representational geometry: integrating cognition, computation, and the brain
TRANSCRIPT
Representational geometry:integrating cognition, computation,and the brainNikolaus Kriegeskorte1 and Rogier A. Kievit1,2
1 Medical Research Council, Cognition and Brain Sciences Unit, Cambridge, UK2 Department of Psychological Methods, University of Amsterdam, Amsterdam, The Netherlands
Review
The cognitive concept of representation plays a key rolein theories of brain information processing. However,linking neuronal activity to representational content andcognitive theory remains challenging. Recent studieshave characterized the representational geometry ofneural population codes by means of representationaldistance matrices, enabling researchers to comparerepresentations across stages of processing and to testcognitive and computational theories. Representationalgeometry provides a useful intermediate level of descrip-tion, capturing both the information represented in aneuronal population code and the format in which it isrepresented. We review recent insights gained with thisapproach in perception, memory, cognition, and action.Analyses of representational geometry can comparerepresentations between models and the brain, andpromise to explain brain computation as transformationof representational similarity structure.
The representational geometry of neuronal populationcodesThe concept of representation is central to the cognitiveand brain sciences. We interpret neuronal activity asserving the function of representing content, and of trans-forming representations of content, with the ultimate ob-jective to produce successful behaviors. The content couldbe a visual image, a sound or odor, a semantic interpreta-tion of sensory input, a proposition, a goal, a plannedaction, or a motor sequence. The representational inter-pretation [1] provides a powerful explanatory frameworkthat makes it easier to understand neuronal activity in thecontext of the overall function of the brain. Representationlinks cognition to brain activity and enables us to buildfunctional theories of brain information processing [2].
Neurophysiology has long interpreted the selectivity ofneurons as serving to represent various kinds of sensoryand higher-level information. The population of neuronswithin an area is thought to jointly represent the content inwhat is called a neuronal population code [3]. It is thepattern of activity across neurons that represents thecontent. The many possible combinations of activity states
1364-6613/$ – see front matter
� 2013 Elsevier Ltd. All rights reserved. http://dx.doi.org/10.1016/j.tics.2013.06.007
Corresponding author: Kriegeskorte, N. ([email protected]).
of neurons provide a rich representational space. Motivat-ed by this idea, recent analyses of neuronal recordings andfunctional imaging data have increasingly focused on pat-terns of activity across many neurons within a functionalregion [4].
We can think of a brain region’s representation as amultidimensional space. The dimensions of the spacecorrespond to the neurons, and a point corresponds toan activity pattern (i.e., each neuron’s activity providesthe coordinate value for one of the dimensions). A visuallyperceived object, for example, will correspond to a pointin the representational space of a given visual area. Theset of all possible objects (or pieces of mental content)corresponds to a vast set of points in the space. It is thegeometry of these points that defines the nature of therepresentation.
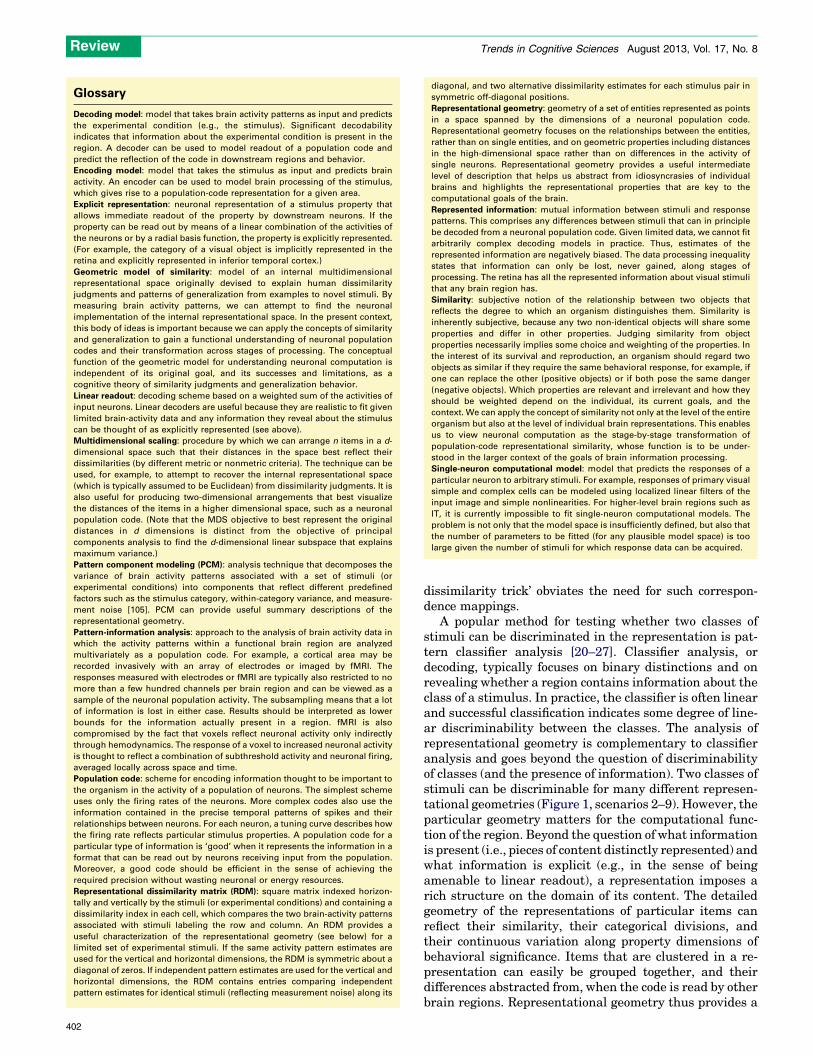
Mathematical and cognitive psychology have a longhistory of investigations of representational geometry onthe basis of behavioral data [5–10]. However, the notion ofrepresentational geometry has only more recently beenbrought into the analysis of brain-activity data [11–15].To characterize the geometry of a representation, we cancompare the brain-activity patterns representing a set ofstimuli (or, more generally, experimental conditions) toeach other. The dissimilarity of two patterns correspondsto the distance between their points in the representation-al space. Having measured these distances, we can con-struct a matrix, the representational dissimilarity matrix(RDM), in which we can look up the representationaldistance (or dissimilarity) for each pair of stimuli(Figure 1). Intuitively, the RDM tells us which distinctionsbetween stimuli the population code honors and whichdistinctions it disregards.
Considering RDMs makes it very easy to compare differ-ent representations (e.g., different brain regions, a region toa computational model representation, or the same regionbetween different individuals or species) by just computingthe correlation between the RDMs (Box 1). Comparingactivity patterns directly, by contrast, would require us todefine the correspondence mapping between, say, voxels oftwo regions, or between single neurons and the units of acomputational network model, or between voxels of thesame region in two individuals. Establishing these map-pings can be difficult and generally requires a separateexperimental data set [16–19]. The ‘representational
Trends in Cognitive Sciences, August 2013, Vol. 17, No. 8 401
Glossary
Decoding model: model that takes brain activity patterns as input and predicts
the experimental condition (e.g., the stimulus). Significant decodability
indicates that information about the experimental condition is present in the
region. A decoder can be used to model readout of a population code and
predict the reflection of the code in downstream regions and behavior.
Encoding model: model that takes the stimulus as input and predicts brain
activity. An encoder can be used to model brain processing of the stimulus,
which gives rise to a population-code representation for a given area.
Explicit representation: neuronal representation of a stimulus property that
allows immediate readout of the property by downstream neurons. If the
property can be read out by means of a linear combination of the activities of
the neurons or by a radial basis function, the property is explicitly represented.
(For example, the category of a visual object is implicitly represented in the
retina and explicitly represented in inferior temporal cortex.)
Geometric model of similarity: model of an internal multidimensional
representational space originally devised to explain human dissimilarity
judgments and patterns of generalization from examples to novel stimuli. By
measuring brain activity patterns, we can attempt to find the neuronal
implementation of the internal representational space. In the present context,
this body of ideas is important because we can apply the concepts of similarity
and generalization to gain a functional understanding of neuronal population
codes and their transformation across stages of processing. The conceptual
function of the geometric model for understanding neuronal computation is
independent of its original goal, and its successes and limitations, as a
cognitive theory of similarity judgments and generalization behavior.
Linear readout: decoding scheme based on a weighted sum of the activities of
input neurons. Linear decoders are useful because they are realistic to fit given
limited brain-activity data and any information they reveal about the stimulus
can be thought of as explicitly represented (see above).
Multidimensional scaling: procedure by which we can arrange n items in a d-
dimensional space such that their distances in the space best reflect their
dissimilarities (by different metric or nonmetric criteria). The technique can be
used, for example, to attempt to recover the internal representational space
(which is typically assumed to be Euclidean) from dissimilarity judgments. It is
also useful for producing two-dimensional arrangements that best visualize
the distances of the items in a higher dimensional space, such as a neuronal
population code. (Note that the MDS objective to best represent the original
distances in d dimensions is distinct from the objective of principal
components analysis to find the d-dimensional linear subspace that explains
maximum variance.)
Pattern component modeling (PCM): analysis technique that decomposes the
variance of brain activity patterns associated with a set of stimuli (or
experimental conditions) into components that reflect different predefined
factors such as the stimulus category, within-category variance, and measure-
ment noise [105]. PCM can provide useful summary descriptions of the
representational geometry.
Pattern-information analysis: approach to the analysis of brain activity data in
which the activity patterns within a functional brain region are analyzed
multivariately as a population code. For example, a cortical area may be
recorded invasively with an array of electrodes or imaged by fMRI. The
responses measured with electrodes or fMRI are typically also restricted to no
more than a few hundred channels per brain region and can be viewed as a
sample of the neuronal population activity. The subsampling means that a lot
of information is lost in either case. Results should be interpreted as lower
bounds for the information actually present in a region. fMRI is also
compromised by the fact that voxels reflect neuronal activity only indirectly
through hemodynamics. The response of a voxel to increased neuronal activity
is thought to reflect a combination of subthreshold activity and neuronal firing,
averaged locally across space and time.
Population code: scheme for encoding information thought to be important to
the organism in the activity of a population of neurons. The simplest scheme
uses only the firing rates of the neurons. More complex codes also use the
information contained in the precise temporal patterns of spikes and their
relationships between neurons. For each neuron, a tuning curve describes how
the firing rate reflects particular stimulus properties. A population code for a
particular type of information is ‘good’ when it represents the information in a
format that can be read out by neurons receiving input from the population.
Moreover, a good code should be efficient in the sense of achieving the
required precision without wasting neuronal or energy resources.
Representational dissimilarity matrix (RDM): square matrix indexed horizon-
tally and vertically by the stimuli (or experimental conditions) and containing a
dissimilarity index in each cell, which compares the two brain-activity patterns
associated with stimuli labeling the row and column. An RDM provides a
useful characterization of the representational geometry (see below) for a
limited set of experimental stimuli. If the same activity pattern estimates are
used for the vertical and horizontal dimensions, the RDM is symmetric about a
diagonal of zeros. If independent pattern estimates are used for the vertical and
horizontal dimensions, the RDM contains entries comparing independent
pattern estimates for identical stimuli (reflecting measurement noise) along its
diagonal, and two alternative dissimilarity estimates for each stimulus pair in
symmetric off-diagonal positions.
Representational geometry: geometry of a set of entities represented as points
in a space spanned by the dimensions of a neuronal population code.
Representational geometry focuses on the relationships between the entities,
rather than on single entities, and on geometric properties including distances
in the high-dimensional space rather than on differences in the activity of
single neurons. Representational geometry provides a useful intermediate
level of description that helps us abstract from idiosyncrasies of individual
brains and highlights the representational properties that are key to the
computational goals of the brain.
Represented information: mutual information between stimuli and response
patterns. This comprises any differences between stimuli that can in principle
be decoded from a neuronal population code. Given limited data, we cannot fit
arbitrarily complex decoding models in practice. Thus, estimates of the
represented information are negatively biased. The data processing inequality
states that information can only be lost, never gained, along stages of
processing. The retina has all the represented information about visual stimuli
that any brain region has.
Similarity: subjective notion of the relationship between two objects that
reflects the degree to which an organism distinguishes them. Similarity is
inherently subjective, because any two non-identical objects will share some
properties and differ in other properties. Judging similarity from object
properties necessarily implies some choice and weighting of the properties. In
the interest of its survival and reproduction, an organism should regard two
objects as similar if they require the same behavioral response, for example, if
one can replace the other (positive objects) or if both pose the same danger
(negative objects). Which properties are relevant and irrelevant and how they
should be weighted depend on the individual, its current goals, and the
context. We can apply the concept of similarity not only at the level of the entire
organism but also at the level of individual brain representations. This enables
us to view neuronal computation as the stage-by-stage transformation of
population-code representational similarity, whose function is to be under-
stood in the larger context of the goals of brain information processing.
Single-neuron computational model: model that predicts the responses of a
particular neuron to arbitrary stimuli. For example, responses of primary visual
simple and complex cells can be modeled using localized linear filters of the
input image and simple nonlinearities. For higher-level brain regions such as
IT, it is currently impossible to fit single-neuron computational models. The
problem is not only that the model space is insufficiently defined, but also that
the number of parameters to be fitted (for any plausible model space) is too
large given the number of stimuli for which response data can be acquired.
Review Trends in Cognitive Sciences August 2013, Vol. 17, No. 8
402
dissimilarity trick’ obviates the need for such correspon-dence mappings.
A popular method for testing whether two classes ofstimuli can be discriminated in the representation is pat-tern classifier analysis [20–27]. Classifier analysis, ordecoding, typically focuses on binary distinctions and onrevealing whether a region contains information about theclass of a stimulus. In practice, the classifier is often linearand successful classification indicates some degree of line-ar discriminability between the classes. The analysis ofrepresentational geometry is complementary to classifieranalysis and goes beyond the question of discriminabilityof classes (and the presence of information). Two classes ofstimuli can be discriminable for many different represen-tational geometries (Figure 1, scenarios 2–9). However, theparticular geometry matters for the computational func-tion of the region. Beyond the question of what informationis present (i.e., pieces of content distinctly represented) andwhat information is explicit (e.g., in the sense of beingamenable to linear readout), a representation imposes arich structure on the domain of its content. The detailedgeometry of the representations of particular items canreflect their similarity, their categorical divisions, andtheir continuous variation along property dimensions ofbehavioral significance. Items that are clustered in a re-presentation can easily be grouped together, and theirdifferences abstracted from, when the code is read by otherbrain regions. Representational geometry thus provides a
Representa�onaldistance
(A)
(B)
1 2 3 4 5
6 7 8 9 10
TRENDS in Cognitive Sciences
Figure 1. Representational geometries and their reflection in distance matrices. (A) Illustration of ten hypothetical representational geometries for brain regions (numbered
1–10). Each dot corresponds to the representation of a particular piece of content (e.g., a visual object). The space in which the dots are placed is the space of
representational patterns (illustrated as two-dimensional, but high-dimensional in reality). The halo regions around the dots indicate the margin of error; dots with
overlapping error halos are indistinguishable. The items fall into two categories (dark or light), or in the case of geometry 10, on a continuous manifold (shades of gray). (1)
No item is distinct from any other item. (2) Most items are distinctly represented but the categories cannot be separated by any simple boundary. (3) Only the light items are
distinctly represented and they are separable from the dark items by a quadratic boundary. (4) Dark and light items are linearly separable and arranged along parallel lines
with pairs of dark and light dots matched up across the boundary. (5) The items form a single cluster but the categories are linearly separable. (6) The items form two
category clusters that are linearly separable and within which all items are distinct. (7) Like the previous case, but the items in the dark category are indistinguishable. (8)
Like the previous case, but only the category distinction is represented; items within each category are indistinguishable from each other. (9) The dark items are
indistinguishable and located among the distinctly represented light items on a circle. (10) Items fall on two manifolds that closely follow each other, with pairs of items
matched up across them. (B) Representational distance matrix for each of the ten geometries (in the corresponding panel location). Distances are color-coded from blue
(items indistinguishable) to red (items widely separated). Each matrix is indexed vertically (from the top down) and horizontally (from left to right) by the items as illustrated
in the lower left panel. Only geometry 10 (lower right) has a different item set, and the upper left quadrant corresponds to the front manifold and the lower right quadrant to
the back manifold. See Box 2 for actual brain representations exhibiting some of the geometric features illustrated here.
Review Trends in Cognitive Sciences August 2013, Vol. 17, No. 8
basis for generalization and abstraction, important hall-marks of cognition [28]. In fact, brain computation can beconstrued as the transformation of the representationalgeometry along stages of processing [29].
Recent papers have reviewed results from patterndecoding of visual representations [27] and pattern-information methods for testing computational models[30]. Here we give an overview of some of the insights fromrecent studies of representational geometry. The nextsection covers vision, the field that has been most activewith this approach. We then describe applications beyondvision, addressing other sensory modalities, memory, cog-nition, and action from this perspective. Finally we high-light current challenges and future directions for studies ofrepresentational geometry.
Representational geometry in the visual systemThe most rigorous account of a sensory representation isprovided by a computational model that predicts neuronalresponses to arbitrary stimuli. If we can accurately predictthe responses of all neurons in an area, we have capturedthe computations up to that area. This method has beenvery successful for V1 and is being extended to higher-levelcortical representations. If we could predict neuronalresponses throughout the brain, along with behavioraloutput, we might not need the abstraction of representa-tional geometry, or indeed the concept of representation.However, even for V1, the degree to which we can predictresponses is limited [31]. Predicting neural responsesbecomes more difficult as we move to higher-level regions.The space of computational mechanisms and model
403
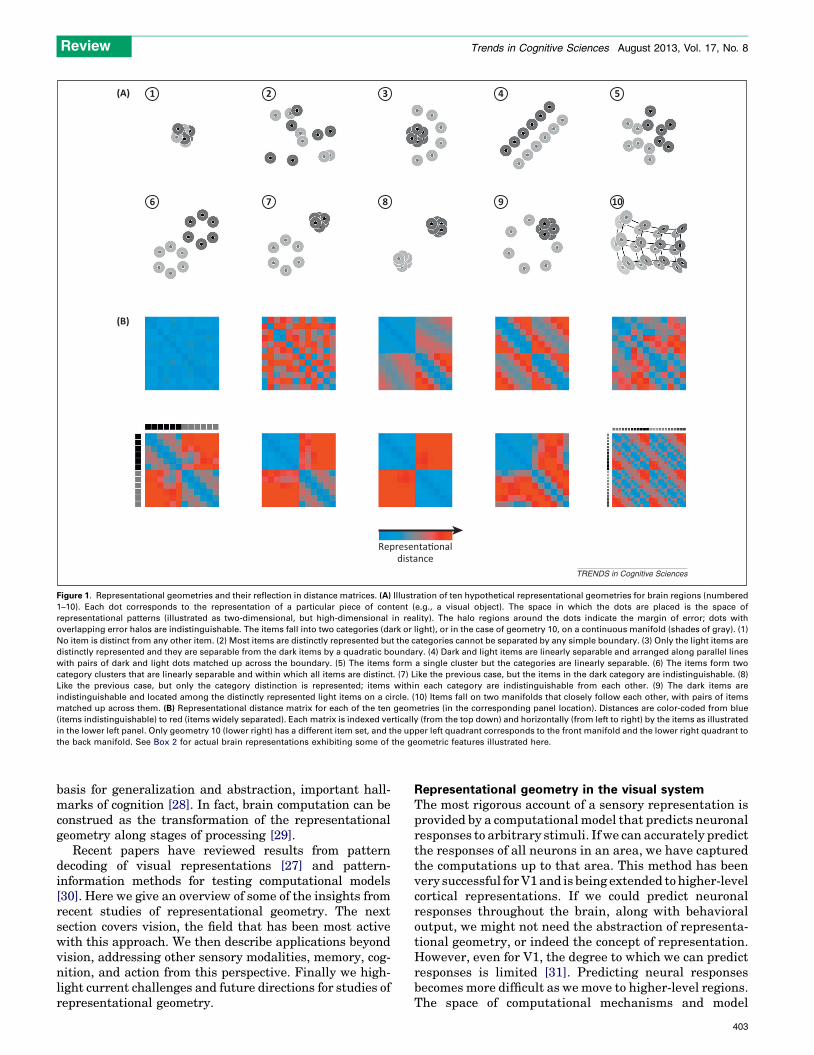
Box 1. Representational similarity analysis
Representational similarity analysis (RSA) is pattern information
analysis that compares representational geometries between brain
regions, stimulus descriptions, conceptual and computational mod-
els, and behavioral reflections of similarity [15]. It can be applied to
functional imaging data (including fMRI, MEG, and EEG) as well as
neuronal recording data. The three basic steps (Figure I) are as
follows. (i) Choose a brain region and estimate the activity patterns.
The region can be functionally or anatomically defined. The patterns
can be estimated with standard methods used in univariate analyses.
In fMRI, for example, a linear model with a hemodynamic response
predictor for each stimulus might be used to estimate the response of
each voxel to each stimulus. For neuronal recordings, a windowed
spike count might be used. However, any other features of the
responses, such as features reflecting the temporal response
structure or energy in different frequency bands, could equally be
used to define the representation of each stimulus. (ii) Estimate the
representational dissimilarity matrix (RDM). The representation in a
given brain region or computational model is characterized by the
matrix of dissimilarities between the stimulus representations. A
popular distance measure is the correlation distance (1–Pearson
correlation across voxels, neurons, features, or model units). The
correlation distance disregards the overall activation level (spatial
mean), rendering the analysis complementary to analyses of overall
activation. Other distance measures such as the Euclidean or
Mahalanobis distance, or cross-validated measures such as the
discriminant t value or accuracy can also be used. (iii) Compare
RDMs from brains, behaviors, and models. The key step is to compare
RDMs to assess to what extent different representations are alike. We
might want to know whether a brain representation (a) reflects
stimulus properties, (b) reflects higher-level semantic properties, (c)
can be accounted for by a computational model, (d) reflects
representations in other brain regions, (e) is similar to a putative
homologous representation in another species, or (f) is reflected in
behavior, for example in similarity judgments, in stimulus confusions,
or in reaction times in discrimination tasks. One useful way to
compare RDMs is to compute the correlation between the corre-
sponding dissimilarities. The rank correlation (Spearman) is often
used for this purpose when a linear relationship between the
dissimilarities cannot be assumed (e.g., when comparing fMRI-based
RDMs to other RDMs). Statistical inference is commonly performed
by means of randomization testing (randomly permuting the stimulus
labels to simulate the null distribution of the RDM correlation) and
bootstrap techniques (to compare the relative performance of
different models). Comparing two representations at the level of
dissimilarities rather than at the level of the original patterns is a
useful trick that obviates the need for defining the correspondence
mapping between the representational units. Like classifier decoding,
RSA is a pattern information technique that is sensitive to information
encoded combinatorially in fine-grained patterns of activity. However,
rather than asking what information can be (linearly) read from the
representation, RSA attempts to characterize the representational
geometry and compare it to various models. Like encoding models
(also known as voxel or population receptive field models in the fMRI
literature [17,18,112]), RSA captures the representation of a rich set of
stimuli and aims to test computational models of brain information
processing that generalize to novel stimuli. However, rather than
comparing brains and models at the level of activity patterns
(requiring fitting of weights that define the relationship between
model units and voxels), RSA compares representations at the level of
dissimilarity matrices.
S�mulus(e.g. images, sounds, otherexperimental condi�ons)
Representa�onal pa�ern(e.g. voxels, neurons, model units)
Brain representa�on(e.g. fMRI pa�ern dissimilari�es)
Behavior(e.g. disimilarity judgments)
S�mulus descrip�on(e.g. pixel-based dissimilarity)
Compute dissimilarity(e.g. 1 - correla�on)
Ac�v
ity
Diss
imila
rity
Computa�onal modelrepresenta�on
(e.g. face-detector model)
(A) (B)
TRENDS in Cognitive Sciences
Figure I. Representational similarity analysis. Illustration of the steps of RSA for a simple design with six visual stimuli. (A) Stimuli (or, more generally, experimental
conditions) are assumed to elicit brain representations of individual pieces of content (e.g., visual objects). Here the representation of each item is visualized as a set of
voxels (an fMRI region of interest) that are active to different degrees (black-to-red color scale). We compute the dissimilarity for each pair of stimuli, for example using
1–correlation across voxels. (B) The representational dissimilarity matrix (RDM) assembles the dissimilarities for all pairs of stimuli (blue-to-red color scale for small-to-
large dissimilarities). The matrix can be used like a table to look up the dissimilarity between any two stimuli. The RDM is typically symmetric about a diagonal of zeros
(white entries along the diagonal). RDMs can similarly be computed from stimulus descriptions (bottom left), from internal representations in computational models
(bottom right), and from behavior (top right). By correlating RDMs (black double arrows), we can then assess to what extent the brain representation reflects stimulus
properties, can be accounted for by different computational models, and is reflected in behavior.
Review Trends in Cognitive Sciences August 2013, Vol. 17, No. 8
404
Review Trends in Cognitive Sciences August 2013, Vol. 17, No. 8
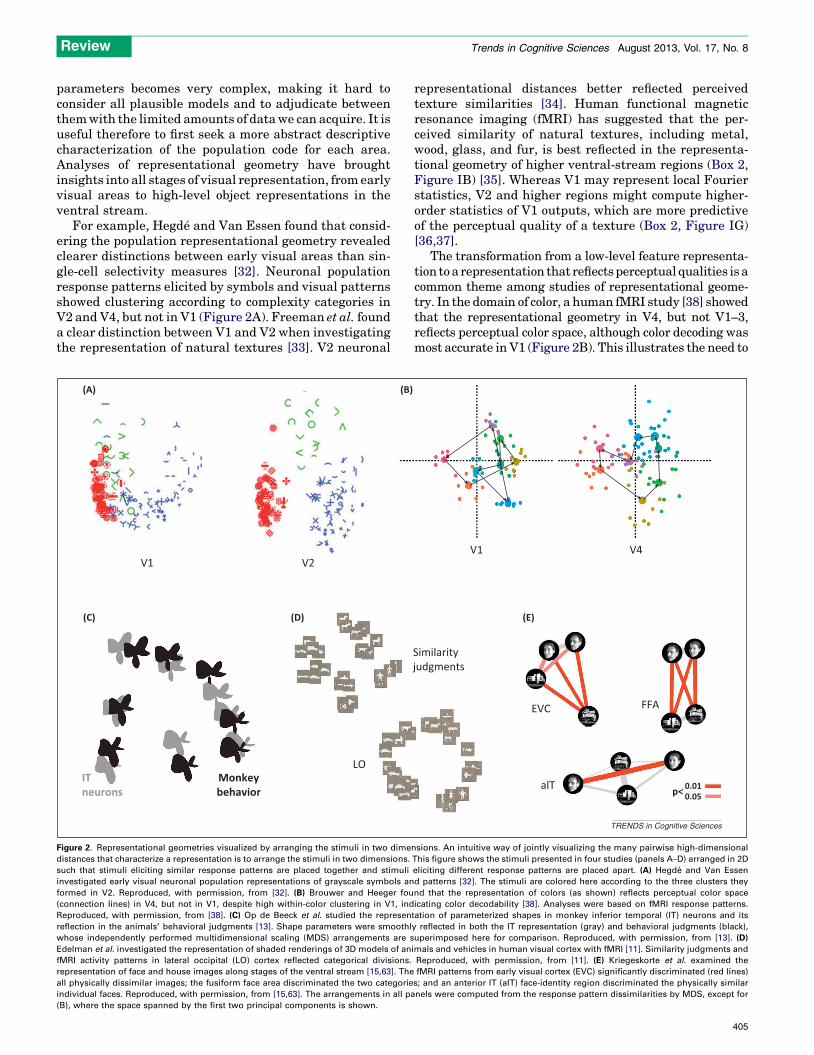
parameters becomes very complex, making it hard toconsider all plausible models and to adjudicate betweenthem with the limited amounts of data we can acquire. It isuseful therefore to first seek a more abstract descriptivecharacterization of the population code for each area.Analyses of representational geometry have broughtinsights into all stages of visual representation, from earlyvisual areas to high-level object representations in theventral stream.
For example, Hegde and Van Essen found that consid-ering the population representational geometry revealedclearer distinctions between early visual areas than sin-gle-cell selectivity measures [32]. Neuronal populationresponse patterns elicited by symbols and visual patternsshowed clustering according to complexity categories inV2 and V4, but not in V1 (Figure 2A). Freeman et al. founda clear distinction between V1 and V2 when investigatingthe representation of natural textures [33]. V2 neuronal
V1 V2
LOMonkeybehavior
(A) (B)
(C) (D)
ITneurons
Figure 2. Representational geometries visualized by arranging the stimuli in two dime
distances that characterize a representation is to arrange the stimuli in two dimensions.
such that stimuli eliciting similar response patterns are placed together and stimuli
investigated early visual neuronal population representations of grayscale symbols an
formed in V2. Reproduced, with permission, from [32]. (B) Brouwer and Heeger fou
(connection lines) in V4, but not in V1, despite high within-color clustering in V1, ind
Reproduced, with permission, from [38]. (C) Op de Beeck et al. studied the represen
reflection in the animals’ behavioral judgments [13]. Shape parameters were smoothl
whose independently performed multidimensional scaling (MDS) arrangements are s
Edelman et al. investigated the representation of shaded renderings of 3D models of an
fMRI activity patterns in lateral occipital (LO) cortex reflected categorical divisions.
representation of face and house images along stages of the ventral stream [15,63]. The
all physically dissimilar images; the fusiform face area discriminated the two categorie
individual faces. Reproduced, with permission, from [15,63]. The arrangements in all pa
(B), where the space spanned by the first two principal components is shown.
representational distances better reflected perceivedtexture similarities [34]. Human functional magneticresonance imaging (fMRI) has suggested that the per-ceived similarity of natural textures, including metal,wood, glass, and fur, is best reflected in the representa-tional geometry of higher ventral-stream regions (Box 2,Figure IB) [35]. Whereas V1 may represent local Fourierstatistics, V2 and higher regions might compute higher-order statistics of V1 outputs, which are more predictiveof the perceptual quality of a texture (Box 2, Figure IG)[36,37].
The transformation from a low-level feature representa-tion to a representation that reflects perceptual qualities is acommon theme among studies of representational geome-try. In the domain of color, a human fMRI study [38] showedthat the representational geometry in V4, but not V1–3,reflects perceptual color space, although color decoding wasmost accurate in V1 (Figure 2B). This illustrates the need to
Similarityjudgments
V1 V4
alT
EVC FFA
p< 0.010.05
(E)
TRENDS in Cognitive Sciences
nsions. An intuitive way of jointly visualizing the many pairwise high-dimensional
This figure shows the stimuli presented in four studies (panels A–D) arranged in 2D
eliciting different response patterns are placed apart. (A) Hegde and Van Essen
d patterns [32]. The stimuli are colored here according to the three clusters they
nd that the representation of colors (as shown) reflects perceptual color space
icating color decodability [38]. Analyses were based on fMRI response patterns.
tation of parameterized shapes in monkey inferior temporal (IT) neurons and its
y reflected in both the IT representation (gray) and behavioral judgments (black),
uperimposed here for comparison. Reproduced, with permission, from [13]. (D)
imals and vehicles in human visual cortex with fMRI [11]. Similarity judgments and
Reproduced, with permission, from [11]. (E) Kriegeskorte et al. examined the
fMRI patterns from early visual cortex (EVC) significantly discriminated (red lines)
s; and an anterior IT (aIT) face-identity region discriminated the physically similar
nels were computed from the response pattern dissimilarities by MDS, except for
405
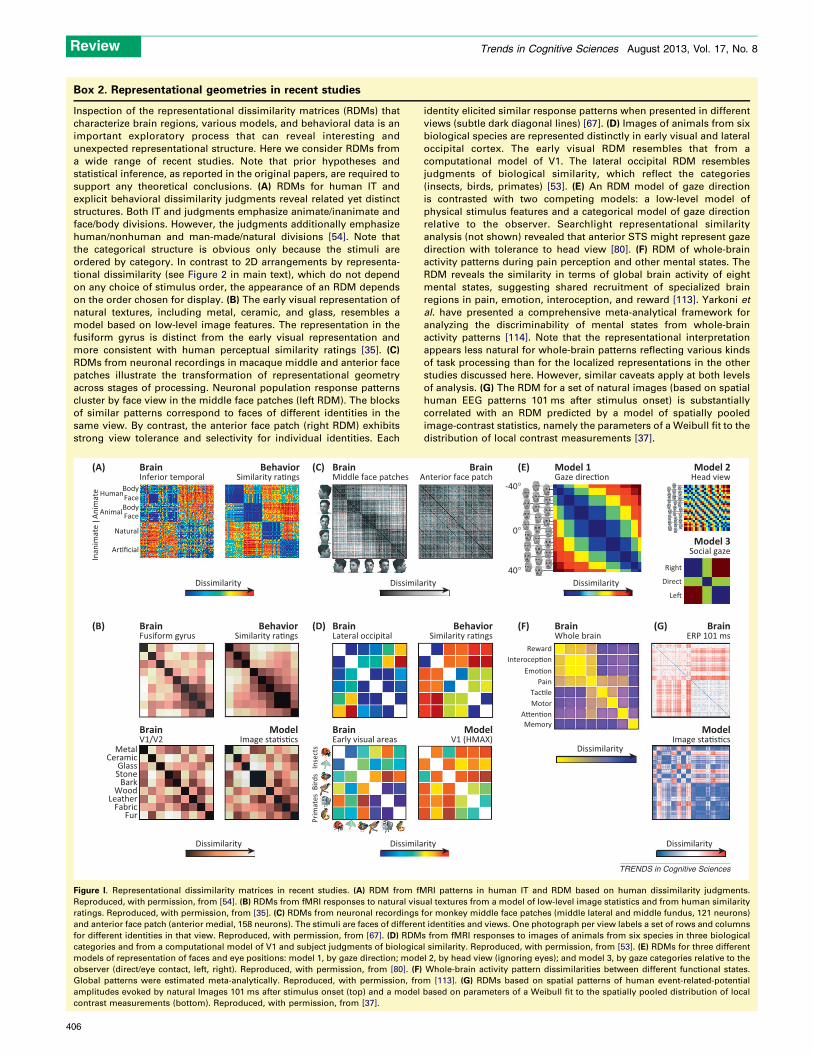
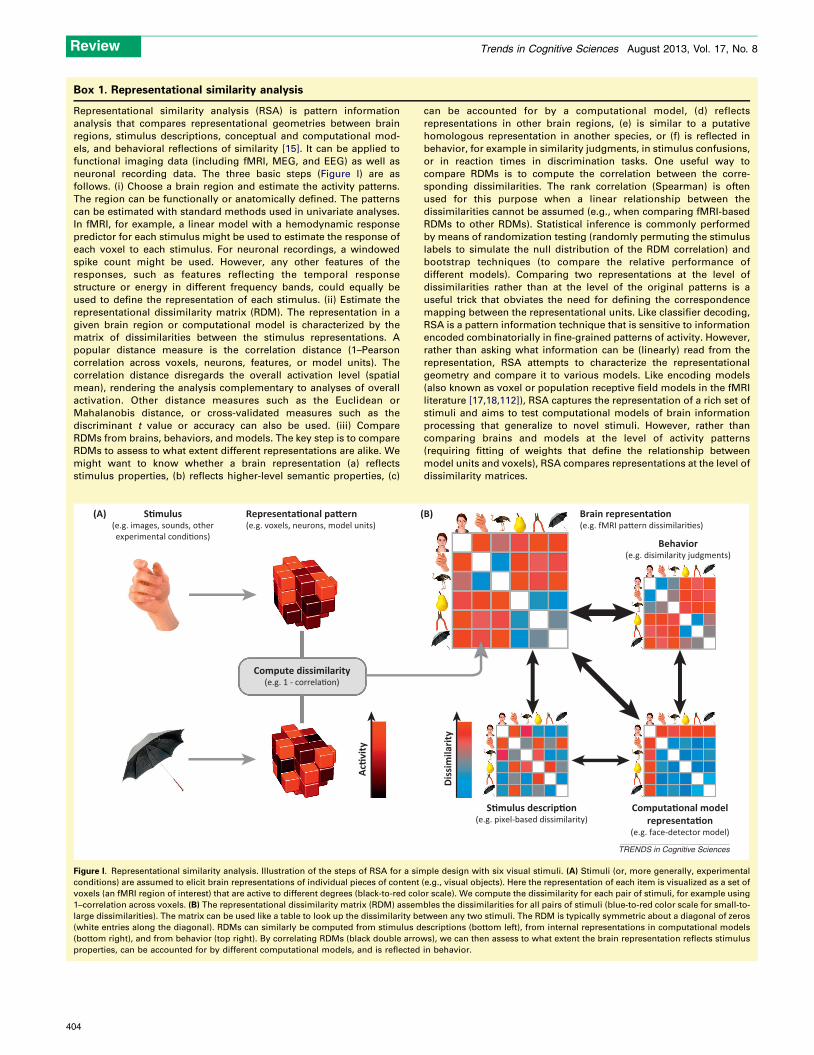
Box 2. Representational geometries in recent studies
Inspection of the representational dissimilarity matrices (RDMs) that
characterize brain regions, various models, and behavioral data is an
important exploratory process that can reveal interesting and
unexpected representational structure. Here we consider RDMs from
a wide range of recent studies. Note that prior hypotheses and
statistical inference, as reported in the original papers, are required to
support any theoretical conclusions. (A) RDMs for human IT and
explicit behavioral dissimilarity judgments reveal related yet distinct
structures. Both IT and judgments emphasize animate/inanimate and
face/body divisions. However, the judgments additionally emphasize
human/nonhuman and man-made/natural divisions [54]. Note that
the categorical structure is obvious only because the stimuli are
ordered by category. In contrast to 2D arrangements by representa-
tional dissimilarity (see Figure 2 in main text), which do not depend
on any choice of stimulus order, the appearance of an RDM depends
on the order chosen for display. (B) The early visual representation of
natural textures, including metal, ceramic, and glass, resembles a
model based on low-level image features. The representation in the
fusiform gyrus is distinct from the early visual representation and
more consistent with human perceptual similarity ratings [35]. (C)
RDMs from neuronal recordings in macaque middle and anterior face
patches illustrate the transformation of representational geometry
across stages of processing. Neuronal population response patterns
cluster by face view in the middle face patches (left RDM). The blocks
of similar patterns correspond to faces of different identities in the
same view. By contrast, the anterior face patch (right RDM) exhibits
strong view tolerance and selectivity for individual identities. Each
identity elicited similar response patterns when presented in different
views (subtle dark diagonal lines) [67]. (D) Images of animals from six
biological species are represented distinctly in early visual and lateral
occipital cortex. The early visual RDM resembles that from a
computational model of V1. The lateral occipital RDM resembles
judgments of biological similarity, which reflect the categories
(insects, birds, primates) [53]. (E) An RDM model of gaze direction
is contrasted with two competing models: a low-level model of
physical stimulus features and a categorical model of gaze direction
relative to the observer. Searchlight representational similarity
analysis (not shown) revealed that anterior STS might represent gaze
direction with tolerance to head view [80]. (F) RDM of whole-brain
activity patterns during pain perception and other mental states. The
RDM reveals the similarity in terms of global brain activity of eight
mental states, suggesting shared recruitment of specialized brain
regions in pain, emotion, interoception, and reward [113]. Yarkoni et
al. have presented a comprehensive meta-analytical framework for
analyzing the discriminability of mental states from whole-brain
activity patterns [114]. Note that the representational interpretation
appears less natural for whole-brain patterns reflecting various kinds
of task processing than for the localized representations in the other
studies discussed here. However, similar caveats apply at both levels
of analysis. (G) The RDM for a set of natural images (based on spatial
human EEG patterns 101 ms after stimulus onset) is substantially
correlated with an RDM predicted by a model of spatially pooled
image-contrast statistics, namely the parameters of a Weibull fit to the
distribution of local contrast measurements [37].
Dissimilarity
MetalCeramic
GlassStone
BarkWood
LeatherFabric
Fur
Body
(A) (C) (E)
(B) (D) (F) (G)
BodyFace
Face
Natural
Inan
imat
eAn
imat
e
Ar�ficial
BrainInferior temporal
BrainMiddle face patches
BehaviorSimilarity ra�ngs
BrainAnterior face patch
Model 2Head view
Model 3Social gaze
BrainERP 101 ms
ModelImage sta�s�cs
ModelV1 (HMAX)
ModelImage sta�s�cs
BrainV1/V2
BrainEarly visual areas
BehaviorSimilarity ra�ngs
BehaviorSimilarity ra�ngs
BrainWhole brain
BrainLateral occipital
BrainFusiform gyrus
Model 1Gaze direc�on
RewardInterocep�on
Emo�onPain
Tac�leMotor
A�en�onMemory
Le�
40°
0°
-40°
Direct
Right
Prim
ates
Inse
cts
Bird
s
Human
Animal
Dissimilarity Dissimilarity
Dissimilarity
Dissimilarity Dissimilarity Dissimilarity
TRENDS in Cognitive Sciences
Figure I. Representational dissimilarity matrices in recent studies. (A) RDM from fMRI patterns in human IT and RDM based on human dissimilarity judgments.
Reproduced, with permission, from [54]. (B) RDMs from fMRI responses to natural visual textures from a model of low-level image statistics and from human similarity
ratings. Reproduced, with permission, from [35]. (C) RDMs from neuronal recordings for monkey middle face patches (middle lateral and middle fundus, 121 neurons)
and anterior face patch (anterior medial, 158 neurons). The stimuli are faces of different identities and views. One photograph per view labels a set of rows and columns
for different identities in that view. Reproduced, with permission, from [67]. (D) RDMs from fMRI responses to images of animals from six species in three biological
categories and from a computational model of V1 and subject judgments of biological similarity. Reproduced, with permission, from [53]. (E) RDMs for three different
models of representation of faces and eye positions: model 1, by gaze direction; model 2, by head view (ignoring eyes); and model 3, by gaze categories relative to the
observer (direct/eye contact, left, right). Reproduced, with permission, from [80]. (F) Whole-brain activity pattern dissimilarities between different functional states.
Global patterns were estimated meta-analytically. Reproduced, with permission, from [113]. (G) RDMs based on spatial patterns of human event-related-potential
amplitudes evoked by natural Images 101 ms after stimulus onset (top) and a model based on parameters of a Weibull fit to the spatially pooled distribution of local
contrast measurements (bottom). Reproduced, with permission, from [37].
Review Trends in Cognitive Sciences August 2013, Vol. 17, No. 8
406
Review Trends in Cognitive Sciences August 2013, Vol. 17, No. 8
reveal not only what information is present in a region butalso its representational geometry to understand the neuralbasis of perception.
Whereas textures and colors make the ‘stuff’ of vision, amajor function of the ventral stream is the visual recognitionof ‘things’ [39]. Ventral-stream representational geometryhas been investigated using abstract parameterized shapes,which serve as a stepping stone towards real-world objectimages. Op de Beeck et al. found that the parameters of asimple 2D shape space were reflected in the representation-al geometry in monkey inferior temporal (IT) and in percep-tual judgments of monkeys and humans (Figure 2C) [13].Human fMRI studies similarly support a representation ofshape reflecting perception in lateral occipital complex(LOC) [40], with the anterior LOC reflecting perceptualsimilarities most strongly [41] and lateral LOC tuned tosmaller features [42]. More complex 3D shape parameter-izations have also been successfully used to model IT single-neuron responses [43], suggesting that IT represents3D shape.
Parameterized shapes afford good experimental control,but they lack naturalism and behavioral relevance. This hasmotivated the use of real-world photos depicting faces,people, animals, objects, and scenes. Several studies usingphotos suggest that ventral-stream regions do not merelyrepresent objects in a continuous space of high-level visualfeatures, but emphasize categorical boundaries and seman-tic dimensions of the visual images in humans [11,20,44,45](Figure 2D) and monkeys [46]. Both the categorical divisionsand the within-category representational geometry arestrikingly similar between monkey IT and human ven-tral–temporal object-sensitive cortex [45]. Beyond the pres-ence of category information [20], several studies suggestthat response patterns elicited by images of the same cate-gory form clusters in ventral–temporal response-patternspace [11,45,46]. The major categorical divisions are be-tween animates and inanimates [45–48] and between facesand bodies. Such clustering was not observed in early visualrepresentations or computational visual features of a rangeof complexities [45], suggesting that the clusters do notsimply reflect visual feature similarity. Instead, the ventraltemporal code might be optimized to emphasize behavioral-ly relevant categorical divisions and semantic dimensions[44–49]. The geometric centrality of an object in the repre-sentation has been linked to the perception of typicality [49].Animates appear to form a representational cluster not onlyin IT but also in the amygdala [50]. The representationappears to be sensitive to the dimension of animacy, evenwhen comparing real faces and physically similar manne-quin faces [51], strengthening the case for a semantic com-ponent to the code. The animate–inanimate division isassociated with a large-scale lateral-to-medial gradient inventral temporal cortex, which is unaltered in congenitallyblind individuals [52], suggesting that it does not requirevisual experience to develop. Finer categorical divisionswithin animates have also been observed in monkeys [46]and humans (Box 2, Figure ID) [53].
Human ventral–temporal representational distancesclosely match human dissimilarity judgments [11,40,41,54], which exhibit the same major categorical divisionsand a similar within-category structure. However, human
judgments transcend the ventral–temporal representationin that they additionally emphasize the division betweenhuman and non-human animals and that between man-made and natural objects, which are not very pronounced inthe ventral stream (Box 2, Figure IA) [54].
Places [55] and faces [56] are thought to have specialbehavioral relevance and specialized cortical regions ded-icated to their analysis. Several studies have attempted tocharacterize the representational geometry of theseregions. Walther et al. found that natural scenes pre-sented as either photographs or line drawings could bedecoded from V1, the parahippocampal place area (PPA),retrosplenial cortex (RSC), and LOC [57–59]. However,only in the higher visual regions did pattern dissimila-rities predict behavioral confusions. Kravitz et al. com-pared the representational geometry of scenes in earlyvisual cortex and PPA and found that early visual repre-sentation strongly reflected the distance of the perceivedscene (near vs far), whereas PPA represented whetherscenes were closed or open [60]. A comparison of therepresentational geometries of LOC, RSC, and PPA sug-gested that LOC represents the objects present in thescene and RSC the global spatial layout, and PPA com-bines information about both of these components ofscenes [61]. Morgan et al. found that geographic distancesbetween landmarks of a college campus were reflected inhippocampal responses when subjects familiar with thelocation of the landmarks viewed them in a scanner [62].The hippocampus responded more strongly to changesspanning a greater physical distance. However, re-sponse-pattern dissimilarity was not significantly corre-lated with physical distance anywhere in the brain.
Studies of face-specific representations in humans havesuggested that the fusiform face area (FFA) [56] emphasizesthe distinction between faces and non-faces, whereas ante-rior temporal cortex discriminates individual faces(Figure 2E) [63–65]. However, individual-level face infor-mation has also been observed in the FFA and other regions[64–66]. The best demonstration of the transformation offace representational geometry across face regions comesfrom fMRI-targeted neuronal recordings in monkeys (Box 2,Figure IC) [67]. The representation of identities was view-specific in the middle face patches (ML and MF), partiallyview-tolerant in anterior face patch (AL), with mirror-sym-metric views co-localized in the representational space, andalmost view-invariant in the most anterior face patch (AM).A mirror-symmetric representation of face views has alsobeen observed in humans [68]. Many higher visual areas,including LOC, occipital face area (OFA), FFA, PPA, anddorsal regions, showed a mirror-symmetric response tofaces. For example, views of –608 and 608 elicited similarresponse patterns, suggesting pooling of mirror-symmetriclower-level features as a computational step towards great-er tolerance to view changes.
Achieving tolerance to stimulus variations that are notrelevant to a given task such as face identification is one ofthe central challenges of object recognition [69]. Althoughventral-stream representations are not fully invariant [70]to the view, position, or scale of an object, they supportlinear readout with some robustness to these accidentalproperties [71]. To understand how tolerance is achieved,
407
Review Trends in Cognitive Sciences August 2013, Vol. 17, No. 8
Rust and DiCarlo compared the population representation-al geometries of V4 and IT on the basis of neuronalrecordings in monkeys [72]. Both regions discriminatedindividual images and their scrambled counterparts. ITexhibited reduced information about scrambled images,but increased generalization for intact images across posi-tion and context clutter. This suggests a transformation ofrepresentational geometry in which position and clutterare de-emphasized relative to the presence of complexfeature conjunctions diagnostic of differences between re-al-world objects.
A special case of clutter is the presence of additionalobjects in the image. Several studies have investigatedventral temporal response patterns to multiple simulta-neously presented objects in monkeys [73] and humans[74–76]. Results suggest that the response pattern elicitedby multiple objects is well predicted by the average of theresponse patterns [73]. If one of the objects is attended, thisobject receives a greater weight in the average [75]. Theseresults are broadly consistent with biased competition andwith the divisive normalization model [77], in which thesummed neural population response to multiple inputs isheld constant through recurrent suppression.
As we observe people in the real world, we do not justrecognize them. We infer a host of socially important piecesof information. Facial expressions of emotion appear to berepresented in posterior STS with the representationalgeometry reflected in similarity judgments of the expres-sions [78]. It has been suggested that the STS and medialprefrontal regions represent perceived emotions with in-variance to the sensory source (dynamic faces, bodies, orvoices, [79]). Another socially important feature of faces isgaze direction. Displacement of the dark iris and pupilprovides a subtle but socially important indication of wheresomeone is looking. Carlin et al. reported a representationof gaze direction in right anterior STS that was tolerant tochanges in both head view and physical image features(Box 2, Figure IE) [80].
Visual representations are not merely perceptual butare also involved in mental imagery in the absence of visualinput. A number of human fMRI studies have investigatedbrain representations during visual imagery and theirrelationship to perceptual representation. Results supportthe idea that imagery and perception of the same visualcontent might be represented in the same cortical regionsand in a similar representational format [81–83].
Overall, studies of the geometry of visual representationshave impressively documented the stage-wise transforma-tion of the retinal image from low-level representations oflocal physical features to high-level holistic representationsof objects, faces, and scenes that better reflect perceptualqualities, emphasizing behaviorally important categoriesand semantic dimensions and deemphasizing accidentaland behaviorally irrelevant variation of the visual input.Further studies are needed to reveal the full computationalmechanism giving rise to these transformations.
Representational geometry beyond visionAuditory perception
Like vision, audition requires substantial tolerance toaccidental variations of the signals to be recognized. The
408
imposition of categorical boundaries on a fundamentallycontinuous space of stimuli is another shared featurebetween the two modalities. Recent studies have investi-gated the representation of sound categories [84,85]. Gior-dano et al. investigated the representation of naturalenvironmental sounds and reported that representationalgeometry in the planum temporale emphasized particularcategorical distinctions more strongly than predicted bylow-level feature models [84]. The categories were living/non-living and human/non-human, which are highly be-haviorally relevant divisions similar to those emphasizedin ventral visual representations.
The clearest examples of categorical representationmight be expected in the domain of human language.Speech percepts are categorical not only at the level ofconceptual and semantic content but also at the phoneticlevel. A well-known example is the categorical perceptionof phonemes. A recent study used human intracranialelectrode arrays to investigate the representational ge-ometry of a continuum of artificial speech sounds rangingfrom ‘ba’ through ‘da’ to ‘ga’ [86]. Response patterns inposterior superior temporal gyrus formed clear clusterscorresponding to phonemes, despite the fact that thesound continuum was sampled in acoustically equalsteps. Pattern dissimilarity emerged rapidly over time,peaking at the same time (�110 ms) as the evokedpotentials. A human fMRI study investigated represen-tations of the phonemes /la/ and /ra/ in native speakers ofEnglish and Japanese [87]. The representational dissim-ilarity between /la/ and /ra/ phonemes in the right pri-mary auditory cortex, but not the overall activation,predicted the extent to which speakers were able todiscriminate between the two phonemes between, andeven within the two groups.
Beyond vision and audition, a close link between repre-sentational geometry and perception has also been ob-served for olfactory stimuli. Behavioral similarity ratingsfor smells correlated with neural pattern representationalsimilarities in the posterior piriform cortex [88]. Acrossseveral sensory modalities, studies of representationalgeometry have demonstrated that brain representationsemphasize behaviorally relevant categorical distinctionsand predict perceptual similarities.
Memory
Recent studies have begun to investigate representationsof particular items during memory encoding and retrieval,and how the precision of representational reinstatementduring encoding and retrieval predicts the success or fail-ure of these memory operations. Polyn et al. showed thatthe category-specific patterns arising during encoding offaces, locations, and objects are reinstated in a subsequentfree-recall phase [89]. Activity patterns during free recallpredicted the category about to be recalled several secondsin advance.
A more recent study by Xue et al. investigated theencoding process and found that more precise perceptualreinstatement of representations during encoding pre-dicted better memory [90]. Interestingly, the precision ofperceptual reinstatement of representations has also beenassociated with conscious representation [91]. Subsequent
Review Trends in Cognitive Sciences August 2013, Vol. 17, No. 8
studies suggested some refinements to this picture, inwhich activity patterns in the hippocampus and othermedial temporal regions have distinct signatures thatpredict successful encoding [92] and retrieval [93,94].
In the studies described so far, memory served as astorage facility, but the structure of the representationalcategories was never manipulated. A recent study associ-ated particular exemplars from each category with a shock[95]. This led to emergence in the frontoparietal represen-tation of a new categorical division between the shock-associated and other images. Moreover, the patterns dur-ing fear learning predicted the long-term behavioral ex-pression of fear memories [96].
In sum, studies of representational geometry arebeginning to reveal how the perceptual representationof an individual piece of content affects its mnemonicencoding and how reinstatement of the representationduring recall enables successful recollection. We arealso beginning to elucidate the specific roles of the hip-pocampus and other medial temporal regions and theplasticity of the representational space itself, includingthe formation of new behaviorally relevant categoricaldivisions.
Action and motor control
We should be able to characterize representations alongthe entire perception–action cycle by their representa-tional geometry. The primary motor representation is aclassic example of a population code [97]. We focus hereon two recent studies that explored the geometry of motorrepresentations. Wiestler et al. studied the representa-tion of finger movements and sensations in the cerebel-lum [98], a structure thought to relate sensory and motorrepresentations for smooth sensorimotor control. Theycompared cerebellar regions to cortical areas M1 and S1.Cerebellar and cortical representations both discriminat-ed movements of different individual fingers. Both alsodiscriminated sensations in different individual fingers.For a given finger, movement and sensation were associ-ated with similar patterns in M1 and S1. In the cerebel-lum, however, the representations were not consistentbetween movement and sensation, with motor and sen-sory finger representations apparently randomly inter-digitated. This arrangement may enable the cerebellumto associate movements and their sensory consequencesin flexible ways, a requirement in learning new motortasks. In another study, Diedrichsen et al. investigatedco-localized motor representations of our two hands,which might serve to coordinate the hands during biman-ual tasks [99]. Representations of unimanual fingermovements were represented mostly in contralateralM1 and S1, with a faint echo of a symmetric representa-tion in ipsilateral areas. Such an arrangement mightfacilitate symmetric bimanual movements. In premotorand parietal areas, unimanual movements also had anipsilateral representation. However, it was not a sym-metric echo, but qualitatively different. Such a co-local-ized representation of both hands might serve toassociate the movements of the two hands in flexibleways to coordinate the hands during asymmetric biman-ual tasks.
Current challenges for investigations ofrepresentational geometryTesting many models: a simultaneously hypothesis- and
data-driven approach
Many studies have focused on one or two models of repre-sentation. In the visual domain, this could be a particularcomputational model, such as a Gabor filter model, aparameterized shape model, a semantic model, or a behav-ioral characterization of the representational geometry.The field is in an early phase in which finding that a modelexplains significant variance (of neuronal or voxelresponses or response pattern dissimilarities) is consid-ered an advance. This is a low bar. The theoretical advanceis not always substantial, because a great number ofqualitatively different models may capture some compo-nent of the representation. For theoretical progress, weneed statistical model comparisons along with estimates ofthe amount of non-noise variance left unexplained by eachmodel. Ideally, we would like to cover the entire space ofmodels that have not yet been strictly eliminated. Realis-tically, we may want to focus on a range of models that arequalitatively different in a single study. These shouldinclude models for which we have strong predictions (soas to put current opinion to the test) and models for whichwe have no strong predictions (to go beyond the state of theliterature and advance theory). In fMRI studies, we cantest our models in a variety of regions of interest orcontinuously throughout the measured volume using asearchlight approach [100]. Such more exploratory analy-ses represent another major source of important informa-tion. We can combine exploration and confirmation in asingle study using multiple-testing correction and cross-validation.
Testing of a wide range of well-motivated modelsin multiple brain regions constitutes an approach thatis simultaneously strongly hypothesis- and stronglydata-driven [15,101]. This is the kind of approach weneed to bridge the divide between modeling and experi-mental approaches, and to richly constrain brain theorywith empirical data. We must resist two temptations: (i)to shy away from disconfirmation of prevailing bias and(ii) to restrict our analyses to be able to tell a better‘story’. A story that crumbles upon consideration of abroader view of the available evidence (i.e., more com-prehensive analyses of our own data) is clearly not worthtelling.
Engaging temporal dynamics
Representations are inherently dynamic, emerging overtime as evidence from the sensory stream accumulates orrecurrent computations converge on an interpretation ofthe input. At the level of higher cognition, thoughts emergedynamically through the interplay of perception, long-termmemory associations, and the current contents of workingmemory. Representational dynamics can be investigatedby analyzing the representational geometry with a tempo-ral sliding window. Recent studies have begun to move inthis direction, using sliding-window decoding techniquesfor neuronal recordings [71] and human magnetoencepha-lography (MEG) [102–104] and electroencephalography(EEG) data [37].
409
Box 3. Outstanding questions
� How are representational geometries transformed across stages
of processing in vision and other modalities?
� How do perceptual representational geometries emerge over tens
and hundreds of milliseconds as sensory information accumulates
and recurrent computations converge?
� How do learning and expertise affect representational geometry?
� What aspects of behavior can we predict from the representational
geometry at different stages of the perception-to-action cycle?
� Can representational geometries explain unique aspects of an
individual’s mind and behavior?
� Are impairments of perception and cognition in mental illness
associated with atypical representational geometries? Can repre-
sentational geometries be tracked over time to characterize the
course of an illness and the effect of therapeutic interventions?
� What multivariate distance is best suited for measuring represen-
tational dissimilarities in neuronal or fMRI data?
� What mathematical concepts of topology and geometry might be
useful for understanding neuronal population codes (e.g., non-
Euclidean or nonmetric geometries)?
� How can neuronal coding theory best be brought to bear on
analyses of representational geometry?
� The geometric model of similarity judgments and generalization
behavior can help us understand neuronal population codes. Does
the same hold true for feature-, analogy-, and transformation-
based similarity models?
� What form of statistical inference best enables us to adjudicate
between competing models that explain representational
geometry?
Review Trends in Cognitive Sciences August 2013, Vol. 17, No. 8
Improving characterizations of representational
geometry
We might seek improvements to the approach of compar-ing representations by the rank correlation between theirdistance matrices. This approach does not require the(often questionable) assumption of a linear relationshipbetween the distances, and deals gracefully with the factthat distances estimated from noisy pattern estimates aregenerally positively biased. However, it also discards po-tentially important geometric information. A promisingcomplementary approach to comparing representationsbased on noisy data is pattern component modeling, inwhich the pattern variance is decomposed into compo-nents that correspond to experimental factors and noise[105].
Analysis of representational dissimilarity matrices isone important tool for understanding representationalgeometry. However, linear decoding remains useful as astraightforward test of linear separability (a particularfeature of the representational geometry) and of the degreeto which the linear decision boundary generalizes to dif-ferent stimuli. Nonlinear decoders based on quadraticboundaries or radial basis functions [106] similarly revealinformation that is available for immediate readout andmight thus be considered explicit in the code, just likeinformation available for linear readout. We will need arepertoire of specific models to test for a range of computa-tionally relevant properties of the representational geom-etry.
Considering different population codes and
representational distance measures
Current studies have largely defined representations asspatial activity patterns (e.g., from fMRI or windowedspike counts), with the activity level in each voxel orneuron contributing one dimension to the space. However,population coding theory has explored a much wider rangeof possible codes, including temporal codes. For example,the representational dissimilarity of two stimuli could bemeasured by comparing the temporal order in which neu-rons fire their first spike in response to the stimulus [107]or relative to the Gamma cycle [108]. Another approachwould be to use spatiotemporal or time–frequency patternsto define the representational space. In addition, a range ofdistance measures based on neuronal population spiketrains deserves to be explored [109].
Investigating plasticity and individual differences
One of the challenges in understanding the brain (or themind) is that it is not a unitary object. Everyone is differ-ent, and our brains are continually plastic. If we are tounderstand the mind or the brain, we must be interested ininterindividual variation and plasticity. Several studiessuggest that the neural representation of visual stimuli islargely shared across people [19,110,111]. Future workshould elucidate how representational geometries aretransformed through experience and whether, in additionto the component of the representation that is sharedbetween individuals, there is a replicable individuallyunique component that can explain a person’s uniqueperception and behavior.
410
Concluding remarksThe study of representational geometry has provided novelinsights into such diverse domains as vision and audition,categorical perception, memory encoding and recall, emo-tion, motor control, and higher cognitive processes includingconscious awareness. Representational geometry can serveas a hub that enables us to connect experiment and theory atthe crucial intermediate level of description, where compu-tational network models meet massively multivariate datafrom electrophysiological population recordings and high-resolution functional imaging. Moreover, representationalgeometries can be compared between stages of processing,between model and brain representations, between individ-uals and species, and between brain and behavior. Manyoutstanding questions remain (Box 3). Future studiesshould systematically test wider ranges of models, includingcomputational models, better integrate population-codingtheory, reveal the representational dynamics, and elucidaterepresentational plasticity and the individually unique com-ponent of representational geometries.
AcknowledgmentsThis work was funded by the Medical Research Council of the UK(programme MC-A060-5PR20) and by a European Research CouncilStarting Grant (ERC-2010-StG 261352) to N.K.
References1 Dennett, D. (1987) The Intentional Stance. MIT Press2 Forstmann, B.U. et al. (2011) Reciprocal relations between cognitive
neuroscience and formal cognitive models: opposites attract? TrendsCogn. Sci. 15, 272–279
3 Averbeck, B.B. et al. (2006) Neural correlations, population coding andcomputation. Nat. Rev. Neurosci. 7, 358–366
4 Kriegeskorte, N. and Kreiman, G., eds (2012) Visual PopulationCodes – Toward a Common Multivariate Framework for CellRecording and Functional Imaging, MIT Press
Review Trends in Cognitive Sciences August 2013, Vol. 17, No. 8
5 Torgerson, W.S. (1958) Theory and Methods of Scaling. Wiley6 Shepard, R.N. (1958) Stimulus and response generalization: tests of a
model relating generalization to distance in psychological space. J.Exp. Psychol. 55, 509–523
7 Shepard, R.N. (1987) Toward a universal law of generalization forpsychological science. Science 237, 1317–1323
8 Tversky, A. (1977) Features of similarity. Psychol. Rev. 84, 327–3529 Edelman, S. (1998) Representation is representation of similarities.
Behav. Brain Sci. 21, 449–46710 Gardenfors, P. (2004) Conceptual Spaces: The Geometry of Thought.
MIT Press11 Edelman, S.H. et al. (1998) Toward direct visualization of the internal
shape representation space by fMRI. Psychobiology 26, 309–32112 Laakso, A. and Cottrell, G. (2000) Content and cluster analysis:
assessing representational similarity in neural systems. Philos.Psychol. 13, 47–76
13 Op de Beeck, H.P. et al. (2001) Inferotemporal neurons represent low-dimensional configurations of parameterized shapes. Nat. Neurosci. 4,1244–1252
14 Aguirre, G.K. (2007) Continuous carry-over designs for fMRI.Neuroimage 35, 1480–1494
15 Kriegeskorte, N. et al. (2008) Representational similarity analysis –connecting the branches of systems neuroscience. Front. Syst.Neurosci. 2, 4
16 Mitchell, T.M. et al. (2008) Predicting human brain activity associatedwith the meanings of nouns. Science 320, 1191–1195
17 Naselaris, T. et al. (2011) Encoding and decoding in fMRI. Neuroimage56, 400–410
18 Kay, K.N. et al. (2008) Identifying natural images from human brainactivity. Nature 452, 352–355
19 Haxby, J.V. et al. (2011) A common, high-dimensional model of therepresentational space in human ventral temporal cortex. Neuron 72,404–416
20 Haxby, J.V. et al. (2001) Distributed and overlapping representations offaces and objects in ventral temporal cortex. Science 293, 2425–2430
21 Cox, D.D. and Savoy, R.L. (2003) Functional magnetic resonanceimaging (fMRI) ‘brain reading’: detecting and classifyingdistributed patterns of fMRI activity in human visual cortex.Neuroimage 19, 261–270
22 Carlson, T.A. et al. (2003) Patterns of activity in the categoricalrepresentation of objects. J. Cogn. Neurosci. 15, 704–717
23 Kamitani, Y. and Tong, F. (2005) Decoding the visual and subjectivecontents of the human brain. Nat. Neurosci. 8, 679–685
24 Mur, M. et al. (2009) Revealing representational content with pattern-information fMRI – an introductory guide. Soc. Cogn. Affect. Neurosci.4, 101–109
25 Norman, K.A. et al. (2006) Beyond mindreading: multi-voxel patternanalysis of fMRI data. Trends Cogn. Sci. 10, 424–430
26 Haynes, J.D. and Rees, G. (2006) Decoding mental states from brainactivity in humans. Nat. Rev. Neurosci. 7, 523–534
27 Tong, F. and Pratte, M.S. (2012) Decoding patterns of human brainactivity. Annu. Rev. Psychol. 63, 483–509
28 Tenenbaum, J.B. and Griffiths, T.L. (2001) Generalization, similarity,and Bayesian inference. Behav. Brain Sci. 24, 629–640
29 DiCarlo, J.J. and Cox, D. (2007) Untangling invariant objectrecognition. Trends Cogn. Sci. 11, 334–341
30 Kriegeskorte, N. (2011) Pattern-information analysis: from stimulusdecoding to computational-model testing. Neuroimage 56, 411–421
31 Carandini, M. et al. (2005) Do we know what the early visual systemdoes? J. Neurosci. 25, 10577–10597
32 Hegde, J. and Van Essen, D.C. (2007) A comparative study of shaperepresentation in macaque visual areas V2 and V4. Cereb. Cortex 17,1100–1116
33 Freeman, J. et al. (2013) A functional and perceptual signature of thesecond visual area in primates. Nat. Neurosci. 16, 1362–1377
34 Ziemba, C. et al. (2012) Selectivity and invariance are greater inmacaque V2 than V1. In Program of the 9th Annual Computationaland Systems Neuroscience Meeting. p. 150, COSYNE
35 Hiramatsu, C. et al. (2011) Transformation from image-based toperceptual representation of materials along the human ventralvisual pathway. Neuroimage 57, 482–494
36 Groen, I.I.A. et al. (2012) Low-level contrast statistics are diagnostic ofinvariance of natural textures. Front. Comp. Neurosci. 6, 2
37 Groen, I.I.A. et al. (2012) Spatially pooled contrast responses predictneural and perceptual similarity of naturalistic image categories.PLoS Comput. Biol. 8, e1002726
38 Brouwer, G.J. and Heeger, D.J. (2009) Decoding and reconstructingcolor from responses in human visual cortex. J. Neurosci. 29, 13992–14003
39 Adelson, E.H. (2001) On seeing stuff: the perception of materials byhumans and machines. Proc. SPIE 4299, 1–12
40 Op de Beeck, H.P. et al. (2008) Perceived shape similarity amongunfamiliar objects and the organization of the human object visionpathway. J. Neurosci. 28, 10111–10128
41 Haushofer, J. et al. (2008) Multivariate patterns in object-selectivecortex dissociate perceptual and physical shape similarity. PLoS Biol.6, e187
42 Drucker, D.M. and Aguirre, G.K. (2009) Different spatial scales ofshape similarity representation in lateral and ventral LOC. Cereb.Cortex 19, 2269–2280
43 Yamane, Y. et al. (2008) A neural code for three-dimensional objectshape in macaque inferotemporal cortex. Nat. Neurosci. 11, 1352–1360
44 Huth, A.G. et al. (2012) A continuous semantic space describes therepresentation of thousands of object and action categories across thehuman brain. Neuron 76, 1210–1224
45 Kriegeskorte, N. et al. (2008) Matching categorical objectrepresentations in inferior temporal cortex of man and monkey.Neuron 26, 1126–1141
46 Kiani, R. et al. (2007) Object category structure in response patterns ofneuronal population in monkey inferior temporal cortex. J.Neurophys. 97, 4296–4309
47 Naselaris, T. et al. (2012) Cortical representation of animate andinanimate objects in complex natural scenes. J. Physiol. Paris 106,239–249
48 Caramazza, A. and Shelton, J.R. (1998) Domain-specific knowledgesystems in the brain: the animate–inanimate distinction. J. Cogn.Neurosci. 10, 1–34
49 Davis, T. and Poldrack, R.A. (2013) Quantifying the internal structureof categories using a neural typicality measure. Cereb. Cortex http://dx.doi.org/10.1093/cercor/bht014
50 Mormann, F. et al. (2011) A category-specific response to animals inthe right human amygdala. Nat. Neurosci. 14, 1247–1249
51 Looser, C.E. et al. (2013) Multivoxel patterns in face-sensitivetemporal regions reveal an encoding schema based on detecting lifein a face. Soc. Cogn. Affect. Neurosci. http://dx.doi.org/10.1093/scan/nss078
52 Mahon, S.A. et al. (2009) Category-specific organization in the humanbrain does not require visual experience. Neuron 63, 397–405
53 Connolly, A.C. et al. (2012) The representation of biological classes inthe human brain. J. Neurosci. 32, 2608–2618
54 Mur, M. et al. (2013) Human object-similarity judgments reflect andtranscend the primate-IT object representation. Front. Percept. Sci.4, 128
55 Epstein, R. and Kanwisher, N. (1998) A cortical representation of thelocal visual environment. Nature 392, 598–601
56 Kanwisher, N. et al. (1997) The fusiform face area: a module in humanextrastriate cortex specialized for face perception. J. Neurosci. 17,4302–4311
57 Walther, D.B. et al. (2009) Natural scene categories revealed indistributed patterns of activity in the human brain. J. Neurosci.29, 10573–10581
58 Walther, D.B. et al. (2012) To err is human: correlating fMRI decodingand behavioral errors to probe the neural representation of naturalscene categories. In Visual Population Codes – Toward a CommonMultivariate Framework for Cell Recording and Functional Imaging(Kriegeskorte, N. and Kreiman, G., eds), pp. 391–416, MIT Press
59 Walther, D.B. et al. (2011) Simple line drawings suffice for functionalMRI decoding of natural scene categories. Proc. Natl. Acad. Sci.U.S.A. 108, 9661–9666
60 Kravitz, D.J. et al. (2011) Real-world scene representations in high-level visual cortex: it’s the spaces more than the places. J. Neurosci.31, 7322–7333
61 Harel, A. et al. (2013) Deconstructing visual scenes in cortex:gradients of object and spatial layout information. Cereb. Cortex 23,947–957
411

Review Trends in Cognitive Sciences August 2013, Vol. 17, No. 8
62 Morgan, L.K. et al. (2011) Distances between real-world locations arerepresented in the human hippocampus. J. Neurosci. 31, 1238–1245
63 Kriegeskorte, N. et al. (2007) Individual faces elicit distinct responsepatterns in human anterior temporal cortex. Proc. Natl Acad. Sci.U.S.A. 104, 20600–20605
64 Nestor, A. et al. (2011) Unraveling the distributed neural code of facialidentity through spatiotemporal pattern analysis. Proc. Natl. Acad.Sci. U.S.A. 108, 9998–10003
65 Anzellotti, S. et al. (2013) Decoding representations of face identitythat are tolerant to rotation. Cereb. Cortex http://dx.doi.org/10.1093/cercor/bht046
66 Goesaert, E. and Op de Beeck, H.P.O. (2013) Representations of facialidentity information in the ventral visual stream investigated withmultivoxel pattern analyses. J. Neurosci. 33, 8549–8558
67 Freiwald, W.A. and Tsao, D.Y. (2010) Functional compartmentalizationand viewpoint generalization within the macaque face-processingsystem. Science 330, 845–851
68 Kietzmann, T.C. et al. (2012) Prevalence of selectivity for mirror-symmetric views of faces in the ventral and dorsal visual pathways. J.Neurosci. 32, 11763–11772
69 DiCarlo, J.J. et al. (2012) How does the brain solve visual objectrecognition? Neuron 73, 415–434
70 Kravitz, D.J. et al. (2010) High-level visual object representations areconstrained by position. Cereb. Cortex 20, 2916–2925
71 Hung, C.P. et al. (2005) Fast readout of object identity from macaqueinferior temporal cortex. Science 310, 863–866
72 Rust, N.C. and DiCarlo, J.J. (2010) Selectivity and tolerance(‘invariance’) both increase as visual information propagates fromcortical area V4 to IT. J. Neurosci. 30, 12978–12995
73 Zoccolan, D. et al. (2005) Multiple object response normalization inmonkey inferotemporal cortex. J. Neurosci. 25, 8150–8164
74 Reddy, L. and Kanwisher, N. (2007) Category selectivity in the ventralvisual pathway confers robustness to clutter and diverted attention.Curr. Biol. 2067–2072
75 Reddy, L. et al. (2009) Attention and biased competition in multi-voxel object representations. Proc. Natl. Acad. Sci. U.S.A. 106,21447–21452
76 MacEvoy, S.P. and Epstein, R.A. (2009) Decoding the representationof multiple simultaneous objects in human occipitotemporal cortex.Curr. Biol. 19, 943–947
77 Carandini, M. and Heeger, D.J. (2012) Normalization as a canonicalneural computation. Nat. Rev. Neurosci. 13, 51–62
78 Said, C.P. et al. (2010) Distributed representations of dynamic facialexpressions in the superior temporal sulcus. J. Vis. 10, 1–12
79 Peelen, M.V. et al. (2010) Supramodal representations of perceivedemotions in the human brain. J. Neurosci. 30, 10127–10134
80 Carlin, J.D. et al. (2011) A head view-invariant representation ofgaze direction in anterior superior temporal sulcus. Curr. Biol. 21,1817–1821
81 Lee, S.H. et al. (2012) Disentangling visual imagery and perception ofreal-world objects. Neuroimage 4, 4064–4073
82 Stokes, M. et al. (2009) Top-down activation of shape-specificpopulation codes in visual cortex during mental imagery. J.Neurosci. 29, 1565–1572
83 Cichy, R.M. et al. (2012) Imagery and perception share corticalrepresentations of content and location. Cereb. Cortex 22, 372–380
84 Giordano, B.L. et al. (2013) Abstract encoding of auditory objects incortical activity patterns. Cereb. Cortex http://dx.doi.org/10.1093/cercor/bhs162
85 Staeren, N. et al. (2009) Sound categories are represented asdistributed patterns in the human auditory cortex. Curr. Biol. 19,498–502
86 Chang, E.F. et al. (2010) Categorical speech representation in humansuperior temporal gyrus. Nat. Neurosci. 13, 1428–1432
87 Raizada, R.D.S. et al. (2010) Quantifying the adequacy of neuralrepresentations for a cross-language phonetic discrimination task:prediction of individual differences. Cereb. Cortex 20, 1–12
412
88 Howard, J.D. et al. (2009) Odor quality coding and categorization inhuman posterior piriform cortex. Nat. Neurosci. 12, 932–938
89 Polyn, S.M. et al. (2005) Category-specific cortical activity precedesretrieval during memory search. Science 310, 1963–1966
90 Xue, G. et al. (2010) Greater neural pattern similarity acrossrepetitions is associated with better memory. Science 330, 97–101
91 Schurger, A. et al. (2010) Reproducibility distinguishes conscious fromnonconscious neural representations. Science 327, 97–99
92 LaRocque, K.F. et al. (2013) Global similarity and pattern separationin the human medial temporal lobe predict subsequent memory. J.Neurosci. 33, 5466–5474
93 Staresina, B.P. et al. (2012) Episodic reinstatement in the medialtemporal lobe. J. Neurosci. 32, 18150–18156
94 Ritchey, M. et al. (2013) Neural similarity between encoding andretrieval is related to memory via hippocampal interactions. Cereb.Cortex http://dx.doi.org/10.1093/cercor/bhs258
95 Visser, R.M. et al. (2011) Associative learning increases trial-by-trialsimilarity of BOLD-MRI patterns. J. Neurosci. 31, 12021–12028
96 Visser, R.M. et al. (2013) Neural pattern similarity predicts long-termfear memory. Nat. Neurosci. 16, 388–390
97 Georgopoulos, A.P. et al. (1986) Neuronal population coding ofmovement direction. Science 233, 1416–1419
98 Wiestler, T. et al. (2011) Integration of sensory and motorrepresentations of single fingers in the human cerebellum. J.Neurophysiol. 105, 3042–3053
99 Diedrichsen, J. et al. (2013) Two distinct ipsilateral corticalrepresentations for individuated finger movements. Cereb. Cortex23, 1362–1377
100 Kriegeskorte, N. et al. (2006) Information-based functional brainmapping. Proc. Natl. Acad. Sci. U.S.A. 103, 3863–3868
101 Kievit, R.A. et al. (2011) Mind the gap: a psychometric approach to thereduction problem. Psychol. Inq. 22, 67–87
102 Carlson, T.A. et al. (2011) High temporal resolution decoding of objectposition and category. J. Vis. 11, 1–17
103 Su, L. et al. (2012) Spatiotemporal searchlight representationalsimilarity analysis in EMEG source space. In Proceedings of the2012 IEEE Workshop on Pattern Recognition in Neuroimaging. pp.97–100, IEEE
104 Carlson, T.A. et al. (2013) Representational dynamics of object vision:the first 1000 ms. J. Vis (in press)
105 Diedrichsen, J. et al. (2011) Comparing the similarity and spatialstructure of neural representations: a pattern-component model.Neuroimage 55, 1665–1678
106 Poggio, T. and Girosi, F. (1990) Regularization algorithms for learningthat are equivalent to multilayer networks. Science 247, 978–982
107 Rullen, R.V. and Thorpe, S.J. (2001) Rate coding versus temporalorder coding: what the retinal ganglion cells tell the visual cortex.Neural Comput. 13, 1255–1283
108 Fries, P. et al. (2007) The gamma cycle. Trends Neurosci. 30, 309–316109 Houghton, C. and Victor, J. (2010) Measuring representational
distances – the spike-train metrics approach. In Visual PopulationCodes – Toward a Common Multivariate Framework for CellRecording and Functional Imaging (Kriegeskorte, N. and Kreiman,G., eds), pp. 391–416, MIT Press
110 Raizada, R.D.S. and Connolly, A.C. (2012) What makes differentpeople’s representations alike: neural similarity-space solves theproblem of across-subject fMRI decoding. J. Cogn. Neurosci. 24,868–877
111 Shinkareva, S.V. et al. (2012) Exploring commonalities acrossparticipants in the neural representation of objects. Hum. Brain.Mapp. 33, 1375–1383
112 Dumoulin, S.O. and Wandell, B.A. (2008) Population receptive fieldestimates in human visual cortex. Neuroimage 39, 647–660
113 Cauda, F. et al. (2012) Shared ‘core’ areas between the pain and othertask-related networks. PLoS ONE 7, e41929
114 Yarkoni, T. et al. (2011) Large-scale automated synthesis of humanfunctional neuroimaging data. Nat. Methods 8, 665–670