representation of confidence in assurance cases using the
TRANSCRIPT

University of Pennsylvania University of Pennsylvania
ScholarlyCommons ScholarlyCommons
Departmental Papers (CIS) Department of Computer & Information Science
1-2016
Representation of Confidence in Assurance Cases Using the Beta Representation of Confidence in Assurance Cases Using the Beta
Distribution Distribution
Lian Duan
Sanjai Rayadurgam
Mats Heimdahl
Oleg Sokolsky University of Pennsylvania, [email protected]
Insup Lee University of Pennsylvania, [email protected]
Follow this and additional works at: https://repository.upenn.edu/cis_papers
Part of the Computer Engineering Commons, and the Computer Sciences Commons
Recommended Citation Recommended Citation Lian Duan, Sanjai Rayadurgam, Mats Heimdahl, Oleg Sokolsky, and Insup Lee, "Representation of Confidence in Assurance Cases Using the Beta Distribution", 2016 IEEE 17th International Symposium on High Assurance Systems Engineering (HASE) , 86-93. January 2016. http://dx.doi.org/10.1109/HASE.2016.52
IEEE High Assurance Systems Engineering Symposium (HASE 2016), Orlando, Florida, USA, January 7 - 9, 2016.
This paper is posted at ScholarlyCommons. https://repository.upenn.edu/cis_papers/812 For more information, please contact [email protected].

Representation of Confidence in Assurance Cases Using the Beta Distribution Representation of Confidence in Assurance Cases Using the Beta Distribution
Abstract Abstract Assurance cases are used to document an argument that a system—such as a critical software system—satisfies some desirable property (e.g., safety, security, or reliability). Demonstrating high confidence that the claims made based on an assurance case can be trusted is crucial to the success of the case. Researchers have proposed quantification of confidence as a Baconian probability ratio of eliminated concerns about the assurance case to the total number of identified concerns. In this paper, we extend their work by mapping this discrete ratio to a continuous probability distribution—a beta distribution— enabling different visualizations of the confidence in a claim. Further, the beta distribution allows us to quantify and visualize the uncertainty associated with the expressed confidence. Additionally, by transforming the assurance case into a reasoning structure, we show how confidence calculations can be performed using beta distributions.
Disciplines Disciplines Computer Engineering | Computer Sciences
Comments Comments IEEE High Assurance Systems Engineering Symposium (HASE 2016), Orlando, Florida, USA, January 7 - 9, 2016.
This conference paper is available at ScholarlyCommons: https://repository.upenn.edu/cis_papers/812

Representation of Confidence in Assurance Casesusing the Beta Distribution
Lian Duan∗, Sanjai Rayadurgam∗, Mats Heimdahl∗, Oleg Sokolsky†, Insup Lee†∗Department of Computer Science and Engineering
University of Minnesota{lduan, rsanjai, heimdahl}@cs.umn.edu
†Department of Computer and Information ScienceUniversity of Pennsylvania{sokolsky, lee}@cis.upenn.edu
Abstract—Assurance cases are used to document an argument that
a system—such as a critical software system—satisfies somedesirable property (e.g., safety, security, or reliability). Demon-strating high confidence that the claims made based on anassurance case can be trusted is crucial to the success of thecase. Researchers have proposed quantification of confidence asa Baconian probability ratio of eliminated concerns about theassurance case to the total number of identified concerns. Inthis paper, we extend their work by mapping this discrete ratioto a continuous probability distribution—a beta distribution—enabling different visualizations of the confidence in a claim.Further, the beta distribution allows us to quantify and visualizethe uncertainty associated with the expressed confidence. Ad-ditionally, by transforming the assurance case into a reasoningstructure, we show how confidence calculations can be performedusing beta distributions.
I. INTRODUCTION
Assurance cases are structured logical arguments that areused to document how a claim is supported by evidence.Assurance cases are becoming increasingly popular, especiallyin safety-critical areas such as medical devices and civilaviation. A well-argued assurance case can be used to showthat a system satisfies desirable properties such as safety(thus becoming a safety case), reliability, or security. The UKMinistry of Defence describes a safety case as:
“A structured argument, supported by a body ofevidence that provides a compelling, comprehensibleand valid case that a system is safe for a givenapplication in a given operating environment.” [1].
In the United States, manufacturers of certain medicaldevices that seek FDA approval must show that they are safethrough, among other things, the use of an assurance case.The preparation of the assurance case demonstrates that themanufacturer has considered how various pieces of evidencesuch as testing results, pre-clinical trials, user studies, anddocumentation support a claim of safety. The reviewer mustnow decide, given all supporting information, if he or sheagrees with with the manufacturer. An important factor in this
This work has been partially supported by NSF grants CNS-0931931 andCNS-1035715.
process is the amount of confidence the reviewer has in theevidence given and on how the assurance case has been pre-pared and structured. Being able to evaluate this confidence insome systematic way is crucial to the evaluation of assurancecases. While the process has a certain subjectiveness due todifferences in reviewers, it is our hope that such a systematicapproach will bring a consistency to the results.
Hawkins et al. [9] introduced a qualitative approach toestablishing confidence in an assurance case. They proposedthe concept of an assured safety argument—an assurance caseand its corresponding confidence case. The confidence caseis based on arguing the sufficiency of the implications in anassurance case written in a graphical notation like GSN [12].The crux of their approach is to find assurance deficits—anything that could reduce one’s confidence in the assurancecase—and argue why these are acceptable.
Goodenough et al. [5] extend Hawkins et al.’s work byquantifying confidence as a Baconian probability. This ratiois derived from inductive reasoning—increasing confidencethrough increased knowledge. This Baconian probability ratiois a pair of integers frequently written in a fractional notationfor convenience. The number of assurance deficits (“doubts”or “defeaters”) that have been eliminated or mitigated isthe numerator-like value while the total number of doubtsidentified is the denominator-like value. The Baconian proba-bilities are then summed up the assurance case to result in aconfidence probability value for the entire assurance case.
We extend the work of Hawkins et al. and Goodenoughet al. by quantifying and visualizing the Baconian probabilitywith the beta distribution. The beta distribution can take ona variety of shapes and usually has the range 0 − 1, makingit ideal for probabilities. It has two parameters, α and β, thataffect the shape and scale of the distribution. As α and βincrease, the variance of the graph decreases. Increasing αshifts the mode of the distribution to the right (towards 1)while increasing β shifts the mode of the distribution to theleft (towards 0). When α and β are equal, the distribution issymmetric. The number of doubts eliminated can be mappeddirectly onto the α parameter and the number of doubtsremaining can be mapped directly onto the β parameter. Intu-
1
itively, this makes sense—as the number of doubts eliminatedgrows, so does our confidence. We then can use propertiesof the beta distribution to calculate the uncertainty. Instead ofsimply summing up the Baconian probability values, however,we propose a weighting scheme with the beta distributionparameters and a logical restructuring of the assurance caseto make a more intuitive argument. The use of the betadistribution also allows us to use Jøsang’s opinion triangle [10]as an additional visualization tool. Jøsang introduces a directmapping from the beta distribution to the opinion triangleand back via subjective logic. The opinion triangle visualizesan opinion on an intuitive three-dimensional scale of belief,disbelief, and uncertainty. According to Habib et al. [8], theopinion triangle is “very well suited for analysis done byexperts,” which fits what we are proposing. Although theyultimately conclude that a different trust analysis system ismore intuitive for the lay person, the opinion triangle will beapt in our case.
II. BACKGROUND AND RELATED WORK
We will go into a bit of background related to assurancecases, relevant approaches to evaluating confidence in assur-ance cases, and the beta distribution. Additionally, we willhighlight relevant related work.
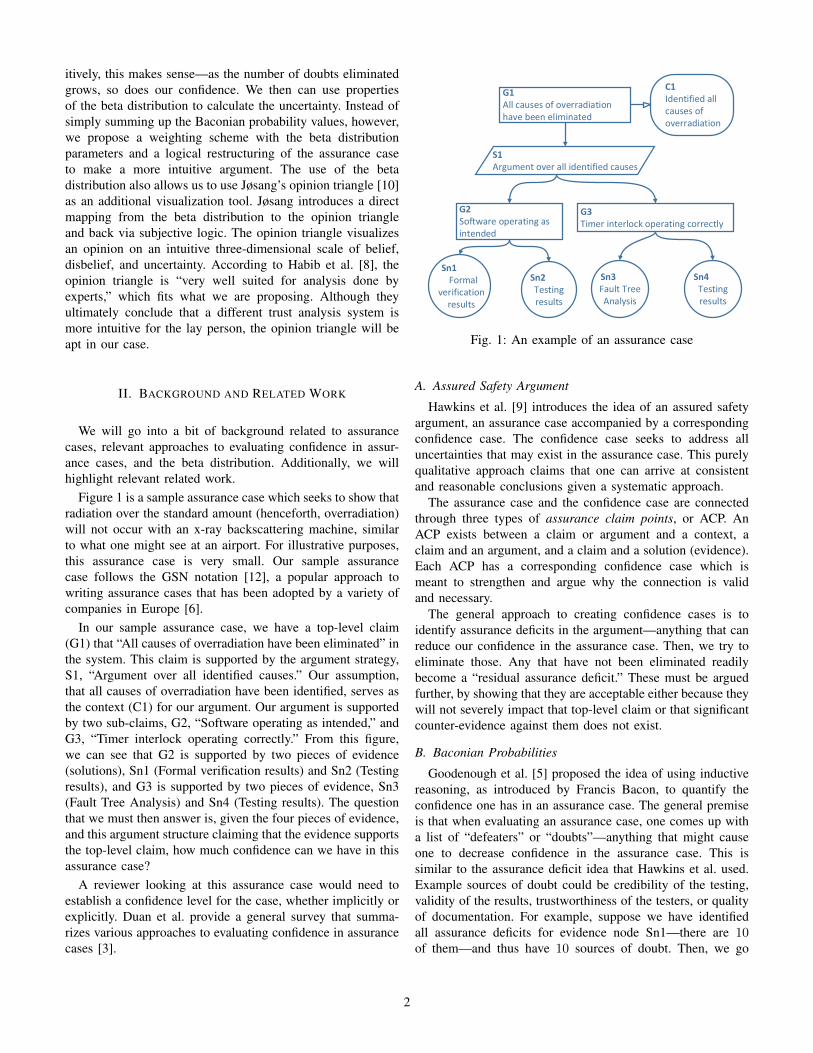
Figure 1 is a sample assurance case which seeks to show thatradiation over the standard amount (henceforth, overradiation)will not occur with an x-ray backscattering machine, similarto what one might see at an airport. For illustrative purposes,this assurance case is very small. Our sample assurancecase follows the GSN notation [12], a popular approach towriting assurance cases that has been adopted by a variety ofcompanies in Europe [6].
In our sample assurance case, we have a top-level claim(G1) that “All causes of overradiation have been eliminated” inthe system. This claim is supported by the argument strategy,S1, “Argument over all identified causes.” Our assumption,that all causes of overradiation have been identified, serves asthe context (C1) for our argument. Our argument is supportedby two sub-claims, G2, “Software operating as intended,” andG3, “Timer interlock operating correctly.” From this figure,we can see that G2 is supported by two pieces of evidence(solutions), Sn1 (Formal verification results) and Sn2 (Testingresults), and G3 is supported by two pieces of evidence, Sn3(Fault Tree Analysis) and Sn4 (Testing results). The questionthat we must then answer is, given the four pieces of evidence,and this argument structure claiming that the evidence supportsthe top-level claim, how much confidence can we have in thisassurance case?
A reviewer looking at this assurance case would need toestablish a confidence level for the case, whether implicitly orexplicitly. Duan et al. provide a general survey that summa-rizes various approaches to evaluating confidence in assurancecases [3].
G1All causes of overradiation have been eliminated
C1Identified all causes of overradiation
S1Argument over all identified causes
G2Software operating as intended
G3Timer interlock operating correctly
Sn1Formal
verification results
Sn2Testing results
Sn3Fault Tree Analysis
Sn4Testing results
Fig. 1: An example of an assurance case
A. Assured Safety Argument
Hawkins et al. [9] introduces the idea of an assured safetyargument, an assurance case accompanied by a correspondingconfidence case. The confidence case seeks to address alluncertainties that may exist in the assurance case. This purelyqualitative approach claims that one can arrive at consistentand reasonable conclusions given a systematic approach.
The assurance case and the confidence case are connectedthrough three types of assurance claim points, or ACP. AnACP exists between a claim or argument and a context, aclaim and an argument, and a claim and a solution (evidence).Each ACP has a corresponding confidence case which ismeant to strengthen and argue why the connection is validand necessary.
The general approach to creating confidence cases is toidentify assurance deficits in the argument—anything that canreduce our confidence in the assurance case. Then, we try toeliminate those. Any that have not been eliminated readilybecome a “residual assurance deficit.” These must be arguedfurther, by showing that they are acceptable either because theywill not severely impact that top-level claim or that significantcounter-evidence against them does not exist.
B. Baconian Probabilities
Goodenough et al. [5] proposed the idea of using inductivereasoning, as introduced by Francis Bacon, to quantify theconfidence one has in an assurance case. The general premiseis that when evaluating an assurance case, one comes up witha list of “defeaters” or “doubts”—anything that might causeone to decrease confidence in the assurance case. This issimilar to the assurance deficit idea that Hawkins et al. used.Example sources of doubt could be credibility of the testing,validity of the results, trustworthiness of the testers, or qualityof documentation. For example, suppose we have identifiedall assurance deficits for evidence node Sn1—there are 10of them—and thus have 10 sources of doubt. Then, we go
2

through each doubt and eliminate it by resolving or mitigatingit—for example, 8 doubts have been eliminated—or decideit cannot be eliminated—2 doubts remain unresolved. Theseunresolved doubts are similar to the residual assurance deficitsmentioned by Hawkins et al. The confidence one has in anassurance case is then represented as a Baconian probability—a ratio of the number of doubts eliminated to the total numberof doubts. This ratio is irreducible, as 4
5 would represent anentirely different confidence value than 8
10—the latter showsa higher confidence value and indicates that more doubts hadbeen found and ultimately mitigated or eliminated.
Figure 2 shows our sample assurance case with exampleBaconian probability values and how they would be combined,by summing up the assurance case, to arrive at a finalconfidence value for the entire case.
G1All causes of overradiation have been eliminated
C1Identified all causes of overradiation
S1Argument over all identified causes
G2Software operating as intended
G3Timer interlock operating correctly
Sn1Formal
verification results
Sn2Testing results
Sn3Fault Tree Analysis
Sn4Testing results
5/6 6/7 2/8 3/9
11/13 5/17
16/30
Fig. 2: Assurance case with sample Baconian probabilities
C. Dempster-Shafer Theory
Dempster-Shafer theory seeks to reason about uncertaintyby quantifying confidence (or belief) as a mass value. Thismass value, which is between 0 and 1, grows as our confidencegrows. The confidence value can exist on a range bounded bybelief on the lower end and plausibility on the upper end.Existing information is used to find the boundaries of thispossible range.
What makes Dempster-Shafer theory unique is that it sep-arates out uncertainty from belief and disbelief. Uncertaintyis treated explicitly as the quantity left over after beliefand disbelief have been accounted for. Jøsang visualizes thisconcept as an opinion triangle, as seen in Figure 3 (a). Anopinion, ω, is represented by three parameters—belief (b),disbelief (d), and uncertainty (u), on this bounded, triangularplane.
Cyra and Gorski [2] use Dempster-Shafer theory, the opin-ion triangle, and Toulmin’s argumentation theory [13] in theircalculations and visualizations of confidence in assurancecases. Figure 4 shows our sample assurance case as visualized
Fig. 3: Jøsang’s Opinion Triangle
by the tool created by Cyra and Gorski. The left side showsthe text-style assurance case as espoused by Cyra and Gorski.Similar to GSN, it has a top level claim, a context for thatclaim, an argument for the entire assurance case, subclaims,and pieces of evidence (solutions). The biggest change fromGSN is the requirement of a justification for the argument.On the right, we see how users can choose to set confidenceand decision ratings for different components of the assurancecase.
D. Beta Distribution
The beta distribution is part of “a most flexible family ofdistributions” [7], a continuous version of the binomial distri-bution on the range from 0 to 1, making it very appropriatefor modeling probabilities. It is popular for use in Bayesiananalysis [7]. The beta function is defined by:
B(α, β) =
∫ 1
0
zα−1(1− z)β−1dz (1)
Its probability density function (pdf) is described by twoparameters, α and β. The pdf is described by:
f(x;α, β) =1
B(α, β)xα−1(1− x)β−1, 0 < x < 1 (2)
where α > 0, β > 0, and B(α, β) is the beta function.When α and β are both 1, beta(1, 1) is the uniform distribu-
tion. When α and β are equal, the beta distribution models anapproximate Gaussian shape. When α and β are both less than1, the beta distribution takes a “U” shape, with the special caseof beta(0.5, 0.5) being the arc-sine distribution [7]. When β is1, the distribution takes on a power shape. When α and β areboth greater than 1 and not equal, the beta distribution takeson a skewed Gaussian shape, where the mean and mode ofthe curve are not equal. Figure 5 shows some of these shapes.
As α increases while β stays the same, the peak of thecurve shifts to the right. This increase can viewed as morepositive information incoming, such as with reviews. Eachreview increases our α value, and increases our trust whilealso reducing the uncertainty due to the fact that we have moreinformation. As β increases while α stays the same, the peakof the curve shifts to the left. This movement can be viewed asmore negative information incoming, such as negative reviewsthat reduce our trust, but also reduce uncertainty. As α or
3

Fig. 4: Assurance case and assessment example using Argevide Nor-Sta
Fig. 5: Sample beta distribution shapes
β increases, the maximum value of the peak increases whilethe uncertainty, or variance of the curve, decreases. This canbe viewed as knowledge being increased, thereby reducinguncertainty or ignorance.
Josang [11] provides a mapping between his opiniontriangle and the beta distribution, as seen in Figure 3.This mapping depends on the values of belief, disbelief,uncertainty, and the prior belief value, a known quan-tity with no uncertainty. In Figure 3, we have an opin-ion {belief, disbelief, uncertainty} of {0.7, 0.1, 0.2}, whichtranslates to a beta distribution with parameters beta(8, 2). Wecan see in the opinion triangle that this opinion has fairlyhigh belief and low disbelief, but also has a fair amount ofuncertainty. These facts are reflected in the beta distributionwith a peak around 0.8, but quite a high variance.
Duan et al. [4] first proposed the use of the beta distributionto represent confidence in assurance cases. This paper extendsthat work with an application of the beta distribution withBaconian probabilities, the use of a weighting scale, and amore formal approach to restructuring the assurance case into
a logical argument.
III. TECHNICAL APPROACH
A. Visualization of Confidence
The beta distribution can be used to visualize the Baconianprobability (nd ) representing confidence. One can view the αparameter of the beta distribution as representing the numberof doubts that have been eliminated—increasing our confi-dence and decreasing our uncertainty. The β parameter wouldrepresent the number of doubts that still remain (the numeratorsubtracted from the denominator)—items that would reduceour confidence while also decreasing our uncertainty.
When all the doubts have been eliminated in Baconianprobability, the numerator and denominator components areequal and we have full confidence. As visualized by a betadistribution, the β parameter is 0, and we would have adiscontinuity (spike) at 1. For a Baconian probability valueof 16
30 , we would get the corresponding α and β values ofbeta(16, 14).
Assuming n is the Baconian numerator and d is the Baco-nian denominator, the mapping is thus:
α = n (3)
β = d− n (4)
Figure 6 shows the beta distributions as mapped fromBaconian probability values for each of the evidence nodes,Sn1 (beta(5, 1)), Sn2 (beta(6, 1)), Sn3 (beta(2, 6)), and Sn4(beta(3, 6)). The distributions for each node are given indifferent colors and line styles. We see that for Sn1 andSn2, which only have one defeater each, the graph is a low-sloped J-shape. Sn2 has a higher slope than Sn1, due to theextra information that exists for it. Sn3 and Sn4 have theirmodes more in the left side of the graph, reflecting our lowconfidence (or higher disbelief) in them. Figure 7 shows thedistributions for the evidence nodes Sn1 (beta(5, 1)) and Sn2(beta(6, 1)), and the combination of the two, the confidencefor the software claim node G2 (beta(11, 2)). We see that theadditional defeater minimizes the ability for our confidence
4

to be at 1, but the disbelief is also reduced slightly. Figure 8shows the distributions for the evidence nodes Sn3 (beta(2, 6))and Sn4 (beta(3, 6)), and the combination of the two, theconfidence for the hardware claim node G3 (beta(5, 12)). Thecombination graph has a higher peak and lower uncertaintythan the two component graphs, and its mode is situatedbetween the two, as one would expect. Lastly, Figure 9 showsthe distributions for the software node (beta(11, 2)) and thehardware node (beta(5, 12)), and the combination of the two,the confidence for the overradiation node, G1, and the entireassurance case (beta(16, 14)). We see that when combiningtwo very disparate graphs, we arrive at a distribution almonstevenly between the two. These examples show the addedrichness of understanding that is provided when visualizingthe Baconian probability ratio as a beta distribution.
Fig. 6: Beta distributions for confidence in the evidence nodesSn1 - Sn4
Fig. 7: Beta distributions for confidence in the software nodeG2
By using the beta distribution, we explicitly add a thirddimension of information that did not previously exist inthe Baconian approach—the separation out of uncertainty.Uncertainty in the beta distribution can be calculated as thedifference between the two inflection points of the curve. This
Fig. 8: Beta distributions for confidence in the hardware nodeG3
Fig. 9: Beta distributions for confidence in the overradiationnode G1
gives a specific, quantifiable value to uncertainty that can aidin assessment. The calculation for the inflection points of thebeta distribution is:
α− 1
α+ β − 2± 1
α+ β − 2
√(α− 1)(β − 1)
α+ β − 3(5)
Note that when α or β is equal to one, the inflection pointsare both either 0 or 1, respectively, so Eq. 5 cannot be used tocalculate an uncertainty value. In such a situation, we proposean alternative method for evaluating uncertainty. Two timesthe distance from 0 (for α) or 1 (for β) of the expected valueof the beta distribution,
α
α+ β(6)
should to be used. The inflection points of the beta distributionare approximately located on either side of expected value. But
5

with a J-shaped graph like we see when α or β is 1, we don’thave inflection points—the slope is constantly increasing asit gets closer and closer to 0 or 1, respectively. The expectedvalue, which can be viewed as the center of the distribution,would then give us a measure of how far from either extrememost of the data is centered. We then multiply this value by2 to account for the two inflection points that exist otherwise.Table I shows the uncertainty values for the evidence nodes.
An additional visualization tool is available with the useof the beta distribution. Introduced by Josang [10], it iscalled an opinion triangle, a triangle whose vertices representbelief (right bottom corner), disbelief (left bottom corner),and uncertainty (top corner). Josang developed a mappingbetween the beta distribution and the opinion triangle, via theuse of subjective logic [11]. Figure 10 shows our Baconianprobability value of 16
30 (represented by a beta distribution ofbeta(16, 14)) as plotted on Jøsang’s opinion triangle. We cansee that we have fairly low uncertainty, due to the quantityof information, but our information is a bit conflicting, sowe are almost at the middle between disbelief and belief. Areviewer examining this assurance case with a confidence ofa Baconian probability ratio of 16
30 will then have two optionsfor visualizing this confidence value beyond the numericalvalues given in the table—either as the central beta distributionfrom Figure 9 or as the dot on the opinion triangle inFigure 10. Even though the distribution seemed to have ahigh uncertainty, from the opinion triangle we can see that it isactually not so high as to cause alarm. We can also clearly see,from the triangle, how evenly divided we are in the opinion.
Fig. 10: Baconian probability example on an opinion triangle
B. Weighting Scheme
In Goodenough et. al.’s approach, any uncertainty that existsis accounted for in the doubts that have accumulated. Thesedoubts only exist at the leaf level of the assurance case—the evidence nodes—and to find a confidence value for theentire case, one simply sums up the tree structure (as seen inFigure 2).
We, however, believe that simple addition will not beenough for calculating a final confidence value. This is be-cause there are factors that have not been accounted for—forexample, the assurance case structure might not be correct,or one evidence should have more importance (weight) thananother one. As an example for the latter, suppose two ofthe sources of doubts we have for Sn2: Testing Results are(1) whether or not proper documentation was employed, and(2) all the tests have passed to a statement coverage criteria,instead of a higher standard such as MC/DC. It is unrealisticto put equal weights to these two sources of doubts, as (2) ismore important than (1).
We propose a weighting scheme for such a situation, tobe applied to the parameters of the beta distribution for eachof the evidence nodes. The weighting scheme will have fiveoptions: very low impact (scale by 0.5), low impact (scaleby 0.75), medium (default) impact (scale by 1.0) , highimpact (scale by 1.5), and very high impact (scale by 2.0).Each evidence node should have a corresponding weight, orimportance, which will figure into ultimate calculations. Eachsub-claim node should also have a corresponding weight.Figure 11 shows sample weights for our Baconian probabilityassurance case. We have deemed the software branch of theassurance case to have more weight than the hardware branch,and have weighted the various nodes according. As such, eventhough we have low confidence in the hardware node, thefact that we have high confidence in the software node shouldbe more important. Figure 12 shows the beta distribution forthe top-level claim for both the original Baconian probabilityvalues (red, dotted line) and the weighted Baconian probabilityvalues (blue, solid line). We can see that, as expected, theweighted distribution has a peak at a higher confidence value,reflecting the higher confidence we have in the assurance casedue to the weighting system. As a result of our weightingsystem, we no longer have integers for the confidence values.This is a fairly trivial concern—the beta distribution has nosuch limit on whether its parameters are integers or reals,and our use of the Baconian probability only extends to theevidence nodes.
C. Combination of Evidence and Uncertainty
When analyzing the way confidence is combined in anassurance case, we can switch to a fault tree analysis-likestructure to aid us. We are thus no longer limited to thestraightforward addition approach as used by Goodenoughet al. We call this a reasoning structure. Depending on theassurance case, evidence can be combined with an AND or ORoperator (and in the future, others as needed). An OR operatorwould not be accurately represented by simple addition, whichwould disproportionately favor the weaker argument.
For an assurance case, we want to make an argument over allcauses, so each branch needs to be evaluated carefully, becausewe seek to make the strongest argument possible. When eval-uating the confidence, however, the argument structure couldbe changed, because, depending on the reasoning structure,confidence in only one branch would be enough.
6

TABLE I: Uncertainty values calculated from the beta distribution
Node Name α β Expected Value Inflection Point 1 Inflection Point 2 UncertaintySn1 Formal verification results 5 1 0.833 1 1 0.333
Sn2 Testing results 6 1 0.857 1 1 0.286Sn3 Fault Tree Analysis 2 6 0.25 0.333 0 0.333
Sn4 Testing results 3 6 0.333 0.470 0.101 0.369G2 Software node 11 2 0.846 1 0.818 0.182G3 Hardware node 5 12 0.294 0.385 0.148 0.236
G1 Overradiation node 16 14 0.533 0.632 0.440 0.192
G1All causes of overradiation have been eliminated
C1Identified all causes of overradiation
S1Argument over all identified causes
G2Software operating as intended
G3Timer interlock operating correctly
Sn1Formal
verification results
Sn2Testing results
Sn3Fault Tree Analysis
Sn4Testing results
5/6 6/7 2/8 3/9
19.5/23 4.5/15
43.5/61
5 3
45
32
Fig. 11: Assurance case with Baconian probabilities andweights
Fig. 12: Beta distributions for weighted evidence nodes
As an example, consider our assurance case with Baconianprobability values assigned to the nodes as seen in Figure 2.The timer interlock (hardware) branch has a lot of doubts thathave not been eliminated, so it has a very low confidencevalue of 5
17 . If we continued with the Baconian approach,we would have a moderate confidence value of 16
30 for theentire assurance case. Such a (comparedly) low confidencevalue would not give one much confidence in the system beingassured. Figure 9 shows the Baconian probability values forthe software, hardware, and overradiation nodes as convertedto beta distribution parameters and then plotted. We see thatone branch has high confidence (mode of graph is shifted tothe right) while the other branch has low confidence (mode ofgraph is shifted to the left), resulting in a medium confidencefor the assurance case.
We can, however, change the assurance case into ourreasoning structure (Figure 13). The conversion requires oneto analyze the specific situation and see what kind of reasoningstructure should best be used. In our case, for overradiationto occur, we would need a failure in both the software andthe hardware components. However, since our claim is that“No overradiation will occur,” and we know that there is anexisting redundancy system in place where both componentshave to fail for overradiation to occur, we just need to haveenough confidence in one branch not failing to have enoughconfidence in the whole assurance case—thus, we use an ORargument. No overradiation will occur if the software doesnot fail or the hardware does not fail (or neither fails). Thenew beta distributions for the logical argumentation structureis shown in Figure 14. We can see that now we have fairly highconfidence in the assurance case, reflecting our confidencein the redundancy system that exists in the x-ray machine.In normal probability, a logical-OR construct has a higherprobability of occurence than either of its components. Bychoosing the branch in which we have the highest confidence,we are actually taking a conservative approach to ensure thatwe have at least accounted for a minimum possible confidencevalue.
IV. CONCLUSION
Assurance cases have become increasing popular in areas ofsafety-critical systems. Being able to capture the confidenceand uncertainty one has in an assurance case in a quantifiableway is extremely helpful. We have introduced a way ofvisualizing the Baconian probability method of representingconfidence in an assurance case with the use of the betadistribution and the opinion triangle and provided an example
7

No overradiation
No software failure No hardware failure
Sn1Formal
verification results
Sn2Testing results
Sn3Fault Tree Analysis
Sn4Testing results
5/6 6/72/8 3/9
11/13 5/17
11/13
Fig. 13: Logical Argument for Example Assurance Case
Fig. 14: Beta distribution representation of Baconian proba-bilities in the logical argument structure
of its use. Additionally, we have established a method tocalculate the uncertainty associated with an evidence node ofan assurance case based on the inflection points and expectedvalues of the beta distribution. These approaches will givea sound, mathematical basis to calcuating uncertainty. Wealso introduced a weighting scheme to make calculations ofconfidences more realistic. Lastly, we introduced a reasoningstructure to better combine confidences for different nodes ofan assurance case. It is our hope that these approaches willprovide a clearer, more consistent method of quantifying con-fidence and uncertainty for an assurance case. Our future workwill seek to further clarify and codify the set of “rules” forour approach, as well as provide a more objective evaluationof the claims.
REFERENCES
[1] Safety management requirements for defence systems. Defence Standard00-56 4, Ministry of Defense, June 2007.
[2] L. Cyra and J. Gorski. Supporting expert assessment of argument struc-tures in trust cases. In 9th International Probability Safety Assessmentand Management Conference PSAM, 2008.
[3] L. Duan, S. Rayadurgam, M. Heimdahl, A. Ayoub, O. Sokolsky, andI. Lee. Reasoning about confidence and uncertainty in assurance cases:A survey. In Software Engineering in Health Care, 2014.
[4] L. Duan, S. Rayadurgam, M. Heimdahl, O. Sokolsky, and I. Lee.Representation of confidence in assurance case evidence. In ASSURE2015, 2015.
[5] J. B. Goodenough, C. B. Weinstock, and A. Z. Klein. Toward a theoryof assurance case confidence. Technical report, Carnegie Mellon, 2012.
[6] GSN. http://www.goalstructuringnotation.info/archives/29.[7] A. K. Gupta and S. Nadarajah, editors. Handbook of Beta Distribution
and Its Applications. Marcel Dekker, Inc., 2004.[8] S. M. Habib, F. Volk, S. Hauke, and M. Mhlhuser. Chapter 21 -
computational trust methods for security quantification in the cloudecosystem. In R. K.-K. R. Choo, editor, The Cloud Security Ecosystem,pages 463 – 493. Syngress, Boston, 2015.
[9] R. Hawkins, T. Kelly, J. Knight, and P. Graydon. A new approach tocreating clear safety arguments. In Advances in Systems Safety, 2011.
[10] A. Jøsang. Artificial reasoning with subjective logic. In Proceedings ofthe Second Australian Workshop on Commonsense Reasoning, 1997.
[11] A. Jøsang. A logic for uncertain probabilities. 1999.[12] T. Kelly and R. Weaver. The goal structuring notation - a safety argument
notation. In Dependable Systems and Netowkrs 2004 Workshop onAssurance Cases, 2004.
[13] S. Toulmin. The Uses of Argument. Cambridge University Press, 1958.
8