repository for industrial security incidents (risi) quarterly ...quarterly report on cyber security...
TRANSCRIPT

Lice
nsed
to C
lient
Com
pany
on
30 N
ovem
ber
2009
. D
istr
ibut
ion
rest
ricte
d to
em
ploy
ees
of C
lient
Com
pany
.
© 2009 Security Incidents Organization
Repository for Industrial Security Incidents (RISI)
Quarterly Report on Cyber Security Incidents and Trends Affecting Industrial Control Systems
3rd Quarter 2009 (Includes events occurring through 30 September 2009)
Prepared for: Client Company Prepared by: Security Incidents Organization Revision: 1.0 Issued on: November 30, 2009

Lice
nsed
to C
lient
Com
pany
on
30 N
ovem
ber
2009
. D
istr
ibut
ion
rest
ricte
d to
em
ploy
ees
of C
lient
Com
pany
.
The Repository of Industrial Security Incidents
www.securityincidents.org
© 2009 Security Incidents Organization Page ii
Industry Type 1999‐2003 2004‐2008 % Change
Petroleum 18 5 ‐72%
Transportation 8 6 ‐25%
Chemical 5 4 ‐20%
Power and Utilities 10 12 20%
Water/Waste Water 4 8 100%
Food & Beverage 3 6 100%
Figure 2.2-1: Incidents by Year
Table 2.3-2: Industry Type by Time Period
Executive Summary
Eleven (11) new incidents were added to the RISI database during the third quarter of 2009 raising the total number of incidents in the database from 153 to 164. To date, 35 incidents have been added to the database in 2009, many of which occurred prior to 2009. If incident collection and reporting continue at this rate one can expect that approximately 48 new records will be added in 2009, representing a 37% increase in the total number of incidents in the database.
To date, all incidents added in 2009 have received a reliability rating of either “Confirmed” or “Likely, but unconfirmed”.
Incident Rates
Incident rates appear to be on the rise again following a decline in the mid-2000’s. A gradual increase can be observed in the incident rate in the late 90’s followed by a spike in the early 2000’s which peaked around 2003. The annual incident rate then declined sharply in the mid 2000’s (2005 – 2007) but appears to be on the rise again in the late 2000’s.
It has been noted that the dip in the mid-2000’s is at least partially attributable to the fact that work on RISI was suspended between 2006 and 2008.
Refer to Section 2.2: Incidents Over Time for details.
Affected Industries
A significant shift has been observed in the incident rates by industry over the last 10 years. There was a decline in the incident rate in the Petroleum and Chemical industries but an increase in the incident rate in the Water & Waste/Water, Power & Utilities and Food & Beverage industries. Details of this observation can be found in Section 2.3 Industry Type.
While there is not sufficient data to determine the absolute reason for this shift, one possible explanation is that the industries with a declining incident rate have been more proactive in addressing control system cyber security than the industries with an increasing incident rate. This explanation is further supported by the fact that DCS system suppliers, that predominantly supply the industries

Lice
nsed
to C
lient
Com
pany
on
30 N
ovem
ber
2009
. D
istr
ibut
ion
rest
ricte
d to
em
ploy
ees
of C
lient
Com
pany
.
The Repository of Industrial Security Incidents
www.securityincidents.org
© 2009 Security Incidents Organization Page iii
Incident Type 1999 ‐ 2003 2004 ‐ 2008 Percent Change
External ‐ Sabatoge 5 0 ‐100%
External ‐ Denial of Service (DoS) 3 0 ‐100%
External ‐ System Penetration 6 4 ‐33%
External ‐ Virus/Trojan/Worm 25 24 ‐4%
Accidental Incident 2 2 0%
Accidental Equipment Failure 8 10 25%
Accidental Network Failure 4 5 25%
Accidental Inappropriate Control 4 5 25%
Internal ‐ Sabatoge 2 3 50%
Accidental Software Failure 2 6 200%
Internal ‐ Non‐Authorized Access 0 4 N/A
Internal Incident 0 1 N/A
Table 2.4-2: Incident Type by Time Period
with declining incident rates, have also been more proactive in addressing control system cyber security than the PLC and SCADA system suppliers, who primarily supply the industries with increasing incident rates.
Incident Types and Pathways
Regardless of whether one is looking at global data or just the US, most incidents have been caused by malware (viruses, worms, trojans, etc.). This fact has remained relatively constant over time as well underscoring the need for operators of industrial automation and control system equipment to be more diligent in installing and maintaining good virus protection, especially on their PC based control system equipment.
With the exception of malware, there has been a decline in the number of incidents perpetrated by external sources. Incidents involving external sabotage, denial of service and system penetration are remarkably down in the last five years (2004 to 2008) when compared to the previous 5 year interval (1999 to 2003).
On the contrary, incidents involving unauthorized access or sabotage perpetrated by internal sources, such as a disgruntled former employee or contractor who uses inside knowledge or access privileges cause to harm to the company, are up considerably in the same time period comparison. These incidents also tend to have the greatest impact both financially as well as in lost operation/production. These incidents provide valuable insight into the potential damage that can be caused by a deliberate cyber attack even though they are always focused on causing financial damage to a company and not intended to cause injury or harm. While they are probably the most difficult to prevent there are countermeasures employers can put in place to minimize the probability of these accidents from occurring.
Also on the rise are incidents involving accidental hardware, software and network failures as well as accidental inappropriate control. These are cases where failure of a piece of equipment caused widespread network failure or cases where “unusual” network traffic, such as network scans, induced failures in control system equipment. These types of incidents highlight the need for improvements in network design and network robustness testing. Proper application of Zone & Conduit modeling, as recommended in ANSI/ISA S99.01.01, can help limit the propagation of network failures. Furthermore, network robustness testing will result in equipment that is far more tolerant of network disturbances that can lead to equipment failure.
The conclusion that can be drawn from this data is that the biggest threats to industrial control system security are malware, insider actors and accidental failures. The good news is that countermeasures to strengthen systems against these threats will also serve to strengthen systems against external actors, should that threat increase in the future.
Lice
nsed
to C
lient
Com
pany
on
30 N
ovem
ber
2009
. D
istr
ibut
ion
rest
ricte
d to
em
ploy
ees
of C
lient
Com
pany
.
The Repository of Industrial Security Incidents
www.securityincidents.org
© 2009 Security Incidents Organization Page iv
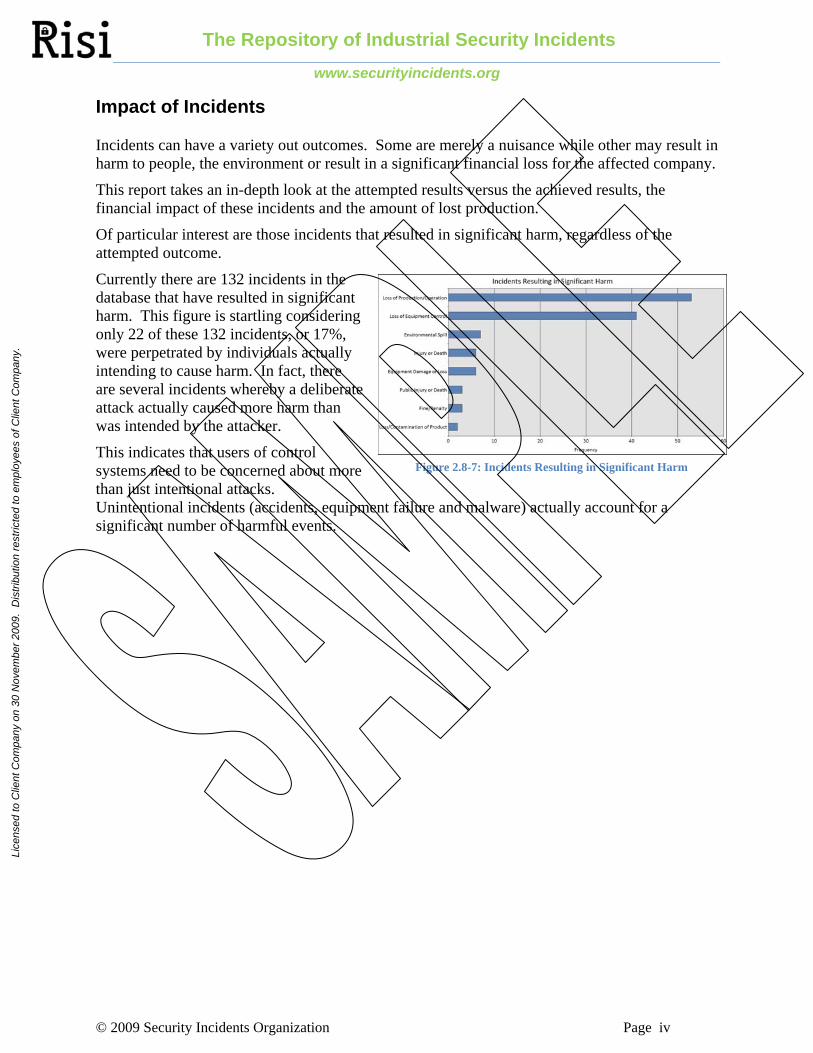
Figure 2.8-7: Incidents Resulting in Significant Harm
Impact of Incidents
Incidents can have a variety out outcomes. Some are merely a nuisance while other may result in harm to people, the environment or result in a significant financial loss for the affected company.
This report takes an in-depth look at the attempted results versus the achieved results, the financial impact of these incidents and the amount of lost production.
Of particular interest are those incidents that resulted in significant harm, regardless of the attempted outcome.
Currently there are 132 incidents in the database that have resulted in significant harm. This figure is startling considering only 22 of these 132 incidents, or 17%, were perpetrated by individuals actually intending to cause harm. In fact, there are several incidents whereby a deliberate attack actually caused more harm than was intended by the attacker.
This indicates that users of control systems need to be concerned about more than just intentional attacks. Unintentional incidents (accidents, equipment failure and malware) actually account for a significant number of harmful events.
Lice
nsed
to C
lient
Com
pany
on
30 N
ovem
ber
2009
. D
istr
ibut
ion
rest
ricte
d to
em
ploy
ees
of C
lient
Com
pany
.
The Repository of Industrial Security Incidents
www.securityincidents.org
© 2009 Security Incidents Organization Page v
Table of Contents
EXECUTIVE SUMMARY ........................................................................................................................................ II
INCIDENT RATES ..................................................................................................................................................... II
AFFECTED INDUSTRIES ............................................................................................................................................ II
INCIDENT TYPES AND PATHWAYS .......................................................................................................................... III
IMPACT OF INCIDENTS ........................................................................................................................................... IV
1 INTRODUCTION ................................................................................................................................................ 1
1.1 STRUCTURE OF THE REPORT ............................................................................................................................ 1
1.2 UPDATES IN THIS REPORT ................................................................................................................................ 1
1.3 DATA ENTRY ................................................................................................................................................... 2
2 DATA ANALYSIS ............................................................................................................................................... 3
2.1 EVENT LOCATIONS .......................................................................................................................................... 3
2.2 INCIDENTS OVER TIME ..................................................................................................................................... 5
2.3 INDUSTRY TYPE ............................................................................................................................................... 7
2.3.1 Incidents by Industry Type and Geography .......................................................................................... 8
2.3.2 Industry Type by Time Period ............................................................................................................. 10
2.4 INCIDENT TYPE .............................................................................................................................................. 11
2.4.1 General Incident Classification .......................................................................................................... 12
2.4.2 Specific Incident Classification .......................................................................................................... 13
2.4.3 Incident Type by Time Period ............................................................................................................. 15
2.5 PERPETRATOR TYPE AND DETECTION METHOD ............................................................................................. 16
2.5.1 Perpetrator Type................................................................................................................................. 16
2.5.2 Detection Method ............................................................................................................................... 18
2.6 METHOD AND POINT OF ENTRY ..................................................................................................................... 20
2.7 EQUIPMENT INVOLVED AND PROTOCOLS ....................................................................................................... 24
2.7.1 Equipment Involved ............................................................................................................................ 24
2.7.2 Protocols involved .............................................................................................................................. 25
2.8 RESULTS ........................................................................................................................................................ 27
2.8.1 Attempted Results ............................................................................................................................... 28
2.8.2 Achieved Results ................................................................................................................................. 29
2.8.3 Attempted versus Achieved Results ..................................................................................................... 31
2.8.4 Incidents Resulting in Significant Harm ............................................................................................. 32
2.8.5 Incident Result by Time Period ........................................................................................................... 33
2.9 FINANCIAL IMPACT ........................................................................................................................................ 34
2.9.1 Financial Impact by Geography ......................................................................................................... 34

Lice
nsed
to C
lient
Com
pany
on
30 N
ovem
ber
2009
. D
istr
ibut
ion
rest
ricte
d to
em
ploy
ees
of C
lient
Com
pany
.
The Repository of Industrial Security Incidents
www.securityincidents.org
© 2009 Security Incidents Organization Page vi
2.9.2 Financial Impact by Industry .............................................................................................................. 37
2.10 OPERATION AND PRODUCTION IMPACT .......................................................................................................... 38
3 RECENT INCIDENTS ...................................................................................................................................... 42
3.1 SUMMARY OF MOST RECENT INCIDENTS ....................................................................................................... 42
3.2 DETAILS OF MOST RECENT INCIDENTS .......................................................................................................... 43
3.2.1 INCIDENT ID#: 155 ......................................................................................................................... 43
3.2.2 INCIDENT ID#: 156 ......................................................................................................................... 44
3.2.3 INCIDENT ID#: 157 ......................................................................................................................... 44
3.2.4 INCIDENT ID#: 158 ......................................................................................................................... 45
3.2.5 INCIDENT ID#: 159 ......................................................................................................................... 45
3.2.6 INCIDENT ID#: 160 ......................................................................................................................... 46
3.2.7 INCIDENT ID#: 161 ......................................................................................................................... 46
3.2.8 INCIDENT ID#: 162 ......................................................................................................................... 47
3.2.9 INCIDENT ID#: 163 ......................................................................................................................... 47
3.2.10 INCIDENT ID#: 164 ......................................................................................................................... 48
3.2.11 INCIDENT ID#: 165 ......................................................................................................................... 49
4 LOOKING AHEAD ........................................................................................................................................... 50
5 CONTRIBUTORS .............................................................................................................................................. 51
6 REVISION HISTORY ....................................................................................................................................... 52
Lice
nsed
to C
lient
Com
pany
on
30 N
ovem
ber
2009
. D
istr
ibut
ion
rest
ricte
d to
em
ploy
ees
of C
lient
Com
pany
.
The Repository of Industrial Security Incidents
www.securityincidents.org
© 2009 Security Incidents Organization Page vii
Table of Figures
Figure 2.1-1: Incidents by World Region ....................................................................................... 3 Figure 2.1-2: Incidents by Country ................................................................................................. 4 Figure 2.2-1: Incidents by Year ...................................................................................................... 5 Figure 2.2-2: Number of Incidents Occurring Globally (5 Year Intervals) .................................... 6 Figure 2.2-3: Number of Incidents occurring in the US (in 5 year intervals) ................................. 7 Figure 2.3-1: Incidents by Industry Type (Global) ......................................................................... 9 Figure 2.3-2: Incidents by Industry Type (USA) .......................................................................... 10 Figure 2.4-1: Incidents Categorized by General Incident Type (Global) ..................................... 12 Figure 2.4-2: Incidents Categorized by General Incident Type (USA) ........................................ 13 Figure 2.4-3: Incidents Categorized by Specific Incident Type (Global) ..................................... 14 Figure 2.4-4: Incidents Categorized by Specific Incident Type (USA) ........................................ 14 Figure 2.5-1: Specific Perpetrator Type (Global) ......................................................................... 17 Figure 2.5-2: Specific Perpetrator Type (USA) ............................................................................ 18 Figure 2.5-3: Incident Detection Method (Global) ....................................................................... 19 Figure 2.5-4: Incident Detection Method (USA) .......................................................................... 20 Figure 2.6-1: General Access Method (Global) ............................................................................ 21 Figure 2.6-2: Point of Entry (Global) .......................................................................................... 22 Figure 2.6-3: General Access Method (USA) ............................................................................... 23 Figure 2.6-4: Point of Entry (USA) ............................................................................................. 23 Figure 2.7-1: Equipment Involved (Global) ................................................................................ 24 Figure 2.7-2: Equipment Involved (USA) .................................................................................... 25 Figure 2.7-3: Protocol (Global)..................................................................................................... 26 Figure 2.7-4: Protocol (USA) ....................................................................................................... 27 Figure 2.8-1: Attempted Result (Global) ...................................................................................... 28 Figure 2.8-2: Attempted Result (USA) ......................................................................................... 29 Figure 2.8-3: Achieved Result (Global)........................................................................................ 30 Figure 2.8-4: Achieved Result (USA) .......................................................................................... 30 Figure 2.8-5: Attempted vs. Achieved (Global) ........................................................................... 31 Figure 2.8-6: Attempted vs. Achieved (USA) .............................................................................. 32 Figure 2.8-7: Incidents Resulting in Significant Harm ................................................................. 33 Figure 2.9-1: Financial Impact (Global) ....................................................................................... 34 Figure 2.9-2: Financial Impact Percentages (Global) ................................................................... 35 Figure 2.9-3: Financial Impact (USA) .......................................................................................... 36 Figure 2.9-4: Financial Impact Percentages (USA) ...................................................................... 37 Figure 2.10-1: Production Impact (Global) .................................................................................. 38 Figure 2.10-2: Production Downtime Percentages (Global) ......................................................... 39 Figure 2.10-3: Production Impact (USA) ..................................................................................... 40 Figure 2.10-4: Production Downtime Percentages (USA) ........................................................... 40 Figure 3.1-1: Location of Recent Incidents .................................................................................. 42 Figure 3.1-2: Location of Recent Incidents .................................................................................. 43 Figure 3.1-3: Incident Type of Most Recent Incidents ................................................................. 43

Lice
nsed
to C
lient
Com
pany
on
30 N
ovem
ber
2009
. D
istr
ibut
ion
rest
ricte
d to
em
ploy
ees
of C
lient
Com
pany
.
The Repository of Industrial Security Incidents
www.securityincidents.org
© 2009 Security Incidents Organization Page viii
Tables
Table 2.3-1 Critical Infrastructure and Key Resources (CIKR) Resources Related to RISI Industry Types ................................................................................................................................ 8 Table 2.3-2: Industry Type by Time Period ................................................................................. 10 Table 2.4-1: Specific Incident Types ............................................................................................ 11 Table 2.4-2: Incident Type by Time Period .................................................................................. 15 Table 2.5-1: Specific Perpetrator Type ......................................................................................... 16 Table 2.5-2: Detection Method Selections .................................................................................... 19 Table 2.8-1: Available list of Incident Results ............................................................................. 28 Table 2.8-2: Incident Result by Time Period ................................................................................ 33 Table 2.9-1: Financial Impact by Time Period ............................................................................. 35 Table 2.9-2: Financial Impact by Industry (Global) ..................................................................... 37 Table 2.9-3 Financial Impact by Industry (USA) ......................................................................... 38 Table 3.1-1: Financial Impact by Industry Most Recent Incidents ............................................... 42

Lice
nsed
to C
lient
Com
pany
on
30 N
ovem
ber
2009
. D
istr
ibut
ion
rest
ricte
d to
em
ploy
ees
of C
lient
Com
pany
.
© 2009 Security Incidents Organization Page 1
1 Introduction
Protecting critical industrial processes from attack has become a growing priority for many companies. Power plants, refineries, chemical plants and other industrial facilities have become increasingly vulnerable as proprietary systems have evolved to open systems. These open systems exposed control systems to security vulnerabilities for critical industrial processes. Heavy use of commercial technologies, such as Windows, SQL and Ethernet, leaves control systems vulnerable to the same viruses, worms and Trojans that impact office environments. Increasing remote and 24/7 system access translates to more connections. With the increase in the sophistication and seriousness of some recent incidents, plant operators face growing pressures to develop security programs for their plant.
The Repository for Industrial Security Incidents (RISI) records incidents of a cyber security nature that directly affect industrial Supervisory Control and Data Acquisition (SCADA) and process control systems. This includes events such as accidental cyber-related incidents, as well deliberate events such as external hacks, Denial of Service (DoS) attacks, and virus/worm infiltrations. It is the largest known collection of incidents of this type. Data is collected from private submissions by member companies and through research into publicly reported incidents.
Each of the incidents has been thoroughly investigated and sensitive information has been removed to protect the confidentiality of the reporter. Incidents are also indexed and categorized according to a long list of criteria outlined in the introduction and the data is analyzed. Events that cannot be confirmed are excluded from the analysis.
At the end of the third quarter of 2009, the database contained a total of 164 records. RISI provides information that can be used to formulate a security plan. Furthermore, by knowing how other incidents occurred, future incidents may be prevented.
1.1 Structure of the Report
The analysis in this report looks at where and when incidents occurred, the types of incidents and the people who executed them, the methods and techniques they used to gain entry, the results they achieved versus the results they were attempting, and finally the financial and operational impact on the “victims”.
The Executive Summary provides an interpretation of the results analyzing the rate at which incidents have occurred, the types and various pathways, the impact of incidents to date and finally a look into the future.
The report includes case studies from the most recent quarter that include descriptions of what happened, the impact of the incident, and what the company did to avoid future incidents.
1.2 Updates in this Report
Consistent with earlier RISI Analysis reports from 2009, this report presents numerous metrics using the entire data set less those incidents with a reliability rating less than “Likely, but confirmed”. Because nearly half of the incidents reported have occurred in the USA, metrics are reported globally as well as just for the USA. Custom reporting, focusing for example on other geographies or industries, is available on request.

Lice
nsed
to C
lient
Com
pany
on
30 N
ovem
ber
2009
. D
istr
ibut
ion
rest
ricte
d to
em
ploy
ees
of C
lient
Com
pany
.
© 2009 Security Incidents Organization Page 2
While RISI Analysis reports have always included selected case studies they were randomly selected from throughout the database to give the reader a sampling of different types of incidents from a variety of industries and applications. Based on customer feedback, starting immediately the report will include case studies for the new incidents occurring since the last quarterly report (see Section3: Recent Incidents). In this way, an annual subscriber will receive case studies for all new incidents added during their subscription period.
Also new for this report is added focus on recent incidents. With the increased data set, meaningful comparison of metrics can be provided based only on recent incidents (those occurring within the last 12 months) versus metrics based on the entire dataset.
1.3 Data Entry
Figure 2-1 shows the data entry screen. The database contains a total of 164 records. However, the data reported in this report is limited to the incidents with a Reliability Rating of “Confirmed” or “Likely, but Unconfirmed”. “Unknown or Unlikely” or “Hoax/Urban Legend” incidents were excluded from the analysis. This data set included in the analysis contains 152 incidents.
Figure 2-1: Typical RISI Incident Entry Screen
The RISI database structure was enhanced in April 2009 and again in October 2009 to aid in analysis and reporting. Upon completion, existing data was carefully reviewed.
Note that to protect the privacy of contributing members; RISI will not publish any information that may identify the source of the submission.

Lice
nsed
to C
lient
Com
pany
on
30 N
ovem
ber
2009
. D
istr
ibut
ion
rest
ricte
d to
em
ploy
ees
of C
lient
Com
pany
.
© 2009 Security Incidents Organization Page 3
2 Data Analysis
2.1 Event Locations
All events in RISI are assigned to the country where the incident occurred unless the contributor requests that information remain confidential. Regardless, all incidents are assigned to a geographical region. Figure 2.1-1: Incidents by World Region shows the distribution of incidents by world region and Figure 2.1-2: Incidents by Country shows the distribution by Country.
Figure 2.1-1: Incidents by World Region
The industrial security incidents reported in RISI show a distribution concentrated in North America. North American incidents account for 60% of all confirmed or likely incidents in RISI. Incidents in Europe account for 27%.
Lice
nsed
to C
lient
Com
pany
on
30 N
ovem
ber
2009
. D
istr
ibut
ion
rest
ricte
d to
em
ploy
ees
of C
lient
Com
pany
.
© 2009 Security Incidents Organization Page 4
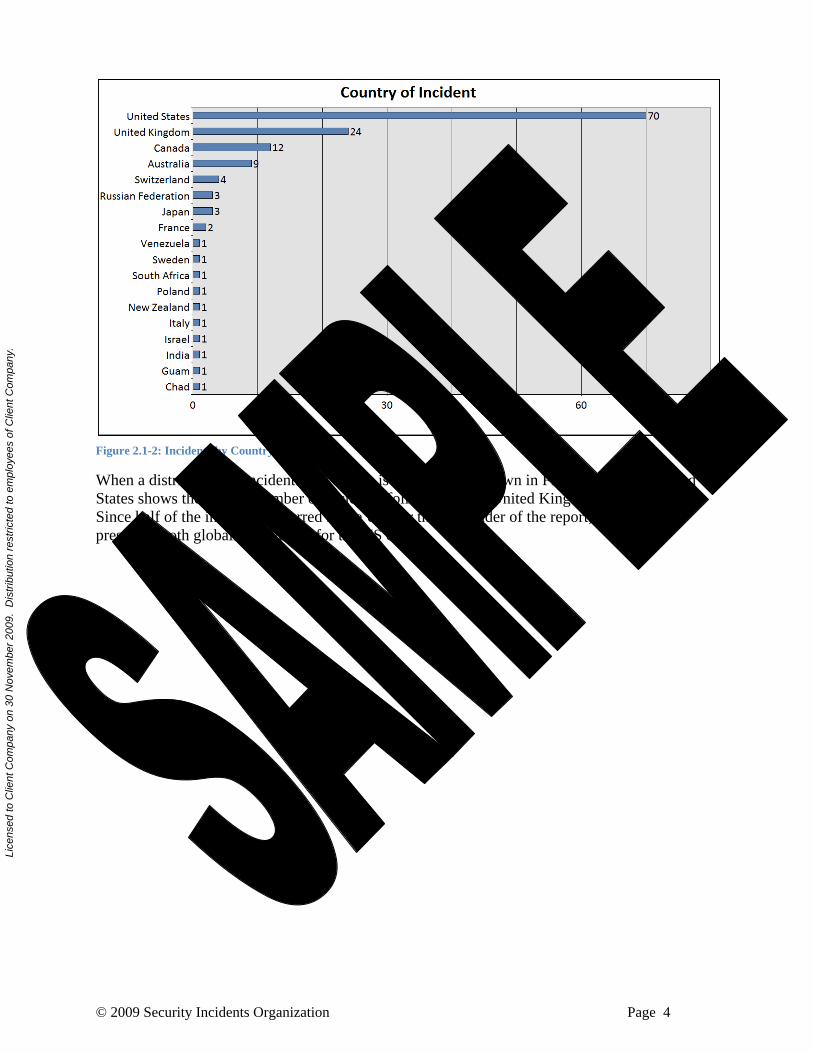
Figure 2.1-2: Incidents by Country
When a distribution of incidents by country is examined, as shown in Figure 2.1-2, the United States shows the highest number of incidents followed by the United Kingdom and Canada. Since half of the incidents occurred in the US, for the remainder of the report, data will be presented both globally as well as for the US only.

Lice
nsed
to C
lient
Com
pany
on
30 N
ovem
ber
2009
. D
istr
ibut
ion
rest
ricte
d to
em
ploy
ees
of C
lient
Com
pany
.
© 2009 Security Incidents Organization Page 5
2.2 Incidents Over Time
All events in RISI are recorded with the date the incident occurred unless the contributor requests that information remain confidential. Regardless, all incidents are recorded with the year in which the event occurred.
Figure 2.2-1: Incidents by Year
Figure 2.2-1: Incidents by Year shows the number of incidents in RISI that occurred every year since 1982. The data illustrates some notable trends. First, a gradual increase in events in the late 90’s can be observed followed by a spike in the early 2000’s. The annual rate declines in the mid 2000’s but appears to be on the rise again in the last 2000’s.
A simple linear trend line was added which illustrates that despite the dip in the mid-2000’s the rate of incidents has been increasing steadily over the last 20 years.
It should be noted that the dip in the mid-2000’s is at least partially attributable to the fact that work on RISI was suspended between 2006 and 2008.

Lice
nsed
to C
lient
Com
pany
on
30 N
ovem
ber
2009
. D
istr
ibut
ion
rest
ricte
d to
em
ploy
ees
of C
lient
Com
pany
.
© 2009 Security Incidents Organization Page 6
Figure 2.2-2: Number of Incidents Occurring Globally (5 Year Intervals)
Figure 2.2-2 shows the same annual incident data but plotted in five year intervals. In this view, the number of incidents peaked in the period between 1999 and 2003 while the number of incidents in the subsequent period is approximately equal.
2 2
14
5961
0
10
20
30
40
50
60
70
1984‐1988 1989‐1993 1994‐1998 1999‐2003 2004‐2008
Incidents Over Time(Global)

Lice
nsed
to C
lient
Com
pany
on
30 N
ovem
ber
2009
. D
istr
ibut
ion
rest
ricte
d to
em
ploy
ees
of C
lient
Com
pany
.
© 2009 Security Incidents Organization Page 7
Figure 2.2-3: Number of Incidents occurring in the US (in 5 year intervals)
Figure 2.2-3 shows the number of incidents over time in the US. Since nearly half of the incidents occur in the US, it is not surprising that the trend in the US mirrors the global trend.
2.3 Industry Type
All incidents in RISI are assigned to one of the following list of Industry Types:
Aerospace Automotive Chemical Electronic Manufacturing Food & Beverage General Manufacturing Metals Mining Other Petroleum Pharmaceutical Power and Utilities Pulp and Paper Telecommunications Transportation
1 1
6
28
26
0
5
10
15
20
25
30
1984‐1988 1989‐1993 1994‐1998 1999‐2003 2004‐2008
Incidents Over Time (USA)

Lice
nsed
to C
lient
Com
pany
on
30 N
ovem
ber
2009
. D
istr
ibut
ion
rest
ricte
d to
em
ploy
ees
of C
lient
Com
pany
.
© 2009 Security Incidents Organization Page 8
Water/Waste Water
As one might expect, industries often categorized as Critical Infrastructure and Key Resources (CIKR) reported more incidents than non-critical infrastructure industries. Table 2.3-1 shows the relationship between CIKR Sectors and RISI Industry Types.
Critical Infrastructure and Key Resources (CIKR) Sectors
RISI Industry Types
Agriculture and Food Food & Beverage
Banking and Finance
Chemical Chemical
Commercial Facilities
Communications Telecommunications
Critical Manufacturing Aerospace
Automotive
Metals
Mining
Dams
Defense Industrial
Emergency Services
Energy Petroleum
Power and Utilities
Government Facilities
Healthcare and Public Health Pharmaceutical
Information Technology
National Monuments and Icons
Nuclear Reactors, Materials and Waste Power and Utilities
Postal and Shipping
Transportation Systems Transportation
Water Water/Waste Water
Table 2.3-1 Critical Infrastructure and Key Resources (CIKR) Resources Related to RISI Industry Types
Occasionally, for confidentiality reasons an incident submitter may withhold this information and in those cases the Industry Type will be recorded as “Unknown”.
2.3.1 Incidents by Industry Type and Geography

Lice
nsed
to C
lient
Com
pany
on
30 N
ovem
ber
2009
. D
istr
ibut
ion
rest
ricte
d to
em
ploy
ees
of C
lient
Com
pany
.
© 2009 Security Incidents Organization Page 9
Figure 2.3-1: Incidents by Industry Type (Global)
Figure 2.3-1 is a chart showing the Industry Type sorted in descending order for all global incidents in the data set.
Globally, Petroleum, Power & Utilities as well as Transportation are the industries with the highest numbers of industrial security incidents. There were ten incidents with the industry reported as unknown.

Lice
nsed
to C
lient
Com
pany
on
30 N
ovem
ber
2009
. D
istr
ibut
ion
rest
ricte
d to
em
ploy
ees
of C
lient
Com
pany
.
© 2009 Security Incidents Organization Page 10
Figure 2.3-2: Incidents by Industry Type (USA)
Figure 2.3-2 is a chart showing the Industry Type sorted in descending order for all USA incidents in the data set. One incident of unknown industry type was removed. It shows that in the US, Power and Utilities followed by Petroleum and Transportation are the industry’s most impacted by industrial security incidents in the US.
2.3.2 Industry Type by Time Period
Table 2.3-2: Industry Type by Time Period
Table 2.3-2: Industry Type by Time Period looks at the top 6 industry types reported for incidents occurring in the five year period between 1999 and 2003 and again for the five year period between 2004 and 2008. Both time periods had approximately 60 incidents (see Figure 2.2-2).
Significant differences in the incident rates for each industry were observed between the earlier and the more recent time period. The most dramatic difference is the Petroleum industry which, having the highest incident rate between 1999 and 2003, dropped 72% for the time period between 2004 and 2008. Also notable is that the Transportation and Chemical industries also
Industry Type 1999‐2003 2004‐2008 % Change
Petroleum 18 5 ‐72%
Transportation 8 6 ‐25%
Chemical 5 4 ‐20%
Power and Utilities 10 12 20%
Water/Waste Water 4 8 100%
Food & Beverage 3 6 100%

Lice
nsed
to C
lient
Com
pany
on
30 N
ovem
ber
2009
. D
istr
ibut
ion
rest
ricte
d to
em
ploy
ees
of C
lient
Com
pany
.
© 2009 Security Incidents Organization Page 11
dropped during the same time period. Going the other direction, Water/Waste Water, Food & Beverage and Power & Utilities all experienced increases, some quite dramatic.
While it is difficult to say with certainty, it is possible that the drop in petroleum and chemical industry incidents is at least in part due to the proactive response these industries and their control system suppliers have taken to addressing control system cyber security.
2.4 Incident Type
RISI incidents are also assigned to a couple of general categories as well as to one or more specific incident types from the list in Table 2.4-1: Specific Incident Types:
The first general category is the called the “General Intent”. “General Intent” can be either Intentional or Unintentional.
The second general category is “General Perpetrator Type”. General Perpetrator Type can be Insider, Outsider or Not Applicable (N/A). N/A is typically used for non-targeted incidents such as accidental equipment or software failures.
Specific Incident Type
Accidental Equipment Failure
Accidental Inappropriate Control
Accidental Incident
Accidental Network Failure
Accidental Software Failure
Audit
External ‐ Denial of Service (DoS)
External – Fraud
External ‐ Information Theft
External – Sabotage
External ‐ System Penetration
External ‐ Virus/Trojan/Worm
External Incident
Internal ‐ Insider Fraud
Internal ‐ Non‐Authorized Access
Internal – Sabotage
Internal Incident
Other
Unknown Table 2.4-1: Specific Incident Types

Lice
nsed
to C
lient
Com
pany
on
30 N
ovem
ber
2009
. D
istr
ibut
ion
rest
ricte
d to
em
ploy
ees
of C
lient
Com
pany
.
© 2009 Security Incidents Organization Page 12
2.4.1 General Incident Classification
Figure 2.4-1: Incidents Categorized by General Incident Type (Global)
Figure 2.4-1 is a stacked bar chart showing the distribution of General Intent for all incidents globally as well as the breakdown of General Perpetrator Type for both Intentional and Unintentional Incidents. This view reveals valuable insight into the types of incidents occurring. First, it reveals that the largest percentage of all incidents is unintentional outsider events which are primarily non-directed malware such as viruses, worms and trojans. The next largest percentage is unintentional N/A incidents which are generally incidents caused by accidental equipment or software failures. Second, the charts also reveal that only 29 of all incidents

Lice
nsed
to C
lient
Com
pany
on
30 N
ovem
ber
2009
. D
istr
ibut
ion
rest
ricte
d to
em
ploy
ees
of C
lient
Com
pany
.
© 2009 Security Incidents Organization Page 13
recorded are intentional and of those, the distribution of whether they are insider or outsider attacks is roughly the same.
Figure 2.4-2: Incidents Categorized by General Incident Type (USA)
Figure 2.4-2 is a also a stacked bar chart showing the distribution of General Intent for all incidents as well as the breakdown of General Perpetrator Type for both Intentional and Unintentional Incidents. However, this chart is limited to events occurring in the USA.
One striking difference between this data and the global data is that for the USA the largest percentage is unintentional N/A incidents (incidents caused by accidental equipment or software failures) whereas globally it was unintentional outsider events which are primarily non-directed malware such as viruses, worms and trojans. The percentage of intentional incidents and the breakdown of them remain consistent with the global data.
A potential conclusion one could draw from this is that US industrial plants are doing a slightly better job at protecting their control systems from malware.
2.4.2 Specific Incident Classification
Figure 2.4-3 and Figure 2.4-4 summarize the frequency of specific incident types globally and the USA respectively.

Lice
nsed
to C
lient
Com
pany
on
30 N
ovem
ber
2009
. D
istr
ibut
ion
rest
ricte
d to
em
ploy
ees
of C
lient
Com
pany
.
© 2009 Security Incidents Organization Page 14
Figure 2.4-3: Incidents Categorized by Specific Incident Type (Global)
Figure 2.4-3 shows that malware (viruses, trojans, worms, etc.) was the incident type most often seen globally followed by accidental equipment failure. Accidental network and software failures and external system penetration are all nearly equal in frequency. Refer to the recommendation section for additional commentary on how many of the most common incident types could be prevented.
Figure 2.4-4: Incidents Categorized by Specific Incident Type (USA)

Lice
nsed
to C
lient
Com
pany
on
30 N
ovem
ber
2009
. D
istr
ibut
ion
rest
ricte
d to
em
ploy
ees
of C
lient
Com
pany
.
© 2009 Security Incidents Organization Page 15
Figure 2.4-4 indicates that while malware (viruses, trojans, worms, etc.) was also the incident type most prevalent in the USA that Accidental Equipment Failure was a close second.
2.4.3 Incident Type by Time Period
Table 2.4-2: Incident Type by Time Period
Table 2.4-2: Incident Type by Time Period looks at the specific incident types reported for incidents occurring in the five year period between 1999 and 2003 and again for the five year period between 2004 and 2008. Both time periods had approximately 60 incidents.
Significant differences in the number of incident types reported were observed between the earlier and the more recent time period. The most dramatic difference is that incidents involving external sabotage, denial of service and system penetration are remarkably down in the last five years (2004 to 2008) when compared to the previous 5 year interval (1999 to 2003). On the contrary, incidents involving unauthorized access or sabotage perpetrated by internal sources are up considerably in the same time period comparison. Also on the rise are incidents involving accidental hardware, software and network failures as well as accidental inappropriate control.
The number of incidents caused by malware (viruses, worms, trojans, etc.) has remained relatively constant over time as well underscoring the need for operators of industrial automation and control system equipment to be more diligent in installing and maintaining good virus protection, especially on their PC based control system equipment.
The conclusion that can be drawn from this data is that the biggest threats to industrial control system security are malware, insider actors and accidental failures. The good news is that countermeasures to strengthen systems against these threats will also serve to strengthen systems against external actors, should that threat increase in the future.
Incident Type 1999 ‐ 2003 2004 ‐ 2008 Percent Change
External ‐ Sabatoge 5 0 ‐100%
External ‐ Denial of Service (DoS) 3 0 ‐100%
External ‐ System Penetration 6 4 ‐33%
External ‐ Virus/Trojan/Worm 25 24 ‐4%
Accidental Incident 2 2 0%
Accidental Equipment Failure 8 10 25%
Accidental Network Failure 4 5 25%
Accidental Inappropriate Control 4 5 25%
Internal ‐ Sabatoge 2 3 50%
Accidental Software Failure 2 6 200%
Internal ‐ Non‐Authorized Access 0 4 N/A
Internal Incident 0 1 N/A

Lice
nsed
to C
lient
Com
pany
on
30 N
ovem
ber
2009
. D
istr
ibut
ion
rest
ricte
d to
em
ploy
ees
of C
lient
Com
pany
.
© 2009 Security Incidents Organization Page 16
2.5 Perpetrator Type and Detection Method
2.5.1 Perpetrator Type As noted in section 2.3, the General Perpetrator Type (Insider, Outsider, N/A) type is recorded for each incidents. In addition, if known, RISI also records further specifics on the perpetrator for each incident per the options in Table 2.5-1: Specific Perpetrator Type
Perpetrator Type
Insider ‐ Current Employee
Insider ‐ Former Employee
Insider ‐ Current Contractor
Insider ‐ Former Contractor
Outsider ‐ General
None
Other
Insider ‐ General
Outsider ‐ Agencies of Foreign States
Outsider ‐ Terrorist
Outsider ‐ Activists
Outsider ‐ Hacker/Virus Writer
Outsider ‐ Script Kiddies
Unknown
Outsider ‐ Competitor
Insider ‐ Former Contractor Table 2.5-1: Specific Perpetrator Type

Lice
nsed
to C
lient
Com
pany
on
30 N
ovem
ber
2009
. D
istr
ibut
ion
rest
ricte
d to
em
ploy
ees
of C
lient
Com
pany
.
© 2009 Security Incidents Organization Page 17
shows the specific perpetrator types globally.
Figure 2.5-1: Specific Perpetrator Type (Global)
As shown in Figure 2.5-1, for all incidents, the External Hacker/Virus Writer is the largest perpetrator group which is consistent with malware being the dominant Incident Type.
Current Insiders (current employees/contractors) make up 28% of the known perpetrators involved in security incidents. In some cases, the incident was caused by accidently introducing a virus into the control system or other type of human error. However, half of incidents involving Current Insiders were intentional. The incidents included a combination of unauthorized access, sabotage, virus/Trojan/worm attacks and external system penetration.
In the case of Former Insiders (former employees/contractors), the situation is somewhat different. Former Insiders were only responsible for 6% of all known incidents. However, in this case all of the incidents were intentional. All of the Former Insider incidents included: sabotage, denial of service and unauthorized access. This data suggests that operating companies must take greater care in making sure that terminated employees and contractors are immediately prevented from gaining remote access to systems, especially the systems that they supported when active.

Lice
nsed
to C
lient
Com
pany
on
30 N
ovem
ber
2009
. D
istr
ibut
ion
rest
ricte
d to
em
ploy
ees
of C
lient
Com
pany
.
© 2009 Security Incidents Organization Page 18
Figure 2.5-2: Specific Perpetrator Type (USA)
Figure 2.5-2 shows the specific perpetrator types responsible for incidents in the US.
The data generally mirrors the global data.
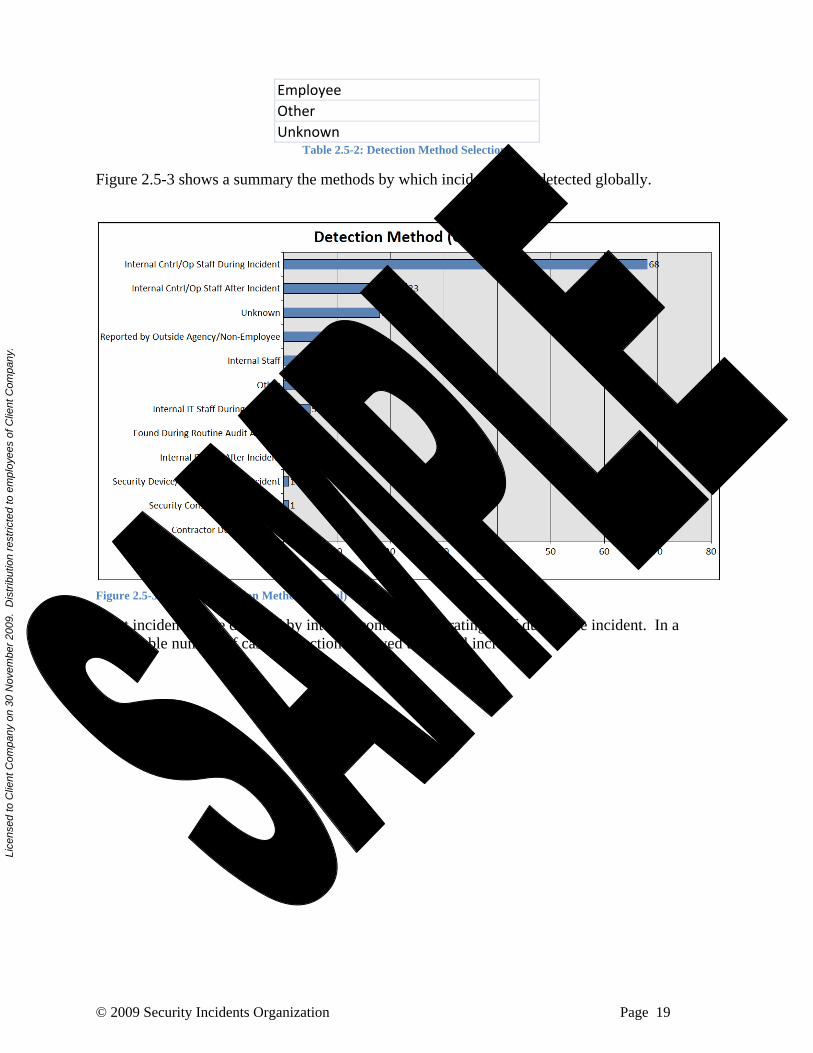
2.5.2 Detection Method
All events in RISI are recorded with the method by which the incident was detected. Available selections include:
Detection Method
Internal Staff
Security Device/Log Alert During Incident
Contractor During Incident
Contractor After Incident
Security Consultant/Investigator
Internal Cntrl/Op Staff During Incident
Internal Cntrl/Op Staff After Incident
Internal IT Staff During Incident
Internal IT Staff After Incident
Security Device/Log Alert
Security Device/Log Alert After Incident
Found During Routine Audit Activity
Reported by Outside Agency/Non‐
Lice
nsed
to C
lient
Com
pany
on
30 N
ovem
ber
2009
. D
istr
ibut
ion
rest
ricte
d to
em
ploy
ees
of C
lient
Com
pany
.
© 2009 Security Incidents Organization Page 19
Employee
Other
Unknown Table 2.5-2: Detection Method Selections
Figure 2.5-3 shows a summary the methods by which incidents were detected globally.
Figure 2.5-3: Incident Detection Method (Global)
Most incidents were detected by internal control or operating staff during the incident. In a respectable number of cases, detection followed the actual incident.

Lice
nsed
to C
lient
Com
pany
on
30 N
ovem
ber
2009
. D
istr
ibut
ion
rest
ricte
d to
em
ploy
ees
of C
lient
Com
pany
.
© 2009 Security Incidents Organization Page 20
Figure 2.5-4: Incident Detection Method (USA)
Figure 2.5-4 shows a summary of the methods by which incidents were detected in the US.
As with the global data, most incidents in the US were detected by internal control or operating staff during the incident.
2.6 Method and Point of Entry
Whenever possible, the method (local/remote) and point of entry are recorded for each incident. The following is a list of the available Methods and Points of Entry available for selection.
Local o Local - Business Network o Local - Communications Channel Media o Local - Human Machine Interface (HMI) o Local - Laptop o Local - Physical Access to Equipment o Local - Programming Terminal o Local Access
Remote o Remote - Corporate WAN o Remote - Dial-up modem o Remote - Internet Directly o Remote - SCADA Network o Remote - Telco Network o Remote - Trusted 3rd Party Connection o Remote - Via Business Network o Remote - VPN Connection

Lice
nsed
to C
lient
Com
pany
on
30 N
ovem
ber
2009
. D
istr
ibut
ion
rest
ricte
d to
em
ploy
ees
of C
lient
Com
pany
.
© 2009 Security Incidents Organization Page 21
o Remote - Wireless System o Remote Access
None Other Unknown
Figure 2.6-1: General Access Method (Global)
Figure 2.6-1 shows the general method of access into affected systems recorded globally.
Remote access, at 42%, is the primary method of entry into industrial control systems. While not surprising, this data supports the assertion that the networking of industrial automation and control systems have made these systems more vulnerable to cyber security incidents. Local access, at 28%, is significant as well.

Lice
nsed
to C
lient
Com
pany
on
30 N
ovem
ber
2009
. D
istr
ibut
ion
rest
ricte
d to
em
ploy
ees
of C
lient
Com
pany
.
© 2009 Security Incidents Organization Page 22
Figure 2.6-2: Point of Entry (Global)
Figure 2.6-2 shows the detailed information on the various points of entry into industrial control systems.
In many cases, the point of entry was documented as “none” or “unknown”. Excluding these, the point of entry most often seen is access through the business network, either remotely or locally. Interestingly, the number of incidents occurring through a Business Network is significantly higher than through direct connection to the Internet. This data supports the warnings by many control system security experts that systems without a direct internet connection are still susceptible to cyber security incidents.

Lice
nsed
to C
lient
Com
pany
on
30 N
ovem
ber
2009
. D
istr
ibut
ion
rest
ricte
d to
em
ploy
ees
of C
lient
Com
pany
.
© 2009 Security Incidents Organization Page 23
Figure 2.6-3: General Access Method (USA)
Figure 2.6-3 shows the general method of access into affected systems in the US.
Similar to the global data, remote access, at 47A%, is the primary method of entry into industrial data and security systems, even slightly higher than it is globally, accounting for a little less than half of the incidents in the US.
Figure 2.6-4: Point of Entry (USA)
Lice
nsed
to C
lient
Com
pany
on
30 N
ovem
ber
2009
. D
istr
ibut
ion
rest
ricte
d to
em
ploy
ees
of C
lient
Com
pany
.
© 2009 Security Incidents Organization Page 24
Figure 2.6-4 shows detailed information on the various points of entry into industrial control systems in the US.
Excluding “none” or “unknown”, the US entry point distribution shows that non-specific remote access was seen most often. Local Human Machine Interface (HMI) and local business network access follows in frequency.
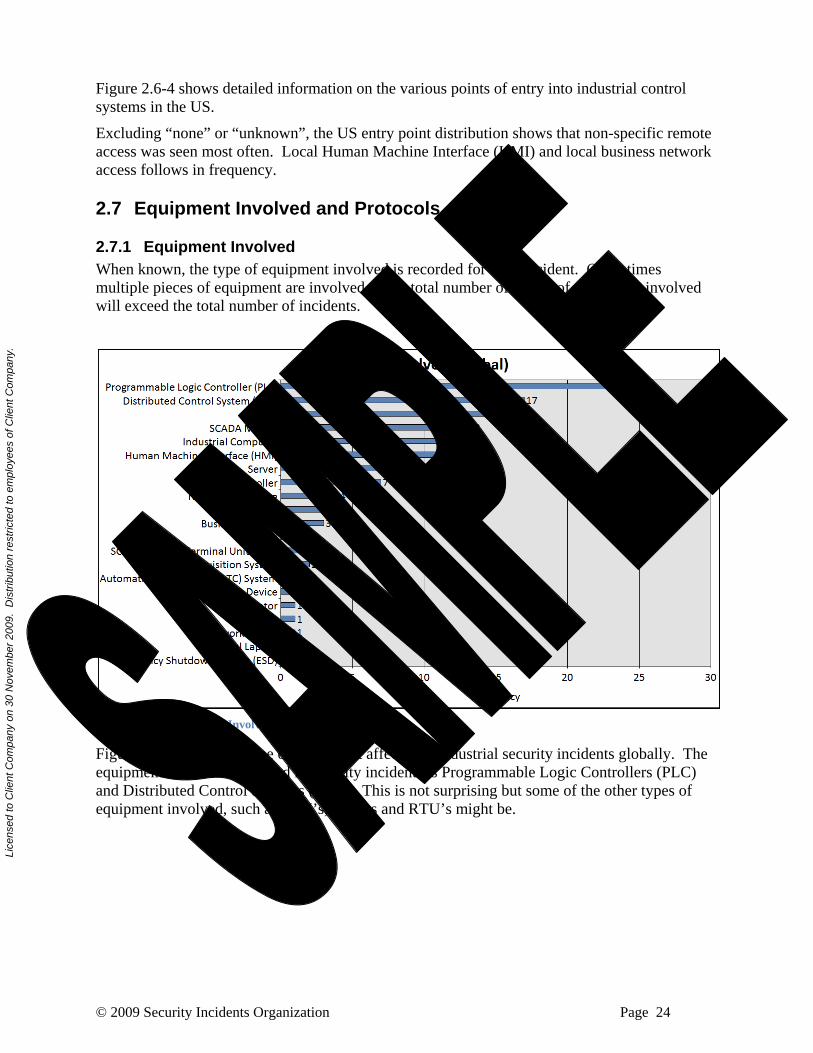
2.7 Equipment Involved and Protocols
2.7.1 Equipment Involved When known, the type of equipment involved is recorded for each incident. Often times multiple pieces of equipment are involved so the total number of pieces of equipment involved will exceed the total number of incidents.
Figure 2.7-1: Equipment Involved (Global)
Figure 2.7-1 shows the type of equipment affected in industrial security incidents globally. The equipment most often affected in security incidents is Programmable Logic Controllers (PLC) and Distributed Control Systems (DCS). This is not surprising but some of the other types of equipment involved, such as HMI’s, servers and RTU’s might be.

Lice
nsed
to C
lient
Com
pany
on
30 N
ovem
ber
2009
. D
istr
ibut
ion
rest
ricte
d to
em
ploy
ees
of C
lient
Com
pany
.
© 2009 Security Incidents Organization Page 25
Figure 2.7-2: Equipment Involved (USA)
Figure 2.7-2 shows the type of equipment affected in industrial security incidents in the US.
PLC’s are involved most often in industrial security incidents in the US followed by SCADA Masters and other.
2.7.2 Protocols involved When known, the types of protocols involved are recorded for each incident.

Lice
nsed
to C
lient
Com
pany
on
30 N
ovem
ber
2009
. D
istr
ibut
ion
rest
ricte
d to
em
ploy
ees
of C
lient
Com
pany
.
© 2009 Security Incidents Organization Page 26
Figure 2.7-3: Protocol (Global)
Figure 2.7-3 shows the frequency of incidents by protocol used.
In many cases the protocol is unknown. When the protocol is known, TCP/IP is most frequently reported.
Lice
nsed
to C
lient
Com
pany
on
30 N
ovem
ber
2009
. D
istr
ibut
ion
rest
ricte
d to
em
ploy
ees
of C
lient
Com
pany
.
© 2009 Security Incidents Organization Page 27
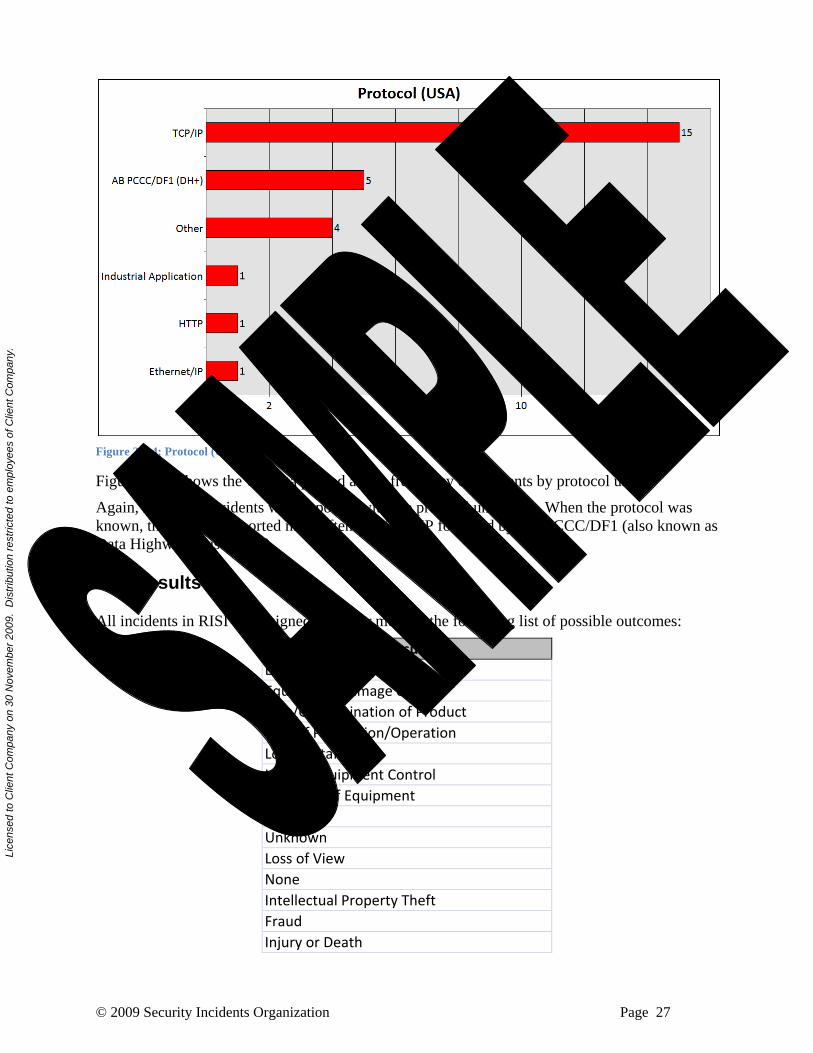
Figure 2.7-4: Protocol (USA)
Figure 2.7-4 shows the US data plotted as the frequency of incidents by protocol used.
Again, many US incidents were reported with the protocol unknown. When the protocol was known, the protocol reported most often was TCP/IP followed by AB PCCC/DF1 (also known as Data Highway Plus - DH+).
2.8 Results
All incidents in RISI are assigned to one or more of the following list of possible outcomes:
Result
Environmental Spill
Equipment Damage or Loss
Loss/Contamination of Product
Loss of Production/Operation
Loss of Staff Time
Loss of Equipment Control
Illicit Use of Equipment
Other
Unknown
Loss of View
None
Intellectual Property Theft
Fraud
Injury or Death

Lice
nsed
to C
lient
Com
pany
on
30 N
ovem
ber
2009
. D
istr
ibut
ion
rest
ricte
d to
em
ploy
ees
of C
lient
Com
pany
.
© 2009 Security Incidents Organization Page 28
Public Injury or Death
Fine/Penalty
Loss of Communications
Loss of Data
Public Nuisance/Inconvenience Table 2.8-1: Available list of Incident Results
Often the outcome (achieved result) does not match the intended result (attempted result). Therefore, both the attempted and the achieved results are recorded for all incidents. In many cases, more than one result was attempted and achieved. The data is presented as a total.
2.8.1 Attempted Results
Figure 2.8-1: Attempted Result (Global)
Figure 2.8-1 summarizes the recorded attempted results for the incidents in the RISI database.
Excluding cases when the attempted result is “Unknown” or “None”, “Loss of production / operation” and “Illicit Use of Equipment” are the types reported most often.

Lice
nsed
to C
lient
Com
pany
on
30 N
ovem
ber
2009
. D
istr
ibut
ion
rest
ricte
d to
em
ploy
ees
of C
lient
Com
pany
.
© 2009 Security Incidents Organization Page 29
Figure 2.8-2: Attempted Result (USA)
Figure 2.8-2 summarizes the recorded attempted results for the US incidents in the RISI database.
For the US data, when there was an attempted result, “Loss of production/operation” as well as “Illicit use of equipment” were among the most frequent results reported.
2.8.2 Achieved Results

Lice
nsed
to C
lient
Com
pany
on
30 N
ovem
ber
2009
. D
istr
ibut
ion
rest
ricte
d to
em
ploy
ees
of C
lient
Com
pany
.
© 2009 Security Incidents Organization Page 30
Figure 2.8-3: Achieved Result (Global)
Figure 2.8-3 shows the achieved results for all of the incidents reported.
The achieved results reported are very different than the attempted results. When “none” or “unknown” are excluded, “Loss of production/operation”, “Loss of equipment control” and “Loss of view” are most frequently reported for achieved results.
In 9 cases, injury or death resulted from an incident, up 3 since 2Q2009.
Figure 2.8-4: Achieved Result (USA)

Lice
nsed
to C
lient
Com
pany
on
30 N
ovem
ber
2009
. D
istr
ibut
ion
rest
ricte
d to
em
ploy
ees
of C
lient
Com
pany
.
© 2009 Security Incidents Organization Page 31
Figure 2.8-4 shows the achieved results for all US incidents reported.
“Loss of production/operation”, “Loss of equipment control” and “Loss of view” have been most frequently reported.
In 5 US cases, injury or death resulted from industrial security incidents. One new incident involving public injury or death was reported this quarter.
2.8.3 Attempted versus Achieved Results
Figure 2.8-5: Attempted vs. Achieved (Global)
Figure 2.8-5 shows the comparison of attempted results to achieved results of reported incidents.
The most striking feature of this plot is that far more was achieved than was known to be attempted. Most often, the attempted result is “Unknown” or “None” as is the case with accidents or malware. However, the results most often achieved “Loss of production/operation”, “Loss of equipment control” and “Loss of view”. All of which, can lead to catastrophic consequences.
6
3
6
2
3
0
31
7
0
6
19
41
29
6
53
2
0
0
0
0
0
1
1
2
2
2
3
3
3
8
11
58
0 10 20 30 40 50 60 70
Equipment Damage or Loss
Fine/Penalty
Injury or Death
Loss/Contamination of Product
Public Injury or Death
Intellectual Property Theft
Loss of View
Environmental Spill
Other
Public Nuisance/Inconvenience
Loss of Communications
Loss of Equipment Control
Loss of Staff Time
Illicit Use of Equipment
Loss of Production/Operation
None
Attempted versus Achieved Results(Global)
Attempted
Achieved

Lice
nsed
to C
lient
Com
pany
on
30 N
ovem
ber
2009
. D
istr
ibut
ion
rest
ricte
d to
em
ploy
ees
of C
lient
Com
pany
.
© 2009 Security Incidents Organization Page 32
Figure 2.8-6: Attempted vs. Achieved (USA)
Figure 2.8-6 shows the comparison of overall attempted results to achieved results of reported US incidents.
The US incidents show the same trend as global. Much more was achieved than was known to be attempted. “Loss of production/operation”, “Loss of equipment control” and “Loss of view” were among the top results achieved, all of which can lead to disastrous outcomes. The data reviewed earlier showed that the primary access point is in the US is remote access with the leading perpetrator being the external hacker/virus writer.
2.8.4 Incidents Resulting in Significant Harm Incidents resulting in “Significant Harm” as those that caused harm to people, the environment or resulted in a significant financial loss. Specifically, for this analysis we include the following categories: Environmental Spill/Release Fine/Penalty Equipment Damage or Loss Injury or Death Loss of Equipment Control Loss of Equipment View
4
2
4
1
1
5
0
19
14
4
10
8
0
4
26
4
0
0
0
0
0
0
1
1
1
1
1
2
2
2
5
5
27
29
0 5 10 15 20 25 30 35
Equipment Damage or Loss
Fine/Penalty
Injury or Death
Loss/Contamination of Product
Public Injury or Death
Environmental Spill
Intellectual Property Theft
Loss of Equipment Control
Loss of View
Public Nuisance/Inconvenience
Loss of Communications
Loss of Staff Time
Other
Illicit Use of Equipment
Loss of Production/Operation
Unknown
None
Attempted versus Achieved(USA)
Attempted
Achieved
Lice
nsed
to C
lient
Com
pany
on
30 N
ovem
ber
2009
. D
istr
ibut
ion
rest
ricte
d to
em
ploy
ees
of C
lient
Com
pany
.
© 2009 Security Incidents Organization Page 33
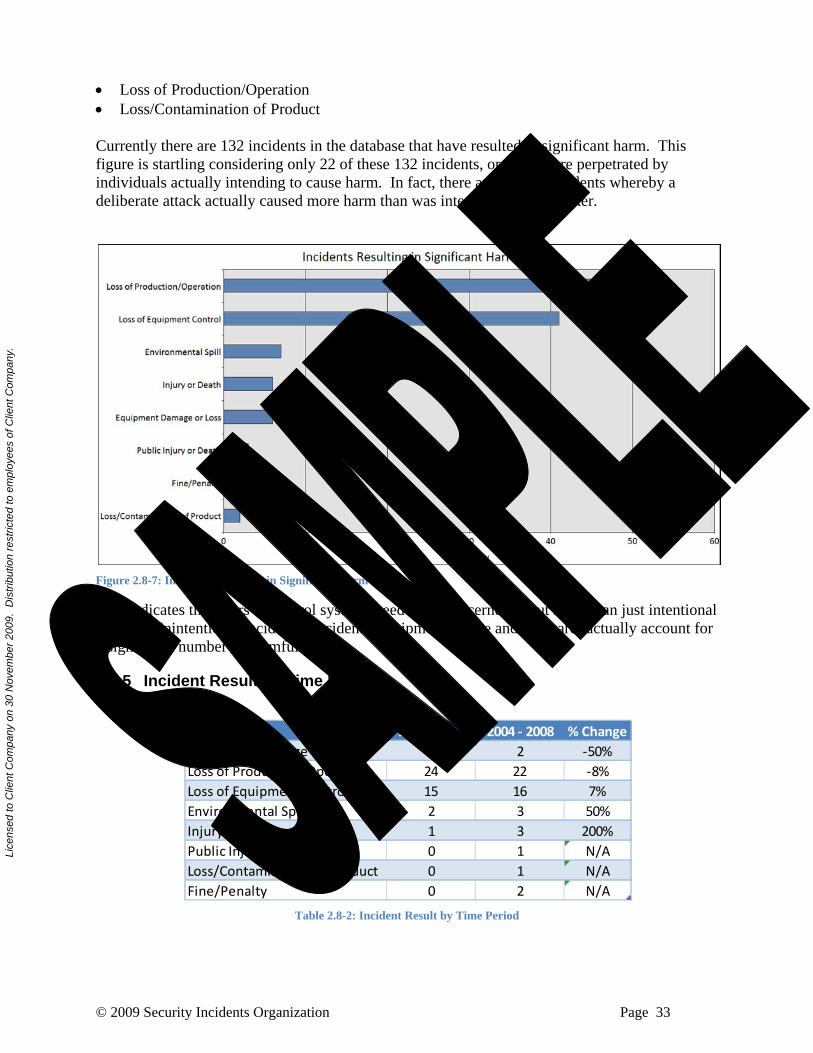
Loss of Production/Operation Loss/Contamination of Product Currently there are 132 incidents in the database that have resulted in significant harm. This figure is startling considering only 22 of these 132 incidents, or 17%, were perpetrated by individuals actually intending to cause harm. In fact, there are several incidents whereby a deliberate attack actually caused more harm than was intended by the attacker.
Figure 2.8-7: Incidents Resulting in Significant Harm
This indicates that users of control systems need to be concerned about more than just intentional attacks. Unintentional incidents (accidents, equipment failure and malware) actually account for a significant number of harmful events.
2.8.5 Incident Result by Time Period
Table 2.8-2: Incident Result by Time Period
1999 ‐ 2003 2004 ‐ 2008 % Change
Equipment Damage or Loss 4 2 ‐50%
Loss of Production/Operation 24 22 ‐8%
Loss of Equipment Control 15 16 7%
Environmental Spill 2 3 50%
Injury or Death 1 3 200%
Public Injury or Death 0 1 N/A
Loss/Contamination of Product 0 1 N/A
Fine/Penalty 0 2 N/A

Lice
nsed
to C
lient
Com
pany
on
30 N
ovem
ber
2009
. D
istr
ibut
ion
rest
ricte
d to
em
ploy
ees
of C
lient
Com
pany
.
© 2009 Security Incidents Organization Page 34
Table 2.8-2: Incident Result by Time Period looks at the rate of incidents resulting in significant harm occurring in the five year period between 1999 and 2003 and again for the five year period between 2004 and 2008. Both time periods had approximately the same number of incidents.
The most dramatic difference is the increase in incidents resulting in injury or death. The figure jumped from 1 to 4, representing a 300% increase.
2.9 Financial Impact
2.9.1 Financial Impact by Geography
Figure 2.9-1: Financial Impact (Global)
Figure 2.9-1 shows the financial impact of industrial security incidents world-wide.
The total number of incidents with an impact of less than $10,000 (36 incidents) is approximately equal to the total number of incidents with an impact exceeding that amount (37). However, there were 9 incidents resulting in a cost impact of greater than $10,000,000, up from 8 reported 2Q2009. The number of incidents with no financial impact was 8.
The industries suffering the greatest financial impact due to industrial security incidents are Petroleum, Power & Utilities and Transportation (see Table 2.9-2: Financial Impact by Industry (Global)).

Lice
nsed
to C
lient
Com
pany
on
30 N
ovem
ber
2009
. D
istr
ibut
ion
rest
ricte
d to
em
ploy
ees
of C
lient
Com
pany
.
© 2009 Security Incidents Organization Page 35
Figure 2.9-2: Financial Impact Percentages (Global)
Figure 2.9-2 shows the financial impact of industrial security incidents world-wide expressed as percentage.
38% of the incidents reported resulted in a financial impact in the range of $1-$10,000. When incidents reported as having no financial impact are included, the percentage of incidents resulting in $0-$10,000 is 49%.
Table 2.9-1: Financial Impact by Time Period summarizes the financial impact of incidents occurring in the five year period between 1999 and 2003 and again for the five year period between 2004 and 2008. Both time periods had approximately the same number of incidents.
Table 2.9-1: Financial Impact by Time Period
1999 ‐ 2003 2004 ‐ 2008 % Change
$0 3 5 67%
< $10,000 12 8 ‐33%
$10,000 ‐ 100,000 3 5 67%
$100,000 ‐ 1,000,000 3 4 33%
$1,000,000 ‐ $10,000,000 1 2 100%
> $10,000,000 3 1 ‐67%

Lice
nsed
to C
lient
Com
pany
on
30 N
ovem
ber
2009
. D
istr
ibut
ion
rest
ricte
d to
em
ploy
ees
of C
lient
Com
pany
.
© 2009 Security Incidents Organization Page 36
Figure 2.9-3: Financial Impact (USA)
Figure 2.9-3 shows the financial impact of industrial security incidents in the US.
In the US there were no incidents that reported with no ($0) financial impact. Data for the remaining incidents show that the greatest number of incidents where the financial impact was known fell into the range of $1-10,000. Five incidents in the US resulted in an impact exceeding $10,000,000.
Lice
nsed
to C
lient
Com
pany
on
30 N
ovem
ber
2009
. D
istr
ibut
ion
rest
ricte
d to
em
ploy
ees
of C
lient
Com
pany
.
© 2009 Security Incidents Organization Page 37
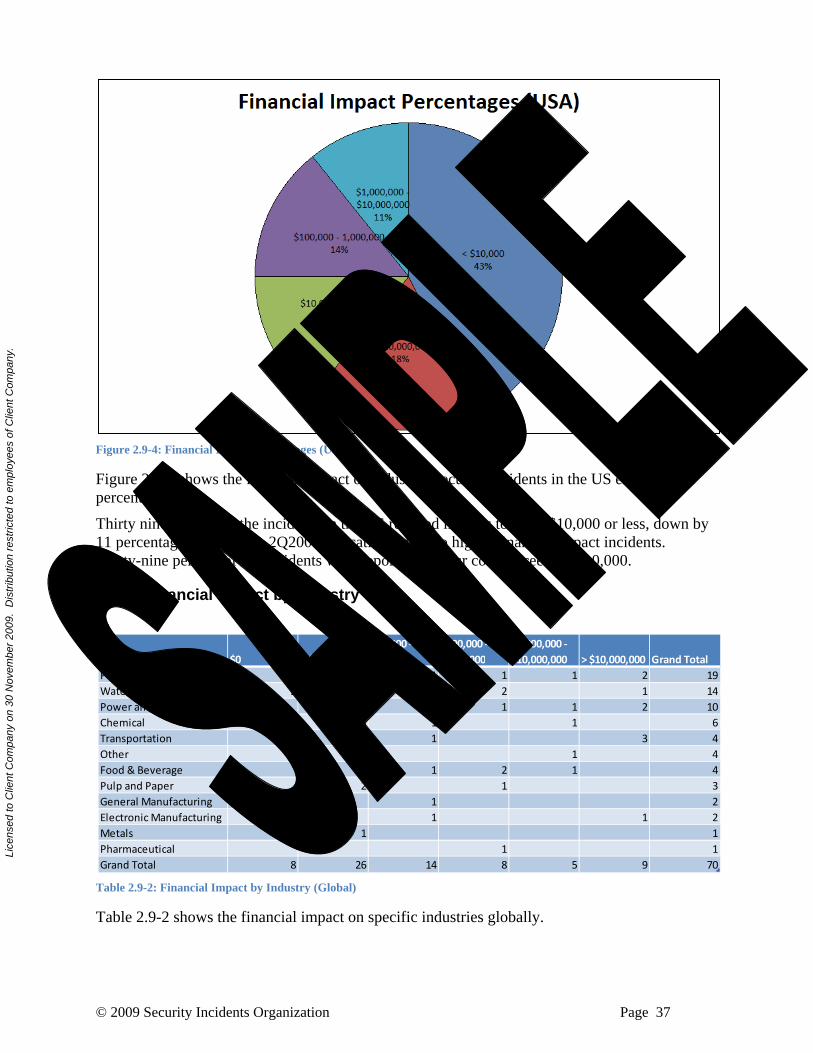
Figure 2.9-4: Financial Impact Percentages (USA)
Figure 2.9-4 shows the financial impact of industrial security incidents in the US expressed as percentage.
Thirty nine percent of the incidents in the US resulted in costs totaling $10,000 or less, down by 11 percentage points since 2Q2009 indicating a shift to higher financial impact incidents. Thirty-nine percent of the incidents were reported to incur costs exceeding $10,000.
2.9.2 Financial Impact by Industry
Table 2.9-2: Financial Impact by Industry (Global)
Table 2.9-2 shows the financial impact on specific industries globally.
IndustryType $0 < $10,000
$10,000 ‐
100,000
$100,000 ‐
1,000,000
$1,000,000 ‐
$10,000,000 > $10,000,000 Grand Total
Petroleum 3 11 1 1 1 2 19
Water/Waste Water 2 5 4 2 1 14
Power and Utilities 2 4 1 1 2 10
Chemical 1 3 1 1 6
Transportation 1 3 4
Other 1 2 1 4
Food & Beverage 1 2 1 4
Pulp and Paper 2 1 3
General Manufacturing 1 1 2
Electronic Manufacturing 1 1 2
Metals 1 1
Pharmaceutical 1 1
Grand Total 8 26 14 8 5 9 70

Lice
nsed
to C
lient
Com
pany
on
30 N
ovem
ber
2009
. D
istr
ibut
ion
rest
ricte
d to
em
ploy
ees
of C
lient
Com
pany
.
© 2009 Security Incidents Organization Page 38
The industries suffering the greatest financial impact are Petroleum, Power & Utilities and Transportation. These industries suffered at least one incident exceeding $10,000,000. Electronic Manufacturing and Water/Waste Water had one incident resulting in costs over $10,000,000. One incident was reported since 2Q2009 that exceed $10,000,000 losses in transportation.
Table 2.9-3 Financial Impact by Industry (USA)
Table 2.9-3 shows the financial impact on specific industries in the US.
The industries in the US that suffered the greatest financial impact are Power & Utilities, Petroleum and Transportation. Power & Utilities, Petroleum, Electronic manufacturing and water/Wastewater industries have suffered one incident resulting in costs exceeding $10,000,000.
2.10 Operation and Production Impact
Figure 2.10-1: Production Impact (Global)
IndustryType < $10,000
$10,000 ‐
100,000
$100,000 ‐
1,000,000
$1,000,000 ‐
$10,000,000 > $10,000,000 Grand Total
Petroleum 6 1 7
Power and Utilities 1 2 1 1 1 6
Water/Waste Water 3 2 1 6
Food & Beverage 2 1 3
Chemical 1 1 2
Other 1 1
Transportation 1 1
Pharmaceutical 1 1
Electronic Manufacturing 1 1
Grand Total 12 4 4 3 5 28

Lice
nsed
to C
lient
Com
pany
on
30 N
ovem
ber
2009
. D
istr
ibut
ion
rest
ricte
d to
em
ploy
ees
of C
lient
Com
pany
.
© 2009 Security Incidents Organization Page 39
Figure 2.10-1 shows the effect of industrial security incidents on production. The incidence frequency is plotted against downtime.
The production downtime was not always known. When a downtime was reported, the number of downtime hours reported most frequently was zero followed by 1 to 4 hours. There were 10 incidents that resulted in downtime exceeding 72 hours.
Figure 2.10-2: Production Downtime Percentages (Global)
Figure 2.10-2 shows the production downtime percentages world-wide.
In 36% of the cases when downtime was known, there was no downtime reported due to the incident. That does not translate to a financial loss or loss of employee time. In many cases, production continued, while software/hardware updates were installed.

Lice
nsed
to C
lient
Com
pany
on
30 N
ovem
ber
2009
. D
istr
ibut
ion
rest
ricte
d to
em
ploy
ees
of C
lient
Com
pany
.
© 2009 Security Incidents Organization Page 40
Figure 2.10-3: Production Impact (USA)
Figure 2.10-3 shows the effect of US industrial security incidents on production. The incidence frequency is plotted against downtime.
When downtime was known, the incidents in the US resulted in no downtime most frequently followed by downtime of 1 to 4 hours. Though downtime was avoided or not known in many cases, there could certainly be other consequences like financial losses and lost employee time as updates or other security measures are put into place.
Figure 2.10-4: Production Downtime Percentages (USA)

Lice
nsed
to C
lient
Com
pany
on
30 N
ovem
ber
2009
. D
istr
ibut
ion
rest
ricte
d to
em
ploy
ees
of C
lient
Com
pany
.
© 2009 Security Incidents Organization Page 41
Figure 2.10-4 shows the production downtime percentages in the US.
When downtime was known, the percentage of incidents resulting in less than 1 hour of downtime was 42%, down 4 percentage points from 2Q2009. 58% of the incidents resulted in at least 1 hour of downtime. This is alarming due to the fact that any production loss can translate into significant financial loss or serious safety issues depending on the equipment involved and the regulated processes.

Lice
nsed
to C
lient
Com
pany
on
30 N
ovem
ber
2009
. D
istr
ibut
ion
rest
ricte
d to
em
ploy
ees
of C
lient
Com
pany
.
© 2009 Security Incidents Organization Page 42
3 Recent Incidents
3.1 Summary of Most Recent Incidents
Eleven new incidents were researched and entered into RISI this quarter. The following charts and tables provide a summary of the most pertinent facts related to these incidents:
Figure 3.1-1: Location of Recent Incidents
Table 3.1-1: Financial Impact by Industry Most Recent Incidents
IndustryType < $10,000 $10,000 ‐ 100,000 $1,000,000 ‐ $10,000,000 > $10,000,000 Grand Total
Water/Waste Water 2 4 6
Power and Utilities 1 1 2
Transportation 1 1
Other 1 1
Grand Total 3 5 1 1 10
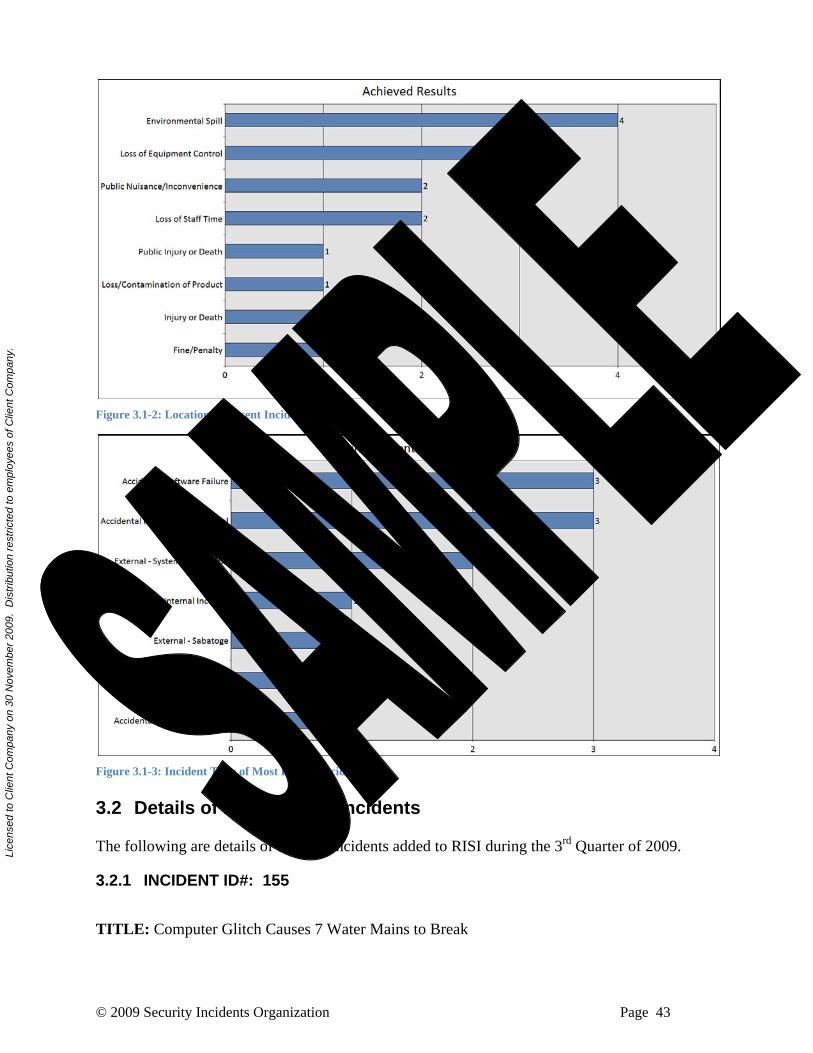
Lice
nsed
to C
lient
Com
pany
on
30 N
ovem
ber
2009
. D
istr
ibut
ion
rest
ricte
d to
em
ploy
ees
of C
lient
Com
pany
.
© 2009 Security Incidents Organization Page 43
Figure 3.1-2: Location of Recent Incidents
Figure 3.1-3: Incident Type of Most Recent Incidents
3.2 Details of Most Recent Incidents
The following are details of the new incidents added to RISI during the 3rd Quarter of 2009.
3.2.1 INCIDENT ID#: 155
TITLE: Computer Glitch Causes 7 Water Mains to Break

Lice
nsed
to C
lient
Com
pany
on
30 N
ovem
ber
2009
. D
istr
ibut
ion
rest
ricte
d to
em
ploy
ees
of C
lient
Com
pany
.
© 2009 Security Incidents Organization Page 44
DATE of EVENT: 7/28/2009
DESCRIPTION:
A computer glitch caused a false low pressure reading and turned on the pumps at a United Water facility. A computer malfunction at the Troy pumping station was blamed for the 7 water main breaks in Jersey City Heights, NJ.
Two firefighters responding to an alarm at a senior center on Hague Street at noon and noticed water in the street. They notified United Water. There were other water main breaks at Hutton St. and Cambridge Ave, Bleecker St. and Pierce Ave., Congress St. and Shermann Ave, Thorne St. and Kennedy Blvd., Congress St. and Odgen Ave., and Ravine Ave..
IMPACT:
A boil order was issued. Water in some places was reported to be brown. Low water pressure resulted in some residents not having water for a period of time. Water tankers were posted at two locations in the event of a fire.
FOLLOW-UP WORK:
REFERENCES:
3.2.2 INCIDENT ID#: 156
TITLE: Paperless Chart Recorder Software Hacked
DATE of EVENT:
DESCRIPTION:
Several installations of paperless chart recorders started to exhibit faults, like "going to sleep" or cyclic rebooting. The recorders were exchanged with spares and returned them to the manufacturer. There was no improvement in reliability. It was discovered that the chart recorders contained a game based on the movie "Hunt for Red October". The game could not be deleted from the firmware, only locked out from the Operators. After "lock-out", reliability seemed to improve, but faults were never completely eliminated. Sellarfeld decided to change the recorders for another make.
IMPACT:
Chart recorder faults and lock-out.
FOLLOW-UP WORK:
REFERENCES:
3.2.3 INCIDENT ID#: 157
TITLE: Lightning Strikes Cause Sewage Pump Station Overflow
DATE of EVENT: 8/22/2009
DESCRIPTION:

Lice
nsed
to C
lient
Com
pany
on
30 N
ovem
ber
2009
. D
istr
ibut
ion
rest
ricte
d to
em
ploy
ees
of C
lient
Com
pany
.
© 2009 Security Incidents Organization Page 45
The sewage pump stations at Austin Run and Potomac Hills overflowed due to lightning strikes that disabled the flow transducers at both stations. The pump transducers control the pumps that move effluent from the wells to the Aquia treatment center.
The Austin Run station overflowed approximate 2.5 million gallons into Austin Run and Aquia Creek. The Potomac Hils station overflowed approximately 55,000 gallons into Aquia Creek. The overflow volumes were higher than nornal because the telemetry system for these two stations malfunctioned and did not activate the station alarms. The utilities plant operators were not aware of the overflow because the alarms did not activate. The overflows were discovered when mechanics rebooted the telemetry system 2 days later.
IMPACT:
The Austin Run station overflowed approximate 2.5 million gallons into Austin Run and Aquia Creek. The Potomac Hils station overflowed approximately 55,000 gallons into Aquia Creek.
FOLLOW-UP WORK:
Stations reparied, and staff is working with the telemetry contractor to determine how to prevent another malfunction. Staff spread lime to disinfect the area of the spill.
REFERENCES:
3.2.4 INCIDENT ID#: 158
TITLE: Sewage Spill Shuts Down a Cornish Shellfishery
DATE of EVENT: 6/2/2007
DESCRIPTION:
On June 2, 2007, a computer and penstock controlling the flow of sewage into the Truro Treatment Works failed. This caused sewage to be direrted ton a storm tank that continued to fill until late on June 3, 2007 when it reached capacity and overflowed into the Truro River. The discharge was not reported until 3 days after the spill.
IMPACT:
Sewage spilled into the Truro River. The shellfishery was closed for 12 days. The local fisherman suffered financially. South West Water was fined £8,215.
FOLLOW-UP WORK:
REFERENCES:
3.2.5 INCIDENT ID#: 159
TITLE: Computer Glitch Floods Neighborhood
DATE of EVENT: 9/19/2009
DESCRIPTION:
A computer glitch caused pumps on the city's water tank failed to shut down when the tank was full. The electronic equipment used to monitor the tank gave a false reading when the tank was
Lice
nsed
to C
lient
Com
pany
on
30 N
ovem
ber
2009
. D
istr
ibut
ion
rest
ricte
d to
em
ploy
ees
of C
lient
Com
pany
.
© 2009 Security Incidents Organization Page 46
full. The pump produces 7,000 gallons per minute. Tens of thousands of gallons of water, mud and rocks rushed through a Cedar Hills neighborhood. The flood channel channel, built by the city, was clogged which caused water to go onto the lawn and driveway of the residential home affected. The glitch may have been caused by a brief electrical storm the night before the flood.
IMPACT:
Tens of thousdands of gallons of water, mud and rocks streamed down a mountainside into the Cedar Hills neighborhood causing minimal damage to one home.
FOLLOW-UP WORK:
REFERENCES:
3.2.6 INCIDENT ID#: 160
TITLE: Computer Failure Causes Jet Crash
DATE of EVENT: 6/1/2009
DESCRIPTION:
The Air France flight 447 crashed into the Atlantic Ocean. The black boxes were not recovered, but based on physical evidence and information from automatic maintenance messages sent, it is believed that a cascade of system failures starting with the airspeed sensors progressed to sweeping computer outages. The Airubus A330 en route from Rio de Janeiro to Paris crashed into the Atltantic Ocean during a storm.
IMPACT:
The Air France flight 447 crashed into the Atlantic Ocean. All 228 pasengers were killed.
FOLLOW-UP WORK:
REFERENCES:
3.2.7 INCIDENT ID#: 161
TITLE: Faulty Software Causes Torrens Lake Drain
DATE of EVENT: 2/11/2009
DESCRIPTION:
Faulty software caused the gates of the Torrens Weir to open without warining. The gates remained open for about two hours draining millions of liters of water from the lake. An investigation revealed that alarms that would alert remote operators of a malfunction were muted. The faulty software was purchased from Ottoway System Integration, an Adelaide-based firm which went out of business only days after the incident. There was no evidence of foul play.
IMPACT:
The Torrens Lake was drained. The water levels dropped by more than two meters. The muddy lake bottom contained large amounts of debris. The incident caused a problem for businesses

Lice
nsed
to C
lient
Com
pany
on
30 N
ovem
ber
2009
. D
istr
ibut
ion
rest
ricte
d to
em
ploy
ees
of C
lient
Com
pany
.
© 2009 Security Incidents Organization Page 47
that relied on the lake. Since the incident, the weir has been opened and closed manually. One positive outcome is that the 17 tons of debris was removed from the lake. A report from GHD Engineering contains 11 recommendations including an overhaul of the software used to regulate the weir. Lord Mayor Michael Harbison was adamant the system would be upgraded.
FOLLOW-UP WORK:
REFERENCES:
3.2.8 INCIDENT ID#: 162
TITLE: Energy Company Exposed to Hackers by a Phishing Attack
DATE of EVENT: 4/3/2007
DESCRIPTION:
An energy company hired Intreidus Group to investigate an attack that exposed the company to hackers. The investigation revealed that the company was a victim of a phishing attack that resulted in outsiders gaining control of an employees computer. The attackers gained a level of access that would have allowed them to control, view and modify everything related to the business. An email sent to employees at an energy company was opened by one of the employees.
The attack started with random administrative account being added in the internal network. The primary domain controller in the system had been compromised. The attack had originated inside the corporate network. The machine resided on the same segment as the SCADA controllers were located. The source of the breach was found to be a phishing attack.
The phishing email contained information claiming to be about employee benefits. An employee opened the email attachment unaware of the mcalicious .chm file attachment. The opened attachment reached out to a server the the Asia-Pacific region and release a malicious executable that gave the attackers access to the employees computer. The attackers used a Windows DNS (Domain Name System) vulnerability as an entry point to gain control of the employees account.
Intrepidus recommended the company re-architect the outbound filtering of Internet access and pt a proxy in place for Web browsing. In addition, segregation was advised so that no workstations sharing a critical network segment should be connected to the Internet.
IMPACT:
The phishing attack lead to a compromise of the energy company network and access to its SCADA system.
FOLLOW-UP WORK:
REFERENCES:
3.2.9 INCIDENT ID#: 163
TITLE: Energy Company Virus Attack
DATE of EVENT: 9/23/2009

Lice
nsed
to C
lient
Com
pany
on
30 N
ovem
ber
2009
. D
istr
ibut
ion
rest
ricte
d to
em
ploy
ees
of C
lient
Com
pany
.
© 2009 Security Incidents Organization Page 48
DESCRIPTION:
A virus attack on Integral Energy's computer network forced the company to restructure all of its 1,000 desktops. Eternal security experts were called in to rebuild all of the desktop computers to contain and remove the virus. The malware had not affected the power grid. Chris Gatford a security consultant from Hacklabs had conucted penetration testing on critical infrastructure said there was often "ineffective segregation" or "more typically none at all between the IT network and the network that monitors and controls the infrastructure. However a spokesperson from Integral Energy stressed that the virus attas Microsoft products and the network doesn't run on Microsoft and there was no way that the virus could make its way onto the grid.
The virus was the W32 Virut.CF strain which has been described as "a particularly sinister file infector" that spreads quickly and is considered difficult to remove. Integral Energy's computer networks were protected by a Symantec security solution, a source said. The Symantec website states that the virus installs a back door enabling hackers to issue commands to the infected machines via an internet relay chat (IRC) channel. According to Gatford, the antivirus software was not updated in a timely manner on some machines or the Symantec product could not detect it.
Integral Energy supplies electricity to Western Sydney and Illawarra region of New South Wales distributing electricity to 2.1 million people in NSW.
IMPACT:
Integral Energy's computer network was infected with the W32.Virut.CF virus. All 1,000 of its desktop computers had to be rebuilt.
FOLLOW-UP WORK:
Integral Energy called in a range of experts to help with the virus infection. The company put in place recovery plans to eliminate the virus from its business systems. An investigation is underway to determine the cause of the infection and develop a strategy to minimize risk in the future.
REFERENCES:
3.2.10 INCIDENT ID#: 164
TITLE: Wastewater pumped into Jones Falls
DATE of EVENT: 4/20/2009
DESCRIPTION:
An estimated 700,000 gallons of waste water overflowed from a pumping station on Sisson Street into the Jones Falls. There was no danger to the public because a screen flitered any macropollutants out before entering Jones Falls. The overflow was the result of a malfunctioning automated switching system that controls electricity to the station's pumps. City officials are not sure of the exact cause of this malfunction, but think a design flaw contributed to water backing up in the station. Public works employees opened a valve and allowed the waste water to flow out so that the station would not be damaged.
A spokesman for the Baltimore City Department of Public Works, Kurt Kocher, said this type of overlfow is uncommon.

Lice
nsed
to C
lient
Com
pany
on
30 N
ovem
ber
2009
. D
istr
ibut
ion
rest
ricte
d to
em
ploy
ees
of C
lient
Com
pany
.
© 2009 Security Incidents Organization Page 49
IMPACT:
An estimated 700,000 gallons of waste water overflowed from the pumping station into the Jones Falls. There was no "visible" pollution of the Jones Falls because the waste water was filtered of any macropollutants. However, public notice of the overflow was posted along the Jones Falls. The pumping station was being refurbished.
FOLLOW-UP WORK:
REFERENCES:
3.2.11 INCIDENT ID#: 165
TITLE: Automated Antiaircraft Cannon Malfunctions, Kills 9, Wounds 14
DATE of EVENT: 10/12/2007
DESCRIPTION:
A software glitch is being blamed for an antiaircraft cannon malfunction that killed 9 soldiers and seriously injured 14 others during a shooting exercise. The cause of the malfunction is not known. The South African National Defense Force is investigating whether a software glitch was the cause. The anti-aircraft weapon, an Oerlikon GDF-005, which is computerized opened fire uncontrollably.
IMPACT:
Computerized weapon fired uncontrollably during a shooting exercise killing 9 specators and injuring 14 others. A computer glitch is being blamed for the malfunction, though the possibility of mechanical failure has not been ruled out.
FOLLOW-UP WORK:
REFERENCES:

Lice
nsed
to C
lient
Com
pany
on
30 N
ovem
ber
2009
. D
istr
ibut
ion
rest
ricte
d to
em
ploy
ees
of C
lient
Com
pany
.
© 2009 Security Incidents Organization Page 50
4 Looking Ahead
While the adoption of commercial technology into control systems has been pervasive over the last 15 years, the reality is that majority of the installed base of industrial automation and control equipment has not yet been upgraded. Worldwide, the ARC Advisory Group estimates there is an ageing installed base of process automation systems reaching the end of their useful life, which in many cases can exceed 25 years, that is valued at roughly $65 billion1. This number gets bigger with each passing year as many manufacturers, particularly small to mid range manufacturers, are facing serious challenges as to how to deal with this installed base. As these systems are upgraded with new technology they introduce the vulnerabilities associated with open system technology.
This observation raises the importance of educating automation equipment manufacturers on how to improve the intrinsic security of their products and automation system end-users on control system design best practices for security.
1 “2007 Marks Another Strong Year for Worldwide DCS Market”, Larry O’Brien, ARC Advisory Group, 11 August 2008, http://www.arcweb.com/AboutARC/Press/Lists/Posts/Post.aspx?ID=53
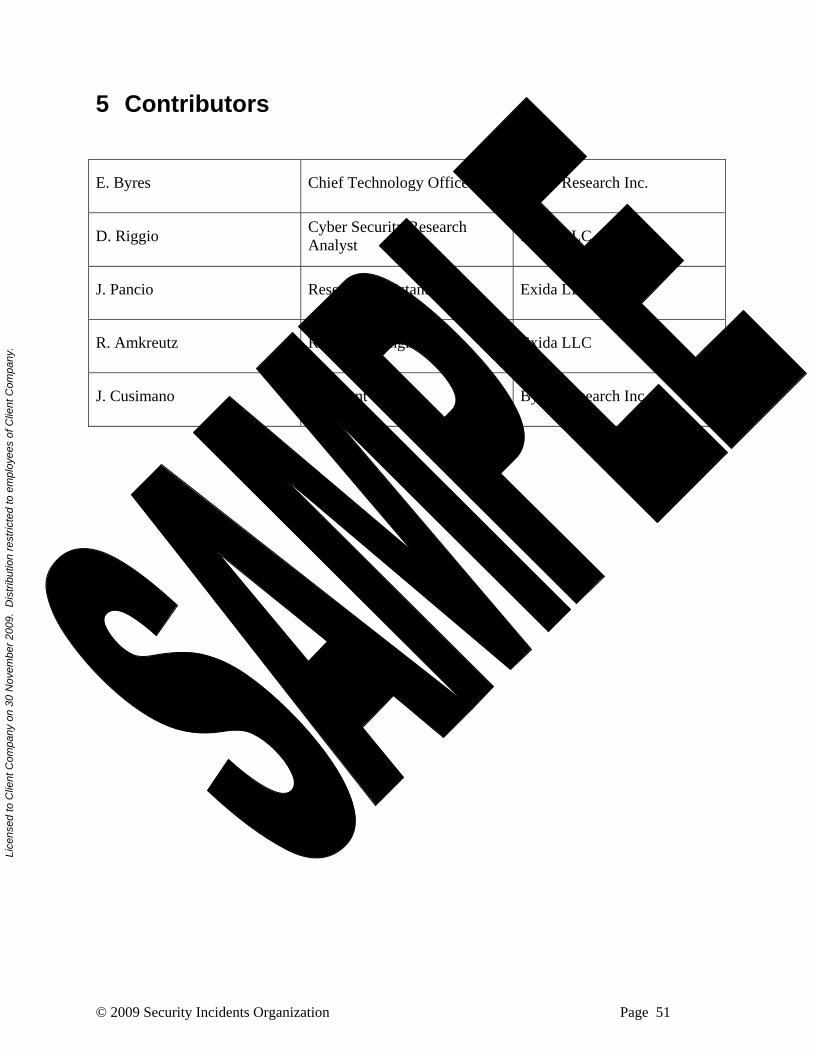
Lice
nsed
to C
lient
Com
pany
on
30 N
ovem
ber
2009
. D
istr
ibut
ion
rest
ricte
d to
em
ploy
ees
of C
lient
Com
pany
.
© 2009 Security Incidents Organization Page 51
5 Contributors
E. Byres Chief Technology Officer Byres Research Inc.
D. Riggio Cyber Security Research Analyst
Exida LLC
J. Pancio Research Assistant Exida LLC
R. Amkreutz Reliability Engineer Exida LLC
J. Cusimano President Byres Research Inc.

Lice
nsed
to C
lient
Com
pany
on
30 N
ovem
ber
2009
. D
istr
ibut
ion
rest
ricte
d to
em
ploy
ees
of C
lient
Com
pany
.
© 2009 Security Incidents Organization Page 52
6 Revision History
Revision Date Author(s) Description
1.0 November 30, 2009 J. Cusimano Issued at Rev. 1