reports - ericinces (national research council, 1987). the nces model fases on a single quantity...
TRANSCRIPT

DOCUMENT RESUME
ED 367 720 TM 021 263
AUTHOR Shin, Hyun-SeokTITLE Estimating Future Teacher Supply: An Application of
Survival Analysis.PUB DATE Apr 94NOTE 66p.; Paper presented at the Annual Meeting of the
American Educational Research Association (NewOrleans, LA, April 4-8, 1994).
PUB TYPE Reports Research/Technical (143)Speeches/Conference Papers (150)
EDRS PRICE MF01/PC03 Plus Postage.DESCRIPTORS *Career Change; *Elementary School Teachers;
Elementary Secondary Education; *Estimation(Mathematics); Faculty Mobility; InstitutionalCharacteristics; Private Schools; Public Schools;Satisfaction; *Secondary School Teachers; StatisticalAnalysis; Teacher Attitudes; Teacher Background;Teacher Characteristics; Teacher Persistence; TeacherRecruitment; Teacher Salaries; *Teacher Supply andDemand
IDENTIFIERS National Longitudinal Study High School Class 1972;*Survival Analysis
ABSTRACTThe purpose of this study was to examine whether
teachers' personal attributes and school characteristics predictdifferences in the career patterns of teachers and, if so, to explorethe implications for teacher supply. The sample was composed of 786current and former teachers identified in 1986 through the TeachingSupplement Questionnaire of the fifth follow-up of the NationalLongitudinal Study of 1972. Statistical methods included descriptivestatistics and survival analysis. Data analysis showed that many ofthe beginning teachers left teaching in the early years of theircareers. Science and English teachers were most likely to leave.Teachers who had a master's degree or who had graduated from 5-yearteacher education programs tended to stay longer; those with higherbeginning salaries tended to stay longer than those with lowersalaries; and private school teachers were more likely to leave thanpublic school teachers. Elementary school teachers were more likelyto stay than secondary school teachers, and teachers who were moresatisfied with teaching s'dyed in teaching longer than those who wereless satisfied. Policy implications for teacher supply and teachereducation and recommendations for further research are suggested.Three tables and 14 figures are included. (Contains 46 references.)(Author/SLD)
************************************************************************ Reproductions supplied by EDRS are the best that can be made ** from the original document. *
***********************************************************************
1

U.S. DEPARTMENT OF EDUCATIONOffice of Educational Research and Improvement
EDUCATIONAL RESOURCES INFORMATIONCENTER (ERIC)
I/is document has been reproduced asreceived from Pie person or cacianixahOnohglhatingd
r Mmor changes have been made mprovereproduction Ovahly
"PERMISSION TO RE'RODUCE THISMATERIAL HAS BEEN GRANTED BY
/94/0 ECIA/ 5/1/4)
Points ol view or opinions stated in this docu-ment do not necessarily represent crIlicia TO THE EDUCATIONAL RESOURCES
(NI OERI PosdOn Or policy INFORMATION CENTER (ERIC)."t,tESTIMATING FUTURE TEACHER SUPPLY:AN APPLICATION OF SURVIVAL ANALYSIS
L.T.1
HYUN-SEOK SHIN
Han Nam UniversityDepartment of Education133 Ojung-dong Daeduck-ku
Taejon, S. Korea
(Do not quote without the author's permission)
N)
Paper presented at the Annual Meeting of the American EducationalResearch Association, New Orleans, LA; April 4-9, 1994.
BEST COPY AVAiLABLE2

1
Estimatin-g Future Teacher Supply:An Application of Survival Analysis
The purpose of this study was to examine whether teachers'personal attributes and school characteristics predictdifferences in the career patterns of teachers, and if so,to explore the implications for teacher supply. The samplewas composed of 786 current and former teachers in 1986, whowere extracted from the Teaching Supplement Questionnaire of theNLS-72 fifth follow-up. Statistical methods included descriptivestatistics and survival analysis. Data analysis showed that manyof the beginning teachers left teaching in their early years ofcareer; science and English teachers were most likely to leaveteaching than those in other subject areas; teachers who hadMaster's degree or graduated from 5-year teacher educationprograms tended to stay in teaching longer than those who hadother degrees; teacher who received higher beginning salariestended to stay in teaching than those who received lowersalaries; private school teachers were more likely to leaveteaching than public teachers; elementary teachers tended tostay in teaching longer than secondary teachers;teachers whowere more satisfied with teaching tended to survive in teachinglonger than those who were less satisfied. From the findings,policy implications for teacher supply and teacher education,and recommendations for further research were suggested.
How many new teachers will be needed in American schools in the
next decade? Will there be enough qualified teachers? The answers
to these questions are important to various actors in the
educational system. For example, school board members need answers
in order to evaluate whether teacher salaries are adequate to
attract qualified teachers. Superintendents need information about
the characteristics of college students to be teachers, in order to
attract qualified teachers their schools. Educational policy makers
also need information with which to assess the quality of teacher
education programs. The primary mechanism for answering these
questions are teacher supply and demand models.
3

2
The most frequently cited projections of teacher supply and
demand, including numerical projections of the size of the
impending teacher shortage or surplus, employ the National Center
for Education Statistics' (NCES) national teacher supply and demand
model ( Murnane, Singer, and Willet, 1988). Unfortunately, the NCES
model's projections of teacher shortages and surpluses have proven
unreliable in predicting the size and timing of supply and demand
imbel,Inces (National Research Council, 1987). The NCES model
fases on a single quantity (that is, the overall attrition rate
defined as the percentage of teachers in public schools in the U.S.
in one year who are not doing so in the next year) to determine
teacher career persistence. Moreover, this model assumes that the
attrition of teachers in their careers is the same for teachers
with different subject matter specialties. It also assumes that
attrition rates do not change over time, and that teachers who
leave teaching do not return (Murnane, Singer, and Willet, 1988).
In spite of other contributing factors to teachers' career
persistence (i.e., Heyns, 1988) the NCES model used to project
teacher supply and demand ignores critical factors known to affect
teacher career patterns. In other words, the model lacks an
adequate base of descriptive information that pertains to the
teacher supply and demand (Grissmer and Kirby, 1987). In order to
overcome the shortcomings of the NCES model, this study examines
several plausible personal and school-related factors that are
believed to contribute to changes in teachers' career patterns over
relatively long periods of time (1972-1986).
4

3
THEORETICAL BACKGROUNDCareer decisions can be categorized according to tendency
patterns reflecting career development stages, and the resultant
career status or career persistence (represented as leaving or
staying) at a given time. While models of career development stages
provide useful information for instructional supervision and staff
development, information about teachers' career persistence at a
specific time is crucial to projecting teacher supply and demand
because it includes their mobility patterns in teaching.
Especially, research on organizational behavior reflects
continuing interest in employees' job termination behaviors
(leaving) such as turnover, exit, absenteeism, withdrawal,
intention to leave, and attrition. The general aim of these studies
is to deter employee behaviors that are detrimental to
organizations and to retain high quality employees. The studies of
this type can also be divided into the turnover research focusing
on individuals, and aggregate attrition research.
Teacher Attrition in the Macro Context
Attrition studies focusing on groups have examined employee
turnover tren6,s in certain jobs or organizations over relatively
longer periods than turnover studies focusing on individuals. Many
studies and reports have expressed concerns about recent trends
and changes in teacher attrition, based on studies exploring macro
level conditions that cause defection from teaching.
The International Labor Office (1981) in preparation for the
Joint Meeting on Conditions of Work of Teachers reported world and
5

4
regional employment trends in teaching. It concluded that shortages
of qualified teachers in developing countries result from poor
salary and career prospects as well as from working conditions that
encourage teachers to leave and young graduates to enter the
profession. By contrast, in developed countries the ILO found
teacher shortages to be concentrated in specialized subject areas
such as language and sciences (i.e., England, USSR, and Ireland),
and technical and vocational studies (U.S. and Sweden). The ILO
teport suggested improving working conditions such as hours of
work, class size, pupil-teacher ratios, health and safety as a
means of lowering attrition from teaching. It especially suggested
material incentives and better working conditions to retain
teachers in isolated rural areas.
Similarly, Darling-Hammond (1984) predicted that constantly
rising teacher attrition rates and declining academic ability among
incoming teachers since 1973 presage an emerging crisis in the
Nation's teaching force, leading to serious shortages of qualified
teachers, especially in math and science. She attributed decline to
factors attracting academically talented women and minorities to
occupations that promise greater financial rewards, more
opportunities for advancement, and better working conditions.
Moreover, she argued that lack of input into professional decision
making, overly restrictive bureaucratic control, and inadequate
administrative support for teaching contribute to teacher
dissatisfaction and attrition, particularly among the most highly
qualified members of the teaching force. To counter these trends
Darling-Hammond called for major changes in the structure of the
6

5
teaching profession including upgrading teacher compensation and
creating more professional working conditions.
In an extended study of Darling-Hammond's findings on expected
higher teacher attrition rates, Grissmer and Kirby (1987) developed
a theory of teacher attrition that attempts to account for
disparate reasons for attrition and to explain the patterns of
attrition unique to each life cycle and career stage. They argued
that voluntary attrition decisions depend on six factors, such asI
I
(a) the degree of acquired occupation-specific, location-specific,
and organization-specific human capital, (b) the informed nature of
the original job commitment and the nature of the original job
search, (c) the previous work and teaching experience of the
teacher at entry, (d) the probability of changes in marital status,
family composition, and residential location after employment, (e)
the salary and working conditions of teachers, and (f) the job
characteristics and wage levels of alternative opportunities both
inside and outside teaching, while involuntary attrition decisions
depend on (a) the probability that the performance characteristics
of the teacher will meet some threshold level set by the school
district, (b) the chance of teacher layoffs, which is primarily
influenced by enrollments, fiscal environment, and perhaps union
rules, (c) mandatory retirement rules, (d) illness and death.
Noting that the above factors explain teacher attrition,
Grissmer and Kirby further argued that the patterns of attrition
differ in a career and life cycle context. The major prediction
from their theory is that teacher attrition patterns will follow a
U-shaped curve over the life cycle. For instance, age-specific
7

6
attrition probabilities will be high for younger teachers who are
early in their career, very low for middle-aged teachers during the
mid-career phase, and high again once teachers become eligible for
retirement. They noted that the timing of marriage, birth of
children, geographical migration, low salaries, bad teaching
assignments, unmet expectations, and family formation could be
major causes of higher attrition rates for young men and women
teachers during their first 10 years of teaching. However, mid-
career attrition (occurring after 10-25 years of teaching
experience) is much lower than early-career attrition primarily
because of the absence of the earlier occurring factors, and that
the accumulation of occupation- and location-specific human
capital, and a self-selection process reduce the likelihood of
leaving teaching. These arguments were supported by hypotheses
testing using national and state level data.
In recent series of annual reports on the condition of teaching
in the states, Feistritzer (1985, 1986) and the Carnegie Foundation
for the Advancement of Teaching (1990) projected that the nation
will need more than half of the current public school teaching
force by 1993 due to retirements, leaving for other jobs or simply
quitting. This would coexist with rising enrollments and constant
teacher-pupil ratios. One of the reports (1986) also predicted that
many of the current teachers would no longer be teaching eight
years later and that teacher attrition rates will increase
dramatically due to an aging teaching force. The reports further
argued that academically and physically poor working conditions and
low teacher salaries are the primary causes of voluntary teacher
s
7
attrition (i.e., leaving for other jobs or simply quitting).
Accordingly, the 1986 report recommended increased recruitment of
older, experienced teachers to bridge the gap resulting from
involuntary attrition (e.g., retirements). Another report (1990)
suggested teacher involvement in decision making, the improvement
of working conditions, and improving school climate as deterrents
of voluntary attrition.
In summary, attrition studies at the macro level provide
important insights into future prospects for the teaching force.
First, they predict teacher shortages during the next decade, due
mainly to voluntary and involuntary attrition. Second, attrition
rates have been analyzed at the national level or combined states
regional level, using national survey data. Third, some studies
draw conclusions about attrition with empirical testing and their
results are based on sound frameworks of labor market theory
(Murnane, 1984), teacher mobility theory (Murnane, 1981) , and
career development and human capital theory (Grissmer and Kirby,
1987). Finally, although the studies exhibit several common causes
(e.g., salary, working conditions) of teacher attrition on national
surveys, they rarely specify a teacher attrition causal model
consisting of personal and school predictors in the development of
teaching careers. Many of these studies have shown that working
conditions or personal factors influencing teachers' affective
responses (e.g., commitment, efficacy, satisfaction) are critical
for teachers to make decisions of whether they leave or not (Ashton
and Webb, 1986; Rosenholtz, 1989; Blossfeld, 1990; Conley,
Bacharach, and Bauer, 1989; McClure, Weidman, and Sharp, 1988; NEA,
9

8
1988). However, none of the studies at the macro level
systematically examined the relationship of these factors to
teacher attrition and future workforce projections.
Determinants of Teacher Attrition
Why do teachers leave the teaching profession? Many studies,
using data gathered mainly at the state or local level, have
identified specific reasons why teachers leave teaching. Micro-
level studies on teacher attrition have focused on empirical
investigations focusing on a variety of personal and/or school-
based determinants of attrition.
Recently, Heyns (1988) analyzed the National Longitudinal Study
(NLS) teacher data on the characteristics of the supply pool to
identify patterns of entry and attrition over multiple years and to
understand the role of school characteristics. After analyzing the
effects of such school characteristics as level of instruction,
control of school, school location, racial composition, economic
status of students, and ability levels of students, she found that
rates of attrition were highest in secondary schools, private
schools, suburban schools, schools with less than 10% minority
enrollment, schools serving students from upper or upper middle
class families, and schools with students of high or average
ability. Heyns did not report, however, whether career patterns
differed by personal characteristics, such as subject specialties,
age, gender, and so forth, and when teachers are most likely to
leave. Knowing teacher career patterns by subject specialties and
when teachers leave these specialties is crucial in estimating
10

9
teacher supply in future years.
Using databases drawn from several states, Grissmer and Kirby
(1987) studied separate estimates of attrition rates by the
teachers' age, teaching levels x age, and subject matters x age.
They found that attrition is high among beginning teachers, low for
many years among experienced teachers, and then high again for
teachers who reach retirement age. whether school levels or subject
matters are concerned or not. These findings confirmed their
teacher attrition theory in relation to teacher career paths, and
concurred with the findings of the Darling-Hammond's study (1984)
and Mark and Anderson study (1985). The findings show that because
attrition rates are sensitive to teacher characteristics,
especially age, teacher career persistence may change as the
composition of the teaching force changes. Grissmer and Kirby
provided several obvious reasons for voluntary and involuntary
attrition. However, they only explained teacher attrition in terms
of age, subject specialty, and school (teaching) level. Further,
they were unable to make inferences concerning the extent to which
attrition rates differed among subsamples and to estimate the
proportion of teachers who return to teaching after a career
interruption.
On the other hand, several longitudinal studies that have
followed samples of teachers who began to teach in a particular
school year have reported the percentage of the sample that
maintained or left teaching from year to year, in terms of teacher
supply and demand. These studies have documented patterns of
teacher survival rates and their predictors over long periods using
11

10
data collected from several states.
In his earlier work, Charters (1970) identified individual and
organizational factors that affect teacher survival in school
districts in Oregon. Age, gender, teaching level, and district size
appeared as important factors that determine teacher career
patterns. In his research, survival rates tend to be higher among
male secondary and female elementary school teachers than among
their counterparts. More specifically, Charters' findings suggested
that survival rates taper off very rapidly after 4 years. Further,
Charters found that males tend to survive longer than females, with
79.2% vs. 65.5% survival rates more than one year after entering
teaching. Although differential between male and female survival
rates decreased over time, it still favored males.
Mark and Anderson (1978) examined data for the period 1968 to
1976 in order to provide a current look at public school teacher
survival rates, and to update Charters' findings. Their results
indicate that the downward sloping survival curve that Charters
found still existed. For example, of the cohort of new entrants to
teaching in St. Louis area in 1968, only 64.7% lasted beyond 1 year
(male:60.5%, female:66.1%). Further, the survival rate differential
between men and women decreased over time to a point where the
rates were virtually identical. In their follow-up study on teacher
survival rates in St. Louis, 1969-1982, Mark and Anderson (1985)
found that high attrition rates continue to exist in the beginning
years of teaching for each entering cohort. Further, survival rates
appeared to have peaked for cohorts entering in the early 1970s,
with survival rates declining substantially for subsequent cohorts.

11
Then, beginning with the cohort entering in 1975, females began to
have higher survival rates than males, a reversal from the pre-1975
cohorts.
In his earlier study, Murnane (1981) examined the mobility
patterns of teachers in one large urban school district for the
period from 1965 to 1974, using logit analysis. He found that
teacher seniority and changes in student enrollment are much more
important in exploring transfers and terminations in the 1970s than
in the 1960s. While gender had no any effect on job attrition over
the period, teachers' years of experience in teaching and racial
compositions in their schools were factors that have significant,
but minor impacts on attrition. This suggests that teachers in
their early years of teaching and in White teacher-dominated
schools tend to leave teaching more frequently than teachers in
oth,?.r settings. Finally, Murnane argued that patterns of mobility
no longer reflect primarily teacher preferences. Instead, they
increasingly reflect the pattern of declining enrollments and
operation of rules that govern the disposition of surplus teachers.
These findings Ciffer substantially from prior studies focusing on
the effects of teacher preferences on teacher attrition.
Extending Murnane's research, Eberts (1982) analyzed the effects
of specific teacher contract provisions on New York teacher
attrition from 1972-1976 and in the process assessed the validity
of two theories, human capital and labor market theories,
explaining teacher mobility, using logit analysis. He reported that
class size increases the probability of transfers and reduces the
probability of quits, but that seniority affects quit (attrition)

12
rates only in districts with rapidly declining enrolment. On the
other hand, gender and racial composition did not substantially
impact teacher attrition across districts with increasing, slightly
declining, and rapidly declining enrollments. He concluded that
teacher mobility reflected the voluntary decisions of teachers
attempting to improve the quality of their jobs during the teacher
shortage of the 1960s, but that work rules (e.g.it contract
provisions) was more useful in explaining teacher
attrition/transfer during the teacher surplus of the 1970s.
During the 1980s, Murnane and his associates initiated studies
on teacher attrition, its predictors, and its application for
teacher supply based on data from several states using survival
analysis techniques. They have found a variety of personal and
school-based predictors that influence teachers' survival rates. In
a study, Murnane, Singer, and Willet (1988) examined teachers'
career paths by age, gender, and subject specialties. They reported
that (1) young women have the shortest teaching career (low
survival rate), (2) many teachers return after a short career
interruption, (3) chemistry/physics teachers tend to shorter
careers in teaching than teachers of other subjects and are
unlikely to return to teaching, and (4) salaries in teaching could
stimulate teachers to seek other job opportunities, although this
was not empirically tested.
To recapitulate, teacher attrition studies at the micro level
have found a list of persc -11 predictors (i.e., subject specialty,
gender, race, salary, typo of certification, college GPA,
education, age, and care c-:. satisfaction) and school-based
14

13
predictors (i.e., location, sector, teaching level, racial
composition, economic status of students, size, and average
academic ability of students).
Problem Statement
A variety of factors identify several stages of teaching careers
that are critical to teacher career development and the
effectiveness of policies aimed at balancing teacher supply and
demand. However, few studies have focused on the nature of these
stage related changes. Teacher supply and demand policies have
often been made without the aid of appropriate descriptive
information about changes in teacher career patterns over long
periods of time. Widespread criticisms of a simple projection model
on teacher supply and demand suggest that the model should be
based on empirically identified predictors of teacher career
patterns that change over time.
Accordingly, this study examines whether there are significant
differences in teachers' career patterns and examines when teachers
change their careers, in terms of their personal and school
predictors. This study uses information on differences in career
patterns and changes in these patterns over time, to answer the
following research questions:
1. Are there differences in teachers' career persistence by
personal characteristics (subject specialty, gender, race, salary,
type of certification, college GPA, and level of education)?
2. Are there differences in teachers' career persistence by
school characteristics (location, school sector, teaching level,
15

14
racial composition, economic status of students, size, and average
academic ability of students)?
Using methods associated with survival analysis, the answers to
the questions provide information not only as to whether specific
events in teachers' careers may serve as predictors at particular
points in time, but also when the transitions are likely to occur.
Then, the answers to the questions will be used to predict future
teacher supply.
METHODOLOGYData and Sample
This study was mainly based on the Teaching Supplement
Questionnaire (TSQ) that follows the fifth follow-up survey of the
NLS-72. The TSQ was sent to all respondents to the fifth follow-up
survey (1986) who indicated on Question 118 that they were (1) a
current teacher, (2) a former teacher, and (3) trained as a teacher
but had never taught. Of 14,489 respondents (actually, 12,841
completed), 1,517 individuals responded to Question 118 with a (1),
(2), or (3).
Of those 1,517 respondents, 1,449 were mailed Teaching
Supplement Questionnaires. The total member of questionnaires
returned was 1,147 (86% response rate). Of these, 1,038
questionnaires were returned complete, and the other 109
questionnaires were discarded because the respondents were not
teachers and had no degree in education or certification to teach.
The 1,038 respondents were distributed as (1) 455 current teachers
who maintained teaching as of 1986 (stayers), (2) 331 former

15
teachers who left teaching (leavers;, and (3) 252 non-teachers who
were trained as teachers but never taught. Therefore, the final
sample for this study consists of 786 current and former teachers
who were drawn from the nation's elementary and secondary schools.
This sample of current and former teachers were asked about
career paths, salaries in teaching, certification, continuing
education, demographic information, reasons for entering into
teaching and attrition, school information, and years of entering
or leaving teaching. This information provided a unique opportunity
to study career dynamics of teaching. It provided an opportunity to
examine the development of teaching careers from very early stages
and to follow the students who eventually became teachers. It also
allowed us to compare those teachers who were still teaching in
1986 to those who had left teaching.
Research Variable
The independent variables for this study are grouped into 1)
personal predictors representing individual attributes of teachers
and 2) school predictors representing organizational
characteristics of their schools. Personal predictors include
teachers' subject specialty, gender, race, salary, type of
certification, college GPA, career satisfaction, and education.
The independent variables for this study are concerned with
teacher survival and attrition. Items representing the variables
were drawn from the NLS-72 data sets, such as the Fifth Follow-up,
the Postsecondary Education Transcript Study (PETS), and the TSQ.
Except for college GPA, all the independent variables are based on

16
responses to questions by teachers. The independent variables were
used individually as categorical variables that differentiate
teacher survival by criterion group.
Subject taught is defined as a subject area taught most
frequently in the last two years (or the last two years the
respondent taught); sciences (1), math (2), vocational education
(3), social science (4), humanities (5), physical education (6),
special education (7), and other education (8).
Gender indicates that female teachers are coded as "1" and male
teachers "0".
Race indicates that white teachers are coded "0" and all other
minority teachers "1".
Salary is defined as a teacher's beginning salary as used in
most studies that examined relationships between earnings and
teachers' career decisions (Murnane, 1981; Eberts, 1982; Murnane
and Olsen, 1989). Salary is categorized as a value of "1" for low-
salary teachers (lower than $ 8,500 ), "2" for medium-salary
teachers ($ 8,501 - $ 9,999), and "3" for high-salary teachers
(more than $ 10,000).
Type of certification indicates type of state teaching
certification a teacher holds. Those holding provisional
certificates, who lack some requirements, are coded "0" and regular
certificators "1" .
College GPA is taken from the PETS and is defined as a
standardized grade of college GPA reported by schools current and
former teachers attended. The college GPA considered here is
obtained from their Bachelor's degree program. The GPA is coded as
18

17
"1" for low academic performers (lower than 2.88), "2" for medium
performers (2.89 - 3.26), and "3" for academically able performers
(more than 3.27).
Education is defined by the highest degree an individual teacner
obtains. It is assigned a value of "1" for teachers who had
associate degrees, a value of "2" for teachers who completed
college education (Bachelor's degree) as of 1986, a value of "3"
for teachers who obtained a Master's degree, a value of "4" for
teachers who obtained a specialist or 6-year certificates, and a
value of "5" for teachers who obtained a Doctorate degree.
School predictors include location, sector, teaching level,
racial composition, economic status of students, size, and average
academic ability of students.
Location describes the place of a teacher's current (most
recent) school. It is coded as "1" for rural schools, "2" for
suburban schools, and "3" for urban schools.
Sector is defined as type of school control. It is coded as "0"
for public schools and "1" for parochial and private schools.
Teaching level indicates the school level at which a teacher
taught. It is coded as "1" for secondary schools including junior
high and middle schools and as "0" for elementary schools.
Racial composition is defined as the proportion of minority
students in a teacher's current (most recent) school. It is
assigned a value of "3" for schools with all white students (less
than 10% minority), "2" for those with integrated students (10 -
60%), and "1" for those with minority students (over 60%).
Economic status of students is coded as "1" for schools with
19

18
upper or upper middle class students, "2" for schools with lower
and lower middle class students, and "3" for schools with mixed
class students.
Size is defined as the student enrollment at a teacher's current
or most recent school.It is categorized as small enrollment (less
than 386) coded "1", medium enrollment (387-685) coded "2", and
large enrollment (more than 686) coded "3".
Academic ability of students describes an academic ability level
of students in a teacher's current or most recent classes. It is
given "1" for schools composed of students with high or average
ability level, "2" for schools with low ability, and "3" for
schools with widely differing ability.
The dependent variable is teachers' career duration in teaching
or teaching spell based on their career persistence at a given time
(1986). The variable was obtained from the TSQ. Career duration is
defined as the length of teaching spell or waiting-time for which
a teacher stay in teaching from entry to teaching to exit during
the data collection period. Information about teachers' career
duration time was obtained from both stayers and leavers during the
period of 192 - 1986.
While leavers' teaching spells remain as fixed information
within the period, stayers' spells are flexible due to their
continuity in teaching. That is, teachers who may not have left
teaching by the end of the data-collection (or for whom the event
of interest does not happen) cannot help possessing truncated or
"right-censored" waiting-times or duration.
The direct analysis about all teachers' waiting-times during the
20

19
data collection period (1972 1986), including teachers' with
right-censored waiting-times, underestimates the true length of
teachers' remaining in tea,ing in 1986. Therefore, this study
deals with right-censoring by employing the survival analysi_s
teaching or event history analysis that make mathematical
transformations of waiting-time that remain meaningful in the face
of right-censoring and then transform back during the
interpretation of the analyses. Thus, in order to protect
underestimation of parameters waiting time or caused by right-
censored information career duration time to an event (staying or
leaving) transformed into the survivor function (or survival
probabilities) or hazard function (or hazard probabilities) as a
new dependent variable that will be detailed.
Analytic Procedures
The primary technique for this study is called event history
analysis or survival analysis (Allison, 1982, 1984; Willet and
Singer, 1988). The technique focuses on the length of time to a
response. The response is an event that occurs at a specific point
in time and refers in this study to leaving or remaining in the
teaching profession. The time-to-response is also called waiting-
time or survival time to an event at a given time. Thus, event
history analysis deals with "a longitudinal record of when events
happen to a sample of individuals" (Allison, 1984).
As briefly mentioned earlier, however, the obvious problem in
analyzing event history data is that the event of interest may not
have occurred during the da.c.a collection period. During the period
21

20
for this study (1972-1986), nearly half of-the sampled teachers
maintained their teaching spells. Therefore, the length of the
teaching spell for them cannot be determined because they were
still teaching or, methodologically speaking, they were "right-
censored". If information about right-censored teachers is excluded
from or included in (without any treatment) event history data
analysis, the true length of first spell would be underestimated.
Therefore, censored information should be accommodated in specific
statistical models using event history analysis (Allison, 1984;
Tuma, 1982; Tuma and Hannan; 1984) or survival analysis
(Kalbfleisch and Prentice, 1980; Miller, 1981).
Due to right-censored cases, the time-to-response or length of
time (or duration) in first (or initial) teaching as an original
dependent variable is mathematically transformed into the survivor
function (or survival probability) and the hazard function (or
hazard probability). The mathematical transformation makes right
censored information during the interpretation of the data analyses
(1972 - 1986). Therefore, the survival probability and the hazard
probability function as new dependent variables throughout all the
event history analyses to follow.
The survivor function1 is a plot which indicates the
1 The survivor function (or survival probability) attime is the probability that a teacher does not leaveteaching prior to time t or that he/she survives beyond t.The survivor function S(t) is given as
S(t)=P(T?.t)=expl"-fth(u)du] in continuous timeor
=Prob[survival beyond t] in discrete time,
where T is a continuous random variable for duration of the
probability that-a selected individual will remain a teacher beyond
a particular time, more simply speaking, how likely it is that a
teacher will survive in teaching beyond 1 year, 2 years, 3 years,
and so on. Thus, survival probabilities can be estimated for each
year after entry and are interpreted as the percentage of teachers
(survived to a year or at risk) who are continuing on to the next
year without having left. They provide a picture of survival as a
function of time. At the very beginning of the study, when all the
teachers have just started their teaching, none of them left in the
first year, hence their survival probability is 1.00, interpreted
as 100% of the teachers surviving beyond year 1. As time passes,
teachers gradually start to leave teaching, and the survival
probability drops steadily, although it may not reach zero during
the period of observation due to right-censoring (Murnane, Singer,
and Willet, 1988).
In this study the survivor function is assumed to be a
continuous function on each interval year (i.e., 0.0-1.2, 1.2-2.4,
2.4-3.6 years, and so on), so a linear interpolation on a midpoint
between the data points is used (Cox and Oakes, 1984). That is
because the points of cumulative proportion surviving (or estimates
of the survivor function) only at beginning of interval years are
given. Interpretation of cumulative proportion surviving is the
same with the survival probability in discrete time.
In addition to a picture showing changes in survival
probabilities plotted on each interval year, the survivor function
provides a useful summary statistic estimated from the
risk period for an event.
3
21

22
probabilities, "estimated median survival time". It summarizes the
time point at which half the teachers in the sample have left
teaching, and which is useful in understanding how rapidly the
survivor function drops and how long a teacher might expect to stay
in teaching.
The hazard function2 (or hazard probability, hazard rate,
instantaneous rate of failure) is defined as the (conditional)
probability of risk or rate that a teacher will leave teaching
after a particular point of time in teaching, given that the
teacher has taught continuously until that time (Allison, 1984). In
discrete time, for instance, when comparing the teacher who entered
in 1978 and left in 1983, with another teacher who entered in 1981
and was censored in 1986, the hazard probabilities for the first
teacher are "0" for the first four years and "1" for the fifth
year. But, the probabilities for the later teacher are "0" for all
five years because s/he never left, although the two teachers
taught for the same five years. Thus, teachers' probabilities of
risk of leaving teaching can be collectively estimated for each
2 The hazard function (or hazard rate) is theinstantaneous risk of leaving teaching at time t, given thatthe event did not occur before time t. The hazard rate h(t)in continuous time is given as
h(t) = lim P(t+At >71t171_?_t) = f(t)dt-40 At S(t)
or
= lim (Prob[leaving between t and t+At1Surviva1 to t]]At-00 At
In discrete time,h(t) = Prob [leaving between t and t+lisurvival to t].

23
year in teaching.
The greater the hazard function, the greater the risk of leaving
teaching. By knowing hazard probabilities in each of the years, we
can tell whether the second year of teaching is particularly risky
compared with the other years, when a particular year is most
risky, and how risk trends vary depending on time or other factors.
For the purposes of interpretation, the survivor function and
the hazard function can be taken together. That is, hazard also
functions as a measure of how rapidly the slope of the survivor
plot is changing. For instance, if the survivor plot drops quickly
from one particular time to the other, we can explain that many
teachers have left teaching at that period or, inversely, that
period is very hazardous or risky for teaching. Thus, hazard
functions can be described in asscciatirm with changes in the
survivor functions.
Survivor functions and hazard functiono cesn be modeled in terms
of two groups of predictors in this study. Both survivor and hazard
functions are compared among teachers' personal (attributes (e.g.,
male vs. female, white vs. minority, inter-subjects). They also are
compared by subgroups of school characteristics (e.g., elementary
vs. secondary, public vs. private, rural vs. suburban vs. urban).
In addition to pictorial comparisons of the functions among the
predictors, the listings of the 75th and 50th (median survival)
percentiles of the survivor function are presented as summary
statistics for comparison. For each group of the predictors, then,
the summary table is presented with the total number of teachers,
the number leaving teaching and censored (staying), and proportion
25

24
censored. Lastly, the MantPl-Cox test is done tO see whether the
survivor functions obtained for the groups of the predictors are
equal (Benedetti, Yuen, and Young, 1990)3.
RESULTSDescriptive analysis
This study initially included 455 current teachers and 331
former teachers in 1986. Of all 786 subjects sampled, 9 subjects
were excluded for this study, since they did not answer most of the
item questions items including those on duration of teaching. Thus
the final sample included 777 subjects. Several continuous
variables consisted of that number of subjects, in case missing
values were substituted with mean values: salary, GPA, size, racial
composition, entry age, years of teaching experience, and career
satisfaction. Some discrete variables maintained complete 777 cases
(gender, subject, marital status, and teaching level), while the
others did not. Table 1 shows descriptive statistics of research
variables: mean, standard deviation, minimum value, maximum value,
and number of cases.
3It i3 exponential scores test which was scores based
on the expected value of order statistics from anexponential distribution. It is known as the log-rank testthat gives equal weight to all observations.
The Mantel-Cox test is one of four nonparametriclinear rank tests provided in in the 1L of BMDP. The othersinclude the Tarone-Ware, Breslow, and Peto-Prentice tests.When interpreting the results of the statistical tests,consideration should be given to the sample size, and thepattern and amount of censoring, since the distribution ofthe test statistics and reported p-values are based onasymptotic statistical theory. When only a small sample ofsubjects is used, the test results should be interpreted withcare.
r, 6

25
In this sample, teachers' per capita beginning salary was
$9,250, which was a bit below the United States average of $9,494
in 1980. In terms of college GPA, subjects appeared to have high
average of GPA, 3.05. It is the same in its median value with 2.88
GPA of one third percentile and 3.26 of two thirds percentile. Most
of the subjects entered teaching at the age of 24.4, held 5 years
of their first teaching spell, and obtained Bachelor's as a highest
degree (64.3%). In terms of racial composition of students in their
schools, most subjects taught at schools with 0% to 40% minorities
of the total student population (71.4%).
Duration by Personal Attributes
Research Question 1 is composed of several specific questions to
see how the patterns of first teaching duration differ depending on
teachers' personal attributes: gender, race, college GPA, subject,
salary, certification, and education.
Duration by gender. Figure 1 displays survivor functions by
gender. Compared to male teachers' duration pattern in teaching,
female teachers appeared to have nearly the same pattern.
Table 2 exhibits the survival statistics that summarize survival
patterns by gender and test their differences. There are no unique
gender differences in teaching spell. The estimated survival time
for 75 percent of female teachers was 2.41 year, while the time for
male teachers was 1.49.. This result was very slightly reversed for
the estimated median survival times, but there is no actual
difference in the times between male and female teachers. Several
test statistics consistently evidence no difference in first
27

26
teaching duration between them. Therefore, there can -be no
generalizations made about the effect of gender on survival
probabilities based on years in teaching. This finding was also
found for a national sample (NCES, 1991) and for several state
samples (Kemple, 1989; Title, 1990).
Duration by race. Figure 2 dispalys obvious differences in
cumulative proportion surviving by race. It indicates that minority
teachers persist longer in their overall in teaching that white
teachers, as was also found by Kemple (1989).
The differences in first teaching duration were summarized and
tested in Table 2. Minority teachers have more censoring proportion
(0.61) and have longer estimated median survival time (9.77) than
white teachers have 0.48 for censoring proportion and 6.06 year for
the survival time. In terms of the median survival time at which
half of the teachers have left teaching, minority teachers stayed
in first teaching three and half year longer than did white
teachers. Test statistics consistently show the significant
difference in survivor functions between minority and White
teachers at the .05 level. Therefore, minority teachers tend to
stay in teaching longer than white teachers. This result reversed
findings from NCES (1991), Chapman and Hutcheson (1982), and
Murnane and Olsen (1987) that reported a slight or no differences
between white and minority teachers.
Duration by GPA. Figure 3 shows that teachers with medium GPA
tend to occupy the top of the cumulative proportion surviving plots
until year 10, followed by teachers who have high GPA. In terms of
the proportion of censored cases which means the percentage
28

27
teachers survived to the end of the data collection period,
teachers with medium GPA represent the highest proportion of
censored cases (54%).
According to Table 2, teachers who have medium GPA have the
longest estimated median survival time (8.87 year). It is about
three year longer in the survival time than 5.92 year for
academically able teachers. This suggests that academically
proficient teachers make a quick exit from teaching and stay less
in first teaching than do others. Test statistics reaffirm the
substantial difference in survival probabilities between teachers
with the three levels of academic ability at .05 level. Therefore,
both academically proficient and poor teachers tend to leave
teaching more frequently than teachers with mediocre ability.
Duration by subject. Figure 4 clearly shows that special
education teachers and other education teachers (mainly, elementary
teachers) remain in their first teaching duration longest of all
the subject matters. To the contrary, teachers who teach sciences,
humanities (mainly, English), and vocational education tend to stay
less than teachers who teach the other subjects.
In Table 2 special education teachers had the longest estimated
median survival time (9.81), followed by social studies teachers
(7.96 year) and then elementary teachers (7.86 year). Although
social and elementary teachers were expected to have the longer
survival times, special education teachers were not thought to.
Special education areas have been thought to be one of the subjects
that have high attrition rates (NCES, 1991). That is, however, not
the case for this sample. Meanwhile, science teachers appeared to
r) 9

28
have the shortest median survival time (4.08 year), then followed
by vocational education teachers were found to have relatively a
high risk of leaving teaching, as elsewhere (Ibid.). The teachers
would be lured out of the profession more easily than elementary
and social studies teachers, because the former teachers have
better abilities and skills that are more attractive to alternative
employers than do elementary and social studies teachers. Besides
inability to find work outside, another possible explanation may be
that elementary teachers tend to be more satisfied to remain in the
classroom (Title, 1990).
On the other hand, test statistics based on survival information
by subjects show statistically significant differences in duration
time among subjects at the 0.01 level. Science, vocational, and
English teachers tend to leave teaching more often than teachers
with other subjects. Previous findings on duration by subjects were
confirmed in this study, except for special education teachers.
Duration by salary. Figure 5 shows that teachers with medium and
high salaries tend to stay longer in teaching than teachers with
low salaries. According to Table 2, while teachers with medium and
high salaries have more than seven year median survival time,
teachers with low salary only have 5.4 year survival time. This
result can be also sensed from distribution of censored cases. More
than half the teachers with medium and high salaries survived to
1986, whenever they entered teaching, whereas only about 40% of low
paid teachers survived to that year. Duration differentials between
teachers with three levels of salary were statistically significant
at the .05 level. Teachers with higher than average salaries tend
30
29
to stay in teaching longer than those with lower salary.
These findings espouse that career duration is positively
related to salaries (e.g., Becker, 1975; Murnane and Olsen, 1988;
Zabalza, Turnbull, and Williams, 1979). That is, the more a teacher
earns, the more likely s/he is to stay in teaching. In their recent
studies using state data, however, Kemple (1989) and Title (1990)
failed to empirically evidence "salary effects on first teaching
duration". They attributed this to (1) Black teachers' tendency to
stay in teaching due to unequal opportunities in changing
occupations; (2) a lack of salary variation among teachers in their
samples; (3) the benefits of working conditions in the profession
that may outweigh the salary consideration. But they generally
agree that high salaries keep teachers from leaving teaching for
other occupations.
Duration by certification. As expected, regular certificants
appeared to stay longer than the counterparts in Figure 6. The
survival probability differences between both certificants made
clear on years in teaching duration. The results looked clearer
from survival statistics in Table 2. The difference in estimated
median survival times was nearly seven years, while the difference
in proportions censored was about sixty percent more for regular
certificants. Test statistics verified the differences with
statistical and substantial significance at an absolute level
(.0000). Provisional certificate holders are more likely to leave
teaching regular certificate holders.
A likely explanation for the short careers of provisional
certificants may be that these teachers were granted temporary
31

30
teaching certificates in order to fill emergency vacancies (Kemple,
1989). These teachers would then have been replaced when a new
group of regular certificants entered teaching in the following
year.Therefbre, the teachers with provisional certificates probably
did not return because they did not upgrade their certificates to
a regular status.
Duration by level of education. Figure 2 shows that teachers
with Masters and Specialist degrees tend to stay longer than
teachers with lower or higher degrees. Teachers with Doctorate and
Associate degrees were positioned far below in their cumulative
proportion surviving plots. Teachers with Bachelor degree moved
their plots down between teachers with Master/Specialist and
Associate/Doctorate degrees. Most noteworthy, teachers with
Associate and Doctorate degrees were dramatically less likely than
others to persist throughout the first seven years of teaching.
Table 2 summarizes the patterns of survival plot depending on
levels of education. As expected, teachers with Master's degrees
(10.60 year) and Specialist degrees (8.35 years) had longer median
survival times than did teachers with Bachelor's (5.24 year),
Doctorate (2.98 year), and Associate degrees (2.96 year). The
former stayed in teaching 3 to 8 years longer than the latter, in
terms of estimated median survival times. This result was also
found in proportions of censored cases, in which more than 50% of
the teachers with Master and Specialist degrees maintained their
teaching until 1986. Test statistics showed that differences in
summary statistics between teachers with the levels of education
are statistically significant at an absolute level (.000). Master
32

31
and Specialist degree teachers tend to stay" in teaching
substantially longer than others. These results differ from those
of recent NCES short-term survey (1991) showing that Specialist
degree teachers had the highest annual attrition rate, then
followed by Bachelor's, Master's, Doctorate, and Associate degree.
Duration by School Characteristics
Reseach question 2 consists of several specific questions used
to determine whether durations in teaching vary depending on
teachers' school characteristics: teaching level, school sector,
academic ability, economic status of students, school size, racial
composition of school, and school location.
Duration by teaching level. Figure 8 displays the plot of
survival patterns by teaching level. Elementary school teachers
were found to have longer years in teaching than secondary school
teachers. These patterns were reflected in survival statistics by
teaching level in Table 3. Elementary teachers appeared to have
nearly three year longer median survival time than secondary
teachers. The proportion of teachers surviving to 1986 was 55
percent for elementary teachers and 44 percent for secondary
teachers. The differences between both sets of teachers were
significant at the .01 level. Therefore, elementary teachers tend
to stay substantially longer in teaching than secondary teachers.
Why do elementary teachers persist longer in teaching? Two
possible explanations have been made for the question. Generally,
secondary teachers, especially science or English teachers, have
skills that provide them with better chances to find alternative
33

32
employment outside teaching, and therefore they tend to leave
teaching more frequently (Title, 1990). Elementary teachers, on the
other hand, who do not need special skills in teaching tend to stay
in teaching. The other likely explanation is that elementary
teachers are typically move satisfied with their careers than are
secondary teachers (Heyns, 1988). Elementary teachers tend to be
satisfied with the rewards they obtain from teaching, and therefore
persist longer in teaching.
Duration by sector. Figure 9 shows a conspicuous difference
between public and private schools, in terms of the cumulative
proportion surviving pattern. As expected from past studies, public
school teachers tend to stay longer than private school teachers.
The differences between teachers in the two schools were very
straightforward in terms of survival statistics by sector. As seen
in Table 3, half of public school teachers remained in teaching 4.5
year longer than did half of private teachers. Comparing survival
times at the 75th percentile for both groups, we can state that
many private teachers tend to leave teaching within the first few
years. Test statistics showed the differences in teacher survival
patterns between public and private schools at an absolute level.
Thus, public teachers are more likely to remain in teaching than
private teachers.
This finding seems ironical, because we know private schools
excel public schools in student outcomes and teacher outcomes.
However, we must remember that many private teachers who leave
earlier tend to enter teaching in public schools. Previous research
has attributed early private teacher attrition to unfavorable
34

33
working conditions and unmet monetary compensation in private
schools (Heyns, 1988).
Durafion by academic ability. As replicated, Figure 10 shows
that teachers at schools composed of students of widely differing
ability levels tend to stay longer in teaching than those at
schools with the other two levels. However, school teachers at the
three levels of ability drew the same patterns of survival
probability plots.
As presented in Table 3, teachers at schools with differing
levels of student ability were censored by 57 perce-it, which means
that more than half of them remained in teaching until 1986. This
result also indicates that these teachers had the longest median
survival times (9.7 years), longer by 3 to 4 years than those of
teachers at schools with higher and lower academic levels. Test
statistics showed the differences ,in summary statistics between
teachers at the three levels of academic ability to be significant
at the .05 level. It concluded that teachers who work at schools
composed of differing levels of student academic ability tend to
stay in teaching longer than other teachers.
The average academic level of students in a school is one of the
working conditions that affect teachers' satisfaction and
commitment. Therefore, the high level of student ability was
anticipated to influence teachers' duration in teaching. From the
results, however, a higher level of student ability is not
associated with longer teacher duration in teaching. Rather,
teachers remained longer at schools with various levels of student
academic ability.
35

34
Duration by economic status. Figure 11 presents cumulative
survival patterns by three levels of economic status. Teachers who
worked at schools composed of mixed class families were found to
stay longer in teaching than those at schools with lower and upper
class families. Although teachers from mixed class schools were
plotted in their survival probabilities above those from upper and
lower class schools, most survival plots between upper and lower
schools overlapped.
As shown in the survival plot, Table 3 showed that teachers who
were at schools with mixed class families had the longest median
survival time (10.4 year). It nearly double the times for teachers
at upper class and lower class schools. When the results from the
summary statistics were tested, however, the differences in
survival times among teachers in the three classes were not
statistically significant. Duration differences were substantial
between teachers at mixed class schools and at upper or lower class
schools, though.
The results run counter to a common belief that teachers working
at schools with economically advantaged families and resources are
more satisfied with their teaching careers, so they are not likely
to leave. The economic status of students in a school proved to be
a non-additive, non-linear function in predicting teachers'
duration in teaching. That is to say, the variable was not a good
predictor of teachers' decisions about whether to stay or to leave.
Duration by school size. Figure 12 displays cumulative
proportion surviving patterns by school size. Although the pattern
differences are not quite plausible, teachers in medium- and large-
3 6

35
sized schools tend to stay longer in teaching than those in small-
sized schools. The survival probability gaps between both groups of
teachers appear obvious during years 2 through 6.
As exhibited in Table 3, teachers in medium-sized schools (5.3
years) and large-sized schools (7.3 years) have longer median
survival times than those in small-sized schools(5.3 years). These
patterns in median times were also found by Title (1990). That is,
the larger the school size, the longer the median survival time.
Median survival times by size in this study were quite similar to
those from the North Carolina sample in Title's study. Test
statistics verified the duration differences by size at the .05
level, except for the Mantel-Cox test. Therefore, teachers in
larger-sized schools tend to stay longer in teaching than those in
small-sized schools.
Why do teachers in larger schools or districts remain longer in
teaching? From human capital theory, teachers seeking to maximize
their returns on accumulated skills and knowledge may find
opportunities, such as those for advancement and promotion, greater
in large-sized schools or districts (Ibid.), which have more
positions in the school hierarchy. Therefore, teachers in small-
sized schools or districts may transfer into large ones. Further,
teachers are more likely to leave small schools because these
schools usually offer worse working conditions. Teachers in small
schools are usually assigned heavy teaching and work loads.
Beginning teachers may also be forced to teach at small-sized
schools with unfavorable working conditions. Therefore, teachers in
small-sized schools or districts tend to move to larger schools or
37

36
districts after a few years of teaching in small ones.
Duration by racial composition. Figure 13 presents cumulative
proportion surviving patterns by racial composition. The patterns
are not discernable by sight: there are similar survival patterns
of plots for years in teaching, although teachers in white-dominant
schools are positioned at the bottom of the patterns.
The fuzziness in differentiating survival patterns of the three
groups of teachers is reflected in the survival statistics shown in
Table 3. In terms of estimated survival time, teachers who work in
schools with integrated and large minority populations appear to
have slightly longer times than those in schools with large white
population. There were, however, no statistically significant
differences between them. Therefore, there were no substantial
differences in survival times between teachers who worked in
schools with three types of minority populations.
This result is not consistent with Title's findings. Title
found, in his samples from three states, that teachers from
districts with large minority populations are more likely to leave
teaching rapidly, and vice versa. It is taken for granted that
white teachers prefer to teach in schools that do not have large
minority populations (Title, 1990). A similar assumption would be
made for minority teachers. From this study, however, we may
tentatively conclude that teachers may seek to teach in schools
which contain an ethnic mix of students.
Duration by location. Figure 14 indicates that teachers tend to
have similar patterns of survival plots over all first teaching
years. Urban teachers had the same survival probabilities until the
3 8

37
sixth year, then they became positioned above those of rural and
suburban teachers.
In terms of summary statistics in Table 3, urban teachers had a
longer median survival time (8.7 years) than did rural teachers
(7.5 years), and suburban teachers (6.0 years). The differences
between the three groups of teachers, however, were found to be
statistically insignificant. Thus, there were no substantial
differences in first teaching duration among teachers from urban,
suburban, and rural schools.
The results of this study were consistent with the findings of
an NCES survey (1991). What is important to note is that urban
teachers are usually at risk of leaving the profession in their
early years of teaching, then they appear to survive longer if they
overcore their early risks. Survival trends of suburban teachers
are also noteworthy. Although suburban teachers are generally
believed to enjoy better working environments, their duration in
teaching is not much longer than that of urban teachers.
CONCLUSIONSThis study was conducted to contribute to understanding
teachers' career patterns by identifying and validating
characteristics of teachers and their schools that have been found
to predict such patterns. More detailed knowledge about teacher
career patterns was expected to produce important implications for
teacher supply projections. Based on the findings of the study,the
following conclusions were drawn.
First, beginning teachers were more likely to leave teaching.
39

38
They were at the highest risk of leaving the profession during the
first two years. This phenomenon was common to every beginning
teacher, whatever his or her personal and school characteristics.
Second, the subjects teacher taught influences how long teachels
remain in their initial teaching stage. Career patterns in teaching
varied depending on which subject they taught. Science (e,g.,
chemistry, physics, biology) and English teachers tended to leave
teaching earlier and more than teachers with other subjects. While
many studies have examined aggregated effects of math and science
teachers on teacher career patterns, the effects of both subjects
appeared to be separable. Science teachers tended to leave the
profession more often than math teachers. Human capital theory
explains that science and English teachers were more likely to
leave teaching, because they have skills and abilities more
applicable to business and industrial occupations that provide
better material benefits.
Third, teachers who had Master's degrees or graduated from 5-
year teacher education programs tended to stay in teaching longer
than those who had the other degrees. The Master's degree was one
of the most powerful predictors that influence teachers' survival
in teaching. Teachers with Master's degrees were less apt to leave
teaching than were those with Bachelor's degrees. Otherwise,
teachers who had associate and doctoral degrees tended toward very
short careers in teaching.
Fourth, regular certificate holders tended to stay in the first
teaching stage longer than provisional certificate holders. The
risk of leaving teaching for regular certificate holders was
40

39
approximately half the risk of provisional certificate holders'.
Fifth, teachers who received better beginning salaries tended to
have longer teaching durations than those who received lower
salaries. Lower-paid teachers were at higher risk of leaving the
profession during the first six years.
Sixth, private school teachers were more likely to leave
teaching than public school teachers. Private teachers' survival in
teaching was more than twice that of their counterparts. As
reported in other studies (Heyns,1988), many of the private
teachers who left teaching earlier tended to enter teaching in
public schools because of unfavorable working conditions and low
pay in private schools.
Finally, elementary school teachers tended to stay in teaching
longer than secondary teachers. Secondary teachers were at more
risk of leaving teaching across all years in teaching than were
elementary teachers. Human capital theory argues that elementary
teachers who do not need specific skills in their teaching areas
tend to stay in teaching due to few job opportunities outside
teaching. The other possible explanation is that elementary
teachers are typically more satisfied with teaching than secondary
teachers (Heyns,1988).
IMPLICATIONSThe findings ans conclusions of the study can provide several
imlications for policy practice. First, the findings can be
utilized for the models that states and the federal government use
to predict teacher supply and demand. As indicated in other studies
41

40
When the projection models consider information on teacher
career patterns, the personal effects model seems to be more
informative than the school effects model. The former appeared to
be better able to identify which kinds of teachers tend to leave or
remain in teaching earlier or more than other models. In addition
to school sector and teaching level considered in current teacher
supply models, the following personal attributes of teachers should
be considered to be important factors in projecting future teacher
supply: race, subject specialty, beginning salary, type of
certificates, and levels of education.
Attrition rates for states that consider some factors are
different from national attrition rates, vary from state to state,
and even differ over time (National Research Council, 1990). The
variety of local information should be used to support national
projections of teacher supply and demand.
Second, structural alternatives to extend current teacher
education programs, such as 5-year programs or Master programs, are
encouraged by the findings of this study. Many types of structural
alternatives for improving the quality of teacher education
programs and teaching candidates appeared during the educational
reform era of the 1980s. While the alternatives have not been
appropriately evidenced in terms of their effects on prospective
teachers or current teachers, or because they were sometimes dced
to fail (Feiman-Nemser, 1990), the findings of this study endorse
reliance on the 5-year and Master-level teacher education programs
in terms of their substantial effects on lengthening the duration
of teaching.
/_.41-n

41
(Murnane, Singer, and Willet, 1988, 1989; Grissmer and Kirby,
1987), projections from these models have utilized a single
attrition rate at which the current stock of teachers is leaving
the profession. Further, most models assume that (1) the single
attrition rate is the same for teachers in all subject areas, (2)
attrition rates do not change over time, and (3) teachers who leave
teaching do not return. Those assumptions, however, have proven
untrue in other studies (e.g., Beaudin, 1988; Title, 1990).
Instead of considering new college graduates the only source of
teacher supply, future teacher supply should be projected on the
basis of reversed information against the above assumptions of
current teacher supply models. English and science teachers tended
to leave teaching more often than teachers of other subjects. As
the result, the nation's schools will need more teachers who teach
those subject areas in future. It is necessary that future teacher
supply be projected depending on subject areas. Moreover, attrition
rates change over time and former teachers tended to return to the
classroom after a short break. Therefore, more realistic, accurate
projections of the balance between teacher supply and demand (1)
should be based on teacher career patterns using a variety of
predictors examined in this study, particularly subject areas, (2)
should identify the size and composition of the reserve pool of
potential teachers (e.g., former teachers, and certificate holders
who never taught) certified to teach, (3) should understand the
factors that influence former teachers' decisions to leave and to
return to teaching, and (4) should consider long-term changes in
attrition rates obtained from local and national data.
43

42
-Third, teacher certification systems need to be reviewed in
terms of retaining high quality teachers. Regular certificate
holders tended to stay in teaching longer than provisional
certificants. Generally, the provisional certificates were awarded
on a one-year basis to teachers who had not met one or more
requirements for a regular certificate. Teachers with provisional
certificates could upgrade their certification by meeting the
missing requirement or they could renew the provisional certificate
by demonstrating their intent to fulfill the missing requirement
(Kemple, 1989). However, most of the teachers with a provisional
certificate tend to have a short spell in teaching because they
would be replaced by teachers with a regular certificate.
Accordingly, states or districts with many provisional certificants
in their teaching force need to consider mobility patterns when
projecting teacher supply and demand. Further, the patterns may
influence school administration and personnel management in dealing
with these very unstable teaching force.
Fourth, teacher salary should be considered for increasing
teacher retention. Several recent reports have indicated the wide
discrepancy between teachers' salaries and those of other
professions (Carnegie Task Force on Teaching as Profession, 1986;
Holmes Group, 1986). They lament the fact that lower teacher
salaries have constantly discouraged many undergraduate students,
particularly the most academically talented, from considering
teaching as career. Although little is known about exactly how
salaries influence teachers who have already entered teaching,
recent studies have found that teachers who are paid higher
4 4

43
salaries tend to remain in teaching longer than those who are paid
lower salaries (Murnane and Olsen, 1989, 1990; Murnane, Singer, and
Willet, 1989). This issue is important to local school districts.
The best and brightest of teaching force are being lured to
business and industry where salaries are higher, particularly in
the fields of sciences, math, and English (College Placement
Council, 1988). Policy makers at the local level need to know if
raising teacher salaries is an effective way of lengthening the
time the current teaching force is likely to stay in teaching. In
this context, the findings of this study suggest that policy makers
design competitive salary schedules to compete with business or
industrial jobs current or prospective teachers may choose.
Particularly, policy measures on salary schedules should be
seriously taken into consideration for teachers in shortage, such
as science teachers.
The findings and conclusions of the study also suggest several
implications for further research. Future research on teacher
supply and demand needs to be more comprehensive in modeling
teacher supply and demand projections. In addition to relying on
the simple demographic data, teacher supply and demand studies have
to consider more comprehensive, detailed information concerning
teacher career patterns and flexible policy variables. As one of
teacher supply components, information on teacher career patterns
needs to be utilized more (1) for constructing refined models of
teacher supply and demand, (2) for more accurately predicting how
many teachers in a specific area will be needed in years to come,
and (3) for making concerted efforts to attract and retain more
45

44
qualified teachers in teaching. In short, future research needs to
be shed more lights on teacher career patterns.
Educational researchers, who intend to study teacher career
patterns or the other topics related to duration or persistence,
should be encouraged to try a variety of event history analysis
techniques. Proportional hazard modeling, which was recently
developed and introduced in educational research, has been found to
be appropriate and powerful in fully understanding (1) teacher
career patterns (e.g., Murnane, Singer, and Willet, 1988; Kemple,
1989), (2) the patterns of graduate students in their doctoral
programs (e.g., Civian, 1990), and (3) the longitudinal patterns of
student dropouts (e.g., Willet and Singer, 1991). Although event
history analysis remain somewhat difficult to understand due mostly
to the logic and principles of its mathematical functions and
transformations, it is becoming accessible because computerized
event history analysis programs are widely available through
statistical packages such as SPSS, SAS, and BMDP.
46

45
REFERENCES
Allison, P. D. (1984). Event history analysis: Regression forlongitudinal event data. Beverly Hills, CA: SagePublications.
Allison, P. D. (1982). Discrete-time methods for the analysis ofevent histories. In S. Leinhardt (Ed.). Sociologicalmethodology. San Francisco, CA: Jossey-Bass.
Ashton, P. T., & Webb, R. B. (1986). Making a difference. NewYork: Longman.
Beaudin, B. Q. (1988). Former Teachers: A study of thecharacteristics of teachers who return to the public schoolwork force. Unpublished doctoral dissertation, HarvardUniversity.
Becker, G. S. (1964). Human capital: Theoretical and empiricalanalysis with a special emphasis on education. New York:Columbia University Press.
Benedetti, J., Yuen, K., & Young, L. (1990). Life tables andsurvivor functions. In W.J. Dixon (Ed.). BMDP statisticalsoftware manual, Vol. 2. Berkeley, CA: University ofCalifornia Press.
Blossfeld, H. (1990). Changes in educational careers in theFederal Republic of Germany. Sociology of Education, 63(July), 165-177.
Carnegie Task Force on Teaching as a Profession. (1986). A nationprepared: Teachers for 21st century. Washington, DC: CarnegieForum on Education and the Economy.
Center for Education Statistics. (1987). The National LongitudinalStudy of the high school class of 1972 (NLS-1972) Fifthfollow-up (1986): Teaching Supplement. Washington, D.C.: U.S.Department of Education.
Chapman, D. W., & Hutcheson, S. M. (1982). Attrition fromteaching careers: A discriminant analysis. AmericanEducational Research Journal, 7 (1), 1-27.
Charters, Jr., W. W. (1970). Some factors affecting teachersurvival in school districts. American Educational ResearchJournal, 7 (1), 1-27.
Civian, J. T. (1990). Examining duration of doctoral study usingproportional hazards model. Unpublished doctoral dissertation,Harvard University.
College Placement Council. (1988). College placement council annualsurveys, 1970-1988. Wshington, DC: National EducationAssociation.
Conely, S. C., Bacharach, S. B., & Bauer, S. (1989). The schoolwork environment and teacher career dissatisfaction.Educational Administration Quarterly, 25 (1), 58-81.
Cox, D. R., & Oakes, D. (1984). Analysis of survival data. London:Chapman and Hall.
Darling-Hammond, L. (1984). Beyond the commission reports: T h e
47

46
coming crisis in teaching. Santa Monica, CA: Rand.
Eberts, R. W. (1982). Determinants of teacher turnover duringthe 1970s: The case of New York State public schoolteachers. Center for Educational Policy and Management,Eugene, Oregon: University of Oregon.
Feistritzer, C. E. (1986). Teacher crisis: Myth or reality?.Washington, D.C.: National Center for EducationalInformation.
Feistritzer, C. E. (1985). The condition of teaching: A state bystate analysis, 1985. Princeton, NJ: The CarnegieFoundation for the Advancement of Teaching.
Grissmer, D. W., & Kirby, S. N. (1987). Teacher attrition: T h euphill climb to staff the Nation's schools. Santa Monica, CA:The RAND Corporation.
Heyns, B. (1988). Educational defectors: A first look at teacherattrition in the NLS-72. Educational Researcher, 17 (3), 24-32.
International Labour Organization. (1981). Employment andconditions work of teachers. Geneva, Switzerland: ILO.
Kalbfleisch, J. D., & Prentice, R. L. (1980). The statisticalanalysis of failure time data. New York: John Wiley and Sons.
Kemple, J. J. (1989). The career patterns of black teachers:Evidence from North Carolina. Unpublished doctoraldissertation, Harvard University.
Mark, J. H., & Anderson, B. D. (1985). Teacher survival rates inSt. Louis, 1969-1982. American Educational Research Journal,22, 413-421.
Mark, J. H., & Anderson, B. D. (1978). Teacher survival rates: Acurrent look. American Educational Research Journal, 15 (3),379-383.
McClure, M. W., Weidman, J. C., & Sharp, L. M. (1988). Teachingcareer paths and teacher education reforms. EducationalAdministration Quarterly, 24 (2), 200-221.
Miller, Jr., R. G. (1981). Survival analysis. New York: JohnWiley and Sons.
Murnane, R. J. (1984). Selection and survival in the teacherlabor market. The Review of Economics and Statistics. 513-518.
Murnane, R. J. (1981). Teacher mobility revisited. Journal ofHuman Resources, 16 (Winter), 3-19.
Murnane, R. J., & Olsen, R. J. (1990). The effects of salaries andopportunity costs on length of stay in teaching. Journal ofHuman Resources, 25 (1), 106-124.
Murnane, R. J., & Olsen, R. J. (1989). The effects of salaries andopportunity costs on duration in teaching: Evidence fromMichigan. The Review of Economics and Statistics, 347-352.
Murnane, R. J., Singer, J. D., & Willet, J. B.(1988). The careerpaths of teachers: Implications for teacher supply andmethodological lessons for research. Educational Researcher,17 (August-September), 22-30.
National Citizens Commission for the Public Schools. (1954).How can we get enough good teachers?: A guidebook. NewYork: National Citizens Commission for the Public
48

47
Schools.National Research Council. (1987). Toward understanding teacher
supply and demand. Interim report of the Panel on Statisticson Supp/y and Demand for Precollege Science and MathematicsTeachers. Washington, D.C.: National Academy Press.
NCES. (1991). Characteristics of stayers, movers, andleavers: Results from the teacher followup survey (the1988 SASS), 1988-89. Washington, D.C.: National Centerfor Education Statistics.
NEA. (1988). Conditions and resources of teaching. A specialreport by NEA.
Rosenholtz, S. J. (1989). Teachers' workplace: The socialorganization of schools. New York: Longman.
The Carnegie Foundation for the Advancement of Teaching. (1990).The condition of teaching: A state-by-state analysis, 1990.Princeton, NJ: The Carnegie Foundation for the Advancement ofTeaching.
The Holmes Group. (1986). Tomorrow's teachers. East Lansing, MI:The Holmes Group Inc.
Title, D. G. (1990). Factors influencing how long teachers remainin their initial school districts. Unpublished doctoraldissertation, Harvard University.
Tuma, N. B. (1982). Nonparametric and partially parametricapproaches to event history analysis. In S. Leinhardt (Bd.).Sociological methodology. San Francisco, CA: Jossey-Bass.
Tuma, N. B., & Hannan, M. T. (1984). Social dynamics. New York:Academic Press.
Willet, J. B., & Singer, J. D. (1991). From whether to when: Newmethods for studying student dropout and teacher attrition.Review of Educational Research, 61 (4), 407-450.
Willet, J. B., & Singer, J. D. (1988). Doing data analysis withproportional hazards models: Model building, interpretationsand diagnosis. Paper presented at the Annual Meeting of theAERA, New Orleans.
Zabalza, A., Turmbull, P., & Williams, G. (1979). The economics ofteacher supply. Cambridge, England: Cambridge UniversityPress.
49

48
Table 1. DESCRIPTIVE STATISTICS OF RESEARCH VARIABLES
Variable Mean S.D. Min. Max.
Personal AttributesGender 0 1 777Race 0 1 773Salary 9519.96 3510.04 1 3 777GPA 3.05 .47 1 3 777Certificate 0 1 774Education 2.40 .66 1 5 722Subject 1 8 777
School CharacteristicsSector 0 1 755Teaching level 0 1 777Location 1 3 739Size 686.93 706.54 1 3 777Racial composition 3.99 1.36 1 6 777Economic status 1 3 741Academic ability 1 3 758
50

TABLE 2. SURVIVAL STATISTICS BY PERSONAL ATTRIBUTES
VariableSummary Statistics
Total Leaving Censored Prop.Censored 75th Median
Mantel-Cox test
Gender
1
Male 210 103 107 0.51 1.49 6.83
0.13Female 566 28i 2/9 0.49 2.41 6.67Totals 776 390 386White 678 350 328 0.48 2.07 6.06
4.59"Minority 94 37 57 0.61 3.70 9.77Totals 772 387 385
G PA
Low 258 135 123 0.48 1.70 5.44
5.84°Medium 118 138 0.54 2.% 8.87
Fligh 262 137 125 0.48 2.21 5.92Totals 776 390 386
Subject
Science 48 28 20 0.42 1.18 4.08
22.170
Math 57 33 24 0.42 2.13 5.53Vocational 40 24 16 0.40 1.19 4.53Social sa. 52 24 28 (L54 1.17 7.96Humanities 179 106 74 0.41 1.38 4.73
Physical ed. 52 21 31 0.60 237 6.15Special ed. 97 38 59 0.61 5.03 9.81
Others 250 117 133 0.53 5.31 7.68Totals 775 390 385
Salary
Low 267 155 112 0.42 1.76 5.40
6.67°Medium 220 111 109 0.50 2.08 7.39 I
FEgh 124 165 0.57 Z86 7.98Totals 776 390 386
Certi-ficate
Provisional 174 119 55 0.32 0.78 2.20
87.44'Regular 598 268 330 0.55 3.54 9.29Totals 772 387 385
'Education
Associate 11 8 3 027 1.60 2.96
42.00e"
Bachelor 463 262 201 0.43 1.56 524Masta 200 74 126 0.EG 4E2 10.60
Specialist 39 16 23 0.59 5.05 8.35Doctorate 7 5 2 029 0.98 2.98
Totals 720
Note : a) * p.05 ** p<.01 *** p<001
51
49

50
TABLE 3. SURVIVAL STATISTICS BY SCHOOL CHARACTERISTICS
VariableSummary Statistics
Mantel-Cox test,
I
Total Leaving CensoredProp.
Ce nsored75th Median
Teachinglevel
Elementary 420 190 230 0.55 2.80 8.34
82r.Secondary 355 200 155 0.44 1.73 5.66
Totals 775 390 385
School' sector
Public 619 ?RS 334 0.54 2.58 8.26
Private 134 M 42 0.31 1.00 3.83
Totals 753 377 376
Academicability
I-Egher 329 182 147 0.45 1.94 5.53
8.84'Lower 166 84 82 0.49 1.87 6.46
Differing 261 112 149 0.57 2.82 9.72
Totals 756 378 378
Economicstatus
Upper 183 % *.* 0.48 2.64 5.99
5.67Lower 415 221 194 0.47 1.x. 5.86
Mixed 141 59 82 0.58 2.37 10.36
Totals 739 375 364
School size
Small 259 142 117 0.45 1.58 5.31
5.52b)Medium 220 102 118 0.54 2.72 8.10
Large 297 146 151 0.51 2.55 7.30
Totals 776 390 386
Racialcomposition
Minority 122 55 67 0.55 2.13 7.36
asoIntegrated 318 163 155 0.49 2.78 722
White 335 172 163 0.49 1.62 6.15
Totals 775 390 385
schoollocation
Rural 206 100 106 0.51 2.19 7.53
a68Suburban 4i2 218 194 0.47 222 5.96
Urban 1..:) 55 64 0.54 1.71 8.71
Totals 737 373 364
Note : a) * p<.05 ** p<.01 *** p<.001b) Except for the Mantel-Cox test, the other tests(Tarone-Ware, Breslow, and Peto-
Prentice) showed significant differences between the sizes at the .05 level.
52

51
FIGURE 1. CUMULATIVE PROPORTION SURVIVING BY GENDER
M IS MALE F IS FEMALE
PROB + + + + + + +
1.0 +F +
F.
M. FM F
M .F_ M
.50 + F F.
- . F...F..M ..M_ .F ..F
_
_
_
_
-+_
-0.0 +
+ + + + + + +
+
2. 6 . 10
0. 4. 8 . 12
YEARS IN TEACHING
53

FIGURE 2. CUMULATIVE PROPORTION SURVIVING BY RACE
W IS WHITE M IS MINORITY
PROB +
1.0 +M
.50 +
. M.W M
W . M .
. W M .
M M
w . .
W W. W W
.M ..M
2. 6 . 10
O. 4. 8. 12
YEARS IN TEACHING
54
52
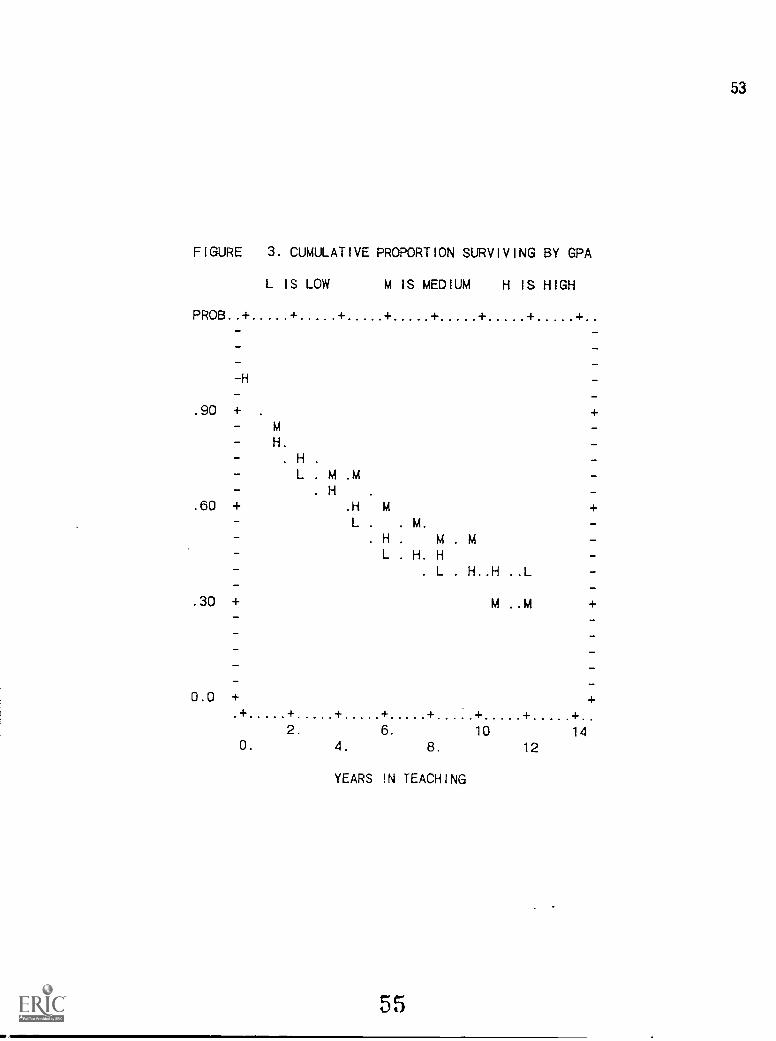
FIGURE 3. CUMULATIVE PROPORTION SURVIVING BY GPA
L IS LOW M IS MEDIUM H IS HIGH
PROB +
-H
.90 +
.60 +
.30 +
0.0 +
21111=1
H.
H .
L . M .M. H . -
.H M
L . . M.
. H M ML . H. H
L H..H ..L
M ..M
+ +
2. 6. 10 140. 4. 8. 12
YEARS IN TEACHING
55
53

54
FIGURE 4.CUMULATIVE PROPORTION SURVIVING BY SUBJECT
SH
PROB
IS SCIENCEIS HUMANITIES
+
--0
M IS MATH V IS VOCATIONAL ED. X IS SOCIALP IS PHYSICAL ED. Z IS SPECIAL ED. 0 IS OTHER
.90 + 0
.P . Z ZM . 0 . ZH P . 0
V P0
.60 + X H P . Z . Z. X . X . P .. Z.. P. .PV . 0...0
. H M
H . M 0 .
S . H ..M . O. .0S . V .. V.. V
H H.. H. .H.30 +
Ek.0 +
2. 6. 100. 4. 8. 12
YEARS IN TEACHING
56

55
FIGURE 5. CUMULATIVE PROPORTION SURVIVING BY SALARY
L IS LOW M IS MEDIUM H IS HIGH
PROB + + + + + + + +
-H-
.90 +- H
M.
- H .
- L . H .
- . .H
.60 + L M .
- .L H-__
.30 +
H. HL L M H..M ..M
L L .
_-+__
---+-_--_
H ..L +__
__
0.0 + ++ + + + + + + +
2. 6. 10 140. 4. 8 . 12
YEARS IN TEACHING
57

FIGURE 6. CUMULATIVE PROPORTION SURVIVING BY CERTIFICATION
P IS PROVISIONAL R IS REGULAR
+ + + + + +PROB +_
_
1.0 +R
- R. R
.
-- P
R
.R
R . R..50 + P R . R
_
-__
__
-0.0 +
P .
P
P .
R ..R
P. P. .P..P ..P
--+_
-_
_
_
+_
_
__
_
_
+
2. 6. 10O. 4 . 8. 12
YEARS IN TEACHING
58
56

57
FIGURE 7 . CUMULATIVE PROPORTION SURVIVING BY EDUCATION
A IS ASSOCIATE B IS BACHELOR M IS MASTER S IS SPECIALD IS DOCTORATE
PROB +
-0
S
. 90 + . M
. MA S . S
.B M . S
D ..D M .
S. .S .
.60 + A. B M M
. B .
. A
.30 + D.. D. .D
A. .A
S .. S.. S
B . . B
0.0 +
.+
2. 6 . 10O. 4. 8 . 12
YEARS IN TEACHING
59

58
FIGURE 8. CUMULATIVE PROPORTION SURVIVING BY TEACHING LEVEL
E IS ELEMENTARY S IS SECONDARY
PROB +
1.0 +S
S.
S E .
. S E.S E
.50 + S E. E . ES.
S . S
2. 6. 10O. 4. 8. 12
YEARS IN TEACHING
CO

FIGURE 9. CUMULATIVE PROPORTION SURVIVING BY SECTOR
P IS PUBLIC N IS PRIVATE
PROB + + + + + +
1.0 +N
.50 +
0.0 +
. P
N. P .
P .
P .
P. P . P
.N
P ..PN . N
. N
. N..N ..N
2. 6. 1 0
O. 4. 8. 1 2
YEARS IN TEACHING
61
59

60
FIGURE 10. CUMULATIVE PROPORTION SURVIVING BY ABILITY
H IS HIGHER L IS LOWER D IS DIFFERING
PROB +4. + +
4. + + 4.-
-D
_
. 90 +-_
DL .
-. D .
L . D .DL . .
. 60 + .L 0 .
H . D. D- .L.L . D
H . H. L .
. H . L..D ..D
.30 + H ..H
-
-_
_
_
_
0.0 + +
--_
_-+--_--+-__-_
+-__--
+ + + + + + + +2. 6. 10 14
O. 4. 8. 12
YEARS IN TEACHING
62

FIGURE 11.CUMULATIVE PROPORTION SURVIVING BY ECONOMIC CLASS
U IS UPPER L IS LOWER M IS MIXED
PROB +
M
.90 +
M.
. M .
L . M .
L M .
.60 + .L M . M
. M. .M
L .
. L. M ..ML...L..0 ..0
.L ..L.30 +
0.0 +
2. 6. 10 14O. 4. 8 . 12
YEARS IN TEACHING
63
61

62
FIGURE 12.CUMULATIVE PROPORTION SURVIVING BY SIZE
S IS SMALL M IS MEDIUM L IS LARGE
PROB +
-L
.90 +
S.
.60 +
.30 +
. S L ML. M .
S S L. L. S . S L L
.M M
_
0.0 + ++ + + + + + + +
2. 6. 10 14O. 4. 8. 12
YEARS IN TEACHING
64

63
FIGURE 13. CUMULATIVE PROPORTION SURVIVING BY RACIAL COMPOSITION
M IS MINORITY I IS INTEGRATED W IS WHITE
PROB + + + + + + + +---W
-.90 + .
- I
- W.
- I
- W I .
W .1.60 + .M
W I
W . I. M- W. W...W..W ..W- M..M
__
_-_
+---__
+_-_
-_
.30 +I ..I +
_
-_
__
_
_
_--_
0.0 + ++ + + + + + + +
2. 6. 10 14O. 4. 8 . 12
YEARS IN TEACHING
65

64
FIGURE 14. CUMULATIVE PROPORTION SURVIVING BY LOCATION
R IS RURAL S IS SUBURBAN U IS URBAN
PROB + + + + + + + +
U-
.90 +_ S- U._ S_ U_ U
_
_
+
7
_
--
.60 + . U +---__
.30 +-
U US R. U .
S. R. .0
S . S..0 ..0
_
__
+
_
0 . 0 + +. + + + + + + + +
2 . 6. 10 14O. 4. 8. 12
YEARS IN TEACHING
66