reports - computational services and bioinformatics resource · vb quiescent turn pause extension...
TRANSCRIPT

The finding that Prochlorococcus releasesDNAwithinmembrane vesicles suggests that theymay also serve as a reservoir of genetic infor-mation and possible vector for horizontal genetransfer in marine systems. To characterize thenature of the vesicle-associated DNA pool innatural seawater, we sequenced the “metagenome”from purified and DNase-treated vesicles isolatedfrom our two field sites. Based on the uniquesequences recovered, these “wild” vesicles con-tained a diverse pool of DNA with significanthomology to members of 33 phyla from all threedomains, although bacterial sequences were dom-inant (table S5). The majority of unique bacterialsequences were most similar to members of theProteobacteria,Cyanobacteria, andBacteroidetes.Since Prochlorococcus and other bacteria (29)export fragments of their genomewithin vesicles,the taxonomic diversity of DNAwe observed inthe field samples implies that diverse marine mi-crobes release vesicles. We also identified se-quences with homology to tailed and other marinephage, despite the fact that these were not appar-ent in the fractions by TEM (table S5 and sup-plementary text). Although we cannot completelyrule out the presence of phage in the samples,these sequences could reflect either the export ofprophage sequences within vesicles or DNA aris-ing from phage infection of vesicles in the field.
Although membrane vesicles constitute onlya fraction of the >109 small (<200-nm) colloidalparticles per ml observed in seawater (30), thatthey are known to move diverse compounds be-tween organisms in other systems (5, 7) suggeststhat they could serve specific functions in marineecosystems. By transporting relatively high localconcentrations of compounds, providing bindingsites, or acting as reactive surfaces, vesicles maymediate interactions between microorganisms andtheir biotic and abiotic environment that wouldotherwise be impossible in the extremely dilutemilieu of the oligotrophic oceans.
References and Notes1. B. L. Deatherage, B. T. Cookson, Infect. Immun. 80,
1948–1957 (2012).2. A. Kulp, M. J. Kuehn, Annu. Rev. Microbiol. 64, 163–184
(2010).3. J. W. Schertzer, M. Whiteley, MBio 3, e00297-11 (2012).4. I. A. MacDonald, M. J. Kuehn, J. Bacteriol. 195, 2971–2981
(2013).5. J. L. Kadurugamuwa, T. J. Beveridge, J. Bacteriol. 177,
3998–4008 (1995).6. J. Rivera et al., Proc. Natl. Acad. Sci. U.S.A. 107,
19002–19007 (2010).7. L. M. Mashburn, M. Whiteley, Nature 437, 422–425 (2005).8. H. Yonezawa et al., BMC Microbiol. 9, 197 (2009).9. Y. Gorby et al., Geobiology 6, 232–241 (2008).
10. A. J. Manning, M. J. Kuehn, BMC Microbiol. 11, 258 (2011).11. J. A. Roden, D. H. Wells, B. B. Chomel, R. W. Kasten,
J. E. Koehler, Infect. Immun. 80, 929–942 (2012).12. G. L. Kolling, K. R. Matthews, Appl. Environ. Microbiol.
65, 1843–1848 (1999).13. C. Rumbo et al., Antimicrob. Agents Chemother. 55,
3084–3090 (2011).14. P. Flombaum et al., Proc. Natl. Acad. Sci. U.S.A. 110,
9824–9829 (2013).15. F. Partensky, L. Garczarek, Annu. Rev. Mar. Sci. 2,
305–331 (2010).
16. Materials and methods are available as supplementarymaterial on Science on the Web.
17. D. Mug-Opstelten, B. Witholt, Biochim. Biophys. Acta508, 287–295 (1978).
18. B. A. S. Van Mooy, G. Rocap, H. F. Fredricks, C. T. Evans,A. H. Devol, Proc. Natl. Acad. Sci. U.S.A. 103, 8607–8612(2006).
19. N. Borch, D. Kirchman, Aquat. Microb. Ecol. 16, 265–272(1999).
20. E. Tanoue, S. Nishiyama, M. Kamo, A. Tsugita,Geochim. Cosmochim. Acta 59, 2643–2648 (1995).
21. H. X. Chiura, K. Kogure, S. Hagemann, A. Ellinger,B. Velimirov, FEMS Microbiol. Ecol. 76, 576–591 (2011).
22. S. Bertilsson, O. Berglund, M. Pullin, S. Chisholm,Vie Milieu 55, 225–232 (2005).
23. L. Aluwihare, D. Repeta, R. Chen, Nature 387, 166–169(1997).
24. A. Shibata, K. Kogure, I. Koike, K. Ohwada, Mar. Ecol.Prog. Ser. 155, 303–307 (1997).
25. J. J. Grzymski, A. M. Dussaq, ISME J. 6, 71–80 (2012).26. D. Sher, J. W. Thompson, N. Kashtan, L. Croal, S. W. Chisholm,
ISME J. 5, 1125–1132 (2011).27. J. J. Morris, Z. I. Johnson, M. J. Szul, M. Keller, E. R. Zinser,
PLOS ONE 6, e16805 (2011).28. R. J. Parsons, M. Breitbart, M. W. Lomas, C. A. Carlson,
ISME J. 6, 273–284 (2012).29. A. V. Klieve et al., Appl. Environ. Microbiol. 71,
4248–4253 (2005).30. M. L. Wells, E. D. Goldberg, Nature 353, 342–344 (1991).
Acknowledgments: We thank the members of the Chisholmlaboratory, D. McLaughlin, and W. Burkholder for helpfuldiscussions and advice; J. Jones for advice on particle analysisand providing access to equipment; N. Watson for microscopyassistance; and the J. King laboratory, Massachusetts Instituteof Technology (MIT) for equipment use. J. Roden, L. Kelly,and P. Berube provided helpful suggestions on the manuscript.We also thank the captain and crew of the R/V AtlanticExplorer, R. Johnson, S. Bell, R. Parsons, and the rest of theBATS team for assistance with field sampling and providingaccess to data. Sequence data are available from the NationalCenter for Biotechnology Information Sequence Read Archive(Prochlorococcus MED4 vesicles: SRP031649; field vesicles:SRP031871). This work was supported by grants from theGordon and Betty Moore Foundation, the NSF Center forMicrobial Oceanography: Research and Education (C-MORE),NSF-Biological Oceanography, and the MIT Energy InitiativeSeed Grant program to S.W.C. F.S. and R.E.S. were supported byan award (NNA13AA90A) from the NASA Astrobiology Institute.
Supplementary Materialswww.sciencemag.org/content/343/6167/183/suppl/DC1Materials and MethodsSupplementary TextFigs. S1 to S13Tables S1 to S6References (31–63)
18 July 2013; accepted 25 November 201310.1126/science.1243457
Progenitor Outgrowth from the Nichein Drosophila Trachea Is Guided byFGF from Decaying BranchesFeng Chen1,2,3 and Mark A. Krasnow1,3*
Although there has been progress identifying adult stem and progenitor cells and the signals thatcontrol their proliferation and differentiation, little is known about the substrates and signals that guidethem out of their niche. By examining Drosophila tracheal outgrowth during metamorphosis, weshow that progenitors follow a stereotyped path out of the niche, tracking along a subset oftracheal branches destined for destruction. The embryonic tracheal inducer branchless FGF (fibroblastgrowth factor) is expressed dynamically just ahead of progenitor outgrowth in decaying branches.Knockdown of branchless abrogates progenitor outgrowth, whereas misexpression redirects it. Thus,reactivation of an embryonic tracheal inducer in decaying branches directs outgrowth of progenitorsthat replace them. This explains how the structure of a newly generated tissue is coordinated with thatof the old.
Many adult stem cells reside in specificanatomical locations, or niches, and areactivated during tissue homeostasis and
after injury (1–4). Although considerable efforthas been made to identify factors that controlstem cell proliferation and differentiation, howstem or progenitor cells move out of the nicheand how they form new tissue are not well un-derstood (4–6). Tissue formation in matureanimals faces challenges not present in the em-bryo (7, 8). The new cells migrate longer dis-tances and navigate around and integrate into a
complex milieu of differentiated tissues. In thiswork, we investigated the substratum and signalsthat guide Drosophila tracheal imaginal progen-itor cells into the posterior during metamorphosisto form the pupal abdominal tracheae (PAT) thatreplace the posterior half of the larval trachealsystem (tracheal metameres Tr6 to Tr10), whichdecays at this time (9, 10) (Fig. 1A).
The PAT extend from the transverse con-nective (TC) branches in Tr4 and Tr5 (Fig. 1A).Each PAT consists of a multicellular stalk withmany secondary branches, each of which hasdozens of terminal cells that form numerous fineterminal branches (tracheoles) (10). There aretwo known tracheal progenitor populations atmetamorphosis: dedifferentiated larval trachealcells and spiracular branch (SB) imaginal tra-cheal cells set aside during embryonic tracheal
1Department of Biochemistry, Stanford University School ofMedicine, Stanford, CA 94305–5307, USA. 2Department ofGenetics, Stanford University School of Medicine, Stanford, CA94305–5307,USA. 3HowardHughesMedical Institute, StanfordUniversity School of Medicine, Stanford, CA 94305–5307, USA.
*Corresponding author E-mail: [email protected]
10 JANUARY 2014 VOL 343 SCIENCE www.sciencemag.org186
REPORTS

development (11–14). Lineage tracing showedthat PAT derive from imaginal progenitors (fig.S1, B and C).
To determine how progenitors in Tr4 and Tr5reach the posterior, we used a btl-RFP-moe transgene(15) (RFP, red fluorescent protein) to label activatedprogenitor cells, and ppk4>GFP (16) (GFP, greenfluorescent protein) to label larval tracheal branches(fig. S2A). Before metamorphosis, there are 7 to 10quiescent progenitor cells in each SB niche (Fig. 1Band fig. S1A) (11, 13). In early third larval instar(L3), progenitors proliferate but remain in the niche(Fig. 1C). Later in L3, progenitors leave the niche,moving onto the larval TC branches toward thedorsal trunk (DT) (Fig. 1D), while progenitorswithin the niche continue to proliferate (13). Pro-genitors in other metameres also proliferate but donot move out of the niche (fig. S2B). Migratingprogenitors in Tr4 and Tr5 crawl along the basalsurface of larval tracheal cells, with cytoplasmicprojections emanating from cells at the leadingedges of the progenitor cluster (fig. S3C). Progen-itors maintain epithelial polarity and a lumencontinuous with the SB and TC branches, forminga saclike structure (fig. S3, A and B) (9). Bywandering L3, progenitors reach theDT (Fig. 1E),where they pause (~12 hours) until the onset ofpuparium formation (Fig. 1F).
Around 1 hour after puparium formation (APF),progenitors move onto the DT and turn posteri-
orly (Fig. 1G). Posterior migration continues for9 hours, extendinghalf the animal’s length (~0.8mm)past Tr9 (Fig. 1, H to J). Live imaging showed
that progenitors move at ~1.7 mm/min, crawlingalong and wrapping around the DTas they migrate(movie S1).
A 6 - 10Tr4 5
0 hrAPF
Larv
aP
upa
F
B C D EEarly L3 Late L3 W3LL2
1 hr
3 hr
6 hr
13 hr
Tr5
G
H
I
J
Tr4 5 6 7 8 9
10Tr4 5 6 7 8 9
DT
SB
LT
TC VB
DB
PAT
(2d BPF)(3d BPF) (1d BPF) (8hr BPF)
Exiting niche
Pause
P6
P7P8
DT
TC
VB
Quiescent
Turn
Pause
Extension
Proliferating
SBniche
NE
Tr 4 56
7 8
9
Progenitors Tracheal cells
P9+10
Fig. 1. Progenitor outgrowth during Drosophila tracheal metamorphosis.(A) Air-filled trachea (reflected light) (left) and schematics (right) in L3 larva andpupa ~13 hours after puparium formation. Tr, tracheal metamere; DB, dorsalbranch; LT, lateral trunk; VB, visceral branch. Circles denote spiracles. Trachealbranches in the posterior (Tr6 to Tr10) are lost (dashed lines) duringmetamorphosisand are replaced by PAT from Tr4 and Tr5. (B to E) Fluorescence micrographs andschematics of Tr5 of ppk4-Gal4>UAS-GFP; btl-RFP-moe larva of the indicated agesstained to show activated tracheal progenitors (anti-RFP, red), larval tracheal cells(anti-GFP, green), and nuclei (4′,6-diamidino-2-phenylindole, blue). BPF, approx-imate time before puparium formation; W3L, wandering third-instar larva. (B)Quiescent progenitors in a Tr5 SBniche. Progenitors are also present in the SBnicheof Tr2 to Tr4 and Tr6 to Tr9, but only those in Tr4 and Tr5 are activated to form PAT.P6 to P10, progenitors 6 to 10; the other five progenitors (P1 to P5) are shown in fig.
S1A. NE, niche exit site (SB-TC junction). (C) Activated progenitors proliferating inthe niche. (Inset) Progenitors near the niche exit site (dash), which have begunexpressing btl-RFP-moe (red). (D) Progenitors exiting the niche. btl-RFP-moe expres-sion increases and ppk4>GFP decreases as progenitors leave the niche andmigratedorsally along TC branches. Arrowhead, progenitor migration front. (E) Progenitorspaused at the DT (arrowhead). Several progenitors have extended onto the VB(arrow). (F to J) Schematics and micrographs [as in (B) to (E)] of trachea (Tr4 to Tr9)of pupa of indicated ages APF. Paused progenitors (F) move onto the DT and turnposteriorly (G), extending along the DT (H and I) before ramifying into the PAT (J).Posterior tracheal branches start to collapse 9 hours APF and are fully collapsed andno longer conduct air by 13 hours APF. The larval cells die during metamorphosis(10), although we did not detect the apoptosis marker anticleaved caspase-3 duringcollapse (fig. S9). Scale bars: 100 mm, (A) and (F) to (J); 50 mm, (B) to (E).
Fig. 2. Progenitor out-growthrequiresbreathlessFGFR. (A) PAT progeni-tor migration in a controlesgP127-Gal4, UAS-GFP/act5c>Y>Gal4, UAS-GFP;UAS-FLP pupa 6 hours APFat 18°C with progenitorsmarked with GFP (green)and tracheal lumens stained(red). Brackets show posi-tion of progenitormigrationfront in the four phenotypicclasses (0, I, II, III) scored incontrol and in esgP127-Gal4,UAS-GFP/act5c>Y>Gal4,UAS-GFP; UAS-FLP/ UAS-DN-btl pupae, inwhichdominant-negativebreathless (DN-btl)is selectively expressed inprogenitors. Examples ofeach phenotypic class canbe found in fig. S5, A to D. Arrowhead, progenitor migration front. The graph at right shows quantification. n,number of branches. (B) PAT formation in control (top) and DN-btl pupae (bottom) as above, exceptreared for 1 to 2 additional days to allow formation of mature, air-filled pupal tracheae (reflected light).No PAT have formed in the DN-btl pupa. The graph shows quantification, with phenotypes classified as infig. S5, E to H. Scale bars, 100 mm.
Bn=95 44
n=38 43
Tr4 5 6-10
PAT formation
Con
trol
DN
-btl
0III
III
A
+ - DN-btl
0
20
40
60
80
100
% o
f bra
nche
s
0
20
40
60
80
100
% o
f bra
nche
s
+ - DN-btl
Normal
PartialMinimalNone
Normal (0)
Partial (I)Minimal (II)None (III)
Progenitor migration
DT
Progenitors Tracheal lumen
Normal
None
www.sciencemag.org SCIENCE VOL 343 10 JANUARY 2014 187
REPORTS

Differentiation begins as progenitors migrate.At the beginning of puparium formation (0 hoursAPF, Fig. 1F), a subset of progenitors that have ex-ited the niche begins to express the terminal cell
master regulator PrunedSRF (serum response factor)(17), initiating cell specialization (fig. S4A). Asprogenitors migrate along the DT, budlike struc-tures composed of Pruned-expressing cells are
detected at the tips of progenitor clusters, whereasPruned-negative cells form the stalks of new trachea(fig. S4B). By 6 hours APF, Pruned-expressingprogenitors in the tips adopt an elongated anddifferentiated morphology (fig. S4, C and D),flattening along the DT as they extend furtherposteriorly (movie S1). Around 13 hours APF, thePAT mature and fill with gas as posterior trachealbranches collapse (Fig. 1, A and J).
What guides tracheal progenitors on theirstereotyped path along specific branches of thelarval tracheal system? Expression of breathless(btl) FGFR (fibroblast growth factor receptor) isinduced in PAT progenitors (11, 13), as shown bythe btl-RFP-moe reporter (Fig. 1, B to J). Wetested whether the Btl pathway, which directstracheal branch outgrowth in embryos (18–20) andlarvae (21) and induces adult air-sac primordiumformation (22), is involved. Expression of dominant-negative Btl FGFR (19) in the progenitors andtheir descendants (23) blocked migration anddiminished or eliminated PAT formation (Fig. 2and fig. S5). To determine the source of the onlyknownBtl ligand, Branchless (Bnl) FGF (20), weused a bnl reporter, bnl-Gal4 enhancer trap lineNP2211 (24) driving UAS-GFP. Unlike previ-ously described examples of tracheal outgrowth(20–22), bnl was not expressed in surroundingtissue. Instead, it was expressed within the tra-cheal system, specifically by larval tracheal cellsalong which progenitors migrate. The expressionpattern is dynamic and precise, almost perfectlymatching the positions and timing of progenitormigration (Fig. 3A and fig. S6A). In L3 animals,when progenitors are observed along the TCbranches, bnl>GFP was expressed in TC larvalcells in Tr4 and Tr5, but not in other metameres.Shortly after puparium formation, when PAT pro-genitors turn to migrate toward the posterior, DTlarval cells in the segment just posterior to PAT
W3LLate L3
Early L3
1.5
hr A
PF
4.5
hr A
PF
7.5
hr A
PF
9 hr
AP
F13
.5 h
r A
PF
bnl>GFP reporter expressionA
D
Tr4 5 6 7 Tr4 5 6 7
0:00Merge
0:00bnl RNAi
5:55Merge
0:00Progenitors
1:50
5:55
56 7 8
9
5 6 78
9
5
67 8
9
5
5 6 78 9
NormalPartialMinimalNone
C60 41
PAT formation
0
20
40
60
80
100
% o
f bra
nche
s
+ - bnl RNAi
NormalPartialMinimalNone
Progenitor migration27 20
B
0
20
40
60
80
100
% o
f bra
nche
s
+ - bnl RNAi
bnl RNAi patch
Tr4 5
NE
5
5 6 7 8 9
Tr4Tr4
Tr4
Tr4
Tr4
Tr4
Tr4
Fig.3. ExpressionandrequirementofbranchlessFGF during progenitor outgrowth. (A) branchlessreporter expression during progenitor outgrowth vi-sualized by GFP immunostaining (white) of UAS-GFP;bnl-Gal4 NP2211/ btl-RFP-moe larvae and pupae of in-dicated ages. Reporter expression dynamically expandsalong theprogenitor outgrowthpath, initially turningonin isolated larval cells in each area. Arrowheads denotefurthest detected reporter expression. (B and C) Quan-
tification (as in Fig. 2) of progenitor migration 3 hours APF (B) and PAT formation (C) phenotypes incontrol (ppk4-Gal4, UAS-GFP; btl-RFP-moe) and ppk4-Gal4, UAS-GFP; btl-RFP-moe/ UAS-bnl RNAi pupae,in which bnl was inactivated in larval tracheal cells. For examples of the phenotypic classes, see fig. S7, Aand B. (D) Frames at indicated times (hours:minutes) APF from live imaging of an act5c>Y>Gal4, UAS-GFP/ UAS-FLP; prd-Gal4, btl-RFP-moe/ UAS-bnl RNAi pupa in which bnl expression was inactivated in a DTpatch (brackets). Tr5 progenitors (btl-RFP-moe) exit the niche (dashes) and move onto the DT but neverpass the patch. Scale bars, 100 mm.
ADT
TC
F
Niche
I
DT
CB D
G
Tr5 control clones Incorrect niche exit Premature entry Wrong turn
Covering a large clone
Proliferate Recruit
Morpho-genesis
DT
TCDT
DT
DT
New tissue
Old tissue
NE
TC TC
Tr8 control clones Inappropriate niche exit
E HBifurcation
Tracheal lumenClone marker Progenitors
Fig. 4. Effect of ectopic bnl on progenitor mi-gration. Tracheal progenitors (red, anti-RFP) inTr4 or Tr5 [(A) to (F)] and Tr8 [(G) and (H)] of con-trol (dfr-FLP/ act5c>Y>Gal4, UAS-GFP; btl-RFP-moe)and experimental (dfr-FLP/ act5c>Y>Gal4, UAS-GFP;btl-RFP-moe/ UAS-bnl) wandering third-instar larvaeshowing control clones of larval tracheal cells express-
ing GFP alone (green) [(A) and (G)] or experimental clones expressing GFP and ectopic bnl FGF [(B to F) and (H)]. Blue, tracheal lumen (Alexa Fluor 350-conjugatedwheat germ agglutinin). Arrowheads denote progenitor migration fronts. (A) Progenitors have exited the niche and reached the TC-DT junction (arrowhead). Controlclones (green) have no effect. (B) Some progenitors have exited the niche in the wrong direction along TC branches (open arrowhead), extending toward the bnl-expressing clone ventral to the niche exit. Other progenitors (solid arrowhead) have exited the niche normally toward DT. (C) Progenitors have prematurely moved ontoDT, extending toward a single larval DT cell expressing bnl. (D) Inappropriate anterior migration of progenitors along DT (arrowhead) toward the bnl-expressing clone. (E)Bifurcation of progenitor cluster (arrowheads) toward a pair of bnl-expressing clones located anterior and posterior to the TC-DT junction. (F) Bifurcation (arrowheads)where progenitors extend to fill the shape of a large bnl-expressing clone (open arrowhead). (G) Progenitors in Tr8 (as well as Tr3 and Tr6 to Tr9) normally remain withinthe niche and are unaffected by control clones. (H) Tr8 progenitors exit the niche toward a clone of bnl-expressing cells on TC branches. Scale bars [(A) to (H)], 100 mm.(I) Model of progenitor outgrowth guided by a signal produced by decaying tissue (green). Progenitors (red) are attracted to and form new tissue at the site of decay.
10 JANUARY 2014 VOL 343 SCIENCE www.sciencemag.org188
REPORTS

progenitors express bnl>GFP. As progenitorscontinue along the DT, DT larval cells activatebnl>GFP expression one segment at a timefrom anterior to posterior, matching progenitormovement.
This dynamic bnl expression along the migra-tion path is required for progenitor outgrowth.Knock-down of bnl expression byRNA interference (RNAi)in larval tracheal cells blocked migration andresulted in diminished or absent PAT (Fig. 3, Band C; fig. S7, A to C; and movie S2). Mosaicexpression of bnl RNAi in small patches along thepath (23) also arrested migration, so long as thepatch encompassed the full DTcircumference (Fig.3D; fig. S7,D andE; andmovies S3 and S4). Thus,Bnl is required all along themigration path, and thesignal does not cross even short gaps.
Ectopic bnl expression in GFP-labeled clonesof larval tracheal cells induced by dfr-FLP (23)redirected progenitor migration. Depending onthe location of the clones, ectopic bnl caused in-correct exit from the niche, premature entry ontotheDT, or wrong turns on theDT (Fig. 4, B toD).Dual clones induced bifurcation with groups ofprogenitorsmoving toward each ectopic bnl source(Fig. 4E). Clones in Tr3 and posterior metamerescaused progenitors in these regions to leave theniche, even though they do not normally do so(Fig. 4, G and H, and fig. S8, D and E). Whenthere was a large clone, progenitors migratedthroughout the clone (Fig. 4F), implying that pro-genitors do not require a gradient and will spreadto cover an entire region of cells expressingbnl at equivalent levels. When bnl-expressingclones failed to induce migration, the clonesappeared to be too far from the progenitors orthere was competition from another clone closeby (fig. S8, A and B). Ectopic bnl expressionwithin the progenitor cluster arrested migration(fig. S8C).
The results show that the embryonic trachealinducer Bnl FGF guides tracheal progenitors outof the niche and into the posterior during trachealmetamorphosis. The source of Bnl is the larvaltracheal branches destined for destruction, whichserve both as the source of the chemoattractantand as the substratum for progenitor migration.Several days earlier in embryos, these larval tra-cheal branches were themselves induced by Bnlprovided by neighboring tissues. But after em-bryonic development, most tracheal cells, includingthose in the decaying larval branches, down-regulate btl FGFR expression (fig. S2A) and thusdo not respond to (or sequester) the Bnl signalthey later express. One of the most notable as-pects of this larval Bnl is its exquisitely specificpattern in decaying larval branches, which pres-ages progenitor outgrowth. It is unclear how Bnlexpression is controlled, though it does not ap-pear to require signals from migrating progenitorsbecause the bnl reporter expression front progressednormallywhen progenitor outgrowthwas stalled bya tracheal break (fig. S6C). Perhaps expression ofBnl involves gradients in the tracheal system orspatial patterning cues established during embry-
onic development in conjunction with temporalsignals mediated by molting hormones.
Because the signal guiding progenitor migra-tion is provided by tracheae destined for destruc-tion, progenitors become positioned along thelarval branches they replace (Fig. 4I). Perhapsduring tissue repair and homeostasis, recruitmentof adult stem or progenitor cells from the niche issimilarly guided by signals from decaying tissue,thereby ensuring that new tissue is directed to theappropriate sites.
References and Notes1. N. Barker, S. Bartfeld, H. Clevers, Cell Stem Cell 7,
656–670 (2010).2. G. B. Adams, D. T. Scadden, Nat. Immunol. 7, 333–337
(2006).3. A. Alvarez-Buylla, D. A. Lim, Neuron 41, 683–686 (2004).4. C. Blanpain, E. Fuchs, Nat. Rev. Mol. Cell Biol. 10,
207–217 (2009).5. E. Sancho, E. Batlle, H. Clevers, Curr. Opin. Cell Biol. 15,
763–770 (2003).6. G. L. Ming, H. Song, Neuron 70, 687–702 (2011).7. E. Nacu, E. M. Tanaka, Annu. Rev. Cell Dev. Biol. 27,
409–440 (2011).8. K. D. Poss, Nat. Rev. Genet. 11, 710–722 (2010).9. T. Matsuno, Jap. J. Appl. Entomol. Zool. 34, 165–167 (1990).10. G. Manning, M. A. Krasnow, in The Development of
Drosophila melanogaster, M. Bate, A. Martinez-Arias, Eds.(Cold Spring Harbor Laboratory Press, Woodbury, NY,1993), vol. 1, pp. 609–685.
11. M. Weaver, M. A. Krasnow, Science 321, 1496–1499(2008).
12. A. Guha, L. Lin, T. B. Kornberg, Proc. Natl. Acad. Sci. U.S.A.105, 10832–10836 (2008).
13. C. Pitsouli, N. Perrimon, Development 137, 3615–3624(2010).
14. M. Sato, Y. Kitada, T. Tabata, Dev. Biol. 318, 247–257 (2008).15. C. Ribeiro, M. Neumann, M. Affolter, Curr. Biol. 14,
2197–2207 (2004).16. L. Liu, W. A. Johnson, M. J. Welsh, Proc. Natl. Acad. Sci.
U.S.A. 100, 2128–2133 (2003).17. K. Guillemin et al., Development 122, 1353–1362 (1996).18. C. Klämbt, L. Glazer, B. Z. Shilo, Genes Dev. 6, 1668–1678
(1992).19. M. Reichman-Fried, B. Z. Shilo, Mech. Dev. 52, 265–273
(1995).20. D. Sutherland, C. Samakovlis, M. A. Krasnow, Cell 87,
1091–1101 (1996).21. J. Jarecki, E. Johnson, M. A. Krasnow, Cell 99, 211–220
(1999).22. M. Sato, T. B. Kornberg, Dev. Cell 3, 195–207
(2002).23. Materials and methods are available as supporting
material on Science Online.24. S. Hayashi et al., Genesis 34, 58–61 (2002).
Acknowledgments: We thank M. Weaver, M. Metzstein, andother lab members for advice and reagents. This work wassupported by a Genentech Graduate Fellowship and aRuth L. Kirschstein NIH training grant (F.C.) and the HowardHughes Medical Institute.
Supplementary Materialswww.sciencemag.org/content/343/6167/186/suppl/DC1Materials and MethodsFigs. S1 to S10References (25–39)Movies S1 to S4
4 June 2013; accepted 12 November 201310.1126/science.1241442
Mutational Analysis Reveals theOrigin and Therapy-Driven Evolutionof Recurrent GliomaBrett E. Johnson,1* Tali Mazor,1* Chibo Hong,1 Michael Barnes,2 Koki Aihara,3,4
Cory Y. McLean,1† Shaun D. Fouse,1 Shogo Yamamoto,3 Hiroki Ueda,3 Kenji Tatsuno,3
Saurabh Asthana,5,6 Llewellyn E. Jalbert,7 Sarah J. Nelson,7,8 Andrew W. Bollen,2
W. Clay Gustafson,9 Elise Charron,10 William A. Weiss,1,9,10 Ivan V. Smirnov,1 Jun S. Song,11,12
Adam B. Olshen,6,11 Soonmee Cha,1 Yongjun Zhao,13 Richard A. Moore,13 Andrew J. Mungall,13
Steven J. M. Jones,13 Martin Hirst,13 Marco A. Marra,13 Nobuhito Saito,4 Hiroyuki Aburatani,3
Akitake Mukasa,4 Mitchel S. Berger,1 Susan M. Chang,1 Barry S. Taylor,5,6,11‡ Joseph F. Costello1‡
Tumor recurrence is a leading cause of cancer mortality. Therapies for recurrent disease may fail, at leastin part, because the genomic alterations driving the growth of recurrences are distinct from those inthe initial tumor. To explore this hypothesis, we sequenced the exomes of 23 initial low-grade gliomasand recurrent tumors resected from the same patients. In 43% of cases, at least half of the mutationsin the initial tumor were undetected at recurrence, including driver mutations in TP53, ATRX, SMARCA4,and BRAF; this suggests that recurrent tumors are often seeded by cells derived from the initial tumor at avery early stage of their evolution. Notably, tumors from 6 of 10 patients treated with the chemotherapeuticdrug temozolomide (TMZ) followed an alternative evolutionary path to high-grade glioma. At recurrence,these tumors were hypermutated and harbored driver mutations in the RB (retinoblastoma) and Akt-mTOR(mammalian target of rapamycin) pathways that bore the signature of TMZ-induced mutagenesis.
The genetic landscape of tumors is contin-ually evolving, which can be an impedi-ment to the clinical management of cancer
patients with recurrent disease (1, 2). In contrastto the clonal evolution of hematological malig-nancies (3, 4) and solid tumor metastases (5–7),
the local regrowth of solid tumors after surgeryoccurs under a unique set of evolutionary pres-sures, which are further affected by adjuvant ther-apies. Through the acquisition of new mutations,residual tumor cells can progress to a more ag-gressive state. Grade II astrocytic gliomas are
www.sciencemag.org SCIENCE VOL 343 10 JANUARY 2014 189
REPORTS

www.sciencemag.org/content/343/6167/186/suppl/DC1
Supplementary Materials for
Progenitor Outgrowth from the Niche in Drosophila Trachea Is Guided
by FGF from Decaying Branches
Feng Chen and Mark A. Krasnow*
*Corresponding author E-mail: [email protected]
Published 10 January 2014, Science 343, 186 (2014)
DOI: 10.1126/science.1241442
This PDF file includes:
Materials and Methods
Figs. S1 to S10
Full Reference List
Captions for Movies S1 to S4
Other Supplementary Material for this manuscript includes the following:
(available at www.sciencemag.org/content/343/6167/186/suppl/DC1)
Movies S1 to S4

Supporting Online Material
Materials and methods Drosophila strains and reporter lines
btl-RFP-moe (gift from M. Affolter, Biozentrum University of Basel) is a transgene that expresses an RFP-moesin fusion protein under the control of a btl enhancer element (15). Line CB02854 (25) (Flytrap, Yale University) contains a GFP enhancer trap insertion at the bnl locus. The Gal4-UAS system (26) was used to express fluorescent reporters, other proteins, and RNAi transgenes in specific tissues and cell types in vivo. Gal4 drivers were: ppk4-Gal4 (16) (gift from L. Liu, Peking University) a transgene containing 2 kb of the ppk4 promoter region controlling Gal4 and expressed in all larval tracheal cells; esgP127-Gal4 (11, 27, 28), an enhancer trap at the escargot locus expressed in all imaginal progenitor cells and tracheal fusion cells; prd-Gal4 (29), a transgene expressing Gal4 in the paired pair-rule gene pattern; and Gal4 enhancer trap lines NP2211 and NP3520 (Drosophila Genetic Resource Center; Kyoto Institute of Technology) (24) with insertions at the bnl locus. UAS responders were: UAS-GFP (29), UAS-FLP122 (29), UAS-DN-btl (19), UAS-bnl-RNAi GD5730 and UAS-btl-RNAi GD948 (30) (Vienna Drosophila RNAi Center), UAS-bnl-A1-1 (31), and UAS-rpr (29). tub-Gal80ts (29), a transgene that ubiquitously expresses a temperature-sensitive conditional repressor of GAL4, was used to limit UAS responder expression to specific time periods. The FLP recombinase system (32) was used for permanent marking of tissues and cells and lineage labeling. dfr-FLP (M. Metzstein and M.A.K., unpublished) is a transgene with a multimerized tracheal-specific dfr enhancer element (33) cloned upstream of an hsp70 minimal promoter driving expression of FLP. act5c>Y>Gal4 (34), a ubiquitously expressed FLP-dependent transgene in which Gal4 is expressed following FLP-mediated recombination, was used for FLP-out experiments (see below). Crumbs::GFP (Crb::GFP-A) (gift from Y. Hong, University of Pittsburgh School of Medicine) encodes a functional Crumbs-GFP fusion protein knocked into the endogenous crumbs locus (35), which labels the apical epithelial surface and tracheal lumen. All crosses were carried out at 25˚C unless otherwise indicated. Lineage trace and FLP-out experiments
All lineage trace and FLP-out experiments used act5c>Y>Gal4, UAS-GFP and a FLP transgene. Expression of FLP recombinase catalyzes “FLP-out” (removal) of a stop cassette and thereby activation of the act5c>Y>Gal4 transgene (34), which then expresses Gal4 that drives expression of UAS-GFP, to permanently label the cells in which recombination has occurred and their progeny, and expression of other UAS responders as indicated.
esgP127-Gal4 (11, 27, 28) is expressed in imaginal cells, including the SB tracheal progenitors, and fusion cells of the tracheal system. FLP-out experiments with a Drosophila strain carrying esgP127-Gal4 and UAS-FLP transgenes crossed to the act5c>Y>Gal4, UAS-GFP strain permanently labels imaginal cells and their progeny (11). Larval tracheal cells were also sporadically labeled, but because rearing the animals at 18°C reduced this unwanted labeling, all crosses and FLP-out experiments with esgP127-Gal4 were conducted at 18°C.
drifter (dfr)/ ventral veins lacking (vvl) is a transcription factor expressed in tracheal cells during embryonic development (36). In dfr-FLP; act5c>Y>Gal4, UAS-GFP animals raised at 25°C, GFP was expressed in larval tracheal clones that covered approximately 30 to 80% of the trachea. Animals raised at lower temperature had larger clones. To knockdown bnl in tracheal clones that encompassed the full circumference of the DT, dfr-FLP/ act5c>Y>Gal4,

UAS-GFP; btl-RFP-moe/ UAS-bnl RNAi animals were raised at 21°C. dfr-FLP/ act5c>Y>Gal4, UAS-GFP; btl-RFP-moe/ UAS-bnl animals raised at 25°C expressing ectopic Bnl (UAS-bnl-A1-1) in tracheal clones were viable and survived beyond puparium formation; the animals had slight defects in the shape and spacing of the larval branches and had local tufts of tracheoles, but the overall structure of the larval tracheal system was unaffected (fig. S10).
FLP-out experiments with the prd-Gal4 driver in act5c>Y>Gal4, UAS-GFP/ UAS-FLP; prd-Gal4, btl-RFP-moe/ UAS-bnl RNAi animals labeled alternating segments of the epidermis and predominantly labeled alternating segments of the trachea. Larval and pupal staging
L2 larvae were distinguished from L3 larvae by appearance of anterior spiracles. The relative ages of L3 larvae were inferred from the size of the animal; older larvae are larger. Wandering third instar larvae (W3L) and newly formed pupae (0 hr APF) were identified as described (37). 0 hr APF animals were selected and subsequent time points were determined by hours elapsed since selection.
Antibody and tracheal stains
Larvae and pupae were dissected by ventral filleting and fixed in 4% paraformaldehyde for 30 minutes then immunostained as described (38). GFP and RFP signals were amplified by immunostaining with polyclonal chicken anti-GFP (Abcam, ab13970; used at 1:1000) and polyclonal rabbit anti-DsRED (Clontech #632496; 1:300) primary antibodies. Pruned (dSRF) protein was detected with mAb2-161, a monoclonal mouse anti-dSRF antibody (used at 1:200) (39). A monoclonal rabbit anti-cleaved Caspase-3 antibody (Cell Signaling #9664) was used to detect apoptotic cells. Secondary antibodies used were: DyLight649-conjugated donkey-anti-chicken, DyLight649-conjugated donkey-anti-rabbit, Cy5-conjugated goat-anti-mouse (Jackson Immunoresearch), Alexa488-conjugated goat-anti-chicken and Alexa555-conjugated goat-anti-rabbit (Invitrogen). Tracheal lumens were stained with Alexa Fluor 350-conjugated or tetramethylrhodamine-conjugated wheat germ agglutinin (WGA) (Invitrogen; 1:1000) and with a rhodamine-conjugated chitin-binding probe (NEB; 1:300) for 1 hour at room temperature. Nuclei were stained with 4',6-Diamidino-2-Phenylindole, Dihydrochloride (DAPI) (Molecular Probes). Cuticle that lines larval tracheae autofluoresces and was also detected in the DAPI channel. Specimens were analyzed and digital images captured on confocal (Leica SP2 AOBS) and conventional florescence (Zeiss Axiophot and Leica MZ16 FA) microscopes. Air-filled tracheae were visualized on the Leica SP2 AOBS by reflected light. Unless otherwise indicated, all fluorescent micrographs are maximum projections of the confocal stack. Live imaging progenitor migration
Immobile white btl-RFP-moe pupae (0 hr APF) were cleaned with a damp tissue and placed within a drop of halocarbon oil on a 6 cm Petri dish. Pupae were positioned with forceps for optimal imaging of tracheal progenitors in Tr4 and Tr5. Movies were acquired on a Zeiss Axio Observer.Z1 inverted microscope equipped with a XL multi S1 incubator to maintain temperature at 25˚C. Images were acquired every 3 - 5 minutes for up to 7 hours, after which the RFP signal from the btl-RFP-moe reporter diminishes. Image capture times were limited to 0.5 sec or less to minimize phototoxicity.

Monitoring bnl expression with bnl reporter lines Because it proved difficult to obtain reliable signals for bnl expression by in situ
hybridization or immunostaining for Bnl protein during metamorphosis, we used Gal4 enhancer trap lines NP2211 and NP3520 and GFP enhancer trap line CB02854 with insertions at the bnl locus within a 300 bp region 5’ to the bnl transcription start site to monitor bnl expression during metamorphosis. All three enhancer trap reporters showed dynamic expression all along the route of PAT progenitor migration, with the exception noted below. CB02854 reported slightly earlier expression along the DT than NP2211 and NP3520, presumably because the binary Gal4/UAS system introduces a delay due to translation of Gal4 and induction of the GFP reporter. No expression of these reporters was detected in the section of DT between the Tr4 and Tr5 TC branches (the Tr5 DT), along which the Tr4 SB progenitors migrate to reach the next section of DT where they meet the progenitors from the Tr5 SB and continue migrating posteriorly along the DT. We infer that this part of the endogenous bnl expression pattern has a separate enhancer not reported by these enhancer trap lines because bnl RNAi knockdown in this region blocked Tr4 progenitor migration (fig. S7D; Movie S4).

esg lineage-trace
B PAT stalk cells
C PAT terminal cells
Tracheal cells
DAPIAir-filled trachea
esg lineage-trace
P1+2
P3
P4
P5
P6
P7P8P9+10
L1
L2
L3
L4NE
DT
SB niche
VB
L5L6
TC PAT terminal cellsC
A
Figure S1. Visualizing and lineage-tracing tracheal progenitors that migrate out of the spiracular branch niche. (A) Cells in the Tr5 spiracular branch (SB) niche (dotted line) before progenitor activation. A portion of tracheal metamere Tr5 is shown from a ppk4>GFP; btl-RFP-moe second instar larva (L2) stained for GFP to show tracheal cells (green), for RFP to show activated progenitors (red), and labeled with DAPI to show cell nuclei (blue). The 10 progenitor cells (P1 - P10) in the spiracular branch (SB) niche are labeled, as are six larval tracheal cells (L1-L6) in the neighboring transverse connective (TC). Progenitors P9 and P10 connect to L5 and L6 and the rest of the larval tracheal system at the SB-TC junction, which we refer to as the niche exit (NE) and indicate with a dash. P1 and P2 connect to the epidermis. Progenitors in tracheal metameres Tr2 - Tr4 and Tr6 - Tr9 (not shown) appear similar. DT, dorsal trunk; VB, visceral branch. (B, C) escargot>FLP lineage trace showing imaginal progenitors give rise to pupal abdominal trachea (PAT). Fluorescent micrographs of differentiated PAT stalk (B) and terminal (C) cells in an esgP127-Gal4, UAS-GFP/act5c>Y>Gal4, UAS-GFP; UAS-FLP pupa approximately 24 hr after puparium formation (APF) at 18ºC. SB and other esgP127-lineage (imaginal) progenitors and their descendants are labeled with GFP (green), and air-filled tracheae and terminal branches (tracheoles) are visualized by reflected light (white). Dashed line, PAT stalk; arrowheads, individual terminal cells, each of which has formed many tracheoles. Bars, 50 µm.
Supplementary Figures
Activated progenitors

Wandering L3b
tl-R
FP-m
oep
pk4
>G
FP
Tr2 4 5 6 7 8 9 btl-RFP-moe
DAPI
Mer
ge
ppk4>GFP Merge
DT
TC
LT
DB
NE
A’
SBniche
DAPI
DT
TC NE
B
ppk4>GFPbtl-RFP-moe
NE
TC
SB
C
esg lineage trace btl-RFP-moe(activated progenitors)
Merge
SBniche
3 10
A
VB
DAPI
DAPI
DAPI
DT * *
DTTCVB
LT
DB
Figure S2. Selective expression of a breathless FGFR reporter in outgrowing progenitors. (A) Fluorescent micrograph of a ppk4>GFP; btl-RFP-moe wandering third instar (W3L) larva stained for GFP to show ppk4>GFP expression and for RFP to show btl-RFP-moe expression as in Fig. 1E. Close-ups of metamere Tr5 (boxed) are shown in A’, with nuclei stained with DAPI (blue). Note that larval tracheal cells along the dorsal trunk (DT), transverse connectives (TC), lateral trunk (LT), visceral branch (VB) and posterior (Tr6 to Tr10) dorsal branches (DB) express ppk4>GFP but little or no btl-RFP-moe, which must have been downregulated after embryonic development (15). Conversely, progenitors have turned off the ppk4>GFP reporter, and Tr4 and Tr5 progenitors that are exiting the niche (arrowheads) highly express the btl reporter. Dotted lines, SB niche. Dashes, SB niche exit (NE). De-differentiating cells in anterior (Tr2 to Tr5) dorsal branches (DB) (11) also express the btl-RFP-moe reporter (A’) though at lower levels. (B) Posterior SB niche after progenitor activation. A portion of tracheal metamere Tr9 of the larva in A is shown with nuclei stained with DAPI (blue). Progenitors have proliferated and those near the niche exit express low but detectable btl-RFP-moe (red). However, progenitors do not exit the niche, as they do in Tr4 and Tr5. (C) Close up of progenitors growing out of the SB niche in an esgP127-Gal4, UAS-GFP/act5c>Y>Gal4, UAS-GFP; UAS-FLP/ btl-RFP-moe pupa 6 hr APF at 18ºC stained for esgP127 lineage-traceprogenitors (anti-GFP, green), activated progenitors (anti-RFP, red), and nuclei (DAPI, blue). Note that all progenitors that have exited the SB niche (arrowheads) express the btl reporter but those still in the niche (dotted line) do not. *, larval fusion cells that also express esg. Dash, SB niche exit (NE). Bars, 100 µm (A, C) and 25 µm (B).
TClumen
TC
SB
DT
VB
DT
TC
SB
VB
NE
Activated progenitors
A Bearly L3 W3L C late L3
NE
Larval tracheal cellProgenitors DAPI DAPI Crumbs::GFP (lumen)
B’
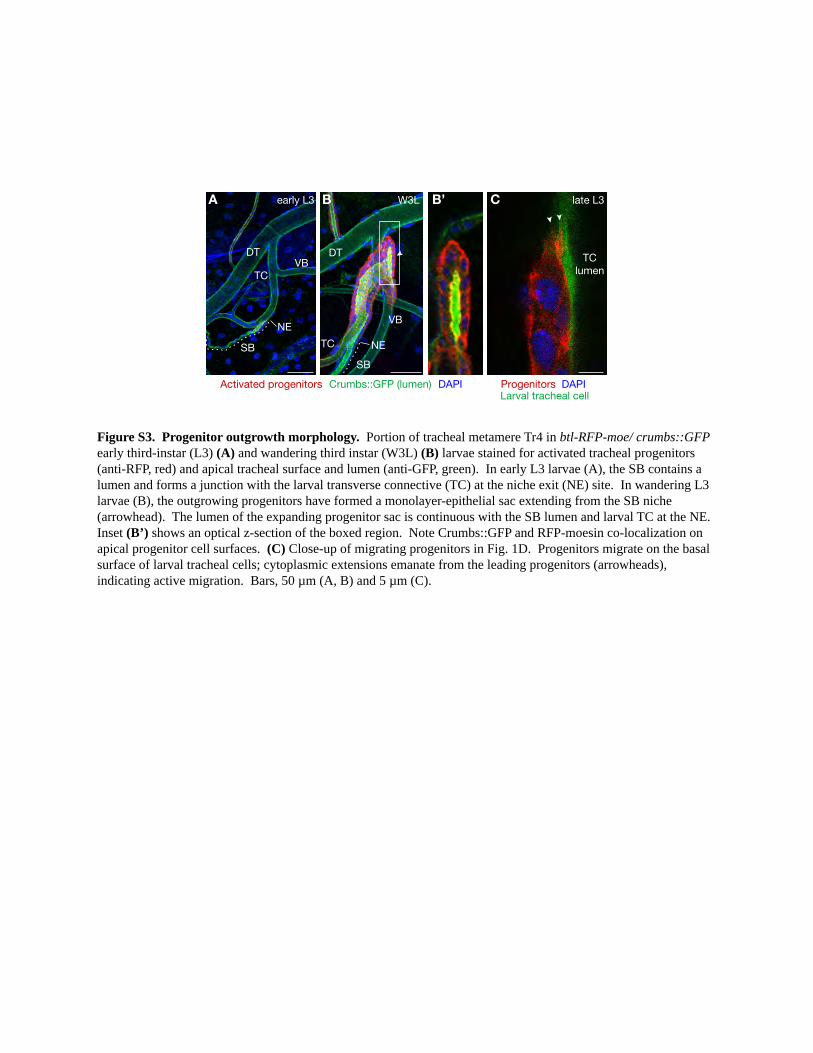
Figure S3. Progenitor outgrowth morphology. Portion of tracheal metamere Tr4 in btl-RFP-moe/ crumbs::GFP early third-instar (L3) (A) and wandering third instar (W3L) (B) larvae stained for activated tracheal progenitors (anti-RFP, red) and apical tracheal surface and lumen (anti-GFP, green). In early L3 larvae (A), the SB contains a lumen and forms a junction with the larval transverse connective (TC) at the niche exit (NE) site. In wandering L3 larvae (B), the outgrowing progenitors have formed a monolayer-epithelial sac extending from the SB niche (arrowhead). The lumen of the expanding progenitor sac is continuous with the SB lumen and larval TC at the NE. Inset (B’) shows an optical z-section of the boxed region. Note Crumbs::GFP and RFP-moesin co-localization on apical progenitor cell surfaces. (C) Close-up of migrating progenitors in Fig. 1D. Progenitors migrate on the basal surface of larval tracheal cells; cytoplasmic extensions emanate from the leading progenitors (arrowheads), indicating active migration. Bars, 50 µm (A, B) and 5 µm (C).

DT
0hr APF
DT
TC
SB
TC
SB VBNE
6hr APF
A
Crumbs::GFP PrunedProgenitors
NE
Stalk cellsD
Lumen
PrunedCrumbs::GFPProgenitors Merge
Pruned
Merge
Terminal cells
C
3hr APF
B
DT
NE
TC
SB
DB
DB
Figure S4. Migrating progenitors initiate the tracheal morphogenesis program. (A) Portion of tracheal metamere Tr5 in btl-RFP-moe/ crumbs::GFP larva at onset of puparium formation (0 hr APF) stained for Pruned SRF (white), tracheal progenitors (anti-RFP, red), and apical surfaces of tracheae (anti-GFP, green). Note that a subset of progenitors in the outgrowing cluster (bracket) has initiated the terminal cell differentiation program as indicated by expression of Pruned. Dotted line, SB niche; dash, SB niche exit (NE). (B, C) Pupae as above at 3 hr (B) and 6 hr (C) APF. Pruned-expressing progenitors are segregated at the tips of the outgrowing PAT (arrowheads), while Pruned-negative cells form the PAT stalk (arrows). (D) Close-up of PAT stalk and terminal cells of the pupa in C also stained for DAPI to show nuclei. Note terminal cells have elongated morphology and have formed intracellular lumens (tracheoles) (outlined by RFP-moesin and Crumbs::GFP) whereas progenitors in the stalk do not express Pruned, do not form tracheoles, and have apical Crumbs::GFP localization. Bars, 50 µm (A), 100 µm (B, C), 25 µm (D).
Moesin::RFP
Crumbs::GFP
DAPI

Progenitormigration
DN-btl
Normal Partial
BA None
* * * *Normal
NE
DT**
* *Partial
* *Minimal
* *
Minimal None
ProgenitorsTracheal
lumen
Tr4 Tr5
Air-filled trachea
Tr4 Tr5 Tr4 Tr5 Tr4 Tr5
C D
E F G HPAT
formation
Control
PAT
I
DN-btlControl
Tr5Tr40
100
200
300
400
# of
pro
geni
tors
n=3
3
3
3Progenitor
proliferation
Figure S5. Effect of dominant negative Breathless on progenitor migration, proliferation, and PAT formation. Dominant-negative breathless (DN-btl) was expressed in SB tracheal progenitors and their progeny, and the animals were analyzed 6 hr APF at 18ºC for effects on Tr4 and Tr5 progenitor migration (A-D) as described in Fig. 2A, or for effects on progenitor proliferation by counting the number of progenitors (I), or animals were reared for an additional 1 to 2 days to allow PAT formation (E-H). (A-D) Examples of progenitor migration phenotypes. (A) Normal (Class 0), migration similar to that in control pupae. (B) Partial (Class I), reduced migration along DT. (C) Minimal (Class II), no migration along DT. (D) None (Class III), progenitors do not exit SB niche. Progenitors, green (GFP fluorescence); larval tracheal branches, red (rhodamine-conjugated WGA and rhodamine-conjugated chitin-binding protein); dash, niche exit (NE); *, larval tracheal fusion cells and sporadic larval tracheal cells that also express the progenitor lineage label. (E-H) Examples of PAT formation phenotypes. (E) Normal, extensive PAT formation similar to that in controls. (F) Partial, reduced PAT ramification and extension into posterior. (G) Minimal, limited PAT formation and extension with thin branches at PAT base. (H) None, no PAT formation. White, mature air-filled pupal tracheae; dashed ovals, extent of PAT formation. Similar though less severe progenitor migration and PAT formation phenotypes were observed with expression of a btl RNAi transgene. (I) Quantification of cell number in Tr4 and Tr5 SB niches. The 10 SB progenitors (fig. S1A) proliferate extensively in both control and DN-btl-expressing pupae, but note there are fewer cells in the DN-btl pupae, in which progenitors do not leave the niche. Bars, 50 µm (A-D), 100 µm (E-H).
* *

Wandering L3
Late L3
Early L3
1.5
hr A
PF
4.5
hr A
PF
7.5
hr A
PF
9 hr
AP
F13
.5 h
r A
PF
bnl reporter expressionA
Tr4 56 7 8
9
5 6 78
9
Tr4
Tr45
67 8
9
Tr45
Tr4 5 6 78 9
Tr4 5
NE
Tr4 5
Tr4 5 6 7 8 9
Progenitorsbnl reporter
s1
s1
s2
s2
s3
s3
B’
B’’
B 4.5hr APF
DT
s1s2s3
*Tr5
7 8 9
9hr APF
C
*Tr5
7 8 9
Figure S6. Expression of branchless (bnl) just ahead of migrating tracheal progenitors. (A) bnl-Gal4 NP2211/ UAS-GFP; btl-RFP-moe animals of the indicated ages showing bnl reporter expression (GFP immunostain, white) as in Fig. 3A but co-stained to show relationship to migrating progenitors (RFP immunostain, red). Isolated larval cells initiate bnl reporter expression (arrowheads) ahead of migrating progenitors. Note reporter expression in TC cells ventral to the niche exit that is ignored by migrating progenitors, and absence of reporter expression in the Tr5 DT, along which Tr4 progenitors migrate to meet Tr5 progenitors. Dashes, niche exit (NE). (B) Close up of Tr6 in pupa 4.5 hr APF. Optical sections through dorsal trunk (DT) at planes indicated (s1, s2, s3) are shown in B' and B'' (bnl reporter expression, white; migrating progenitors, red). Although bnl reporter expression initially appears in individual DT cells (section s1), it expands to cover the entire circumference of the DT (section s3). However, progenitors do not completely envelop the entire circumference (section s3). (C) A 9 hr APF pupa, stained as above, with sporadic break that has separated DT into anterior and posterior regions. Note that progenitors (red, arrow) have not migrated beyond the lesion (*) but bnl reporter expression has expanded beyond lesion into posterior metameres (arrowhead) just as in animals with intact DT (panel A). Bars, 100 µm (A,C), 50 µm (B).

ppk4>GFP; bnl RNAippk4>GFP
B Normal Partial Minimal
Progenitors
GFP (bnl RNAi)
DAPIPartial Minimal NoneNormal
DT
Tr4 Tr5
Air-filledtrachea
Tr4 Tr5 Tr6
bnl RNAi DAPI
Tr7
NENE
DBDB
DT
None
Tr5 Tr4 Tr5 Tr4 Tr5
Progenitors
prd>bnl RNAi patch
A
PATformation
Progenitormigration
NE
PATTr4
s1 s2 s3 s4
Control Tracheal bnl RNAiProgenitors 0:00
3:00
5:55
*
0:00
0:00
5:56
0:00
2:56
5:56
Tr4 5 6 7 Tr4 5 6 7
Merge
bnl RNAi
Merge
Progenitorsbnl RNAi patch
**
Tr4 5 6 7
C D
ETr4 5 6 7
s1s2
s3 s4
0:00
3:05
5:55
Figure S7. Progenitor migration and PAT formation phenotypes from branchless (bnl) knockdown along migration route. (A) Progenitor migration in a control (ppk4-Gal4/ UAS-GFP; btl-RFP-moe) and ppk4-Gal4/ UAS-GFP; btl-RFP-moe/ UAS-bnl RNAi pupa in which bnl RNAi was expressed in all larval tracheal cells. The effect on progenitor migration 3 hr APF was analyzed as described in Fig. 2A after staining for progenitors (anti-RFP, red), larval tracheal cells in which bnl is knocked down by RNAi (anti-GFP, green), and nuclei (DAPI, blue). Examples of migration phenotypes are indicated, classified as in fig. S5A-D. Dotted line, SB niche; dash, niche exit (NE); arrowheads, extent of progenitor migration. (B) Pupae as in A reared for another 1 to 2 days to allow PAT formation. Air-filled trachea, visualized by reflected light (white). Dashed circles, extent of PAT formation. Examples of PAT formation phenotypes are indicated, classified as in fig. S5E-H. (C) Frames from live imaging (see also Movie S2) at the indicated times APF of control and tracheal bnl RNAi knockdown pupae as in A. Progenitors (white, btl-RFP-moe) migrate along larval DT in control pupa, but they never leave the SB niche (dash) in the tracheal bnl knockdown pupa. Arrowheads, progenitor migration front; *, progenitor migration extends beyond field of view. (D) Frames from live imaging (see Movie S4) at the indicated times APF of a dfr-FLP/ act5c>Y>Gal4, UAS-GFP; btl-RFP-moe/ UAS-bnl RNAi pupa in which bnl expression was knocked down in a DT patch along the Tr5 DT (bracket). Tr4 progenitors are stalled next to the large patch, whereas Tr5 progenitors are not stalled by the smaller patches of bnl RNAi expression in the Tr6 DT. (E) Confocal fluorescent micrograph of a UAS-FLP/ act5c>Y>Gal4, UAS-GFP; prd-Gal4, btl-RFP-moe/ UAS-bnl RNAi pupa fixed following 6 hours of live-imaging (see Fig. 3D and Movie S3) and then stained for tracheal progenitors (anti-RFP, red), cells expressing bnl RNAi (anti-GFP, green), and nuclei (DAPI, blue). Optical sections at the planes indicated (s1 - s4) are shown. Progenitors stalled next to the short segment of DT, approximately 2 to 3 larval cells wide, in which paired FLP-out drives a patch of expression (bracket) of UAS-bnl RNAi and UAS-GFP. Optical sections show that bnl RNAi expressing cells encompass full circumference of DT. Bars, 50 µm (A and E), 100 µm (B-D).

Progenitors Ectopic Bnl Tracheal lumen
B
DT
TC
C
DT
TC
ADT
TC
NE
Too far Competition Within progenitor cluster
D
NE
Tr3 control clones Inappropriate Tr3 niche exit
TC
DTDT
TC
E Tr5 control clones Inappropriate DB exitF G
DTDT
DB DB
Figure S8. Examples of branchless-expressing clones that did not induce ectopic migration of PAT progenitors and clones that induced migration of progenitors that do not normally migrate. GFP-labeled clones of bnl-expressing cells (green) were induced and analyzed in wandering third-instar larvae as in Figure 4. Dash, niche exit (NE); DT, dorsal trunk; TC, transverse connective; DB, dorsal branch; arrowheads, progenitor migration front. (A) A clone (arrow) far from the Tr4 migrating progenitors (red) that did not induce ectopic progenitor migration. (B) A pair of clones (arrow and arrowhead) in which Tr5 progenitors have migrated toward only one of the clones (arrowhead). (C) A clone in the Tr5 progenitor cell cluster. Migration is disrupted and progenitors remain near the SB niche. (D) Control clones in Tr3. Tr3 progenitors normally remain within the SB niche during PAT outgrowth and are unaffected by control clones expressing only GFP. (E) A bnl-expressing clone that has recruited Tr3 progenitors out of the niche to DT. Note that the Tr3 progenitors have reached the DT clone even though there is no endogenous (or ectopic) bnl expression in the TC, perhaps because the Tr3 TC is shorter than those in other metameres. (F) Control clone near Tr5 DB. Progenitors in anterior DBs (Tr2 to Tr5) derived from de-differentiated larval cells express btl-RFP-moe (fig. S2A) and proliferate but normally remain in the DB niche (see also fig. S2A’ and fig. S4B, C). (G) Tr5 DB progenitors (arrowhead) are sometimes recruited onto the DT by clones expressing ectopic bnl. Arrow, Tr5 SB progenitors also recruited by the clone. Dash, DB boundary at DB/DT junction. Bars, 100 µm (A-C), 50 µm (D-G).

Apoptotic tracheal cells
DAPIanti-cleaved Caspase-3
Figure S9. Decaying tracheal branches do not express cleaved Caspase-3. (A, B) Fluorescent micrographs of ppk4>GFP; btl-RFP-moe 15 hr APF pupae immunostained for cleaved Caspase-3 (white), a marker of apoptosis, and for GFP (green) to show tracheal cells. Nuclei are stained with DAPI (blue). Larval tracheal cells in posterior metameres (Tr6 to Tr10) are lost during metamorphosis (10) but are not stained by the cleaved Caspase-3 immunostain, suggesting that they die later in metamorphosis or by other mechanisms. Thin or spotty staining (open arrowheads) is antibody trapped in collapsed posterior tracheal branches (Fig. 1). (C) Fluorescent micrograph of a ppk4-Gal4, UAS-GFP/ UAS-rpr; tub-Gal80ts/ + wandering third-instar larva stained as in A and B as a control to show cleaved Caspase-3 expression in apoptotic tracheal cells. Note cleaved Caspase-3 immunostaining (white) in tracheal cells activating expression of the apoptosis inducer reaper (rpr) and marked by GFP (green; arrowheads). Animals were raised at the permissive temperature (18o C) of the GAL80ts repressor to prevent early ectopic rpr expression and allow embryonic tracheal formation, and then transferred to the non-permissive temperature (30o C) to activate rpr-induced apoptosis. Bars, 50 µm.
Tr4 5 6-10
A CB
DT
DB
TC
Control (rpr induced apoptosis)Trachea after branch collapse (15 hr APF)
Tracheal cellsanti-cleaved Caspase-3
Tr6 7Tr7
DAPIanti-cleaved Caspase-3
Tracheal cells
8

Brig
htfie
ld DT
TC
LT *
Clo
ne m
arke
r
Larva with bnl-expressing clonesControl larva
DT
TC
LT
Figure S10. Effect on the larval tracheal system of tracheal clones expressing branchless FGF. Brightfield (upper) and fluorescence (lower) images of a control Cyo/ act5c>Y>Gal4, UAS-GFP; btl-RFP-moe/ UAS-bnl wandering third instar larva and a dfr-FLP/ act5c>Y>Gal4, UAS-GFP; btl-RFP-moe/ UAS-bnl larva in which the GFP-marked clones express ectopic bnl. Note tracheal patterning in the larva with bnl-expressing clones was not globally perturbed, although there are local defects including a sporadic gap (*) in the lateral trunk (LT) and scattered foci of densely-packed tracheoles (arrowhead). DT, dorsal trunk; TC, transverse connective. Bars, 100 µm.

1241442s1.mov
Movie S1. Tracheal progenitors migrating along the larval dorsal trunk. Fluorescence imaging of a live btl-RFP-moe white pupa beginning just after puparium
formation (0 hr APF) in which migrating PAT progenitors originating from tracheal
metameres Tr4 and Tr5 and expressing RFP-moesin (white; arrowheads) were visualized
through the cuticle. Images were acquired every three minutes for seven hours at 25°C.
DT, dorsal trunk; TC, transverse connective; dash, SB niche exit. Progenitors move
toward the posterior at ~1.7 µm/min, maintaining a close association with the DT and
crawling and wrapping around it as they migrate. Tr4 progenitors move onto DT about
one hour later than Tr5 progenitors. Note multiple tips of migrating progenitors, each
taking slightly different paths along DT into posterior. Bar, 100 µm.
1241442s2.mov
Movie S2. Effect of branchless knockdown on progenitors exiting SB niche.
Fluorescence imaging of a live ppk4-Gal4/ UAS-GFP; btl-RFP-moe/ UAS-bnl RNAi pupa
in which bnl was knocked down by RNAi in larval tracheal cells (marked by GFP,
pseudo-colored green in merged images). Tracheal progenitors marked by RFP
fluorescence and pseudo-colored red in merged images (arrowheads) do not move
beyond niche exit (dash). DT, dorsal trunk; TC, transverse connective. Images were
acquired every five minutes from 0 hr to 6 hr APF at 25°C. Bar, 100 µm.
1241442s3.mov
Movie S3. Effect of branchless knockdown in patch along Tr5 progenitor migration
route. Live imaging of an act5c>Y>Gal4, UAS-GFP/ UAS-FLP; prd-Gal4, btl-RFP-
moe/ UAS-bnl RNAi pupa in which bnl expression was inactivated in portion of Tr6 DT
(bracket) by expression of bnl RNAi mediated by paired-Gal4. Tr5 tracheal progenitors
move onto DT but stall when they reach DT patch where bnl RNAi is expressed;
meanwhile, Tr4 progenitors progress posteriorly. DT, dorsal trunk; TC, transverse
connective; dash, SB niche exit; arrowhead, progenitors. Images were acquired every
five minutes from 0 hr to 6 hr APF at 25°C. Bar, 100 µm.
1241442s4.mov
Movie S4. Effect of branchless knockdown in patch along Tr4 progenitor migration
route. Live imaging of a dfr-flp / act5c>Y>Gal4, UAS-GFP; btl-RFP-moe/ UAS-bnl
RNAi pupa in which bnl expression was inactivated in a portion of Tr5 DT (bracket) by
expression of bnl RNAi. Tr4 tracheal progenitors stall next to DT patch where bnl RNAi
is expressed. DT, dorsal trunk; TC, transverse connective; dash, SB niche exit; arrowhead,
progenitors. Images were acquired every five minutes from 0 hr to 6 hr APF at 25°C.
Bar, 100 µm.

References and Notes
1. N. Barker, S. Bartfeld, H. Clevers, Tissue-resident adult stem cell populations of rapidly self-
renewing organs. Cell Stem Cell 7, 656–670 (2010). Medline
doi:10.1016/j.stem.2010.11.016
2. G. B. Adams, D. T. Scadden, The hematopoietic stem cell in its place. Nat. Immunol. 7, 333–
337 (2006). Medline doi:10.1038/ni1331
3. A. Alvarez-Buylla, D. A. Lim, For the long run: Maintaining germinal niches in the adult
brain. Neuron 41, 683–686 (2004). Medline doi:10.1016/S0896-6273(04)00111-4
4. C. Blanpain, E. Fuchs, Epidermal homeostasis: A balancing act of stem cells in the skin. Nat.
Rev. Mol. Cell Biol. 10, 207–217 (2009). Medline doi:10.1038/nrm2636
5. E. Sancho, E. Batlle, H. Clevers, Live and let die in the intestinal epithelium. Curr. Opin. Cell
Biol. 15, 763–770 (2003). Medline doi:10.1016/j.ceb.2003.10.012
6. G. L. Ming, H. Song, Adult neurogenesis in the mammalian brain: Significant answers and
significant questions. Neuron 70, 687–702 (2011). Medline
doi:10.1016/j.neuron.2011.05.001
7. E. Nacu, E. M. Tanaka, Limb regeneration: A new development? Annu. Rev. Cell Dev. Biol.
27, 409–440 (2011). Medline doi:10.1146/annurev-cellbio-092910-154115
8. K. D. Poss, Advances in understanding tissue regenerative capacity and mechanisms in
animals. Nat. Rev. Genet. 11, 710–722 (2010). Medline doi:10.1038/nrg2879
9. T. Matsuno, Morphogenesis of pupal abdominal tracheae in a fruit fly, Drosophila
melanogaster. Jap. J. Appl. Entomol. Zool. 34, 165–167 (1990). doi:10.1303/jjaez.34.165
10. G. Manning, M. A. Krasnow, in The Development of Drosophila melanogaster, M. Bate, A.
Martinez-Arias, Eds. (Cold Spring Harbor Laboratory Press, Woodbury, NY, 1993), vol.
1, pp. 609–685.
11. M. Weaver, M. A. Krasnow, Dual origin of tissue-specific progenitor cells in Drosophila
tracheal remodeling. Science 321, 1496–1499 (2008). doi:10.1126/science.1158712
12. A. Guha, L. Lin, T. B. Kornberg, Organ renewal and cell divisions by differentiated cells in
Drosophila. Proc. Natl. Acad. Sci. U.S.A. 105, 10832–10836 (2008). Medline
doi:10.1073/pnas.0805111105
13. C. Pitsouli, N. Perrimon, Embryonic multipotent progenitors remodel the Drosophila airways
during metamorphosis. Development 137, 3615–3624 (2010). Medline
doi:10.1242/dev.056408
14. M. Sato, Y. Kitada, T. Tabata, Larval cells become imaginal cells under the control of
homothorax prior to metamorphosis in the Drosophila tracheal system. Dev. Biol. 318,
247–257 (2008). Medline doi:10.1016/j.ydbio.2008.03.025
15. C. Ribeiro, M. Neumann, M. Affolter, Genetic control of cell intercalation during tracheal
morphogenesis in Drosophila. Curr. Biol. 14, 2197–2207 (2004). Medline
doi:10.1016/j.cub.2004.11.056

16. L. Liu, W. A. Johnson, M. J. Welsh, Drosophila DEG/ENaC pickpocket genes are expressed
in the tracheal system, where they may be involved in liquid clearance. Proc. Natl. Acad.
Sci. U.S.A. 100, 2128–2133 (2003). Medline doi:10.1073/pnas.252785099
17. K. Guillemin, J. Groppe, K. Ducker, R. Treisman, E. Hafen, M. Affolter, M. A. Krasnow,
The pruned gene encodes the Drosophila serum response factor and regulates
cytoplasmic outgrowth during terminal branching of the tracheal system. Development
122, 1353–1362 (1996). Medline
18. C. Klämbt, L. Glazer, B. Z. Shilo, Breathless, a Drosophila FGF receptor homolog, is
essential for migration of tracheal and specific midline glial cells. Genes Dev. 6, 1668–
1678 (1992). Medline doi:10.1101/gad.6.9.1668
19. M. Reichman-Fried, B. Z. Shilo, Breathless, a Drosophila FGF receptor homolog, is required
for the onset of tracheal cell migration and tracheole formation. Mech. Dev. 52, 265–273
(1995). Medline doi:10.1016/0925-4773(95)00407-R
20. D. Sutherland, C. Samakovlis, M. A. Krasnow, branchless encodes a Drosophila FGF
homolog that controls tracheal cell migration and the pattern of branching. Cell 87, 1091–
1101 (1996). Medline doi:10.1016/S0092-8674(00)81803-6
21. J. Jarecki, E. Johnson, M. A. Krasnow, Oxygen regulation of airway branching in Drosophila
is mediated by branchless FGF. Cell 99, 211–220 (1999). Medline doi:10.1016/S0092-
8674(00)81652-9
22. M. Sato, T. B. Kornberg, FGF is an essential mitogen and chemoattractant for the air sacs of
the Drosophila tracheal system. Dev. Cell 3, 195–207 (2002). Medline
doi:10.1016/S1534-5807(02)00202-2
23. Materials and methods are available as supporting material on Science Online.
24. S. Hayashi, K. Ito, Y. Sado, M. Taniguchi, A. Akimoto, H. Takeuchi, T. Aigaki, F.
Matsuzaki, H. Nakagoshi, T. Tanimura, R. Ueda, T. Uemura, M. Yoshihara, S. Goto,
GETDB, a database compiling expression patterns and molecular locations of a collection
of Gal4 enhancer traps. Genesis 34, 58–61 (2002). Medline doi:10.1002/gene.10137
25. M. Buszczak, S. Paterno, D. Lighthouse, J. Bachman, J. Planck, S. Owen, A. D. Skora, T. G.
Nystul, B. Ohlstein, A. Allen, J. E. Wilhelm, T. D. Murphy, R. W. Levis, E. Matunis, N.
Srivali, R. A. Hoskins, A. C. Spradling, The Carnegie protein trap library: A versatile
tool for Drosophila developmental studies. Genetics 175, 1505–1531 (2007). Medline
doi:10.1534/genetics.106.065961
26. A. H. Brand, N. Perrimon, Targeted gene expression as a means of altering cell fates and
generating dominant phenotypes. Development 118, 401–415 (1993). Medline
27. P. Steneberg, C. Englund, J. Kronhamn, T. A. Weaver, C. Samakovlis, Translational
readthrough in the hdc mRNA generates a novel branching inhibitor in the Drosophila
trachea. Genes Dev. 12, 956–967 (1998). Medline doi:10.1101/gad.12.7.956
28. G. J. Beitel, M. A. Krasnow, Genetic control of epithelial tube size in the Drosophila tracheal
system. Development 127, 3271–3282 (2000). Medline

29. S. J. Marygold, P. C. Leyland, R. L. Seal, J. L. Goodman, J. Thurmond, V. B. Strelets, R. J.
Wilson; FlyBase consortium, FlyBase: Improvements to the bibliography. Nucleic Acids
Res. 41, D751–D757 (2013). Medline doi:10.1093/nar/gks1024
30. G. Dietzl, D. Chen, F. Schnorrer, K. C. Su, Y. Barinova, M. Fellner, B. Gasser, K. Kinsey, S.
Oppel, S. Scheiblauer, A. Couto, V. Marra, K. Keleman, B. J. Dickson, A genome-wide
transgenic RNAi library for conditional gene inactivation in Drosophila. Nature 448,
151–156 (2007). Medline doi:10.1038/nature05954
31. D. Sutherland, thesis, Stanford University (1999).
32. K. G. Golic, S. Lindquist, The FLP recombinase of yeast catalyzes site-specific
recombination in the Drosophila genome. Cell 59, 499–509 (1989). Medline
doi:10.1016/0092-8674(89)90033-0
33. K. Certel, M. G. Anderson, R. J. Shrigley, W. A. Johnson, Distinct variant DNA-binding
sites determine cell-specific autoregulated expression of the Drosophila POU domain
transcription factor drifter in midline glia or trachea. Mol. Cell. Biol. 16, 1813–1823
(1996). Medline
34. K. Ito, W. Awano, K. Suzuki, Y. Hiromi, D. Yamamoto, The Drosophila mushroom body is
a quadruple structure of clonal units each of which contains a virtually identical set of
neurones and glial cells. Development 124, 761–771 (1997). Medline
35. J. Huang, W. Zhou, W. Dong, A. M. Watson, Y. Hong, Directed, efficient, and versatile
modifications of the Drosophila genome by genomic engineering. Proc. Natl. Acad. Sci.
U.S.A. 106, 8284–8289 (2009). Medline doi:10.1073/pnas.0900641106
36. M. G. Anderson, G. L. Perkins, P. Chittick, R. J. Shrigley, W. A. Johnson, drifter, a
Drosophila POU-domain transcription factor, is required for correct differentiation and
migration of tracheal cells and midline glia. Genes Dev. 9, 123–137 (1995). Medline
doi:10.1101/gad.9.1.123
37. M. Ashburner, K. G. Golic, R. S. Hawley, Drosophila: A Laboratory Handbook (Cold
Spring Harbor Laboratory Press, Cold Spring Harbor, NY, ed. 2, 2005).
38. B. P. Levi, A. S. Ghabrial, M. A. Krasnow, Drosophila talin and integrin genes are required
for maintenance of tracheal terminal branches and luminal organization. Development
133, 2383–2393 (2006). Medline doi:10.1242/dev.02404
39. N. Hacohen, S. Kramer, D. Sutherland, Y. Hiromi, M. A. Krasnow, sprouty encodes a novel
antagonist of FGF signaling that patterns apical branching of the Drosophila airways.
Cell 92, 253–263 (1998). Medline doi:10.1016/S0092-8674(00)80919-8