reporting user’s guide - a.c.e. diagnostic test · student’s test and composite scores, an apr...
TRANSCRIPT

ReportingUser’s Guide
Version 10

TrademarksAdobe®, the Adobe logo, Adobe® PDF, Acrobat®, and Reader® are either registered trademarks or trademarks of Adobe Systems Incorporated in the United States and/or other countries.
MetaMetrics®, the MetaMetrics logo and tagline, Lexile®, Lexile Framework®, Lexile Analyzer®, the Lexile logo, Quantile®, Quantile Framework® and the Quantile logo are trademarks of MetaMetrics, Inc., and are registered in the United States and abroad.
Microsoft®, Excel®, Word®, and Windows® are registered trademarks of Microsoft Corporation in the United States and/or other countries.
SAT® is a registered trademark of the College Board, which was not involved in the production of, and does not endorse, this product.
ACT® is a trademark of ACT, Inc, and is registered in the United States and abroad. ACT, Inc. was not involved in the production of, and does not endorse, this product.
Copyright © 2012 by The Riverside Publishing Company. All rights reserved. No part of this work may be reproduced or transmitted in any form or by any means, electronic or mechanical, including photocopying and recording, or by any information storage or retrieval system without the prior written permission of Riverside unless such copying is expressly permitted by federal copyright law. Address inquiries to Permissions, Riverside, 3800 Golf Rd., Suite 200, Rolling Meadows, IL 60008.
v10.0 Contents i
Contents
Part 1 Overview .......................................................................... 1
About DataManager Reporting ............................................................................. 1
Part 2 Creating Reports .............................................................. 3
About Reports ....................................................................................................... 3 Data Export ........................................................................................................ 4 Student Roster .................................................................................................... 5 Multimeasure Student Roster ............................................................................. 6 Student Profile ................................................................................................... 7 Group Roster ...................................................................................................... 8 Subgroup Roster ................................................................................................. 9 Group Profile .................................................................................................... 10 Scoring Service Print Style ................................................................................ 11
Creating CogAT Reports ...................................................................................... 14 Loading and Managing Saved Criteria ................................................................ 25
Part 3 Viewing and Working with Reports .............................. 27
Viewing and Editing Reports ............................................................................... 27 Navigate or Print a Report ............................................................................... 27 View Descriptions ............................................................................................. 28 Link to a Related Report .................................................................................. 28 Edit the Report Selection Criteria ..................................................................... 29
Sorting and Searching Reports ............................................................................ 29 Sort a Report .................................................................................................... 29 Search a Report by Last Name .......................................................................... 30
Exporting and Printing Reports ........................................................................... 31 Export a Report to Excel ................................................................................... 31 Export a Report to PDF or RTF .......................................................................... 32 Export a Data File ............................................................................................. 33 Print a Report ................................................................................................... 34
Using Report Center ............................................................................................ 36
Part 4 Test and Score Descriptions ........................................... 39
Test Descriptions ................................................................................................. 39 Level 5/6 ........................................................................................................... 39 Level 7 .............................................................................................................. 40 Level 8 .............................................................................................................. 41
ii DataManager Reporting User’s Guide for CogAT
Level 9 .............................................................................................................. 42 Levels 10–17/18 ................................................................................................. 43
Score Descriptions ............................................................................................... 44

Overview 1
Part 1 Overview
About DataManager Reporting The Riverside DataManager™ Reporting application is a dynamic, online report creation tool. With the DataManager Reporting application, you can perform the following tasks:
• View reports online.
• Create customized reports using the options available for your account.
• Export reports to PDF, RTF, or Microsoft Excel® format.
• Print reports.
• Export the full assessment results for a test event. (Account Holders and Administrator roles only)
The availability of report options within DataManager Reporting will vary depending on how the account is set up. Users are able to create and view reports only for their own location level and levels below them.
For example:
A district administrator may be able to view all of the following levels:
A building administrator may be able to view only these levels:
A test administrator for a class may be able to view only these levels:
District
Building 1
Class 1
Class 2
Class 3
Building 2
Class 1
Class 2
Class 3
Building 3
Class 1
Class 2
Class 3
Building 1
Class 1
Class 2
Class 3
Class 1
Student 1
Student 2
Student 3

2 DataManager Reporting User’s Guide for CogAT

Creating Reports 3
Part 2 Creating Reports
About Reports Riverside DataManager Reporting provides you with a list of reports that have been set up specifically for your account. These reports are set up with default report options, which can be modified to customize the report to address your needs.
Note: The Add DataManager Reporting Key link in the Navigate menu is used to enter access codes, which allow users to view reports for a specific group of students. Web reporting keys must be distributed by users with the Account Holder or Administrator role in order for users to create and view reports. For more information, see the Managing Web Reporting Keys document available on the DataManager Digital Resources page.
For more information regarding the CogAT® report formats available, see the descriptions provided on the following pages.

4 DataManager Reporting User’s Guide for CogAT
Data Export
Data Export files are available to users with Account Holder or Administrator roles. These files contain the testing data for a test event and can be exported as .txt files in the following formats: ASCII Fixed-Width, ASCII Tab-Delimited, ASCII Comma-Delimited, ASCII Pipe-Delimited. When you create a Data Export file, you can choose to export it using a standard template or a custom template. The custom template allows you to select fields to include, specify the order of the fields, and rename the fields. Data Export files are available to be exported on the report page as shown below.
A link to the DataManager Digital Resources page appears in the upper right corner of the report page. On the DataManager page, Riverside’s standard and custom file format templates are available for you to download. The standard file template, which is shown below, details how information is organized in the Data Export file.
The custom file, which is shown below, lists all the fields that are available for selection.

Creating Reports 5
Student Roster
The Student Roster provides scores by battery and composite for each student in the selected group. The top of each page of the Student Roster provides the report scope and test information, including some or all of the following: assessment, form, test date, norms, grade, level, class, building, district (if applicable), system, region (if applicable), state, and the total number of students tested.
Within the report, the first column of each row contains a student’s name, ID number, secondary student ID (if applicable), birth date, age, program, level, form, administration mode, gender, and administrator code (if applicable). The remaining columns in the row provide the student’s scores for each test and composite.
You can click a student’s name within the report to open the Student Profile for that student.
Note: Student Rosters display a maximum of 25 students per page.
Note: Data in this sample are for illustrative purposes only.

6 DataManager Reporting User’s Guide for CogAT
Multimeasure Student Roster
The Multimeasure Student Roster allows you to create a multiple-column report (up to ten columns) that provides scores by test and composite for multiple test administrations, test types, grades, and levels for each student in the selected group. This report also provides a Performance Band option, which allows you to specify performance indicator labels and values that color code the test results for each student. For example, you could assign green to represent “proficient,” yellow to represent “approaching proficiency,” and red to represent “needs improvement.” A footnote is provided at the bottom of the report identifying the labels and value ranges assigned for each column.
Note: Data in this sample are for illustrative purposes only.
Creating Reports 7
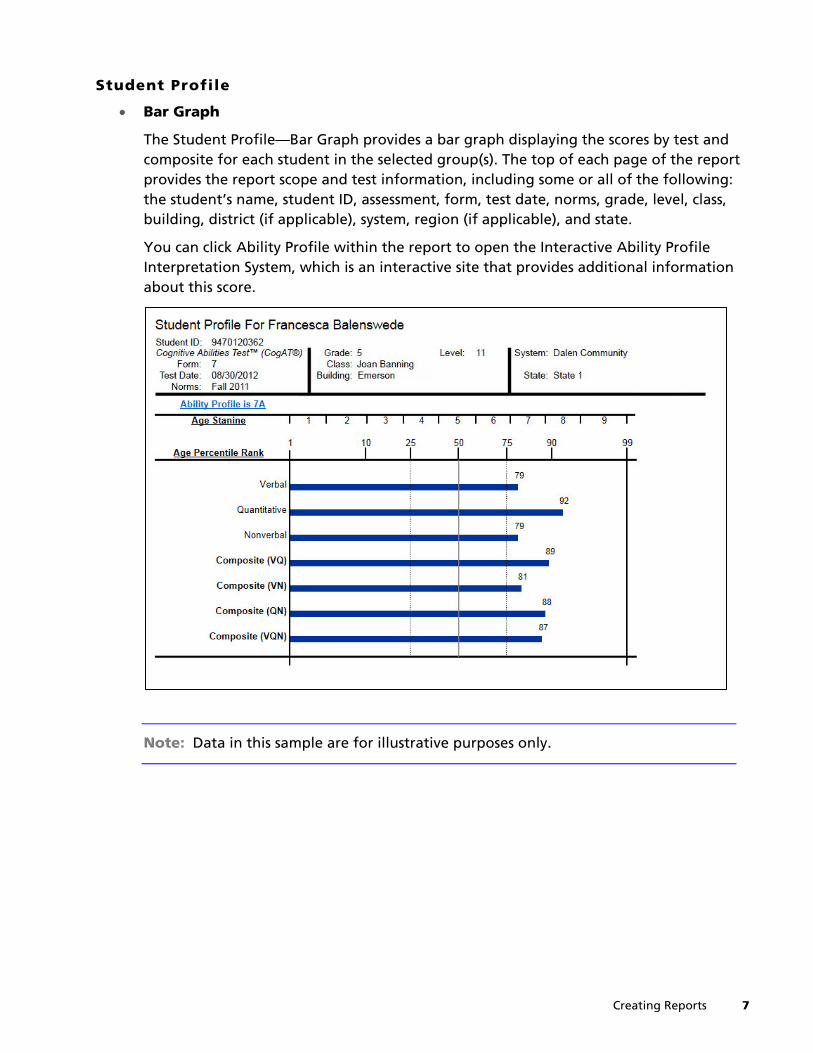
Student Profile
• Bar Graph
The Student Profile—Bar Graph provides a bar graph displaying the scores by test and composite for each student in the selected group(s). The top of each page of the report provides the report scope and test information, including some or all of the following: the student’s name, student ID, assessment, form, test date, norms, grade, level, class, building, district (if applicable), system, region (if applicable), and state.
You can click Ability Profile within the report to open the Interactive Ability Profile Interpretation System, which is an interactive site that provides additional information about this score.
Note: Data in this sample are for illustrative purposes only.

8 DataManager Reporting User’s Guide for CogAT
Group Roster
The Group Roster provides scores by test and composite for each selected group—class, building, district, system, or region. The top of each page of the Group Roster provides the report scope and test information, including some or all of the following: assessment, form, test date, norms, grade, level, class, building, district (if applicable), system, region (if applicable), and state.
Groups are displayed by row. The name of each group is shown in the first column; the remaining columns provide the group’s score(s) for each test and composite. Under each Group Name, the number of students tested in that group is provided. The Group Total, displayed on the bottom row, provides the selected groups’ average scores for each test and composite.
You can click a group’s name to open the Group Profile for that group or click Group Total at the bottom of the report to open a Group Profile that combines all the selected groups. You can click the arrows in a column to sort the report in ascending or descending order by the scores displayed in that column.
Note: Group Rosters display a maximum of 25 groups per page.
Note: Data in this sample are for illustrative purposes only.

Creating Reports 9
Subgroup Roster
The Subgroup Roster provides scores for all subgroups or a selected subgroup—gender, federal race/ethnicity, programs, and/or administrator codes. The scores are provided by test or composite. The top of each page of the Subgroup Roster provides the report scope and test information, including some or all of the following: assessment, form, test date, norms, grade, level, class, building, district, system, region, and state.
Subgroups are displayed by row. The name of each subgroup is shown in the first column; the next column provides the subgroup’s selected score(s) for the test or composite. Under each Subgroup Name, the number of students tested in that subgroup is provided.
You can click a subgroup name to open the Group Profile for that subgroup. You can click the arrows in a column to sort the report in ascending or descending order by the scores displayed in that column.
Note: Data in this sample are for illustrative purposes only.
10 DataManager Reporting User’s Guide for CogAT
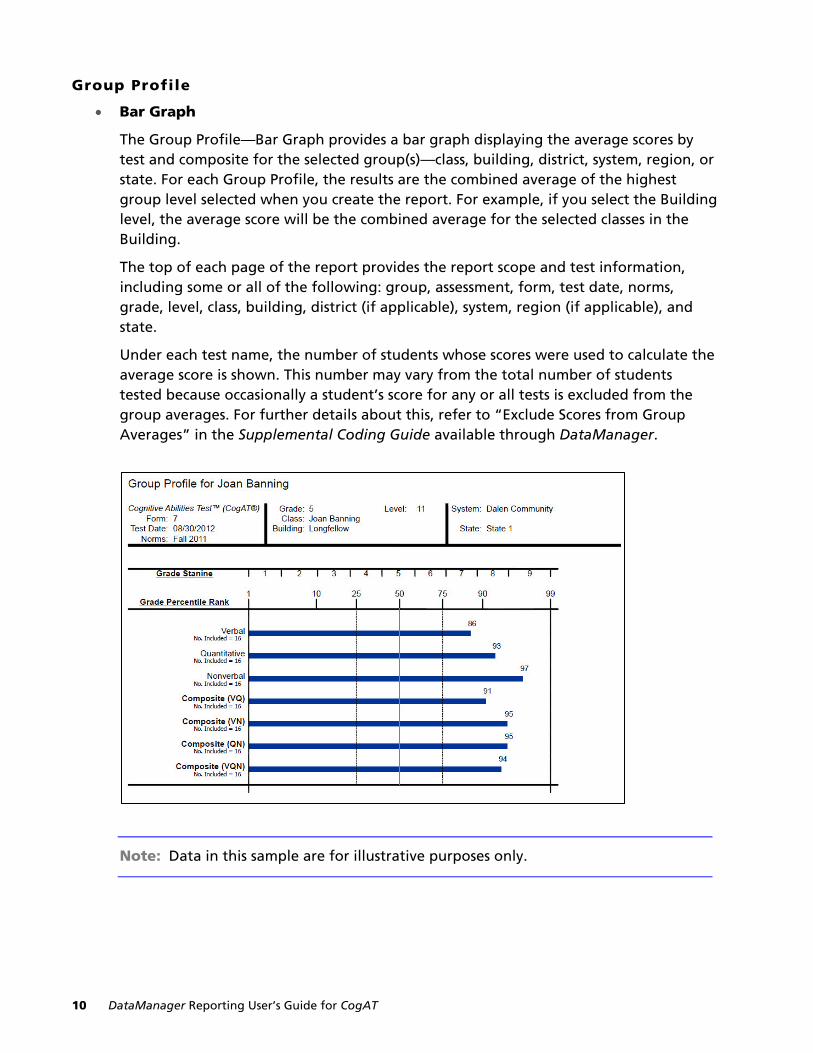
Group Profile
• Bar Graph
The Group Profile—Bar Graph provides a bar graph displaying the average scores bytest and composite for the selected group(s)—class, building, district, system, region, orstate. For each Group Profile, the results are the combined average of the highestgroup level selected when you create the report. For example, if you select the Buildinglevel, the average score will be the combined average for the selected classes in theBuilding.
The top of each page of the report provides the report scope and test information,including some or all of the following: group, assessment, form, test date, norms,grade, level, class, building, district (if applicable), system, region (if applicable), andstate.
Under each test name, the number of students whose scores were used to calculate theaverage score is shown. This number may vary from the total number of studentstested because occasionally a student’s score for any or all tests is excluded from thegroup averages. For further details about this, refer to “Exclude Scores from GroupAverages” in the Supplemental Coding Guide available through DataManager.
Note: Data in this sample are for illustrative purposes only.
Creating Reports 11
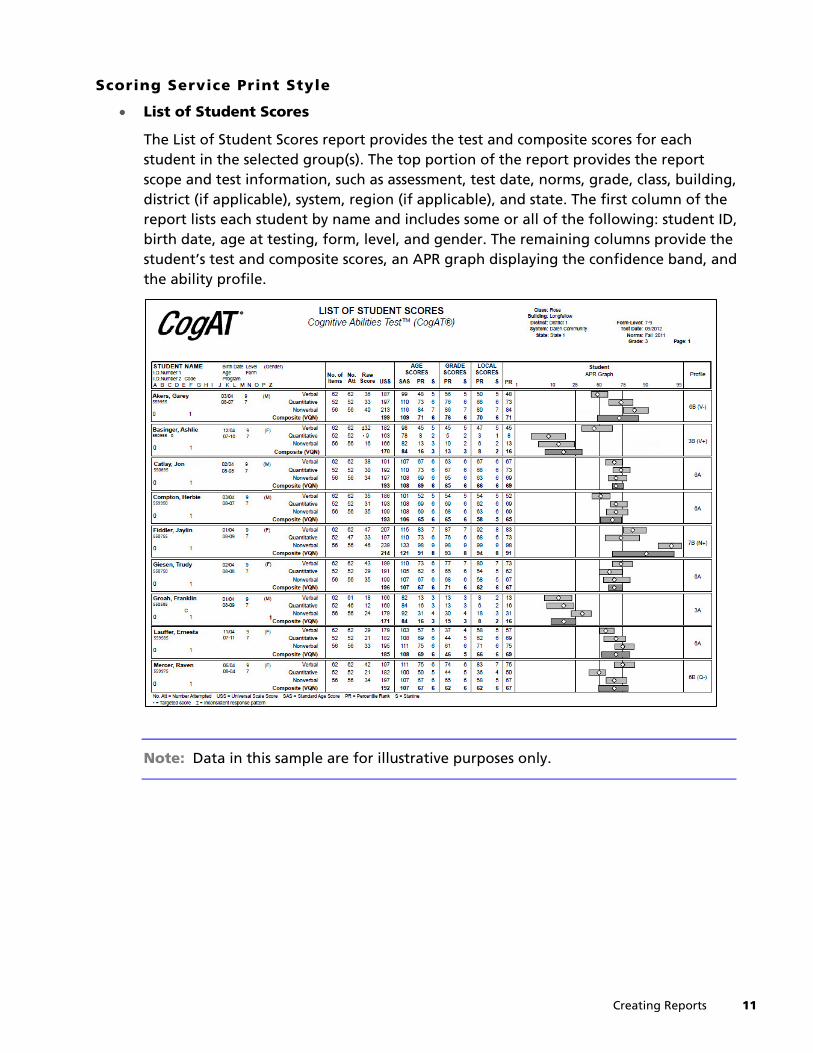
Scoring Service Print Style
• List of Student Scores
The List of Student Scores report provides the test and composite scores for eachstudent in the selected group(s). The top portion of the report provides the reportscope and test information, such as assessment, test date, norms, grade, class, building,district (if applicable), system, region (if applicable), and state. The first column of thereport lists each student by name and includes some or all of the following: student ID,birth date, age at testing, form, level, and gender. The remaining columns provide thestudent’s test and composite scores, an APR graph displaying the confidence band, andthe ability profile.
Note: Data in this sample are for illustrative purposes only.

12 DataManager Reporting User’s Guide for CogAT
• Student Profile Narrative
The Student Profile Narrative report provides a table of each individual student’s scores, a graph of the student’s APR, and a narrative overview of how to interpret and use the scores to assist in the student’s educational development. The top portion of the report provides the student name, class name, report scope, and test information, such as assessment, test date, norms, grade, building, district (if applicable), system, region (if applicable), and state.
Note: Data in this sample are for illustrative purposes only.

Creating Reports 13
• Group Summary
The Group Summary report presents the average scores for a selected group. The topportion of the report provides the group or class name, report scope, and testinformation, such as assessment, test date, norms, grade, building, district (ifapplicable), system, region (if applicable), and state. The first column of the report liststhe number of students in the group and the scores selected to appear on this report.The remaining columns list the average test and composite scores for the group.
Note: Data in this sample are for illustrative purposes only.

14 DataManager Reporting User’s Guide for CogAT
Creating CogAT Reports
Data Package: Platinum or Data Plus Role: Account Holder, Administrator, Teacher, or Digital Resource & Reporting Access
On the Create a Report page, you specify the criteria that will appear in your report and run the report.
To create a CogAT report:
1. Click the Application Switcher button ( ) and select Reports.
Or
Click the Reports button ( ) located on the bottom left corner of the page.
Or On the Find Assessments page, locate the test event for which you want to create a
report and click the reports icon ( ) in the Action column.
The Create a Report page appears. On this page, you specify the types of data you want to appear in the report by selecting report criteria.
Note: The availability of report options on the Create a Report page will vary depending on how your account is set up. You are able to create and view reports only for your own location level and below. As you make selections on this page, the subsequent report options and the selections available within those report options will vary.
If your location level allows you to view reports at multiple locations, you are provided with a list of reporting keys at the top of the Select Report Criteria box. This allows you to select the reporting key associated with a specific location for which you want to create a report.
2. If you have more than one reporting key, select a reporting key in the Select Report Criteria for list.
3. In the Select Report Criteria box, change the default report options for each item to the selections you want to see in your report.
For CogAT reports, the following report options apply:
a. In the Assessment list, select CogAT Assessments.
b. In the Test Administration Date list, select the test date for your report. The test date includes the test administration name.
c. In the Display Type list, select the type of report you want to see. Descriptions for each Display Type are provided on the following page.
Creating Reports 15
Data Export – provides a file in a standard or custom template containing thetesting data that can be exported in various formats (available to users withAccount Holder and Administrator roles only)
Student Roster – provides scores by test and composite for each student in theselected group
Multimeasure Student Roster – allows you to create a multiple-columnreport (up to ten columns) that provides scores by test and composite formultiple test administrations, test types, grades, and levels for each student inthe selected group. This report also provides a Performance Band option,which allows you to specify performance indicator labels and values that colorcode the test results for each student.
List of Student Scores (Scoring Service Print Style) – provides a list of eachstudent’s test and composite scores for the selected content areas
Student Profile – provides a bar graph displaying the test and composite scoresfor each student in the selected group(s)
Student Profile Narrative (Scoring Service Print Style) – provides test andcomposite scores for an individual student as well as descriptions to aid ininterpreting and using the scores
Group Roster – provides test and composite scores for each selected group—class, building, district, system, or region
Subgroup Roster – provides test or composite scores for all subgroups or aselected subgroup—gender, federal race/ethnicity, programs, and/oradministrator codes
Group Profile – provides a bar graph displaying the average test or compositescores for the selected group(s)—class, building, district, system, region, or state
Group Summary (Scoring Service Print Style) – provides the average testand composite scores for the selected group
d. Select the grade or level using one of the following options:
In the Grade/Level list, select the grade and test level for your report.
In the Grade list, select any or all grades to include on your report. (This optionis available for Scoring Service Print Style reports only.)
Only those grades and levels that were tested are available for selection.
e. Use the table on the following pages to select the remaining report options.
16 DataManager Reporting User’s Guide for CogAT
CogAT Report Options Option Selections Applies to
Export Template • Standard
• Custom Data Fields (selected below)
Data Export
Export Format • ASCII Fixed-Width (.txt file)
• ASCII Tab-Delimited (.txt file)
• ASCII Comma-Delimited (.txt file)
• ASCII Pipe-Delimited (.txt file)
Data Export
Export Headings
(Option is available if your selection for Export Template is Custom Data Fields.)
• Yes
• No
Note: If your Export Format selection is ASCII Fixed-Width, then this option defaults to No because that format does not allow headings.
Data Export
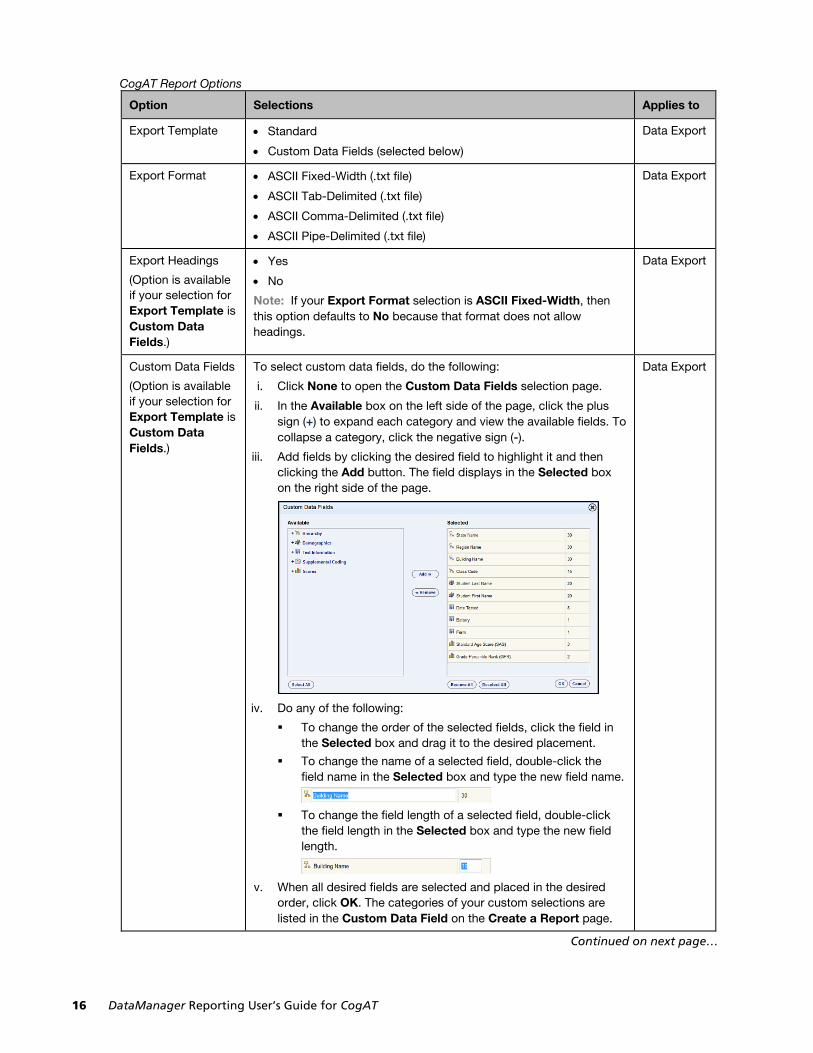
Custom Data Fields
(Option is available if your selection for Export Template is Custom Data Fields.)
To select custom data fields, do the following:
i. Click None to open the Custom Data Fields selection page.
ii. In the Available box on the left side of the page, click the plussign (+) to expand each category and view the available fields. Tocollapse a category, click the negative sign (-).
iii. Add fields by clicking the desired field to highlight it and thenclicking the Add button. The field displays in the Selected boxon the right side of the page.
iv. Do any of the following:
To change the order of the selected fields, click the field inthe Selected box and drag it to the desired placement.
To change the name of a selected field, double-click thefield name in the Selected box and type the new field name.
To change the field length of a selected field, double-clickthe field length in the Selected box and type the new fieldlength.
v. When all desired fields are selected and placed in the desiredorder, click OK. The categories of your custom selections arelisted in the Custom Data Field on the Create a Report page.
Data Export
Continued on next page…
Creating Reports 17
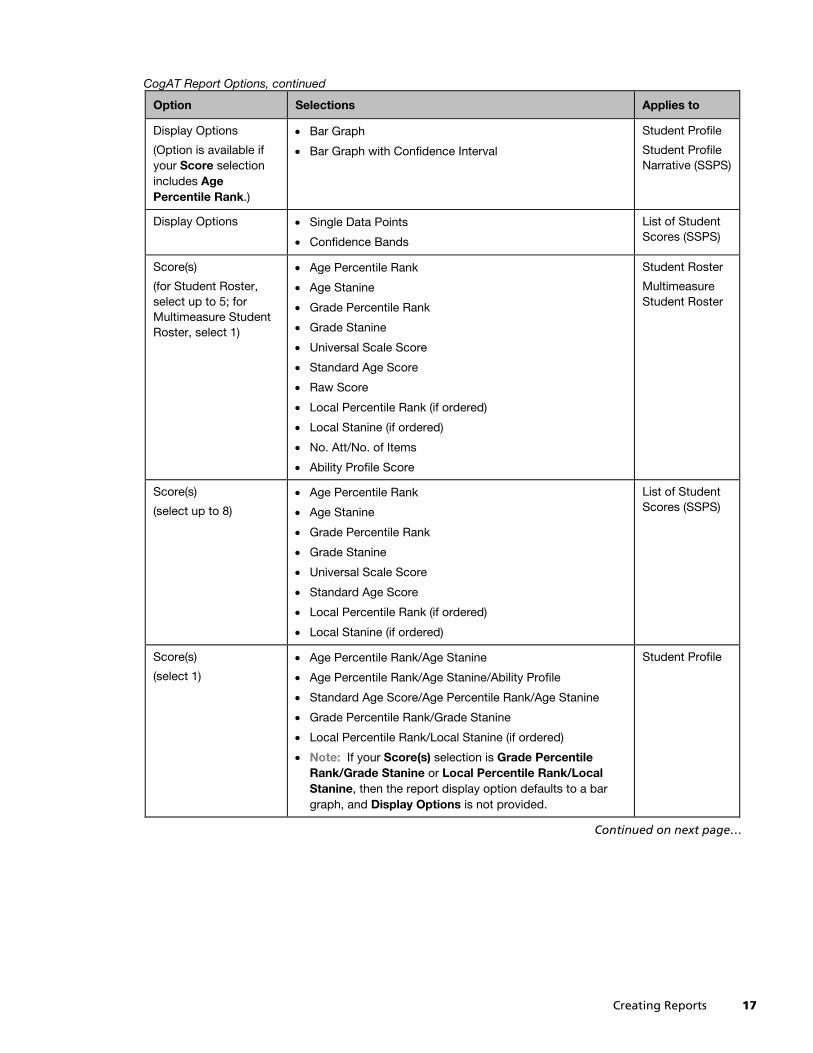
CogAT Report Options, continued Option Selections Applies to
Display Options
(Option is available if your Score selection includes Age Percentile Rank.)
• Bar Graph
• Bar Graph with Confidence Interval
Student Profile
Student Profile Narrative (SSPS)
Display Options • Single Data Points
• Confidence Bands
List of Student Scores (SSPS)
Score(s)
(for Student Roster, select up to 5; for Multimeasure Student Roster, select 1)
• Age Percentile Rank
• Age Stanine
• Grade Percentile Rank
• Grade Stanine
• Universal Scale Score
• Standard Age Score
• Raw Score
• Local Percentile Rank (if ordered)
• Local Stanine (if ordered)
• No. Att/No. of Items
• Ability Profile Score
Student Roster
Multimeasure Student Roster
Score(s)
(select up to 8)
• Age Percentile Rank
• Age Stanine
• Grade Percentile Rank
• Grade Stanine
• Universal Scale Score
• Standard Age Score
• Local Percentile Rank (if ordered)
• Local Stanine (if ordered)
List of Student Scores (SSPS)
Score(s)
(select 1)
• Age Percentile Rank/Age Stanine
• Age Percentile Rank/Age Stanine/Ability Profile
• Standard Age Score/Age Percentile Rank/Age Stanine
• Grade Percentile Rank/Grade Stanine
• Local Percentile Rank/Local Stanine (if ordered)
• Note: If your Score(s) selection is Grade PercentileRank/Grade Stanine or Local Percentile Rank/LocalStanine, then the report display option defaults to a bargraph, and Display Options is not provided.
Student Profile
Continued on next page…
18 DataManager Reporting User’s Guide for CogAT
CogAT Report Options, continued Option Selections Applies to
Score(s)
(select up to 6)
• Age Percentile Rank
• Age Stanine
• Grade Percentile Rank
• Grade Stanine
• Standard Age Score
• Local Percentile Rank (if ordered)
• Local Stanine (if ordered)
Student Profile Narrative (SSPS)
Score(s)
(select up to 5)
• Avg. Age Percentile Rank
• Avg. Age Stanine
• Avg. Grade Percentile Rank
• Avg. Grade Stanine
• Avg. Universal Scale Score
• Avg. Standard Age Score
• Number Included
Group Roster
Subgroup Roster
Score(s)
(select 1)
• Age Percentile Rank/Age Stanine
• Grade Percentile Rank/Grade Stanine
Group Profile
Score(s)
(select up to 6)
• Avg. Age Percentile Rank
• Avg. Age Stanine
• Avg. Grade Percentile Rank
• Avg. Grade Stanine
• Avg. Universal Scale Score
• Avg. Standard Age Score
Group Summary (SSPS)
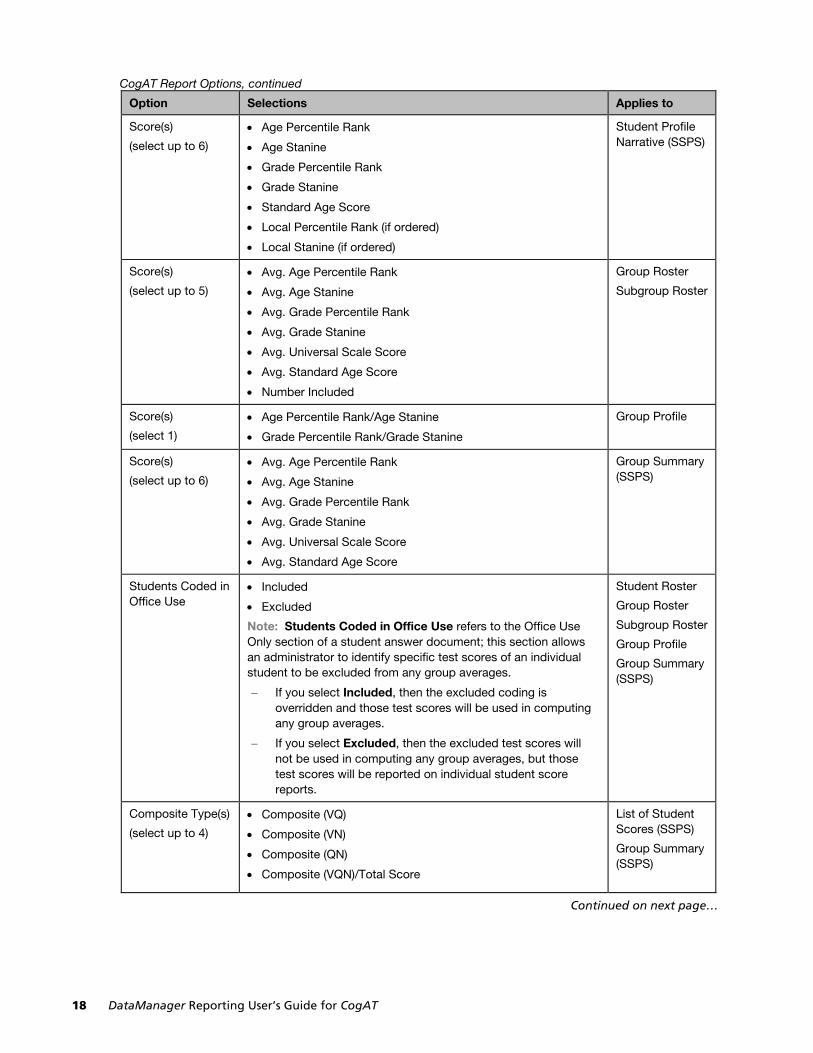
Students Coded in Office Use
• Included
• Excluded
Note: Students Coded in Office Use refers to the Office Use Only section of a student answer document; this section allows an administrator to identify specific test scores of an individual student to be excluded from any group averages.
− If you select Included, then the excluded coding is overridden and those test scores will be used in computing any group averages.
− If you select Excluded, then the excluded test scores will not be used in computing any group averages, but those test scores will be reported on individual student score reports.
Student Roster
Group Roster
Subgroup Roster
Group Profile
Group Summary (SSPS)
Composite Type(s)
(select up to 4)
• Composite (VQ)
• Composite (VN)
• Composite (QN)
• Composite (VQN)/Total Score
List of Student Scores (SSPS)
Group Summary (SSPS)
Continued on next page…

Creating Reports 19
CogAT Report Options, continued Option Selections Applies to
Content Scope Student Roster, Student Profile, Group Roster, Group Profile, Multimeasure Student Roster:
Select any or all tests and composites to include on the report.
Subgroup Roster:
Select one test or composite to include on the report.
Student Roster
Multimeasure Student Roster
Student Profile
Group Roster
Subgroup Roster
Group Profile
Ability Profile • Yes
• No
Student Profile Narrative (SSPS)
Performance Band (Optional) In the from and to boxes, type the performance indicator value range to be applied to any or all of the color categories. Enter the low value in the from box and the high value in the to box.
Note: You can change the performance band labels by typing different text in the label field for any or all of the categories.
Multimeasure Student Roster
Sort Direction
(select 1)
• A–Z by Student last name
• Ascending by Test/Composite
• Descending by Test/Composite
List of Student Scores (SSPS)
Sort by Subtest
(Option available if selection for Sort Direction is Ascending by Test/Composite or Descending by Test/Composite.)
Select a test or composite by which to sort the report. List of Student Scores (SSPS)
Sort Type
(select 1)
• Age Scores
• Grade Scores
List of Student Scores (SSPS)
Continued on next page…

20 DataManager Reporting User’s Guide for CogAT
CogAT Report Options, continued Option Selections Applies to
Region, System, District, Building, and/or Class
(Location options vary depending on your setup and permissions.)
Data Export, Student Roster, Group Roster, Subgroup Roster, Group Profile, Multimeasure Student Roster:
For each location option, select one or select All to include all locations.
Note: Only the highest-level location option displays, defaulted to All. If you change the selection from All to another selection, then the next highest location level will appear. This continues for all location options available.
Student Profile:
Select one for each location option available.
Data Export
Student Roster
Multimeasure Student Roster
List of Student Scores (SSPS)
Student Profile
Student Profile Narrative (SSPS)
Group Roster
Subgroup Roster
Group Profile
Group Summary (SSPS)
Student Select one student or select All to include all students in the selected class.
Student Profile
Population Filters Student Roster, Group Roster, Group Profile:
(Optional) Select one category within each subgroup.
Subgroup Roster:
Select one subgroup or All Subgroups.
Student Roster
List of Student Scores (SSPS)
Group Roster
Subgroup Roster
Group Profile
Group Summary (SSPS)
Score Filters Student Roster, Group Roster, Subgroup Roster:
(Optional) To filter reports, do the following:
i. In the Score Filters list, click None. The filter box opensdisplaying the filter options available for the report. Theseoptions vary depending on the type of report.
ii. In the Score list, select a score to filter the results by thatscore.
Note: Ability Profile Score and Number Attempted/Number of Items Included are not available for filtering.
iii. In the Content Area list, select one of the batteries orcomposites.
iv. Select a relational operator (is equal to, is greater than, etc.)from the list and type a value in the box.
Student Roster
Multimeasure Student Roster
Group Roster
Subgroup Roster
Continued on next page…

Creating Reports 21
CogAT Report Options, continued Option Selections Applies to
Score Filters,
continued
v. If needed, specify one or two additional filters by selecting ANDor OR in the AND/OR list and repeat steps ii–iv.
Note: Selecting AND adds the additional filter requirement to the previous filter(s); the results contain only those values that meet both filter requirements. (For example: If your filter states “greater than 40 AND less than 50,” then the results include only values between 41 and 49.) Selecting OR includes the additional filter results together with the results of the previous filter(s); the results contain those values that meet either of the filter requirements. (For example: If your filter states “greater than 90 OR less than 10” on a scale of 0 to 99, then the results include values 91 to 99 and values 0 to 9.)
vi. To remove the filter(s), click Clear Filters.
Multimeasure Student Roster:
(Optional) To filter reports, do the following:
i. Click the column number to select the column of the report towhich you want to apply the filter and then click None in theScore Filters list. The filter box appears with the score for theselected column displayed in the Score box.
Note: Ability Profile Score and Number Attempted/Number of Items Included are not available for filtering.
ii. Select a relational operator (is equal to, is greater than, etc.)from the list and type a value in the box.
iii. If needed, specify filters for additional columns by clicking theColumn number and then click None in the Score Filters list.The filter box appears.
iv. Select AND or OR in the AND/OR list and repeat step ii.
Note: Selecting AND adds the additional filter requirement to the previous filter(s); the results contain only those values that meet both filter requirements. Selecting OR includes the additional filter results together with the results of the previous filter(s); the results contain those values that meet either of the filter requirements.
v. To remove the filter(s), click Clear Filters.
Student Roster
Multimeasure Student Roster
Group Roster
Subgroup Roster
Continued on next page…
22 DataManager Reporting User’s Guide for CogAT
CogAT Report Options, continued Option Selections Applies to
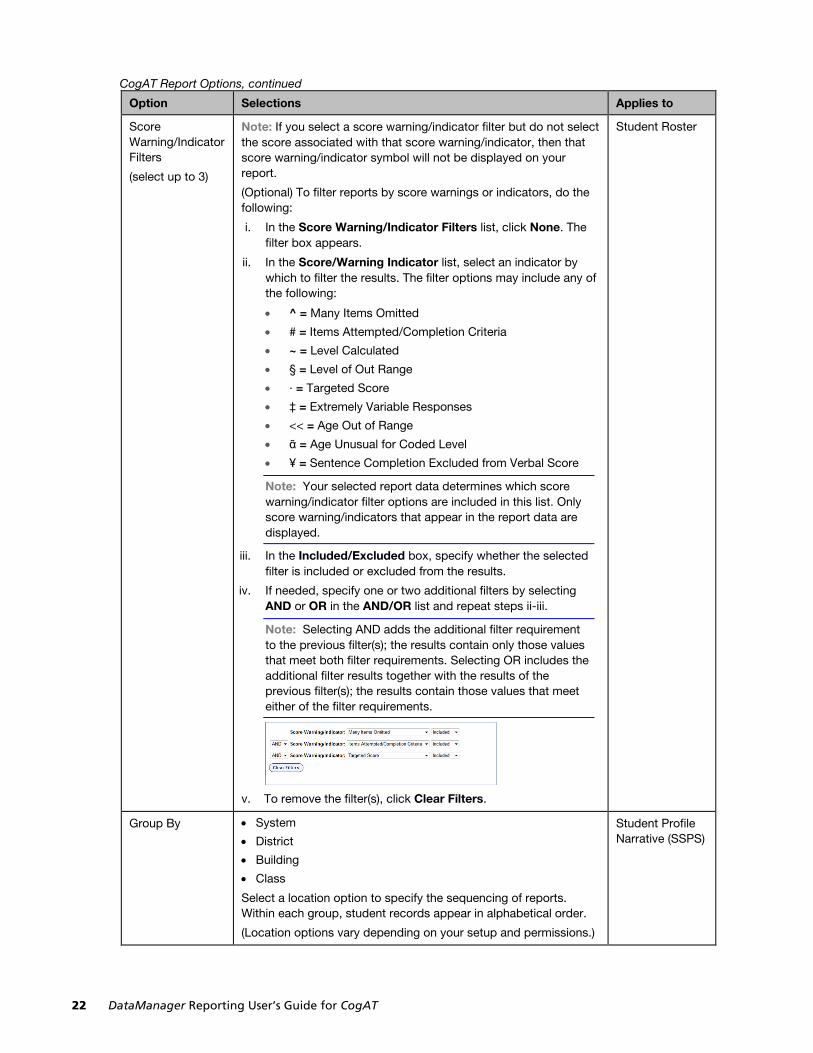
Score Warning/Indicator Filters
(select up to 3)
Note: If you select a score warning/indicator filter but do not select the score associated with that score warning/indicator, then that score warning/indicator symbol will not be displayed on your report.
(Optional) To filter reports by score warnings or indicators, do the following:
i. In the Score Warning/Indicator Filters list, click None. Thefilter box appears.
ii. In the Score/Warning Indicator list, select an indicator bywhich to filter the results. The filter options may include any ofthe following:
• ^ = Many Items Omitted
• # = Items Attempted/Completion Criteria
• ~ = Level Calculated
• § = Level of Out Range
• · = Targeted Score
• ‡ = Extremely Variable Responses
• << = Age Out of Range
• ᾶ = Age Unusual for Coded Level
• ¥ = Sentence Completion Excluded from Verbal Score
Note: Your selected report data determines which score warning/indicator filter options are included in this list. Only score warning/indicators that appear in the report data are displayed.
iii. In the Included/Excluded box, specify whether the selectedfilter is included or excluded from the results.
iv. If needed, specify one or two additional filters by selectingAND or OR in the AND/OR list and repeat steps ii-iii.
Note: Selecting AND adds the additional filter requirement to the previous filter(s); the results contain only those values that meet both filter requirements. Selecting OR includes the additional filter results together with the results of the previous filter(s); the results contain those values that meet either of the filter requirements.
v. To remove the filter(s), click Clear Filters.
Student Roster
Group By • System
• District
• Building
• Class
Select a location option to specify the sequencing of reports. Within each group, student records appear in alphabetical order.
(Location options vary depending on your setup and permissions.)
Student Profile Narrative (SSPS)

Creating Reports 23
4. If you selected a Display Type of Multimeasure Student Roster, click Add Column tocreate the next column in the report. As columns are added to the report, a series of upto ten numbers (corresponding to the columns) appears in the lower left corner of thepage.
− To edit the report options of one of the columns, click the number correspondingto that column.
− To delete a column, select the column to be deleted and click Remove Column.
− To clear all selections (including the Display Type) and return to the default options, click Reset Criteria.
Note: The Region, System, District, Building, and/or Class selections that you make in the first column apply to all the columns in the report.
5. (Optional) To save the current selection criteria for future use, do the following:
a. Click Save Criteria in the lower left corner of the page. A Save Report Criteriadialog box opens. The report name defaults to the Display Type of the report.
b. Type in the Report Name box to change or add to the name of the saved selectioncriteria. If you wish to add a description for the selection criteria, type in theSummary box.
Note: The Report Name can be a maximum of 80 characters. The Summary can be a maximum of 255 characters.
c. Click Save.
If the report name does not already exist, a confirmation dialog box appears.Continue to step d.
If the report name does already exist, a Report Name Exists dialog boxappears. Do one of the following:
o To change the selection criteria that were saved under this report name withthe updated selected criteria, click Yes. A confirmation dialog box appears.Continue to step d.

24 DataManager Reporting User’s Guide for CogAT
o To retain the selection criteria that were saved under this report name andsave the updated selection criteria under a new report name, click No. ASave Report Criteria dialog box opens with an empty Report Name box.Return to step b.
d. Click OK. The saved selection criteria are available on the Load/Manage Criteriapage. For more information, see “Loading & Managing Saved Criteria” on page 25.
6. Run the report using one of the following options.
To do the following… Follow these instructions…
Run the report immediately as you wait.
a. Click Run Report. A progress bar displays as the report is running.When the report has completed running, it appears on a reportpage.
b. See “Viewing and Working with Reports” on page 27 forinformation about the report page.
Note: The Run Report option is not available for Data Export or Scoring Service Print Style reports. These report types must be submitted to run in the background.
Submit the report to run in the background.
a. Click Run in Background.A Specify a Report Namedialog box opens. Thereport name defaultsto the Display Type of the report.
b. (Optional) Change or add to the Report Name.
Note: Do not use the following characters in the Report Name: semicolon (;), colon (:), asterisk (*), question mark (?), slash (/), backslash (\), pipe (|), angle brackets (< >), or quotation marks (“).
c. Click OK. A dialog box appears confirming that the job has beensubmitted successfully.
d. Click OK. The report is submitted. When it has completed running,it can be opened in the Report Center.
e. See “Using Report Center” on page 36 for information aboutretrieving reports.
Note: Completed jobs are available in Report Center for five days after they have completed running.
Creating Reports 25
Loading and Managing Saved Criteria
Data Package: Platinum or Data Plus Role: Account Holder, Administrator, Teacher, or Digital Resource & Reporting Access
When you save report criteria on the Create a Report page, the saved selection criteria is available on the Load/Manage Criteria page. Use this page to load, edit, or delete any of your saved selection criteria.
To load and manage saved criteria:
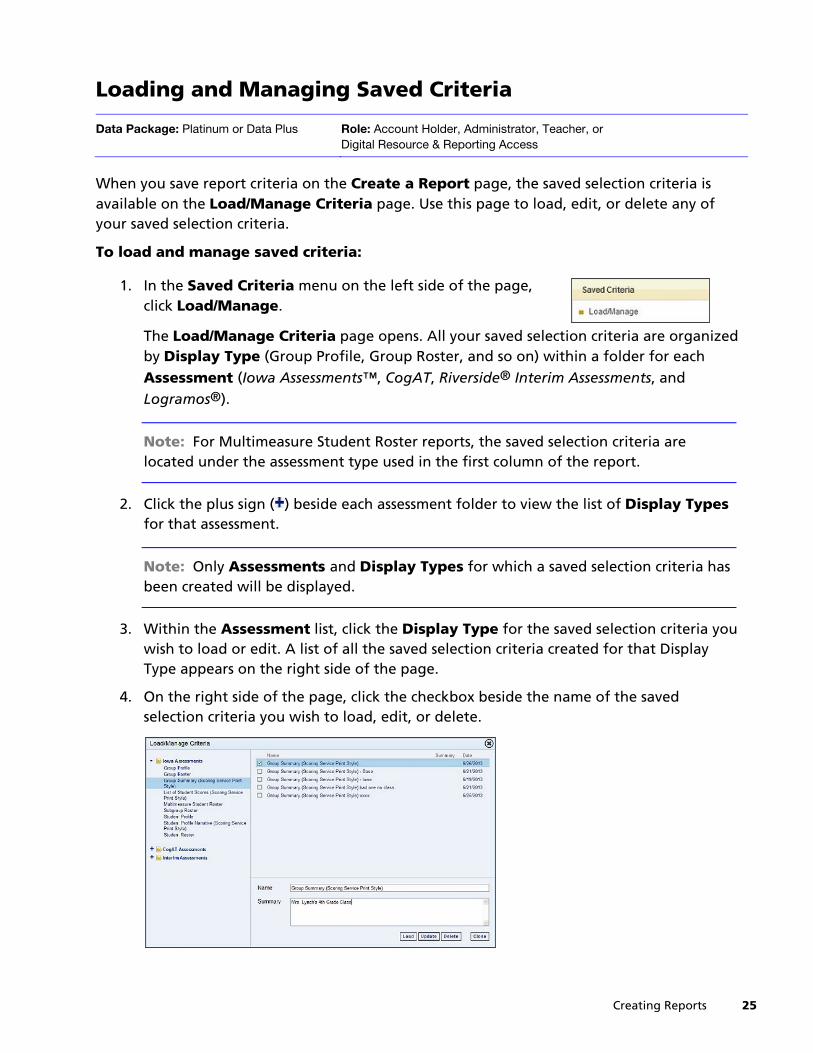
1. In the Saved Criteria menu on the left side of the page,click Load/Manage.
The Load/Manage Criteria page opens. All your saved selection criteria are organizedby Display Type (Group Profile, Group Roster, and so on) within a folder for eachAssessment (Iowa Assessments™, CogAT, Riverside® Interim Assessments, andLogramos®).
Note: For Multimeasure Student Roster reports, the saved selection criteria are located under the assessment type used in the first column of the report.
2. Click the plus sign ( ) beside each assessment folder to view the list of Display Typesfor that assessment.
Note: Only Assessments and Display Types for which a saved selection criteria has been created will be displayed.
3. Within the Assessment list, click the Display Type for the saved selection criteria youwish to load or edit. A list of all the saved selection criteria created for that DisplayType appears on the right side of the page.
4. On the right side of the page, click the checkbox beside the name of the savedselection criteria you wish to load, edit, or delete.

26 DataManager Reporting User’s Guide for CogAT
5. Refer to the following table to load, edit, or delete the saved selection criteria.
To do the following... Follow these instructions...
Load the saved selection criteria
a. Click Load. The Create a Report page will open withall the report options set to the saved selection criteria.
b. Refer to “Creating CogAT Reports” on page 14 formore information regarding creating reports:
Edit the name or summary of the saved selection criteria
a. Edit the name and/or summary by typing in the Nameand/or Summary box.
b. Click Update. The edited name and summary display inthe list of saved selection criteria.
Delete the saved selection criteria
a. Click the checkboxes beside the name(s) of each savedselection criteria to be deleted.
b. Click Delete. A dialog box appears confirming thedeletion. Click Yes. The selected criteria are removedfrom the list of saved selection criteria.
6. Click Close or click the button in the upper right corner to close the Load/Manage Criteria page. The Create a Report page will open.
Viewing and Working with Reports 27
Part 3 Viewing and Working with Reports
The report page presents the report that you created and allows you to perform the following tasks:
Task Page Task Page
Navigate or Print a Report 27 Sort a Report by Score 29
View Descriptions 28 Search a Report by Name 30
Link to a Related Report 28 Export a Report 31
Edit the Report Selection Criteria 29 Print a Report 34
For more information regarding the report format, see “About Reports” on page 3.
Viewing and Editing Reports Navigate or Print a Report
Data Package: Platinum or Data Plus Role: Account Holder, Administrator, Teacher, or Digital Resource & Reporting Access
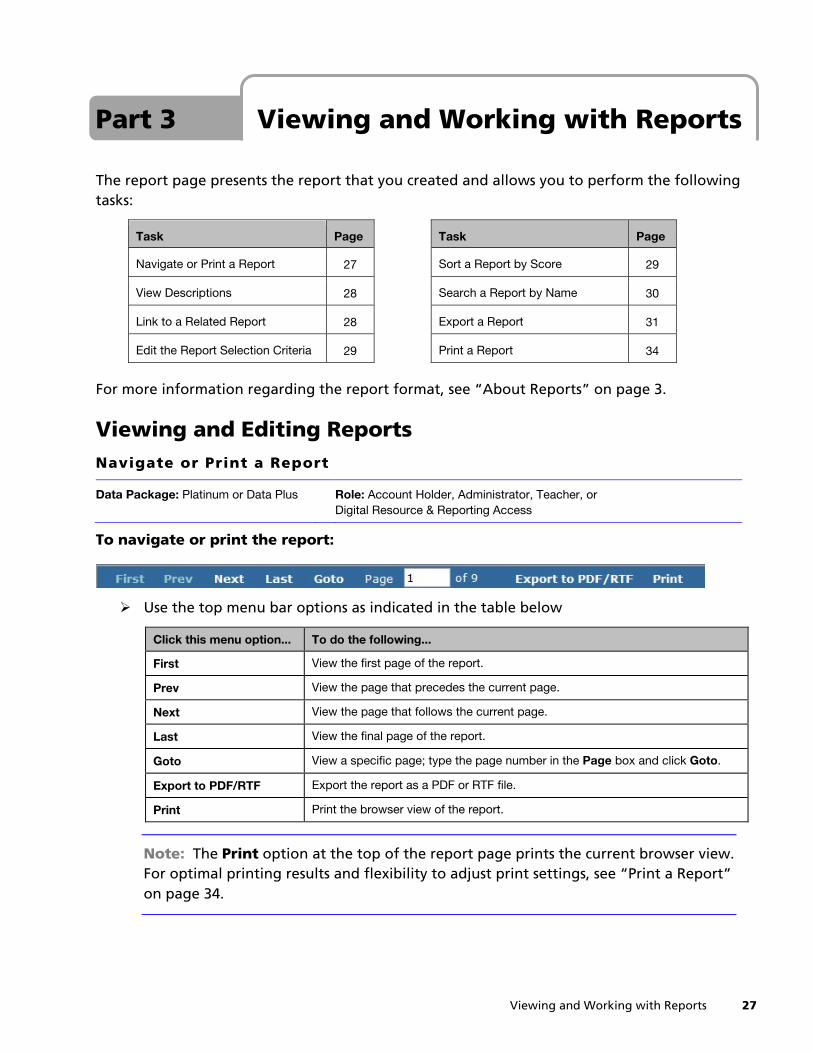
To navigate or print the report:
Use the top menu bar options as indicated in the table below
Click this menu option... To do the following...
First View the first page of the report.
Prev View the page that precedes the current page.
Next View the page that follows the current page.
Last View the final page of the report.
Goto View a specific page; type the page number in the Page box and click Goto.
Export to PDF/RTF Export the report as a PDF or RTF file.
Print Print the browser view of the report.
Note: The Print option at the top of the report page prints the current browser view. For optimal printing results and flexibility to adjust print settings, see “Print a Report” on page 34.

28 DataManager Reporting User’s Guide for CogAT
View Descriptions
Within a Student Profile or Group Profile report, the report page provides links to view the test, score, and composite descriptions.
To view test, score, and composite descriptions in Student Profile and Group Profile reports:
Point to the test name, score title, or composite title. A pop-up window displays a briefdescription of the test, score, or composite. For a complete listing of the fulldescriptions of these items, see one of the following topics:
Topic Page
Test Descriptions 39
Score Descriptions 44
Link to a Related Report
Depending on the type of report, the report page may provide links within the report to a related report.
To link to a related report:
Click a link within the report to open a related report. For example, each student'sname within a Student Roster report is a link that allows you to open the StudentProfile report for that student. For more information, see “About Reports” on page 3.
Viewing and Working with Reports 29
Edit the Report Selection Criteria
The report page allows you to edit some of the report selections or to return to the Create a Report page to make edits.
To edit the selection criteria for a report:
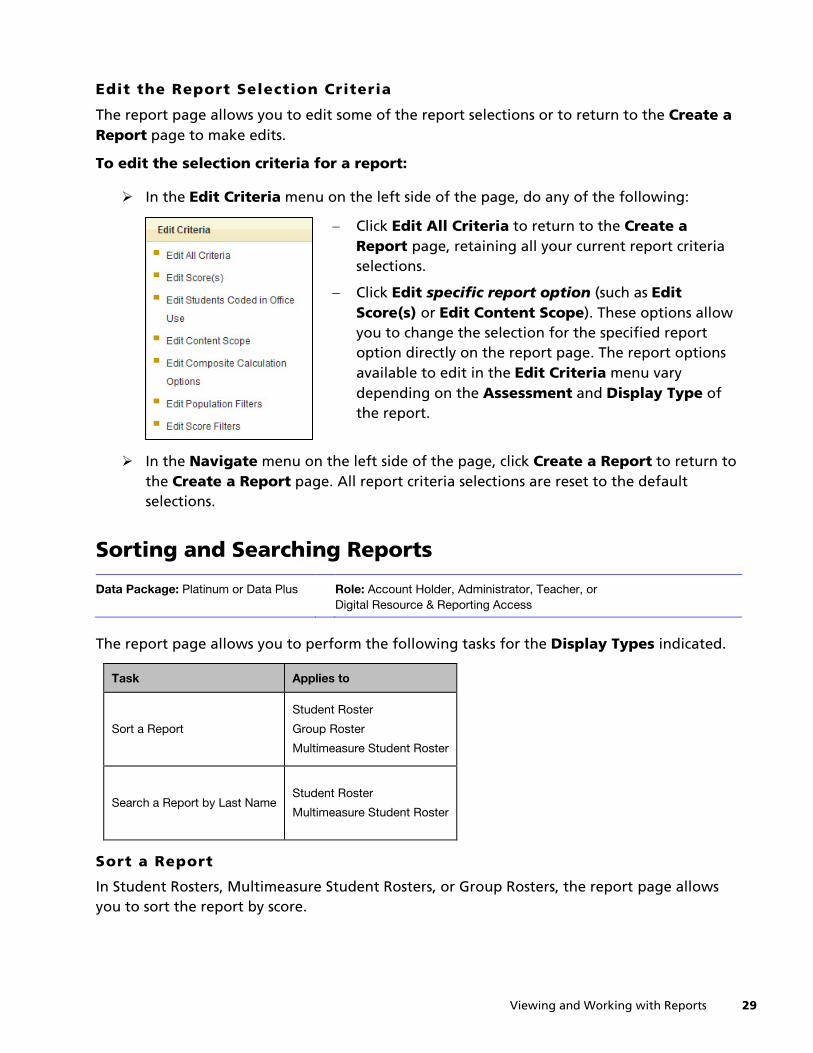
In the Edit Criteria menu on the left side of the page, do any of the following:
− Click Edit All Criteria to return to the Create a Report page, retaining all your current report criteria selections.
− Click Edit specific report option (such as Edit Score(s) or Edit Content Scope). These options allow you to change the selection for the specified report option directly on the report page. The report options available to edit in the Edit Criteria menu vary depending on the Assessment and Display Type of the report.
In the Navigate menu on the left side of the page, click Create a Report to return tothe Create a Report page. All report criteria selections are reset to the defaultselections.
Sorting and Searching Reports
Data Package: Platinum or Data Plus Role: Account Holder, Administrator, Teacher, or Digital Resource & Reporting Access
The report page allows you to perform the following tasks for the Display Types indicated.
Task Applies to
Sort a Report
Student Roster
Group Roster
Multimeasure Student Roster
Search a Report by Last NameStudent Roster
Multimeasure Student Roster
Sort a Report
In Student Rosters, Multimeasure Student Rosters, or Group Rosters, the report page allows you to sort the report by score.

30 DataManager Reporting User’s Guide for CogAT
To sort a report by score:
1. Click Show Sorting. The Sort by list appears.
2. In the Sort by list, select Age Scores or Grade Scores to specify the score types to usefor sorting the report.
3. Locate the column containing the test, composite, or total score by which you want tosort the report.
4. Use the arrows ( ) beside the column title as follows:
− Click once to sort in descending order. (Top arrow is shaded to indicate the reportis sorted in descending order by the score displayed in this column.)
− Click twice to sort in ascending order. (Bottom arrow is shaded to indicate the report is sorted in ascending order by the score displayed in this column.)
− Click three times to reset the column to the default setting, which is alphabetical by
students' last names. (Arrows are not shaded to indicate the report is not sorted by this column.)
Note: If all columns display the unshaded arrows, then the report is sorted by the default setting, which is alphabetical by students' last names.
Search a Report by Last Name
In Student Rosters and Multimeasure Student Rosters, the report page allows you to search for a student by last name.
To search a report by last name:
Type a student’s last name or part of the name in the Search by Last Name box. Theresults of the search are displayed.
Viewing and Working with Reports 31
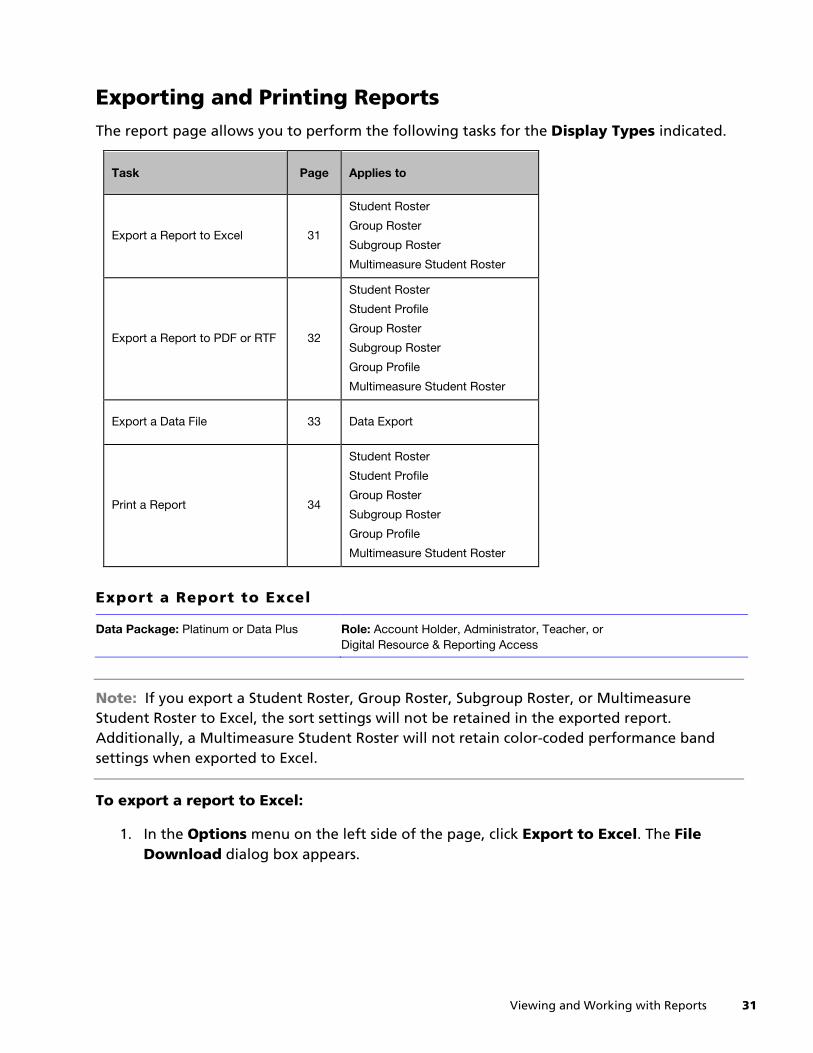
Exporting and Printing Reports The report page allows you to perform the following tasks for the Display Types indicated.
Task Page Applies to
Export a Report to Excel 31
Student Roster
Group Roster
Subgroup Roster
Multimeasure Student Roster
Export a Report to PDF or RTF 32
Student Roster
Student Profile
Group Roster
Subgroup Roster
Group Profile
Multimeasure Student Roster
Export a Data File 33 Data Export
Print a Report 34
Student Roster
Student Profile
Group Roster
Subgroup Roster
Group Profile
Multimeasure Student Roster
Export a Report to Excel
Data Package: Platinum or Data Plus Role: Account Holder, Administrator, Teacher, or Digital Resource & Reporting Access
Note: If you export a Student Roster, Group Roster, Subgroup Roster, or Multimeasure Student Roster to Excel, the sort settings will not be retained in the exported report. Additionally, a Multimeasure Student Roster will not retain color-coded performance band settings when exported to Excel.
To export a report to Excel:
1. In the Options menu on the left side of the page, click Export to Excel. The FileDownload dialog box appears.
32 DataManager Reporting User’s Guide for CogAT
2. Do one of the following:
− To view the report, click Open. An Excel file of the report opens, displaying aseparate row for each student or group. All the information provided on the report page is provided in separate columns.
− To save the report, click Save. The Save As dialog box appears. In the File name box, type a name for the report, and then click Save.
Export a Report to PDF or RTF
Data Package: Platinum or Data Plus Role: Account Holder, Administrator, Teacher, or Digital Resource & Reporting Access
Note: To export reports to PDF, you need Adobe® Reader®. You can download a free copy from the Adobe website at www.adobe.com/products.
To export a report to PDF or RTF:
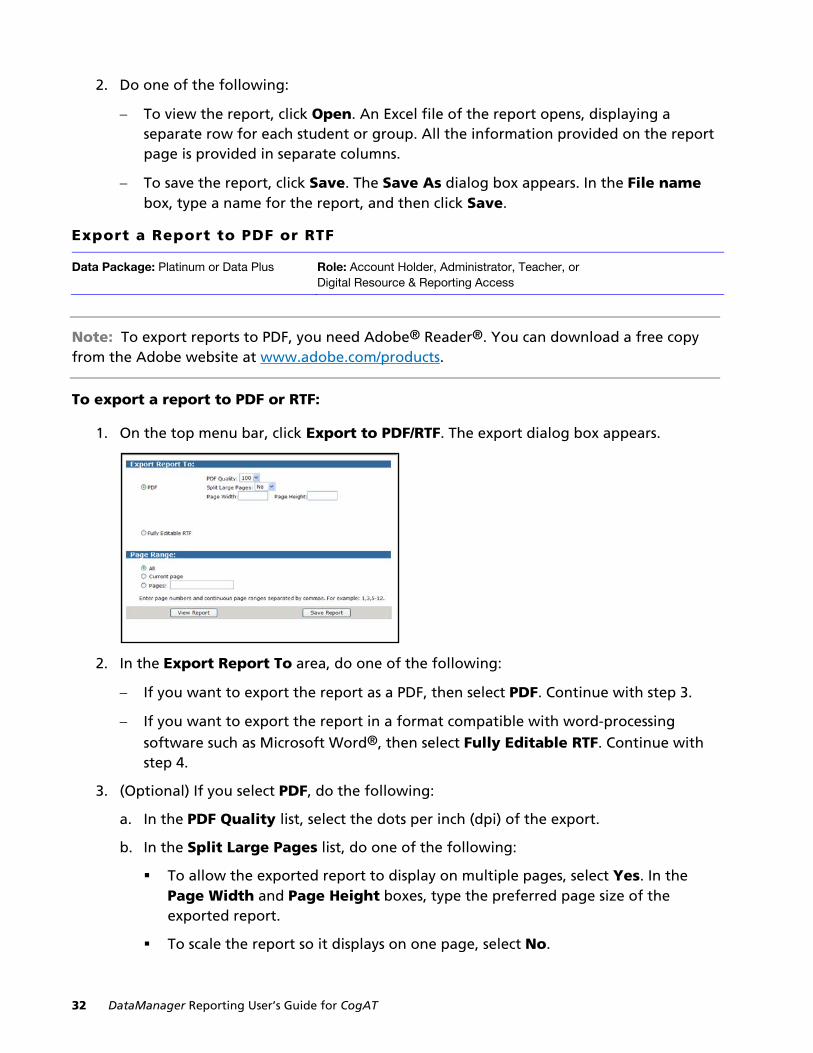
1. On the top menu bar, click Export to PDF/RTF. The export dialog box appears.
2. In the Export Report To area, do one of the following:
− If you want to export the report as a PDF, then select PDF. Continue with step 3.
− If you want to export the report in a format compatible with word-processingsoftware such as Microsoft Word®, then select Fully Editable RTF. Continue with step 4.
3. (Optional) If you select PDF, do the following:
a. In the PDF Quality list, select the dots per inch (dpi) of the export.
b. In the Split Large Pages list, do one of the following:
To allow the exported report to display on multiple pages, select Yes. In thePage Width and Page Height boxes, type the preferred page size of theexported report.
To scale the report so it displays on one page, select No.

Viewing and Working with Reports 33
Note: All print settings can be adjusted after the report has been exported. See “Print a Report” on page 34.
4. In the Page Range area, specify the pages to be exported: All, Current page, orPages. If you select Pages, type the page range to export.
5. Do one of the following:
− To view a PDF report, click View Report. The PDF opens in Adobe Reader.
− To view an RTF report, click View Report. The report opens in a word-processingapplication such as Microsoft Word.
− To save a PDF or RTF report, click Save Report. The File Download dialog box appears. Click Save. The Save As dialog box appears. In the File name box, type a name for the report, and then click Save.
Export a Data File
Data Package: Platinum or Data Plus Role: Account Holder or Administrator
After retrieving your Data Export file from the Report Center, the report page opens providing a link to export the file. Your Data Export file can be identified with the name you provided followed by the date and time that it was created.
To export the data file:
Click the Data Export file link provided in the center of the report page.
For your reference, a data file template, which presents the format of the information provided in the Data Export file, is available for you to download.
To view a standard or custom file format used for data exports:
Click the Data Export File Format Documents link provided in green text on the topright corner of the report page. This opens the DataManager Digital Resources page,which provides links to both standard and custom export file format documentsavailable to download.

34 DataManager Reporting User’s Guide for CogAT
Print a Report
Data Package: Platinum or Data Plus Role: Account Holder, Administrator, Teacher, or Digital Resource & Reporting Access
You can print the portion of a report that appears in the browser on your screen, or you can export the report to a PDF or RTF file and print all or some of the report pages.
To print the browser view of a report:
Click the Print option at the top of the report page.
To print a PDF report:
1. Export the report to PDF. See “Export a Report to PDF or RTF” on page 32.
2. Click the Print icon ( ) on the Adobe Reader toolbar at the bottom of the page orclick File on the top menu bar and select Print. The Print dialog box appears.
3. Refer to the table on the following page to adjust the settings in the Print dialog box.
Note: The Print dialog box may look slightly different depending on the version of Adobe Reader you are using.

Viewing and Working with Reports 35
Depending on the size of your report, your printer's capabilities, your version of Adobe Reader, and your preferred report display, the printing options and settings may vary.
For Display Types: Using the paper size:
Adjust the settings as follows:
Student Profiles
Group Profiles
Group Rosters
Subgroup Rosters
8.5” x 11” • In Orientation, click Landscape.
Student Rosters
Multimeasure Student Rosters
11” x 17” • In Size Options, click Fit anduncheck the Choose papersource by PDF page sizecheckbox.
• In Orientation, click Landscape.
• Click Page Setup..., select thepaper size, and click OK.
Student Rosters
Multimeasure Student Rosters
Note: The optimal paper size for these reports is tabloid-size (11” x 17”). However, if your printer cannot accommodate 11” x 17” paper, then your report can be printed on letter-size paper (8.5” x 11”).
8.5” x 11” • In Size Options, click Fit and clickthe Choose paper source by PDFpage size checkbox.
• In Orientation, click Landscape.
4. Click Print.
To print an RTF report:
1. Export the report to RTF. See “Export a Report to PDF or RTF” on page 32.
2. Open and print the RTF using your word-processing application.

36 DataManager Reporting User’s Guide for CogAT
Using Report Center
Data Package: Platinum or Data Plus Role: Account Holder, Administrator, Teacher, or Digital Resource & Reporting Access
DataManager Reporting allows you to submit reports as jobs that run immediately as you wait or as jobs that run in the background, allowing you to retrieve them at your convenience. It is recommended that large reports be run in the background to allow you to continue working in DataManager as the report is completed. Reports you have submitted to run in the background are available to you in the Report Center.
Note: Completed reports are available in Report Center for five days after they have completed running.
To view and manage reports submitted to run in the background:
1. In the Navigate menu on the left side of the page, click Report Center.
The Report Center opens. This page contains the following three tabs, which provide the status of all the reports you submitted to run in the background:
− Pending - jobs waiting to begin running
− Running - reports in the process of being created
− Completed - reports successfully completed and available for viewing
Note: To ensure that completed reports are available to you as soon as possible, the Report Center page automatically refreshes every 60 seconds.

Viewing and Working with Reports 37
2. Open a report by clicking the Report Name on the Completed tab.
− Scoring Service Print Style reports open as PDF files. See “Print a Report” on page 34for more information.
− All other reports open in the DataManager report page. See “Viewing and Working with Reports” on page 27 for more information.
3. (Optional) Refer to the following table to filter, sort, or delete reports on theCompleted tab.
To do the following... Follow these instructions...
Filter the list a. Click On in the Filter option at the top of the screen. A Filterbox appears.
b. In the Filter box, enter the text by which to filter the ReportName list.
c. Click Apply. The reports that match the filter criteria are listed.
d. To remove the filter and display all completed reports, clickReset.
Sort the list Click one of the column headers (Report Name, Result, or Finished). The list of reports sorts alphanumerically by that column.
Delete a report a. Click the red in the Delete column. A dialog box appears toconfirm the deletion.
b. Click OK. The selected report is deleted from the list.

38 DataManager Reporting User’s Guide for CogAT
Test and Score Descriptions 39
Part 4 Test and Score Descriptions
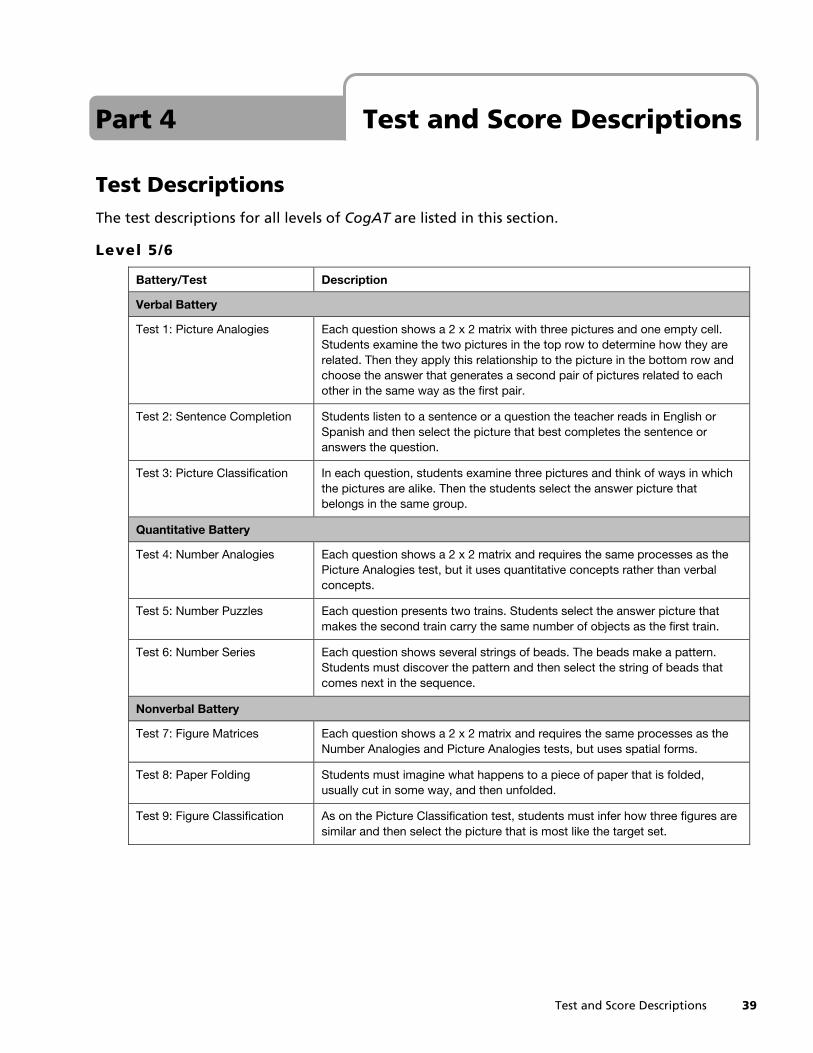
Test Descriptions The test descriptions for all levels of CogAT are listed in this section.
Level 5/6
Battery/Test Description
Verbal Battery
Test 1: Picture Analogies Each question shows a 2 x 2 matrix with three pictures and one empty cell. Students examine the two pictures in the top row to determine how they are related. Then they apply this relationship to the picture in the bottom row and choose the answer that generates a second pair of pictures related to each other in the same way as the first pair.
Test 2: Sentence Completion Students listen to a sentence or a question the teacher reads in English or Spanish and then select the picture that best completes the sentence or answers the question.
Test 3: Picture Classification In each question, students examine three pictures and think of ways in which the pictures are alike. Then the students select the answer picture that belongs in the same group.
Quantitative Battery
Test 4: Number Analogies Each question shows a 2 x 2 matrix and requires the same processes as the Picture Analogies test, but it uses quantitative concepts rather than verbal concepts.
Test 5: Number Puzzles Each question presents two trains. Students select the answer picture that makes the second train carry the same number of objects as the first train.
Test 6: Number Series Each question shows several strings of beads. The beads make a pattern. Students must discover the pattern and then select the string of beads that comes next in the sequence.
Nonverbal Battery
Test 7: Figure Matrices Each question shows a 2 x 2 matrix and requires the same processes as the Number Analogies and Picture Analogies tests, but uses spatial forms.
Test 8: Paper Folding Students must imagine what happens to a piece of paper that is folded, usually cut in some way, and then unfolded.
Test 9: Figure Classification As on the Picture Classification test, students must infer how three figures are similar and then select the picture that is most like the target set.

40 DataManager Reporting User’s Guide for CogAT
Level 7
Battery/Test Description
Verbal Battery
Test 1: Picture Analogies Each question shows a 2 x 2 matrix with three pictures and one empty cell. Students examine the two pictures in the top row to determine how they are related. Then they apply this relationship to the picture in the bottom row and choose the answer that generates a second pair of pictures related to each other in the same way as the first pair.
Test 2: Sentence Completion Students listen to a sentence or a question the teacher reads in English or Spanish and then select the picture that best completes the sentence or answers the question.
Test 3: Picture Classification In each question, students examine three pictures and think of ways in which the pictures are alike. Then the students select the answer picture that belongs in the same group.
Quantitative Battery
Test 4: Number Analogies Each question shows a 2 x 2 matrix and requires the same processes as the Picture Analogies test, but it uses quantitative concepts rather than verbal concepts.
Test 5: Number Puzzles Each question presents two trains. Students select the answer picture that makes the second train carry the same number of objects as the first train.
Test 6: Number Series Each question shows several strings of beads. The beads make a pattern. Students must discover the pattern and then select the string of beads that comes next in the sequence.
Nonverbal Battery
Test 7: Figure Matrices Each question shows a 2 x 2 matrix and requires the same processes as the Number Analogies and Picture Analogies tests, but uses spatial forms.
Test 8: Paper Folding Students must imagine what happens to a piece of paper that is folded, usually cut in some way, and then unfolded.
Test 9: Figure Classification As on the Picture Classification test, students must infer how three figures are similar and then select the picture that is most like the target set.

Test and Score Descriptions 41
Level 8
Battery/Test Description
Verbal Battery
Test 1: Picture Analogies Each question shows a 2 x 2 matrix with three pictures and one empty cell. Students examine the two pictures in the top row to determine how they are related. Then they apply this relationship to the picture in the bottom row and choose the answer that generates a second pair of pictures related to each other in the same way as the first pair.
Test 2: Sentence Completion Students listen to a sentence or a question the teacher reads in English or Spanish and then select the picture that best completes the sentence or answers the question.
Test 3: Picture Classification In each question, students examine three pictures and think of ways in which the pictures are alike. Then the students select the answer picture that belongs in the same group.
Quantitative Battery
Test 4: Number Analogies Each question shows a 2 x 2 matrix and requires the same processes as the Picture Analogies test, but it uses quantitative concepts rather than verbal concepts.
Test 5: Number Puzzles Each question presents an equation in which one number is missing. Students must select the missing number from the four answer choices.
Test 6: Number Series Each question shows several strings of beads. The beads make a pattern. Students must discover the pattern and then select the string of beads that comes next in the sequence.
Nonverbal Battery
Test 7: Figure Matrices Each question shows a 2 x 2 matrix and requires the same processes as the Number Analogies and Picture Analogies tests, but uses spatial forms.
Test 8: Paper Folding Students must imagine what happens to a piece of paper that is folded, usually cut in some way, and then unfolded.
Test 9: Figure Classification As on the Picture Classification test, students must infer how three figures are similar and then select the picture that is most like the target set.

42 DataManager Reporting User’s Guide for CogAT
Level 9
Battery/Test Description
Verbal Battery
Test 1: Verbal Analogies First students examine a pair of words and think of ways in which they are related. Then they apply this relationship to a third word to generate a new pair of words related to each other in the same way as the first pair.
Test 2: Sentence Completion Students read an incomplete sentence and then select the answer choice that best completes the sentence.
Test 3: Verbal Classification Students examine three words and think of ways in which they are alike. Then they select the answer choice that belongs in the same group.
Quantitative Battery
Test 4: Number Analogies Students examine two pairs of numbers and figure out the rule both pairs follow. Then they apply the rule to a given number and choose the answer that generates a third pair of numbers that follows the same rule. All questions require the same processes as the Verbal Analogies test but use quantitative concepts rather than verbal concepts.
Test 5: Number Puzzles Each question presents an equation in which at least one number is missing. If one element is missing, students must select the missing number from the available answer choices. If two or three elements are missing, students must substitute numbers that are provided for the missing elements and then solve the equation.
Test 6: Number Series Some questions in this test show several strings of beads with the number of beads shown beneath each string. The numbers make a pattern. Students must discover the pattern and then select the string of beads that comes next in the sequence. Other questions show only the series of numbers and require the same processes.
Nonverbal Battery
Test 7: Figure Matrices Each item presents a 2 by 2 matrix with one empty cell. Students examine the two pictures in the top row to determine how they are related. Then they apply this relationship to the picture in the bottom row and choose the answer that generates a second pair of pictures related to each other in the same way as the first pair.
Test 8: Paper Folding Students look at pictures of a piece of paper being folded and holes being punched in the folded paper. Then they select the picture that shows how the paper looks when it is unfolded.
Test 9: Figure Classification For each question, students must determine how three figures are similar and then select the answer choice that is most like the first three figures.

Test and Score Descriptions 43
Levels 10–17/18
Battery/Test Description
Verbal Battery
Test 1: Verbal Analogies Students examine a pair of words and think of ways in which they are related. Then they apply this relationship to a third word to generate a new pair of words related to each other in the same way as the first pair.
Test 2: Sentence Completion Students read an incomplete sentence and then select the answer choice that best completes the sentence.
Test 3: Verbal Classification Students examine three words and think of ways in which they are alike. Then they select the answer choice that belongs in the same group.
Quantitative Battery
Test 4: Number Analogies Students examine two pairs of numbers and determine the rule both pairs follow. Then they apply the rule to a given number and choose the answer that generates a third pair of numbers that follows the same rule. The test questions require the same processes as the Verbal Analogies test but use quantitative concepts rather than verbal concepts.
Test 5: Number Puzzles Each question presents an equation in which elements are missing. The students must substitute numbers for the missing elements and solve the equation.
Test 6: Number Series Each question contains a series of numbers that follows a pattern. First students identify the rule the numbers follow. Then they apply the rule to find the next number in the series.
Nonverbal Battery
Test 7: Figure Matrices Each question presents a matrix in which one figure is missing. Students determine the rule(s) that the existing figures follow. Then they apply the rule(s) to choose the figure that completes the matrix.
Test 8: Paper Folding Each question shows a piece of paper being folded and holes being punched in the folded paper. Students must choose the answer that shows how the paper looks when it is unfolded.
Test 9: Figure Classification For each question, students must determine how three figures are similar and then select the answer choice that is most like the first three figures.

44 DataManager Reporting User’s Guide for CogAT
Score Descriptions Score descriptions for CogAT are provided below.
Score Type Description
Ability Profile Captures the level and pattern of a student’s scores on the three CogAT batteries
Percentile Rank (PR) A score from 1 to 99 that indicates the percentage of students in the same age or grade group who obtained lower scores on a test than a particular student did
Raw Score (RS) The number of questions a student answers correctly on a test
Standard Age Score (SAS) A normalized standard score with a mean of 100 and standard deviation of 16
Stanine (S) Normalized standard scores that range from 1 to 9 and have an average value of 5
Universal Scale Score (USS) A scale score based on a continuous growth scale from K–12; used to convert to other score types
Age Norms Allow you to compare a student’s performance on the test with that of a national sample of students in the same age group
Grade Norms Allow you to compare a particular student’s performance on the test with that of a national sample of other students in the same grade group
Local Norms Allow you to compare a particular student’s performance on the test with that of other students in the same grade group in the same school or school district (available as a special scoring service)

