reporters review results from the decade of geopotential...
TRANSCRIPT

© NERC All rights reserved
Reporters ReviewResults from the decade of geopotential
research and beyond: Session A13.2
Ciarán BegganBritish Geological Survey, Edinburgh, UK
© NERC All rights reserved
RE +
450km
RE
3485km
1233km
RE +
450km
RE
3485km
1233km
RE +
450km
RE
3485km
1233km
RE +
110km
10RE
RE +
450km
RE
3485km
1233km
RE +
110km
10RE
RE +
450km
RE
3485km
1233km
RE +
110km
10RE
RE +
450km
RE
3485km
1233km
RE +
110km
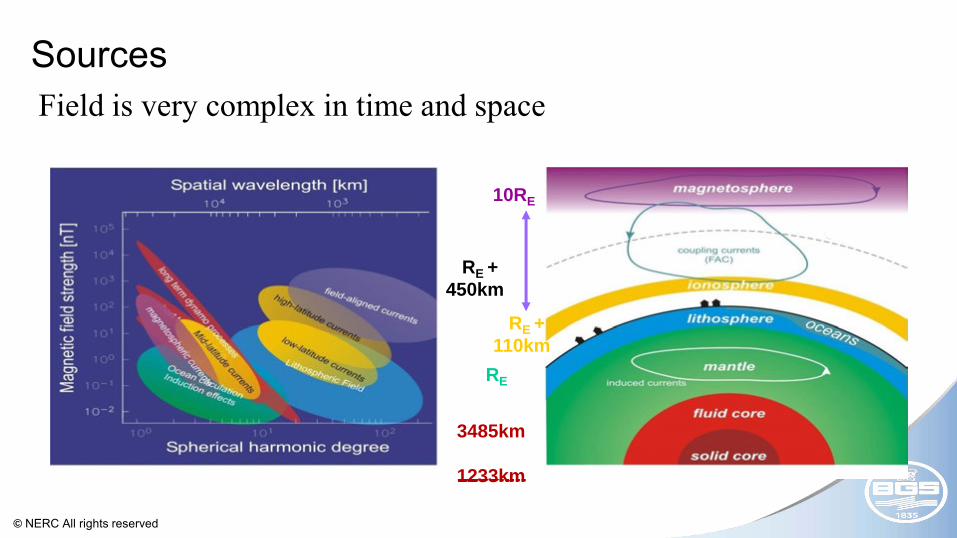
SourcesField is very complex in time and space

© NERC All rights reserved
Decade of Geopotential Research
• Officially started in February1999 with launch of Ørsted• Altitude 650-800km;
• Vector and scalar initially; scalar only (since 2005)
• CHAMP (July 2000 – September 2010)• Altitude 450km → 300km; 4 month repeat period
• SAC-C launched (November 2000 – end-2004)• Altitude 700km; scalar only
• GRACE (2002) & GOCE (2009) gravity missions
• Next generation: ESA Swarm (July 2012)
© NERC All rights reserved
Decade of Geopotential Research (DoGR)
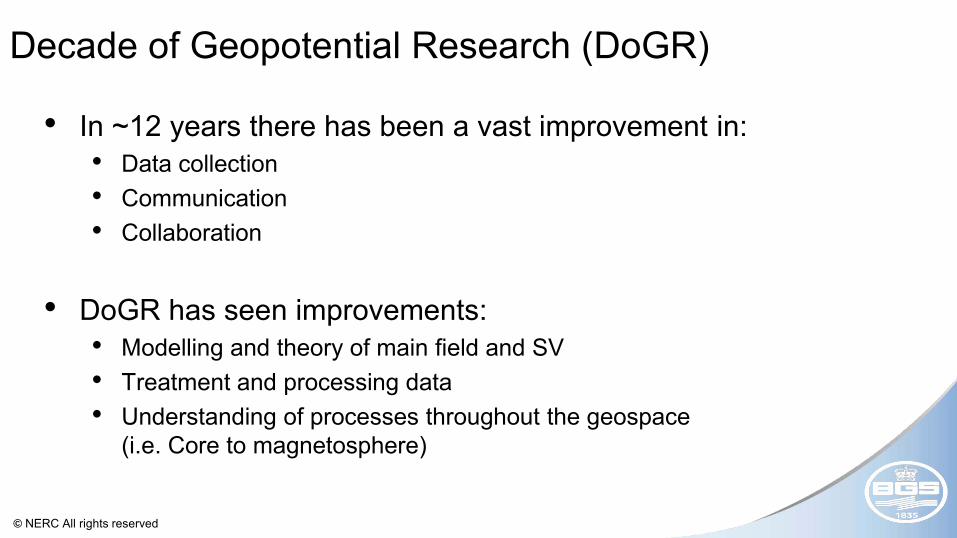
• In ~12 years there has been a vast improvement in:• Data collection • Communication• Collaboration
• DoGR has seen improvements:• Modelling and theory of main field and SV• Treatment and processing data• Understanding of processes throughout the geospace
(i.e. Core to magnetosphere)

© NERC All rights reserved
Satellite data
• High quality data:• Global coverage• Improved Euler angle estimation• Precise orbit determination (GPS)• Extremely low solar activity from
2005 – 2010• Long-lasting missions
• Dedicated managers & scientists:• Data-driven experiments now
possible

© NERC All rights reserved
Other factors
• Improved ground observatory network and data availability (e.g. INTERMAGNET, WDC)
• The Internet (plus other communication technologies)
• Large-scale computing readily available:
• PC and HPC for handling large datasets and inverse problems
• International collaborations on many projects now truly possible
• Willingness of funding agencies to invest in research programmes on geopotential fields
Current Observatories
World Data Centre Data Holdings
© NERC All rights reserved
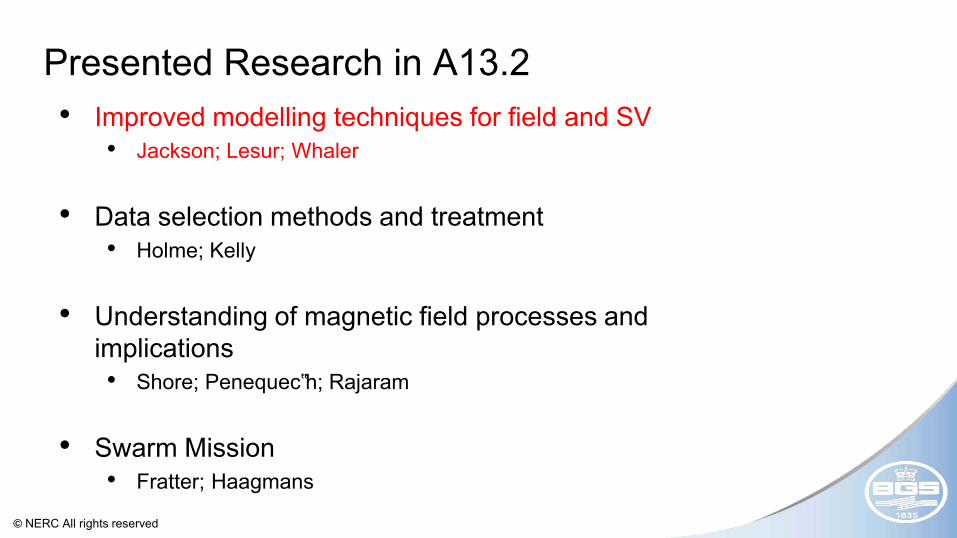
Presented Research in A13.2• Improved modelling techniques for field and SV
• Jackson; Lesur; Whaler
• Data selection methods and treatment• Holme; Kelly
• Understanding of magnetic field processes and implications• Shore; Penequec‟h; Rajaram
• Swarm Mission• Fratter; Haagmans

© NERC All rights reserved
Modelling I• Updated GUFM-type model for 2000-
2010• Imaging of the field at the core-
mantle boundary• „Blurred‟ due to the Green‟s
function• Maximum Entropy approach
• Allows solutions with „sharp‟ features and boundaries
• Image processing heritage

© NERC All rights reserved
Core Mantle boundary

© NERC All rights reserved
Modelling IIGRIMM-3: • Magnetic field covering the full
CHAMP data time span.• Improve the time behavior of the
model:• Fitting the rapid evolution of
the observed SV (Jerks)• Avoiding spurious oscillations
• Solve for field using different constraints

© NERC All rights reserved
Field & SV at CMB
Vertical down component of GRIMM-3 and its SV at the CMB for year 2005.0. The model has been truncated at SH degree 13

© NERC All rights reserved
Observations about the past decade
• The smoothing constraints applied allow for large/sharp variations of the acceleration, consequently the Gauss‟s coefficient third time derivatives behave “step-like” in time.
• “Jerks” are localized both in time and space. They are identified in :
• 2003.7 at the magnetic equator under South-East Asia
• 2007.3 at the magnetic equator under South-West Atlantic Ocean
• At low latitudes the current geodynamo possesses a series of intense westward drifting flux concentrations.
• Satellite observations have enabled us to image the formation of the newest member of this sequence under the eastern Indian ocean.
• Bursts of equatorward flow stripping flux from the high latitud lobes may be responsible.
• Decay of the dipole is almost entirely controlled by southern hemisphere.
• The Pacific hemisphere has very low secular variation (c.f. palaeomagnetism); coincidence with edge of continents is remarkable.
Jackson et al. Lesur et al.

© NERC All rights reserved
Core Flow Models
• Steady core surface flows fit gross features of secular variation (SV) data over long periods with a small number of parameters
• Provide a better SV forecast than extrapolation
• But cannot follow details of SV variation
• Can we do better if we allow flow acceleration too?• small increase in the number
of parameters
• Jointly invert SV and SA data for flow and flow acceleration coefficients
• Flow truncated at degree 14, flow acceleration at degree 8
• Regularise using „strong‟ norm (weighting ~ ℓ5), applied to both flow and flow acceleration
• Data VO + Ground Obs (2000-2010)

© NERC All rights reserved
0
10
20
30
40
50
60
70
1 2 3 4 5 6 7 8 9 10 11 12 13 14
degree
velo
cit
y p
ow
er
0
0.1
0.2
0.3
0.4
0.5
0.6
0.7
1 2 3 4 5 6 7 8
harmonic degree
flo
w a
cc
ele
rati
on
po
we
r
Toroidal flow
Toroidal flow accleration
VO data 2002-7

© NERC All rights reserved
Presented Research in A13.2• Improved modelling techniques for field and SV
• Jackson; Lesur; Whaler
• Data selection methods and treatment• Kelly; Holme
• Understanding of magnetic field processes and implications• Shore; Penequec‟h; Rajaram
• Swarm Mission• Fratter; Haagmans

© NERC All rights reserved
Data selection High Latitude: Ovation auroral model
• Many existing models exclude all data at dip latitudes > either |50 | or |60 |• Use of Ovation may allow more data to be included whilst still avoiding the
“noisy” auroral region
Residuals between CHAMP and CHAOS-2 for 11/12 Dec 2001 in Geomagnetic coordinates ( component)
G. Kelly: Univ. of Liverpool

© NERC All rights reserved
Data selection: Standard deviation approach
• A single orbit for 8th Sept 2001 (CHAMP-CHAOS2)
• Dark green line is data selected with Ovation
• Red line (plotted with an offset) data that would be selected using standard deviation.
• Improved data selection gives more representative field models at high latitudes

© NERC All rights reserved
Data selection Mid-latitudes: Removing along-track noiseProblem:• Mid and low latitude data still show along-
track structure in residuals• Unmodelled external (and induced) field still
dominant error source
Solution:• Calculate initial field model from decimated
data set. Use track residuals from model to estimate contamination from large-scale field signal
• Model this contamination with simple low-degree field model.
• Remodel from decimated data set downweighting data in direction of contamination
R. Holme: Univ. of Liverpool

© NERC All rights reserved
Data selection Mid-latitudes: Correlation & Detrending
• Substantial remaining correlated residual
• Large Y component difficult to model deterministically
• RMS of tracks order ~4nT• After detrending, residual
of order: ~1nT
• Applications to:• Short wavelength field• Secular variation

© NERC All rights reserved
Presented Research in A13.2• Improved modelling techniques for field and SV
• Jackson; Lesur; Whaler
• Data selection methods and treatment• Kelly; Holme
• Understanding of magnetic field processes and implications• Shore; Penequec‟h; Rajaram
• Swarm Mission• Fratter; Haagmans
© NERC All rights reserved
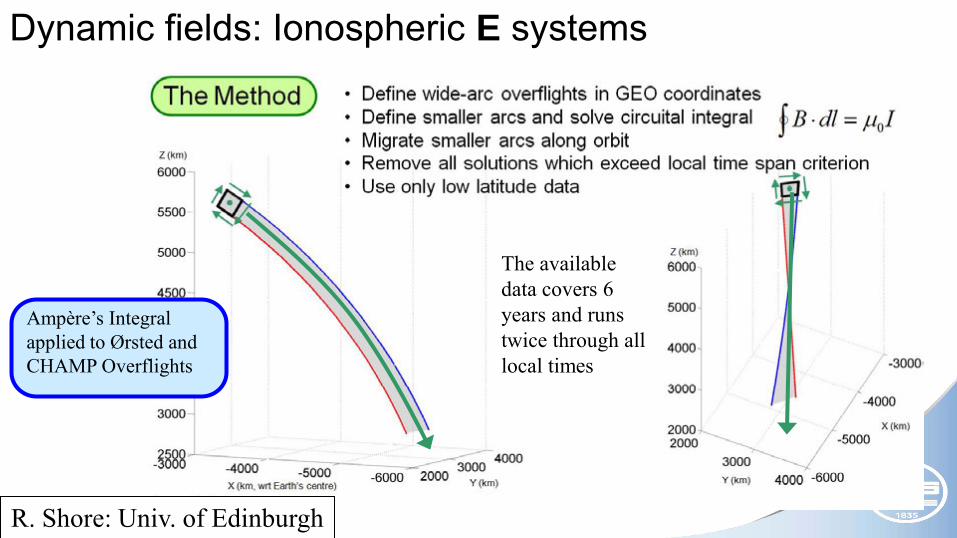
Ampère’s Integral applied to Ørsted and CHAMP Overflights
The available data covers 6 years and runs twice through all local times
Dynamic fields: Ionospheric E systems
R. Shore: Univ. of Edinburgh

© NERC All rights reserved
• Strong ionospheric current flow patterns resolved at a range of altitudes between the satellites Ørsted and CHAMP, throughout the span of local times
• Flow directions are systematic in local time or altitude, or both
Summary of main results
• Gravity and pressure-driven currents both appear to affect solution
• Method should be suitable for use with ESA’s Swarm constellation – lessening impact of ionospheric current flow on potential field models
© NERC All rights reserved
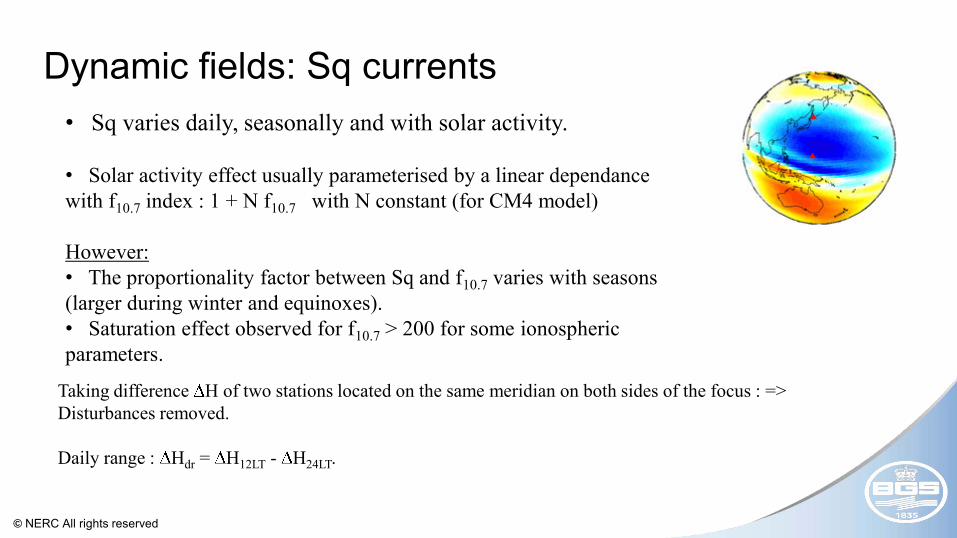
Dynamic fields: Sq currents• Sq varies daily, seasonally and with solar activity.
• Solar activity effect usually parameterised by a linear dependance with f10.7 index : 1 + N f10.7 with N constant (for CM4 model)
However:• The proportionality factor between Sq and f10.7 varies with seasons (larger during winter and equinoxes).• Saturation effect observed for f10.7 > 200 for some ionospheric parameters.
Taking difference H of two stations located on the same meridian on both sides of the focus : => Disturbances removed.
Daily range : Hdr = H12LT - H24LT.

© NERC All rights reserved
vs. f10.7Hdr
=> For each month : Hdr = af10.7 + b
GUA - MMB
BNG - HER
Athough reduced, a seasonal variation is still visible after removal of the magnetospheric part of the
POMME model (Maus, 2006)
GUA-MMB real dataGUA-MMB real data - POMME BNG-HER real dataBNG-HER real data - POMME
a/b ratio -> N : b parameter:

© NERC All rights reserved
Heat Flow in India
MF5 Lithospheric Model from CHAMP Lithospheric Crustal Thickness (km)

© NERC All rights reserved
Heat flow including crustal heat production
Depth to the bottom of the magnetic crust lies above the Moho depth - could represent a thermal boundary rather than a petrological or compositional boundary

© NERC All rights reserved
Presented Research in A13.2• Improved modelling techniques for field and SV
• Jackson; Lesur; Whaler
• Data selection methods and treatment• Kelly; Holme
• Understanding of magnetic field processes and implications• Shore; Penequec‟h; Rajaram
• Swarm Mission• Fratter; Haagmans

© NERC All rights reserved
Each Single satellite: Magnetic field magnitude and vector components Electric field vector components Electron density, Ion/Electron Temp. Air drag Position, attitude and time
1st dedicated Earth Observation Constellation 3 satellites:
2 side-by-side in low orbit1 in higher orbit
three orbital planes with two different near-polar inclinations (global coverage)
Launch July 2012: 4 years operations(Potential overlap with Cluster)
Swarm: ESA’s Magnetic Field Mission

© NERC All rights reserved
Objectives: the Earth
Studies of core dynamics, geodynamo processes, and core-mantle interaction, (SV to degree 16-18)
Mapping of the lithospheric magnetisation and its geological interpretation, (to degree 133-150)
Determination of the 3-D electrical conductivity of the mantle (new complementing seismology and gravity)
Identifying the ocean circulation by its magnetic signature
Sun’s influence withinEarth system
Unique view “inside” the Earth from space for
core, mantle & crust
Expected Cal/Val Announcement of Opportunity summer 2011 (app. 1 year before launch) www.esa.int/esaLP/LPswarm.html
Objectives: near-Earth EM Environment Investigation of electric currents flowing in the
magnetosphere and ionosphere, (e.g. Field aligned currents)
Quantifying the magnetic forcing of the upper atmosphere (air density and winds)

© NERC All rights reserved
Absolute Scalar Magnetometer (ASM)
• Built by CNES / LETI (France)• New technology :
• Optical pumping of 4He with careful control of the heading errors
• Reduced susceptibility to magnetic gradients and to radiated H fields in the low frequency range
• Improved performances with significant gains :
• New vector capacity :
• Synchronous absolute scalar and vectorialmeasurements are continuously delivered by the same instrument : a world première
• Implemented on Swarm on an experimental basis

© NERC All rights reserved
Performance
• Scalar absolute accuracy :
• 32.5 pT @ 65 μT (Instrument error)• < 45 pT@ 65 μT (All errors)
• Stability :• demonstrated below 20 pT on a 15 days
period @ 65 μT (All errors)• Vector mode:
• Expected performance :• Absolute accuracy ≤ 1 nT @ 50 μT
• Experimental mode, data not distributed by ESA : (let ESA know your interest)
• Six Flight Models delivered to ESA
• Best scalar precision and accuracy ever attained in space similar performances all along the orbit same point / same time vectorial measurements capability
• In progress:
Integration / tests on the 3 satellitesCharacterisation / improvement of the vectorial performance
Status:

© NERC All rights reserved
Decade of Geopotential Research: Part Deux?
• Swarm (2012 – 2016 + extension)
• Swarm Follow-on (2019 - ?)
• Other opportunities?• Space weather
• Public interest too?

© NERC All rights reserved
User applications...
Orientation of maps on smartphones using digital compass and magnetic
declination model
‘Augmented reality’e.g. Google Sky or
Lonely Planet travel guides

© NERC All rights reserved
Thank You