report unstable areas demonstration...october 9, 2018 1779126b 1 1.0 introduction 1.1 background...
TRANSCRIPT

REPORT
Unstable Areas Demonstration Nucla Station Ash Disposal Facility
Submitted to:
Tri-State Generation and Transmission Association, Inc. 1100 West 116th Avenue, Westminster, Colorado 80234
Submitted by:
Golder Associates Inc. 44 Union Boulevard, Suite 300 Lakewood, Colorado 80228
+1 303 980-0540
1779126B
October 9, 2018

October 9, 2018 1779126B
i
Table of Contents
1.0 INTRODUCTION ............................................................................................................................................. 1
1.1 Background .......................................................................................................................................... 1
1.2 Facility Information ............................................................................................................................... 1
2.0 UNSTABLE AREA ASSESSMENT ................................................................................................................ 1
2.1 Requirements ....................................................................................................................................... 1
2.2 Review of Available Information ........................................................................................................... 1
2.3 Geotechnical and Geologic Information ............................................................................................... 2
2.4 Findings ................................................................................................................................................ 3
3.0 CONCLUSION ................................................................................................................................................ 4
4.0 REFERENCES ................................................................................................................................................ 5
FIGURE
FIGURE 1 QUATERNARY FAULTS AND KARST FEATURES IN PROXIMITY TO NUCLA CCR FACILITY
APPENDICES
APPENDIX A Global Slope Stability Calculations

October 9, 2018 1779126B
1
1.0 INTRODUCTION
1.1 Background Golder Associates Inc. (Golder) has prepared this report for Tri-State Generation and Transmission Association,
Inc. (Tri-State) to summarize our assessment of Tri-State’s Nucla Station Ash Disposal Facility (the Facility) with
respect to factors that could cause an area to be considered an unstable area, and to provide supporting
information demonstrating that the Facility is not located in an unstable area. This report includes written
certification by a qualified professional engineer registered in Colorado stating that the Facility is not located in an
unstable area and is in compliance with 40 CFR 257.64.
1.2 Facility Information The Facility is located in Montrose County, approximately 5.5 miles southeast of Nucla, Colorado. It serves as the
location for final deposition of coal combustion residuals (CCRs or ash) generated at Tri-State’s Nucla Station, a
110-megawatt, coal-fired electric generation plant located near Nucla, Colorado, and classifies as an existing
CCR landfill under 40 CFR 257.
2.0 UNSTABLE AREA ASSESSMENT
2.1 Requirements An unstable area is defined under 40 CFR 257.53 as follows:
Unstable area means a location that is susceptible to natural or human-induced events or forces capable of
impairing the integrity, including structural components of some or all of the CCR unit that are responsible for
preventing releases from such unit. Unstable areas can include poor foundation conditions, areas
susceptible to mass movements, and karst terrains.
Under 40 CFR 257.64(b), the following factors, at a minimum, must be considered as part of the assessment to
determine whether the Facility is located in an unstable area:
On-site or local soil conditions that may result in significant differential settling
On-site or local geologic or geomorphologic features
On-site or local human-made features or events (both surface and subsurface)
2.2 Review of Available Information Golder reviewed the following information in the course of completing the unstable area assessment:
Engineering design and operations report for ash disposal on the initial 40-acre landfill footprint (Colorado-
Ute Electric Association, Inc. 1987)
Hydrogeologic investigation report for ash disposal on the initial 40-acre landfill footprint (Western Colorado
Testing, Inc., and J.F.T. Agapito & Associates, Inc. 1987)
Design and operations report for ash disposal on a 40-acre lateral expansion footprint (GeoTrans Inc. 2002)
Landslides dataset for Colorado (Colorado Geological Survey, Colorado Landslide Inventory)

October 9, 2018 1779126B
2
Quaternary faults and folds dataset for the United States (United States Geological Survey and Colorado
Geological Survey 2006)
Karst dataset for the United States (Weary and Doctor 2014)
Report documenting the final cover system in place over approximately 22 acres of the Facility (Golder 2015)
2015 annual inspection report for the Facility (Golder 2016)
2016 annual inspection report for the Facility (Golder 2017a)
Addenda to the design and operations report for the Facility (Golder 2017b)
Geologic and hydrogeologic site characterization report for the Facility (Golder 2017c)
Groundwater monitoring system certification for the Facility (Golder 2017d)
2017 annual inspection report for the Facility (Golder 2018)
Historical mine boundaries dataset (United States Geological Survey, Mineral Resources Data System)
In addition to the review of available information, the professional engineer overseeing the unstable area
assessment has visited and observed the Facility on several occasions, including the site visits associated with
annual inspections conducted for compliance with 40 CFR 257.84(b)(1) in 2015, 2016, and 2017, and has visually
assessed the factors that could cause the area within and in close proximity to the Facility to be considered an
unstable area.
2.3 Geotechnical and Geologic Information The site is located within the Paradox Basin, which is an area of the Colorado Plateau that is underlain by a
sequence of Pennsylvanian-age evaporites dominated by halite bedding (Masbruch and Shope 2014). The
geology of the Paradox Basin is controlled by the Uncompahgre Uplift (Plateau) to the north, the San Juan
Volcanic Region to the east, and the Salt Anticlines to the southwest (Hanna and Gandera 2000). The topography
of the Paradox Basin is mostly composed of high plateaus with canyons, washes, and dry streambeds.
Subsurface soil and rock conditions encountered at the site can be categorized into the following general strata,
presented in sequential order beginning at the ground surface (Golder 2017c):
Stratum 1 – Regolith (i.e., unconsolidated material) accumulations of sandy lean clay and clayey sand, 0 to
15 feet thick, primarily derived from weathering of the underlying Dakota Sandstone and depositional
processes
Stratum 2 – Dakota Sandstone, 0 to 110 feet thick, an Upper Cretaceous coastal plain deposit primarily
composed of sandstone and conglomerate with interbedded mudstone, carbonaceous shale, coal, and
claystone (Masbruch and Shope 2014) that is largely absent on the western edge of the site
Stratum 3 – Burro Canyon Formation, 90 to 210 feet thick, a Lower Cretaceous fluvial and floodplain deposit
primarily composed of sandstone and conglomerate with interbedded siltstone, shale, and mudstone (Lowe
et al. 2007, Masbruch and Shope 2014)
Stratum 4 – Morrison Formation, at least 355 feet thick, an Upper Jurassic unit comprising the Brushy Basin
Member, composed of variegated mudstone, claystone, and siltstone with discontinuous lenses of

October 9, 2018 1779126B
3
conglomerate and sandstone, and the Salt Wash Member, composed of a fine- to medium-grained fluvial
sandstone with discontinuous interbedded conglomeratic sandstone and mudstone (Freethey and Cordy
1991, Lowe et al. 2007, Masbruch and Shope 2014)
Five major field programs have been carried out during the history of the Facility for characterization of
geotechnical and geologic conditions beneath and around the Facility. In 1987, the first drilling program was
performed within the northern half of the site to assess its suitability for construction of an ash landfill (Western
Colorado Testing, Inc., and J.F.T. Agapito & Associates, Inc. 1987). To characterize the site geology, one
corehole and one drillhole were drilled to depths of 250 feet below ground surface (ft bgs) and 305 ft bgs,
respectively. In 1988, four boreholes were drilled to a depth of 50 ft bgs (GeoTrans Inc. 2002). In 2001, three
boreholes were drilled to a depth of 50 ft bgs and three more boreholes were drilled to depth of 10 ft bgs. This
investigation was in support of the engineering design for expansion of the Facility onto the southern half of the
site (Geo-Trans Inc. 2002). In 2015, five boreholes were drilled to depths ranging from 97 ft bgs to 240 ft bgs for
further characterization of site hydrogeology focused on the Burro Canyon Formation (Golder 2017c). In 2016,
six boreholes were drilled to depths ranging from 404 ft bgs to 565 ft bgs for further characterization of site
hydrogeology focused on the Morrison Formation and installation of groundwater monitoring wells for compliance
with 40 CFR 257 (Golder 2017d).
2.4 Findings Golder’s review of available information and knowledge of the Facility indicate the following with respect to factors
that could cause an area to be considered an unstable area:
On-site or local soil conditions that may result in significant differential settling
The thickness of unconsolidated material (soil) at the site prior to construction of the Facility is limited,
ranging from 0 to 15 feet (Golder 2017c).
The unconsolidated material found at the site consists primarily of soils characterized as clayey sand,
sandy lean clay, or silty sand (Golder 2015). The plasticity index for the soils found at the site is generally
less than 20 (Golder 2015). Soils having these characteristics are not commonly prone to high
compressibility.
For purposes of accumulating soil for Facility construction and closure, Tri-State excavated and
stockpiled much or all of the unconsolidated material before constructing or expanding the Facility
footprint into a given area. Thus, the Facility is primarily founded directly on rock.
The Facility is at its full design height across the majority of its footprint, and no evidence of differential
settlement has been observed at the Facility during annual inspections by a qualified professional
engineer (Golder 2016, Golder 2017a, Golder 2018).
Given the limited thickness of unconsolidated material (or more commonly the absence of
unconsolidated material) beneath the Facility, the characteristics of the unconsolidated material (i.e., not
commonly prone to high compressibility), and site observations, Golder concludes that there are not on-
site or local soil conditions that may result in significant differential settling.

October 9, 2018 1779126B
4
On-site or local geologic or geomorphologic features
The Facility is not located in an area with geological conditions that create the potential for karst terrain
or features, as shown in Figure 1.
The Facility is not located in an area with known faults or folds that demonstrate geological evidence of
coseismic surface deformation during the Quaternary Period, as shown in Figure 1.
The Facility is not located in an area with landslide potential, as shown in Figure 1.
The northeast corner of the Facility lies atop a northwest-trending ridge, and site topography generally
slopes south and west towards the southwest corner. The Facility is higher in elevation than the
surrounding topography around its full perimeter. As such, the Facility is not susceptible to instability
related to mass movement (e.g., landslides, avalanches, debris flows, solifluction, block sliding, or rock
fall) from adjacent areas.
No evidence of faulting, rock fall, landslides, or local soil conditions that are conducive to downslope
movement of soil, rock, or debris have been observed at the Facility during annual inspections by a
qualified professional engineer (Golder 2016, Golder 2017a, Golder 2018).
On-site or local human-made features or events (both surface and subsurface)
There are no known historical mine workings at the site, as shown on Figure 1. Geotechnical
investigations at the site have not identified coal seams or other subsurface resources of sufficient
thickness to have motivated mining at the site.
Slope stability analyses for the Facility indicate a factor of safety equal to 1.5 for static conditions and a
factor of safety equal to 1.1 under design seismic loading (Golder 2017b). The associated critical slip
surfaces are limited to the cover soils (shallow depth) and do not pass into the ash or rock underlying the
Facility. The slope stability analyses for the Facility are summarized in Appendix A.
The Facility is the only human-made structure or permanent feature on the site. As such, no human-
made features having the potential to create unstable conditions have been observed at the Facility
during annual inspections by a qualified professional engineer (Golder 2016, Golder 2017a, Golder
2018).
3.0 CONCLUSION Based upon the assessment described in this report, the undersigned professional engineer registered in
Colorado certifies that the Nucla Station Ash Disposal Facility is not located in an unstable area and is in
compliance with 40 CFR 257.64.

October 9, 2018 1779126B
5
4.0 REFERENCES Colorado-Ute Electric Association, Inc. (1987). Nucla Station Fly Ash, Bottom Ash, Slag and Flue Gas Emission
Control Waste Disposal Facility – Engineering Design and Operations Report. February 1987.
Colorado Geological Survey. Colorado Landslide Inventory. Available online:
http://coloradogeologicalsurvey.org/geologic-hazards/landslides/colorado-landslide-inventory/. Accessed
September 12, 2018.
Freethey, G.W., and G.E. Cordy (1991). Geohydrology of Mesozoic rocks in the Upper Colorado River Basin in
Arizona, Colorado, New Mexico, Utah, and Wyoming, excluding the San Juan Basin. U.S. Geological Survey
Professional Paper 1411–C. Available online: http://pubs.er.usgs.gov/publication/pp1411C. Accessed
September 13, 2018.
GeoTrans Inc. (2002). Design and Operations Report, Nucla, Colorado Ash Disposal Facility. Report prepared for
Tri-State Generation and Transmission Association, Inc. March 2002.
Golder Associates Inc. (2015). Final Cover Verification Program. Report prepared for Tri-State Generation and
Transmission Association, Inc. Project number 103-81938. September 10, 2015.
Golder Associates Inc. (2016). Coal Combustion Residuals Landfill Annual Inspection Report. Report prepared for
Tri-State Generation and Transmission Association, Inc. Project number 103-81938. January 18, 2016.
Golder Associates Inc. (2017a). Coal Combustion Residuals Landfill Annual Inspection Report. Report prepared
for Tri-State Generation and Transmission Association, Inc. Project number 1657746. January 16, 2017.
Golder Associates Inc. (2017b). Design & Operations Report Addenda. Report prepared for Tri-State Generation
and Transmission Association, Inc. Project number 103-81938. April 11, 2017.
Golder Associates Inc. (2017c). Site Characterization Report. Report prepared for Tri-State Generation and
Transmission Association, Inc. Project number 153893416B. June 21, 2017.
Golder Associates Inc. (2017d). Coal Combustion Residuals Landfill Groundwater Monitoring System
Certification. Report prepared for Tri-State Generation and Transmission Association, Inc. Project number
1779126B. October 16, 2017.
Golder Associates Inc. (2018). Coal Combustion Residuals Landfill Annual Inspection Report. Report prepared for
Tri-State Generation and Transmission Association, Inc. Project number 1779126B. January 12, 2018.
Hanna, T.M., and W. Gandera (2000). Paradox Basin, in Aiken and others, eds., Colorado Ground-water Atlas.
Colorado Ground-Water Association.
Lowe, M., J. Wallace, S.M. Kirby, and C.E. Bishop (2007). The Hydrogeology of Moab-Spanish Valley, Grand and
San Juan Counties, Utah, with Emphasis on Maps for Water-Resource Management and Land-Use Planning.
Utah Geological Survey Special Study 120.
Masbruch, M.D., and C.L. Shope (2014). Groundwater and Surface-Water Resources in the Bureau of Land
Management Moab Master Leasing Plan Area and Adjacent Areas, Grand and San Juan Counties, Utah, and
Mesa and Montrose Counties, Colorado. United States Geological Survey Open-File Report 2014-1062. Available
online: https://pubs.usgs.gov/of/2014/1062/pdf/ofr2014-1062.pdf.

October 9, 2018 1779126B
6
United States Geological Survey. Mineral Resources Data System: Historic Mine Boundaries. Available online:
http://mining.state.co.us/Reports/Documents/Historic_Mine.zip. Accessed September 12, 2018.
United States Geological Survey and Colorado Geological Survey (2006). Quaternary Fault and Fold Database
for the United States. Available online: http://earthquake.usgs.gov/hazards/qfaults. Accessed September 12,
2018.
Weary, D.J., and D.H. Doctor (2014). Karst in the United States: A Digital Map Compilation and Database. United
States Geological Survey Open-File Report 2014-1156. Available online:
https://pubs.usgs.gov/of/2014/1156/pdf/of2014-1156.pdf. Accessed September 12, 2018.
Western Colorado Testing, Inc., and J.F.T. Agapito & Associates, Inc. (1987). Final Report - Geological and
Geohydrological Evaluation of Dry Storage Site, Nucla CFB Demonstration Project. Report prepared for Colorado-
Ute Electric Association, Inc. July 1987.

Figure

CLIENT
TRI-STATE GENERATION AND TRANSMISSION ASSOCIATION, INC.
PROJECT
UNSTABLE AREAS DEMONSTRATION
TITLE
QUATERNARY FAULTS AND KARST FEATURESIN PROXIMITY TO NUCLA CCR FACILITY
1 in
0PA
TH
: M
:\T
riS
tate
\Nu
cla
\Arc
Ma
p\2
01
8_
Un
sta
ble
Are
as\
11x1
7_
17
79
12
6B
_N
ucl
aF
au
lts&
Ka
rst_
v2.m
xd
P
RIN
TE
D O
N:
20
18
-09
-14
AT
: 1
0:1
7:3
7 A
M
IF T
HIS
ME
AS
UR
EM
EN
T D
OE
S N
OT
MA
TC
H W
HA
T I
S S
HO
WN
, T
HE
SH
EE
T S
IZE
HA
S B
EE
N M
OD
IFIE
D F
RO
M: A
NS
I B
1. KARST DATASET: DIGITAL ENGINEERING ASPECTS OF KARST MAP : A GIS VERSION OFDAVIES, W.E., SIMPSON, J.H., OHLMACHER, G.C., KIRK, W.S., AND NEWTON, E.G., 1984,ENGINEERING ASPECTS OF KARST:U.S. GEOLOGICAL SURVEY, NATIONAL ATLAS OF THE UNITED STATES OF AMERICA, SCALE1:7,500,000BY BRET D. TOBIN AND DAVID J. WEARYU.S. GEOLOGICAL SURVEY OPEN-FILE REPORT 2004-13522. QUATERNARY FAULTS DATASET: U.S. GEOLOGICAL SURVEY AND COLORADO GEOLOGICALSURVEY, 2006, QUATERNARY FAULT AND FOLD DATABASE FOR THE UNITED STATES,ACCESSED SEPTEMBER 2018, FROM USGS WEB SITE:HTTP//EARTHQUAKE.USGS.GOV/HAZARDS/QFAULTS/.3. HISTORICAL MINE BOUNDARIES DATASET: MINERAL RESOURCES DATA SYSTEM (MRDS),UNITED STATES GEOLOGICAL SURVEY (USGS).4. LANDSLIDES DATASET: COLORADO GEOLOGICAL SURVEY, 2004.5. BASEMAP: ESRI, BING MAPS, MICROSOFT CORPORATION.
REFERENCES
1779126B 1
2018-09-14
KJC
KJC
JEO
TJS
CONSULTANT
PROJECT NO. FIGURE
YYYY-MM-DD
DESIGNED
PREPARED
REVIEWED
APPROVED
LEGEND
SITE LOCATION
10-MILE RADIUS FROM SITE
25-MILE RADIUS FROM SITE
QUATERNARY FAULT
HISTORICAL MINE BOUNDARIES (NONE WITHIN MAPEXTENTS)
AREA WITH POTENTIAL FOR LANDSLIDES
KARST TYPEFISSURES, TUBES AND CAVES GENERALLY LESS THAN1,000 FT (300 M) LONG; 50 FT (15 M) OR LESS VERTICALEXTENT; IN GENTLY DIPPING TO FLAT-LYING BEDS OFGYPSUM
FISSURES, TUBES AND CAVES GENERALLY LESS THAN1,000 FT (300 M) LONG; 50 FT (15 M) OR LESS VERTICALEXTENT; IN MODERATELY TO STEEPLY DIPPING BEDS OFCARBONATE ROCK
KEY MAP
0 5 102.5Miles

APPENDIX A
Global Slope Stability Calculations

CALCULATIONS
i:\10\81938\0700\adda-slopestabcalc_fnl-09mar17\10381938 addenduma slopestabilityanalysis_fnl-09mar17.docx
Golder Associates Inc. 44 Union Boulevard, Suite 300 Lakewood, Colorado 80228
Tel: (303) 980-0540 Fax: (303) 985-2080 www.golder.com
Golder Associates: Operations in Africa, Asia, Australasia, Europe, North America and South America
Golder, Golder Associates and the GA globe design are trademarks of Golder Associates Corporation
1.0 OBJECTIVE
Evaluate the global slope stability of the Nucla Station Ash Disposal Facility (landfill) at
final closure. The analysis assesses the stability of the landfill using the existing
sideslope grades in areas that have already been constructed and closure grades
consistent with the Design and Operations Report above the constructed areas.
2.0 METHODOLOGY
Two cross sections were selected for global slope stability analyses. Limit equilibrium
slope stability analyses were performed using Spencer’s method in Slide 7.0, a
two-dimensional slope stability modeling software platform (Rocscience 2017).
Spencer’s method considers both moment and force equilibrium. It is common
geotechnical practice to analyze the stability of embankment slopes using limit
equilibrium methods.
Two sets of analyses were conducted to evaluate different slip surface depth ranges for
each cross section. The first set of analyses focused on shallow circular slip surfaces
within the soil material used in the construction of the starter berms and containment
berms (dikes). This material typically classifies as lean clay and also serves as final
cover material for the landfill sideslopes. Movement along the shallow slip surfaces
(minimum slip surface depth of 3 feet) considered in the first set of analyses would
result in minor sloughing with limited or no financial or environmental consequence.
The second set of analyses focused on deeper circular slip surfaces that pass into the
comingled fly ash and bottom ash contained in the landfill. Since the comingled ash is
stronger than the lean clay, a minimum slip surface depth of 15 feet was used to force
Date: March 9, 2017 Made by: ALB
Project No.: 103-81938 Checked by: JEO
Site Name: Nucla Station Ash Disposal Facility Reviewed by: JEO
Subject: GLOBAL SLOPE STABILITY ANALYSIS

CALCULATIONS Page 2 of 5 Project No.: 103-81938 Made by: ALB Site Name: Nucla Station Ash Disposal Facility Checked by: JEO Date: March 9, 2017 Reviewed by: JEO
i:\10\81938\0700\adda-slopestabcalc_fnl-09mar17\10381938 addenduma slopestabilityanalysis_fnl-09mar17.docx
slip surfaces into the comingled ash. The slope stability analyses were performed to
evaluate the minimum factors of safety under static and seismic loading conditions.
2.1 Geometry
Two cross sections were selected to represent critical slope configurations
corresponding to: 1) the steepest bedrock topography dipping toward the toe of the
embankment, and 2) the longest embankment slope at final closure. A plan view with
the cross section locations is included as Figure A-1 and illustrates:
South Section: Cross section through the south embankment, representing the highest waste grades and some of the steepest bedrock slopes dipping north to south.
West Section: Cross section through the west embankment, representing one of the longest slopes.
2.2 Analysis
The slope stability analyses were predicated on the following assumptions:
Factors of safety were computed using Spencer’s method (Spencer 1967).
The critical slip surface was assumed to be circular, since there are no geosynthetics or known planes of geologic weakness underlying the landfill.
The United States Geological Survey (USGS) seismic hazard analysis indicates a 2% probability of exceeding a peak ground acceleration (PGA) of 0.12 g in 50 years (see Attachment A-1). Pseudo-static analyses were conducted using a horizontal seismic coefficient of 0.06, corresponding to half of the PGA, in accordance with the recommendations of Hynes-Griffin and Franklin (1984).
Strength properties for lean clay were selected based on the results of consolidated-undrained triaxial testing performed on soil sampled from a stockpile that serves as a borrow source for containment berm construction (refer to Attachment A-2).
Lean clay was assumed to exhibit drained strengths under static loading and undrained strengths under seismic loading. A 20% reduction was applied to lean clay undrained strengths in the seismic analyses, as recommended by Hynes-Griffin and Franklin (1984).

CALCULATIONS Page 3 of 5 Project No.: 103-81938 Made by: ALB Site Name: Nucla Station Ash Disposal Facility Checked by: JEO Date: March 9, 2017 Reviewed by: JEO
i:\10\81938\0700\adda-slopestabcalc_fnl-09mar17\10381938 addenduma slopestabilityanalysis_fnl-09mar17.docx
Lean clay density was selected based on the average of 30 in situ density measurements in containment berms at the landfill.
The bedrock underlying the fly ash was assumed to have infinite strength, constraining slip surfaces to the comingled ash and lean clay.
Strength properties for comingled ash were selected based on the results of drained direct shear testing performed on comingled ash sampled from the landfill (refer to Attachment A-3). Comingled ash was assumed to exhibit drained strengths under static and seismic loading conditions.
Comingled ash density was based on an average in-place dry unit weight of 64.9 pounds per cubic foot (pcf), as provided by Tri-State Generation and Transmission Association, Inc., and a typical moisture content of 15%.
Comingled ash was assumed to be unsaturated.
2.3 Material Properties
A summary of material properties used in the slope stability analyses is presented in
Table A-1:
Table A-1: Material Properties
Condition Material Total Unit
Weight (pcf)Strength
Type Friction Angle (°)
Cohesion (psf)
Static Loading Bedrock 120.0
Infinite Strength
-- -- Seismic Loading
Static Loading Comingled Ash
74.6 Shear-Normal
Function1 -- --
Seismic Loading
Static Loading Lean Clay 109.0
Mohr-Coulomb
22 90
Seismic Loading Shear-Normal
Function2 -- --
Notes: 1). The shear-normal function defining the drained strength of comingled ash is based
on the results of drained direct shear testing as follows: shear strength of 450 pounds per square foot (psf) under zero normal stress; shear strength of 6,975 psf under 7,200-psf normal stress; shear strength of 13,072 psf under 14,400-psf normal stress; shear strength of 19,763 psf under 21,600-psf normal stress.
2). The shear-normal function defining the undrained strength of lean clay is based on the results of consolidated-undrained triaxial testing, with a 20% reduction for cyclic

CALCULATIONS Page 4 of 5 Project No.: 103-81938 Made by: ALB Site Name: Nucla Station Ash Disposal Facility Checked by: JEO Date: March 9, 2017 Reviewed by: JEO
i:\10\81938\0700\adda-slopestabcalc_fnl-09mar17\10381938 addenduma slopestabilityanalysis_fnl-09mar17.docx
loading, as follows: shear strength of 72 psf under zero initial effective stress; shear strength of 219 psf under 360-psf initial effective stress; shear strength of 218 psf under 720-psf initial effective stress; shear strength of 346 psf under 1,440-psf initial effective stress.
3.0 RESULTS AND CONCLUSIONS
Results of the slope stability analyses are summarized in Table A-2. The results are
also illustrated graphically on the figures in Attachment A-4. The figures depict the
critical slip surfaces and computed minimum factors of safety for the analyzed
scenarios.
Table A-2: Summary of Analyses and Computed Minimum Factors of Safety
Section Shallow (Containment
Berms) Deeper (Comingled Ash)
Static Seismic Static Seismic
South Section 1.8 1.4 3.5 2.8
West Section 1.5 1.1 2.9 2.4
Based on the factors of safety computed using the methods and assumptions described
herein, the landfill is expected to remain stable with an acceptable safety margin.
Factors of safety of 1.5 or greater were computed for critical slip surfaces through the
containment berms under static loading. Factors of safety of 2.9 or greater were
computed for critical slip surfaces through comingled ash under static loading. Factors
of safety of 1.1 or greater were computed for critical slip surfaces through the
containment berms under seismic loading. Factors of safety of 2.4 or greater were
computed for critical slip surfaces through comingled ash under seismic loading. The
critical slip surfaces for the south section and the west section were shallow, passing
only through the containment berms, and would not be expected to affect the global
slope stability of the landfill.

CALCULATIONS Page 5 of 5 Project No.: 103-81938 Made by: ALB Site Name: Nucla Station Ash Disposal Facility Checked by: JEO Date: March 9, 2017 Reviewed by: JEO
i:\10\81938\0700\adda-slopestabcalc_fnl-09mar17\10381938 addenduma slopestabilityanalysis_fnl-09mar17.docx
4.0 REFERENCES
Hynes-Griffin, M. and A. Franklin. 1984. Rationalizing the Seismic Coefficient Method. Miscellaneous Paper GL-84-13. US Army Engineer Waterways Experiment Station, Vicksburg, MS.
RocScience. 2017. Slide Version 7.022. Build date: January 19. 2017.
Spencer, E. 1967. A Method of Analysis of the Stability of Embankments Assuming Parallel Inter-Slice Forces. Geotechnique, Vol. XVII, No. 1, pp. 11–26.
United States Geological Survey (USGS). 2014. PGA with 2% probability of exceedance in 50 years, USGS map, 2014 rev. Available online: http://earthquake.usgs.gov/hazards/products/conterminous/2014/2014pga2pct.pdf accessed July 27, 2015.

FIGURE

5880
58905900
59105920
5930594059505960
5970
5940
5950
5960
5970
585058605870588058905900591059205930
59405950
5960
5 200 N5 200 N
4 400 E 4 400 E
5 00
0 N
5 00
0 N
4 80
0 N
4 80
0 N
4 60
0 N
4 60
0 N
4 40
0 N
4 40
0 N
4 20
0 N
4 20
0 N
4 00
0 N
4 00
0 N
5 40
0 N
5 40
0 N
5 60
0 N
5 60
0 N
5 80
0 N
5 80
0 N
6 00
0 N
6 00
0 N
6 20
0 N
6 20
0 N
4 600 E 4 600 E
4 800 E 4 800 E
5 000 E 5 000 E
4 200 E 4 200 E
4 000 E 4 000 E
3 800 E 3 800 E
5900 5925
5950
5950
5875
5960
59805970
5950
5975
5960
5970
5980
5900
5875
S
01
in
103-81938FIGURE
A-1A
2017-03-08
MBR
MBR
ALB
JEO
NUCLA STATIONASH DISPOSAL FACILITY
TRI-STATE GENERATION AND TRANSMISSIONASSOCIATION, INC.
SLOPE STABILITY SECTION LOCATIONSTITLE
PROJECT NO. REV.
PROJECTCLIENT
CONSULTANT
PREPARED
DESIGNED
REVIEWED
APPROVED
YYYY-MM-DD
Path
: \\D
enve
r.gol
der.g
ds\a
cad\
10\1
03-8
1938
\CIV
IL 3
D\C
ALC
S\ |
File
Nam
e: S
tabi
lity
Sect
ion
Loca
tions
1.dw
g
IF T
HIS
MEA
SUR
EMEN
T D
OES
NO
T M
ATC
H W
HAT
IS S
HO
WN
, TH
E SH
EET
SIZE
HAS
BEE
N M
OD
IFIE
D F
RO
M: A
NSI
D
LEGEND
EXISTING GROUND TOPOGRAPHY (REFERENCE 1)
PROPOSED GROUND TOPOGRAPHY
APPROXIMATE LIMITS OF ASH
175
175
0
FEET
80 160
SCALE
TOP OF BEDROCK TOPOGRAPHY (REFERENCE 2)
1. EXISTING SITE TOPOGRAPHY WAS PROVIDED BY TRI-STATEGENERATION AND TRANSMISSION ASSOCIATION, INC.TOPOGRAPHY IS A COMPOSITE BASED ON SURVEYSPERFORMED BY DEL-MONT CONSULTANTS BETWEEN 2008 AND2015.
2. TOP OF BEDROCK TOPOGRAPHY WAS TAKEN FROM UNITEDSTATES GEOLOGICAL SURVEY DATA FOR THE AREA FROM 1964.
NOTES
175
W

ATTACHMENT A-1

SITE LOCATION
IF T
HIS
MEA
SUR
EMEN
T D
OES
NO
T M
ATC
H W
HAT
IS S
HO
WN
, TH
E SH
EET
SIZE
HAS
BEE
N M
OD
IFIE
D F
RO
M: A
NSI
A
CONSULTANT
DESIGN
PREPARED
REVIEW
APPROVED
YYYY-MM-DD TITLE
PROJECT No. Rev.
PROJECTCLIENT
Path: \\Denver.golder.gds\acad\10\103-81938\CIVIL 3D\CALCS\ | File Name: PGA MAP.dwg
01
in
103-81938ATTACHMENT
A-1A
2017-02-10
ALB
ALB
JEO
JEO
NUCLA STATIONASH DISPOSAL FACILITY
TRI-STATE GENERATION AND TRANSMISSIONASSOCIATION, INC.
TWO PERCENT PROBABILITY OF EXCEEDANCE IN 50 YEARSMAP OF PEAK GROUND ACCELERATION

ATTACHMENT A-2

Boring or Test Pit: -- Boring or Test Pit: -- Boring or Test Pit: --Sample: TP-3A Sample: TP-3A Sample: TP-3A
Depth: -- ft Depth: -- ft Depth: -- ftPoint No.: 1 Point No.: 2 Point No.: 3
Initial Initial InitialLength = 5.765 in Length = 5.765 in Length = 5.765 in
Diameter = 2.863 in Diameter = 2.865 in Diameter = 2.867 inWet Mass = 2.310 lb Wet Mass = 2.308 lb Wet Mass = 2.313 lb
Area = 6.438 in2 Area = 6.447 in2 Area = 6.456 in2
Volume = 37.11 in3 Volume = 37.17 in3 Volume = 37.22 in3
Specific Gravity = 2.66 (ASTM D854) Specific Gravity = 2.66 (ASTM D854) Specific Gravity = 2.66 (ASTM D854)Dry Mass of Solids = 1.934 lb Dry Mass of Solids = 1.933 lb Dry Mass of Solids = 1.940 lb
Moisture Content = 19.4% Moisture Content = 19.4% Moisture Content = 19.2%Wet Unit Weight = 107.5 pcf Wet Unit Weight = 107.3 pcf Wet Unit Weight = 107.4 pcfDry Unit Weight = 90.1 pcf Dry Unit Weight = 89.9 pcf Dry Unit Weight = 90.1 pcf
Void Ratio = 0.84 Void Ratio = 0.84 Void Ratio = 0.84Percent Saturation = 61% Percent Saturation = 61% Percent Saturation = 61%
After Consolidation After Consolidation After ConsolidationLength = 5.661 in Length = 5.664 in Length = 5.571 in
Diameter = 2.781 in Diameter = 2.796 in Diameter = 2.781 inArea = 6.073 in2 (Method B) Area = 6.141 in2 (Method B) Area = 6.074 in2 (Method B)
Volume = 34.38 in3 Volume = 34.78 in3 Volume = 33.84 in3
Moisture Content = 26.5% Moisture Content = 27.3% Moisture Content = 25.3%Wet Unit Weight = 123.0 pcf Wet Unit Weight = 122.2 pcf Wet Unit Weight = 124.1 pcfDry Unit Weight = 97.2 pcf Dry Unit Weight = 96.0 pcf Dry Unit Weight = 99.1 pcf
Void Ratio = 0.70 Void Ratio = 0.73 Void Ratio = 0.67Percent Saturation = 100% Percent Saturation = 100% Percent Saturation = 100%
B Parameter = 0.97 B Parameter = 0.95 B Parameter = 0.96Shear Rate = 0.084% /min. Shear Rate = 0.084% /min. Shear Rate = 0.083% /min.
t50 = 0.3 min. t50 = 1.6 min. t50 = 3.6 min.
Strain at Failure = 0.7% Strain at Failure = 0.9% Strain at Failure = 2.6%
Cell Pressure = 52.5 psi Cell Pressure = 75.0 psi Cell Pressure = 90.0 psiBack Pressure = 50.0 psi Back Pressure = 70.0 psi Back Pressure = 80.0 psi
Confining Pressure = 2.5 psi Confining Pressure = 5.0 psi Confining Pressure = 10.0 psi
Notes: Gravelly lean clay with sand, dark brown, moistAtterberg limits: LL = 40 PL = 20 PI = 20 (ASTM D4318)Percent finer: 3/4 in. = 88% No. 4 = 86% No. 200 = 63% (ASTM D422, refer to separate report for gradation curve)Specimen type: Intact X Reconstituted Remold targets: 89.8 pcf (dry) at 19.5% moistureMoisture from: Cuttings X Entire specimenSaturation method: X Wet DryFailure criterion: (σ'1/σ'3)max X (σ'1-σ'3)max % strain
Membrane effect: X Corrected Not Corrected
Title:
Figure:1TP-3A JEO
Tri-State/Nucla Ash Landfill/CO
SAMPLE AND TEST DATA
Reviewed:7/9/2015
Date:
Job Short Title:
Job Number:103-81938
Technician:RJM
CONSOLIDATED UNDRAINED TRIAXIAL COMPRESSION TEST REPORT
ASTM D4767
Sample:
Golder Associates Inc.
USCS description (ASTM D2487):

Figure:
2JEOTP-3A 103-819387/9/2015RJM
Title:
Reviewed:Sample:
ASTM D4767
Tri-State/Nucla Ash Landfill/CO
CONSOLIDATED UNDRAINED TRIAXIAL COMPRESSION TEST REPORT
q AND EXCESS PORE PRESSURE PLOTSJob Short Title:
Job Number:Date:Technician:
Golder Associates Inc.
0.0
0.5
1.0
1.5
2.0
2.5
3.0
3.5
4.0
0% 2% 4% 6% 8% 10% 12% 14% 16% 18%
q, p
si
Strain
q vs. Strain
2.5 psi
5.0 psi
10.0 psi
0.0
1.0
2.0
3.0
4.0
5.0
6.0
7.0
8.0
0% 2% 4% 6% 8% 10% 12% 14% 16% 18%
Exc
ess
Por
e P
ress
ure
, psi
Strain
Excess Pore Pressure vs. Strain
2.5 psi
5.0 psi
10.0 psi

Figure:
3
Sample:
TP-3A JEO
Reviewed: Job Number:
103-81938
Date:
7/9/2015
Technician:
RJM
Job Short Title:
Tri-State/Nucla Ash Landfill/CO
Title:
CONSOLIDATED UNDRAINED TRIAXIAL COMPRESSION TEST REPORT
STRESS PATH PLOT
ASTM D4767Golder Associates Inc.
Confining Pressure
(psi)
2.5
5.0
10.0
p' at failure
(psi)
2.8
3.5
6.5
p at failure
(psi)
4.4
6.9
13.0
q at failure
(psi)
1.9
1.9
3.0
0
2
4
6
8
10
12
0 2 4 6 8 10 12
q, p
si
p', psi
Stress Path (p'-q) Plot
2.5 psi
5.0 psi
10.0 psi
p' and q at Failure

Figure:
4TP-3A JEO
Reviewed: Job Number:
103-81938
Date:
7/9/2015
Technician:
RJM
16.0 10.0
Sample:
9.5
MOHR'S CIRCLE DIAGRAM
Tri-State/Nucla Ash Landfill/CO
Job Short Title:
CONSOLIDATED UNDRAINED TRIAXIAL COMPRESSION TEST REPORT
Title:
3.5
Golder Associates Inc.
(psi) (psi)
6.3 2.5
8.8 5.0
Confining Pressure
(psi)
ASTM D4767
σ'1 at failure σ'3 at failure
(psi) (psi)
2.5 4.7 0.9
5.0 5.4 1.6
10.0
σ1 at failure σ3 at failure
0
2
4
6
8
10
12
14
16
18
0 2 4 6 8 10 12 14 16 18
fp
si
f and 'f, psi
Mohr's Circle Diagram
2.5 psi Effective Stress
5.0 psi Total Stress
10.0 psi

Insert photograph here and adjust width to 7.3 inches
Title:
2.5 psi
Figure:5TP-3A JEO
ASTM D4767
CONSOLIDATED UNDRAINED TRIAXIAL COMPRESSION TEST REPORT
Job Short Title: SPECIMEN PHOTOGRAPH -
Tri-State/Nucla Ash Landfill/CO
Sample: Reviewed: Job Number:103-819387/9/2015
Date:Technician:RJM
Golder Associates Inc.

Insert photograph here and adjust width to 7.3 inches
Title:
5.0 psi
Figure:6
Job Number:103-819387/9/2015
Date:Technician:RJM
Sample: Reviewed:TP-3A JEO
Tri-State/Nucla Ash Landfill/CO
ASTM D4767
CONSOLIDATED UNDRAINED TRIAXIAL COMPRESSION TEST REPORT
Job Short Title: SPECIMEN PHOTOGRAPH -
Golder Associates Inc.

Insert photograph here and adjust width to 7.3 inches
Title:
10.0 psi
Figure:7
Job Number:103-819387/9/2015
Date:Technician:RJM
Sample: Reviewed:TP-3A JEO
Tri-State/Nucla Ash Landfill/CO
ASTM D4767
CONSOLIDATED UNDRAINED TRIAXIAL COMPRESSION TEST REPORT
Job Short Title: SPECIMEN PHOTOGRAPH -
Golder Associates Inc.
ATTACHMENT A-3

Boring or Test Pit: -- Boring or Test Pit: -- Boring or Test Pit: --Sample: LF Ash Sample: LF Ash Sample: LF Ash
Depth: -- ft Depth: -- ft Depth: -- ftPoint No.: 1 Point No.: 2 Point No.: 3
Initial Initial InitialThickness = 1.197 in Thickness = 1.195 in Thickness = 1.193 inDiameter = 2.493 in Diameter = 2.493 in Diameter = 2.493 in
Wet Mass = 0.222 lb Wet Mass = 0.222 lb Wet Mass = 0.222 lbArea = 4.881 in2 Area = 4.881 in2 Area = 4.881 in2
Volume = 5.843 in3 Volume = 5.833 in3 Volume = 5.823 in3
Specific Gravity = 2.60 (ASTM D854) Specific Gravity = 2.60 (ASTM D854) Specific Gravity = 2.60 (ASTM D854)
Dry Mass of Solids = 0.196 lb Dry Mass of Solids = 0.196 lb Dry Mass of Solids = 0.196 lbMoisture Content = 13.2% Moisture Content = 13.4% Moisture Content = 13.2%Wet Unit Weight = 65.6 pcf Wet Unit Weight = 65.9 pcf Wet Unit Weight = 65.9 pcfDry Unit Weight = 57.9 pcf Dry Unit Weight = 58.1 pcf Dry Unit Weight = 58.2 pcf
Void Ratio = 1.80 Void Ratio = 1.79 Void Ratio = 1.78Percent Saturation = 19% Percent Saturation = 19% Percent Saturation = 19%
Pre-Shear Pre-Shear Pre-ShearThickness = 1.155 in Thickness = 1.142 in Thickness = 1.110 inDiameter = 2.493 in Diameter = 2.493 in Diameter = 2.493 in
Area = 4.881 in2 Area = 4.881 in2 Area = 4.881 in2
Volume = 5.639 in3 Volume = 5.573 in3 Volume = 5.417 in3
Moisture Content = 12.2% Moisture Content = 12.7% Moisture Content = 12.5%Wet Unit Weight = 67.4 pcf Wet Unit Weight = 68.5 pcf Wet Unit Weight = 70.4 pcfDry Unit Weight = 60.0 pcf Dry Unit Weight = 60.8 pcf Dry Unit Weight = 62.5 pcf
Void Ratio = 1.70 Void Ratio = 1.67 Void Ratio = 1.59Percent Saturation = 19% Percent Saturation = 20% Percent Saturation = 20%
Shear Rate = 0.0033 in/min Shear Rate = 0.0033 in/min Shear Rate = 0.0033 in/minNormal Stress = 7,200 psf Normal Stress = 14,400 psf Normal Stress = 21,600 psf
Notes:Silty sand, gray, moist
Atterberg limits: LL = NP PL = NP PI = NP (ASTM D4318)Percent finer: 3/4 in. = 100% No. 4 = 100% No. 200 = 18% (ASTM D422, refer to separate report)Specimen type: Intact X ReconstitutedInundation: NoApparatus: 2.5 -inch nominal diameter box, GeoTac automated test system, GeoJac loading systemSpecimens remolded at delivered moisture content using moderate compactive effort
Title:
Figure:JEO
Technician:PRHLF Ash 1103-819382/17/2015
USCS description (ASTM D2487):
Job Number:Date:Reviewed:
Golder Associates Inc. ASTM D3080
CONSOLIDATED DRAINED DIRECT SHEAR TEST REPORT
SAMPLE AND TEST DATA
Tri-State/Nucla Ash Landfill/CO
Job Short Title:
Sample:

Title:
Figure:Technician:Sample:
ASTM D3080
Tri-State/Nucla Ash Landfill/CO
CONSOLIDATED DRAINED DIRECT SHEAR TEST REPORT
SHEAR STRESS AND NORMAL DISPLACEMENT PLOTSJob Short Title:
Date: Job Number:Reviewed:
Golder Associates Inc.
2PRHLF Ash 103-819382/17/2015JEO
0
5,000
10,000
15,000
20,000
25,000
0 2 4 6 8 10 12
Sh
ear
Str
ess,
psf
Lateral Strain, %
Shear Stress vs. Lateral Strain
7,200 psf
14,400 psf
21,600 psf
-0.0200
-0.0150
-0.0100
-0.0050
0.0000
0.0050
0.0100
0.0150
0.0200
0 2 4 6 8 10 12
Nor
mal
Dis
pla
cem
ente
, in
Lateral Strain, %
Normal Displacement vs. Lateral Strain
7,200 psf
14,400 psf
21,600 psf

The shear rate for Point No. 1 was based on ASTM D3080 guidance for:
-Soil description of SW-SM, SP-SM, or SM
-Minimum time to failure = 60 min
-Soil other than normally consolidated fine-grained soil
-Displacement at failure = 0.2 in
The shear rate for Point No. 2 was based on ASTM D3080 guidance for:
-Soil description of SW-SM, SP-SM, or SM
-Minimum time to failure = 60 min
-Soil other than normally consolidated fine-grained soil
-Displacement at failure = 0.2 in
The shear rate for Point No. 3 was based on ASTM D3080 guidance for:
-Soil description of SW-SM, SP-SM, or SM
-Minimum time to failure = 60 min
-Soil other than normally consolidated fine-grained soil
-Displacement at failure = 0.2 in
Golder Associates Inc.
21,601 0.0818 1,259
Reviewed: Date: Job Number:
Point No. 3
JEO 2/17/2015 103-81938
0.0040 316
Point No. 1
LF Ash PRH 3
102 0.0014 20
Figure:
Title:
ASTM D3080
CONSOLIDATED DRAINED DIRECT SHEAR TEST REPORT
Job Short Title: CONSOLIDATION DATA
60
1,0007,200
Sample: Technician:
Tri-State/Nucla Ash Landfill/CO
100 0.0004 10
13,238 0.0488 15
14,396
Consolidation Data Used to Determine Shear Rate
Point No. 2
0.0412
Normal Stress, psf
Normal Displacement,
inLoad Duration,
min
100 0.0005

Point No.: Point No.: Point No.:
Normal Stress = psf Normal Stress = psf Normal Stress = psf
Shear Rate = in/min Shear Rate = in/min Shear Rate = in/min
1 2 3
19,693 9.4 0.0148
19,763 9.9 0.0155
19,503 8.5 0.0137
19,637 8.9 0.0142
19,152 7.5 0.0124
19,331 8.0 0.0131
18,522 6.4 0.0112
18,868 6.9 0.0117
17,698 5.4 0.0106
18,135 5.9 0.0109
16,540 4.5 0.0095
17,174 4.9 0.0100
14,947 3.5 0.0084
15,808 4.0 0.0088
12,595 2.5 0.0057
13,808 2.9 0.0072
9,475 1.5 0.0030
11,175 2.0 0.0047
5,747 0.9 0.0007
6,515 1.0 0.0010
3,841 0.7 0.0004
4,802 0.8 0.0006
1,755 0.5 0.0000
2,826 0.6 0.0002
546 0.3 0.0000
976 0.4 0.0000
334 0.1 0.0000
536 0.2 0.0000
13,072 9.5 0.0042
12,763 7.4 0.0035
12,888 7.9 0.0036
12,297 6.5 0.0031
12,562 6.9 0.0034
5.5 0.0031
11,995
13,054 9.9 0.0046
13,007 8.4 0.0037
13,041 9.0 0.0040
6.0 0.0030
0.0035
10,731 4.4 0.0035
11,163 4.9 0.0034
0.0028
8,984 3.0 0.0034
9,704 3.5 0.0035
0.0006
6,365 1.4 0.0014
7,463 2.0 0.0023
-0.0059
-0.0057
0.0004
0.0005
0.0000
-0.0005
-0.0017
0.0001
0.0000
0.0001
0.0001
0.0002
-0.0040
-0.0047
-0.0051
0.0000
175 0.2 0.0000
453 0.3 0.0001
0.0000
0.0000
0.0000
0.0001
0.0000
0.0002
3,826 0.8 0.0003
4,309 0.9 0.0004
0.0001
1,970 0.5 0.0001
2,677 0.6 0.0001
6.5
6.9
7.4
-0.0056
0 0.1
1,093 0.4
3,284 0.7
4,777 1.0
8,276 2.5
10,282 4.0
11,677
-0.0055
-0.0058
-0.0058
-0.0060
-0.0059
-0.0024
-0.0031
6,775
6,740
6,691
0.1
0.2
0.3
0.4
0.5
0.6
0.7
0.8
0.9
1.0
1.4
2.0
2.5
6,975
6,972
6,934
7.9
8.4
9.0
9.5
9.9
6,801
6,910
3,936
4,618
5,120
5,537
5,913
3.0
3.5
4.0
4.4
4.9
5.5
6.0
7,200 14,400 21,600
Shear Lateral NormalShear Lateral NormalNormal
0.0033 0.0033 0.0033
Stress Strain Displacement
psf % in
Stress Strain Displacement
psf % in
Displacement
in
Shear
Stress
psf %
Strain
Lateral
Job Short Title:
1,652
2,153
2,548
2,864
3,123
96
99
162
325
1,065
6,889
6,828
6,190
6,407
6,600
Tri-State/Nucla Ash Landfill/CO
Title:
CONSOLIDATED DRAINED DIRECT SHEAR TEST REPORT
SHEAR DATA
ASTM D3080
4
Figure:Sample:
LF Ash PRH
Technician: Reviewed: Date: Job Number:
JEO 2/17/2015 103-81938
Golder Associates Inc.

Insert photograph here and adjust width to 7.3 inches
Title:
7,200 psf
Reviewed:Sample: Figure:
5LF Ash
Date: Job Number:
PRH JEO 2/17/2015 103-81938
Technician:
ASTM D3080
CONSOLIDATED DRAINED DIRECT SHEAR TEST REPORT
SPECIMEN PHOTOGRAPH -
Golder Associates Inc.
Tri-State/Nucla Ash Landfill/CO
Job Short Title:

Insert photograph here and adjust width to 7.3 inches
Title:
14,400 psf
ASTM D3080
CONSOLIDATED DRAINED DIRECT SHEAR TEST REPORT
Job Short Title: SPECIMEN PHOTOGRAPH -
Golder Associates Inc.
Tri-State/Nucla Ash Landfill/CO
6LF Ash PRH JEO 2/17/2015 103-81938
Figure:Sample: Technician: Reviewed: Date: Job Number:

Insert photograph here and adjust width to 7.3 inches
Title:
21,600 psf
ASTM D3080
CONSOLIDATED DRAINED DIRECT SHEAR TEST REPORT
Job Short Title: SPECIMEN PHOTOGRAPH -
Golder Associates Inc.
Tri-State/Nucla Ash Landfill/CO
7LF Ash PRH JEO 2/17/2015 103-81938
Figure:Sample: Technician: Reviewed: Date: Job Number:

ATTACHMENT A-4

1.81.81.81.8
Material Name ColorUnit Weight
(lbs/�3)Strength Type
Cohesion
(psf)
Phi
(deg)Shear Normal Func#on
Lean Clay 109 Mohr-Coulomb 90 22
Bedrock 120 Infinite strength
Comingled Ash 74.6 Shear Normal func'on LF Ash - CD Direct Shear Test
61
00
60
00
59
00
58
00
0 50 100 150 200 250 300 350 400 450 500 550 600
Analysis DescriptionSouth Section - Shallow Slip Surfaces - Static Loading
CompanyGolder Associates Inc.
Drawn ByALEBrown
File NameSouth-Shallow-09FEB2017.slim
Date02/09/2017, 11:53:52 AM
Project
Nucla Station Ash Disposal Site
SLIDEINTERPRET 7.022

1.41.41.41.4
Material Name ColorUnit Weight
(lbs/�3)Strength Type Shear Normal Func on
Lean Clay 109 Shear Normal func�on Lean Clay (CL) - Reduced (PS)
Bedrock 120 Infinite strength
Comingled Ash 74.6 Shear Normal func�on LF Ash - CD Direct Shear Test
0.06
61
00
60
00
59
00
58
00
0 50 100 150 200 250 300 350 400 450 500 550 600
Analysis DescriptionSouth Section - Shallow Slip Surfaces - Seismic Loading
CompanyGolder Associates Inc.
Drawn ByALEBrown
File NameSouth-Shallow-Seismic-09FEB2017.slim
Date02/09/2017, 11:53:52 AM
Project
Nucla Station Ash Disposal Site
SLIDEINTERPRET 7.022

3.53.53.53.5
Material Name ColorUnit Weight
(lbs/�3)Strength Type
Cohesion
(psf)
Phi
(deg)Shear Normal Func#on
Lean Clay 109 Mohr-Coulomb 90 22
Bedrock 120 Infinite strength
Comingled Ash 74.6 Shear Normal func'on LF Ash - CD Direct Shear Test
61
00
60
00
59
00
58
00
0 50 100 150 200 250 300 350 400 450 500 550 600
Analysis DescriptionSouth Section - Deeper Slip Surfaces - Static Loading
CompanyGolder Associates Inc.
Drawn ByALEBrown
File NameSouth-Deep-09FEB2017.slim
Date02/09/2017, 11:53:52 AM
Project
Nucla Station Ash Disposal Site
SLIDEINTERPRET 7.022

2.82.82.82.8
Material Name ColorUnit Weight
(lbs/�3)Strength Type Shear Normal Func on
Lean Clay 109 Shear Normal func�on Lean Clay (CL) - Reduced (PS)
Bedrock 120 Infinite strength
Comingled Ash 74.6 Shear Normal func�on LF Ash - CD Direct Shear Test
0.06
61
00
60
00
59
00
58
00
0 50 100 150 200 250 300 350 400 450 500 550 600
Analysis DescriptionSouth Section - Deeper Slip Surfaces - Seismic Loading
CompanyGolder Associates Inc.
Drawn ByALEBrown
File NameSouth-Deep-Seismic-09FEB2017.slim
Date02/09/2017, 11:53:52 AM
Project
Nucla Station Ash Disposal Site
SLIDEINTERPRET 7.022

1.51.51.51.5
Material Name ColorUnit Weight
(lbs/�3)Strength Type
Cohesion
(psf)
Phi
(deg)Shear Normal Func#on
Lean Clay 109 Mohr-Coulomb 90 22
Bedrock 120 Infinite strength
Comingled Ash 74.6 Shear Normal func'on LF Ash - CD Direct Shear Test
61
00
60
00
59
00
58
00
0 100 200 300 400 500 600
Analysis DescriptionWest Section - Shallow Slip Surfaces - Static Loading
CompanyGolder Associates Inc.
Drawn ByALEBrown
File NameWest-Shallow-09FEB2017.slim
Date02/09/2017, 11:53:52 AM
Project
Nucla Station Ash Disposal Site
SLIDEINTERPRET 7.022
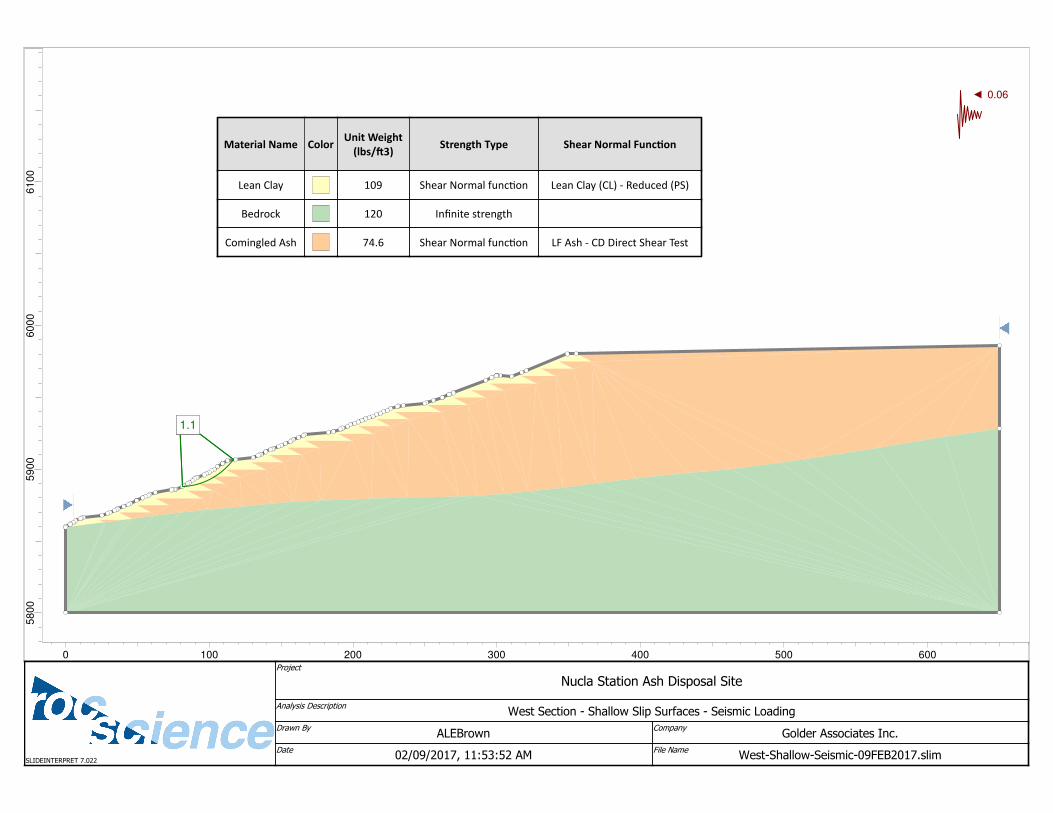
1.11.11.11.1
Material Name ColorUnit Weight
(lbs/�3)Strength Type Shear Normal Func on
Lean Clay 109 Shear Normal func�on Lean Clay (CL) - Reduced (PS)
Bedrock 120 Infinite strength
Comingled Ash 74.6 Shear Normal func�on LF Ash - CD Direct Shear Test
0.06
61
00
60
00
59
00
58
00
0 100 200 300 400 500 600
Analysis DescriptionWest Section - Shallow Slip Surfaces - Seismic Loading
CompanyGolder Associates Inc.
Drawn ByALEBrown
File NameWest-Shallow-Seismic-09FEB2017.slim
Date02/09/2017, 11:53:52 AM
Project
Nucla Station Ash Disposal Site
SLIDEINTERPRET 7.022

2.92.92.92.9
Material Name ColorUnit Weight
(lbs/�3)Strength Type
Cohesion
(psf)
Phi
(deg)Shear Normal Func#on
Lean Clay 109 Mohr-Coulomb 90 22
Bedrock 120 Infinite strength
Comingled Ash 74.6 Shear Normal func'on LF Ash - CD Direct Shear Test
61
00
60
00
59
00
58
00
0 100 200 300 400 500 600
Analysis DescriptionWest Section - Deeper Slip Surfaces - Static Loading
CompanyGolder Associates Inc.
Drawn ByALEBrown
File NameWest-Deep-09FEB2017.slim
Date02/09/2017, 11:53:52 AM
Project
Nucla Station Ash Disposal Site
SLIDEINTERPRET 7.022

2.42.42.42.4
Material Name ColorUnit Weight
(lbs/�3)Strength Type Shear Normal Func on
Lean Clay 109 Shear Normal func�on Lean Clay (CL) - Reduced (PS)
Bedrock 120 Infinite strength
Comingled Ash 74.6 Shear Normal func�on LF Ash - CD Direct Shear Test
0.06
62
00
61
00
60
00
59
00
58
00
0 100 200 300 400 500 600
Analysis DescriptionWest Section - Deeper Slip Surfaces - Seismic Loading
CompanyGolder Associates Inc.
Drawn ByALEBrown
File NameWest-Deep-Seismic-09FEB2017.slim
Date02/09/2017, 11:53:52 AM
Project
Nucla Station Ash Disposal Site
SLIDEINTERPRET 7.022

golder.com