report unley - stage 3
TRANSCRIPT

REPORT
Unley - Stage 3 Environmental Assessment Program
Submitted to:
Environment Protection Authority SA submitted via email:
Submitted by:
Golder Associates Pty Ltd
118 Franklin Street, Adelaide, South Australia 5000, Australia
+61 8 8213 2100
19121313-001-R-Rev0
20 June 2019

20 June 2019 19121313-001-R-Rev0
i
Distribution List Environment Protection Authority
Golder Associates Pty Ltd

20 June 2019 19121313-001-R-Rev0
ii
Executive Summary
Golder Associates Pty Ltd was commissioned by the Environment Protection Authority to undertake the Stage
3 environmental assessment of an EPA designated assessment area located within Unley, South Australia
(the Stage 3 assessment area). The objective of the works was to assess vapour intrusion risks to residential
properties in a localised area near the former dry cleaner on the corner of Mary Street and Unley Road.
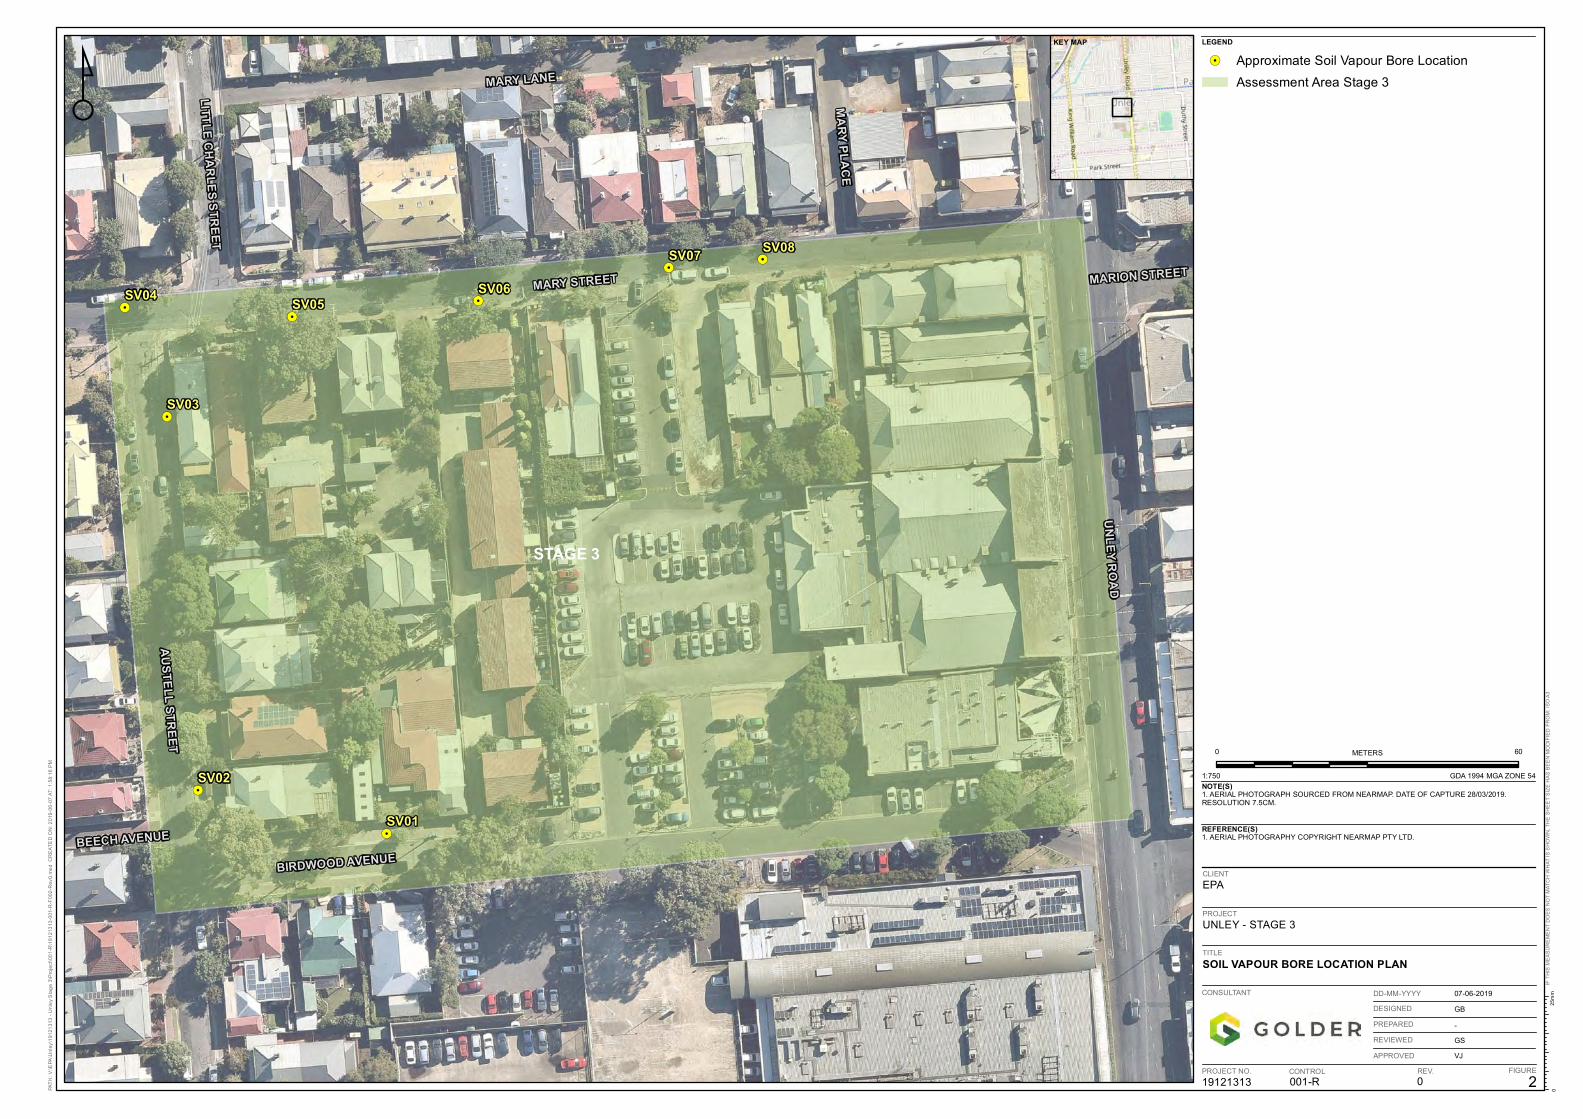
Eight soil vapour bores were installed to screen depths between 1 and 1.5 m bgl along Mary Street, Austell
Street and Birdwood Avenue in Unley. Soil vapour samples were collected from each bore three days after
installation and concentrations of contaminants of interest were reported as less than the laboratory limit of
reporting in all samples, with the exception of tetrachloroethene (PCE) at locations SV03, SV04 and SV05.
The concentrations of PCE reported did not exceed the Tier 1 screening guidelines (Interim HILs published in
the ASC NEPM).
Based on the measured soil vapour concentrations potential vapour intrusion risks to human health within the
Stage 3 assessment area have not been identified.
20 June 2019 19121313-001-R-Rev0
iii
Table of Contents
1.0 INTRODUCTION ......................................................................................................................................... 1
1.1 Background ....................................................................................................................................... 1
1.2 Objective ........................................................................................................................................... 1
1.3 Scope of Works ................................................................................................................................. 2
2.0 FIELDWORK METHODOLOGY ................................................................................................................. 2
2.1 Service clearance .............................................................................................................................. 2
2.2 Borehole Drilling ................................................................................................................................ 2
2.3 Field Observations ............................................................................................................................ 2
2.4 Soil Vapour Bore Installation ............................................................................................................. 2
2.5 Soil Vapour Sampling ........................................................................................................................ 3
2.6 Survey ............................................................................................................................................... 3
3.0 SUMMARY OF LABORATORY TESTING RESULTS ............................................................................... 3
3.1 Soil Vapour Assessment Screening Criteria ..................................................................................... 3
3.2 Analytical Results .............................................................................................................................. 3
4.0 DATA QUALITY EVALUATION ................................................................................................................. 4
4.1.1 Soil Vapour .................................................................................................................................... 4
5.0 CONCEPTUAL SITE MODEL .................................................................................................................... 5
6.0 CONCLUSIONS .......................................................................................................................................... 5
7.0 IMPORTANT INFORMATION ..................................................................................................................... 6
TABLES
Table 1: Soil Vapour Analytical Results ................................................................................................................ 4
Table 2: Results of QC Assessment .................................................................................................................... 5
FIGURES
Figure 1: Assessment Area Location Plan
Figure 2: Soil Vapour Bore Location Plan

20 June 2019 19121313-001-R-Rev0
iv
APPENDICES
APPENDIX A Figures
APPENDIX B Borelogs and Sampling Sheets
APPENDIX C Photographs
APPENDIX D Survey and Calibration Records
APPENDIX E Chemical Table
APPENDIX F QC Table
APPENDIX G Laboratory Certificates and COCs
APPENDIX H Important Information

20 June 2019 19121313-001-R-Rev0
1
1.0 INTRODUCTION
The South Australian Environment Protection Authority (EPA) engaged Golder Associates Pty Ltd (Golder) to
undertake the Stage 3 environmental assessment of an EPA designated assessment area located within
Unley, South Australia. The location of the Stage 3 assessment area is shown in Figure 1, Appendix A.
1.1 Background
A number of activities associated with the use of chlorinated hydrocarbon compounds (CHC), including a dry
cleaner on the corner of Mary St and Unley Road, were understood to have been historically undertaken in or
within the vicinity of the Stage 3 assessment area. The EPA has previously undertaken two stages of
assessment work at Unley to assess potential risks associated with CHC present in the subsurface.
Stage 1 of the assessment works was undertaken in 2017 and included a broad-scale passive soil vapour
screen within an area bounded by Mary Street, Charles Lane, Tyne Place and Little Charles Street, as shown
on Figure 1, Appendix A. Some CHCs, including trichloroethene (TCE) and tetrachloroethene (PCE) and also
benzene were detected. Concentrations of these contaminants of potential concern were all reported below or
equal to the adopted Tier 1 screening guidelines. The findings of the Stage 1 assessment are reported in the
Stage 1 environmental assessment report (Tierra, 2017).
Stage 2 of the assessment works was undertaken in 2018 across an expanded assessment area (as
illustrated on Figure 1, Appendix A) and included passive soil vapour sampling in the south-eastern corner of
this expanded area and an investigation of groundwater contamination within the assessment area. PCE was
detected in one of the passive soil vapour samples, however at a concentration below the screening guideline
for residential land use. Groundwater results indicated low concentrations of PCE, TCE and carbon
tetrachloride in the western portion of the expanded assessment area, with concentrations of PCE in
groundwater marginally exceeding screening guidelines for potable water and primary contact recreation in
one of these wells.
In addition to the assessments commissioned by EPA, the EPA were made aware of PCE detected in the
groundwater at concentrations above the adopted screening guideline and TCE concentrations above the
laboratory limit of reporting, at an upgradient site within the south-eastern portion of the Stage 2 assessment
area. SA Health advised that a risk to human health from exposure to low concentrations of CHC in
groundwater does not exist. However, as a precautionary approach, SA Health recommended that
quantitative soil vapour assessment be undertaken in a small area (south-eastern portion of the Stage 2
assessment area) to conclusively determine whether there is any risk to human health.
The Stage 3 Assessment was commissioned by EPA to address the recommendation from SA Health for
quantitative soil vapour assessment in the south eastern portion of the Stage 2 Assessment Area.
1.2 Objective
The objective of the Stage 3 assessment was to assess vapour intrusion risks to residential properties in the
localised area shown on Figure 1 (Appendix A) by undertaking an active soil vapour assessment at eight
locations within public footpaths.
20 June 2019 19121313-001-R-Rev0
2
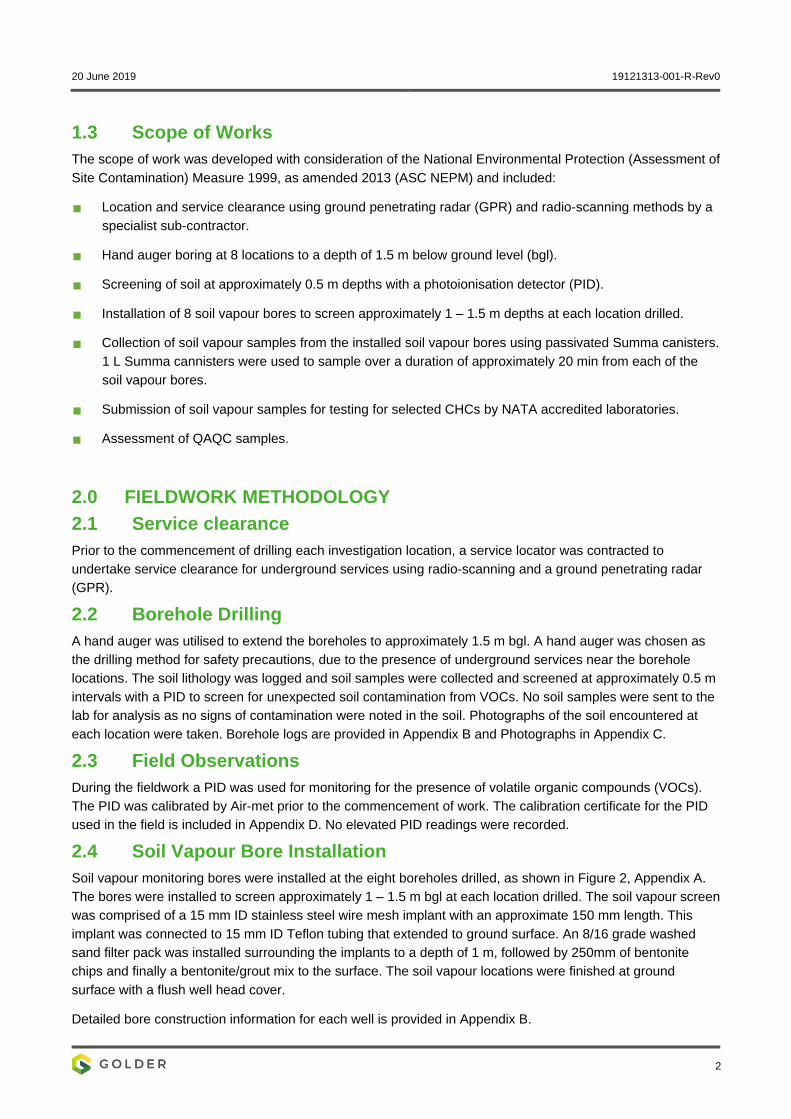
1.3 Scope of Works
The scope of work was developed with consideration of the National Environmental Protection (Assessment of
Site Contamination) Measure 1999, as amended 2013 (ASC NEPM) and included:
Location and service clearance using ground penetrating radar (GPR) and radio-scanning methods by a
specialist sub-contractor.
Hand auger boring at 8 locations to a depth of 1.5 m below ground level (bgl).
Screening of soil at approximately 0.5 m depths with a photoionisation detector (PID).
Installation of 8 soil vapour bores to screen approximately 1 – 1.5 m depths at each location drilled.
Collection of soil vapour samples from the installed soil vapour bores using passivated Summa canisters.
1 L Summa cannisters were used to sample over a duration of approximately 20 min from each of the
soil vapour bores.
Submission of soil vapour samples for testing for selected CHCs by NATA accredited laboratories.
Assessment of QAQC samples.
2.0 FIELDWORK METHODOLOGY
2.1 Service clearance
Prior to the commencement of drilling each investigation location, a service locator was contracted to
undertake service clearance for underground services using radio-scanning and a ground penetrating radar
(GPR).
2.2 Borehole Drilling
A hand auger was utilised to extend the boreholes to approximately 1.5 m bgl. A hand auger was chosen as
the drilling method for safety precautions, due to the presence of underground services near the borehole
locations. The soil lithology was logged and soil samples were collected and screened at approximately 0.5 m
intervals with a PID to screen for unexpected soil contamination from VOCs. No soil samples were sent to the
lab for analysis as no signs of contamination were noted in the soil. Photographs of the soil encountered at
each location were taken. Borehole logs are provided in Appendix B and Photographs in Appendix C.
2.3 Field Observations
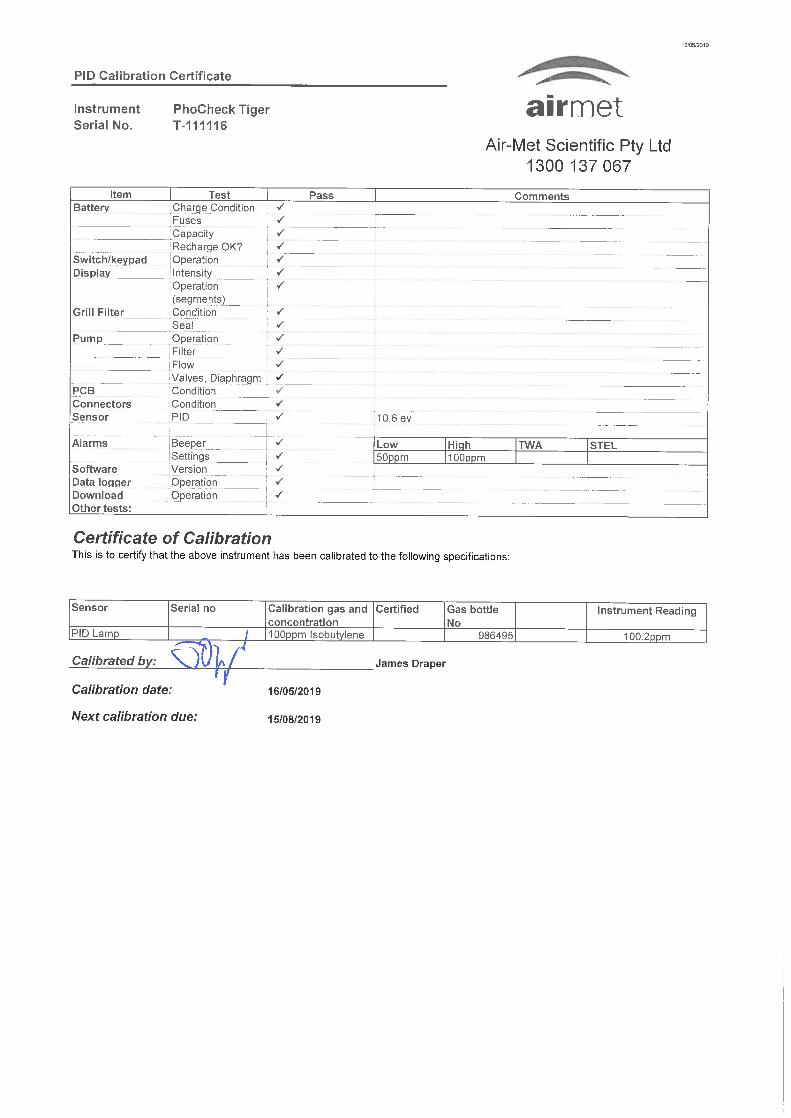
During the fieldwork a PID was used for monitoring for the presence of volatile organic compounds (VOCs).
The PID was calibrated by Air-met prior to the commencement of work. The calibration certificate for the PID
used in the field is included in Appendix D. No elevated PID readings were recorded.
2.4 Soil Vapour Bore Installation
Soil vapour monitoring bores were installed at the eight boreholes drilled, as shown in Figure 2, Appendix A.
The bores were installed to screen approximately 1 – 1.5 m bgl at each location drilled. The soil vapour screen
was comprised of a 15 mm ID stainless steel wire mesh implant with an approximate 150 mm length. This
implant was connected to 15 mm ID Teflon tubing that extended to ground surface. An 8/16 grade washed
sand filter pack was installed surrounding the implants to a depth of 1 m, followed by 250mm of bentonite
chips and finally a bentonite/grout mix to the surface. The soil vapour locations were finished at ground
surface with a flush well head cover.
Detailed bore construction information for each well is provided in Appendix B.
20 June 2019 19121313-001-R-Rev0
3
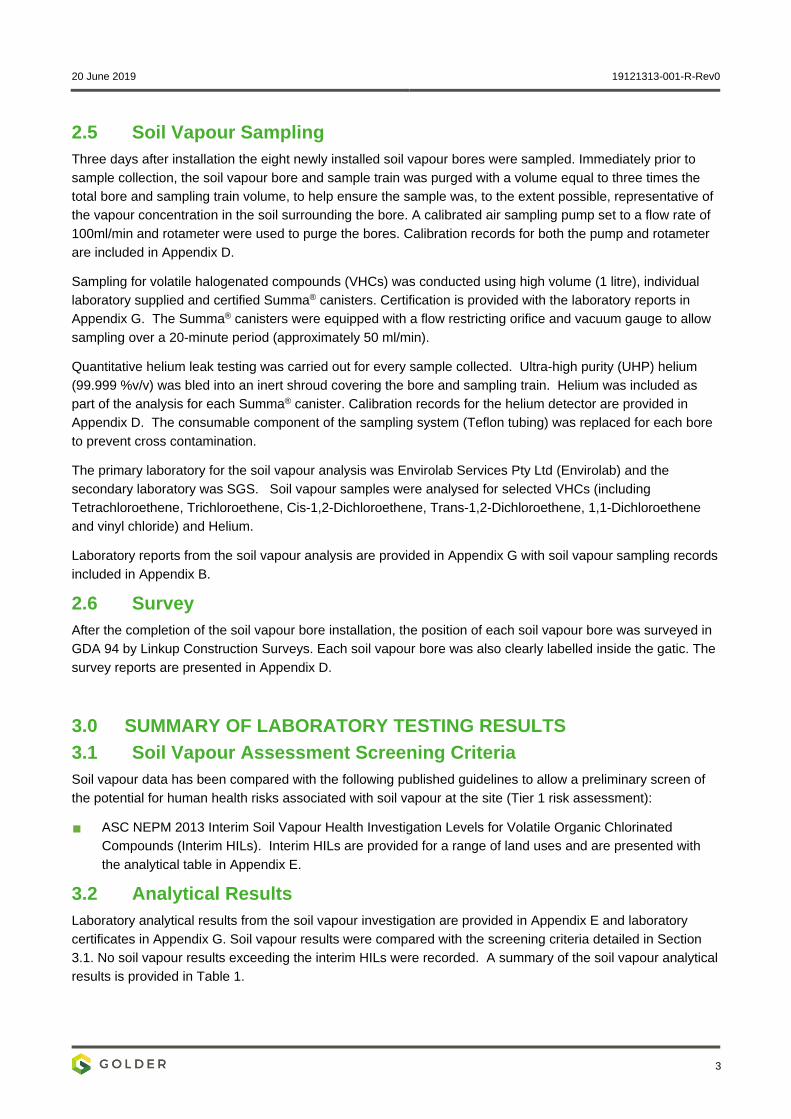
2.5 Soil Vapour Sampling
Three days after installation the eight newly installed soil vapour bores were sampled. Immediately prior to
sample collection, the soil vapour bore and sample train was purged with a volume equal to three times the
total bore and sampling train volume, to help ensure the sample was, to the extent possible, representative of
the vapour concentration in the soil surrounding the bore. A calibrated air sampling pump set to a flow rate of
100ml/min and rotameter were used to purge the bores. Calibration records for both the pump and rotameter
are included in Appendix D.
Sampling for volatile halogenated compounds (VHCs) was conducted using high volume (1 litre), individual
laboratory supplied and certified Summa® canisters. Certification is provided with the laboratory reports in
Appendix G. The Summa® canisters were equipped with a flow restricting orifice and vacuum gauge to allow
sampling over a 20-minute period (approximately 50 ml/min).
Quantitative helium leak testing was carried out for every sample collected. Ultra-high purity (UHP) helium
(99.999 %v/v) was bled into an inert shroud covering the bore and sampling train. Helium was included as
part of the analysis for each Summa® canister. Calibration records for the helium detector are provided in
Appendix D. The consumable component of the sampling system (Teflon tubing) was replaced for each bore
to prevent cross contamination.
The primary laboratory for the soil vapour analysis was Envirolab Services Pty Ltd (Envirolab) and the
secondary laboratory was SGS. Soil vapour samples were analysed for selected VHCs (including
Tetrachloroethene, Trichloroethene, Cis-1,2-Dichloroethene, Trans-1,2-Dichloroethene, 1,1-Dichloroethene
and vinyl chloride) and Helium.
Laboratory reports from the soil vapour analysis are provided in Appendix G with soil vapour sampling records
included in Appendix B.
2.6 Survey
After the completion of the soil vapour bore installation, the position of each soil vapour bore was surveyed in
GDA 94 by Linkup Construction Surveys. Each soil vapour bore was also clearly labelled inside the gatic. The
survey reports are presented in Appendix D.
3.0 SUMMARY OF LABORATORY TESTING RESULTS
3.1 Soil Vapour Assessment Screening Criteria
Soil vapour data has been compared with the following published guidelines to allow a preliminary screen of
the potential for human health risks associated with soil vapour at the site (Tier 1 risk assessment):
ASC NEPM 2013 Interim Soil Vapour Health Investigation Levels for Volatile Organic Chlorinated
Compounds (Interim HILs). Interim HILs are provided for a range of land uses and are presented with
the analytical table in Appendix E.
3.2 Analytical Results
Laboratory analytical results from the soil vapour investigation are provided in Appendix E and laboratory
certificates in Appendix G. Soil vapour results were compared with the screening criteria detailed in Section
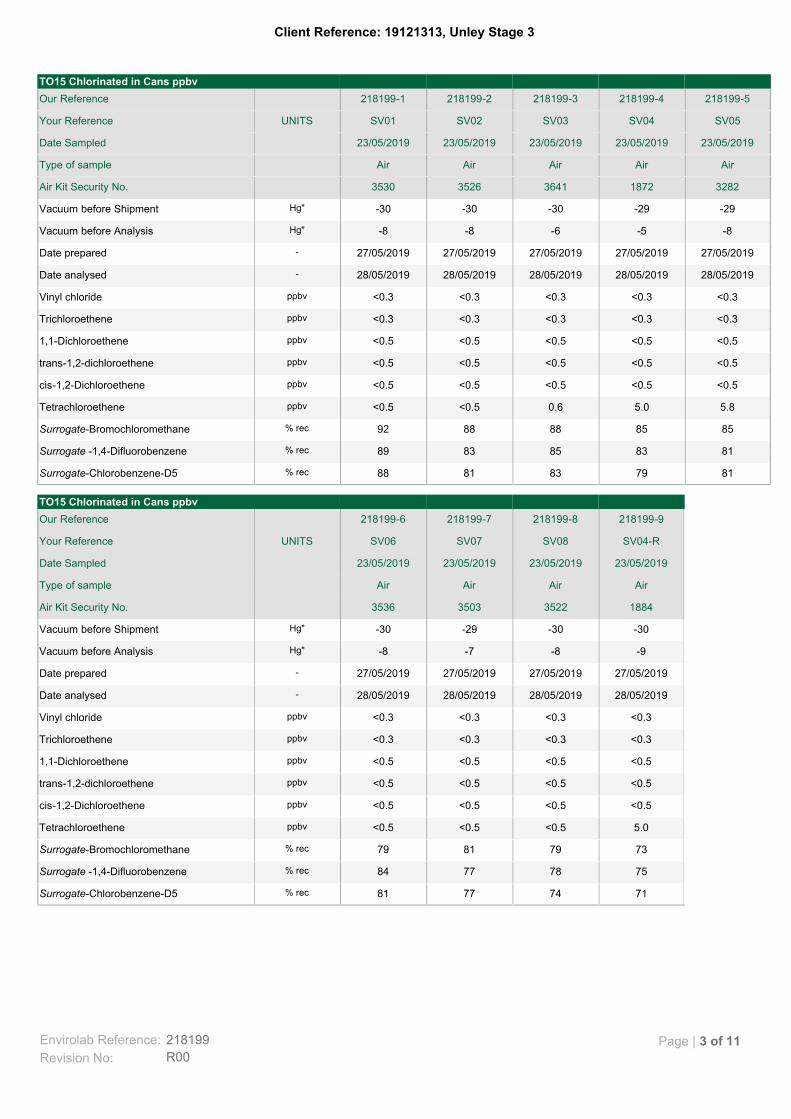
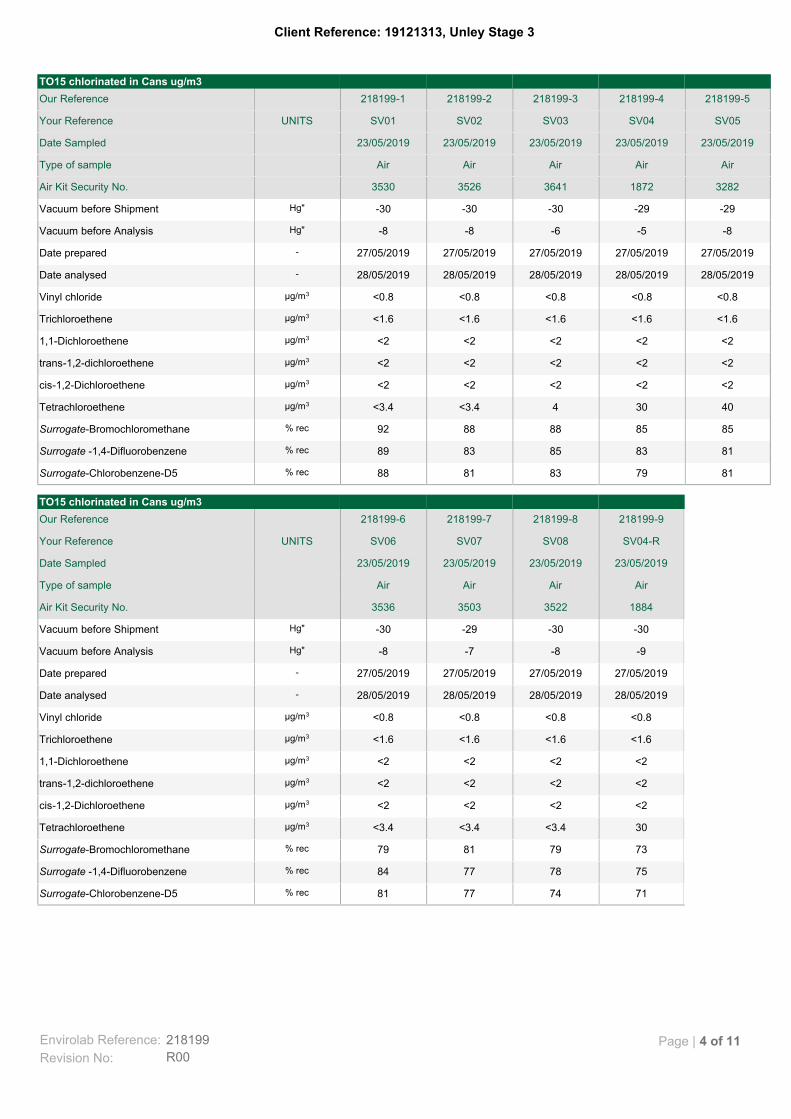
3.1. No soil vapour results exceeding the interim HILs were recorded. A summary of the soil vapour analytical
results is provided in Table 1.

20 June 2019 19121313-001-R-Rev0
4
Table 1: Soil Vapour Analytical Results
Chemical Locations Reporting Concentrations Above LOR
Locations Reporting Concentrations Above
Adopted Guideline1
Maximum Concentration (mg/m3)
1,1-Dichloroethene All below LOR N/A <0.002
Cis-1,2-Dichloroethene All below LOR <0.002
Trans-1,2-dichloroethene All below LOR N/A <0.002
Trichloroethene All below LOR - <0.0016
Tetrachloroethene SV03, SV04 and SV05 - 0.04 (SV05)
Vinyl Chloride All below LOR - <0.0008
Notes: N/A – No applicable guideline for chemical of interest.
1ASC NEPM 2013 Interim Soil Vapour Health Investigation Levels for Volatile Organic Chlorinated Compounds
4.0 DATA QUALITY EVALUATION
A data quality assurance and quality control (QA/QC) program was implemented as part of this assessment.
The QA/QC program is made up of the following elements:
Implementation of appropriate field work procedures.
Collection and interpretation of field quality control data.
Collection and evaluation of internal laboratory quality control data.
The field work was carried out in accordance with Golder standard technical procedures.
As part of the QA/QC process field quality control samples (primary duplicate and secondary duplicate
samples) were collected and internal quality control samples (spikes, duplicates and method blanks) were
analysed by the laboratories.
The overall assessment of the QC program has been made in terms of completeness. The completeness is
equal to the percentage of valid quality assurance and quality control results. The QC criteria include the
following:
A Relative Percentage Difference (RPD) less than 30% for field duplicates.
Primary laboratory internal duplicates recording RPDs less than 30%.
Primary laboratory control spikes within the acceptable recovery range set by the laboratory.
Primary laboratory internal blanks below laboratory limits of reporting (LORs).
An overall completeness of greater than 95% to be achieved.
4.1.1 Soil Vapour
The following QC samples were collected during the soil vapour investigation:
Duplicates: There was one primary (intra-laboratory) and one secondary (inter-laboratory) duplicate
sample collected in addition to the 8 primary samples collected and submitted for analysis. This results in
a duplicate frequency of greater than 1 in 10 primary samples, which meets ASC NEPM requirements.
The comparison of the duplicate samples and calculation of RPDs is included in Appendix F.
Table 2 lists the results of the QC assessment for the soil vapour sampling.

20 June 2019 19121313-001-R-Rev0
5
Table 2: Results of QC Assessment
Item Objective Summary of Results Compliance, % complete
Chain of Custody Records Completed in full Completed in full Yes, 100%
Recovery and analysis of
field duplicate sample
Collect duplicate samples at
a minimum rate of 10% and
assess that RPDs are within
±30%
The number of duplicate
samples obtained complied
with requirement. No RPD
values were outside ±30%.
Yes, 100%
NATA certification and
approved analytical methods Comply with reference Complied Yes, 100%
Sample preservation and
holding times Comply with reference Complied Yes, 100%
Analysis of laboratory
duplicates
RPDs are within laboratory
DQO of ±50% Complied Yes, 100%
Analysis of Laboratory
Control Samples
Percentage recovery within
the laboratory’s acceptable
limits
Complied. Yes, 100%
Overall Completeness 100%
On the basis of the field and laboratory results conducted for this sampling period, the laboratory has provided
an acceptable QA/QC program and data confirmation. The overall data quality for this investigation is
considered acceptable and sufficiently reliable to achieve the objectives of this assessment.
5.0 CONCEPTUAL SITE MODEL
A Conceptual Site Model (CSM) was previously developed for the Unley Stage 2 Assessment Area by
Kleinfelder (Kleinfelder 2018) to consider known and potential sources, land uses, the nature and extent of
contamination, contaminant transport mechanisms, receptors and potential exposure pathways. The
additional soil vapour information obtained by the Stage 3 assessment supports the previous finding that only
minor concentrations of chlorinated hydrocarbons are present in soil vapour and that the identified
concentrations do not exceed health-based screening guidelines. The previously presented CSM is
considered to remain valid.
6.0 CONCLUSIONS
Eight soil vapour bores were installed to screen depths between 1 and 1.5 m bgl along Mary Street, Austell
Street and Birdwood Avenue in Unley. Soil vapour samples were collected from each bore three days after
installation and concentrations of contaminants of interest were reported as less than the laboratory limit of
reporting in all samples, with the exception of tetrachloroethene (PCE) at locations SV03, SV04 and SV05.
The concentrations of PCE reported did not exceed the Tier 1 screening guidelines (Interim HILs published in
the ASC NEPM).
Based on the measured soil vapour concentrations potential vapour intrusion risks to human health within the
Stage 3 assessment area have not been identified.

20 June 2019 19121313-001-R-Rev0
6
7.0 IMPORTANT INFORMATION
Your attention is drawn to the document – “Important Information”, which is included in Appendix H of this
report. The statements presented in this document are intended to advise you of what your realistic
expectations of this report should be. The document is not intended to reduce the level of responsibility
accepted by Golder Associates, but rather to ensure that all parties who may rely on this report are aware of
the responsibilities each assumes in so doing.

20 June 2019 19121313-001-R-Rev0
7
Signature Page
Golder Associates Pty Ltd
James Coley James Corbett
Senior Environmental Consultant Principal Environmental Engineer
JGC/JBC/gp
A.B.N. 64 006 107 857
Golder and the G logo are trademarks of Golder Associates Corporation
https://golderassociates.sharepoint.com/sites/107537/project files/6 deliverables/rev 0/19121313-001-r-rev0.docx

APPENDIX A
Figures
20 June 2019 19121313-001-R-Rev0

AU
STELL STREET
MARY STREET
KIN
G W
ILLIAM
RO
AD
UN
LEY RO
AD
PALM
ERSTO
N R
OA
D
MA
RY PLAC
E
QU
EEN STR
EET
BEEC
H AVEN
UE
CHARLES STREET
RO
BER
TS STREET
CHARLES WALK
ARTHUR STREET
HUGHES LANE
UNION STREET
HUGHES STREET
YOUNG STREET
MAUD STREET
CULVERT STREET
WHITTAM STREET
TYNE PLA
CE
DUNKS STREET
MIZPA
H AVEN
UE
CLELA
ND
AVENU
E
MARY LANE
CHARLES LANE
HU
GH
ES PLAC
E
IRW
IN LA
NE
SALISB
UR
Y STREET
PALM
ERSTO
N PLA
CE
MO
RN
ING
TON
RO
AD
ASH
AVENU
E
KILLIC
OAT STR
EET
MCGOWAN AVENUE
OA
K AVEN
UE
RA
MA
GE STR
EET
STAGE 2
STAGE 1
STAGE 3
CLIENTEPA
LEGEND
Assessment Area Stage 1Assessment Area Stage 2Assessment Area Stage 3
NOTE(S)
REFERENCE(S)
1. AERIAL PHOTOGRAPH SOURCED FROM NEARMAP. DATE OF CAPTURE 28/03/2019.RESOLUTION 15CM.
1. AERIAL PHOTOGRAPHY COPYRIGHT NEARMAP PTY LTD.
PROJECTUNLEY - STAGE 3
TITLE
ASSESSMENT AREAS
19121313 001-R 0 1
07-06-2019
GB
-
GS
VJ
PATH
: V:\E
PA\U
nley
\191
2131
3 - U
nley
Sta
ge 3
\Pro
ject
\001
-R\1
9121
313-
001-
R-F
00A
-Rev
0.m
xd C
RE
ATE
D O
N: 2
019-
06-0
7 AT
: 2:3
5:30
PM
IF T
HIS
ME
AS
UR
EM
EN
T D
OE
S N
OT
MAT
CH
WH
AT IS
SH
OW
N, T
HE
SH
EE
T S
IZE
HA
S B
EE
N M
OD
IFIE
D F
RO
M: I
SO
A3
CONSULTANT
PROJECT NO. CONTROL REV. FIGURE
DD-MM-YYYY
DESIGNED
PREPARED
REVIEWED
APPROVED
25m
m0
¸KEY MAP
0 220METERS
1:2,750 GDA 1994 MGA ZONE 54
!.
!.
!.
!.!.
!.
!.!.
MA
RY PLAC
E
AU
STELL STREET
UN
LEY RO
AD
LITTLE CH
AR
LES STREET
MARY STREET MARION STREET
BEECH AVENUE
BIRDWOOD AVENUE
MARY LANE
SV01
SV02
SV03
SV04SV05
SV06
SV07 SV08
STAGE 3
CLIENTEPA
LEGEND
!. Approximate Soil Vapour Bore LocationAssessment Area Stage 3
NOTE(S)
REFERENCE(S)
1. AERIAL PHOTOGRAPH SOURCED FROM NEARMAP. DATE OF CAPTURE 28/03/2019.RESOLUTION 7.5CM.
1. AERIAL PHOTOGRAPHY COPYRIGHT NEARMAP PTY LTD.
PROJECTUNLEY - STAGE 3
TITLE
SOIL VAPOUR BORE LOCATION PLAN
19121313 001-R 0 2
07-06-2019
GB
-
GS
VJ
PATH
: V:\E
PA\U
nley
\191
2131
3 - U
nley
Sta
ge 3
\Pro
ject
\001
-R\1
9121
313-
001-
R-F
002-
Rev
0.m
xd C
RE
ATE
D O
N: 2
019-
06-0
7 AT
: 1:5
8:16
PM
IF T
HIS
ME
AS
UR
EM
EN
T D
OE
S N
OT
MAT
CH
WH
AT IS
SH
OW
N, T
HE
SH
EE
T S
IZE
HA
S B
EE
N M
OD
IFIE
D F
RO
M: I
SO
A3
CONSULTANT
PROJECT NO. CONTROL REV. FIGURE
DD-MM-YYYY
DESIGNED
PREPARED
REVIEWED
APPROVED
25m
m0
¸KEY MAP
0 60METERS
1:750 GDA 1994 MGA ZONE 54

APPENDIX B
Borelogs and Sampling Sheets
20 June 2019 19121313-001-R-Rev0

Updated in line with Australian Standard Geotechnical Site Investigations (AS1726:2017) GAP Form No.6 RL8 January 2018
EXPLANATION OF NOTES, ABBREVIATIONS & TERMS USED ON BOREHOLE AND TEST PIT REPORTS
DRILLING/EXCAVATION METHOD ADH Hollow auger drilling EX Excavator PQ3 Diamond core - 83 mm ADT Auger drilling with tc-bit HA Hand auger PT Push tube sampling ADV Auger drilling with v-bit HAND Excavated by hand methods RAB Rotary air blast AIRCORE Aircore HMLC Diamond core - 63 mm RC Reverse circulation AT Air track HQ3 Diamond core - 61 mm RT Rock roller BH Backhoe bucket JET Jetting SONIC Sonic drilling CT Cable tool rig MZ Mazier tube sampling SPT Standard penetration testing DTC Diatube coring NDD Non-destructive digging U Undisturbed tube sampling EE Existing excavation NMLC Diamond core - 52 mm WB Washbore drilling EPT Extruded push tube NQ3 Diamond core - 45 mm PENETRATION/EXCAVATION RESISTANCE L Low resistance. Rapid penetration possible with little effort from the equipment used. M Medium resistance. Excavation/possible at an acceptable rate with moderate effort from the equipment used. H High resistance to penetration/excavation. Further penetration is possible at a slow rate and requires significant
effort from the equipment. R Refusal or Practical Refusal. No further progress possible without the risk of damage or unacceptable wear to
the digging implement or machine. These assessments are subjective and are dependent on many factors including the equipment power, weight, condition of excavation or drilling tools, and the experience of the operator. WATER
Water level at date shown Partial water loss Water inflow Complete water loss
GROUNDWATER NOT OBSERVED
The observation of groundwater, whether present or not, was not possible due to drilling water, surface seepage or cave in of the borehole/test pit.
GROUNDWATER NOT ENCOUNTERED
The borehole/test pit was dry soon after excavation. However, groundwater could be present in less permeable strata. Inflow may have been observed had the borehole/test pit been left open for a longer period.
SAMPLING AND TESTING SPT Standard Penetration Test to AS1289.6.3.1-2004 4,7,11 N=18 4,7,11 = Blows per 150mm. N = Blows per 300mm penetration following 150mm seating 30/80 mm Where practical refusal occurs, the blows and penetration for that interval are reported RW Penetration occurred under the rod weight only HW Penetration occurred under the hammer and rod weight only HB Hammer double bouncing on anvil DS Disturbed sample BDS Bulk disturbed sample G Gas Sample W Water Sample FP Field permeability test over section noted FV Field vane shear test expressed as uncorrected shear strength (sv = peak value, sr = residual value) PID Photoionisation Detector reading in ppm PM Pressuremeter test over section noted PP Pocket penetrometer test expressed as instrument reading in kPa U63 Thin walled tube sample - number indicates nominal sample diameter in millimetres WPT Water pressure test DCP Dynamic cone penetration test CPT Cone penetration test CPTu Cone penetration test with pore pressure (u) measurement RANKING OF VISUALLY OBSERVABLE CONTAMINATION AND ODOUR (for specific soil contamination assessment projects) R = 0 R = 1 R = 2 R = 3
No visible evidence of contamination Slight evidence of visible contamination Visible contamination Significant visible contamination
R = A R = B R = C R = D
No non-natural odours identified Slight non-natural odours identified Moderate non-natural odours identified Strong non-natural odours identified
ROCK CORE RECOVERY TCR = Total Core Recovery
(%) RQD = Rock Quality Designation
(%) SCR = Solid Core Recovery
(%) F = Fracture Frequency
100runcoreofLength
eredcovrecoreofLength 100
runcoreofLengthmm100coreoflengthsAxial
100
runcoreofLengthrecovered core alcyclindric of Length
(m) zoneofLength defectsofNo.

Updated in line with Australian Standard Geotechnical Site Investigations (AS1726:2017) GAP Form No.5 RL9 January 2018
METHOD OF SOIL DESCRIPTION USED ON BOREHOLE AND TEST PIT REPORTS
SYMBOLS
FILL
CLAY (CL, CI or CH)
GRAVEL (GW, GP, GM or GC)
ORGANIC SOILS (OL, OH or Pt)
SAND (SW, SP, SM or SC)
COBBLES or BOULDERS
SILT (ML or MH)
Combinations of these basic symbols may be used to indicate mixed materials such as sandy clay. CLASSIFICATION AND INFERRED STRATIGRAPHY Soil and Rock is classified and described in Reports of Boreholes and Test Pits using the preferred method given in AS1726-2017. The material properties are assessed in the field by visual/tactile methods.
Particle Size Plasticity Properties Soil Group Sub Division Particle Size
BOULDERS > 200 mm COBBLES 63 to 200 mm
GRAVEL Coarse 19 to 63 mm
Medium 6.7 to 19 mm
Fine 2.36 to 6.7 mm
SAND Coarse 0.6 to 2.36 mm
Medium 0.21 to 0.6 mm
Fine 0.075 to 0.21 mm
SILT 0.002 to 0.075 mm
CLAY ˂ 0.002 mm MOISTURE CONDITION Symbol Term Description D Dry Sands and gravels are free flowing. Clays and silts may be brittle or friable and powdery. M Moist Soils are darker than in dry condition and may feel cool. Sands and gravels tend to cohere. W Wet Soils exude free water. Sand and gravels tend to cohere. Moisture condition for fine grained soils is described relative to the plastic limit or liquid limit as specified in AS1726-2017. CONSISTENCY AND DENSITY
Fine Grained Soils Coarse Grained Soils Symbol Term Undrained Shear Strength Symbol Term Density Index (%) SPN “N” *
VS Very Soft 0 to 12 kPa VL Very Loose Less than 15 0 to 4 S Soft 12 to 25 kPa L Loose 15 to 35 4 to 10 F Firm 25 to 50 kPa MD Medium Dense 35 to 65 10 to 30 St Stiff 50 to 100 kPa D Dense 65 to 85 30 to 50
VSt Very Stiff 100 to 200 kPa VD Very Dense Above 85 Above 50 H Hard Above 200 kPa Fr Friable -
In the absence of test results, consistency and density may be assessed from correlations with the observed behaviour of the material. * SPT correlations are not stated in AS1726-2017, and may be subject to corrections for overburden pressure and equipment type. CEMENTATION Weakly Cemented The soil may be easily disaggregated by hand in air or water. Moderately Cemented Effort is required to disaggregate the soil by hand in air or water.

L-M
M-H
FILL: CLAYhigh plasticity, dark brown / grey
CLAYhigh plasticity, pale brown
END OF HAND AUGER @ 1.50 mTARGET DEPTHGROUNDWATER NOT ENCOUNTEREDSOIL VAPOUR PROBE INSTALLED
CH
CH0.40
43.56
43.16
42.06
HA
0.00 mPID = 0 ppm
PID = 0 ppm
PID = 0 ppm
GN
E
M(>PL)
M(<PL)
SV
01
Gattic
Bentonite /Grout
Bentonite
Filter pack
SHEET: 1 OF 1
Field Material DescriptionSamplingDrilling
PE
NE
TRA
TIO
NR
ES
ISTA
NC
E
SOIL/ROCK MATERIAL DESCRIPTION
RE
CO
VE
RE
D
GR
OU
P S
YM
BO
L
WA
TER
RLDEPTH
DE
PTH
(met
res)
ME
THO
D
GR
AP
HIC
LOG
SAMPLE ORFIELD TEST
GAP gINT FN. F01dRL3
CLIENT:PROJECT:LOCATION:JOB NO:
DATE: 20/5/19DATE: 31/5/19
This report of hand augered borehole must be read in conjunction with accompanying notes and abbreviations. It has beenprepared for environmental purposes only, without attempt to consider geotechnical properties or the geotechnical significance of
the materials encountered. As such it should not be relied upon for geotechnical purposes.
EPAEPA Unley Stage 3Unley19121313
COORDS: 281364.5 m E 6129958.4 m N MGA94 54SURFACE RL: 43.56 m DATUM: AHDINCLINATION: -90°HOLE DEPTH: 1.50 m
LOGGED: OHCHECKED: ES
REPORT OF HAND AUGERED BOREHOLE: BH01/SV01
GAP
8_1
6.4
LIB.
GLB
Log
GAP
NO
N-C
OR
ED
FU
LL P
AGE
191
2131
3 G
INT.
GPJ
<<D
raw
ingF
ile>>
07/
06/2
019
11:3
9 8
.30.
004
Dat
gel T
ools
MO
ISTU
RE
CO
ND
ITIO
NC
ON
SIS
TEN
CY
DE
NS
ITY
PIEZOMETER DETAILS
SV01ID Static Water Level
0.0
0.5
1.0
1.5
2.0
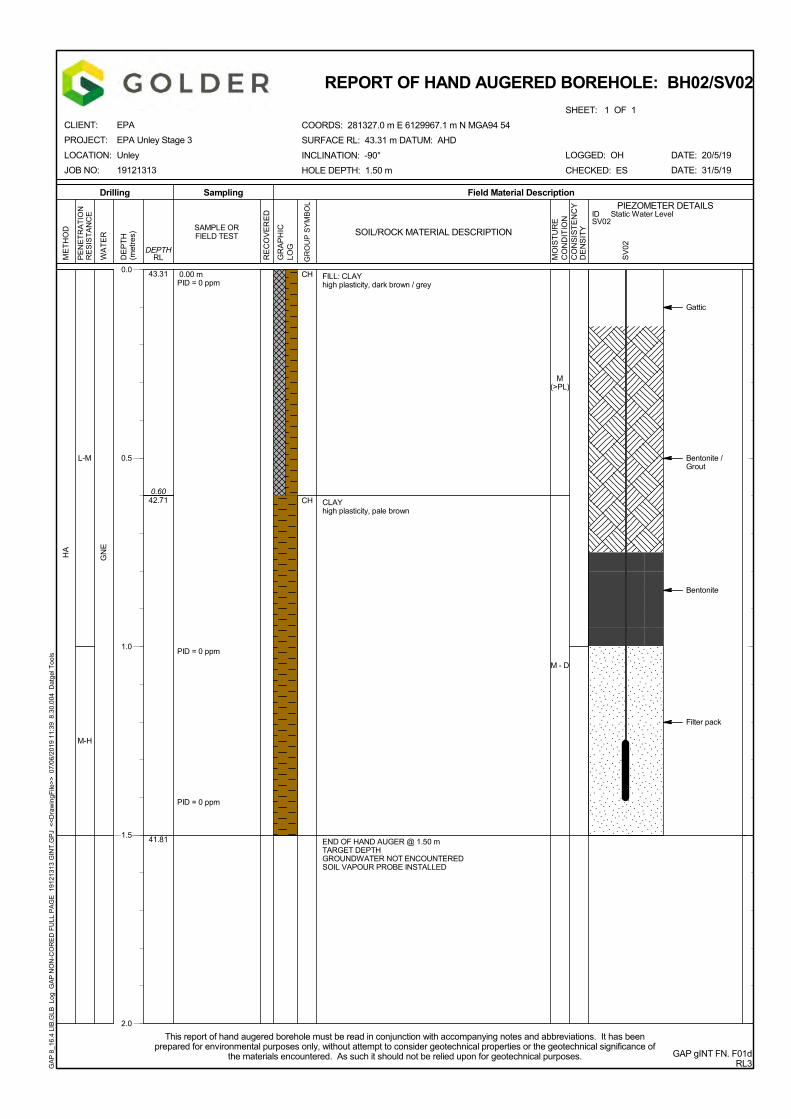
L-M
M-H
FILL: CLAYhigh plasticity, dark brown / grey
CLAYhigh plasticity, pale brown
END OF HAND AUGER @ 1.50 mTARGET DEPTHGROUNDWATER NOT ENCOUNTEREDSOIL VAPOUR PROBE INSTALLED
CH
CH0.60
43.31
42.71
41.81
HA
0.00 mPID = 0 ppm
PID = 0 ppm
PID = 0 ppm
GN
E
M(>PL)
M - D
SV
02
Gattic
Bentonite /Grout
Bentonite
Filter pack
SHEET: 1 OF 1
Field Material DescriptionSamplingDrilling
PE
NE
TRA
TIO
NR
ES
ISTA
NC
E
SOIL/ROCK MATERIAL DESCRIPTION
RE
CO
VE
RE
D
GR
OU
P S
YM
BO
L
WA
TER
RLDEPTH
DE
PTH
(met
res)
ME
THO
D
GR
AP
HIC
LOG
SAMPLE ORFIELD TEST
GAP gINT FN. F01dRL3
CLIENT:PROJECT:LOCATION:JOB NO:
DATE: 20/5/19DATE: 31/5/19
This report of hand augered borehole must be read in conjunction with accompanying notes and abbreviations. It has beenprepared for environmental purposes only, without attempt to consider geotechnical properties or the geotechnical significance of
the materials encountered. As such it should not be relied upon for geotechnical purposes.
EPAEPA Unley Stage 3Unley19121313
COORDS: 281327.0 m E 6129967.1 m N MGA94 54SURFACE RL: 43.31 m DATUM: AHDINCLINATION: -90°HOLE DEPTH: 1.50 m
LOGGED: OHCHECKED: ES
REPORT OF HAND AUGERED BOREHOLE: BH02/SV02
GAP
8_1
6.4
LIB.
GLB
Log
GAP
NO
N-C
OR
ED
FU
LL P
AGE
191
2131
3 G
INT.
GPJ
<<D
raw
ingF
ile>>
07/
06/2
019
11:3
9 8
.30.
004
Dat
gel T
ools
MO
ISTU
RE
CO
ND
ITIO
NC
ON
SIS
TEN
CY
DE
NS
ITY
PIEZOMETER DETAILS
SV02ID Static Water Level
0.0
0.5
1.0
1.5
2.0
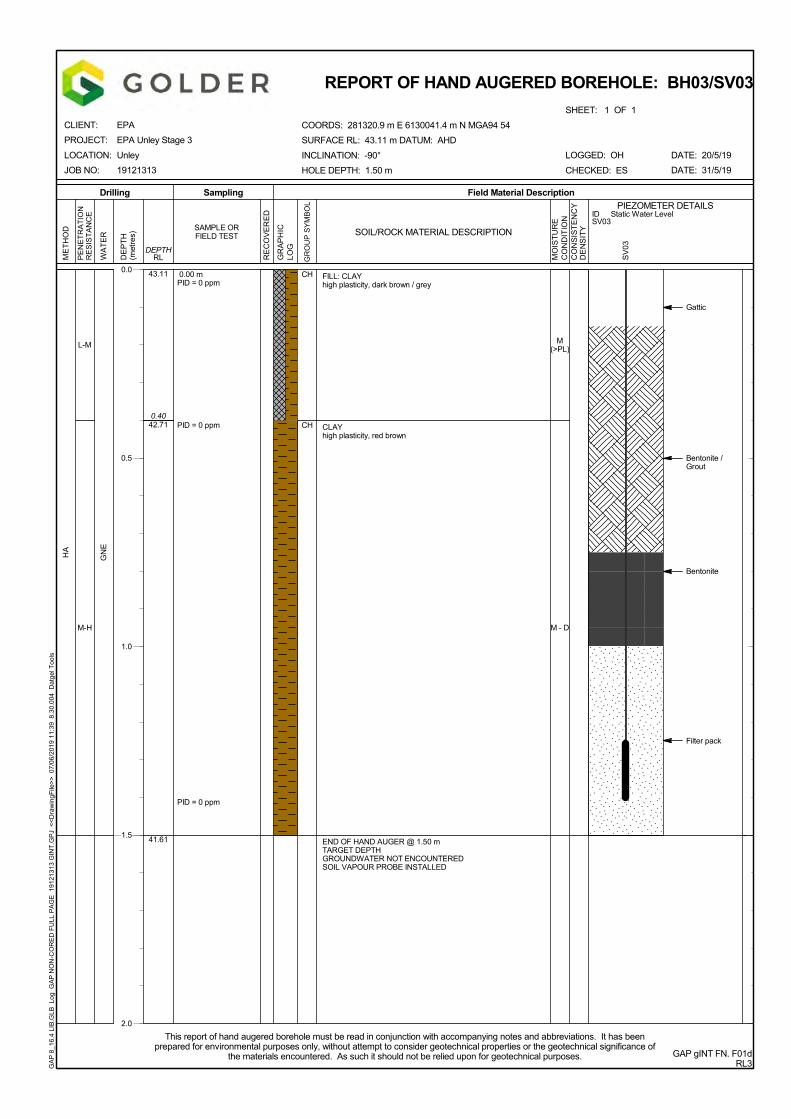
L-M
M-H
FILL: CLAYhigh plasticity, dark brown / grey
CLAYhigh plasticity, red brown
END OF HAND AUGER @ 1.50 mTARGET DEPTHGROUNDWATER NOT ENCOUNTEREDSOIL VAPOUR PROBE INSTALLED
CH
CH0.40
43.11
42.71
41.61
HA
0.00 mPID = 0 ppm
PID = 0 ppm
PID = 0 ppm
GN
E
M(>PL)
M - DS
V03
Gattic
Bentonite /Grout
Bentonite
Filter pack
SHEET: 1 OF 1
Field Material DescriptionSamplingDrilling
PE
NE
TRA
TIO
NR
ES
ISTA
NC
E
SOIL/ROCK MATERIAL DESCRIPTION
RE
CO
VE
RE
D
GR
OU
P S
YM
BO
L
WA
TER
RLDEPTH
DE
PTH
(met
res)
ME
THO
D
GR
AP
HIC
LOG
SAMPLE ORFIELD TEST
GAP gINT FN. F01dRL3
CLIENT:PROJECT:LOCATION:JOB NO:
DATE: 20/5/19DATE: 31/5/19
This report of hand augered borehole must be read in conjunction with accompanying notes and abbreviations. It has beenprepared for environmental purposes only, without attempt to consider geotechnical properties or the geotechnical significance of
the materials encountered. As such it should not be relied upon for geotechnical purposes.
EPAEPA Unley Stage 3Unley19121313
COORDS: 281320.9 m E 6130041.4 m N MGA94 54SURFACE RL: 43.11 m DATUM: AHDINCLINATION: -90°HOLE DEPTH: 1.50 m
LOGGED: OHCHECKED: ES
REPORT OF HAND AUGERED BOREHOLE: BH03/SV03
GAP
8_1
6.4
LIB.
GLB
Log
GAP
NO
N-C
OR
ED
FU
LL P
AGE
191
2131
3 G
INT.
GPJ
<<D
raw
ingF
ile>>
07/
06/2
019
11:3
9 8
.30.
004
Dat
gel T
ools
MO
ISTU
RE
CO
ND
ITIO
NC
ON
SIS
TEN
CY
DE
NS
ITY
PIEZOMETER DETAILS
SV03ID Static Water Level
0.0
0.5
1.0
1.5
2.0

L-M
M-H
FILL: FOOTPATH PAVING
FILL: SANDfine to coarse grained, orangegrey
Sandy CLAYmedium to high plasticity, grey brown, fine to coarse grained sand
CLAYmedium to high plasticity, pale brown / pale orange
END OF HAND AUGER @ 1.50 mTARGET DEPTHGROUNDWATER NOT ENCOUNTEREDSOIL VAPOUR PROBE INSTALLED
SP
CI-CH
CI-CH
0.06
0.10
0.20
0.40
43.05
42.99
42.95
42.85
42.65
41.55
HA
0.00 m
PID = 0 ppm
PID = 0 ppm
PID = 0 ppm
PID = 0 ppm
GN
E
M
M(>PL)
M(<PL)
SV
04
Gattic
Bentonite /Grout
Bentonite
Filter pack
SHEET: 1 OF 1
Field Material DescriptionSamplingDrilling
PE
NE
TRA
TIO
NR
ES
ISTA
NC
E
SOIL/ROCK MATERIAL DESCRIPTION
RE
CO
VE
RE
D
GR
OU
P S
YM
BO
L
WA
TER
RLDEPTH
DE
PTH
(met
res)
ME
THO
D
GR
AP
HIC
LOG
SAMPLE ORFIELD TEST
GAP gINT FN. F01dRL3
CLIENT:PROJECT:LOCATION:JOB NO:
DATE: 20/5/19DATE: 31/5/19
This report of hand augered borehole must be read in conjunction with accompanying notes and abbreviations. It has beenprepared for environmental purposes only, without attempt to consider geotechnical properties or the geotechnical significance of
the materials encountered. As such it should not be relied upon for geotechnical purposes.
EPAEPA Unley Stage 3Unley19121313
COORDS: 281308.2 m E 6130066.5 m N MGA94 54SURFACE RL: 43.05 m DATUM: AHDINCLINATION: -90°HOLE DEPTH: 1.50 m
LOGGED: OHCHECKED: ES
REPORT OF HAND AUGERED BOREHOLE: BH04/SV04
GAP
8_1
6.4
LIB.
GLB
Log
GAP
NO
N-C
OR
ED
FU
LL P
AGE
191
2131
3 G
INT.
GPJ
<<D
raw
ingF
ile>>
07/
06/2
019
11:3
9 8
.30.
004
Dat
gel T
ools
MO
ISTU
RE
CO
ND
ITIO
NC
ON
SIS
TEN
CY
DE
NS
ITY
PIEZOMETER DETAILS
SV04ID Static Water Level
0.0
0.5
1.0
1.5
2.0

L-M
M-H
FILL: FOOTPATH PAVING
FILL: SANDfine to medium grained, orange brownFILL: Sandy GRAVELfine to coarse grained, sub-rounded to sub-angular, dark brown,fine to coarse grained sand
CLAYhigh plasticity, orange brown
END OF HAND AUGER @ 1.50 mTARGET DEPTHGROUNDWATER NOT ENCOUNTEREDSOIL VAPOUR PROBE INSTALLED
SP
GP
CH
0.06
0.10
0.20
43.27
43.21
43.17
43.07
41.77
HA
0.00 m
PID = 0 ppm
PID = 0 ppm
PID = 0 ppm
GN
E
M
M(<PL)
SV
05
Gattic
Bentonite /Grout
Bentonite
Filter pack
SHEET: 1 OF 1
Field Material DescriptionSamplingDrilling
PE
NE
TRA
TIO
NR
ES
ISTA
NC
E
SOIL/ROCK MATERIAL DESCRIPTION
RE
CO
VE
RE
D
GR
OU
P S
YM
BO
L
WA
TER
RLDEPTH
DE
PTH
(met
res)
ME
THO
D
GR
AP
HIC
LOG
SAMPLE ORFIELD TEST
GAP gINT FN. F01dRL3
CLIENT:PROJECT:LOCATION:JOB NO:
DATE: 20/5/19DATE: 31/5/19
This report of hand augered borehole must be read in conjunction with accompanying notes and abbreviations. It has beenprepared for environmental purposes only, without attempt to consider geotechnical properties or the geotechnical significance of
the materials encountered. As such it should not be relied upon for geotechnical purposes.
EPAEPA Unley Stage 3Unley19121313
COORDS: 281345.8 m E 6130061.2 m N MGA94 54SURFACE RL: 43.27 m DATUM: AHDINCLINATION: -90°HOLE DEPTH: 1.50 m
LOGGED: OHCHECKED: ES
REPORT OF HAND AUGERED BOREHOLE: BH05/SV05
GAP
8_1
6.4
LIB.
GLB
Log
GAP
NO
N-C
OR
ED
FU
LL P
AGE
191
2131
3 G
INT.
GPJ
<<D
raw
ingF
ile>>
07/
06/2
019
11:3
9 8
.30.
004
Dat
gel T
ools
MO
ISTU
RE
CO
ND
ITIO
NC
ON
SIS
TEN
CY
DE
NS
ITY
PIEZOMETER DETAILS
SV05ID Static Water Level
0.0
0.5
1.0
1.5
2.0

L-M
M-H
FILL: CLAYhigh plasticity, dark brown, with fine to coarse, sub-angular toangular gravel
CLAYmedium to high plasticity, pale brown / orange brown
END OF HAND AUGER @ 1.40 mREFUSALGROUNDWATER NOT ENCOUNTEREDSOIL VAPOUR PROBE INSTALLED
CH
CI-CH
0.40
43.62
43.22
42.22
HA
0.00 mPID = 0 ppm
PID = 0 ppm
PID = 0 ppm
GN
E
W(>LL)
M(>PL)
SV
06
Gattic
Bentonite /Grout
Bentonite
Filter pack
SHEET: 1 OF 1
Field Material DescriptionSamplingDrilling
PE
NE
TRA
TIO
NR
ES
ISTA
NC
E
SOIL/ROCK MATERIAL DESCRIPTION
RE
CO
VE
RE
D
GR
OU
P S
YM
BO
L
WA
TER
RLDEPTH
DE
PTH
(met
res)
ME
THO
D
GR
AP
HIC
LOG
SAMPLE ORFIELD TEST
GAP gINT FN. F01dRL3
CLIENT:PROJECT:LOCATION:JOB NO:
DATE: 20/5/19DATE: 31/5/19
This report of hand augered borehole must be read in conjunction with accompanying notes and abbreviations. It has beenprepared for environmental purposes only, without attempt to consider geotechnical properties or the geotechnical significance of
the materials encountered. As such it should not be relied upon for geotechnical purposes.
EPAEPA Unley Stage 3Unley19121313
COORDS: 281382.8 m E 6130064.4 m N MGA94 54SURFACE RL: 43.62 m DATUM: AHDINCLINATION: -90°HOLE DEPTH: 1.40 m
LOGGED: OHCHECKED: ES
REPORT OF HAND AUGERED BOREHOLE: BH06/SV06
GAP
8_1
6.4
LIB.
GLB
Log
GAP
NO
N-C
OR
ED
FU
LL P
AGE
191
2131
3 G
INT.
GPJ
<<D
raw
ingF
ile>>
07/
06/2
019
11:3
9 8
.30.
004
Dat
gel T
ools
MO
ISTU
RE
CO
ND
ITIO
NC
ON
SIS
TEN
CY
DE
NS
ITY
PIEZOMETER DETAILS
SV06ID Static Water Level
0.0
0.5
1.0
1.5
2.0
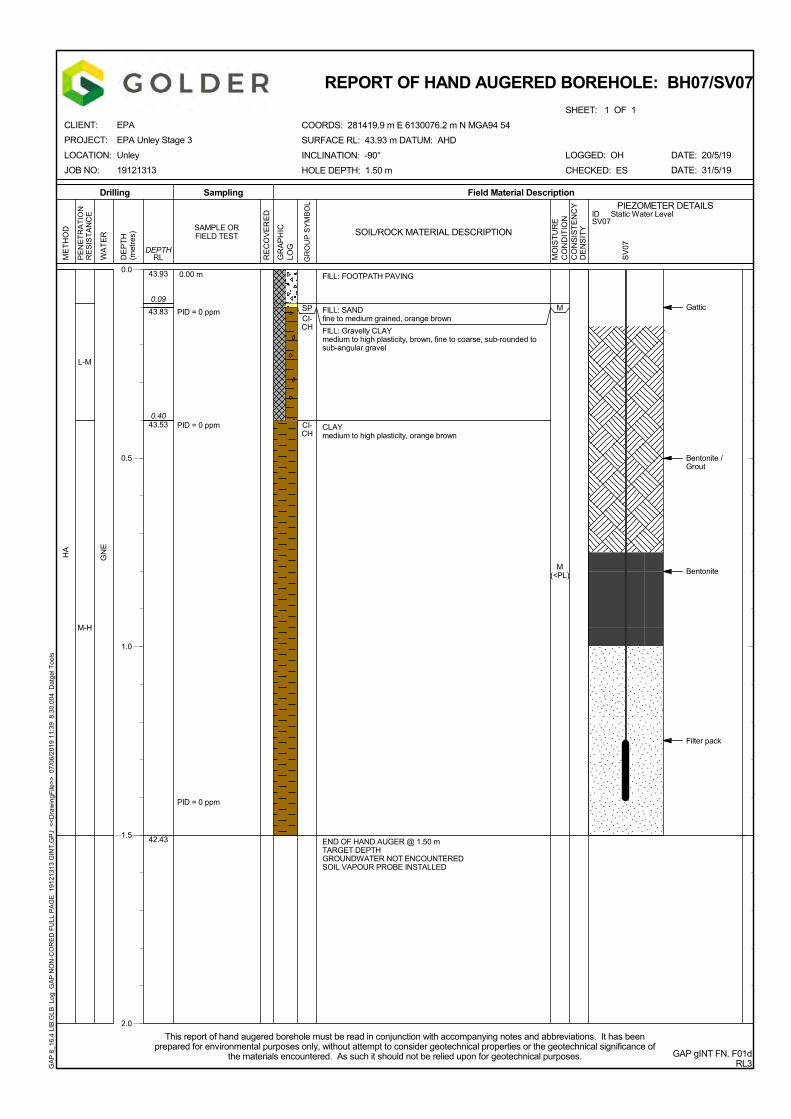
L-M
M-H
FILL: FOOTPATH PAVING
FILL: SANDfine to medium grained, orange brownFILL: Gravelly CLAYmedium to high plasticity, brown, fine to coarse, sub-rounded tosub-angular gravel
CLAYmedium to high plasticity, orange brown
END OF HAND AUGER @ 1.50 mTARGET DEPTHGROUNDWATER NOT ENCOUNTEREDSOIL VAPOUR PROBE INSTALLED
SPCI-CH
CI-CH
0.09
0.40
43.93
43.83
43.53
42.43
HA
0.00 m
PID = 0 ppm
PID = 0 ppm
PID = 0 ppm
GN
E
M
M(<PL)
SV
07
Gattic
Bentonite /Grout
Bentonite
Filter pack
SHEET: 1 OF 1
Field Material DescriptionSamplingDrilling
PE
NE
TRA
TIO
NR
ES
ISTA
NC
E
SOIL/ROCK MATERIAL DESCRIPTION
RE
CO
VE
RE
D
GR
OU
P S
YM
BO
L
WA
TER
RLDEPTH
DE
PTH
(met
res)
ME
THO
D
GR
AP
HIC
LOG
SAMPLE ORFIELD TEST
GAP gINT FN. F01dRL3
CLIENT:PROJECT:LOCATION:JOB NO:
DATE: 20/5/19DATE: 31/5/19
This report of hand augered borehole must be read in conjunction with accompanying notes and abbreviations. It has beenprepared for environmental purposes only, without attempt to consider geotechnical properties or the geotechnical significance of
the materials encountered. As such it should not be relied upon for geotechnical purposes.
EPAEPA Unley Stage 3Unley19121313
COORDS: 281419.9 m E 6130076.2 m N MGA94 54SURFACE RL: 43.93 m DATUM: AHDINCLINATION: -90°HOLE DEPTH: 1.50 m
LOGGED: OHCHECKED: ES
REPORT OF HAND AUGERED BOREHOLE: BH07/SV07
GAP
8_1
6.4
LIB.
GLB
Log
GAP
NO
N-C
OR
ED
FU
LL P
AGE
191
2131
3 G
INT.
GPJ
<<D
raw
ingF
ile>>
07/
06/2
019
11:3
9 8
.30.
004
Dat
gel T
ools
MO
ISTU
RE
CO
ND
ITIO
NC
ON
SIS
TEN
CY
DE
NS
ITY
PIEZOMETER DETAILS
SV07ID Static Water Level
0.0
0.5
1.0
1.5
2.0

L-M
M-H
FILL: FOOTPATH PAVING
FILL: SANDfine to medium grained, orange brownFILL: CLAYmedium plasticity, dark brownCLAYmedium to high plasticity, pale brown / orange brown
END OF HAND AUGER @ 1.50 mTARGET DEPTHGROUNDWATER NOT ENCOUNTEREDSOIL VAPOUR PROBE INSTALLED
SPCI
CI-CH
0.09
0.20
44.08
43.98
43.88
42.58
HA
0.00 m
PID = 0 ppm
PID = 0 ppm
PID = 0 ppm
PID = 0 ppm
PID = 0 ppm
GN
E
M
M(<PL)
SV
08
Gattic
Bentonite /Grout
Bentonite
Filter pack
SHEET: 1 OF 1
Field Material DescriptionSamplingDrilling
PE
NE
TRA
TIO
NR
ES
ISTA
NC
E
SOIL/ROCK MATERIAL DESCRIPTION
RE
CO
VE
RE
D
GR
OU
P S
YM
BO
L
WA
TER
RLDEPTH
DE
PTH
(met
res)
ME
THO
D
GR
AP
HIC
LOG
SAMPLE ORFIELD TEST
GAP gINT FN. F01dRL3
CLIENT:PROJECT:LOCATION:JOB NO:
DATE: 20/5/19DATE: 31/5/19
This report of hand augered borehole must be read in conjunction with accompanying notes and abbreviations. It has beenprepared for environmental purposes only, without attempt to consider geotechnical properties or the geotechnical significance of
the materials encountered. As such it should not be relied upon for geotechnical purposes.
EPAEPA Unley Stage 3Unley19121313
COORDS: 281438.5 m E 6130077.8 m N MGA94 54SURFACE RL: 44.08 m DATUM: AHDINCLINATION: -90°HOLE DEPTH: 1.50 m
LOGGED: OHCHECKED: ES
REPORT OF HAND AUGERED BOREHOLE: BH08/SV08
GAP
8_1
6.4
LIB.
GLB
Log
GAP
NO
N-C
OR
ED
FU
LL P
AGE
191
2131
3 G
INT.
GPJ
<<D
raw
ingF
ile>>
07/
06/2
019
11:3
9 8
.30.
004
Dat
gel T
ools
MO
ISTU
RE
CO
ND
ITIO
NC
ON
SIS
TEN
CY
DE
NS
ITY
PIEZOMETER DETAILS
SV08ID Static Water Level
0.0
0.5
1.0
1.5
2.0

PROJECT INFORMATION
Project Number: Gas Bore ID:
Client: Bore Depth:
Site Location: Date:
Sample Type Sampled By:
GAS BORE DATA
Ambient Temperature Sample train Volume (mL) Clean Sampling Line Yes
Barometric Pressure (kPa) Bore Volume (mL) Leak Check (Helium) Yes
Relative Humidity (%) Purge Volume (mL) Purged Bore Line Yes
Rain Dry Purge time @50mL/min (mins)
Water Logged No
EQUIPMENT RECORD
Calibration Date
Purge Pump 14/06/2018 Flow Controller
Rotameter Canister Number
Helium Dectector 10/10/2018 Date Cleaned
SAMPLING RECORD
Time Helium (ppm) Vacuum (Hg) Time Helium (ppm) Vacuum (Hg)
Start 8:35 600,000 -28
8:40 500,000 -21
8:45 400,000 -14
8:49 300,000 -8
Finish
NOTES
PID = 0.5 ppm
Helium = 5000 ppm
SOIL GAS SAMPLING RECORD FORM
19121313
EPA
Unley
SV01
1.2
23/05/2019
2
Primary ES
9
22
92
Information recorded on site Purging Information (Calculated) Pre Sample Checklist
1899
3530
14/05/2019
ID
SKC AirChek XR5000
Gas Check G3
Defender 510-M

PROJECT INFORMATION
Project Number: Gas Bore ID:
Client: Bore Depth:
Site Location: Date:
Sample Type Sampled By:
GAS BORE DATA
Ambient Temperature Sample train Volume (mL) Clean Sampling Line Yes
Barometric Pressure (kPa) Bore Volume (mL) Leak Check (Helium) Yes
Relative Humidity (%) Purge Volume (mL) Purged Bore Line Yes
Rain Dry Purge time @50mL/min (mins)
Water Logged No
EQUIPMENT RECORD
Calibration Date
Purge Pump 14/06/2018 Flow Controller
Rotameter Canister Number
Helium Dectector 10/10/2018 Date Cleaned
SAMPLING RECORD
Time Helium (ppm) Vacuum (Hg) Time Helium (ppm) Vacuum (Hg)
Start 9:29 860,000 -29.5
9:34 700,000 -22
9:39 550,000 -14
9:44 450,000 -8
Finish
NOTES
PID = 0.3 ppm
Helium = 5000 ppm
SOIL GAS SAMPLING RECORD FORM
19121313
EPA
Unley
SV02
1.2
23/05/2019
2
Primary ES
9
22
92
Information recorded on site Purging Information (Calculated) Pre Sample Checklist
2078
3526
24/04/2019
ID
SKC AirChek XR5000
Gas Check G3
Defender 510-M

PROJECT INFORMATION
Project Number: Gas Bore ID:
Client: Bore Depth:
Site Location: Date:
Sample Type Sampled By:
GAS BORE DATA
Ambient Temperature Sample train Volume (mL) Clean Sampling Line Yes
Barometric Pressure (kPa) Bore Volume (mL) Leak Check (Helium) Yes
Relative Humidity (%) Purge Volume (mL) Purged Bore Line Yes
Rain Dry Purge time @50mL/min (mins)
Water Logged No
EQUIPMENT RECORD
Calibration Date
Purge Pump 14/06/2018 Flow Controller
Rotameter Canister Number
Helium Dectector 10/10/2018 Date Cleaned
SAMPLING RECORD
Time Helium (ppm) Vacuum (Hg) Time Helium (ppm) Vacuum (Hg)
Start 10:10 820,000 -30
10:15 650,00 -23
10:20 5500,00 -15
10:24 470,00 -8
Finish
NOTES
Purging Information (Calculated) Pre Sample Checklist
1752
3641
24/04/2019
ID
SKC AirChek XR5000
Gas Check G3
Defender 510-M
PID = 0.6 ppm
Helium = 9,000 ppm
SOIL GAS SAMPLING RECORD FORM
19121313
EPA
Unley
SV03
1.2
23/05/2019
2
Primary ES
9
22
92
Information recorded on site

PROJECT INFORMATION
Project Number: Gas Bore ID:
Client: Bore Depth:
Site Location: Date:
Sample Type Sampled By:
GAS BORE DATA
Ambient Temperature Sample train Volume (mL) Clean Sampling Line Yes
Barometric Pressure (kPa) Bore Volume (mL) Leak Check (Helium) Yes
Relative Humidity (%) Purge Volume (mL) Purged Bore Line Yes
Rain Dry Purge time @50mL/min (mins)
Water Logged No
EQUIPMENT RECORD
Calibration Date
Purge Pump 14/06/2018 Flow Controller
Rotameter Canister Number
Helium Dectector 10/10/2018 Date Cleaned
SAMPLING RECORD
Time Helium (ppm) Vacuum (Hg) Time Helium (ppm) Vacuum (Hg)
Start 10:45 900,000 -30
10:50 800,000 -24
10:55 650,000 -16
11:00 550,000 -8
Finish
NOTES
PID = 0.3 ppm
Helium = 3,000 ppm
SOIL GAS SAMPLING RECORD FORM
19121313
EPA
Unley
SV04
1.2
23/05/2019
2
Primary ES
9
22
92
Information recorded on site Purging Information (Calculated) Pre Sample Checklist
1751
1872
18/04/2019
ID
SKC AirChek XR5000
Gas Check G3
Defender 510-M

PROJECT INFORMATION
Project Number: Gas Bore ID:
Client: Bore Depth:
Site Location: Date:
Sample Type Sampled By:
GAS BORE DATA
Ambient Temperature Sample train Volume (mL) Clean Sampling Line Yes
Barometric Pressure (kPa) Bore Volume (mL) Leak Check (Helium) Yes
Relative Humidity (%) Purge Volume (mL) Purged Bore Line Yes
Rain Dry Purge time @50mL/min (mins)
Water Logged No
EQUIPMENT RECORD
Calibration Date
Purge Pump 14/06/2018 Flow Controller
Rotameter Canister Number
Helium Dectector 10/10/2018 Date Cleaned
SAMPLING RECORD
Time Helium (ppm) Vacuum (Hg) Time Helium (ppm) Vacuum (Hg)
Start 11:03 900,000 -28
11:08 780,000 -22
11:13 650,000 -15
11:18 550,000 -8
Finish
NOTES
Purging Information (Calculated) Pre Sample Checklist
1747
1884
14/05/2019
ID
SKC AirChek XR5000
Gas Check G3
Defender 510-M
Replicate sample of SV04.
SOIL GAS SAMPLING RECORD FORM
19121313
EPA
Unley
SV04-R
1.2
23/05/2019
2
Replicate ES
9
22
92
Information recorded on site
PROJECT INFORMATION
Project Number: Gas Bore ID:
Client: Bore Depth:
Site Location: Date:
Sample Type Sampled By:
GAS BORE DATA
Ambient Temperature Sample train Volume (mL) Clean Sampling Line Yes
Barometric Pressure (kPa) Bore Volume (mL) Leak Check (Helium) Yes
Relative Humidity (%) Purge Volume (mL) Purged Bore Line Yes
Rain Dry Purge time @50mL/min (mins)
Water Logged No
EQUIPMENT RECORD
Calibration Date
Purge Pump 14/06/2018 Flow Controller
Rotameter Canister Number
Helium Dectector 10/10/2018 Date Cleaned
SAMPLING RECORD
Time Helium (ppm) Vacuum (Hg) Time Helium (ppm) Vacuum (Hg)
Start 11:49 900,000 -30
11:54 700,000 -23
11:59 530,000 -15
12:03 450,000 -8
Finish
NOTES
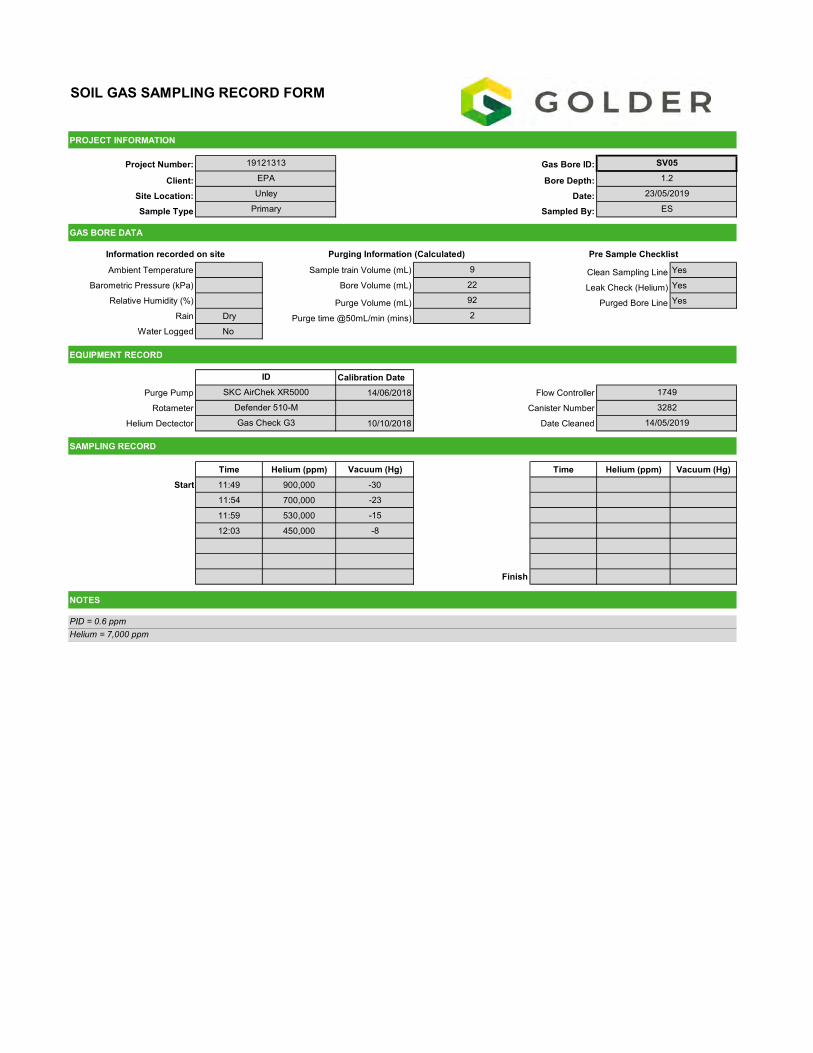
Purging Information (Calculated) Pre Sample Checklist
1749
3282
14/05/2019
ID
SKC AirChek XR5000
Gas Check G3
Defender 510-M
PID = 0.6 ppm
Helium = 7,000 ppm
SOIL GAS SAMPLING RECORD FORM
19121313
EPA
Unley
SV05
1.2
23/05/2019
2
Primary ES
9
22
92
Information recorded on site

PROJECT INFORMATION
Project Number: Gas Bore ID:
Client: Bore Depth:
Site Location: Date:
Sample Type Sampled By:
GAS BORE DATA
Ambient Temperature Sample train Volume (mL) Clean Sampling Line Yes
Barometric Pressure (kPa) Bore Volume (mL) Leak Check (Helium) Yes
Relative Humidity (%) Purge Volume (mL) Purged Bore Line Yes
Rain Dry Purge time @50mL/min (mins)
Water Logged Yes
EQUIPMENT RECORD
Calibration Date
Purge Pump 14/06/2018 Flow Controller
Rotameter Canister Number
Helium Dectector 10/10/2018 Date Cleaned
SAMPLING RECORD
Time Helium (ppm) Vacuum (Hg) Time Helium (ppm) Vacuum (Hg)
Start 14:19 850,000 -30
14:24 650,000 -23.5
14:29 500,000 -14.5
14:34 350,000 -8
Finish
NOTES
Purging Information (Calculated) Pre Sample Checklist
1745 or 1779
3536
24/04/2019
ID
SKC AirChek XR5000
Gas Check G3
Defender 510-M
PID = 1.5 ppm
Helium = 2,000 ppm
SOIL GAS SAMPLING RECORD FORM
19121313
EPA
Unley
SV06
1.2
23/05/2019
2
Primary ES
9
22
92
Information recorded on site

PROJECT INFORMATION
Project Number: Gas Bore ID:
Client: Bore Depth:
Site Location: Date:
Sample Type Sampled By:
GAS BORE DATA
Ambient Temperature Sample train Volume (mL) Clean Sampling Line Yes
Barometric Pressure (kPa) Bore Volume (mL) Leak Check (Helium) Yes
Relative Humidity (%) Purge Volume (mL) Purged Bore Line Yes
Rain Dry Purge time @50mL/min (mins)
Water Logged No
EQUIPMENT RECORD
Calibration Date
Purge Pump 14/06/2018 Flow Controller
Rotameter Canister Number
Helium Dectector 10/10/2018 Date Cleaned
SAMPLING RECORD
Time Helium (ppm) Vacuum (Hg) Time Helium (ppm) Vacuum (Hg)
Start 14:36 850,000 -29
14:41 750,000 -21
14:46 550,00 -13
14:51 450,000 -8
Finish
NOTES
Replicate sample of SV06.
SOIL GAS SAMPLING RECORD FORM
19121313
EPA
Unley
SV06-R
1.2
23/05/2019
2
Replicate ES
9
22
92
Information recorded on site Purging Information (Calculated) Pre Sample Checklist
SG1020
SC3699
ID
SKC AirChek XR5000
Gas Check G3
Defender 510-M

PROJECT INFORMATION
Project Number: Gas Bore ID:
Client: Bore Depth:
Site Location: Date:
Sample Type Sampled By:
GAS BORE DATA
Ambient Temperature Sample train Volume (mL) Clean Sampling Line Yes
Barometric Pressure (kPa) Bore Volume (mL) Leak Check (Helium) Yes
Relative Humidity (%) Purge Volume (mL) Purged Bore Line Yes
Rain Dry Purge time @50mL/min (mins)
Water Logged No
EQUIPMENT RECORD
Calibration Date
Purge Pump 14/06/2018 Flow Controller
Rotameter Canister Number
Helium Dectector 10/10/2018 Date Cleaned
SAMPLING RECORD
Time Helium (ppm) Vacuum (Hg) Time Helium (ppm) Vacuum (Hg)
Start 12:43 950,000 -30
12:48 900,000 -23
12:53 770,000 -15
12:57 700,000 -8
Finish
NOTES
Purging Information (Calculated) Pre Sample Checklist
1748
3503
24/04/2019
ID
SKC AirChek XR5000
Gas Check G3
Defender 510-M
PID = 0.8 ppm
Helium = 7,000 ppm
SOIL GAS SAMPLING RECORD FORM
19121313
EPA
Unley
SV07
1.2
23/05/2019
2
Primary ES
9
22
92
Information recorded on site

PROJECT INFORMATION
Project Number: Gas Bore ID:
Client: Bore Depth:
Site Location: Date:
Sample Type Sampled By:
GAS BORE DATA
Ambient Temperature Sample train Volume (mL) Clean Sampling Line Yes
Barometric Pressure (kPa) Bore Volume (mL) Leak Check (Helium) Yes
Relative Humidity (%) Purge Volume (mL) Purged Bore Line Yes
Rain Dry Purge time @50mL/min (mins)
Water Logged No
EQUIPMENT RECORD
Calibration Date
Purge Pump 14/06/2018 Flow Controller
Rotameter Canister Number
Helium Dectector Date Cleaned
SAMPLING RECORD
Time Helium (ppm) Vacuum (Hg) Time Helium (ppm) Vacuum (Hg)
Start 13:20 850,000 -30
13:25 650,000 -23
13:30 550,000 -15
13:35 500,000 -8
Finish
NOTES
Purging Information (Calculated) Pre Sample Checklist
1753
3522
6/05/2019
ID
SKC AirChek XR5000
Gas Check G3
Defender 510-M
PID = 0.5 ppm
Helium = 4,000 ppm
SOIL GAS SAMPLING RECORD FORM
19121313
EPA
Unley
SV08
1.2
23/05/2019
2
Primary ES
9
22
92
Information recorded on site

APPENDIX C
Photographs
20 June 2019 19121313-001-R-Rev0

Project number: 19121313
Project name: EPA Unley ‐ Stage 3
Photograph 1: Finished SV bore at loca on SV01
Photograph 2: Finished SV bore at loca on SV02
Project number:
Project name:
Site Address:
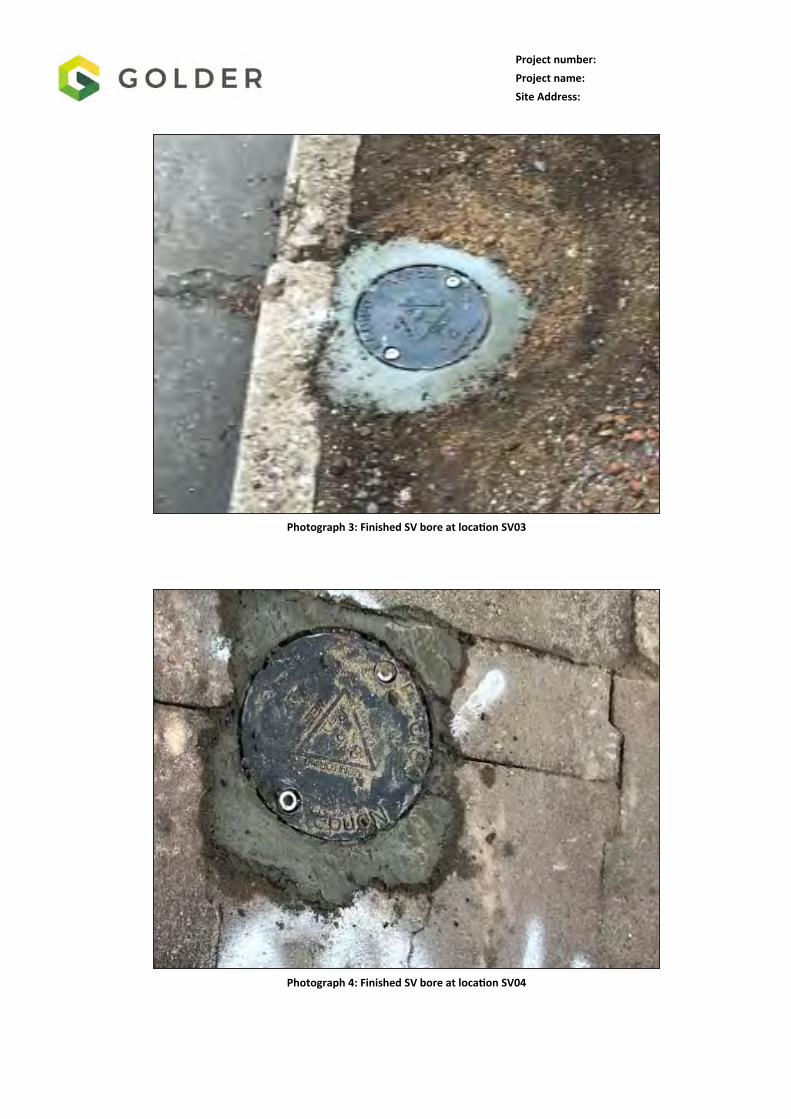
Photograph 3: Finished SV bore at loca on SV03
Photograph 4: Finished SV bore at loca on SV04

Project number:
Project name:
Site Address:
Photograph 5: Finished SV bore at loca on SV05
Photograph 6: Finished SV bore at loca on SV06

Project number:
Project name:
Site Address:
Photograph 7: Finished SV bore at loca on SV07
Photograph 8: Finished SV bore at loca on SV08

0m 1m
1m 2m
CLIENT EPA PROJECT Unley - Stage 3DRAWN ES DATE 3-Jun-19 TITLE
CHECK JC DATE 3-Jun-19SCALE Not To Scale A4 PROJECT No. PHOTO No. 1
SV01
19121313
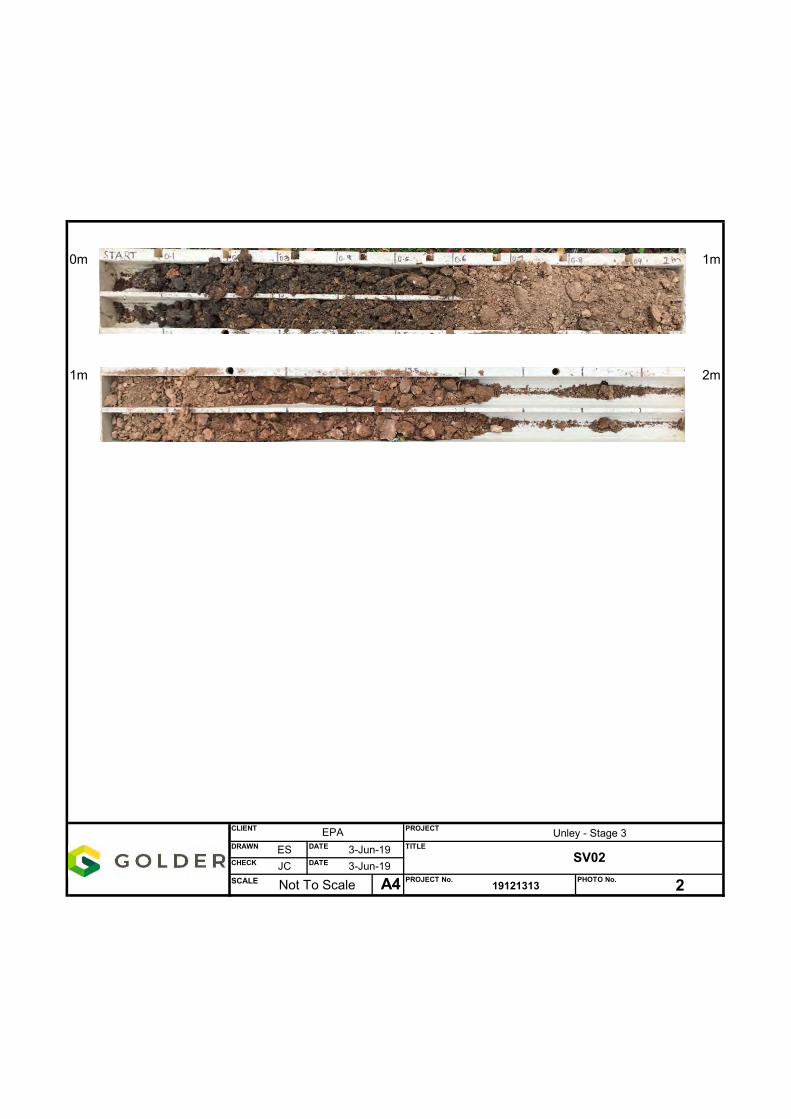
0m 1m
1m 2m
CLIENT EPA PROJECT Unley - Stage 3DRAWN ES DATE 3-Jun-19 TITLE
CHECK JC DATE 3-Jun-19SCALE Not To Scale A4 PROJECT No. PHOTO No. 2
SV02
19121313

0m 1m
1m 2m
CLIENT EPA PROJECT Unley - Stage 3DRAWN ES DATE 3-Jun-19 TITLE
CHECK JC DATE 3-Jun-19SCALE Not To Scale A4 PROJECT No. PHOTO No. 3
SV03
19121313

0m 1m
1m 2m
CLIENT EPA PROJECT Unley - Stage 3DRAWN ES DATE 3-Jun-19 TITLE
CHECK JC DATE 3-Jun-19SCALE Not To Scale A4 PROJECT No. PHOTO No. 4
SV04
19121313

0m 1m
1m 2m
CLIENT EPA PROJECT Unley - Stage 3DRAWN ES DATE 3-Jun-19 TITLE
CHECK JC DATE 3-Jun-19SCALE Not To Scale A4 PROJECT No. PHOTO No. 4
SV04
19121313

0m 1m
1m 2m
CLIENT EPA PROJECT Unley - Stage 3DRAWN ES DATE 3-Jun-19 TITLE
CHECK JC DATE 3-Jun-19SCALE Not To Scale A4 PROJECT No. PHOTO No. 4
SV04
19121313

APPENDIX D
Survey and Calibration Records
20 June 2019 19121313-001-R-Rev0


To: James Coley Company: Golder associates
Phone: 8213 2100 Fax: 8213 2101
From: Lincoln Jeffery Phone: 0414 840 569 Email: [email protected]
Date: 22/5/2019
SVB coordinates, District – North of Unley Shopping Centre
Well or Bore Easting Northing R.L. Top of PVC No. GDA2020 GDA2020 A.H.D.
SV1 281364.543 6129958.430 43.563
SV2 281327.004 6129967.073 43.309
SV3 281320.891 6130041.370 43.107
SV4 281308.178 6130066.548 43.050
SV5 281345.781 6130061.248 43.271
SV6 281382.824 6130064.416 43.619
SV7 281419.858 6130076.192 43.929
SV8 281438.533 6130077.821 44.084
All Survey information was based from the MGA94 grid system and Australian Height Datum(AHD), triangulated from Permanent Survey Marks in the vicinity of the site.

APPENDIX E
Chemical Table
20 June 2019 19121313-001-R-Rev0

Chemical Data Table Project number: 19121313Project: EPA Unley Stage 3
Other
Vacu
um b
efor
e A
naly
sis
Vacu
um b
efor
e Sh
ipm
ent
Hel
ium
1,1-
Dic
hlor
oeth
ene
cis-
1,2-
Dic
hlor
oeth
ene
tran
s-1,
2-di
chlo
roet
hene
Tric
hlor
oeth
ene
Tetr
achl
oroe
then
e
Viny
l chl
orid
e
Hg" Hg" % by Vol mg/m3 mg/m3 mg/m3 mg/m3 mg/m3 mg/m3EQL 0.01 0.002 0.002 0.002 0.0016 0.0034 0.0008NEPM 2013 Table 1A(2) Comm/Ind D Soil Vap VOCC HILs 0.3 0.08 8 0.1NEPM 2013 Table 1A(2) Rec C Soil Vap VOCC HILs 2 0.4 40 0.5NEPM 2013 Table 1A(2) Res A Soil Vap VOCC HILs 0.08 0.02 2 0.03NEPM 2013 Table 1A(2) Res B Soil Vap VOCC HILs 0.08 0.02 2 0.03
Well ID Sample ID DateLab Report
NumberSample Type
SV01 SV01 23/05/2019 218199 Normal -8 -30 <0.01 <0.002 <0.002 <0.002 <0.0016 <0.0034 <0.0008SV02 SV02 23/05/2019 218199 Normal -8 -30 <0.01 <0.002 <0.002 <0.002 <0.0016 <0.0034 <0.0008SV03 SV03 23/05/2019 218199 Normal -6 -30 <0.01 <0.002 <0.002 <0.002 <0.0016 0.004 <0.0008
SV04 23/05/2019 218199 Normal -5 -29 <0.01 <0.002 <0.002 <0.002 <0.0016 0.03 <0.0008SV04-R 23/05/2019 218199 Field_D -9 -30 <0.01 <0.002 <0.002 <0.002 <0.0016 0.03 <0.0008
SV05 SV05 23/05/2019 218199 Normal -8 -29 <0.01 <0.002 <0.002 <0.002 <0.0016 0.04 <0.0008SV06 23/05/2019 218199 Normal -8 -30 <0.01 <0.002 <0.002 <0.002 <0.0016 <0.0034 <0.0008
SV06-R 23/05/2019 M191237 Interlab_D 9.18 - <0.01 <0.0036 <0.0048 <0.0036 <0.0054 <0.0066 <0.0024SV07 SV07 23/05/2019 218199 Normal -7 -29 <0.01 <0.002 <0.002 <0.002 <0.0016 <0.0034 <0.0008SV08 SV08 23/05/2019 218199 Normal -8 -30 <0.01 <0.002 <0.002 <0.002 <0.0016 <0.0034 <0.0008
Prepared by: JGCChecked by: ES
NA Volatile Organic Compounds
SV04
SV06
1 of 1

APPENDIX F
QC Table
20 June 2019 19121313-001-R-Rev0

Chemical Data Table
Quality Control Replicate Samples
Project number: 19121313Project: EPA Unley Stage 3
SV04 SV04-R SV06 SV06-R SC3699Normal Field_D Normal Interlab_DAir Air Air Air23/05/2019 23/05/2019 23/05/2019 23/05/2019218199 218199 RPD 218199 M191237 RPD
OtherHelium % by Vol 0.01 <0.01 <0.01 0 <0.01 <0.01 0
Volatile Organic Compounds1,1-Dichloroethene mg/m3 0.002 <0.002 <0.002 0 <0.002 <0.0036 0cis-1,2-Dichloroethene mg/m3 0.002 <0.002 <0.002 0 <0.002 <0.0048 0trans-1,2-dichloroethene mg/m3 0.002 <0.002 <0.002 0 <0.002 <0.0036 0Trichloroethene mg/m3 0.0016 <0.0016 <0.0016 0 <0.0016 <0.0054 0Tetrachloroethene mg/m3 0.0034 0.03 0.03 0 <0.0034 <0.0066 0Vinyl chloride mg/m3 0.0008 <0.0008 <0.0008 0 <0.0008 <0.0024 0
Prepared by: JGCChecked by: ES
Unit EQL
Field IDSample TypeMatrix TypeDateLab Report Number
Page 1 of 1

APPENDIX G
Laboratory Certificates and COCs
20 June 2019 19121313-001-R-Rev0
Envirolab Services Pty Ltd
ABN 37 112 535 645
12 Ashley St Chatswood NSW 2067
ph 02 9910 6200 fax 02 9910 6201
www.envirolab.com.au
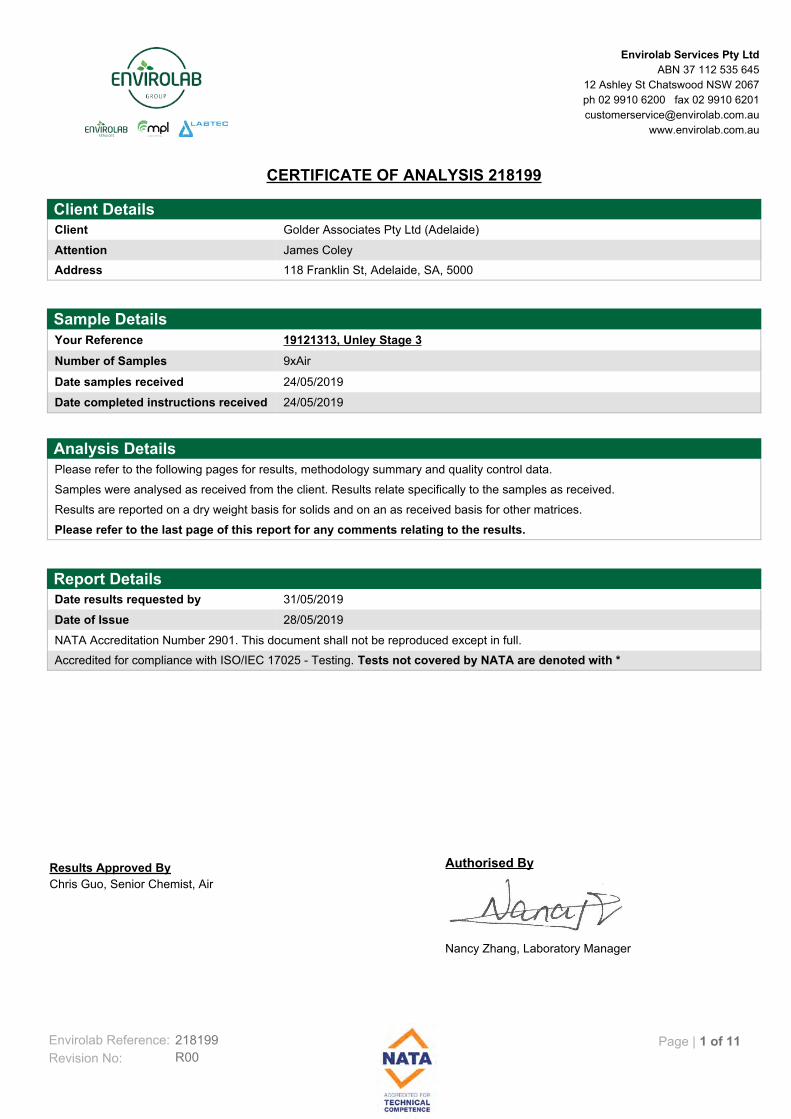
CERTIFICATE OF ANALYSIS 218199
118 Franklin St, Adelaide, SA, 5000Address
James ColeyAttention
Golder Associates Pty Ltd (Adelaide)Client
Client Details
24/05/2019Date completed instructions received
24/05/2019Date samples received
9xAirNumber of Samples
19121313, Unley Stage 3Your Reference
Sample Details
Please refer to the last page of this report for any comments relating to the results.
Results are reported on a dry weight basis for solids and on an as received basis for other matrices.
Samples were analysed as received from the client. Results relate specifically to the samples as received.
Please refer to the following pages for results, methodology summary and quality control data.
Analysis Details
Tests not covered by NATA are denoted with *Accredited for compliance with ISO/IEC 17025 - Testing.
NATA Accreditation Number 2901. This document shall not be reproduced except in full.
28/05/2019Date of Issue
31/05/2019Date results requested by
Report Details
Nancy Zhang, Laboratory Manager
Authorised By
Chris Guo, Senior Chemist, Air
Results Approved By
Revision No: R00
218199Envirolab Reference: Page | 1 of 11

Client Reference: 19121313, Unley Stage 3
<0.01<0.01<0.01<0.01%Helium (He)
24/05/201924/05/201924/05/201924/05/2019-Date analysed
24/05/201924/05/201924/05/201924/05/2019-Date prepared
1884352235033536Air Kit Security No.
AirAirAirAirType of sample
23/05/201923/05/201923/05/201923/05/2019Date Sampled
SV04-RSV08SV07SV06UNITSYour Reference
218199-9218199-8218199-7218199-6Our Reference
Permanent Gas analysis
<0.01<0.01<0.01<0.01<0.01%Helium (He)
24/05/201924/05/201924/05/201924/05/201924/05/2019-Date analysed
24/05/201924/05/201924/05/201924/05/201924/05/2019-Date prepared
32821872364135263530Air Kit Security No.
AirAirAirAirAirType of sample
23/05/201923/05/201923/05/201923/05/201923/05/2019Date Sampled
SV05SV04SV03SV02SV01UNITSYour Reference
218199-5218199-4218199-3218199-2218199-1Our Reference
Permanent Gas analysis
Envirolab Reference: 218199
R00Revision No:
Page | 2 of 11
Client Reference: 19121313, Unley Stage 3
71747781% recSurrogate-Chlorobenzene-D5
75787784% recSurrogate -1,4-Difluorobenzene
73798179% recSurrogate-Bromochloromethane
5.0<0.5<0.5<0.5ppbvTetrachloroethene
<0.5<0.5<0.5<0.5ppbvcis-1,2-Dichloroethene
<0.5<0.5<0.5<0.5ppbvtrans-1,2-dichloroethene
<0.5<0.5<0.5<0.5ppbv1,1-Dichloroethene
<0.3<0.3<0.3<0.3ppbvTrichloroethene
<0.3<0.3<0.3<0.3ppbvVinyl chloride
28/05/201928/05/201928/05/201928/05/2019-Date analysed
27/05/201927/05/201927/05/201927/05/2019-Date prepared
-9-8-7-8Hg"Vacuum before Analysis
-30-30-29-30Hg"Vacuum before Shipment
1884352235033536Air Kit Security No.
AirAirAirAirType of sample
23/05/201923/05/201923/05/201923/05/2019Date Sampled
SV04-RSV08SV07SV06UNITSYour Reference
218199-9218199-8218199-7218199-6Our Reference
TO15 Chlorinated in Cans ppbv
8179838188% recSurrogate-Chlorobenzene-D5
8183858389% recSurrogate -1,4-Difluorobenzene
8585888892% recSurrogate-Bromochloromethane
5.85.00.6<0.5<0.5ppbvTetrachloroethene
<0.5<0.5<0.5<0.5<0.5ppbvcis-1,2-Dichloroethene
<0.5<0.5<0.5<0.5<0.5ppbvtrans-1,2-dichloroethene
<0.5<0.5<0.5<0.5<0.5ppbv1,1-Dichloroethene
<0.3<0.3<0.3<0.3<0.3ppbvTrichloroethene
<0.3<0.3<0.3<0.3<0.3ppbvVinyl chloride
28/05/201928/05/201928/05/201928/05/201928/05/2019-Date analysed
27/05/201927/05/201927/05/201927/05/201927/05/2019-Date prepared
-8-5-6-8-8Hg"Vacuum before Analysis
-29-29-30-30-30Hg"Vacuum before Shipment
32821872364135263530Air Kit Security No.
AirAirAirAirAirType of sample
23/05/201923/05/201923/05/201923/05/201923/05/2019Date Sampled
SV05SV04SV03SV02SV01UNITSYour Reference
218199-5218199-4218199-3218199-2218199-1Our Reference
TO15 Chlorinated in Cans ppbv
Envirolab Reference: 218199
R00Revision No:
Page | 3 of 11
Client Reference: 19121313, Unley Stage 3
71747781% recSurrogate-Chlorobenzene-D5
75787784% recSurrogate -1,4-Difluorobenzene
73798179% recSurrogate-Bromochloromethane
30<3.4<3.4<3.4µg/m3 Tetrachloroethene
<2<2<2<2µg/m3 cis-1,2-Dichloroethene
<2<2<2<2µg/m3 trans-1,2-dichloroethene
<2<2<2<2µg/m3 1,1-Dichloroethene
<1.6<1.6<1.6<1.6µg/m3 Trichloroethene
<0.8<0.8<0.8<0.8µg/m3 Vinyl chloride
28/05/201928/05/201928/05/201928/05/2019-Date analysed
27/05/201927/05/201927/05/201927/05/2019-Date prepared
-9-8-7-8Hg"Vacuum before Analysis
-30-30-29-30Hg"Vacuum before Shipment
1884352235033536Air Kit Security No.
AirAirAirAirType of sample
23/05/201923/05/201923/05/201923/05/2019Date Sampled
SV04-RSV08SV07SV06UNITSYour Reference
218199-9218199-8218199-7218199-6Our Reference
TO15 chlorinated in Cans ug/m3
8179838188% recSurrogate-Chlorobenzene-D5
8183858389% recSurrogate -1,4-Difluorobenzene
8585888892% recSurrogate-Bromochloromethane
40304<3.4<3.4µg/m3 Tetrachloroethene
<2<2<2<2<2µg/m3 cis-1,2-Dichloroethene
<2<2<2<2<2µg/m3 trans-1,2-dichloroethene
<2<2<2<2<2µg/m3 1,1-Dichloroethene
<1.6<1.6<1.6<1.6<1.6µg/m3 Trichloroethene
<0.8<0.8<0.8<0.8<0.8µg/m3 Vinyl chloride
28/05/201928/05/201928/05/201928/05/201928/05/2019-Date analysed
27/05/201927/05/201927/05/201927/05/201927/05/2019-Date prepared
-8-5-6-8-8Hg"Vacuum before Analysis
-29-29-30-30-30Hg"Vacuum before Shipment
32821872364135263530Air Kit Security No.
AirAirAirAirAirType of sample
23/05/201923/05/201923/05/201923/05/201923/05/2019Date Sampled
SV05SV04SV03SV02SV01UNITSYour Reference
218199-5218199-4218199-3218199-2218199-1Our Reference
TO15 chlorinated in Cans ug/m3
Envirolab Reference: 218199
R00Revision No:
Page | 4 of 11

Client Reference: 19121313, Unley Stage 3
USEPA TO15 - Analysis of VOC's in air following USEPA TO15 protocolsTO15
Gases determined by GC-FID/TCD using methods ASTM 1945, 1946 and USEPA 3C.AT-003
Methodology SummaryMethod ID
Envirolab Reference: 218199
R00Revision No:
Page | 5 of 11

Client Reference: 19121313, Unley Stage 3
[NT]950<0.01<0.011<0.01AT-0030.01%Helium (He)
[NT]24/05/201924/05/201924/05/2019124/05/2019-Date analysed
[NT]24/05/201924/05/201924/05/2019124/05/2019-Date prepared
[NT]LCS-1RPDDup.Base#BlankMethodPQLUnitsTest Description
Spike Recovery %DuplicateQUALITY CONTROL: Permanent Gas analysis
Envirolab Reference: 218199
R00Revision No:
Page | 6 of 11

Client Reference: 19121313, Unley Stage 3
[NT]8528688198TO15% recSurrogate-Chlorobenzene-D5
[NT]83287891102TO15% recSurrogate -1,4-Difluorobenzene
[NT]89193921107TO15% recSurrogate-Bromochloromethane
[NT][NT]0<0.5<0.51<0.5TO150.5ppbvTetrachloroethene
[NT][NT]0<0.5<0.51<0.5TO150.5ppbvcis-1,2-Dichloroethene
[NT][NT]0<0.5<0.51<0.5TO150.5ppbvtrans-1,2-dichloroethene
[NT][NT]0<0.5<0.51<0.5TO150.5ppbv1,1-Dichloroethene
[NT][NT]0<0.3<0.31<0.3TO150.3ppbvTrichloroethene
[NT][NT]0<0.3<0.31<0.3TO150.3ppbvVinyl chloride
[NT]28/05/201928/05/201928/05/2019128/05/2019-Date analysed
[NT]27/05/201927/05/201927/05/2019127/05/2019-Date prepared
[NT][NT]0-8-81[NT]Hg"Vacuum before Analysis
[NT][NT]0-30-301[NT]Hg"Vacuum before Shipment
[NT]LCS-1RPDDup.Base#BlankMethodPQLUnitsTest Description
Spike Recovery %DuplicateQUALITY CONTROL: TO15 Chlorinated in Cans ppbv
Envirolab Reference: 218199
R00Revision No:
Page | 7 of 11

Client Reference: 19121313, Unley Stage 3
[NT][NT]28688198TO15% recSurrogate-Chlorobenzene-D5
[NT][NT]287891102TO15% recSurrogate -1,4-Difluorobenzene
[NT][NT]193921107TO15% recSurrogate-Bromochloromethane
[NT][NT]0<3.4<3.41<3.4TO153.4µg/m3 Tetrachloroethene
[NT][NT]0<2<21<2.0TO152.0µg/m3 cis-1,2-Dichloroethene
[NT][NT]0<2<21<2.0TO152.0µg/m3 trans-1,2-dichloroethene
[NT][NT]0<2<21<2.0TO152.0µg/m3 1,1-Dichloroethene
[NT][NT]0<1.6<1.61<1.6TO151.6µg/m3 Trichloroethene
[NT][NT]0<0.8<0.81<0.8TO150.8µg/m3 Vinyl chloride
[NT][NT]28/05/201928/05/2019128/05/2019-Date analysed
[NT][NT]27/05/201927/05/2019127/05/2019-Date prepared
[NT][NT]0-8-81[NT]Hg"Vacuum before Analysis
[NT][NT]0-30-301[NT]Hg"Vacuum before Shipment
[NT][NT]RPDDup.Base#BlankMethodPQLUnitsTest Description
Spike Recovery %DuplicateQUALITY CONTROL: TO15 chlorinated in Cans ug/m3
Envirolab Reference: 218199
R00Revision No:
Page | 8 of 11

Client Reference: 19121313, Unley Stage 3
Not ReportedNR
National Environmental Protection MeasureNEPM
Not specifiedNS
Laboratory Control SampleLCS
Relative Percent DifferenceRPD
Greater than>
Less than<
Practical Quantitation LimitPQL
Insufficient sample for this testINS
Test not requiredNA
Not testedNT
Result Definitions
Australian Drinking Water Guidelines recommend that Thermotolerant Coliform, Faecal Enterococci, & E.Coli levels are less than1cfu/100mL. The recommended maximums are taken from "Australian Drinking Water Guidelines", published by NHMRC & ARMC2011.
Surrogates are known additions to each sample, blank, matrix spike and LCS in a batch, of compounds whichare similar to the analyte of interest, however are not expected to be found in real samples.
Surrogate Spike
This comprises either a standard reference material or a control matrix (such as a blank sand or water) fortifiedwith analytes representative of the analyte class. It is simply a check sample.
LCS (LaboratoryControl Sample)
A portion of the sample is spiked with a known concentration of target analyte. The purpose of the matrix spikeis to monitor the performance of the analytical method used and to determine whether matrix interferencesexist.
Matrix Spike
This is the complete duplicate analysis of a sample from the process batch. If possible, the sample selectedshould be one where the analyte concentration is easily measurable.
Duplicate
This is the component of the analytical signal which is not derived from the sample but from reagents,glassware etc, can be determined by processing solvents and reagents in exactly the same manner as forsamples.
Blank
Quality Control Definitions
Envirolab Reference: 218199
R00Revision No:
Page | 9 of 11
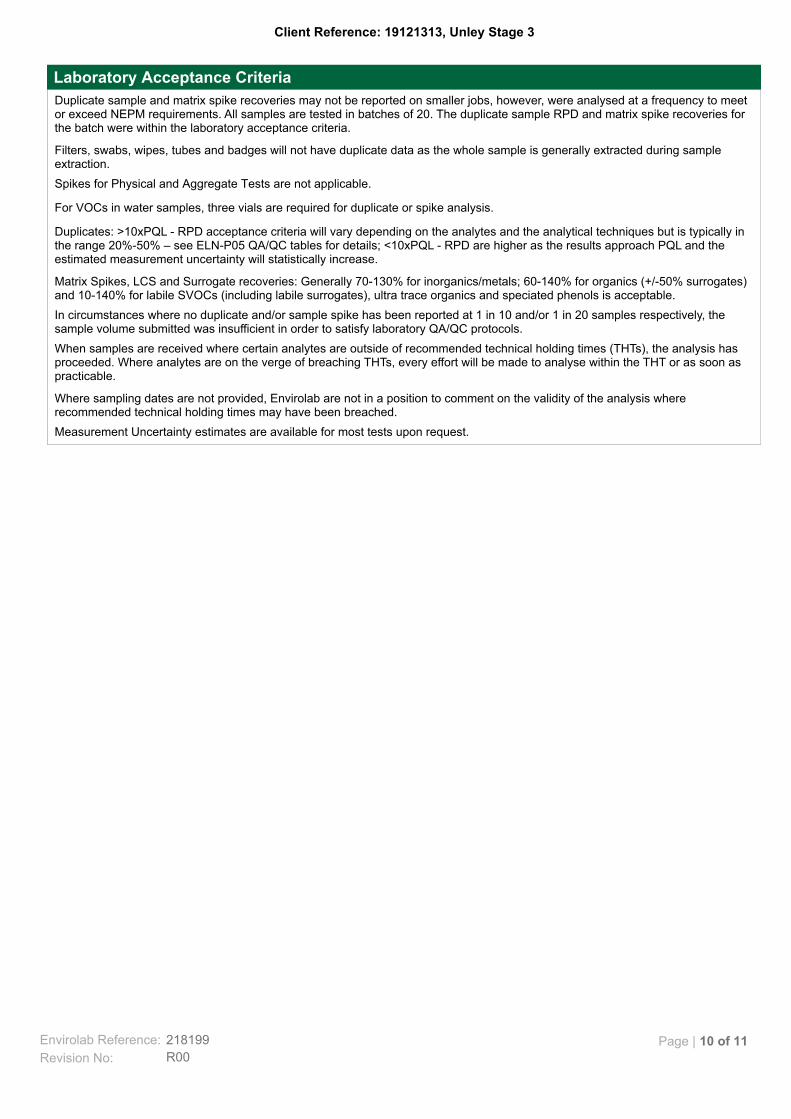
Client Reference: 19121313, Unley Stage 3
Measurement Uncertainty estimates are available for most tests upon request.
Where sampling dates are not provided, Envirolab are not in a position to comment on the validity of the analysis whererecommended technical holding times may have been breached.
When samples are received where certain analytes are outside of recommended technical holding times (THTs), the analysis hasproceeded. Where analytes are on the verge of breaching THTs, every effort will be made to analyse within the THT or as soon aspracticable.
In circumstances where no duplicate and/or sample spike has been reported at 1 in 10 and/or 1 in 20 samples respectively, thesample volume submitted was insufficient in order to satisfy laboratory QA/QC protocols.
Matrix Spikes, LCS and Surrogate recoveries: Generally 70-130% for inorganics/metals; 60-140% for organics (+/-50% surrogates)and 10-140% for labile SVOCs (including labile surrogates), ultra trace organics and speciated phenols is acceptable.
Duplicates: >10xPQL - RPD acceptance criteria will vary depending on the analytes and the analytical techniques but is typically inthe range 20%-50% – see ELN-P05 QA/QC tables for details; <10xPQL - RPD are higher as the results approach PQL and theestimated measurement uncertainty will statistically increase.
For VOCs in water samples, three vials are required for duplicate or spike analysis.
Spikes for Physical and Aggregate Tests are not applicable.
Filters, swabs, wipes, tubes and badges will not have duplicate data as the whole sample is generally extracted during sampleextraction.
Duplicate sample and matrix spike recoveries may not be reported on smaller jobs, however, were analysed at a frequency to meetor exceed NEPM requirements. All samples are tested in batches of 20. The duplicate sample RPD and matrix spike recoveries forthe batch were within the laboratory acceptance criteria.
Laboratory Acceptance Criteria
Envirolab Reference: 218199
R00Revision No:
Page | 10 of 11

Client Reference: 19121313, Unley Stage 3
AIR_TO15_PCETCE: LCS has been run as Ozone Precursor standard; the recovery of LCS cannot be reported due to the fact they are not in the list of analytes requested. However, the non-reported analytes within the LCS had acceptable recoveries.
Report Comments
Envirolab Reference: 218199
R00Revision No:
Page | 11 of 11

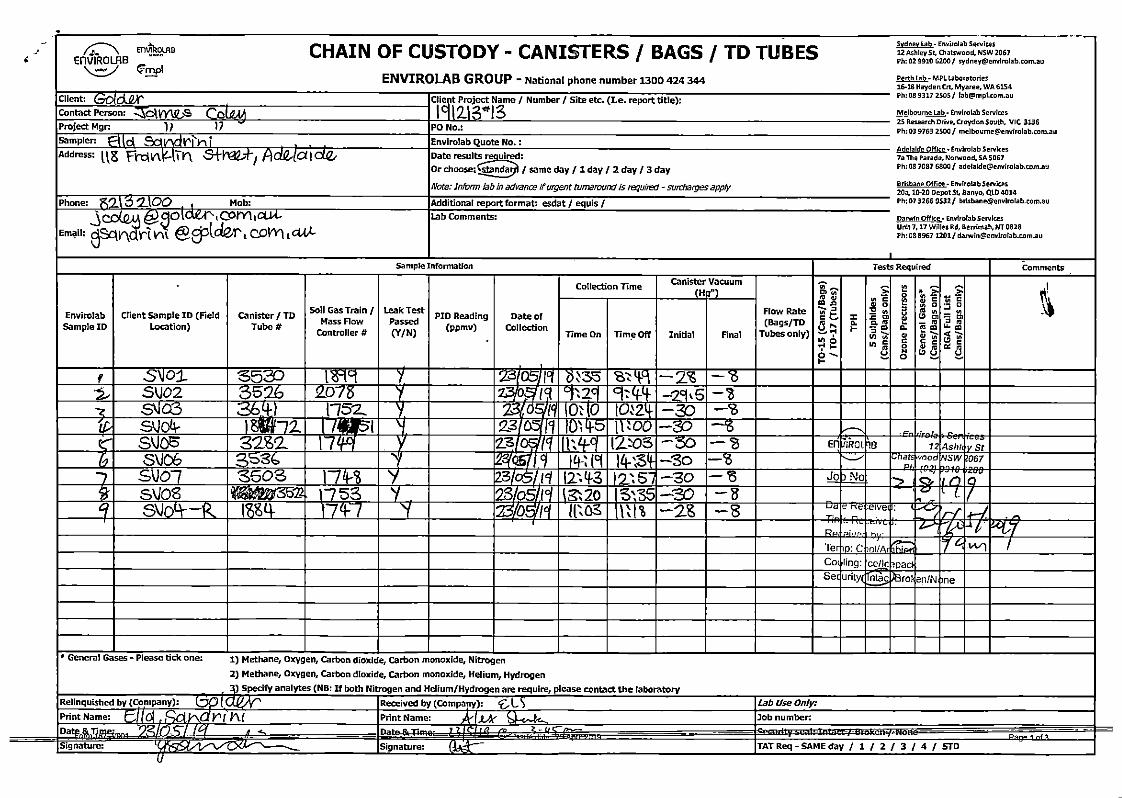
Envirolab Services Pty Ltd
ABN 37 112 535 645
12 Ashley St Chatswood NSW 2067
ph 02 9910 6200 fax 02 9910 6201
www.envirolab.com.au
SAMPLE RECEIPT ADVICE
James ColeyAttention
Golder Associates Pty Ltd (Adelaide)Client
Client Details
31/05/2019Date Results Expected to be Reported
24/05/2019Date Instructions Received
24/05/2019Date Sample Received
218199Envirolab Reference
19121313, Unley Stage 3Your reference
Sample Login Details
YESSampling Date Provided
Not applicableCooling Method
n/aTemperature on Receipt (°C)
StandardTurnaround Time Requested
9xAirNo. of Samples Provided
YesSamples received in appropriate condition for analysis
Sample Condition
Nil
Comments
Please direct any queries to:
Email: [email protected]: [email protected]
Fax: 02 9910 6201Fax: 02 9910 6201
Phone: 02 9910 6200Phone: 02 9910 6200
Jacinta HurstAileen Hie
Analysis Underway, details on the following page:
Page | 1 of 2

Envirolab Services Pty Ltd
ABN 37 112 535 645
12 Ashley St Chatswood NSW 2067
ph 02 9910 6200 fax 02 9910 6201
www.envirolab.com.au
PPPSV04-R
PPPSV08
PPPSV07
PPPSV06
PPPSV05
PPPSV04
PPPSV03
PPPSV02
PPPSV01
TO
15
ch
lori
na
ted
in
Ca
ns
ug
/m3
TO
15
Ch
lori
na
ted
in
Ca
ns
pp
bv
Pe
rma
ne
nt
Ga
s a
na
lys
is
Sample ID
The ' THIS IS NOT A REPORT OF THE RESULTS.P' indicates the testing you have requested.
Requests for longer term sample storage must be received in writing.
Sample storage - Waters are routinely disposed of approximately 1 month and soils approximately 2 months from receipt.
Additional Info
Page | 2 of 2


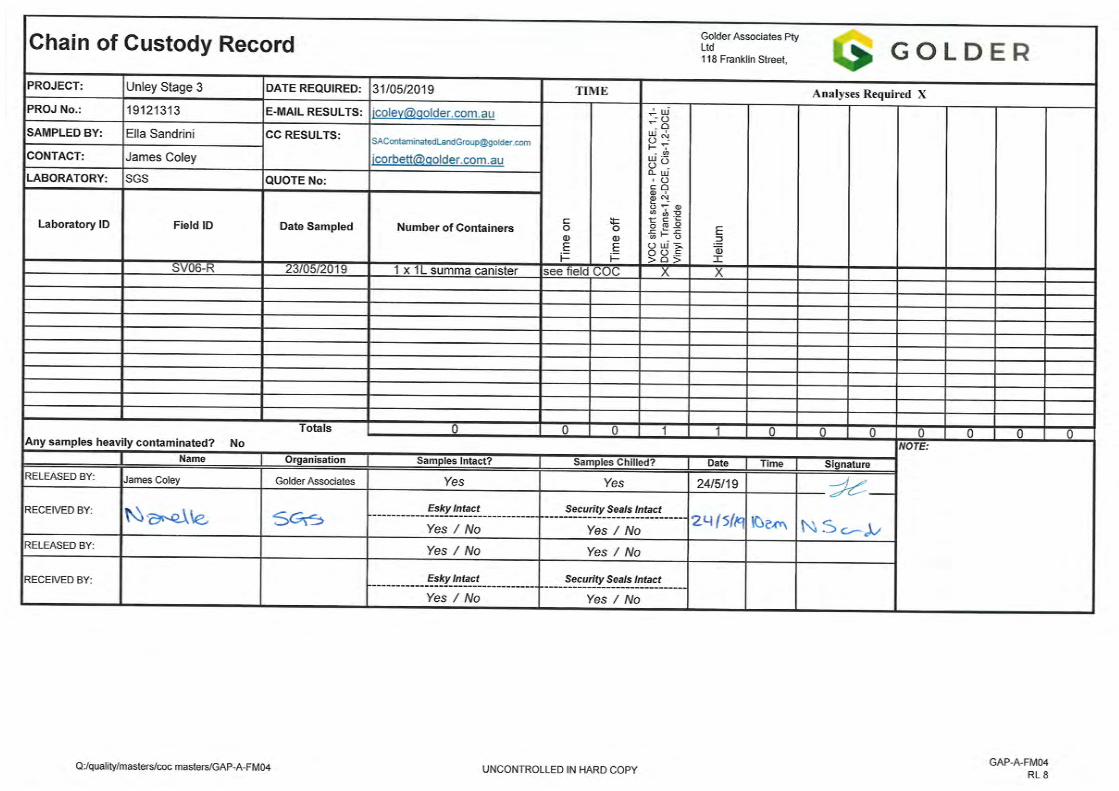

Sample Receipt Acknowledgement
To:
Fax:
From: Sample Reception
Pages: ( 1 ) including this page
Co:
24/05/2019
Ref:
SGS has received your samples from the project listed below. If you have any
enquiries please contact us quoting our reference number.
Project/Reference No.:
Our Reference Number:
Date Received:
Estimated date of report:
Additional Information:
Samples received after 4 pm are considered as received on the next working day for turnaround purposes.
Samples with a 24hr or 48hr TAT are considered as received on the next working day if received after 2:30pm.
Surcharges for urgent turnaround requests may apply.
All analytical work is conducted at our Melbourne office.
Sample Storage - All aqueous samples are stored for two weeks after reporting.
- All soils and other samples are stored for one month after reporting.
Please direct any technical or turnaround queries to Adam Atkinson at our Melbourne office.
SGS
Specialist Laboratory Services
Date:
PF-AU-ENV-NHC-QU-018.rpt / Ver 6 / 26.07.2017 / Page 1 of 1
19121313
M191237
24-May-2019
31-May-2019
M191237
James Coley
08 8213 2101
Golder Associates
A.B.N. 44 000 964 278
10 / 585 Blackburn Road
Notng Hill, Vic, 3168
Telephone: (03) 9574 3200
A.B.N. 44 000 964 278
Website: www.sgs.com.au
Email: [email protected]
To the extent not inconsistent with the other provisions of this document and unless specifically agr eed otherwise in writing by SGS, all SGS ser vices ar e rendered in
accordance with the applicable SGS General Conditions of Service accessible at http://www.sgs.com/en/Ter ms -and-Conditions/G eneral -Conditions -of-Services-English.aspx as at the date of this document. Attention is drawn to the limitations of liability and to the clauses of indemnification .

Chartered Chemists
A.B.N. 44 000 964 27810 / 585 Blackburn RoadNo ng Hill, Vic, 3168Telephone: (03) 9574 3200
AdelaideSA 5000A en on: James Coley
SAMPLES:
DATE RECEIVED:
DATE COMMENCED:
METHODS:
RESULTS: Please refer to a ached pages for results.
REPORTED BY:
118 Franklin Street
24‐May‐2019
One sample was received for analysis
24‐May‐2019
CERTIFICATE OF ANALYSIS
Majid Abdolali
See A ached Results
Chemist
Note: Results are based on samples as received at SGS laboratories
Golder Associates
3‐Jun‐2019
REPORT NUMBER:
Site/Client Ref:
Order No: 19121313
M191237
19121313
NATA Accredited Laboratory Number: 2562Corporate Site Number: 14420Accredited for compliance with ISO/IEC 17025 - Testing.
Page 1 of 4

ANALYTICAL RESULTS
Report N°: M191237
Matrix: Canister
Method: TO‐15.04 Receipt Vacuum / Pressure
Units as Listed ‐ ^^ Vacuum reported as inches of Mercury below standard atmospheric pressure Test Started: 27‐May‐19
Analyte Name
PQL
Client ID
Sampled Date
Leeder ID
10.1
9.18
10.1
9.18Receipt Vacuum (inch Hg) ^^
Receipt Pressure (PSIA)
Duplicate
SV06‐RSC3699
2019018394
SV06‐RSC3699
23‐May‐19
2019018393
Matrix: Canister
Method: TO‐15.02 Vola le Organics (w/v)
Sample units are expressed in µg/m³ Test Started: 27‐May‐19
Analyte Name
PQL
Client ID
Sampled Date
Leeder ID
<3.6
<4.8
<3.6
<6.6
<5.4
<2.4
<3.6
<4.8
<3.6
<6.6
<5.4
<2.4
<1.2
<1.6
<1.2
<2.2
<1.8
<0.8Vinyl Chloride
Trichloroethene
Tetrachloroethene
trans‐1,2‐Dichloroethene
cis‐1,2‐Dichloroethene
1,1‐Dichloroethene
Blank
Method
2019018395
Duplicate
SV06‐RSC3699
2019018394
SV06‐RSC3699
23‐May‐19
2019018393
Matrix: Canister
Method: MA‐1105.AIR.01 General Gases
Sample units are expressed in % by Vol Test Started: 28‐May‐19
Analyte Name
PQL
Client ID
Sampled Date
Leeder ID
nd nd0.01Helium
Duplicate
SV06‐RSC3699
2019018394
SV06‐RSC3699
23‐May‐19
2019018393
Page 2 of 4

QA/QC RESULTS
Report N°: M191237
Matrix: Canister
Method: TO‐15.02 Vola le Organics (w/v)
Quality Control Results are expressed in Percent Recovery of expected result Test Started: 27‐May‐19
Analyte Name
PQL
Client ID
Sampled Date
Leeder ID
109
109
127Vinyl Chloride
Trichloroethene
Tetrachloroethene
Spike
Method
2019018396
Page 3 of 4

Report N°: M191237
Q U ALIFIER S / N O TES F OR R E P OR TE D R ESU LTS PQ L Practic al Quant ita ti on Lim it nd N ot Detect ed – The an a lyt e was no t d et ected above th e rep ort ed PQ L. is Insuffic ient Sample to per form thi s ana lys i s. T Tent at ive ident ific at ion based o n c omput er l ibr a ry search of mass spec tra . NC N ot ca lcul at ed and /or Result s below PQ L NV N o Vacuum , C an ister rece i ved ab ove standard a tmo spher ic p ressure nr N ot Request ed for ana ly sis . R R ejected Resul t – result s for th is ana ly sis fa il ed QC c heck s. SQ S em i‐Quanti ta tiv e r esu lt – quan tit at ion based o n a gener ic respon se fa cto r fo r t his c la ss of ana l yt e. IM Inappropr ia te method of an a lys i s for thi s comp ound U Un able t o p rov ide Qu a lity C ont rol data – high level s of co mpou nds i n sample int er fered wit h ana ly sis o f
QC r esult s . UF Un able t o p rov ide Qu a lity C ont rol data ‐ Sur ro ga t es fai led QC check s du e to samp le matr ix effects L Ana ly te d etect ed a t a leve l above th e lin ear r esp onse o f ca li bra t ion cur ve. E Estimat ed r esu lt. N ATA acc redi ta tio n d oes no t co ver estim at ed r esu lts. C1 These co mpou nds c o‐elut e . ‐‐ Par amet er N ot Determ ined CT E lev a ted c oncen tr at ion . R esult s repo rt ed fr om ca rbon tub e ana ly sis ** S amp le sho ws no n‐petroleu m hydroca rb on pro file
This document is issued, on the Client's behalf, by the Company under its General Conditions of Service available on request and accessible at http://www.sgs.com/en/Terms‐and‐Conditions/General‐Conditions‐of‐Services‐English.aspx .
The Client's attention is drawn to the limitation of liability, indemnification and jurisdiction issues defined therein. Any other holder of this document is advised that information contained hereon reflects the Company's findings at the time of its intervention only and within the limits of Client's instructions, if any. The Company's sole responsibility is to its Client and th is document does not exonerate parties to a transaction from exercising all their rights and obligations under
the transaction documents This report must not be reproduced, except in fu ll.
Page 4 of 4

APPENDIX ONE. CHAIN OF CUSTODY DOCUMENT

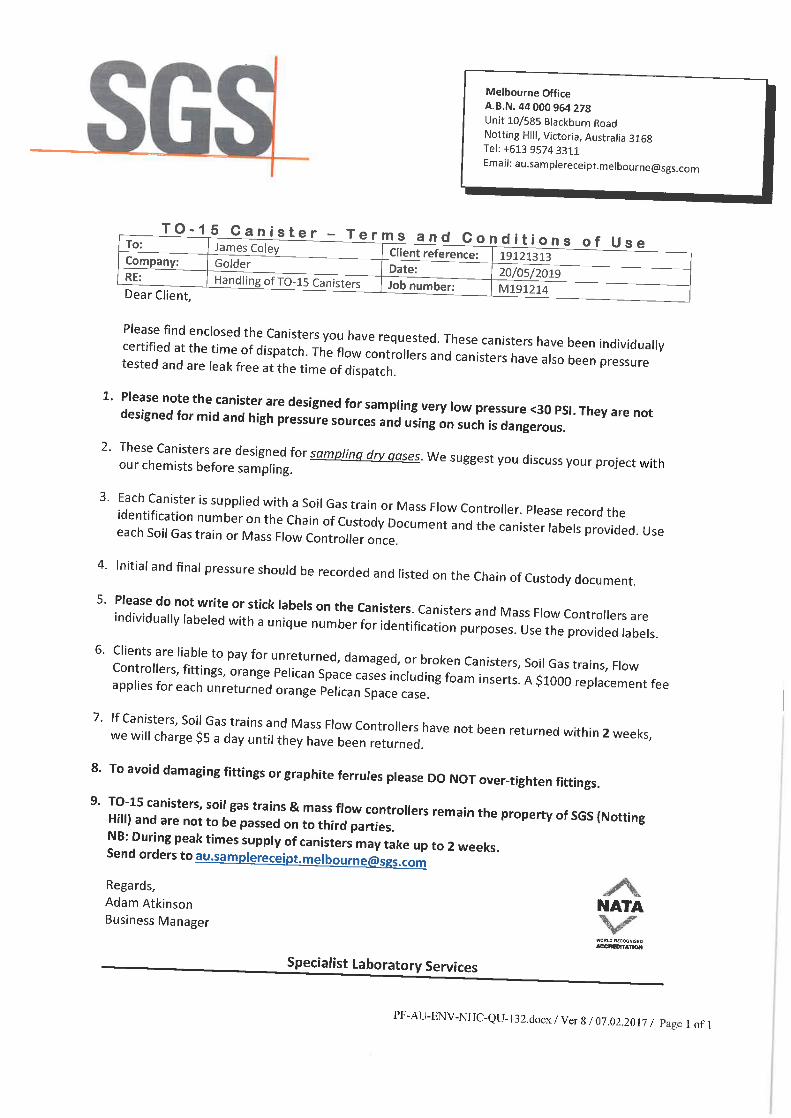


APPENDIX H
Important Information
20 June 2019 19121313-001-R-Rev0

GOLDER ASSOCIATES PTY LTD IMPORTANT INFORMATION RELATING TO THIS REPORT
Error! Unknown document property name. Page 1 of 1 GAP Form No. LEG04 RL2
5/2018
The document (“Report”) to which this page is attached and which this page forms a part of, has been issued by Golder Associates Pty Ltd (“Golder”) subject to the important limitations and other qualifications set out below.
This Report constitutes or is part of services (“Services”) provided by Golder to its client (“Client”) under and subject to a contract between Golder and its Client (“Contract”). The contents of this page are not intended to and do not alter Golder’s obligations (including any limits on those obligations) to its Client under the Contract.
This Report is provided for use solely by Golder’s Client and persons acting on the Client’s behalf, such as its professional advisers. Golder is responsible only to its Client for this Report. Golder has no responsibility to any other person who relies or makes decisions based upon this Report or who makes any other use of this Report. Golder accepts no responsibility for any loss or damage suffered by any person other than its Client as a result of any reliance upon any part of this Report, decisions made based upon this Report or any other use of it.
This Report has been prepared in the context of the circumstances and purposes referred to in, or derived from, the Contract and Golder accepts no responsibility for use of the Report, in whole or in part, in any other context or circumstance or for any other purpose.
The scope of Golder’s Services and the period of time they relate to are determined by the Contract and are subject to restrictions and limitations set out in the Contract. If a service or other work is not expressly referred to in this Report, do not assume that it has been provided or performed. If a matter is not addressed in this Report, do not assume that any determination has been made by Golder in regards to it.
At any location relevant to the Services conditions may exist which were not detected by Golder, in particular due to the specific scope of the investigation Golder has been engaged to undertake. Conditions can only be verified at the exact location of any tests undertaken. Variations in conditions may occur between tested locations and there may be conditions which have not been revealed by the investigation and which have not therefore been taken into account in this Report.
Golder accepts no responsibility for and makes no representation as to the accuracy or completeness of the information provided to it by or on behalf of the Client or sourced from any third party. Golder has assumed that such information is correct unless otherwise stated and no responsibility is accepted by Golder for incomplete or inaccurate data supplied by its Client or any other person for whom Golder is not responsible. Golder has not taken account of matters that may have existed when the Report was prepared but which were only later disclosed to Golder.
Having regard to the matters referred to in the previous paragraphs on this page in particular, carrying out the Services has allowed Golder to form no more than an opinion as to the actual conditions at any relevant location. That opinion is necessarily constrained by the extent of the information collected by Golder or otherwise made available to Golder. Further, the passage of time may affect the accuracy, applicability or usefulness of the opinions, assessments or other information in this Report. This Report is based upon the information and other circumstances that existed and were known to Golder when the Services were performed and this Report was prepared. Golder has not considered the effect of any possible future developments including physical changes to any relevant location or changes to any laws or regulations relevant to such location.
Where permitted by the Contract, Golder may have retained subconsultants affiliated with Golder to provide some or all of the Services. However, it is Golder which remains solely responsible for the Services and there is no legal recourse against any of Golder’s affiliated companies or the employees, officers or directors of any of them.
By date, or revision, the Report supersedes any prior report or other document issued by Golder dealing with any matter that is addressed in the Report.
Any uncertainty as to the extent to which this Report can be used or relied upon in any respect should be referred to Golder for clarification

golder.com