report to the legislative finance committee · rachel mercer-smith . madelyn serna mármol, ed.d....
TRANSCRIPT

Report to
The LEGISLATIVE FINANCE COMMITTEE
Public Education Department Performance, Programming, and Cost of Middle Schools in New Mexico
June 25, 2015
Report #15-09

LEGISLATIVE FINANCE COMMITTEE
Senator John Arthur Smith, Chairman Representative Jimmie C. Hall, Vice-Chairman
Representative Paul C. Bandy Senator Sue Wilson Beffort
Senator Pete Campos Senator Carlos R. Cisneros
Representative George Dodge, Jr. Representative Jason C. Harper
Representative Larry A. Larrañaga Senator Carroll H. Leavell
Representative Patricia A. Lundstrom Senator Howie C. Morales Senator George K. Muñoz Senator Steven P. Neville
Representative Nick L. Salazar Representative Luciano “Lucky” Varela
DIRECTOR
David Abbey
DEPUTY DIRECTOR FOR PROGRAM EVALUATION
Charles Sallee
PROGRAM EVALUATION TEAM
Michelle Aubel, CGFM Jon R. Courtney, Ph.D.
Cody Cravens Nathan Eckberg, Esq. Jenny Felmley, Ph.D.
Brenda Fresquez, CICA Pamela Galbraith Maria D. Griego
Brian Hoffmeister Yann Lussiez, Ed.D. Rachel Mercer-Smith
Madelyn Serna Mármol, Ed.D. Shane Shariff, Intern

Senator John Arthur Smith State ofNew Mexico Representative Jimmie C. HallChairman Vice-Chairman
LEGISLATWE FINANCE COMMITTEESenator Sue Wilson Reffort 325 Don Gaspar, Suite 101 • Santa Fe, NM 87501 Representative Paul C. BandySenator Pete Campos Phone: (505) 986-4550 • Fax (505) 986-4545 Representative George Dodge, Jr.Senator Carlos R. Cisneros Representative Jason C. HarperSenator Carroll H. Leavell D d Abb Representative Larry A. LarranagaSenator Howie C. Morales avi ey Representative Patricia A. LundstromSenator George K. Munoz Director Representative Nick L. SalazarSenator Steven P. Neville Representative Luciano “Lucky” Varela
June 25, 2015
Ms. Hanna Skandera, SecretaryPublic Education DepartmentJerry Apodaca Education Building300 Don GasparSanta Fe, New Mexico 87501
Dear Secretary Skandera:
On behalf of the Legislative Finance Committee, I am pleased to transmit the evaluation,Performance, Programming, and Cost of Middle Schools in New Mexico. The evaluationreviewed student performance, school programming, and funding of middle schools in NewMexico school districts and charter schools.
This report will be presented to the Legislative Finance Committee on June 25, 2015. An exitconference to discuss the contents of the report was conducted with the Public EducationDepartment on June 22, 2015.
I believe this report addresses issues the Committee asked us to review and hope New Mexico’seducation system will benefit from our efforts. We very much appreciate the cooperation andassistance we received from your staff.
Sincerely,
~aDavid Abbey, Director
Cc: Senator John Arthur Smith, Chairman, Legislative Finance CommitteeRepresentative Jimmie C. Hall, Vice-Chairman, Legislative Finance CommitteeRepresentative Dennis J. Roch, Chairman, Legislative Education Study CommitteeMs. Hanna Skandera, Secretary, Public Education DepartmentDr. Tom Clifford, Secretary, Department of Finance and AdministrationKeith Gardner, Chief of Staff, Office of the GovernorMs. Frances Maestas, Director, Legislative Education Study Committee

[Insert Transmittal Letter]

Table of Contents Page No.
EXECUTIVE SUMMARY ..................................................................................................................... 5
BACKGROUND INFORMATION...................................................................................................... 10
FINDINGS AND RECOMMENDATIONS ......................................................................................... 17
Student Performance in Middle School has Remained Relatively Flat for the Past Decade ............... 17 Middle Schools in New Mexico Do Not Consistently Provide Programming and Resources to Promote Motivational and Social-Emotional Behavior Conducive to Engagement and Academic Growth ................................................................................................................................................. 31 Middle School Grades Receive Similar Formula Funding as High Schools but Lack Similar Access to Grant Funds ..................................................................................................................................... 41
AGENCY RESPONSES ........................................................................................................................ 44
APPENDIX A: Evaluation Objectives, Scope, and Methodology ..................................................... 45
APPENDIX B: Selected Schools Demographics ................................................................................. 46
APPENDIX C: Grade Configurations ................................................................................................. 47
APPENDIX D: National and State Math Proficiency ........................................................................ 48
APPENDIX E: Reading and Math Scaled Scores ............................................................................... 49
APPENDIX F: School Grades by Grade Range ................................................................................. 50
APPENDIX G: Student Retention by District and Grade ................................................................. 51
APPENDIX H: Middle Schools with Above Average Truancy ......................................................... 52
APPENDIX I: Charter School Performance by Grade Configuration ............................................. 53
APPENDIX J: PED Instructional Audits of Selected Schools ........................................................... 55
APPENDIX K: Middle Schools “Beating-the-Odds” ......................................................................... 56
APPENDIX L: Career and Technical Education Subject Areas ....................................................... 57

Public Education Department, Report #15-09 Performance, Programming, and Cost of Middle Schools in New Mexico June 25, 2015
5
EXECUTIVE SUMMARY
Student achievement in eighth grade has a greater impact on college and career readiness than performance in any other grade in high school. Middle school (sixth, seventh, and eighth grades) is a time when achievement gaps are closed or widened. In New Mexico, middle schools are struggling with student performance, programming, and funding. Middle school students account for 22 percent of the overall student enrollment in New Mexico and 50 percent of students taking statewide assessments. Legislative Finance Committee (LFC) has never conducted a comprehensive evaluation of middle schools. This evaluation analyzed student socio-economic status, language acquisition, attendance, truancy, and mobility as factors that affect student performance.
The state is lacking academic programming and financial resources for middle schools students. Students transitioning between fifth and sixth grades experience a decline in assessment scores and an increase in disciplinary issues. Low-income students and English language learners (ELL) continue to lag behind their more affluent peers well into middle school. Middle school teachers are often generalists with a kindergarten through eighth (k-8) grade license and do not possess an endorsement in a core subject area. In addition, middle schools are often not equipped to meet the social-emotional needs of young adolescents.
The funding formula recognizes base costs for middle school grades differently and assumes costs for seventh and eighth grades are the same as high school. However, instructional spending at selected schools does not outpace school district levels of per-student funding. Furthermore, engaging programming such as career and technical education (CTE) classes are often not present in the middle grades due to the deficiency in the vocational cost differential in the funding formula and in federal grants.
Public Education Department (PED) instructional audits have shown how middle schools are still in the beginning stages of implementing common core standards, which should have been fully implemented in FY14. In 2014, PED announced implementation of an early warning system to track and monitor students at risk of dropping out of school. However, the system is not in place and training on the dashboard is currently underway. Grade configurations for students in sixth, seventh, and eighth grades vary widely. Over a third of middle schools serve sixth through eighth grades. The evaluation does not find a clear answer on the best grade configuration for middle schools, although preliminary evidence shows reading scores are slightly higher for students in a kindergarten through eighth grade configuration.
The evaluation recommends the Legislature pass legislation for a preliminary next step plan to include sixth and seventh grade students. The evaluation suggests PED continue to reinforce implementation of school site best practices. In addition, PED should collaborate on an immediate reallocation of existing resources and provide professional development for CTE and college and career readiness programs. The evaluation also recommends school districts and charter schools create “whole-student” programming engaging middle school students in cognitively rich classes.

Public Education Department, Report #15-09 Performance, Programming, and Cost of Middle Schools in New Mexico June 25, 2015
6
Low-income and English Language Learner (ELL) middle school students consistently trail behind more affluent students in sixth, seventh, and eighth grades.
KEY FINDINGS Student performance in middle school has remained relatively flat for the past decade. Middle school students (sixth, seventh, and eighth grades) in New Mexico have made nominal gains in student performance from FY05 to FY14. In the middle grades, Standards Based Assessment (SBA) proficient and above scores have changed minimally in the last 10 years, particularly in reading. Math scores show a steady increase from FY05 to FY09 but have remained flat in the last five years, FY10 to FY14. Student performance dips between fifth and sixth grades but rebounds by eighth grade. Fifth grade students in New Mexico have outperformed sixth and seventh grade students on the Standards Based Assessment (SBA) in reading and math for the last five years. From FY10 to FY14, the percentage of fifth graders proficient on the SBA was 54 percent in reading and 44 percent in math. An achievement gap beginning in elementary school continues through the middle school grades. In addition, low-income and ELL middle school students consistently trail behind more affluent students in sixth, seventh, and eighth grades. Issues with student discipline increase as students’ age, creating challenges for middle schools. In New Mexico, disciplinary infractions increase for middle school aged students in the transitions from fifth to sixth grade and eighth to ninth grades. Mobility and absenteeism including truancy, negatively impact student performance in middle school. Frequent absences in elementary schools have consequences for middle schools contributing to academic weaknesses and poor attendance habits compounding into chronic absenteeism as students’ progress into middle school. Absences have the largest impact on eighth grade reading and math SBA scores with a reduction of 0.31 in reading and 0 .40 in math for every absence. A student with zero absences is projected to be proficient in both reading and math; however, the likelihood of scoring proficient and above declines with every absence. Mobility can negatively affect student performance. Controlling for poverty, there is a statistically significant difference in SBA proficient and above scores for students who attended a different school in eighth grade than they attended in seventh grade. Students who were mobile scored 2.4 percentage points lower on reading SBA and 3.0 percentage points lower on math SBA. In New Mexico, there is not a clear cut answer to which grade configuration leads to higher student performance. None of the three most popular grade configurations produce an average student proficient scaled score of 40 points or above on the SBA. Preliminary data shows reading SBA scores increased slightly in FY13 for students in schools with kindergarten through eighth grade (k-8) configurations. Only 8 percent of middle schools are k-8 and 35 percent of middle schools in New Mexico have the standard sixth through eighth grade middle school configuration.
30 35 40 45 50 55 60 65 70
FY05
FY
06
FY07
FY
08
FY09
FY
10
FY11
FY
12
FY13
FY
14
Percentage Proficient, Middle School SBA
Reading Scores, FY05 to FY14
6th 7th 8th
Source: PED
0% 10% 20% 30% 40% 50% 60% 70% 80%
Sixth Grade
Seventh Grade
Eighth Grade
Reading Achievement Gap by Grade, FY14
Non low-income and Non-ELL Low-income and Non-ELL Low-income and ELL
Source: LFC Files

Public Education Department, Report #15-09 Performance, Programming, and Cost of Middle Schools in New Mexico June 25, 2015
7
A student with zero absences is projected to be proficient in both reading and math, however the likelihood of scoring proficient and above declines with every absence.
A middle school student with 10 absences could potentially reduce their SBA scaled score in reading by 3.1 points and in math by 4 points. In addition, a student with 20 absences would reduce their SBA scaled scored in reading by 6.2 points and in math by 8 points.
PED instructional audits of selected middle schools reveal the schools are at beginning steps for implementing state mandates. Middle schools are struggling to implement new common core state standards (CCSS), schools are not data-driven, there is a lack of differentiated instruction, and research-based interventions are inconsistent. A few middle schools in New Mexico are “beating the odds.” Twelve middle schools, or 8 percent of all non-charter middle schools in New Mexico may be considered “beating-the-odds.” The middle schools were selected based on factors such as positive results from the predicted versus the actual proficiency scores on the SBA in both reading and math, school grades of C or above for the last three school years, and high poverty rates or free and reduced lunch (FRL) percentages above the state average of 72.8 percent. Middle schools in New Mexico do not consistently provide programming and resources to promote motivational and social-emotional behavior conducive to engagement and academic growth. Best practices in national studies suggest students in the middle grades require creative programming that compels students to attend school. School districts and charter schools need cognitively rich activities which combine teamwork with performance to engage students. Barriers exist to improve middle school engagement through career and technical education and career and college readiness. Career focused classes are generally not offered in the middle school grades. State law requires school districts and charter schools offer electives for middle school students that contribute to academic growth and skill development and provide career and technical education (Section 22-13-1 NMSA 1978). Career and technical education (CTE) classes provide technical knowledge skills and competency-based applied learning. Most selected middle schools do not offer CTE classes. According to PED, when public schools are looking to offer CTE classes, they are making decisions between staffing high schools versus middle schools. Since CTE has more immediate consequences or possibilities for high school students, public schools often prioritize staffing the high school. PED does not administer any grant at the middle school level for CTE nor does the state receive federal funding for CTE middle school programs. College and career readiness needs to start earlier than eighth grade. According to an American College Testing (ACT) study, fewer than 20 percent of eighth grade students nationwide are on track to be ready for college-level work by the time they graduate from high school. Section 22-13-1.1 NMSA 1978 provides, at the end of grades eight through eleven and during the senior year, each student must prepare an interim next step plan setting the course for the grades remaining until high school. Selected schools provide next step plans in accordance with the state, however the ACT student further recommends college and career readiness begin in sixth grade.
29%
45%
10%
15%
12%
Elementary Schools
Middle Schools
High Schools
Percent of Schools with D and F Grades,
FY14
D F Source: PED

Public Education Department, Report #15-09 Performance, Programming, and Cost of Middle Schools in New Mexico June 25, 2015
8
The original funding formula enacted in 1974 included program units for students enrolled in approved vocational education programs. By 1976, however, the vocational cost differential was eliminated as a separate factor and the seventh through twelfth grade weight increased to 1.25.
*After School by the Numbers in New Mexico for All Students… 8,392 students participate in 21st CCLC programs. 70,841 (21 percent) students participate in after school programs. 71,532 (21 percent) students are unsupervised during hours after school. 90,659 (33 percent) students would participate in afterschool program if one were available. Source: Afterschool Alliance, 2015 *Figures include all students in New Mexico.
Teachers may require different preparation and professional development to effectively deal with young adolescent needs. Many middle school teachers are generalists teaching students from sixth to eighth grades with a kindergarten through eighth grade (k-8) teaching license. In New Mexico, 73 percent, or 5,788 middle school teachers have k-8 teacher licenses. Of the total amount of middle school teachers, 28 percent, or 2,264, only have a k-8 grade license. A National Council for Teachers of Mathematics (NCTM) study reveals many middle school teachers do not have a major, minor or certification in the core subject areas they teach and also lack training in the development of young adolescents. Teacher attrition is higher for middle schools than elementary schools or high schools. From FY12 to FY14 approximately 1,600 middle school teachers stopped teaching middle school in New Mexico. Of the 4,238 teachers who were teaching middle school in FY12, only 2,616 of those same teachers were still teaching middle school in FY14. After school programs can help improve student performance but opportunities are limited. In communities across the United States, one in five children do not have someone to care for them after school. This trend holds in New Mexico as the Afterschool Alliance reports 21 percent, or 75 thousand, students are alone and unsupervised afterschool. New Mexico lacks comprehensive after school programs relying on limited federal funds and local discretionary resources. Nearly 160 thousand students in New Mexico are eligible to participate in the 21st Century Community Learning Centers (CCLC) programs, however only 8,730 students actually participate due to lack of federal funding. Middle school grades receive similar formula funding as high schools but lack similar access to grant funds. Middle school grades generate an estimated $575 million in state formula funds to serve about 77 thousand students. This allocation applies the average per-student formula funding cost of $7,667 to middle school grade enrollments for FY15. Individual districts or charters may generate different per student funding for middle school students depending on a variety of other formula factors, such as special education enrollment, school size adjustments, training and experience (T&E), and at-risk indexes among others. Middle school grades generate about $358 million in basic grade weight funding, or about $4,736 per student. Basic grade weight in the formula account for about 63 percent of per student funding, and for middle school grades about 62 percent. These percentages are similar to state averages for spending on classroom instruction. The state’s funding formula recognizes base costs to educate students in sixth to eighth grades differently. The base grade weight for sixth grade is 1.045 and for seventh and eighth grades is 1.25. Depending on the grade configuration of the school and number of sixth grade students, middle school students generate similar revenue as high school students for basic school site level per-student operations. Future review of the base grade weights may be worthwhile as the 1.25 weight may be too high or the 1.045 may be too low for sixth grade students.
-0.22 -0.16
-0.25 -0.24
-0.24
-0.34
Sixth Grade Seventh Grade
Eighth Grade
Decrease in Reading and Math SBA Scores
Per Absence, FY14
Reading Scores Math Scores
Source: LFC Files

Public Education Department, Report #15-09 Performance, Programming, and Cost of Middle Schools in New Mexico June 25, 2015
9
KEY RECOMMENDATIONS The Legislature should:
• Consider legislation to require sixth and seventh grade students complete a next step plan to expose and target a student’s possible postsecondary interests and set the classes the student will complete in middle school in order to be on track for high school graduation.
The Public Education Department should:
• Continue to reinforce implementation of school site best practices through the budget process, technical assistance, and instructional audits, and targeted turnaround initiatives already in place.
• Collaborate on an immediate reallocation of existing resources
directive, with school districts and charter schools, for career and technical education and college and career readiness in middle school grades, and report the results to the Legislature in September 2016.
• Consider requesting state supplemental funds for 21st Century programs for more high needs middle schools and associated performance measures to track program performance.
• Re-evaluate licensure and preparation routes for career and
technical education classes to expand pool of potentially qualified teachers for these types of classes.
• Provide professional development for teachers and administrators
on behavior interventions for the social-emotional needs of middle school students.
School Districts and Charter Schools should: • Provide case management for students who fall below established
school district measures or school parameters.
• Build academic and behavioral interventions within the school day.
• Create “whole student” programming that compels middle school students to attend school (cognitively rich classes which combine teamwork with performance to engage students).
• Model and teach resiliency and self-management and organizational
skills to middle school students.
• Consider hiring social workers in place of counselors in middle schools to address the social-emotional needs of young adolescents.

Public Education Department, Report #15-09 Performance, Programming, and Cost of Middle Schools in New Mexico June 25, 2015
10
BACKGROUND INFORMATION Overview. Middle school creates the pathway to college and the workforce. Sixth, seventh, and eighth grades are a crucial time to engage students in a rigorous academic curriculum to help them transition into high school and be successful in postsecondary education or careers. An American College Test (ACT) study showed the level of academic achievement students attain by eighth grade has a larger impact on college and career readiness than any grade in high school. Rigorous middle and high school classes can help students develop effective study habits and learn critical thinking and writing skills they will need to succeed in college. The ACT study also stated fewer than two in ten eighth graders nationwide are on target to be ready for college-level work by the time they graduate from high school. A United Way study indicated students who fail even one middle school core subject class are much more likely to drop out of high school in the future. Early Warning Indicators. An early warning study by the National Conference of State Legislatures (NCSL) reported college and career ready students need to successfully navigate several key transitions and acquire a set of academic behaviors in order to graduate on time. In high-poverty school districts, 75 percent or more of eventual drop-outs can be identified between sixth and ninth grade. The report also found sixth graders with one or more negative areas of performance related to: attendance, behavior or course performance (ABCs), only have a 10 percent to 20 percent chance of graduating from high school on time or within one year of expected graduation. The ABCs are further explored in Chapter 2 of the evaluation.
Figure 1. Sixth Grade ABC Early Warning Indicators
Source: NCSL Task Force Report, National Middle School Association
A 2011 Everyone Graduates Center report, which PED cites as the basis of the state’s early warning system, defined a strategic tiered approach to an ultimate goal for raising graduation rates by 90 percent nationwide by 2020. The report specifically identified a goal of re-designing middle schools to foster high student engagement and preparation for rigorous high school classes by 2013. In FY14, PED announced implementation of an early warning system in New Mexico. Johns Hopkins administers the research and professional development for the system in New Mexico and PED training for the data dashboard began for public schools in FY15.
Attendance - <80-90 percent school
attendance (missing 20 or
more days).
Behavior -Two or more major
infractions in one year or sustained
mild behavior infractions.
Course Performance – final grade of “F” in math
or English.
Beginning in the Middle
“Young adolescents make critical and complex life choices that will affect their academic and social options for the remainder of their lives…for nearly a quarter of these students, the seeds of withdrawal from school and the life-long consequences of underemployment, limited income, and involvements with the justice system are planted in these years.” Source: National Association of School Boards of Education (NASBE)
One or more indicators = 10 percent to 20 percent chance of graduating from high school on time or within one year of expected graduation.

Public Education Department, Report #15-09 Performance, Programming, and Cost of Middle Schools in New Mexico June 25, 2015
11
Table 1. Everyone Graduates Center Goals, 2012 - 2020
Year Goals
2012
• Increase assessment scores for struggling readers by fifth grade. • Reduce chronic absenteeism. • Conduct needs and capacity assessments.
2013
• Establish early warning systems in every targeted school district in every state. • Re-design middle schools to foster high student engagement and preparation
for rigorous high school classes. • Provide mentors for low-performing students in clusters of 15 to 20 students.
2016
• Transform or replace drop-out factories (graduation rate <75 percent). • Create clear college and career readiness pathways. • Raise compulsory school age to 18 years old in all states.
2020 • Achieve nationwide graduation rate of 90 percent. Source: Civic Enterprises, Everyone Graduates Center
High-performing Middle Schools. A Stanford University study found high-performing middle schools share eight similar characteristics listed in the table below. However, several additional studies suggest young adolescents of middle school age, require additional resources as they are at a critical stage in their social, emotional, physical, and psychological development therefore a ninth characteristic was added.
Table 2. High-performing Middle Schools
Characteristics of High-performing Middle Schools Create a shared, school-wide intense focus on the improvement of student outcomes; Set measurable goals on standards based tests and benchmark tests across all proficiency levels, grades, and
subjects; Create future oriented school missions; Design curricula and instruction to prepare students to succeed in a rigorous high-school curriculum; Include improvement of student outcomes as part of the evaluation of the superintendent, the principal, and
the teachers; Communicate to parents and students their responsibility for student learning, including parent contracts,
turning in homework, attending class, and asking for help when needed; Inject college and career readiness discussion and practice into everyday curriculum and classroom activities; Use data frequently to influence curriculum, student intervention, and differential teaching and provide
immediate intervention for students falling behind; and Create strategies to manage intensive social-emotional needs of middle school students.
Source: Stanford University and New Mexico middle school principals.
New Mexico. Previous LFC evaluations have concentrated on early childhood, elementary schools, and high schools, among other educational institutions. This is the first LFC evaluation to centrally focus on middle schools. This evaluation focused on middle school students in sixth, seventh, and eighth grades. Middle school students in New Mexico account for 22 percent of the overall student population and an estimated $575 million in funding. The study evaluated traditional and charter middle schools across the state with varying demographics and grade configurations (Appendix B).

Public Education Department, Report #15-09 Performance, Programming, and Cost of Middle Schools in New Mexico June 25, 2015
12
Figure 2. The Definition of Middle School Students
Source: Santa Teresa Middle School Mural, Gadsden Independent Schools
Middle School Enrollment. Over 11 million sixth, seventh, and eighth grade students attended U.S. public schools in FY14, an increase of one million over 20 years. In New Mexico, over 77 thousand students attended sixth, seventh, and eighth grades in FY15. Since FY10, middle school enrollment statewide has increased steadily.
70000
71000
72000
73000
74000
75000
76000
77000
78000
FY10 FY11 FY12 FY13 FY14 FY15
Chart 1. Sixth through Eighth Grade Enrollment in New Mexico, FY10 to FY15
Source: PED

Public Education Department, Report #15-09 Performance, Programming, and Cost of Middle Schools in New Mexico June 25, 2015
13
In New Mexico 385 regular public schools, district charters, and state charters serve sixth, seventh, and eighth grades students. Grade configurations differ widely in New Mexico middle schools (Appendix C).
The majority of schools in New Mexico serving middle school students, 279 have a total student enrollment below 500; this figure includes 63 school districts and all charter schools.
Truman Middle School in the Albuquerque Public Schools (APS), the largest middle school in the state, has a total student enrollment of 1,401 sixth, seventh, and eighth grade students. The smallest school serving middle school students, Lindrith Area Heritage Charter School in the Jemez Mountain Public Schools has an enrollment of 25 students, kindergarten through eighth grade and four middle school students. Five schools statewide have an enrollment of over 1,000 middle school students.
6th-8th 35%
Pre/K-6th 39%
K-8th 8%
6th-12th 4%
K-12th 2%
5th-8th 2%
4th-6th 2%
Other 8%
Chart 2: Percentage of New Mexico School Configurations Including 6th Grade, FY13
Source: U.S. Department of Education
0
50
100
150
200
250
300
<500 501-999 >1,000
num
ber o
f sch
ools
number of students
Chart 3. Size Distribution for Schools Serving Sixth, Seventh, and/or Eighth Grade Students Statewide
Source: PED

Public Education Department, Report #15-09 Performance, Programming, and Cost of Middle Schools in New Mexico June 25, 2015
14
Table 3. Student Enrollment of Largest Middle Schools in New Mexico
Middle School
District Student
Enrollment Truman Middle School Albuquerque Public Schools 1,401 Jimmy Carter Middle School Albuquerque Public Schools 1,229 Rio Rancho Middle School Rio Rancho Public Schools 1,222 Desert Ridge Middle School Albuquerque Public Schools 1,047 Lincoln Middle School Rio Rancho Public Schools 1,010
Source: PED
Student Performance. In New Mexico, sixth through eighth grade students comprised 50 percent of the state’s test takers from FY12 to FY14. Fourth graders have shown a steady decline in reading scores on the SBA between FY09 and FY14 while math scores have remained relatively flat. Eighth grade students showed a slight gain in reading from FY12 to FY13 but flat scores in math since FY10.
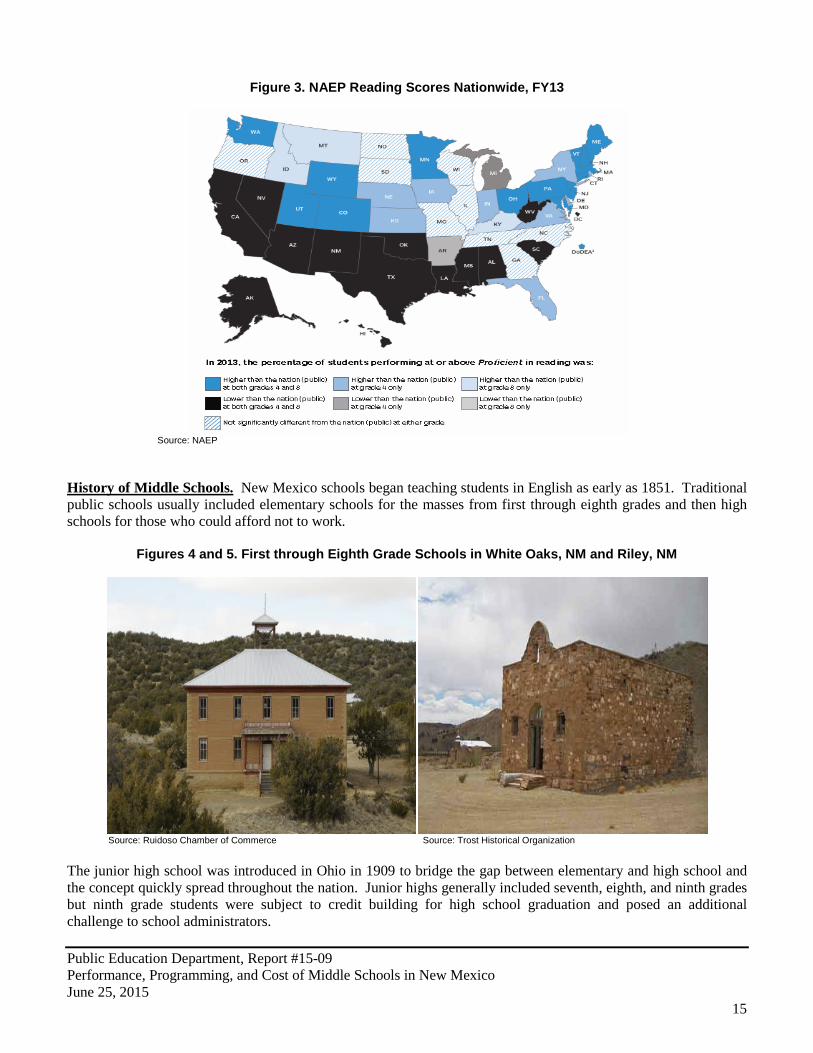
Sixth through eighth grade students represent 57 percent, or 14 million students taking standardized tests nationwide. Fourth and eighth grade students are showing improvement on the National Assessment of Educational Progress (NAEP) reading and math assessments. Reading scores were higher in FY13 in comparison to all previous assessments for eighth grade, and all but the FY11 assessment for fourth grade. Math scores were higher in FY13 than in all previous assessment years for fourth and eighth grades. However, New Mexico students do not follow the national trend and were below the national average on the NAEP in both reading and math in FY13 (Appendix D).
0%
10%
20%
30%
40%
50%
60%
70%
2009 2010 2011 2012 2013 2014
prof
icie
nt a
nd a
bove
Chart 4. Fourth and Eighth Grade SBA Reading, Statewide
Fourth Grade Reading Eighth Grade Reading Source: LFC Files
0%
10%
20%
30%
40%
50%
60%
70%
2009 2010 2011 2012 2013 2014
prof
icie
nt a
nd a
bove
Chart 5. Fourth and Eighth Grade SBA Math, Statewide
Fourth Grade Math Eighth Grade Math
Source: LFC Files
Public Education Department, Report #15-09 Performance, Programming, and Cost of Middle Schools in New Mexico June 25, 2015
15
Figure 3. NAEP Reading Scores Nationwide, FY13
Source: NAEP
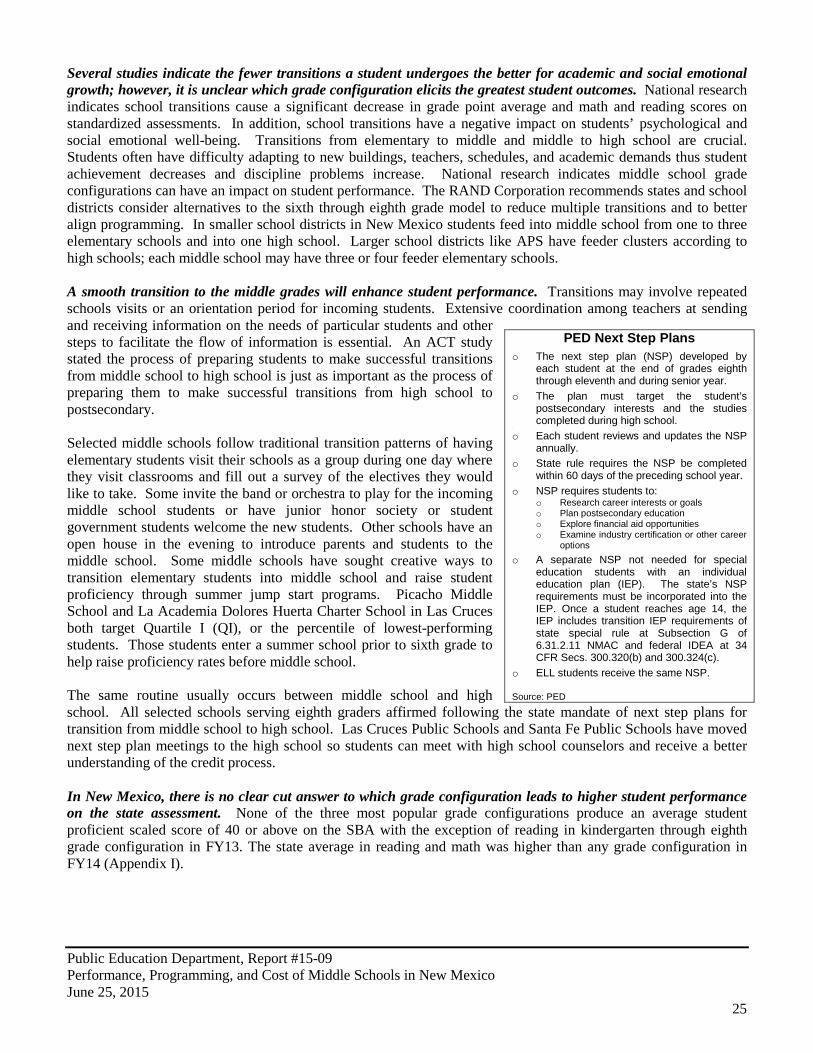
History of Middle Schools. New Mexico schools began teaching students in English as early as 1851. Traditional public schools usually included elementary schools for the masses from first through eighth grades and then high schools for those who could afford not to work.
Figures 4 and 5. First through Eighth Grade Schools in White Oaks, NM and Riley, NM
Source: Ruidoso Chamber of Commerce Source: Trost Historical Organization The junior high school was introduced in Ohio in 1909 to bridge the gap between elementary and high school and the concept quickly spread throughout the nation. Junior highs generally included seventh, eighth, and ninth grades but ninth grade students were subject to credit building for high school graduation and posed an additional challenge to school administrators.

Public Education Department, Report #15-09 Performance, Programming, and Cost of Middle Schools in New Mexico June 25, 2015
16
Figure 6. North Junior High School, Roswell, NM 1930s
Source: Historical Society for Southeast New Mexico
In 1963, a new “middle” school model was proposed. Junior high schools were thought to append the high school and “had lost touch with the development needs of the preadolescent student” according to Dr. William Alexander, founder of the middle school concept in his seminal speech at Cornell University. The middle school model took nearly 20 years to transform from a seventh through ninth grade or seventh and eighth grade configuration to a sixth through eighth grade model. New Mexico began the middle school in the late 1960s but the concept did not take shape statewide until the 1980s. Some schools in New Mexico continue to be known as junior-senior highs, but by FY01 the number of junior high schools declined by 57 percent. National Center for Education Statistics (NCES) figures show the number of middle schools nationwide—schools geared for students from 11 to 15 years of age—increased from over 2 thousand in 1970 to nearly 11 thousand in 1998 and to almost 12 thousand by 2002. Today there are over 13 thousand middle schools nationwide.
Figures 7 and 8. Lordsburg Middle School, 1969 and MESA Middle School, 2015
Source: Lordsburg Public Schools Source: Las Cruces Public Schools
Research shows the trend for many school districts nationwide is moving away from stand-alone or traditional middle schools with grade configurations of sixth through eighth grades. In New Mexico, 35 percent of all middle schools have a sixth through eighth grade configuration. In the last fifteen years many school districts nationwide have been moving to a kindergarten through eighth grade model. Eight percent of middle schools in New Mexico have a kindergarten through eighth grade configuration. In FY08, Santa Fe Public Schools expanded three elementary schools into community schools and opened a fourth community school in FY15 using a kindergarten through eighth grade model. However, 85 percent of kindergarten through eighth grade configured middle schools in New Mexico are charter schools.

Public Education Department, Report #15-09 Performance, Programming, and Cost of Middle Schools in New Mexico June 25, 2015
17
FINDINGS AND RECOMMENDATIONS STUDENT PERFORMANCE IN MIDDLE SCHOOL HAS REMAINED RELATIVELY FLAT FOR THE PAST DECADE Middle school students have made nominal gains in student performance from FY05 to FY14. Middle School students (sixth, seventh, and eighth grades) in New Mexico scoring proficient and above on the Standards Based Assessment (SBA) has changed minimally in the last 10 years, particularly in reading. Math scores show a steady increase from FY05 to FY09 but have remained flat between FY10 and FY14 (Appendix D).
Student performance dips between fifth and sixth grades but rebounds by eighth grade. Fifth grade students in New Mexico have outperformed sixth and seventh grade students on the SBA in reading and math for the last five years. From FY10 to FY14, the percentage of fifth grade students proficient on the SBA was 54 percent in reading and 44 percent in math. From fifth to sixth grade there is a dip in SBA scores. For example, in FY14 there was a 9 percent decrease in proficient and above SBA reading scores and a 7 percent decrease in proficient and above SBA math scores. Proficient and above scores in reading increase by the time students reach eighth grade by nearly 6 percent, however math scores increase from sixth to seventh grade by 3 percent but still remain 3 percent under fifth grade scores (Appendix E). The decline in SBA scores holds over time, particularly in math.
0
10
20
30
40
50
60
70
FY05 FY06 FY07 FY08 FY09 FY10 FY11 FY12 FY13 FY14
prof
icie
nt a
nd a
bove
Chart 6. Middle School SBA Reading Scores, FY05 to FY14
6th 7th 8th Source: PED Source: PED
0
10
20
30
40
50
60
FY10 FY11 FY12 FY13 FY14
perc
ent p
rofic
ient
and
abo
ve
Chart 7. Student Performance by Grade, SBA Reading
5th Grade 6th Grade 7th Grade 8th Grade Source: PED
0
10
20
30
40
50
60
FY10 FY11 FY12 FY13 FY14
perc
ent p
rofic
ient
and
abo
ve
Chart 8. Student Performance by Grade, SBA Math
5th Grade 6th Grade 7th Grade 8th Grade Source: PED

Public Education Department, Report #15-09 Performance, Programming, and Cost of Middle Schools in New Mexico June 25, 2015
18
Using an actual cohort of all fifth grade students in FY11 statewide and following those students to eighth grade in FY14, the data also shows a dip in SBA scaled scores in reading and math between fifth and sixth grade. SBA reading scaled scores increased steadily by eighth grade, surpassing the proficiency score of 40, while scores in math decreased from seventh to eighth grade and remained significantly below proficiency.
An achievement gap beginning in elementary school continues through the middle school grades. Student performance is greatly impacted by economic and language status, as noted in previous LFC evaluations. Low-income and English language learner (ELL) middle school students consistently trail behind more affluent students in sixth, seventh, and eighth grades.
30
32
34
36
38
40
42
Fifth Grade Sixth Grade Seventh Grade
Eighth Grade
Chart 9. New Mexico Cohort of Middle School Students, Scaled Reading Scores FY11 to FY14
Source: PED
30
32
34
36
38
40
42
Fifth Grade Sixth Grade Seventh Grade
Eighth Grade
Chart 10. New Mexico Cohort of Middle School Students, Scaled
Math Scores FY11 to FY14
Source: PED
0%
10%
20%
30%
40%
50%
60%
70%
80%
Sixth Grade Seventh Grade Eighth Grade
perc
ent p
rofic
ient
and
abo
ve
Chart 11. Reading Achievement Gap by Grade, FY14
Non low-income and Non-ELL Low-income and Non-ELL Low-income and ELL
Source: LFC Files
Proficient Proficient

Public Education Department, Report #15-09 Performance, Programming, and Cost of Middle Schools in New Mexico June 25, 2015
19
In addition, the achievement gap is evident among assessment sub-groups in New Mexico. Asian and Caucasian students outperformed all other subgroups in sixth, seventh, and eighth grades on the SBA in FY14. Although most sub-groups showed an increase in SBA proficient and above reading scores from sixth to eighth grade, Native American students’ scores did not follow similar trends as scores declined in seventh grade. Caucasian students scored 51 percentage points above ELL, 25 percentage points above Hispanic students, and 33 percentage points above Native American students in the sixth grade. Economically disadvantaged (ED) students showed some growth, but continue to lag behind other subgroups. ELL students are the subgroup with the lowest proficiency scores with a 9 percent overall for sixth grade, 15 percent for seventh grade, and 23 percent for eighth grade students.
Middle schools in New Mexico are more likely to earn “D” or “F” grades than are elementary schools. In FY14, elementary schools slightly out-performed middle schools in terms of distribution of school grades. The majority of middle schools in New Mexico received a “D” or “F” grade in FY14, an increase of 12 percent from FY13. In FY14, 2 percent of middle schools in New Mexico had a school grade of “A,” a decrease of 4 percent from FY13 (Appendix F). Middle schools have more than three times the “D” grades as high schools.
0
10
20
30
40
50
60
70
80
90
Asian Caucasian Hispanic Afr. Amer. Nat. Amer. ELL ED
perc
ent p
rofic
ient
and
abo
ve
Chart 12. Middle School Acheivement Gap in SBA Reading, FY14
6th 7th 8th Source: PED
0%
10%
20%
30%
40%
50%
60%
Elementary Schools Middle Schools High Schools
Chart 13. Percent of Schools with "D" and "F" Grades, FY14
D F
Source: PED

Public Education Department, Report #15-09 Performance, Programming, and Cost of Middle Schools in New Mexico June 25, 2015
20
Several studies suggest students retained in the eighth grade are more likely to drop out of high school than their peers. In New Mexico, over 300 students from a cohort of 25 thousand sixth grade students beginning in FY11 were retained in either sixth, seventh, or eighth grade. Of the students, 32 percent were retained in the eighth grade compared to 33 percent of students retained in seventh grade and 35 percent in sixth grade (Appendix G). Brookings Institute, National Center for Education Statistics (NCES), and Association for Supervision and Curriculum Development (ASCD) studies show data suggesting retention in eighth grade leads to higher drop-out rates in high school.
Table 4. Student Retention by District and Grade (Top 10), FY11 to FY14
District Sixth Grade Seventh Grade Eighth Grade Total Number of
Students Retained Albuquerque Public Schools 39 19 27 85 Santa Fe Public Schools 6 11 11 28 Central Consolidated Schools 2 15 5 22 Gallup-McKinley County Schools 12 5 2 19 Gadsden Independent Schools 2 12 3 17 Rio Rancho Public Schools 8 7 2 17 Carlsbad Municipal Schools 1 2 10 13 Las Cruces Public Schools 4 3 5 12 Española Public School District 3 0 6 9 Farmington Municipal Schools 4 2 2 8 Source: LFC Files
Issues with student discipline increase as students age, creating challenges for middle schools. In New Mexico, disciplinary infractions increase for middle school students in the transitions from fifth to sixth grade and eighth to ninth grade. In FY14, two percent of fifth grade students had one or more disciplinary infraction(s) during the school year. Seven percent of sixth grade students had one or more infractions. Seventh and eighth grade students, who typically do not transition schools between grade levels, were equal at 9 percent and there was a slight increase in ninth grade to 10 percent.
Students with disabilities served by Individuals with Disabilities Education Act (IDEA) are more than twice as likely to receive one or more out-of-school suspensions as students without disabilities. New Mexico’s secondary school suspension rates (middle school and high school) rank among the top twelve states in the nation, according to the U.S. Department of Education. From FY11 to FY12, suspension rates ranged between 13 percent and 15 percent. Nationwide, students with disabilities are more than twice as likely to receive an out-of-school suspension (13 percent) than students without disabilities (6 percent). In contrast, English language learners do not receive out-of-school suspensions at disproportionately higher rates (7 percent suspension rate, compared to 10 percent of student enrollment), according to the U.S. Department of Education.
0%
2%
4%
6%
8%
10%
12%
Fifth Grade Sixth Grade Seventh Grade
Eighth Grade Ninth Grade
Chart 14. Students with One or More Disciplinary Infractions in New Mexico, FY14
Source: LFC Files

Public Education Department, Report #15-09 Performance, Programming, and Cost of Middle Schools in New Mexico June 25, 2015
21
Some school districts or charter schools have recently purchased additional software or hired personnel to help track disciplinary violations. Several selected middle schools have a specialized software program called School Wide Information System (SWIS) that summarizes information about individual students, groups of students, or the entire student body over any time period. Through SWIS, the principal is able to review school-wide referral patterns such as which problem behavior occurs most frequently and define behavior patterns in greater detail. Pecos Middle School, Los Alamitos Middle School, and Mission Achievement and Success are among the middle schools that use the data from SWIS to intervene with students on small infractions before the situation escalates into serious infractions that may require suspension or expulsion. Other schools like Pojoaque Sixth Grade Academy and Pojoaque Middle School have hired a full-time truancy officer to monitor disciplinary violations. Most teachers in the selected middle schools monitor and deal with small infractions often doling out disciplinary actions such as lunch detention. Larger infractions are dealt with at an administrative level. Mobility and absenteeism including truancy, negatively impact student performance in middle school. Absenteeism in middle school can have a negative effect on student performance. Controlling for poverty, every day a middle school student is absent there is a correlation to a reduction in the student’s SBA reading and math scores. The decline in performance varies across grade levels and assesment topics. Frequent absences in elementary schools have consequences contributing to academic weaknesses and poor attendance habits compounding chronic absenteeism as students’ progress into middle school.
Middle school attendance rates decrease from sixth to eighth grade. Poor attendance is a strong indicator of a student’s future performance in school and the student’s likelihood of graduating. In FY14, sixth grade students statewide were absent an average of 4 days and were enrolled an average of 110 days. Eighth grade students statewide missed an average of 4.5 days and were enrolled an average of 109 days. For the same year, 11 percent of sixth grade students were habitually truant, meaning they missed 10 or more days in one school year, and 14 percent of eighth grade students were habitually truant.
-0.4
-0.3
-0.2
-0.1
0
0.1
Sixth Grade Seventh Grade Eighth Grade
Chart 15. Decrease in Reading and Math SBA Scores Per Absence, FY14
Reading Scores Math Scores
Source: LFC Files
Table 5. Disciplinary Infractions in New Mexico by Grade and Severity of Infraction, FY14
Grade Infractions
Out of School
Suspensions
Percent of Students with One or More
Out of School Suspensions
Number of Expulsions
Alternative Placements
Fifth 499 338 1% 1 0 Sixth 1674 1165 5% 1 14 Seventh 2277 1730 7% 8 22 Eighth 2280 1688 7% 7 36 Ninth 2786 2118 7.5% 24 41 Source: LFC Files

Public Education Department, Report #15-09 Performance, Programming, and Cost of Middle Schools in New Mexico June 25, 2015
22
number of days absent eighth grade
806040200
mat
h sc
aled
sco
re
100
80
60
40
20
0
y=40.02-0.39*x
number of days absent eighth grade
806040200
read
ing
scal
ed s
core
80
60
40
20
0
y=44.71-0.31*x
Chart 17. Relationship Between Eighth Grade Absences and Reading Scores, FY14
Absences have the largest impact on eighth grade reading and math SBA scores with a reduction of 0.31 in reading and .40 in math scaled points for every absence. A student with zero absences is projected to be proficient in both reading and math, however the likelihood of scoring proficient on the SBA declines with every absence. For example a student with 10 absences would potentially reduce their SBA scaled score points in reading by 3.1 points and in math by 4.0 points. In addition, a student with 20 absences would reduce their SBA scaled scored points in reading by 6.2 points and in math by 8.0 points. The charts below show a high concentration of eighth grade students in New Mexico with absences between zero and 20 days with a group of students missing over 40 days of school.
Chronic absenteeism begins to rise in middle school and continues to climb through twelfth grade. Nearly a quarter of school districts in New Mexico have habitually truant percentages higher than the statewide average of 12.5 percent. National research has found a strong relationship between sixth grade attendance and on-time graduation rates. Chronic absenteeism in middle school is one of the best indicators a student will drop out later. Students who were chronically absent in any year between eighth and twelfth grades were 7.5 times more likely to drop out of high school. A report by the National Assessment of Educational Progress (NAEP) found absences had
0% 2% 4% 6% 8%
10% 12% 14% 16% 18% 20%
Fifth Grade Sixth Grade Seventh Grade Eighth Grade Ninth Grade
Chart 16. Students Absent 10 or More Days in NewMexico, FY14
Source: LFC Files
Source: LFC Files
Chart 17. Relationship Between Eighth Grade Absences and Reading Scores, FY14
Chart 18. Relationship Between Eighth Grade Absences and Math Scores, FY14

Public Education Department, Report #15-09 Performance, Programming, and Cost of Middle Schools in New Mexico June 25, 2015
23
consequences for fourth and eighth grade students: 56 percent of eighth grade students who performed at the advanced level in NAEP reading in FY11 had perfect attendance in the month before the test, compared with 39 percent of students who performed below the basic level; in contrast, nearly one in five eighth grade students at the basic level and more than one in four below basic in reading had missed three or more days in the previous month. The trends were similar for fourth grade students. A student who misses an average of 3 days a month is missing five weeks of school each year, based on a nine month school calendar.
PED data compiled annually reveals the percentage of middle school students habitually truant has increased by 8 percent in one year and 11 percent since FY08. In FY14, middle school students were nearly 9 percent more habitually truant than elementary students (Appendix H).
Eighteen percent of middle school students who attended seventh grade at one school attended a different school for eighth grade. Previous LFC program evaluations concluded mobility can negatively affect student performance. Farmington Municipal Schools had the highest mobility rate at 33 percent. In comparison, West Las Vegas Public Schools had a rate of 17 percent and APS had a rate of 12 percent.
7th 5% 8th
5%
9th 35%
10th 21%
11th 17%
12th 17%
Chart 19. FY13 Dropouts by Grade N=7,185
Source: LFC Files
0%
2%
4%
6%
8%
10%
12%
14%
16%
18%
20%
FY08 FY09 FY10 FY11 FY12 FY13 FY14
Chart 20. Percentage of Elementary School Students Habitually Truant
Source: PED
0%
2%
4%
6%
8%
10%
12%
14%
16%
18%
20%
FY08 FY09 FY10 FY11 FY12 FY13 FY14
Chart 21. Percentage of Middle School Students Habitually Truant
Source: PED

Public Education Department, Report #15-09 Performance, Programming, and Cost of Middle Schools in New Mexico June 25, 2015
24
Table 6. Student Mobility Seventh and Eighth Grades by District, FY13 to FY14
District
Number of Students Who Attended Same
School for Seventh and Eighth Grade
Number of Students Who Did Not Attend Same School
for Seventh and Eighth Grade
Percent of Students Who Did
Not Attend the Same School in
Seventh and Eighth Grade
Districtwide Seventh Grade SBA Reading Scaled Scores
Districtwide Eighth Grade SBA Reading Scaled Scores
Farmington Municipal Schools 546 269 33% 38.7 41.0 All School Districts 20,476 4,530 18% 39.5 42.1 West Las Vegas Public Schools 98 20 17% 37.0 38.1 Albuquerque Public Schools 5465 766 12% 39.5 42.4 Bernalillo Public Schools 170 22 11% 36.8 40.0 Española Public School District 261 28 10% 36.2 38.6 Las Cruces Public Schools 1557 170 10% 39.9 42.8 Moriarty-Edgewood Schools 219 23 10% 40.1 44.4 Gallup-McKinley County Schools 727 74 9% 34.8 37.6 Los Lunas Schools 573 60 9% 39.8 42.0 Rio Rancho Public Schools 1152 115 9% 42.9 45.7 Socorro Consolidated Schools 128 12 9% 37.8 38.6 Aztec Municipal Schools 228 21 8% 39.2 42.5 Belen Consolidated Schools 268 23 8% 39.5 41.3 Carlsbad Municipal Schools 421 35 8% 38.2 39.6 Hobbs Municipal Schools 599 52 8% 37.3 40.1 Roswell Independent Schools 637 56 8% 40.6 43.5 Santa Fe Public Schools 913 83 8% 37.9 40.5 Alamogordo Public Schools 326 25 7% 42.7 45.4 Pecos Independent Schools 42 3 7% 39.9 40.6 Central Consolidated Schools 400 22 5% 38.6 40.3 Gadsden Independent Schools 930 39 4% 40.1 43.3 Hatch Valley Public schools 88 4 4% 37.6 38.8 Los Alamos Public Schools 244 9 4% 47.7 51.7 Deming Public School District 381 3 <1% 36.9 39.3 Source: LFC Files and PED
Mobility can negatively affect student performance. Controlling for poverty, there is a statistically significant difference in SBA proficient and above scores for students who attended a different school in eighth grade than they attended in seventh grade. Students who were mobile scored 2.4 points lower on reading SBA and 3.0 points lower on math SBA. Mobility also has an impact on student reading and math proficiency as indicated in the charts below.
0%
10%
20%
30%
40%
50%
60%
At Same School Not at Same School
Chart 22. Percent of Middle School Students Proficient in Reading, FY13
to FY14
Source: LFC Files
0%
10%
20%
30%
40%
50%
60%
At Same School Not at Same School
Chart 23. Percent of Middle School Students Proficient in Math, FY13 to
FY14
Source: LFC Files
Public Education Department, Report #15-09 Performance, Programming, and Cost of Middle Schools in New Mexico June 25, 2015
25
Several studies indicate the fewer transitions a student undergoes the better for academic and social emotional growth; however, it is unclear which grade configuration elicits the greatest student outcomes. National research indicates school transitions cause a significant decrease in grade point average and math and reading scores on standardized assessments. In addition, school transitions have a negative impact on students’ psychological and social emotional well-being. Transitions from elementary to middle and middle to high school are crucial. Students often have difficulty adapting to new buildings, teachers, schedules, and academic demands thus student achievement decreases and discipline problems increase. National research indicates middle school grade configurations can have an impact on student performance. The RAND Corporation recommends states and school districts consider alternatives to the sixth through eighth grade model to reduce multiple transitions and to better align programming. In smaller school districts in New Mexico students feed into middle school from one to three elementary schools and into one high school. Larger school districts like APS have feeder clusters according to high schools; each middle school may have three or four feeder elementary schools. A smooth transition to the middle grades will enhance student performance. Transitions may involve repeated schools visits or an orientation period for incoming students. Extensive coordination among teachers at sending and receiving information on the needs of particular students and other steps to facilitate the flow of information is essential. An ACT study stated the process of preparing students to make successful transitions from middle school to high school is just as important as the process of preparing them to make successful transitions from high school to postsecondary. Selected middle schools follow traditional transition patterns of having elementary students visit their schools as a group during one day where they visit classrooms and fill out a survey of the electives they would like to take. Some invite the band or orchestra to play for the incoming middle school students or have junior honor society or student government students welcome the new students. Other schools have an open house in the evening to introduce parents and students to the middle school. Some middle schools have sought creative ways to transition elementary students into middle school and raise student proficiency through summer jump start programs. Picacho Middle School and La Academia Dolores Huerta Charter School in Las Cruces both target Quartile I (QI), or the percentile of lowest-performing students. Those students enter a summer school prior to sixth grade to help raise proficiency rates before middle school. The same routine usually occurs between middle school and high school. All selected schools serving eighth graders affirmed following the state mandate of next step plans for transition from middle school to high school. Las Cruces Public Schools and Santa Fe Public Schools have moved next step plan meetings to the high school so students can meet with high school counselors and receive a better understanding of the credit process. In New Mexico, there is no clear cut answer to which grade configuration leads to higher student performance on the state assessment. None of the three most popular grade configurations produce an average student proficient scaled score of 40 or above on the SBA with the exception of reading in kindergarten through eighth grade configuration in FY13. The state average in reading and math was higher than any grade configuration in FY14 (Appendix I).
PED Next Step Plans
o The next step plan (NSP) developed by each student at the end of grades eighth through eleventh and during senior year.
o The plan must target the student’s postsecondary interests and the studies completed during high school.
`
o Each student reviews and updates the NSP annually.
o State rule requires the NSP be completed within 60 days of the preceding school year.
o NSP requires students to: o Research career interests or goals o Plan postsecondary education o Explore financial aid opportunities o Examine industry certification or other career
options
o A separate NSP not needed for special education students with an individual education plan (IEP). The state’s NSP requirements must be incorporated into the IEP. Once a student reaches age 14, the IEP includes transition IEP requirements of state special rule at Subsection G of 6.31.2.11 NMAC and federal IDEA at 34 CFR Secs. 300.320(b) and 300.324(c).
o ELL students receive the same NSP.
Source: PED

Public Education Department, Report #15-09 Performance, Programming, and Cost of Middle Schools in New Mexico June 25, 2015
26
PED instructional audits of selected middle schools reveal the schools are at beginning steps for implementing state mandates. Middle schools are struggling to implement new Common Core State Standards (CCSS), schools are not data-driven, there is a lack of differentiated instruction, and research-based interventions are inconsistent. During site visits principals and instructional staff also described a lack of professional development opportunities in the areas of CCSS, data-driven instruction, differentiated instruction, and interventions (Appendix J). However, PED maintains a New Mexico Common Core Professional Development Program (NMCCPD) with a guiding coalition made up of state stakeholders and regional mentors available to school districts. Since 2014, PED has offered 20 professional development opportunities in CCSS for teachers, school leaders, or district administrators. In addition, PED offers webinars and online classes on its website in the areas of CCSS, support for diverse learners, and response to intervention. PED instructional audits of selected schools reveal common core implementation, research-based interventions, and differentiated instruction were “inconsistent,” “fuzzy,” or “not evident.” Eight of the 33 selected schools received a PED audit in FY15. PED audits are conducted in schools receiving a “D” or “F” grade. The CCSS have been phased in over the last three years and should have been in full effect by FY14; however most PED audits show schools are in “beginning steps” for implementing CCSS, curriculum and assessments are “not aligned” to CCSS or learning objectives “were not observed.” During site visits, learning objectives were also not observed in a majority of classrooms visited.
32 33 34 35 36 37 38 39 40 41
7th-12th 6th-8th K-8th State
prof
icie
nt =
sca
led
scor
e of
40
Chart 24. SBA Reading Scaled Scores by Middle School Grade Configuration, FY12 to FY14
FY12 FY13 FY14 Source: PED
32
33
34
35
36
37
38
39
40
41
7th-12th 6th-8th K-8th State
prof
icie
nt =
sca
led
scor
e of
40
Chart 25. SBA Math Scaled Scores by Middle School Grade Configuration, FY12 to FY14
FY12 FY13 FY14 Source: PED
Public Education Department, Report #15-09 Performance, Programming, and Cost of Middle Schools in New Mexico June 25, 2015
27
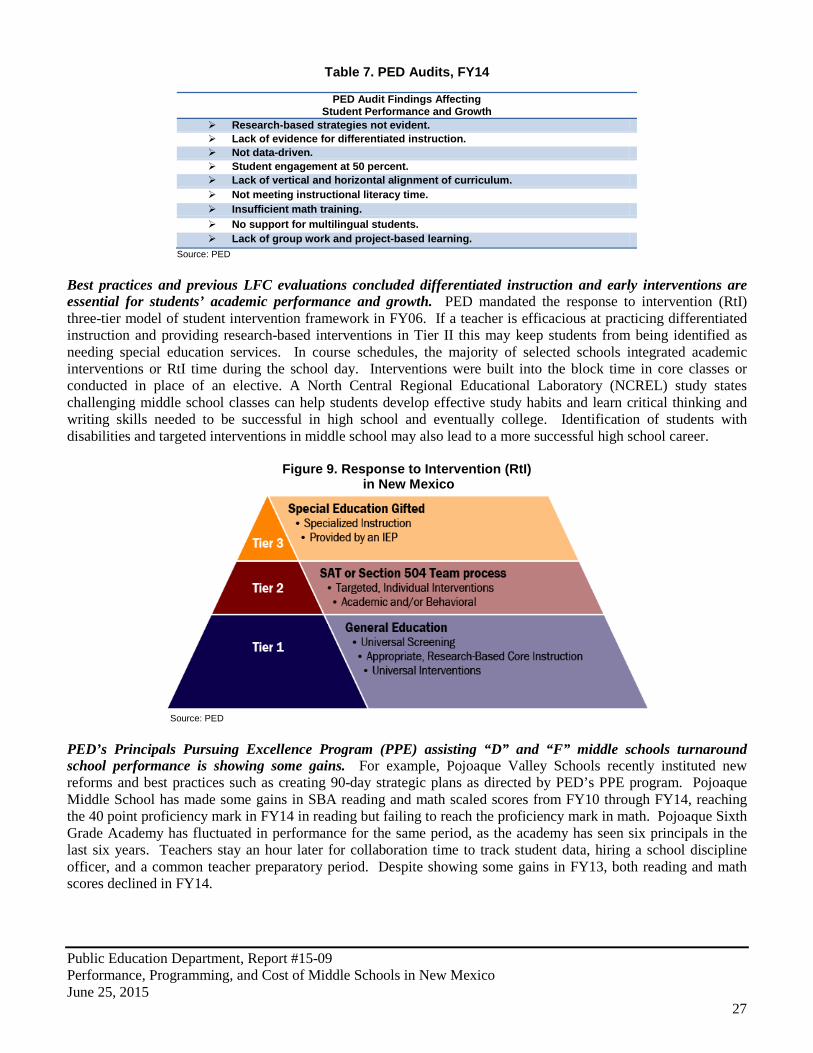
Table 7. PED Audits, FY14
PED Audit Findings Affecting Student Performance and Growth
Research-based strategies not evident. Lack of evidence for differentiated instruction. Not data-driven. Student engagement at 50 percent. Lack of vertical and horizontal alignment of curriculum. Not meeting instructional literacy time. Insufficient math training. No support for multilingual students. Lack of group work and project-based learning.
Source: PED Best practices and previous LFC evaluations concluded differentiated instruction and early interventions are essential for students’ academic performance and growth. PED mandated the response to intervention (RtI) three-tier model of student intervention framework in FY06. If a teacher is efficacious at practicing differentiated instruction and providing research-based interventions in Tier II this may keep students from being identified as needing special education services. In course schedules, the majority of selected schools integrated academic interventions or RtI time during the school day. Interventions were built into the block time in core classes or conducted in place of an elective. A North Central Regional Educational Laboratory (NCREL) study states challenging middle school classes can help students develop effective study habits and learn critical thinking and writing skills needed to be successful in high school and eventually college. Identification of students with disabilities and targeted interventions in middle school may also lead to a more successful high school career.
Figure 9. Response to Intervention (RtI) in New Mexico
Source: PED PED’s Principals Pursuing Excellence Program (PPE) assisting “D” and “F” middle schools turnaround school performance is showing some gains. For example, Pojoaque Valley Schools recently instituted new reforms and best practices such as creating 90-day strategic plans as directed by PED’s PPE program. Pojoaque Middle School has made some gains in SBA reading and math scaled scores from FY10 through FY14, reaching the 40 point proficiency mark in FY14 in reading but failing to reach the proficiency mark in math. Pojoaque Sixth Grade Academy has fluctuated in performance for the same period, as the academy has seen six principals in the last six years. Teachers stay an hour later for collaboration time to track student data, hiring a school discipline officer, and a common teacher preparatory period. Despite showing some gains in FY13, both reading and math scores declined in FY14.

Public Education Department, Report #15-09 Performance, Programming, and Cost of Middle Schools in New Mexico June 25, 2015
28
A few middle schools in New Mexico with high poverty rates, higher than average school grades, and higher than predicted values on SBA scores are “beating the odds.” Twelve middle schools or 8 percent of all non-charter middle schools in New Mexico may be considered “beating-the-odds.” The middle schools were selected based on factors such as positive results from the predicted versus the actual proficiency scores on the SBA in both reading and math, school grades of C or above for the last three years and FRL above the state average of 72.8 percent, a few middle schools are beating the odds. Only three charter schools or 5 percent, could be considered beating-the-odds according to two predictors, middle school grades and FRL. While beating-the-odds middle schools share similar characteristics, they also have unique programming. Principals at the selected schools are hands-on, get to know students, and readily identify strengths and areas of growth for their school. The principals have high and clear expectations and align curriculum vertically. Principals at many of the selected middle schools could identify students by name, addressed programming, and identified their “wish list” (Appendix K). One beating-the-odds school places goals and school mission statements around the middle school building.
Figure 10. Goals and School Mission Statement
Source: Pecos Independent School District
32
33
34
35
36
37
38
39
40
41
FY10 FY11 FY12 FY13 FY14
Chart 26. Pojoaque Middle School, Reading and Math, SBA
Scaled Scores, FY10 to FY14
Reading Math
Source: PED
31
32
33
34
35
36
37
38
39
40
41
FY10 FY11 FY12 FY13 FY14
Chart 27. Pojoaque 6th Grade Academy Reading and Math, SBA
Scaled Scores, FY10 to FY14
Reading Math Source: PED
Proficient Proficient

Public Education Department, Report #15-09 Performance, Programming, and Cost of Middle Schools in New Mexico June 25, 2015
29
Pecos Middle School continues to receive carry-over federal Student Improvement Grant (SIG) funds and has experienced a steady increase in student performance between FY10 and FY14, nearly reaching the proficiency target in reading in FY14 but failing to achieve proficiency in math. Pecos Middle School received SIG funding from FY11 to FY14 following a transformational model. According to the U.S. Department of Education, to follow the model a school must:
1) Replace the principal and take steps to increase teacher and school leader effectiveness; 2) Institute comprehensive instructional reforms; 3) Increase learning time and create community-oriented schools; and 4) Provide operational flexibility and sustained support.
Pecos follows best practices of aligning the curriculum from kindergarten to twelfth grades, embedding reading and math interventions into the school day, mandating teacher collaboration time, and providing career and college readiness curriculum to students beginning in seventh grade. Pecos is a QualityCore ACT school and all high school juniors – whether college-bound or not – take the ACT.
Santa Teresa Middle School in the Gadsden Independent School District has surpassed state SBA scaled scores in reading and math for the last five years. Santa Teresa has the highest FRL rate, 98 percent, of the selected schools and almost one fourth of all students, 24 percent are ELLs. School administrators closely monitor student data and the leadership team is an integral part of the decision-making process. Math classes are separated by gender, increasing student engagement and decreasing classroom management and disciplinary issues.
20
25
30
35
40
45
FY10 FY11 FY12 FY13 FY14
Chart 28. Pecos Middle School Reading and Math, SBA Scaled Scores, FY10 to FY14
Reading Math Source: PED
Proficient

Public Education Department, Report #15-09 Performance, Programming, and Cost of Middle Schools in New Mexico June 25, 2015
30
Recommendations
The Legislature should: • Consider legislation to require sixth and seventh grade students complete a next step plan to expose and
target a student’s possible postsecondary interests and set the classes the student will complete in middle school in order to be on track for high school graduation.
The Public Education Department should:
• Continue to reinforce implementation of school site best practices through the budget process, technical assistance, institutional audits, and targeted turnaround initiatives already in place.
School Districts and charter schools should:
• Provide case management for students who fall below established school district or school parameters. • Build academic and behavioral interventions within the school day. • Begin college and career counseling by sixth grade.
0
10
20
30
40
50
60
FY10 FY11 FY12 FY13 FY14
Chart 29. Santa Teresa Middle School, SBA Reading Scaled
Scores, FY10 to FY15
STMS 7th State 7th STMS 8th State 8th
Source: PED
0
10
20
30
40
50
60
FY10 FY11 FY12 FY13 FY14
Chart 30. Santa Teresa Middle School, SBA Math Scaled Scores,
FY10 to FY15
STMS 7th State 7th STMS 8th State 8th
Source: PED
Proficient Proficient

Public Education Department, Report #15-09 Performance, Programming, and Cost of Middle Schools in New Mexico June 25, 2015
31
MIDDLE SCHOOLS IN NEW MEXICO DO NOT CONSISTENTLY PROVIDE PROGRAMMING AND RESOURCES TO PROMOTE MOTIVATIONAL AND SOCIAL-EMOTIONAL BEHAVIOR CONDUCIVE TO ENGAGEMENT AND ACADEMIC GROWTH According to National Conference of State Legislatures (NCSL) and other research, a focus on student engagement, behavior, and course performance boosts achievement in middle school. Best practices in national studies suggest students in the middle grades (sixth, seventh, and eighth) require creative programming that compels students to attend school. School districts and charter schools need cognitively rich activities which combine teamwork with performance to engage students. National statistics show student engagement drops by 15 percent from elementary school to middle school and then another 17 percent from middle school to high school, according to the Gallup Poll survey. New Mexico, however, does not participate in the Gallup Poll survey. Early warning and intervention systems track and monitor student performance using data, targeted professional development based on characteristics of young adolescents, and the use of challenging, project-based instruction to engage students.
Figure 11. Whole School Program for Middle School Students
Source: NCSL Task Force Report, National Middle School Association Career and technical education (CTE), previously referred to as vocational education has the potential to promote a personalized learning environment for middle school students through strong curriculum and instruction, increase student achievement and further engage students in their learning. Best practices of high-performing schools dictate middle school students should be exposed to an exploration of subject areas, especially experiential classes such as CTE and college and career readiness to better engage students. Barriers exist to improve middle school engagement through CTE and career and college readiness. Career-focused classes are generally not offered in the middle school grades. State law requires districts offer electives for middle school students that contribute to academic growth and skill development and provide career and technical education, previously known as vocational education (Section 22-13-1 NMSA 1978). Career and technical education classes provide technical knowledge skills and competency-based applied learning. PED states minimal primary and secondary education standards for CTE consists of challenging academic and technical standards for students in seventh through twelfth grades. CTE should assist students in meeting such standards including preparation for high-skill, high-wage, or high-demand occupations in current or emerging professions. New Mexico recently adopted the common career technical core standards for students in seventh through twelfth grades.
Attendance Chronic absenteeism = low
graduation rates
• Measure and track attendance (every absence elicits a response).
• Recognize good attendance. • Separate attendance from course
performance. • Create culture where school perceived
as safe and engaging place.
Belief, Behavior, and Effort Success= hard work and positive
behavior
• Create high engagement electives for short-term success.
• Honor and use students' desire for adventure and camaraderie.
• Develop challenging, attainable learning tasks.
• Teach organizational and self-management skills.
Course Performance
• Require formative and summative assessments that integrate skills and require application.
• Create developmentally appropriate high school readiness indicators that are meaningful and engaging.
• Offer interventions or enrichment when/if needed (evaluate effectiveness).
Public Education Department, Report #15-09 Performance, Programming, and Cost of Middle Schools in New Mexico June 25, 2015
32
Most selected middle schools do not offer CTE classes. Selected schools cited high schools received funding for career and technical education classes but the school districts failed to apportion funding for middle school classes. According to PED, when schools are looking to offer CTE classes, they are making decisions between staffing high schools versus middle schools and because CTE has more immediate consequences or possibilities for high school students, they often prioritize providing the staffing to the high school. Additionally, there is not a mechanism for accountability tied to CTE at the middle school level. Since college and career readiness is a measure in high school grades, it is something that is addressed within scheduling curricular implementation (Appendix L). The public school funding formula has no specific units for CTE participation. The original funding formula enacted in 1974 included program units for students enrolled in approved vocational education programs, which were based on a unique cost differential factor and also subject to multiplication by the instructional staff training and experience (T&E) index. By 1976, however, the vocational cost differential was eliminated as a separate factor and subsumed into a single cost differential for seventh through twelfth grade basic program units (Laws of 1976 S.S., Chapter 32). According to the Legislative Education Study Committee (LESC), in the absence of separately identifiable units or categorical appropriations from the Legislature, it is difficult to ascertain the level of state funding currently available to support CTE (vocational) programs. PED does not administer any grant at the middle school level for CTE nor does the state receive federal funding for CTE middle school programs. The federal Carl D. Perkins Vocational and Technical Education Act was first authorized in 1984 and then reauthorized in 1998. The 1998 law was reauthorized as the Carl D. Perkins Career and Technical Education Improvement Act of 2006, commonly referred to as Perkins IV. As outlined in Perkins IV, states must allocate at least 85 percent of funds to eligible recipients by formula allocation. Up to 10 percent of the funds can be used for leadership activities and up to 5 percent can be used for administration. Perkins IV includes three major areas of revision: 1) using the term "career and technical education" instead of "vocational education"; 2) maintaining the tech prep program as a separate federal funding stream within the legislation; and 3) maintaining state administrative funding at 5 percent of a state’s allocation. Only high schools receive federal Perkins IV funding. In FY14, New Mexico received $8.1 million in Perkins funding, according to PED. Some smaller and rural schools lack scale to make affordable CTE classes. Some school districts offer a variety of elective classes and shorter classes during the semester called “the wheel.” The wheel offers enrichment classes where students rotate from one elective to another during each nine-week period or quarter. For example, at Tularosa Middle School in Tularosa Municipal Schools, a student may rotate among kitchen chemistry, photo-shop, and movement in one semester. At Chaparral Middle School in Alamogordo Public Schools, wheel classes entail music, arts, and sports. In several selected schools principals relayed the shortage of licensed vocational teachers. The future of CTE in New Mexico middle schools may take a non-traditional approach. Sierra Middle School in the Las Cruces Public School District is a science and fine arts and broadcasting magnate school which offers classes in broadcasting. Students use computer software and technology to create news broadcasts, public service announcements, music videos, and project-based learning. During a site visit students were visibly engaged and instruction was student-centered. The majority of classes were project-based and instruction was differentiated, two best practices for students particularly in the middle grades. One principal stated CTE teachers at his school and in his district are nearing retirement age; once his family and consumer science (FAC) teacher retires, he will neither have the staff nor the funding to replace the teacher. Another principal stated it is important for middle schools to offer pre-cursor vocational classes to complement the high school curriculum.
Requirements for NM Licensure, Secondary Vocational-Technical, 7-12
Bachelor's degree including 32 credit hours of vocational-technical training related to the occupational area OR associates degree plus 2 years work experience related to the occupational area OR certificate plus 3 years of work experience related to the occupational area OR high school diploma/GED plus 5 years of work experience related to the occupational area AND within 3 years of the date of employment, meet the following: Minimum of 15 semester hours in a secondary vocational-technical education program AND supervised classroom internship/student teaching experience OR professional development plan (PDP) developed, in lieu of completion of 15 semester hours in secondary vocational-technical education and supervised student teaching, by the employing authority and approved by PED. Source: PED

Public Education Department, Report #15-09 Performance, Programming, and Cost of Middle Schools in New Mexico June 25, 2015
33
Some state universities in New Mexico offer licensure tracks in traditional vocational arts or CTE. Eastern New Mexico University (ENMU) and Western New Mexico University (NMSU) are the only four year institutions in New Mexico offering a B.A. in vocational or career and technical education. However, entrance to both B.A. programs requires a prior certification in a technical field. According to the National Research Center for Career and Technical Education (NRCCTE), teacher certification and licensure requirements across the United States are in constant flux. CTE, with its many subject disciplines, has historically had two pathways to certification and licensure: a traditional degree-based program of classes, field experiences, and exit exams and an alternative pathway based primarily on work experience.
Table 8. Career and Technical Education Teacher Licensure Tracks in New Mexico
University/College
College/Department
Degree(s)
Program Requirements Eastern New Mexico University
College of Education and Technology (Vocational Education Teacher Program NM licensure 7-12)
B.A.
Career and technical educators must be certified in a technical field prior to enrolling in the program.
New Mexico Highlands College of Education na na New Mexico State University
College of Education
To obtain a New Mexico teaching license to teach in vocational education, earn a bachelors and/or have work experience in that area. The New Mexico Teacher Assessments are not required for this license.
Northern New Mexico College
College of Education
na
na
University of New Mexico
College of Education
na
To obtain a New Mexico teaching license to teach in vocational education, earn a bachelors and/or have work experience in that area. The New Mexico Teacher Assessments are not required for this license.
Western New Mexico University
College of Education Career and Technical Education
B.A.
For entrance into the program, students should already possess an associate of arts degree in a technical field such as construction technology, automotive technology, digital media, or business.
Source: LFC Files
PED oversees all teacher preparation programs in New Mexico; this is inclusive of programs geared toward career and technical education. According to PED, teachers that come from programs within an institute of higher learning emphasizing CTE generally can apply for a secondary license with an endorsement in the specific area. Teachers that come from industry are generally applying for the vocational license. This license provides opportunity for experience to be a qualifier for initial licensure. Because many CTE teachers (mechanics, culinary arts, construction) are entering the field with industry experience and certification, they are not attending colleges of education or teacher preparation colleges and may not receive training in pedagogy. College and Career Readiness needs to start earlier than eighth grade. According to an ACT study, fewer than 20 percent of eighth grade students nationwide are on track to be ready for college-level work by the time they graduate from high school. Section 22-13-1.1 NMSA 1978 provides, at the end of eighth through eleventh grades and during the senior year, each student must prepare an interim next step plan setting the course for the grades remaining until high school. Local school boards are directed to ensure the plans are based on reports of college and workplace readiness assessments as available and to ensure high school students are reasonably informed about curricular and course options, including the following classes: honors or advanced placement; dual-credit; distance learning; career clusters; or remediation programs. A recent ACT study found academic and career counseling needs to start as early as sixth grade so students are prepared for the rigorous curriculum of high school and beyond.

Public Education Department, Report #15-09 Performance, Programming, and Cost of Middle Schools in New Mexico June 25, 2015
34
A National Association of Secondary School Principals (NASSP) report highlights the importance of educational reform as many students are leaving middle school unprepared for the academic rigors of high school. NASSP has several recommendations for public middle schools.
Table 9. National Association of Secondary School Principals Recommendations for Middle Schools
Recognize and support middle grades as a unique developmental stage apart from
elementary and high school grades; Strengthen middle level organizational structures, instructional practices, and classroom
learning environments; Improve middle level transitions; and Identify and promote specialized middle level teacher and school leader competencies.
Source: National Association of Secondary School Principals Middle school students who demonstrate the behaviors enhancing academic achievement are more likely to perform well academically in high school and be ready for college or a career by the end of high school. By considering these behaviors along with academic achievement, educators may be able to more accurately identify students who are in the greatest need of interventions to prevent them from failing classes and dropping out of school, thus increasing the likelihood these students will graduate from high school. Academic and social behaviors also affect grade point average by ninth grade. Grade point average not only predicts future academic performance but also can be used to identify students who are at high risk of experiencing academic difficulty.
Figure 12. College Readiness Bulletin Board
Source: Gadsden Independent School District For example, algebra I is a gateway class for students planning to attend college; much like proficiency in reading by third grade is an essential benchmark in elementary school. An ACT study revealed middle school students who take rigorous classes such as algebra I can enroll in advanced and higher-level classes in high school. Students in higher-level classes are likely to obtain information about postsecondary opportunities and are likely to apply to a four-year college, according to several studies. Particularly among minority and first generation college students, those who take higher-level math classes are more likely to attend college. Most selected schools offer algebra I for high school credit and honors classes for students in need of enrichment such as gifted students. Evaluated schools do offer algebra I for high school credit and many offer geometry for high school credit either on site or at a high school campus. Some charter schools offer accelerated classes on-line while Santa Teresa Middle School in Gadsden Independent Schools offers English language arts I for high school credit as well as algebra I and geometry.

Public Education Department, Report #15-09 Performance, Programming, and Cost of Middle Schools in New Mexico June 25, 2015
35
Middle schools with formal college and career readiness programs often do not serve all students. Middle schools in the evaluation had college and career readiness Advancement Via Individual Determination (AVID) programs. Most of the schools only served 5 percent to 10 percent of the overall population. For example, 5 percent, or 438 students at Rio Rancho Public Schools participate in AVID college and career readiness program for sixth through twelfth grades. Fifty percent of FY13 cohort attended post-secondary institutions after graduation while FY14 saw a 40 percent increase with 90 percent attending a post-secondary institution. Among AVID students, grade point averages increased by 11 percent and participation in AP classes and exams increased. AVID’s mission is closing the student achievement gap and making college accessible. The program recruits “middle of the road” and first generation college students in sixth through eighth grades. Cost per student ranges from $539 per student at Rio Rancho Middle School to $841 at Mountain View Middle School.
Table 10. AVID Program Costs at Rio Rancho Public Schools, FY15
Costs
Eagle Ranch Middle
Lincoln Middle
Mountain
View Middle
Rio Rancho
Middle
Cleveland
High
Rio Rancho
High
School District Total
Tutors $,9464 $1,690 $2,704 $2,873 $6,760 $6,760 $37,151 Annual fee $3,840 $3,840 $3,840 $3,840 $3,840 $3,840 $23,040 Director/professional development/subs
$3,005
$3,005
$3,005
$3,005
$3,005
$3,005
$18,030
FTE 1 .2 .2 .2 1 1 4 Total students 849 1,010 888 1222 2,327 2,399 9,104 Participants (Percentage of total students)
115
(13%)
20
(1%)
29
(3%)
47
(3%)
103
(4%)
124
(5%)
438
(5%) Total student cost $71,309 $22,535 $23,549 $23,718 $68,605 $68,605 $318,221 Average Cost per student $561 $460 $841 $539 $653 $512 $594
Source: Rio Rancho Public Schools APS is utilizing the AVID program like Rio Rancho Public Schools; however the largest middle school in the state (1,401 students) offers the program to 75 students or 5 percent of the total school population. Teachers may require different preparation and professional development to effectively deal with young adolescent needs. As stated in previous LFC evaluations, teachers have a great impact on student performance. Many middle schools teachers are generalists teaching students from sixth to eighth grades with a kindergarten through eighth (k-8) teaching license. In New Mexico, 73 percent, or 5,788 out of 7,864 middle school teachers have k-8 teacher licenses but may have another license(s). Of the total middle school teachers, 28 percent, or 2,264, only had a k-8 grade license. A National Council for Teachers of Mathematics (NCTM) study reveals many middle school teachers do not have a major, minor, or certification in the core subject areas they teach and lack training in the development of young adolescents. The NCTM study further states k-8 teacher certification programs rarely require more than nine semester hours of mathematics content and possibly a three credit methods class. NCTM's Principles and Standards for School Mathematics as well as other recent national reports on school mathematics suggest prospective middle school teachers take at least 21 semester-hours of mathematics, including at least 12 semester-hours on fundamental ideas of school mathematics appropriate for middle grades teachers, in order to broaden understanding of mathematical connections between one educational level and the next. New Mexico has three routes to becoming a licensed mathematics teacher - traditional, alternative or out-of-state. In the traditional route for secondary math requirements, no distinction is made between middle school and high school. While specific classes are listed under secondary math requirements, no specific credit hour amounts are listed.

Public Education Department, Report #15-09 Performance, Programming, and Cost of Middle Schools in New Mexico June 25, 2015
36
Table 11. PED Routes to become Licensed Mathematics Teacher
Traditional Route for Teacher Licensure Middle School Grades 5-9 Secondary Grades 7-12
Secondary Math Requirements
Aspiring math teachers not yet enrolled in undergraduate program. Fulfill requirements of math major.
• Calculus • Advanced algebra and geometry • Statistics and probability • Discrete mathematics • Trigonometry
Education program component of the degree. 24 semester hours: student teaching segment - focus on pedagogy and education while developing skills
Alternative Route Program Requirements
Candidate with bachelor’s degree in math but not completed an education program.
• 30 semester hours in a post-graduate mathematics education program
• Master’s degree in any field and 12 hours of graduate study in a mathematics education program
• Doctoral degree in a mathematics field • 12-21 semester hours in PED-approved alternative education
program Out-of-State Route Requirements Licensed teacher in a state other than New Mexico, generally eligible for a New Mexico teaching license if the program completed had similar requirements as those of New Mexico.
• At least a bachelor’s degree in the field of math • Valid teaching license from home state or Department of
Defense school • Completed standard or alternative teacher preparation
program • Passed tests to obtain license • Demonstrate licensed teaching experience
Source: PED Some of these developmental needs are ignored or challenged in middle schools. In Best Schools, Armstrong (2006) states’ middle schools must provide students in early adolescence with an environment to allow them to navigate the impact of puberty on their intellectual, social and emotional lives. In an Association for Supervision and Curriculum Development (ASCD) report, best practices in middle schools were described as providing a safe school environment, student-initiated learning, student roles in decision making, and strong adult role models. School districts and charter schools in this evaluation have attempted to incorporate a period in the day where middle school students may interact with a teacher or teachers who follow their academic and behavioral progress. In the selected middle schools, most traditional “homerooms” are gone; instead an “advisory” period helps a teacher track 10 to 15 students in more of a progress monitoring or case management system. For example, Garfield Middle School in Albuquerque Public Schools (APS) has a 30 minute advisory period at the beginning of the school day where each teacher is responsible for about 15 students. Camino Real Middle School in Las Cruces Public Schools (LCPS) has an advisory period in which students’ grades, data, and behavior are progress monitored and special education and bilingual students have access to case managers. La Academia Dolores Huerta Charter School has an advisory period where students set goals for the academic year and the trajectory of their middle school careers. Mission Achievement and Success Charter School maintains a consistent schedule where teachers see students every day and has hired a dean of students to track students’ academic and behavioral progress. Best practices indicate modeling and teaching resiliency and self-management/organizational skills is essential for middle school aged students. Research suggests risk behavior rates in young adolescents are associated with resiliency, or protective factors. Students with close relationships with their parents, teachers, peers, and adults in the community are less likely to engage in risk behaviors such as smoking cigarettes, using cocaine, binge drinking, being involved in physical fights, or attempting suicide. Similar patterns are found for students who say they have strong positive relationships with their teachers, friends their own age or adults in the community. Fifty-three school-based health centers serve student statewide with 28 serving middle school students. The centers provide comprehensive primary care and behavioral health services by using a multi-disciplinary health team. It is essential for teachers to receive professional development in the areas of social-emotional behavior for young adolescents.

Public Education Department, Report #15-09 Performance, Programming, and Cost of Middle Schools in New Mexico June 25, 2015
37
Adolescence is the stage of development that sees students less bound by societal conventions and ready to challenge authority mixed with feelings of social inadequacy. Mesa Middle School in the Las Cruces Public Schools (LCPS) has hired two social workers in lieu of traditional counselors to deal with the social-emotional needs of middle school students and outreach for parents in need. New Mexico has seen statistically significant increases among middle school students in the rates of being bullied on school property, in fasting to lose weight, and unhealthy weight control behavior. The New Mexico Youth Risk Behavior Survey in middle school reports students being bullied on school property increased by 40 percent, while fasting to lose weight increased by 26 percent from FY09 to FY11. In addition, girls had higher rates than boys for almost all mental health indicators; girls had a higher rate than boys for suicide attempts. Mental health risk factors, such as persistent feelings of sadness or hopelessness, making suicide plans, and seriously considering suicide, were each highly associated with suicide attempts. When these risk factors were combined, the strength of these associations increased considerably. Among female and male students, the prevalence of suicide attempts increased as the number of mental health risk factors increased.
Table 12. Mental Health and Related Behavior: New Mexico
Youth Risk and Resiliency Survey, Middle Schools FY11
In New Mexico bullying is prohibited in the school, on school grounds, in school vehicles, at a designated bus stop, or at school activities or sanctioned events. Anti-bullying shall be included as a part of the health education curriculum as set forth in 6.30.2.19 NMAC. Selected schools have taken proactive measures on bullying and even cyber-bullying done off campus. At Camino Middle School in LCPS, the principal sees a trend with problems associated with social-media. He has a bully proofing plan with levels of infractions and next step consequences. He also expects students to come up with solutions.
0%
5%
10%
15%
20%
25%
Students who report not going to school because they felt unsafe at school or on their way to or from
school at least one day
Students who reported being bullied on school property
Students who report having been electronically bullied
Chart 31. Percent Middle School Age Students Who Report Being Bullied, FY11
New Mexico U.S.
Source: NM Youth Risk and Resiliency Survey
Total percentage
Mental Health and Related Behavior
Students in a class of 30
20 percent 25 percent girls 15 percent boys
Seriously thought about killing themselves
6/30 students 8/30 girls 4/30 boys
11 percent Ever made a plan about how to kill themselves 3/30 students 7 percent 10 percent girls 4 percent boys
Ever tried to kill themselves
2/30 students 3/30 girls 1/30 boys
Source: New Mexico Youth Risk and Resiliency Survey

Public Education Department, Report #15-09 Performance, Programming, and Cost of Middle Schools in New Mexico June 25, 2015
38
Teacher attrition is higher for middle schools than elementary schools or high schools. From FY12 to FY14 approximately 1,600 middle school teachers stopped teaching middle school in New Mexico. Of the 4,238 teachers who were teaching middle school in FY12, only 2,616 of those same teachers were still teaching middle school in FY14. The teachers may have stopped teaching middle school for various reasons including retirement, teaching a different grade level, or they are no longer teaching in New Mexico.
Teacher attrition percentages show the movement from teaching middle school in FY12 to not teaching middle school in FY14 was 38 percent as compared to 32 percent of high school teachers and 26 percent of elementary teachers who were not teaching the same school level in FY14.
Table 13. Teacher Attrition FY12 to FY14
School Level
Teaching School Level
FY12
Still Teaching School Level
FY14
Percent Teachers Not
Teaching Same School Level in
FY14 Elementary School 10,167 7,519 26% Middle School 4,238 2,616 38% High School 6,278 4,266 32% Source: LFC Files
After school programs can help improve student performance but opportunities are limited. In communities across the United States, one in five children do not have someone to care for them after school. This trend holds in New Mexico as the Afterschool Alliance reports 21 percent, or more than 7.5 thousand students are alone and unsupervised afterschool. An Education Commission of the States (ECS) study concluded young adolescents participating in after school activities achieve higher grades in school and engage in less risky behaviors. The national report America After 3pm shows 21 percent of New Mexico children participate in after school programs. After school programs can address student performance by 1) offering interventions for struggling students; 2) extending learning time on task; 3) offering enrichment for advanced students; and 4) keeping students engaged in a positive environment. Border state Arizona is ranked sixth of the top 10 states for afterschool programs. Arizona convened a statewide committee in FY12 – including afterschool program providers, state agencies, policy makers, schools and philanthropic organizations – to discuss the needs of Arizona’s youth and develop for afterschool programs. The committee developed a guide to quality standards and an assessment tool was rolled out in FY14. Arizona received $26.5 million in federal funding through the 21st century community learning centers grant. New Mexico received $8.8 million.
0
500
1000
1500
2000
2500
3000
3500
4000
4500
FY12 FY13 FY14
Chart 32. Number of Teachers who Still Teach Middle School in New Mexico, 2012 Cohort
Source: LFC Files
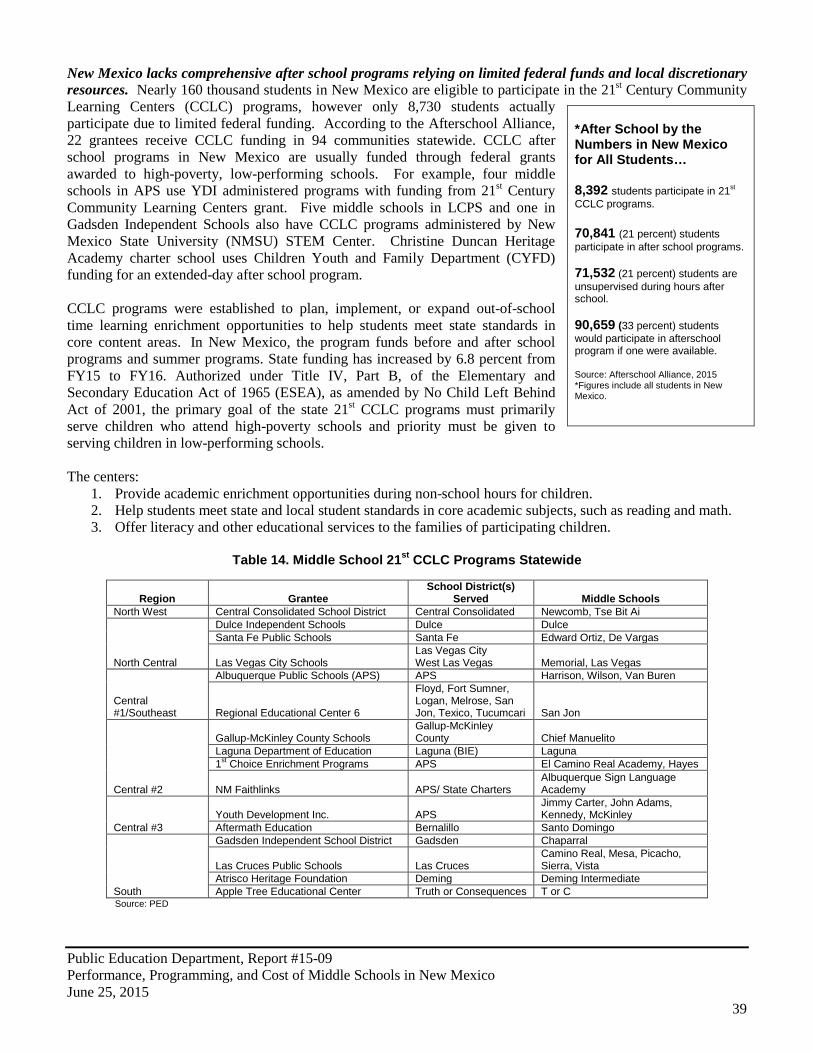
Public Education Department, Report #15-09 Performance, Programming, and Cost of Middle Schools in New Mexico June 25, 2015
39
New Mexico lacks comprehensive after school programs relying on limited federal funds and local discretionary resources. Nearly 160 thousand students in New Mexico are eligible to participate in the 21st Century Community Learning Centers (CCLC) programs, however only 8,730 students actually participate due to limited federal funding. According to the Afterschool Alliance, 22 grantees receive CCLC funding in 94 communities statewide. CCLC after school programs in New Mexico are usually funded through federal grants awarded to high-poverty, low-performing schools. For example, four middle schools in APS use YDI administered programs with funding from 21st Century Community Learning Centers grant. Five middle schools in LCPS and one in Gadsden Independent Schools also have CCLC programs administered by New Mexico State University (NMSU) STEM Center. Christine Duncan Heritage Academy charter school uses Children Youth and Family Department (CYFD) funding for an extended-day after school program. CCLC programs were established to plan, implement, or expand out-of-school time learning enrichment opportunities to help students meet state standards in core content areas. In New Mexico, the program funds before and after school programs and summer programs. State funding has increased by 6.8 percent from FY15 to FY16. Authorized under Title IV, Part B, of the Elementary and Secondary Education Act of 1965 (ESEA), as amended by No Child Left Behind Act of 2001, the primary goal of the state 21st CCLC programs must primarily serve children who attend high-poverty schools and priority must be given to serving children in low-performing schools. The centers:
1. Provide academic enrichment opportunities during non-school hours for children. 2. Help students meet state and local student standards in core academic subjects, such as reading and math. 3. Offer literacy and other educational services to the families of participating children.
Table 14. Middle School 21st CCLC Programs Statewide
Region
Grantee School District(s)
Served
Middle Schools North West Central Consolidated School District Central Consolidated Newcomb, Tse Bit Ai
North Central
Dulce Independent Schools Dulce Dulce Santa Fe Public Schools Santa Fe Edward Ortiz, De Vargas
Las Vegas City Schools Las Vegas City West Las Vegas Memorial, Las Vegas
Central #1/Southeast
Albuquerque Public Schools (APS) APS Harrison, Wilson, Van Buren
Regional Educational Center 6
Floyd, Fort Sumner, Logan, Melrose, San Jon, Texico, Tucumcari San Jon
Central #2
Gallup-McKinley County Schools Gallup-McKinley County Chief Manuelito
Laguna Department of Education Laguna (BIE) Laguna 1st Choice Enrichment Programs APS El Camino Real Academy, Hayes
NM Faithlinks APS/ State Charters
Albuquerque Sign Language Academy
Central #3
Youth Development Inc. APS
Jimmy Carter, John Adams, Kennedy, McKinley
Aftermath Education Bernalillo Santo Domingo South
Gadsden Independent School District Gadsden Chaparral
Las Cruces Public Schools Las Cruces
Camino Real, Mesa, Picacho, Sierra, Vista
Atrisco Heritage Foundation Deming Deming Intermediate Apple Tree Educational Center Truth or Consequences T or C
Source: PED
*After School by the Numbers in New Mexico for All Students… 8,392 students participate in 21st CCLC programs. 70,841 (21 percent) students participate in after school programs. 71,532 (21 percent) students are unsupervised during hours after school. 90,659 (33 percent) students would participate in afterschool program if one were available. Source: Afterschool Alliance, 2015 *Figures include all students in New Mexico.
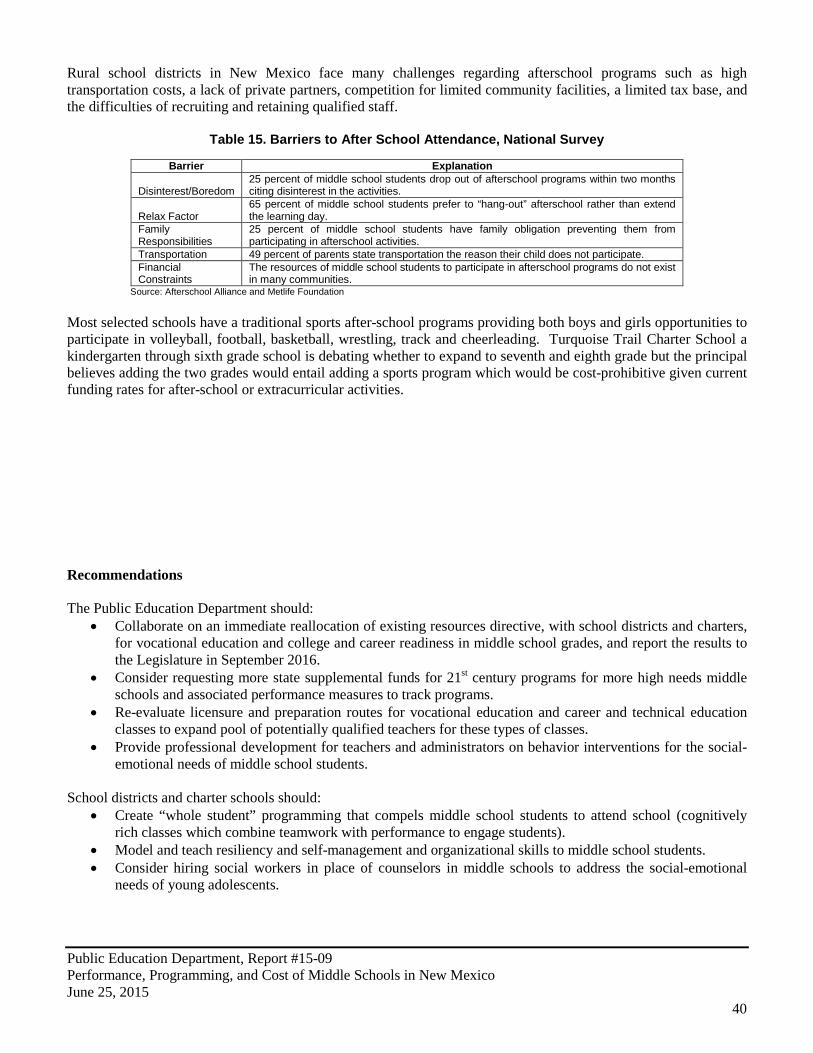
Public Education Department, Report #15-09 Performance, Programming, and Cost of Middle Schools in New Mexico June 25, 2015
40
Rural school districts in New Mexico face many challenges regarding afterschool programs such as high transportation costs, a lack of private partners, competition for limited community facilities, a limited tax base, and the difficulties of recruiting and retaining qualified staff.
Table 15. Barriers to After School Attendance, National Survey
Barrier Explanation
Disinterest/Boredom 25 percent of middle school students drop out of afterschool programs within two months citing disinterest in the activities.
Relax Factor 65 percent of middle school students prefer to “hang-out” afterschool rather than extend the learning day.
Family Responsibilities
25 percent of middle school students have family obligation preventing them from participating in afterschool activities.
Transportation 49 percent of parents state transportation the reason their child does not participate. Financial Constraints
The resources of middle school students to participate in afterschool programs do not exist in many communities.
Source: Afterschool Alliance and Metlife Foundation Most selected schools have a traditional sports after-school programs providing both boys and girls opportunities to participate in volleyball, football, basketball, wrestling, track and cheerleading. Turquoise Trail Charter School a kindergarten through sixth grade school is debating whether to expand to seventh and eighth grade but the principal believes adding the two grades would entail adding a sports program which would be cost-prohibitive given current funding rates for after-school or extracurricular activities. Recommendations The Public Education Department should:
• Collaborate on an immediate reallocation of existing resources directive, with school districts and charters, for vocational education and college and career readiness in middle school grades, and report the results to the Legislature in September 2016.
• Consider requesting more state supplemental funds for 21st century programs for more high needs middle schools and associated performance measures to track programs.
• Re-evaluate licensure and preparation routes for vocational education and career and technical education classes to expand pool of potentially qualified teachers for these types of classes.
• Provide professional development for teachers and administrators on behavior interventions for the social-emotional needs of middle school students.
School districts and charter schools should:
• Create “whole student” programming that compels middle school students to attend school (cognitively rich classes which combine teamwork with performance to engage students).
• Model and teach resiliency and self-management and organizational skills to middle school students. • Consider hiring social workers in place of counselors in middle schools to address the social-emotional
needs of young adolescents.

Public Education Department, Report #15-09 Performance, Programming, and Cost of Middle Schools in New Mexico June 25, 2015
41
MIDDLE SCHOOL GRADES RECEIVE SIMILAR FORMULA FUNDING AS HIGH SCHOOLS BUT LACK SIMILAR ACCESS TO GRANT FUNDS Middle school grades generate an estimated $575 million in state formula funds to serve about 77 thousand students. This allocation applies the average per student formula funding cost of $7,667 to middle school grade enrollments for FY15. Individual school districts or charter schools may generate different per student funding for middle school students depending on a variety of other formula factors, such as special education enrollment, school size adjustments, T&E index, and at-risk indexes among others. Middle school grades generate about $358 million in basic grade weight funding, or about $4,736 per student. Basic grade weights in the formula account for about 63 percent of per student funding, and for middle school grades about 62 percent. These percentages are similar to state averages for spending on classroom instruction. The state’s funding formula recognizes base costs to educate students in sixth to eighth grades differently. The base grade weight for sixth grade is 1.045 and seventh and eighth grades are 1.25. According to LESC the sixth grade weight was increased in 1993 from 1.0 as part of legislation establishing class size limits for first through sixth grades. Depending on the grade configuration of the school and number of sixth grade students, middle school students generate similar revenue as high school students for basic school site level per student operations. For example, two middle schools LFC visited do not include sixth grade in their grade configuration, and thus generate more per student than other middle schools that have sixth grade, as shown in the table below. Future review of the base grade weights may be worthwhile as the 1.25 weight may be too high or the 1.045 may be too low for sixth grade students.
Table 16. Funding Formula Revenue Generated by Student Enrollment, FY14
School
Number of Sixth Grade
Students
Funding Formula Revenue Per
Student
Number of Seventh and Eighth Grade
Students
Funding Formula
Revenue Per Student
Average Funding Formula
Revenue Per Student
Capshaw Middle School 0 $3,989 429 $4,772 $4,772 Santa Teresa Middle School 0 $3,989 627 $4,772 $4,772 Garfield Middle School 89 $3,989 237 $4,772 $4,558 Mesa Middle School 186 $3,989 413 $4,772 $4,529 Picacho Middle School 270 $3,989 549 $4,772 $4,514 Truman Middle School 472 $3,989 929 $4,772 $4,508 Source: LFC Files
$0
$1,000
$2,000
$3,000
$4,000
$5,000
$6,000
Sixth Grade Students
Seventh Grade Students
Eighth Grade Students
Chart 33. Base Grade Weight Per Student Formula Funding
Source: LFC Files
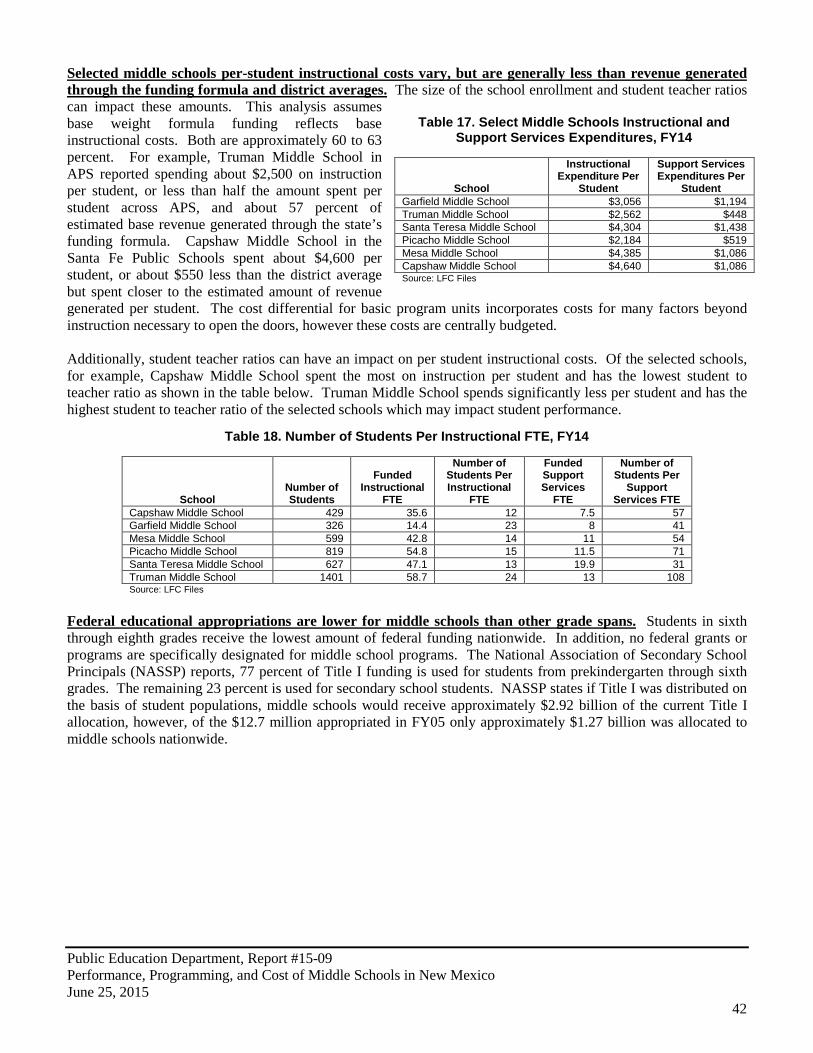
Public Education Department, Report #15-09 Performance, Programming, and Cost of Middle Schools in New Mexico June 25, 2015
42
Selected middle schools per-student instructional costs vary, but are generally less than revenue generated through the funding formula and district averages. The size of the school enrollment and student teacher ratios can impact these amounts. This analysis assumes base weight formula funding reflects base instructional costs. Both are approximately 60 to 63 percent. For example, Truman Middle School in APS reported spending about $2,500 on instruction per student, or less than half the amount spent per student across APS, and about 57 percent of estimated base revenue generated through the state’s funding formula. Capshaw Middle School in the Santa Fe Public Schools spent about $4,600 per student, or about $550 less than the district average but spent closer to the estimated amount of revenue generated per student. The cost differential for basic program units incorporates costs for many factors beyond instruction necessary to open the doors, however these costs are centrally budgeted. Additionally, student teacher ratios can have an impact on per student instructional costs. Of the selected schools, for example, Capshaw Middle School spent the most on instruction per student and has the lowest student to teacher ratio as shown in the table below. Truman Middle School spends significantly less per student and has the highest student to teacher ratio of the selected schools which may impact student performance.
Federal educational appropriations are lower for middle schools than other grade spans. Students in sixth through eighth grades receive the lowest amount of federal funding nationwide. In addition, no federal grants or programs are specifically designated for middle school programs. The National Association of Secondary School Principals (NASSP) reports, 77 percent of Title I funding is used for students from prekindergarten through sixth grades. The remaining 23 percent is used for secondary school students. NASSP states if Title I was distributed on the basis of student populations, middle schools would receive approximately $2.92 billion of the current Title I allocation, however, of the $12.7 million appropriated in FY05 only approximately $1.27 billion was allocated to middle schools nationwide.
Table 17. Select Middle Schools Instructional and Support Services Expenditures, FY14
School
Instructional Expenditure Per
Student
Support Services Expenditures Per
Student Garfield Middle School $3,056 $1,194 Truman Middle School $2,562 $448 Santa Teresa Middle School $4,304 $1,438 Picacho Middle School $2,184 $519 Mesa Middle School $4,385 $1,086 Capshaw Middle School $4,640 $1,086 Source: LFC Files
Table 18. Number of Students Per Instructional FTE, FY14
School Number of Students
Funded Instructional
FTE
Number of Students Per Instructional
FTE
Funded Support Services
FTE
Number of Students Per
Support Services FTE
Capshaw Middle School 429 35.6 12 7.5 57 Garfield Middle School 326 14.4 23 8 41 Mesa Middle School 599 42.8 14 11 54 Picacho Middle School 819 54.8 15 11.5 71 Santa Teresa Middle School 627 47.1 13 19.9 31 Truman Middle School 1401 58.7 24 13 108 Source: LFC Files

Public Education Department, Report #15-09 Performance, Programming, and Cost of Middle Schools in New Mexico June 25, 2015
43
Chart 34. Federal Appropriations by Grade Span, FY15
Source: U.S. Department of Education Federal funding in New Mexico middle schools account for a small portion of site level expenditures. The majority of expenditures are state allocated funds at the instructional level as shown by the charts below.
$3,590,308 $3,590,308
$402,920 $321,872
$628,123 $628,123
$62,197 $55,828
$0 $500,000
$1,000,000 $1,500,000 $2,000,000 $2,500,000 $3,000,000 $3,500,000 $4,000,000 $4,500,000 $5,000,000
FY14 FY15 Budgeted
Chart 35. Truman Middle School Site Level Expenditures
Instruction (State Funds) Instruction (Federal Funds) Support Services (State Funds) Support Services (Federal Funds)
Source: LFC Files Note: Excludes operation and maintenance (O&M) as these costs are budgeted centrally
$996,372 $964,639
$98,004 $84,242
$389,222 $394,292
$476 $771
$0
$200,000
$400,000
$600,000
$800,000
$1,000,000
$1,200,000
$1,400,000
$1,600,000
FY14 FY15 Budgeted
Chart 36. Garfield Middle School Site Level Expenditures
Instruction (State Funds) Instruction (Federal Funds) Support Services (State Funds) Support Services (Federal Funds)
Source: LFC Files Note: Excludes operation and maintenance (O&M) as these costs are budgeted centrally

Public Education Department, Report #15-09 Performance, Programming, and Cost of Middle Schools in New Mexico June 25, 2015
44
AGENCY RESPONSES The Public Education Department did not provide a written response prior to publication.

Public Education Department, Report #15-09 Performance, Programming, and Cost of Middle Schools in New Mexico June 25, 2015
45
APPENDIX A: Evaluation Objectives, Scope, and Methodology Evaluation Objectives.
• Overview and analysis of structure and cost of middle schools in New Mexico • School transitions and grade configurations • Programming, curriculum, college and career readiness, and performance outcomes
Scope and Methodology.
• Reviewed applicable laws and regulations. • Reviewed prior LFC reports and file documents. • Reviewed external program evaluations, reports, peer-reviewed educational studies, and other literature. • Conducted site visits of and/or teleconferenced with selected schools. • Interviewed staff from the Public Education Department. • Met with LFC staff, including analysts and LFC staff leadership. • Reviewed document with LESC staff.
Evaluation Team. Madelyn P. Serna Mármol, Lead Program Evaluator Nathan Eckberg, Program Evaluator Authority for Evaluation. LFC is authorized under the provisions of Section 2-5-3 NMSA 1978 to examine laws governing the finances and operations of departments, agencies, and institutions of New Mexico and all of its political subdivisions; the effects of laws on the proper functioning of these governmental units; and the policies and costs. LFC is also authorized to make recommendations for change to the Legislature. In furtherance of its statutory responsibility, LFC may conduct inquiries into specific transactions affecting the operating policies and cost of governmental units and their compliance with state laws. Exit Conferences. The contents of this report were discussed with Deputy Secretary Leighann Lenti and College and Career Readiness Director Eric Spencer of the Public Education Department on June 22, 2015. A report draft was provided to the Public Education Department on June 18, 2015 for a formal written response. Report Distribution. This report is intended for the information of the Office of the Governor; The Public Education Department; Office of the State Auditor; and the Legislative Finance Committee. This restriction is not intended to limit distribution of this report, which is a matter of public record.
Charles Sallee Deputy Director for Program Evaluation

Public Education Department, Report #15-09 Performance, Programming, and Cost of Middle Schools in New Mexico June 25, 2015
46
APPENDIX B: Selected Schools Demographics
Table 19. Selected Schools Demographics, FY14
School
District or
Charter
Grade
Configuration
School Grades
FY12 FY13 FY14
FRL
SWD
ELL
Total 6th/7th/8th Graders
Total
Students Albuquerque Sign-language Academy
State Charter
K – 8TH
F
Pending
TBD
58%
47%
21%
24
94
Academy for Tech. and the Classics
SFPS Charter
7TH – 12TH
B
A
A
na
14%
4%
140
361
Anthony Charter
State Charter
7TH – 12TH
na
na
D
73%
na
na
29
70
Anton Chico Santa Rosa 6TH – 8TH B C C 83% 0% 0% 42 42 Camino Real LCPS 6TH – 8TH B C B 42% 13% 5% 676 676 Capshaw SFPS 7TH – 8TH B D C 59% 18% 13% 429 429 Chaparral Alamogordo 6TH – 8TH B B B 65% 14% 0% 686 686 Christine Duncan Heritage Academy
APS Charter
K – 8TH
F
D
F
93%
15%
30%
68
181
Garfield Middle
APS
6TH – 8TH
D
C
D
90%
25%
19%
326
326
El Dorado Community
SFPS
K – 8TH
B
B
B
26%
12%
5%
184
568
La Academia Dolores Huerta
State Charter
6TH – 8TH
B
B
B
92%
7%
23%
165
165
Los Alamitos Grants 6TH – 8TH C C C 77% 12% 12% 426 426 Mandela International Magnet
SFPS
6TH – 8TH
na
na
na
na
na
na
na
na McKinley APS 6TH – 8TH D D F 88% 21% 20% 549 549 Mesa Middle LCPS 6TH – 8TH D C D 67% 12% 12% 599 599 Mission Achievement and Success
State Charter
6TH – 8TH
na
C
C
73%
18%
15%
319
392 Native American Community Academy
APS Charter
6TH – 12TH
D
C
B
86%
14%
6%
197
378 Ortiz SFPS 6TH – 8TH D D D 84% 14% 43% 732 732 Pecos Pecos 6TH – 8TH C C C 72% 10% 17% 662 662 Picacho LCPS 6TH – 8TH B C D 72% 17% 14% 819 819 Pojoaque Pojoaque 7TH – 8TH C D D 66% 10% 21% 334 334 Pojoaque Sixth Grade Academy
Pojoaque
6TH
C
C
F
73%
8%
0%
137
137
Roosevelt APS 6TH – 8TH B B B 32% 18% 0% 341 341 Santa Teresa Gadsden 7TH – 8TH B B A 98% 7% 24% 627 627 Sierra Middle LCPS 6TH – 8TH B B C 54% 14% 7% 844 844 Truman APS 6TH – 8TH D D D 88% 17% 25% 1401 1401 Tularosa Tularosa 6TH – 8TH C D C 71% 8% 0% 149 149 Turquoise Trail
SFPS Charter
Pre-K – 6TH
C
D
A
69%
14%
16%
67
464
Twenty First Century
APS Charter
5TH – 8TH
B
B
C
45%
16%
5%
223
256
Zia Intermediate
Artesia
6TH – 7TH
B
B
B
51%
10%
2%
570
570
Statewide
na
na
C
C
C
72.8%
13%
15%
75,880
339,118
Source: PED Dashboard

Public Education Department, Report #15-09 Performance, Programming, and Cost of Middle Schools in New Mexico June 25, 2015
47
APPENDIX C: Grade Configurations
Table 20. Middle School Grade Configurations for New Mexico Schools Servicing
Sixth through Eighth Grade Students
Middle School
Grade Configuration
Number of
Schools
Regular Public School
Charter School
Pre-kindergarten – sixth 59 58 1 Prekindergarten - eighth 1 1 0 Pre-kindergarten – twelfth 3 2 1 Kindergarten – sixth grades 64 58 6 Kindergarten – seventh grades 4 0 4 Kindergarten – eighth grades 25 6 19 Kindergarten – tenth grades 2 0 2 Kindergarten – twelfth grades 6 5 1 First – sixth grade 1 1 0 First – eighth grade 2 1 1 First – tenth grade 1 0 1 Third – sixth grade 2 2 0 Fourth – sixth grade 5 4 1 Fifth – sixth grades 4 4 0 Fifth – eighth grades 6 5 1 Fifth – twelfth grade 1 0 1 Sixth grade 3 3 0 Sixth – seventh grades 1 1 0 Sixth – eighth grades 111 105 6 Sixth – eleventh grades 1 0 1 Sixth – twelfth grades 13 5 8 Seventh – eighth grades 36 35 1 Seventh – ninth grades 1 1 0 Seventh – twelfth grades 32 23 9 Eighth – ninth grades 1 1 0 Total 385 321 64 Source: US Department of Education

Public Education Department, Report #15-09 Performance, Programming, and Cost of Middle Schools in New Mexico June 25, 2015
48
APPENDIX D: National and State Math Proficiency
Figure 12. NAEP Math Scores Nationwide, FY13
0
5
10
15
20
25
30
35
40
45
FY05 FY06 FY07 FY08 FY09 FY10 FY11 FY12 FY13 FY14
Chart 32. Middle School SBA Math Scores, FY05 to FY14
6th 7th 8th Source: PED

Public Education Department, Report #15-09 Performance, Programming, and Cost of Middle Schools in New Mexico June 25, 2015
49
APPENDIX E: Reading and Math Scaled Scores
34
35
36
37
38
39
40
41
42
43
FY10 FY11 FY12 FY13 FY14
Chart 33. New Mexico Students Scaled Reading Scores
Grades Fifth through Eighth, FY10-FY14
Fifth Grade Sixth Grade Seventh Grade Eighth Grade
Source: PED
34.5
35
35.5
36
36.5
37
37.5
38
38.5
FY10 FY11 FY12 FY13 FY14
Chart 34. New Mexico Students Scaled Math Scores Grades Fifth through
Eighth, FY10-FY14
Fifth Grade Sixth Grade Seventh Grade Eighth Grade
Source: PED

Public Education Department, Report #15-09 Performance, Programming, and Cost of Middle Schools in New Mexico June 25, 2015
50
APPENDIX F: School Grades by Grade Range
6% 2%
28% 31%
23%
30% 20%
18%
32% 29% 45%
10% 15% 12%
Elementary Schools Middle Schools High Schools
Chart 35. Distribution of New Mexico School Grades, FY14
A B C D F Source: PED
1% 4%
35% 20%
23%
47%
31% 29%
17%
35% 33%
14% 10%
Elementary Schools
Middle Schools High Schools
Chart 36. Distribution of New Mexico School Grades, FY13
A B C D F Source: PED

Public Education Department, Report #15-09 Performance, Programming, and Cost of Middle Schools in New Mexico June 25, 2015
51
APPENDIX G: Student Retention by District and Grade
Table 21. Student Retention by District and Grade, FY11 to FY14
District Sixth Grade
Seventh Grade
Eighth Grade
Total Number of Students Retained
Alamogordo Public Schools 1 1 1 3 Albuquerque Public Schools 39 19 27 85 Animas Public Schools 0 1 0 1 Artesia Public School District 3 1 2 6 Aztec Municipal Schools 0 1 1 2 Belen Consolidated Schools 1 2 1 4 Bernalillo Public Schools 1 0 0 1 Bloomfield School District 1 1 2 4 Carlsbad Municipal Schools 1 2 10 13 Central Consolidated Schools 2 15 5 22 Clovis Municipal School District 2 0 0 2 Cuba Independent Schools 2 0 0 2 Deming Public School District 0 1 0 1 Dexter Consolidated Schools 0 1 0 1 Dora Consolidated Schools 0 0 1 1 Dulce Independent Schools 0 1 0 1 Española Public School District 3 0 6 9 Farmington Municipal Schools 4 2 2 8 Gadsden Independent Schools 2 12 3 17 Gallup-McKinley County Schools 12 5 2 19 Grants-Cibola County Schools 1 2 0 3 Hagerman Municipal Schools 0 0 1 1 Hatch Valley Public schools 2 0 0 2 Hobbs Municipal Schools 1 1 0 2 Hondo Valley Public Schools 1 1 0 2 Las Cruces Public Schools 4 3 5 12 Los Lunas Schools 2 0 0 2 Loving Municipal Schools 1 0 0 1 Lovington Municipal Schools 0 4 3 7 Magdalena Municipal School District 1 1 0 2 Mora Independent School District 0 0 1 1 Moriarty-Edgewood School District 1 0 0 1 Pojoaque Valley Schools 1 1 1 3 Portales Municipal Schools 1 0 3 4 Quemado School District 0 0 1 1 Questa Independent School District 1 0 0 1 Raton Public Schools 1 2 3 6 Rio Rancho Public Schools 8 7 2 17 Roswell Independent School District 0 3 3 6 Ruidoso Municipal School District 0 1 0 1 Santa Fe Public Schools 6 11 11 28 Silver Consolidated Schools 0 0 4 4 Socorro Consolidated Schools 1 0 1 2 Springer Municipal Schools 0 1 0 1 Taos Municipal Schools 2 3 2 7 Truth or Consequences Municipal Schools 1 0 0 1 Tucumcari Public Schools 1 0 0 1 Zuni Public Schools 2 0 1 3 All School Districts (Not including charter schools) 113 106 105 324 Source: LFC Files

Public Education Department, Report #15-09 Performance, Programming, and Cost of Middle Schools in New Mexico June 25, 2015
52
APPENDIX H: Middle Schools with Above Average Truancy
Table 22. New Mexico Middle Schools above the Statewide Average for Habitually Truant Students, FY13
Charter School or School District
Schools Serving 6th-8th
Graders
Habitually
Truant Percentage
Mountainair Public Schools 1 76.67% Española Public Schools 1 43.01% Deming Public Schools 2 29.13% Bernalillo Public Schools 2 24.56% Truth or Consequences Municipal Schools 1 24.04% Santa Fe Public Schools 4 22.86% Cuba Independent Schools 1 22.46% Village Academy Charter 1 22.22% Lake Arthur Municipal Schools 1 21.62% Ruidoso Municipal Schools 1 19.58% Hagerman Municipal Schools 1 19.17% La Resolana Charter School 1 19.05% Zuni Public Schools 1 19.05% The Ask Academy Charter 1 18.23% Pojoaque Valley Municipal Schools 3 17.92% Socorro Consolidated Schools 1 17.49% West Las Vegas Public Schools 1 17.46% Tularosa Municipal Schools 2 17.14% Raton Public Schools 1 17.13% Cobre Consolidated Schools 1 16.67% Central Consolidated Schools 2 16.05% Gallup-McKinley County Schools 7 16.04% Lovington Municipal Schools 1 13.94% Mesa Vista Consolidated Schools 1 13.70% Roswell Independent Schools 5 13.60% Statewide 385 12.53%
Source: PED

Public Education Department, Report #15-09 Performance, Programming, and Cost of Middle Schools in New Mexico June 25, 2015
53
APPENDIX I: Charter School Performance by Grade Configuration
Table 23. Charter Schools Performance in New Mexico, Kindergarten through Eighth Grade Configuration
Public School (*Charter)
SBA Scaled Scores Reading
FY12 - FY14
SBA Scaled Scores Math
FY12-FY14
School Grades
FY12 – FY14
FRL
(*District) *Albuquerque Sign Language Academy
na
na
na
na
na
na
F
pndg
tbd
58%
Aspen Community Magnet School
36.8
37.3
36.7
32.0
33.3
33.7
D
F
D
*69%
*Cariños de los Niños
36.0
36.4
37.2
31.0
31.5
31.8
F
D
D
70%
*Christine Duncan Heritage Academy
30.7
31.6
29.6
26.7
29.3
24.7
F
D
F
92%
*Cien Aguas International School
41.3
41.5
41.7
36.8
39.3
39.9
D
C
B
41%
*Cottonwood Valley
41.0
39.9
41.2
39.2
40.8
41.0
C
C
B
44%
El Dorado Community School
45.0
43.9
44.9
42.2
41.8
42.0
B
B
B
*69%
Gonzales Community School
40.1
38.5
39.5
36.2
35.3
35.3
C
D
D
*69%
*International School at Mesa del Sol
41.8
40.2
38.7
41.5
38.5
37.9
B
D
D
54%
*La Promesa Early Learning
30.5
34.2
33.7
26.9
32.9
32.3
F
D
D
89%
*Lindrith Area Heritage
39.9
41.9
43.3
38.8
38.5
42.1
C
C
B
68%
*Montessori Elementary School
44.7
43.1
44.8
40.5
38.4
40.8
B
D
B
0%
*Mosaic Academy
36.3
36.7
35.3
34.9
34.4
33.2
C
D
D
56%
*Mountain Mahogany community
42.7
40.9
41.0
41.1
40.9
41.0
B
B
B
52%
Nina Otero Community
na
na
na
na
na
na
na
na
na
*69%
*North Valley Academy
39.8
40.4
39.2
37.3
36.6
36.2
B
B
D
57%
*Ralph J. Bunche
37.5
32.9
31.4
32.8
30.5
26.8
D
F
F
91%
*Rio Gallinas
37.8
35.4
31.7
32.8
28.7
28.4
F
F
F
83%
*Roots and Wings
43.2
44.2
44.4
40.3
42.3
41.2
A
B
B
*81%
*Sage Montessori
n/a
38.8
38.2
n/a
35.6
34.8
n/a
F
D
0%
*San Diego Riverside
31.4
34.9
32.8
27.0
27.8
28.8
F
F
F
94%
*Taos Charter
46.1
45.8
46.4
46.6
47.5
45.8
A
B
B
52%
*Taos International
na
na
na
na
na
na
na
na
na
na
Average
39.0
40.6
38.5
36.0
36.2
35.8
C
D
C
62%
STATE
39.5
40.4
39.8
37.2
37.4
36.5
C
C
C
73%
Source: PED

Public Education Department, Report #15-09 Performance, Programming, and Cost of Middle Schools in New Mexico June 25, 2015
54
Table 24. New Mexico Micro-School Districts Seventh through Twelfth Grade Schools, FY14
School
School Grade
Scaled Scores
Reading
Scaled Scores Math
Total Seventh
and Eighth
Graders
Total Student
Population Animas A 41.3 39.0 37 99
Cliff (Silver Consolidated Schools)
A
42.7
43.4
41
117
Corona A 40.5 40.7 14 34 Des Moines A 46.1 41.6 13 86
Dora A 43.9 41.3 32 231 Elida A 43.8 43.4 25 64
Escalante (Chama Valley Independent Schools)
B
38.1
36.4
67
139
Hondo B 38.1 35.0 30 79 Mosquero B 40.3 36.9 6 42 Quemado B 38.0 34.2 27 157 Reserve A 40.0 37.5 22 147
Roy A 3 40 Vaughn C 33.9 34.1 21 48
Wagon Mound B 38.1 33.3 8 35 Source: PED

Public Education Department, Report #15-09 Performance, Programming, and Cost of Middle Schools in New Mexico June 25, 2015
55
APPENDIX J: PED Instructional Audits of Selected Schools
Table 25. PED INSTRUCTIONAL AUDITS of SELECTED SCHOOLS
School
Research-Based Interventions
Differentiated Instruction
Data
CCSS
Other
School A
Inconsistent - Lack of Tier 2 identification and interventions
Lack of evidence
Limited use
Beginning Steps
• Student engagement: 50% • Pacing Guides not used • Lack of vertical and horizontal
alignment of curriculum (no consistency in what is taught across grade level)
School B
Great Concern -Teachers “Fuzzy” on Tier 2 and SAT process “a beast”
Whole group instruction
Not data driven
na
• No common preparatory time for teachers
• Lack of student engagement • Not meeting literacy
instructional time School C
Need to improve SAT process and Tier II
Lack of group work and project-based learning
Not data driven
na
• Lack of vertical articulation between grades and feeder schools
• Insufficient math training and coaching
School D
Intervention class does not address RtI framework
• Not evident in all classes
• Whole group instruction
• Not evident (to refocus or modify instruction)
• No data meetings
• Curriculum and assessments not aligned to CCSS
• Learning objectives and targets not observed
• Common Prep for instructional teaming and collaboration
• Consistent feedback to teachers not evident
• PLCs in beginning steps School E
• Continuous improvement process not evident school-wide
• Research-based strategies not evident
• No teacher understanding of RtI framework
• Not evident • Whole group
instruction
• No PLC time for data meetings
• No formal collab. time
• Curriculum and assessments not aligned to CCSS
• Learning objectives and targets not observed
• No support for multilingual students
School F
na
• Not evident in all classrooms
• No evidence for content lessons
• Modifications for SPED student not evident
Not evident
Lack of higher order questions
• Need inclusion or integrated approach to prove appropriate supports for special education.
• Team could not tell if ELL/ESL needs were begin met.
• Need clearer parent communication.
School G
na
• High expectations
not evident • Only a few
classrooms
na
• Planning stages
• Questioning not cognitively demanding
• Addressing attendance and truancy issues
• Student not engaged • Need more parental
involvement School H
na
na
Full use of data to guide instruction not established
• Questioning not cognitively demanding
• Learning objectives not observed
• Technology and instructional materials lacking
• Math instruction deficient Source: PED

Public Education Department, Report #15-09 Performance, Programming, and Cost of Middle Schools in New Mexico June 25, 2015
56
APPENDIX K: Middle Schools “Beating-the-Odds”
Table 26. Sample Group of “Beating-the-Odds” Selected Middle Schools
School
Principal’s Emphasis
Programming and Unique Programs
Wish List
Anton Chico Middle
• Students as active participants (looking at data) (taking risks)
• Teacher self-reflection
• Communication • High Expectations
• Reading/math interventions embedded in schedule
• MESA – math, engineering, science and achievement
• Innoventure – NMSU • After-school tutoring • Publications class
• More electives such as band and art
Chaparral Middle
• Get to know students • PLCs (book study-
research) • Promotes electives
• Reading/math interventions embedded in schedule
• The Wheel (rotate electives every semester) • Chess club • Origami club • CHAPs (Tier II behavior intervention program) • Truancy home visits
• Engineering classes • STEM classes • Computer classes • Funding for staff to teach
vocational La Academia Dolores Huerta Charter (Las Cruces)
• Community partnerships
• Collaboration • Student-centered • High and clear
expectations
• Reading/math interventions embedded in schedule
• Home Visits • ENLACE (only middle school in state) • Dual Language • Arts focused • Saturday school for lowest-performing students • Advisory class
• Pre-law, nursing, engineering, and STEM programs
Mission Achievement and Success (Albuquerque)
• Consistency • Wrap-around services • Teachers see
students every day
• Reading/math interventions embedded in schedule
• Before and after-school care • College prep • Early morning PD for teachers • Track attendance/discipline referrals • Provide all school supplies
• Enhanced partnerships with UNM and CNM
• Additional community partnerships
Native American Community Academy (Albuquerque)
• Focus on college and career readiness
• Student wellness emphasized
• Teachers create unique curriculum
• Culture and language integrated into curriculum
• Personal wellness course • Organized “play” time during lunch • Boys program- community service activities for
boys with behavioral infractions
• A system for getting student data from feeder schools
Pecos Middle
• Aligned Curriculum • Community
partnerships
• Reading/math interventions embedded in schedule
• QualityCore ACT school • Teacherages • NISL wheel • SB instructional system • Gear Up (7-12 grades)
• Enhanced community partnerships
• Additional elective opportunities
Santa Teresa Middle
• Vertical curriculum
alignment with feeder schools
• Community partnerships
• Reading/math interventions embedded in
schedule • Teach soft skills (work-ethic, responsibility) • Emphasis on academic language • Writing on demand • Cornell notes
• Funding for grant writer • Pre-engineering class • Increase at-risk index • Increase funding for SPED • Stricter attendance laws • More STEM funding
Source: LFC Site Visits and Teleconferences
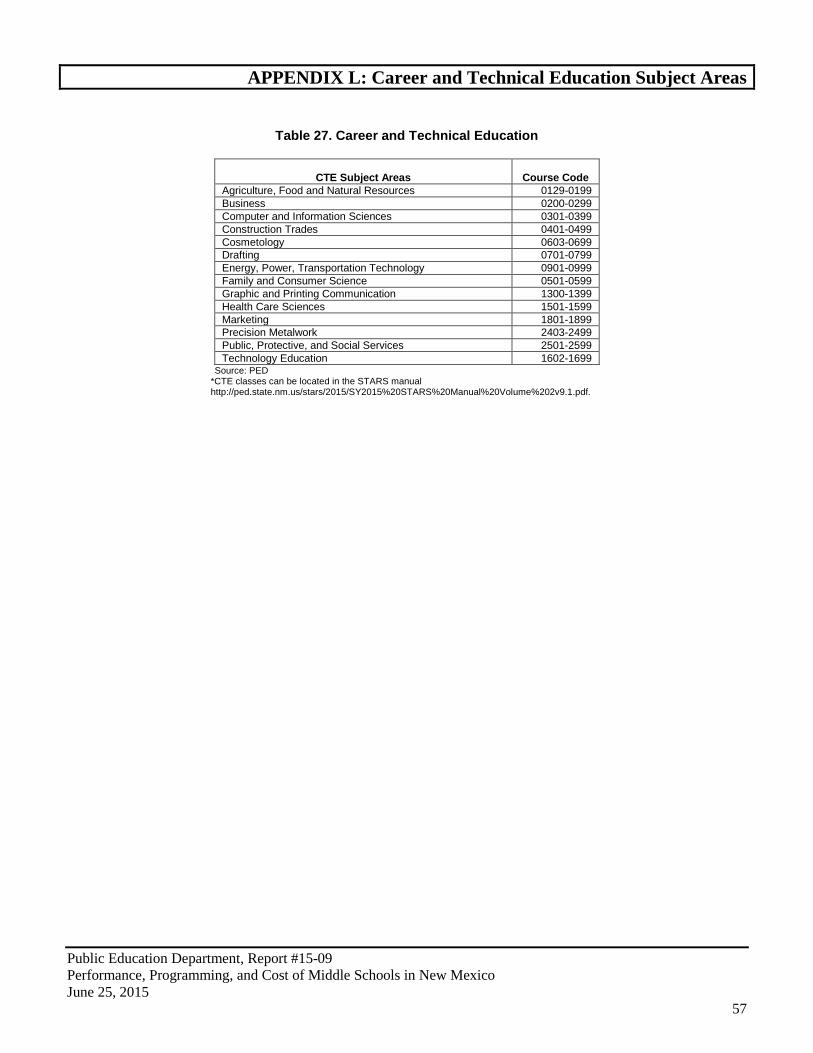
Public Education Department, Report #15-09 Performance, Programming, and Cost of Middle Schools in New Mexico June 25, 2015
57
APPENDIX L: Career and Technical Education Subject Areas
Table 27. Career and Technical Education
CTE Subject Areas
Course Code
Agriculture, Food and Natural Resources 0129-0199 Business 0200-0299 Computer and Information Sciences 0301-0399 Construction Trades 0401-0499 Cosmetology 0603-0699 Drafting 0701-0799 Energy, Power, Transportation Technology 0901-0999 Family and Consumer Science 0501-0599 Graphic and Printing Communication 1300-1399 Health Care Sciences 1501-1599 Marketing 1801-1899 Precision Metalwork 2403-2499 Public, Protective, and Social Services 2501-2599 Technology Education 1602-1699
Source: PED *CTE classes can be located in the STARS manual http://ped.state.nm.us/stars/2015/SY2015%20STARS%20Manual%20Volume%202v9.1.pdf.