report to the governor - welcome to division of human
TRANSCRIPT

FY 2018 Change in Employee Compensation & Benefits Report
Submitted by Susan E. Buxton, DHR Administrator
Report to the Governor

Cover Page Photo. This photograph of the Capitol at sunrise was taken by DHR employee Michelle Peugh on the morning of October 27, 2016, from her office in the Borah Building.

| F Y 2 0 1 8 C E C R e p o r t
TABLE OF CONTENTS
Contents PURPOSE OF REPORT ............................................................................................................................... 1
EXECUTIVE SUMMARY .......................................................................................................................... 1
State Job Evaluation Methodology ............................................................................................................... 2
Compensation Structure ................................................................................................................................ 3
Performance Management ............................................................................................................................ 3
TOTAL COMPENSATION AND ANALYSIS ........................................................................................... 4
Total Compensation ...................................................................................................................................... 4
Total Compensation Analysis ....................................................................................................................... 6
Korn Ferry Hay Group (KFHG) General Market Update ............................................................................. 6
DHR STATEWIDE INITIATIVES .............................................................................................................. 8
IT Classification Project ........................................................................................................................... 8
Fair Labor Standards Act (FLSA) ............................................................................................................. 8
Specific Occupational Inequity - Payline Exception Review ................................................................... 9
Professional Training ................................................................................................................................ 9
WORKFORCE DEMOGRAPHICS ........................................................................................................... 10
Impact of a Changing Workforce: The Generations ............................................................................... 10
Workforce Turnover Statistics – Classified Employees ......................................................................... 11
Employee Exit Survey Results ................................................................................................................ 12
Total Workforce Retirement ................................................................................................................... 13
DHR RECOMMENDATIONS FOR FY2018 ............................................................................................ 14
Appendix A- Glossary ............................................................................................................................ 15
Appendix B- Six Year Synopsis of State CEC Increases ....................................................................... 16
Appendix C- Agencies with Classified and Non-Classified Employees ................................................ 19
Appendix D- Workforce Demographics by County ............................................................................... 20
Appendix E- FY 2017 Salary Structure .................................................................................................. 21
Appendix F- Classified Employees’ Compa-Ratio by Agency .............................................................. 22
Appendix G- Hay Benefits Analysis & Total Compensation Executive Summary ................................ 25
Appendix H- Hay Total Compensation Analysis- Methodology & Market Sources ............................. 71
Appendix I- Payline Exception/ Specific Occupational Inequities ......................................................... 77

| F Y 2 0 1 8 C E C R e p o r t
Appendix J- Classified New Hires by Occupational Group and Average Age ...................................... 78
Appendix K- Classified Employees Total Separations by Agency FY2014-FY2016 ............................ 79
Appendix L- Classified Employees Voluntary Separations by Agency FY2013-FY2016 ..................... 81
Appendix M- Classified Employees Involuntary Separations by Agency FY2013-FY2016 ................. 84
Appendix N- Retirement Forecast Calendar Years 2016 to 2025 ........................................................... 87
Appendix O- Retirement Classified Turnover FY2016 .......................................................................... 89

1 |FY 2018 CEC Report
PURPOSE OF REPORT Idaho Code §67-5309C Annual Surveys, Reports and Recommendations requires the Division of Human Resources (DHR) to provide workforce data and total compensation analysis to the Governor and the Legislature for their consideration on an annual basis. The Change in Employee Compensation (CEC) report provides specific recommendations on the salary structure, specific occupational inequity, merit increase, and the employee benefit package. See generally, Appendix A, Glossary and Appendix B, Six Year Synopsis of State CEC Increase.
State Employee Compensation Philosophy: Idaho Code 67-5309A.
(1) It is hereby declared to be the intent of the legislature of the State of Idaho that the goal of a total compensation system for state employees shall be to fund a competitive employee compensation and benefit package that will attract qualified applicants to the work force; retain employees who have a commitment to public service excellence; motivate employees to maintain high standards of productivity; and reward employees for outstanding performance.
(2) The foundation for this philosophy recognizes that state government is a service enterprise in which the state work force provides the most critical role for Idaho citizens. Maintaining a competitive compensation system is an integral, necessary and expected cost of providing the delivery of state services and is based on the following compensation standards:
(a) The state's overall compensation system, which includes both a salary and a benefit component, when taken as a whole, shall be competitive with relevant labor market averages.
(b) Advancement in pay shall be based on job performance and market changes.
(c) Pay for performance shall provide faster salary advancement for higher performers based on a merit increase matrix developed by the Division of Human Resources.
(d) All employees below the state's midpoint market average in a salary range who are meeting expectations in the performance of their jobs shall move through the pay range toward the midpoint market average.
(3) It is hereby declared to be legislative intent that regardless of specific budgetary conditions from year to year, it is vital to fund necessary compensation adjustments each year to maintain market competitiveness in the compensation system. In order to provide this funding commitment in difficult fiscal conditions, it may be necessary to increase revenues, or to prioritize and eliminate certain functions or programs in state government, or to reduce the overall number of state employees in a given year, or any combination of such methods.
EXECUTIVE SUMMARY Pursuant to applicable federal and Idaho State law, Title 67 State Government and State Affairs, Chapter 53 Personnel system, DHR administers the state personnel system by establishing statewide policies, procedures, providing support and oversight to 65 state agencies, and administrative support to the Idaho Personnel Commission. As private and public employers

2 |FY 2018 CEC Report
seek to attract and retain qualified and dedicated employees, it is critical for the State to have a sound compensation plan that is externally competitive1 and meets State statutory requirements. As the economy continues to recover, private and other public sector employers are competing for the same employees the State is trying to recruit and retain. The State has and continues to need employees with skill sets that foster good, efficient government. Good government starts with employees who see their jobs as bettering both government and the private sector in order to establish a positive business climate statewide. DHR has implemented professional training and is putting more professional training opportunities in place for the state workforce to further the goal of good government at all levels.
The Governor and the Legislature have provided salary increases for permanent state employees and covered increased costs of health insurance over the last few years. Appendix B – Six Year Synopsis of State CEC Increases. These efforts have been appreciated by the State workforce.
State workforce consists of approximately 25,673 employees - 13,080 classified and 12,593 non-classified employees2. A classified employee is any person appointed to or holding a position in any department of the state and subject to the provisions of the merit examination, selection, retention, promotion, and dismissal requirements of Idaho Code Title 67, Chapter 53. See generally, Appendix C, Agencies with Classified and Non-Classified Employees; Appendix D, Workforce Demographics by County. A non-classified employee is any person appointed or holding a position that is exempt from Idaho Code Title 67, Chapter 53 and identified in Idaho Code §67-5303 or as defined in some agency-specific statutes. The non-classified employees include board members, elected officials, judges, commissioners, higher education, State Insurance Fund, and temporaries. For purposes of this report, information is categorized by classified employees and general workforce (includes classified and non-classified employees).
State Job Evaluation Methodology Per Idaho Code §67-5309B(1), Idaho uses the Hay job evaluation methodology to ensure the classifications of State positions, based on the size and complexity of the job, are placed into the appropriate pay grades. The Hay Group methodology is based on three factors, each of which have sub factors based on the premise that all jobs exist to achieve the purpose of creating value within the organization. The methodology evaluates the value by analyzing and scoring the three following factors:
(1) Know-how - The job requirements a person has to meet in order to deliver the value. Know-how has three dimensions: Practical/Technical knowledge; Planning, Organizing and Integrating (includes managerial) knowledge; and Communicating and Influencing skills.
(2) Problem Solving - The use of know-how to identify, delineate, and resolve problems. Problem Solving measures in two dimensions: Analyzing the thinking environment and analyzing the thinking challenge.
1 Externally Competitive: refers to how competitive a business organization’s compensation is in relation to its competitors. If an organization pays comparable in total compensation to its competitors, it will have a better chance of recruiting and retaining employees. 2 These numbers fluctuate.

3 |FY 2018 CEC Report
(3) Accountability - Accountability measures the type and level of value a job can add by analyzing three dimensions: Freedom to Act, Scope, and Impact.
Compensation Structure The State of Idaho’s compensation structure or pay structure is required to ensure the State is able to maintain salary ranges for all job classifications comparable to public and private employers. Idaho’s salary structure consists of 19 pay grades with minimum, policy, and maximum rates. See Appendix E, FY 2017 Salary Structure. The breadth of pay grades allows for variations in compensation due to market factors, experience, performance, job complexity, and compensation philosophy in state agencies.
The policy rate, or midpoint, of the pay range is intended to represent the market average, per Idaho Code §67-5309(B) (Idaho Compensation Plan). This statute further requires merit increases to consider an employee’s proximity to the policy rate. The policy rate should reflect the market average and be adjusted periodically to ensure the State’s salary structure keeps pace with the external market. Adjustments within the market competitive salary structure can then be made to not only ensure external competitiveness, but also internal fairness. See generally, Appendix F, Classified Employees’ Compa-Ratio by Agency.
Currently, the State’s annual average salary for a classified employee is $44,033. Idaho ranks seventh in average salary in the state government comparator markets consisting of Colorado, Montana, New Mexico, Oregon, Washington, Wyoming and Utah. The State’s policy rates are 7% below the eight state governments.
Performance Management The State of Idaho Compensation Philosophy calls for performance based increases and adjustments to address market compensation. To better evaluate merit based performance, DHR provides statewide performance management training for supervisors as a component of the DHR Supervisory Academy. A web-based employee evaluation system is also available for State agencies to use. Performance should be a priority driven by the evaluation of performance goals which are set jointly by the supervisor and the employee at the beginning of the evaluation period. The employee’s completed performance evaluation is discussed with the employee prior to finalization.
On at least an annual basis, State employees receive an evaluation of overall performance. The employee is rated on four statewide expectations established by the Governor: Promoting Responsible Government, Professionalism, Customer Focus, and Leadership. The State uses four levels of ratings within these expectations: Exemplary, Solid Sustained, Achieves, and Does Not Achieve. Once the evaluation is reviewed and approved by the reviewer, supervisor and employee, the required employee information is electronically submitted to the State Controller’s Office for record retention. This transmission eliminates the need for manual data entry of this information, minimizing errors and providing expedient updated information to the employee’s record.

4 |FY 2018 CEC Report
TOTAL COMPENSATION AND ANALYSIS Total compensation includes all forms of compensation and benefits.3 Cash compensation includes base salary, while benefits include health care coverage (for employee and family), disability benefits, life insurance, paid time off, and retirement. The following information provides an overview of State employees’ benefits, salary information, and total compensation.
Total Compensation The chart below illustrates the components of a sample employee’s total compensation and the related state paid costs. The costs include wage, medical, paid time off (vacation, sick, and holidays), retirement, social security, life insurance, workers compensation insurance, and unemployment insurance. Since the benefit costs are based on the annual salary of an employee, the costs will increase as the employee’s salary increases.
Health coverage, life insurance, disability, and other benefits for state employees are managed by the Department of Administration, Office of Group Insurance. As a part of their employment, all participating employees receive employer-paid basic life insurance and accidental death and dismemberment coverage. The basic life policy also includes short and long term disability.
In addition to the employer-sponsored coverages, employees have the option of participating in the medical and dental plans. Medical insurance is the most significant dollar value program with an FY2017 projected cost of $306 million covering nearly 46,000 lives. Premiums for medical insurance are shared by the employer and the over 18,500 employees enrolled for coverage. The employee’s share of medical premiums is based on the plan type and number of eligible family members enrolled for coverage.
At enrollment, employees have the choice of three medical plans to best suit their cost-share preferences and geographic location: Blue Cross of Idaho Preferred Provider Organization (PPO), Traditional or High Deductible plans. Each medical plan provides the same coverage and
3 A Total Compensation analysis is provided for each employee by login through the State Controller Office’s website. This report itemizes the “real-time” amount the State pays for each employee’s salary, medical, dental, life insurance, disability (long and short term), retirement, worker’s compensation insurance, vacation, sick leave, and paid holidays.

5 |FY 2018 CEC Report
vision benefit with differing levels of out-of-pocket expenses and premium contribution rates. The majority of employees select the PPO plan.
Blue Cross of Idaho contracts with Vision Service Plan (VSP) to provide the vision benefit. Prescription drug coverage is included in the medical plan. The medical plan also includes the Employee Assistance Program (EAP). This program provides confidential, short-term counseling with no copayment required.
Supplemental life insurance is available for state employees and their families to purchase. Voluntary term life insurance allows employees to purchase up to 3 times their annual salaries’ worth of coverage, as well as purchase spouse and child coverages.
Flexible Spending Accounts (FSA) are a tax-advantaged benefit allowing employees to pay for eligible health care or day care expenses with pre-tax dollars. Employees do not have to be enrolled in any other health benefit plan to participate in flexible spending. 4
State employees’ retirement benefit or pension plan is managed by the Public Employee Retirement System of Idaho (PERSI). PERSI provides a defined benefit plan5 designed to provide secure, long-term retirement benefits for career public service employees. PERSI funds are separate from all public monies or funds of the State. Funding is provided from contributions from employees, employers and investment income.
As of June 30, 2016, there were 774 contributing employers with a total of 144,560 members.6 A breakdown of this data is illustrated below.
4 State employee group insurance benefit information provided by the Office on Group Insurance – Dept. of Administration. 5 Defined Benefit Plan is a type of pension plan in which an employer/sponsor promises a specified monthly benefit on retirement that is predetermined by a formula based on the employee's earnings history, and tenure of service and age, rather than depending directly on individual investment returns. 6 Retirement information provided by the Public Employee Retirement System of Idaho (PERSI).

6 |FY 2018 CEC Report
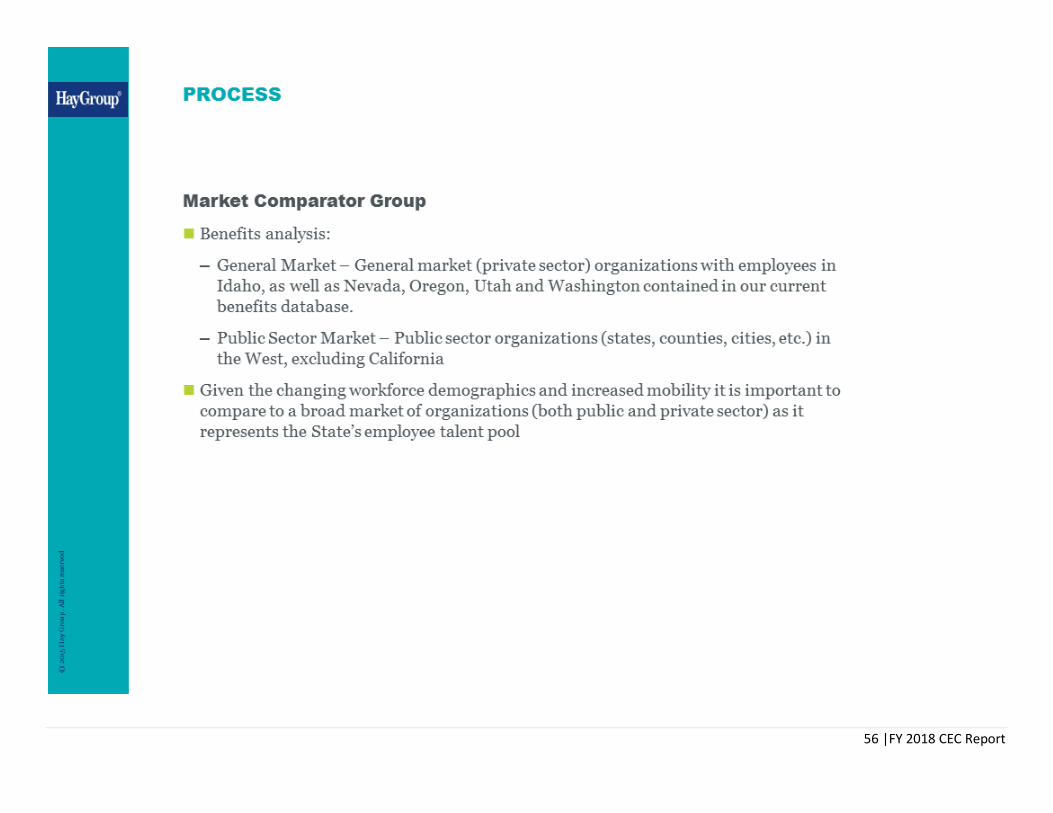
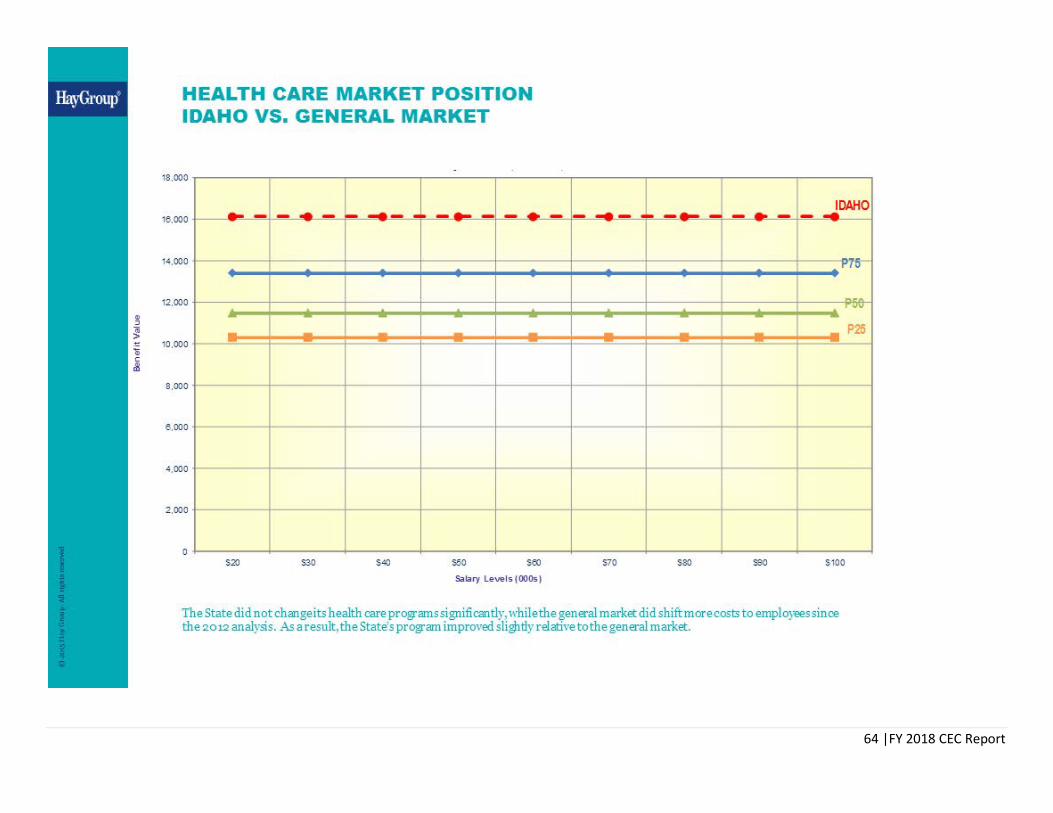
Total Compensation Analysis DHR contracts with the Korn Ferry Hay Group (KFHG), a global HR consulting firm, to perform the State’s total compensation study. The analysis compared the value of the total compensation package provided to State employees against similar workforce structures in other states and private companies. The analysis included both the cost and the value of the total compensation (the plan design and different elements provided to the employee) for classified employees. This approach provides a holistic view to determine if the State, as an employer, is competitive to the market. KFHG uses the salary and market data results provided by DHR7 combined with KFHG data.8 See generally, Appendix G, Hay Benefits Analysis & Total Compensation Executive Summary.
The State’s total compensation package is below market average when compared to both the private sector (general market) and public sector markets. Based on the market data sources used for the analysis, the state policy rate is 20% below the private sector (general) market average and 7% below the public sector market average. The average annual salary for a classified state employee of $44,033 is approximately 24% below the private sector market average and 14% below the public sector market average, as displayed in the chart below.
Korn Ferry Hay Group (KFHG) General Market Update According to KFHG’s 2016 Compensation Report – General Market, nationwide 95% of companies increased salaries for at least some employees. The total salary increases reported are 3% at all employee levels. Companies also reported a salary increase forecast of 3% for the next salary review period. KFHG’s report consists of nearly 700 organizations, primarily private sector.
7 The data includes Idaho salary survey results from Western Management Group, Milliman Health, Milliman Management Professional Survey, Milliman IT, and the National Compensation Association of State Governments (NCASG), see also Idaho Code §67-5309C. 8 Appendix H: Hay Total Compensation Analysis Methodology and Market Sources.

7 |FY 2018 CEC Report
Salary structure increases for the general market were 2% at the median for the most recent annual cycle and are forecast to be 2% in the next annual cycle.
Companies in KFHG’s survey also reported a high prevalence of short-term incentives (94%); however, incentives do not extend to all employee levels, with 97% reporting incentives for middle and senior management, while only 74% reporting incentives for clerical or operation roles.
Companies in the general market are experiencing a scarcity of candidates for particular job families, including: Information Technology (42%) and Engineering (34%). However, companies are also reporting a surplus of candidates in Administration/Support (70%) and Call Center/Customer Service (27%). The average total turnover is 17.2%, while voluntary turnover is 11.9%. Job families with the highest turnover are Production (26%), Sales (24%), IT (21%) and Engineering (20%).
In the area of benefits, companies in the general market are exploring ways to optimize the value of their benefit programs to meet the needs of a changing workforce. Providing employees a meaningful choice of benefits which allows an employee to purchase the level of benefits needed and opt out if desired, is critical to retaining talent. The prevalence of defined benefit retirement programs in the general market nationally continues to decline with only 20% of such programs. A higher prevalence of defined benefit retirement programs exists in the public sector where a well-managed pension program, like PERSI, can be cost effective. Defined benefit programs do not achieve a good balance between retirement security and portability to the same extent defined contribution programs do in the private sector.
Many general market companies are also implementing non-financial programs to attract and retain employees such as flex time work arrangements. 56% of companies report flexible work hours. The most prevalent offering is a 5 day work week with flexible hours (66%) followed by a four day work week with increased hours per day (22%). Work from home policies are also increasing for jobs that are well-suited to virtual work. Flex time policies are not typically one size fits all, as the needs of the business, as well as individual performance, must be considered before implementing such a policy.
KFHG has also published research on the Future of Work and Reward, collecting data from Fortune magazine’s “Most Admired Companies” surveyed by KFHG and through interviews with leaders of over 700 organizations. The research findings include:
Organizations need to focus on the changing nature of work in order to be successful. Workforce planning, assessing the capability needs of the business and leaders and what it will take to attract and retain talent in the future, were key areas of action.
Transparency and fairness in rewards was of vital interest to leaders as well as employees. Perceptions of employee fairness in pay systems becomes problematic when regular employees, contractors and part-time employees, whose pay may be determined in different way, work side by side or together on projects.

8 |FY 2018 CEC Report
With the uncertainty of political support of the Affordable Care Act (ACA) employers are not considering substantial changes to what they offer, at least in the short term.
A variety of emerging benefits are being considered to attract and retain employees, including paid parental leave, student loan repayment, wellness, and fitness benefits.
The changing work environment, where technology is allowing greater worker
mobility, is creating challenges for companies to develop applicable and consistent policies.
At the present time, DHR is reworking the telecommuting policy to balance the desire for reasonable and responsible flexibility with the need for accurate record keeping, productivity, and efficient public service.
DHR STATEWIDE INITIATIVES
IT Classification Project In an effort to modernize and consolidate the current 44 IT classifications, the Division of Human Resources contracted with Korn Ferry Hay Group (KFHG) to conduct a comprehensive review of the current IT structure and make recommendations for changes to simplify and modernize the classifications into functional IT areas. Salary review was not included in the scope of this project. IT Administrators and Human Resource representatives from the Idaho Department of Health and Welfare; Idaho Department of Fish and Game; Idaho Department of Transportation; Idaho Department of Labor and the Idaho Tax Commission were engaged in the overall review. KFHG developed six IT job families consisting of 28 consolidated IT positions. The Division is currently working with IT leaders from the previously-mentioned agencies to develop new classification specifications and related examinations for the 28 positions. This work is anticipated to be completed in the Spring of 2017.
Fair Labor Standards Act (FLSA) The Fair Labor Standards Act (FLSA) requires that non-exempt employees receive overtime pay at one and one-half times the employee’s regular rate of pay for all hours worked above forty (40) hours in a work week. In 2014, the U.S. Department of Labor published a Notice of Proposed rulemaking to revise FLSA. In May of 2016, the Final Rule was released which increased the minimum salary level for exempt employees from $455 per week ($23,660 annually) up to $913 per week ($47,476 annually) and would be effective December 1, 2016. The Final Rule also established an automatic updating mechanism to adjust the minimum salary level every three years. The first automatic increase is to occur on January 1, 2020. In May of 2016, the Division of Human Resources (DHR), in collaboration with the Division of Financial Management (DFM) and the State Controller’s Office (SCO), worked to assess the impact on our state workforce and plan accordingly. Initially, over 1900 employees were coded as administrative, professional, or executive exempt and making under $913 per week. DHR and SCO met with State Agencies to review the federal requirements.

9 |FY 2018 CEC Report
On November 22, 2016, the court in Nevada v. United States Department of Labor, Civil Action No. 4:16-CV-00731, 2016 U.S. Dist. LEXIS 162048, issued a nationwide preliminary injunction on implementation of the U.S. Department of Labor’s new overtime rule. For now, all state agencies were instructed to suspend actions to move exempt employees to non-exempt FLSA status.
Specific Occupational Inequity - Payline Exception Review Per Idaho Code 67-5309(B), the payline exception report identifies classifications that have been requested by state agencies to have a temporary assignment to a pay grade in excess of the pay grade allocated to the classification. These positions have been identified as hard to fill and retain due to salary issues. The agency requests for positions to be placed on payline exception require approval by the DHR Administrator and the positions on the payline exception are reviewed annually by DHR to determine their status on the report. The following classifications were reviewed and re-factored by DHR using the Hay methodology, removing them from payline exception: Building Safety Inspector/Advisor; ISP Sergeant; ISP Specialist; ISP Trooper; Nurse, Licensed Practical; Nurse, Registered; Nurse, Registered Manager; and Nurse, Registered Senior.
Actuary and Strategic Business Analyst classifications were removed from payline exception and archived due to no incumbents. The other classifications on the report were reviewed and recommended to stay on payline exception. See Appendix I – Payline Exception/ Specific Occupational Inequities.
It is critical for DHR to assist agencies in the analysis of hard to fill, hard to retain classifications. This promotes a statewide and consistent approach, ensuring the State’s compensation philosophy is maintained and applied consistently.
Professional Training DHR provides a three-day Supervisory Academy training for State agency supervisors. This training provides education and information on human resource matters with a focus on state statutes, rules, regulations, and policies. Additionally, DHR has added statewide HR training forums for agencies, providing discussion and information on human resources management best practices relevant law and policy, and Crucial Conversations© classes. State agencies may also request specific agency training from DHR. Presently, all slots for the Supervisory Academy and Crucial Conversations© are filled. DHR is in the process of hiring another trainer to address this demand.
In July 2016, DHR worked with Idaho Career & Technical Education (CTE) to transition the administration of the Certified Public Manager Program (CPM) and the Health Matters Wellness Program back to DHR. Though funded by DHR, these programs had been administered through CTE for the past nine years. The 300-hour CPM Program provides an educational opportunity for state employees to become nationally certified and recognized as Certified Public Managers. The Health Matters Wellness Program promotes healthy behaviors and provides state employees with credible wellness resources and opportunities via a website, blog, Facebook page, and twice monthly wellness e-newsletters. This program was not connected to ThriveIdaho nor to the Office of Group Insurance.

10 |FY 2018 CEC Report
WORKFORCE DEMOGRAPHICS
Impact of a Changing Workforce: The Generations
According to the US Bureau of Labor Statistics (BLS) 2015, three generations currently represent about 97 percent of the US workforce: Baby Boomers, Generation X, and Millennials. In 2015, Millennials became the largest generation in the workforce. By 2020, Millennials will dominate the workforce of the future and fill more roles and positions of retired Baby Boomers than Generation Xers. The total workforce of the State of Idaho reflects 1.8% Traditionalists9, 35.7% Baby Boomers, 35.3% Gen X and 27.2% Millennials.
The generational change has shifted with retirements and other exiting employees. Understanding the generational workforce is essential to recruiting, managing, and retaining state employees.
Traditionalists (born 1933-1946) prefer: to be active, involved, and appreciate opportunities to share their knowledge and experience; Baby Boomers (born 1947-1964) prefer: to be challenged, like to multi-task, and they work well with others; Gen X (born 1965-1979): appreciate candid perspective, feedback and flexible work arrangements; and, Millennials (born 1980-2000) prefer: to use technology and social media, desire feedback often, and flexibility.
9 Traditionalists make up less than 3% of the U.S. Workforce.

11 |FY 2018 CEC Report
The charts below depict the actual breakdown by generation of the state employee, illustrating the need to understand and support generational preferences in order to recruit and retain the workforce. See generally, Appendix J, Classified New Hires by Occupational Group and Average Age.
When considering retention of employees by generation, the top motivators for each group are similar. Each year, the Society for Human Resource Management (SHRM) completes a job satisfaction and engagement report10 that outlines workplace factors that contribute to satisfaction and engagement. According to that report, the top two contributors that are important for job satisfaction for all generations is the respectful treatment of all and overall compensation and pay. For both Millennials and Gen X, the top three is completed with overall benefits. Baby Boomers round their top three out with trust between employees and senior management and the organization’s financial stability.
Workforce Turnover Statistics – Classified Employees In FY 2016, 1,861 classified employees “exited” state employment. See Appendix K, Classified Employees Total Separation by Agency FY2014-FY2016; Appendix L, Classified Employees Voluntary Separations by Agency FY2013-FY2016; Appendix M, Classified Employees Involuntary Separations by Agency FY2013-FY2016. The following chart reflects the reason these employees left based on the code entered by state agencies when processing an employee’s final paperwork. This information is entered into the State Controller’s Office - Employee Information System (EIS).
The top four reason codes entered were: Personal 42%, Retirement 21%, Private Sector Job 11%, and Transfer to Another Agency 7%. Although a transfer to another agency is not considered separation of state service, it is treated as such statistically when processing the employee’s job change.
10 Society for Human Resource Management (2016). Employee Job Satisfaction and Engagement: Revitalizing a Changing Workforce, Alexandria, VA.
Voluntary Turnover by Generation New Hires by Generation

12 |FY 2018 CEC Report
Reason for Leaving Code Percentage of Employees
Termination 2% Failure to Complete Entrance Probation 5% Retirement 21% Medical Retirement 0.5% Layoff 0.4% Layoff/Shortage 0.5% Layoff/Medical 3% Transfer to Another Agency 7.2% State Job (Not in Idaho) 0.7% Personal 42% Federal Job 2% County Job 2% City Job 1% School District Job 0.8% Private Sector Job 11% Military 0.1% Death 0.8%
Employee Exit Survey Results When an employee voluntarily leaves state employment, they have the option of completing an online exit survey. This survey is available to the total workforce (classified and non-classified employees). 244 employees responded to the voluntary separation survey request. In FY16 DHR is working on simplifying and promoting the survey in an effort to increase exit survey participation.
The information below reflects the top three results of the responses to the question of “why did you leave state employment”.
REASONS PERCENTAGE OF RESPONDENTS 1. PAY 46% 2. RETIREMENT 34% 3. FAMILY REASONS 29%

13 |FY 2018 CEC Report
Total Workforce Retirement In FY 2016, the number of State employees retiring, 631 individuals, represents 2.4% of the State’s total workforce. The retirement projections for the next ten years represent 13% of the workforce. See Appendix N, Retirement Forecast Calendar Years 2016 to 2025 and Appendix O, Retirement Classified Turnover FY2016. DHR is assisting State agencies with succession planning so that these expected vacant positions may be filled by qualified internal applicants, as appropriate.11 The chart below reflects the retirement percentages for FY2016 and the projected retirements in the future.
11 Idaho Code §67-5309(g)

14 |FY 2018 CEC Report
DHR RECOMMENDATIONS FOR FY2018
Per Idaho Code §67-5309C, DHR must include recommendations on the following components: salary structure adjustment, specific occupational inequity (pay line exception), merit increase, and the employee benefit package.
1) Salary structure adjustment: To more accurately align itself with the market, DHR recommends the policy level be adjusted to reflect the midpoint market average as identified in I.C. §67-5309A(2)(d). Based on the salary market analysis results and the strength of the State’s benefits programs, the State should target a policy rate that is 10% below the private sector average and within 5% of the public sector; however, it is not reasonable to achieve this target in one year.
For FY 2018, DHR recommends at least a 3% increase to the entire pay structure in order to move toward a target policy rate 10% below the private sector. DHR recommends an overall structure move to keep the integrity of the current pay structure of 70% to 125%.
The estimated fiscal impact of this 3% change is $129,500 which is the cost to bring 394 employees up to the new minimum of the salary ranges.
A 2% structure increase would have an estimated fiscal impact of $68,500 for 107 employees and a 4% structure increase would have an estimated fiscal impact of $306,200 for 506 employees.
2) Specific occupational inequity/payline exception component: DHR recommends continuing with the job classifications that are currently on pay line exception to address specific recruitment or retention issues.
3) Merit increase component: DHR recommends at least a 3% increase for the salary component of state employee compensation administered in accordance with the State’s merit based pay philosophy, set forth in statute. This increase should be considered an appropriate step in an effort to keep pace with current market rate increases. A 3% increase would amount to an estimated cost of $18,059,900 to the General Fund and an estimated cost of $21,741,700 in other funds, for a total of $39,801,600.
4) Employee benefit package: The State’s employee benefit package continues to be a key component of the State’s total compensation package for employees. DHR recommends that the State continue to maintain the current funding for the employer cost of group insurance and retirement benefits.

15 | F Y 2 0 1 8 C E C R e p o r t
Appendix A- Glossary
Compa-ratio: The relationship between an employee’s salary and the policy pay rate (market) of their job. For example: If an employee in pay grade K earns $21.22 per hour, and the policy pay rate (market) for pay grade K is $24.65, their compa-ratio is 86% (hourly rate divided by policy rate equals compa-ratio). Classified Employee: Any person appointed to or holding a position in any department of the State of Idaho and subject to the provisions of the merit examination, selection, retention, promotion and dismissal requirements of Idaho Code, Title 67, Chapter 53. Job Classification: Describes the duties, required knowledge, skills and abilities, and minimum qualifications. Maximum Pay Rate: Highest allowable salary of the pay grade. Minimum Pay Rate: Lowest allowable salary of the pay grade. Non-classified Employee: Any person appointed to or holding a position in any department of the State of Idaho and is exempt from Idaho Code, Title 67, Chapter 53 (merit examination, selection, retention, promotion and dismissal requirements) but subject to Idaho Code, Title 59, Chapter 16. Pay Grade: Alphabetical indicator of pay range assigned to each job classification. Payline Exception: A temporary assignment of a higher pay grade to a classification in order to address market related recruitment or retention issues. Pay Range: The span between the minimum and maximum salaries. Policy Pay Rate: The salary relative to the external labor market as determined by salary surveys of similar jobs. Salary Structure: A chart listing the 19 pay grades and associated pay ranges (See Appendix C). Salary Survey: Survey conducted with private and public employers to determine pay levels for specific jobs. Specific Occupational Inequity: See Payline Exception. Temporary Employee: A non-classified employee limited to working no more than one thousand three hundred eighty-five (1,385) hours during a twelve month period for any one agency (Ref. Idaho Code 67-5302(33)).


16 | F Y 2 0 1 8 C E C R e p o r t
Appendix B- Six Year Synopsis of State CEC Increases
SYNOPSIS OF STATE EMPLOYEE SALARY INCREASES FY2012 – FY2017
Fiscal
Year
DHR
Recommendation
Executive Budget
Recommendation
Legislative Action
FY 17 DHR recommended to maintain the current salary structure for FY17, continuation of job classifications on pay line exception. Budget a 3% merit based salary increase. State to maintain funding for the employer cost of group insurance benefits.
The Governor recommended a 3% merit increase for permanent state employees and the Legislature’s Joint CEC Committee also recommended a 3% ongoing merit based increase, not including an increase for group and temporary positions. 3% increase for judges and other appointed officials which will require statutory changes. Recommends funding for a 9.3% increase for the cost of employer paid health insurance.
The Legislature authorized and funded a 3% merit increase for permanent employees to be distributed at the discretion of agency heads. Costs to cover the 27th payroll that will occur in FY2017 and costs to cover benefit cost increases.
FY 16 Maintain the current salary structure for FY16. DHR recommends continuation of job classifications on pay line exception. Budget a 3% merit based salary increase. State to fund the estimated increase in the cost of group insurance benefits.
The Governor recommended a 3% salary increase for permanent state employees and the Legislature’s Joint CEC Committee also recommended a 3% ongoing merit based increase, to be distributed at the discretion of each agency head. The Committee also directed Human Resources to change the minimum amounts on the classified pay schedule from 68% of policy to 70% of policy. JFAC funded the recommendations.
The Legislature authorized and funded a 3% increase in the annual salary for appointed officials, as well, effective July 1, 2015. The salary for each of the three public utilities commissioners, four tax commissioners, and three industrial commissioners was statutorily increased by 3%.Employer health insurance premiums will increase $650 per employee (a 6% increase over FY 2015). The increase is paid by the employer only.

17 | F Y 2 0 1 8 C E C R e p o r t
FY15 Maintain the current salary structure for FY15 and focus resources on compensation issues such as salary compression, salary inequities, recruitment of skilled applicants, and retention of high performing employees.
Budget a 2% merit based salary increase.
No increase in funding for employee compensation. Fund personnel benefit cost adjustments.
Adopted the Legislature's Joint CEC Committee recommendations:
Fund an overall 2% increase for state employees – 1% ongoing and 1% one-time, based on merit.
The Legislature continues to strongly encourage the use of salary savings to compensate employees. Approved adjusting the pay structure upwards by 1%.
The Legislature funded a 15.9% increase in the employer cost of health insurance.
FY14 Two year plan with options: FY 2014
Option 1: if funding is available, a percentage be appropriated to agencies’ personnel budgets and also allow directors to use salary savings to address various compensation challenges. Option 2: if merit increases are not appropriated, allow agencies to use existing salary savings to address their specific compensation challenges.
FY 2015
Propose to move the salary structure towards market. If funding is available, appropriate increases to agencies’ personnel budgets and allow directors to use salary savings to address compensation challenges.
No increase in funding for employee compensation.
No increase in funding for employee compensation. However, each agency’s appropriation bill included the following language that “strongly encourages agency directors, institution executives and the Division of Financial Management to approve the use of salary savings to provide either one-time or ongoing merit increases for deserving employees, and also target employees who are below policy compensation.” The Legislature funded a 6% increase in the cost of employee health insurance and a 9% increase for the employers’ share of PERSI. Employees’ contribution rates to PERSI increased by 9% as well.
FY13 Salaries average 18.6% behind labor market averages.
Budget a 3% merit based salary increase. The
Reserve an amount equivalent to a one-time merit based 3% increase to be distributed in two payments if revenues meet projections.
Legislature approved a 2% ongoing increase to all permanent state employees who are performing satisfactorily. Also, agencies were directed to use salary savings, if

18 |FY 2018 CEC Report
proposed increase is intended to retain and move high performing employees closer to policy pay rates.
available, for additional merit pay for permanent and temporary employees.
FY12 Salaries average 15.9% behind labor market averages.
Budget a 3% salary increase to be administered in accordance with the State’s merit-based pay philosophy.
No increase in funding for employee compensation. Fund employee benefit costs with reserves to cover premium increase and restoration of a two-month health insurance premium holiday.
No action taken. Governor’s recommendation approved. Two months of insurance premiums were deducted from Group Insurance reserves rather than from agency appropriations and employees’ paychecks.


19 | F Y 2 0 1 8 C E C R e p o r t
Appendix C- Agencies with Classified and Non-Classified Employees AGENCIES WITH ONE OR MORE CLASSIFIED EMPLOYEES
AGENCIES WITH ONLY NON-CLASSIFIED EMPLOYEES
*Executive Branch Agencies
Total Number of State Agencies = 86 (Classified 65; Non-Classified 2
• Accountancy Board* • Administration, Dept of* • Agriculture, Dept of* • Boise State University* • Brand Inspector* • Building Safety, Division of* • Central Health District IV* • Comm -Blind and Visually Impaired* • Commerce, Dept of* • Commission for Libraries* • Commission on Aging* • Correction, Dept of* • Dentistry Board* • Eastern Idaho Health District VII* • Eastern Idaho Technical College* • Education Board* • Endowment Fund Investment Board* • Environmental Quality, Dept of* • Finance, Department of* • Financial Management, Division of* • Fish and Game, Dept of* • Health and Welfare, Dept of*
• Hispanic Commission* • Historical Society* • Human Resources, Division of* • Idaho State University* • Independent Living Council* • Industrial Commission* • Insurance, Dept of* • Juvenile Corrections, Dept of* • Labor, Dept of* • Lands, Dept of* • Lava Hot Springs Foundation* • Lewis - Clark State College* • Liquor Division* • Lottery* • Medicine Board* • North Central Health District II* • Nursing Board* • Occupational Licenses* • Outfitters and Guides Licensing Board* • Panhandle Health District I* • Pardons and Parole Commission*
• Parks and Recreation, Dept of* • PERSI* • Pharmacy Board* • Prof Engineers and Land Surveyors Board* • Professional -Technical Education* • Public Defense Commission* • Public Television* • Public Utilities Commission* • Racing Commission* • Real Estate Commission* • Soil and Water Conservation* • South Central Health District V* • Southeast Health District VI* • Southwest Health District III* • State Police* • Tax Appeals Board* • Tax Commission* • Transportation, Dept of* • Veterans Services, Division of* • Veterinary Medicine Board* • Vocational Rehabilitation, Division of* • Water Resources, Dept of*
• Arts, Commission on the* • Attorney General, Office of the • Controller, Office of the State • Correctional Industries* • Drug Policy, Office of* • Energy Resources, Office of* • Governor, Office of the
• House of Representatives • Judicial Branch • Legislative Services Office • Lieutenant Governor, Office of • Military Division* • Office of Energy Resources* • Secretary of State, Office of
• Senate • Species Conservation, Office of* • State Appellate Public Defender* • State Insurance Fund • Supt of Public Instruction • Treasurer, Office of the State • University of Idaho*


20 | F Y 2 0 1 8 C E C R e p o r t
Appendix D- Workforce Demographics by County Work County Employee
Count ADA 11,153 ADAMS 17 BANNOCK 2,817 BEAR LAKE 28 BENEWAH 63 BINGHAM 465 BLAINE 49 BOISE 20 BONNER 172 BONNEVILLE 1,052 BOUNDARY 51 BUTTE 10 CAMAS 10 CANYON 828 CARIBOU 24 CASSIA 126 CLARK 13 CLEARWATER 371 CUSTER 57 ELMORE 54 FRANKLIN 22 FREMONT 249 GEM 11 GOODING 31 IDAHO 142 JEFFERSON 112 JEROME 98 KOOTENAI 984 LATAH 3,925 LEMHI 121 LEWIS 50 LINCOLN 82 MADISON 65 MINIDOKA 35 NEZPERCE 1,638 ONEIDA 14 OUT-OF-STATE 6 OWYHEE 39 PAYETTE 50 POWER 38 SHOSHONE 112 TETON 20 TWIN FALLS 460 VALLEY 89 WASHINGTON 12 Total (As of 11/2016) 25,785


21 | F Y 2 0 1 8 C E C R e p o r t
Appendix E- FY 2017 Salary Structure


22 | F Y 2 0 1 8 C E C R e p o r t
Appendix F- Classified Employees’ Compa-Ratio by Agency Agency Name Compa-Ratio
10/16/14 Compa-Ratio 10/15/15
Compa-Ratio 11/18/16
Count of Employee
Average Pay Rate
Average Policy Rate
Avg Yrs of Service
ACCOUNTANCY, STATE BOARD OF 95.4% 96.5% 93% 3 $15.97 $16.91 12.4 ADMINISTRATION, DEPARTMENT OF 94.4% 97.0% 99% 115 $23.51 $23.83 10.2 AGING, COMMISSION ON 94.0% 97.4% 99% 12 $27.52 $27.60 12.7 AGRICULTURE, DEPARTMENT OF 83.2% 84.6% 85% 177 $22.52 $26.31 10.2 BLIND AND VISUALLY IMPARED, COMMISSION FOR THE
86.8% 88.4% 91% 39 $21.35 $23.54 11.2
BOISE STATE UNIVERSITY 81.0% 85.4% 87% 557 $14.99 $17.27 8.5 BRAND INSPECTOR, STATE 84.0% 86.0% 88% 33 $17.09 $19.44 15.3 BUILDING SAFETY, DIVISION OF 89.0% 89.6% 91% 121 $22.37 $24.47 9.6 COMMERCE, DEPARTMENT OF 85.1% 88.9% 92% 34 $25.08 $27.11 8.6 CONSERVATION , SOIL AND WATER COMMISSION
84.5% 88.7% 92% 16 $23.85 $26.23 13.7
CORRECTION, DEPARTMENT OF 76.9% 80.3% 84% 1,907 $19.13 $22.69 7.5 DENTISTRY, BOARD OF 96.3% 100.3% 103% 2 $15.02 $14.51 3.6 EASTERN IDAHO TECHNICAL COLLEGE
83.4% 87.5% 90% 36 $15.48 $17.52 8.7
EDUCATION, STATE BOARD OF 79.9% 82.4% 83% 4 $16.23 $19.52 1.4 ENDOWMENT FUND INVESTMENT BD
109.8% 114.1% 114% 2 $26.82 $23.68 8.4
ENGINEERS AND LAND SURVEYORS, PROFESSIONAL BOARD OF
104.3% 108.7% 112% 2 $20.35 $18.12 16.3
ENVIRONMENTAL QUALITY, DEPARTMENT OF
82.2% 84.7% 87% 337 $26.58 $30.50 12.1
FINANCE, DEPARTMENT OF 94.3% 99.4% 102% 62 $30.80 $29.78 9.7 FISH AND GAME, DEPARTMENT OF 87.3% 91.0% 93% 523 $25.67 $27.32 14.4 HEALTH AND WELFARE, DEPARTMENT OF
83.2% 85.7% 88% 2,721 $22.58 $25.52 8.9
HEALTH DISTRICT 1 (PANHANDLE) 87.6% 89.4% 90% 115 $21.16 $23.38 6.8 HEALTH DISTRICT 2 (NORTH CENTRAL)
88.8% 91.1% 94% 47 $22.12 $23.70 9.9
HEALTH DISTRICT 3 (SOUTHWEST) 90.7% 90.7% 93% 92 $20.26 $21.86 8.9 HEALTH DISTRICT 4 (CENTRAL) 92.5% 92.7% 93% 108 $21.22 $22.65 8.7 HEALTH DISTRICT 5 (SOUTH CENTRAL)
91.0% 90.2% 92% 73 $20.21 $21.71 9.6

23 |FY 2018 CEC Report
Appendix F- Classified Employees’ Compa-Ratio by Agency (Cont’d.) Agency Name Compa-Ratio
10/16/14 Compa-Ratio 10/15/15
Compa-Ratio 11/18/16
Count of Employee
Average Pay Rate
Average Policy Rate
Avg Yrs of Service
HEALTH DISTRICT 6 (SOUTHEASTERN)
87.6% 89.4% 91% 73 $20.73 $23.00 9.7
HEALTH DISTRICT 7 (EASTERN) 84.8% 85.5% 88% 97 $21.05 $23.73 8.3 HISTORICAL SOCIETY, IDAHO STATE 82.7% 83.0% 84% 42 $20.01 $23.66 10.0 HUMAN RESOURCES, DIVISION OF 87.9% 91.8% 92% 6 $30.25 $32.50 15.3 IDAHO STATE UNIVERSITY 83.5% 85.0% 86% 678 $14.71 $17.03 9.9 INDEPENDENT LIVING COUNCIL 76.9% 79.1% 83% 3 $20.46 $24.83 11.6 INDUSTRIAL COMMISSION 85.9% 88.2% 90% 74 $16.96 $18.92 8.4 INSURANCE, DEPARTMENT OF 84.3% 86.4% 88% 58 $21.27 $24.04 9.4 JUVENILE CORRECTIONS, DEPARTMENT OF
82.5% 84.6% 88% 394 $19.58 $22.17 9.2
LABOR, DEPARTMENT OF 86.7% 87.6% 89% 514 $23.27 $25.66 13.1 LANDS, DEPARTMENT OF 83.2% 86.3% 88% 271 $24.07 $27.46 12.1 LAVA HOT SPRINGS FOUNDATION 91.6% 95.1% 100% 12 $14.92 $14.80 9.6 LEWIS-CLARK STATE COLLEGE 81.2% 84.4% 86% 127 $14.24 $16.58 8.5 LIBRARIES, IDAHO COMMISSION FOR
84.1% 87.3% 91% 34 $21.44 $23.50 13.2
LIQUOR DIVISION, IDAHO STATE 85.6% 87.6% 88% 217 $14.90 $16.79 7.5 LOTTERY COMMISSION, IDAHO STATE
92.6% 96.9% 100% 7 $17.74 $17.73 8.4
MEDICINE, BOARD OF 83.4% 83.9% 92% 9 $15.47 $16.85 11.4 NURSING, BOARD OF 93.9% 89.2% 92% 8 $15.13 $16.39 11.3 OCCUPATIONAL LICENSES, BUREAU OF
84.2% 86.4% 90% 35 $18.09 $20.07 11.8
OUTFITTERS AND GUIDES LICENSING BOARD
88.9% 93.0% 94% 4 $14.92 $15.76 10.7
PARDONS AND PAROLE, COMMISSION OF
75.1% 77.6% 81% 31 $20.35 $25.34 11.7
PARKS AND RECREATION, DEPARTMENT OF
80.2% 81.4% 83% 150 $19.70 $23.46 11.2
PERSI (PUBLIC EMPLOYEE RETIREMENT SYSTEM OF IDAHO)
82.6% 83.1% 85% 54 $20.28 $23.41 9.4
PHARMACY, BOARD OF 84.5% 87.2% 88% 12 $17.91 $20.39 8.1

24 |FY 2018 CEC Report
Appendix F- Classified Employees’ Compa-Ratio by Agency (Cont’d.) Agency Name Compa-Ratio
10/16/14 Compa-Ratio 10/15/15
Compa-Ratio 11/18/16
Count of Employee
Average Pay Rate
Average Policy Rate
Avg Yrs of Service
POLICE, IDAHO STATE 96.0% 96.3% 100% 491 $27.42 $27.18 11.3 PROFESSIONAL-TECHNICAL EDUCATION, DIVISION OF
94.2% 97.2% 90% 12 $14.44 $16.10 7.9
PUBLIC TELEVISION 85.3% 87.9% 89% 60 $19.86 $22.20 12.4 PUBLIC UTILITIES COMMISSION 85.4% 87.1% 89% 36 $24.35 $27.50 11.3 RACING, STATE COMMISSION 103.5% 93.8% 100% 2 $19.77 $19.36 14.7 REAL ESTATE COMMISSION, IDAHO 83.8% 85.5% 90% 9 $20.94 $23.23 9.1 STATE PUBLIC DEFENSE COMMISSION
76.8% 80% 1 $15.53 $19.52 1.2
TAX APPEALS, BOARD OF 87.2% 90.8% 94% 3 $26.26 $28.01 6.9 TAX COMMISSION, IDAHO STATE 81.5% 83.1% 84% 425 $21.56 $25.35 11.3 TRANSPORTATION, DEPARTMENT OF
93.9% 95.9% 98% 1,478 $22.61 $22.91 13.3
VETERANS SERVICES 88.9% 91.5% 99% 310 $18.08 $18.25 7.3 VETERINARY MEDICINE, BOARD OF 79.7% 91.3% 79% 1 $15.45 $19.52 3.6 VOCATIONAL REHABILITATION, IDAHO DIVISION OF
79.4% 79.9% 81% 55 $15.87 $19.51 9.0
WATER RESOURCES, DEPARTMENT OF
85.1% 87.0% 89% 148 $25.42 $28.30 11.2
Total 13,080


25 | F Y 2 0 1 8 C E C R e p o r t
Appendix G- Hay Benefits Analysis & Total Compensation Executive Summary

26 |FY 2018 CEC Report

27 |FY 2018 CEC Report

28 |FY 2018 CEC Report

29 |FY 2018 CEC Report

30 |FY 2018 CEC Report

31 |FY 2018 CEC Report

32 |FY 2018 CEC Report

33 |FY 2018 CEC Report

34 |FY 2018 CEC Report

35 |FY 2018 CEC Report

36 |FY 2018 CEC Report

37 |FY 2018 CEC Report

38 |FY 2018 CEC Report

39 |FY 2018 CEC Report

40 |FY 2018 CEC Report

41 |FY 2018 CEC Report

42 |FY 2018 CEC Report

43 |FY 2018 CEC Report

44 |FY 2018 CEC Report

45 |FY 2018 CEC Report

46 |FY 2018 CEC Report

47 |FY 2018 CEC Report

48 |FY 2018 CEC Report

49 |FY 2018 CEC Report

50 |FY 2018 CEC Report

51 |FY 2018 CEC Report

52 |FY 2018 CEC Report

53 |FY 2018 CEC Report

54 |FY 2018 CEC Report

55 |FY 2018 CEC Report
56 |FY 2018 CEC Report

57 |FY 2018 CEC Report

58 |FY 2018 CEC Report

59 |FY 2018 CEC Report

60 |FY 2018 CEC Report

61 |FY 2018 CEC Report

62 |FY 2018 CEC Report

63 |FY 2018 CEC Report
64 |FY 2018 CEC Report

65 |FY 2018 CEC Report

66 |FY 2018 CEC Report

67 |FY 2018 CEC Report

68 |FY 2018 CEC Report

69 |FY 2018 CEC Report

70 |FY 2018 CEC Report
71 | F Y 2 0 1 8 C E C R e p o r t
Appendix H- Hay Total Compensation Analysis- Methodology & Market Sources

72 |FY 2018 CEC Report

73 |FY 2018 CEC Report

74 |FY 2018 CEC Report

75 |FY 2018 CEC Report

76 |FY 2018 CEC Report

77 | F Y 2 0 1 8 C E C R e p o r t
Appendix I- Payline Exception/ Specific Occupational Inequities
Note: A payline exception occurs when a higher pay grade is assigned to a job class, generally due to recruitment or retention issues. Payline exceptions are approved by the Administrator of the Division of Human Resources in accordance with §67-5309D (5), Idaho Code, which states that "When necessary to obtain or retain qualified personnel in a particular classification, upon petition of the department to the administrator containing acceptable reasons therefore, a higher temporary pay grade may be authorized by the administrator which, if granted, shall be reviewed annually to determine the need for continuance."
Class Code Title
Number of Classified Employees Pay Grade Temporary Pay Grade
7203 Clinical Specialist 20 M N 7433 ISP Forensic Scientist 2 18 K L 6572 Locksmith 3 G H 7584 Nurse, Advanced Practice 8 N O 7476 Pharmacist, Clinical 5 O Q 7478 Pharmacy Services Specialist 2 M P 7474 Pharmacy Services Supervisor 3 P R 7209 Physician, Clinical Director - Community * Q V 7211 Physician, Epidemiologist - State 1 Q V 7207 Physician, Medical Clinic - Institution 2 Q V 7208 Physician, Medical Director - Institution 1 R V 7206 Physician, Psychiatric Specialty 3 Q V 7205 Physician, Public Health * P V 9406 Psychologist 1 M O 9402 Psychologist, Chief of 3 O P 7727 Therapist 1 L M 7710 Therapist, Early Intervention 11 L M 4556 Utilities Division Deputy Administrator 1 O Q
83 * Hired as Temporary Employees


78 | F Y 2 0 1 8 C E C R e p o r t
Appendix J- Classified New Hires by Occupational Group and Average Age OCCUPATIONAL GROUP DESCRIPTION
COUNT OF EMPLOYEE
AGE PERCENT OF NEW HIRES
ADMINISTRATIVE 446 39.4 23% ENGINEERING 85 39.4 4% FINANCE AND ACCOUNTING 86 43.7 4% HEALTH CARE - MEDICAL 2 62.5 0% HEALTH CARE - SERVICES 229 35.4 12% INFORMATION TECHNOLOGY 59 39.3 3% LABOR TRADES AND CRAFTS 161 40.5 8% MANAGEMENT SUB GROUP 7 50.1 0% NURSES 154 38.8 8% PARA-PROFESSIONAL SUB GROUP 141 37.8 7% PROFESSIONAL SERVICES 211 41.2 11% PROTECTIVE SERVICES 310 31.0 16% SCIENCE/ENVIRONMENTAL 66 33.0 3% Total 1,956


79 | F Y 2 0 1 8 C E C R e p o r t
Appendix K- Classified Employees Total Separations by Agency FY2014-FY2016 AGENCY NAME FY 2016
TURNOVER RATE
FY 2016 SEPARATIONS
JULY 2016 EMPLOYEE COUNT
JULY 2015 EMPLOYEE COUNT
JULY 2014 EMPLOYEE COUNT
ACCOUNTANCY, STATE BOARD OF 40.0% 1 2 3 3 ADMINISTRATION, DEPARTMENT OF 15.1% 18 119 120 120 AGING, COMMISSION ON 8.3% 1 12 12 12 AGRICULTURE, DEPARTMENT OF 19.2% 33 172 171 167 BLIND AND VISUALLY IMPAIRED, COMMISSION FOR THE
8.1% 3 38 36 38
BOISE STATE UNIVERSITY 14.2% 78 546 570 575 BRAND INSPECTOR, STATE 16.7% 5 30 30 28 BUILDING SAFETY, DIVISION OF 5.4% 6 114 107 102 COMMERCE, DEPARTMENT OF 14.7% 5 32 36 33 CONSERVATION, SOIL AND WATER COMMISSION 0.0% 0 17 15 15 CORRECTION, DEPARTMENT OF 15.7% 304 1,927 1,923 1,723 DENTISTRY, BOARD OF 0.0% 0 2 2 1 EASTERN IDAHO TECHNICAL COLLEGE 27.0% 10 35 39 38 EDUCATION, STATE BOARD OF 50.0% 2 5 3 2 ENDOWMENT FUND INVESTMENT BOARD 50.0% 1 2 2 2 ENGINEERS AND LAND SURVEYORS, PROFESSIONAL BOARD OF
0.0% 0 2 2 2
ENVIRONMENTAL QUALITY, DEPARTMENT OF 8.5% 28 336 325 323 FINANCE, DEPARTMENT OF 10.2% 6 60 58 61 FISH AND GAME, DEPARTMENT OF 8.3% 44 529 533 528 HEALTH AND WELFARE, DEPARTMENT OF 14.5% 393 2,705 2,620 2,644 HEALTH DISTRICT 1 (PANHANDLE) 17.5% 19 110 107 108 HEALTH DISTRICT 2 (NORTH CENTRAL) 8.7% 4 48 44 42 HEALTH DISTRICT 3 (SOUTHWEST) 11.2% 10 95 84 82 HEALTH DISTRICT 4 (CENTRAL) 17.0% 19 113 110 108 HEALTH DISTRICT 5 (SOUTH CENTRAL) 16.3% 11 70 65 68 HEALTH DISTRICT 6 (SOUTHEASTERN) 11.2% 8 73 70 75 HEALTH DISTRICT 7 (EASTERN) 24.7% 24 97 94 89 HISPANIC AFFAIRS, IDAHO COMMISSION ON 0.0% 0 1 1 1 HISTORICAL SOCIETY, IDAHO STATE 14.3% 6 43 41 40 HUMAN RESOURCES, DIVISION OF 28.6% 2 8 6 8 IDAHO STATE UNIVERSITY 12.4% 85 684 666 633 INDEPENDENT LIVING COUNCIL 50.0% 1 2 2 3

80 |FY 2018 CEC Report
Appendix K- Classified Employees Total Separations by Agency FY2014-FY2016 INDUSTRIAL COMMISSION 34.7% 26 75 75 77 INSURANCE, DEPARTMENT OF 16.2% 9 57 54 57 JUVENILE CORRECTIONS, DEPARTMENT OF 19.4% 75 388 385 388 LABOR, DEPARTMENT OF 13.5% 73 525 553 580 LANDS, DEPARTMENT OF 14.6% 38 270 249 251 LAVA HOT SPRINGS FOUNDATION 24.0% 3 12 13 12 LEWIS-CLARK STATE COLLEGE 12.7% 16 127 125 124 LIBRARIES, IDAHO COMMISSION FOR 8.8% 3 34 34 32 LIQUOR DIVISION, IDAHO STATE 18.3% 37 204 200 195 LOTTERY COMMISSION, IDAHO STATE 0.0% 0 8 8 9 MEDICINE, BOARD OF 0.0% 0 9 9 8 NURSING, BOARD OF 30.8% 2 6 7 4 OCCUPATIONAL LICENSES, BUREAU OF 9.5% 3 32 31 32 OUTFITTERS AND GUIDES LICENSING BOARD 0.0% 0 4 4 4 PARDONS AND PAROLE, COMMISSION OF 16.1% 5 31 31 29 PARKS AND RECREATION, DEPARTMENT OF 13.4% 19 146 137 134 PERSI (PUBLIC EMPLOYEES RETIREMENT SYSTEM OF IDAHO
25.9% 14 56 52 53
PHARMACY, BOARD OF 0.0% 0 11 11 10 POLICE, IDAHO STATE 11.2% 54 491 474 478 PROFESSIONAL-TECHNICAL EDUCATION, DIVISION OF 41.7% 5 12 12 11 PUBLIC TELEVISION 5.9% 3 51 50 48 PUBLIC UTILITIES COMMISSION 8.1% 3 38 36 35 RACING, STATE COMMISSION 0.0% 0 2 2 1 REAL ESTATE COMMISSION, IDAHO 10.0% 1 12 8 11 STATE PUBLIC DEFENSE COMMISSION 0.0% 0 1 1 TAX APPEALS, BOARD OF 0.0% 0 3 3 3 TAX COMMISSION, IDAHO STATE 10.4% 43 415 411 424 TRANSPORTATION, DEPARTMENT OF 10.9% 163 1,488 1,527 1,592 VETERANS SERVICES 36.3% 109 311 289 294 VETERINARY MEDICINE, BOARD OF 0.0% 0 2 1 1 VOCATIONAL REHABILITATION, IDAHO DIVISION OF 24.5% 13 52 54 54 WATER RESOURCES, DEPARTMENT OF 12.5% 17 136 137 131 Totals 1,861 13,038 12,880 12,756

81 |FY 2018 CEC Report
Appendix L- Classified Employees Voluntary Separations by Agency FY2013-FY2016 AGENCY NAME 5 year
average turnover rate
FY2016 Separat-ions
FY 2016 Turnover Rate
FY 2015 Separat-ions
FY 2015 Turnover Rate
FY 2014 Separat-ions
FY 2014 Turnover Rate
FY 2013 Separations
FY 2013 Turnover Rate
FY 2012 Separat-ions
FY 2012 Turnover Rate
ACCOUNTANCY, STATE BOARD OF 0% 0 0.0% 0 0.0% 0 0.0% 0 0.0% 0 0.0% ADMINISTRATION, DEPARTMENT OF
5.90% 8 6.7% 6 5.0% 9 7.6% 5 4.2% 7 5.9%
AGING, COMMISSION ON 8% 1 8.3% 0 0.0% 0 0.0% 0 0.0% 3 31.6% AGRICULTURE, DEPARTMENT OF 7.90% 18 10.5% 14 8.3% 14 8.4% 13 7.9% 7 4.3% BLIND AND VISUALLY IMPAIRED, COMMISSION FOR THE
4.20% 1 2.7% 2 5.4% 1 2.6% 2 5.1% 2 5.1%
BOISE STATE UNIVERSITY 7.40% 49 8.9% 46 8.0% 47 7.9% 34 5.8% 38 6.6% BRAND INSPECTOR, STATE 2.80% 2 6.7% 1 3.5% 1 3.7% 0 0.0% 0 0.0% BUILDING SAFETY, DIVISION OF 3.20% 2 1.8% 5 4.8% 1 1.0% 2 2.1% 6 6.2% COMMERCE, DEPARTMENT OF 10.20% 3 8.8% 4 11.6% 5 14.5% 6 16.0% 0 0.0% CONSERVATION, SOIL AND WATER COMMISSION
11.10% 0 0.0% 2 13.3% 0 0.0% 1 6.9% 3 24.0%
CORRECTION, DEPARTMENT OF 7.70% 149 7.7% 152 8.3% 124 7.5% 124 8.2% 104 6.9% DENTISTRY, BOARD OF 16.70% 0 0.0% 1 66.7% 0 0.0% 0 0.0% 0 0.0% EASTERN IDAHO TECHNICAL COLLEGE
9.50% 6 16.2% 1 2.6% 5 13.2% 3 7.8% 3 7.7%
EDUCATION, STATE BOARD OF 25% 1 25.0% 0 0.0% 2 100.0% 0 0.0% 0 0.0% ENDOWMENT FUND INVESTMENT BOARD
10% 1 50.0% 0 0.0% 0 0.0% 0 0.0% 0 0.0%
ENGINEERS AND LAND SURVEYORS, PROFESSIONAL BOARD O
0% 0 0.0% 0 0.0% 0 0.0% 0 0.0% 0 0.0%
ENVIRONMENTAL QUALITY, DEPARTMENT OF
4.90% 11 3.3% 17 5.3% 14 4.3% 19 5.8% 19 5.9%
FINANCE, DEPARTMENT OF 4.40% 1 1.7% 4 6.7% 5 8.3% 0 0.0% 3 5.5% FINANCIAL MANAGEMENT, DIVISION OF
16.7 0 0.0% 0 0.0% 0 0.0% 0 0.0% 1 66.7%
FISH AND GAME, DEPARTMENT OF 3.40% 18 3.2% 14 2.6% 15 2.8% 15 2.8% 18 3.4% HEALTH AND WELFARE, DEPARTMENT OF
8.00% 198 7.3% 251 9.5% 237 9.0% 189 7.2% 192 7.3%
HEALTH DISTRICT 1 (PANHANDLE) 9.60% 13 12.0% 14 13.0% 11 10.2% 7 6.4% 7 6.5%

82 |FY 2018 CEC Report
Appendix L- Classified Employees Voluntary Separations by Agency FY2013-FY2016 (Cont’d.) AGENCY NAME 5 year
average turnover rate
FY2016 Separat-ions
FY 2016 Turnover Rate
FY 2015 Separat-ions
FY 2015 Turnover Rate
FY 2014 Separat-ions
FY 2014 Turnover Rate
FY 2013 Separations
FY 2013 Turnover Rate
FY 2012 Separat-ions
FY 2012 Turnover Rate
HEALTH DISTRICT 2 (NORTH CENTRAL)
5.20% 1 2.2% 2 4.7% 2 4.8% 3 7.2% 3 7.3%
HEALTH DISTRICT 3 (SOUTHWEST) 6.70% 6 6.7% 4 4.8% 6 7.2% 6 6.9% 7 8.0% HEALTH DISTRICT 4 (CENTRAL) 8.90% 8 7.2% 9 8.3% 13 11.9% 7 6.4% 12 11.0% HEALTH DISTRICT 5 (SOUTH CENTRAL)
10.20% 4 5.9% 10 15.0% 9 13.2% 4 5.8% 8 10.9%
HEALTH DISTRICT 6 (SOUTHEASTERN)
6.80% 4 5.6% 7 9.7% 7 9.4% 2 2.7% 5 6.4%
HEALTH DISTRICT 7 (EASTERN) 6% 9 9.4% 8 8.7% 4 4.6% 4 4.7% 2 2.4% HISPANIC AFFAIRS, IDAHO COMMISSION ON
0% 0 0.0% 0 0.0% 0 0.0% 0 0.0% 0 0.0%
HISTORICAL SOCIETY, IDAHO STATE
8.30% 5 11.9% 1 2.5% 3 7.5% 3 7.4% 5 12.0%
HUMAN RESOURCES, DIVISION OF 20.10% 1 14.3% 1 14.3% 3 33.3% 1 11.8% 2 26.7% IDAHO STATE UNIVERSITY 6% 45 6.7% 31 4.8% 40 6.4% 37 6.0% 39 6.4% INDEPENDENT LIVING COUNCIL 31.30% 1 50.0% 1 40.0% 0 0.0% 1 33.3% 1 33.3% INDUSTRIAL COMMISSION 12.80% 16 21.3% 6 7.9% 7 9.3% 13 17.2% 6 8.1% INSURANCE, DEPARTMENT OF 9.10% 4 7.2% 5 9.0% 9 15.7% 4 6.8% 4 7.0% JUVENILE CORRECTIONS, DEPARTMENT OF
10% 52 13.4% 45 11.6% 37 9.7% 35 9.2% 23 6.1%
LABOR, DEPARTMENT OF 5.70% 38 7.2% 39 6.9% 27 4.6% 26 4.3% 34 5.5% LANDS, DEPARTMENT OF 5.80% 21 8.1% 14 5.6% 13 5.3% 10 4.2% 13 5.5% LAVA HOT SPRINGS FOUNDATION 4.90% 2 16.0% 0 0.0% 1 8.3% 0 0.0% 0 0.0% LEWIS-CLARK STATE COLLEGE 7.10% 7 5.6% 7 5.6% 15 12.0% 12 9.4% 4 3.1% LIBRARIES, IDAHO COMMISSION FOR
2.90% 2 5.9% 0 0.0% 1 3.0% 1 2.9% 1 2.8%
LIQUOR DIVISION, IDAHO STATE 7.00% 14 6.8% 19 9.6% 20 10.2% 13 6.7% 3 1.6% LOTTERY COMMISSION, IDAHO STATE
10.20% 0 0.0% 1 11.8% 1 10.0% 1 9.5% 1 9.5%
MEDICINE, BOARD OF 0% 0 0.0% 0 0.0% 0 0.0% 0 0.0% 0 0.0% NURSING, BOARD OF 28.30% 1 15.4% 2 36.4% 2 40.0% 2 33.3% 1 16.7% OCCUPATIONAL LICENSES 7.60% 2 6.4% 6 19.1% 0 0.0% 3 9.2% 1 3.2%

83 |FY 2018 CEC Report
Appendix L- Classified Employees Voluntary Separations by Agency FY2013-FY2016 (Cont’d.) AGENCY NAME 5 year
average turnover rate
FY2016 Separat-ions
FY 2016 Turnover Rate
FY 2015 Separat-ions
FY 2015 Turnover Rate
FY 2014 Separat-ions
FY 2014 Turnover Rate
FY 2013 Separations
FY 2013 Turnover Rate
FY 2012 Separat-ions
FY 2012 Turnover Rate
OUTFITTERS AND GUIDES LICENSING BOARD
0% 0 0.0% 0 0.0% 0 0.0% 0 0.0% 0 0.0%
PARDONS AND PAROLE, COMMISSION OF
13.90% 4 12.9% 2 6.7% 7 24.6% 5 17.9% 2 7.3%
PARKS AND RECREATION, DEPARTMENT OF
6.60% 7 5.0% 10 7.4% 10 7.4% 10 7.3% 8 5.9%
PERSI (PUBLIC EMPLOYEES RETIREMENT SYSTEM OF IDAHO
5.60% 4 7.4% 7 13.3% 2 3.7% 0 0.0% 2 3.7%
PHARMACY, BOARD OF 0% 0 0.0% 0 0.0% 0 0.0% 0 0.0% 0 0.0% POLICE, IDAHO STATE 4.10% 19 3.9% 27 5.7% 15 3.2% 20 4.4% 15 3.3% PROFESSIONAL-TECHNICAL EDUCATION, DIVISION OF
17.40% 3 25.0% 0 0.0% 3 28.6% 3 26.1% 1 7.1%
PUBLIC TELEVISION 4.10% 2 4.0% 1 2.0% 1 2.1% 4 8.2% 2 4.1% PUBLIC UTILITIES COMMISSION 5.70% 2 5.4% 3 8.5% 1 2.9% 1 2.9% 3 8.7% RACING, STATE COMMISSION 29.20% 0 0.0% 0 0.0% 1 66.7% 1 50.0% 0 0.0% REAL ESTATE COMMISSION, IDAHO 10.30% 0 0.0% 3 31.6% 0 0.0% 0 0.0% 1 9.5% STATE PUBLIC DEFENSE COMMISSION
0 0.0%
TAX APPEALS, BOARD OF 10% 0 0.0% 0 0.0% 0 0.0% 0 0.0% 1 40.0% TAX COMMISSION, IDAHO STATE 5.30% 16 3.8% 25 6.0% 21 5.0% 25 5.9% 23 5.6% TRANSPORTATION, DEPARTMENT OF
4.1% 67 4.5% 67 4.3% 67 4.2% 69 4.2% 55 3.3%
VETERANS SERVICES 12.30% 54 18.0% 34 11.7% 40 13.4% 37 12.6% 16 5.8% VETERINARY MEDICINE, BOARD OF 0% 0 0.0% 0 0.0% 0 0.0% 0 0.0% 0 0.0% VOCATIONAL REHABILITATION, IDAHO DIVISION OF
14.90% 7 13.2% 5 9.3% 4 7.4% 14 26.2% 10 18.3%
WATER RESOURCES, DEPARTMENT OF
5.30% 9 6.6% 8 6.0% 12 9.0% 4 2.8% 3 2.1%
Totals 919 10.40% 944 8.20% 895 9.50% 801 7.20% 730 8.00%


84 | F Y 2 0 1 8 C E C R e p o r t
Appendix M- Classified Employees Involuntary Separations by Agency FY2013-FY2016 AGENCY NAME 4 year
Average turnover rate
FY 2016 Separations
FY 2016 Turnover Rate
FY 2015 Separations
FY 2015 Turnover Rate
FY 2014 Separations
FY 2014 Turnover Rate
ACCOUNTANCY, STATE BOARD OF 0.0% 0 0.0% 0 0.0% 0 0.0% ADMINISTRATION, DEPARTMENT OF 3.0% 3 2.5% 5 4.3% 2 1.7% AGING, COMMISSION ON 0.0% 0 0.0% 0 0.0% 0 0.0% AGRICULTURE, DEPARTMENT OF 2.2% 4 2.3% 3 1.8% 8 4.8% BLIND AND VISUALLY IMPAIRED, COMMISSION FOR THE
2.1% 2 5.4% 1 2.8% 0 0.0%
BOISE STATE UNIVERSITY 2.3% 19 3.4% 10 1.8% 13 2.2% BRAND INSPECTOR, STATE 3.4% 3 10.0% 0 0.0% 0 0.0% BUILDING SAFETY, DIVISION OF 2.2% 1 0.9% 4 3.7% 1 1.0% COMMERCE, DEPARTMENT OF 2.2% 1 2.9% 1 2.8% 1 2.9% CONSERVATION, SOIL AND WATER COMMISSION 0.0% 0 0.0% 0 0.0% 0 0.0% CORRECTION, DEPARTMENT OF 3.4% 121 6.3% 19 1.0% 46 2.8% DENTISTRY, BOARD OF 0.0% 0 0.0% 0 0.0% 0 0.0% EASTERN IDAHO TECHNICAL COLLEGE 3.9% 1 2.7% 4 10.3% 1 2.6% EDUCATION, STATE BOARD OF 6.3% 1 25.0% 0 0.0% 0 0.0% ENDOWMENT FUND INVESTMENT BOARD 0.0% 0 0.0% 0 0.0% 0 0.0% ENGINEERS AND LAND SURVEYORS, PROFESSIONAL BOARD O
0.0% 0 0.0% 0 0.0% 0 0.0%
ENVIRONMENTAL QUALITY, DEPARTMENT OF 0.6% 5 1.5% 1 0.3% 1 0.3% FINANCE, DEPARTMENT OF 0.8% 2 3.4% 0 0.0% 0 0.0% FINANCIAL MANAGEMENT, DIVISION OF 0.0% 0 0.0% 0 0.0% 0 0.0% FISH AND GAME, DEPARTMENT OF 0.7% 9 1.7% 1 0.2% 2 0.4% HEALTH AND WELFARE, DEPARTMENT OF 3.5% 123 4.6% 60 2.3% 92 3.5% HEALTH DISTRICT 1 (PANHANDLE) 24.4% 5 4.6% 1 90.0% 3 2.8% HEALTH DISTRICT 2 (NORTH CENTRAL) 0.5% 1 2.2% 0 0.0% 0 0.0% HEALTH DISTRICT 3 (SOUTHWEST) 1.8% 1 1.1% 1 1.2% 2 2.4% HEALTH DISTRICT 4 (CENTRAL) 2.5% 7 6.3% 1 0.9% 1 0.9% HEALTH DISTRICT 5 (SOUTH CENTRAL) 4.0% 6 8.9% 1 1.5% 0 0.0% HEALTH DISTRICT 6 (SOUTHEASTERN) 2.4% 3 4.2% 2 2.9% 1 1.3% HEALTH DISTRICT 7 (EASTERN) 5.4% 13 13.6% 1 1.1% 1 1.1% HISPANIC AFFAIRS, IDAHO COMMISSION ON 0.0% 0 0.0% 0 0.0% 0 0.0% HISTORICAL SOCIETY, IDAHO STATE 0.8% 0 0.0% 0 0.0% 0 0.0%

85 |FY 2018 CEC Report
Appendix M- Classified Employees Involuntary Separations by Agency FY2013-FY2016 (Cont’d.) AGENCY NAME 4 year
Average turnover rate
FY 2016 Separations
FY 2016 Turnover Rate
FY 2015 Separations
FY 2015 Turnover Rate
FY 2014 Separations
FY 2014 Turnover Rate
HUMAN RESOURCES, DIVISION OF 3.6% 1 14.3% 0 0.0% 0 0.0% IDAHO STATE UNIVERSITY 1.7% 25 3.7% 2 0.3% 7 1.1% INDEPENDENT LIVING COUNCIL 0.0% 0 0.0% 0 0.0% 0 0.0% INDUSTRIAL COMMISSION 3.0% 6 8.0% 0 0.0% 1 1.3% INSURANCE, DEPARTMENT OF 2.2% 2 3.6% 1 1.9% 1 1.7% JUVENILE CORRECTIONS, DEPARTMENT OF 2.5% 15 3.9% 5 1.3% 10 2.6% LABOR, DEPARTMENT OF 2.1% 13 2.4% 5 0.9% 11 1.9% LANDS, DEPARTMENT OF 1.0% 6 2.3% 4 1.6% 0 0.0% LAVA HOT SPRINGS FOUNDATION 0.0% 0 0.0% 0 0.0% 0 0.0% LEWIS-CLARK STATE COLLEGE 3.8% 8 6.4% 2 1.6% 6 4.8% LIBRARIES, IDAHO COMMISSION FOR 1.0% 0 0.0% 0 0.0% 1 3.0% LIQUOR DIVISION, IDAHO STATE 4.8% 19 9.4% 5 2.5% 8 4.1% LOTTERY COMMISSION, IDAHO STATE 0.0% 0 0.0% 0 0.0% 0 0.0% MEDICINE, BOARD OF 0.0% 0 0.0% 0 0.0% 0 0.0% NURSING, BOARD OF 6.7% 0 0.0% 0 0.0% 1 20.0% OCCUPATIONAL LICENSES, BUREAU OF 2.1% 0 0.0% 0 0.0% 1 3.1% OUTFITTERS AND GUIDES LICENSING BOARD 0.0% 0 0.0% 0 0.0% 0 0.0% PARDONS AND PAROLE, COMMISSION OF 2.6% 1 3.2% 0 0.0% 1 3.5% PARKS AND RECREATION, DEPARTMENT OF 0.7% 4 2.8% 0 0.0% 0 0.0% PERSI (PUBLIC EMPLOYEES RETIREMENT SYSTEM OF IDAHO
4.2% 6 11.1% 0 0.0% 2 3.7%
PHARMACY, BOARD OF 3.3% 0 0.0% 0 0.0% 1 10.0% POLICE, IDAHO STATE 1.7% 17 3.5% 4 0.8% 7 1.5% PROFESSIONAL-TECHNICAL EDUCATION, DIVISION OF
2.1% 1 8.3% 0 0.0% 0 0.0%
PUBLIC TELEVISION 0.7% 0 0.0% 0 0.0% 0 0.0% PUBLIC UTILITIES COMMISSION 0.9% 0 0.0% 1 2.8% 0 0.0% RACING, STATE COMMISSION 0.0% 0 0.0% 0 0.0% 0 0.0% REAL ESTATE COMMISSION, IDAHO 5.6% 1 10.0% 1 12.5% 0 0.0% STATE PUBLIC DEFENSE COMMISSION 0 0.0% TAX APPEALS, BOARD OF 0.0% 0 0.0% 0 0.0% 0 0.0%

86 |FY 2018 CEC Report
Appendix M- Classified Employees Involuntary Separations by Agency FY2013-FY2016 (Cont’d.) AGENCY NAME 4 year
Average turnover rate
FY 2016 Separations
FY 2016 Turnover Rate
FY 2015 Separations
FY 2015 Turnover Rate
FY 2014 Separations
FY 2014 Turnover Rate
TAX COMMISSION, IDAHO STATE 1.6% 9 2.2% 3 0.7% 6 1.4% TRANSPORTATION, DEPARTMENT OF 1.7% 26 1.7% 30 2.0% 26 1.6% VETERANS SERVICES 8.8% 50 16.7% 15 5.2% 18 6.0% VETERINARY MEDICINE, BOARD OF 55.6% 0 0.0% 1 100.0% 1 66.7% VOCATIONAL REHABILITATION, IDAHO DIVISION OF
4.2% 5 9.4% 0 0.0% 2 3.7%
WATER RESOURCES, DEPARTMENT OF 1.6% 4 2.9% 1 0.7% 1 0.7% Overall - Total 3.3% 550 5.8% 196 4.1% 287 2.7%


87 | F Y 2 0 1 8 C E C R e p o r t
Appendix N- Retirement Forecast Calendar Years 2016 to 2025 Agency Less than 5 years 5 to 9 years 10 to 19 years 20 to 29 years 30 or more years ACCOUNTANCY, STATE 1 2 7 0 1 ADMINISTRATION, DEPARTMENT OF 17 21 48 39 6 AGING, COMMISSION ON 3 2 13 2 1 AGRICULTURE, DEPARTMENT OF 40 31 68 99 82 BLIND AND VISUALLY IMPAIRED, COMMISSION FOR THE
4 5 19 13 3
BOISE STATE UNIVERSITY 0 0 1 4 2488 BRAND INSPECTOR, STATE 17 5 13 5 20 BUILDING SAFETY, DIVISION OF 15 23 65 34 54 COMMERCE, DEPARTMENT OF 2 3 17 20 9 CONSERVATION, SOIL AND WATER COMMISSION
3 1 8 4 6
CORRECTION, DEPARTMENT OF 190 222 728 779 35 DENTISTRY, BOARD OF 1 0 0 3 9 EASTERN IDAHO TECHNICAL COLLEGE 7 13 38 45 389 EDUCATION, STATE BOARD OF 1 5 17 15 5 ENDOWMENT FUND INVESTMENT BOARD 0 2 3 1 3 ENGINEERS AND LAND SURVEYORS, PROFESSIONAL BOARD OF
0 2 7 1 4
ENVIRONMENTAL QUALITY, DEPARTMENT OF 52 56 124 112 23 FINANCE, DEPARTMENT OF 9 9 19 21 8 FISH AND GAME, DEPARTMENT OF 112 82 202 193 222 HEALTH AND WELFARE, DEPARTMENT OF 214 269 900 1192 373 HEALTH DISTRICT 1 (PANHANDLE) 10 12 42 57 16 HEALTH DISTRICT 2 (NORTH CENTRAL) 5 8 23 20 6 HEALTH DISTRICT 3 (SOUTHWEST) 5 13 37 32 24 HEALTH DISTRICT 4 (CENTRAL) 7 13 45 42 38 HEALTH DISTRICT 5 (SOUTH CENTRAL) 8 11 27 23 24 HEALTH DISTRICT 6 (SOUTHEASTERN) 6 11 30 23 22 HEALTH DISTRICT 7 (EASTERN) 3 14 36 35 35 HISPANIC AFFAIRS, IDAHO COMMISSION ON 0 1 2 0 0 HISTORICAL SOCIETY, IDAHO STATE 7 1 16 18 30 HUMAN RESOURCES, DIVISION OF 1 2 3 2 5 IDAHO STATE UNIVERSITY 1 0 3 0 1,989 INDEPENDENT LIVING COUNCIL 0 1 2 0 1 INDUSTRIAL COMMISSION 16 25 39 39 16

88 |FY 2018 CEC Report
Appendix N- Retirement Forecast Calendar Years 2016 to 2025 (Cont’d.) Agency Less than 5 years 5 to 9 years 10 to 19 years 20 to 29 years 30 or more years INSURANCE, DEPARTMENT OF 8 12 27 18 14 JUVENILE CORRECTIONS, DEPARTMENT OF 27 37 150 140 50 LABOR, DEPARTMENT OF 74 101 219 132 39 LANDS, DEPARTMENT OF 42 40 130 129 48 LAVA HOT SPRINGS FOUNDATION 2 1 5 6 35 LEWIS-CLARK STATE COLLEGE 52 58 154 161 669 LIBRARIES, IDAHO COMMISSION FOR 9 7 14 5 6 LIQUOR DIVISION, IDAHO STATE 13 39 71 70 174 LOTTERY COMMISSION, IDAHO STATE 5 4 20 17 7 MEDICINE, BOARD OF 1 0 10 5 35 NURSING, BOARD OF 3 1 15 2 0 OCCUPATIONAL LICENSES, BUREAU OF 6 7 21 8 125 OUTFITTERS AND GUIDES LICENSING BOARD 0 0 6 1 10 PARDONS AND PAROLE, COMMISSION OF 6 7 14 6 5 PARKS AND RECREATION, DEPARTMENT OF 24 25 72 38 87 PERSI (PUBLIC EMPLOYEES RETIREMENT SYSTEM OF IDAHO
8 9 31 16 2
PHARMACY, BOARD OF 0 3 6 5 6 POLICE, IDAHO STATE 56 73 184 153 48 PROFESSIONAL-TECHNICAL EDUCATION, DIVISION OF
6 4 15 13 3
PUBLIC TELEVISION 14 10 24 11 45 PUBLIC UTILITIES COMMISSION 13 7 17 10 3 RACING, STATE COMMISSION 1 1 0 1 9 REAL ESTATE COMMISSION, IDAHO 1 0 7 4 5 STATE PUBLIC DEFENSE COMMISSION 0 0 1 2 1 TAX APPEALS, BOARD OF 1 1 2 1 3 TAX COMMISSION, IDAHO STATE 65 65 169 118 52 TRANSPORTATION, DEPARTMENT OF 266 241 553 361 115 VETERANS SERVICES 23 37 121 117 62 VETERINARY MEDICINE, BOARD OF 0 0 2 0 11 VOCATIONAL REHABILITATION, IDAHO DIVISION OF
10 21 58 55 9
WATER RESOURCES, DEPARTMENT OF 27 13 56 46 23 Totals 1520 1689 4776 4524 7648

89 | F Y 2 0 1 8 C E C R e p o r t
Appendix O- Retirement Classified Turnover FY2016 Agency Name July 2016 Employee Count FY2016 Retirements
ACCOUNTANCY, STATE BOARD OF 2 1 ADMINISTRATION, DEPARTMENT OF 119 7 AGING, COMMISSION ON 12 0 AGRICULTURE, DEPARTMENT OF 172 11 BLIND AND VISUALLY IMPAIRED, COMMISSION FOR THE 38 0 BOISE STATE UNIVERSITY 546 7 BRAND INSPECTOR, STATE 30 0 BUILDING SAFETY, DIVISION OF 114 3 COMMERCE, DEPARTMENT OF 32 1 CONSERVATION, SOIL AND WATER COMMISSION 17 0 CORRECTION, DEPARTMENT OF 1,927 33 DENTISTRY, BOARD OF 2 0 EASTERN IDAHO TECHNICAL COLLEGE 35 3 EDUCATION, STATE BOARD OF 5 0 ENDOWMENT FUND INVESTMENT BOARD 2 0 ENGINEERS AND LAND SURVEYORS, PROFESSIONAL BOARD O
2 0
ENVIRONMENTAL QUALITY, DEPARTMENT OF 336 12 FINANCE, DEPARTMENT OF 60 3 FINANCIAL MANAGEMENT, DIVISION OF 1 FISH AND GAME, DEPARTMENT OF 529 18 HEALTH AND WELFARE, DEPARTMENT OF 2,705 69 HEALTH DISTRICT 1 (PANHANDLE) 110 1 HEALTH DISTRICT 2 (NORTH CENTRAL) 48 1 HEALTH DISTRICT 3 (SOUTHWEST) 95 3 HEALTH DISTRICT 4 (CENTRAL) 113 4 HEALTH DISTRICT 5 (SOUTH CENTRAL) 70 1 HEALTH DISTRICT 6 (SOUTHEASTERN) 73 1 HEALTH DISTRICT 7 (EASTERN) 97 1 HISPANIC AFFAIRS, IDAHO COMMISSION ON 1 0 HISTORICAL SOCIETY, IDAHO STATE 43 1 HUMAN RESOURCES, DIVISION OF 8 0 IDAHO STATE UNIVERSITY 684 13 INDEPENDENT LIVING COUNCIL 2 0 INDUSTRIAL COMMISSION 75 4 INSURANCE, DEPARTMENT OF 57 3 JUVENILE CORRECTIONS, DEPARTMENT OF 388 9 LABOR, DEPARTMENT OF 525 23 LANDS, DEPARTMENT OF 270 11 LAVA HOT SPRINGS FOUNDATION 12 1 LEWIS-CLARK STATE COLLEGE 127 1 LIBRARIES, IDAHO COMMISSION FOR 34 1 LIQUOR DIVISION, IDAHO STATE 204 6 LOTTERY COMMISSION, IDAHO STATE 8 0 MEDICINE, BOARD OF 9 0 URSING, BOARD OF 6 1 OCCUPATIONAL LICENSES, BUREAU OF 32 1

90 |FY 2018 CEC Report
Appendix O- Retirement Classified Turnover FY2016 (Cont’d.)
Agency Name July 2016 Employee Count FY2016 Retirements OUTFITTERS AND GUIDES LICENSING BOARD 4 0 PARDONS AND PAROLE, COMMISSION OF 31 0 PARKS AND RECREATION, DEPARTMENT OF 146 8 PERSI (PUBLIC EMPLOYEES RETIREMENT SYSTEM OF IDAHO 56 4 PHARMACY, BOARD OF 11 0 POLICE, IDAHO STATE 491 18 PROFESSIONAL-TECHNICAL EDUCATION, DIVISION OF 12 1 PUBLIC TELEVISION 51 1 PUBLIC UTILITIES COMMISSION 38 1 RACING, STATE COMMISSION 2 0 REAL ESTATE COMMISSION, IDAHO 12 0 STATE PUBLIC DEFENSE COMMISSION 1 0 TAX APPEALS, BOARD OF 3 0 TAX COMMISSION, IDAHO STATE 415 19 TRANSPORTATION, DEPARTMENT OF 1,488 73 VETERANS SERVICES 311 5 VETERINARY MEDICINE, BOARD OF 2 0 VOCATIONAL REHABILITATION, IDAHO DIVISION OF 52 1 WATER RESOURCES, DEPARTMENT OF 136 4 Total 391

