report to congress - aspe
TRANSCRIPT

REPORT TO CONGRESS
Prescription Drug Pricing
May 20, 2020
U.S. Department of Health & Human Services
Office of the Assistant Secretary for Planning and Evaluation

May 2020 REPORT TO CONGRESS 2
Acknowledgements
Many people at ASPE contributed to this project including Kenneth Finegold, Nguyen Nguyen, Sean
Klein, Arielle Bosworth, Victoria Aysola, and Michael Tran. ASPE also acknowledges programming
support from Acumen, LLC.
Suggested Citation
Office of the Assistant Secretary for Planning and Evaluation, U.S. Department of Health & Human
Services. Prescription Drug Pricing Report. 2020. https://aspe.hhs.gov/prescription-drugs

May 2020 REPORT TO CONGRESS 3
Table of Contents
Section 1. Introduction ............................................................................................................................. 6
Section 2. Medicare Part B ...................................................................................................................... 11
Section 3. Medicare Part D ..................................................................................................................... 22
Section 4. Medicaid ................................................................................................................................. 31
Section 5. Drugs Benefiting from Government Grants or Research Subsidies ....................................... 39
Appendix: Top 10 Drugs by Total Cost, Spending Per Unit, and Prescription Frequency in Medicare
Part B, Medicare Part D, and Medicaid ................................................................................................... 46

May 2020 REPORT TO CONGRESS 4
Tables
Table 2-1 Medicare Fee-for-Service Part B Program Spending for Drug Benefits, 2006-2018 Table 2-2 Medicare Fee-for-Service Part B Program Spending per Enrollee and User for Drug Benefits, 2006-2018
Table 2-3 Top 10 Highest-Cost Prescribed Drugs, Medicare Part B, Ranked by Total Spending (2008,
2011, 2014, 2018)
Table 2-4 Top 10 Highest-Cost Prescribed Drugs, Medicare Part B, Ranked by Spending per Unit (2011,
2014, 2018)
Table 2-5 Top 10 Most Frequently Prescribed Drugs, Medicare Part B, Ranked by Total Number of Services (2008, 2011, 2014, 2018)
Table 3-1 Medicare Part D Total Program Spending and Benefit Spending, 2006-2018
Table 3-2 Medicare Part D Prescription Gross Drug Costs (GDC): 2007-2018 Table 3-3 Top 10 Highest-Cost Drugs, Medicare Part D, Ranked by Program Spending (2008, 2011, 2014, 2018) Table 3-4 Top 10 Highest-Cost Drugs, Medicare Part D, Ranked by Spending per Unit (2008, 2011, 2014, 2018) Table 3-5 Top 10 Most Frequently Prescribed Drugs, Medicare Part D, Ranked by Number of Claims (2008, 2011, 2014, 2018) Table 4-1 Medicaid Prescription Drug Gross Spending, 2006-2018 Table 4-2 Top 10 High-Cost Prescribed Drugs, Medicaid, Ranked by Total Spending (2008, 2011, 2014,
2018)
Table 4-3 Top 10 High-Cost Prescribed Drugs, Medicaid, Ranked by Spending per Unit (2014, 2018) Table 4-4 Top 10 Most Frequently Prescribed Drugs, Medicaid, Ranked by Number of Claims (2008, 2011, 2014, 2018)
Table 5-1 Prescription Drugs Approved for Sale by the Food and Drug Administration from 2013 to 2018, and 2018 Spending by Program Where Applicable Table A-1 Top 10 High-Cost Prescribed Drugs, Medicare Part B, Ranked by Program Spending (All years) Table A-2 Top 10 Highest-Cost Prescribed Drugs, Medicare Part B, Ranked by Spending per Unit (All
years)
May 2020 REPORT TO CONGRESS 5
Table A-3 Top 10 Most Frequently Prescribed Drugs, Medicare Part B, Ranked by Total Number of
Services (All years)
Table A-4 Top 10 High-Cost Prescribed Drugs, Medicare Part D, Ranked by Total Spending (All years) Table A-5 Top 10 Highest-Cost Drugs, Medicare Part D, Ranked by Spending per Unit (All years) Table A-6 Top 10 Most Frequently Prescribed Drugs, Medicare Part D, Ranked by Number of Claims (All years)
Table A-7 Top 10 High-Cost Prescribed Drugs, Medicaid, Ranked by Total Spending (All years)
Table A-8 Top 10 High-Cost Prescribed Drugs, Medicaid, Ranked by Spending per Unit (All years)
Table A-9 Top 10 Most Frequently Prescribed Drugs, Medicaid, Ranked by Number of Claims
(All years)
Figures
Figure 1-1 Annual Percentage Change in Prescription Drug Spending by Program, 2007-2018 Figure 3-1 Medicare Part D Total Spending per Enrollee and Per User, 2006-2018

May 2020 REPORT TO CONGRESS 6
Section 1. Introduction
The Secretary of Health and Human Services (HHS) has been directed to submit a drug pricing report
containing information requested by the House Committee on Appropriations. In response, the Office of
the Assistant Secretary for Planning and Evaluation (ASPE) developed this report containing data and
analyses related to prescription drug spending between 20061 and 2018 as well as on prescription drugs
benefiting from public funding for biomedical research since 2013. The sections on prescription drug
spending provide comparative gross prescription drug spending and prices as well as the top 10 highest-
cost drugs and the top 10 most frequently prescribed drugs for each of the following: (1) The Medicare
program under part B of title XVIII of the Social Security Act; (2) The Medicare prescription drug program
under part D of title XVIII of the Social Security Act; (3) The Medicaid program under title XIX of the Social
Security Act. The section on public funding for biomedical research provides the list of drugs that have
been approved for sale by the Food and Drug Administration (FDA) in the past five years that have
benefited significantly from government grants or research subsidies in either the pre-clinical or clinical
stages of development, as well as spending in Medicare Part D and Medicaid for each of those drugs.
This report does not include: (1) prescription drug spending or prices pertaining to programs of the
Department of Veterans Affairs; (2) spending and prices net of rebates for individual drugs within
Medicare Part D or Medicaid; or (3) a breakdown of the comparative prices net of rebates for each of the
10 most frequently prescribed drugs or the 10 highest-cost drugs between ambulatory settings and retail
settings. Rebate data and prices net of rebates are excluded because this information is generally
considered proprietary and is subject to a variety of disclosure restrictions under Federal law. The
Department of Health and Human Services does not have access to the requested data on prescription
drug spending and prices under programs of the Department of Veterans Affairs.
Prescription Drug Spending in Medicare Part B, Medicare Part D, and Medicaid
Prescription drug spending generally continues to increase in the United States.2 The Office of the Actuary
within the Centers for Medicare & Medicaid Services (CMS) estimates that in 2020, $358.7 billion will be
spent on retail prescription drugs, rising from $258.2 billion in 2013.3 The May 2018 “American Patients
1 The committee request data on drug pricing back to 2008. In several analyses, this report presents data starting with 2006; several policy changes began in 2006 including the implementation of Medicare Part D and the first year that most hospital outpatient departments began using ASP methodology for payments under Medicare Part B. 2 IQVIA’s baseline analysis projects 4-7% annual spending growth in invoice prices and 3-6% annual spending growth in net prices through 2023. See IQVIA Institute for Human Data Science, Medicine Use and Spending in the U.S.: A Review of 2019 and Outlook to 2023, May 2019 (https://www.iqvia.com/en/insights/the-iqvia-institute/reports/medicine-use-and-spending-in-the-us-a-review-of-2018-and-outlook-to-2023). 3 The $358.7 billion estimate for 2020 includes $122.4 billion for Medicare (including Part B and Part D) and $37.0 billion for Medicaid. Both estimates are net of rebates. See Table 11 in https://www.cms.gov/files/zip/nhe-projections-2019-2028-tables.zip-0. The projections cited in this report were developed before the impacts of the COVID-19 epidemic could be incorporated.

Section 1: Introduction
May 2020 REPORT TO CONGRESS 7
First: Trump Administration Blueprint to Lower Drug Prices and Reduce Out of Pocket Costs” described a
new, more transparent drug pricing system that would lower high prescription drug prices and bring down
out-of-pocket costs. The blueprint includes four strategies for putting American patients first: bringing
down out-of-pocket-costs, boosting competition, strengthening negotiation, and creating incentives for
lower list prices.4
Trends in prescription drug utilization and spending vary across the Medicare Part B, Medicare Part D, and
Medicaid programs. Differences in utilization and spending reflect underlying variation in eligibility for
each program, including age, disability, income, and medical need. The Medicare Program provides health
insurance coverage for individuals aged 65 years and older as well as certain younger individuals with
disabilities or End-Stage Renal Disease. Medicaid is a joint Federal-State program that provides coverage
4 https://www.hhs.gov/sites/default/files/AmericanPatientsFirst.pdf
KEY POINTS
Drug spending is concentrated in relatively few drugs in the Medicare and Medicaid programs. The top spending drugs differ by program and the level of concentration differs as well. For example, in 2018, the top ten highest-cost drugs by total spending accounted for 46 percent of spending in Medicare Part B, 18 percent of spending in Medicare Part D, and 14 percent of spending in Medicaid.
Drug spending has been growing rapidly in the Medicare Part B program, increasing at an average of 8.4 percent per year between 2006 and 2018, and 9.7 percent between 2017 and 2018. During the period 2006-18, as FFS enrollment in Part B between 2006 and 2018 was flat, spending per enrollee increased similarly at 8.3 percent per year on average.
While Medicare Part D drug spending has grown since the program began in 2006, the average annual rate of growth in spending in recent years has not increased as fast as drug spending in Medicare Part B. Medicare Part D program spending increased an average of 6.0 percent per year between 2006 and 2018, but dropped by 4.8 percent between 2017 and 2018, due partly to increased manufacturer rebates. During the period 2006-18, although Medicare Part D spending increased 6 percent annually, as Part D enrollees increased about 3.5 percent, spending per enrollee increased on average 2.5 percent per year.
Medicaid program spending on drugs increased an average of 4.8 percent per year between 2006 and 2018, but only 1.4 percent between 2017 and 2018 due in part to reduced spending on hepatitis C drugs. Medicaid program spending on prescription drugs increased 0.8 percent on a per enrollee basis between 2006 and 2018. Of particular note, in the list of top ten drugs by volume for Medicaid, hydrocodone-acetaminophen, a pain relief drug, was the most prescribed drug in 2014 and 2015. It is no longer in the top ten, which may be a result of government action to address the opioid epidemic.
All or virtually all new drugs approved for sale by the FDA between 2014 and 2018 benefited significantly from government grants or research subsidies in either the pre-clinical or clinical stages of development.

Section 1: Introduction
May 2020 REPORT TO CONGRESS 8
for individuals and families with low incomes; some individuals with incomes above these limits may also
qualify due to high medical expenses.
In addition to populations served, these programs and different parts of these programs also vary in the
coverage offered for prescription drugs. Medicare Part D and Medicare Part B provide coverage for
different types of prescription drugs based on site of service: in general, Medicare Part D provides
coverage for self-administered prescription drugs and Medicare Part B covers drugs that are administered
in physician’s offices or hospital outpatient departments. In Medicaid, outpatient prescription drug
coverage is an optional benefit, currently offered by all states and the District of Columbia.
Prescription drug expenditures are projected to continue rising during the coming decade, placing
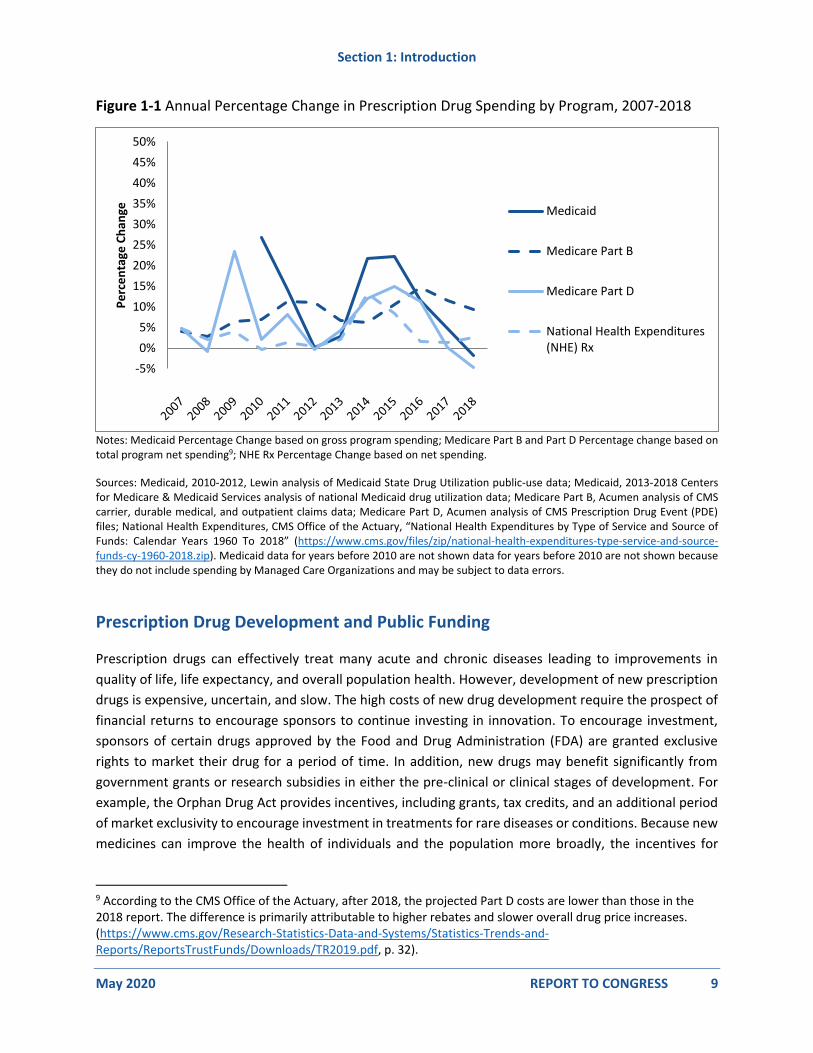
increasing fiscal pressures on commercial, federal, and state budgets.5,6 As Figure 1-1 shows, spending
growth has slowed down over the past three years, with drops of 5 percent in Medicare Part D and 2
percent in Medicaid between 2017 and 2018. Medicare Part B spending, however, has continued to
increase. Over the longer period from 2006 to 2018, program spending for prescription drug has grown
at an compounded annual rate of 6 percent for Medicare Part D, 8 percent for Medicare Part B, and 5
percent for Medicaid, each far above the 3 percent rate for overall prescription drug expenditures.7,8
Increases in prescription drug spending are not expected to be uniform across government programs,
however, in part due to differences in eligibility and coverage across programs. Another important factor
underlying differential projected increases in prescription drug spending is variation in use of purchasing
arrangements, utilization management strategies, and value-based approaches by the different
government programs.
5 Observations on trends in prescription drug spending. ASPE Issue Brief (3/8/2016). https://aspe.hhs.gov/pdf-report/observations-trends-prescription-drug-spending 6 Sisko AM, Keehan SP, Poisal JA, et al. National Health Expenditure Projections, 2018–27: Economic And Demographic Trends Drive Spending And Enrollment Growth. Health Affairs. 3 (2019). Available from: https://www-healthaffairs-org.ezproxyhhs.nihlibrary.nih.gov/toc/hlthaff/0/0. 7 Medicaid data for years before 2010 are not shown in Figure 1-1 because they do not include spending by Managed Care Organizations and may be subject to data errors. The high rate of increase in Medicaid spending in 2014 and 2015 is associated with Medicaid expansion under the Affordable Care Act and the launch of expensive new drugs such as Sovaldi and Harvoni for hepatitis C. 8 On a per person basis, Medicare Part D spending increased on average 2.5 percent annually during the period 2006-18 as Part D enrollment increased about 3.5 percent annually while Medicare Part B drug spending per person in FFS remains at about 8 percent as enrollment in Part B FFS was flat over the period.
Section 1: Introduction
May 2020 REPORT TO CONGRESS 9
Figure 1-1 Annual Percentage Change in Prescription Drug Spending by Program, 2007-2018
Notes: Medicaid Percentage Change based on gross program spending; Medicare Part B and Part D Percentage change based on total program net spending9; NHE Rx Percentage Change based on net spending.
Sources: Medicaid, 2010-2012, Lewin analysis of Medicaid State Drug Utilization public-use data; Medicaid, 2013-2018 Centers for Medicare & Medicaid Services analysis of national Medicaid drug utilization data; Medicare Part B, Acumen analysis of CMS carrier, durable medical, and outpatient claims data; Medicare Part D, Acumen analysis of CMS Prescription Drug Event (PDE) files; National Health Expenditures, CMS Office of the Actuary, “National Health Expenditures by Type of Service and Source of Funds: Calendar Years 1960 To 2018” (https://www.cms.gov/files/zip/national-health-expenditures-type-service-and-source-funds-cy-1960-2018.zip). Medicaid data for years before 2010 are not shown data for years before 2010 are not shown because they do not include spending by Managed Care Organizations and may be subject to data errors.
Prescription Drug Development and Public Funding
Prescription drugs can effectively treat many acute and chronic diseases leading to improvements in
quality of life, life expectancy, and overall population health. However, development of new prescription
drugs is expensive, uncertain, and slow. The high costs of new drug development require the prospect of
financial returns to encourage sponsors to continue investing in innovation. To encourage investment,
sponsors of certain drugs approved by the Food and Drug Administration (FDA) are granted exclusive
rights to market their drug for a period of time. In addition, new drugs may benefit significantly from
government grants or research subsidies in either the pre-clinical or clinical stages of development. For
example, the Orphan Drug Act provides incentives, including grants, tax credits, and an additional period
of market exclusivity to encourage investment in treatments for rare diseases or conditions. Because new
medicines can improve the health of individuals and the population more broadly, the incentives for
9 According to the CMS Office of the Actuary, after 2018, the projected Part D costs are lower than those in the 2018 report. The difference is primarily attributable to higher rebates and slower overall drug price increases. (https://www.cms.gov/Research-Statistics-Data-and-Systems/Statistics-Trends-and-Reports/ReportsTrustFunds/Downloads/TR2019.pdf, p. 32).
-5%
0%
5%
10%
15%
20%
25%
30%
35%
40%
45%
50%
Pe
rce
nta
ge C
han
ge Medicaid
Medicare Part B
Medicare Part D
National Health Expenditures(NHE) Rx

Section 1: Introduction
May 2020 REPORT TO CONGRESS 10
innovation described above are important. At the same time, policy makers must balance these incentives
with assuring that the new medicines are affordable and reflect their value in terms of improving patient
health outcomes.
Congressional Request for this Drug Pricing Report
This is the third report on drug pricing that ASPE has prepared at the request of the Congress. The 2016
and 2019 reports are available on the ASPE website.10 The current report prepared in 2020 responds to
the request shown below:
“The Committee directs the Secretary of Health and Human Services to submit a report to the
Committees on Appropriations not later than 120 days after the date of enactment of this Act regarding
price changes of prescription drugs since 2008. The report should include comparative prescription drug
prices (net of rebates) paid by the following programs for the 10 most frequently prescribed drugs and
the 10 highest-cost drugs for each of the following: (1) The Medicare program under part B of title XVIII
of the Social Security Act; (2) The Medicare prescription drug program under part D of title XVIII of the
Social Security Act; (3) The Medicaid program under title XIX of the Social Security Act; and (4) The
Department of Veterans Affairs. The report should also provide a breakdown of the comparative prices
(net of rebates) for each of the 10 most frequently prescribed drugs and the 10 highest-cost drugs
between ambulatory settings and retail settings. In addition, the report should include total annual costs
due to prescription drugs to the Medicare program under part B of title XVIII of the Social Security Act,
the Medicare prescription drug program under part D of title XVIII of such Act, and the Medicaid program
under title XIX of such Act. Finally, the report should list the drugs that have been registered for sale by
the Food and Drug Administration (FDA) in the past five years that have benefited significantly from
government grants or research subsidies in either the pre-clinical or clinical stages of development, as
well as the price (net of rebates) and total spending in Medicare and Medicaid for each of those drugs.”11
10 ASPE, Report to Congress: Prescription Drugs: Innovation, Spending, and Patient Access, December 7, 2016, and ASPE, Report to Congress, Prescription Drug Pricing Report, August 6, 2019. These reports and other ASPE research on prescription drugs are available at https://aspe.hhs.gov/prescription-drugs. 11 Departments of Labor, Health and Human Services, and Education, and Related Agencies Appropriations Bill, 2020, Report of the Committee on Appropriations, House of Representatives, Report 116-62, May 15, 2019 (https://www.congress.gov/116/crpt/hrpt62/CRPT-116hrpt62.pdf), p. 133. The Further Consolidated Appropriations Act, including appropriations for the Department of Health and Human Services, became Public Law 116-94 upon its signature by President Trump on December 20, 2019.

May 2020 REPORT TO CONGRESS 11
Section 2. Medicare Part B
This section presents information about prescription drugs in Medicare Part B between 2006 and 2018. It
presents data pertaining to trends in overall spending for prescription drugs and the top 10 highest-cost
drugs and top 10 most frequently prescribed drugs in Medicare Part B. The data presented in this section
include only spending in fee-for-service Medicare Part B and exclude Medicare Advantage spending.
Program Overview
Medicare is a federal health insurance program created in 1965 for people ages 65 and older; it was
expanded in 1972 to cover people under age 65 with permanent disabilities or end-stage renal disease
(ESRD). Medicare Part B, also known as the Supplementary Medical Insurance (SMI) program, helps pay
for physician, outpatient, and preventive services as well as some home health services.
Part B is financed through a combination of general revenues, premiums paid by beneficiaries, interest,
and other sources. Premiums are automatically set to cover 25 percent of spending in the aggregate, while
general revenues subsidize 73 percent and the remaining 2 percent is financed through interest and other
sources. Higher-income beneficiaries pay a larger share of spending, ranging from 35 percent to 80
percent of Part B costs.12
Certain types of drugs including infusible and injectable drugs and biologics administered in physician
offices and hospital outpatient departments, as well as certain other drugs provided by pharmacies and
suppliers (for example, inhalation drugs and certain oral anticancer, oral antiemetic, and
immunosuppressive drugs), are covered by Part B.13 Providers purchase these Part B drugs and Medicare
payments are made directly to these providers.
Through the passage of the Medicare Prescription Drug, Improvement, and Modernization Act of 2003
(MMA)14, beginning in 2005 payments for Part B drugs generally are tied to health care providers’
acquisition costs by paying for a drug’s average sales price (ASP) plus a 6 percent add-on (106 percent of
ASP) as computed by CMS using quarterly sales price and volume of sales data.15 The Secretary was
provided discretion for drugs administered in hospital outpatient settings, to determine payment based
12 High-income beneficiaries have paid an income-related premium for Part B since 2007 and for Part D since 2011. 13 Steven Sheingold, Elena Marchetti-Bowick, Nguyen Nguyen, and Robin Yabroff, Medicare Part B Drugs: Pricing and Incentives, ASPE, March 8, 2016. Available from: https://aspe.hhs.gov/system/files/pdf/187581/PartBDrug.pdf 14 Medicare Prescription Drug, Improvement, and Modernization Act of 2003. 2003. retrieved from: https://www.congress.gov/108/plaws/publ173/PLAW-108publ173.pdf 15 Medicare payments on the claims data reflect the 2 percent reduction due to the sequester in effect during the period from April 2013 through September 2027. The sequestration reduces benefit payments by 2 percent from April 1, 2013 through March 31, 2027 and by 4 percent from April 1, 2027 through September 30, 2027. Under the sequester, Medicare payments to providers, but not beneficiary coinsurance payments, are reduced by 2 percent. After applying this payment reduction, the payment rate is effectively ASP+4.3%. (In other words, as the sequester applies to federal payment only (80 percent of total payment while beneficiaries still pay the full 20 percent copay), the effective federal payment under ASP+6% is reduced to (ASP+6%)*(1-(2%*80%)), or ASP+4.3%.

Section 2: Medicare Part B
May 2020 REPORT TO CONGRESS 12
on average acquisition costs or similarly to how payment is made in a physician’s office. The Secretary has
used ASP-based pricing for most Part B drugs provided in hospital outpatient departments since 2006.
Medicare Part B Spending and Spending Trends
Overall spending and spending trends
In Calendar Year (CY) 2018, total Medicare expenditures were $740.6 billion, of which $337.2 billion were
for total Part B benefits.16 The total fee-for-service Part B benefit was $201.5 billion after netting out
spending for Medicare Advantage and administrative expenses (Table 2-1).
Table 2-1 Medicare Fee-for-Service Part B Program Spending, 2006-201817
Total Part B Benefit Part B Drug Program
Year Spending
($B) Annual Growth Spending
($B) Annual Growth Part B Drugs' Share of
Part B Benefit
2006 134.4 - 10.1 - 7.5%
2007 137.5 2.3% 10.5 3.3% 7.6%
2008 132.2 -3.9% 10.8 3.7% 8.2%
2009 149.2 12.9% 11.5 6.5% 7.7%
2010 154.5 3.5% 12.3 6.8% 8.0%
2011 162.7 5.3% 13.7 11.3% 8.4%
2012 170.5 4.8% 15.2 10.7% 8.9%
2013 170.5 0.0% 16.2 6.8% 9.5%
2014 176.5 3.5% 17.2 6.2% 9.8%
2015 180.8 2.5% 19.0 10.2% 10.5%
2016 186.0 2.8% 21.8 14.6% 11.7%
2017 194.1 4.4% 24.3 11.3% 12.5%
2018 201.5 3.8% 26.6 9.7% 13.2% Average Annual 2006-18
3.4% 8.4%
Source: Total Part B benefit spending from Trustees Reports 2007-2019 (Table III.C1 for 2007-2011 and Table III. C4 for 2012-2019) netting out spending in Medicare Advantage (MA numbers provided by the Office of the CMS Office of the Actuary). The data presented in this table include only spending in fee-for-service Medicare Part B and exclude Medicare Advantage spending.
16 Table II.B1, p. 11. Medicare Trustees Report (2019). 2019 Annual Report Of The Boards Of Trustees Of The Federal Hospital Insurance And Federal Supplementary Medical Insurance Trust Funds. Retrieved from: https://www.cms.gov/Research-Statistics-Data-and-Systems/Statistics-Trends-and-Reports/ReportsTrustFunds/Downloads/TR2019.pdf 17 Medicare payments in the claims data reflect the 2 percent reduction due to the sequester in effect during the period from April 1, 2013 through September 30, 2030, except for the period from May 1, 2020 to December 31, 2020.

Section 2: Medicare Part B
May 2020 REPORT TO CONGRESS 13
As shown in Table 2-1, fee-for-service Part B drug program spending grew from $10.1 billion in 2006 to
$26.6 billion in 2018, representing an average annual growth rate of 8.4 percent.18 Comparatively, total
fee-for-service Part B benefit spending grew at 3.4 percent annually over the same period. Part B drug
spending has particularly increased since 2014, with annual average growth of 11.5 percent compared to
3.4 percent for total Part B benefit spending.
Table 2-2 shows that on a per fee-for-service enrollee basis, program spending on Part B drugs grew much
faster than spending on total Part B benefits. Per fee-for-service enrollee program spending for Part B
drugs grew 8.3 percent annually from 2006 to 2018, while per fee-for-service enrollee program spending
for total Part B benefits grew 3.3 percent (data not shown). Fee-for-service enrollment for Part B was flat
at about 33 million over the same period.
Table 2-2 Medicare Fee-for-Service Part B Program Spending per Enrollee for Drug Benefits,
2006-2018
Total Part B Benefit Part B Drug Program
Year Fee-for-Service Enrollees (M)
Spending per Enrollee ($)
Annual Growth
Payment per Enrollee ($)
Annual Growth
2006 33.1 4,111 - 306 -
2007 32.4 4,293 4.4% 322 5.3%
2008 32.0 4,296 0.1% 339 5.2%
2009 31.8 4,721 9.9% 363 7.0%
2010 32.2 4,779 1.2% 383 5.6%
2011 32.5 4,936 3.3% 422 10.1%
2012 32.9 5,089 3.1% 462 9.5%
2013 33.1 5,084 -0.1% 490 6.1%
2014 33.2 5,301 4.3% 520 6.0%
2015 33.3 5,434 2.5% 571 9.9%
2016 33.7 5,557 2.3% 647 13.1%
2017 33.6 5,783 4.1% 723 11.8%
2018 33.2 6,102 5.5% 800 10.7% Source: Total Part B benefit spending from Trustees Reports 2007-2019 (Table III.C1 for 2007-2011 and Table III.C4 for 2012-2019); Enrollment from Trustees Report 2019 Table V. B3. The data presented in this section include only spending in fee-for-service Medicare Part B and exclude Medicare Advantage spending.
18 Program spending excludes beneficiary liability and third party payments. Total FFS Part B spending (Medicare program, beneficiary liability and third party payments) grew from $12.7 B. in 2006 to $33.5 B. in 2018.

Section 2: Medicare Part B
May 2020 REPORT TO CONGRESS 14
Spending concentration for top ten drugs A relatively small number of Part B drugs account for a substantial share of the spending.19 Table 2-320
presents the top 10 drugs in terms of Medicare Part B drug program payment over the last ten years. For
brevity, we present only 2008, 2011, 2014, and 2018 here, with tables for all years included in Appendix
Table A-1. Concentrated spending for a relatively small number of drugs has been consistent for the past
decade with the top 10 highest-cost drugs accounting for 45 to 50 percent of total Part B spending on
drugs.
In 2018, the top 10 highest-cost drugs accounted for $12.2 billion in Part B payments (not including
beneficiary cost-sharing), or 46 percent of $26.6 billion in total Part B spending for all drugs. At nearly $2.1
billion in total Part B payments, aflibercept (Eylea) accounted for more spending than any other drug in
2018. Total Part B payments including beneficiary cost-sharing for aflibercept was $943 per unit in 2018,
or $10,703 per Medicare user (data not shown). We defined unit based on the Healthcare Common
Procedure Coding System (HCPCS) billing unit, which, in many cases, is the lowest dispensable amount or
the lowest denomination (e.g., one pill or a standardized volume for liquids) and may not be the common
dose.21 Pembrolizumab (Keytruda), which has historically been in the top ten list over the last decade,
accounts for the second most Medicare Part B payments with approximately $1.5 billion.
Table 2-4 presents the top 10 highest-cost prescribed drugs in Medicare Part B ranked by spending per
unit for 2011, 2014, and 2018, with all years 2011-2018 presented in Appendix Table A-2.
As displayed in Table 2-5, the top 10 most frequently prescribed drugs in Medicare Part B are relatively
inexpensive and typically account for less than 10 percent of total Part B drug spending. In 2018, spending
on the top 10 most frequently prescribed drugs was $2.2 billion, or 8 percent of $26.6 billion in total Part
B spending for all drugs. Aflibercept, the eighth most prescribed drug, accounted for $2.1 billion in Part B
spending. The remaining nine drugs each accounted for at most $18.2 million in spending and had average
per unit spending of $13 or less. Spending and pricing data for all years are included in Appendix Table A-
3.
19 Spending numbers presented are program spending, net of beneficiary cost sharing, and include the reduction of the sequester. The sequestration reduces benefit payments by 2 percent from April 1, 2013 through March 31, 2030, except for the period from May 1, 2020 to December 31, 2020. 20 The drug spending presented in Table 2-3 includes claims by critical access hospitals, Maryland hospitals and third party claims. Acumen analyzed the carrier, durable medical, and outpatient claims data 2006-2018 for ASPE. 21 Per the above example, a unit of aflibercept is 1mg, although the common dose for aflibercept is 2mg. On the claims data the unit is the MTUS_CNT.

Section 2: Medicare Part B
May 2020 REPORT TO CONGRESS 15
Table 2-3 Top 10 Highest-Cost Prescribed Drugs, Medicare Part B, Ranked by Program Spending 2008 2011
Rank Description
Spending per Unit
($)
Program Spending
($M) Description
Spending per Unit
($)
Program Spending
($M)
1 Rituximab cancer treatment (Rituxan)
516.94 918.7 Ranibizumab injection (Lucentis)
405.35 1,141.9
2 Bevacizumab injection (Avastin)
57.41 761.3 Rituximab injection (Rituxan)
611.65 1,098.3
3 Infliximab injection (Remicade)
55.85 647.8 Bevacizumab injection (Avastin)
60.45 817.4
4 Injection, pegfilgrastim 6mg (Neulasta)
2,208.74 634.3 Injection, pegfilgrastim 6mg (Neulasta)
2,643.26 808.4
5 Ranibizumab injection (Lucentis)
397.07 588.1 Infliximab injection (Remicade)
61.49 761.6
6 Darbepoetin alfa, non-esrd (Aranesp)
2.91 534.5 Oxaliplatin (Eloxatin) 9.42 398.0
7 Oxaliplatin (Eloxatin) 9.42 365.9 Pemetrexed injection (Alimta)
53.07 374.0
8 Epoetin alfa, non-esrd (Epogen/Procrit)
9.26 362.3 Darbepoetin alfa, non-esrd (Aranesp)
3.15 341.9
9 Docetaxel (Taxotere) 327.90 316.8 Trastuzumab injection (Herceptin)
70.60 327.2
10 Gemcitabine HCl ((Gemzar)
132.42 263.7 Docetaxel injection (Taxotere)
18.70 315.8
Medicare Part B Spending, Top 10 5,393.4 6,384.5 Medicare Part B Spending, All Drugs 10,843.8 13,733.3

Section 2: Medicare Part B
May 2020 REPORT TO CONGRESS 16
Table 2-3 Top 10 Highest-Cost Prescribed Drugs, Medicare Part B, Ranked by Total Spending (cont.)
2014 2018
Rank Description
Spending per Unit
($)
Program Spending
($M) Description
Spending per Unit
($)
Program Spending
($M)
1 Rituximab injection (Rituxan)
693.46 1,244.6 Aflibercept injection (Eylea)
942.72 2,051.4
2 Ranibizumab injection (Lucentis)
390.62 1,063.4 Inj pembrolizumab (Keytruda)
43.72 1,536.3
3 Aflibercept injection (Eylea)
964.46 1,036.1 Injection, nivolumab (Opdivo)
24.75 1,429.0
4 Injection, pegfilgrastim 6mg (Neulasta)
3,308.51 974.4 Rituximab injection (Rituxan)
819.28 1,414.5
5 Infliximab injection (Remicade)
71.72 965.6 Denosumab injection (Prolia)
17.06 1,163.6
6 Bevacizumab injection (Avastin)
65.17 880.3 Injection, pegfilgrastim 6mg (Neulasta)
4,181.28 1,138.9
7 Denosumab injection (Prolia)
14.30 629.8 Ranibizumab injection (Lucentis)
368.24 967.9
8 Trastuzumab injection (Herceptin)
80.78 464.0 Infliximab not biosimil (Remicade) 10mg
78.32 954.3
9 Pemetrexed injection (Alimta)
59.50 463.6 Bevacizumab injection (Avastin)
71.04 836.6
10 Bortezomib injection (Velcade)
45.54 387.3 Trastuzumab injection (Herceptin)
93.23 684.0
Medicare Part B Spending, Top 10 8,109.1 12,176.5 Medicare Part B Spending, All Drugs 17,240.2 26,602.5
Source: Analysis of carrier, durable medical, and outpatient claims data 2006-2018. Data include Part B covered drugs administered in physicians' offices and furnished by suppliers, covered drugs in hospital outpatient departments; and reflect only Part B drugs paid under the average sales price plus 6 percent (ASP) methodology. HCPCS codes and prices for carrier and DM were obtained from the CMS ASP file, those for OP come from the CMS Addendum B file. Lines with denied payments or Medicare as secondary payer were dropped. Spending per Unit includes beneficiary cost-sharing; Total Spending does not include beneficiary cost-sharing. Both measures include the sequester.

Section 2: Medicare Part B
May 2020 REPORT TO CONGRESS 17
Table 2-4 Top 10 Highest-Cost Prescribed Drugs, Medicare Part B, Ranked by Spending per Unit 2008 2011
Rank Description
Spending per Unit
($)
Program Spending
($M) Description
Spending per Unit
($)
Program Spending
($M)
1 Fluocinolone acetonide implt (Retisert)
19,195.39 2.4 Y90 ibritumomab, rx (Zevalin)
33,573.26 7.5
2 Ganciclovir long act implant
6,602.06 0.4 Sipuleucel-T (Provenge)*
32,848.53 97.9
3 Porfimer sodium (Photofrin)
2,494.71 0.8 I131 tositumomab, rx (Bexxar)
27,732.46 1.1
4 Gemtuzumab ozogamicin (Mylotarg)
2,438.37 2.6 Fluocinolone acetonide implt (Retisert)
16,162.45 1.4
5 Injection, pegfilgrastim 6mg (Neulasta)
2,208.74 634.3 Sm 153 lexidronam (Quadramet)
7,608.51 3.8
6 Pegaspargase /singl dose vial (Oncaspar)
2,094.39 0.2 Porfimer sodium injection (Photofrin)
5,254.63 0.8
7 Tenecteplase injection (TNKase)
1,968.37 4.6 Leuprolide acetate implant (Lupron)
4,378.09 0.3
8 Pentostatin injection (Nipent )
1,771.27 4.9 Ganciclovir long act implant
3,449.66 0.4
9 Inj melphalan hydrochl 50 MG (Evomela)
1,502.60 2.9 Vantas implant 2,960.96 13.8
10 Leuprolide acetate implant (Lupron)
1,434.62 4.8 Pegaspargase injection (Oncaspar)
2,683.49 0.2
Medicare Part B Spending, Top 10 657.9 127.0 Medicare Part B Spending, All Drugs 10,843.8 13,733.3

Section 2: Medicare Part B
May 2020 REPORT TO CONGRESS 18
Table 2-4 Top 10 Highest-Cost Prescribed Drugs, Medicare Part B, Ranked by Spending per Unit (cont.)
2014 2018
Rank Description
Spending per Unit
($)
Program Spending
($M) Description
Spending per Unit
($)
Program Spending
($M)
1 Y90 ibritumomab, rx (Zevalin)
42,297.49 7.2 Tisagenlecleucel car-pos t (Kymriah)
480,463.46 5.8
2 Sipuleucel-t auto cd54+ (Provenge)
33,841.80 146.6 Y90 ibritumomab, rx (Zevalin)
41,746.76 1.5
3 Porfimer sodium injection (Photofrin)
19,291.79 2.7 Sipuleucel-t auto cd54+ (Provenge)
39,392.47 157.1
4 Fluocinolone acetonide implt (Retisert)
19,140.58 1.7 Porfimer sodium injection (Photofrin)
18,263.00 2.1
5 Sm 153 lexidronam (Quadramet)
8,000.12 1.2 Fluocinolone acetonide implt Retisert)
17,815.65 0.2
6 Pegaspargase injection (Oncaspar)
5,952.34 1.0 Sm 153 lexidronam (Quadramet)
11,994.26 0.7
7 Centruroides immune f(ab) (Anascorp)
3,583.29 0.1 Pegaspargase injection (Oncaspar)
11,869.87 1.2
8 Injection, pegfilgrastim 6mg (Neulasta)
3,308.51 974.4 Choline c-11 5,209.25 9.5
9 Reteplase injection (Retavase)
2,978.94 0.0 Injection, pegfilgrastim 6mg (Neulasta)
4,187.28 1,138.9
10 Vantas implant 2,926.38 4.7 Centruroides immune f(ab) (Anascorp)
3,925.12 0.3
Medicare Part B Spending, Top 10 1,139.7 1,317.2 Medicare Part B Spending, All Drugs 17,240.2 26,602.5
* The current HCPCS code for Sipuleucel-T, Q2043, replaced the earlier C9273 code as of July 1, 2011. The 2011 listing for this drug shows spending per unit for Q2043, which accounts for the larger number of services in CY 2011, and total spending under both codes.
Source: Analysis of carrier, durable medical, and outpatient claims data 2008-2018. Data include Part B covered drugs administered in physicians' offices and furnished by suppliers, covered drugs in hospital outpatient departments; and reflect only Part B drugs paid under the average sales price plus 6 percent (ASP) methodology. HCPCS codes and prices for carrier and DM were obtained from the CMS ASP file, those for OP come from the CMS Addendum B file. Lines with denied payments or Medicare as secondary payer were dropped. Spending per Unit includes beneficiary cost-sharing; Total Spending does not include beneficiary cost-sharing. Both measures include the sequester.

Section 2: Medicare Part B
May 2020 REPORT TO CONGRESS 19
Table 2-5 Top 10 Most Frequently Prescribed Drugs, Medicare Part B, Ranked by Total Number of Services
2008 2011
Rank Description
Spending per Unit
($)
Program Spending
($M) Description
Spending per Unit
($)
Program Spending
($M)
1 Vitamin b12 injection (Cobal-1000, Cobolin-M)
0.29 0.6 Vitamin b12 injection (Cobal-1000, Cobolin-M)
0.35 0.7
2 Dexamethasone sodium phos (Hexadrol)
0.09 1.5 Triamcinolone acet inj NOS (Kenalog)
1.62 13.0
3 Ondansetron hcl injection (Zofran)
0.43 5.4 Dexamethasone sodium phos (Hexadrol)
0.09 1.4
4 Triamcinolone acetonide inj (Kenalog)
1.44 10.0 Albuterol non-comp unit 0.06 21.2
5 Albuterol ipratrop non-comp (Duoneb)
0.66 121.6 Albuterol ipratrop non-comp (Duoneb)
0.24 34.5
6 Normal saline solution infus
0.28 0.6 Methylprednisolone 40 MG inj (Medrol)
2.76 5.1
7 Methylprednisolone 40 MG inj (Medrol)
4.41 7.7 Methylprednisolone 80 MG inj (Depo Medrol)
6.91 9.0
8 Epoetin alfa, non-esrd (Epogen/Procrit)
9.26 362.3 Normal saline solution infus
0.28 0.4
9 Albuterol non-comp unit
0.04 12.5 LOCM 300-399mg/ml iodine,1ml
0.17 12.0
10 Methylprednisolone 80 MG inj (Depo Medrol)
8.56 10.8 Epoetin alfa, non-esrd (Epogen/Procrit)
9.96 278.1
Medicare Part B Spending, Top 10 533.0
375.4
Medicare Part B Spending, All Drugs 10,843.8 13,733.3

Section 2: Medicare Part B
May 2020 REPORT TO CONGRESS 20
Table 2-5 Top 10 Most Frequently Prescribed Drugs, Medicare Part B, Ranked by Total Number of Services (cont.)
2014 2018
Rank Description
Spending per Unit
($)
Program Spending
($M) Description
Spending per Unit
($)
Program Spending
($M)
1 Triamcinolone acet inj nos (Kenalog)
1.75 14.8 Triamcinolone acet inj nos (Kenalog)
1.79 18.2
2 Dexamethasone sodium phos (Hexadrol)
0.13 2.0 Dexamethasone sodium phos (Hexadrol)
0.12 1.7
3 Vitamin b12 injection (Cobal-1000)
2.02 3.4 Vitamin b12 injection (Cobal-1000)
1.93 3.2
4 Methylprednisolone 40 mg inj (Medrol)
2.95 6.0 Methylprednisolone 40 mg inj (Medrol)
6.60 13.7
5 Albuterol non-comp unit
0.05 13.4 Albuterol non-comp unit 0.05 9.0
6 Albuterol ipratrop non-comp (Duoneb)
0.18 20.0 Albuterol ipratrop non-comp (Duoneb)
0.13 12.8
7 Methylprednisolone 80 mg inj (Depo Medrol)
5.63 7.4 Methylprednisolone 80 mg inj (Depo Medrol)
12.79 15.3
8 Locm 300-399mg/ml iodine,1ml
0.18 12.4 Aflibercept injection (Eylea)
942.72 2,051.4
9 Betamethasone acet&sod phosp (Celestone Soluspan)
5.59 11.1 Locm 300-399mg/ml iodine,1ml
0.12 8.8
10 Ceftriaxone sodium injection (Rocephin)
0.69 2.0 Betamethasone acet&sod phosp (Celestone Soluspan)
7.03 15.6
Medicare Part B Spending, Top 10 92.5 2,149.7 Medicare Part B Spending, All Drugs 17,240.2 26,602.5
Source: Analysis of carrier, durable medical, and outpatient claims data 2006-2018. Data include Part B covered drugs administered in physicians' offices and furnished by suppliers, covered drugs in hospital outpatient departments; and reflect only Part B drugs paid under the average sales price plus 6 percent (ASP) methodology. HCPCS codes and prices for carrier and DM were obtained from the CMS ASP file, those for OP come from the CMS Addendum B file. Lines with denied payments or Medicare as secondary payer were dropped. Spending per Unit includes beneficiary cost-sharing; Total Spending does not include beneficiary cost-sharing. Both measures include the sequester.
Data and Methods
The Medicare claims data used in the analyses of spending and trends in spending include Part B22 covered
drugs administered in physicians’ offices and furnished by suppliers (carrier and durable medical
equipment (DME) claims files) and covered drugs in hospital outpatient departments (outpatient claims
files) from 2006 to 2018. Many of the analyses start with calendar year 2006 because it is the first year
that most hospital outpatient departments were paid using the ASP methodology.
22 Part B drugs that are separately paid, i.e., neither bundled nor paid under a bundled system.

Section 2: Medicare Part B
May 2020 REPORT TO CONGRESS 21
Medicare Part B drugs are identified by the HCPCS codes in the claims data. Analyses are restricted to Part
B drugs paid under the methodology described in section 1847A of the Social Security Act.23 As a result,
the analyses exclude vaccines; blood products with P* codes (but include blood clotting with J & Q codes);
claims in the DME file with an AWP flag24; and enteral and parenteral drugs that have B* codes.
Claims with HCPCS codes that represent ESRD25 drugs as well as claims with HCPCS codes that do not
represent drugs were dropped from the analyses. Codes and prices for carrier and DME were obtained
from the CMS ASP files, while those for hospital outpatient departments come from the CMS Addendum
B files. Claim lines with denied payments or Medicare as secondary payer were dropped from the
analyses. Medicare payments include Medicare program payments and beneficiary cost sharing, and
include the effects of the budget sequestration beginning in 2013, which reduced Medicare spending rates
by a fixed 2 percent per year.26
The top 10 highest cost drugs and top 10 most frequently prescribed drugs present average spending per
billing unit. We define unit based on the combination of HCPCS unit per beneficiary per date, which, in
many cases, is the lower of the lowest dispensable amount or the lowest denomination (e.g., one pill or a
standardized volume for liquids) and may not be the common dose.27
23 Typically, this means ASP, but may also include WAC- or AMP-based payments. WAC-based payment occurs in limited situations, such as when a drug is new. AMP-based payment occurs infrequently when ASP exceeds AMP by a threshold percentage and other safeguards are met. The pricing files do not always indicate which source is used for a payment amount. 24 Claims in the durable medical equipment (DME) file with an AWP flag include infusion drugs which previously appeared in the ASP Drug Pricing Files. This indicator was not maintained in the ASP Drug Pricing files and its use has been discontinued (because of the change in DME infusion payment resulting from the Cures Act). 25 ESRD drugs were mostly bundled into the ESRD facility composite rates by 2014. 26 The budget sequestration in 2013 refers to the automatic spending cuts to United States federal government spending in particular categories of outlays that were initially set to begin on January 1, 2013, as an austerity fiscal policy as a result of Budget Control Act of 2011 (BCA), and were postponed by two months by the American Taxpayer Relief Act of 2012 until March 1 when this law went into effect, with the first reductions to Medicare payment as of April 1, 2013.The cuts are split evenly (by dollar amounts, not by percentages) between the defense and non-defense categories. Some major programs such as Social Security, Medicaid, federal pensions and veteran's benefits are exempt. By a special provision in the BCA, Medicare spending rates were reduced by a fixed 2 percent per year. That is providers and health insurance plans will be paid 98 cents on the dollar under Medicare for the entire period April 1, 2013 to September 30, 2030, with the exception of the period from May 1, 2020 to December 31, 2020. As the sequester applies to federal payment only (80 percent of total payment while beneficiaries still pay the full 20 percent copay), the effective federal payment under ASP+6% is (ASP+6%)*(1-(2%*80%)), or ASP+4.3%. 27 An example where the billing unit is lower than the dispensable amount is bevacizumab. This drug is available in 100mg and 400mg vials, so the lowest dispensable amount (without pharmacy/outsourcer repackaging) is 100mg. The lowest denomination is 10mg, hence the HCPCS billing unit is 10mg. Payment in Oct 2017 was about $75 per 10mg, and Medicare’s share was about $60; these figures correspond to the unit being equal to the HCPCS code descriptor amount.

May 2020 REPORT TO CONGRESS 22
Section 3. Medicare Part D
This section presents information about prescription drugs in Medicare Part D between 2006 and 2018.
Specifically, in response to the information requested by the House Committee on Appropriations, this
section presents data pertaining to trends in overall spending for prescription drugs and the top 10
highest-cost drugs and top 10 most frequently prescribed drugs in Medicare Part D.28
For many of the analyses contained in this chapter, measures of drug spending are constructed from Part
D Prescription Drug Event (PDE) records to include payments to the pharmacy by the Part D plan sponsor
and the beneficiary’s out-of-pocket liability. These measures are referred to as gross drug costs (GDC). In
some cases we estimate Medicare program spending for Part D, which differs from gross drug costs to the
extent that rebates and other price concessions affect plan premiums but are not reflected in prices paid
at the pharmacy.29
Program Overview
The Medicare Modernization Act of 2003 (MMA) authorized Medicare Part D as a voluntary drug benefit
for Medicare beneficiaries, and the Part D program was implemented in January 2006. Private plans
compete for enrollees by providing and managing the drug benefit.30 Each enrollee in either Part A or Part
B is also entitled to enroll in a Part D prescription drug plan. In addition, some Medicare Advantage plans
also cover the Part D benefit. These plans are known as MA-PDs. Similar to Part B, enrollment in Part D is
voluntary and the enrollee pays a monthly premium.31 In 2018, total enrollment in Medicare was 59.9
million, of which enrollment in Part D was 45.8 million (equivalent to 76 percent).32 Enrollees in Part D
pay a monthly premium, in addition to cost sharing and typically costs up to a deductible for their drugs.
Low-income beneficiaries (LIS) pay lower or no premiums, cost sharing, or deductibles. Under Part D,
private plan sponsors submit annual premium bids for providing the benefit. Medicare subsidizes 74.5
28 Rebate data at the drug level are considered proprietary data and therefore not available for this report. 29 Total Government payment is estimated as the sum of Premium Subsidies (PG), Reinsurance (RI), Low-Income Premium Subsidies (LIPS), and Low-Income Cost Sharing (LICS), with the government paying 74.5% of premiums and beneficiaries paying 25.5%. 30 The Medicare Part D drug benefit is administered through private prescription drug plans, which each separately design and manage benefits and pay claims. Private prescription drug plans use purchasing arrangements and utilization management, including negotiation of prices with manufacturers and pharmacies, formularies, step therapy, quantity limitations, and prior authorization. All formularies must include all (with specified exceptions) drugs in the immunosuppressant, antidepressant, antipsychotic, anticonvulsant, antiretroviral, and antineoplastic classes to ensure patient access to these protected classes of drugs. The current exceptions include that the formulary does not have to include all therapeutic equivalents (i.e., generics) and can use safety edits to limit quantities (see 42 CFR 423.120(b)(2)(vi)). 31 High-income beneficiaries have paid an income-related premium for Part B since 2007 and for Part D since 2011. 32 Medicare Trustees Report 2019 Table II.B.1. Medicare Trustees Report (2019). 2019 Annual Report Of The Boards Of Trustees Of The Federal Hospital Insurance And Federal Supplementary Medical Insurance Trust Funds. Retrieved from: https://www.cms.gov/Research-Statistics-Data-and-Systems/Statistics-Trends-and-Reports/ReportsTrustFunds/Downloads/TR2019.pdf

Section 3:Medicare Part D
May 2020 REPORT TO CONGRESS 23
percent of the national average premium and provides additional assistance for premiums and out-of-
pocket costs to LIS beneficiaries. In CY 2018, total Medicare expenditures were $740.6 billion, of which
$95.2 billion (or 13 percent) was for the Part D benefit.33
Medicare Part D Program Spending and Program Spending Trends
Medicare Part D program spending per enrollee34 rose about 2.5 percent annually between CY 2006 to CY
2018.35 In recent years, program spending per enrollee grew from $1,782 per enrollee in 2013 to $2,312
per enrollee in 2016, before decreasing to $2,080 in 2018 (Figure 3-1). As the number of enrollees
increased about 3.4 percent annually, total spending increased 6.0 percent annually from 2006 to 2018
(Table 3-1).
Figure 3-1 Medicare Part D Total Program Spending per Enrollee and Per User, 2006-2018
Source: Spending and Enrollment from Trustees Report 2019, Tables III. D3 and V.B3; Users from Acumen analysis of claims data for ASPE.
33 Medicare Trustees Report 2019, Table II.B1. Medicare expenditures reflect program payment for the benefits net of rebates plus administrative expenses. 34 Federal spending (Medicare Part D net program spending) is based on a percent of premiums which in turn reflect the rebates plans expect to receive. Federal spending is estimated as the sum of Premium Subsidies, Reinsurance, Low-Income Premium Subsidies, Low-Income Cost Sharing, and risk corridor payments. CMS pays plans a monthly prospective payment for each enrollee (the direct subsidy). This payment is first adjusted by the enrollee’s case mix and other subsidy factors, namely low-income status and longterm institutionalized status. A second adjustment to the plan’s approved bid is the subtraction of the enrollee’s premium. (See the following section on how premiums are calculated.) CMS also provides plans with interim prospective payment adjustments for individual reinsurance and low-income subsidies. The agency reconciles actual levels of enrollment, risk factors, levels of incurred allowable drug costs (after rebates and other discounts), reinsurance amounts, and low-income subsidies after the end of each year. 35 Annual compound growth rate of total program spending per enrollee and enrollment growth computed from United States Centers for Medicare & Medicaid Services. Medicare Trustees Reports, 2019. Part D total spending from Table III.D3 and Part D enrollment from Table V.B3.
1,551 1,583
1,513
1,8071,786
1,878
1,7861,782
1,928
2,1482,312
2,248 2,0802,105 2,083
1,950
2,293
2,2572,305
2,1391,986
2,103
2,308 2,465
2,377
2,187
1,500
1,600
1,700
1,800
1,900
2,000
2,100
2,200
2,300
2,400
2,500
2006 2007 2008 2009 2010 2011 2012 2013 2014 2015 2016 2017 2018
Tota
l sp
end
ing
per
per
son
($
)
Year
Total D Spending per Enrollee ($) Total D Spending per User ($)

Section 3:Medicare Part D
May 2020 REPORT TO CONGRESS 24
In 2018, total program spending was estimated to be $95.2 billion, while net benefit spending was $94.7
billion (Table 3-1). The difference reflects federal administrative costs. Given that the total drug cost
obtained from the 2018 claims data was over $167.6 billion (Table 3-2); this implies that Medicare
spending ($95.2 billion) was about 57 percent of the gross drug cost in 2018. This difference reflects
primarily rebates and beneficiary cost sharing, and to a lesser extent administrative cost and profits of
plan sponsors, low-income subsidies, net risk corridor payment, coverage gap discount, and the timing of
reconciliation payments, among other factors.
Table 3-1 Medicare Part D Total Program Spending and Benefit Spending, 2006-2018
Total Part D Enrollees (M)
Part D Total Program Spending ($B)
Part D Benefits Spending ($B)
Year Enrollment
(M) Annual Growth Spending ($B)
Annual Growth
Spending ($B)
Annual Growth
2006 30.6 47.4 47.1
2007 31.4 2.7% 49.7 4.9% 48.8 3.6%
2008 32.6 3.8% 49.3 -0.8% 49.0 0.4%
2009 33.6 3.2% 60.8 23.3% 60.5 23.5%
2010 34.8 3.4% 62.1 2.1% 61.7 2.0%
2011 35.7 2.7% 67.1 8.1% 66.7 8.1%
2012 37.4 4.8% 66.9 -0.3% 66.5 -0.3%
2013 39.1 4.4% 69.7 4.2% 69.3 4.2%
2014 40.5 3.6% 78.1 12.1% 77.7 12.1%
2015 41.8 3.2% 89.8 15.0% 89.5 15.2%
2016 43.2 3.4% 99.9 11.2% 99.5 11.2%
2017 44.5 2.9% 100.0 0.1% 100.1 0.6%
2018 45.8 2.9% 95.2 -4.8% 94.7 -5.4%
Average Annual 2006-18 3.4% 6.0% 6.0%
Source: Spending and Enrollment from Trustees Report 2019, Tables III. D3 and V. B3
The decline in total Part D program spending from $100.0 billion in 2017 to $95.2 billion in 2018 took the
form of the 3.5 percentage point increase in rebates, which grew from 21.9 percent to 25.0 percent.36
Because rebates are not passed onto consumers at the point of sale, they mainly affect premiums and
plan bids, and hence program spending.
Medicare Part D Gross Drug Costs and Costs Trends
In CY 2018, total gross drug costs (GDC) for the Medicare Part D drugs are estimated to be $167.6 billion
(Table 3-2).37 This reflects a 8.7 percent increase from the previous year’s $154.2 billion in GDC. In recent
years, the growth in GDC has slowed from its peak in 2013 through 2015, when GDC exhibited double
digit growth each year. The higher rates of growth in 2013 to 2015 in total GDC were primarily the result
36 Medicare Trustees 2020, Table IV.B8, p. 142. 37 Estimate based on Medicare Part D events (PDE) 2007-18 files by Acumen for ASPE

Section 3:Medicare Part D
May 2020 REPORT TO CONGRESS 25
of increases in both utilization (number of users, claims, and days) and unit cost (per user, per script, and
per day) driven in large part because of spending for drugs used to treat hepatitis C and even faster growth
in prices for existing brand-name drugs.38
Table 3-2 Medicare Part D Prescription Gross Drug Costs (GDC): 2007-2018
Total Gross Drug Cost Users Drug Cost Per User
Year Gross Drug Cost ($B)
Annual Growth Users (M)
Annual Growth Cost per User ($)
Annual Growth
2007 $61.9 - 23.9 - $2,594 -
2008 $68.2 10.2% 25.3 5.9% $2,699 4.1%
2009 $73.5 7.8% 26.5 4.9% $2,773 2.7%
2010 $77.4 5.3% 27.5 3.8% $2,813 1.5%
2011 $84.6 9.3% 29.1 5.8% $2,908 3.4%
2012 $89.5 5.8% 31.3 7.5% $2,862 -1.6%
2013 $103.3 15.4% 35.1 12.2% $2,944 2.9%
2014 $121.0 17.1% 37.1 5.8% $3,258 10.7%
2015 $136.8 13.1% 38.9 4.7% $3,517 8.0%
2016 $145.4 6.3% 40.5 4.2% $3,589 2.0%
2017 $154.2 6.0% 42.1 3.8% $3,666 2.2%
2018 $167.6 8.7% 43.5 3.5% $3,851 5.0%
Average Annual
2007-18 9.5% 5.6% 3.7%
2007-12 7.7% 5.6% 2.0%
2012-18 11.0% 5.7% 5.1%
Source: Analysis of Medicare Part D Events data 2007-2018 by Acumen for HHS/ASPE.
Over the entire 2007-18 period, total gross drug cost increased by 9.5 percent annually, while Medicare
benefit spending (net of rebates and cost-sharing) grew at 6.2 percent over the same period (data not
shown). The divergence likely reflects the growth in manufacturer rebates over time.39 Moreover, the
period from 2007 to 2018 encompasses two sub-periods: the period from 2007 to 2012 saw increasing
entry of generic drugs into the market, while the subsequent period from 2013 to 2018 experienced the
arrivals of expensive drugs such as the hepatitis C and specialty drugs. As shown in Table 3-2, although
the annual average growth of GDC over the whole 2007-18 period was 9.5 percent, the annual rate during
2007-12 was 7.7 percent, increasing to 11.0 percent during 2012 to 2018.
Top 10 Drugs by Total Spending and by Number of Claims
Over the last 10 years, the top 10 highest-cost drugs in Part D account for approximately 20 percent of
total Part D GDC. Table 3-3 presents the top 10 drugs in term of Medicare Part D GDC over the last ten
38 IQVIA Institute for Human Data Science. Medicine use and spending in the U.S.: a review of 2017 and outlook to 2022. Parsippany (NJ): IQVIA Institute for Human Data Science; 2018 Apr. 39 Medicare Trustees Report 2019, Table IV.B8.

Section 3:Medicare Part D
May 2020 REPORT TO CONGRESS 26
years. For brevity, we present only 2008, 2011, 2014, and 2018 here, with tables for all years included in
Appendix Table A-4.
In 2018, the top 10 highest-cost drugs accounted for $29.4 billion in Part D GDC, or 17.5 percent of $167.6
billion in total Part D GDC. At $5 billion in Medicare Part D GDC, Eliquis, used to treat and prevent blood
clots and to prevent stroke, accounted for more spending than any other drug in 2018. Medicare Part D
GDCs for Eliquis was $7 per unit40 in 2018. Table A-4 shows that the GDC per user for Eliquis was $3,031
in 2018; GDC per user for the second highest-cost drug, Revlimid (used in chemotherapy), was $103,031.
Medicare beneficiaries using these high cost drugs face high patient liabilities despite the catastrophic
coverage provisions of Part D. More detailed spending and pricing data for the top highest-cost drugs for
all years are included in Appendix Table A-4.
Table 3-4 presents the top 10 highest-cost prescribed drugs in Medicare Part D ranked by spending per
unit for 2008, 2011, 2014, and 2018 with all years 2008-2018 presented in Appendix Table A-5. Gattex,
used to treat short bowel syndrome, topped the list for 2018 at $38,596.
As shown in Table 3-5, the top 10 most frequently prescribed drugs in Medicare Part D (as calculated by
number of claims), are relatively inexpensive and typically account for less than 10 percent of total Part D
GDC. In 2018, spending on the top 10 most frequently prescribed drugs was $4.3 billion, or 2.6 percent of
$167.6 billion in total Part D GDC. Spending and pricing data for all years are included in Appendix Table
A-6.
40 A unit here refers to a quantity dispensed in the PDE data. A unit refers to the lowest dispensable amount (e.g. one pill or a standardized volume for liquids).

Section 3:Medicare Part D
May 2020 REPORT TO CONGRESS 27
Table 3-3 Top 10 Highest-Cost Drugs, Medicare Part D, Ranked by Total Spending 2008 2011
Rank Drug Name GDC Per Unit ($) GDC ($M) Drug Name
GDC Per Unit ($) GDC ($M)
1 Lipitor 2.96 2,397.8 Plavix 6.18 3,656.7 2 Plavix 3.83 2,305.1 Lipitor 4.58 2,672.9 3 Nexium 4.73 1,487.0 Seroquel 7.36 2,045.3 4 Seroquel 4.84 1,462.2 Nexium 5.89 1,970.1 5 Aricept 5.18 1,326.1 Advair Diskus 3.81 1,664.9 6 Zyprexa 12.69 1,229.0 Zyprexa 19.87 1,625.3 7 Advair Diskus 2.95 1,213.3 Abilify 19.22 1,469.6 8 Actos 4.90 1,063.0 Crestor 4.44 1,416.3 9 Prevacid 4.58 947.2 Actos 7.11 1,294.1 10 Abilify 14.43 837.1 Spiriva 7.48 1,288.4 Medicare Part D GDC, Top 10 14,267.8 19,103.6
Medicare Part D GDC, All Drugs 68,223.6 84,639.2
2014 2018
Rank Drug Name GDC Per Unit ($) GDC ($M) Drug Name
GDC Per Unit ($) GDC ($M)
1 Sovaldi 1,016.87 3,102.2 Eliquis 7.00 4,992.2 2 Nexium 7.82 2,658.3 Revlimid 697.35 4,065.1 3 Crestor 6.07 2,541.2 Xarelto 13.97 3,358.8 4 Abilify 28.98 2,524.9 Januvia 14.24 3,228.9 5 Advair Diskus 4.95 2,273.8 Lyrica 7.55 2,950.2 6 Spiriva 9.43 2,156.2 Advair Diskus 6.71 2,394.0 7 Lantus
Solostar 21.74 2,014.7 Humira Pen 2,457.82 2,388.8
8 Januvia 9.67 1,773.8 Lantus Solostar
26.54 2,370.5
9 Lantus 21.52 1,724.2 Imbruvica 303.62 1,867.2 10 Revlimid 450.97 1,670.5 Symbicort 31.63 1,751.2 Medicare Part D GDC, Top 10 22,439.8 29,366.8
Medicare Part D GDC, All Drugs 121,001.4 167,628.6
Source: Analysis of Medicare claims data (carrier, outpatient) and Part D prescription drug event records by Acumen for ASPE.

Section 3:Medicare Part D
May 2020 REPORT TO CONGRESS 28
Table 3-4 Top 10 Highest-Cost Drugs, Medicare Part D, Ranked by Spending per Unit 2008 2011
Rank Drug Name GDC Per Unit ($) GDC ($M) Drug Name
GDC Per Unit ($) GDC ($M)
1 Somatuline Depot 7,747.93 0.3 Lucentis 38,985.58 1.1 2 Arcalyst 5,198.06 1.1 Ilaris 16,278.40 0.8 3 Viadur 4,905.50 0.1 Stelara 10,736.42 31.7 4 Vantas 4,738.90 0.5 Somatuline Depot 8,474.58 3.5 5 H.P. Acthar 4,547.26 6.9 Neulasta 5,952.62 28.3 6 Neulasta 3,399.84 19.5 Mozobil 5,703.27 1.1 7 Fabrazyme 3,220.60 1.4 Sylatron 4-Pack 5,585.66 0.1 8 Herceptin 2,728.76 2.3 Jevtana 5,528.20 1.2 9 Sandostatin Lar 2,468.81 14.2 H.P. Acthar 5,303.69 49.5 10 Panhematin 2,403.41 0.3 Arcalyst 5,178.90 2.5 Medicare Part D GDC, Top 10 46.7 119.8 Medicare Part D GDC, All Drugs 68,223.6 84,639.2
2014 2018
Rank Drug Name GDC Per Unit ($) GDC ($M) Drug Name
GDC Per Unit ($) GDC ($M)
1 Eylea 38,360.36 2.9 Gattex 38,586.16 240.9 2 Lucentis 36,665.31 2.7 Eylea 38,477.57 16.6 3 Gattex 28,077.72 46.7 Lucentis 32,482.75 3.1 4 Ilaris 16,381.65 4.1 Spinraza 26,339.53 8.0 5 Stelara 14,608.29 156.9 Krystexxa 20,919.48 23.9 6 Somatuline Depot 12,083.85 10.2 Stelara 20,571.11 582.6 7 Krystexxa 7,744.50 0.8 Besponsa 19,307.95 1.8 8 Neulasta 7,384.42 57.8 Lemtrada 18,722.10 4.7 9 H.P. Acthar 6,497.68 391.1 Somatuline Depot 17,743.60 29.9 10 Jevtana 6,017.94 1.7 Ilaris 16,465.32 11.3 Medicare Part D GDC, Top 10 674.7 922.8 Medicare Part D GDC, All Drugs 121,001.4 167,628.6
Source: Analysis of Medicare claims data (carrier, outpatient) and Part D prescription drug event records by Acumen for ASPE.

Section 3:Medicare Part D
May 2020 REPORT TO CONGRESS 29
Table 3-5 Top 10 Most Frequently Prescribed Drugs, Medicare Part D, Ranked by Number of Claims
2008 2011
Rank Drug Name GDC Per Unit ($) GDC ($M) Drug Name
GDC Per Unit ($) GDC ($M)
1 Lisinopril 0.25 345.0 Simvastatin 0.31 594.3
2 Simvastatin 0.57 694.1 Lisinopril 0.19 322.3
3 Furosemide 0.11 131.8 Hydrocodone-Acetaminophen
0.18 430.1
4 Hydrocodone-Acetaminophen
0.18 312.5 Amlodipine Besylate 0.30 383.1
5 Levothyroxine Sodium 0.24 207.8 Omeprazole 0.51 674.7
6 Amlodipine Besylate 0.45 401.5 Levothyroxine Sodium
0.22 256.5
7 Lipitor 2.96 2,397.8 Furosemide 0.11 133.5 8 Omeprazole 0.85 695.6 Metformin HCl 0.12 214.4
9 Hydrochlorothiazide 0.12 94.1 Metoprolol Tartrate 0.09 126.1
10 Atenolol 0.11 111.7 Hydrochlorothiazide 0.12 95.2
Medicare Part D GDC, Top 10 5,391.9 3,230.2 Medicare Part D GDC, All Drugs 68,223.6 84,639.2
2014 2018
Rank Drug Name GDC Per Unit ($) GDC ($M) Drug Name
GDC Per Unit ($) GDC ($M)
1 Lisinopril 0.13 281.4 Atorvastatin Calcium 0.27 881.1 2 Levothyroxine Sodium 0.34 631.5 Amlodipine Besylate 0.11 287.1 3 Amlodipine Besylate 0.16 303.6 Levothyroxine
Sodium 0.35 828.1
4 Simvastatin 0.19 346.5 Lisinopril 0.10 264.8 5 Hydrocodone-
Acetaminophen 0.27 676.2 Gabapentin 0.15 579.7
6 Omeprazole 0.29 527.6 Omeprazole 0.21 388.9 7 Atorvastatin Calcium 0.44 747.2 Furosemide 0.10 145.1 8 Furosemide 0.10 135.6 Losartan Potassium 0.14 244.5 9 Metformin HCl 0.08 203.8 Metformin HCl 0.06 189.8 10 Gabapentin 0.19 491.2 Hydrocodone-
Acetaminophen 0.29 529.4
Medicare Part D GDC, Top 10 4,344.5 4,338.5 Medicare Part D GDC, All Drugs 121,001.4 167,628.6
Source: Analysis of Medicare claims data (carrier, outpatient) and Part D prescription drug event records by Acumen for ASPE.
Section 3:Medicare Part D
May 2020 REPORT TO CONGRESS 30
Data and Methods
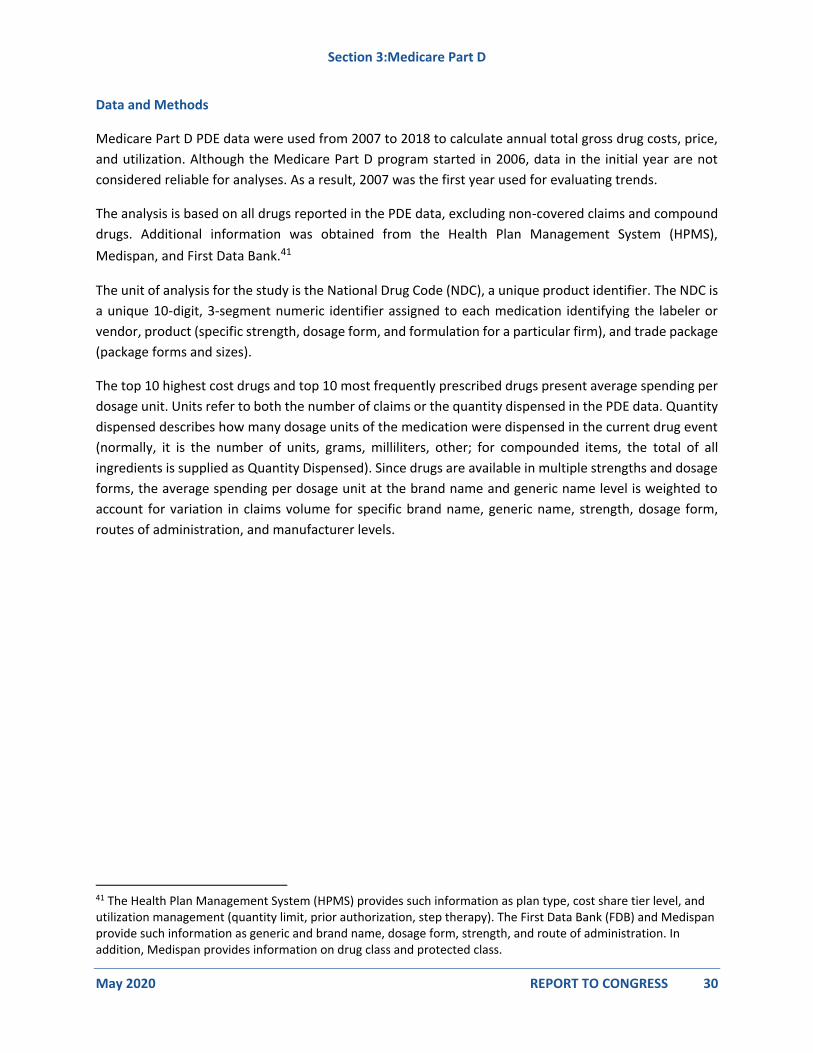
Medicare Part D PDE data were used from 2007 to 2018 to calculate annual total gross drug costs, price,
and utilization. Although the Medicare Part D program started in 2006, data in the initial year are not
considered reliable for analyses. As a result, 2007 was the first year used for evaluating trends.
The analysis is based on all drugs reported in the PDE data, excluding non-covered claims and compound
drugs. Additional information was obtained from the Health Plan Management System (HPMS),
Medispan, and First Data Bank.41
The unit of analysis for the study is the National Drug Code (NDC), a unique product identifier. The NDC is
a unique 10-digit, 3-segment numeric identifier assigned to each medication identifying the labeler or
vendor, product (specific strength, dosage form, and formulation for a particular firm), and trade package
(package forms and sizes).
The top 10 highest cost drugs and top 10 most frequently prescribed drugs present average spending per
dosage unit. Units refer to both the number of claims or the quantity dispensed in the PDE data. Quantity
dispensed describes how many dosage units of the medication were dispensed in the current drug event
(normally, it is the number of units, grams, milliliters, other; for compounded items, the total of all
ingredients is supplied as Quantity Dispensed). Since drugs are available in multiple strengths and dosage
forms, the average spending per dosage unit at the brand name and generic name level is weighted to
account for variation in claims volume for specific brand name, generic name, strength, dosage form,
routes of administration, and manufacturer levels.
41 The Health Plan Management System (HPMS) provides such information as plan type, cost share tier level, and utilization management (quantity limit, prior authorization, step therapy). The First Data Bank (FDB) and Medispan provide such information as generic and brand name, dosage form, strength, and route of administration. In addition, Medispan provides information on drug class and protected class.

Section 4: Medicaid
May 2020 REPORT TO CONGRESS 31
Section 4. Medicaid
This section presents information about prescription drugs in Medicaid between 2006 and 2018. It
presents data pertaining to trends in overall spending for prescription drugs and the top 10 highest-cost
drugs and top 10 most frequently prescribed drugs in Medicaid.
Program Overview
Medicaid, created alongside Medicare in 1965, provides comprehensive health coverage, including
prescription drug benefits, to low-income and disabled individuals and families. Unlike Medicare,
Medicaid is administered by states in accord with federal statutes and regulations. Financial responsibility
for Medicaid is apportioned between the federal government and the states according to the applicable
Federal Medical Assistance Percentage (FMAP). Although prescription drug coverage is legally an optional
rather than a mandatory Medicaid benefit, all states and the District of Columbia have elected to provide
this coverage.
About 64 million people were enrolled in Medicaid as of December 2019.42 Most enrollees receive services
under some form of managed care.43 States can carve prescription drugs out of managed care but fewer
do so since the Affordable Care Act (ACA) extended Medicaid prescription drug rebates to cover Managed
Care Organizations (MCOs) as well as Fee for Service (FFS) utilization, allowing states to receive full rebates
under either type of utilization.
About half of the gross cost of Medicaid prescription drugs comes back to the federal government and
the states through rebates. Since the Omnibus Budget Reconciliation Act of 1990, manufacturers have
been required to provide rebates on prescription drugs as a condition of state Medicaid coverage for their
products. For single source/innovator multiple source (brand name) drugs, rebate amounts are based on
the greater of a percentage of the Average Manufacturer Price (AMP) or the difference between AMP and
the “best price” available to other purchasers.44 Additional rebates that apply when the cost of a branded
drug increases faster than inflation now account for about half of total rebate amounts on these drugs.45
42 Centers for Medicare & Medicaid Services [CMS]. December 2019 Medicaid & CHIP Enrollment Data Highlights. https://www.medicaid.gov/medicaid/program-information/medicaid-and-chip-enrollment-data/report-highlights/index.html. 43 Centers for Medicare & Medicaid Services [CMS]. Medicaid Managed Care Enrollment and Program Characteristics, 2017 Winter 2019. Available at https://www.medicaid.gov/medicaid/managed-care/downloads/enrollment/2017-medicaid-managed-care-enrollment-report.pdf. 44 “Best price” is defined at section 1927(c)(1)(C) of the Social Security Act, and 42 CFR 447.505. Exclusions from the prices used in this calculation include the prices charged to Medicare Part D Plans and to the Veterans Health Administration. 45 U.S. Department of Health and Human Services, Office of Inspector General. Medicaid rebates for brand-name drugs exceeded Part D rebates by a substantial margin. Publication number OEI-03-00650. April 2015. Available at http://oig.hhs.gov/oei/reports/oei-03-13-00650.pdf.

Section 4: Medicaid
May 2020 REPORT TO CONGRESS 32
The Bipartisan Budget Act of 2015 (Public Law 114-74) amended the Social Security Act to provide for the
payment of additional inflation-based rebates for non-innovator multiple source drugs (generic drugs).
The ACA made several important changes to Medicaid prescription drug rebates. The minimum rebate
percentage for single source/innovator multiple source (brand name) drugs was raised from 15.1 percent
to 23.1 percent of AMP for most drugs, with a lower rate of 17.1 percent for blood clotting factors and
drugs approved by the FDA exclusively for pediatric indications. The minimum rebate percentage for non-
innovator (generic) drugs was increased from 11.0 to 13.0 percent of AMP. A line extension of a single
source drug or an innovator multiple source drug that is an oral dosage was made subject to an additional
penalty that discourages manufacturers from making trivial changes to avoid inflation rebates.46 The ACA
also provided for a maximum rebate amount (or cap) with respect to each dosage form and strength of a
brand drug for a rebate period (basic plus additional inflation-based) at 100 percent of AMP; this
maximum rebate amount or cap applies to rebates for generic drugs (basic plus additional inflation-based)
as well.
Medicaid Spending and Spending Trends
Overall spending and spending trends
Medicaid gross spending on prescription drugs in CY 2018 totaled $66.4 billion (Table 4-1). However,
nearly half of that spending came back to the federal government and the states as rebates. Table 4-1
shows estimates of Medicaid prescription drug gross and net spending. In 2014, the combination of new,
expensive drugs for hepatitis C and other conditions, price increases in existing drugs, a relatively low
number of patent expirations, and increased enrollment due to Medicaid expansion under the ACA
increased gross prescription drug spending by 21.6 percent to $47.3 billion.47 From CYs 2006 to 2018,
Medicaid gross spending on prescription drugs grew from $13.0 billion to $66.4 billion with a compounded
average annual growth rate of 14.8 percent.
The Medicaid Drug Rebate Program discussed above, however, substantially reduced spending in all years,
and pushed net spending below half of gross spending in 2016 and 2017. The additional rebate based on
inflation, in particular, meant net Medicaid prices decreased as list prices for many drugs increased rapidly
during this period. Due to the expansion of rebates based on inflation, the compounded average annual
growth for net spending, 4.8 percent, was much lower than the gross growth rate over this period. The
CMS Office of the Actuary identifies lower spending on hepatitis C drugs as a factor in the particularly
46 Line extension is defined in statute at section 1927(c)(2)(C) of the Social Security Act to mean, with respect to a drug, a new formulation of the drug, such as an extended release formulation, but does not include an abuse-deterrent formulation of the drug (as determined by the Secretary), regardless of whether such abuse-deterrent formulation is an extended release formulation. 47 See the analysis of the jump in net spending between 2013 and 2014 in ASPE, Report to Congress: Prescription Drugs: Innovation, Spending, and Patient Access, December 7, 2016 (https://delauro.house.gov/sites/delauro.house.gov/files/Prescription-Drugs-Innovation-Spending-and-Patient-Access-12-07-16.pdf), p. 73.

Section 4: Medicaid
May 2020 REPORT TO CONGRESS 33
small 1.4 percent rate of increase in net spending between 2017 and 2018.48 On a per capita basis, which
adjusts for the growth in Medicaid enrollment over this period, net spending grew only 0.8 percent per
year between 2006 and 2018.
Table 4-1 Medicaid Prescription Drug Gross and Net Spending, 2006-2018
Year
Total Gross
Medicaid Spending
($B) Annual Growth
Total Net Medicaid Spending
($B) Annual Growth
2006 13.0 - 19.1 -
2007 16.7 28.5% 18.3 -4.1%
2008 24.7 47.5% 19.2 4.9%
2009 26.0 5.6% 20.3 5.8%
2010 33.0 26.8% 20.4 0.4%
2011 37.7 14.2% 21.0 2.6%
2012 37.8 0.2% 21.4 2.3%
2013 38.9 3.0% 22.1 2.9%
2014 47.3 21.6% 27.3 23.9%
2015 57.8 22.2% 30.5 11.6%
2016 64.5 11.5% 32.0 5.0%
2017 67.6 4.9% 32.9 2.7%
2018 66.4 -1.7% 33.4 1.4%
Average Annual 2006-18 14.6% 4.8%
Sources: Gross Spending: 2006-2012 Lewin analysis of Medicaid State Drug Utilization public-use data, 2013-2018 Centers for Medicare & Medicaid Services analysis of national Medicaid drug utilization data. Medicaid data for years before 2010 does not include spending by Managed Care Organizations and may be subject to data errors. Net Spending: National Health Expenditure Accounts, Historical Data (https://www.cms.gov/files/zip/nhe-tables.zip), Table 16.
Spending concentration for top ten drugs
Table 4-2 presents the top 10 drugs in term of Medicaid drug program spending over the last ten years.
For brevity, we present only 2008, 2011, 2014, and 2018 here, with tables for all years from 2008 to 2018
included in Appendix Table A-7. In 2008, the top 10 highest-cost drugs accounted for $5.5 billion in
Medicaid spending, or 22 percent of $24.7 billion in Medicaid spending for all drugs. Comparatively, in
2018, the top 10 highest-cost drugs accounted for $9.2 billion in Medicaid spending, or 14 percent of
$66.4 billion in Medicaid spending for all drugs. At $1.4 billion in Medicaid spending, Humira Pen, used to
treat rheumatoid arthritis and other chronic conditions, accounted for more spending than any other drug
48 Sean P. Keehan, Gigi A. Cuckler, John A. Poisal, Andrea M. Sisko, Sheila D. Smith, Andrew J. Madison, Kathryn E. Rennie, Jacqueline A. Fiore, and James C. Hardesty, National Health Expenditure Projections, 2019–28: Expected Rebound In Prices Drives RisingSpending Growth, Health Affairs 39, no. 4 (2020), p. 712. Mavyret, approved and launched for hepatitis C in 2017, reached third in total Medicaid prescription drug spending in 2018 at an average price per unit of $239.60. The competing hepatitis C medications, Harvoni and Epclusa, at respective 2018 unit prices of $1,086,43 and $876.81, fell from second and fifth in 2017 to thirty-eighth and sixteenth in 2018.

Section 4: Medicaid
May 2020 REPORT TO CONGRESS 34
in 2018. Medicaid gross spending for the Humira Pen was $2,222.53 per unit in 2018. A unit refers to the
lowest dispensable amount (e.g. one pill or a standardized volume for liquids). Prior to the release of a
lower-cost generic in mid-2015, the psychotropic drug Abilify was one of the highest-cost drugs in
Medicaid, with $2.4 billion in spending in 2014.
Table 4-3 shows the top 10 drugs by gross unit cost in 2014 and 2018.49 The competing macular
degeneration drugs Eylea and Lucentis topped the list in 2014, but Compath, used to treat both leukemia
and multiple sclerosis, was highest in 2018, with an average price of $31,788.87. Spending and pricing
data for 2013-2018 are included in Appendix Table A-8. Because Medicaid volume for the highest unit cost
drugs is typically low, the top 10 accounted for less than 1 percent of total Medicaid gross spending in all
the years shown.
As shown in Table 4-4, the top 10 most frequently prescribed drugs in Medicaid (as calculated by number
of claims) are relatively inexpensive and typically account for less than 5 percent of total Medicaid drug
spending. In 2018, spending on the top 10 most frequently prescribed drugs was $1.4 billion, or 2% of
$66.4 billion in total Medicaid spending for all drugs. The antibiotic Amoxicillin was the most prescribed
drug in 2015, 2016, 2017, and 2018. Hydrocodone-Acetaminophen, number one in 2014 and 2015,
dropped thereafter and is no longer in the top ten. This change likely reflects government responses to
the opioid crisis, including the adoption of quantity limits and prior authorization requirements by state
Medicaid agencies, the Drug Enforcement Administration’s rescheduling of hydrocodone combination
products, and the adoption of opioid prescribing guidelines developed by the Centers for Disease Control
and Prevention.50 Spending and pricing data for 2008-2018 are included in Appendix Table A-9.
49 Data on the top 10 drugs by gross unit cost for 2006-2012 are not reliable and are not shown in this Report. 50 Shefali Luthra, “Hoping to attack opioid epidemic at its source, state Medicaid programs are limiting prescriptions, STAT News, November 23, 2016 (https://www.statnews.com/2016/11/23/medicaid-opioid-limits/); Raji MA, Kuo Y‐F, Adhikari D, Baillargeon J, Goodwin JS. Decline in opioid prescribing after federal rescheduling of hydrocodone products. Pharmacoepidemiol Drug Saf. 2018;27:513–519. https://doi.org/10.1002/pds.4376; Amy S.B. Bohnert, Gery P. Guy Jr., and Jan L. Losby, Opioid Prescribing in the United States Before and After the Centers for Disease Control and Prevention's 2016 Opioid Guideline, Annals of Internal Medicine Vol. 169, No. 6, September 18, 2018.

Section 4: Medicaid
May 2020 REPORT TO CONGRESS 35
Table 4-2 Top 10 High-Cost Prescribed Drugs, Medicaid, Ranked by Total Spending
2008 2011
Rank Generic Drug Name Spending per Unit Total Spending
Generic Drug Name
Spending per Unit Total Spending
1 Quetiapine Fumarate
$5.59 $962,610,903 Aripiprazole $16.92 $1,667,289,509
2 Aripiprazole $12.98 $864,665,984 Quetiapine
Fumarate
$8.47 $1,618,779,336
3 Olanzapine $14.00 $655,125,344 Olanzapine $20.49 $983,556,014
4 Risperidone $5.54 $624,080,668 Montelukast
Sodium
$4.65 $892,903,221
5 Montelukast
Sodium
$3.46 $452,731,574 Methylphenidate
HCL
$4.09 $709,352,216
6 Palivizumab $1,603.26 $440,111,778 Fluticasone/
Salmeterol
$4.14 $640,832,463
7 Lansoprazole $4.80 $396,513,136 Esomeprazole Mag
Trihydrate
$5.82 $573,215,157
8 Fluticasone/
Salmeterol
$3.38 $372,878,837 Emtricitabine/
Tenofovir
$35.81 $455,304,078
9 Esomeprazole Mag
Trihydrate
$5.00 $351,395,745 Albuterol Sulfate $3.10 $453,110,973
10 Topiramate $3.79 $335,536,619 Efavirenz/Emtricib
/Tenofovir
$55.06 $443,793,760
Medicaid Spending, Top 10 $5,455,650,587
$8,438,136,726
Medicaid Spending, All Drugs $24,655,613,645 $37,679,593,904
2014 2018
Rank Generic Drug Name Spending per Unit Total Spending
Generic Drug Name
Spending per Unit
Total Spending
1 Abilify $27.88 $2,346,179,601 Humira Pen $2,222.53 $1,386,718,665
2 Sovaldi $1,013.21 $1,370,816,701 Latuda $40.59 $1,244,564,745
3 Atorvastatin Calcium
$8.58 $1,137,100,298 Mavyret $239.60 $1,021,288,242
4 Truvada $43.54 $638,258,728 Vyvanse $9.46 $1,015,172,563
5 Vyvanse $6.74 $582,714,805 Genvoya $86.63 $911,876,985
6 Lantus $21.49 $570,672,682 Invega Sustenna $1,577.04 $869,025,167
7 Atripla $68.57 $566,065,841 Suboxone $7.85 $788,866,456
8 Methylphenidate ER $4.98 $547,943,220 Lyrica $7.07 $767,025,790
9 Advair Diskus $4.97 $519,066,484 Triumeq $83.32 $602,684,956
10 Lantus Solostar $22.51 $442,768,093 Flovent HFA $18.71 $584,499,258
Medicaid Spending, Top 10 $9,007,086,936
$9,191,722,827
Medicaid Spending, All Drugs $47,308,056,863 $66,427,744,266
Source: 2006-2012 Lewin analysis of Medicaid State Drug Utilization public-use data, 2013-2018 Centers for Medicare & Medicaid Services analysis of national Medicaid drug utilization data.

Section 4: Medicaid
May 2020 REPORT TO CONGRESS 36
Table 4-3 Top 10 High-Cost Prescribed Drugs, Medicaid, Ranked by Unit Cost 2014 2018
Rank Generic Drug Name Spending per Unit Total Spending
Generic Drug Name
Spending per Unit
Total Spending
1 Eylea $31,551.35 $23,343,424 Campath $31,788.87 $267,026
2 Lucentis $25,981.67 $41,433,582 Supprelin La $30,480.93 $22,574,174
3 Supprelin La $17,762.59 $12,646,967 Eylea $29,531.34 $168,289,609
4 Ilaris $16,091.56 $16,749,878 Brineura $26,503.70 $795,111
5 Stelara $15,037.77 $51,719,138 Lucentis $21,484.19 $53,075,737
6 Jetrea $14,755.80 $212,484 Xofigo $18,746.35 $2,154,405
7 Somatuline Depot $11,530.85 $2,172,294 Retisert $17,441.25 $197,470
8 Marqibo $7,202.00 $151,242 Stelara $17,274.02 $334,701,308
9 Jevtana $6,978.23 $3,339,192 Spinraza $17,241.35 $223,505,259
10 Panhematin $6,467.93 $3,465,737 Krystexxa $15,948.96 $9,102,868
Medicaid Spending, Top 10 $155,233,938 $814,662,969
Medicaid Spending, All Drugs $47,308,056,863 $66,427,744,266
Source: Centers for Medicare & Medicaid Services analysis of national Medicaid drug utilization data.

Section 4: Medicaid
May 2020 REPORT TO CONGRESS 37
Table 4-4 Top 10 Most Frequently Prescribed Drugs, Medicaid, Ranked by Number of Claims 2008 2011
Rank Generic Drug Name Spending per Unit Total Spending Generic Drug Name
Spending per Unit Total Spending
1 Hydrocodone bit/Acetaminophen
$0.23 $112,492,086 Hydrocodone bit/Acetaminophen
$0.20 $185,851,039
2 Amoxicillin $0.09 $64,329,996 Amoxicillin $0.09 $127,704,574
3 Ibuprofen $0.09 $49,200,240 Ibuprofen $0.09 $82,215,957
4 Azithromycin $2.40 $145,355,482 Albuterol Sulfate $3.10 $453,110,973
5 Alprazolam $0.13 $39,489,546 Azithromycin $1.47 $182,600,085
6 Clonazepam $0.20 $51,623,548 Alprazolam $0.12 $59,014,244
7 Lorazepam $0.27 $57,573,711 Loratadine $0.16 $54,014,819
8 Montelukast sodium $3.46 $452,731,574 Clonazepam $0.13 $53,746,692
9 Aspirin $0.09 $14,808,907 Lisinopril $0.19 $43,334,762
10 Loratadine $0.24 $44,987,853 Montelukast sodium
$4.65 $892,903,221
Medicaid Spending, Top 10 $1,032,592,942
$2,134,496,367
Medicaid Spending, All Drugs $24,655,613,645 $37,679,593,904
2014 2018
Rank Generic Drug Name Spending per Unit Total Spending Generic Drug Name
Spending per Unit Total Spending
1 Hydrocodone-Acetaminophen
$0.30 $219,659,896 Amoxicillin $0.13 $97,170,954
2 Amoxicillin $0.13 $91,646,982 Gabapentin $0.14 $182,622,489
3 Ibuprofen $0.12 $70,387,995 Ibuprofen $0.11 $83,378,906
4 Omeprazole $0.30 $98,303,694 Atorvastatin Calcium
$0.26 $114,085,012
5 Lisinopril $0.14 $42,780,167 Lisinopril $0.13 $55,164,969
6 Gabapentin $0.21 $149,205,210 Omeprazole $0.19 $73,039,418
7 Azithromycin $1.68 $110,672,172 Ventolin HFA $2.81 $522,020,935
8 Metformin HCl $0.10 $43,208,354 Fluticasone Propionate
$0.67 $104,298,341
9 Levothyroxine Sodium
$0.38 $83,162,384 Levothyroxine Sodium
$0.40 $124,542,600
10 Fluticasone Propionate
$1.04 $109,336,321 Amlodipine Besylate
$0.15 $50,590,301
Medicaid Spending, Top 10 $1,019,709,357 $1,406,913,925
Medicaid Spending, All Drugs $47,308,056,863 $66,427,744,266
Source: 2006-2012 Lewin analysis of Medicaid State Drug Utilization public-use data, 2013-2018 Centers for Medicare & Medicaid Services analysis of Medicaid State Drug Utilization public-use data.

Section 4: Medicaid
May 2020 REPORT TO CONGRESS 38
Data and Methods
Gross spending amounts for 2006-2012 in Table 4-1 are based on Lewin analysis of the public-use
Medicaid State Drug Utilization Data.51 Gross spending amounts for 2013-2018 in Table 4-1 are based on
CMS analysis of national Medicaid drug utilization data, which excludes claims for over-the-counter drugs
covered by Medicaid. Net spending amounts are CMS estimates from the National Health Expenditure
Accounts, as released in 2019.52 Both gross and net totals combine federal and state reimbursement and
include any applicable dispensing fees. Annual prescription drug spending as shown is not adjusted for
inflation.
Data for 2006-2012 in Tables 4-2 and 4-4 and Appendix Tables A-7 and A-9 are based on Lewin analysis of
the public-use Medicaid State Drug Utilization Data. Data for 2013 in Tables 4-2, 4-3, and 4-4 and Appendix
Tables A-7, A-8, and A-9 are based on CMS analysis of national Medicaid drug utilization data, which
excludes claims for over-the-counter drugs covered by Medicaid and NDCs with fewer than 50 claims in
2016 or 2017. Data for 2014 to 2018 in Tables 4-2, 4-3, and 4-4 and Appendix Tables A-7, A-8, and A-9 are
from the CMS Medicaid Drug Spending Dashboard, which excludes claims for over-the-counter drugs
covered by Medicaid and NDCs with fewer than 11 claims in 2018.53 Spending per unit and total spending
in these tables combine federal and state reimbursement, include any applicable dispensing fees, and are
not adjusted for Medicaid rebates or inflation. Data on the top 10 drugs by gross unit cost for 2006-2012
are not reliable and are not shown in this Report.
The top 10 highest cost drugs, top 10 most frequently prescribed drugs, and top 10 drugs by unit cost
present average spending per dosage unit. Units refer to the drug unit in the lowest dispensable amount.
Since drugs are available in multiple strengths and dosage forms, the average spending per dosage unit at
the brand name and generic name level is weighted to account for variation in claims volume for specific
brand name, generic name, strength, dosage form, routes of administration, and manufacturer levels. The
overall brand name/generic name claim weighted spending per unit is calculated by first summarizing
each drug to specific strength, form, route of administration, and manufacture levels. For each unique
level, spending is divided by the number of units and multiplied by its proportion of total claims, so that
claims volume becomes the weight. The claim-weighted average spending per dosage unit at the overall
brand name/generic name level is then calculated by summarizing across the strength, form, route, and
manufacturer levels. We use number of claims to identify the “most frequently prescribed drugs” as more
directly related to the Congressional request than number of units. Number of scripts (including
prescriptions that were never filled) is not available from the Medicaid drug data discussed above.
51 https://www.medicaid.gov/medicaid/prescription-drugs/state-drug-utilization-data/index.html. 52 https://www.cms.gov/Research-Statistics-Data-and-Systems/Statistics-Trends-and-Reports/NationalHealthExpendData/NationalHealthAccountsHistorical, Table 16. 53 https://www.cms.gov/Research-Statistics-Data-and-Systems/Statistics-Trends-and-Reports/Information-on-Prescription-Drugs/Medicaid. Additional information on the Medicaid Drug Spending Dashboard methodology is available at https://www.cms.gov/files/zip/medicaid-drug-spending-dataset-2018.zip.

May 2020 REPORT TO CONGRESS 39
Section 5. Drugs Benefiting from Government Grants or Research Subsidies
Congress requested that HHS identify prescription drug products recently approved by the Food and Drug
Administration (FDA) whose development “benefited significantly from government grants or research
subsidies in either the pre-clinical or clinical stages of development.” There is some empirical evidence
which suggests that in virtually all cases, new drug products approved for sale in recent years involved
research and development activity that was based at least in part on advances in basic medical science
that were made possible by public funding. Additional research finds the public sector’s role in late-stage
drug development is substantive and growing.
The mission of the National Institutes of Health (NIH) is to improve human health by conducting and
supporting research in the causes, diagnosis, prevention, and cure of diseases. Basic science research
funded by NIH identifies mechanisms of disease and describes biological processes, highlighting potential
drug targets that offer the promise of valuable new strategies for therapy. Knowledge gleaned from such
research is often described as a “public good” available to all parties for use. Private markets are known
to underproduce public goods such as basic scientific knowledge because private investments in their
development yield economic benefits that cannot be held solely for private use, so such investments are
not profitable; that dilemma provides the rationale for public funding of basic science.
In a typical case of new commercial drug development, private investments in research on the safety and
efficacy of specific drug compounds are based directly or indirectly on insights into basic science
knowledge made possible by public funding. Private firms have strong incentives to conduct applied
research into the development of new drug therapies because patent protection confers time-limited
exclusive sales rights, allowing drugmakers to earn potentially-high rates of return on investments in new
product development. Those high rates of return are necessary to induce investments in pharmaceutical
R&D given the high capital costs of such investments and the fact that such investments are made in the
face of scientific uncertainty as to a compound’s clinical value. Of the many compounds that are studied
by innovative drugmakers, the overwhelming majority fail to reach FDA approval and marketing by the
sponsor. Even when a drug is approved and marketed, the drugmaker sees no revenue for years after the
initial investment decision, so there are high opportunity costs for investment capital during the research
stage.
A recent analysis addresses the question of how public funding has contributed to the development of
new prescription drug products in recent years.54 The authors examine every one of the 210 new
molecular entities (NMEs)—essentially, new drugs that contain active ingredients not previously
54 Ekaterina Galkina Cleary, Jennifer M. Beierlein, Navleen Surjit Khanuja, Laura M. McNamee, and Fred D. Ledley, “Contribution of NIH funding to new drug approvals 2010–2016,” Proceedings of the National Academy of Sciences of the United States of America (PNAS) 115 (10):2329-2334, March 6, 2018 (www.pnas.org/cgi/doi/10.1073/pnas.1715368115).

Section 5: Drugs Benefiting from Government Grants or Research Subsidies
May 2020 REPORT TO CONGRESS 40
approved—which were approved for marketing by the FDA from 2010 to 2016. In an extensive analysis of
published medical literature related to those drugs as well as a thorough review of government data on
NIH-funded research projects, the authors find that “NIH funding contributed to every one of the NMEs
approved from 2010–2016 and was focused primarily on the drug targets rather than on the NMEs
themselves” and that the contribution of public funding “primarily involved funding for research related
to molecular targets for new drugs and likely represents basic research.” These findings are consistent
with the idea that publicly-funded basic science enables subsequent private research efforts which focus
on applications of basic science with viable commercial prospects.
In some cases, the development of a newly-approved drug might benefit from public research funding in
ways that go beyond basic science. Current research suggests the public sector contributed to late-stage
(intellectual contributions to patentable or nearly patentable discoveries) drug development in 25% of
the NMEs approved for marketing by the FDA from 2008 to 2017.55 This represents expansion of the role
of the public sector in late-stage drug development over the last four decades. The study also found that
publicly funded NMEs were more likely to win first in class designations or expedited approval from the
FDA, which suggests they were more innovative and/or targeted at high priority areas than NMEs without
late-stage federal support. This research makes clear that the federal government contributes throughout
the drug development life cycle from basic science to late-stage development for some drugs. It appears
safe to conclude that all or nearly all new drugs have at least some history of public funding in their
development.
The Committee requested a list of all drugs approved for sale in the past five years that involved public
funding. Below (Table 5-1) is a list of all drugs approved during the five-year period for which data are
currently available, 2014 through 2018. This list does not correspond exactly to the set of drugs examined
in the study mentioned above, but because that study examined all new NMEs from 2010 to 2016, there
will be considerable overlap in the two sets of drugs. Because all NMEs examined in that study had at least
some history of public funding, it appears highly likely that a similar conclusion would be drawn in a full
analysis of more-recent drug approvals. Table 5-1 also presents 2018 total and per unit spending in
Medicare Part D and Medicaid where available for each prescription drug. Because Medicare Part B drug
claims are aggregated to the HCPCS level, which may include multiple drugs, we are unable to include
Medicare Part B spending for individual drugs.
55 Rahul K. Nayak, Jerry Avorn, and Aaron S. Kesselheim, “Public sector financial support for late stage discovery of new drugs in the United States: cohort study,” BMJ 367, October 23, 2019 (www.bmj.com/content/367/bmj.l5766).

Section 5: Drugs Benefiting from Government Grants or Research Subsidies
May 2020 REPORT TO CONGRESS 41
Table 5-1 Prescription Drugs Approved for Sale by the Food and Drug Administration from 2014
to 2018, and 2018 Spending by Program Where Applicable
Medicare Part D Medicaid
Brand Name Total Spending in
2018 Spending per Unit in 2018
Total Spending in 2018
Spending per Unit in 2018
Year of FDA Approval
Addyi $41,549 $25.18 2015
Adlyxin $63,298 $99.67 $392,411 $91.45 2016
Aemcolo 2018
Aimovig† $18,649,849 $580.55 $6,627,123 $555.47 2018
Ajovy $1,033,232 $389.02 $592,821 $377.47 2018
Akynzeo†† $683,619 $540.84 $545,852 $488.15 2018
Alecensa $64,635,717 $61.63 $21,802,495 $57.28 2015
Aliqopa $227,530 $4,740.20 $194,775 $888.84 2017
Alunbrig $12,363,134 $412.22 $3,078,369 $350.60 2017
Annovera 2018
Anthim 2016
Aristada† $112,794,326 $768.85 $105,685,626 $700.85 2015
Asparlas 2018
Austedo $136,444,846 $74.40 $26,710,878 $70.86 2017
Avycaz $5,336,535 $20.89 $2,472,173 $300.05 2015
Axumin 2016
Bavencio $498,626 $161.89 $541,597 $117.36 2017
Baxdela* $1,854,812 $71.01 $348,801 $70.08 2017
Beleodaq $454,016 $1,860.72 $567,514 $63.85 2014
Belsomra $79,276,233 $11.37 $13,784,298 $10.74 2014
Benznidazole $4,117 $3.02 2017
Besponsa $1,814,947 $19,307.95 $1,418,496 $13,998.36 2017
Bevyxxa $17,577 $15.32 2017
Biktarvy $298,283,826 $99.31 $255,322,319 $90.13 2018
Blincyto $342,468 $3,913.97 $11,738,710 $4,295.81 2014
Bridion $1,661,946 $32.56 2015
Brineura $795,111 $26,503.70 2017
Briviact* $47,036,508 $17.74 $40,185,295 $15.70 2016
Calquence $33,476,152 $238.13 $1,611,934 $211.54 2017
Cerdelga $17,945,890 $445.71 $5,660,228 $394.83 2014
Cholbam $14,149,417 $491.12 2015
Cinqair $831,764 $90.30 $1,952,467 $66.23 2016
Copiktra $560,852 $213.09 2018
Corlanor $17,086,854 $7.20 $6,258,873 $6.79 2015
Cosentyx*† $369,998,623 $2,374.98 $185,417,237 $2,143.57 2015
Cotellic $5,508,835 $114.19 $1,420,441 $108.22 2015
Cresemba* $29,129,856 $88.35 $10,805,883 $102.03 2015
Crysvita $8,893,740 $7,292.72 2018
Cyramza $1,373,285 $115.16 $19,662,621 $107.91 2014
Daklinza $6,816,373 $770.39 $1,201,293 $742.88 2015
Dalvance $2,677,242 $180.90 $4,232,011 $1,273.77 2014
Darzalex $11,263,942 $103.81 $32,231,423 $89.70 2015
Daurismo 2018

Section 5: Drugs Benefiting from Government Grants or Research Subsidies
May 2020 REPORT TO CONGRESS 42
Medicare Part D Medicaid
Brand Name Total Spending in
2018 Spending per Unit in 2018
Total Spending in 2018
Spending per Unit in 2018
Year of FDA Approval
Defitelio 2016
Diacomit 2018
Doptelet $3,160,143 $937.73 $1,059,872 $917.64 2018
Dupixent $101,803,038 $736.25 $59,745,272 $651.61 2017
Elzonris 2018
Emflaza $3,523,041 $218.12 $38,554,778 $177.70 2017
Emgality $789,937 $583.41 $301,623 $534 2018
Empliciti $3,295,275 $2,173.74 $3,570,577 $1,662.17 2015
Entresto $476,575,743 $7.75 $58,455,328 $7.21 2015
Entyvio $23,881,087 $1,521.28 $75,794,058 $3,195.80 2014
Epclusa $896,454,303 $877.14 $492,571,226 $838.81 2016
Epidiolex $540,463 $12.58 $868,378 $12.28 2018
Erleada $87,331,270 $93.22 $1,436,714 $85.54 2018
Esbriet $571,407,728 $51.10 $16,605,881 $48.14 2014
Eucrisa $13,021,342 $10.38 $52,936,360 $9.75 2016
Exondys 51 $11,489,143 $773.91 $102,230,228 $796.41 2016
Farxiga $356,573,700 $15.41 $51,919,110 $14.67 2014
Farydak $7,893,633 $1,391.29 $687,490 $1,180.81 2015
Fasenra $14,770,062 $4,829.97 $10,888,968 $3,706.85 2017
Firdapse 2018
Galafold $1,324,671 $1,785.27 2018
Gamifant 2018
Genvoya $871,858,538 $99.45 $911,876,985 $86.63 2015
Giapreza 2017
Harvoni $1,726,263,039 $1,131.37 $312,969,804 $1,064.83 2014
Hemlibra $53,442,022 $10,350.40 2017
Hetlioz $90,316,946 $498.07 $14,469,959 $484.27 2014
Ibrance $1,507,730,890 $552.83 $277,989,209 $511.30 2015
Idhifa $42,806,444 $843.52 $3,119,701 $746.59 2017
Ilumya $493,778 $13,345.36 $228,800 $13,458.79 2018
Imfinzi $4,764,486 $361.44 $14,461,559 $82.92 2017
Impavido $640,215 $601.71 2014
Ingrezza $308,166,322 $207.17 $77,034,537 $194.95 2017
Jardiance $668,459,356 $15.42 $201,621,840 $14.24 2014
Jublia $35,473,372 $145.15 $3,431,269 $123.53 2014
Kanuma $9,291,378 $1,301.31 2015
Kengreal 2015
Kerydin $9,670,613 $149.12 $744,868 $121.87 2014
Kevzara $18,531,349 $1,389.37 $4,717,483 $1,129.95 2017
Keytruda $26,485,846 $1,184.20 $216,287,017 $1,064.62 2014
Kisqali*† $73,575,412 $202.37 $21,573,104 $191.59 2017
Krintafel 2018
Kybella 2015
Lartruvo $1,072,688 $49.51 $9,831,971 $50.90 2016
Lenvima $138,354,129 $317.59 $17,777,596 $2,158.14 2015
Libtayo $102,976 $1,225.90 2018

Section 5: Drugs Benefiting from Government Grants or Research Subsidies
May 2020 REPORT TO CONGRESS 43
Medicare Part D Medicaid
Brand Name Total Spending in
2018 Spending per Unit in 2018
Total Spending in 2018
Spending per Unit in 2018
Year of FDA Approval
Lokelma 2018
Lonsurf $74,896,393 $194.04 $19,864,398 $185.89 2015
Lorbrena $723,896 $459.64 $245,878 $446.98 2018
Lucemyra $793,089 $21.05 $717,636 $20.63 2018
Lumason 2014
Lumoxiti 2018
Lutathera 2018
Lynparza $119,106,528 $111.69 $26,861,000 $104.54 2014
Macrilen 2017
Mavyret $461,337,391 $160.16 $1,021,288,242 $239.60 2017
Mektovi $6,594,533 $61.83 $795,373 $59.05 2018
Mepsevii $2,358,201 $375.81 2017
Motegrity 2018
Movantik $86,783,013 $11.65 $18,369,040 $10.18 2014
Moxidectin 2018
Mulpleta 2018
Myalept $11,357,421 $4,483.78 $21,441,823 $4,243.38 2014
Natpara $53,128,928 $4,837.37 $21,349,353 $4,665.04 2015
Nerlynx $25,587,361 $64.99 $25,407,382 $62.15 2017
Netspot 2016
Neuraceq 2014
Ninlaro $268,301,807 $3,372.53 $12,281,799 $2,968.19 2015
Northera $176,669,499 $56.03 $8,992,982 $47.19 2014
Nucala $32,478,179 $2,939.20 $29,894,460 $2,199.46 2015
Nuplazid $209,067,812 $53.83 $3,497,620 $48.60 2016
Nuzyra 2018
Ocaliva $52,445,398 $216.66 $9,197,508 $201.65 2016
Ocrevus $50,553,375 $1,488.18 $107,547,817 $1,240.84 2017
Odomzo $11,624,006 $361.38 $1,502,389 $342.31 2015
Ofev $618,635,442 $157.00 $17,648,458 $142.74 2014
Olumiant $2,023,223 $69.60 $383,536 $68.73 2018
Omegaven 2018
Onpattro 2018
Opdivo $33,146,376 $268.03 $243,496,449 $242.64 2014
Orbactiv $516,924 $93.99 $1,808,183 $555.30 2014
Orilissa $138,612 $26.21 $1,063,295 $24.80 2018
Orkambi $48,653,400 $193.07 $282,545,276 $188.59 2015
Otezla $318,273,429 $54.81 $93,736,396 $48.08 2014
Oxervate 2018
Ozempic $56,817,559 $404.74 $12,163,131 $395.30 2017
Palynziq $972,905 $666.70 $388,302 $806.80 2018
Parsabiv $13,849,558 $129.41 2017
Pifeltro $381,363 $46.52 $161,389 $45.89 2018
Plegridy*† $75,309,862 $6,870.18 $14,687,047 $3,274.05 2014
Portrazza $166,392 $87.57 $363,701 $53.02 2015
Poteligeo 2018

Section 5: Drugs Benefiting from Government Grants or Research Subsidies
May 2020 REPORT TO CONGRESS 44
Medicare Part D Medicaid
Brand Name Total Spending in
2018 Spending per Unit in 2018
Total Spending in 2018
Spending per Unit in 2018
Year of FDA Approval
Praluent*† $211,868,506 $570.37 2015
Praxbind 2015
Prevymis* $7,187,846 $196.17 $3,165,572 $167.76 2017
Radicava $64,233,760 $5.60 $4,260,662 $6.15 2017
Rapivab 2014
Repatha*† $278,776,544 $549.01 $19,262,139 $481.38 2015
Revcovi 2018
Rexulti $238,907,717 $37.03 $183,248,095 $34.46 2015
Rhopressa $15,644,629 $94.70 $685,727 $88.61 2017
Rubraca $30,130,554 $123.91 $6,784,488 $116.69 2016
Rydapt $24,792,988 $144.02 $10,059,036 $132.04 2017
Savaysa $9,832,465 $11.22 $911,250 $10.68 2015
Seysara 2018
Siliq $3,135,421 $1,192.40 $1,586,087 $1,073.68 2017
Sivextro* $7,932,743 $349.20 $2,506,710 $331.61 2014
Solosec $57,731 $273.61 $431,499 $210.90 2017
Spinraza $8,033,556 $26,339.53 $223,505,259 $17,241.35 2016
Steglatro $740,483 $8.89 $9,463,375 $7.61 2017
Strensiq $69,696,199 $5,918.63 $46,392,498 $3,870.51 2015
Striverdi Respimat $2,569,511 $49.53 $876,855 $45.87 2014
Sylvant $812,300 $1,455.68 2014
Symdeko $102,650,904 $407.68 $127,086,739 $382.62 2018
Symproic $4,486,240 $10.65 $906,335 $10.12 2017
Tagrisso $387,940,690 $503.26 $53,225,790 $434.88 2015
Takhzyro $12,343,788 $11,262.58 $5,107,588 $11,299.97 2018
Taltz*† $130,521,984 $5,233.16 $52,461,645 $4,802.62 2016
Talzenna $162,688 $492.99 2018
Tanzeum $11,664,688 $127.54 $15,255,241 $111.52 2014
Tavalisse $5,337,627 $158.92 $1,494,375 $153.89 2018
Tecentriq $3,601,620 $431.85 $20,318,958 $382.72 2016
Tegsedi 2018
Tibsovo $6,673,701 $443.76 $571,828 $414.37 2018
Tpoxx 2018
Tremfya $77,058,267 $10,259.39 $25,466,822 $9,318.20 2017
Tresiba*† $932,414,209 $63.36 $119,986,806 $59.30 2015
Trogarzo $4,366,508 $879.82 $344,336 $1,171.50 2018
Trulance $20,158,481 $13.08 $7,278,209 $11.87 2017
Trulicity $1,360,642,452 $363.21 $196,059,927 $324.99 2014
Tymlos $52,079,801 $1,118.20 $3,321,673 $998.39 2017
Ultomiris 2018
Unituxin 2015
Uptravi $305,315,458 $250.39 $76,932,187 $241.45 2015
Vabomere $306,830 $4.03 $173,713 $158.63 2017
Varubi* $1,896,101 $302.50 $604,381 $209.60 2015
Veltassa $77,725,105 $27.10 $8,298,208 $25.77 2015
Venclexta*† $144,011,208 $90.65 $6,636,628 $82.38 2016

Section 5: Drugs Benefiting from Government Grants or Research Subsidies
May 2020 REPORT TO CONGRESS 45
Medicare Part D Medicaid
Brand Name Total Spending in
2018 Spending per Unit in 2018
Total Spending in 2018
Spending per Unit in 2018
Year of FDA Approval
Verzenio $106,458,848 $205.17 $21,283,286 $193.57 2017
Viberzi $59,371,509 $19.19 $14,975,917 $18.21 2015
Viekira Pak*† $503,808 $333.21 $11,529,527 $964.35 2014
Vimizim $13,906,366 $229.91 $52,757,725 $223.06 2014
Vitrakvi 2018
Vizimpro 2018
Vosevi $144,806,296 $895.06 $69,168,165 $809.91 2017
Vraylar $184,939,872 $40.95 $166,296,359 $38.30 2015
Vyzulta $8,640,790 $71.91 $402,707 $58.66 2017
Xadago $6,304,633 $24.90 $94,988 $21.33 2017
Xepi 2017
Xerava 2018
Xermelo $8,985,928 $68.54 $957,937 $63.27 2017
Xiidra $140,996,659 $8.48 $30,032,496 $30.80 2016
Xofluza $40,698 $76.93 $8,418 $77.23 2018
Xospata $775,798 $253.53 $256,476 $248.52 2018
Xtoro 2014
Xuriden 2015
Yondelis $179,131 $115.43 $1,313,302 $2,173.86 2015
Yupelri 2018
Zejula $68,458,312 $192.59 $10,987,404 $188.12 2017
Zemdri 2018
Zepatier $82,840,870 $624.30 $72,491,544 $617.89 2016
Zerbaxa $3,368,450 $8.19 $1,174,976 $92.55 2014
Zinbryta $4,258,998 $7,471.93 $1,090,458 $7,127.17 2016
Zinplava $285,157 $98.61 $112,056 $83.37 2016
Zontivity $4,423,462 $10.59 $337,282 $9.14 2014
Zurampic $873,639 $12.50 $267,347 $11.47 2015
Zydelig $44,084,085 $175.27 $2,458,354 $166.53 2014
Zykadia $8,083,559 $114.31 $1,752,566 $103.62 2014
Source: The list of approved drugs was obtained at https://www.fda.gov/Drugs/DevelopmentApprovalProcess/HowDrugsareDevelopedandApproved/DrugandBiologicApprovalReports/NDAandBLAApprovalReports/ucm373420.htm. Spending data are from the CMS Medicare Part D and Medicaid dashboards at https://www.cms.gov/Research-Statistics-Data-and-Systems/Statistics-Trends-and-Reports/Information-on-Prescription-Drugs. Blank fields indicate no associated volume or spending in 2018. Information on drugs with fewer than 11 claims in 2018 is suppressed to protect patient confidentiality. * Average spending per dosage unit reflects multiple routes of administration of the drug (e.g., intravenous, subcutaneous) which individually may have different unit pricing. † Drugs with more than one product listed separately in the dashboard data for Medicare Part D and/or Medicaid. In such cases, Total Spending represents the sum of those products. Spending per Dosage Unit represents the reported figure for the product with the largest number of service units in 2018. †† Akynzeo received FDA approval in 2014. A prodrug version was approved under the same brand name by the FDA in 2018. Because the active ingredients and indications are nearly identical and the CMS Medicare Part D and Medicaid State Drug Utilization data do not differentiate between the 2014 and 2018 versions, data are aggregated under the most recently approved version.

May 2020 REPORT TO CONGRESS 46
Appendix: Top 10 Drugs by Total Cost, Spending Per Unit, and Prescription Frequency in Medicare Part B, Medicare Part D, and Medicaid
Table A-1 Top 10 High-Cost Prescribed Drugs, Medicare Part B, Ranked by Program Spending
Year Rank HCPCS Description
Total Payment
($M)
Beneficiaries
(1000s)
Spending per
Beneficiary ($)
Services
(1000s)
Spending per
Service ($)
Units
(1000s)
Spending
per Unit ($)
Medicare
Payment Net
of Cost-
Sharing ($M)
2008 1 J9310 Rituximab cancer treatment 1,151.1 63 18,194 299 3,848.12 2,227 516.94 918.7 2 J9035 Bevacizumab injection 944.7 149 6,349 581 1,626.77 16,457 57.41 761.3 3 J1745 Infliximab injection 814.8 59 13,700 339 2,401.25 14,589 55.85 647.8 4 J2505 Injection, pegfilgrastim 6mg 798.8 101 7,895 361 2,214.14 362 2,208.74 634.3 5 J2778 Ranibizumab injection 735.8 87 8,423 364 2,023.04 1,853 397.07 588.1 6 J0881 Darbepoetin alfa, non-esrd 676.7 203 3,331 1,142 592.73 232,618 2.91 534.5 7 J9263 Oxaliplatin 457.5 26 17,330 149 3,069.31 48,582 9.42 365.9 8 J0885 Epoetin alfa, non-esrd 462.3 185 2,493 1,522 303.86 49,918 9.26 362.3 9 J9170 Docetaxel 396.7 46 8,624 240 1,649.52 1,210 327.90 316.8 10 J9201 Gemcitabine HCl 330.8 46 7,242 313 1,056.47 2,498 132.42 263.7 Medicare Part B Spending, Top 10 6,769.4
5,393.4
Medicare Part B Spending, All Drugs 13,614.3
10,843.8

Appendix: Top 10 Drugs by Total Cost, Spending Per Unit, and Prescription Frequency in Medicare Part B, Medicare Part D, and Medicaid
May 2020 REPORT TO CONGRESS 47
Table A-1 continued Top 10 High-Cost Prescribed Drugs, Medicare Part B, Ranked by Program Spending
Year Rank HCPCS Description
Total Payment
($M)
Beneficiaries
(1000s)
Spending per
Beneficiary ($)
Services
(1000s)
Spending per
Service ($)
Units
(1000s)
Spending
per Unit ($)
Medicare
Payment Net
of Cost-
Sharing ($M)
2009 1 J9310 Rituximab injection 1,195.5 64 18,660 293 4,075.20 2,203 542.65 954.5 2 J9035 Bevacizumab injection 1,086.7 167 6,491 679 1,601.47 19,024 57.12 875.5 3 J2778 Ranibizumab injection 899.0 99 9,112 435 2,068.39 2,236 402.03 718.6 4 J1745 Infliximab injection 854.4 59 14,538 338 2,525.06 14,943 57.17 678.7 5 J2505 Injection, pegfilgrastim 6mg 793.1 99 7,990 355 2,232.98 1,356 584.72 628.5 6 J0881 Darbepoetin alfa, non-esrd 583.6 164 3,568 966 603.94 193,897 3.01 460.5 7 J9263 Oxaliplatin 467.5 27 17,158 152 3,081.10 49,594 9.43 373.7 8 J0885 Epoetin alfa, non-esrd 463.9 170 2,727 1,453 319.35 48,219 9.62 364.0 9 J9170 Docetaxel injection 409.8 46 9,006 234 1,751.30 1,200 341.42 327.3 10 J9305 Pemetrexed injection 363.9 20 18,100 81 4,501.54 7,505 48.49 292.6
Medicare Part B Spending, Top 10 7,117.4 5,674.0
Medicare Part B Spending, All Drugs 14,488.5 11,547.5

Appendix: Top 10 Drugs by Total Cost, Spending Per Unit, and Prescription Frequency in Medicare Part B, Medicare Part D, and Medicaid
May 2020 REPORT TO CONGRESS 48
Table A-1 continued Top 10 High-Cost Prescribed Drugs, Medicare Part B, Ranked by Program Spending
Year Rank HCPCS Description
Total Payment
($M)
Beneficiaries
(1000s)
Spending per
Beneficiary ($)
Services
(1000s)
Spending per
Service ($)
Units
(1000s)
Spending
per Unit ($)
Medicare
Payment Net
of Cost-
Sharing ($M)
2010 1 J9310 Rituximab injection 1,253.1 65 19,312 290 4,325.74 2,171 577.17 1,000.9 2 J2778 Ranibizumab injection 1,171.8 115 10,157 557 2,103.88 2,900 404.11 936.4 3 J9035 Bevacizumab injection 1,105.6 162 6,821 699 1,581.74 19,142 57.75 890.7 4 J1745 Infliximab injection 899.8 59 15,264 339 2,654.44 15,232 59.07 713.9 5 J2505 Injection, pegfilgrastim 6mg 876.2 100 8,802 357 2,452.56 358 2,444.30 694.3 6 J0881 Darbepoetin alfa, non-esrd 500.4 138 3,637 833 601.09 169,876 2.95 393.5 7 J9305 Pemetrexed injection 429.8 22 19,894 92 4,667.74 8,439 50.93 346.0 8 J0885 Epoetin alfa, non-esrd 421.9 150 2,804 1,297 325.33 43,247 9.76 330.6 9 J9171 Docetaxel injection 392.4 44 8,990 221 1,776.83 21,902 17.92 312.8 10 J9355 Trastuzumab injection 365.4 14 25,707 177 2,066.54 5,510 66.33 291.5 Medicare Part B Spending, Top 10 7,416.4
5,910.6
Medicare Part B Spending, All Drugs 15,478.6
12,336.5

Appendix: Top 10 Drugs by Total Cost, Spending Per Unit, and Prescription Frequency in Medicare Part B, Medicare Part D, and Medicaid
May 2020 REPORT TO CONGRESS 49
Table A-1 continued Top 10 High-Cost Prescribed Drugs, Medicare Part B, Ranked by Program Spending
Year Rank HCPCS Description
Total Payment
($M)
Beneficiaries
(1000s)
Spending per
Beneficiary ($)
Services
(1000s)
Spending per
Service ($)
Units
(1000s)
Spending
per Unit ($)
Medicare
Payment Net
of Cost-
Sharing ($M)
2011 1 J2778 Ranibizumab injection 1,428.9 133 10,753 670 2,131.30 3,525 405.35 1,141.9 2 J9310 Rituximab injection 1,373.0 68 20,286 298 4,601.63 2,245 611.65 1,098.3 3 J9035 Bevacizumab injection 1,012.5 174 5,809 756 1,339.73 16,750 60.45 817.4 4 J2505 Injection, pegfilgrastim 6mg 1,020.5 106 9,661 386 2,645.27 386 2,643.26 808.4 5 J1745 Infliximab injection 960.5 60 16,045 344 2,791.30 15,620 61.49 761.6 6 J9263 Oxaliplatin 498.3 30 16,529 164 3,040.10 52,882 9.42 398.0 7 J9305 Pemetrexed injection 464.4 22 20,867 97 4,807.40 8,751 53.07 374.0 8 J0881 Darbepoetin alfa, non-esrd 435.4 112 3,888 687 633.74 138,222 3.15 341.9 9 J9355 Trastuzumab injection 410.7 15 27,130 182 2,257.82 5,817 70.60 327.2 10 J9171 Docetaxel injection 395.9 45 8,797 210 1,883.21 21,168 18.70 315.8 Medicare Part B Spending, Top 10 8,000.1 6,384.5 Medicare Part B Spending, All Drugs 17,191.6 13,733.3

Appendix: Top 10 Drugs by Total Cost, Spending Per Unit, and Prescription Frequency in Medicare Part B, Medicare Part D, and Medicaid
May 2020 REPORT TO CONGRESS 50
Table A-1 continued Top 10 High-Cost Prescribed Drugs, Medicare Part B, Ranked by Program Spending
Year Rank HCPCS Description
Total Payment
($M)
Beneficiaries
(1000s)
Spending per
Beneficiary ($)
Services
(1000s)
Spending per
Service ($)
Units
(1000s)
Spending
per Unit ($)
Medicare
Payment Net
of Cost-
Sharing ($M)
2012 1 J9310 Rituximab injection 1,466.2 70 20,972 302 4,858.21 2,364 620.27 1,175.0 2 J2778 Ranibizumab injection 1,268.0 136 9,338 605 2,097.19 3,166 400.53 1,013.4 3 J2505 Injection, pegfilgrastim 6mg 1,118.7 107 10,428 395 2,829.12 396 2,822.92 886.0 4 J9035 Bevacizumab injection 1,027.5 183 5,628 789 1,302.61 16,713 61.48 831.2 5 J1745 Infliximab injection 1,040.5 61 17,089 352 2,955.06 16,201 64.22 824.7 6 J9263 Oxaliplatin 532.7 31 16,937 172 3,092.09 55,077 9.67 425.6 7 J9305 Pemetrexed injection 521.9 23 22,656 103 5,048.21 9,386 55.60 421.1 8 J0897 Denosumab injection 503.8 164 3,073 386 1,304.46 34,654 14.54 400.4 9 J9355 Trastuzumab injection 478.6 17 28,951 192 2,488.81 6,441 74.30 381.5 10 J9041 Bortezomib injection 436.4 20 21,590 311 1,401.06 10,145 43.01 347.5 Medicare Part B Spending, Top 10 8,394.3 6,706.5 Medicare Part B Spending, All Drugs 19,001.0 15,201.6

Appendix: Top 10 Drugs by Total Cost, Spending Per Unit, and Prescription Frequency in Medicare Part B, Medicare Part D, and Medicaid
May 2020 REPORT TO CONGRESS 51
Table A-1 continued Top 10 High-Cost Prescribed Drugs, Medicare Part B, Ranked by Program Spending
Year Rank HCPCS Description
Total Payment
($M)
Beneficiaries
(1000s)
Spending per
Beneficiary ($)
Services
(1000s)
Spending per
Service ($)
Units
(1000s)
Spending
per Unit ($)
Medicare
Payment Net
of Cost-
Sharing ($M)
2013 1 J9310 Rituximab injection 1,554.8 72 21,696 304 5,122.40 2,321 669.87 1,245.7 2 J2778 Ranibizumab injection 1,354.1 144 9,412 678 1,996.39 3,443 393.25 1,078.9 3 J2505 Injection, pegfilgrastim 6mg 1,159.5 105 11,074 386 3,001.61 387 2,998.81 915.1 4 J1745 Infliximab injection 1,139.7 62 18,473 359 3,175.49 16,779 67.92 900.8 5 J0178 Aflibercept injection 1,079.3 109 9,924 520 2,075.76 1,117 966.45 859.7 6 J9035 Bevacizumab injection 1,060.2 188 5,641 795 1,334.16 16,689 63.52 855.6 7 J0897 Denosumab injection 655.9 237 2,765 537 1,220.36 46,311 14.16 517.8 8 J9305 Pemetrexed injection 564.6 23 24,050 107 5,290.91 9,664 58.42 455.2 9 J9355 Trastuzumab injection 518.5 18 29,376 190 2,723.78 6,670 77.74 413.2 10 J9041 Bortezomib injection 465.3 21 22,393 321 1,450.56 10,448 44.53 368.8 Medicare Part B Spending, Top 10 9,551.8 7,610.7 Medicare Part B Spending, All Drugs 20,331.5 16,231.8

Appendix: Top 10 Drugs by Total Cost, Spending Per Unit, and Prescription Frequency in Medicare Part B, Medicare Part D, and Medicaid
May 2020 REPORT TO CONGRESS 52
Table A-1 continued Top 10 High-Cost Prescribed Drugs, Medicare Part B, Ranked by Program Spending
Year Rank HCPCS Description
Total Payment
($M)
Beneficiaries
(1000s)
Spending per
Beneficiary ($)
Services
(1000s)
Spending per
Service ($)
Units
(1000s)
Spending
per Unit ($)
Medicare
Payment Net
of Cost-
Sharing ($M)
2014 1 J9310 Rituximab injection 1,552.5 70 22,031 292 5,323.90 2,239 693.46 1,244.6 2 J2778 Ranibizumab injection 1,336.0 142 9,412 676 1,977.01 3,420 390.62 1,063.4 3 J0178 Aflibercept injection 1,302.0 133 9,791 627 2,075.35 1,350 964.46 1,036.1 4 J2505 Injection, pegfilgrastim 6mg 1,235.7 102 12,086 373 3,309.64 373 3,308.51 974.4 5 J1745 Infliximab injection 1,223.5 62 19,894 360 3,397.98 17,060 71.72 965.6 6 J9035 Bevacizumab injection 1,091.4 217 5,030 907 1,202.69 16,747 65.17 880.3 7 J0897 Denosumab injection 799.3 306 2,615 670 1,192.09 55,891 14.30 629.8 8 J9355 Trastuzumab injection 581.0 19 30,590 198 2,934.94 7,192 80.78 464.0 9 J9305 Pemetrexed injection 575.4 24 24,476 107 5,363.31 9,670 59.50 463.6 10 J9041 Bortezomib injection 489.3 21 23,459 328 1,491.70 10,745 45.54 387.3 Medicare Part B Spending, Top 10 10,186.0
8,108.9
Medicare Part B Spending, All Drugs 21,597.8
17,240.2

Appendix: Top 10 Drugs by Total Cost, Spending Per Unit, and Prescription Frequency in Medicare Part B, Medicare Part D, and Medicaid
May 2020 REPORT TO CONGRESS 53
Table A-1 continued Top 10 High-Cost Prescribed Drugs, Medicare Part B, Ranked by Program Spending
Year Rank HCPCS Description
Total Payment
($M)
Beneficiaries
(1000s)
Spending per
Beneficiary ($)
Services
(1000s)
Spending per
Service ($)
Units
(1000s)
Spending
per Unit ($)
Medicare
Payment Net
of Cost-
Sharing ($M)
2015 1 J0178 Aflibercept injection 1,823.5 181 10,091 870 2,095.42 1,890 964.59 1,451.2 2 J9310 Rituximab injection 1,615.8 70 22,959 286 5,658.14 2,213 730.07 1,297.7 3 J2505 Injection, pegfilgrastim 6mg 1,326.4 100 13,245 369 3,590.57 369 3,589.93 1,047.4 4 J1745 Infliximab injection 1,302.7 61 21,500 354 3,675.49 17,064 76.34 1,026.8 5 J9035 Bevacizumab injection 1,155.0 209 5,523 906 1,275.19 16,985 68.00 931.9 6 J2778 Ranibizumab injection 1,153.9 120 9,625 575 2,007.38 2,980 387.17 918.5 7 J0897 Denosumab injection 956.8 371 2,579 791 1,209.41 64,348 14.87 753.1 8 J9355 Trastuzumab injection 669.5 20 32,714 207 3,226.66 7,857 85.21 536.1 9 J9305 Pemetrexed injection 566.2 22 25,194 104 5,447.12 9,362 60.48 456.1 10 J9041 Bortezomib injection 526.2 22 24,351 345 1,523.87 11,347 46.37 416.2 Medicare Part B Spending, Top 10 11,096.0
8,834.9
Medicare Part B Spending, All Drugs 23,813.3
19,007.1

Appendix: Top 10 Drugs by Total Cost, Spending Per Unit, and Prescription Frequency in Medicare Part B, Medicare Part D, and Medicaid
May 2020 REPORT TO CONGRESS 54
Table A-1 continued Top 10 High-Cost Prescribed Drugs, Medicare Part B, Ranked by Program Spending
Year Rank HCPCS Description
Total Payment
($M)
Beneficiaries
(1000s)
Spending per
Beneficiary ($)
Services
(1000s)
Spending per
Service ($)
Units
(1000s)
Spending
per Unit ($)
Medicare
Payment Net
of Cost-
Sharing ($M)
2016 1 J0178 Aflibercept injection 2,224.1 211 10,532 1,052 2,113.43 2,303 965.64 1,769.4
2 J9310 Rituximab injection 1,723.1 72 24,006 286 6,030.50 2,235 770.88 1,388.1
3 J2505 Injection, pegfilgrastim 6mg 1,433.3 99 14,475 367 3,902.72 367 3,902.14 1,137.9
4 J1745 Infliximab injection 1,402.9 60 23,262 354 3,967.60 17,241 81.37 1,105.9
5 J9299 Injection, nivolumab 1,260.3 28 44,412 217 5,802.74 49,748 25.33 1,010.3
6 J9035 Bevacizumab injection 1,141.9 208 5,488 904 1,262.76 16,205 70.47 923.2
7 J0897 Denosumab injection 1,133.4 436 2,601 904 1,253.26 71,943 15.75 890.4
8 J2778 Ranibizumab injection 1,046.8 107 9,826 526 1,989.43 2,765 378.62 833.1
9 J9355 Trastuzumab injection 730.6 21 34,431 211 3,461.30 8,137 89.79 585.7
10 J0129 Abatacept injection 601.0 23 25,695 198 3,031.89 14,727 40.81 474.5
Medicare Part B Spending, Top 10 12,697.6
10,118.6
Medicare Part B Spending, All Drugs 27,266.7
21,789.6

Appendix: Top 10 Drugs by Total Cost, Spending Per Unit, and Prescription Frequency in Medicare Part B, Medicare Part D, and Medicaid
May 2020 REPORT TO CONGRESS 55
Table A-1 continued Top 10 High-Cost Prescribed Drugs, Medicare Part B, Ranked by Program Spending
Year Rank HCPCS Description
Total Payment
($M)
Beneficiaries
(1000s)
Spending per
Beneficiary ($)
Services
(1000s)
Spending per
Service ($)
Units
(1000s)
Spending
per Unit ($)
Medicare
Payment Net
of Cost-
Sharing ($M)
2017 1 J0178 Aflibercept injection 2,473.4 230 10,758 1,166 2,121.69 2,573 961.30 1,967.3 2 J9310 Rituximab injection 1,815.3 72 25,059 282 6,446.76 2,216 819.14 1,467.6 3 J9299 Injection, nivolumab 1,516.5 30 50,897 252 6,006.69 58,432 25.95 1,207.8 4 J2505 Injection, pegfilgrastim 6mg 1,461.7 94 15,520 349 4,183.73 349 4,183.13 1,164.3 5 J1745 Infliximab not biosimil 10mg 1,413.9 59 24,149 336 4,207.82 16,633 85.00 1,113.0 6 J0897 Denosumab injection 1,296.6 491 2,642 995 1,303.63 77,429 16.75 1,016.7 7 J9035 Bevacizumab injection 1,100.2 220 4,992 935 1,176.83 15,017 73.26 887.5 8 J9271 Inj pembrolizumab 1,062.2 22 47,585 119 8,948.61 23,017 46.15 885.9 9 J2778 Ranibizumab injection 1,039.1 105 9,869 525 1,980.08 2,790 372.40 826.9 10 J9355 Trastuzumab injection 814.1 21 38,441 208 3,914.34 8,581 94.87 654.3 Medicare Part B Spending, Top 10 13,993.0 11,191.3
Medicare Part B Spending, All Drugs 30,294.0 24,260.5

Appendix: Top 10 Drugs by Total Cost, Spending Per Unit, and Prescription Frequency in Medicare Part B, Medicare Part D, and Medicaid
May 2020 REPORT TO CONGRESS 56
Table A-1 continued Top 10 High-Cost Prescribed Drugs, Medicare Part B, Ranked by Program Spending
Year Rank HCPCS Description
Total Payment
($M)
Beneficiaries
(1000s)
Spending per
Beneficiary ($)
Services
(1000s)
Spending per
Service ($)
Units
(1000s)
Spending
per Unit ($)
Medicare
Payment Net
of Cost-
Sharing ($M)
2018 1 J0178 Aflibercept injection 2,579.6 241 10,691 1,231 2,095.60 2,736 942.72 2,051.4 2 J9271 Inj pembrolizumab 1,869.9 36 51,446 218 8,570.74 42,767 43.72 1,536.3 3 J9299 Injection, nivolumab 1,768.3 34 52,758 266 6,637.75 71,431 24.75 1,429.0 4 J9310 Rituximab injection 1,761.8 73 24,189 272 6,484.76 2,150 819.28 1,414.5 5 J0897 Denosumab injection 1,485.9 557 2,669 1,126 1,319.70 87,080 17.06 1,163.6 6 J2505 Injection, pegfilgrastim 6mg 1,430.2 91 15,668 342 4,188.12 342 4,187.28 1,138.9 7 J2778 Ranibizumab injection 1,216.3 123 9,855 619 1,964.20 3,303 368.24 967.9 8 J1745 Infliximab not biosimil 10mg 1,220.9 54 22,573 310 3,941.04 15,587 78.32 954.3 9 J9035 Bevacizumab injection 1,043.9 224 4,653 983 1,062.06 14,694 71.04 836.6 10 J9355 Trastuzumab injection 851.8 21 40,360 208 4,103.71 9,137 93.23 684.0 Medicare Part B Spending, Top 10 15,228.6
12,176.6
Medicare Part B Spending, All Drugs 33,200.9
26,602.5
Source: Analysis of carrier, durable medical, and outpatient claims data 2006-2018 by Acumen for ASPE. Data include Part B covered drugs administered in physicians' offices and furnished by suppliers, covered drugs in hospital outpatient departments; and reflect only Part B drugs paid under the average sales price plus 6 percent (ASP) methodology. The Healthcare Common Procedure Coding System (HCPCS) codes and prices for carrier and DM were obtained from the CMS ASP file, those for OP come from the CMS Addendum B file. Lines with denied payments or Medicare as secondary payer were dropped. Spending per Beneficiary, Spending per Service, and Spending per Unit include beneficiary cost-sharing and include the sequester.

Appendix: Top 10 Drugs by Total Cost, Spending Per Unit, and Prescription Frequency in Medicare Part B, Medicare Part D, and Medicaid
May 2020 REPORT TO CONGRESS 57
Table A-2 Top 10 Highest-Cost Prescribed Drugs, Medicare Part B, Ranked by Spending per Unit
Year Rank HCPCS Description
Total Payment
($M)
Beneficiaries
(1000s)
Spending per
Beneficiary ($)
Services
(1000s)
Spending per
Service ($)
Units
(1000s)
Spending
per Unit ($)
Medicare
Payment Net
of Cost-
Sharing ($M)
2008 1 J7311 Fluocinolone acetonide implt 2.6 * 22,701 * 19,195.39 * 19,195.39 2.4 2 J7310 Ganciclovir long act implant 0.4 * 8,488 * 6,818.52 * 6,602.06 0.4 3 J9600 Porfimer sodium 1.0 * 6,435 * 5,908.53 * 2,494.71 0.8 4 J9300 Gemtuzumab ozogamicin 3.1 * 9,472 1 6,086.39 1 2,438.37 2.6 5 J2505 Injection, pegfilgrastim 6mg 798.8 101 7,895 361 2,214.14 362 2,208.74 634.3 6 J9266 Pegaspargase/singl dose vial 0.2 * 6,762 * 3,242.01 * 2,094.39 0.2 7 J3100 Tenecteplase injection 6.2 3 2,264 3 2,176.73 3 1,968.37 4.6 8 J9268 Pentostatin injection 6.1 1 6,583 3 1,834.83 3 1,771.27 4.9 9 J9245 Inj melphalan hydrochl 50 MG 3.4 * 9,350 1 3,715.94 2 1,502.60 2.9 10 J9219 Leuprolide acetate implant 6.1 4 1,510 4 1,508.23 4 1,434.62 4.8 Medicare Part B Spending, Top 10 828.0 657.9 Medicare Part B Spending, All Drugs 13,614.3 10,843.8

Appendix: Top 10 Drugs by Total Cost, Spending Per Unit, and Prescription Frequency in Medicare Part B, Medicare Part D, and Medicaid
May 2020 REPORT TO CONGRESS 58
Table A-2 continued Top 10 High-Cost Prescribed Drugs, Medicare Part B, Ranked by Spending per Unit
Year Rank HCPCS Description
Total Payment
($M)
Beneficiaries
(1000s)
Spending per
Beneficiary ($)
Services
(1000s)
Spending per
Service ($)
Units
(1000s)
Spending
per Unit ($)
Medicare
Payment Net
of Cost-
Sharing ($M)
2009 1 J7311 Fluocinolone acetonide implt 2.0 * 22,480 * 19,482.57 * 19,118.41 1.9 2 J7310 Ganciclovir long act implant 0.3 * 17,103 * 13,156.42 * 7,126.40 0.3 3 J9266 Pegaspargase injection 0.4 * 11,291 * 5,268.95 * 2,652.16 0.3 4 J9600 Porfimer sodium injection 0.8 * 7,259 * 6,507.87 * 2,630.36 0.6 5 J9300 Gemtuzumab ozogamicin inj 3.4 * 9,700 1 5,813.42 1 2,517.55 2.8 6 C9247 Inj, iobenguane, I-123, dx 0.6 * 2,417 * 2,357.10 * 1,936.47 0.5 7 J9219 Leuprolide acetate implant 0.7 * 2,213 * 2,193.40 * 1,895.33 0.6 8 J9245 Inj melphalan hydrochl 50 MG 3.1 * 10,132 1 3,851.84 2 1,563.09 2.6 9 J9268 Pentostatin injection 3.0 1 5,461 2 1,544.72 2 1,444.61 2.4 10 J9160 Denileukin diftitox inj 12.9 * 104,347 2 5,707.53 9 1,427.51 10.6 Medicare Part B Spending, Top 10 27.2 22.6 Medicare Part B Spending, All Drugs 14,488.5 11,547.5

Appendix: Top 10 Drugs by Total Cost, Spending Per Unit, and Prescription Frequency in Medicare Part B, Medicare Part D, and Medicaid
May 2020 REPORT TO CONGRESS 59
Table A-2 continued Top 10 High-Cost Prescribed Drugs, Medicare Part B, Ranked by Spending per Unit
Year Rank HCPCS Description
Total Payment
($M)
Beneficiaries
(1000s)
Spending per
Beneficiary ($)
Services
(1000s)
Spending per
Service ($)
Units
(1000s)
Spending
per Unit ($)
Medicare
Payment Net
of Cost-
Sharing ($M)
2010 1 C9273 Sipuleucel-T 6.4 * 73,188 * 32,860.00 * 32,860.00 6.2 2 A9543 Y90 ibritumomab, rx 8.0 * 31,173 * 30,580.35 * 30,464.52 7.8 3 A9545 I131 tositumomab, rx 2.5 * 26,578 * 24,513.37 * 23,819.59 2.4 4 J7311 Fluocinolone acetonide implt 2.2 * 21,452 * 19,345.54 * 19,006.15 2.0 5 A9604 Sm 153 lexidronam 4.3 1 6,697 1 6,387.85 1 5,887.71 3.6 6 J7310 Ganciclovir long act implant 0.5 * 16,794 * 13,349.21 * 4,338.49 0.5 7 J9219 Leuprolide acetate implant 0.7 * 4,094 * 4,093.88 * 4,093.88 0.6 8 J9600 Porfimer sodium injection 0.6 * 7,242 * 6,821.09 * 2,847.64 0.5 9 J9266 Pegaspargase injection 0.3 * 7,677 * 4,558.21 * 2,652.05 0.2 10 J9300 Gemtuzumab ozogamicin inj 1.9 * 8,901 * 5,440.90 1 2,589.17 1.6 Medicare Part B Spending, Top 10 27.5 25.4 Medicare Part B Spending, All Drugs 15,478.6 12,336.5

Appendix: Top 10 Drugs by Total Cost, Spending Per Unit, and Prescription Frequency in Medicare Part B, Medicare Part D, and Medicaid
May 2020 REPORT TO CONGRESS 60
Table A-2 continued Top 10 High-Cost Prescribed Drugs, Medicare Part B, Ranked by Spending per Unit
Year Rank HCPCS Description
Total Payment
($M)
Beneficiaries
(1000s)
Spending per
Beneficiary ($)
Services
(1000s)
Spending per
Service ($)
Units
(1000s)
Spending
per Unit ($)
Medicare
Payment Net
of Cost-
Sharing ($M)
2011 1 A9543 Y90 ibritumomab, rx 7.7 * 34,789 * 33,573.26 * 33,573.36 7.5 2 C9273 Sipuleucel-T* 111.2 1 80,532.82 3 32,872.33 3 32,848.53 97.9 3 A9545 I131 tositumomab, rx 90.8 1 80,533 3 32,872.33 3 32,848.53 1.1 4 J7311 Fluocinolone acetonide implt 1.1 * 32,626 * 29,192.06 * 27,732.46 1.4 5 A9604 Sm 153 lexidronam 1.4 * 18,004 * 16,348.22 * 16,162.45 3.8 6 J9600 Porfimer sodium injection 4.4 1 8,042 1 7,688.74 1 7,608.51 0.8 7 J9219 Leuprolide acetate implant 0.8 * 13,645 * 12,441.12 * 5,254.63 0.3 8 J7310 Ganciclovir long act implant 0.3 * 4,378 * 4,378.09 * 4,378.09 0.4 9 J9225 Vantas implant 0.4 * 18,727 * 8,549.16 * 3,449.66 13.8 10 J9266 Pegaspargase injection 17.3 6 2,972 6 2,966.55 6 2,960.96 0.2 Medicare Part B Spending, Top 10 144.9 127.0 Medicare Part B Spending, All Drugs 17,191.6 13,733.3

Appendix: Top 10 Drugs by Total Cost, Spending Per Unit, and Prescription Frequency in Medicare Part B, Medicare Part D, and Medicaid
May 2020 REPORT TO CONGRESS 61
Table A-2 continued Top 10 High-Cost Prescribed Drugs, Medicare Part B, Ranked by Spending per Unit
Year Rank HCPCS Description
Total Payment
($M)
Beneficiaries
(1000s)
Spending per
Beneficiary ($)
Services
(1000s)
Spending per
Service ($)
Units
(1000s)
Spending
per Unit ($)
Medicare
Payment Net
of Cost-
Sharing ($M)
2012 1 A9543 Y90 ibritumomab, rx 7.6 * 37,285 * 36,214.42 * 36,041.97 7.4 2 Q2043 Sipuleucel-T auto CD54+ 219.7 2 88,100 7 32,794.31 7 32,769.85 186.5 3 A9545 I131 tositumomab, rx 1.3 * 28,978 * 28,977.70 * 28,977.70 1.3 4 J9600 Porfimer sodium injection 2.8 * 44,288 * 42,945.92 * 19,151.56 2.7 5 J7311 Fluocinolone acetonide implt 2.3 * 22,084 * 19,006.54 * 19,006.54 2.2 6 A9604 Sm 153 lexidronam 3.7 * 8,105 * 7,747.72 * 7,683.29 3.2 7 J7310 Ganciclovir long act implant 0.2 * 12,112 * 6,921.36 * 5,237.78 0.2 8 J9266 Pegaspargase injection 0.6 * 17,900 * 6,819.14 * 4,895.79 0.5 9 J9219 Leuprolide acetate implant 0.3 * 4,602 * 4,601.73 * 4,371.64 0.2 10 J9225 Vantas implant 12.4 4 3,070 4 3,064.66 4 3,062.38 9.9 Medicare Part B Spending, Top 10 250.9 214.0 Medicare Part B Spending, All Drugs 19,001.0 15,201.6
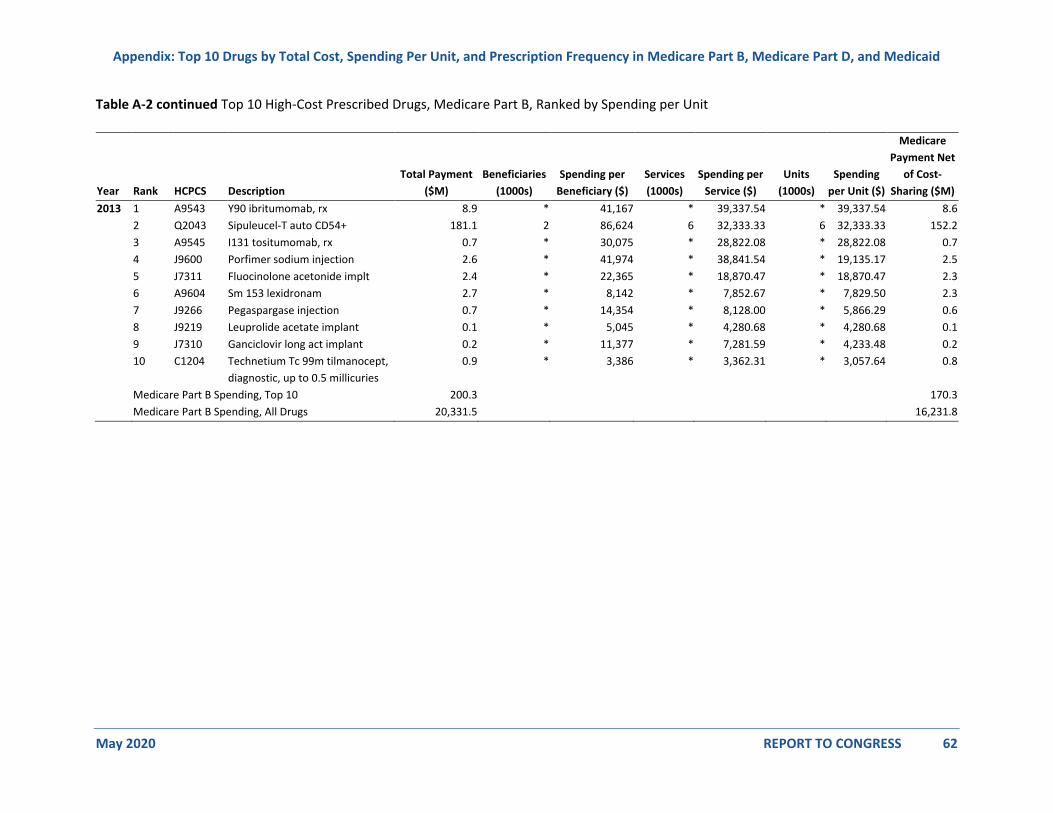
Appendix: Top 10 Drugs by Total Cost, Spending Per Unit, and Prescription Frequency in Medicare Part B, Medicare Part D, and Medicaid
May 2020 REPORT TO CONGRESS 62
Table A-2 continued Top 10 High-Cost Prescribed Drugs, Medicare Part B, Ranked by Spending per Unit
Year Rank HCPCS Description
Total Payment
($M)
Beneficiaries
(1000s)
Spending per
Beneficiary ($)
Services
(1000s)
Spending per
Service ($)
Units
(1000s)
Spending
per Unit ($)
Medicare
Payment Net
of Cost-
Sharing ($M)
2013 1 A9543 Y90 ibritumomab, rx 8.9 * 41,167 * 39,337.54 * 39,337.54 8.6 2 Q2043 Sipuleucel-T auto CD54+ 181.1 2 86,624 6 32,333.33 6 32,333.33 152.2 3 A9545 I131 tositumomab, rx 0.7 * 30,075 * 28,822.08 * 28,822.08 0.7 4 J9600 Porfimer sodium injection 2.6 * 41,974 * 38,841.54 * 19,135.17 2.5 5 J7311 Fluocinolone acetonide implt 2.4 * 22,365 * 18,870.47 * 18,870.47 2.3 6 A9604 Sm 153 lexidronam 2.7 * 8,142 * 7,852.67 * 7,829.50 2.3 7 J9266 Pegaspargase injection 0.7 * 14,354 * 8,128.00 * 5,866.29 0.6 8 J9219 Leuprolide acetate implant 0.1 * 5,045 * 4,280.68 * 4,280.68 0.1 9 J7310 Ganciclovir long act implant 0.2 * 11,377 * 7,281.59 * 4,233.48 0.2 10 C1204 Technetium Tc 99m tilmanocept,
diagnostic, up to 0.5 millicuries
0.9 * 3,386 * 3,362.31 * 3,057.64 0.8
Medicare Part B Spending, Top 10 200.3 170.3 Medicare Part B Spending, All Drugs 20,331.5 16,231.8

Appendix: Top 10 Drugs by Total Cost, Spending Per Unit, and Prescription Frequency in Medicare Part B, Medicare Part D, and Medicaid
May 2020 REPORT TO CONGRESS 63
Table A-2 continued Top 10 High-Cost Prescribed Drugs, Medicare Part B, Ranked by Spending per Unit
Year Rank HCPCS Description
Total Payment
($M)
Beneficiaries
(1000s)
Spending per
Beneficiary ($)
Services
(1000s)
Spending per
Service ($)
Units
(1000s)
Spending
per Unit ($)
Medicare
Payment Net
of Cost-
Sharing ($M)
2014 1 A9543 Y90 ibritumomab, rx 7.3 * 44,619 * 42,543.40 * 42,297.49 7.2 2 Q2043 Sipuleucel-t auto cd54+ 174.6 2 90,761 5 33,841.80 5 33,841.80 146.6 3 J9600 Porfimer sodium injection 2.8 * 47,085 * 43,406.52 * 19,291.79 2.7 4 J7311 Fluocinolone acetonide implt 1.8 * 22,213 * 19,140.58 * 19,140.58 1.7 5 A9604 Sm 153 lexidronam 1.4 * 8,419 * 8,000.12 * 8,000.12 1.2 6 J9266 Pegaspargase injection 1.1 * 19,147 * 7,922.77 * 5,952.34 1.0 7 J0716 Centruroides immune f(ab) 0.1 * 7,614 * 6,412.21 * 3,583.29 0.1 8 J2505 Injection, pegfilgrastim 6mg 1,235.7 102 12,086 373 3,309.64 373 3,308.51 974.4 9 J2993 Reteplase injection 0.0 * 2,979 * 2,978.94 * 2,978.94 0.0 10 J9225 Vantas implant 5.9 2 2,928 2 2,926.38 2 2,926.38 4.7 Medicare Part B Spending, Top 10 1,430.9 1,139.7 Medicare Part B Spending, All Drugs 21,597.8 17,240.2

Appendix: Top 10 Drugs by Total Cost, Spending Per Unit, and Prescription Frequency in Medicare Part B, Medicare Part D, and Medicaid
May 2020 REPORT TO CONGRESS 64
Table A-2 continued Top 10 High-Cost Prescribed Drugs, Medicare Part B, Ranked by Spending per Unit
Year Rank HCPCS Description
Total Payment
($M)
Beneficiaries
(1000s)
Spending per
Beneficiary ($)
Services
(1000s)
Spending per
Service ($)
Units
(1000s)
Spending
per Unit ($)
Medicare
Payment Net
of Cost-
Sharing ($M)
2015 1 A9543 Y90 ibritumomab, rx 4.5 * 44,343 * 42,669.30 * 42,270.52 4.3 2 Q2043 Sipuleucel-t auto cd54+ 172.4 2 95,552 5 35,193.09 5 35,193.09 145.1 3 J9600 Porfimer sodium injection 2.2 * 53,446 * 49,882.84 * 19,690.60 2.2 4 J7311 Fluocinolone acetonide implt 2.2 * 20,993 * 18,543.62 * 18,543.62 2.1 5 A9604 Sm 153 lexidronam 1.4 * 10,352 * 9,549.97 * 9,549.97 1.2 6 J9266 Pegaspargase injection 0.9 * 13,880 * 7,822.99 * 6,103.05 0.7 7 J0716 Centruroides immune f(ab) 0.2 * 8,821 * 8,820.86 * 3,632.12 0.2 8 J2505 Injection, pegfilgrastim 6mg 1,326.4 100 13,245 369 3,590.57 369 3,589.93 1,047.4 9 J9216 Interferon gamma 1-b inj 0.1 * * 3,727.15 * 3,194.70 0.1 10 J9225 Vantas implant 4.5 2 2,952 2 2,948.00 2 2,948.00 3.6 Medicare Part B Spending, Top 10 1,514.8 1,206.9 Medicare Part B Spending, All Drugs 23,813.3 19,007.1

Appendix: Top 10 Drugs by Total Cost, Spending Per Unit, and Prescription Frequency in Medicare Part B, Medicare Part D, and Medicaid
May 2020 REPORT TO CONGRESS 65
Table A-2 continued Top 10 High-Cost Prescribed Drugs, Medicare Part B, Ranked by Spending per Unit
Year Rank HCPCS Description
Total Payment
($M)
Beneficiaries
(1000s)
Spending per
Beneficiary ($)
Services
(1000s)
Spending per
Service ($)
Units
(1000s)
Spending
per Unit ($)
Medicare
Payment Net
of Cost-
Sharing ($M)
2016 1 A9543 Y90 ibritumomab, rx 3.5 * 44,055 * 44,054.79 * 43,504.10 3.4 2 Q2043 Sipuleucel-t auto cd54+ 181.8 2 100,458 5 37,002.26 5 37,002.26 152.6 3 J9600 Porfimer sodium injection 2.5 * 42,966 * 41,557.10 * 20,279.87 2.5 4 J7311 Fluocinolone acetonide implt 0.4 * 18,664 * 17,852.52 * 17,852.52 0.3 5 A9604 Sm 153 lexidronam 1.3 * 12,224 * 11,241.56 * 11,241.56 1.1 6 J9266 Pegaspargase injection 3.0 * 36,299 * 15,399.59 * 10,197.72 2.8 7 J2505 Injection, pegfilgrastim 6mg 1,433.3 99 14,475 367 3,902.72 367 3,902.14 1,137.9 8 J0716 Centruroides immune f(ab) 0.3 * 8,303 * 8,043.77 * 3,677.15 0.2 9 C9461 Choline C 11, diagnostic 5.3 1 5,166 1 3,647.35 1 3,647.35 5.3 10 J9050 Carmustine injection 1.6 * 16,516 * 10,362.85 * 3,316.98 1.4 Medicare Part B Spending, Top 10 1,633.0 1,307.5 Medicare Part B Spending, All Drugs 27,266.7 21,789.6

Appendix: Top 10 Drugs by Total Cost, Spending Per Unit, and Prescription Frequency in Medicare Part B, Medicare Part D, and Medicaid
May 2020 REPORT TO CONGRESS 66
Table A-2 continued Top 10 High-Cost Prescribed Drugs, Medicare Part B, Ranked by Spending per Unit
Year Rank HCPCS Description
Total Payment
($M)
Beneficiaries
(1000s)
Spending per
Beneficiary ($)
Services
(1000s)
Spending per
Service ($)
Units
(1000s)
Spending
per Unit ($)
Medicare
Payment Net
of Cost-
Sharing ($M)
2017 1 A9543 Y90 ibritumomab, rx 2.4 * 42,330 * 42,330.21 * 42,330.21 2.3 2 Q2043 Sipuleucel-t auto cd54+ 204.1 2 105,299 5 38,737.48 5 38,730.12 171.5 3 J9600 Porfimer sodium injection 3.0 * 54,702 * 50,066.28 * 20,802.19 2.9 4 J7311 Fluocinolone acetonide implt 0.5 * 21,711 * 19,823.20 * 19,823.20 0.4 5 A9604 Sm 153 lexidronam 1.1 * 12,210 * 11,560.73 * 11,560.73 1.0 6 J9266 Pegaspargase injection 2.3 * 30,828 * 13,579.17 * 9,666.53 2.0 7 A9515 Choline c-11 9.3 1 7,458 2 5,030.06 2 5,030.06 9.3 8 J2505 Injection, pegfilgrastim 6mg 1,461.7 94 15,520 349 4,183.73 349 4,183.13 1,164.3 9 J0716 Centruroides immune f(ab) 0.3 * 9,125 * 7,821.01 * 4,147.50 0.2 10 J0480 Basiliximab 1.1 * 5,521 * 3,338.62 * 3,319.04 0.9 Medicare Part B Spending, Top 10 1,685.6 1,354.8 Medicare Part B Spending, All Drugs 30,294.0 24,260.5

Appendix: Top 10 Drugs by Total Cost, Spending Per Unit, and Prescription Frequency in Medicare Part B, Medicare Part D, and Medicaid
May 2020 REPORT TO CONGRESS 67
Table A-2 continued Top 10 High-Cost Prescribed Drugs, Medicare Part B, Ranked by Spending per Unit
Year Rank HCPCS Description
Total Payment
($M)
Beneficiaries
(1000s)
Spending per
Beneficiary ($)
Services
(1000s)
Spending per
Service ($)
Units
(1000s)
Spending
per Unit ($)
Medicare
Payment Net
of Cost-
Sharing ($M)
2018 1 Q2040 Tisagenlecleucel car-pos t 5.8 * 480,463 * 480,463.46 * 480,463.46 5.8 2 A9543 Y90 ibritumomab, rx 1.6 * 46,658 * 42,875.05 * 41,746.76 1.5 3 Q2043 Sipuleucel-t auto cd54+ 189.6 2 107,215 5 39,392.47 5 39,392.47 157.1 4 J9600 Porfimer sodium injection 2.1 * 47,484 * 43,607.57 * 18,263.00 2.1 5 J7311 Fluocinolone acetonide implt 0.3 * 20,361 * 17,815.65 * 17,815.65 0.2 6 A9604 Sm 153 lexidronam 0.8 * 12,781 * 11,994.26 * 11,994.26 0.7 7 J9266 Pegaspargase injection 1.3 * 24,412 * 15,044.37 * 11,869.87 1.2 8 A9515 Choline c-11 9.5 1 7,473 2 5,209.25 2 5,209.25 9.5 9 J2505 Injection, pegfilgrastim 6mg 1,430.2 91 15,668 342 4,188.12 342 4,187.28 1,138.9 10 J0716 Centruroides immune f(ab) 0.3 * 7,196 * 7,028.70 * 3,925.12 0.3 Medicare Part B Spending, Top 10 1,641.4 1,317.2 Medicare Part B Spending, All Drugs 33,200.9 26,602.5
* Fewer than 500.
Source: Analysis of carrier, durable medical, and outpatient claims data 2006-2018 by Acumen for ASPE. Data include Part B covered drugs administered in physicians' offices and furnished by suppliers, covered drugs in hospital outpatient departments; and reflect only Part B drugs paid under the average sales price plus 6 percent (ASP) methodology. The Healthcare Common Procedure Coding System (HCPCS) codes and prices for carrier and DM were obtained from the CMS ASP file, those for OP come from the CMS Addendum B file. Lines with denied payments or Medicare as secondary payer were dropped. Spending per Beneficiary, Spending per Service, and Spending per Unit include beneficiary cost-sharing and include the sequester. As per CMS data policy, drugs with fewer than 11 services are not shown to protect patient confidentiality. Number of beneficiaries and spending per beneficiary are marked as n/a for drugs with fewer than 11 beneficiaries.

Appendix: Top 10 Drugs by Total Cost, Spending Per Unit, and Prescription Frequency in Medicare Part B, Medicare Part D, and Medicaid
May 2020 REPORT TO CONGRESS 68
Table A-3 Top 10 Most Frequently Prescribed Drugs, Medicare Part B, Ranked by Total Number of Services
Year Rank HCPCS Description Total Payment
($M) Beneficiaries
(1000s) Spending per
Beneficiary ($) Services (1000s)
Spending per Service ($)
Units (1000s)
Spending per Unit ($)
Medicare Payment Net
of Cost-Sharing ($M)
2008 1 J3420 Vitamin b12 injection 0.9 638 1 2,824 0.33 3,226 0.29 0.6 2 J1100 Dexamethasone sodium phos 1.9 824 2 2,466 0.78 21,530 0.09 1.5 3 J2405 Ondansetron hcl injection 7.8 1,520 5 2,281 3.41 17,940 0.43 5.4 4 J3301 Triamcinolone acetonide inj 13.3 1,404 9 2,250 5.89 9,213 1.44 10.0 5 J7620 Albuterol ipratrop non-comp 157.8 435 363 1,790 88.15 240,892 0.66 121.6 6 J7050 Normal saline solution infus 0.8 389 2 1,630 0.46 2,734 0.28 0.6 7 J1030 Methylprednisolone 40 MG inj 10.1 1,013 10 1,591 6.36 2,294 4.41 7.7 8 J0885 Epoetin alfa, non-esrd 462.3 185 2,493 1,522 303.86 49,918 9.26 362.3 9 J7613 Albuterol non-comp unit 15.7 457 34 1,455 10.82 366,913 0.04 12.5 10 J1040 Methylprednisolone 80 MG inj 14.2 840 17 1,340 10.63 1,663 8.56 10.8
Medicare Part B Spending, Top 10 684.9 533.1
Medicare Part B Spending, All Drugs 13,614.3 10,843.8

Appendix: Top 10 Drugs by Total Cost, Spending Per Unit, and Prescription Frequency in Medicare Part B, Medicare Part D, and Medicaid
May 2020 REPORT TO CONGRESS 69
Table A-3 continued Top 10 Most Frequently Prescribed Drugs, Medicare Part B, Ranked by Total Number of Services
Year Rank HCPCS Description Total Payment
($M) Beneficiaries
(1000s) Spending per
Beneficiary ($) Services (1000s)
Spending per Service ($)
Units (1000s)
Spending per Unit ($)
Medicare Payment Net
of Cost-Sharing ($M)
2009 1 J3420 Vitamin b12 injection 0.8 673 1 3,014 0.26 3,299 0.24 0.6 2 J2405 Ondansetron hcl injection 8.2 1,841 4 2,792 2.92 20,737 0.39 5.6 3 J1100 Dexamethasone sodium phos 2.0 849 2 2,484 0.79 21,572 0.09 1.5 4 J3301 Triamcinolone acet inj NOS 14.7 1,453 10 2,345 6.28 9,619 1.53 11.2 5 J7613 Albuterol non-comp unit 22.6 510 44 1,909 11.85 479,730 0.05 17.0 6 J7620 Albuterol ipratrop non-comp 51.7 407 127 1,730 29.89 205,555 0.25 39.0 7 J1030 Methylprednisolone 40 MG inj 9.4 1,053 9 1,661 5.68 2,395 3.94 7.2 8 J7050 Normal saline solution infus 0.7 382 2 1,547 0.44 2,532 0.27 0.5 9 J0885 Epoetin alfa, non-esrd 463.9 170 2,727 1,453 319.35 48,219 9.62 364.0 10 J1040 Methylprednisolone 80 MG inj 12.8 878 15 1,403 9.11 1,701 7.52 9.7
Medicare Part B Spending, Top 10 586.7 456.4
Medicare Part B Spending, All Drugs 14,488.5 11,547.5

Appendix: Top 10 Drugs by Total Cost, Spending Per Unit, and Prescription Frequency in Medicare Part B, Medicare Part D, and Medicaid
May 2020 REPORT TO CONGRESS 70
Table A-3 continued Top 10 Most Frequently Prescribed Drugs, Medicare Part B, Ranked by Total Number of Services
Year Rank HCPCS Description Total Payment
($M) Beneficiaries
(1000s) Spending per
Beneficiary ($) Services (1000s)
Spending per Service ($)
Units (1000s)
Spending per Unit ($)
Medicare Payment Net
of Cost-Sharing ($M)
2010 1 J3420 Vitamin b12 injection 0.8 654 1 2,930 0.28 3,008 0.27 0.6 2 J1100 Dexamethasone sodium phos 2.0 894 2 2,536 0.77 21,768 0.09 1.5 3 J3301 Triamcinolone acet inj NOS 15.5 1,501 10 2,426 6.39 10,007 1.55 11.8 4 J7613 Albuterol non-comp unit 27.0 519 52 1,863 14.51 467,175 0.06 20.5 5 J7620 Albuterol ipratrop non-comp 44.3 404 110 1,790 24.77 202,350 0.22 33.4 6 J1030 Methylprednisolone 40 MG inj 9.0 1,079 8 1,702 5.30 2,394 3.77 6.9 7 J1040 Methylprednisolone 80 MG inj 12.2 907 14 1,449 8.45 1,742 7.03 9.3 8 J7050 Normal saline solution infus 0.6 341 2 1,368 0.44 2,155 0.28 0.5 9 J0885 Epoetin alfa, non-esrd 421.9 150 2,804 1,297 325.33 43,247 9.76 330.6 10 Q9967 LOCM 300-399mg/ml iodine,1ml 16.5 857 19 1,139 14.47 94,413 0.17 13.0
Medicare Part B Spending, Top 10 549.9 428.1
Medicare Part B Spending, All Drugs 15,478.6 12,336.5

Appendix: Top 10 Drugs by Total Cost, Spending Per Unit, and Prescription Frequency in Medicare Part B, Medicare Part D, and Medicaid
May 2020 REPORT TO CONGRESS 71
Table A-3 continued Top 10 Most Frequently Prescribed Drugs, Medicare Part B, Ranked by Total Number of Services
Year Rank HCPCS Description Total Payment
($M) Beneficiaries
(1000s) Spending per
Beneficiary ($) Services (1000s)
Spending per Service ($)
Units (1000s)
Spending per Unit ($)
Medicare Payment Net
of Cost-Sharing ($M)
2011 1 J3420 Vitamin b12 injection 1.0 638 2 2,753 0.35 2,759 0.35 0.7 2 J3301 Triamcinolone acet inj NOS 17.1 1,590 11 2,568 6.65 10,559 1.62 13.0 3 J1100 Dexamethasone sodium phos 1.8 855 2 2,388 0.77 20,543 0.09 1.4 4 J7613 Albuterol non-comp unit 28.2 537 53 1,886 14.95 456,741 0.06 21.2 5 J7620 Albuterol ipratrop non-comp 45.0 403 112 1,774 25.39 191,322 0.24 34.5 6 J1030 Methylprednisolone 40 MG inj 6.7 1,108 6 1,741 3.84 2,424 2.76 5.1 7 J1040 Methylprednisolone 80 MG inj 11.9 927 13 1,477 8.05 1,721 6.91 9.0 8 J7050 Normal saline solution infus 0.5 298 2 1,207 0.45 1,901 0.28 0.4 9 Q9967 LOCM 300-399mg/ml iodine,1ml 15.3 842 18 1,129 13.57 91,794 0.17 12.0 10 J0885 Epoetin alfa, non-esrd 354.8 129 2,754 1,086 326.60 35,638 9.96 278.1
Medicare Part B Spending, Top 10 482.4 375.4
Medicare Part B Spending, All Drugs 17,191.6 13,733.3

Appendix: Top 10 Drugs by Total Cost, Spending Per Unit, and Prescription Frequency in Medicare Part B, Medicare Part D, and Medicaid
May 2020 REPORT TO CONGRESS 72
Table A-3 continued Top 10 Most Frequently Prescribed Drugs, Medicare Part B, Ranked by Total Number of Services
Year Rank HCPCS Description Total Payment
($M) Beneficiaries
(1000s) Spending per
Beneficiary ($) Services (1000s)
Spending per Service ($)
Units (1000s)
Spending per Unit ($)
Medicare Payment Net
of Cost-Sharing ($M)
2012 1 J3420 Vitamin b12 injection 1.0 638 2 2,753 0.35 2,759 0.35 0.7 2 J3301 Triamcinolone acet inj NOS 17.1 1,590 11 2,568 6.65 10,559 1.62 13.0 3 J1100 Dexamethasone sodium phos 1.8 855 2 2,388 0.77 20,543 0.09 1.4 4 J7613 Albuterol non-comp unit 28.2 537 53 1,886 14.95 456,741 0.06 21.2 5 J1030 Methylprednisolone 40 MG inj 45.0 403 112 1,774 25.39 191,322 0.24 34.5 6 J7620 Albuterol ipratrop non-comp 6.7 1,108 6 1,741 3.84 2,424 2.76 5.1 7 J1040 Methylprednisolone 80 MG inj 11.9 927 13 1,477 8.05 1,721 6.91 9.0 8 J2785 Regadenoson injection 0.5 298 2 1,207 0.45 1,901 0.28 0.4 9 Q9967 LOCM 300-399mg/ml iodine,1ml 15.3 842 18 1,129 13.57 91,794 0.17 12.0 10 J0702 Betamethasone acet&sod phosp 354.8 129 2,754 1,086 326.60 35,638 9.96 278.1
Medicare Part B Spending, Top 10 371.7 290.0
Medicare Part B Spending, All Drugs 19,001.0 15,201.6

Appendix: Top 10 Drugs by Total Cost, Spending Per Unit, and Prescription Frequency in Medicare Part B, Medicare Part D, and Medicaid
May 2020 REPORT TO CONGRESS 73
Table A-3 continued Top 10 Most Frequently Prescribed Drugs, Medicare Part B, Ranked by Total Number of Services
Year Rank HCPCS Description Total Payment
($M) Beneficiaries
(1000s) Spending per
Beneficiary ($) Services (1000s)
Spending per Service ($)
Units (1000s)
Spending per Unit ($)
Medicare Payment Net
of Cost-Sharing ($M)
2013 1 J3420 Vitamin b12 injection 2.9 635 5 2,611 1.11 2,616 1.11 2.2 2 J3301 Triamcinolone acet inj NOS 19.3 1,611 12 2,609 7.38 11,041 1.74 14.6 3 J1100 Dexamethasone sodium phos 2.1 953 2 2,460 0.87 19,725 0.11 1.7 4 J7613 Albuterol non-comp unit 21.6 581 37 1,871 11.54 429,856 0.05 16.1 5 J1030 Methylprednisolone 40 MG inj 7.2 1,153 6 1,816 3.96 2,542 2.83 5.5 6 J7620 Albuterol ipratrop non-comp 32.6 423 77 1,673 19.47 169,941 0.19 24.3 7 J1040 Methylprednisolone 80 MG inj 9.5 946 10 1,500 6.36 1,745 5.47 7.2 8 J2785 Regadenoson injection 248.6 1,181 211 1,199 207.44 4,638 53.61 196.2 9 Q9967 LOCM 300-399mg/ml iodine,1ml 14.0 820 17 1,146 12.25 86,550 0.16 11.1 10 J0702 Betamethasone acet&sod phosp 14.2 707 20 1,099 12.93 2,559 5.55 10.9
Medicare Part B Spending, Top 10 372.1 289.6
Medicare Part B Spending, All Drugs 20,331.5 16,231.8

Appendix: Top 10 Drugs by Total Cost, Spending Per Unit, and Prescription Frequency in Medicare Part B, Medicare Part D, and Medicaid
May 2020 REPORT TO CONGRESS 74
Table A-3 continued Top 10 Most Frequently Prescribed Drugs, Medicare Part B, Ranked by Total Number of Services
Year Rank HCPCS Description Total Payment
($M) Beneficiaries
(1000s) Spending per
Beneficiary ($) Services (1000s)
Spending per Service ($)
Units (1000s)
Spending per Unit ($)
Medicare Payment Net
of Cost-Sharing ($M)
2014 1 J3301 Triamcinolone acet inj nos 19.5 1,641 12 2,642 7.39 11,168 1.75 14.8 2 J1100 Dexamethasone sodium phos 2.6 982 3 2,461 1.05 19,556 0.13 2.0 3 J3420 Vitamin b12 injection 4.7 581 8 2,327 2.02 2,331 2.02 3.4 4 J1030 Methylprednisolone 40 mg inj 7.8 1,192 7 1,880 4.16 2,656 2.95 6.0 5 J7613 Albuterol non-comp unit 18.1 530 34 1,647 10.97 354,647 0.05 13.4 6 J7620 Albuterol ipratrop non-comp 26.9 409 66 1,508 17.87 151,477 0.18 20.0 7 J1040 Methylprednisolone 80 mg inj 9.7 946 10 1,491 6.54 1,732 5.63 7.4 8 Q9967 Locm 300-399mg/ml iodine,1ml 15.8 827 19 1,160 13.63 86,806 0.18 12.4 9 J0702 Betamethasone acet&sod phosp 14.6 721 20 1,110 13.16 2,611 5.59 11.1 10 J0696 Ceftriaxone sodium injection 2.6 598 4 1,019 2.60 3,857 0.69 2.0
Medicare Part B Spending, Top 10 122.5 92.6
Medicare Part B Spending, All Drugs 21,597.8 17,240.2

Appendix: Top 10 Drugs by Total Cost, Spending Per Unit, and Prescription Frequency in Medicare Part B, Medicare Part D, and Medicaid
May 2020 REPORT TO CONGRESS 75
Table A-3 continued Top 10 Most Frequently Prescribed Drugs, Medicare Part B, Ranked by Total Number of Services
Year Rank HCPCS Description Total Payment
($M) Beneficiaries
(1000s) Spending per
Beneficiary ($) Services (1000s)
Spending per Service ($)
Units (1000s)
Spending per Unit ($)
Medicare Payment Net
of Cost-Sharing ($M)
2015 1 J3301 Triamcinolone acet inj nos 20.8 1,724 12 2,783 7.48 11,915 1.75 15.8 2 J1100 Dexamethasone sodium phos 2.7 1,032 3 2,483 1.10 19,403 0.14 2.1 3 J3420 Vitamin b12 injection 6.8 572 12 2,367 2.88 2,369 2.88 5.0 4 J1030 Methylprednisolone 40 mg inj 9.8 1,233 8 1,943 5.02 2,774 3.52 7.5 5 J7613 Albuterol non-comp unit 20.6 517 40 1,556 13.25 321,972 0.06 15.4 6 J1040 Methylprednisolone 80 mg inj 11.5 960 12 1,511 7.59 1,759 6.52 8.7 7 J7620 Albuterol ipratrop non-comp 23.6 416 57 1,457 16.23 144,047 0.16 17.5 8 Q9967 Locm 300-399mg/ml iodine,1ml 13.2 837 16 1,165 11.32 87,560 0.15 10.3 9 J0702 Betamethasone acet&sod phosp 15.9 750 21 1,156 13.72 2,744 5.78 12.1 10 J0696 Ceftriaxone sodium injection 2.8 634 4 1,072 2.65 4,071 0.70 2.1
Medicare Part B Spending, Top 10 127.7 96.5
Medicare Part B Spending, All Drugs 23,813.3 19,007.1

Appendix: Top 10 Drugs by Total Cost, Spending Per Unit, and Prescription Frequency in Medicare Part B, Medicare Part D, and Medicaid
May 2020 REPORT TO CONGRESS 76
Table A-3 continued Top 10 Most Frequently Prescribed Drugs, Medicare Part B, Ranked by Total Number of Services
Year Rank HCPCS Description Total Payment
($M) Beneficiaries
(1000s) Spending per
Beneficiary ($) Services (1000s)
Spending per Service ($)
Units (1000s)
Spending per Unit ($)
Medicare Payment Net
of Cost-Sharing ($M)
2016 1 J3301 Triamcinolone acet inj nos 22.5 1,819 12 2,950 7.62 12,824 1.75 16.9 2 J1100 Dexamethasone sodium phos 2.6 1,091 2 2,536 1.03 19,762 0.13 2.0 3 J3420 Vitamin b12 injection 9.1 584 16 2,448 3.71 2,454 3.70 6.8 4 J1030 Methylprednisolone 40 mg inj 13.2 1,254 11 1,969 6.69 2,840 4.64 10.0 5 J7613 Albuterol non-comp unit 14.3 510 28 1,508 9.51 304,221 0.05 10.5 6 J1040 Methylprednisolone 80 mg inj 15.6 960 16 1,507 10.34 1,763 8.84 11.7 7 J7620 Albuterol ipratrop non-comp 22.5 426 53 1,439 15.64 139,231 0.16 16.7 8 Q9967 Locm 300-399mg/ml iodine,1ml 11.1 864 13 1,209 9.17 90,733 0.12 8.7 9 J0702 Betamethasone acet&sod phosp 17.0 777 22 1,204 14.15 2,922 5.83 12.9 10 J0696 Ceftriaxone sodium injection 2.5 642 4 1,091 2.32 4,165 0.61 1.8
Medicare Part B Spending, Top 10 130.4 98.2
Medicare Part B Spending, All Drugs 27,266.7 21,789.6
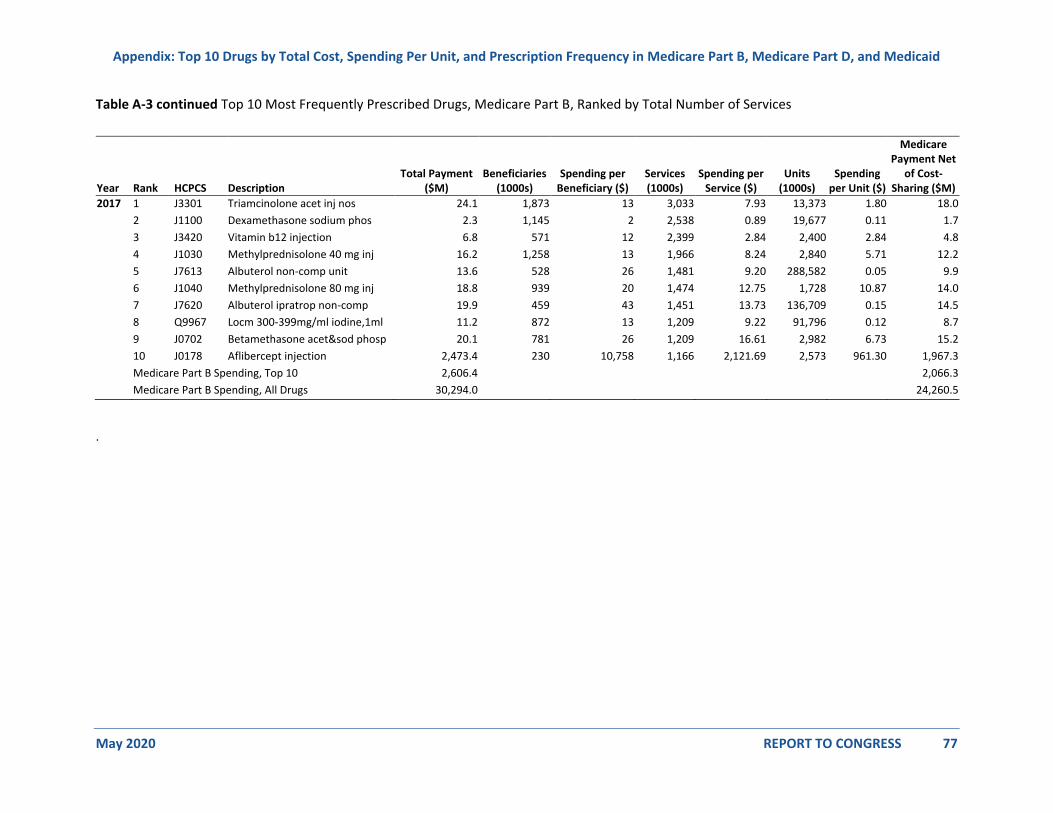
Appendix: Top 10 Drugs by Total Cost, Spending Per Unit, and Prescription Frequency in Medicare Part B, Medicare Part D, and Medicaid
May 2020 REPORT TO CONGRESS 77
Table A-3 continued Top 10 Most Frequently Prescribed Drugs, Medicare Part B, Ranked by Total Number of Services
Year Rank HCPCS Description Total Payment
($M) Beneficiaries
(1000s) Spending per
Beneficiary ($) Services (1000s)
Spending per Service ($)
Units (1000s)
Spending per Unit ($)
Medicare Payment Net
of Cost-Sharing ($M)
2017 1 J3301 Triamcinolone acet inj nos 24.1 1,873 13 3,033 7.93 13,373 1.80 18.0 2 J1100 Dexamethasone sodium phos 2.3 1,145 2 2,538 0.89 19,677 0.11 1.7 3 J3420 Vitamin b12 injection 6.8 571 12 2,399 2.84 2,400 2.84 4.8 4 J1030 Methylprednisolone 40 mg inj 16.2 1,258 13 1,966 8.24 2,840 5.71 12.2 5 J7613 Albuterol non-comp unit 13.6 528 26 1,481 9.20 288,582 0.05 9.9 6 J1040 Methylprednisolone 80 mg inj 18.8 939 20 1,474 12.75 1,728 10.87 14.0 7 J7620 Albuterol ipratrop non-comp 19.9 459 43 1,451 13.73 136,709 0.15 14.5 8 Q9967 Locm 300-399mg/ml iodine,1ml 11.2 872 13 1,209 9.22 91,796 0.12 8.7 9 J0702 Betamethasone acet&sod phosp 20.1 781 26 1,209 16.61 2,982 6.73 15.2 10 J0178 Aflibercept injection 2,473.4 230 10,758 1,166 2,121.69 2,573 961.30 1,967.3
Medicare Part B Spending, Top 10 2,606.4 2,066.3
Medicare Part B Spending, All Drugs 30,294.0 24,260.5
.

Appendix: Top 10 Drugs by Total Cost, Spending Per Unit, and Prescription Frequency in Medicare Part B, Medicare Part D, and Medicaid
May 2020 REPORT TO CONGRESS 78
Table A-3 continued Top 10 Most Frequently Prescribed Drugs, Medicare Part B, Ranked by Total Number of Services
Year Rank HCPCS Description Total Payment
($M) Beneficiaries
(1000s) Spending per
Beneficiary ($) Services (1000s)
Spending per Service ($)
Units (1000s)
Spending per Unit ($)
Medicare Payment Net
of Cost-Sharing ($M)
2018 1 J3301 Triamcinolone acet inj nos 24.4 1,904 13 3,080 7.91 13,600 1.79 18.2 2 J1100 Dexamethasone sodium phos 2.3 1,162 2 2,500 0.91 19,493 0.12 1.7 3 J3420 Vitamin b12 injection 4.4 546 8 2,291 1.93 2,293 1.93 3.2 4 J1030 Methylprednisolone 40 mg inj 18.1 1,214 15 1,890 9.60 2,749 6.60 13.7 5 J7613 Albuterol non-comp unit 12.4 521 24 1,439 8.64 273,376 0.05 9.0 6 J7620 Albuterol ipratrop non-comp 17.4 465 37 1,433 12.10 132,891 0.13 12.8 7 J1040 Methylprednisolone 80 mg inj 20.6 883 23 1,373 14.99 1,609 12.79 15.3 8 J0178 Aflibercept injection 2,579.6 241 10,691 1,231 2,095.60 2,736 942.72 2,051.4 9 Q9967 Locm 300-399mg/ml iodine,1ml 11.3 888 13 1,217 9.25 93,639 0.12 8.8 10 J0702 Betamethasone acet&sod phosp 20.7 769 27 1,180 17.53 2,942 7.03 15.6
Medicare Part B Spending, Top 10 2,711.2 2,149.7
Medicare Part B Spending, All Drugs 33,200.9 26,602.5
Source: Analysis of carrier, durable medical, and outpatient claims data 2006-2018 by Acumen for ASPE. Data include Part B covered drugs administered in physicians' offices and furnished by suppliers, covered drugs in hospital outpatient departments; and reflect only Part B drugs paid under the average sales price plus 6 percent (ASP) methodology. The Healthcare Common Procedure Coding System (HCPCS) codes and prices for carrier and DM were obtained from the CMS ASP file, those for OP come from the CMS Addendum B file. Lines with denied payments or Medicare as secondary payer were dropped. Spending per Beneficiary, Spending per Service, and Spending per Unit include beneficiary cost-sharing and include the sequester.

Appendix: Top 10 Drugs by Total Cost, Spending Per Unit, and Prescription Frequency in Medicare Part B, Medicare Part D, and Medicaid
May 2020 REPORT TO CONGRESS 79
Table A-4 Top 10 High-Cost Prescribed Drugs, Medicare Part D, Ranked by Program Spending
Year Rank Brand Name Gross Drug Cost
($M) Claims (1000s)
Units Dispensed
(1000s) Beneficiaries
(1000s) GDC per Claim ($)
GDC per Unit ($)
GDC per User ($)
Total Estimated Government (net of Cost-Sharing, in
$M)
2008 1 Lipitor 2,397.8 18,446.2 812,966.5 3,124.8 129.99 2.95 767.34 1,349.4 2 Plavix 2,305.1 14,268.3 601,948.6 2,156.1 161.56 3.83 1,069.10 1,319.8 3 Nexium 1,487.0 7,910.2 314,143.7 1,480.1 187.99 4.73 1,004.66 978.7 4 Seroquel 1,462.2 6,038.8 306,095.0 767.1 242.13 4.78 1,906.03 1,152.5 5 Aricept 1,326.1 7,102.7 256,076.3 1,041.5 186.71 5.18 1,273.33 803.6 6 Zyprexa 1,229.0 2,814.5 97,134.6 339.6 436.69 12.65 3,618.96 1,004.4 7 Advair Diskus 1,213.3 5,507.7 413,199.2 1,278.7 220.29 2.94 948.88 774.5 8 Actos 1,063.0 5,174.6 220,536.5 846.1 205.42 4.82 1,256.35 663.1 9 Prevacid 947.2 5,176.2 206,602.2 949.1 182.99 4.58 998.02 780.5 10 Abilify 837.1 1,841.7 59,250.7 279.4 454.51 14.13 2,995.69 696.7 Medicare Part D Spending, Top 10 14,267.8 9,523.1
Medicare Part D Spending, All Drugs 68,223.6 44,840.0

Appendix: Top 10 Drugs by Total Cost, Spending Per Unit, and Prescription Frequency in Medicare Part B, Medicare Part D, and Medicaid
May 2020 REPORT TO CONGRESS 80
Table A-4 continued Top 10 High-Cost Prescribed Drugs, Medicare Part D, Ranked by Program Spending
Year Rank Brand Name Gross Drug Cost
($M) Claims (1000s)
Units Dispensed
(1000s) Beneficiaries
(1000s) GDC per Claim ($)
GDC per Unit ($)
GDC per User ($)
Total Estimated Government (net of Cost-Sharing, in
$M)
2009 1 Plavix 2,721.3 15,091.7 577,272.2 2,308.9 180.32 4.71 1,178.60 1,527.9 2 Lipitor 2,288.4 16,124.6 653,606.5 2,797.1 141.92 3.50 818.12 1,236.4 3 Nexium 1,676.8 8,185.9 316,028.8 1,538.1 204.85 5.31 1,090.19 1,097.5 4 Seroquel 1,647.0 6,114.6 335,895.3 778.7 269.35 4.90 2,114.95 1,276.2 5 Aricept 1,585.3 7,537.4 247,633.8 1,107.9 210.32 6.40 1,430.90 939.8 6 Advair Diskus 1,394.2 5,919.7 427,927.5 1,360.5 235.52 3.26 1,024.75 871.3 7 Zyprexa 1,341.4 2,730.6 117,748.0 328.8 491.23 11.39 4,079.42 1,085.1 8 Actos 1,188.3 5,105.6 213,588.7 839.0 232.74 5.56 1,416.26 729.3 9 Abilify 1,079.2 2,210.0 73,310.5 337.8 488.35 14.72 3,194.42 879.2 10 Flomax 958.9 6,533.8 288,158.8 1,226.3 146.76 3.33 781.99 500.8 Medicare Part D Spending, Top 10 15,880.7 10,143.6
Medicare Part D Spending, All Drugs 73,520.0 47,329.5

Appendix: Top 10 Drugs by Total Cost, Spending Per Unit, and Prescription Frequency in Medicare Part B, Medicare Part D, and Medicaid
May 2020 REPORT TO CONGRESS 81
Table A-4 continued Top 10 High-Cost Prescribed Drugs, Medicare Part D, Ranked by Program Spending
Year Rank Brand Name Gross Drug Cost
($M) Claims (1000s)
Units Dispensed
(1000s) Beneficiaries
(1000s) GDC per Claim ($)
GDC per Unit ($)
GDC per User ($)
Total Estimated Government (net of Cost-Sharing, in
$M)
2010 1 Plavix 3,105.2 15,235.3 573,566.4 2,371.2 203.81 5.41 1,309.54 1,772.6 2 Lipitor 2,280.9 14,347.6 586,401.3 2,457.2 158.98 3.89 928.28 1,244.9 3 Nexium 1,858.7 8,488.2 332,456.5 1,556.0 218.97 5.59 1,194.58 1,270.4 4 Seroquel 1,817.0 5,990.0 282,975.9 771.7 303.34 6.42 2,354.64 1,415.0 5 Aricept 1,796.6 7,206.5 238,494.8 1,096.9 249.31 7.53 1,637.92 1,083.0 6 Advair Diskus 1,517.5 6,113.5 423,206.3 1,402.4 248.21 3.59 1,082.04 959.6 7 Zyprexa 1,487.0 2,688.4 91,173.5 325.3 553.13 16.31 4,571.81 1,215.3 8 Actos 1,270.4 5,019.2 199,166.3 853.4 253.11 6.38 1,488.63 788.7 9 Abilify 1,226.4 2,296.7 71,850.3 338.6 533.99 17.07 3,621.85 1,003.9 10 Crestor 1,095.8 7,020.9 273,762.9 1,304.0 156.08 4.00 840.31 617.8 Medicare Part D Spending, Top 10 17,455.6 11,371.3
Medicare Part D Spending, All Drugs 77,418.4 50,526.2

Appendix: Top 10 Drugs by Total Cost, Spending Per Unit, and Prescription Frequency in Medicare Part B, Medicare Part D, and Medicaid
May 2020 REPORT TO CONGRESS 82
Table A-4 continued Top 10 High-Cost Prescribed Drugs, Medicare Part D, Ranked by Program Spending
Year Rank Brand Name Gross Drug Cost
($M) Claims (1000s)
Units Dispensed
(1000s) Beneficiaries
(1000s) GDC per Claim ($)
GDC per Unit ($)
GDC per User ($)
Total Estimated Government (net of Cost-Sharing, in
$M)
2011 1 Plavix 3,656.7 15,209.9 591,894.7 2,395.4 240.42 6.18 1,526.57 2,047.8 2 Lipitor 2,672.9 13,774.0 584,820.9 2,607.5 194.05 4.57 1,025.08 1,441.6 3 Seroquel 2,045.3 5,937.4 280,754.1 762.7 344.48 7.28 2,681.73 1,568.9 4 Nexium 1,970.1 8,223.8 334,287.8 1,516.2 239.56 5.89 1,299.34 1,334.8 5 Advair Diskus 1,664.9 6,168.1 436,745.3 1,402.4 269.91 3.81 1,187.16 1,028.4 6 Zyprexa 1,625.3 2,408.1 81,766.3 312.6 674.94 19.88 5,199.61 1,317.4 7 Abilify 1,469.6 2,447.9 77,464.4 360.7 600.36 18.97 4,074.93 1,186.1 8 Crestor 1,416.3 7,826.7 318,709.3 1,496.0 180.96 4.44 946.70 782.5 9 Actos 1,294.1 4,484.5 184,544.5 778.7 288.57 7.01 1,661.93 779.7 10 Spiriva 1,288.4 4,815.4 172,359.5 981.3 267.57 7.48 1,312.91 765.5 Medicare Part D Spending, Top 10 19,103.6
12,252.7
Medicare Part D Spending, All Drugs 84,639.2
54,815.2

Appendix: Top 10 Drugs by Total Cost, Spending Per Unit, and Prescription Frequency in Medicare Part B, Medicare Part D, and Medicaid
May 2020 REPORT TO CONGRESS 83
Table A-4 continued Top 10 High-Cost Prescribed Drugs, Medicare Part D, Ranked by Program Spending
Year Rank Brand Name Gross Drug Cost
($M) Claims (1000s)
Units Dispensed
(1000s) Beneficiaries
(1000s) GDC per Claim ($)
GDC per Unit ($)
GDC per User ($)
Total Estimated Government (net of Cost-Sharing, in
$M)
2012 1 Nexium 2,124.2 7,911.8 337,691.6 1,434.2 268.49 6.29 1,481.16 1,388.6 2 Advair Diskus 1,886.3 6,288.9 452,552.6 1,424.3 299.94 4.17 1,324.39 1,131.6 3 Crestor 1,789.8 8,624.5 361,021.6 1,598.1 207.53 4.96 1,119.94 971.7 4 Abilify 1,758.0 2,572.0 82,133.7 376.6 683.54 21.40 4,668.48 1,388.1 5 Plavix 1,690.7 6,468.8 258,051.4 2,032.7 261.35 6.55 831.73 968.4 6 Spiriva 1,603.2 5,275.9 193,071.2 1,065.5 303.87 8.30 1,504.59 928.3 7 Cymbalta 1,453.8 5,776.3 243,795.2 912.8 251.69 5.96 1,592.77 924.4 8 Atorvastatin Calcium 1,347.8 16,152.8 734,283.3 3,655.9 83.44 1.84 368.67 752.7 9 Namenda 1,327.4 5,425.4 345,809.0 757.6 244.66 3.84 1,752.13 750.9 10 Januvia 1,113.0 3,766.1 149,648.7 666.6 295.53 7.44 1,669.77 645.3 Medicare Part D Spending, Top 10 16,094.2
9,850.1
Medicare Part D Spending, All Drugs 89,524.6
57,004.1

Appendix: Top 10 Drugs by Total Cost, Spending Per Unit, and Prescription Frequency in Medicare Part B, Medicare Part D, and Medicaid
May 2020 REPORT TO CONGRESS 84
Table A-4 continued Top 10 High-Cost Prescribed Drugs, Medicare Part D, Ranked by Program Spending
Year Rank Brand Name Gross Drug Cost
($M) Claims (1000s)
Units Dispensed
(1000s) Beneficiaries
(1000s) GDC per Claim ($)
GDC per Unit ($)
GDC per User ($)
Total Estimated Government (net of Cost-Sharing, in
$M)
2013 1 Nexium 2,526.3 8,192.4 360,017.7 1,484.0 308.38 7.02 1,702.39 1,516.8 2 Advair Diskus 2,263.1 6,605.7 492,979.4 1,527.2 342.60 4.59 1,481.83 1,246.7 3 Crestor 2,216.2 9,066.6 401,735.0 1,732.7 244.44 5.52 1,279.02 1,098.9 4 Abilify 2,107.1 2,886.9 86,132.7 396.8 729.89 24.46 5,310.84 1,593.9 5 Cymbalta 1,961.2 6,887.7 279,891.9 1,032.8 284.74 7.01 1,898.98 1,147.2 6 Spiriva 1,958.6 5,735.3 218,670.5 1,181.6 341.51 8.96 1,657.60 1,043.7 7 Namenda 1,564.8 6,878.5 347,985.0 798.7 227.49 4.50 1,959.14 812.4 8 januvia 1,460.6 4,358.9 174,161.4 761.8 335.08 8.39 1,917.32 781.4 9 Lantus Solostar 1,372.0 3,864.0 80,270.4 862.9 355.09 17.09 1,590.06 719.3 10 Revlimid 1,349.9 153.8 3,227.5 24.6 8,778.38 418.26 54,794.71 853.5 Medicare Part D Spending, Top 10 18,779.9
10,813.8
Medicare Part D Spending, All Drugs 103,334.3
62,585.7

Appendix: Top 10 Drugs by Total Cost, Spending Per Unit, and Prescription Frequency in Medicare Part B, Medicare Part D, and Medicaid
May 2020 REPORT TO CONGRESS 85
Table A-4 continued Top 10 High-Cost Prescribed Drugs, Medicare Part D, Ranked by Program Spending
Year Rank Brand Name Gross Drug Cost
($M) Claims (1000s)
Units Dispensed
(1000s) Beneficiaries
(1000s) GDC per Claim ($)
GDC per Unit ($)
GDC per User ($)
Total Estimated Government (net of Cost-Sharing, in
$M)
2014 1 Sovaldi 3,102.2 109.4 3,050.8 33.0 28,360.47 1,016.87 93,970.21 2,311.5 2 Nexium 2,658.3 7,533.5 340,109.6 1,405.3 352.86 7.82 1,891.56 1,568.1 3 Crestor 2,541.2 9,065.4 418,795.5 1,751.6 280.32 6.07 1,450.83 1,205.3 4 Abilify 2,524.9 2,961.4 88,079.9 404.8 852.60 28.67 6,237.58 1,878.4 5 Advair Diskus 2,273.8 6,087.5 459,844.7 1,419.7 373.51 4.94 1,601.58 1,185.5 6 Spiriva 2,156.2 5,847.1 228,758.3 1,211.1 368.77 9.43 1,780.38 1,105.4 7 Lantus Solostar 2,014.7 4,437.2 92,674.1 972.5 454.04 21.74 2,071.61 1,011.6 8 Januvia 1,773.8 4,493.2 183,418.8 789.4 394.77 9.67 2,247.03 903.0 9 Lantus 1,724.2 4,281.2 80,133.3 786.6 402.73 21.52 2,192.01 935.3 10 Revlimid 1,670.5 178.3 3,705.1 27.1 9,371.24 450.86 61,557.30 972.2 Medicare Part D Spending, Top 10 22,439.8
13,076.5
Medicare Part D Spending, All Drugs 121,001.4
71,948.6

Appendix: Top 10 Drugs by Total Cost, Spending Per Unit, and Prescription Frequency in Medicare Part B, Medicare Part D, and Medicaid
May 2020 REPORT TO CONGRESS 86
Table A-4 continued Top 10 High-Cost Prescribed Drugs, Medicare Part D, Ranked by Program Spending
Year Rank Brand Name Gross Drug Cost
($M) Claims (1000s)
Units Dispensed
(1000s) Beneficiaries
(1000s) GDC per Claim ($)
GDC per Unit ($)
GDC per User ($)
Total Estimated Government (net of Cost-Sharing, in
$M)
2015 1 Harvoni 7,031.6 225.9 6,238.8 75.7 31,130.80 1,127.08 92,845.71 4,771.3 2 Crestor 2,883.2 8,712.2 416,827.2 1,733.0 330.93 6.92 1,663.66 1,270.2 3 Lantus Solostar 2,483.3 4,861.7 100,569.1 1,041.4 510.80 24.69 2,384.66 1,175.4 4 Advair Diskus 2,270.2 5,649.5 430,440.5 1,321.5 401.83 5.27 1,717.85 1,084.5 5 Spiriva 2,191.7 5,447.2 212,261.8 1,142.2 402.35 10.33 1,918.78 1,042.5 6 Januvia 2,131.9 4,623.6 193,043.8 828.8 461.10 11.04 2,572.33 1,011.4 7 Revlimid 2,077.7 204.9 4,240.8 30.5 10,140.47 489.92 68,220.65 1,121.5 8 Nexium 2,012.9 5,470.9 251,472.7 1,127.9 367.93 8.00 1,784.61 1,184.3 9 Lantus 1,876.3 3,993.9 75,074.9 734.0 469.80 24.99 2,556.48 961.4 10 Lyrica 1,765.7 4,731.6 346,639.6 825.5 373.17 5.09 2,138.85 963.7 Medicare Part D Spending, Top 10 26,724.4
14,586.2
Medicare Part D Spending, All Drugs 136,841.9
77,659.0

Appendix: Top 10 Drugs by Total Cost, Spending Per Unit, and Prescription Frequency in Medicare Part B, Medicare Part D, and Medicaid
May 2020 REPORT TO CONGRESS 87
Table A-4 continued Top 10 High-Cost Prescribed Drugs, Medicare Part D, Ranked by Program Spending
Year Rank Brand Name Gross Drug Cost
($M) Claims (1000s)
Units Dispensed
(1000s) Beneficiaries
(1000s) GDC per Claim ($)
GDC per Unit ($)
GDC per User ($)
Total Estimated Government (net of Cost-Sharing, in
$M)
2016 1 Harvoni 4,399.7 141.7 3,933.3 52.8 31,047.66 1,118.58 83,326.10 2,958.0 2 Revlimid 2,661.6 239.1 4,896.2 35.4 11,132.08 543.60 75,243.90 1,398.1 3 Lantus solostar 2,526.4 5,029.2 102,691.2 1,075.4 502.35 24.60 2,349.23 1,161.4 4 Januvia 2,440.4 4,743.2 203,654.2 864.6 514.50 11.98 2,822.56 1,119.7 5 Crestor 2,323.1 6,013.5 285,722.2 1,560.3 386.32 8.13 1,488.87 1,066.5 6 Advair Diskus 2,320.1 5,195.1 401,111.3 1,196.2 446.60 5.78 1,939.58 1,070.4 7 Lyrica 2,097.1 4,939.8 364,403.5 852.3 424.54 5.75 2,460.47 1,123.5 8 Xarelto 1,955.0 4,403.9 167,518.1 808.0 443.93 11.67 2,419.69 729.6 9 Eliquis 1,926.3 4,456.3 328,547.8 827.1 432.27 5.86 2,329.07 690.1 10 Spiriva 1,819.1 4,153.7 164,588.2 903.6 437.95 11.05 2,013.07 817.8 Medicare Part D Spending, Top 10 24,468.9
12,135.1
Medicare Part D Spending, All Drugs 145,439.6
80,365.0

Appendix: Top 10 Drugs by Total Cost, Spending Per Unit, and Prescription Frequency in Medicare Part B, Medicare Part D, and Medicaid
May 2020 REPORT TO CONGRESS 88
Table A-4 continued Top 10 High-Cost Prescribed Drugs, Medicare Part D, Ranked by Program Spending
Year Rank Brand Name Gross Drug Cost
($M) Claims (1000s)
Units Dispensed
(1000s) Beneficiaries
(1000s) GDC per Claim ($)
GDC per Unit ($)
GDC per User ($)
Total Estimated Government (net of Cost-Sharing, in
$M)
2017 1 Revlimid 3,312.8 259.7 5,283.7 37.5 12,756.50 626.98 88,442.03 1,654.1 2 Eliquis 3,078.9 6,352.2 480,038.5 1,143.1 484.70 6.41 2,693.42 1,032.9 3 Januvia 2,786.1 4,833.9 216,563.6 893.6 576.36 12.86 3,117.75 1,220.9 4 Lantus solostar 2,632.4 5,236.0 106,072.4 1,112.4 502.74 24.82 2,366.34 1,152.0 5 Xarelto 2,611.8 5,246.1 204,631.9 952.9 497.86 12.76 2,740.80 949.6 6 Harvoni 2,555.8 81.9 2,282.8 32.4 31,207.60 1,119.62 78,891.25 1,611.1 7 Lyrica 2,516.9 5,071.9 377,949.8 876.1 496.24 6.66 2,872.90 1,275.5 8 Advair Diskus 2,374.8 4,881.7 381,843.2 1,135.9 486.48 6.22 2,090.73 1,040.5 9 Humira Pen 2,015.7 370.8 901.5 51.8 5,436.12 2,235.96 38,889.78 1,124.3 10 Spiriva 1,662.0 3,358.3 136,812.8 717.9 494.90 12.15 2,315.25 702.7 Medicare Part D Spending, Top 10 25,547.2
11,763.7
Medicare Part D Spending, All Drugs 154,229.6
81,332.7

Appendix: Top 10 Drugs by Total Cost, Spending Per Unit, and Prescription Frequency in Medicare Part B, Medicare Part D, and Medicaid
May 2020 REPORT TO CONGRESS 89
Table A-4 continued Top 10 High-Cost Prescribed Drugs, Medicare Part D, Ranked by Program Spending
Year Rank Brand Name Gross Drug Cost
($M) Claims (1000s)
Units Dispensed
(1000s) Beneficiaries
(1000s) GDC per Claim ($)
GDC per Unit ($)
GDC per User ($)
Total Estimated Government (net of Cost-Sharing, in
$M)
2018 1 Eliquis 4,992.2 9,092.0 713,807.3 1,646.8 549.07 6.99 3,031.46 1,610.4 2 Revlimid 4,065.1 285.9 5,829.3 39.5 14,217.06 697.35 103,030.51 1,975.2 3 Xarelto 3,358.8 5,896.6 240,480.2 1,050.6 569.62 13.97 3,196.91 1,137.6 4 Januvia 3,228.9 4,819.5 226,814.5 919.6 669.97 14.24 3,511.30 1,352.6 5 Lyrica 2,950.2 5,222.2 391,129.0 905.0 564.93 7.54 3,260.06 1,431.5 6 Advair Diskus 2,394.0 4,398.7 356,768.1 1,031.0 544.25 6.71 2,321.93 997.9 7 Humira Pen 2,388.8 394.6 971.9 53.7 6,053.45 2,457.82 44,500.54 1,290.9 8 Lantus Solostar 2,370.5 4,475.8 89,306.4 1,050.7 529.62 26.54 2,256.12 953.5 9 Imbruvica 1,867.2 165.2 7,909.0 21.9 11,300.24 236.09 85,128.43 868.6 10 Symbicort 1,751.2 4,265.2 55,342.5 1,039.6 410.58 31.64 1,684.58 796.4 Medicare Part D Spending, Top 10 29,366.8
12,414.7
Medicare Part D Spending, All Drugs 167,628.6
85,207.5
Source: Analysis of Medicare claims data (carrier, outpatient) and Part D prescription drug event records by Acumen for ASPE.
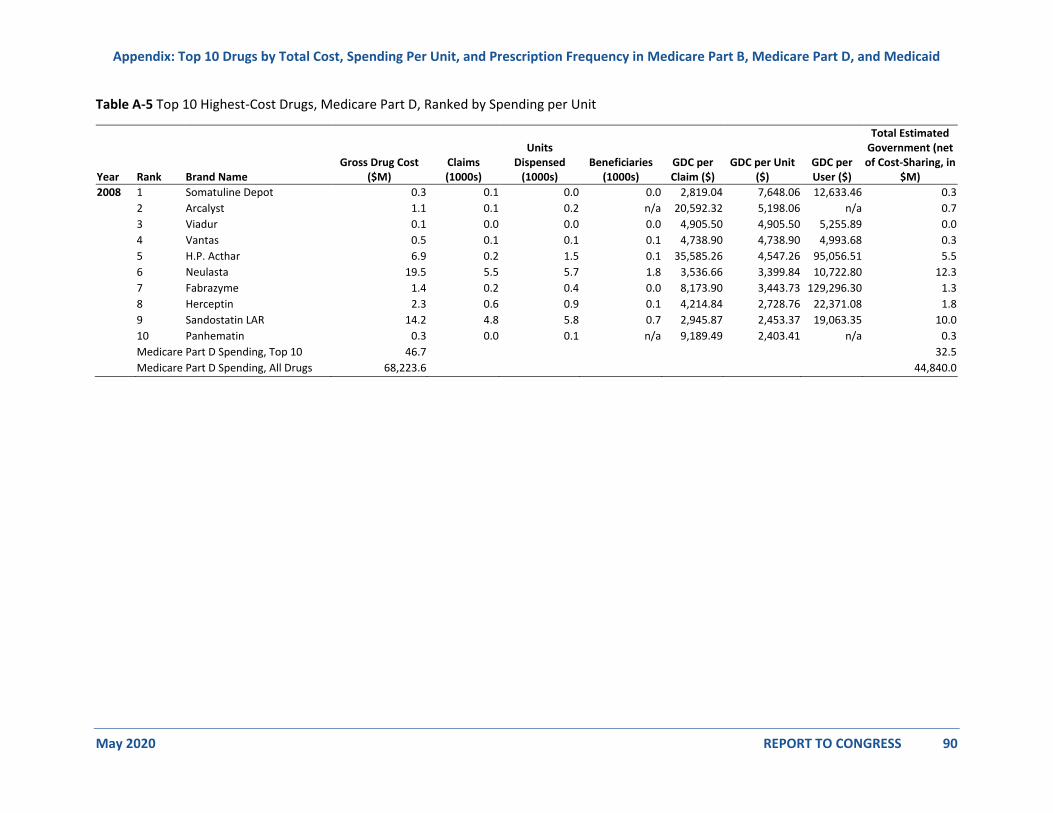
Appendix: Top 10 Drugs by Total Cost, Spending Per Unit, and Prescription Frequency in Medicare Part B, Medicare Part D, and Medicaid
May 2020 REPORT TO CONGRESS 90
Table A-5 Top 10 Highest-Cost Drugs, Medicare Part D, Ranked by Spending per Unit
Year Rank Brand Name Gross Drug Cost
($M) Claims (1000s)
Units Dispensed
(1000s) Beneficiaries
(1000s) GDC per Claim ($)
GDC per Unit ($)
GDC per User ($)
Total Estimated Government (net of Cost-Sharing, in
$M)
2008 1 Somatuline Depot 0.3 0.1 0.0 0.0 2,819.04 7,648.06 12,633.46 0.3 2 Arcalyst 1.1 0.1 0.2 n/a 20,592.32 5,198.06 n/a 0.7 3 Viadur 0.1 0.0 0.0 0.0 4,905.50 4,905.50 5,255.89 0.0 4 Vantas 0.5 0.1 0.1 0.1 4,738.90 4,738.90 4,993.68 0.3 5 H.P. Acthar 6.9 0.2 1.5 0.1 35,585.26 4,547.26 95,056.51 5.5 6 Neulasta 19.5 5.5 5.7 1.8 3,536.66 3,399.84 10,722.80 12.3 7 Fabrazyme 1.4 0.2 0.4 0.0 8,173.90 3,443.73 129,296.30 1.3 8 Herceptin 2.3 0.6 0.9 0.1 4,214.84 2,728.76 22,371.08 1.8 9 Sandostatin LAR 14.2 4.8 5.8 0.7 2,945.87 2,453.37 19,063.35 10.0 10 Panhematin 0.3 0.0 0.1 n/a 9,189.49 2,403.41 n/a 0.3 Medicare Part D Spending, Top 10 46.7 32.5
Medicare Part D Spending, All Drugs 68,223.6 44,840.0

Appendix: Top 10 Drugs by Total Cost, Spending Per Unit, and Prescription Frequency in Medicare Part B, Medicare Part D, and Medicaid
May 2020 REPORT TO CONGRESS 91
Table A-5 continued Top 10 High-Cost Prescribed Drugs, Medicare Part D, Ranked by Spending per Unit
Year Rank Brand Name Gross Drug Cost
($M) Claims (1000s)
Units Dispensed
(1000s) Beneficiaries
(1000s) GDC per Claim ($)
GDC per Unit ($)
GDC per User ($)
Total Estimated Government (net of Cost-Sharing, in
$M)
2009 1 Stelara 1.5 0.2 0.2 0.1 8,361.83 9,541.40 11,889.48 1.1 2 Somatuline Depot 1.1 0.4 0.1 0.1 3,011.21 7,875.82 21,138.69 0.8 3 Mozobil 0.7 0.0 0.1 0.0 14,950.95 5,564.27 18,587.67 0.5 4 Arcalyst 2.2 0.1 0.4 0.0 22,317.79 5,235.69 184,121.78 1.6 5 Neulasta 22.5 6.1 4.5 2.0 3,693.07 5,009.98 11,121.24 14.1 6 H.P. Acthar 9.1 0.3 1.9 0.2 31,995.97 4,863.39 59,213.32 7.5 7 Vantas 0.3 0.1 0.1 0.1 4,725.97 4,725.97 4,901.01 0.2 8 Fabrazyme 2.0 0.3 0.7 0.0 6,482.43 3,021.31 170,703.94 1.9 9 Simponi 0.3 2,833 1,717 955 1,865.5 3,078.0 5,534.0 3.8 10 Herceptin 2.0 683 1,047 118 4,166.6 2,718.0 24,116.8 2.2 Medicare Part D Spending, Top 10 44.7 31.4
Medicare Part D Spending, All Drugs 73,520.0 47,329.5

Appendix: Top 10 Drugs by Total Cost, Spending Per Unit, and Prescription Frequency in Medicare Part B, Medicare Part D, and Medicaid
May 2020 REPORT TO CONGRESS 92
Table A-5 continued Top 10 High-Cost Prescribed Drugs, Medicare Part D, Ranked by Spending per Unit
Year Rank Brand Name Gross Drug Cost
($M) Claims (1000s)
Units Dispensed
(1000s) Beneficiaries
(1000s) GDC per Claim ($)
GDC per Unit ($)
GDC per User ($)
Total Estimated Government (net of Cost-Sharing, in
$M)
2010 1 Lucentis 0.3 0.1 0.0 0.0 2,503.94 22,702.37 7,739.44 0.2 2 Ilaris 0.4 0.0 0.0 n/a 16,322.31 16,322.31 n/a 0.3 3 Stelara 17.0 2.3 1.7 0.8 7,370.30 9,739.63 20,294.78 12.9 4 Somatuline Depot 2.1 0.6 0.3 0.1 3,556.19 7,898.25 23,486.46 1.5 5 Mozobil 0.6 0.0 0.1 0.0 17,696.26 5,647.74 19,305.02 0.5 6 Jevtana 0.3 0.0 0.1 0.0 8,162.78 5,441.85 22,311.59 0.2 7 Neulasta 23.5 6.2 4.5 2.0 3,812.86 5,200.94 11,536.11 15.1 8 Arcalyst 2.7 0.1 0.5 0.0 20,785.97 5,196.49 209,458.67 2.1 9 H.P. Acthar 19.3 0.6 4.0 0.3 30,162.85 4,838.15 58,320.92 16.0 10 Vantas 0.2 0.0 0.0 0.0 4,229.59 4,229.59 4,229.59 0.1 Medicare Part D Spending, Top 10 66.1 48.7
Medicare Part D Spending, All Drugs 77,418.4 50,526.2

Appendix: Top 10 Drugs by Total Cost, Spending Per Unit, and Prescription Frequency in Medicare Part B, Medicare Part D, and Medicaid
May 2020 REPORT TO CONGRESS 93
Table A-5 continued Top 10 High-Cost Prescribed Drugs, Medicare Part D, Ranked by Spending per Unit
Year Rank Brand Name Gross Drug Cost
($M) Claims (1000s)
Units Dispensed
(1000s) Beneficiaries
(1000s) GDC per Claim ($)
GDC per Unit ($)
GDC per User ($)
Total Estimated Government (net of Cost-Sharing, in
$M)
2011 1 Lucentis 1.1 0.5 0.0 0.2 2,279.74 38,985.58 6,438.53 0.5 2 Ilaris 0.8 0.0 0.0 0.0 16,278.40 16,278.40 61,357.03 0.6 3 Stelara 31.7 3.9 2.9 1.4 8,064.04 10,756.61 23,308.63 23.6 4 Somatuline Depot 3.5 1.0 0.4 0.1 3,713.58 8,342.85 27,866.44 2.4 5 Neulasta 28.3 7.1 4.8 2.2 3,998.67 5,952.62 12,706.41 18.8 6 Mozobil 1.1 0.1 0.2 0.1 19,048.93 5,703.27 22,410.51 0.9 7 Sylatron 4-Pack 0.1 0.0 0.0 n/a 6,494.88 5,567.04 n/a 0.1 8 Jevtana 1.2 0.1 0.2 0.0 8,706.92 5,528.20 35,852.03 1.0 9 H.P. Acthar 49.5 1.5 9.3 0.9 33,621.29 5,303.69 57,979.97 39.7 10 Arcalyst 2.5 0.1 0.5 0.0 21,429.95 5,178.90 191,221.07 1.8 Medicare Part D Spending, Top 10 119.8 89.5
Medicare Part D Spending, All Drugs 84,639.2 54,815.2

Appendix: Top 10 Drugs by Total Cost, Spending Per Unit, and Prescription Frequency in Medicare Part B, Medicare Part D, and Medicaid
May 2020 REPORT TO CONGRESS 94
Table A-5 continued Top 10 High-Cost Prescribed Drugs, Medicare Part D, Ranked by Spending per Unit
Year Rank Brand Name Gross Drug Cost
($M) Claims (1000s)
Units Dispensed
(1000s) Beneficiaries
(1000s) GDC per Claim ($)
GDC per Unit ($)
GDC per User ($)
Total Estimated Government (net of Cost-Sharing, in
$M)
2012 1 Eylea 0.9 0.4 0.0 0.1 2,297.08 38,331.14 6,453.71 0.4 2 Lucentis 1.8 0.8 0.0 0.2 2,384.96 36,617.53 7,338.33 0.9 3 Ilaris 1.7 0.1 0.1 0.0 18,148.49 16,282.76 79,193.43 1.3 4 Stelara 50.3 5.7 4.2 1.9 8,775.18 11,838.64 26,482.64 36.7 5 Somatuline Depot 5.3 1.4 0.6 0.2 3,774.88 8,953.32 30,307.51 3.6 6 Neulasta 33.0 7.6 5.2 2.4 4,337.23 6,308.60 13,541.62 20.9 7 H.P. Acthar 141.5 3.4 23.7 1.6 41,763.10 5,977.25 89,356.67 108.3 8 Mozobil 1.5 0.1 0.3 0.1 19,094.40 5,786.18 23,034.51 1.0 9 Jevtana 1.6 0.2 0.3 0.0 9,396.62 5,680.17 38,242.07 1.4 10 Sylatron 4-Pack 0.4 0.1 0.1 0.0 5,437.02 5,437.02 16,528.55 0.3 Medicare Part D Spending, Top 10 238.1 174.7
Medicare Part D Spending, All Drugs 89,524.6 57,004.1

Appendix: Top 10 Drugs by Total Cost, Spending Per Unit, and Prescription Frequency in Medicare Part B, Medicare Part D, and Medicaid
May 2020 REPORT TO CONGRESS 95
Table A-5 continued Top 10 High-Cost Prescribed Drugs, Medicare Part D, Ranked by Spending per Unit
Year Rank Brand Name Gross Drug Cost
($M) Claims (1000s)
Units Dispensed
(1000s) Beneficiaries
(1000s) GDC per Claim ($)
GDC per Unit ($)
GDC per User ($)
Total Estimated Government (net of Cost-Sharing, in
$M)
2013 1 Eylea 1.6 0.7 0.0 0.2 2,309.66 36,383.59 7,637.12 0.7 2 Lucentis 2.3 1.0 0.1 0.3 2,361.54 34,887.59 8,185.55 1.0 3 Gattex 15.2 0.6 0.8 0.1 26,801.27 20,118.72 102,496.75 10.8 4 Ilaris 2.0 0.1 0.1 0.0 17,108.96 16,413.48 80,754.31 1.4 5 Stelara 89.5 9.0 6.7 3.0 9,940.45 13,330.93 29,471.14 61.8 6 Somatuline Depot 7.5 1.7 0.8 0.2 4,394.33 9,834.27 32,074.85 5.0 7 Neulasta 46.7 9.5 6.9 3.0 4,902.99 6,810.18 15,321.63 28.2 8 H.P. Acthar 262.6 6.8 42.6 2.4 38,889.46 6,158.54 108,013.82 196.2 9 Mozobil 1.7 0.1 0.3 0.1 16,639.76 5,930.15 20,122.50 1.1 10 Jevtana 1.8 0.2 0.3 0.0 9,507.63 5,770.35 48,288.74 1.5 Medicare Part D Spending, Top 10 431.0 307.6
Medicare Part D Spending, All Drugs 103,334.3 62,585.7

Appendix: Top 10 Drugs by Total Cost, Spending Per Unit, and Prescription Frequency in Medicare Part B, Medicare Part D, and Medicaid
May 2020 REPORT TO CONGRESS 96
Table A-5 continued Top 10 High-Cost Prescribed Drugs, Medicare Part D, Ranked by Spending per Unit
Year Rank Brand Name Gross Drug Cost
($M) Claims (1000s)
Units Dispensed
(1000s) Beneficiaries
(1000s) GDC per Claim ($)
GDC per Unit ($)
GDC per User ($)
Total Estimated Government (net of Cost-Sharing, in
$M)
2014 1 Eylea 2.9 1.2 0.1 0.4 2,454.93 38,360.36 8,065.24 1.3 2 Lucentis 2.7 1.2 0.1 0.4 2,306.97 36,442.45 7,452.28 1.1 3 Gattex 46.7 1.5 1.7 0.2 30,400.76 28,077.72 187,410.33 32.4 4 Ilaris 4.1 0.2 0.3 0.0 19,689.48 16,381.65 91,009.16 2.7 5 Stelara 156.9 14.1 10.8 4.5 11,166.08 14,510.12 34,578.67 98.2 6 Somatuline Depot 10.2 2.0 0.9 0.3 5,108.44 11,421.89 38,847.44 6.5 7 Krystexxa 0.8 0.1 0.1 0.0 14,612.26 7,744.50 40,760.50 0.6 8 Neulasta 57.8 10.9 7.8 3.5 5,312.60 7,384.42 16,424.20 30.4 9 H.P. Acthar 391.1 9.6 60.2 2.9 40,696.05 6,497.68 133,340.95 276.6 10 Jevtana 1.7 0.2 0.3 0.0 9,026.91 6,017.94 35,915.57 1.3 Medicare Part D Spending, Top 10 674.7 451.2
Medicare Part D Spending, All Drugs 121,001.4 71,948.6

Appendix: Top 10 Drugs by Total Cost, Spending Per Unit, and Prescription Frequency in Medicare Part B, Medicare Part D, and Medicaid
May 2020 REPORT TO CONGRESS 97
Table A-5 continued Top 10 High-Cost Prescribed Drugs, Medicare Part D, Ranked by Spending per Unit
Year Rank Brand Name Gross Drug Cost
($M) Claims (1000s)
Units Dispensed
(1000s) Beneficiaries
(1000s) GDC per Claim ($)
GDC per Unit ($)
GDC per User ($)
Total Estimated Government (net of Cost-Sharing, in
$M)
2015 1 Eylea 6.4 2.7 0.2 0.8 2,419.86 35,457.43 8,530.47 2.8 2 Lucentis 3.1 1.3 0.1 0.4 2,329.83 35,086.39 8,394.99 1.3 3 Gattex 74.2 2.1 3.1 0.3 35,253.47 24,311.15 228,225.56 49.0 4 Lemtrada 4.3 0.0 0.3 0.0 90,605.92 16,856.91 106,075.22 3.0 5 Ilaris 4.3 0.2 0.3 0.0 20,073.20 16,395.66 99,899.17 2.4 6 Stelara 205.3 17.0 12.7 5.6 12,109.85 16,219.81 36,381.06 118.0 7 Somatuline Depot 13.7 2.3 1.1 0.4 5,881.26 12,493.25 38,310.32 7.8 8 Signifor LAR 1.7 0.1 0.1 0.0 11,511.42 11,200.30 53,472.38 1.0 9 Neulasta 66.2 11.6 8.3 3.8 5,688.47 8,024.69 17,313.71 31.8 10 H.P. Acthar 504.0 11.2 73.8 3.1 44,963.81 6,827.41 162,370.93 334.2 Medicare Part D Spending, Top 10 883.3 551.3
Medicare Part D Spending, All Drugs 136,841.9 77,659.0

Appendix: Top 10 Drugs by Total Cost, Spending Per Unit, and Prescription Frequency in Medicare Part B, Medicare Part D, and Medicaid
May 2020 REPORT TO CONGRESS 98
Table A-5 continued Top 10 High-Cost Prescribed Drugs, Medicare Part D, Ranked by Spending per Unit
Year Rank Brand Name Gross Drug Cost
($M) Claims (1000s)
Units Dispensed
(1000s) Beneficiaries
(1000s) GDC per Claim ($)
GDC per Unit ($)
GDC per User ($)
Total Estimated Government (net of Cost-Sharing, in
$M)
2016 1 Eylea 9.5 3.9 0.3 1.0 2,433.75 37,668.61 9,522.84 4.0 2 Lucentis 2.8 1.2 0.1 0.3 2,355.95 31,859.70 8,379.86 1.1 3 Gattex 103.4 2.8 3.4 0.4 36,538.49 30,719.39 231,328.70 65.4 4 Stelara 265.1 20.2 20.1 6.7 13,118.25 13,181.51 39,799.76 147.3 5 Lemtrada 6.9 0.1 0.4 0.1 83,264.34 17,140.23 86,386.75 4.6 6 Ilaris 5.0 0.2 0.3 0.0 20,710.32 16,446.43 104,846.00 2.7 7 Krystexxa 5.0 0.2 0.3 0.1 28,548.43 16,273.54 99,919.52 3.0 8 Somatuline Depot 18.8 3.0 1.4 0.4 6,313.87 13,662.80 43,609.75 10.3 9 Signifor LAR 2.9 0.3 0.3 0.0 11,687.71 11,505.09 79,602.77 1.9 10 Neulasta 70.1 11.2 8.0 3.5 6,252.09 8,782.59 20,096.27 33.1 Medicare Part D Spending, Top 10 489.6 273.4
Medicare Part D Spending, All Drugs 145,439.6 80,365.0

Appendix: Top 10 Drugs by Total Cost, Spending Per Unit, and Prescription Frequency in Medicare Part B, Medicare Part D, and Medicaid
May 2020 REPORT TO CONGRESS 99
Table A-5 continued Top 10 High-Cost Prescribed Drugs, Medicare Part D, Ranked by Spending per Unit
Year Rank Brand Name Gross Drug Cost
($M) Claims (1000s)
Units Dispensed
(1000s) Beneficiaries
(1000s) GDC per Claim ($)
GDC per Unit ($)
GDC per User ($)
Total Estimated Government (net of Cost-Sharing, in
$M)
2017 1 Eylea 13.0 5.3 0.3 1.3 2,468.10 38,341.55 9,633.85 5.3 2 Lucentis 3.2 1.3 0.1 0.3 2,379.18 37,542.48 9,202.22 1.3 3 Gattex 164.8 4.2 4.7 0.7 39,470.04 35,331.78 228,871.44 98.8 4 Krystexxa 13.6 0.4 0.7 0.1 33,153.88 19,152.45 159,528.66 8.0 5 Stelara 406.0 27.4 45.4 8.8 14,841.17 8,949.45 46,216.27 218.4 6 Lemtrada 7.7 0.1 0.4 0.1 82,319.50 18,062.64 91,035.69 4.4 7 Ilaris 8.1 0.4 0.5 0.1 21,572.47 16,621.41 126,738.28 4.6 8 Somatuline Depot 25.7 3.5 1.7 0.5 7,302.22 15,515.58 52,424.32 13.5 9 Signifor LAR 2.7 0.2 0.2 0.0 11,850.16 11,541.03 102,093.70 1.7 10 Neulasta 77.0 11.1 7.9 3.4 6,968.21 9,767.20 22,970.98 36.8 Medicare Part D Spending, Top 10 721.8 392.9
Medicare Part D Spending, All Drugs 154,229.6 81,332.7
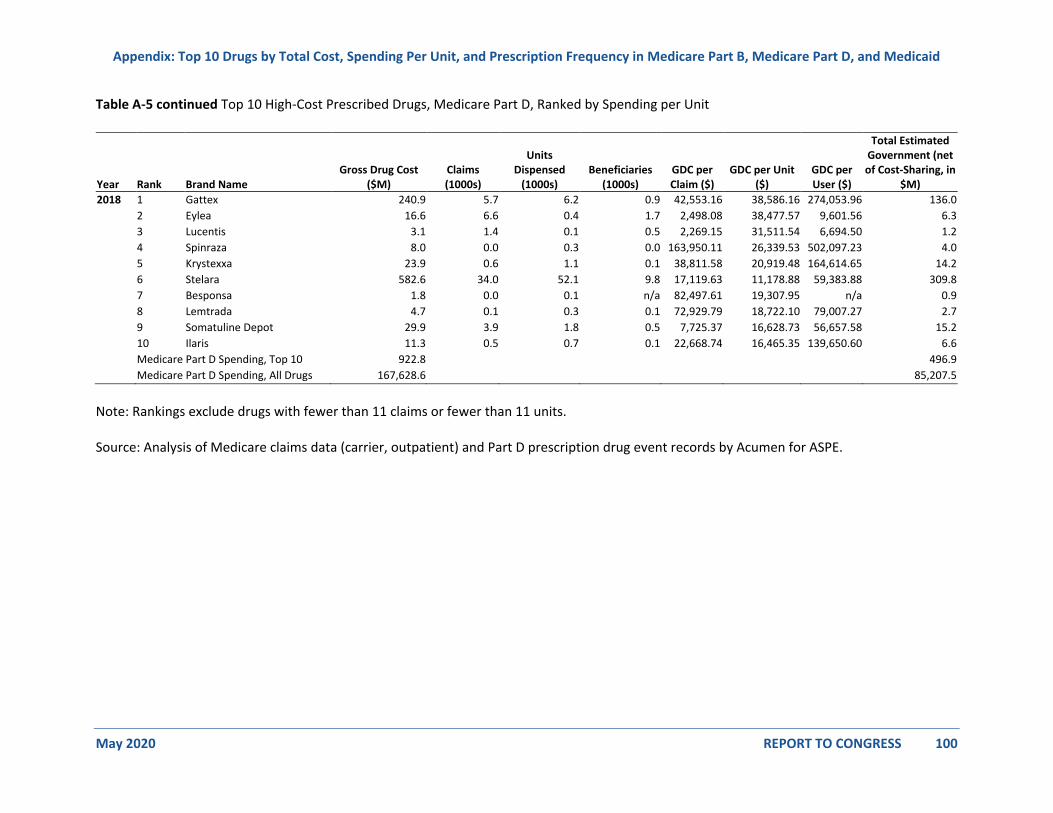
Appendix: Top 10 Drugs by Total Cost, Spending Per Unit, and Prescription Frequency in Medicare Part B, Medicare Part D, and Medicaid
May 2020 REPORT TO CONGRESS 100
Table A-5 continued Top 10 High-Cost Prescribed Drugs, Medicare Part D, Ranked by Spending per Unit
Year Rank Brand Name Gross Drug Cost
($M) Claims (1000s)
Units Dispensed
(1000s) Beneficiaries
(1000s) GDC per Claim ($)
GDC per Unit ($)
GDC per User ($)
Total Estimated Government (net of Cost-Sharing, in
$M)
2018 1 Gattex 240.9 5.7 6.2 0.9 42,553.16 38,586.16 274,053.96 136.0 2 Eylea 16.6 6.6 0.4 1.7 2,498.08 38,477.57 9,601.56 6.3 3 Lucentis 3.1 1.4 0.1 0.5 2,269.15 31,511.54 6,694.50 1.2 4 Spinraza 8.0 0.0 0.3 0.0 163,950.11 26,339.53 502,097.23 4.0 5 Krystexxa 23.9 0.6 1.1 0.1 38,811.58 20,919.48 164,614.65 14.2 6 Stelara 582.6 34.0 52.1 9.8 17,119.63 11,178.88 59,383.88 309.8 7 Besponsa 1.8 0.0 0.1 n/a 82,497.61 19,307.95 n/a 0.9 8 Lemtrada 4.7 0.1 0.3 0.1 72,929.79 18,722.10 79,007.27 2.7 9 Somatuline Depot 29.9 3.9 1.8 0.5 7,725.37 16,628.73 56,657.58 15.2 10 Ilaris 11.3 0.5 0.7 0.1 22,668.74 16,465.35 139,650.60 6.6 Medicare Part D Spending, Top 10 922.8 496.9
Medicare Part D Spending, All Drugs 167,628.6 85,207.5
Note: Rankings exclude drugs with fewer than 11 claims or fewer than 11 units. Source: Analysis of Medicare claims data (carrier, outpatient) and Part D prescription drug event records by Acumen for ASPE.
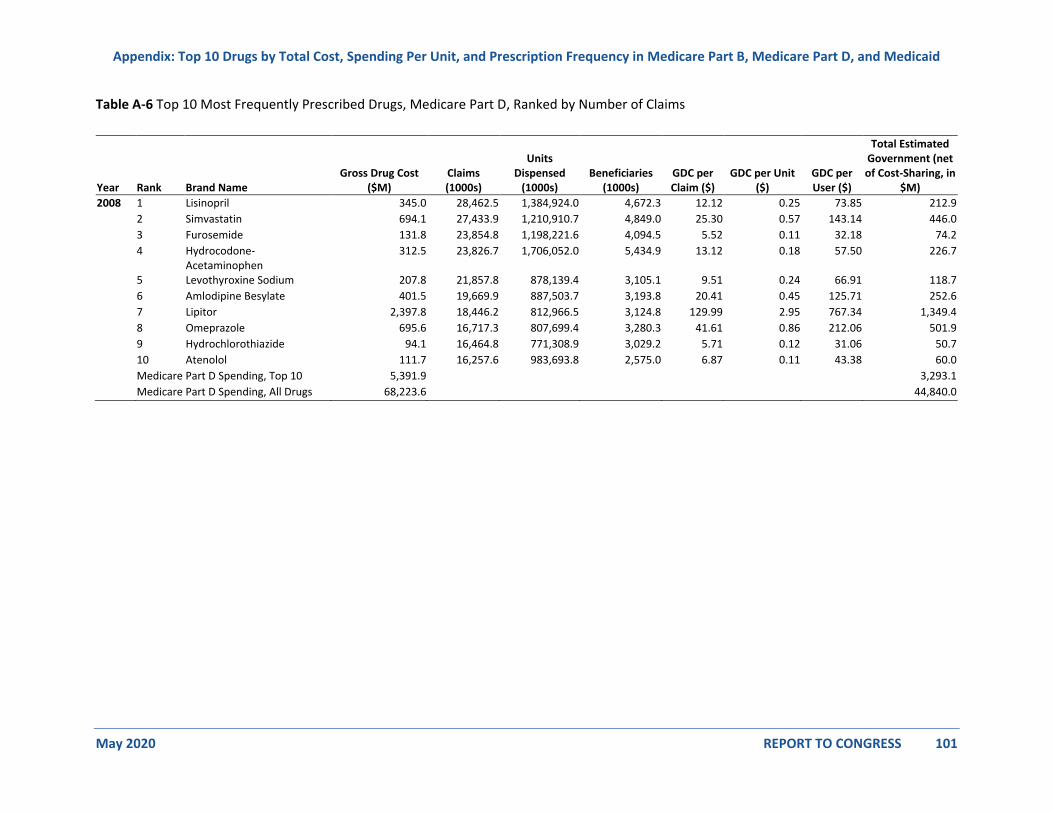
Appendix: Top 10 Drugs by Total Cost, Spending Per Unit, and Prescription Frequency in Medicare Part B, Medicare Part D, and Medicaid
May 2020 REPORT TO CONGRESS 101
Table A-6 Top 10 Most Frequently Prescribed Drugs, Medicare Part D, Ranked by Number of Claims
Year Rank Brand Name Gross Drug Cost
($M) Claims (1000s)
Units Dispensed
(1000s) Beneficiaries
(1000s) GDC per Claim ($)
GDC per Unit ($)
GDC per User ($)
Total Estimated Government (net of Cost-Sharing, in
$M)
2008 1 Lisinopril 345.0 28,462.5 1,384,924.0 4,672.3 12.12 0.25 73.85 212.9 2 Simvastatin 694.1 27,433.9 1,210,910.7 4,849.0 25.30 0.57 143.14 446.0 3 Furosemide 131.8 23,854.8 1,198,221.6 4,094.5 5.52 0.11 32.18 74.2 4 Hydrocodone-
Acetaminophen 312.5 23,826.7 1,706,052.0 5,434.9 13.12 0.18 57.50 226.7
5 Levothyroxine Sodium 207.8 21,857.8 878,139.4 3,105.1 9.51 0.24 66.91 118.7 6 Amlodipine Besylate 401.5 19,669.9 887,503.7 3,193.8 20.41 0.45 125.71 252.6 7 Lipitor 2,397.8 18,446.2 812,966.5 3,124.8 129.99 2.95 767.34 1,349.4 8 Omeprazole 695.6 16,717.3 807,699.4 3,280.3 41.61 0.86 212.06 501.9 9 Hydrochlorothiazide 94.1 16,464.8 771,308.9 3,029.2 5.71 0.12 31.06 50.7 10 Atenolol 111.7 16,257.6 983,693.8 2,575.0 6.87 0.11 43.38 60.0 Medicare Part D Spending, Top 10 5,391.9 3,293.1
Medicare Part D Spending, All Drugs 68,223.6 44,840.0

Appendix: Top 10 Drugs by Total Cost, Spending Per Unit, and Prescription Frequency in Medicare Part B, Medicare Part D, and Medicaid
May 2020 REPORT TO CONGRESS 102
Table A-6 continued Top 10 High-Cost Prescribed Drugs, Medicare Part D, Ranked by Number of Claims
Year Rank Brand Name Gross Drug Cost
($M) Claims (1000s)
Units Dispensed
(1000s) Beneficiaries
(1000s) GDC per Claim ($)
GDC per Unit ($)
GDC per User ($)
Total Estimated Government (net of Cost-Sharing, in
$M)
2009 1 Simvastatin 739.1 34,591.8 1,507,177.8 6,049.8 21.37 0.49 122.16 456.3 2 Lisinopril 342.6 30,379.4 1,439,338.6 5,160.8 11.28 0.24 66.39 206.4 3 Hydrocodone-
Acetaminophen 352.1 26,105.7 1,957,212.7 5,919.0 13.49 0.18 59.49 253.3
4 Furosemide 134.2 23,854.2 1,155,844.7 4,211.4 5.63 0.12 31.87 74.7 5 Levothyroxine Sodium 221.2 23,635.2 936,334.0 3,418.5 9.36 0.24 64.72 123.6 6 Amlodipine Besylate 387.1 23,000.0 973,035.4 3,788.0 16.83 0.40 102.20 230.4 7 Omeprazole 825.1 21,535.3 1,042,306.3 4,212.0 38.31 0.79 195.89 581.4 8 Metoprolol Tartrate 129.4 18,572.0 1,265,381.7 3,162.7 6.97 0.10 40.91 77.5 9 Metformin HCl 247.9 16,815.3 1,466,211.6 2,790.5 14.74 0.17 88.85 163.2 10 Hydrochlorothiazide 94.6 16,518.9 721,527.2 3,138.4 5.73 0.13 30.16 49.6 Medicare Part D Spending, Top 10 3,473.4 2,216.5
Medicare Part D Spending, All Drugs 73,520.0 47,329.5

Appendix: Top 10 Drugs by Total Cost, Spending Per Unit, and Prescription Frequency in Medicare Part B, Medicare Part D, and Medicaid
May 2020 REPORT TO CONGRESS 103
Table A-6 continued Top 10 Most Frequently Prescribed Drugs, Medicare Part D, Ranked by Number of Claims
Year Rank Brand Name Gross Drug Cost
($M) Claims (1000s)
Units Dispensed
(1000s) Beneficiaries
(1000s) GDC per Claim ($)
GDC per Unit ($)
GDC per User ($)
Total Estimated Government (net of Cost-Sharing, in
$M)
2010 1 Simvastatin 675.4 39,103.9 1,719,786.3 6,848.7 17.27 0.39 98.62 395.8 2 Lisinopril 319.7 31,820.3 1,529,230.0 5,533.6 10.05 0.21 57.77 184.5 3 Hydrocodone-
Acetaminophen 380.3 28,107.0 2,077,239.4 6,402.7 13.53 0.18 59.39 270.6
4 Amlodipine Besylate 369.0 25,763.0 1,105,779.4 4,302.8 14.32 0.33 85.76 206.2 5 Levothyroxine Sodium 238.5 25,517.1 1,039,522.1 3,736.0 9.35 0.23 63.85 129.5 6 Omeprazole 774.7 25,015.8 1,203,076.1 4,819.2 30.97 0.64 160.76 535.1 7 Furosemide 134.5 23,836.6 1,170,099.9 4,297.7 5.64 0.11 31.29 73.5 8 Metoprolol Tartrate 119.1 18,307.8 1,286,033.6 3,105.3 6.50 0.09 38.34 69.5 9 Metformin HCl 220.0 17,887.0 1,581,764.1 3,056.4 12.30 0.14 71.99 141.5 10 Hydrochlorothiazide 93.0 16,505.6 744,455.4 3,209.3 5.64 0.12 28.99 45.7 Medicare Part D Spending, Top 10 3,324.2 2,051.9
Medicare Part D Spending, All Drugs 77,418.4 50,526.2

Appendix: Top 10 Drugs by Total Cost, Spending Per Unit, and Prescription Frequency in Medicare Part B, Medicare Part D, and Medicaid
May 2020 REPORT TO CONGRESS 104
Table A-6 continued Top 10 Most Frequently Prescribed Drugs, Medicare Part D, Ranked by Number of Claims
Year Rank Brand Name Gross Drug Cost
($M) Claims (1000s)
Units Dispensed
(1000s) Beneficiaries
(1000s) GDC per Claim ($)
GDC per Unit ($)
GDC per User ($)
Total Estimated Government (net of Cost-Sharing, in
$M)
2011 1 Simvastatin 594.3 40,947.8 1,893,225.1 7,410.7 14.51 0.31 80.20 321.4 2 Lisinopril 322.3 32,756.4 1,656,393.0 5,883.8 9.84 0.19 54.78 178.3 3 Hydrocodone-
Acetaminophen 430.1 31,363.7 2,353,900.5 7,091.0 13.71 0.18 60.66 305.5
4 Amlodipine Besylate 383.1 27,946.4 1,263,380.4 4,798.2 13.71 0.30 79.83 210.2 5 Omeprazole 674.7 27,327.0 1,350,133.3 5,328.3 24.69 0.50 126.62 439.7 6 Levothyroxine Sodium 256.5 27,308.8 1,174,724.3 4,132.6 9.39 0.22 62.07 133.0 7 Furosemide 133.5 23,915.7 1,217,118.1 4,439.2 5.58 0.11 30.07 71.8 8 Metformin HCl 214.4 18,853.6 1,740,552.4 3,323.6 11.37 0.12 64.52 133.8 9 Metoprolol Tartrate 126.1 18,486.8 1,373,459.4 3,245.1 6.82 0.09 38.85 71.8 10 Hydrochlorothiazide 95.2 16,893.8 800,829.1 3,401.8 5.64 0.12 28.00 44.1 Medicare Part D Spending, Top 10 3,230.2 1,909.6
Medicare Part D Spending, All Drugs 84,639.2 54,815.2

Appendix: Top 10 Drugs by Total Cost, Spending Per Unit, and Prescription Frequency in Medicare Part B, Medicare Part D, and Medicaid
May 2020 REPORT TO CONGRESS 105
Table A-6 continued Top 10 Most Frequently Prescribed Drugs, Medicare Part D, Ranked by Number of Claims
Year Rank Brand Name Gross Drug Cost
($M) Claims (1000s)
Units Dispensed
(1000s) Beneficiaries
(1000s) GDC per Claim ($)
GDC per Unit ($)
GDC per User ($)
Total Estimated Government (net of Cost-Sharing, in
$M)
2012 1 Simvastatin 491.9 37,795.7 1,834,651.7 7,036.5 13.02 0.27 69.91 264.7 2 Lisinopril 292.7 34,012.4 1,829,754.1 6,276.8 8.61 0.16 46.63 159.8 3 Hydrocodone-
Acetaminophen 462.0 32,935.7 2,514,651.9 7,463.0 14.03 0.18 61.91 322.5
4 Amlodipine Besylate 311.4 30,511.0 1,458,302.5 5,393.2 10.20 0.21 57.73 161.2 5 Levothyroxine Sodium 287.0 30,273.5 1,446,101.5 4,917.6 9.48 0.20 58.36 140.7 6 Omeprazole 591.5 29,740.8 1,535,244.4 5,776.7 19.89 0.39 102.40 362.5 7 Furosemide 128.7 24,196.9 1,287,834.2 4,603.5 5.32 0.10 27.95 69.3 8 Metformin HCl 209.9 19,993.8 1,919,371.7 3,625.6 10.50 0.11 57.90 128.3 9 Metoprolol Tartrate 133.8 19,548.2 1,546,730.0 3,547.9 6.84 0.09 37.71 76.2 10 Hydrochlorothiazide 98.0 17,097.6 848,605.5 3,513.7 5.73 0.12 27.90 44.6 Medicare Part D Spending, Top 10 3,007.0 1,729.8
Medicare Part D Spending, All Drugs 89,524.6 57,004.1
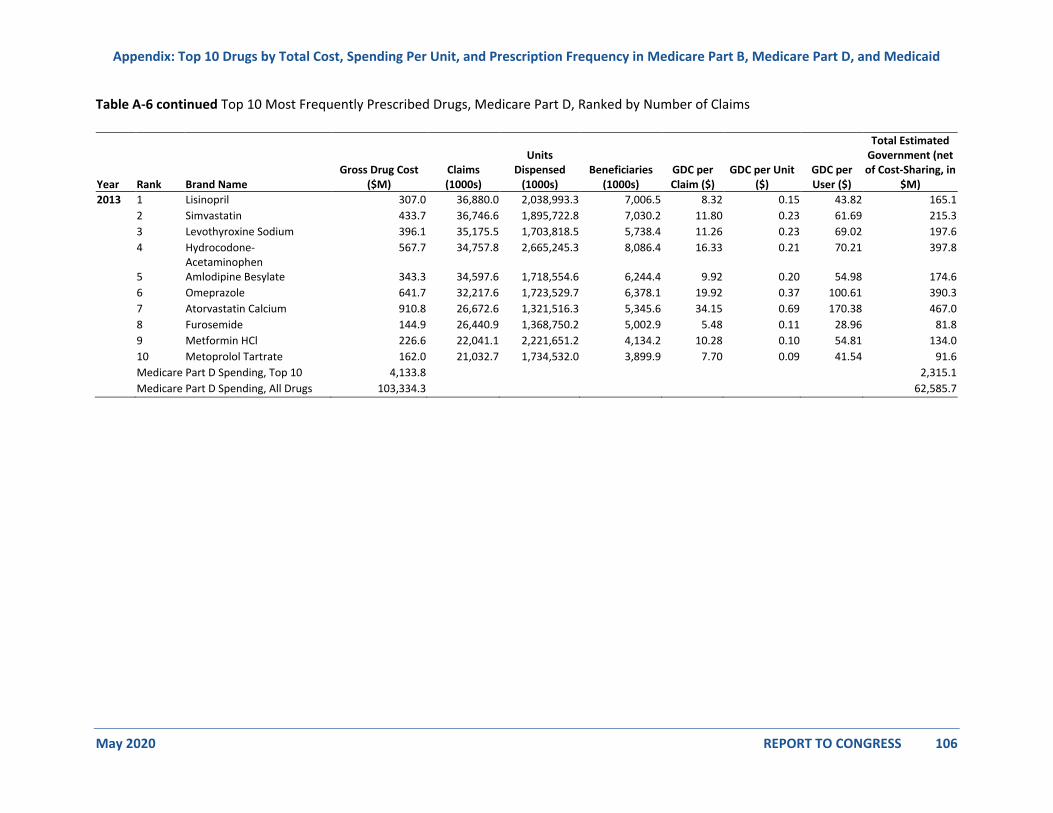
Appendix: Top 10 Drugs by Total Cost, Spending Per Unit, and Prescription Frequency in Medicare Part B, Medicare Part D, and Medicaid
May 2020 REPORT TO CONGRESS 106
Table A-6 continued Top 10 Most Frequently Prescribed Drugs, Medicare Part D, Ranked by Number of Claims
Year Rank Brand Name Gross Drug Cost
($M) Claims (1000s)
Units Dispensed
(1000s) Beneficiaries
(1000s) GDC per Claim ($)
GDC per Unit ($)
GDC per User ($)
Total Estimated Government (net of Cost-Sharing, in
$M)
2013 1 Lisinopril 307.0 36,880.0 2,038,993.3 7,006.5 8.32 0.15 43.82 165.1 2 Simvastatin 433.7 36,746.6 1,895,722.8 7,030.2 11.80 0.23 61.69 215.3 3 Levothyroxine Sodium 396.1 35,175.5 1,703,818.5 5,738.4 11.26 0.23 69.02 197.6 4 Hydrocodone-
Acetaminophen 567.7 34,757.8 2,665,245.3 8,086.4 16.33 0.21 70.21 397.8
5 Amlodipine Besylate 343.3 34,597.6 1,718,554.6 6,244.4 9.92 0.20 54.98 174.6 6 Omeprazole 641.7 32,217.6 1,723,529.7 6,378.1 19.92 0.37 100.61 390.3 7 Atorvastatin Calcium 910.8 26,672.6 1,321,516.3 5,345.6 34.15 0.69 170.38 467.0 8 Furosemide 144.9 26,440.9 1,368,750.2 5,002.9 5.48 0.11 28.96 81.8 9 Metformin HCl 226.6 22,041.1 2,221,651.2 4,134.2 10.28 0.10 54.81 134.0 10 Metoprolol Tartrate 162.0 21,032.7 1,734,532.0 3,899.9 7.70 0.09 41.54 91.6 Medicare Part D Spending, Top 10 4,133.8 2,315.1
Medicare Part D Spending, All Drugs 103,334.3 62,585.7

Appendix: Top 10 Drugs by Total Cost, Spending Per Unit, and Prescription Frequency in Medicare Part B, Medicare Part D, and Medicaid
May 2020 REPORT TO CONGRESS 107
Table A-6 continued Top 10 Most Frequently Prescribed Drugs, Medicare Part D, Ranked by Number of Claims
Year Rank Brand Name Gross Drug Cost
($M) Claims (1000s)
Units Dispensed
(1000s) Beneficiaries
(1000s) GDC per Claim ($)
GDC per Unit ($)
GDC per User ($)
Total Estimated Government (net of Cost-Sharing, in
$M)
2014 1 Lisinopril 281.4 38,255.9 2,193,230.6 7,454.7 7.36 0.13 37.75 147.9 2 Levothyroxine Sodium 631.5 37,693.9 1,887,046.8 6,245.4 16.75 0.33 101.11 310.6 3 Amlodipine Besylate 303.6 36,323.5 1,880,188.1 6,749.9 8.36 0.16 44.97 150.7 4 Simvastatin 346.5 34,075.7 1,855,648.8 6,768.0 10.17 0.19 51.20 167.2 5 Hydrocodone-
Acetaminophen 676.2 33,444.0 2,573,595.3 8,005.7 20.22 0.26 84.47 477.9
6 Omeprazole 527.6 32,981.3 1,811,634.8 6,703.8 16.00 0.29 78.69 312.9 7 Atorvastatin Calcium 747.2 32,583.8 1,690,100.2 6,739.2 22.93 0.44 110.87 361.9 8 Furosemide 135.6 27,117.7 1,409,321.2 5,176.2 5.00 0.10 26.20 76.3 9 Metformin HCl 203.8 23,461.8 2,444,099.8 4,509.8 8.69 0.08 45.19 117.7 10 Gabapentin 491.2 22,109.5 2,495,659.5 4,292.3 22.22 0.20 114.43 339.4 Medicare Part D Spending, Top 10 4,344.5 2,462.6
Medicare Part D Spending, All Drugs 121,001.4 71,948.6

Appendix: Top 10 Drugs by Total Cost, Spending Per Unit, and Prescription Frequency in Medicare Part B, Medicare Part D, and Medicaid
May 2020 REPORT TO CONGRESS 108
Table A-6 continued Top 10 Most Frequently Prescribed Drugs, Medicare Part D, Ranked by Number of Claims
Year Rank Brand Name Gross Drug Cost
($M) Claims (1000s)
Units Dispensed
(1000s) Beneficiaries
(1000s) GDC per Claim ($)
GDC per Unit ($)
GDC per User ($)
Total Estimated Government (net of Cost-Sharing, in
$M)
2015 1 Levothyroxine Sodium 777.8 39,439.6 2,036,719.8 6,640.8 19.72 0.38 117.12 362.9 2 Lisinopril 253.0 39,119.7 2,318,174.2 7,767.0 6.47 0.11 32.57 127.5 3 Atorvastatin Calcium 712.0 38,601.1 2,078,721.8 8,070.3 18.44 0.34 88.22 346.0 4 Amlodipine Besylate 264.1 38,207.9 2,041,318.6 7,262.7 6.91 0.13 36.36 125.5 5 Omeprazole 446.6 33,470.5 1,883,411.7 6,941.1 13.34 0.24 64.34 259.9 6 Simvastatin 261.2 31,741.2 1,807,426.0 6,479.8 8.23 0.14 40.32 122.7 7 Hydrocodone-
Acetaminophen 727.1 29,544.1 2,359,203.0 7,482.2 24.61 0.31 97.18 504.6
8 Furosemide 137.9 27,544.9 1,446,438.2 5,314.9 5.01 0.10 25.95 67.1 9 Gabapentin 490.1 24,808.1 2,857,603.1 4,813.8 19.76 0.17 101.81 336.5 10 Metformin HCl 178.3 24,608.8 2,641,097.0 4,835.1 7.25 0.07 36.87 99.5 Medicare Part D Spending, Top 10 4,248.0 2,352.3
Medicare Part D Spending, All Drugs 136,841.9 77,659.0

Appendix: Top 10 Drugs by Total Cost, Spending Per Unit, and Prescription Frequency in Medicare Part B, Medicare Part D, and Medicaid
May 2020 REPORT TO CONGRESS 109
Table A-6 continued Top 10 Most Frequently Prescribed Drugs, Medicare Part D, Ranked by Number of Claims
Year Rank Brand Name Gross Drug Cost
($M) Claims (1000s)
Units Dispensed
(1000s) Beneficiaries
(1000s) GDC per Claim ($)
GDC per Unit ($)
GDC per User ($)
Total Estimated Government (net of Cost-Sharing, in
$M)
2016 1 Atorvastatin Calcium 757.0 44,481.1 2,491,418.6 9,407.7 17.02 0.30 80.47 343.7 2 Levothyroxine Sodium 806.7 41,037.3 2,190,683.3 7,027.0 19.66 0.37 114.80 330.9 3 Amlodipine Besylate 269.1 39,856.0 2,229,469.5 7,791.2 6.75 0.12 34.53 127.9 4 Lisinopril 259.6 39,461.8 2,424,552.5 8,008.3 6.58 0.11 32.42 125.4 5 Omeprazole 411.9 32,882.4 1,911,212.4 6,999.2 12.53 0.22 58.85 232.6 6 Simvastatin 247.5 29,680.7 1,767,731.3 6,199.8 8.34 0.14 39.92 107.5 7 Hydrocodone-
Acetaminophen 727.4 28,504.6 2,264,853.4 7,222.6 25.52 0.32 100.72 507.6
8 Furosemide 135.6 27,858.5 1,489,998.1 5,416.3 4.87 0.09 25.04 59.5 9 Gabapentin 488.1 27,547.9 3,254,818.6 5,346.8 17.72 0.15 91.28 321.7 10 Metformin HCl 184.2 25,462.7 2,847,474.7 5,119.8 7.23 0.06 35.97 98.9 Medicare Part D Spending, Top 10 4,287.2 2,255.7
Medicare Part D Spending, All Drugs 145,439.6 80,365.0

Appendix: Top 10 Drugs by Total Cost, Spending Per Unit, and Prescription Frequency in Medicare Part B, Medicare Part D, and Medicaid
May 2020 REPORT TO CONGRESS 110
Table A-6 continued Top 10 Most Frequently Prescribed Drugs, Medicare Part D, Ranked by Number of Claims
Year Rank Brand Name Gross Drug Cost
($M) Claims (1000s)
Units Dispensed
(1000s) Beneficiaries
(1000s) GDC per Claim ($)
GDC per Unit ($)
GDC per User ($)
Total Estimated Government (net of Cost-Sharing, in
$M)
2017 1 Atorvastatin Calcium 808.9 48,580.5 2,883,654.6 10,662.4 16.65 0.28 75.86 358.1 2 Levothyroxine Sodium 836.1 41,396.3 2,296,350.5 7,343.7 20.20 0.36 113.85 303.8 3 Amlodipine Besylate 267.1 40,572.5 2,389,099.9 8,300.7 6.58 0.11 32.18 125.9 4 Lisinopril 256.2 38,680.3 2,496,970.1 8,168.2 6.62 0.10 31.37 118.2 5 Omeprazole 394.3 31,251.6 1,890,974.6 6,865.0 12.62 0.21 57.44 221.0 6 Gabapentin 494.5 29,424.6 3,574,001.9 5,806.5 16.81 0.14 85.17 325.9 7 Furosemide 139.7 27,504.9 1,508,572.7 5,494.6 5.08 0.09 25.42 58.6 8 Simvastatin 219.2 27,023.8 1,699,708.5 5,882.8 8.11 0.13 37.26 91.9 9 Hydrocodone-
Acetaminophen 498.4 26,893.1 2,104,453.6 6,846.1 18.53 0.24 72.80 336.1
10 Metformin HCl 188.2 25,415.9 3,006,011.9 5,337.2 7.41 0.06 35.27 98.5 Medicare Part D Spending, Top 10 4,102.6 2,038.1
Medicare Part D Spending, All Drugs 154,229.6 81,332.7

Appendix: Top 10 Drugs by Total Cost, Spending Per Unit, and Prescription Frequency in Medicare Part B, Medicare Part D, and Medicaid
May 2020 REPORT TO CONGRESS 111
Table A-6 continued Top 10 Most Frequently Prescribed Drugs, Medicare Part D, Ranked by Number of Claims
Year Rank Brand Name Gross Drug Cost
($M) Claims (1000s)
Units Dispensed
(1000s) Beneficiaries
(1000s) GDC per Claim ($)
GDC per Unit ($)
GDC per User ($)
Total Estimated Government (net of Cost-Sharing, in
$M)
2018 1 Atorvastatin Calcium 881.1 51,749.8 3,278,599.5 11,862.7 17.03 0.27 74.27 391.1 2 Amlodipine Besylate 287.1 41,592.2 2,597,238.2 8,932.6 6.90 0.11 32.15 134.3 3 Levothyroxine Sodium 828.1 41,536.5 2,402,980.3 7,596.0 19.94 0.34 109.02 269.8 4 Lisinopril 264.8 37,750.6 2,585,182.3 8,340.1 7.01 0.10 31.74 119.8 5 Gabapentin 579.7 30,730.5 3,772,070.1 6,163.4 18.86 0.15 94.05 389.9 6 Omeprazole 388.9 29,402.2 1,862,537.1 6,769.4 13.23 0.21 57.46 218.3 7 Furosemide 145.1 26,861.0 1,536,821.2 5,572.5 5.40 0.09 26.04 64.6 8 Losartan Potassium 244.5 25,465.5 1,725,165.9 5,902.6 9.60 0.14 41.41 111.8 9 Metformin HCl 189.8 24,653.6 3,118,256.8 5,467.4 7.70 0.06 34.71 99.0 10 Hydrocodone-
Acetaminophen 529.4 24,599.5 1,876,058.4 6,221.0 21.52 0.28 85.10 367.9
Medicare Part D Spending, Top 10 4,338.5 2,166.7
Medicare Part D Spending, All Drugs 167,628.6 85,207.5
Source: Analysis of Medicare claims data (carrier, outpatient) and Part D prescription drug event records by Acumen for ASPE.

Appendix: Top 10 Drugs by Total Cost, Spending Per Unit, and Prescription Frequency in Medicare Part B, Medicare Part D, and Medicaid
May 2020 REPORT TO CONGRESS 112
Table A-7 Top 10 High-Cost Prescribed Drugs, Medicaid, Ranked by Total Spending
Year Rank Generic Drug Name Spending per Unit Total Spending
2008 1 Quetiapine Fumarate $5.59 $962,610,903 2 Aripiprazole $12.98 $864,665,984 3 Olanzapine $14.00 $655,125,344 4 Risperidone $5.54 $624,080,668 5 Montelukast Sodium $3.46 $452,731,574 6 Palivizumab $1,603.26 $440,111,778 7 Lansoprazole $4.80 $396,513,136 8 Fluticasone/Salmeterol $3.38 $372,878,837 9 Esomeprazole Mag Trihydrate $5.00 $351,395,745 10 Topiramate $3.79 $335,536,619
Medicaid Spending, Top 10
$5,455,650,587 Medicaid Spending, All Drugs
$24,655,613,645
Year Rank Generic Drug Name Spending per Unit Total Spending
2009 1 Aripiprazole $14.05 $1,086,225,218 2 Quetiapine Fumarate $6.33 $1,081,880,930 3 Olanzapine $12.51 $689,987,147 4 Montelukast Sodium $3.73 $509,973,605 5 Esomeprazole Mag Trihydrate $5.31 $435,692,163 6 Lansoprazole $5.22 $426,174,979 7 Fluticasone/Salmeterol $3.58 $413,942,343 8 Palivizumab $1,689.25 $398,919,752 9 Methylphenidate Hcl $3.14 $357,362,638 10 Amphet Asp/Amphet/D-Amphet $5.50 $286,553,078
Medicaid Spending, Top 10
$5,686,711,852 Medicaid Spending, All Drugs
$26,029,704,453
Year Rank Generic Drug Name Spending per Unit Total Spending
2010 1 Aripiprazole $15.29 $1,424,014,486 2 Quetiapine Fumarate $7.36 $1,411,178,430 3 Olanzapine $17.07 $848,755,243 4 Montelukast Sodium $4.07 $731,230,131 5 Esomeprazole Mag Trihydrate $5.52 $577,427,457 6 Fluticasone/Salmeterol $3.81 $572,958,809 7 Methylphenidate Hcl $3.72 $559,315,101 8 Ziprasidone Hcl $7.65 $376,368,788 9 Palivizumab $1,771.61 $370,882,218 10 Emtricitabine/Tenofovir $33.23 $368,035,678
Medicaid Spending, Top 10
$7,240,166,341 Medicaid Spending, All Drugs
$32,999,520,529

Appendix: Top 10 Drugs by Total Cost, Spending Per Unit, and Prescription Frequency in Medicare Part B, Medicare Part D, and Medicaid
May 2020 REPORT TO CONGRESS 113
Table A-7 continued Top 10 High-Cost Prescribed Drugs, Medicaid, Ranked by Total Spending
Year Rank Generic Drug Name Spending per Unit Total Spending
2011 1 Aripiprazole $16.92 $1,667,289,509 2 Quetiapine Fumarate $8.47 $1,618,779,336 3 Olanzapine $20.49 $983,556,014 4 Montelukast Sodium $4.65 $892,903,221 5 Methylphenidate Hcl $4.09 $709,352,216 6 Fluticasone/Salmeterol $4.14 $640,832,463 7 Esomeprazole Mag Trihydrate $5.82 $573,215,157 8 Emtricitabine/Tenofovir $35.81 $455,304,078 9 Albuterol Sulfate $3.10 $453,110,973 10 Efavirenz/Emtricitab/Tenofovir $55.06 $443,793,760
Medicaid Spending, Top 10
$8,438,136,726 Medicaid Spending, All Drugs
$37,679,593,904
Year Rank Generic Drug Name Spending per Unit Total Spending
2012 1 Aripiprazole $19.15 $1,827,786,498
2 Quetiapine Fumarate $10.86 $985,626,781
3 Montelukast Sodium $6.23 $713,394,035
4 Methylphenidate Hcl $4.63 $703,317,971
5 Fluticasone/Salmeterol $4.59 $670,347,610
6 Emtricitabine/Tenofovir $39.39 $549,689,170
7 Albuterol Sulfate $3.54 $538,800,846
8 Insulin Glargine,Hum.Rec.Anlog $13.13 $524,024,969
9 Efavirenz/Emtricitab/Tenofovir $59.21 $497,667,487
10 Lisdexamfetamine Dimesylate $5.23 $459,895,293
Medicaid Spending, Top 10 $7,470,550,662
Medicaid Spending, All Drugs $37,771,206,170
Year Rank Generic Drug Name Spending per Unit Total Spending
2013 1 Abilify $23.72 $2,011,387,678
2 Advair Diskus $4.63 $580,242,453
3 Methylphenidate Er $5.09 $578,534,690
4 Vyvanse $6.01 $559,256,432
5 Truvada $41.69 $522,333,513
6 Cymbalta $6.97 $498,940,945
7 Atripla $63.69 $494,445,974
8 Seroquel Xr $14.44 $414,436,248
9 Synagis $2,346.53 $387,004,169
10 Adderall Xr $7.28 $377,512,240
Medicaid Spending, Top 10 $6,424,094,342
Medicaid Spending, All Drugs $38,896,894,112

Appendix: Top 10 Drugs by Total Cost, Spending Per Unit, and Prescription Frequency in Medicare Part B, Medicare Part D, and Medicaid
May 2020 REPORT TO CONGRESS 114
Table A-7 continued Top 10 High-Cost Prescribed Drugs, Medicaid, Ranked by Total Spending
Year Rank Generic Drug Name Spending per Unit Total Spending
2014 1 Abilify* $27.88 $2,346,179,601 2 Sovaldi $1,013.21 $1,370,816,701 3 Atorvastatin Calcium $8.58 $1,137,100,298 4 Truvada $43.54 $638,258,728 5 Vyvanse $6.74 $582,714,805 6 Lantus $21.49 $570,672,682 7 Atripla $68.57 $566,065,841 8 Methylphenidate ER $4.98 $547,943,220 9 Advair Diskus $4.97 $519,066,484 10 Lantus Solostar $22.51 $442,768,093
Medicaid Spending, Top 10
$8,721,586,453 Medicaid Spending, All Drugs
$47,308,056,863
Year Rank Generic Drug Name Spending per Unit Total Spending
2015 1 Harvoni $1,138.94 $2,168,970,359 2 Abilify* $32.00 $2,035,844,536 3 Lantus $25.40 $769,469,517 4 Vyvanse $7.43 $723,823,649 5 Truvada $46.36 $716,826,487 6 Methylphenidate ER $5.94 $695,108,331 7 Lantus Solostar $25.21 $644,982,796 8 Humira Pen $1,566.94 $603,450,403 9 Atripla $74.19 $602,802,414 10 Aripiprazole $21.27 $601,296,137
Medicaid Spending, Top 10
$9,562,574,626 Medicaid Spending, All Drugs
$57,820,639,442
Year Rank Generic Drug Name Spending per Unit Total Spending
2016 1 Harvoni $1,127.93 $2,219,115,075
2 Abilify* $31.84 $1,071,359,522
3 Humira Pen $1,922.67 $986,629,482
4 Vyvanse $8.25 $889,167,642
5 Latuda $32.70 $868,210,466
6 Lantus $25.08 $787,424,300
7 Lantus Solostar $24.98 $762,526,226
8 Truvada $49.79 $762,180,023
9 Methylphenidate ER $6.28 $728,864,177
10 Aripiprazole $11.12 $676,114,263
Medicaid Spending, Top 10 $9,751,591,178
Medicaid Spending, All Drugs $64,455,170,411

Appendix: Top 10 Drugs by Total Cost, Spending Per Unit, and Prescription Frequency in Medicare Part B, Medicare Part D, and Medicaid
May 2020 REPORT TO CONGRESS 115
Table A-7 continued Top 10 High-Cost Prescribed Drugs, Medicaid, Ranked by Total Spending
Year Rank Generic Drug Name Spending per Unit Total Spending
2017 1 Humira Pen $2,160.88 $1,296,774,050 2 Harvoni $1,086.43 $1,217,366,921 3 Latuda $37.30 $1,101,252,524 4 Vyvanse $8.88 $973,599,150 5 Epclusa $876.81 $931,238,927 6 Genvoya $90.55 $815,376,747 7 Invega Sustenna $1,522.21 $748,862,538 8 Methylphenidate ER $6.74 $738,759,444 9 Lyrica $6.54 $727,773,266 10 Suboxone $7.88 $711,997,013
Medicaid Spending, Top 10
$9,263,000,581
Medicaid Spending, All Drugs $67,585,558,174
Year Rank Generic Drug Name Spending per Unit Total Spending
2018 1 Humira Pen $2,222.53 $1,386,718,665 2 Latuda $40.59 $1,244,564,745 3 Mavyret $239.60 $1,021,288,242 4 Vyvanse $9.46 $1,015,172,563 5 Genvoya $86.63 $911,876,985 6 Invega Sustenna $1,577.04 $869,025,167 7 Suboxone $7.85 $788,866,456 8 Lyrica $7.07 $767,025,790 9 Triumeq $83.32 $602,684,956 10 Flovent HFA $18.71 $584,499,258
Medicaid Spending, Top 10
$9,191,722,827 Medicaid Spending, All Drugs
$66,427,744,266
*Average spending per dosage unit reflects multiple routes of administration of the drug (e.g., intravenous, subcutaneous) which individually may have different unit pricing.
Source: 2006-2012 Lewin analysis of Medicaid State Drug Utilization public-use data, 2013-2018 Centers for Medicare & Medicaid Services analysis of national Medicaid drug utilization data.

Appendix: Top 10 Drugs by Total Cost, Spending Per Unit, and Prescription Frequency in Medicare Part B, Medicare Part D, and Medicaid
May 2020 REPORT TO CONGRESS 116
Table A-8 Top 10 High-Cost Prescribed Drugs, Medicaid, Ranked by Spending per Unit
Year Rank Generic Drug Name Spending per Unit Total Spending
2013 1 Eylea $28,726.14 $11,329,044 2 Lucentis $27,154.34 $35,875,600 3 Ilaris $16,441.73 $6,641,802 4 Supprelin La $15,778.66 $11,234,408 5 Retisert $13,283.28 $212,532 6 Stelara $11,528.58 $29,800,559 7 Somatuline Depot $9,951.89 $1,655,617 8 Jevtana $7,152.10 $2,891,192 9 H.P. Acthar $5,841.24 $83,938,624 10 Mozobil $5,459.21 $2,049,180
Medicaid Spending, Top 10
$185,628,558 Medicaid Spending, All Drugs
$38,896,894,112
Year Rank Generic Drug Name Spending per Unit Total Spending
2014 1 Eylea $31,551.35 $23,343,424 2 Lucentis $25,981.67 $41,433,582 3 Supprelin La $17,762.59 $12,646,967 4 Ilaris $16,091.56 $16,749,878 5 Stelara* $15,037.77 $51,719,138 6 Jetrea $14,755.80 $212,484 7 Somatuline Depot $11,530.85 $2,172,294 8 Marqibo $7,202.00 $151,242 9 Jevtana $6,978.23 $3,339,192 10 Panhematin $6,467.93 $3,465,737
Medicaid Spending, Top 10
$155,233,938 Medicaid Spending, All Drugs
$47,308,056,863
Year Rank Generic Drug Name Spending per Unit Total Spending
2015 1 Eylea $28,963.26 $59,505,315 2 Lucentis $25,695.61 $41,833,622 3 Supprelin La $21,008.09 $14,748,730 4 Lemtrada $18,809.72 $1,079,678 5 Calcium Disodium Versenate $16,182.57 $28,158 6 Stelara* $15,419.79 $86,169,160 7 Jetrea $14,237.22 $209,344 8 Xofigo $14,211.63 $448,434 9 Somatuline Depot $12,468.23 $4,337,608 10 Ilaris $10,876.21 $31,004,109
Medicaid Spending, Top 10
$239,364,157 Medicaid Spending, All Drugs
$57,820,639,442

Appendix: Top 10 Drugs by Total Cost, Spending Per Unit, and Prescription Frequency in Medicare Part B, Medicare Part D, and Medicaid
May 2020 REPORT TO CONGRESS 117
Table A-8 continued Top 10 High-Cost Prescribed Drugs, Medicaid, Ranked by Spending per Unit
Year Rank Generic Drug Name Spending per Unit Total Spending
2016 1 Eylea $29,948.78 $123,603,852 2 Supprelin La $25,814.53 $19,438,343 3 Lucentis $21,080.72 $40,130,873 4 Xofigo $19,776.19 $1,097,539 5 Stelara* $16,553.34 $143,951,167 6 Lemtrada $12,885.56 $10,374,381 7 Jetrea $11,941.05 $161,443 8 Somatuline Depot $11,731.02 $8,529,336 9 Signifor Lar $11,560.15 $1,260,056 10 Marqibo $9,196.10 $320,944
Medicaid Spending, Top 10
$348,867,934 Medicaid Spending, All Drugs
$64,455,170,411
Year Rank Generic Drug Name Spending per Unit Total Spending
2017 1 Eylea $32,121.62 $160,981,290 2 Supprelin La $28,261.40 $21,676,491 3 Lucentis $19,695.11 $40,561,698 4 Spinraza $19,042.25 $124,364,964 5 Lemtrada $17,862.46 $17,515,040 6 Xofigo $17,838.78 $2,296,440 7 Retisert $17,355.51 $225,622 8 Krystexxa $16,588.18 $1,476,348 9 Stelara* $16,533.93 $228,530,191 10 Ilaris $16,152.85 $52,845,407
Medicaid Spending, Top 10 $650,473,490 Medicaid Spending, All Drugs $67,585,558,174
Year Rank Generic Drug Name Spending per Unit Total Spending
2018 1 Campath $31,788.87 $267,026
2 Supprelin La $30,480.93 $22,574,174
3 Eylea $29,531.34 $168,289,609
4 Brineura $26,503.70 $795,111
5 Lucentis $21,484.19 $53,075,737
6 Xofigo $18,746.35 $2,154,405
7 Retisert $17,441.25 $197,470
8 Stelara* $17,274.02 $334,701,308
9 Spinraza $17,241.35 $223,505,259
10 Krystexxa $15,948.96 $9,102,868
Medicaid Spending, Top 10 $814,662,969
Medicaid Spending, All Drugs $66,427,744,266
*Average spending per dosage unit reflects multiple routes of administration of the drug (e.g., intravenous, subcutaneous) which individually may have different unit pricing.
Source: Centers for Medicaid and Medicaid Services analysis of national Medicaid drug utilization data.

Appendix: Top 10 Drugs by Total Cost, Spending Per Unit, and Prescription Frequency in Medicare Part B, Medicare Part D, and Medicaid
May 2020 REPORT TO CONGRESS 118
Table A-9 Top 10 Most Frequently Prescribed Drugs, Medicaid, Ranked by Number of Claims
Year Rank Generic Drug Name Spending per Unit Total Spending
2008 1 Hydrocodone Bit/Acetaminophen $0.23 $112,492,086 2 Amoxicillin $0.09 $64,329,996 3 Ibuprofen $0.09 $49,200,240 4 Azithromycin $2.40 $145,355,482 5 Alprazolam $0.13 $39,489,546 6 Clonazepam $0.20 $51,623,548 7 Lorazepam $0.27 $57,573,711 8 Montelukast Sodium $3.46 $452,731,574 9 Aspirin $0.09 $14,808,907 10 Loratadine $0.24 $44,987,853
Medicaid Spending, Top 10
$1,032,592,942 Medicaid Spending, All Drugs
$24,655,613,645
Year Rank Generic Drug Name Spending per Unit Total Spending
2009 1 Hydrocodone Bit/Acetaminophen $0.24 $128,705,221 2 Amoxicillin $0.10 $74,540,834 3 Ibuprofen $0.09 $54,549,556 4 Azithromycin $1.76 $138,836,617 5 Albuterol Sulfate $3.05 $221,791,801 6 Alprazolam $0.12 $40,524,359 7 Clonazepam $0.13 $38,998,901 8 Lorazepam $0.16 $36,034,159 9 Montelukast Sodium $3.73 $509,973,605 10 Loratadine $0.22 $47,178,424
Medicaid Spending, Top 10
$1,291,133,475 Medicaid Spending, All Drugs
$26,029,704,453
Year Rank Generic Drug Name Spending per Unit Total Spending
2010 1 Hydrocodone Bit/Acetaminophen $0.22 $170,503,632
2 Amoxicillin $0.09 $108,328,686
3 Ibuprofen $0.09 $75,096,982
4 Albuterol Sulfate $2.87 $356,562,839
5 Azithromycin $1.53 $169,561,708
6 Loratadine $0.17 $60,859,947
7 Alprazolam $0.13 $53,806,189
8 Clonazepam $0.13 $48,683,997
9 Montelukast Sodium $4.07 $731,230,131
10 Lisinopril $0.19 $36,786,525
Medicaid Spending, Top 10 $1,811,420,636
Medicaid Spending, All Drugs $32,999,520,529

Appendix: Top 10 Drugs by Total Cost, Spending Per Unit, and Prescription Frequency in Medicare Part B, Medicare Part D, and Medicaid
May 2020 REPORT TO CONGRESS 119
Table A-9 continued Top 10 Most Frequently Prescribed Drugs, Medicaid, Ranked by Number of Claims Year Rank Generic Drug Name Spending per Unit Total Spending
2011 1 Hydrocodone Bit/Acetaminophen $0.20 $185,851,039 2 Amoxicillin $0.09 $127,704,574 3 Ibuprofen $0.09 $82,215,957 4 Albuterol Sulfate $3.10 $453,110,973 5 Azithromycin $1.47 $182,600,085 6 Alprazolam $0.12 $59,014,244 7 Loratadine $0.16 $54,014,819 8 Clonazepam $0.13 $53,746,692 9 Lisinopril $0.19 $43,334,762 10 Montelukast Sodium $4.65 $892,903,221
Medicaid Spending, Top 10
$2,134,496,367
Medicaid Spending, All Drugs
$37,679,593,904
Year Rank Generic Drug Name Spending per Unit Total Spending
2012 1 Hydrocodone Bit/Acetaminophen $0.21 $185,509,603 2 Amoxicillin $0.08 $109,425,719 3 Albuterol Sulfate $3.54 $538,800,846 4 Ibuprofen $0.08 $71,155,236 5 Azithromycin $1.29 $160,450,118 6 Omeprazole $0.42 $116,061,714 7 Alprazolam $0.11 $55,748,894 8 Loratadine $0.16 $48,268,866 9 Lisinopril $0.16 $40,290,457 10 Clonazepam $0.12 $51,067,101
Medicaid Spending, Top 10
$1,376,778,555 Medicaid Spending, All Drugs $37,771,206,170
Year Rank Generic Drug Name Spending per Unit Total Spending
2013 1 Hydrocodone-Acetaminophen $0.26 $195,051,575 2 Amoxicillin $0.12 $98,135,545 3 Ibuprofen $0.11 $62,215,054 4 Omeprazole $0.38 $114,616,969 5 Azithromycin $1.66 $129,482,064 6 Lisinopril $0.15 $38,977,743 7 Loratadine $0.18 $40,981,632 8 Cetirizine Hcl $0.16 $53,416,090 9 Albuterol Sulfate $0.15 $109,339,045 10 Gabapentin $0.27 $150,887,536
Medicaid Spending, Top 10
$993,103,255 Medicaid Spending, All Drugs
$38,896,894,112

Appendix: Top 10 Drugs by Total Cost, Spending Per Unit, and Prescription Frequency in Medicare Part B, Medicare Part D, and Medicaid
May 2020 REPORT TO CONGRESS 120
Table A-9 continued Top 10 Most Frequently Prescribed Drugs, Medicaid, Ranked by Number of Claims
Year Rank Generic Drug Name Spending per Unit Total Spending
2014 1 Hydrocodone-Acetaminophen $0.30 $219,659,896 2 Amoxicillin $0.13 $91,646,982 3 Ibuprofen $0.12 $70,387,995 4 Omeprazole $0.30 $98,303,694 5 Lisinopril $0.14 $42,780,167 6 Gabapentin $0.21 $149,205,210 7 Azithromycin* $1.68 $110,672,172 8 Metformin HCl $0.10 $43,208,354 9 Levothyroxine Sodium* $0.38 $83,162,384 10 Fluticasone Propionate* $1.04 $109,336,321
Medicaid Spending, Top 10 $1,018,363,174 Medicaid Spending, All Drugs $47,308,056,863
Year Rank Generic Drug Name Spending per Unit Total Spending
2015 1 Hydrocodone-Acetaminophen $0.38 $276,818,616 2 Amoxicillin $0.12 $108,565,708 3 Ibuprofen $0.13 $87,088,592 4 Lisinopril $0.12 $47,332,269 5 Omeprazole $0.25 $93,897,592 6 Gabapentin $0.21 $200,563,295 7 Azithromycin* $1.55 $122,883,334 8 Metformin HCl $0.08 $45,565,299 9 Levothyroxine Sodium* $0.44 $118,249,890 10 Fluticasone Propionate* $0.79 $104,247,810
Medicaid Spending, Top 10 $1,205,212,405 Medicaid Spending, All Drugs $57,820,639,442
Year Rank Generic Drug Name Spending per Unit Total Spending
2016 1 Amoxicillin $0.12 $107,167,584 2 Hydrocodone-Acetaminophen $0.35 $237,541,101 3 Ibuprofen $0.12 $88,413,480 4 Lisinopril $0.11 $47,765,662 5 Gabapentin $0.17 $199,399,163 6 Omeprazole $0.20 $80,766,832 7 Atorvastatin Calcium $0.35 $112,403,412 8 Metformin HCl $0.07 $47,742,536 9 Levothyroxine Sodium* $0.44 $130,651,279 10 Ventolin HFA $2.91 $500,574,838
Medicaid Spending, Top 10 $1,552,425,888 Medicaid Spending, All Drugs $64,455,170,411

Appendix: Top 10 Drugs by Total Cost, Spending Per Unit, and Prescription Frequency in Medicare Part B, Medicare Part D, and Medicaid
May 2020 REPORT TO CONGRESS 121
Table A-9 continued Top 10 Most Frequently Prescribed Drugs, Medicaid, Ranked by Number of Claims
Year Rank Generic Drug Name Spending per Unit Total Spending
2017 1 Amoxicillin $0.12 $106,460,986 2 Gabapentin $0.16 $207,348,756 3 Ibuprofen $0.11 $86,397,134 4 Lisinopril $0.12 $52,775,860 5 Hydrocodone-Acetaminophen $0.32 $182,209,566 6 Atorvastatin Calcium $0.31 $121,688,101 7 Omeprazole $0.21 $81,990,323 8 Ventolin HFA $2.92 $565,975,929 9 Metformin HCl $0.08 $53,576,325 10 Levothyroxine Sodium* $0.42 $132,160,514
Medicaid Spending, Top 10
$1,590,583,494 Medicaid Spending, All Drugs
$67,585,558,174
Year Rank Generic Drug Name Spending per Unit Total Spending
2018 1 Amoxicillin $0.13 $97,170,954 2 Gabapentin $0.14 $182,622,489 3 Ibuprofen $0.11 $83,378,906 4 Atorvastatin Calcium $0.26 $114,085,012 5 Lisinopril $0.13 $55,164,969 6 Omeprazole $0.19 $73,039,418 7 Ventolin HFA $2.81 $522,020,935 8 Fluticasone Propionate* $0.67 $104,298,341 9 Levothyroxine Sodium* $0.40 $124,542,600 10 Amlodipine Besylate $0.15 $50,590,301
Medicaid Spending, Top 10 $1,406,913,925
Medicaid Spending, All Drugs $66,427,744,266
*Average spending per dosage unit reflects multiple routes of administration of the drug (e.g., intravenous, subcutaneous) which individually may have different unit pricing.
Source: 2006-2012 Lewin analysis of Medicaid State Drug Utilization public-use data, 2013-2018 Centers for Medicare & Medicaid Services analysis of national Medicaid drug utilization data.