report to audit committee item 8
TRANSCRIPT
Report to Audit committee Item 12 June 2018
8 Report of Chief finance officer (Section 151 Officer) Subject Statement of Accounts 2017-18
Purpose
This report presents the formal unaudited draft Statement of Accounts, authorised by the chief finance officer on 31 May 2018.
Recommendation
To review the draft Statement of Accounts 2017-18.
Corporate and service priorities
The report helps to meet the corporate priority value for money services.
Financial implications
The report has no direct financial consequences however it does report on the performance of the council and the provision of value for money services.
Ward/s: All Wards
Cabinet member: Councillor Kendrick - Resources
Contact officers
Karen Watling – chief finance officer 01603 212440
Hannah Simpson – strategic finance business partner 01603 212561
Background documents
None

Report Background
1. The unaudited draft statement of accounts was authorised by the Chief Finance Officer (CFO) on 31 May 2018. There is no requirement for the Committee to approve the draft financial statements however the unaudited accounts are presented to the Audit Committee for review.
2. For 2017/18 the Accounts and Audit Regulations 2015 required the CFO to authorise and publish the draft unaudited statement of accounts by 31 May. The earlier deadline has been met and the Statement of Accounts can be accessed on the Council website.
Statement of Accounts
3. The statement of accounts is attached at Appendix 1. Its format is required to follow the Code of Practice (CoP) on Local Authority Accounting in the United Kingdom (supported by International Financial Reporting Standards (IFRS)), and includes a full balance sheet and statement of cash flow movements. There have been no significant changes to the accounting requirements in 2017-18.
4. Group Accounts have been prepared for the first time in 2017-18. These consolidate in the financial performance and position of the Council’s wholly-owned subsidiary Norwich Regeneration Limited.
5. The Narrative Report is included within the Statement of Accounts. The format of the report has been significantly updated this year to ensure compliance with additional Code requirements as well as provide a clearer explanation of the key statements and financial context in which the Council operates. The report provides the reader with:
• an understanding of the council, its strategic priorities, and the local and
national context in which it operates; • an overview of the Council’s medium term financial plans, future outlook,
and key risks going forwards; • a summary of the Council’s financial performance for 2017/18 along with
information on how well the council delivered its key priorities during the year; and
• a guide to the key features of the primary statements and notes that make up the financial statements.
6. Section 9 of the Narrative Report details each of the primary financial statements and provides explanations of the key figures and movements.

Norwich City Council - 2017-18 Statement of Accounts
DRAFT STATEMENT OF ACCOUNTS FOR THE YEAR ENDING 31 MARCH 2018 - UNAUDITED
Check
Item 8 Statement of AccountsAppendix 1
Audit committee: 12 June 2018
Norwich City Council - 2017-18 Draft Statement of Accounts
Contents
Narrative Report ............................................................................................................................. 1 1. Introduction ............................................................................................................................................... 1 2. Norwich City Council ................................................................................................................................ 1 3. Strategic direction of the Council ........................................................................................................... 2 4. Local context ............................................................................................................................................. 3 5. National Context........................................................................................................................................ 4 6. Medium Term Financial Strategy (MTFS), Future Outlook, and Risks ................................................ 4 7. Performance against our priorities ......................................................................................................... 8 8. 2017/18 Financial Performance ............................................................................................................. 14 9. 2017/18 Statement of Accounts ............................................................................................................. 18
Independent auditor’s report to the members of Norwich City Council ...................................31
Statement of Responsibilities for the Statement of Accounts ...................................................34
Certificate of Approval of the Statement of Accounts ................................................................34
Expenditure Funding Analysis 2017/18 .......................................................................................35
Comprehensive Income and Expenditure Statement (CIES) .....................................................37
Movement in Reserves Statement ...............................................................................................38
Balance Sheet ...............................................................................................................................40
Cash Flow Statement ....................................................................................................................41
Notes to the Accounts ..................................................................................................................42 1. Accounting Policies ................................................................................................................................ 42 2. Accounting Standards that have been issued but have not been adopted ...................................... 57 3. Critical Judgments in Applying Accounting Policies ......................................................................... 58 4. Assumptions made about future and other major sources of estimation uncertainty ................... 59 5. Material Items of Income and Expense ................................................................................................ 61 6. Expenditure and Income by Nature....................................................................................................... 62 7. Segmental Income .................................................................................................................................. 62 8. Events after the Reporting Date ............................................................................................................ 62 9. Adjustments between Accounting Basis and Funding Basis under regulations ............................ 63 10. Transfers to/from Earmarked and Other Reserves ............................................................................. 68 11. Other Operating Expenditure ................................................................................................................. 70 12. Financing and Investment Income and Expenditure........................................................................... 70 13. Taxation and Non-Specific Grant Income ............................................................................................ 70 14. Property Plant and Equipment .............................................................................................................. 71 15. Heritage Assets ....................................................................................................................................... 75 16. Investment Properties ............................................................................................................................ 76 17. Intangible Assets .................................................................................................................................... 80 18. Financial Instruments ............................................................................................................................. 82 19. Long Term Investments ......................................................................................................................... 91 20. Long Term Debtors ................................................................................................................................. 92 21. Short Term Investments ......................................................................................................................... 93 22. Short Term Debtors ................................................................................................................................ 93 23. Cash & Cash Equivalents ....................................................................................................................... 93 24. Assets Held for Sale ............................................................................................................................... 93 25. Short Term Creditors .............................................................................................................................. 94 26. Long Term Creditors .............................................................................................................................. 94 27. Provisions ................................................................................................................................................ 94 28. Usable Reserves ..................................................................................................................................... 94 29. Unusable Reserves ................................................................................................................................. 94 30. Cash Flow Statement – Operating Activities ....................................................................................... 98 31. Cash Flow Statement – Investing Activities ......................................................................................... 99 32. Cash Flow Statement – Financing Activities ..................................................................................... 100 33. Trading Operations ............................................................................................................................... 100 34. Associates ............................................................................................................................................. 101

Norwich City Council - 2017-18 Statement of Accounts
DRAFT STATEMENT OF ACCOUNTS FOR THE YEAR ENDING 31 MARCH 2018 - UNAUDITED
35. Agency Services ................................................................................................................................... 101 36. Members’ Allowances .......................................................................................................................... 102 37. Officers Remuneration ......................................................................................................................... 103 38. External Audit Costs ............................................................................................................................. 105 39. Grants Income ....................................................................................................................................... 106 40. Capital Expenditure & Capital Financing ........................................................................................... 108 41. Leases .................................................................................................................................................... 109 42. Impairment Losses ............................................................................................................................... 111 43. Termination Benefits ............................................................................................................................ 111 44. Other Long Term Liabilities ................................................................................................................. 111 45. Defined Benefit Pension Schemes ...................................................................................................... 112 46. Contingent Assets and Liabilities ....................................................................................................... 117 47. Related Parties ...................................................................................................................................... 117
Movement in Reserves Statement (Housing Revenue Account) ............................................. 120
Notes to Housing Revenue Account Income & Expenditure Statement ................................. 121 1. Other Operating (Income) / Expenditure ............................................................................................ 121 2. Financing and Investment Income and Expenditure......................................................................... 121 3. Taxation and Non-Specific Grant Income .......................................................................................... 121 4. Loan Charges ........................................................................................................................................ 121 5. HRA Council Dwellings ........................................................................................................................ 122 6. Housing Valuation ................................................................................................................................ 122 7. Major Repairs Reserve ......................................................................................................................... 123 8. HRA Capital Expenditure ..................................................................................................................... 123 9. HRA Capital Receipts ........................................................................................................................... 124 10. Depreciation .......................................................................................................................................... 124 11. Impairment Costs .................................................................................................................................. 124 12. Pensions Reserve ................................................................................................................................. 125 13. Rent Arrears .......................................................................................................................................... 125
The Collection Fund Revenue Account ..................................................................................... 126
Notes to the Collection Fund Statement ................................................................................... 127 1. Income from Business Rates .................................................................................................................. 127 2. Council Tax ............................................................................................................................................ 127 3. Council Tax Contribution to Collection Fund Surpluses & Deficits ................................................ 128 4. NNDR Contribution to Collection Fund Surpluses and Deficits ...................................................... 128
Group Financial Statements ....................................................................................................... 129 1. Introduction ........................................................................................................................................... 129 2. Basis of Identification of the Group Boundary .................................................................................. 129 3. Norwich Regeneration Limited (NRL) ................................................................................................. 129 4. NPS Norwich Ltd ................................................................................................................................... 130 5. Norwich Norse (Environmental) Limited ............................................................................................ 130 6. Norwich Norse (Building) Limited ....................................................................................................... 131 7. Three Score Open Space Management Ltd ........................................................................................ 131 8. Basis of Consolidation ......................................................................................................................... 131
Group Movement in Reserves Statement .................................................................................. 132
Group Comprehensive Income and Expenditure Statement ................................................... 133
Group Balance Sheet .................................................................................................................. 134
Group Cash Flow Statement ...................................................................................................... 135
Notes to the Group Accounts .................................................................................................... 136 9. Financing and investment Income and Expenditure......................................................................... 136 10. Property Plant and Equipment ............................................................................................................ 137 11. Investment Properties .......................................................................................................................... 138 12. Long Term Investments ....................................................................................................................... 139 13. Long Term Debtors ............................................................................................................................... 139 14. Short Term Debtors .............................................................................................................................. 139 15. Stock ...................................................................................................................................................... 140
Norwich City Council - 2017-18 Draft Statement of Accounts
16. Cash and Cash Equivalents ................................................................................................................. 140 17. Short Term Creditors ............................................................................................................................ 140
Glossary of Terms ...................................................................................................................... 141

Norwich City Council - 2017-18 Statement of Accounts
1
Narrative Report
1. Introduction Effective planning, management and scrutiny of the use of public funds are a key part of a local authority's responsibilities. The financial statements (commonly known as the accounts) are a vital part of the accountability framework, as they demonstrate how much money was spent and for what purpose, and how cash needs were met. They also record assets used, and liabilities incurred, in delivering services.
However, local authority financial statements are complex and can be difficult to understand: they must comply with the Chartered Institute of Public Finance & Accountancy’s (CIPFA) “Code of Practice on Local Authority Accounting in the United Kingdom 2017/18”, which is based on International Reporting Standards (IFRS), and also the requirements of accounting and financing regulations of central government.
This narrative report provides the reader with:
An understanding of the council, its strategic priorities, and the local and national context in which it operates.
An overview of the Council’s medium term financial plans, future outlook, and key risks going forwards.
A summary of the Council’s financial performance for 2017/18 along with information on how well the Council delivered its key priorities during the year.
A guide to the key features of the primary statements and notes that make up the set of financial statements along with a pointer to the key figures.
The Council is required to publish an Annual Governance Statement to accompany the Statement of Accounts. This sets out the arrangements the council has put in place to manage and mitigate the risks it faces when meeting its responsibilities. The 2017/18 Annual Governance Statement can be found at: https://www.norwich.gov.uk/downloads/download/1978/statement_of_accounts
2. Norwich City Council
Norwich City Council is a city district council. It delivers services to the heart of the city, approximately 60% of the urban area, covering a population of some 139,900 (Source: 2016 midyear estimates, Office of National Statistics, March 2018). These services include:
Housing services
Waste & recycling collections
Street cleansing
Car parking
Parks and open spaces
Cultural, tourism and leisure services
Electoral Registration
Housing and Council Tax Benefits
Local Planning
Public protection services including licensing and environmental health
The Council has 39 Councillors representing 13 Wards (three Councillors for each Ward), each serving a four year term.

Norwich City Council - 2017-18 Statement of Accounts
2
The political make-up of the city council during the 2017/18 financial year was as follows:
Labour 26 seats,
Green Party 10, and
Liberal Democrats 3.
Labour had a majority of the seats and therefore had overall control. The Cabinet for the 2017/18 financial year consisted of eight members of the Labour group including the Leader of the Council, as follows:
Portfolio Councillor
Leader of the council Councillor Alan Waters
Deputy leader and social housing Councillor Gail Harris
Safe city environment Councillor Kevin Maguire
Social inclusion Councillor Karen Davis
Safer, stronger neighbourhoods Councillor Chris Herries
Resources Councillor Paul Kendrick
Sustainable and inclusive growth Councillor Mike Stonard
Health and wellbeing Councillor Matthew Packer
The Council employs 549.82 full time equivalent (FTE) employees (as at 31 March 2018). The actual number of individuals is 672 of whom 395 are full time and 277 are part-time employees. The Council delivers some of it services in partnership with other organisations, the most significant of these being NPS Norwich Ltd (land and property management), Norwich Norse Environmental Ltd (street and other cleansing, grounds maintenance and tree work), Norwich Norse Building Ltd (housing and non-housing repairs and
maintenance), CNC Building Control, LGSS (provision of finance, internal audit, insurance and IT services) and NPLaw (legal services).
3. Strategic direction of the Council The corporate plan 2015-2020 sets out the overall strategic direction of the council including its vision, priorities and values. This guides everything the council will do for the city and its residents and visitors for the period. A copy of the Corporate Plan can be downloaded by following: https://www.norwich.gov.uk/info/20277/performance_and_open_data/1859/corporate_plan Our vision: overall this is what as council we aim to achieve for the city and its citizens. Our vision: to make Norwich a fine city for all. Our mission: this is the fundamental purpose of the council – so basically what we are here for. Our mission: to always put the city and its people first. Our priorities: these are the key things we aim to focus on achieving for the city and its residents to realise our vision over the next five years. Our core values: these drive how we will all work and act as teams and employees of the council. Taken together, these summarise what we promise to do and be as a council for the city and its residents. Everything we ever do as an organisation, whether in teams or as individuals, will be done with our core values in mind. These are:

Norwich City Council - 2017-18 Statement of Accounts
3
P Pride: We will take pride in what we do and demonstrate
integrity in how we do it. A Accountability: We will take responsibility, do what we
say we will do and see things through. C Collaboration: We will work with others and help others
to succeed. E Excellence: We will strive to do things well and look for
ways to innovate and improve.
4. Local context Norwich is a success story. It seamlessly combines the modern with the historic and is a vibrant city with a thriving economy and cultural scene. There is much to celebrate, but as with any city, it has some challenges. These issues include poor educational attainment and poor health. The severity of these varies considerably between different wards of the city. Detailed statistical information about the city can be found in The State of Norwich report found at https://www.norwich.gov.uk/download/downloads/id/4172/state_of_norwich_2017.pdf To build on the successes and address the challenges, Norwich needs a long term vison for the city – what do we want the city to be like in 2040 and what do we need to do to make it happen? As civic leader, Norwich City Council is steering the development of this vison. During 2017/18 the City engaged with residents, businesses, organisations and groups from across the city. This included focus groups with staff and residents, a 2040 Norwich City Vision conference, Councillor focus groups, and a youth city vison event. The City Council, along with key strategic partners, aims to publish the 2040 Norwich City Vision in autumn 2018. Running alongside this city vision project, is a review of the Council’s whole operating model to make sure we are “Fit for the Future” and can deliver the services that our residents, visitors, businesses and partner organisations want and need, within the resources we have. This review will reach preliminary conclusions during the early part of the

Norwich City Council - 2017-18 Statement of Accounts
4
2018/19 financial year and will result in a new corporate plan for the Council for 2019/20 and onwards.
5. National Context Norwich City Council is working in the context of the most challenging financial times that local government has ever faced. Since 2010, successive governments have reduced funding for local government in England as part of their efforts to reduce the national fiscal deficit. The National Audit office’s report (“Financial sustainability of local authorities 2018” published 5 March 2018) concludes that:
Government funding for local authorities has fallen by an estimated 49.1% in real terms from 2010/11 to 2017/18.
Alongside reductions in funding, local authorities have had to deal with growth in demand for key services (particularly homelessness and adult & children’s social care) as well as absorbing other cost pressures (such as higher national insurance contributions, the apprenticeship levy, and the National Living Wage).
Local authorities have changed their approach to managing reductions in income, shifting away from reducing spending on front-line services, to looking for other savings and alternative income sources, such as income from commercial activities.
To illustrate the severity of the challenges facing the sector, the statutory financial officer for Northamptonshire County
Council issued a section 114 notice in February 2018, indicating that it was at risk of spending more in the financial year than the resources it has available, which would be unlawful.
6. Medium Term Financial Strategy (MTFS), Future Outlook, and Risks
The latest MTFS, HRA Business Plan, and 2018/19 budgets were approved by Council in February 2018 and can be found at here.
General Fund The Council’s General Fund (GF) revenue budget comprises the annual day-to-day costs and income of providing all of the Council’s services except social housing which is in a separate budget called the Housing Revenue Account (HRA). The Medium Term Financial Strategy (MTFS) for the General Fund shows that forecast income is insufficient to fund forecast expenditure over the next five years. This is a result of cost pressures, such as inflation and Pension Fund deficit contributions, growth in demand for services and for funding the capital budget from revenue contributions, and reducing grants from central government (in particular Revenue Support Grant (RSG) and New Homes Bonus). The Council’s agreed approach to meeting this financial challenge is to:
Norwich City Council - 2017-18 Statement of Accounts
5
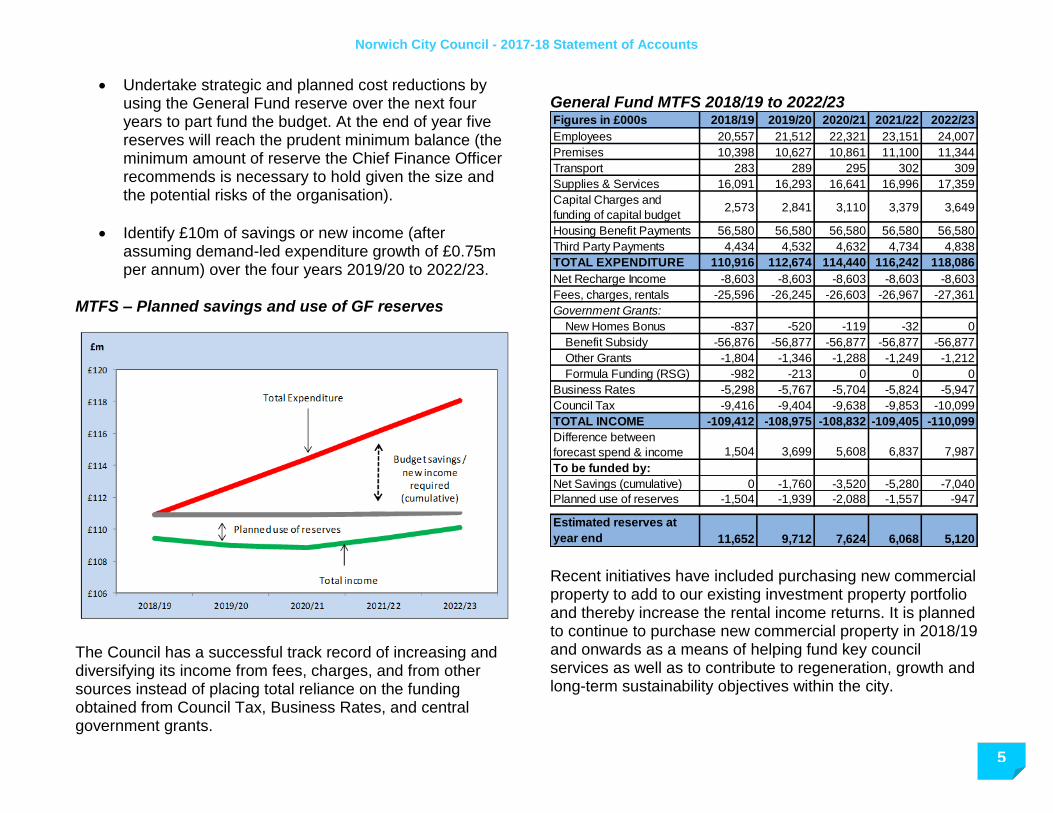
Undertake strategic and planned cost reductions by using the General Fund reserve over the next four years to part fund the budget. At the end of year five reserves will reach the prudent minimum balance (the minimum amount of reserve the Chief Finance Officer recommends is necessary to hold given the size and the potential risks of the organisation).
Identify £10m of savings or new income (after assuming demand-led expenditure growth of £0.75m per annum) over the four years 2019/20 to 2022/23.
MTFS – Planned savings and use of GF reserves
The Council has a successful track record of increasing and diversifying its income from fees, charges, and from other sources instead of placing total reliance on the funding obtained from Council Tax, Business Rates, and central government grants.
General Fund MTFS 2018/19 to 2022/23
Recent initiatives have included purchasing new commercial property to add to our existing investment property portfolio and thereby increase the rental income returns. It is planned to continue to purchase new commercial property in 2018/19 and onwards as a means of helping fund key council services as well as to contribute to regeneration, growth and long-term sustainability objectives within the city.
Figures in £000s 2018/19 2019/20 2020/21 2021/22 2022/23
Employees 20,557 21,512 22,321 23,151 24,007
Premises 10,398 10,627 10,861 11,100 11,344
Transport 283 289 295 302 309
Supplies & Services 16,091 16,293 16,641 16,996 17,359
Capital Charges and
funding of capital budget2,573 2,841 3,110 3,379 3,649
Housing Benefit Payments 56,580 56,580 56,580 56,580 56,580
Third Party Payments 4,434 4,532 4,632 4,734 4,838
TOTAL EXPENDITURE 110,916 112,674 114,440 116,242 118,086
Net Recharge Income -8,603 -8,603 -8,603 -8,603 -8,603
Fees, charges, rentals -25,596 -26,245 -26,603 -26,967 -27,361
Government Grants:
New Homes Bonus -837 -520 -119 -32 0
Benefit Subsidy -56,876 -56,877 -56,877 -56,877 -56,877
Other Grants -1,804 -1,346 -1,288 -1,249 -1,212
Formula Funding (RSG) -982 -213 0 0 0
Business Rates -5,298 -5,767 -5,704 -5,824 -5,947
Council Tax -9,416 -9,404 -9,638 -9,853 -10,099
TOTAL INCOME -109,412 -108,975 -108,832 -109,405 -110,099
Difference between
forecast spend & income 1,504 3,699 5,608 6,837 7,987
To be funded by:
Net Savings (cumulative) 0 -1,760 -3,520 -5,280 -7,040
Planned use of reserves -1,504 -1,939 -2,088 -1,557 -947
Estimated reserves at
year end 11,652 9,712 7,624 6,068 5,120
Norwich City Council - 2017-18 Statement of Accounts
6
In addition we are increasingly investing in the Council’s wholly owned company, Norwich Regeneration Ltd, by lending money at commercial rates to the company. This provides the Council with a new and increasing income source and also enables the company to construct much needed new housing in the city. The council is currently reviewing its operating model, working practices, and its use of IT technology to ensure it is “Fit for the Future”. It is anticipated that some efficiency savings can be made over the medium term arising from this review although these have not as yet been quantified. Whilst it is the Council’s preference to find further income generation opportunities and efficiency savings to balance the MTFS budget going forwards, we cannot rule out cuts or reductions in front line services given the scale of the financial challenges faced by the Council.
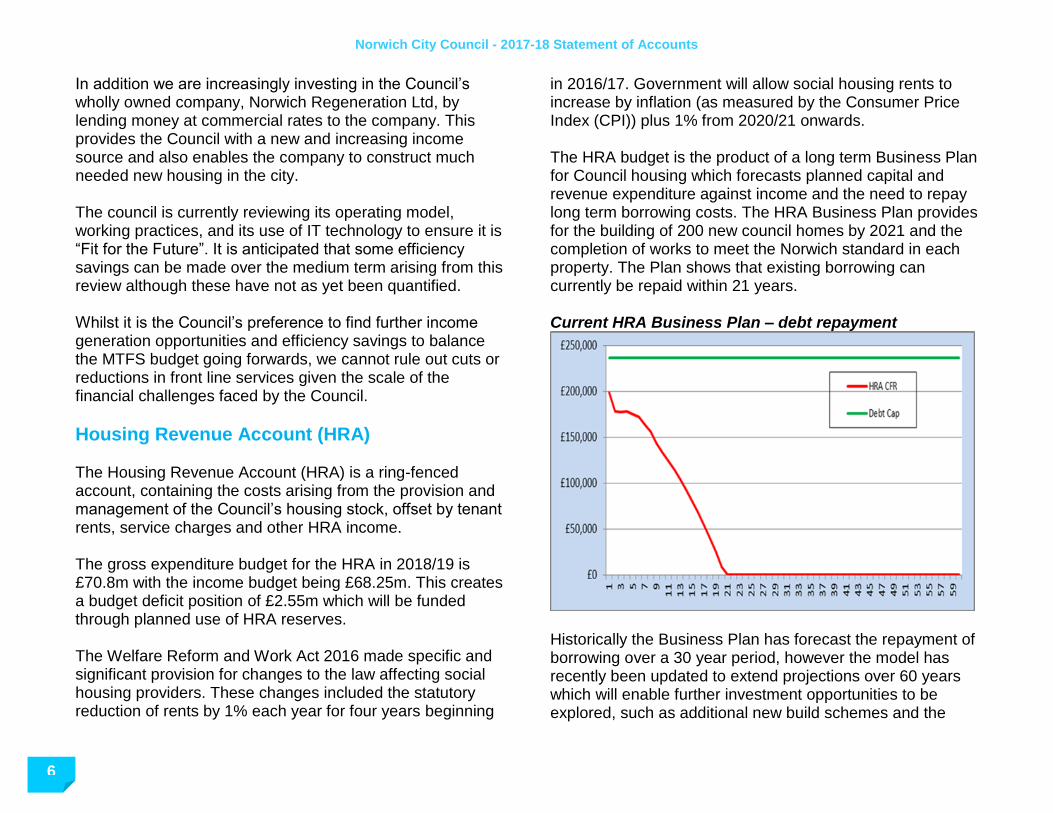
Housing Revenue Account (HRA) The Housing Revenue Account (HRA) is a ring-fenced account, containing the costs arising from the provision and management of the Council’s housing stock, offset by tenant rents, service charges and other HRA income. The gross expenditure budget for the HRA in 2018/19 is £70.8m with the income budget being £68.25m. This creates a budget deficit position of £2.55m which will be funded through planned use of HRA reserves. The Welfare Reform and Work Act 2016 made specific and significant provision for changes to the law affecting social housing providers. These changes included the statutory reduction of rents by 1% each year for four years beginning
in 2016/17. Government will allow social housing rents to increase by inflation (as measured by the Consumer Price Index (CPI)) plus 1% from 2020/21 onwards. The HRA budget is the product of a long term Business Plan for Council housing which forecasts planned capital and revenue expenditure against income and the need to repay long term borrowing costs. The HRA Business Plan provides for the building of 200 new council homes by 2021 and the completion of works to meet the Norwich standard in each property. The Plan shows that existing borrowing can currently be repaid within 21 years. Current HRA Business Plan – debt repayment
Historically the Business Plan has forecast the repayment of borrowing over a 30 year period, however the model has recently been updated to extend projections over 60 years which will enable further investment opportunities to be explored, such as additional new build schemes and the

Norwich City Council - 2017-18 Statement of Accounts
7
consideration of renewing rather than upgrading some existing housing stock.
Capital Programme The council owns and maintains an extensive range of assets including commercial property, HRA dwellings, a market, heritage assets, walkways and paths and lighting columns. Major investment in these and in new assets is funded from the capital programme which in turn is resourced from the disposal of surplus assets, revenue budget contributions, grants and external borrowing. The Council’s General Fund capital budget for 2018/19 is £42.8m with the largest individual budget being for the acquisition of new commercial property at £40m. Other large capital projects may be included in the programme later in the year once a Business Case has been submitted and approved to cabinet and full Council. The HRA capital budget is £31.6m of which the largest element is £22.8m for council house upgrades.
Future Outlook
Local government is set to experience the most significant
reform of its funding arrangements for over two decades.
The Fair Funding review, reset of business rates baselines,
and changes to the business rates retention system all have
critical implications for the distribution of funding across local
government. At the same time, the results of Spending
Review 2019 will affect the total level of funding available to
local government as a whole from April 2020.
Fairer Funding Review: The review will develop a new needs assessment which will form the basis of distribution of funding to local government. Government published an initial consultation earlier this year focused on the potential statistical approaches that could be used to measure the relative needs of local authorities and the identification of common cost drivers. It is understood that a further consultation will be launched in December 2018 and very indicative funding allocations published in spring 2019.
75% retention of Business Rates: Since 2013-14, councils in England have in theory kept 50% of business rates although the exact sum retained depends on a system of tariffs and top ups based on local need. From April 2020 councils will be able to keep 75% of the Business Rates they raise above a government established baseline figure. However, many questions remain about the scheme including how growth in Business Rates income should be divided up in areas where there is more than one tier of local government and whether some Business Rates income should be retained by government and redistributed nationally (as under the current system).
Another medium term uncertainty is the future performance of the national economy arising from Brexit. The financial impact of Brexit is as yet uncertain. It could be positive or negative, but is likely to affect interest and inflation rates, labour costs and property and rental values. In addition, any economic downturn decreases the amount of tax receipts and income collected by both national and local government and this has consequential impacts on the amount of money available for local government services.

Norwich City Council - 2017-18 Statement of Accounts
8
Financial Risks Financially the Council faces a large number of challenges in the coming years. The 2018/19 Budget Report identified five key financial risks facing the Council, as follows:
Long term uncertainty: Given the lack of clarity on future local government funding post April 2020 it is not possible to undertake meaningful and robust medium term financial planning for the financial year 2020/21 and onwards.
Scale of budget savings required over the medium term: £10m of gross savings and/or increased income needs to be identified and delivered over the 4 year period 2019/20 to 2022/23 which represents some 13% of the 2018/19 gross expenditure budget (excluding housing benefit payments).
Business Rates income: This is a highly volatile source of revenue and various factors including business closures, successful appeals against rateable values, changes in property usage from office/industrial to residential, and changes to the national and local economy can cause reductions in Business Rates income. The Business Rates Retention scheme will increase this risk from 50% to 75% for local authorities from 2020/21.
Achieving the 2018/19 budget savings: Planned savings and/or increased income of £2.4m will need to be delivered during 2018/19.
Increasing reliance on commercial income: The Council’s General Fund revenue budget comprises £26m
of fees, charges, rental and interest income arising from commercial or quasi-commercial activities, including net income arising from lending to the Council’s company, Norwich Regeneration Limited. This income funds 47% of expenditure on GF services (excluding housing benefits payments which is funded through government subsidy) and is planned to grow over the medium term. A recession or other unexpected/uncontrollable event could leave the Council exposed to under-funding or large losses in income. The Council is also exposed in some areas to competitive forces, for example the private sector housing market..
7. Performance against our priorities
To help us improve and demonstrate progress, we use a performance management framework. This helps us to:
Focus on the council priorities set up in the corporate plan
Set targets aimed at improving services and measure progress
Be accountable to our residents
For further information on the Council’s performance, please click here for the Citizen’s Portal which highlights the Council’s performance for each performance indicator. The performance for the financial year 2017/18 is shown in summary form in the pages that follow. (Green-means Succeeding, Amber- on track, and Red- needs improvement).
Norwich City Council - 2017-18 Statement of Accounts
9
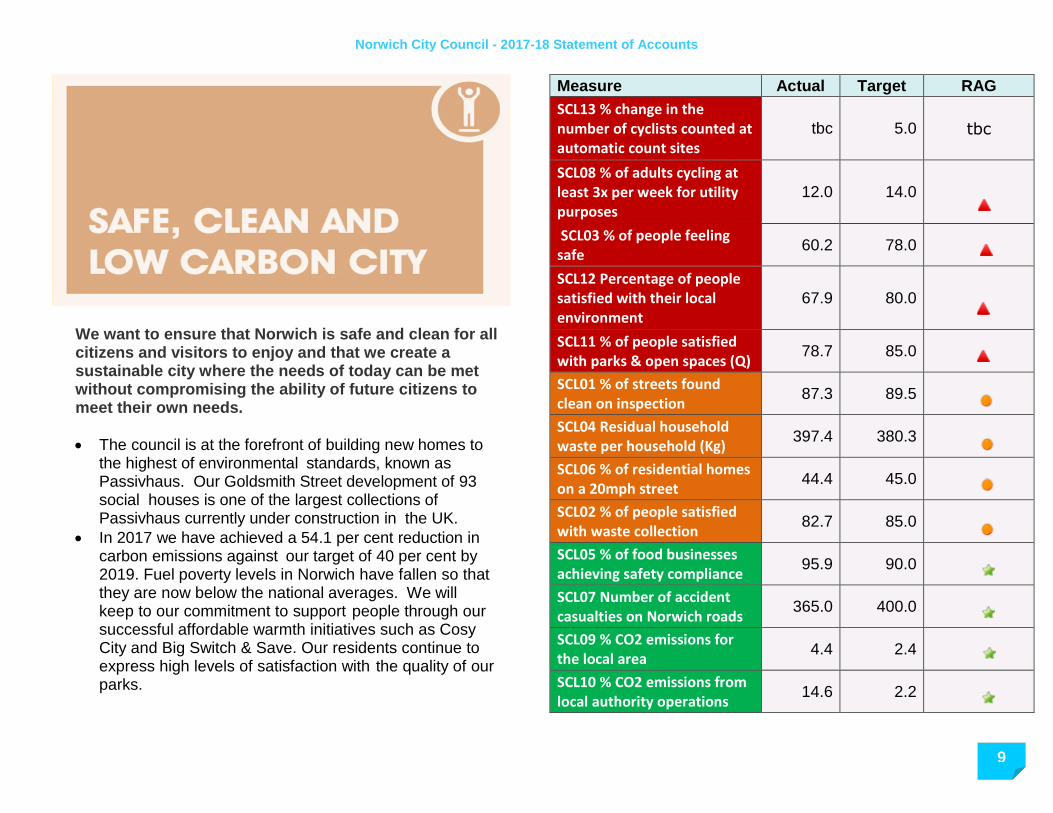
We want to ensure that Norwich is safe and clean for all citizens and visitors to enjoy and that we create a sustainable city where the needs of today can be met without compromising the ability of future citizens to meet their own needs.
The council is at the forefront of building new homes to the highest of environmental standards, known as Passivhaus. Our Goldsmith Street development of 93 social houses is one of the largest collections of Passivhaus currently under construction in the UK.
In 2017 we have achieved a 54.1 per cent reduction in carbon emissions against our target of 40 per cent by 2019. Fuel poverty levels in Norwich have fallen so that they are now below the national averages. We will keep to our commitment to support people through our successful affordable warmth initiatives such as Cosy City and Big Switch & Save. Our residents continue to express high levels of satisfaction with the quality of our parks.
Measure Actual Target RAG
SCL13 % change in the number of cyclists counted at automatic count sites
tbc 5.0 tbc
SCL08 % of adults cycling at least 3x per week for utility purposes
12.0 14.0
SCL03 % of people feeling safe
60.2 78.0
SCL12 Percentage of people satisfied with their local environment
67.9 80.0
SCL11 % of people satisfied with parks & open spaces (Q)
78.7 85.0
SCL01 % of streets found clean on inspection
87.3 89.5
SCL04 Residual household waste per household (Kg)
397.4 380.3
SCL06 % of residential homes on a 20mph street
44.4 45.0
SCL02 % of people satisfied with waste collection
82.7 85.0
SCL05 % of food businesses achieving safety compliance
95.9 90.0
SCL07 Number of accident casualties on Norwich roads
365.0 400.0
SCL09 % CO2 emissions for the local area
4.4 2.4
SCL10 % CO2 emissions from local authority operations
14.6 2.2

Norwich City Council - 2017-18 Statement of Accounts
10
We want Norwich to be a prosperous and vibrant city in which businesses want to invest and where everyone has access to economic, leisure and cultural opportunities.
The council is working with partners to support the development of major infrastructure which will help to support the growth of the city. This includes the Northern Distributor Road, now part opened and due for completion in April 2018, and the development of the Airport Industrial Estate to retain existing businesses and attract new ones.
Following a successful ballot of businesses, the Norwich Business Improvement District now has a remit to invest in the vitality of the whole of the city centre. We continue to build on the positive partnerships which support our programme of free events and work well with the creative sector to help the city’s unique cultural offer to thrive.
A number of city centre development sites continue to progress, including St Anne’s Quarter.
Measure Actual Target RAG
PVC8 % of people satisfied with leisure and cultural facilities
85.0
95.0
PVC09 Amount of visitors at council ran events
98,945
85,200
PVC03 Amount of funding secured by the council for regeneration activity (4 year rolling average)
£6,051 £2,000
PVC1 Number of new jobs created/ supported by council funded activity
327
300
PVC6 % Planning service quality measure
90.0
83.0
PVC2 % Delivery of the council’s capital programme
81.0
80.0
PVC07 No. of priority buildings on the 'at risk register' saved from decay by council interventions
1 1
Norwich City Council - 2017-18 Statement of Accounts
11
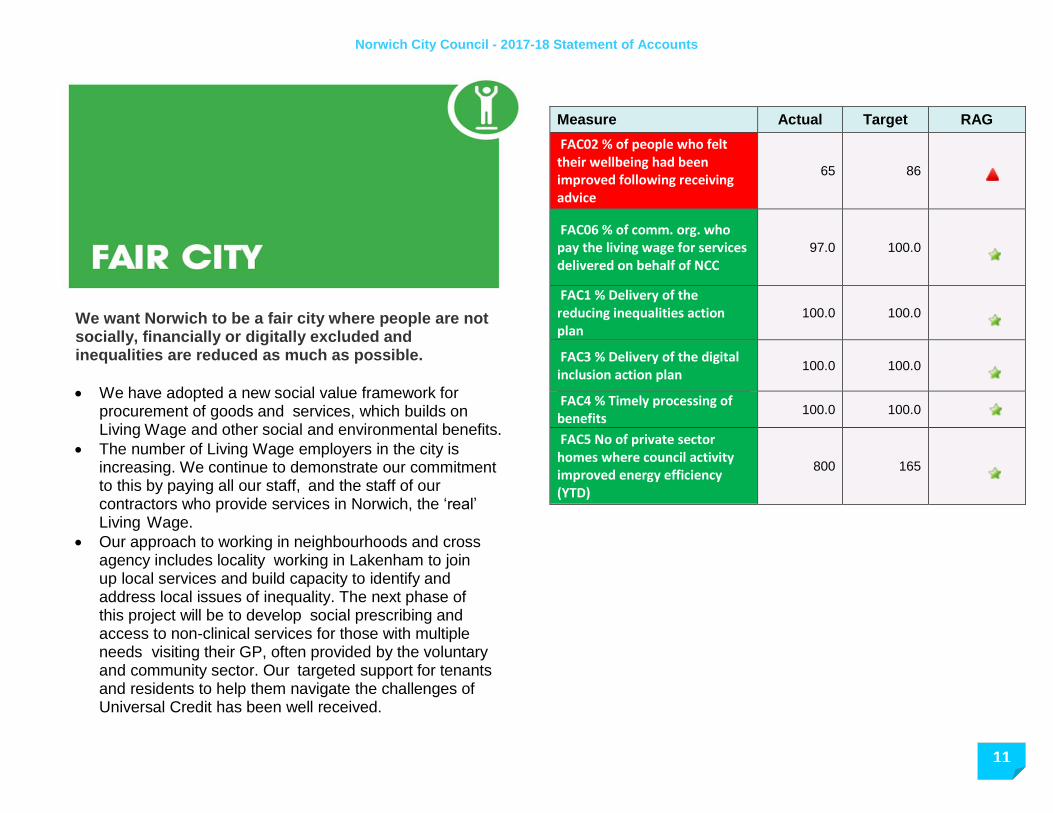
We want Norwich to be a fair city where people are not socially, financially or digitally excluded and inequalities are reduced as much as possible.
We have adopted a new social value framework for procurement of goods and services, which builds on Living Wage and other social and environmental benefits.
The number of Living Wage employers in the city is increasing. We continue to demonstrate our commitment to this by paying all our staff, and the staff of our contractors who provide services in Norwich, the ‘real’ Living Wage.
Our approach to working in neighbourhoods and cross agency includes locality working in Lakenham to join up local services and build capacity to identify and address local issues of inequality. The next phase of this project will be to develop social prescribing and access to non-clinical services for those with multiple needs visiting their GP, often provided by the voluntary and community sector. Our targeted support for tenants and residents to help them navigate the challenges of Universal Credit has been well received.
Measure Actual Target RAG
FAC02 % of people who felt their wellbeing had been improved following receiving advice
65 86
FAC06 % of comm. org. who pay the living wage for services delivered on behalf of NCC
97.0 100.0
FAC1 % Delivery of the reducing inequalities action plan
100.0 100.0
FAC3 % Delivery of the digital inclusion action plan
100.0 100.0
FAC4 % Timely processing of benefits
100.0 100.0
FAC5 No of private sector homes where council activity improved energy efficiency (YTD)
800 165

Norwich City Council - 2017-18 Statement of Accounts
12
We want to ensure that people in Norwich are healthy and have access to appropriate and good quality housing.
Norwich City Council will build new homes through the council owned company, Norwich Regeneration Company. The new development at Rayne Park will see 172 new homes being built during the first phase. This will be a mixture of social rented housing and private properties for sale and rent.
We will endeavour to contribute to the health of residents by working in partnership with our colleagues in the Healthy Norwich Partnership, for example developing the ‘daily mile’ which encourages activity in primary school children.
Measure Actual Target RAG
HCH04 Affordable Homes measure 117 200
HCH1 % Delivery of the Healthy Norwich action plan
95.0
100.0
HCH2 Relet times for council housing
17 16
HCH03 No of empty homes brought back into use
45 20
HCH5 % Preventing homelessness
67.5
60.0
HCH6 % of people who feel that the work of the HIA has enabled them to maintain independent living
95 90
HCH7 % of council properties meeting Norwich standard
97.9
97.0
HCH8 % of tenants satisfied with the housing service
84.0
83.0
HCH9 No of private sector homes made safe
102 100
Norwich City Council - 2017-18 Statement of Accounts
13
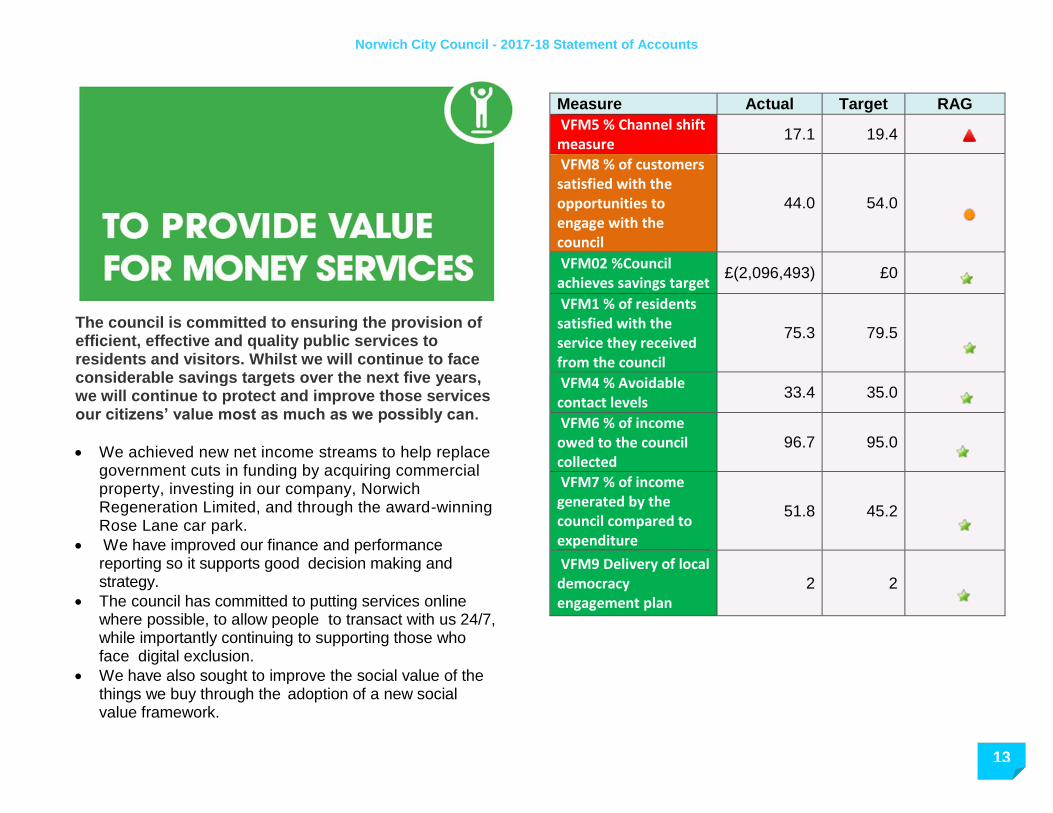
The council is committed to ensuring the provision of efficient, effective and quality public services to residents and visitors. Whilst we will continue to face considerable savings targets over the next five years, we will continue to protect and improve those services our citizens’ value most as much as we possibly can.
We achieved new net income streams to help replace government cuts in funding by acquiring commercial property, investing in our company, Norwich Regeneration Limited, and through the award-winning Rose Lane car park.
We have improved our finance and performance reporting so it supports good decision making and strategy.
The council has committed to putting services online where possible, to allow people to transact with us 24/7, while importantly continuing to supporting those who face digital exclusion.
We have also sought to improve the social value of the things we buy through the adoption of a new social value framework.
Measure Actual Target RAG
VFM5 % Channel shift measure
17.1 19.4
VFM8 % of customers satisfied with the opportunities to engage with the council
44.0 54.0
VFM02 %Council achieves savings target
£(2,096,493) £0
VFM1 % of residents satisfied with the service they received from the council
75.3 79.5
VFM4 % Avoidable contact levels
33.4 35.0
VFM6 % of income owed to the council collected
96.7 95.0
VFM7 % of income generated by the council compared to expenditure
51.8 45.2
VFM9 Delivery of local democracy engagement plan
2 2
Norwich City Council - 2017-18 Statement of Accounts
14
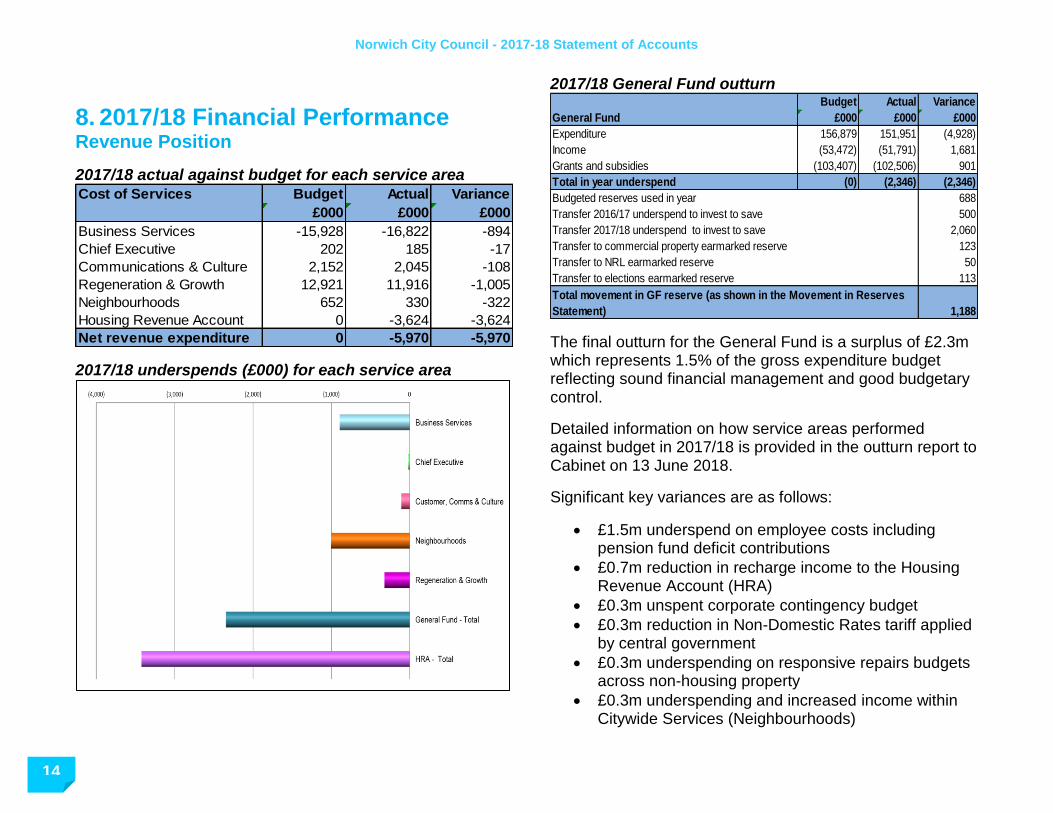
8. 2017/18 Financial Performance Revenue Position
2017/18 actual against budget for each service area
2017/18 underspends (£000) for each service area
2017/18 General Fund outturn
The final outturn for the General Fund is a surplus of £2.3m which represents 1.5% of the gross expenditure budget reflecting sound financial management and good budgetary control.
Detailed information on how service areas performed against budget in 2017/18 is provided in the outturn report to Cabinet on 13 June 2018.
Significant key variances are as follows:
£1.5m underspend on employee costs including pension fund deficit contributions
£0.7m reduction in recharge income to the Housing Revenue Account (HRA)
£0.3m unspent corporate contingency budget
£0.3m reduction in Non-Domestic Rates tariff applied by central government
£0.3m underspending on responsive repairs budgets across non-housing property
£0.3m underspending and increased income within Citywide Services (Neighbourhoods)
Cost of Services Budget Actual Variance
£000 £000 £000
Business Services -15,928 -16,822 -894
Chief Executive 202 185 -17
Communications & Culture 2,152 2,045 -108
Regeneration & Growth 12,921 11,916 -1,005
Neighbourhoods 652 330 -322
Housing Revenue Account 0 -3,624 -3,624
Net revenue expenditure 0 -5,970 -5,970
Budget Actual Variance
£000 £000 £000
Expenditure 156,879 151,951 (4,928)
Income (53,472) (51,791) 1,681
Grants and subsidies (103,407) (102,506) 901
Total in year underspend (0) (2,346) (2,346)
Budgeted reserves used in year 688
Transfer 2016/17 underspend to invest to save 500
Transfer 2017/18 underspend to invest to save 2,060
Transfer to commercial property earmarked reserve 123
Transfer to NRL earmarked reserve 50
Transfer to elections earmarked reserve 113
1,188
Total movement in GF reserve (as shown in the Movement in Reserves
Statement)
General Fund

Norwich City Council - 2017-18 Statement of Accounts
15
£0.1m reduction in Minimum Revenue Provision (MRP) arising from back-dating of new MRP Policy agreed by Council in January 2018
£0.1m additional grant income – relating to New Burdens for housing subsidy payments
2017/18 General Fund Savings achieved
The 2017/18 budget included a target of £3.312m of budget savings or increased income. 92% of the target had been delivered by year end. The undelivered element was more than met by unbudgeted savings and additional income as mentioned in the previous paragraph. The following pie charts show how the money was spent (excluding housing benefit payments) and where the money came from in 2017/18.
General Fund – how the money was spent in 2017/18
General Fund - where the money came from in 2017/18

Norwich City Council - 2017-18 Statement of Accounts
16
2017/18 Housing Revenue Account outturn
The final outturn position for the HRA is a surplus of £3.6m which represents 5% of the total expenditure budget.
This is largely a result of the need for responsive repairs on HRA dwellings being less than anticipated by £2.5m. Capital investment in planned works over the last five years has meant that old items have been replaced before they start to fail and require funding from the responsive repairs budget. The other significant area of underspending was in HRA general management including staffing costs and the HRA contingency budget.
Reserves position
This is shown in the 2017/18 Statement of Accounts section of this narrative report in section 9.
HRA – how the money was spent in 2017/18
HRA- where the money came from in 2017/18
Budget Actual Variance
£000 £000 £000
Expenditure 70,764 66,959 (3,805)
Receipts (70,764) (70,583) 181
Total in year underspend (0) (3,624) (3,624)
3,020
500
(104)
Housing Revenue Account (HRA)
Total movement in HRA reserve (as shown in the Movement
in Reserves Statement)
Budgeted reserves used in year
Transfer to HRA invest to save reserve

Norwich City Council - 2017-18 Statement of Accounts
17
Capital Position
2017/18 capital outturn
2017/18 funding of the capital programme
The Council decided in February 2018, as part of the 2018/19 budget setting report, to change its approach to how and when it agrees schemes and projects for inclusion in the capital budget. It decided that for large projects and those requiring the council to borrow in order to finance, such schemes would only be approved and included in the budget once a robust Business Case has been submitted to the Council and the scheme is ready to implement.
The General Fund capital budget agreed for 2017/18 was partly aspirational in that a number of large projects had been included which were not ready to be implemented in that financial year and have not therefore spent any of the budget allocated to them.
The biggest of these was the £4.4m budget approved for investment in the redevelopment of the airport industrial estate including related demolition costs of property at Hurricane Way. Whilst no actual capital expenditure has yet been incurred, Norwich City Council and Norfolk County Council have appointed a joint Project Manager for the scheme and soft-market testing has just concluded to assess potential private sector interest in redeveloping the estate as a Joint Venture partnership.
In addition, £16.2m was approved in the General Fund capital budget to lend to the Council’s wholly owned company, Norwich Regeneration Limited (NRL) so that it could develop new housing at Rayne Park (part of the Threescore land development). Whilst £10.7m was lent to NRL during 2017/18 this isn’t, in accounting terms, capital expenditure but is a balance sheet transaction. There is therefore no capital expenditure to report alongside the budget approved for the loan.
A sum of £40m was approved in the 2017/18 General Fund capital budget for commercial property acquisition. This is part of a programme of upgrading and growing the Council’s existing investment property portfolio by selling smaller, less valuable assets and/or assets that take a lot of management time, and replacing them by better quality and higher yielding investment property.
£13.4m was spent in 2017/18 on acquiring three new investment properties whilst the acquisition of another property (£10m) concluded just after the end of the financial
Current
Budget
£000s
Final
Outturn
£000s
Final
Variance
£000s
£000 £000 £000
General Fund Capital 75,182 19,040 (56,143)
Housing Capital 59,345 28,636 (30,709)
TOTAL 134,527 47,676 (86,852)
Fund
SOURCE OF FUNDING £000
Internal borrowing (use of cash balances) 13,808
Revenue Contributions (RCCO) 13,273
Major Repairs Reserve 7,001
Retained One for One RTB Capital Receipts 6,628
Other capital receipts 656
CCA Grant 2,530
Leaseholder Contributions 1,159
Grant funding 1,671
Section 106 316
CIL Strategic Pool 635
FUNDING OF 2017/18 CAPITAL PROGRAMME 47,676

Norwich City Council - 2017-18 Statement of Accounts
18
year in April 2018. £16m of the budget remains uncommitted to carry forward into 2018/19 although the pace of spending the money is dependent on good and relevant investment opportunities becoming available in the market. The purchase of these properties has more than achieved the new net income target for commercial rental income set in the MTFS (£75k in 2017/18 and £400k in 2018/19).
During the 2017/18 financial year, the housing capital programme delivered upgrades to over 3,700 council homes, including over 500 new kitchens, 600 new bathrooms, and 500 heating installations. Over 400 properties have benefitted from structural or roofing upgrades. Additionally, over 1,600 doors were replaced including 283 in tower blocks as part of a programme to improve fire resistance. The development of new council homes has continued, with 10 homes completed at Hansard Close. Work also commenced on the 93 homes being built at Goldsmith Street, although some delay on site has meant that £7m of budget was not spent last year and will carry forward into 2018/19. In addition to being one of the largest residential Passivhaus schemes in the UK, the design of the Goldsmith Street development was a project winner at the 2016 Housing Design Awards and voted as one of the top 10 architectural schemes by The Times. Grants of Right to Buy receipts to Registered Providers have also enabled the development of a further 177 new affordable homes in the city. Detailed information on 2017/18 performance against the capital budget is provided in the outturn report to Cabinet on 13 June 2018.
Architect’s impression of Goldsmith Street
9. 2017/18 Statement of Accounts
The Statement of Accounts sets out the financial performance of the Council for the year ended 31 March 2018 and its financial position at that date.
It comprises core and supplementary statements together with disclosure notes.
The format and content of the financial statements are prescribed by the Chartered Institute of Public Finance & Accountancy (CIPFA) Code of Practice on Local Authority Accounting in the United Kingdom (the Code). The Code requires that the accounts give a true and fair view of the financial position of the Council and are prepared

Norwich City Council - 2017-18 Statement of Accounts
19
on the basis that the Council is a going concern. In line with the Code, suitable accounting policies have been applied, and where necessary, prudent judgements and estimates have been made. The Statement also includes for the first time the financial performance and position of the Council’s wholly owned company, Norwich Regeneration Limited, now that the company has reached the financial size required for it to be consolidated within the Council’s accounts. The purpose and key figures to note for each of the key statements are described in the following sections of this narrative report.
Expenditure and Funding Analysis
The Expenditure and Funding Analysis essentially reconciles the figures given in the budget outturn position to those included in the Comprehensive Income and Expenditure Statement (CIES) which follows the Analysis.
The CIES shows the accounting cost for the year of providing the Council’s services. This is not the same as the budget outturn information. The accounting cost is determined in accordance with generally accepted accounting principles (contained within the Code) whilst the budget, and the year-end outturn against the budget, has to comply with local government legislation.
The Code requires that councils make a number of adjustments to the budget outturn results to determine the accounting costs and income shown in the Statement of Accounts. For example, large adjustments are made for the accounting treatment of fixed assets (depreciation) and pension costs. These costs, whilst shown in the CIES
because they are required under accounting standards, are not included in the Council’s annual budget nor funded from Council Tax.
The inclusion of such costs in the CIES is to enable comparison of a council’s Statement of Accounts with other organisations, both public and private sector.
The Expenditure Funding Analysis allows a link to be made between year-end outturn against the budget to the financial position as set out in the financial statements.
Key figures to note:
Net (Surplus) / Deficit on General Fund and HRA balance in year
This part of analysis shows how annual expenditure is used and funded from resources (government grants, fees & charges, council tax and business rates).
For the General Fund the year-end outturn position is a surplus of (£2.783m), alongside total transfers to reserves of £3.971m in line with the proposed approach to managing reserves set out in the Medium term financial Strategy
For the HRA the year-end outturn is a surplus of (£0.902m), alongside total transfers to reserves of £0.797m. This results in an overall increase in general fund reserves of £0.105m.
Adjustments between the funding & accounting basis
This part of the analysis shows the adjustments that have been made in order to comply with generally accepted accounting practices.

Norwich City Council - 2017-18 Statement of Accounts
20
These total £54.8m and comprise:
Depreciation & Impairment
Revaluation gains/losses
Capital grants and contributions credited to the CIES
Reversal of the HRA depreciation charge
Pension reserve adjustments
Collection fund adjustment account adjustments.
Net expenditure in the CIES
This shows the accounting cost of providing each service (shown also in the CIES) after adding together the year-end outturn position against the budget with the adjustments required under accounting standards.
It is a surplus of £58.5m
Comprehensive Income and Expenditure Statement (CIES)
The CIES records all of the Council’s income and expenditure for the year and has two parts:
The first part reflects the accounting cost of providing the Council’s services with the results summarised at the Surplus or Deficit on the Cost of Services line. In the private sector this would be equivalent to the profit or loss of a company.
The second part, showing other comprehensive income and expenditure, shows the gains or losses in the measurement of the council’s assets and liabilities. These gains and loses arise as a result of changes in market valuations, interest rates or changes in measurement assumptions in relation to pension liabilities.
Key figures to note:
Cost of Services
This shows expenditure on continuing operations analysed by service area (based on the way the Council operates and manages its services). These lines are reconciled to the budget outturn position in the Expenditure & Funding Analysis.
The 2017/18 cost of services is a surplus of (£35.77m) compared to (£1.56m) surplus in 2016/17.
The main reason for the movement is the gain in value of the Council’s HRA dwellings arising from a higher asset revaluation in 2017/18 compared to the prior year.
Other operating income & expenditure
This includes the surplus or deficit from the sale of property, plant or equipment.
Total other operating income and expenditure is a (£3.3m) surplus largely arising from an increased gain on the disposal of HRA dwellings (against the carrying value of the properties).

Norwich City Council - 2017-18 Statement of Accounts
21
Financing and investment income and expenditure
Includes interest receivable and payable, net rental income on the properties held purely for investment purposes; and the interest element of the pension fund liability. The net costs have decreased from 2016/17 mainly due to lower interest costs following the scheduled repayment of £7m of borrowing in 2017/18.
Other income & expenditure
This includes surplus/deficit on revaluations of non-current assets and actuarial gains/losses on the local government pension scheme. These are both calculated annually by our property valuers and actuaries. These items are non-cash transactions and do not impact on the general fund reserve balances, being reversed out through the Movement in Reserves Statement.
Movement in Reserves Statement (MIRS)
The MIRS shows the movement from the start of the year to the end on the different reserves held by the council. It shows how the movements are broken down between gains and losses incurred in accordance with the Code and the statutory adjustments required to return to the amounts chargeable to the budget as required under local government legislation. Reserves are important to local authorities as, unlike central government, they cannot borrow money over the medium-term, other than for investment in assets, and they are
required to balance their budgets on an annual basis. They are therefore a vital part of prudential financial management and help reduce the financial risks mentioned earlier in this narrative report. Reserves are analysed into two categories: usable and unusable.
Usable reserves
Result from the Council’s activities
Members are involved in deciding on the levels maintained and their use
Can be spent in the future
Include: general fund, HRA, earmarked reserves, capital receipts reserve, major repairs reserve, and capital grants unapplied
Unusable reserves
Derive from accounting adjustments
Cannot be spent
Include: revaluation reserve and capital adjustment account
Key figures to note:
Opening Balances
These are the same as the previous year’s closing balances.
Total comprehensive income
This is £83.83m and agrees with the Comprehensive Income and Expenditure Account.

Norwich City Council - 2017-18 Statement of Accounts
22
Adjustments between accounting basis & funding basis under regs.
These are made as the result of regulation and are adjustments that are required by accounting standards or statute.
For example, accounting standards require depreciation to be charged to the general fund to represent the cost of assets used in the delivery of services. Statute however requires that these are removed from the general fund in order to calculate the amount of useable general fund reserves.
Overall net adjustments of (£37.5m) have been made to the useable reserves.
Transfers to/from earmarked reserves and between reserves (voluntary transfers)
These are made as a result of the authority’s decisions.
Voluntary transfers include the earmarking of reserves, which is the setting aside of cash to fund specific longer-term objectives & spend.
The main transfers in year have been into the general fund and HRA invest-to-save reserves, Section 31 grant reserve and the insurance reserve. In addition three new earmarked reserves have been created: Commercial property reserve, Norwich Regeneration Ltd reserve, and the Elections reserve.
Closing Balances
These agree with the figures shown in the Balance Sheet with total usable reserves of £101m and unusable reserves of £575m.
A description of each of the Council’s useable reserves and the amount held in the reserve as at the end of 2017/18 is shown below.
Reserve Purpose
Amount as at
31/3/18 (£000)
GENERAL FUND RESERVES
General reserve
This is a usable reserve which has not been earmarked for a specific future use. However, the agreed MTFS strategy is to use this reserve over the next 4 years to part fund the annual budget.
13,156
Invest to save reserve
The reserve has been set up to support the delivery of savings and efficiencies through the Fit for the Future programme. The reserve is expected to be utilised to support the implementation of a new operating model, IT investment and increased capacity in commercial, property and place shaping activities over the next 2-3 years.
2,648

Norwich City Council - 2017-18 Statement of Accounts
23
Revenue grants unapplied reserve
This holds the grants and contributions received which have yet to be applied to meet expenditure. The use of the balance is restricted and can only be used to fund the specific expenditure/service area awarded the grant income.
2,072
S31 Earmarked reserve
This holds the unutilised balance of the S31 grant monies received in 2016/17 and 2017/18 from central government to fund Business Rates relief. These monies will be transferred to the General Fund Reserves as and when required to offset any future Business Rates deficit.
2,165
Insurance reserve
This is to cover the excesses carried in respect of claims under various insurance policies and is subject to annual review.
681
Commercial property reserve
Has been established to reduce the risks associated with holding commercial property by providing funding for any future void and rent free periods as well as repairs and upgrades to the investment property portfolio. This is the first year for the earmarked reserve and it is anticipated that the amounts put aside for this purpose will increase in 2018/19 onwards.
123
Elections reserve
This is to provide funding for future elections, the cost and funding of which varies each year depending on the type of elections being held.
113
Mousehold Conservators Reserve
Set aside for use on Mousehold Heath.
8
NRL reserve
This reserve has been established to smooth any fluctuations in net income received by the Council from lending to NRL. It will provide a buffer in case the income is lower than anticipated due to the company not borrowing as much or as early from the council as planned (e.g. due to delays in construction). This is the first year for the earmarked reserve and it is anticipated that the amounts put aside for this purpose will increase in 2018/19 onwards.
50
HOUSING REVENUE ACCOUNT (HRA) RESERVES
General reserve
This is also a usable reserve which has not been earmarked for a specific future use. The use of this is incorporated into the HRA business plan.
30,488
Invest to save reserve
This will fund the HRA's share of implementing the Fit for the Future programme (see above).
500
Norwich City Council - 2017-18 Statement of Accounts
24
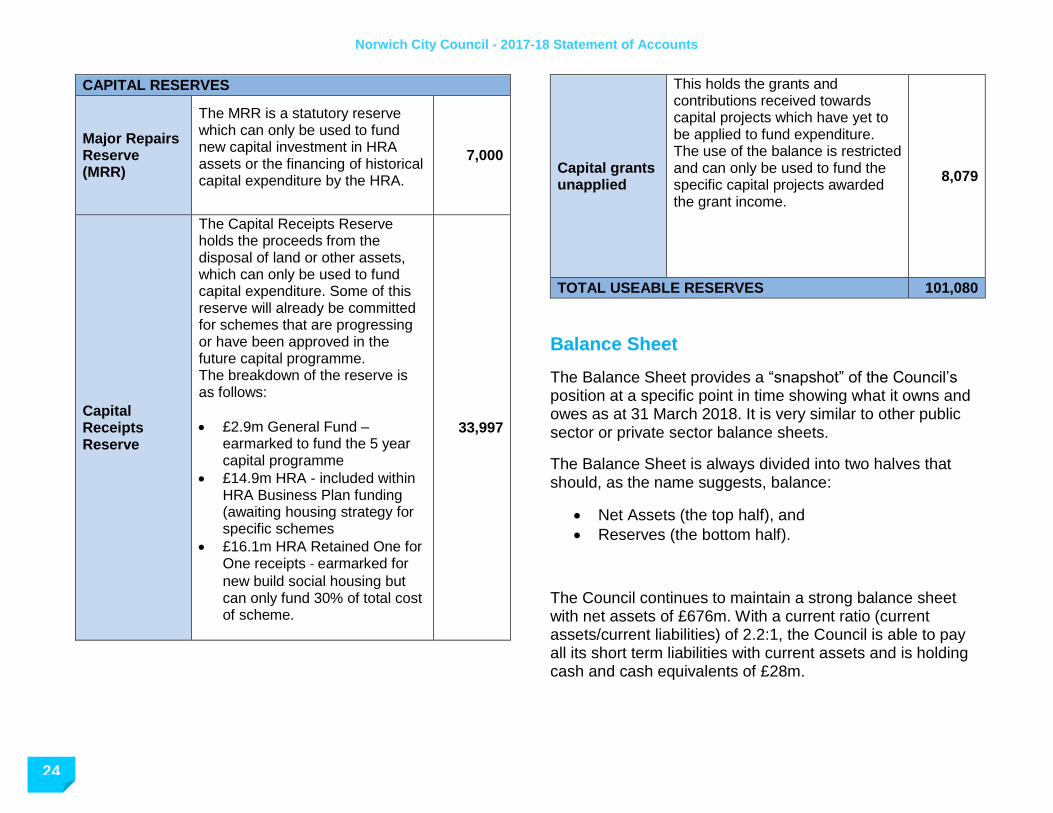
CAPITAL RESERVES
Major Repairs Reserve (MRR)
The MRR is a statutory reserve which can only be used to fund new capital investment in HRA assets or the financing of historical capital expenditure by the HRA.
7,000
Capital Receipts Reserve
The Capital Receipts Reserve holds the proceeds from the disposal of land or other assets, which can only be used to fund capital expenditure. Some of this reserve will already be committed for schemes that are progressing or have been approved in the future capital programme. The breakdown of the reserve is as follows:
£2.9m General Fund – earmarked to fund the 5 year capital programme
£14.9m HRA - included within HRA Business Plan funding (awaiting housing strategy for specific schemes
£16.1m HRA Retained One for One receipts - earmarked for
new build social housing but can only fund 30% of total cost of scheme.
33,997
Capital grants unapplied
This holds the grants and contributions received towards capital projects which have yet to be applied to fund expenditure. The use of the balance is restricted and can only be used to fund the specific capital projects awarded the grant income.
8,079
TOTAL USEABLE RESERVES 101,080
Balance Sheet
The Balance Sheet provides a “snapshot” of the Council’s position at a specific point in time showing what it owns and owes as at 31 March 2018. It is very similar to other public sector or private sector balance sheets.
The Balance Sheet is always divided into two halves that should, as the name suggests, balance:
Net Assets (the top half), and
Reserves (the bottom half).
The Council continues to maintain a strong balance sheet with net assets of £676m. With a current ratio (current assets/current liabilities) of 2.2:1, the Council is able to pay all its short term liabilities with current assets and is holding cash and cash equivalents of £28m.
Norwich City Council - 2017-18 Statement of Accounts
25
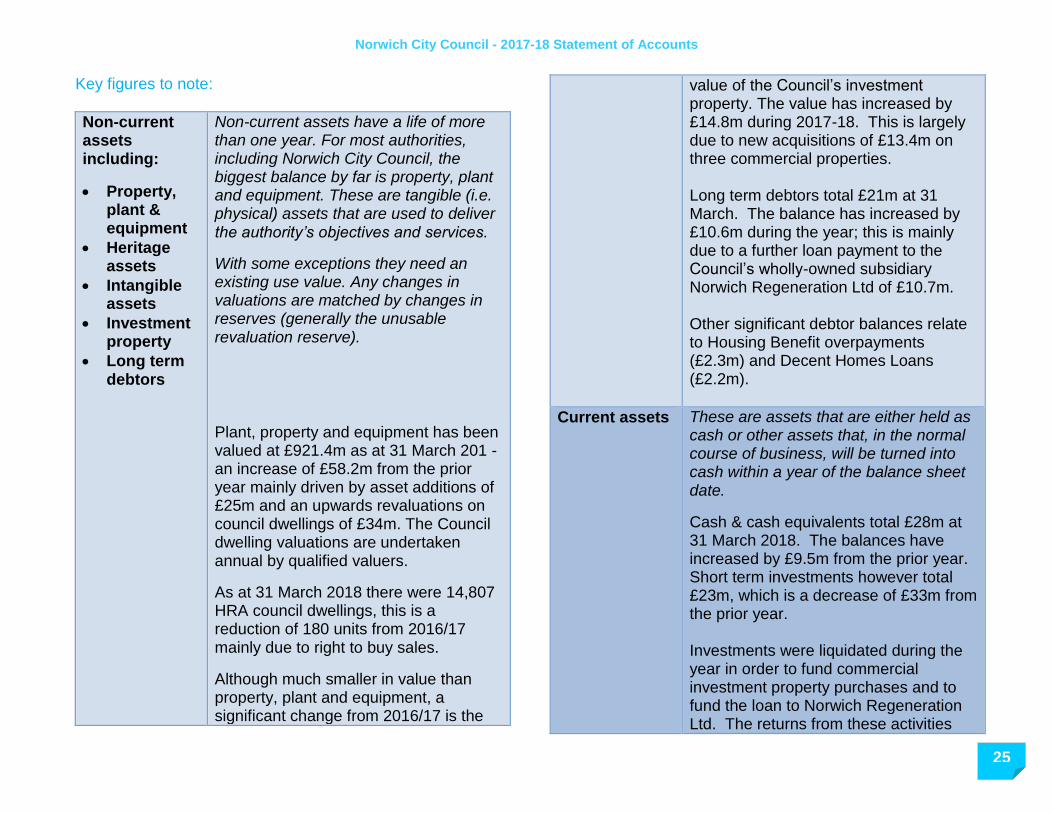
Key figures to note:
Non-current assets including:
Property, plant & equipment
Heritage assets
Intangible assets
Investment property
Long term debtors
Non-current assets have a life of more than one year. For most authorities, including Norwich City Council, the biggest balance by far is property, plant and equipment. These are tangible (i.e. physical) assets that are used to deliver the authority’s objectives and services.
With some exceptions they need an existing use value. Any changes in valuations are matched by changes in reserves (generally the unusable revaluation reserve).
Plant, property and equipment has been valued at £921.4m as at 31 March 201 - an increase of £58.2m from the prior year mainly driven by asset additions of £25m and an upwards revaluations on council dwellings of £34m. The Council dwelling valuations are undertaken annual by qualified valuers.
As at 31 March 2018 there were 14,807 HRA council dwellings, this is a reduction of 180 units from 2016/17 mainly due to right to buy sales.
Although much smaller in value than property, plant and equipment, a significant change from 2016/17 is the
value of the Council’s investment property. The value has increased by £14.8m during 2017-18. This is largely due to new acquisitions of £13.4m on three commercial properties. Long term debtors total £21m at 31 March. The balance has increased by £10.6m during the year; this is mainly due to a further loan payment to the Council’s wholly-owned subsidiary Norwich Regeneration Ltd of £10.7m. Other significant debtor balances relate to Housing Benefit overpayments (£2.3m) and Decent Homes Loans (£2.2m).
Current assets These are assets that are either held as cash or other assets that, in the normal course of business, will be turned into cash within a year of the balance sheet date.
Cash & cash equivalents total £28m at 31 March 2018. The balances have increased by £9.5m from the prior year. Short term investments however total £23m, which is a decrease of £33m from the prior year. Investments were liquidated during the year in order to fund commercial investment property purchases and to fund the loan to Norwich Regeneration Ltd. The returns from these activities

Norwich City Council - 2017-18 Statement of Accounts
26
are higher than the interest income obtainable in the market for short term cash investments. Short term debtors includes housing rent debt (£7.4m), VAT recovery claim, collection fund debtors, trade receivables and a receivable of £1.7m for the DfT Cycle Safety Grant.
Current Liabilities
Short term creditors include trade creditors, collection fund shares for central government and Norfolk County Council and year end expenditure accruals. These are amounts which are anticipated to be settled within 12 months.
The short term creditors balance has reduced by £7.6m from 16/17 due in part to reductions in the Housing Benefit subsidy creditor of £1.8m and a reduction in the central government share of the Non-Domestic Rate collection fund of £1.3m.
Long term liabilities & provisions
Includes borrowings, any amounts owed for leases and an estimate for the cost of meeting the council’s pensions obligations earned by past and current members of the pension scheme.
Borrowing - Overall borrowing (long term and short term) has reduced from £210m to £203m due to the scheduled repayment of £7m of HRA debt. The
Council has taken no new borrowing during the year. Long term borrowing is disclosed and analysed in Note 18.
Provisions – represent future liabilities over how much the authority owes or when it will have to pay.
The Council’s most significant provision relates to Business Rates valuation appeals. Following localisation in 2013, the Council has to set aside a provision for any future successful ratepayer appeals against rateable valuations. Norwich has a high degree of exposure to risk in this regard due to the number and size of rateable properties in the area. The Council currently has 197 rating appeals outstanding.
The provision allowance has been increased in 2017/18 to provide coverage of the new 2017 ratings list. To date only a small number of rating challenges have been received and a provision has therefore been created based on historic appeals trends until further information is available.
Pension Liabilities - The Council has net pension liabilities of £180m in the Balance Sheet. This reflects the value of pension liabilities which the Council is required to pay in the future as they fall due, offset by the value of assets
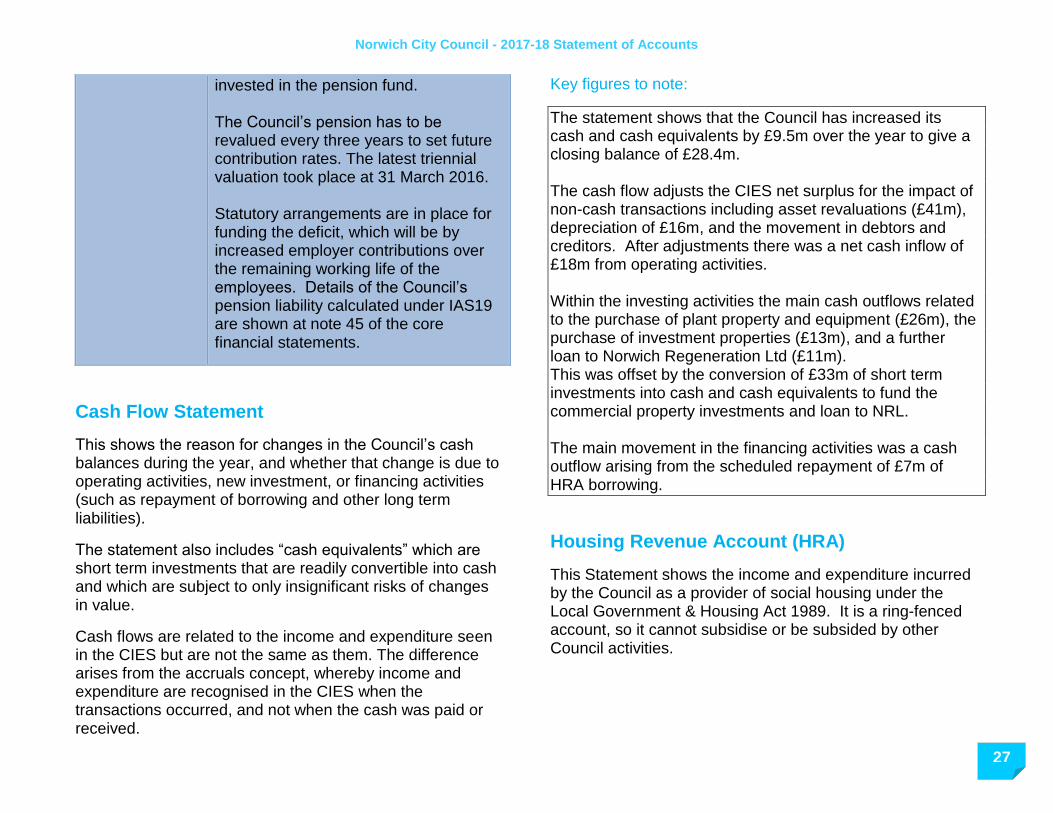
Norwich City Council - 2017-18 Statement of Accounts
27
invested in the pension fund. The Council’s pension has to be revalued every three years to set future contribution rates. The latest triennial valuation took place at 31 March 2016. Statutory arrangements are in place for funding the deficit, which will be by increased employer contributions over the remaining working life of the employees. Details of the Council’s pension liability calculated under IAS19 are shown at note 45 of the core financial statements.
Cash Flow Statement
This shows the reason for changes in the Council’s cash balances during the year, and whether that change is due to operating activities, new investment, or financing activities (such as repayment of borrowing and other long term liabilities).
The statement also includes “cash equivalents” which are short term investments that are readily convertible into cash and which are subject to only insignificant risks of changes in value.
Cash flows are related to the income and expenditure seen in the CIES but are not the same as them. The difference arises from the accruals concept, whereby income and expenditure are recognised in the CIES when the transactions occurred, and not when the cash was paid or received.
Key figures to note:
The statement shows that the Council has increased its cash and cash equivalents by £9.5m over the year to give a closing balance of £28.4m. The cash flow adjusts the CIES net surplus for the impact of non-cash transactions including asset revaluations (£41m), depreciation of £16m, and the movement in debtors and creditors. After adjustments there was a net cash inflow of £18m from operating activities. Within the investing activities the main cash outflows related to the purchase of plant property and equipment (£26m), the purchase of investment properties (£13m), and a further loan to Norwich Regeneration Ltd (£11m). This was offset by the conversion of £33m of short term investments into cash and cash equivalents to fund the commercial property investments and loan to NRL. The main movement in the financing activities was a cash outflow arising from the scheduled repayment of £7m of HRA borrowing.
Housing Revenue Account (HRA)
This Statement shows the income and expenditure incurred by the Council as a provider of social housing under the Local Government & Housing Act 1989. It is a ring-fenced account, so it cannot subsidise or be subsided by other Council activities.
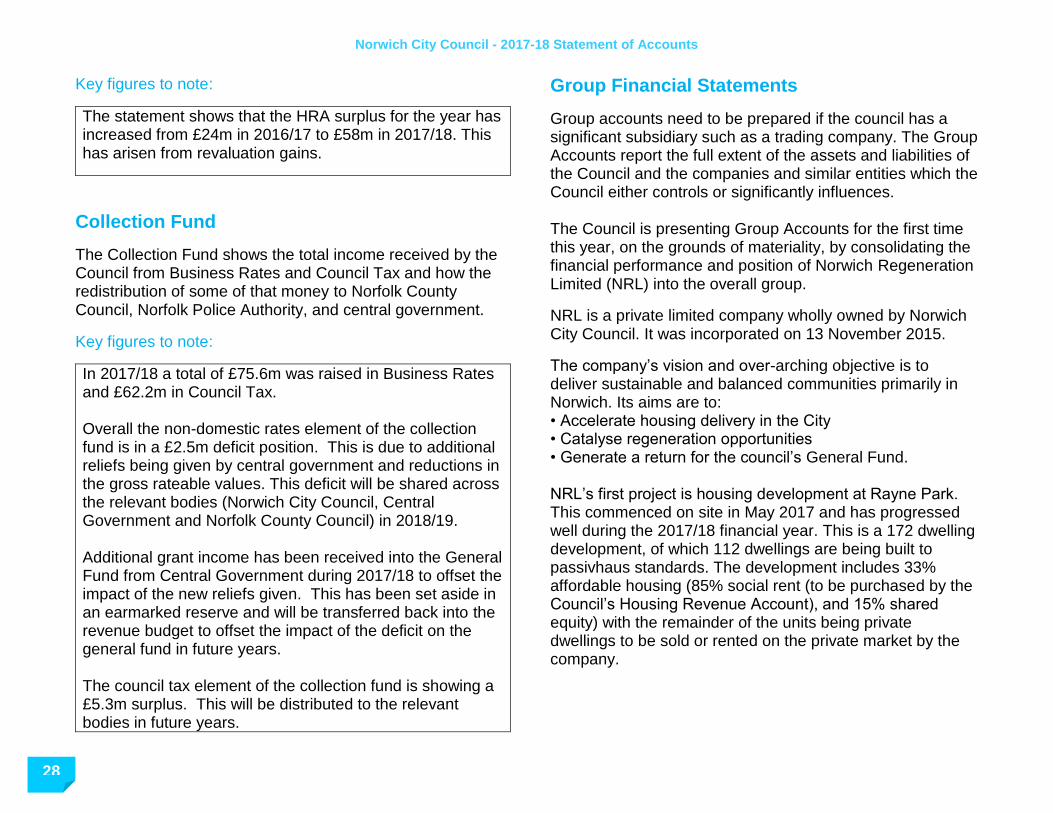
Norwich City Council - 2017-18 Statement of Accounts
28
Key figures to note:
The statement shows that the HRA surplus for the year has increased from £24m in 2016/17 to £58m in 2017/18. This has arisen from revaluation gains.
Collection Fund
The Collection Fund shows the total income received by the Council from Business Rates and Council Tax and how the redistribution of some of that money to Norfolk County Council, Norfolk Police Authority, and central government.
Key figures to note:
In 2017/18 a total of £75.6m was raised in Business Rates and £62.2m in Council Tax. Overall the non-domestic rates element of the collection fund is in a £2.5m deficit position. This is due to additional reliefs being given by central government and reductions in the gross rateable values. This deficit will be shared across the relevant bodies (Norwich City Council, Central Government and Norfolk County Council) in 2018/19. Additional grant income has been received into the General Fund from Central Government during 2017/18 to offset the impact of the new reliefs given. This has been set aside in an earmarked reserve and will be transferred back into the revenue budget to offset the impact of the deficit on the general fund in future years. The council tax element of the collection fund is showing a £5.3m surplus. This will be distributed to the relevant bodies in future years.
Group Financial Statements
Group accounts need to be prepared if the council has a significant subsidiary such as a trading company. The Group Accounts report the full extent of the assets and liabilities of the Council and the companies and similar entities which the Council either controls or significantly influences. The Council is presenting Group Accounts for the first time this year, on the grounds of materiality, by consolidating the financial performance and position of Norwich Regeneration Limited (NRL) into the overall group.
NRL is a private limited company wholly owned by Norwich City Council. It was incorporated on 13 November 2015.
The company’s vision and over-arching objective is to deliver sustainable and balanced communities primarily in Norwich. Its aims are to: • Accelerate housing delivery in the City • Catalyse regeneration opportunities • Generate a return for the council’s General Fund. NRL’s first project is housing development at Rayne Park. This commenced on site in May 2017 and has progressed well during the 2017/18 financial year. This is a 172 dwelling development, of which 112 dwellings are being built to passivhaus standards. The development includes 33% affordable housing (85% social rent (to be purchased by the Council’s Housing Revenue Account), and 15% shared equity) with the remainder of the units being private dwellings to be sold or rented on the private market by the company.

Norwich City Council - 2017-18 Statement of Accounts
29
Rayne Park Development
NRL’s first project is housing development at Rayne Park. This commenced on site in May 2017 and has progressed well during the 2017/18 financial year. This is a 172 dwelling development, of which 112 dwellings are being built to passivhaus standards. The development includes 33% affordable housing (85% social rent (to be purchased by the Council’s Housing Revenue Account), and 15% shared equity) with the remainder of the units being private dwellings to be sold or rented on the private market by the company. The show homes were completed in January 2018 to allow the first properties for private sale to be released on the
market. Interest has been strong with reservations already made. The first residents are due to move in in May 2018. The company’s Business Plan for the next three years includes further housing development at the Threescore site, at Ber Street, and at Hurricane Way. Other developments are also being actively considered. In order to finance the development, NRL borrows money at commercial interest rates from the Council. In 2017/18 NRL drew down loans totalling £10.7m in anticipation of meeting its cashflow requirements for the on-going development. Norwich Regeneration Limited made an operating loss for 2017/18 of £686k. This was anticipated in the company’s Financial Model as housing development was still under construction in 2017/18 and no dwellings were sold or rented to the market during the year other than dwellings sold to the Council’s Housing Revenue Account under a Development Agreement. The company however has long term assets (land and investment property) - property that it will rent on the private sector market valued at £5.8m. In addition it has property to be sold to the market (once completed) valued at £3.9m. A draft Statement of Accounts for Norwich Regeneration Limited has been prepared and will be subject to audit by Aston Shaw. The accounts will be presented to the company’s Board of Directors on 14th June 2018 for approval. A copy of the draft accounts may be obtained by request to the Council.
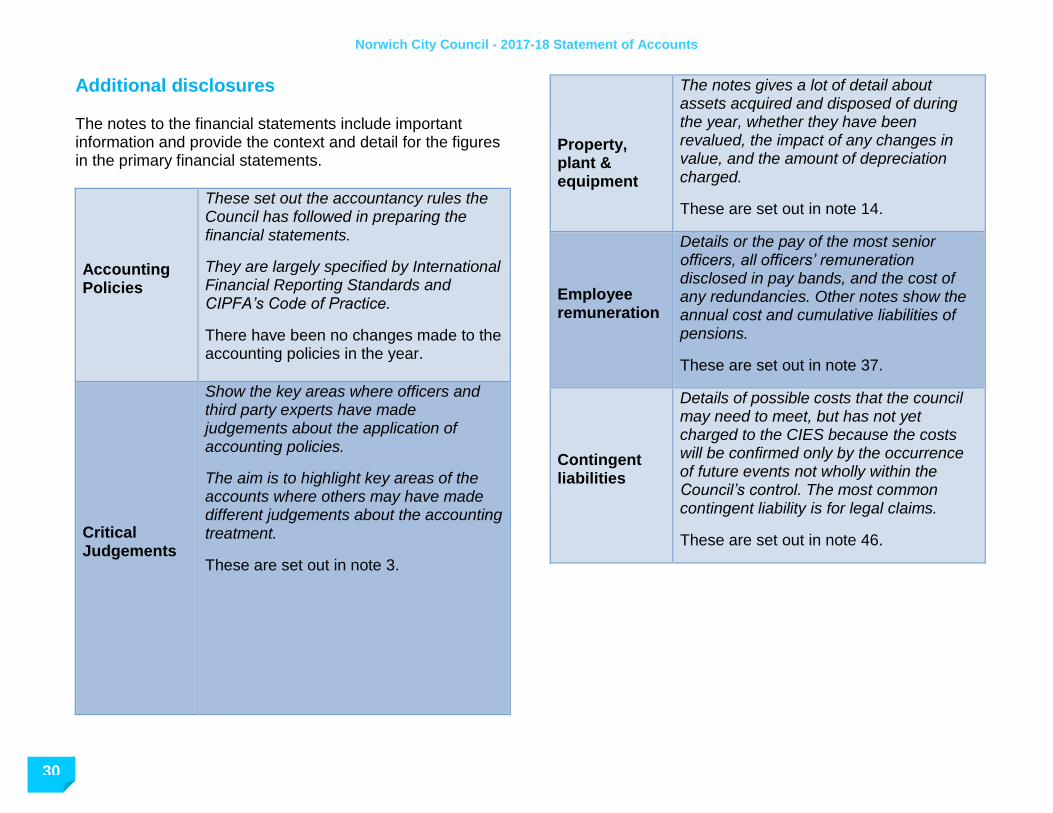
Norwich City Council - 2017-18 Statement of Accounts
30
Additional disclosures The notes to the financial statements include important information and provide the context and detail for the figures in the primary financial statements.
Accounting Policies
These set out the accountancy rules the Council has followed in preparing the financial statements.
They are largely specified by International Financial Reporting Standards and CIPFA’s Code of Practice.
There have been no changes made to the accounting policies in the year.
Critical Judgements
Show the key areas where officers and third party experts have made judgements about the application of accounting policies.
The aim is to highlight key areas of the accounts where others may have made different judgements about the accounting treatment.
These are set out in note 3.
Property, plant & equipment
The notes gives a lot of detail about assets acquired and disposed of during the year, whether they have been revalued, the impact of any changes in value, and the amount of depreciation charged.
These are set out in note 14.
Employee remuneration
Details or the pay of the most senior officers, all officers’ remuneration disclosed in pay bands, and the cost of any redundancies. Other notes show the annual cost and cumulative liabilities of pensions.
These are set out in note 37.
Contingent liabilities
Details of possible costs that the council may need to meet, but has not yet charged to the CIES because the costs will be confirmed only by the occurrence of future events not wholly within the Council’s control. The most common contingent liability is for legal claims.
These are set out in note 46.

Norwich City Council - 2017-18 Statement of Accounts
31
Independent auditor’s report to the members of Norwich City Council
This page is intentionally blank

Norwich City Council - 2017-18 Statement of Accounts
32 32
32
32
This page is intentionally blank

Norwich City Council - 2017-18 Statement of Accounts
33
This page is intentionally blank
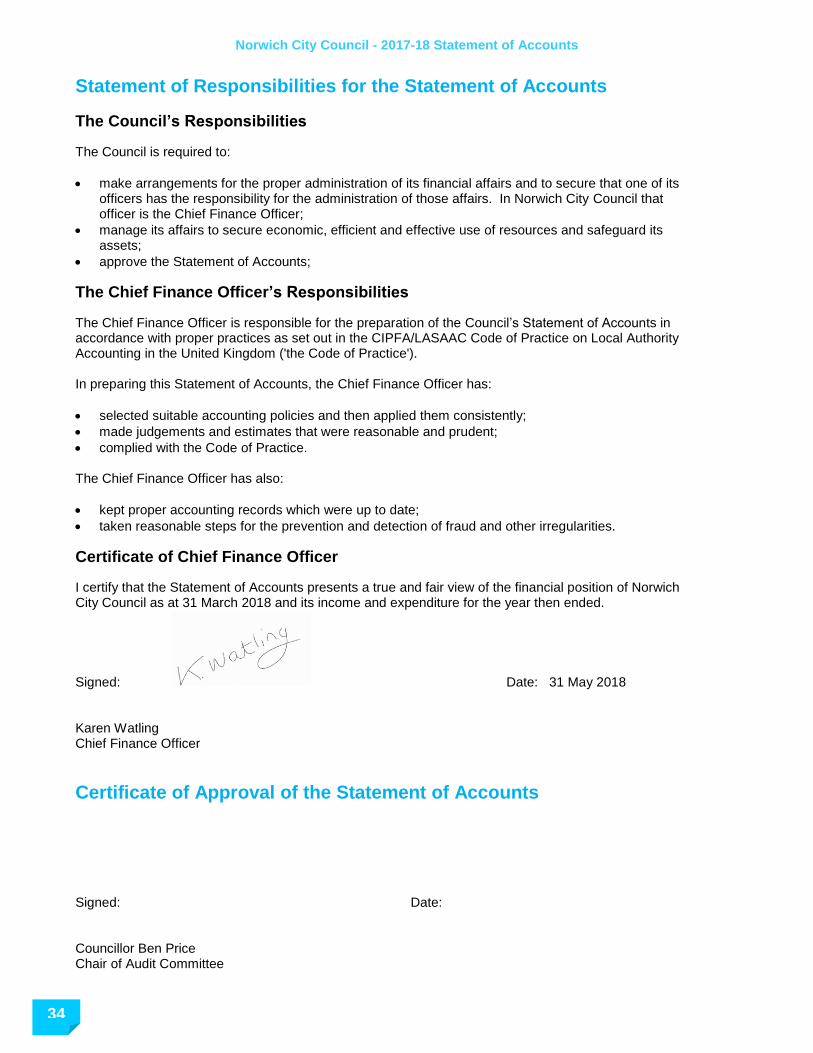
Norwich City Council - 2017-18 Statement of Accounts
34 34
34
34
Statement of Responsibilities for the Statement of Accounts
The Council’s Responsibilities
The Council is required to:
make arrangements for the proper administration of its financial affairs and to secure that one of its officers has the responsibility for the administration of those affairs. In Norwich City Council that officer is the Chief Finance Officer;
manage its affairs to secure economic, efficient and effective use of resources and safeguard its assets;
approve the Statement of Accounts;
The Chief Finance Officer’s Responsibilities
The Chief Finance Officer is responsible for the preparation of the Council’s Statement of Accounts in accordance with proper practices as set out in the CIPFA/LASAAC Code of Practice on Local Authority Accounting in the United Kingdom ('the Code of Practice'). In preparing this Statement of Accounts, the Chief Finance Officer has:
selected suitable accounting policies and then applied them consistently;
made judgements and estimates that were reasonable and prudent;
complied with the Code of Practice. The Chief Finance Officer has also:
kept proper accounting records which were up to date;
taken reasonable steps for the prevention and detection of fraud and other irregularities.
Certificate of Chief Finance Officer
I certify that the Statement of Accounts presents a true and fair view of the financial position of Norwich City Council as at 31 March 2018 and its income and expenditure for the year then ended.
Signed: Date: 31 May 2018 Karen Watling Chief Finance Officer
Certificate of Approval of the Statement of Accounts Signed: Date: Councillor Ben Price Chair of Audit Committee
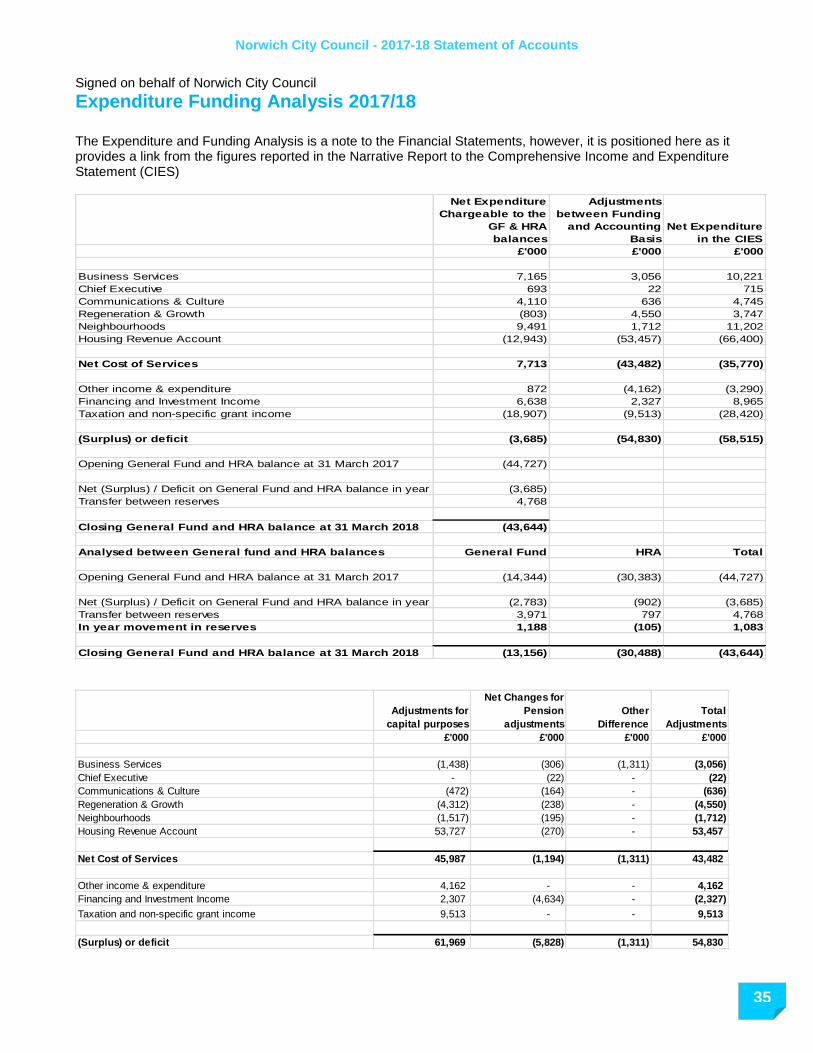
Norwich City Council - 2017-18 Statement of Accounts
35
Signed on behalf of Norwich City Council
Expenditure Funding Analysis 2017/18 The Expenditure and Funding Analysis is a note to the Financial Statements, however, it is positioned here as it provides a link from the figures reported in the Narrative Report to the Comprehensive Income and Expenditure Statement (CIES)
Net Expenditure
Chargeable to the
GF & HRA
balances
Adjustments
between Funding
and Accounting
Basis
Net Expenditure
in the CIES
£'000 £'000 £'000
Business Services 7,165 3,056 10,221
Chief Executive 693 22 715
Communications & Culture 4,110 636 4,745
Regeneration & Growth (803) 4,550 3,747
Neighbourhoods 9,491 1,712 11,202
Housing Revenue Account (12,943) (53,457) (66,400)
Net Cost of Services 7,713 (43,482) (35,770)
Other income & expenditure 872 (4,162) (3,290)
Financing and Investment Income 6,638 2,327 8,965
Taxation and non-specific grant income (18,907) (9,513) (28,420)
(Surplus) or deficit (3,685) (54,830) (58,515)
Opening General Fund and HRA balance at 31 March 2017 (44,727)
Net (Surplus) / Deficit on General Fund and HRA balance in year (3,685)
Transfer between reserves 4,768
Closing General Fund and HRA balance at 31 March 2018 (43,644)
Analysed between General fund and HRA balances General Fund HRA Total
Opening General Fund and HRA balance at 31 March 2017 (14,344) (30,383) (44,727)
Net (Surplus) / Deficit on General Fund and HRA balance in year (2,783) (902) (3,685)
Transfer between reserves 3,971 797 4,768
In year movement in reserves 1,188 (105) 1,083
Closing General Fund and HRA balance at 31 March 2018 (13,156) (30,488) (43,644)
Adjustments for
capital purposes
Net Changes for
Pension
adjustments
Other
Difference
Total
Adjustments
£'000 £'000 £'000 £'000
Business Services (1,438) (306) (1,311) (3,056)
Chief Executive - (22) - (22)
Communications & Culture (472) (164) - (636)
Regeneration & Growth (4,312) (238) - (4,550)
Neighbourhoods (1,517) (195) - (1,712)
Housing Revenue Account 53,727 (270) - 53,457
Net Cost of Services 45,987 (1,194) (1,311) 43,482
Other income & expenditure 4,162 - - 4,162
Financing and Investment Income 2,307 (4,634) - (2,327)
Taxation and non-specific grant income 9,513 - - 9,513
(Surplus) or deficit 61,969 (5,828) (1,311) 54,830

Norwich City Council - 2017-18 Statement of Accounts
36 36
36
36
Expenditure Funding Analysis 2016/17
Net Expenditure
Chargeable to the
GF & HRA
balances
Adjustments
between Funding
and Accounting
Basis
Net Expenditure
in the CIES
£'000 £'000 £'000
Business Services 11,288 (1,928) 9,360
Chief Executive 594 (44) 550
Communications & Culture 3,968 119 4,088
Regeneration & Growth 4,112 2,905 7,016
Neighbourhoods 11,317 229 11,546
Housing Revenue Account (1,902) (32,219) (34,120)
Net Cost of Services 29,378 (30,938) (1,560)
Other income & expenditure (11,920) 12,713 793
Financing and Investment Income 6,375 4,741 11,116
Taxation and non-specific grant income (30,055) 0 (30,055)
(Surplus) or deficit (6,222) (13,484) (19,706)
Opening General Fund and HRA balance at 31 March 2016 (38,347)
Net (Surplus) / Deficit on General Fund and HRA balance in year (6,222)
Transfer between reserves (159)
Closing General Fund and HRA balance at 31 March 2017 (44,728)
Analysed between General fund and HRA balances General Fund HRA Total
Opening General Fund and HRA balance at 31 March 2016 (12,160) (26,187) (38,347)
Net (Surplus) / Deficit on General Fund and HRA balance in year (1,976) (4,246) (6,222)
Transfer between reserves (208) 49 (159)
In year movement in reserves (2,184) (4,197) (6,381)
Closing General Fund and HRA balance at 31 March 2017 (14,344) (30,384) (44,728)
Adjustments for
capital purposes
Net Changes for
Pension
adjustments
Other
Difference
Total
Adjustments
£'000 £'000 £'000 £'000
Business Services 6 (153) 2,075 1,928
Chief Executive - 44 - 44
Communications & Culture (443) 324 - (119)
Regeneration & Growth (3,383) 478 - (2,905)
Neighbourhoods (656) 428 - (229)
Housing Revenue Account 31,641 577 - 32,219
Net Cost of Services 27,164 1,699 2,075 30,938
Other income & expenditure (12,713) - - (12,713)
Financing and Investment Income (577) (4,164) - (4,741)
(Surplus) or deficit 13,874 (2,465) 2,075 13,484
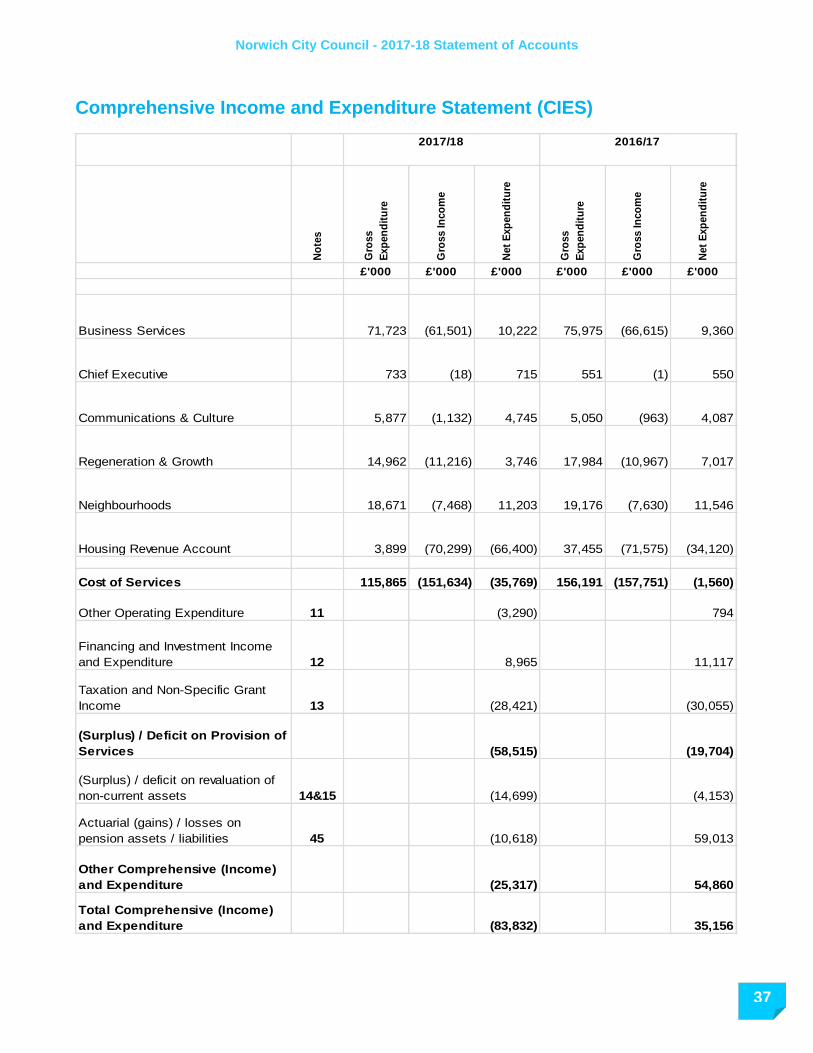
Norwich City Council - 2017-18 Statement of Accounts
37
Comprehensive Income and Expenditure Statement (CIES)
No
tes
Gro
ss
Exp
en
dit
ure
Gro
ss In
co
me
Net
Exp
en
dit
ure
Gro
ss
Exp
en
dit
ure
Gro
ss In
co
me
Net
Exp
en
dit
ure
£'000 £'000 £'000 £'000 £'000 £'000
Business Services 71,723 (61,501) 10,222 75,975 (66,615) 9,360
Chief Executive 733 (18) 715 551 (1) 550
Communications & Culture 5,877 (1,132) 4,745 5,050 (963) 4,087
Regeneration & Growth 14,962 (11,216) 3,746 17,984 (10,967) 7,017
Neighbourhoods 18,671 (7,468) 11,203 19,176 (7,630) 11,546
Housing Revenue Account 3,899 (70,299) (66,400) 37,455 (71,575) (34,120)
Cost of Services 115,865 (151,634) (35,769) 156,191 (157,751) (1,560)
Other Operating Expenditure 11 (3,290) 794
Financing and Investment Income
and Expenditure 12 8,965 11,117
Taxation and Non-Specific Grant
Income 13 (28,421) (30,055)
(Surplus) / Deficit on Provision of
Services (58,515) (19,704)
(Surplus) / deficit on revaluation of
non-current assets 14&15 (14,699) (4,153)
Actuarial (gains) / losses on
pension assets / liabilities 45 (10,618) 59,013
Other Comprehensive (Income)
and Expenditure (25,317) 54,860
Total Comprehensive (Income)
and Expenditure (83,832) 35,156
2017/18 2016/17

Norwich City Council - 2017-18 Statement of Accounts
38 38
38
38
The amounts disclosed above relating to the Housing Account do not match those in the Housing Revenue Account Income and Expenditure Account as the figures above are before corporate recharges and those in the Housing Revenue Account Income and Expenditure Account are after these recharges.
Movement in Reserves Statement
Ge
ne
ral F
un
d
Ba
lan
ce
Ea
rma
rke
d G
en
era
l
Fu
nd
Ba
lan
ce
Re
se
rve
s
Ho
us
ing
Re
ve
nu
e
Ac
co
un
t
Ea
rma
rke
d H
.R.A
.
Ba
lan
ce
Re
se
rve
s
Ca
pit
al R
ec
eip
ts
Re
se
rve
Ma
jor
Re
pa
irs
Re
se
rve
Ca
pit
al G
ran
ts
Un
ap
plie
d
To
tal U
sa
ble
Re
se
rve
s
Un
us
ab
le R
es
erv
es
To
tal C
ou
nc
il
Re
se
rve
s
£'000 £'000 £'000 £'000 £'000 £'000 £'000 £'000 £'000 £'000
Balance at 31 March
2017 carried forward 14,344 3,699 30,383 3 26,554 - 4,879 79,862 512,334 592,196
Movement in reserves
during 2017/18
Surplus/ (deficit) on
provision of services 59 - 58,456 - - - - 58,515 - 58,515
Other Comprehensive
Income & Expenditure - - - - - - - - 25,317 25,317
Total Comprehensive
Income & Expenditure 59 - 58,456 - - - - 58,515 25,317 83,832
Adjustments between
accounting basis &
funding basis under
regulations (note 7) 2,724 - (57,555) - 7,171 7,000 3,200 (37,460) 37,460 -
Net Increase/
(Decrease) before
Transfers to
Earmarked Reserves 2,783 - 902 - 7,171 7,000 3,200 21,055 62,777 83,832
Transfers to/from
Earmarked Reserves
(note 8) (3,971) 4,165 (691) 497 - - - - - -
Transfers between
reserves - - (107) - 279 - - 172 (172) -
Other Adjustments - (4) 1 - (7) - - (10) - (10)
Increase/(Decrease)
in 2017/18 (1,188) 4,161 105 497 7,443 7,000 3,200 21,217 62,605 83,822
Balance at 31 March
2018 carried forward 13,156 7,860 30,488 500 33,997 7,000 8,079 101,080 574,939 676,019

Norwich City Council - 2017-18 Statement of Accounts
39
Ge
ne
ral F
un
d
Ba
lan
ce
Ea
rma
rke
d
Ge
ne
ral F
un
d
Ba
lan
ce
Re
se
rve
s
Ho
us
ing
Re
ve
nu
e
Ac
co
un
t
Ea
rma
rke
d H
.R.A
.
Ba
lan
ce
Re
se
rve
s
Ca
pit
al R
ec
eip
ts
Re
se
rve
Ma
jor
Re
pa
irs
Re
se
rve
Ca
pit
al G
ran
ts
Un
ap
plie
d
To
tal U
sa
ble
Re
se
rve
s
Un
us
ab
le
Re
se
rve
s
To
tal C
ou
nc
il
Re
se
rve
s
£'000 £'000 £'000 £'000 £'000 £'000 £'000 £'000 £'000 £'000
Balance at 31 March
2016 carried forward 12,160 3,932 26,187 3 17,313 - 3,200 62,794 564,557 627,351
Movement in reserves
during 2016/17
Surplus/ (deficit) on
provision of services (4,331) - 24,036 - - - - 19,705 - 19,705
Other Comprehensive
Income & Expenditure - - - - - - - - (54,860) (54,860)
Total Comprehensive
Income & Expenditure (4,331) - 24,036 - - - - 19,705 (54,860) (35,155)
Adjustments between
accounting basis &
funding basis under
regulations (note 7) 6,307 - (19,790) - 9,083 - 1,679 (2,722) 2,722 -
Net Increase/
(Decrease) before
Transfers to
Earmarked Reserves 1,976 - 4,245 - 9,083 - 1,679 16,983 (52,138) (35,155)
Transfers to/from
Earmarked Reserves
(note 8) 208 (233) - - 25 - - - - -
Transfers between
reserves - - (49) - 133 - - 84 (84) -
Increase/(Decrease)
in 2016/17 2,184 (233) 4,196 - 9,241 - 1,679 17,067 (52,222) (35,155)
Balance at 31 March
2017 carried forward 14,344 3,699 30,383 3 26,554 - 4,879 79,861 512,335 592,196
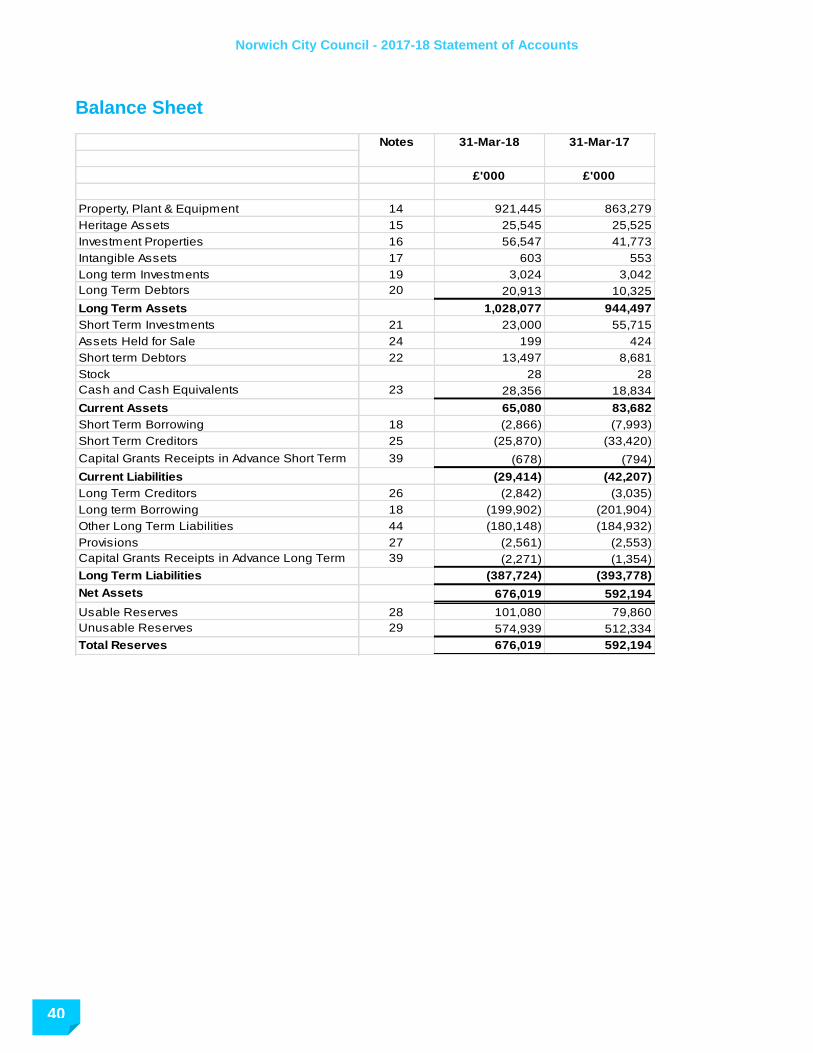
Norwich City Council - 2017-18 Statement of Accounts
40 40
40
40
Balance Sheet
£'000 £'000
Property, Plant & Equipment 14 921,445 863,279
Heritage Assets 15 25,545 25,525
Investment Properties 16 56,547 41,773
Intangible Assets 17 603 553
Long term Investments 19 3,024 3,042
Long Term Debtors 20 20,913 10,325
Long Term Assets 1,028,077 944,497
Short Term Investments 21 23,000 55,715
Assets Held for Sale 24 199 424
Short term Debtors 22 13,497 8,681
Stock 28 28
Cash and Cash Equivalents 23 28,356 18,834
Current Assets 65,080 83,682
Short Term Borrowing 18 (2,866) (7,993)
Short Term Creditors 25 (25,870) (33,420)
Capital Grants Receipts in Advance Short Term 39 (678) (794)
Current Liabilities (29,414) (42,207)
Long Term Creditors 26 (2,842) (3,035)
Long term Borrowing 18 (199,902) (201,904)
Other Long Term Liabilities 44 (180,148) (184,932)
Provisions 27 (2,561) (2,553)
Capital Grants Receipts in Advance Long Term 39 (2,271) (1,354)
Long Term Liabilities (387,724) (393,778)
Net Assets 676,019 592,194
Usable Reserves 28 101,080 79,860
Unusable Reserves 29 574,939 512,334
Total Reserves 676,019 592,194
Notes 31-Mar-18 31-Mar-17

Norwich City Council - 2017-18 Statement of Accounts
41
Cash Flow Statement
Notes 2017/18 2016/17
£'000 £'000
Net surplus or (deficit) on provision of services 58,515 19,706
Adjustments to net surplus or deficit on provision
of services for non-cash movements 30 (22,901) 31,181
Adjustments for items included in the net surplus
or deficit on the provision of services that are
investing and financing activities 30 (17,300) (14,439)
Net cash flows from Operating Activities 18,314 36,448
Investing Activities 31 (16) (31,997)
Financing Activities 32 (8,776) (7,168)
Net Increase or (decrease) in cash and cash
equivalents 9,522 (2,717)
Cash and cash equivalents at the beginning of
the reporting period 23 18,834 21,551
Cash and cash equivalents at the end of the
reporting period 23 28,356 18,834
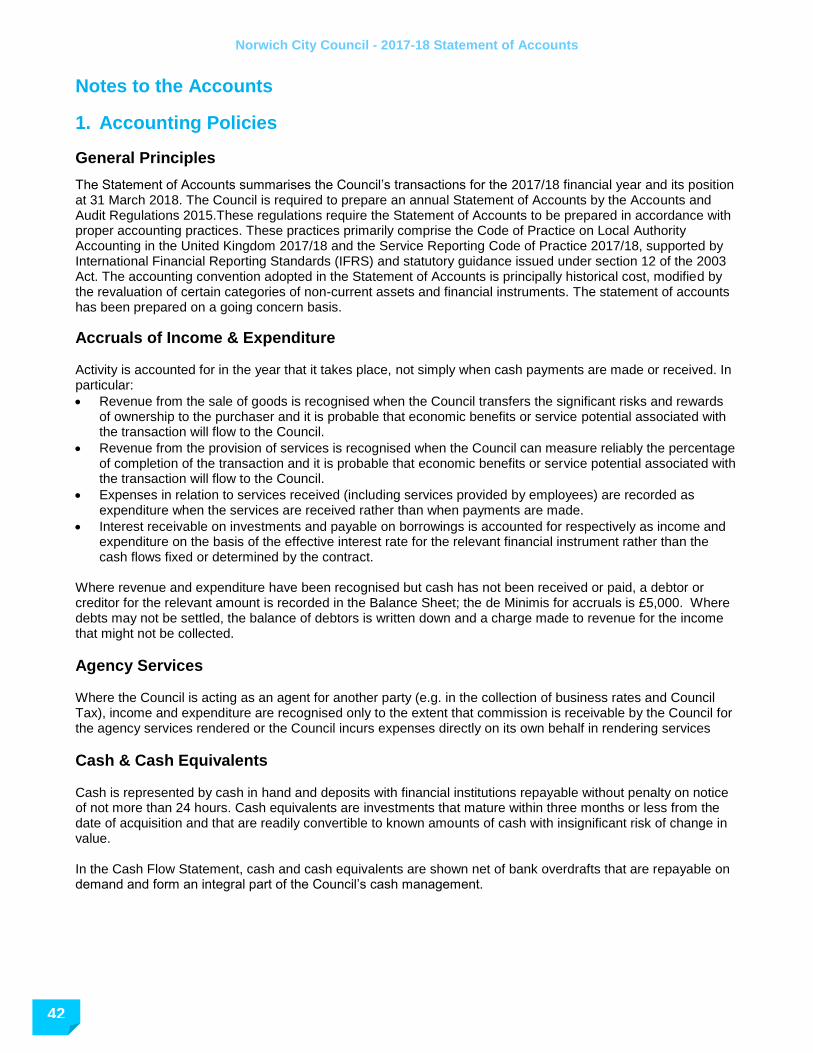
Norwich City Council - 2017-18 Statement of Accounts
42 42
42
42
Notes to the Accounts
1. Accounting Policies
General Principles
The Statement of Accounts summarises the Council’s transactions for the 2017/18 financial year and its position at 31 March 2018. The Council is required to prepare an annual Statement of Accounts by the Accounts and Audit Regulations 2015.These regulations require the Statement of Accounts to be prepared in accordance with proper accounting practices. These practices primarily comprise the Code of Practice on Local Authority Accounting in the United Kingdom 2017/18 and the Service Reporting Code of Practice 2017/18, supported by International Financial Reporting Standards (IFRS) and statutory guidance issued under section 12 of the 2003 Act. The accounting convention adopted in the Statement of Accounts is principally historical cost, modified by the revaluation of certain categories of non-current assets and financial instruments. The statement of accounts has been prepared on a going concern basis.
Accruals of Income & Expenditure Activity is accounted for in the year that it takes place, not simply when cash payments are made or received. In particular:
Revenue from the sale of goods is recognised when the Council transfers the significant risks and rewards of ownership to the purchaser and it is probable that economic benefits or service potential associated with the transaction will flow to the Council.
Revenue from the provision of services is recognised when the Council can measure reliably the percentage of completion of the transaction and it is probable that economic benefits or service potential associated with the transaction will flow to the Council.
Expenses in relation to services received (including services provided by employees) are recorded as expenditure when the services are received rather than when payments are made.
Interest receivable on investments and payable on borrowings is accounted for respectively as income and expenditure on the basis of the effective interest rate for the relevant financial instrument rather than the cash flows fixed or determined by the contract.
Where revenue and expenditure have been recognised but cash has not been received or paid, a debtor or creditor for the relevant amount is recorded in the Balance Sheet; the de Minimis for accruals is £5,000. Where debts may not be settled, the balance of debtors is written down and a charge made to revenue for the income that might not be collected.
Agency Services Where the Council is acting as an agent for another party (e.g. in the collection of business rates and Council Tax), income and expenditure are recognised only to the extent that commission is receivable by the Council for the agency services rendered or the Council incurs expenses directly on its own behalf in rendering services
Cash & Cash Equivalents Cash is represented by cash in hand and deposits with financial institutions repayable without penalty on notice of not more than 24 hours. Cash equivalents are investments that mature within three months or less from the date of acquisition and that are readily convertible to known amounts of cash with insignificant risk of change in value. In the Cash Flow Statement, cash and cash equivalents are shown net of bank overdrafts that are repayable on demand and form an integral part of the Council’s cash management.
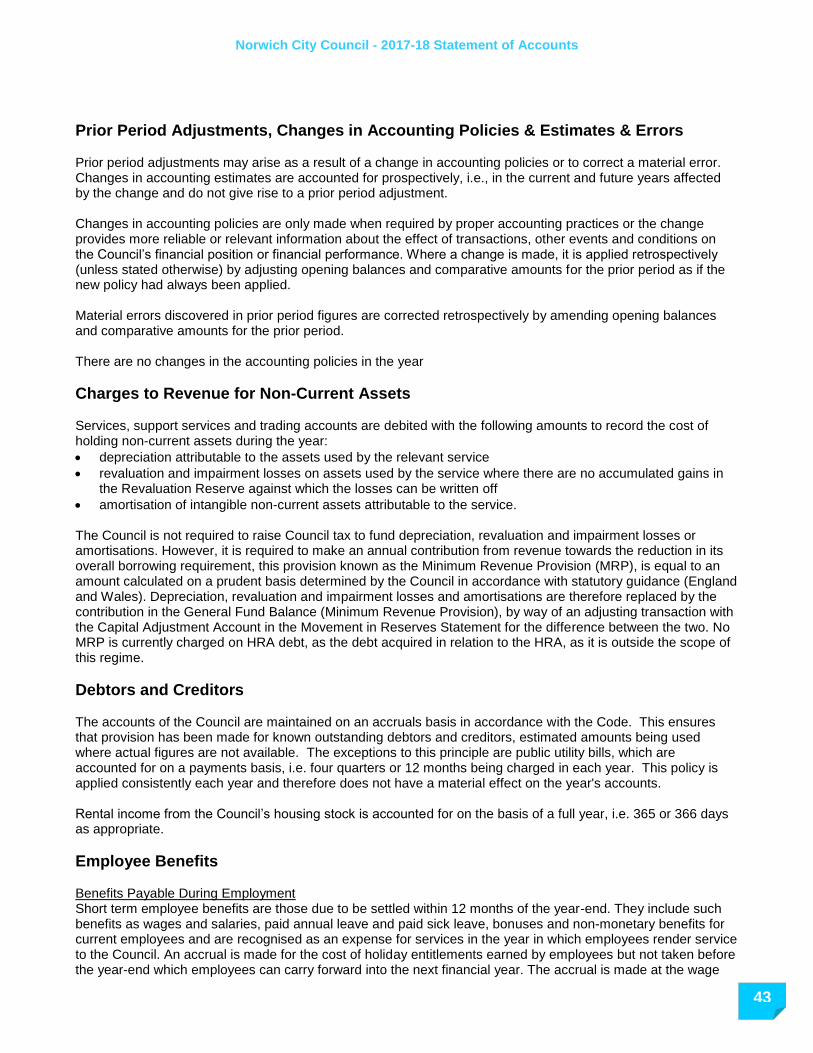
Norwich City Council - 2017-18 Statement of Accounts
43
Prior Period Adjustments, Changes in Accounting Policies & Estimates & Errors Prior period adjustments may arise as a result of a change in accounting policies or to correct a material error. Changes in accounting estimates are accounted for prospectively, i.e., in the current and future years affected by the change and do not give rise to a prior period adjustment. Changes in accounting policies are only made when required by proper accounting practices or the change provides more reliable or relevant information about the effect of transactions, other events and conditions on the Council’s financial position or financial performance. Where a change is made, it is applied retrospectively (unless stated otherwise) by adjusting opening balances and comparative amounts for the prior period as if the new policy had always been applied. Material errors discovered in prior period figures are corrected retrospectively by amending opening balances and comparative amounts for the prior period. There are no changes in the accounting policies in the year
Charges to Revenue for Non-Current Assets Services, support services and trading accounts are debited with the following amounts to record the cost of holding non-current assets during the year:
depreciation attributable to the assets used by the relevant service
revaluation and impairment losses on assets used by the service where there are no accumulated gains in the Revaluation Reserve against which the losses can be written off
amortisation of intangible non-current assets attributable to the service. The Council is not required to raise Council tax to fund depreciation, revaluation and impairment losses or amortisations. However, it is required to make an annual contribution from revenue towards the reduction in its overall borrowing requirement, this provision known as the Minimum Revenue Provision (MRP), is equal to an amount calculated on a prudent basis determined by the Council in accordance with statutory guidance (England and Wales). Depreciation, revaluation and impairment losses and amortisations are therefore replaced by the contribution in the General Fund Balance (Minimum Revenue Provision), by way of an adjusting transaction with the Capital Adjustment Account in the Movement in Reserves Statement for the difference between the two. No MRP is currently charged on HRA debt, as the debt acquired in relation to the HRA, as it is outside the scope of this regime.
Debtors and Creditors The accounts of the Council are maintained on an accruals basis in accordance with the Code. This ensures that provision has been made for known outstanding debtors and creditors, estimated amounts being used where actual figures are not available. The exceptions to this principle are public utility bills, which are accounted for on a payments basis, i.e. four quarters or 12 months being charged in each year. This policy is applied consistently each year and therefore does not have a material effect on the year's accounts. Rental income from the Council’s housing stock is accounted for on the basis of a full year, i.e. 365 or 366 days as appropriate.
Employee Benefits Benefits Payable During Employment Short term employee benefits are those due to be settled within 12 months of the year-end. They include such benefits as wages and salaries, paid annual leave and paid sick leave, bonuses and non-monetary benefits for current employees and are recognised as an expense for services in the year in which employees render service to the Council. An accrual is made for the cost of holiday entitlements earned by employees but not taken before the year-end which employees can carry forward into the next financial year. The accrual is made at the wage

Norwich City Council - 2017-18 Statement of Accounts
44 44
44
44
and salary rates applicable in the following accounting year. The accrual is charged to Surplus or Deficit on the Provision of Services. Termination Benefits Termination benefits are amounts payable as a result of a decision by the Council to terminate an officer’s employment before the normal retirement date or an officer’s decision to accept voluntary redundancy and are charged on an accruals basis to the relevant service line in the Comprehensive Income and Expenditure Statement when the Council is demonstrably committed to the termination of the employment of an officer or group of officers or making an offer to encourage voluntary redundancy. Where termination benefits involve the enhancement of pensions, statutory provisions require the General Fund balance to be charged with the amount payable by the Council to the pension fund or pensioner in the year, not the amount calculated according to the relevant accounting standards. In the Movement in Reserves Statement, appropriations are required to and from the Pensions Reserve to remove the notional debits and credits for pension enhancement termination benefits and replace them with debits for the cash paid to the pension fund and pensioners and any such amounts payable but unpaid at the year-end. Post-Employment Benefits Employees of the Council are members of The Local Government Pensions Scheme, administered by Norfolk County Council. The scheme provides defined benefits to members (retirement lump sums and pensions), earned as employees worked for the Council. The Local Government Pension Scheme Membership of the Local Government Pension Scheme is available to employees of the Council; the scheme is accounted for as a defined benefits scheme: The liabilities of the Norfolk pension fund attributable to the Council are included in the Balance Sheet on an actuarial basis using the projected unit method – i.e. an assessment of the future payments that will be made in relation to retirement benefits earned to date by employees, based on assumptions about mortality rates, employee turnover rates, etc., and projections of projected earnings for current employees. Liabilities are discounted to their value at current prices, using a discount rate of 5.5% (based on the indicative rate of return on high quality corporate bonds). The assets of Norfolk pension fund attributable to the Council are included in the Balance Sheet at their fair value:
quoted securities – current bid price
unquoted securities – professional estimate
unitised securities – current bid price
property – market value.
The change in the net pension’s liability is analysed into the following components:
Service cost comprising:
o current service cost – the increase in liabilities as a result of years of service earned this year – allocated in the Comprehensive Income and Expenditure Statement to the services for which the employees worked
o past service cost – the increase in liabilities as a result of a scheme amendment or curtailment whose effect relates to years of service earned in earlier years – debited to the Surplus or Deficit on the Provision of Services in the Comprehensive Income and Expenditure Statement as part of Non Distributed Costs
o net interest on the net defined benefit liability (asset), ie net interest expense for the authority – the change during the period in the net defined benefit liability (asset) that arises from the passage of time charged to the Financing and Investment Income and Expenditure line of the Comprehensive Income and Expenditure Statement – this is calculated by applying the discount rate used to measure the defined benefit obligation at the beginning of the period to the net defined benefit liability (asset) at the beginning of the period – taking into account any changes in the net defined benefit liability (asset) during the period as a result of contribution and benefit payments.

Norwich City Council - 2017-18 Statement of Accounts
45
Re-measurements comprising:
o the return on plan assets – excluding amounts included in net interest on the net defined benefit liability (asset) – charged to the Pensions Reserve as Other Comprehensive Income and Expenditure
o actuarial gains and losses – changes in the net pensions liability that arise because events have not coincided with assumptions made at the last actuarial valuation or because the actuaries have updated their assumptions – charged to the Pensions Reserve as Other Comprehensive Income and Expenditure
Contributions paid to the Norfolk pension fund – cash paid as employer’s contributions to the pension fund in settlement of liabilities; not accounted for as an expense.
In relation to retirement benefits, statutory provisions require the General Fund Balance to be charged with the amount payable by the Authority to the pension fund or directly to pensioners in the year, not the amount calculated according to the relevant accounting standards. In the Movement in Reserves Statement, this means that there are transfers to and from the Pensions Reserve to remove the notional debits and credits for retirement benefits and replace them with debits for the cash paid to the pension fund and pensioners and any such amounts payable but unpaid at the year-end. The negative balance that arises on the Pensions Reserve thereby measures the beneficial impact to the General Fund of being required to account for retirement benefits on the basis of cash flows rather than as benefits are earned by employees.
Discretionary Benefits
The Council also has restricted powers to make discretionary awards of retirement benefits in the event of early retirements. Any liabilities estimated to arise as a result of an award to any member of staff are accrued in the year of the decision to make the award and accounted for using the same policies as are applied to the Local Government Pension Scheme.
Events after the Balance Sheet Date Events after the balance sheet date are those events, both favourable and unfavourable, that occur between the end of the reporting period and the date when the Statement of Accounts is authorised for issue. Two types of events can be identified:
those that provide evidence of conditions that existed at the end of the reporting period – the Statement of Accounts is adjusted to reflect such events
those that are indicative of conditions that arose after the reporting period – the Statement of Accounts is not adjusted to reflect such events, but where a category of events would have a material effect, disclosure is made in the notes of the nature of the events and their estimated financial effect.
Events taking place after the date of authorisation for issue are not reflected in the Statement of Accounts.
Exceptional Items When items of income and expense are material, their nature and amount is disclosed separately, either on the face of the Comprehensive Income and Expense Statement or in the notes to the account.
Financial Instruments
Financial Liabilities Financial liabilities are recognised on the Balance Sheet when the Council becomes a party to the contractual provisions of a financial instrument and are initially measured at fair value and are carried at their amortised cost. Annual charges to the Financing and Investment Income and Expenditure line in the Comprehensive Income and Expenditure Statement for interest payable are based on the carrying amount of the liability, multiplied by the effective rate of interest for the instrument. The effective interest rate is the rate that exactly discounts estimated future cash payments over the life of the instrument to the amount at which it was originally recognised.

Norwich City Council - 2017-18 Statement of Accounts
46 46
46
46
For most of the borrowings that the Council has, this means that the amount presented in the Balance Sheet is the outstanding principal repayable (plus accrued interest); and interest charged to the Comprehensive Income and Expenditure Statement is the amount payable for the year according to the loan agreement. Gains and losses on the repurchase or early settlement of borrowing are credited and debited to the Financing and Investment Income and Expenditure line in the Comprehensive Income and Expenditure Statement in the year of repurchase/settlement. However, where repurchase has taken place as part of a restructuring of the loan portfolio that involves the modification or exchange of existing instruments, the premium or discount is respectively deducted from or added to the amortised cost of the new or modified loan and the write-down to the Comprehensive Income and Expenditure Statement is spread over the life of the loan by an adjustment to the effective interest rate. Where premiums and discounts have been charged to the Comprehensive Income and Expenditure Statement, regulations allow the impact on the General Fund Balance to be spread over future years. The Council has a policy of spreading the gain or loss over the term that was remaining on the loan against which the premium was payable or discount receivable when it was repaid. The reconciliation of amounts charged to the Comprehensive Income and Expenditure Statement to the net charge required against the General Fund Balance is managed by a transfer to or from the Financial Instruments Adjustment Account in the Movement in Reserves Statement.
Financial Assets Financial assets are classified into two types:
loans and receivables – assets that have fixed or determinable payments but are not quoted in an active market
available-for-sale assets – assets that have a quoted market price and/or do not have fixed or determinable payments.
Loans & Receivables Loans and receivables are recognised on the Balance Sheet when the Council becomes a party to the contractual provisions of a financial instrument and are initially measured at fair value. They are subsequently measured at their amortised cost. Annual credits to the Financing and Investment Income and Expenditure line in the Comprehensive Income and Expenditure Statement for interest receivable are based on the carrying amount of the asset multiplied by the effective rate of interest for the instrument. For most of the loans that the Council has made, this means that the amount presented in the Balance Sheet is the outstanding principal receivable (plus accrued interest) and interest credited to the Comprehensive Income and Expenditure Statement is the amount receivable for the year in the loan agreement. However, the Council has made a number of loans to individuals for decent homes and for home improvements at less than market rates (soft loans). When soft loans are made, a loss is recorded in the Comprehensive Income and Expenditure Statement (debited to the appropriate service) for the present value of the interest that will be foregone over the life of the instrument, resulting in a lower amortised cost than the outstanding principal. Interest is credited to the Financing and Investment Income and Expenditure line in the Comprehensive Income and Expenditure Statement at a marginally higher effective rate of interest than the rate receivable from individuals, with the difference serving to increase the amortised cost of the loan in the Balance Sheet. Statutory provisions require that the impact of soft loans on the General Fund Balance is the interest receivable for the financial year – the reconciliation of amounts debited and credited to the Comprehensive Income and Expenditure Statement to the net gain required against the General Fund Balance is managed by a transfer to or from the Financial Instruments Adjustment Account in the Movement in Reserves Statement. Where assets are identified as impaired because of a likelihood arising from a past event that payments due under the contract will not be made, the asset is written down and a charge made to the relevant service (for receivables specific to that service) or the Financing and Investment Income and Expenditure line in the Comprehensive Income and Expenditure Statement. The impairment loss is measured as the difference between the carrying amount and the present value of the revised future cash flows discounted at the asset’s original effective interest rate. Any gains and losses that arise on the derecognition of an asset are credited or debited to the Financing and Investment Income and Expenditure line in the Comprehensive Income and Expenditure Statement.

Norwich City Council - 2017-18 Statement of Accounts
47
Available-for-Sale Assets Available-for-sale assets are recognised on the Balance Sheet when the Council becomes a party to the contractual provisions of a financial instrument and are initially measured and carried at fair value. Where the asset has fixed or determinable payments, annual credits to the Financing and Investment Income and Expenditure line in the Comprehensive Income and Expenditure Statement for interest receivable are based on the amortised cost of the asset multiplied by the effective rate of interest for the instrument. Where there are no fixed or determinable payments, income (e.g., dividends) is credited to the Comprehensive Income and Expenditure Statement when it becomes receivable by the Council. Assets are maintained in the Balance Sheet at fair value. Values are based on the following principles:
instruments with quoted market prices – the market price
other instruments with fixed and determinable payments – discounted cash flow analysis
equity shares with no quoted market prices – independent appraisal of company valuations. Changes in fair value are balanced by an entry in the Available-for-Sale Reserve and the gain/loss is recognised in the Surplus or Deficit on Revaluation of Available-for-Sale Financial Assets. The exception is where impairment losses have been incurred – these are debited to the Financing and Investment Income and Expenditure line in the Comprehensive Income and Expenditure Statement, along with any net gain or loss for the asset accumulated in the Available-for-Sale Reserve. Where assets are identified as impaired because of a likelihood arising from a past event that payments due under the contract will not be made (fixed or determinable payments) or fair value falls below cost, the asset is written down and a charge made to the Financing and Investment Income and Expenditure line in the Comprehensive Income and Expenditure Statement. If the asset has fixed or determinable payments, the impairment loss is measured as the difference between the carrying amount and the present value of the revised future cash flows discounted at the asset’s original effective interest rate. Otherwise, the impairment loss is measured as any shortfall of fair value against the acquisition cost of the instrument (net of any principal repayment and amortisation). Any gains and losses that arise on the derecognition of the asset are credited or debited to the Financing and Investment Income and Expenditure line in the Comprehensive Income and Expenditure Statement, along with any accumulated gains or losses previously recognised in the Available-for-Sale Reserve. Fair Value of the equity shares in Norwich Airport cannot be measured reliably therefore the instrument is carried at cost.
Government Grants & Contributions Whether paid on account, by instalments or in arrears, government grants and third party contributions and donations are recognised as due to the Council when there is reasonable assurance that:
the Council will comply with the conditions attached to the payments, and
the grants or contributions will be received. Amounts recognised as due to the Council are not credited to the Comprehensive Income and Expenditure Statement until conditions attached to the grant or contribution have been satisfied. Conditions are stipulations that specify that the future economic benefits or service potential embodied in the asset acquired using the grant or contribution are required to be consumed by the recipient as specified, or future economic benefits or service potential must be returned to the transferor. Monies advanced as grants and contributions for which conditions have not been satisfied are carried in the Balance Sheet as creditors. When conditions are satisfied, the grant or contribution is credited to the relevant service line (attributable revenue grants and contributions) or Taxation and Non-Specific Grant Income (non-ring-fenced revenue grants and all capital grants) in the Comprehensive Income and Expenditure Statement. Where capital grants are credited to the Comprehensive Income and Expenditure Statement, they are reversed out of the General Fund Balance in the Movement in Reserves Statement. Where the grant has yet to be used to finance capital expenditure, it is posted to the Capital Grants Unapplied reserve. Where it has been applied, it is

Norwich City Council - 2017-18 Statement of Accounts
48 48
48
48
posted to the Capital Adjustment Account. Amounts in the Capital Grants Unapplied reserve are transferred to the Capital Adjustment Account once they have been applied to fund capital expenditure.
Community Infrastructure Levy
The Authority has elected to charge a Community Infrastructure Levy (CIL). The levy will be charged on new builds (chargeable developments for the Authority) with appropriate planning consent. The Council charges for and collects the levy, which is a planning charge. The income from the levy will be used to fund a number of infrastructure projects (these include transport, flood defences and schools) to support the development of the area.
CIL is received without outstanding conditions; it is therefore recognised at the commencement date of the chargeable development in the Comprehensive Income and Expenditure Statement in accordance with the accounting policy for government grants and contributions set out above. CIL charges will be largely used to fund capital expenditure. However, a small proportion of the charges may be used to fund revenue expenditure.
Investment Property Investment properties are those that are used solely to earn rentals and/or for capital appreciation. The definition is not met if the property is used in any way to facilitate the delivery of services or production of goods or is held for sale. Investment properties are measured initially at cost and subsequently at fair value, being the price that would be received to sell such an asset in an orderly transaction between market participants at the measurement date. As a non-financial asset, investment properties are measured at highest and best use. Properties are not depreciated but are revalued on a five year rolling programme according to market conditions at the year-end. Carrying values are reviewed annually to ascertain if materially different from market values for those assets not valued in year. Gains and losses on revaluation are posted to the Financing and Investment Income and Expenditure line in the Comprehensive Income and Expenditure Statement. The same treatment is applied to gains and losses on disposal. Rentals received in relation to investment properties are credited to the Financing and Investment Income line and result in a gain for the General Fund Balance. However, revaluation and disposal gains and losses are not permitted by statutory arrangements to have an impact on the General Fund Balance. The gains and losses are therefore reversed out of the General Fund Balance in the Movement in Reserves Statement and posted to the Capital Adjustment Account and (for any sale proceeds greater than £10,000) the Capital Receipts Reserve.
Group Accounts The Code requires local authorities to consider all their interests (including those in local authorities and similar bodies) and to prepare a full set of group financial statements where they have material interests in subsidiaries, associates or joint ventures. The Council has gone through a process in line with the Code guidance flowcharts and concluded Group Accounts are required in 2017/18. Further detail on the Group boundary judgement is included in note 3 and the Group Financial statements
Leases Leases are classified as finance leases where the terms of the lease transfer substantially all the risks and rewards incidental to ownership of the property, plant or equipment from the lessor to the lessee. All other leases are classified as operating leases. Where a lease covers both land and buildings, the land and buildings elements are considered separately for classification. Arrangements that do not have the legal status of a lease but convey a right to use an asset in return for payment are accounted for under this policy where fulfilment of the arrangement is dependent on the use of specific assets.
Norwich City Council - 2017-18 Statement of Accounts
49
The Council as Lessee Finance Leases Property, plant and equipment held under finance leases is recognised on the Balance Sheet at the commencement of the lease at its fair value measured at the lease’s inception (or the present value of the minimum lease payments, if lower). The asset recognised is matched by a liability for the obligation to pay the lessor. Initial direct costs of the Council are added to the carrying amount of the asset. Premiums paid on entry into a lease are applied to writing down the lease liability. Contingent rents are charged as expenses in the periods in which they are incurred. Lease payments are apportioned between:
a charge for the acquisition of the interest in the property, plant or equipment – applied to write down the lease liability, and
a finance charge (debited to the Financing and Investment Income and Expenditure line in the Comprehensive Income and Expenditure Statement).
Property, Plant and Equipment recognised under finance leases is accounted for using the policies applied generally to such assets, subject to depreciation being charged over the lease term if this is shorter than the asset’s estimated useful life (where ownership of the asset does not transfer to the Council at the end of the lease period). The Council is not required to raise Council tax to cover depreciation or revaluation and impairment losses arising on leased assets. Instead, a prudent annual contribution is made from revenue funds towards the deemed capital investment in accordance with statutory requirements. Depreciation and revaluation and impairment losses are therefore substituted by a revenue contribution in the General Fund Balance, by way of an adjusting transaction with the Capital Adjustment Account in the Movement in Reserves Statement for the difference between the two. Operating Leases Rentals paid under operating leases are charged to the Comprehensive Income and Expenditure Statement as an expense of the services benefiting from use of the leased property, plant or equipment. Charges are made on a straight-line basis over the life of the lease, even if this does not match the pattern of payments (e.g., there is a rent-free period at the commencement of the lease). The Council as Lessor Finance Leases Where the Council grants a finance lease over a property or an item of plant or equipment, the relevant asset is written out of the Balance Sheet as a disposal. At the commencement of the lease, the carrying amount of the asset in the Balance Sheet (whether Property, Plant and Equipment or Assets Held for Sale) is written off to the Other Operating Expenditure line in the Comprehensive Income and Expenditure Statement as part of the gain or loss on disposal. A gain, representing the Council’s net investment in the lease, is credited to the same line in the Comprehensive Income and Expenditure Statement also as part of the gain or loss on disposal (i.e. netted off against the carrying value of the asset at the time of disposal), matched by a lease (long-term debtor) asset in the Balance Sheet. Lease rentals receivable are apportioned between:
a charge for the acquisition of the interest in the property – applied to write down the lease debtor (together with any premiums received), and;
finance income (credited to the Financing and Investment Income and Expenditure line in the Comprehensive Income and Expenditure Statement)
The gain credited to the Comprehensive Income and Expenditure Statement on disposal is not permitted by statute to increase the General Fund Balance and is required to be treated as a capital receipt. Where a premium has been received, this is posted out of the General Fund Balance to the Capital Receipts Reserve in the Movement in Reserves Statement. Where the amount due in relation to the lease asset is to be settled by the payment of rentals in future financial years, this is posted out of the General Fund Balance to the Deferred Capital Receipts Reserve in the Movement in Reserves Statement. When the future rentals are received, the

Norwich City Council - 2017-18 Statement of Accounts
50 50
50
50
element for the capital receipt for the disposal of the asset is used to write down the lease debtor. At this point, the deferred capital receipts are transferred to the Capital Receipts Reserve. The written-off value of disposals is not a charge against Council tax, as the cost of non-current assets is fully provided for under separate arrangements for capital financing. Amounts are therefore appropriated to the Capital Adjustment Account from the General Fund Balance in the Movement in Reserves Statement. Operating Leases Where the Council grants an operating lease over a property or an item of plant or equipment, the asset is retained in the Balance Sheet. Rental income is credited to the Other Operating Expenditure line in the Comprehensive Income and Expenditure Statement. Credits are made on a straight-line basis over the life of the lease, even if this does not match the pattern of payments (e.g., there is a premium paid at the commencement of the lease). Initial direct costs incurred in negotiating and arranging the lease are added to the carrying amount of the relevant asset and charged as an expense over the lease term on the same basis as rental income.
Overheads & Support Services From 2016/17 the Code of Practice on Local Authority Accounting in the United Kingdom introduced the requirement for local authorities to report their service segments based on the way in which they operate and manage services, thereby allowing the reporting on the face of the Comprehensive Income and Expenditure Statement to align with how a local authority reports its performance internally to its management. Corporate overhead allocations are made at the year-end and shared between users in proportion to the benefits received. However, during the year the authority reports to budget holders and members the financial performance without the impact of the corporate recharges. In deference to the intentions of CIPFA’s review, the 2017/18 accounts have been reported without support cost recharges, showing support and overhead costs within their respective portfolio lines.
Intangible Assets Expenditure on non-monetary assets that do not have physical substance but are controlled by the Council as a result of past events (e.g. software licences) is capitalised when it is expected that future economic benefits or service potential will flow from the intangible asset Expenditure on the development of websites is not capitalised if the website is solely or primarily intended to promote or advertise the Council’s goods or services. Intangible assets are measured initially at cost. Amounts are only revalued where the fair value of the assets held by the Council can be determined by reference to an active market. In practice, no intangible asset held by the Council meets this criterion, and they are therefore carried at amortised cost. The depreciable amount of an intangible asset is amortised over its useful life to the relevant service line(s) in the Comprehensive Income and Expenditure Statement. An asset is tested for impairment whenever there is an indication that the asset might be impaired – any losses recognised are posted to the relevant service line(s) in the Comprehensive Income and Expenditure Statement. Any gain or loss arising on the disposal or abandonment of an intangible asset is posted to the Other Operating Expenditure line in the Comprehensive Income and Expenditure Statement. Where expenditure on intangible assets qualifies as capital expenditure for statutory purposes, amortisation, impairment losses and disposal gains and losses are not permitted to have an impact on the General Fund Balance. The gains and losses are therefore reversed out of the General Fund Balance in the Movement in Reserves Statement and posted to the Capital Adjustment Account and (for any sale proceeds greater than £10,000) the Capital Receipts Reserve.
Property, Plant & Equipment Assets that have physical substance and are held for use in the production or supply of goods or services, for rental to others, or for administrative purposes and that are expected to be used during more than one financial year are classified as Property, Plant and Equipment. The de minimis level for accounting for expenditure as capital is £5,000

Norwich City Council - 2017-18 Statement of Accounts
51
Recognition Expenditure on the acquisition, creation or enhancement of Property, Plant and Equipment is capitalised on an accruals basis, provided that it is probable that the future economic benefits or service potential associated with the item will flow to the Council and the cost of the item can be measured reliably. Expenditure that maintains but does not add to an asset’s potential to deliver future economic benefits or service potential (i.e., repairs and maintenance) is charged as an expense when it is incurred. Measurement Assets are initially measured at cost, comprising:
the purchase price
any costs attributable to bringing the asset to the location and condition necessary for it to be capable of operating in the manner intended by management
The Council does not capitalise borrowing costs incurred whilst assets are under construction.
The cost of assets acquired other than by purchase is deemed to be its fair value, unless the acquisition does not have commercial substance (i.e., it will not lead to a variation in the cash flows of the Council). In the latter case, where an asset is acquired via an exchange, the cost of the acquisition is the carrying amount of the asset given up by the Council. Donated assets are measured initially at fair value. The difference between fair value and any consideration paid is credited to the Taxation and Non-Specific Grant Income line of the Comprehensive Income and Expenditure Statement, unless the donation has been made conditionally. Until conditions are satisfied, the gain is held in the Donated Assets Account. Where gains are credited to the Comprehensive Income and Expenditure Statement, they are reversed out of the General Fund Balance to the Capital Adjustment Account in the Movement in Reserves Statement. Assets are then carried in the Balance Sheet using the following measurement bases:
infrastructure, community assets and assets under construction – depreciated historical cost
dwellings – fair value, determined using the basis of existing use value for social housing (EUV-SH)
all other assets – fair value, determined as the amount that would be paid for the asset in its existing use (existing use value – EUV)
Where there is no market-based evidence of fair value because of the specialist nature of an asset, depreciated replacement cost (DRC) is used as an estimate of fair value. Where non-property assets that have short useful lives or low values (or both), depreciated historical cost basis is used as a proxy for fair value.
Assets included in the Balance Sheet at fair value are revalued sufficiently regularly to ensure that their carrying amount is not materially different from their fair value at the year-end, but as a minimum every five years. Increases in valuations are matched by credits to the Revaluation Reserve to recognise unrealised gains. Gains are credited to the Comprehensive Income and Expenditure Statement where they arise from the reversal of a loss previously charged to a service. Where decreases in value are identified, they are accounted for by:
where there is a balance of revaluation gains for the asset in the Revaluation Reserve, the carrying amount of the asset is written down against that balance (up to the amount of the accumulated gains)
where there is no balance in the Revaluation Reserve or an insufficient balance, the carrying amount of the asset is written down against the relevant service line(s) in the Comprehensive Income and Expenditure Statement.
The Revaluation Reserve contains revaluation gains recognised since 1 April 2007 only, the date of its formal implementation. Gains arising before that date have been consolidated into the Capital Adjustment Account. Componentisation The 2017/18 CIPFA Code of Practice on Local Authority Accounting states that each part of an item of Property, Plant and Equipment (PP&E) with a cost that is significant in relation to the total cost of the item shall be

Norwich City Council - 2017-18 Statement of Accounts
52 52
52
52
depreciated separately, applied from 1 April 2010 onwards. Where there is more than one significant part of the same asset which has the same useful life and depreciation method, such parts may be grouped in determining the depreciation charge. In adopting the Code, the Authority has developed the following Componentisation Policy using the approach set out in LAAP bulletin 86:
Assets within PP&E, excluding Council dwellings with a carrying value of £1m and below, will be disregarded for componentisation as the impact upon the reported cost of service is not considered material.
Assets, excluding Council dwellings that are above the £1m de-minimis threshold will be componentised where the cost of the component: is significant in relation to the overall total cost of the asset and has a different useful life and/or method of depreciation to the main asset.
This policy excludes land assets which are already identified separately. Council dwellings are not individually componentised. The valuation of dwellings is based on a beacon approach using the assumption that the beacon property is fully upgraded. Each property in that beacon has a reduction in value, as a percentage, for each component that is not upgraded. Impairment Assets are assessed at each year-end as to whether there is any indication that an asset may be impaired. Where indications exist and any possible differences are estimated to be material, the recoverable amount of the asset is estimated and, where this is less than the carrying amount of the asset, an impairment loss is recognised for the shortfall. Where impairment losses are identified, they are accounted for by:
where there is a balance of revaluation gains for the asset in the Revaluation Reserve, the carrying amount of the asset is written down against that balance (up to the amount of the accumulated gains)
where there is no balance in the Revaluation Reserve or an insufficient balance, the carrying amount of the asset is written down against the relevant service line(s) in the Comprehensive Income and Expenditure Statement.
Where an impairment loss is reversed subsequently, the reversal is credited to the relevant service line(s) in the Comprehensive Income and Expenditure Statement, up to the amount of the original loss, adjusted for depreciation that would have been charged if the loss had not been recognised. Depreciation Depreciation is provided for on all Property, Plant and Equipment assets by the systematic allocation of their depreciable amounts over their useful lives. An exception is made for assets without a determinable finite useful life (i.e., freehold land and certain Community Assets) and assets that are not yet available for use (i.e., assets under construction). Depreciation is calculated on the following bases:
Dwellings – from 1st April 2012 depreciation is calculated based on the useful life of the individual
components of the dwelling.
other buildings – straight-line allocation over the useful life of the property as estimated by the valuer
vehicles – a percentage of the value of each class of assets in the Balance Sheet, as advised by a suitably qualified officer
Infrastructure – straight-line allocation of between 25-40 years.
Plant, furniture & equipment – straight line allocation over the useful life of asset.
Where an item of Property, Plant and Equipment assets has major components whose cost is significant in relation to the total cost of the item, the components are depreciated separately. Revaluation gains are also depreciated, with an amount equal to the difference between current value depreciation charged on assets and the depreciation that would have been chargeable based on their historical cost being transferred each year from the Revaluation Reserve to the Capital Adjustment Account.

Norwich City Council - 2017-18 Statement of Accounts
53
Disposals & Non-Current Assets Held for Sale When it becomes probable that the carrying amount of an asset will be recovered principally through a sale transaction rather than through its continuing use, it is reclassified as an Asset Held for Sale. The asset is revalued immediately before reclassification and then carried at the lower of this amount and fair value less costs to sell. Where there is a subsequent decrease to fair value less costs to sell, the loss is posted to the Other Operating Expenditure line in the Comprehensive Income and Expenditure Statement. Gains in fair value are recognised only up to the amount of any previous losses recognised in the Surplus or Deficit on Provision of Services. If assets no longer meet the criteria to be classified as Assets Held for Sale, they are reclassified back to non-current assets and valued at the lower of their carrying amount before they were classified as held for sale; adjusted for depreciation, amortisation or revaluations that would have been recognised had they not been classified as Held for Sale, and their recoverable amount at the date of the decision not to sell.
When an asset is disposed of or decommissioned, the carrying amount of the asset in the Balance Sheet (whether Property, Plant and Equipment or Assets Held for Sale) is written off to the Other Operating Expenditure line in the Comprehensive Income and Expenditure Statement as part of the gain or loss on disposal. Receipts from disposals (if any) are credited to the same line in the Comprehensive Income and Expenditure Statement also as part of the gain or loss on disposal (i.e. netted off against the carrying value of the asset at the time of disposal). Any revaluation gains accumulated for the asset in the Revaluation Reserve are transferred to the Capital Adjustment Account. Amounts received for a disposal in excess of £10,000 are categorised as capital receipts. A proportion of receipts relating to housing disposals (75% for dwellings, 50% for land and other assets, net of statutory deductions and allowances) is payable to the Government. The balance of receipts is required to be credited to the Capital Receipts Reserve, and can then only be used for new capital investment or set aside to reduce the Council’s underlying need to borrow (the capital financing requirement). Receipts are appropriated to the Reserve from the General Fund Balance in the Movement in Reserves Statement. The written-off value of disposals is not a charge against Council tax, as the cost of non-current assets is fully provided for under separate arrangements for capital financing. Amounts are appropriated to the Capital Adjustment Account from the General Fund Balance in the Movement in Reserves Statement.
Heritage Assets Heritage assets are assets with historic, artistic, scientific, technological, geophysical or environmental qualities which are held and maintained principally for their contribution to knowledge & culture. Museums collections The museums are run by the Norfolk Museums & Archaeology Service (NMAS) which is regarded as one of the leaders in the museum sector. Through a Joint Committee established under delegated powers by the County and district council’s in Norfolk, the Service runs museums throughout the County to preserve and interpret material evidence of the past with the aim of “bringing history to life The Council’s heritage assets are relatively static, and significant acquisitions and donations are rare. Where they do occur acquisitions are initially recognised at cost and subsequently at valuation where available
Material disposals are rare. However, any disposals are accounted for in accordance with the Council’s accounting policies on property, plant and equipment. The proceeds of disposals, if any, are accounted for in accordance with the Council’s general provisions relating to the disposal of property, plant and equipment.
Disposal proceeds are disclosed separately in the notes to the financial statements and are accounted for in accordance with statutory accounting requirements relating to capital expenditure and capital receipts. Heritage Buildings There are a number of buildings within the city which are considered to be of significant historical value.

Norwich City Council - 2017-18 Statement of Accounts
54 54
54
54
Where the buildings have an operational use, as offices or museums for instance, they are classified as operational assets and are depreciated and valued on a rolling five year program Four of the buildings are considered to be heritage assets and in the category of National Treasures. The March 2009 Report of Kingston University London, on behalf of RICS and HM Treasury, recommended that a category of asset defined as National Treasures be created. These are assets which are incapable of meaningful valuation, in that there is no recognised method of traditional valuation which gives any degree of accuracy. Therefore these assets are held at nil value Civic Plate & Regalia The Council owns a large collection of Civic Plate and Regalia which date back to the 19
th century. This
collection is stored, managed and cared for on behalf of the Council by NMAS in line with County Council and National Museums standards. Valuation and insurance of the collection is the responsibility of the Council. The collection of Civic Plate and Regalia is reported in the Balance Sheet at market value. Individual items in the collection are periodically revalued by an external valuer with any surplus being credited to the revaluation reserve. Any deficit on revaluation, after utilisation of any revaluation reserve in respect of the individual asset, is reported in the Comprehensive Income and Expenditure Statement. The Civic Plate and Regalia collection are deemed to have indeterminate lives and a high residual value; hence the Council do not consider it appropriate to charge depreciation. Paintings The Council owns a collection of paintings which are stored, managed insured, valued and cared for on behalf of the Council by NMAS in line with County Council and National Museums standards. The collection of paintings is reported in the Balance Sheet at insurance value. Individual items in the collection are periodically revalued by an external valuer with any surplus being credited to the revaluation reserve. Any deficit on revaluation, after utilisation of any revaluation reserve in respect of the individual asset, is reported in the Comprehensive Income and Expenditure Statement. The collection of paintings is deemed to have indeterminate lives and a high residual value; hence the Trustees do not consider it appropriate to charge depreciation. Following the 1974 Local Government reorganisation the budgets for income and expenditure relating to paintings, were vired to Norfolk County Council, who run NMAS. Therefore any expenditure which, in the Trustees’ view, is required to preserve or clearly prevent further deterioration of individual collection items is recognised in the Income and Expenditure account of Norfolk County Council. Sculptures and Bronzes The Council owns 25 sculptures and bronzes which are situated in external locations around the city. The Sculptures and Bronzes are reported in the Balance Sheet at insurance value and are periodically revalued by an external valuer with any surplus being credited to the revaluation reserve. Any deficit on revaluation, after utilisation of any revaluation reserve in respect of the individual asset, is reported in the Comprehensive Income and Expenditure Statement. Statues, Architectural Ornamentation, Plaques, Fountains etc The Council owns 60 of the above which are situated in external locations around the city. The assets are reported in the Balance Sheet at insurance value and are periodically revalued by an external valuer with any surplus being credited to the revaluation reserve. Any deficit on revaluation, after utilisation of any revaluation reserve in respect of the individual asset, is reported in the Comprehensive Income and Expenditure Statement
Fair Value Measurement The council measures some of its non-financial assets such as surplus assets and investment properties at fair value at each reporting date. Fair value is the price that would be received to sell an asset or paid to transfer a liability in an orderly transaction between market participants at the measurement date. The fair value measurement assumes that the transaction to sell the asset or transfer the liability takes place either:
in the principal market for the asset or liability, or
in the absence of a principal market, in the most advantageous market for the asset or liability The council measures the fair value of an asset or liability using the assumptions that market participants would use when pricing the asset or liability, assuming that market participants act in their economic best interest.
Norwich City Council - 2017-18 Statement of Accounts
55
When measuring the fair value of a non-financial asset, the council takes into account a market participant’s ability to generate economic benefits by using the asset in its highest and best use or by selling it to another market participant that would use the asset in its highest and best use. The council uses valuation techniques that are appropriate in the circumstances and for which sufficient data is available, maximising the use of relevant observable inputs and minimising the use of unobservable inputs. Inputs to the valuation techniques in respect of assets and liabilities for which fair value is measured or disclosed in the council’s financial statements are categorised within the fair value hierarchy, as follows:
Level 1 – quoted prices (unadjusted) in active markets for identical assets or liabilities that the council can access at the measurement date
Level 2 – inputs other than quoted prices included within Level 1 that are observable for the asset or liability, either directly or indirectly
Level 3 – unobservable inputs for the asset or liability.
Provisions, Contingent Assets & Liabilities
Provisions Provisions are made where an event has taken place that gives the Council a legal or constructive obligation that probably requires settlement by a transfer of economic benefits or service potential, and a reliable estimate can be made of the amount of the obligation. For instance, the Council may be involved in a court case that could eventually result in the making of a settlement or the payment of compensation. Provisions are charged as an expense to the appropriate service line in the Comprehensive Income and Expenditure Statement in the year that the Council becomes aware of the obligation, and are measured at the best estimate at the balance sheet date of the expenditure required to settle the obligation, taking into account relevant risks and uncertainties. When payments are eventually made, they are charged to the provision carried in the Balance Sheet. Estimated settlements are reviewed at the end of each financial year – where it becomes less than probable that a transfer of economic benefits will now be required (or a lower settlement than anticipated is made), the provision is reversed and credited back to the relevant service.
Where some or all of the payment required to settle a provision is expected to be recovered from another party (e.g. from an insurance claim), this is only recognised as income for the relevant service if it is virtually certain that reimbursement will be received if the Council settles the obligation. Contingent Assets A contingent asset arises where there is a possibility of an economic benefit which will only be confirmed by the occurrence or otherwise of uncertain future events not wholly within the control of the Council. Due to the uncertainty of future events, these assets are not placed on the balance sheet, even when they are probable and the amount can be estimated. Contingent Liabilities A contingent liability arises where an event has taken place that gives the Council a possible obligation whose existence will only be confirmed by the occurrence or otherwise of uncertain future events not wholly within the control of the Council. Contingent liabilities also arise in circumstances where a provision would otherwise be made but either it is not probable that an outflow of resources will be required or the amount of the obligation cannot be measured reliably. Contingent liabilities are not recognised in the Balance Sheet but disclosed in a note to the accounts.
Reserves The Council sets aside specific amounts as reserves for future policy purposes or to cover contingencies. Reserves are created by appropriating amounts out of the General Fund Balance in the Movement in Reserves Statement. When expenditure to be financed from a reserve is incurred it is charged to the appropriate service in that year to score against the Surplus or Deficit on the Provision of Services in the Comprehensive Income and
Norwich City Council - 2017-18 Statement of Accounts
56 56
56
56
Expenditure Statement. The reserve is then appropriated back into the General Fund Balance in the Movement in Reserves Statement so that there is no net charge against Council tax for the expenditure. Certain reserves are kept to manage the accounting processes for non-current assets, financial instruments, and retirement and employee benefits, and do not represent usable resources for the Council – these reserves are explained in the relevant policies.
Revenue Expenditure Funded from Capital under Statute (REFCUS) Expenditure incurred during the year that may be capitalised under statutory provisions but that does not result in the creation of a non-current asset has been charged as expenditure to the relevant service in the Comprehensive Income and Expenditure Statement in the year. Where the Council has determined to meet the cost of this expenditure from existing capital resources or by borrowing, a transfer in the Movement in Reserves Statement from the General Fund Balance to the Capital Adjustment Account then reverses out the amounts charged so that there is no impact on the level of Council tax.
The Collection Fund
This account reflects the statutory requirement for billing authorities to maintain a separate Collection Fund, which shows the transactions of the billing authority in relation to national nondomestic rates and the Council Tax and illustrates the way in which these have been distributed to preceptors and the General Fund. The transactions of the Collection Fund are wholly prescribed by legislation. Billing authorities have no discretion to
determine which receipts and payments are accounted for within the fund and which outside. Council Tax The council tax included in the Comprehensive Income and Expenditure Statement for the year is the accrued income for the year. The difference between the income included in the Income and Expenditure Account and the amount required by regulation to be credited to the Collection Fund is taken to the Collection Fund adjustment Account and included as a reconciling item in the Statement of Movement on the General Fund balance. Cash collected by the billing authority from council tax debtors belongs proportionately to the billing authority and the major precepting authorities. There will be a debtor or creditor position between the billing authority and each major preceptor to be recognised at the end of each year as the net cash paid to each major preceptor during the year will not exactly match its share of the cash collected from Council Taxpayers. The cash flow statement only includes in revenue activities cash flows relating to its own share of Council Tax collected. The difference between the government and the preceptors’ share of the net cash collected from Council Tax payers and the net cash paid to them is included as a net movement in other liquid resources. National Non-Domestic Rates Cash collected by the billing authority from National non-domestic rates (NNDR) debtors belongs proportionately to the government, the billing authority and the major precepting authority. There will be a debtor or creditor position between the billing authority and major preceptor to be recognised at the end of each year as the net cash paid to each major preceptor during the year will not exactly match its share of the cash collected from NNDR Taxpayers. The NNDR included in the Comprehensive Income and Expenditure Statement (CIES) for the year is the accrued income. The difference between the income included in the CIES and the amount required by regulation to be credited to the General fund is taken to the Collection Fund Adjustment Account and is included as a reconciling item in the Movement in Reserves Statement (MiRS). The cash flow statement only includes in revenue activities cash flows relating to its own share of NNDR collected. The difference between the government and the preceptors’ share of the net cash collected from NNDR payers and the net cash paid to them is included as a net movement in other liquid resources. There are a number of NNDR reliefs available to NNDR payers which are mandatory, the government funds these reliefs in full (except for Small Business Rate relief which it funds 50%) via s31 grant to each authority. The
Norwich City Council - 2017-18 Statement of Accounts
57
s31 grant included in the CIES for the year that which is equal to the deficit claimed back within that year. Any excess over this amount is transferred to a S31 earmarked reserve. To ensure that BRRS is equitable when compared to the previous system of NNDR, the government has calculated the Funding Baseline which each authority needs to fund its business as well as a Business Rate Baseline which relates to the collectable NNDR, the difference between the two will either result in an individual authority paying a tariff to, or receiving top-up from the government. In a two tier authority the County Council will be in a top-up position and the billing authority in a tariff position. The tariff or top-up is reflected in the authority’s individual CIES i.e. does not go through the Collection Fund. The authority is required to calculate whether it is in a levy or safety net position at year end. If the authority’s income from NNDR and the s31 grant less the tariff paid is greater than the funding baseline then a levy is payable according to the levy formula, the percentage of levy is capped at 50%. If the authority’s income from NNDR and the s31 grant less the tariff paid is less than 92.5% of the funding baseline then the authority is entitled to a safety net payment. Any levy/ safety net amounts are accrued and included in the CIES and in creditors/debtors as appropriate in the Balance Sheet.
VAT VAT payable is included as an expense only to the extent that it is not recoverable from Her Majesty’s Revenue and Customs. VAT receivable is excluded from income.
2. Accounting Standards that have been issued but have not been adopted
The Code of Practice on Local Authority Accounting in the UK 2018-19 has introduced the following changes in accounting policy, which will need to be adopted fully by the Council in the 2018-19 financial statements from 1 April 2018. The Council is required to disclose information relating to the impact of the accounting changes on the financial statements as a result of the adoption by the Code of a new standard that has been issued, but is not yet required to be adopted by the Council. The Council is required to make disclosure of the estimated effect of the new standard in these financial statements. IFRS 9 Financial Instruments This financial instrument has been implemented in the 2018/19 CIPFA Accounting Code of Practice. Its introduction will see the classifications of financial assets change to Amortised Cost, Fair Value through Comprehensive Income and Fair Value through Profit and Loss, from the previous categories of Loans and Receivables, Available for Sale and Fair Value through Profit and Loss. The second main change will be the introduction of an expected credit loss model for particular asset types, rather than an impairment of the asset resulting from a specific incident. Certain aspects of the introduction of IFRS 9 have been adapted for local authorities, effectively removing the IFRS 9 implications. These cover such areas as soft loans, Lender Option Borrowing Option (LOBO) loans, immaterial transactions, exchanges of debt instruments and hedge accounting. The impact of these changes on the Authority’s financial position is likely to be immaterial. The main financial assets held by the Authority will be treasury management investments which will move from the Loans and Receivables category to Amortised Cost and will be accounted for on a similar basis. In addition, the high credit quality adopted by the Authority for its investment counterparties is likely to see an immaterial expected credit loss position. IFRS 15 – Revenue from Contracts with Customers This standard will not have any impact on Norwich City Council’s accounts; however it may impact on the group accounts with Norwich Regeneration Ltd, depending on the type of transactions undertaken in future years and the timing of these transactions.

Norwich City Council - 2017-18 Statement of Accounts
58 58
58
58
Other Standards The following accounting standards have minor changes next year, but these are either not relevant to the Council or the changes are expected to be minor and are not expected to make any change to the reported information in the accounts and will therefore not have a material effect: Amendments to IAS 12 Income Taxes: Recognition of Deferred Tax Assets for Unrealised Losses and Amendments to IAS 7 Statement of Cash Flows: Disclosure Initiative.
3. Critical Judgments in Applying Accounting Policies
In applying the accounting policies set out in Note 1, the Council has had to make certain judgments about complex transactions or those involving uncertainty about future events. The critical judgments made in the Statement of Accounts are:
There is a high degree of uncertainty about future funding for local government. However, the Council has determined that this uncertainty is not yet sufficient to provide an indication that the assets of the Council might be impaired as a result of a need to close facilities and reduce levels of service provision.
Note 16 Financial Instruments details the authority’s Investment Strategy and approach to managing risk. None of the authority’s investments are impaired;
The Council has undertaken an analysis to classify the leases it holds, both as a lessee and lessor, as either operating or finance leases. The accounting policy for leases has been applied to these arrangements and assets are recognised or derecognised (as appropriate) as Property, Plant and Equipment in the Council’s Balance Sheet
The Council has reviewed all property assets in accordance with the policy for Investment Properties and classified as appropriate
The Council has reviewed all property assets in accordance with the policy for Assets Held for Sale and reclassified as appropriate
Insurance fund levels are maintained on advice from the council’s insurance manager
The preparation of financial statements also requires management to exercise judgement in applying the council’s accounting policies. The areas involving a higher degree of judgement or complexity, or areas where assumptions or estimates are significant are disclosed below:
Property, Plant and Equipment
In determining the useful economic life of property, plant and equipment, judgement needs to be exercised in estimating the length of time that assets will be operational. Judgements are also required regarding the classification of specialist/non-specialist assets and in determining residual values.
Valuers also make a range of judgements when determining the values of assets held at fair value.
The significant assumptions applied in estimating the fair values are:
For income producing properties, the Valuers adopted an investment approach where they applied a capitalisation rate, as a multiplier, against the current and, if any, reversionary income streams. Following market practice they construct their valuations adopting hardcore methodology where the reversions are generated from regular short-term uplifts of market rent. They would normally apply a term and reversion approach where the next event is one which fundamentally changes the nature of the income or characteristics of the investment. Where there is an actual exposure or a risk thereto of irrecoverable costs, including those of achieving a letting, an allowance is reflected in the valuation;
The assessment of rental values is formed purely for the purposes of assisting in the formation of an opinion of capital value and is generally on the basis of Market Rent, as defined in “the Red Book”. Where circumstances dictate that it is necessary to utilise a different rental value in the capital valuation, the valuers will generally set out the reasons for this in their report;
Vacant buildings, in addition to the above methodology, may also be valued and analysed on a comparison method with other capital value transactions where applicable; and
Norwich City Council - 2017-18 Statement of Accounts
59
Owner-occupied properties are valued on the basis of existing use value, thereby assuming the premises are vacant and will be required for the continuance of the existing business. Such valuations ignore any higher value that might exist from an alternative use.
Investment Properties IAS 40 Investment properties (“IAS 40”) requires that properties are classified as investment properties where they are held for the purpose of capital appreciation or to earn rentals. To comply with IAS 40, judgement needs to be exercised in determining whether these properties should be classified as investment properties in accordance with IAS 40. As investment properties are valued at fair value with movements in the fair value being recorded in the income statement this could have a significant effect on the reported surplus or deficit of the Council
Post Retirement Benefits Pensions liability – the estimation of the net liability to pay pensions depends on a number of complex judgements relating to the discount rate used, the rate at which salaries are projected to increase, changes in retirement ages, mortality rates and expected returns on pension fund assets. Actuaries are engaged to provide the Authority with expert advice about the assumptions to be applied. The assumptions made and sensitivity analyses are provided in note 45
Group Boundaries The Code of Practice requires local authorities with interests in subsidiaries, associated and joint ventures to prepare group accounts in addition to their own single entity financial statements, unless the interest is not material. The group boundaries have been estimated using criteria associated with the Code of Practice and the following relationships determined: Norwich Regeneration Limited Subsidiary Consolidated NPS Norwich Ltd Associate Consolidated Norwich Norse (Environmental) Limited Associate Consolidated Norwich Norse (Building) Limited Associate Consolidated Three Score Open Space Management Limited Subsidiary Not Material Due to the material levels of transactions going through Norwich Regeneration Ltd (NRL) in 2017-18, consolidated group accounts have been prepared. As a subsidiary, the accounts of NRL have been consolidated with those of the Council on a line by line basis, and any balances and transactions between parties have been eliminated in full.
4. Assumptions made about future and other major sources of estimation uncertainty
The preparation of financial statements requires management to make judgements, estimates and assumptions that affect the amounts reported for assets and liabilities as at the balance sheet date and the amounts reported for the revenues and expenses during the year. However, the nature of estimation means that actual outcomes could differ from those estimates.
The key judgements and estimation uncertainty that have a significant risk of causing material adjustment to the carrying amounts of assets and liabilities within the next financial year are:

Norwich City Council - 2017-18 Statement of Accounts
60 60
60
60
Items Uncertainties Effect if Actual Results differ from Assumptions
Business Rates
Since the introduction of the Business Rates retention Scheme in April 2013, Local Authorities are liable for successful appeals against business rates charged to business in 2017/18 and earlier financial years in their proportionate share. As at the 31 March 2018 197 appeals remain outstanding relating to the 2005 and 2010 rating lists. A provision has been recognised for the best estimate of the amount that businesses have been overcharged for the period. Following the 2017 revaluation, a new check, challenge and appeal process has been introduced by the Valuation Office Agency; the impact of which is highly uncertain with only 6 challenges lodged to date. A provision has been made for the estimated success of future appeals for losses for the period to the end of March 2018.
Should the outstanding appeals be successful, the amount owed to businesses may be more than estimated, in which case the proportionate share of this would require an increase to the provision. However there may be appeals that are not successful or they may be successful but the amount owed to businesses be less than estimated, which would result in a reduction in the appeals provision
Property, Plant and Equipment (excluding Housing Stock) £164.1m
Assets are depreciated over useful lives that are dependent on assumptions about the level of repairs and maintenance that will be incurred in relation to individual assets. The current economic climate makes it uncertain that the Council will be able to sustain its current spending on repairs and maintenance, bringing into doubt the useful lives assigned to assets
If the useful life of assets is reduced, depreciation increases and the carrying amount of the assets falls. It is estimated that the annual depreciation charge for assets would increase by £0.336m for every year that useful lives had to be reduced
Pensions Liability £180.0m
Estimation of the net liability to pay pensions depends on a number of complex judgments relating to the discount rate used, the rate at which salaries are projected to increase, changes in retirement ages, mortality rates and expected returns on pension fund assets. A firm of consulting actuaries is engaged to provide the Council with expert advice about the assumptions to be applied.
The sensitivities resulting in an impact on the Council’s finances are disclosed in Note 45
Arrears At 31 March 2018, the Council had a balance of sundry debtors for £3.218m. A review of significant balances suggested that an impairment of doubtful debts ranging from 10% to 100% was appropriate. However, in the current economic climate it is not certain that such an allowance would be sufficient.
If collection rates were to deteriorate, an increase in the amount of the impairment for doubtful debt would be required.
Housing Stock The housing stock is not individually componentised, for valuation purposes a beacon approach is used with the assumption that the beacon property is fully upgraded. Each property in that beacon is then reduced by percentages for each component that is not upgraded.
The percentages used to reduce the value may not reflect the true depreciated value of the individual components. The valuation of housing stock may be under or overstated
Housing Stock The housing stock is not individually componentised, for depreciation purposes council dwellings have their individual components identified as to date of upgrade and using the asset life as advised by the council’s valuers, the depreciation associated with each properties components is calculated.
The use of standard lives to calculate components and assumption of full depreciation on components not upgraded may not be valid. The depreciation of council dwellings may be under or overstated
Fair value measurements When the fair value of financial assets and financial liabilities cannot be measured based on quoted prices in active markets (level 1 inputs), their fair value is measured using valuation techniques (e.g. quoted prices for similar assets or liabilities in active markets or the discounted cash flow [DCF] model). Where possible, the
The council uses the model disclosed in note 15 to measure the fair value of its investment properties and financial assets. The significant unobservable inputs used in the fair value measurement include management assumptions regarding rent growth, vacancy levels (for investment

Norwich City Council - 2017-18 Statement of Accounts
61
inputs to these valuation techniques are based on observable data but where this is not possible judgement is required in establishing fair values. These judgements typically include considerations such as uncertainty and risk. However, changes in the assumptions used could affect the fair value of the council’s assets and liabilities. Where level 1 inputs are not available, the council employs relevant experts to identify the most appropriate valuation techniques to determine the fair value. Information about the valuation techniques and inputs used in determining the fair value of the council’s assets and liabilities is disclosed in
notes16 and 18 below.
properties) and discount rates – adjusted for regional factors (for investment properties, surplus assets and assets held for sale) Significant changes in any of the unobservable inputs would result in a significantly lower or higher fair value measurement for investment properties and financial assets.
5. Material Items of Income and Expense During 2017/18 the Council has advanced a loan amount to its wholly owned subsidiary Norwich Regeneration Ltd of £10.7m. This takes the total loan to £11.5m. The company is using the loan to finance its house building at the Threescore site. The Council has made three material purchases of commercial investment properties during the 2017/18 financial year. The total acquisition costs for the three purchases totalled £13.4m. Note 6 details material items of Income and Expense

Norwich City Council - 2017-18 Statement of Accounts
62 62
62
62
6. Expenditure and Income by Nature
The authority's expenditure and income is analysed as follows:
2017/18 2016/17
Income £000 £000
Fees, charges and other service income (91,888) (94,301)
Interest and investment income (3,048) (3,861)
Authority’s share of income from Council Tax and Non-Domestic Rates (38,033) (39,726)
Government grants and contributions (15,415) (14,382)
Gain on disposal of non-current assets (4,276) (367)
Housing Benefit contributions and allowances (59,419) (62,940)
Equity Transfer - (2,200)
Total (212,077) (217,777)
Expenditure
Employee benefits expenses 25,827 22,926
Pension Interest cost and expected retuirn on assets 4,634 4,164
Other service expenses 59,358 58,305
Depreciation, amortisation, revaluation and impairment (30,471) 12,135
Interest payments 8,791 9,432
Payments to Housing Capital Receipts Pool 1,114 1,471
Housing Benefit expenditure 59,281 63,384
Non-Domestic rates levy 25,027 26,253
Total 153,563 198,072
(Surplus) or deficit on the Provision of services (58,515) (19,706)
7. Segmental Income
Income received on a segmental basis is analysed below:
2017/18 2016/17
£000 £000
Revenue from External customers (94,390) (96,808)
Other Income (117,687) (120,969)
Total Income (212,077) (217,777)
8. Events after the Reporting Date
The draft statement of accounts were authorised for issue by the Chief Finance Officer on 31 May 2018. Events taking place after this date are not reflected in the financial statements or notes. Where events taking place before this date provided information about conditions existing at 31 March 2018, the figures in the financial statements and notes have been adjusted in all material respects to reflect the impact of this information. On 27 April 2018 Norwich City Council signed a contract to transfer the Norwich Community Alarm Service (NCAS) to Welbeing (Wealden and Eastbourne Lifeline Ltd). Norwich City Council has received £300k in relation to the transfer of the business. This will be recognised in the 2018/19 financial statements.

Norwich City Council - 2017-18 Statement of Accounts
63
The Council has been in dispute with one of its contractors over some construction costs. The case was referred for adjudication and on 1 May 2018 the Adjudicator ruled in favour of the Council, finding it not to be liable for additional payments to the contractor. Whilst the decision could be referred to the High Court, the Council does not believe there is any liability for these costs. This has been included within the Contingent Liabilities note. On 25
April 2018 the Council purchased a new investment property within Norwich for a purchase price of £9.4m
(excluding Stamp Duty Land Tax).
9. Adjustments between Accounting Basis and Funding Basis under regulations
This note details the adjustments that are made to the total comprehensive income and expenditure recognised by the Council in the year in accordance with proper accounting practice to the resources that are specified by statutory provisions as being available to the Council to meet future capital and revenue expenditure The following sets out a description of the reserves that the adjustments are made against.
General Fund Balance The General Fund is the statutory fund into which all the receipts of an authority are required to be paid and out of which all liabilities of the authority are to be met, except to the extent that statutory rules might provide otherwise. These rules can also specify the financial year in which liabilities and payments should impact on the General Fund Balance, which is not necessarily in accordance with proper accounting practice. The General Fund Balance therefore summarises the resources that the Council is statutorily empowered to spend on its services or on capital investment (or the deficit of resources that the Council is required to recover) at the end of the financial year– however, the balance is not available to be applied to funding HRA services.
Housing Revenue Account Balance The Housing Revenue Account Balance reflects the statutory obligation to maintain a revenue account for local authority council housing provision in accordance with Part VI of the Local Government and Housing Act 1989. It contains the balance of income and expenditure as defined by the 1989 Act that is available to fund future expenditure in connection with the Council’s landlord function or (where in deficit) that is required to be recovered from tenants in future years.
Major Repairs Reserve The Authority is required to maintain the Major Repairs Reserve. The MRR is restricted to being applied to new capital investment in HRA assets or the financing of historical capital expenditure by the HRA. The balance shows the MRR that has yet to be applied at the year-end.
Capital Receipts Reserve The Capital Receipts Reserve holds the proceeds from the disposal of land or other assets, which are restricted by statute from being used other than to fund new capital expenditure or to be set aside to finance historical capital expenditure. The balance on the reserve shows the resources that have yet to be applied for
Capital Grants Unapplied The Capital Grants Unapplied Account (Reserve) holds the grants and contributions received towards capital projects for which the Council has met the conditions that would otherwise require repayment of the monies but which have yet to be applied to meet expenditure. The balance is restricted by grant terms as to the capital expenditure against which it can be applied and/or the financial year in which this can take place.

Norwich City Council - 2017-18 Statement of Accounts
64 64
64
64
2017/18 Gen
era
l F
un
d
Bala
nce
Ho
usin
g R
even
ue
Acco
un
t
Cap
ital R
eceip
ts
Reserv
e
Majo
r R
ep
air
s
Reserv
e
Cap
ital G
ran
ts
Un
ap
plied
Mo
vem
en
t in
Usab
le R
eserv
es
Mo
vem
en
t in
Un
usab
le
Reserv
es
£'000 £'000 £'000 £'000 £'000 £'000 £'000
Adjustments involving the Capital
Adjustment Account
Reversal of items debited or credited
to the Comprehensive Income and
Expenditure Statement
Charges for depreciation and
impairment of non-current assets (3,938) (15,607) (19,545) 19,545
Excess dep'n over HRA MRA
Revaluation gains / (Losses) on
Property, Plant and Equipment 5,565 43,013 48,578 (48,578)
Movement in Market Value of
Investment Properties 1,755 1,755 (1,755)
Capital Grants and Contributions
Applied 1,424 4 1,428 (1,428)
Movement in Donated Assets
Account
Revenue expenditure funded from
capital under statute (8,768) (8,768) 8,768
Amounts of non-current assets
written off on disposal or sale as part
of a gain/loss on disposal to the
Comprehensive Income and
Expenditure Statement (734) (10,714) (11,448) 11,448
Insertion of items not debited or
credited to the Comprehensive
Income and expenditure Statement
Statutory provision for the financing of
capital investment 262 90 352 (352)
Capital expenditure charged against
the General Fund and HRA balances 550 12,527 13,077 (13,077)
Adjustments involving the Capital
Grants Unapplied Account
Capital Grants and contributions
unapplied credited to the
Comprehensive Income and
Expenditure Statement 6,926 1,159 (8,085) -
Application of grants to capital
financing transferred to the Capital
Adjustment Account 4,885 4,885 (4,885)
Adjustments involving the Capital
Receipts Reserve:
Transfer of cash sale proceeds
credited as part of the gain/loss on
disposal to the Comprehensive
Income and Expenditure Statement 1,100 14,772 (15,872) -
Use of Capital Receipts Reserve to
finance new capital expenditure 7,284 7,284 (7,284)
Contribution from the Capital receipts
Reserve towards administration
costs of non-current asset disposals (26) (277) 303 -
Contribution from the Capital receipts
Reserve to Finance the payments to
the Government capital receipts pool (1,114) 1,114 -
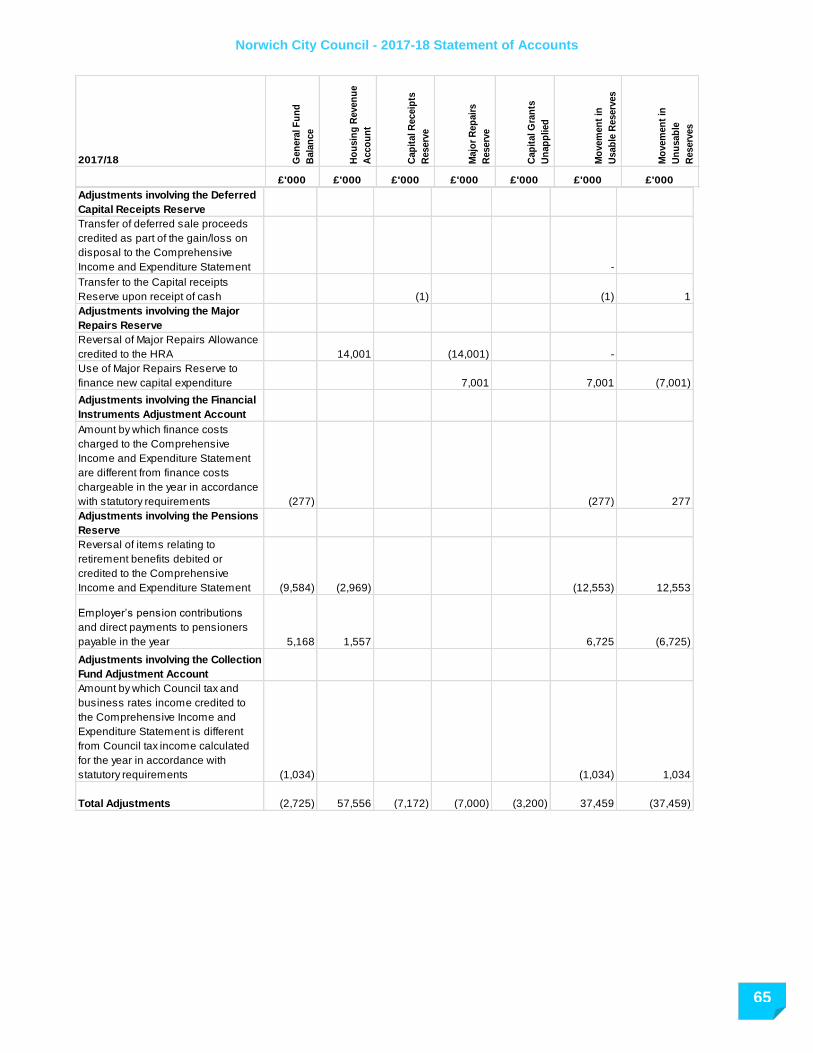
Norwich City Council - 2017-18 Statement of Accounts
65
2017/18 Gen
era
l F
un
d
Bala
nce
Ho
usin
g R
even
ue
Acco
un
t
Cap
ital R
eceip
ts
Reserv
e
Majo
r R
ep
air
s
Reserv
e
Cap
ital G
ran
ts
Un
ap
plied
Mo
vem
en
t in
Usab
le R
eserv
es
Mo
vem
en
t in
Un
usab
le
Reserv
es
£'000 £'000 £'000 £'000 £'000 £'000 £'000 Adjustments involving the Deferred
Capital Receipts Reserve
Transfer of deferred sale proceeds
credited as part of the gain/loss on
disposal to the Comprehensive
Income and Expenditure Statement -
Transfer to the Capital receipts
Reserve upon receipt of cash (1) (1) 1
Adjustments involving the Major
Repairs Reserve
Reversal of Major Repairs Allowance
credited to the HRA 14,001 (14,001) -
Use of Major Repairs Reserve to
finance new capital expenditure 7,001 7,001 (7,001)
Adjustments involving the Financial
Instruments Adjustment Account
Amount by which finance costs
charged to the Comprehensive
Income and Expenditure Statement
are different from finance costs
chargeable in the year in accordance
with statutory requirements (277) (277) 277
Adjustments involving the Pensions
Reserve
Reversal of items relating to
retirement benefits debited or
credited to the Comprehensive
Income and Expenditure Statement (9,584) (2,969) (12,553) 12,553
Employer’s pension contributions
and direct payments to pensioners
payable in the year 5,168 1,557 6,725 (6,725)
Adjustments involving the Collection
Fund Adjustment Account
Amount by which Council tax and
business rates income credited to
the Comprehensive Income and
Expenditure Statement is different
from Council tax income calculated
for the year in accordance with
statutory requirements (1,034) (1,034) 1,034
Total Adjustments (2,725) 57,556 (7,172) (7,000) (3,200) 37,459 (37,459)

Norwich City Council - 2017-18 Statement of Accounts
66 66
66
66
2016/17 comparative figures Ge
ne
ral
Fu
nd
Ba
lan
ce
Ho
us
ing
Re
ve
nu
e
Ac
co
un
t
Ca
pit
al
Re
ce
ipts
Re
se
rve
Ma
jor
Re
pa
irs
Re
se
rve
Ca
pit
al
Gra
nts
Un
ap
plie
d
Mo
ve
me
nt
in U
sa
ble
Re
se
rve
s
Mo
ve
me
nt
in U
nu
sa
ble
Re
se
rve
s
£'000 £'000 £'000 £'000 £'000 £'000 £'000
Adjustments involving the Capital
Adjustment Account
Reversal of items debited or credited to the
Comprehensive Income and Expenditure
Statement
Charges for depreciation and impairment of
non-current assets (3,206) (15,834) (19,040) 19,040
Revaluation gains / (Losses) on Property,
Plant and Equipment (1,589) 10,426 8,837 (8,837)
Movement in Market Value of Investment
Properties (577) (577) 577
Capital Grants and Contributions Applied 1,147 31 1,178 (1,178)
Movement in Donated Assets Account
Revenue expenditure funded from capital
under statute (6,479) (6,479) 6,479
Amounts of non-current assets written off
on disposal or sale as part of a gain/loss
on disposal to the Comprehensive Income
and Expenditure Statement (1,262) (9,584) (10,846) 10,846
HRA Self Financing Debt - -
Insertion of items not debited or credited to
the Comprehensive Income and
expenditure Statement
Statutory provision for the financing of
capital investment 278 85 363 (363)
Capital expenditure charged against the
General Fund and HRA balances 95 9,531 9,626 (9,626)
Adjustments involving the Capital Grants
Unapplied Account
Capital Grants and contributions unapplied
credited to the Comprehensive Income and
Expenditure Statement 5,500 442 (5,942) -
Application of grants to capital financing
transferred to the Capital Adjustment
Account 4,262 4,262 (4,262)
Adjustments involving the Capital
Receipts Reserve:
Transfer of cash sale proceeds credited as
part of the gain/loss on disposal to the
Comprehensive Income and Expenditure
Statement 1,277 11,984 (13,261) -
Use of Capital Receipts Reserve to finance
new capital expenditure 3,231 3,231 (3,231)
Contribution from the Capital receipts
Reserve towards administration costs of
non-current asset disposals (39) (237) 276 -
Contribution from the Capital receipts
Reserve to Finance the payments to the
Government capital receipts pool (1,471) 1,471 -

Norwich City Council - 2017-18 Statement of Accounts
67
2016/17 comparative figures Ge
ne
ral
Fu
nd
Ba
lan
ce
Ho
us
ing
Re
ve
nu
e
Ac
co
un
t
Ca
pit
al
Re
ce
ipts
Re
se
rve
Ma
jor
Re
pa
irs
Re
se
rve
Ca
pit
al
Gra
nts
Un
ap
plie
d
Mo
ve
me
nt
in U
sa
ble
Re
se
rve
s
Mo
ve
me
nt
in U
nu
sa
ble
Re
se
rve
s
£'000 £'000 £'000 £'000 £'000 £'000 £'000
Adjustments involving the Deferred
Capital Receipts Reserve
Transfer of deferred sale proceeds credited
as part of the gain/loss on disposal to the
Comprehensive Income and Expenditure
Statement (197) 197 -
Transfer to the Capital receipts Reserve
upon receipt of cash (997) (997) 997
Adjustments involving the Major Repairs
Reserve
Reversal of Major Repairs Allowance
credited to the HRA 13,553 (13,553) -
Use of Major Repairs Reserve to finance
new capital expenditure 13,553 13,553 (13,553)
Adjustments involving the Financial
Instruments Adjustment Account
Amount by which finance costs charged to
the Comprehensive Income and
Expenditure Statement are different from
finance costs chargeable in the year in
accordance with statutory requirements 839 839 (839)
Adjustments involving the Pensions
Reserve
Reversal of items relating to retirement
benefits debited or credited to the
Comprehensive Income and Expenditure
Statement (6,600) (2,290) (8,890) 8,890
Employer’s pension contributions and
direct payments to pensioners payable in
the year 4,740 1,685 6,425 (6,425)
Adjustments involving the Collection Fund
Adjustment Account
Amount by which Council tax and business
rates income credited to the
Comprehensive Income and Expenditure
Statement is different from Council tax
income calculated for the year in
accordance with statutory requirements 1,236 1,236 (1,236)
Total Adjustments (6,308) 19,792 (9,083) - (1,680) 2,721 (2,721)

Norwich City Council - 2017-18 Statement of Accounts
68 68
68
68
10. Transfers to/from Earmarked and Other Reserves
This note sets out the amounts set aside from the General Fund and HRA balances in earmarked reserves to provide financing for future expenditure plans and the amounts posted back from earmarked reserves to meet General Fund and HRA expenditure in 2017/18 and 2016/17. The following sets out a description of the reserves;
Insurance Reserve
The Insurance Reserve was established to cover the excesses carried in respect of claims under various insurance policies, particularly public and employers’ liability, subject to periodic review of the appropriate level at which any ‘stop-loss’ arrangements apply. The Council only insures housing stock three storeys and above in height, sheltered and listed accommodation, and only for limited perils (fire, lightening, explosion and storm). The risk has been identified and assessed and it has been decided that the most cost effective way to manage risk is for the Council to self-insure losses via the Housing Revenue Account. An evaluation of the balance on the Insurance Reserve has been undertaken and the amount set aside to cover the uninsured risks at 31 March 2017 is based on the assessed liability.
Included within this balance is an amount to cover potential liabilities following the trigger of the Municipal Mutual Insurance Limited (MMI) Scheme of Arrangement. MMI was formed as a limited company by guarantee in 1903 and by 1974 some 90% of local authorities were insured by the company. Due to dramatic increases in claims, coincidental with a fall in the property market and poor investment environment, along with its inability to raise capital because of its mutual status, MMI's net assets fell below the minimum regulatory solvency requirement and the company went into run-off in September 1992. The Council is also liable to contribute to each and every subsequent claim paid by MMI on the Council's behalf, thereby creating an on-going financial obligation. An allowance is also made for this within the reserve.
S31 Earmarked Reserve Central government compensates local authorities for changes to business rates reliefs. This compensation is made outside of the rate retention scheme by means of a Section 31 (S31) grant directly to the general fund. The S31 Earmarked Reserve holds the unused balance of the S31 grant monies received in 2016/17 and 2017/18. These monies will be transferred to the General Fund Reserves during 2018/19 and 2019/20 to mitigate the delayed impact of the 2016/17 & 2017/18 deficits on the NNDR Collection Fund as properly accounted for under regulation. Similar transfers in and out of the reserve will take place each year whilst the S31 grant is received.
Revenue Grants Unapplied Reserves
This reserve is the balance of revenue grant income received that has no conditions applied to it, but where the grant has yet to be applied and there are restrictions as to how the monies are to be applied. This ensures that amounts are set aside from the General Fund and the Housing Revenue Account balances to provide financing to meet the requirements of the grant. The amounts set aside will be transferred back to meet General Fund and Housing Revenue Account expenditure in future years, the transfer being accounted for in the Movement in Reserves Statement within the transfers to/or from Earmarked reserves line.

Norwich City Council - 2017-18 Statement of Accounts
69
Invest to Save Reserves
The Invest to Save Reserves for both the General Fund and Housing Revenue Account were set up to support the delivery of savings and efficiencies through the Fit for the Future Transformation Programme. The reserve is expected to be utilised to support the implementation of a new operating model and IT investment over the next 2-3 years.
Commercial Property Reserve
The Council has a significant and increasing investment property portfolio. The Commercial Property Reserve has been created using a proportion of the net income generated from the investment properties during the year and will be used to provide funding for any future void and rent free periods as well as any repairs/upgrades required to the property. The reserve will help to safeguard the future value of the investment properties and the rental income stream, thereby minimising the risk of holding these assets and of fluctuations in the income return. It is planned that the reserve will continue to be built up as the investment portfolio grows.
Norwich Regeneration Ltd Reserve
The Council has made a commercial loan of £11.5m to its wholly-owned subsidiary Norwich Regeneration Ltd (NRL). The company is using the loan to finance its house building at the Threescore site and the Council receives an income stream through the loan interest payments. The MTFS includes plans for significant future lending to the company. An earmarked reserve has been set up to smooth any fluctuations in net income received by the Council from the lending to NRL. It will provide a buffer in case the income is lower than anticipated due to the company not borrowing as much or as early from the council as planned (e.g. due to delays in construction).
Elections Reserve This is to provide future funding for council election costs which vary each year according to the differing local and national elections cycles.
Ba
lan
ce
at
31
Ma
rch
20
16
Tra
ns
fers
Ou
t
20
16
/17
Tra
ns
fers
In
20
16
/17
Ba
lan
ce
at
31
Ma
rch
20
17
Tra
ns
fers
Ou
t
20
17
/18
Tra
ns
fers
In
20
17
/18
Ba
lan
ce
at
31
Ma
rch
20
18
£'000 £'000 £'000 £'000 £'000 £'000 £'000
General Fund
Insurance Reserve 395 (265) 277 407 (133) 407 681
S31 Earmarked Reserve 1,467 (1,455) 1,041 1,053 (713) 1,825 2,165
Mousehold Conservators Reserve 5 - - 5 - 3 8
General Fund Invest to Save Reserve 117 (31) - 86 (75) 2,637 2,648
Revenue Grants Unapplied Reserve GF 1,943 (34) 233 2,142 (208) 138 2,072
Revenue Grants Unapplied Reserve HRA 4 - - 4 (4) - -
Commercial Property Earmarked Reserve - - - - - 123 123
Norwich Regeneration Ltd Earmarked
Reserve - - - - - 50 50
Elections Earmarked Reserve - - - - - 113 113
HRA Invest to Save Reserve - - - - - 500 500
Total 3,931 (1,785) 1,551 3,697 (1,133) 5,796 8,360
Transfers between other reserves of £279,500 (2016/17 £233,406) in the Movement in Reserves Statement comprise of Decent Home Loan & Home Improvement Loan repayments £172,314 (2016/17 £84,467) and repayment of discount £107,236 (2016/17 £48,652)

Norwich City Council - 2017-18 Statement of Accounts
70 70
70
70
11. Other Operating Expenditure
2017/18 2016/17
£'000 £'000
Payments to the Government Housing Capital Receipts Pool 1,114 1,471
(Gains)/Losses on the disposal of non-current assets (4,276) (367)
Provision Market (163) (129)
Livestock Market 35 (182)
Total (3,290) 793 The surplus of £0.128m (2016/17 surplus £0.311m) from Market trading (Provision and Livestock) is not allocated back to services but included in other operating expenditure above
12. Financing and Investment Income and Expenditure
2017/18 2016/17
£'000 £'000
Interest payable and similar charges 8,791 9,432
(Gains)/Losses on the disposal of investment property (265) -
Pension interest cost and expected return on pension assets 4,634 4,164
Interest Receivable and similar income (545) (1,353)Income and expenditure in relation to investment properties and
changes in their fair value (3,683) (1,279)
Other investment income (12) -
Impairment of Soft Loans 45 152
Total 8,965 11,116
13. Taxation and Non-Specific Grant Income
2017/18 2016/17
£'000 £'000
Council tax income (8,964) (8,658)
Non domestic rates income and expenditure (29,069) (31,068)
Non-ring fenced government grants (5,902) (7,263)
Capital grants and contributions (9,513) (7,120)
Business Rates - Tariff & Levy 25,027 26,253
Equity Transfer (Norwich Regeneration Ltd) - (2,200)
Total (28,421) (30,056)

Norwich City Council - 2017-18 Statement of Accounts
71
14. Property Plant and Equipment
Movements in 2017/18 Co
un
cil
Dw
ellin
gs
Oth
er
La
nd
an
d
Bu
ild
ing
s
Ve
hic
les
, P
lan
t,
Fu
rnit
ure
an
d
eq
uip
me
nt
Infr
as
tru
ctu
re
As
se
ts
Co
mm
un
ity
As
se
ts
Su
rplu
s A
ss
ets
As
se
ts U
nd
er
Co
ns
tru
cti
on
To
tal P
rop
ert
y,
Pla
nt
&
Eq
uip
me
nt
£'000 £'000 £'000 £'000 £'000 £'000 £'000 £'000
Cost or Valuation
At 1 April 2017 721,442 132,520 27,200 2,772 11,577 270 11,987 907,768
Additions 13,995 1,881 185 5 131 - 8,781 24,978
Revaluation increases /
(decreases) recognised
in the Revaluation
Reserve 4,216 6,423 - - - - - 10,639
Revaluation decreases
recognised in the
Surplus / (Deficit) on the
Provision of Services (2,074) (4,028) - - - - - (6,102)
Revaluation write back
of prior year deficit
recognised in the
Surplus / (Deficit) on the
Provision of Services 32,069 4,710 - - - - - 36,779
Derecognition –
Disposals (9,481) - (28) - - - - (9,509)
Derecognition - Other (278) - - - - - - (278)
Demolition - (16) - - - - - (16)
Assets Reclassified (to)
/ from Held for Sale (710) (74) - - - - - (784)
Other Movements in
Cost or Valuation 3,169 (161) - - - - (3,008) -
At 31 March 2018 762,348 141,255 27,357 2,777 11,708 270 17,760 963,475
Accumulated
Depreciation &
Impairment
At 1 April 2017 (4,831) (15,238) (23,247) (1,063) (100) (8) - (44,487)
Depreciation charge (13,473) (2,567) (773) (78) (8) (8) - (16,907)
Depreciation written out
to the Surplus/Deficit on
Provision of Services 12,507 2,605 - - - - - 15,112
Depreciation write-back
on revaluation to
Revaluation Reserve 965 2,369 - - - 8 - 3,342
Impairment losses /
(reversals) recognised
in CIES (193) 601 - - - - - 408
Impairment losses /
(reversals) recognised
in RR 1 473 - - - - - 474
Derecognition –
Disposals - - 28 - - - - 28
Derecognition - Other (2) 2 - - - - - -
At 31 March 2018 (5,026) (11,755) (23,992) (1,141) (108) (8) - (42,030)
Net Book Value
At 31 March 2018 757,322 129,500 3,365 1,636 11,600 262 17,760 921,445
At 31 March 2017 716,610 117,281 3,954 1,708 11,477 261 11,988 863,279

Norwich City Council - 2017-18 Statement of Accounts
72 72
72
72
Comparative
Movements in 2016/17 Co
un
cil
Dw
ellin
gs
Oth
er
La
nd
&
Bu
ild
ing
s
Ve
hic
les
, P
lan
t,
Fu
rnit
ure
&
eq
uip
me
nt
Infr
as
tru
ctu
re
As
se
ts
Co
mm
un
ity
As
se
ts
Su
rplu
s A
ss
ets
As
se
ts U
nd
er
Co
ns
tru
cti
on
To
tal P
rop
ert
y,
Pla
nt
&
Eq
uip
me
nt
£'000 £'000 £'000 £'000 £'000 £'000 £'000 £'000
Cost or Valuation
At 1 April 2016 710,559 126,232 27,063 2,816 11,447 328 19,135 897,580
Additions 18,960 1,764 197 45 130 - 6,185 27,281
Revaluation increases /
(decreases) recognised
in the Revaluation
Reserve (1,860) (73) - - - - - (1,933)
Revaluation decreases
recognised in the
Surplus / (Deficit) on the
Provision of Services (14,263) (1,672) - - - - - (15,935)
Revaluation write back
of prior year deficit
recognised in the
Surplus / (Deficit) on the
Provision of Services 11,424 2 - - - - - 11,426
Derecognition –
Disposals (7,993) - (241) - - - - (8,234)
Derecognition - Other (500) - - (89) - - - (589)
Demolition - - - - - - - -
Assets Reclassified (to)
/ from Held for Sale (715) (1,115) - - - - - (1,830)
Other Movements in
Cost or Valuation 5,829 7,381 181 - - (59) (13,332) -
At 31 March 2017 721,441 132,519 27,200 2,772 11,577 269 11,988 907,766
Accumulated
Depreciation &
Impairment
At 1 April 2016 (4,800) (11,675) (22,745) (989) (91) (8) - (40,308)
Depreciation charge (13,553) (2,762) (714) (79) (9) (8) - (17,125)
Depreciation written out
to the Surplus/Deficit on
Provision of Services 12,554 31 - - - - - 12,585
Depreciation write-back
on revaluation to
Revaluation Reserve 999 553 - - - 8 - 1,560
Impairment losses /
(reversals) recognised
in CIES (71) (1,446) - - - - - (1,517)
Impairment losses /
(reversals) recognised
in RR 40 - - - - - - 40
Derecognition –
Disposals - 32 242 - - - - 274
Derecognition - Other - 29 (29) 4 - - - 4
At 31 March 2017 (4,831) (15,238) (23,246) (1,064) (100) (8) - (44,487)
Net Book Value
At 31 March 2017 716,610 117,281 3,954 1,708 11,477 261 11,988 863,279
At 31 March 2016 705,757 114,556 4,318 1,827 11,356 322 19,135 857,271

Norwich City Council - 2017-18 Statement of Accounts
73
The Council operates a 5-year rolling programme of revaluations in relation to land and buildings except for revaluation of Housing Revenue Account Assets which is carried out on an annual basis. The assets are valued by our external valuers NPS. Current year valuations were carried out by: Gillian Knox MRICS (NPS) Deborah O’Shea MRICS (NPS) Grant Brewer MRICS (NPS)
HRA Dwellings The date of valuation is 31 March 2018. The valuers undertook a full revaluation at 31 March 2016. The valuations were undertaken in accordance with the RICS Valuation – Professional Standards 2012 as published by the Royal Institution of Chartered Surveyors. For each operational asset, that is, those held, occupied and used by the Council in the direct delivery of services for which the Council has either a statutory or a discretionary responsibility, a Current Value Existing Use Value (EUV) has been provided, except in the case of housing stock where Existing Use Value for Social Housing is appropriate (EUV-SH). EUV-SH assumes the property is let for its existing use as social housing. EUV-SH valuations are arrived at by means of a beacon approach. The beacons are valued on the additional assumptions that there is no potential residential redevelopment of the site or intensification of use. They are then adjusted by a regional adjustment factor, in this case for the Eastern region at 62% (2016/17 62%), to arrive at EUV-SH to reflect the fact that sitting tenants enjoy rents lower than market rents and tenants' rights including Right to Buy Any reference to Existing Use Value is not recognised under International Financial Reporting Standards and the use of Existing Use Value (Social Housing) is a departure from International Accounting Standards. This departure is in accordance with current CIPFA and DCLG guidance Under paragraph 4.1.2.40 of the Code, if an item of property comprises two or more significant components with substantially different useful lives, then each component is treated separately for depreciation purposes and depreciated over its individual lives. Due to the onerous amount of work that would be involved in componentising all the council dwellings, this has not been done. However for valuation purposes, the property used as the beacon in each beacon type, are fully upgraded. For all other dwellings in the beacon; a percentage reduction is made for each component that has not been upgraded. The percentage reduction is that advised by the Council’s valuers. The valuations are made on the following assumptions:
That no high alumina cement, asbestos, or other deleterious material was used in the construction of any property and that none has been subsequently incorporated.
That the properties are not subject to any unusual or especially onerous restrictions, encumbrances or outgoings and that good title can be shown.
That the properties and their values are unaffected by any matters which would be revealed by a local search or inspection of any register and that the use and occupation are both legal.
That inspection of those parts which have not been inspected would not cause us to alter our opinion of value.
That the land and properties are not contaminated, nor adversely affected by radon.
That no allowances have been made for any rights obligations or liabilities arising from the Defective Premises Act 1972.

Norwich City Council - 2017-18 Statement of Accounts
74 74
74
74
HRA Non-Dwellings The date of valuation is 31 March 2018. The valuers undertook a full revaluation at 31 March 2016. The valuations were undertaken in accordance with the RICS Valuation – Professional Standards 2012 as published by the Royal Institution of Chartered Surveyors. Apart from infrastructure, community and assets under construction, the basis of value for all assets is Current Value. Current value may be either the Existing Use Value, Depreciated replacement Cost or Fair Value depending on the property type and classification. EUV is used only for valuing property that is owner-occupied. Fair value is used to value property held as surplus assets or properties held for sale. In accordance with changes brought about by the HRA item 8 post- transition outcomes, Impairment and valuation losses not covered by revaluation reserve in relation to HRA non-dwellings can now be reversed in the same way as losses for dwellings. This is a change, as under transition any such losses for non-dwellings could not be reversed and therefore impacted on the HRA balance in full. As with dwellings, valuation gains for non-dwellings, where taken to the HRA income and expenditure statement, can also be reversed under the new Determination, again by a transfer to the CAA via the movement in reserves statement. Note that this change has been applied prospectively from 1 April 2017 only.
General Fund Assets The date of valuation is 1 April 2017. The Council carries out a rolling programme that ensures that all Property, Plant and equipment required to be measured at current value is revalued at least every five years. Valuations are carried out by the Council’s external valuers, NPS Norwich Ltd, in accordance with the methodologies and bases for estimation set out by the Royal Institution of Chartered surveyors. Apart from infrastructure, community and assets under construction, the basis of value for all assets is Current Value. Current value may be either the Existing Use Value, Depreciated replacement Cost or Fair Value depending on the property type and classification. EUV is used only for valuing property that is owner-occupied. Fair value is used to value property held for investment purposes, surplus assets or properties held for sale. The valuation cycle fluctuated due to asset reclassifications, disposals and additions and any additional revaluations which occur due to the portfolio review and impairment review.

Norwich City Council - 2017-18 Statement of Accounts
75
VALUATION CYCLE
;
'000s Co
un
cil
dw
ellin
gs
Oth
er
La
nd
&
Bu
ild
ing
s
Co
mm
un
ity
as
se
ts
Infr
as
tru
ctu
re
Ve
hic
les
,
Pla
nt,
&
Eq
uip
me
nt
AU
C
Su
rplu
s
pro
pe
rtie
s
To
tal P
PE
Valued at historical cost 11,600 1,636 3,365 17,760 34,361
Valued at current value -
2017-18 757,322 72,496 262 830,080
2016-17 8,098 8,098
2015-16 18,508 18,508
2014-15 4,078 4,078
2013-14 26,320 26,320
Total 757,322 129,500 11,600 1,636 3,365 17,760 262 921,445 Depreciation The following useful lives and depreciation rates have been used in the calculation of depreciation:
Council Dwellings – 35–50 years
Other Land and Buildings – 30–100 years
Vehicles – 25% of carrying amount
Plant Furniture & Equipment 3–25 years
Infrastructure – 25–40 years
15. Heritage Assets Reconciliation of the carrying value of the Heritage Assets held by the Council
Civic Plate
& Regalia
Paintings Sculptures
& Bronzes
Statues,
Fountain
etc
Buildings Total
Heritage
Assets
Valuation
1st April 2016 8,066 4,675 2,235 2,287 3,405 20,668
Additions 7 - - - - 7
Disposals - - (5) (5) - (10)
Revaluations 5 - 4,700 155 - 4,860
31st March 2017 8,078 4,675 6,930 2,437 3,405 25,525
Valuation
1st April 2017 8,078 4,675 6,930 2,437 3,405 25,525
Additions - - - - - -
Disposals - - - - - -
Revaluations - - - 20 - 20
31st March 2018 8,078 4,675 6,930 2,457 3,405 25,545 The Council’s external valuer (Christopher Hartop) carried out a full valuation of the collection of civic plate and regalia as at 31 January 2014. The valuations were based on commercial markets, including recent transaction information from auctions where similar types of silverware are regularly being purchased. There are two particularly significant exhibits within the collection which are:
The Reade Salt - A rare and important Elizabeth I silver-gilt standing or drum salt (William Cobbold I 1568), valued by our external valuers as £2.5m
The Howard Ewer and Basin - An early 17th century silver-gilt ewer and basin or rosewater dish (1617), valued by our external valuers as £2.0m

Norwich City Council - 2017-18 Statement of Accounts
76 76
76
76
At any time approximately 50 percent of the collection of regalia and civic plate are on display in Shirehall museum, 34 percent in the Castle Museum and 15 percent in public meeting rooms at City Hall. The Council’s external valuer (Bonhams Fine Art Valuer and Auctioneers) carried out a full valuation of the collection of paintings, sculptures, bronzes, statues, plaques, fountains, memorials etc as at 31 March 2012. In accordance with the accounting code a full valuation every five years is not required as there is no prescribed minimum period between valuations however, the code includes a requirement that authorities review the carrying amounts of these heritage assets carried at valuation with sufficient regularity to ensure they remain current.
In 2016-17 a review of the valuations was carried out by Bonhams who advised that the only piece that would need updating at this stage would be the Barbara Hepworth which was last valued at £1.3m. The Modern British Art specialists have provided an up-to-date auction estimate of £3.0m - £5.0m and for insurance suggested £6.0m. A particularly significant exhibit within the collection is the portrait of Sir Harbord Harbord by Gainsborough. The portrait has been valued by an external valuer at £2.5m. At any time approximately 17 percent of the collection of paintings are on display in the Castle Museum, 19 percent in Blackfriars Hall, 10 percent in public meeting rooms at City Hall, 9 percent in St Andrews Hall and 5 percent in Strangers Hall. The remaining items are held in storage but access is permitted to scholars and others for research purposes. The Heritage buildings valuations have been reviewed by NPS who advised that no revaluations were required In 2017/18 a review of the specialist valuation for the Gurney Clock was completed by Michlmayr Clock and Watchmakers Ltd. As a result of this the valuation is now £490k.
16. Investment Properties The following items of income and expense have been accounted for in the Financing and Investment Income and Expenditure line in the Comprehensive Income and Expenditure Statement
2017/18 2016/17
£000 £000
Rental income from investment property (2,503) (2,508)
Direct operating expenses arising from investment
property (1,180) 1,229
Total (3,683) (1,279)
There are no restrictions on the Authority’s ability to realise the value inherent in its investment property or on the Authority’s right to the remittance of income and the proceeds of disposal. The Authority has no contractual obligations to purchase, construct or develop investment property or repairs, maintenance or enhancement. The following table summarises the movement in the fair value of investment properties over the year:
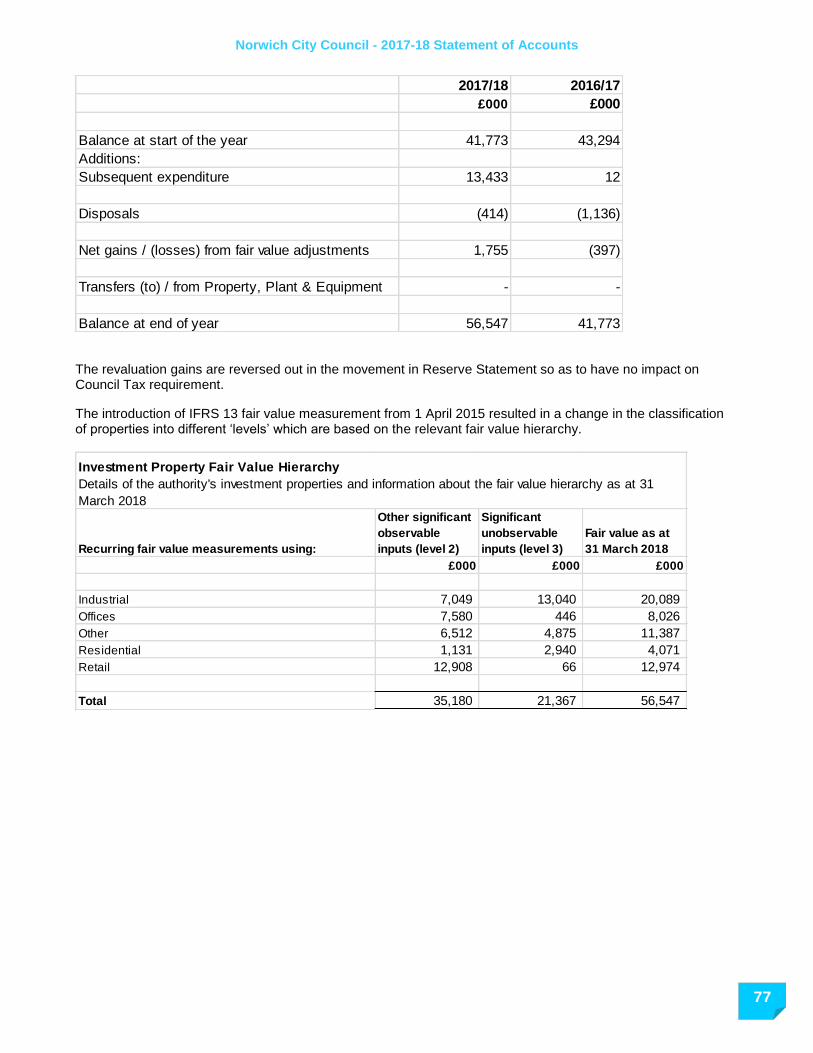
Norwich City Council - 2017-18 Statement of Accounts
77
2017/18 2016/17
£000 £000
Balance at start of the year 41,773 43,294
Additions:
Subsequent expenditure 13,433 12
Disposals (414) (1,136)
Net gains / (losses) from fair value adjustments 1,755 (397)
Transfers (to) / from Property, Plant & Equipment - -
Balance at end of year 56,547 41,773
The revaluation gains are reversed out in the movement in Reserve Statement so as to have no impact on Council Tax requirement.
The introduction of IFRS 13 fair value measurement from 1 April 2015 resulted in a change in the classification of properties into different ‘levels’ which are based on the relevant fair value hierarchy.
Recurring fair value measurements using:
Other significant
observable
inputs (level 2)
Significant
unobservable
inputs (level 3)
Fair value as at
31 March 2018
£000 £000 £000
Industrial 7,049 13,040 20,089
Offices 7,580 446 8,026
Other 6,512 4,875 11,387
Residential 1,131 2,940 4,071
Retail 12,908 66 12,974
Total 35,180 21,367 56,547
Investment Property Fair Value Hierarchy
Details of the authority's investment properties and information about the fair value hierarchy as at 31
March 2018

Norwich City Council - 2017-18 Statement of Accounts
78 78
78
78
Recurring fair value measurements using:
Other significant
observable
inputs (level 2)
Significant
unobservable
inputs (level 3)
Fair value as at
31 March 2017
£000 £000 £000
Industrial 3,010 12,552 15,562
Offices 7,680 544 8,224
Other 4,351 3,900 8,251
Residential 898 2,940 3,838
Retail 5,832 66 5,898
Total 21,771 20,002 41,773
Investment Property Fair Value Hierarchy
Details of the authority's investment properties and information about the fair value hierarchy as at 31
March 2017
There were no transfers between Levels 1 and 2 during the year
Valuation techniques used to determine Level 2 and 3 Fair values for Investment Properties Valuation techniques used to determine Level 2 fair values for Investment Properties The fair value of Level 2 investment property has been measured using a market approach, which takes into account comparable evidence for similar transactions, for similar properties in similar locations, with yields chosen by comparison to similar transactions adjusted to allow for factors such as lease terms, strength of covenant, rent review periods and other lease clauses, voids, etc. There are significant observable inputs, including physical inspection of location, size, accommodation, facilities, suitability etc. detailed lease terms, strength of covenant, general repair and condition together with yield evidence from comparable transactions. Valuation techniques used to determine Level 3 fair values for Investment Properties The fair value of level 3 investment property, valuations have been based on comparable transactions to calculate gross development costs and gross development values to arrive at a residual land value. The following factors have been also been taken into account: location and topography, title and legal constraints, planning advice, access and ground conditions. The authority’s Investment properties categorised as Level 3 in the fair value hierarchy due to the fact that the measurement technique uses significant unobservable inputs to determine the fair value measurements (and there is no reasonably available information that indicates that market participants would use different assumptions).
Highest and Best use of Investment Properties In estimating the fair value of the Authority’s investment properties, the highest and best use of the properties is deemed to be their current use. Valuation Techniques There has been no change in the valuation techniques used during the year for investment properties.

Norwich City Council - 2017-18 Statement of Accounts
79
Reconciliation of fair value measurements (using significant observable inputs) categorised within Level 2 of the fair value hierarchy
Industrial Offices Other Residential Retail Total
Investment Properties Level 2 £000 £000 £000 £000 £000 £000
Opening balance 3,010 7,680 4,352 898 5,832 21,772
Transfer between disclosure category - - - 69 (69) -
Transfers into Level 2 - - - - - -
Transfers out of Level 2 - - (62) - - (62)
Total gains or (losses ) for the period included in
surplus or deficit on the provision of services
resulting from changes in the fair value 142 (36) (123) 164 - 147
Additions 3,897 - 2,345 - 7,186 13,428
Disposals - (64) - - (41) (105)
Balance at end of year 7,049 7,580 6,512 1,131 12,908 35,180
2017/18
Industrial Offices Other Residential Retail Total
Investment Properties Level 2 £000 £000 £000 £000 £000 £000
Opening balance 3,298 7,565 4,223 1,290 5,996 22,372
Transfer between disclosure category - - 182 - (182) -
Transfers into Level 2 - - - - - -
Transfers out of Level 2 (285) - - - - (285)
Total gains or (losses ) for the period included in
surplus or deficit on the provision of services
resulting from changes in the fair value (4) 199 (53) - 18 160
Additions - - - - -
Disposals - (84) - (392) - (476)
Balance at end of year 3,009 7,680 4,352 898 5,832 21,771
2016/17
Gains or losses arising from changes in the fair value of the investment property are recognised in surplus or deficit on the provision of services – financing and investment income and expenditure line. The transfers out of level 2 were due to new lettings being agreed.
Reconciliation of fair value measurements (using significant unobservable inputs) categorised within Level 3 of the fair value hierarchy
Industrial Offices Other Residential Retail Total
Investment Properties Level 3 £000 £000 £000 £000 £000 £000
Opening balance 12,553 544 3,900 2,940 66 20,003
Transfer between disclosure category - - - - - -
Transfers into Level 3 - - 62 - - 62
Transfers out of Level 3 - - - - - -
Total gains or (losses ) for the period included in
surplus or deficit on the provision of services
resulting from changes in the fair value 483 - 1,124 - - 1,607
Additions 4 - - - - 4
Disposals - (98) (211) - - (309)
Balance at end of year 13,040 446 4,875 2,940 66 21,367
2017/18
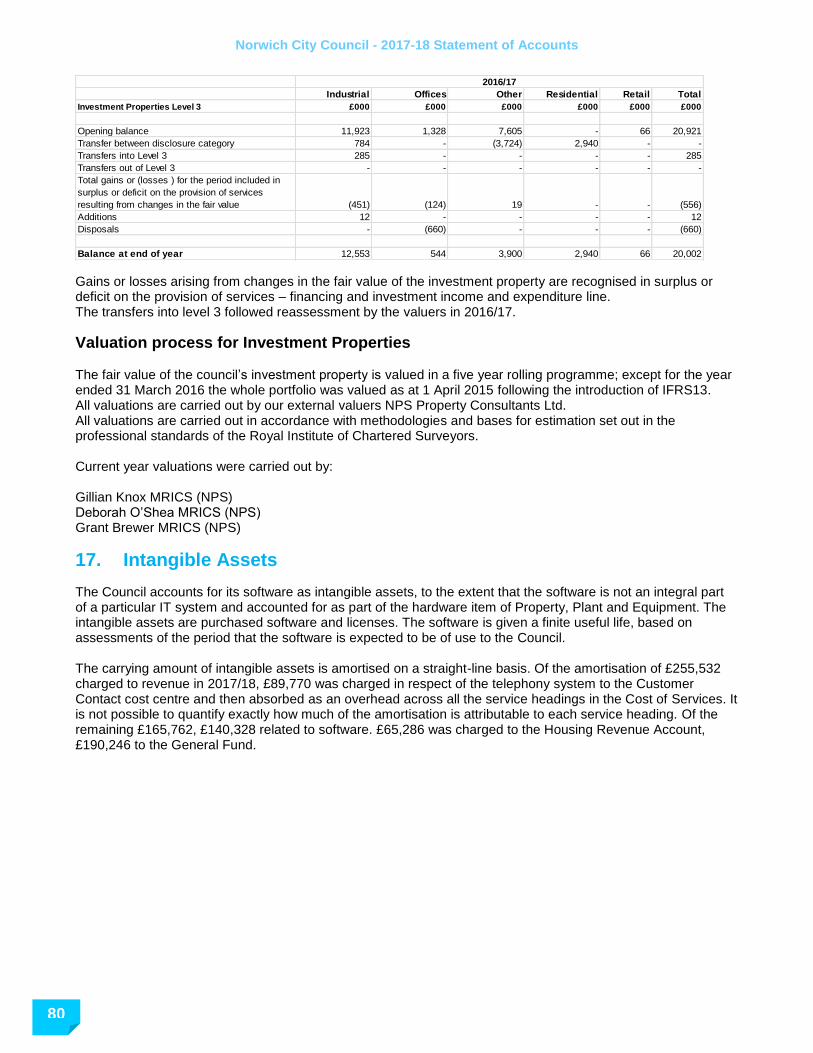
Norwich City Council - 2017-18 Statement of Accounts
80 80
80
80
Industrial Offices Other Residential Retail Total
Investment Properties Level 3 £000 £000 £000 £000 £000 £000
Opening balance 11,923 1,328 7,605 - 66 20,921
Transfer between disclosure category 784 - (3,724) 2,940 - -
Transfers into Level 3 285 - - - - 285
Transfers out of Level 3 - - - - - -
Total gains or (losses ) for the period included in
surplus or deficit on the provision of services
resulting from changes in the fair value (451) (124) 19 - - (556)
Additions 12 - - - - 12
Disposals - (660) - - - (660)
Balance at end of year 12,553 544 3,900 2,940 66 20,002
2016/17
Gains or losses arising from changes in the fair value of the investment property are recognised in surplus or deficit on the provision of services – financing and investment income and expenditure line. The transfers into level 3 followed reassessment by the valuers in 2016/17.
Valuation process for Investment Properties The fair value of the council’s investment property is valued in a five year rolling programme; except for the year ended 31 March 2016 the whole portfolio was valued as at 1 April 2015 following the introduction of IFRS13. All valuations are carried out by our external valuers NPS Property Consultants Ltd. All valuations are carried out in accordance with methodologies and bases for estimation set out in the professional standards of the Royal Institute of Chartered Surveyors. Current year valuations were carried out by: Gillian Knox MRICS (NPS) Deborah O’Shea MRICS (NPS) Grant Brewer MRICS (NPS)
17. Intangible Assets
The Council accounts for its software as intangible assets, to the extent that the software is not an integral part of a particular IT system and accounted for as part of the hardware item of Property, Plant and Equipment. The intangible assets are purchased software and licenses. The software is given a finite useful life, based on assessments of the period that the software is expected to be of use to the Council. The carrying amount of intangible assets is amortised on a straight-line basis. Of the amortisation of £255,532 charged to revenue in 2017/18, £89,770 was charged in respect of the telephony system to the Customer Contact cost centre and then absorbed as an overhead across all the service headings in the Cost of Services. It is not possible to quantify exactly how much of the amortisation is attributable to each service heading. Of the remaining £165,762, £140,328 related to software. £65,286 was charged to the Housing Revenue Account, £190,246 to the General Fund.

Norwich City Council - 2017-18 Statement of Accounts
81
The movement on Intangible Asset balances during the year is as follows:
2017/18 2016/17
£000 £000
553 776
305 27
(77) -
(255) (250)
77 -
603 553
1,707 1,479
(1,104) (926)
603 553
Comprising:
· Gross carrying amount
· Accumulated amortisation
· Additions
· Disposals
Disposals
Net Carrying amounts at the end of the year
Amortisation for the period
Balance at the start of the year
· Net carrying amount

Norwich City Council - 2017-18 Statement of Accounts
82 82
82
82
18. Financial Instruments
The borrowings and investments disclosed in the Balance Sheet are made up of the following categories of financial instruments:
31-Mar-18 31-Mar-17 31-Mar-18 31-Mar-17
£000 £000 £000 £000
Financial Liabilities (principal
amount) 199,902 201,617 2,000 7,000
Accrued interest - - 866 993
Other accounting adjustments 285 287 - -
Financial liabilities at amortised cost 200,187 201,904 2,866 7,993
Total Borrowings 200,187 201,904 2,866 7,993
Finance lease liabilities 1,003 1,099 96 90
Other long term liabilities 1,003 1,099 96 90
Financial liabilities carried at
contract amount - - 16,092 22,096
Total creditors 201,190 203,003 19,054 30,179
Loans and receivables - - 50,670 73,560
Accrued interest - - 109 315
Total Loans and receivables
(principal amount) - - 50,779 73,875
Unquoted equity investment at cost 824 824 - -
Loans & receivables at amortised
costs 824 824 50,779 73,875
NPT,HIL & DHL 3,099 3,146 - -
Finance Leases 1,268 1,256 18 18
Total Investments 5,191 5,226 50,797 73,893
Financial assets carried at contract
amounts - - 7,354 3,832
Total Debtors 5,191 5,226 58,151 77,725
Soft Loans Provided 2,955 3,128
Long Term Current
Financial assets carried at contract amount exclude statutory amounts, for example Council Tax Payers and Trade Creditors exclude receipts in advance as these are not classified as financial instruments.

Norwich City Council - 2017-18 Statement of Accounts
83
The reduction of £22.9m in short term loans and receivables is due to the temporary use of cash to fund capital expenditure. This will be replaced when borrowing is taken at some point in the future. The Council has made a number of loans to residents in respect of decent home loans and home improvement loans at less than market rates (soft loans). There are a number of small loans making up the balance owing of £2.956m. When soft loans are made, a loss is recorded in the Comprehensive Income and Expenditure Statement (debited to the appropriate service) for the present value of the interest that will be foregone over the life of the instrument, resulting in a lower amortised cost than the outstanding principal. Interest is credited at a marginally higher effective rate of interest than the rate receivable from the voluntary organisations, with the difference serving to increase the amortised cost of the loan in the Balance Sheet. Statutory provisions require that the impact of soft loans on the General Fund Balance is the interest receivable for the financial year – the reconciliation of amounts debited and credited to the Comprehensive Income and Expenditure Statement to the net gain required against the General Fund Balance is managed by a transfer to or from the Financial Instruments Adjustment Account. The detailed decent home loans information is as follows:
31-Mar-18 31-Mar-17
£000 £000
2,768 2,448
(356) 400
(172) (80)
2,240 2,768
2,710 2,882
Fair value adjustment
Loans repaid
Balance carried forward
Nominal value carried forward
Decent Home Loans
Opening Balance
The home improvement loans carrying value after fair value adjustments (minus £43k) total £203k.
Valuation Assumptions The interest rate at which the fair value of this soft loan has been made is arrived at by taking the authority’s prevailing cost of borrowing (5 percent) and adding an allowance for the risk that the loan might not be repaid, in this case a zero rate. The loans are held as a land charge on the properties.

Norwich City Council - 2017-18 Statement of Accounts
84 84
84
84
The gains and losses recognised in the Comprehensive Income and Expenditure Statement in relation to financial instruments are made up as follows:
Total
£000 £000 £000 £000
Interest expense 8,791 - - 8,791
Reductions in fair value - - - -
Total expenses in Surplus or Deficit
on the Provision of Services 8,791 - - 8,791
Interest Income - (545) - (545)
Increases in fair value -
Total income in Surplus or Deficit on
the Provision of Services - (545) - (545)
Net (gain)/loss for the year 8,791 (545) - 8,246
Total
£000 £000 £000 £000
Interest expense 9,432 - - 9,432
Reductions in fair value - - - -
Total expenses in Surplus or Deficit
on the Provision of Services 9,432 - - 9,432
Interest Income - (1,353) - (1,353)
Increases in fair value - - - -
Total income in Surplus or Deficit on
the Provision of Services - (1,353) - (1,353)
Net (gain)/loss for the year 9,432 (1,353) - 8,079
Financial Liabilities
measured at
amortised cost
Financial Assets
Loans and
receivables
Assets &
Liabilities at Fair
Value through
Profit & Loss
2017/18
Financial Liabilities
measured at
amortised cost
Financial Assets
Loans and
receivables
Assets &
Liabilities at Fair
Value through
Profit & Loss
2016/17
The fair value of trade and other receivables is taken to be the invoiced, billed amount or cost, less any bad debt provision. The fair values calculated are as follows:
Fair Values of Assets and Liabilities Financial liabilities and financial assets represented by loans and receivables are carried in the Balance Sheet at amortised cost. Their fair value has been assessed by calculating the present value of the cash flows that will take place over the remaining term of the instruments, using the following assumptions:
For loans from the PWLB, equivalent borrowing rates available from the PWLB at 31 March 2018 have been applied to provide the fair value under the PWLB debt redemption procedures,
For non PWLB loans and loans receivable prevailing benchmark market rates have been used to provide the fair value
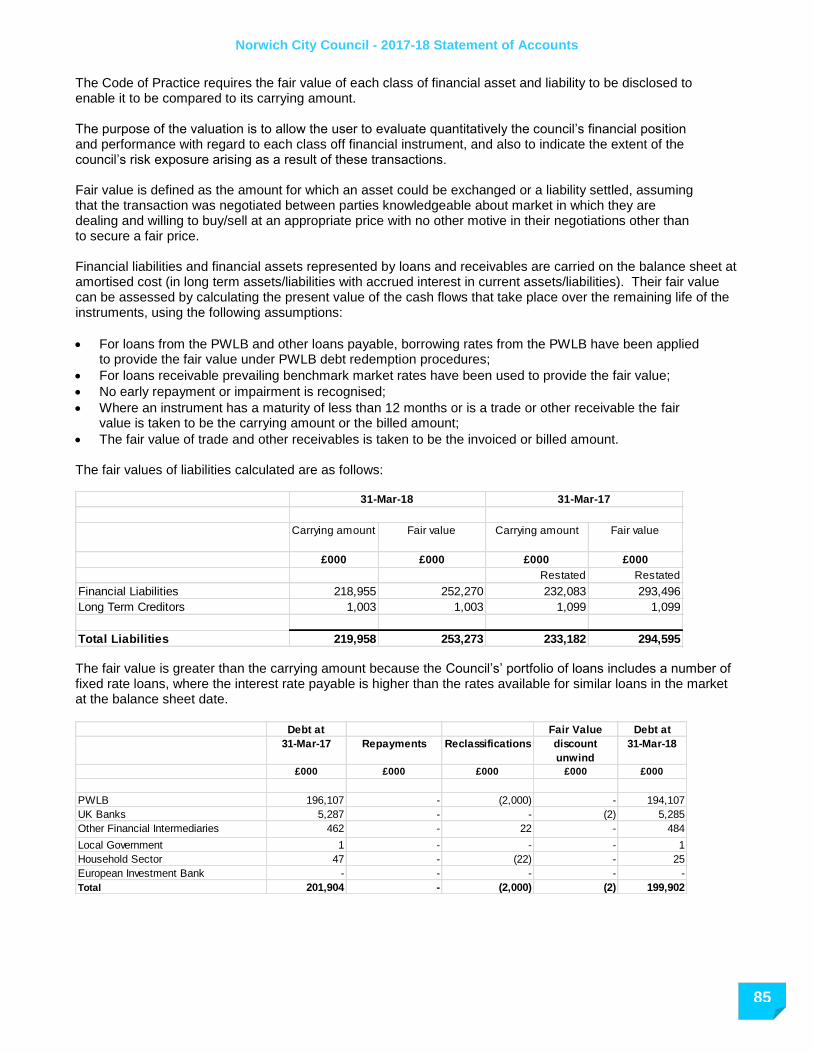
Norwich City Council - 2017-18 Statement of Accounts
85
The Code of Practice requires the fair value of each class of financial asset and liability to be disclosed to enable it to be compared to its carrying amount. The purpose of the valuation is to allow the user to evaluate quantitatively the council’s financial position and performance with regard to each class off financial instrument, and also to indicate the extent of the council’s risk exposure arising as a result of these transactions. Fair value is defined as the amount for which an asset could be exchanged or a liability settled, assuming that the transaction was negotiated between parties knowledgeable about market in which they are dealing and willing to buy/sell at an appropriate price with no other motive in their negotiations other than to secure a fair price. Financial liabilities and financial assets represented by loans and receivables are carried on the balance sheet at amortised cost (in long term assets/liabilities with accrued interest in current assets/liabilities). Their fair value can be assessed by calculating the present value of the cash flows that take place over the remaining life of the instruments, using the following assumptions:
For loans from the PWLB and other loans payable, borrowing rates from the PWLB have been applied to provide the fair value under PWLB debt redemption procedures;
For loans receivable prevailing benchmark market rates have been used to provide the fair value;
No early repayment or impairment is recognised;
Where an instrument has a maturity of less than 12 months or is a trade or other receivable the fair value is taken to be the carrying amount or the billed amount;
The fair value of trade and other receivables is taken to be the invoiced or billed amount. The fair values of liabilities calculated are as follows:
Carrying amount Fair value Carrying amount Fair value
£000 £000 £000 £000
Restated Restated
Financial Liabilities 218,955 252,270 232,083 293,496
Long Term Creditors 1,003 1,003 1,099 1,099
Total Liabilities 219,958 253,273 233,182 294,595
31-Mar-18 31-Mar-17
The fair value is greater than the carrying amount because the Council’s’ portfolio of loans includes a number of fixed rate loans, where the interest rate payable is higher than the rates available for similar loans in the market at the balance sheet date.
Debt at Fair Value Debt at
31-Mar-17 Repayments Reclassifications discount
unwind
31-Mar-18
£000 £000 £000 £000 £000
PWLB 196,107 - (2,000) - 194,107
UK Banks 5,287 - - (2) 5,285
Other Financial Intermediaries 462 - 22 - 484
Local Government 1 - - - 1
Household Sector 47 - (22) - 25
European Investment Bank - - - - -
Total 201,904 - (2,000) (2) 199,902

Norwich City Council - 2017-18 Statement of Accounts
86 86
86
86
The fair values of assets calculated are
as follows:
Carrying amount Fair value Carrying amount Fair value
£000 £000 £000 £000
Loans & Receivables 31,178 31,178 60,056 60,471
Long Term Debtors 3,916 3,403 4,491 4,256
Total Assets 35,094 34,581 64,547 64,727
31-Mar-18 31-Mar-17
The differences are attributable to fixed interest instruments receivable being held by the authority whose interest rate is higher than the prevailing rate estimated to be available at 31 March. This increases the fair value of loans and receivables. The fair values for loans and receivables have been determined by reference to similar practices, as above, which provide a reasonable approximation for the fair value of a financial instrument and includes accrued interest. The comparator market rates prevailing have been taken from indicative investment rates at each balance sheet date. In practice rates will be determined by the size of the transaction and the counterparty, but it is impractical to use these figures, and the difference is likely to be immaterial.
Nature & Extent of Risks Arising from Financial Instruments The Council’s activities expose it to a variety of financial risks:
credit risk – the possibility that other parties might fail to pay amounts due to the Council
liquidity risk – the possibility that the Council might not have funds available to meet its commitments to make payments
re-financing risk – the possibility that the Council might be requiring to renew a financial instrument on maturity at disadvantageous interest rates or terms.
market risk – the possibility that financial loss might arise for the Council as a result of changes in such measures as interest rates and stock market movements.
Overall procedures for managing risk
The Council’s overall risk management programme focuses on the unpredictability of financial markets and implementing restrictions to minimise these risks. The procedures for risk management are set out through a legal framework in the Local Government Act 2003 and the associated regulations. These require the Council to comply with the CIPFA Prudential Code, the CIPFA Treasury Management in the Public Services Code of Practice and Investment Guidance issued through the Act. Overall these procedures require the Council to manage risk in the following ways:
by formally adopting the requirements of the Code of Practice;
by the adoption of a Treasury Policy Statement and treasury management clauses within its financial regulations
by approving annually in advance prudential and treasury indicators for the following three years limiting: o The Council’s overall borrowing; o Its maximum and minimum exposures to fixed and variable rates; o Its maximum and minimum for exposures the maturity structure of its debt; o Its maximum annual exposures to investments maturing beyond a year.
by approving an investment strategy for the forthcoming year setting out its criteria for both investing and selecting investment counterparties in compliance with the Government Guidance;
These are required to be reported and approved at or before the Council’s annual Council Tax setting budget or before the start of the year to which they relate. These items are reported with the annual treasury management strategy which outlines the detailed approach to managing risk in relation to the Council’s financial instrument exposure. Actual performance is also reported at annually to Members.

Norwich City Council - 2017-18 Statement of Accounts
87
The annual treasury management strategy which incorporates the prudential indicators was approved by Council on 21 February 2017 and then a revised strategy was approved by Council on 23 January 2018. Both versions are available on the Council website. The key issues within the strategy were:
The Authorised Limit for 2017/18 was set at £291.6m. This is the maximum limit of external borrowings or other long term liabilities.
The Operational Boundary was expected to be £271.6m. This is the expected level of debt and other long term liabilities during the year.
The maximum amounts of fixed and variable interest rate exposure were set at 100% and 20% based on the Council’s net debt.
The maximum and minimum exposures to the maturity structure of debt are shown within this note. These policies are implemented by a central treasury team. The Council maintains written principles for overall risk management, as well as written policies covering specific areas, such as interest rate risk, credit risk, and the investment of surplus cash through Treasury Management Practices (TMPs). These TMPs are a requirement of the Code of Practice and are reviewed periodically.
Credit risk
Credit risk arises from deposits with banks and financial institutions, as well as credit exposures to the Council’s customers. This risk is minimised through the Annual Investment Strategy (which is contained in the Council’s Treasury Management Strategy), which requires that deposits are not made with financial institutions unless they meet identified minimum credit criteria, in accordance with the Fitch, Moody’s and Standard and Poors Credit Ratings Services. The Annual Investment Strategy also considers maximum amounts and time limits in respect of each financial institution. Deposits are not made with banks and financial institutions unless they meet the minimum requirements of the investment criteria outlined above. Additional selection criteria are also applied after this initial criterion is applied. The key areas of the Investment Strategy are that the minimum criteria for investment counterparties include:
Credit ratings of Short Term of F1, Long Term A, Support C and Individual 3 (Fitch or equivalent rating), with the lowest available rating being applied to the criteria.
UK institutions provided with support from the UK Government;
Building societies with assets in excess of £2bn The full Treasury Management Strategy for 2017/18 was approved by Full Council on 21 February 2017 and is available on the Council’s website. https://www.norwich.gov.uk/info/20189/finance_and_transparency/1601/treasury_management_strategy Commercial Tenants are assessed, taking into account their financial position, past experience via trade and bank references, if these are not available then rent deposits may be requested or a guarantor required. Heads of Terms state rent liability and commitments in accordance with parameters set by Norwich City Council.
Norwich City Council has debentures, unquoted equity investments and loans to related parties where there is no observable market or historical experience of default and has assessed the credit risk as nil. The following analysis summarises the Council’s maximum exposure to credit risk.
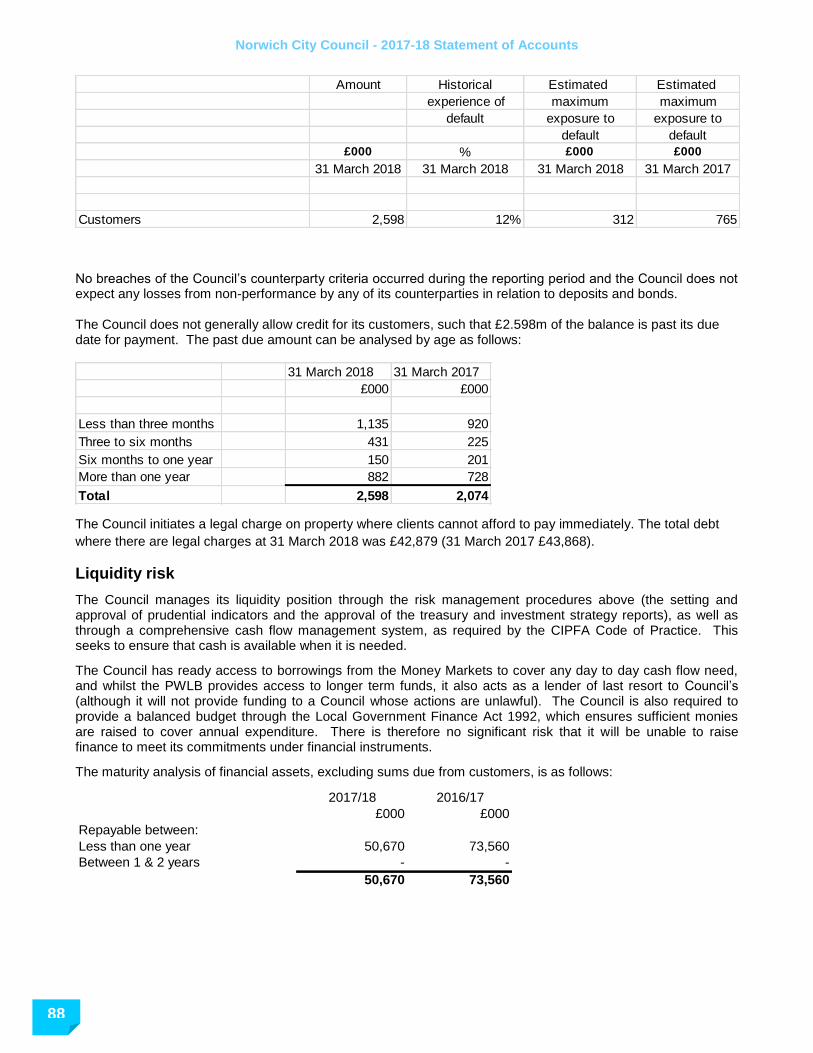
Norwich City Council - 2017-18 Statement of Accounts
88 88
88
88
Amount Historical Estimated Estimated
experience of maximum maximum
default exposure to exposure to
default default
£000 % £000 £000
31 March 2018 31 March 2018 31 March 2018 31 March 2017
Customers 2,598 12% 312 765
No breaches of the Council’s counterparty criteria occurred during the reporting period and the Council does not expect any losses from non-performance by any of its counterparties in relation to deposits and bonds. The Council does not generally allow credit for its customers, such that £2.598m of the balance is past its due date for payment. The past due amount can be analysed by age as follows:
31 March 2018 31 March 2017
£000 £000
Less than three months 1,135 920
Three to six months 431 225
Six months to one year 150 201
More than one year 882 728
Total 2,598 2,074
The Council initiates a legal charge on property where clients cannot afford to pay immediately. The total debt
where there are legal charges at 31 March 2018 was £42,879 (31 March 2017 £43,868).
Liquidity risk
The Council manages its liquidity position through the risk management procedures above (the setting and approval of prudential indicators and the approval of the treasury and investment strategy reports), as well as through a comprehensive cash flow management system, as required by the CIPFA Code of Practice. This seeks to ensure that cash is available when it is needed.
The Council has ready access to borrowings from the Money Markets to cover any day to day cash flow need, and whilst the PWLB provides access to longer term funds, it also acts as a lender of last resort to Council’s (although it will not provide funding to a Council whose actions are unlawful). The Council is also required to provide a balanced budget through the Local Government Finance Act 1992, which ensures sufficient monies are raised to cover annual expenditure. There is therefore no significant risk that it will be unable to raise finance to meet its commitments under financial instruments.
The maturity analysis of financial assets, excluding sums due from customers, is as follows:
2017/18 2016/17
£000 £000
Repayable between:
Less than one year 50,670 73,560
Between 1 & 2 years - -
50,670 73,560

Norwich City Council - 2017-18 Statement of Accounts
89
Refinancing & Maturity Risk
The Council maintains a significant debt and investment portfolio. Whilst the cash flow procedures above are considered against the refinancing risk procedures, longer term risk to the Council relates to managing the exposure to replacing financial instruments as they mature. This risk relates to both the maturing of longer term financial liabilities and longer term financial assets.
The approved treasury indicator limits for the maturity structure of debt and the limits placed on investments placed for greater than one year in duration are the key parameters used to address this risk. The Council approved treasury and investment strategies address the main risks and the central treasury team address the operational risks within the approved parameters. This includes:
monitoring the maturity profile of financial liabilities and amending the profile through either new borrowing or the rescheduling of the existing debt; and
monitoring the maturity profile of investments to ensure sufficient liquidity is available for the Council’s day to day cash flow needs, and the spread of longer term investments provide stability of maturities and returns in relation to the longer term cash flow needs.
The maturity analysis of financial liabilities is as follows, with the maximum and minimum limits for fixed interest rates maturing in each period (approved by Council in the Treasury Management Strategy):
Approved Approved Actual Actual
Minimum Maximum 31 March 2018 31 March 2017
Limit Limit £000 £000
Less than 1 year 0% 10% 2,866 7,993
Between 1 & 2 years 0% 10% - 2,000
Between 2 & 5 years 0% 30% 53,459 2,500
Between 5 & 10 years 0% 50% 69,700 118,159
More than 10 years 0% 95% 75,948 78,448
201,973 209,100
Perpetually
irredeemable Loan 0% 10% 510 573
Stock
202,483 209,673
Market risk Interest rate risk The Council is exposed to interest rate movements on its borrowings and investments. Movements in interest rates have a complex impact on the Council, depending on how variable and fixed interest rates move across differing financial instrument periods. For instance, a rise in variable and fixed interest rates would have the following effects:
borrowings at variable rates – the interest expense charged to the Income and Expenditure Account will rise;
borrowings at fixed rates – the fair value of the borrowing will fall (no impact on revenue balances);
investments at variable rates – the interest income credited to the Income and Expenditure Account will rise; and
investments at fixed rates – the fair value of the assets will fall (no impact on revenue balances).

Norwich City Council - 2017-18 Statement of Accounts
90 90
90
90
Borrowings are not carried at fair value on the balance sheet, so nominal gains and losses on fixed rate borrowings would not impact on the Surplus or Deficit on the Provision of Services or Other Comprehensive Income and Expenditure. However, changes in interest payable and receivable on variable rate borrowings and investments will be posted to the Surplus or Deficit on the Provision of Services and affect the General Fund Balance, subject to influences from Government grants (i.e. HRA). Movements in the fair value of fixed rate investments that have a quoted market price will be reflected in the Other Comprehensive Income and Expenditure Statement
The Council has a number of strategies for managing interest rate risk. The Annual Treasury Management Strategy draws together Council’s prudential and treasury indicators and its expected treasury operations, including an expectation of interest rate movements. From this Strategy a treasury indicator is set which provides maximum limits for fixed and variable interest rate exposure. The central treasury team will monitor market and forecast interest rates within the year to adjust exposures appropriately. For instance during periods of falling interest rates, and where economic circumstances make it favourable, fixed rate investments may be taken for longer periods to secure better long term returns, similarly the drawing of longer term fixed rates borrowing would be postponed.
If all interest rates had been 1% higher (with all other variables held constant) the financial effect would be:
The impact of a 1% fall in interest rates on interest receivable would be £ (493)k – where the fall of 1% would take the interest lower than zero, this interest received has been taken as zero. The impact of a 1% fall in interest rates on the fair value of fixed rate borrowing liabilities would be as above, but with the movement being reversed. Indemnity In February 2014 the Council advanced £1m to Lloyds Banking Group as part of the Local Authority Mortgage Scheme (LAMS). LAMS is aimed at first time buyers within the district and the advance reflects the Council’s share of financial assistance through the provision of an indemnity. This indemnity will be in place for a fixed five year period, at which point the advance will be returned to the Council plus an amount of interest. As at 31 March 2018, the total commitment against the £1m indemnity is £0.938m. There have been no defaults requiring a call on this indemnity to date.
Price risk
The Council, excluding the pension fund, does not generally invest in equity shares or marketable bonds. However it does have shareholdings to the value of £0.8m in Norwich Airport. Whilst these holding are generally illiquid, the Council is exposed to losses arising from movements in the price of the shares.
As the shareholdings have arisen in the acquisition of specific interests, the Council is not in a position to limit its exposure to price movements by diversifying its portfolio. Instead it only acquires shareholdings in return for “open book” arrangements with the company concerned so that the Council can monitor factors that might cause a fall in the value of specific shareholdings.
Foreign exchange risk The Council has no financial assets or liabilities denominated in foreign currencies at the balance sheet date. It therefore has no exposure to loss arising from movements in exchange rates.
£000s Increase in interest payable on variable rate borrowings (all Norwich City Council borrowing is at fixed rate)
-
Increase in interest receivable on variable rate investments 800 Impact on Surplus or Deficit on Provision of Services 800 Decrease in fair value of fixed rate borrowings liabilities (no impact CIES)
(16,927)

Norwich City Council - 2017-18 Statement of Accounts
91
19. Long Term Investments
2017/18 2016/17
£000 £000
Banks - -
Equity Shareholding in Subsidiary 2,200 2,200
Norwich Airport Ltd 824 824
Norwich Preservation Trust - 18
3,024 3,042
Equity Shareholding in Subsidiary In October 2016 the council disposed of land at Bowthorpe to its wholly owned subsidiary Norwich Regeneration Limited in exchange for 22,000 £100 shares in the company.
Norwich Airport Ltd As part of a Public Private Partnership Agreement, 80.1% of the shares held in Norwich Airport Ltd (NAL) by Norfolk County Council and Norwich City Council were sold in March 2004 to Omniport Ltd., thereby taking NAL out of local Council control. The remaining shares are held by the City Council (6%), the County Council (9%) and a jointly owned Local Authority company, Legislator 1656 (4.9%). A second jointly owned Local Authority Company - Legislator 1657, a wholly owned subsidiary of Legislator 1656 - holds some land associated with the airport which was excluded from the sale to Omniport. The City Council holds 40% of Legislator 1656, with Norfolk County Council holding the other 60%, effectively giving the City Council a further holding of 2% in NAL. The sale valued Norwich Airport Ltd at £13.7m and the investment value shown in the Balance Sheet represents the Council’s 6% direct holding in the company. The shares of Norwich Airport Ltd are carried in the accounts at cost. Consideration has been given to measuring the fair value of Norwich Airport Ltd from Norwich City Council’s percentage shareholding from the Airports balance sheet. These calculations give a fair value higher than that of the carrying value at cost but were subjective and could not reliably measure fair value. An impairment review was undertaken in accordance with the Code which states that ‘where fair value cannot be measured reliably, the instrument is carried at cost (less any impairment losses).’ Norwich City Council have assessed that there has been no impairment of the asset. Norwich City Council has an interest in Legislator Companies 1656 and 1657 which has been assessed as immaterial for the purpose of Group Accounts.

Norwich City Council - 2017-18 Statement of Accounts
92 92
92
92
20. Long Term Debtors
2016/17
Debtors Provision for
Bad Debt
Net
Debtors
Net Debtors
£000 £000 £000 £000
Advances for House Purchase: Council
Houses Sold 3 - 3 3
Norfolk County Council Transferred Debt 865 - 865 919
Deferred Capital Receipt Sale of Airport
Shares 400 - 400 400
Deferred Capital Receipt – Livestock
Market - - - -
Decent Home Loans 2,240 - 2,240 2,768
Finance Lease > 1 year 1,267 - 1,267 1,255
Home Improvement Loans 203 - 203 195
Local Authority Mortgage Scheme 1,000 - 1,000 1,000
Housing Benefit Overpayments 7,254 (4,918) 2,336 2,136
Shared Equity Dwellings 282 - 282 297
SALIX 334 - 334 241
Debts with legal charge over property 43 - 43 44
Wholly owned subsidiary 11,500 - 11,500 794
Other Long Term Debtors 440 - 440 273
Total 25,831 (4,918) 20,913 10,325
2017/18
Long Term Debtors include:
Transferred Debt - This debt represents the value of assets transferred to other Public Bodies. The value of these assets was determined by the amount of related outstanding loan at the time of transfer.
Deferred Capital Receipts Sales of Airport Shares - 80.1% of the shares held in Norwich Airport Ltd. by Norfolk County Council and Norwich City Council were sold in March 2004 to Omniport Ltd. £1m of the total sale price is payable after 15 years or, should Omniport sell its interest before then, at the time of the sale. The City Council’s share of this deferred capital receipt is £400,000.
In February 2014 the Council advanced £1m to Lloyds Banking group as part of the Local Authority Mortgage Scheme. The Scheme is aimed at first time buyers; the advance reflects the Council’s share of financial assistance through the provision of an indemnity. This indemnity will be in place for a fixed five year period; at the end of this term, the advance will be returned to the Council. No calls have been made on the indemnity during the year.
Wholly Owned Subsidiary Loan – the Council has advanced a loan to its wholly owned subsidiary Norwich
Regeneration Ltd of £11.5m. The company is using the loan to finance its house building at the Threescore site.

Norwich City Council - 2017-18 Statement of Accounts
93
21. Short Term Investments The amounts invested at 31 March were as follows:
2017/18 2016/17
£000 £000
Banks 8,000 28,217
Building Societies 12,000 27,496
Local Authority 3,000 2
Total Short Term Investments 23,000 55,715
22. Short Term Debtors 2017/18 2016/17
£000 £000
Central Government Bodies 3,689 1,194
Other entities & individuals 7,134 4,952
Other Local Authorities 2,674 2,535
Total Short Term Debtors 13,497 8,681
23. Cash & Cash Equivalents
Cash equivalent short term deposits are those for a period of 3 months or less at inception and represent the lending of surplus monies to other local authorities and major financial institutions
2017/18 2016/17
£000 £000
Cash held by Council 11 16
Bank current accounts 3,855 1,398
Short term deposits with banks 3,590 9,920
Short term deposits with building societies 1,650 -
Short term deposits with local authorities 4,250 7,500
Money Markets 15,000 -
Total Cash & Cash Equivalents 28,356 18,834
24. Assets Held for Sale
2017/18 2016/17
£000 £000
Balance outstanding at start of year 424 2,536
Assets newly classified as held for sale:
Property, Plant & Equipment 784 1,830
Assets declassified as held for sale:
Property, Plant & Equipment - -
Asset disposals (1,231) (3,294)
Other movements 222 (648)
Balance outstanding at year-end 199 424
Current

Norwich City Council - 2017-18 Statement of Accounts
94 94
94
94
25. Short Term Creditors 2017/18 2016/17
£000 £000
Central Government Bodies 1,971 5,134
Other Local Authorities 10,242 12,520
National Health Bodies 27 5
Trade Creditors 7,722 8,750
Receipts in Advance 2,737 2,618
Other entities & individuals 3,171 4,393
Total Short Term Creditors 25,870 33,420
26. Long Term Creditors 2017/18 2016/17
£000 £000
Developer Contributions 1,618 1,704
Lease Liability 1,002 1,098
Rent Prepayments 150 200
SALIX 70 32
Total Long Term Creditors 2,840 3,034
27. Provisions 2017/18 2016/17
£000 £000
Balance at 1 April 2,553 1,572
Movement in provisions 8 980
Balance at 31 March 2,561 2,553
The provision includes £2.521m in respect of Non-Domestic Rates appeals following the introduction of Business Rates Retention on 1 April 2013. Within the 2016/17 balance there was a provision of £0.391m based on probable redundancy costs for a number of officers as part of the restructure of several service areas. These departures occurred in 2017/18 and the provision reduced accordingly.
28. Usable Reserves
Movements in the Council’s usable reserves are detailed in the Movement in Reserves Statement
29. Unusable Reserves 2017/18 2016/17
£000 £000
Revaluation Reserve 73,434 60,296
Capital Adjustment Account 681,293 635,305
Financial Instruments Adjustments Account (919) (642)
Deferred Capital Receipts 1,434 1,434
Pensions Reserve (180,039) (184,829)
Collection Fund Adjustment Account (264) 771
Total Unusable Reserves 574,939 512,335
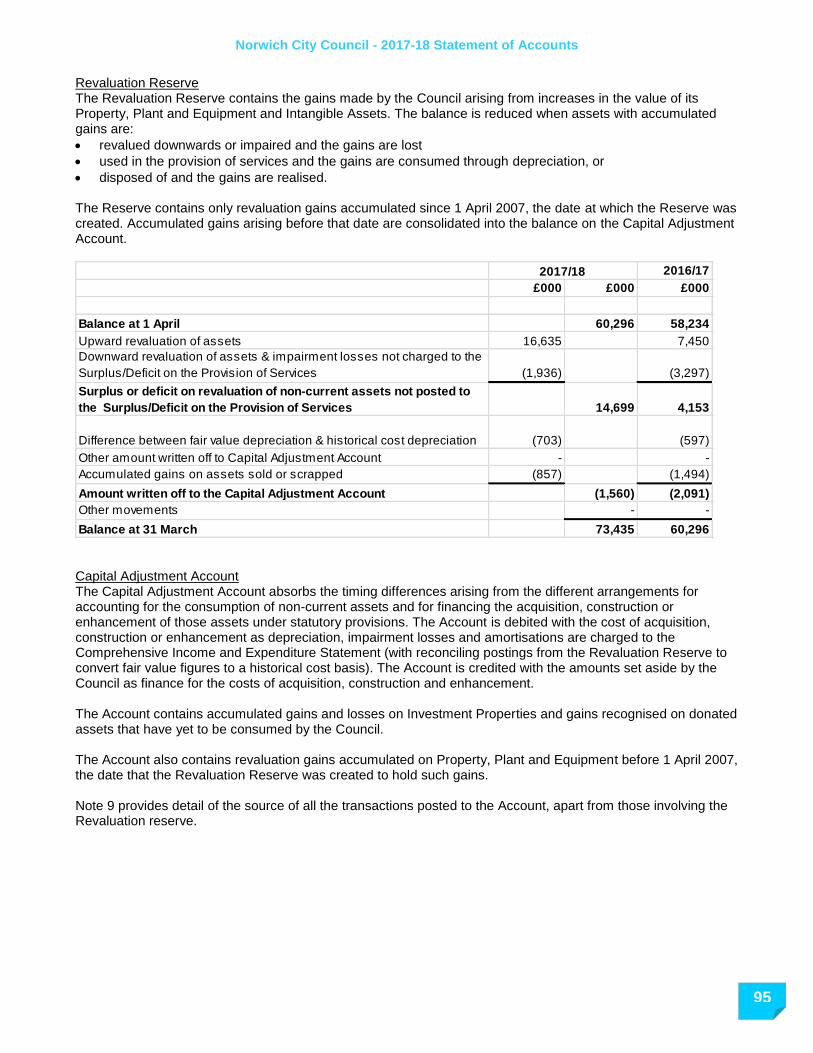
Norwich City Council - 2017-18 Statement of Accounts
95
Revaluation Reserve The Revaluation Reserve contains the gains made by the Council arising from increases in the value of its Property, Plant and Equipment and Intangible Assets. The balance is reduced when assets with accumulated gains are:
revalued downwards or impaired and the gains are lost
used in the provision of services and the gains are consumed through depreciation, or
disposed of and the gains are realised. The Reserve contains only revaluation gains accumulated since 1 April 2007, the date at which the Reserve was created. Accumulated gains arising before that date are consolidated into the balance on the Capital Adjustment Account.
2016/17
£000 £000 £000
Balance at 1 April 60,296 58,234
Upward revaluation of assets 16,635 7,450
Downward revaluation of assets & impairment losses not charged to the
Surplus/Deficit on the Provision of Services (1,936) (3,297)
Surplus or deficit on revaluation of non-current assets not posted to
the Surplus/Deficit on the Provision of Services 14,699 4,153
Difference between fair value depreciation & historical cost depreciation (703) (597)
Other amount written off to Capital Adjustment Account - -
Accumulated gains on assets sold or scrapped (857) (1,494)
Amount written off to the Capital Adjustment Account (1,560) (2,091)
Other movements - -
Balance at 31 March 73,435 60,296
2017/18
Capital Adjustment Account The Capital Adjustment Account absorbs the timing differences arising from the different arrangements for accounting for the consumption of non-current assets and for financing the acquisition, construction or enhancement of those assets under statutory provisions. The Account is debited with the cost of acquisition, construction or enhancement as depreciation, impairment losses and amortisations are charged to the Comprehensive Income and Expenditure Statement (with reconciling postings from the Revaluation Reserve to convert fair value figures to a historical cost basis). The Account is credited with the amounts set aside by the Council as finance for the costs of acquisition, construction and enhancement. The Account contains accumulated gains and losses on Investment Properties and gains recognised on donated assets that have yet to be consumed by the Council. The Account also contains revaluation gains accumulated on Property, Plant and Equipment before 1 April 2007, the date that the Revaluation Reserve was created to hold such gains. Note 9 provides detail of the source of all the transactions posted to the Account, apart from those involving the Revaluation reserve.
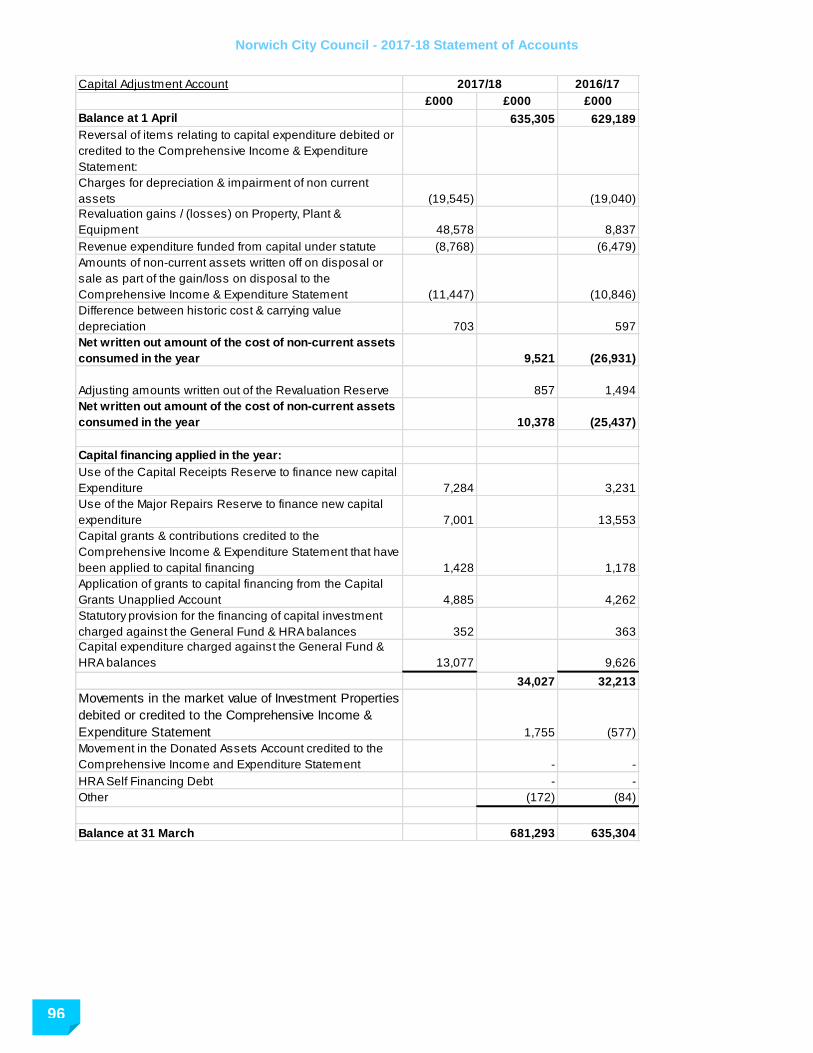
Norwich City Council - 2017-18 Statement of Accounts
96 96
96
96
Capital Adjustment Account 2016/17
£000 £000 £000
Balance at 1 April 635,305 629,189
Reversal of items relating to capital expenditure debited or
credited to the Comprehensive Income & Expenditure
Statement:
Charges for depreciation & impairment of non current
assets (19,545) (19,040)
Revaluation gains / (losses) on Property, Plant &
Equipment 48,578 8,837
Revenue expenditure funded from capital under statute (8,768) (6,479)
Amounts of non-current assets written off on disposal or
sale as part of the gain/loss on disposal to the
Comprehensive Income & Expenditure Statement (11,447) (10,846)
Difference between historic cost & carrying value
depreciation 703 597
Net written out amount of the cost of non-current assets
consumed in the year 9,521 (26,931)
Adjusting amounts written out of the Revaluation Reserve 857 1,494
Net written out amount of the cost of non-current assets
consumed in the year 10,378 (25,437)
Capital financing applied in the year:
Use of the Capital Receipts Reserve to finance new capital
Expenditure 7,284 3,231
Use of the Major Repairs Reserve to finance new capital
expenditure 7,001 13,553
Capital grants & contributions credited to the
Comprehensive Income & Expenditure Statement that have
been applied to capital financing 1,428 1,178
Application of grants to capital financing from the Capital
Grants Unapplied Account 4,885 4,262
Statutory provision for the financing of capital investment
charged against the General Fund & HRA balances 352 363
Capital expenditure charged against the General Fund &
HRA balances 13,077 9,626
34,027 32,213
Movements in the market value of Investment Properties
debited or credited to the Comprehensive Income &
Expenditure Statement 1,755 (577)
Movement in the Donated Assets Account credited to the
Comprehensive Income and Expenditure Statement - -
HRA Self Financing Debt - -
Other (172) (84)
Balance at 31 March 681,293 635,304
2017/18

Norwich City Council - 2017-18 Statement of Accounts
97
Financial Instruments Adjustment Account The Financial Instruments Adjustment Account absorbs the timing differences arising from the different arrangements for accounting for income and expenses relating to certain financial instruments and for bearing losses or benefiting from gains per statutory provisions. The Council uses the Account to manage premiums paid on the early redemption of loans. Premiums are debited to the Comprehensive Income and Expenditure Statement when they are incurred, but reversed out of the General Fund Balance to the Account in the Movement in Reserves Statement. Over time, the expense is posted back to the General Fund Balance in accordance with statutory arrangements for spreading the burden on Council tax. In the Council’s case, this period is the unexpired term that was outstanding on the loans when they were redeemed. As a result, the balance on the Account at 31 March 2018 will be charged to the General Fund over the next 15 years.
2017/18 2016/17
£000 £000
Financial Instruments Adjustment Account
Balance at 1 April 642 1,108
Proportion of premiums incurred in previous financial years to be
charged against the General Fund Balance in accordance with
statutory requirements 289 (454)
931 654
Amount by which finance costs charged to the Comprehensive Income
& Expenditure Statement are different from finance costs chargeable in
the year in accordance with statutory requirements (12) (12)
Balance at 31 March 919 642 Deferred Capital Receipts Reserve The Deferred Capital Receipts Reserve holds the gains recognised on the disposal of noncurrent assets but for which cash settlement has yet to take place. Under statutory arrangements, the Council does not treat these gains as usable for financing new capital expenditure until they are backed by cash receipts. When the deferred
cash settlement eventually takes place, amounts are transferred to the Capital Receipts Reserve.
2017/18 2016/17
£000 £000
Deferred Capital Receipts Reserve
Balance at 1 April 1,434 2,059
Transfer of deferred sale proceeds credited as part of the gain/loss on
disposal to the Comprehensive Income and Expenditure Statement - 373
Transfer to the Capital Receipts Reserve upon receipt of cash (1) (997)
Balance at 31 March 1,433 1,435 Pensions Reserve The Pensions Reserve absorbs the timing differences arising from the different arrangements for accounting for post-employment benefits and for funding benefits in accordance with statutory provisions. The Council accounts for post-employment benefits in the Comprehensive Income and Expenditure Statement as the benefits are earned by employees accruing years of service, updating the liabilities recognised to reflect inflation, changing assumptions and investment returns on any resources set aside to meet the costs. However, statutory arrangements require benefits earned to be financed as the Council makes employer’s contributions to pension funds or eventually pays any pensions for which it is directly responsible. The debit balance on the Pensions Reserve therefore shows a substantial shortfall in the benefits earned by past and current employees and the resources the Council has set aside to meet them. The statutory arrangements will ensure that funding will have been set aside by the time the benefits come to be paid.

Norwich City Council - 2017-18 Statement of Accounts
98 98
98
98
2017/18 2016/17
£000 £000
Pensions Reserve
Balance at 1 April (184,829) (123,351)
Actuarial gains or (losses) on pensions assets & liabilities 10,618 (59,013)
Reversal of items relating to retirement benefits debited or credited to
the Surplus or Deficit on the Provision of Services in the
Comprehensive Income & Expenditure Statement (12,553) (8,890)
Employer’s pensions contributions & direct payments to pensioners
payable in the year 6,074 5,645
Non-Council Employer’s pensions contributions payable in the year in
respect of TUPE'd employees still in pension fund 651 780
Balance at 31 March (180,039) (184,829) Collection Fund Adjustment Account The Collection Fund Adjustment Account manages the differences arising from the recognition of Council tax and business rates income in the Comprehensive Income and Expenditure Statement as it falls due from Council tax payers compared with the statutory arrangements for paying across amounts to the General Fund from the Collection Fund.
2017/18 2016/17
Collection Fund Adjustment Account £000 £000
Balance at 1 April 771 (465)
Amount by which Council tax income credited to the Comprehensive
Income & Expenditure Statement is different from Council tax income
calculated for the year in accordance with statutory requirements (65) 163
Amount by which NNDR income credited to the Comprehensive
Income & Expenditure Statement is different from Council tax income
calculated for the year in accordance with statutory requirements (969) 1,073
Balance at 31 March (263) 771
30. Cash Flow Statement – Operating Activities
The surplus or deficit on the provision of services has been adjusted for the following non-cash movements. The cash flows for operating activities include the following items:
2017/18 2016/17
£000 £000
Interest received (1,163) (1,113)
Interest paid 8,919 9,651
7,756 8,538

Norwich City Council - 2017-18 Statement of Accounts
99
2017/18 2016/17
£000 £000
Depreciation 16,906 17,126
Amortisation 256 250
Impairment and revaluations (40,857) (3,778)
Reductions in the fair value of soft loans (non Subsidiary) made in the
year 45 (12)
Soft Loans (non Subsidiary) – interest adjustment credited to the CIES
during the year 290 (557)
(Decrease)/Increase in provision for doubtful debts re: Loans and
Advances 661 1,003
Increase/(Decrease) in Interest Creditors (128) (256)
Increase/(Decrease) in Creditors (5,155) 1,374
(Increase)/Decrease in Interest Debtors 315 -
(Increase)/Decrease in Debtors (5,187) 1,678
(Increase)/Decrease in Inventories - (5)
(Decrease)/Increase in Pension Liability - -
Contributions to Provisions 288 981
Carrying amount of non-current assets sold 11,420 12,979
Movement in Investment Property values (1,755) 397
(22,901) 31,180 The adjustment for items in the net surplus or deficit on the provision of services that are investing and financing activities is comprised of:
2017/18 2016/17
£000 £000
Capital grants credited to surplus or deficit on the provision of services (1,428) (1,178)
Proceeds from the sale of property, plant and equipment and
investment properties (15,872) (13,261)
(17,300) (14,439)
31. Cash Flow Statement – Investing Activities
2017/18 2016/17
£000 £000
Purchase of property, plant & equipment, investment property & intangible
assets (39,518) (27,011)
Other Capital Payments (16) -
Purchase of short term & long-term investments (46,400) (86,600)
Other payments for investing activities (11,288) (1,371)
Proceeds from the sale of property, plant & equipment, investment property &
intangible assets 15,871 13,261
Other Capital Cash Receipts 279 914
Capital grants received 2,238 1,810
Proceeds from short term & long-term investments 78,818 67,000
Net cash flows from investing activities (16) (31,997)
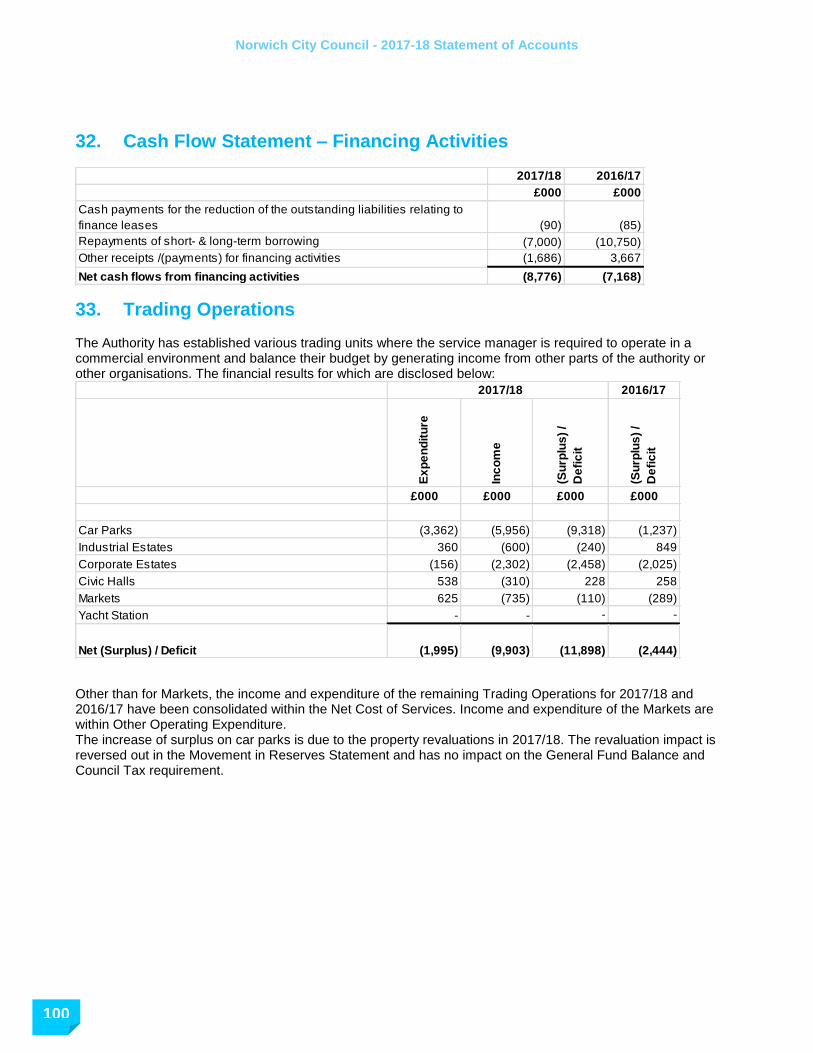
Norwich City Council - 2017-18 Statement of Accounts
100 100
100
100
32. Cash Flow Statement – Financing Activities
2017/18 2016/17
£000 £000
Cash payments for the reduction of the outstanding liabilities relating to
finance leases (90) (85)
Repayments of short- & long-term borrowing (7,000) (10,750)
Other receipts /(payments) for financing activities (1,686) 3,667
Net cash flows from financing activities (8,776) (7,168)
33. Trading Operations The Authority has established various trading units where the service manager is required to operate in a commercial environment and balance their budget by generating income from other parts of the authority or other organisations. The financial results for which are disclosed below:
2016/17
Ex
pe
nd
itu
re
Inc
om
e
(Su
rplu
s)
/
De
fic
it
(Su
rplu
s)
/
De
fic
it
£000 £000 £000 £000
(3,362) (5,956) (9,318) (1,237)
360 (600) (240) 849
(156) (2,302) (2,458) (2,025)
538 (310) 228 258
625 (735) (110) (289)
- - - -
(1,995) (9,903) (11,898) (2,444)
Car Parks
2017/18
Industrial Estates
Corporate Estates
Civic Halls
Markets
Yacht Station
Net (Surplus) / Deficit
Other than for Markets, the income and expenditure of the remaining Trading Operations for 2017/18 and 2016/17 have been consolidated within the Net Cost of Services. Income and expenditure of the Markets are within Other Operating Expenditure. The increase of surplus on car parks is due to the property revaluations in 2017/18. The revaluation impact is reversed out in the Movement in Reserves Statement and has no impact on the General Fund Balance and Council Tax requirement.

Norwich City Council - 2017-18 Statement of Accounts
101
34. Associates Norwich City Council has three associate companies; NPS Norwich Limited, Norwich Norse Environmental Limited and Norwich Norse Building Limited– see disclosure of services produced in note 47. In line with the service level agreements, Norwich City Council is entitled to an amount equivalent to 50% of any pre-tax profits as a discount on charges. An estimate of the pre-tax discounts has been accrued in the accounts. There is no other entitlement to the Council in terms of dividends or rights to retained earnings. The draft unaudited performance of the associates is shown below and will be updated for the audited accounts.
2017/18 2016/17 2017/18 2016/17 2017/18 2016/17
£000 £000 £000 £000 £000 £000
Profit & Loss Account Restated*
Operating Profit 184 263 136 126 119 145
Interest (Payable) /Receivable (7) (10) (30) (17) - -
Profit on Ordinary Activities
before Corporation Tax 177 253 106 109 119 145
Corporation Tax (35) (51) (24) (25) (17) (33)
Retained Profit for the
financial year 142 202 82 84 102 (40)
Balance Sheet
Profit & Loss b/f 671 469 328 244 199 87
Profit & Loss for the financial
year 142 202 82 84 102 112
Profit & Loss reserve c/f 813 671 410 328 301 199
Norwich Norse
Building LtdNPS (Norwich) Ltd
Norwich/Norse
Environmental Ltd
*2016/17 figures restated in line with the final audited accounts for Norwich Norse Building Ltd
35. Agency Services
The City Council is a member of four Joint Committees – Norfolk Joint Museums and Archaeology Committee, Norfolk Joint Records Committee, Norfolk Highways Joint Committee and CNC Building Control Consultancy Joint Committee (Building Control Partnership). The Norwich Highways Joint Committee oversees the operation of the Highways Agency Agreement providing the services for highways, traffic management and on-street car parking. The Council acts as agent for the County in relation to the work governed by the Joint Committee. The amounts of income and expenditure for 2017/18 and 2016/17 are as follows:-
Highways 2017/18 2016/17
£000 £000
Expenditure 2,595 2,542
Income (2,392) (2,569)
(Surplus) / Deficit 203 (27)
On-Street Car parking 2017/18 2016/17
£000 £000
Expenditure 1,272 1,039
Income (1,315) (1,252)
(Surplus) paid over to Norfolk County Council (43) (213)

Norwich City Council - 2017-18 Statement of Accounts
102 102
102
102
The non-agency elements of the Norwich Highways Joint Committee are not material. The Council’s interest in the Norfolk Joint Museums and Archaeology Committee and the Norfolk Joint Records Committee are not material. On 1
st November 2012 the Norwich Business Improvement District was launched. A Business Improvement
District (BID) is a defined area within which businesses pay an additional tax or fee in order to fund projects within the district's boundaries. On 1
st November 2017 a new five year BID agreement was launched, covering an expanded geographic area.
The council acts as agent for Norwich BID by billing and collecting the additional tax.
Business Improvement District 2017/18 2016/17
£000 £000
Billed 950 624
Collected (915) (490)
Paid over to Norwich BID 1,060 436
36. Members’ Allowances
The total of members' allowances paid in the year was £359,985 (2016/17 £357,081) in accordance with the Members' Allowance Scheme as set out in Appendix 16 of the Council's Constitution.

Norwich City Council - 2017-18 Statement of Accounts
103
37. Officers Remuneration
Post Holder Sala
ry (
incl
Fees &
all
ow
an
ces)
Exp
en
ses
Co
mp
en
sati
on
fo
r lo
ss
of
off
ice
To
tal
Rem
un
era
tio
n
(excl
Pen
sio
n
co
ntr
ibu
tio
ns)
Pen
sio
n C
on
trib
uti
on
s
To
tal
Rem
un
era
tio
n
(in
cl
Pen
sio
n
co
ntr
ibu
tio
ns)
£ £ £ £ £ £
Chief Executive Officer 2017/18 1 120,895 - - 120,895 16,691 137,586
Chief Executive Officer 2016/17 1 2 119,020 - - 119,020 17,217 136,237
Director of Regeneration &
Development 2017/18 82,050 - - 82,050 11,819 93,869
Director of Regeneration &
Development 2016/17 81,225 - - 81,225 11,702 92,927
Director of Customer & Culture
2017/18 89,655 - - 89,655 13,000 102,655
Director of Customer & Culture
2016/17 84,739 - - 84,739 12,287 97,026
Director of Neighbourhoods 2017/18 78,377 - - 78,377 11,327 89,704
Director of Neighbourhoods 2016/17 73,575 - - 73,575 10,605 84,180
-
Director of Business Services
2017/18 1 83,306 - - 83,306 11,819 95,125
Director of Business Services
2016/17 1 82,140 - - 82,140 11,702 93,842
S151 officer 17/18 3 71,801 - - 71,801 - 71,801
S151 officer 17/18 4 4,980 - - 4,980 1,080 6,060
S151 officer 16/17 5 57,416 - - 57,416 12,454 69,870
TOTAL 2017/18 531,064 - - 531,064 65,736 596,800
TOTAL 2016/17 498,115 - - 498,115 75,967 574,082 1Remuneration includes payments made in respect of election duties for the Chief executive and
Director of Business services. 2 Chief Executive Officer reduced to 4 days in 2016/17
3 S151 officer started May 2017, and is employed by LGSS shared services
4 S151 officer finished April 2017, and was employed by LGSS shared services
5 S151 officer was employed by LGSS shared services

Norwich City Council - 2017-18 Statement of Accounts
104 104
104
104
Senior officer’s remuneration disclosed on the tables above is included in the bandings in the table below. The number of employees whose remuneration, excluding pension contributions, was £50,000 or more in bands of £5,000 was:
Remuneration Band 2017/18 2016/17
£50,000 to £54,999 6 1
£55,000 to £59,999 3 1
£60,000 to £64,999 - -
£65,000 to £69,999 6 5
£70,000 to £74,999 1 1
£75,000 to £79,999 2 2
£80,000 to £84,999 1 3
£85,000 to £89,999 - -
£90,000 to £94,999 - -
£95,000 to £99,999 - -
£100,000 to £104,999 - 2
£105,000 to £109,999 - 1
£110,000 to £114,999 - -
£115,000 to £119,999 1 1
20 17 The number of exit packages with total cost per band and total of the compulsory and other redundancies are set out in the table below:-
2017/18
Exit package cost band
(including special
payments)
Number of
compulsory
redundancies
Number of other
departures agreed
Total number of
exit packages by
cost band
Total cost of exit
packages in
each band
£0 - £20,000 6 13 19 198,101
£20,001 - £40,000 7 7 14 372,565
£40,001 - £60,000 1 2 3 149,776
£60,001 - £80,000 0 2 2 140,877
£80,001 - £100,000 0 1 1 86,132
Total 14 25 39 947,451
The table above represents redundancies during 2017/18. The 2017/18 accounts include an estimate of £56,757 based on probable redundancy costs for a number of officers as part of the restructure of several service areas during 2017/18. As there are redeployment opportunities some of these officers may not be made redundant whilst others will leave during 2018/19, any variance between the accrual in 2017/18 and the final exit package costs will be disclosed as part of the 2018/19 accounts.
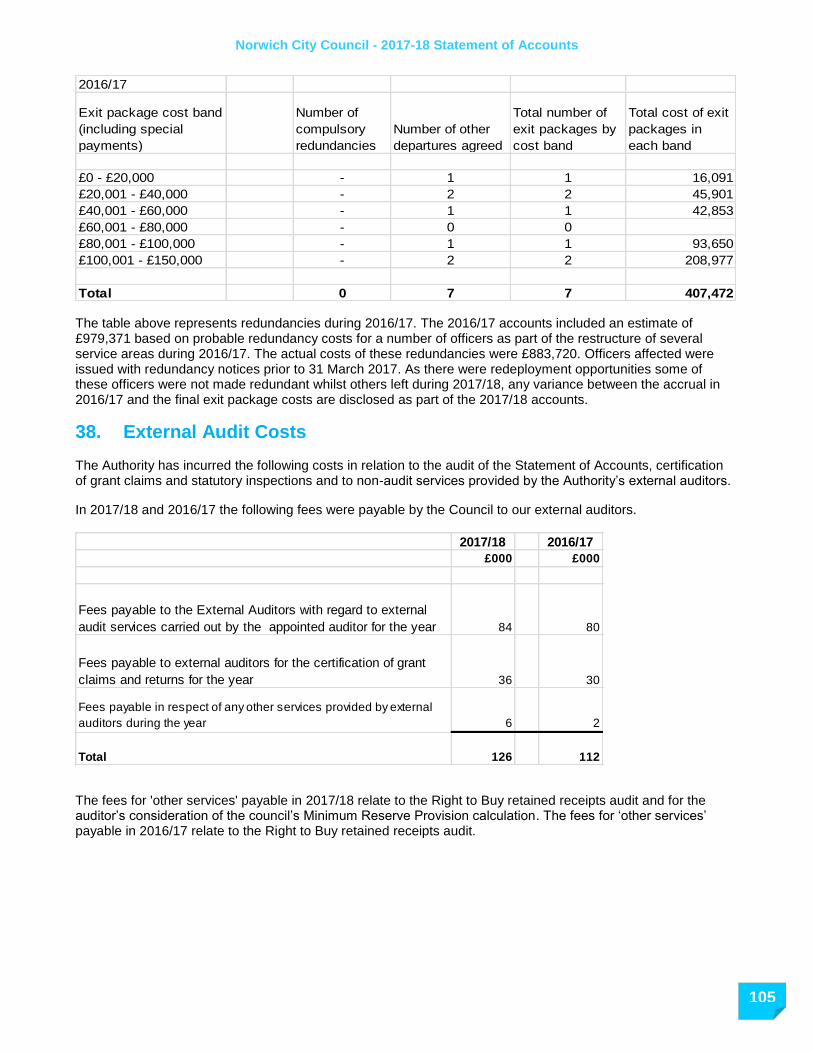
Norwich City Council - 2017-18 Statement of Accounts
105
2016/17
Exit package cost band
(including special
payments)
Number of
compulsory
redundancies
Number of other
departures agreed
Total number of
exit packages by
cost band
Total cost of exit
packages in
each band
£0 - £20,000 - 1 1 16,091
£20,001 - £40,000 - 2 2 45,901
£40,001 - £60,000 - 1 1 42,853
£60,001 - £80,000 - 0 0
£80,001 - £100,000 - 1 1 93,650
£100,001 - £150,000 - 2 2 208,977
Total 0 7 7 407,472
The table above represents redundancies during 2016/17. The 2016/17 accounts included an estimate of £979,371 based on probable redundancy costs for a number of officers as part of the restructure of several service areas during 2016/17. The actual costs of these redundancies were £883,720. Officers affected were issued with redundancy notices prior to 31 March 2017. As there were redeployment opportunities some of these officers were not made redundant whilst others left during 2017/18, any variance between the accrual in 2016/17 and the final exit package costs are disclosed as part of the 2017/18 accounts.
38. External Audit Costs The Authority has incurred the following costs in relation to the audit of the Statement of Accounts, certification of grant claims and statutory inspections and to non-audit services provided by the Authority’s external auditors.
In 2017/18 and 2016/17 the following fees were payable by the Council to our external auditors.
2017/18 2016/17
£000 £000
Fees payable to the External Auditors with regard to external
audit services carried out by the appointed auditor for the year 84 80
Fees payable to external auditors for the certification of grant
claims and returns for the year 36 30
Fees payable in respect of any other services provided by external
auditors during the year 6 2
Total 126 112
The fees for 'other services' payable in 2017/18 relate to the Right to Buy retained receipts audit and for the auditor’s consideration of the council’s Minimum Reserve Provision calculation. The fees for ‘other services’ payable in 2016/17 relate to the Right to Buy retained receipts audit.
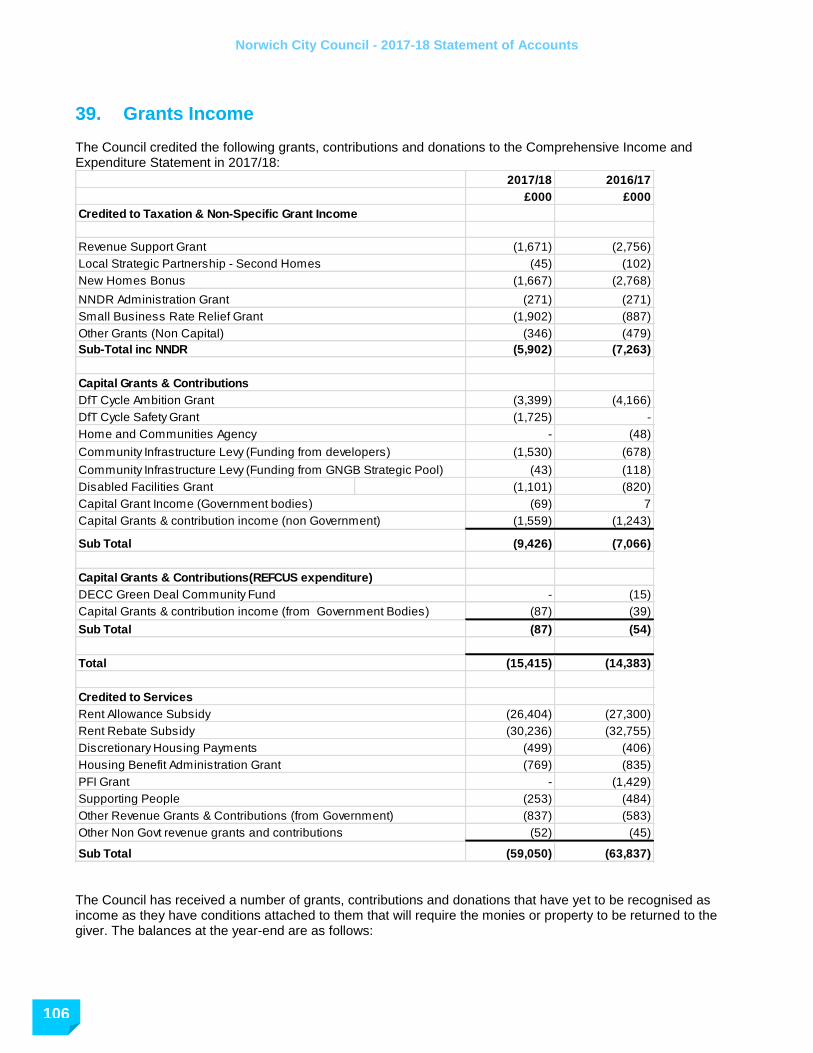
Norwich City Council - 2017-18 Statement of Accounts
106 106
106
106
39. Grants Income
The Council credited the following grants, contributions and donations to the Comprehensive Income and Expenditure Statement in 2017/18:
2017/18 2016/17
£000 £000
Credited to Taxation & Non-Specific Grant Income
(1,671) (2,756)
(45) (102)
(1,667) (2,768)
(271) (271)
(1,902) (887)
(346) (479)
(5,902) (7,263)
(3,399) (4,166)
(1,725) -
- (48)
(1,530) (678)
(43) (118)
Disabled Facilities Grant (1,101) (820)
(69) 7
(1,559) (1,243)
(9,426) (7,066)
- (15)
(87) (39)
(87) (54)
(15,415) (14,383)
(26,404) (27,300)
(30,236) (32,755)
(499) (406)
(769) (835)
- (1,429)
(253) (484)
(837) (583)
(52) (45)
(59,050) (63,837)
Sub Total
Credited to Services
Rent Allowance Subsidy
Total
Sub-Total inc NNDR
Community Infrastructure Levy (Funding from developers)
Capital Grants & contribution income (from Government Bodies)
Other Grants (Non Capital)
Local Strategic Partnership - Second Homes
Sub Total
Community Infrastructure Levy (Funding from GNGB Strategic Pool)
NNDR Administration Grant
Small Business Rate Relief Grant
DfT Cycle Safety Grant
Rent Rebate Subsidy
Capital Grants & contribution income (non Government)
Capital Grants & Contributions(REFCUS expenditure)
DECC Green Deal Community Fund
DfT Cycle Ambition Grant
Home and Communities Agency
Capital Grant Income (Government bodies)
Capital Grants & Contributions
New Homes Bonus
Revenue Support Grant
Sub Total
Discretionary Housing Payments
Supporting People
Other Non Govt revenue grants and contributions
Other Revenue Grants & Contributions (from Government)
PFI Grant
Housing Benefit Administration Grant
The Council has received a number of grants, contributions and donations that have yet to be recognised as income as they have conditions attached to them that will require the monies or property to be returned to the giver. The balances at the year-end are as follows:
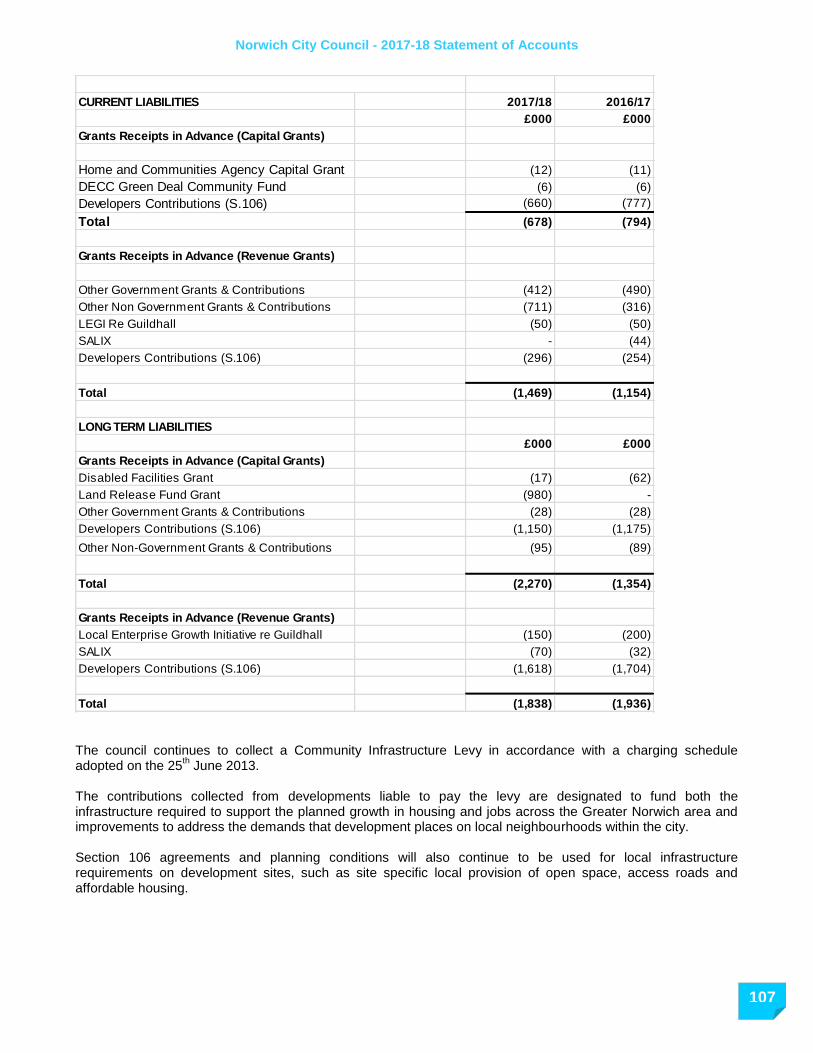
Norwich City Council - 2017-18 Statement of Accounts
107
CURRENT LIABILITIES 2017/18 2016/17
£000 £000
Grants Receipts in Advance (Capital Grants)
Home and Communities Agency Capital Grant (12) (11)
DECC Green Deal Community Fund (6) (6)
Developers Contributions (S.106) (660) (777)
Total (678) (794)
Grants Receipts in Advance (Revenue Grants)
Other Government Grants & Contributions (412) (490)
Other Non Government Grants & Contributions (711) (316)
LEGI Re Guildhall (50) (50)
SALIX - (44)
Developers Contributions (S.106) (296) (254)
Total (1,469) (1,154)
LONG TERM LIABILITIES
£000 £000
Grants Receipts in Advance (Capital Grants)
Disabled Facilities Grant (17) (62)
Land Release Fund Grant (980) -
Other Government Grants & Contributions (28) (28)
Developers Contributions (S.106) (1,150) (1,175)
Other Non-Government Grants & Contributions (95) (89)
Total (2,270) (1,354)
Grants Receipts in Advance (Revenue Grants)
Local Enterprise Growth Initiative re Guildhall (150) (200)
SALIX (70) (32)
Developers Contributions (S.106) (1,618) (1,704)
Total (1,838) (1,936) The council continues to collect a Community Infrastructure Levy in accordance with a charging schedule adopted on the 25
th June 2013.
The contributions collected from developments liable to pay the levy are designated to fund both the infrastructure required to support the planned growth in housing and jobs across the Greater Norwich area and improvements to address the demands that development places on local neighbourhoods within the city. Section 106 agreements and planning conditions will also continue to be used for local infrastructure requirements on development sites, such as site specific local provision of open space, access roads and affordable housing.

Norwich City Council - 2017-18 Statement of Accounts
108 108
108
108
40. Capital Expenditure & Capital Financing The total amount of capital expenditure incurred in the year is shown in the table below (including the value of assets acquired under finance leases and PFI contracts), together with the resources that have been used to finance it. Where capital expenditure is to be financed in future years by charges to revenue as assets are used by the Authority, the expenditure results in an increase in the Capital Financing Requirement (CFR), a measure of the capital expenditure incurred historically by the Authority that has yet to be financed. The CFR is analysed in the second part of this note.
2017/18 2016/17
£000 £000
Restated
Opening Capital Financing Requirement 1st April 240,390 238,988
Correction of prior years error - -
Adjusted Opening Capital Financing Requirement 240,390 238,988
Property, Plant & Equipment 14 16,199 21,096
Assets under Construction 14 8,781 6,185
Investment Property 16 13,433 12
Heritage Assets 15 - 7
Intangible Assets 17 305 27
Decent Home Loans granted net of repaid (172) (71)
Transferred debt net of repaid (56) (58)
Norwich Regeneration Ltd loan net of repaid 10,706 794
Norwich Preservation Trust loan net of repaid 126 -
Revenue Expenditure Funded from Capital Under Statute 8,768 6,479
298,480 273,459
Sources of Finance
Capital Receipts (7,284) (3,231)
Government Grants & Other Contributions (6,313) (5,441)
Housing Revenue Account Major Repairs Allowance (7,001) (13,553)
Revenue Contributions & Minimum Revenue Provision * (13,429) (9,989)
264,453 241,245
HRA non-dwelling depreciation, revaluation & impairments - (855)
Closing Capital Financing Requirement 31 March 264,453 240,390
Increase (decrease) in underlying need to borrow
(unsupported by government financial assistance) 24,063 1,402
Notes
Each local Council has a borrowing limit determined by the level of debt which it can afford. The system is governed by CIPFA’s ‘Prudential Code for Capital Finance in Local Authorities’ and the Local Authorities (Capital Finance and Accounting) (England) Regulations 2003. On 17 January 2018 Cabinet agreed to update the revised Minimum Revenue Provision (MRP) policy which had been approved by Cabinet on 3 February 2016. The revised policy changed the basis of the calculation of the MRP from the 4% reducing balance Regulatory Method to an annuity based charge on the basis that it was a more prudent and fair basis for the charge. The update to this MRP policy was to back-date the application of the annuity basis provision from its inception, i.e. apply the annuity basis method of calculation from 2007/08 onwards rather than just from 2015/16 onwards. This has been done and the updated charges will be applied from 2017/08 onwards. * The Minimum Revenue Provision 2017/18 is £0.261m (2016/17 £0.278m) and this represents a provision against the Council’s underlying debt that has been acquired to finance capital expenditure.

Norwich City Council - 2017-18 Statement of Accounts
109
41. Leases
Council as Lessee Operating Leases The Council leases cars and equipment to facilitate provision of services. It also leases privately owned properties to provide a decent, affordable housing alternative to those facing homelessness. The Council’s future minimum lease payments due under non-cancellable lease in future years are:
Veh
icle
s,
Pla
nt
&
Eq
uip
men
t
Lan
d &
Bu
ild
ing
s
Veh
icle
s,
Pla
nt
&
Eq
uip
men
t
Lan
d &
Bu
ild
ing
s
£000 £000 £000 £000
Future Rental Liabilities
Not later than one year 128 1,396 108 1,305
Later than one year & not later than five years * 412 1,888 356 1,825
Total 540 3284 464 3,130
31-Mar-18 31-Mar-17
* based on Pool Car contract extension to March 2021 The expenditure charged to the Housing Revenue Account, Cultural, Environmental, Regulatory and Planning Services lines in the Comprehensive Income and Expenditure Statement during the year in relation to these leases was £1.874m (2016/17 £2.117m)
2017/18 2016/17
£000 £000
Sublease payments receivable 1,888 2,026
Total 1,888 2,026 Finance Leases The council has acquired communal aerials for its dwellings under a finance lease, these assets are disclosed as Property, Plant and Equipment in the Balance Sheet under Vehicles, Plant and Equipment at the net amount of £0.835m (2016/17 £0.927m) The Council is committed to making minimum payments under these leases comprising settlement of the long-term liability for the interest in the property acquired by the Council and finance costs that will be payable by the Council in future years while the liability remains outstanding. The minimum lease payments are made up of the following amounts.
2017/18 2016/17
Finance Lease Liabilities£000 £000
Current 96 90
Non-Current 1,003 1,099
Financing Costs payable in future years 354 425
Minimum Lease Payments 1,453 1,614

Norwich City Council - 2017-18 Statement of Accounts
110 110
110
110
The future minimum lease payments payable under non-cancellable leases in future years are:
2017/18 2016/17
£000 £000
Future Rental Liabilities
No later than one year 161 161
Later than one year & not later than 5 years 646 646
Over 5 years 646 807
Total 1,453 1,614
Council as Lessor
Operating Leases The Council leases out property and equipment under operating leases for the following purposes:
The provision of community services such as sports facilities, tourism services and community centres
economic development purposes to provide suitable affordable accommodation for local businesses The future minimum lease payments receivable under non-cancellable leases in future years are:
2017/18 2016/17
£000 £000
Tenants Future Rental Liabilities
Not later than one year 3,539 3,108
Later than one year & not later than five years 13,919 11,179
Over five years 61,477 60,085
Total 78,935 74,372
In addition to the above, there are 90 properties (97 in 2016/17) where the rent is in perpetuity that amounts annually to £0.314m per annum (2016/17 £0.269m). The minimum lease payments receivable do not include rents that are contingent on events taking place after the lease was entered into, such as adjustments following rent reviews.
Finance Leases The Council leases out 21 properties on a finance lease. The Council has gross investments in the leases, made up of the minimum lease payments expected to be received over the remaining term and the residual value anticipated for the property when the lease comes to an end. The minimum lease payments are the payments over the lease term that the lessee is or can be required to make, excluding contingent rent. The gross investment is made up of the following amounts
2017/18 2016/17
£000 £000
Finance lease debtor (net present value of
minimum lease payments):
Current 18 18
Non-current 1,268 1,256
Unearned finance income 2,068 2,104
Unguaranteed residual value of property - -
Gross investment in the leases 3,354 3,378

Norwich City Council - 2017-18 Statement of Accounts
111
The gross investment in the lease and the minimum lease payments will be received over the following periods:
31-Mar-18 31-Mar-17 31-Mar-18 31-Mar-17
£000 £000 £000 £000
Future Rental Liabilities
Not later then one year 24 24 24 24
Later than one year & not later than five years 95 95 95 95
Later than five years 3,236 3,259 3,236 3,259
Total 3,355 3,378 3,355 3,378
Gross Investment in the
Lease
Minimum Lease Payments
42. Impairment Losses
During the year the Council carried out adaptations at a cost of £522,587 (2016/17 £745,144) to a number of council dwellings under Disabled Facilities legislation. No individual adaptation was significant in value. As advised by our valuer, these adaptations added no value to the dwellings; therefore this expenditure was impaired as shown in note 14 (combined with the impairments detailed below). The Council also impaired the cost of works to flats within blocks for which the lease has been sold £602,769, of which structural work constituted £566,298, roofing £17,456, window installations £12,090 and door access controls £6,511. Other impairments include the enhancement of HRA estates £130,433. The Council also impaired the cost of works to HRA shops £144,559 and district heating boiler houses £61,924 as it was deemed not to add value. Remedial works were carried out on City Hall £629,379, St Giles Car Park £358,095 and Waterloo Pavilion £50,247. All these assets had been valued at the beginning of the year. The Valuer advised this expenditure would not increase the valuation therefore it was impaired immediately.
43. Termination Benefits The Council terminated the contracts of a number of employees in 2017/18, incurring liabilities of £947,451 (2016/17 £407,472). These were payable to 39 (7 in 2016/17) officers who were made redundant as part of the Council’s rationalisation of Services and include amounts payable in respect of early retirement to the pension fund. The 2017/18 accounts include an estimate of £56,757 based on probable redundancy costs for a number of officers as part of the restructure of several service areas during 2017/18. As there are redeployment opportunities some of these officers may not be made redundant whilst others will leave during 2018/19, any variance between the accrual in 2017/18 and the final exit package costs will be disclosed as part of the 2018/19 accounts.
44. Other Long Term Liabilities The Council has other long term liabilities as detailed in the table below
2017/18 2016/17
£000 £000
Pension Fund Liability 180,039 184,829
Other 110 103
180,148 184,932

Norwich City Council - 2017-18 Statement of Accounts
112 112
112
112
45. Defined Benefit Pension Schemes
Participation in Pension Schemes
As part of the terms and conditions of employment of its officers, the Authority makes contributions towards the cost of post-employment benefits. Although these benefits will not actually be payable until employees retire, the Authority has a commitment to make the payments (for those benefits) and to disclose them at the time that employees earn their future entitlement. The Council participates in the Local Government Pension Scheme (LGPS), administered by Norfolk County
Council – this is a funded defined benefit final salary scheme, meaning that the Authority and employees pay
contributions into a fund, calculated at a level intended to balance the pensions liabilities with investment assets. Arrangements for the award of discretionary post-retirement benefits upon early retirement – this is an unfunded defined benefit arrangement, under which liabilities are recognised when awards are made. However, there are no investment assets built up to meet these pension liabilities, and cash has to be generated to meet actual pension payments as they eventually fall due. The LGPS pension scheme is operated under the regulatory framework for the Local Government Pension Scheme and the governance of the scheme is the responsibility of the pensions committee of Norfolk County Council. Policy is determined in accordance with the Pensions Fund Regulations. The investment managers of the fund are appointed by the committee which includes the Interim Head of Finance of Norfolk County Council. The principal risks to the authority of the scheme are the longevity assumptions, statutory changes to the scheme, structural changes to the scheme (i.e. large-scale withdrawals from the scheme), changes to inflation, bond yields and the performance of the equity investments held by the scheme. These are mitigated to a certain extent by the statutory requirements to charge to the General Fund and Housing Revenue Account the amounts required by statute as described in the accounting policies note.
Transactions relating to Retirement Benefits The Council recognises the cost of retirement benefits in the reported cost of services when they are earned by employees, rather than when the benefits are eventually paid as pensions. However, the charge the council is required to make against council tax is based on the cash payable in the year, so the real cost of post-employment/retirement benefits is reversed out of the General Fund and Housing Revenue Account via the Movement in Reserves Statement. The following transactions have been made in the Comprehensive Income and Expenditure Statement and the General Fund Balance via the Movement in Reserves Statement during the year:

Norwich City Council - 2017-18 Statement of Accounts
113
2017/18 2016/17
£000 £000
Comprehensive Income & Expenditure Statement
Cost of Services
Current service cost 7,819 4,391
(Gain)/loss from settlements 100 335
Financing and Investment Income and expenditure
Net Interest expense 4,634 4,164
Total Post-employment Benefits Charged to the Surplus or
Deficit on the Provision of Services 12,553 8,890
Other post-employment Benefits charged to the Comprehensive
Income and Expenditure Statement
Return on plan assets (excluding the amount included in the net
interest expense) (2,348) (20,718)
Actuarial (Gains) and Losses arising on changes in demographic
assumptions - (4,029)
Actuarial (Gains) and Losses arising on changes in financial
assumptions (7,768) 76,183
Other experience (502) 7,577
Total Post-employment Benefits Charged to the
Comprehensive Income and Expenditure Statement 1,935 67,903
Reversal of net charges made to the Surplus or Deficit for the
Provision of Services for post-employment benefits in accordance
with the Code and HRA balances for pensions in the year
(12,553) (8,890)
Total Remeasurements recognised in Other Comprehensive
Income (10,618) 59,013
The cumulative amount of actuarial gains and losses recognised in the Comprehensive Income and Expenditure Statement to the 31 March 2018 is a loss of £148.499m (31 March 2017 loss of 159.117m)
Pensions Assets and Liabilities Recognised in the Balance Sheet
The amount included in the Balance Sheet arising from the authority’s obligation in respect of its defined benefit plans is as follows:
2017/18 2016/17
£000 £000
Present Value of funded liabilities (438,820) (440,331)
Present Value of unfunded liabilities (19,924) (21,157)
Fair Value of plan assets 278,717 276,581
Net Liability arising from defined benefit obligation (180,027) (184,907)

Norwich City Council - 2017-18 Statement of Accounts
114 114
114
114
2017/18 2016/17
Reconciliation of present value of the scheme
liabilities: £000 £000
At 1 April (461,488) (378,041)
Total service Cost (7,819) (4,391)
Interest Cost (11,456) (12,693)
Contributions by Members (1,270) (1,259)
Remeasurement (gains)/Losses
- actuarial gains/losses arising from changes in
demographic assumptions - -
- actuarial gains/losses arising from changes infinancial
assumptions 7,768 (76,183)
- other 502 (3,548)
Benefits Paid 15,119 14,962Losses/(Gains ) on curtailments (100) (335)
At 31 March (458,744) (461,488)
2017/18 2016/17
Reconciliation of fair value of the scheme assets £000 £000
At 1 April 276,581 254,635
Interest Income 6,822 8,529
Remeasurement Gain/(loss)
the return on plan assets excluding amount included in
net interest expense 2,348 20,718
Employer Contributions 5,686 5,210
Contributions by Members 1,270 1,259
Contributions in respect of unfunded benefits 1,129 1,192
Benefits Paid (13,990) (13,770)
Unfunded benefits paid (1,129) (1,192)
(gains)/loss on curtailments - -
At 31 March 278,717 276,581

Norwich City Council - 2017-18 Statement of Accounts
115
Local Government Pension Scheme assets comprised:
Quoted
Prices in
active
markets
Quoted
prices not
in active
markets Total
% of total
assets
Quoted
Prices in
active
markets
Quoted
prices not
in active
markets Total
% of total
assets
£000 £000 £000 £000 £000 £000
Cash & Cash Equivalents 15,027 15,027 5.3% 7,968 7,968 2.9%
Equity Instruments
by industry type
Consumer 19,722 19,722 6.9% 20,598 20,598 7.4%
Manufacturing 16,820 16,820 5.9% 16,073 16,073 5.8%
Energy and Utilities 5,352 5,352 1.9% 7,683 7,683 2.8%
Financial institutions 16,733 16,733 5.9% 17,777 17,777 6.4%
Health and care 5,496 5,496 1.9% 8,362 8,362 3.0%
Information Technology 9,406 9,406 3.3% 7,905 7,905 2.9%
Other - - 0.0% - - 0.0%
73,529 73,529 78,398 78,398
Private equity 16,571 16,571 5.8% 17,286 17,286 6.2%
Bonds
by sector
Corporate
Other 3,556 3,556 1.2% - - 0.0%
Sub-total Bonds 3,556 3,556
Property
by geographical location
UK property 25,817 25,817 9.1% 25,817 25,817 9.3%
Overseas property 4,317 4,317 1.5% 4,317 4,317 1.6%
30,134 30,134 30,134 30,134
Investment Funds & Unit Trusts
Equities 80,304 80,304 28.2% 73,460 73,460 26.6%
Bonds 65,377 65,377 23.0% 69,908 69,908 25.3%
145,681 145,681 143,368 143,368
Derivatives 230 230 0.1% (573) (573) -0.2%
Other
Total Assets 222,996 61,732 284,728 221,193 55,388 276,581
2017/18
Sub-total Equity Instruments
Sub-total Property
Sub-total Investment Funds & Unit Trusts
2016/17

Norwich City Council - 2017-18 Statement of Accounts
116 116
116
116
Basis for Estimating Assets & Liabilities Liabilities have been assessed on an actuarial basis using the projected unit credit method, an estimate of the pensions that will be payable in future years dependent on assumptions about mortality rates, salary levels etc. Liabilities have been assessed by Hymans Robertson, an independent firm of actuaries, based on the latest full valuation of the scheme at 31 March 2016. The principle assumptions used in their calculations have been:
2017/18 2016/17
22.1yrs 22.1yrs
24.4yrs 24.4yrs
24.1yrs 24.1yrs
26.4yrs 26.4yrs
2.40% 2.40%
2.70% 2.70%
2.40% 2.40%
2.60% 2.50%
50% 50%
75% 75%
Mortality Assumptions:
Longevity at 65 for current pensioners
Men
Women
Men
Women
Rate of inflation
Longevity at 65 for future pensioners
Pre-April 2008 service
Post-April 2008 service
Rate of increase in salaries
Rate of increase in pensions
Rate for discounting scheme liabilities
Take up of option to convert annual pension into retirement lump
sum
The estimation of the defined benefit obligations is sensitive to the actuarial assumptions set out in the table above. The sensitivity analyses below have been determined based on reasonably possible changes of the assumptions occurring at the end of the reporting period and assumes for each change that the assumption analysed changes while all the other assumptions remain constant. The assumptions in longevity, for example, assume that life expectancy increases or decreases for men and women. In practice, this is unlikely to occur, and changes in some of the assumptions may be interrelated. The estimations in the sensitivity analysis have followed the accounting policies for the scheme, i.e. on an actuarial basis using the projected unit credit method. The methods and types of assumptions used in preparing the sensitivity analysis below did not change from those used in the previous period.
Increase in Assumption
£000
Rate of increase in salaries (increase by 0.5%) 3,980 Rate of increase in pensions (increase by 0.5%) 35,926 Rate for discounting scheme liabilities (decrease by 0.5%)
40,331
Impact on the Council’s Cash Flows
The objectives of the scheme are to keep employers’ contributions at as constant a rate as possible. The County Council has agreed a strategy with the scheme’s actuary to achieve a funding level of 100% over the next 20 years. Funding levels are monitored on an annual basis. The next triennial valuation is due to be completed on 31 March 2019.

Norwich City Council - 2017-18 Statement of Accounts
117
The scheme will need to take account of the national changes to the scheme under the Public Pensions Services Act 2013. Under the Act, the Local Government Pension Scheme in England and Wales and the other main existing public service schemes may not provide benefits in relation to service after 31 March 2014 (or service after 31 March 2015 for other main existing public service pension schemes in England and Wales). The Act provides for scheme regulations to be made within a common framework, to establish new career average revalued earnings schemes to pay pensions and other benefits to certain public servants. The total contribution expected to be made to the scheme by the Council for the year to March 2019 is £5.9m The weighted average duration of the defined benefit obligation for scheme members is 16.2 years, (2016/17 16.2 years)
46. Contingent Assets and Liabilities
Liabilities Norwich Livestock Market On 30 March 2017 Norwich City Council surrendered it lease on the Norwich Livestock Market and received a deferred capital receipt of £800k from the landowner relating to the original sale of the land in 2010. This decision to surrender the lease was challenged by the council’s former tenants, Norwich Livestock Market Ltd, who had now become tenants of the landowner. On 8th March 2018 a judicial review concluded that Norwich City Council must have a property interest in a livestock market in order to fulfil its statutory obligations under the Norwich Corporation Markets Act 1860. The judge also confirmed the need to consult interested parties before any change in the location of the market. As a result of the judicial review findings the Council’s lease with Norwich Livestock Market is re-established. Pending the outcome of discussions with the current landowner, and results of the consultation, it is not yet known what costs the Council may ultimately incur in meeting the requirements of the judicial review. The Council assesses it maximum liability to be £800k.
NHS Trusts During January and February 2016, NHS Trusts wrote to local authorities countrywide claiming charitable status and requesting mandatory relief from business rates under s.43(5) and (6) of the Local Government Act 1988, the request being backdated to 2010. If granted this would lead to a backdated payment by Norwich City Council and ongoing reduced business rates going forward as well as impacting the Norfolk business rates pool. The decision to grant relief to the Trust related to the council has not yet been taken and is subject to ongoing investigation. The view of the council is that the claim is unfounded. The timing, probability and amount of any relief is therefore uncertain at the current time. Dispute The Council has been in dispute with one of its contractors over some construction costs. The case was referred for adjudication and on 1 May 2018 the Adjudicator ruled in favour of the Council, finding it not to be liable for additional payments to the contractor. Whilst the decision could be referred to the High Court, the Council does not believe there is any liability for these costs.
47. Related Parties
The council is required to disclose material transactions with related parties – bodies or individuals that have the potential to control or influence the council or to be controlled or influenced by the council. Disclosure of these transactions allows readers to assess the extent to which the council might have been constrained in its ability to operate independently or might have secured the ability to limit another party’s ability to bargain freely with the council. UK government has significant influence over the general operations of the council– it is responsible for providing the statutory framework within which the council operates, and prescribes the terms of many of the transactions that the council has with other parties (e.g. council tax bills, housing benefits). Grants received from
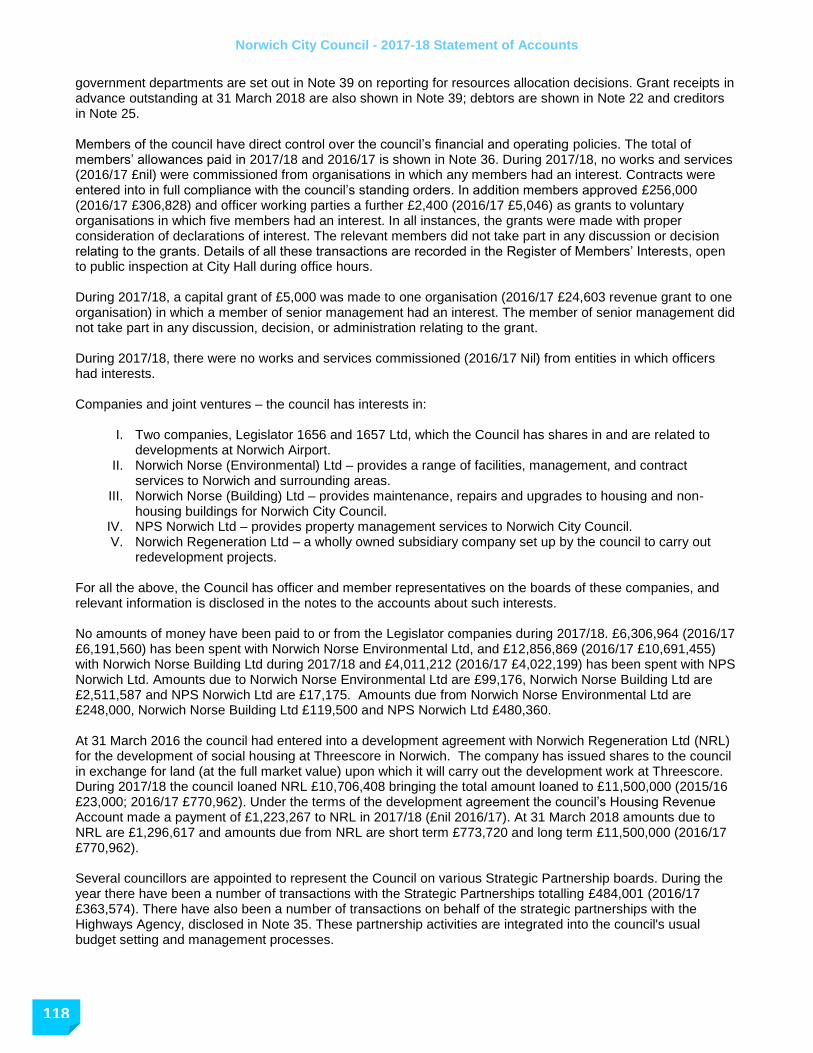
Norwich City Council - 2017-18 Statement of Accounts
118 118
118
118
government departments are set out in Note 39 on reporting for resources allocation decisions. Grant receipts in advance outstanding at 31 March 2018 are also shown in Note 39; debtors are shown in Note 22 and creditors in Note 25. Members of the council have direct control over the council’s financial and operating policies. The total of members’ allowances paid in 2017/18 and 2016/17 is shown in Note 36. During 2017/18, no works and services (2016/17 £nil) were commissioned from organisations in which any members had an interest. Contracts were entered into in full compliance with the council’s standing orders. In addition members approved £256,000 (2016/17 £306,828) and officer working parties a further £2,400 (2016/17 £5,046) as grants to voluntary organisations in which five members had an interest. In all instances, the grants were made with proper consideration of declarations of interest. The relevant members did not take part in any discussion or decision relating to the grants. Details of all these transactions are recorded in the Register of Members’ Interests, open to public inspection at City Hall during office hours. During 2017/18, a capital grant of £5,000 was made to one organisation (2016/17 £24,603 revenue grant to one organisation) in which a member of senior management had an interest. The member of senior management did not take part in any discussion, decision, or administration relating to the grant. During 2017/18, there were no works and services commissioned (2016/17 Nil) from entities in which officers had interests. Companies and joint ventures – the council has interests in:
I. Two companies, Legislator 1656 and 1657 Ltd, which the Council has shares in and are related to developments at Norwich Airport.
II. Norwich Norse (Environmental) Ltd – provides a range of facilities, management, and contract services to Norwich and surrounding areas.
III. Norwich Norse (Building) Ltd – provides maintenance, repairs and upgrades to housing and non-housing buildings for Norwich City Council.
IV. NPS Norwich Ltd – provides property management services to Norwich City Council. V. Norwich Regeneration Ltd – a wholly owned subsidiary company set up by the council to carry out
redevelopment projects. For all the above, the Council has officer and member representatives on the boards of these companies, and relevant information is disclosed in the notes to the accounts about such interests. No amounts of money have been paid to or from the Legislator companies during 2017/18. £6,306,964 (2016/17 £6,191,560) has been spent with Norwich Norse Environmental Ltd, and £12,856,869 (2016/17 £10,691,455) with Norwich Norse Building Ltd during 2017/18 and £4,011,212 (2016/17 £4,022,199) has been spent with NPS Norwich Ltd. Amounts due to Norwich Norse Environmental Ltd are £99,176, Norwich Norse Building Ltd are £2,511,587 and NPS Norwich Ltd are £17,175. Amounts due from Norwich Norse Environmental Ltd are £248,000, Norwich Norse Building Ltd £119,500 and NPS Norwich Ltd £480,360. At 31 March 2016 the council had entered into a development agreement with Norwich Regeneration Ltd (NRL) for the development of social housing at Threescore in Norwich. The company has issued shares to the council in exchange for land (at the full market value) upon which it will carry out the development work at Threescore. During 2017/18 the council loaned NRL £10,706,408 bringing the total amount loaned to £11,500,000 (2015/16 £23,000; 2016/17 £770,962). Under the terms of the development agreement the council’s Housing Revenue Account made a payment of £1,223,267 to NRL in 2017/18 (£nil 2016/17). At 31 March 2018 amounts due to NRL are £1,296,617 and amounts due from NRL are short term £773,720 and long term £11,500,000 (2016/17 £770,962). Several councillors are appointed to represent the Council on various Strategic Partnership boards. During the year there have been a number of transactions with the Strategic Partnerships totalling £484,001 (2016/17 £363,574). There have also been a number of transactions on behalf of the strategic partnerships with the Highways Agency, disclosed in Note 35. These partnership activities are integrated into the council's usual budget setting and management processes.
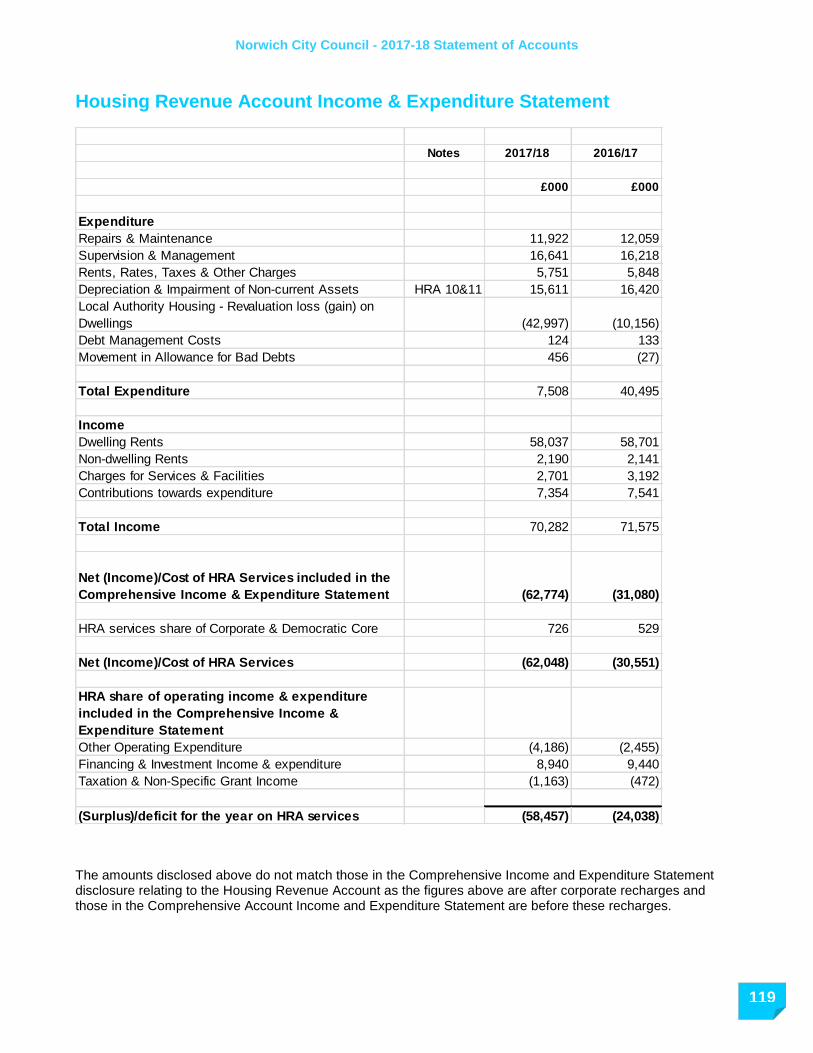
Norwich City Council - 2017-18 Statement of Accounts
119
Housing Revenue Account Income & Expenditure Statement
Notes 2017/18 2016/17
£000 £000
Expenditure
Repairs & Maintenance 11,922 12,059
Supervision & Management 16,641 16,218
Rents, Rates, Taxes & Other Charges 5,751 5,848
Depreciation & Impairment of Non-current Assets HRA 10&11 15,611 16,420
Local Authority Housing - Revaluation loss (gain) on
Dwellings (42,997) (10,156)
Debt Management Costs 124 133
Movement in Allowance for Bad Debts 456 (27)
Total Expenditure 7,508 40,495
Income
Dwelling Rents 58,037 58,701
Non-dwelling Rents 2,190 2,141
Charges for Services & Facilities 2,701 3,192
Contributions towards expenditure 7,354 7,541
Total Income 70,282 71,575
Net (Income)/Cost of HRA Services included in the
Comprehensive Income & Expenditure Statement (62,774) (31,080)
HRA services share of Corporate & Democratic Core 726 529
Net (Income)/Cost of HRA Services (62,048) (30,551)
HRA share of operating income & expenditure
included in the Comprehensive Income &
Expenditure Statement
Other Operating Expenditure (4,186) (2,455)
Financing & Investment Income & expenditure 8,940 9,440
Taxation & Non-Specific Grant Income (1,163) (472)
(Surplus)/deficit for the year on HRA services (58,457) (24,038)
The amounts disclosed above do not match those in the Comprehensive Income and Expenditure Statement disclosure relating to the Housing Revenue Account as the figures above are after corporate recharges and those in the Comprehensive Account Income and Expenditure Statement are before these recharges.

Norwich City Council - 2017-18 Statement of Accounts
120 120
120
120
Movement in Reserves Statement (Housing Revenue Account)
2017/18 2016/17
£000 £000
Balance at 1 April 30,387 26,190
Movement in reserves during Year
Surplus/ (deficit) on provision of services 58,457 24,038
Total Comprehensive Income & Expenditure 58,457 24,038
Adjustments between accounting basis & funding basis under
regulations (note 7 main accounts) (57,555) (19,790)
Net Increase/ Decrease before Transfers to Earmarked Reserves 902 4,248
Transfers between reserves (107) (49)
Increase/Decrease in Year 102 4,197
Balance at 31 March carried forward 30,489 30,387

Norwich City Council - 2017-18 Statement of Accounts
121
Notes to Housing Revenue Account Income & Expenditure Statement
1. Other Operating (Income) / Expenditure
2017/18 2016/17
£000 £000
(Gains)/Losses on the disposal of non-current assets (4,186) (2,455)
Total (4,186) (2,455)
2. Financing and Investment Income and Expenditure
2017/18 2016/17
Interest payable and similar charges 8,035 8,480
Pension interest cost and expected return on pension assets 1,142 1,182
Interest receivable and similar income (238) (222)
Total 8,939 9,440
£000 £000
3. Taxation and Non-Specific Grant Income
2017/18 2016/17
Capital Grants and contributions (1,163) (472)
Total (1,163) (472)
£000 £000
4. Loan Charges Under HRA self-financing the Council has adopted a ‘two-pool’ approach so that HRA self-financing loans and the resultant interest are directly attributable to the HRA. This has led to external interest charges of £7.965m being charged to the HRA in 2017/18 (2016/17 £8.405m).
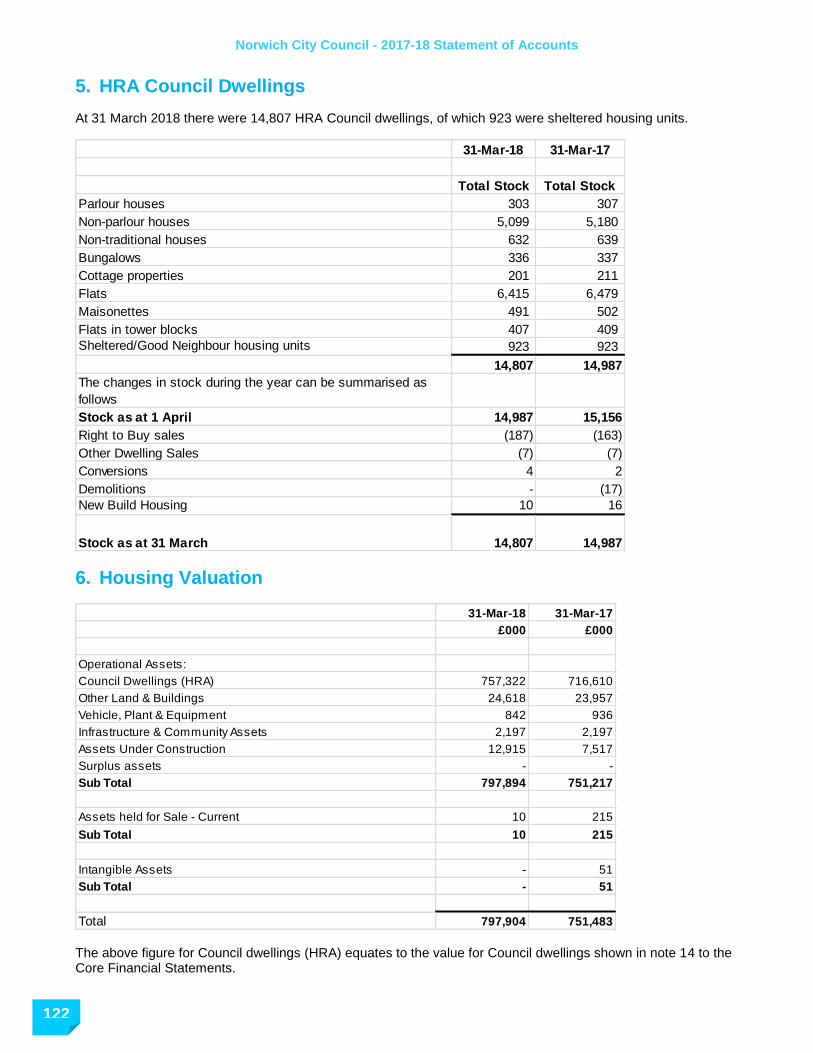
Norwich City Council - 2017-18 Statement of Accounts
122 122
122
122
5. HRA Council Dwellings
At 31 March 2018 there were 14,807 HRA Council dwellings, of which 923 were sheltered housing units.
31-Mar-18 31-Mar-17
Total Stock Total Stock
Parlour houses 303 307
Non-parlour houses 5,099 5,180
Non-traditional houses 632 639
Bungalows 336 337
Cottage properties 201 211
Flats 6,415 6,479
Maisonettes 491 502
Flats in tower blocks 407 409
Sheltered/Good Neighbour housing units 923 923
14,807 14,987
The changes in stock during the year can be summarised as
follows
Stock as at 1 April 14,987 15,156
Right to Buy sales (187) (163)
Other Dwelling Sales (7) (7)
Conversions 4 2
Demolitions - (17)
New Build Housing 10 16
14,987Stock as at 31 March 14,807
6. Housing Valuation
31-Mar-18 31-Mar-17
£000 £000
Operational Assets:
Council Dwellings (HRA) 757,322 716,610
Other Land & Buildings 24,618 23,957
Vehicle, Plant & Equipment 842 936
Infrastructure & Community Assets 2,197 2,197
Assets Under Construction 12,915 7,517
Surplus assets - -
Sub Total 797,894 751,217
Assets held for Sale - Current 10 215
Sub Total 10 215
Intangible Assets - 51
Sub Total - 51
Total 797,904 751,483 The above figure for Council dwellings (HRA) equates to the value for Council dwellings shown in note 14 to the Core Financial Statements.

Norwich City Council - 2017-18 Statement of Accounts
123
As set out in the Statement of Accounting Policies, Council dwellings are valued on the basis of Existing Use Value for Social Housing (EUV-SH). This value is less than the Vacant Possession Value to reflect the fact that Local Authority Housing is let at sub-market rents and, in broad terms, is arrived at after applying a regional adjustment factor of 62% (2016/17 62%). The difference between the two values therefore shows the economic cost of providing housing at less than market value. The Vacant Possession Value of all HRA Dwellings as at 31 March 2018 was £1,953.59m (31 March 2017 £1,848.57m)
7. Major Repairs Reserve
2017/18 2016/17
£000 £000
Balance brought forward at 1 April - -
Depreciation charge for the year (14,001) (13,553)
Financing of capital expenditure for the year 7,001 13,553
Balance for the year (7,000) -
Balance Carried forward (7,000) -
8. HRA Capital Expenditure
2017/18 2016/17
£000 £000
Capital Investment
Opening Capital Financing Requirement 1st April 205,717 206,827
Operational Assets 14,543 19,617
Other Land & Buildings 145 286
Assets under Construction 8,405 4,491
Revenue Expenditure Financed as Capital 4,225 1,829
Appropriation to General Fund - (255)
233,035 232,795
Sources of Finance
Capital Receipts (6,628) (2,667)
Government Grants & Other Contributions (1,163) (472)
Major Repairs Allowance (7,001) (13,553)
Revenue Contributions (12,527) (9,530)
205,716 206,573
HRA Non Dwellings depreciation, revaluation & impairments - (856)
Closing Capital Financing Requirement 31 March 205,716 205,717

Norwich City Council - 2017-18 Statement of Accounts
124 124
124
124
9. HRA Capital Receipts
In 2017/18 total capital receipts from the disposal of HRA assets were:
2017/18 2016/17
£000 £000
Land 163 408
Council dwellings 14,711 11,625
Insurance receipt - -
Total 14,874 12,033
10. Depreciation
From 1st April 2012 depreciation of the Council’s housing stock is calculated by reference to the value at the previous 31st March. Council dwellings have their individual components identified as to the date of upgrade, and using the asset life as advised by the Council’s valuers, depreciation associated with each properties components is calculated. The amount of depreciation charged for the year was £14.146m (2016/17 £14.232m)
2017/18 2016/17
£000 £000
Operational Assets
Council dwellings 13,472 13,553
Other land & buildings 529 534
Vehicles, Plant & Equipment 94 94
Intangible Assets 51 51
Total 14,146 14,232
11. Impairment Costs
During the year there were £1.461m of impairment costs (2016/17 £2.189m) relating to HRA assets, which are detailed in the table below.
2017/18 2016/17£000 £000
Council Dwellings (1,317) (1,888)
Other Property (144) (301)
Total (1,461) (2,189)
Disabled Facilities adaptations not adding value (523) (745)
Lift installations not adding value - -
Upgrades to District Heating schemes not adding value (62) -
Enhancement of HRA estates not adding value (130) (14)Construction of Bin Stores not adding value - (7)
Structural work to flats where lease has been sold not adding value (566) (1,075)
Other work to flats where lease has been sold not adding value (36) (46)
Other (144) (301)
Total (1,461) (2,189)

Norwich City Council - 2017-18 Statement of Accounts
125
12. Pensions Reserve
As set out in the Statement of Accounting Policies at Note 1, the Council has restricted the accounting entries for the purposes of IAS19 ‘Retirement Benefits’ to current service cost only for the HRA. This is reflected in the Net Cost of Services and a compensating adjustment is made to the Pensions Reserve in order that there is no impact on either the Surplus/ (Deficit) for the year or subsequent rent levels.
13. Rent Arrears
Rent arrears at 31 March 2018 were £4.97m (31 March 2017 £4.46m). The provision for doubtful debts (rents) at 31 March 2018 was £2.85m (31 March 2017 £2.63m). Amounts written off during the year amounted to £0.31m (2016/17 £0.45m).

Norwich City Council - 2017-18 Statement of Accounts
126 126
126
126
The Collection Fund Revenue Account
31-Mar-17
Business
Rates
Council
Tax
Total Total
Restated
£000 £000 £000 £000
INCOME
Council Tax receivable 75,459 75,459 72,519
Business rates receivable 75,608 75,608 80,868
Council Tax Reduction Scheme (13,239) (13,239) (13,062)
75,608 62,220 137,828 140,325
EXPENDITURE
Precepts & Demands:
Central Government 37,712 37,712 38,931
Norfolk County Council 7,542 43,762 51,304 48,656
Norfolk Police Authority 7,615 7,615 7,309
Norwich City Council 30,170 8,732 38,902 39,520
Distribution of Estimated Surplus / (Deficit) for Previous Years:
Central Government (165) (165) (1,437)
Norfolk County Council (33) 1,450 1,417 285
Norfolk Police Authority 259 259 104
Norwich City Council (132) 297 165 (1,030)
Charges to Collection Fund
Transitional Protection Payment 1,570 1,570 150
Costs of Collection 271 271 271
Increase/decrease in Bad Debt Provision (472) (33) (505) 1,319
Increase/decrease in Provision for Appeals 897 897 1,475
Write Offs of uncollectable amounts 671 461 1,132 879
78,031 62,543 140,574 136,432
Collection Fund Balance b/fwd at 1 April (122) 5,647 5,525 1,632
Surplus / (Deficit) for the year (2,423) (323) (2,746) 3,893
Collection Fund Balance c/fwd at 31 March (2,545) 5,324 2,779 5,525
31-Mar-18

Norwich City Council - 2017-18 Statement of Accounts
127
Notes to the Collection Fund Statement
1. Income from Business Rates
Since 1 April 2013 and the introduction of the Business Rates Retention Scheme, the Council collects national non-domestic rates (NNDR) for its area, which are based on local rateable values controlled by the Valuation Office multiplied by a uniform rate controlled by Central Government. The total amount, less certain reliefs and other deductions, is paid to Central Government, Norwich City Council and Norfolk County Council in accordance with legislated percentages of 50%, 40% and 10% respectively. The total non-domestic rateable value at 31 March 2018 (2017 list) was £200,521,031 (31 March 2017 (2010 list) £193,716,266). The national non-domestic rate multiplier for 2017/18 was 47.9p in the £ (2016/17 49.7p in the £). The small business multiplier for eligible businesses in 2017/18 was 46.6p in the £ (2016/17 48.4p in the £).
2. Council Tax The calculation of the tax base, i.e. the number of chargeable dwellings in each Valuation Band (adjusted for dwellings where discounts apply) converted to an equivalent number of Band D dwellings, is shown below:
Property Value Band 2017/18 2016/17
Calculated Number of
Properties in Band
Calculated Number of
Properties in Band
Up to £40,000 A 10,160.14 9,675.79
£40,001 to £52,000 B 12,483.29 12,194.58
£52,001 to £68,000 C 5,919.51 5,870.27
£68,001 to £88,000 D 2,999.15 2,990.60
£88,001 to £120,000 E 2,375.33 2,408.45
£120,001 to £160,000 F 1,169.64 1,199.61
£160,001 to £320,000 G 949.50 952.25
Over £320,000 H 95.00 92.00
36,151.56 35,383.55
Collection Rate 0.97 0.97
35,067.00 34,322.00
- -
35,067.00 34,322.00
Contribution in Lieu (relating to Crown Properties)
Tax Base The tax rate per Band D property was £1,714.12 (2016/17 £1,647.74).

Norwich City Council - 2017-18 Statement of Accounts
128 128
128
128
3. Council Tax Contribution to Collection Fund Surpluses & Deficits
The Council Tax surplus/deficit on the Collection Fund will be distributed in subsequent financial years between Norwich City Council, Norfolk County Council and Norfolk Police Authority in proportion to the value of the respective precept made on the Collection Fund.
2017/18 2016/17
£000 £000
3,894 4,112
675 715
755 820
5,324 5,647
Norfolk County Council
Norfolk Police Authority
Norwich City Council
Surplus Carried Forward
4. NNDR Contribution to Collection Fund Surpluses and Deficits The NNDR surplus/deficit on the Collection Fund will be distributed in subsequent financial years between Central Government, Norwich City Council and Norfolk County Council in accordance with legislated percentages of 50%, 40% and 10% respectively.
2017/18 2016/17
£000 £000
(1,273) (61)
(1,018) (49)
(255) (12)
(2,546) (122)Surplus /(deficit) Carried Forward
Central Government
Norwich City Council
Norfolk County Council

Norwich City Council - 2017-18 Statement of Accounts
129
Group Financial Statements
1. Introduction The Code of Practice requires local authorities with interests in subsidiaries, associates and/or joint ventures to prepare group accounts in addition to their own single entity financial statements, unless their interest is not considered material. The Group Accounts contain the core statements similar in presentation to the Council’s single entity accounts but consolidating the figures of the Council with Norwich Regeneration Ltd. The following pages include: Group Movement in Reserves Statement Group Comprehensive Income and Expenditure Statement Group Balance Sheet Group Cash Flow Statement Notes to the Group Accounts These statements are set out on the following pages, together with accompanying disclosure notes.
2. Basis of Identification of the Group Boundary In its preparation of these Group Accounts, the Council has considered its relationship with the entities that fall into the following categories: Subsidiaries – where the Council exercises control and gains benefits or has exposures to risks arising from this control. These entities are included in the group. Associates – where the Council exercises a significant influence and has a participating interest. No material entities meet these criteria to be included in the group. Jointly Controlled Entities - where the Council exercises joint control with one or more organisations. No entities identified to be included in the group. No Group Relationship – where the body is not an entity in its own right or the Council has an insufficient interest in the entity to justify inclusion in the group financial statements. These entities are not included in the group. In accordance with this requirement, the Council has determined its Group relationships as follows:
Norwich Regeneration Limited (NRL) Subsidiary Consolidated
NPS Norwich Ltd Associate Consolidated
Norwich Norse (Environmental) Limited Associate Consolidated
Norwich Norse (Building) Limited Associate Consolidated
Three Score Open Space Management Ltd Subsidiary Not material
3. Norwich Regeneration Limited (NRL) Norwich Regeneration Limited (NRL) was incorporated on 13 November 2015. It is wholly owned by Norwich City Council. It was set up to develop more housing for affordable rent (to be purchased by the HRA upon completion from NRL) and also to develop housing for private sale and market rent. The company’s first set of accounts was produced as at 31 March 2017 for the period from November 2015 to 31 March 2017. These accounts have been audited by Aston Shaw. Copies of the accounts may be obtained from Companies House or by request to the Council. In 2016/17 the lack of trading and the non-material level of transactions and assets led to the conclusion that group accounts were not required for year end 31 March 2017 on the grounds of materiality. However for the year ended 31 March 2018 there has been significantly more activity on the Three Score development site and accordingly group accounts have been prepared for 2017-18. The Company’s accounting period for 2017-2018 is from 1 April 2017 to 31 March 2018.

Norwich City Council - 2017-18 Statement of Accounts
130 130
130
130
As a subsidiary, the accounts of NRL have been consolidated with those of the Council on a line by line basis, and any balances and transactions between parties have been eliminated in full. NRL expenditure and income, adjusted for transactions with the council, is shown within the Norwich Regeneration Limited line in the Comprehensive Income and Expenditure Statement. As the NRL performance is not reported alongside the Council’s to management, the figures have been shown as a separate service line. Balance sheet values are incorporated into the relevant heading of the Balance Sheet, removing balances owed between the two parties. NRL has prepared 2017/18 accounts using accounting policies consistent with those applied by the Council, and no adjustments have been required to align accounting policies. Both entities have a financial year end of 31 March.
4. NPS Norwich Ltd This is a company owned by NPS Property Consultants Limited (a subsidiary of Norfolk County Council) and Norwich City Council. The principle activity of the company is the provision of property management services for NCC, which is managed under a service agreement. NPS Property Consultants hold eight A shares and NCC hold two B shares in NPS Norwich Ltd. Two senior officers of NCC are Directors of NPS Norwich Ltd whilst NPS Property Consultants have three representatives on the board. In line with the Service Level Agreement, Norwich City Council is entitled to an amount equivalent to 50% of any pre-tax profits as a discount on charges, with NPS Property Consultants Limited retaining the remaining 50%. NPS Norwich Ltd has been included within the Group due to the nature and extent of activities carried out by the associate for the council. An estimate of the pre-tax discount is accrued at the year-end within the Council’s accounts. The company results are disclosed in Note 34 of the Council’s single entity accounts. Apart from the discount on charges, there is no other entitlement to NCC e.g. dividends or rights to retained profits and therefore no financial equity asset to be disclosed in the Group Accounts.
5. Norwich Norse (Environmental) Limited This is a company owned by Norse Commercial Services (NCS) Limited (a subsidiary of Norse group, itself a subsidiary of Norfolk County Council) and Norwich City Council. The principle activities of the company are provision of streets, buildings and other cleaning, grounds maintenance, arboriculture and associated services for NCC, which is managed under a service agreement. NCS hold eight A shares and NCC hold two B shares in Norwich Norse (Environmental) Limited. A senior officer of NCC and the portfolio holder are Directors of Norwich Norse (Environmental) Limited whilst NCS have three representatives on the board. In line with the Service Level Agreement, Norwich City Council is entitled to an amount equivalent to 50% of any pre-tax profits as a discount on charges, with Norse Commercial Services Limited retaining the remaining 50%. Norwich Norse (Environmental) Ltd has been included within the Group due to the nature and extent of activities carried out by the associate for the council. An estimate of the pre-tax discount is accrued at the year-end within the Council’s accounts. The company results are disclosed in Note 34 of the Council’s single entity accounts. Apart from the discount on charges, there is no other entitlement to NCC e.g. dividends or rights to retained profits and therefore no financial equity asset to be disclosed in the Group Accounts.

Norwich City Council - 2017-18 Statement of Accounts
131
6. Norwich Norse (Building) Limited This is a company owned by NPS Norwich Limited (NPSN) and Norwich City Council. The principle activities of the company are provision of reactive and proactive maintenance and refurbishments, repairs and upgrades for both housing revenue and general fund non-housing buildings. NPSN hold eight A shares and NCC hold two B shares in Norwich Norse (Building) Limited. A senior officer of NCC and the portfolio holder are Directors of Norwich Norse (Building) Limited, whilst Norfolk County Council appoints two Directors to the board, the fifth Director is the company Managing Director whom is jointly appointed by NPSN & NCC. In line with the Service Level Agreement, Norwich City Council is entitled to an amount equivalent to 50% of any pre-tax profits as a discount on charges, with NPS Norwich Ltd retaining the
remaining 50%. Norwich Norse (Building) Ltd has been included within the Group due to the nature and extent of activities carried out by the associate for the council. An estimate of the pre-tax discount is accrued at the year-end within the Council’s accounts. The company results are disclosed in Note 34 of the Council’s single entity accounts. Apart from the discount on charges, there is no other entitlement to NCC e.g. dividends or rights to retained profits and therefore no financial equity asset to be disclosed in the Group Accounts.
7. Three Score Open Space Management Ltd This company has been set up to manage the open spaces around the Three Score development. The principle activity will be to maintain the open spaces on the Three Score site. Income to do this will, be generated through homeowners paying over of an annual service charge to the company for the maintenance. This is incorporated within the contract to purchase any properties on the site. The company has been set up initially as a subsidiary of NRL and NCC are registered as subscribers and have guarantee limit of £1 each should the company be wound up. NRL has been registered as being the Relevant Legal Entity with 75% ownership of the voting rights. NCC is named as an ‘Other Registrable Person’ again with 75% ownership of the voting rights (as it indirectly holds the voting rights as parent company of NRL). In the long term it is intended to hand the company over to the residents/stakeholders to manage at which point the ownership of the voting rights will be amended accordingly. The company was set up during 2017/18; however there has been no activity during the year.
8. Basis of Consolidation The financial statements of Norwich Regeneration Limited have been consolidated with those of Norwich City Council on a line by line basis which has eliminated balances, transactions, income and expenditure between the Council and the subsidiary. Prior year comparative figures have not been included on the basis that Norwich Regeneration Ltd’s transactions in 2016/17 were not material.

Norwich City Council - 2017-18 Statement of Accounts
132 132
132
132
Group Movement in Reserves Statement
Co
un
cil's
us
ab
le
Re
se
rve
s
Su
bs
idia
ry
us
ab
le
Re
se
rve
s
To
tal G
rou
p
us
ab
le
Re
se
rve
s
Co
un
cil's
un
us
ab
le
Re
se
rve
s
Su
bs
idia
ry
un
us
ab
le
Re
se
rve
s
To
tal G
rou
p
un
us
ab
le
Re
se
rve
s
To
tal G
rou
p
Re
se
rve
s
Balance at 31 March 2017 carried
forward 79,862 -4 79,858 512,334 - 512,334 592,192
Movement in reserves during
2017/18 - - - - - -
Surplus/ (deficit) on provision of
services 58,035 -206 57,829 - - - 57,829
Other Comprehensive Income &
Expenditure - - 25,317 - 25,317 25,317
Total Comprehensive Income &
Expenditure 58,515 (206) 58,309 25,317 - 25,317 83,626
Adjustments between group
accounts and authority accounts 480 -480 - - - - -
Adjustments between accounting
basis & funding basis under
regulations (note 7) (37,460) (37,460) 37,460 - 37,460 -
Net Increase/ (Decrease) before
Transfers to Earmarked Reserves 21,055 (686) 20,369 62,777 - 62,777 83,146
Transfers to/from Earmarked
Reserves (note 8) - - - - - -
Transfers between reserves 172 172 (172) - (172) -
Other Adjustments (10) (10) - - - (10)
Increase/(Decrease) in 2017/18 21,217 (686) 20,531 62,605 - 62,605 83,136
Balance at 31 March 2018 carried
forward 101,080 (690) 100,390 574,939 - 574,939 675,329

Norwich City Council - 2017-18 Statement of Accounts
133
Group Comprehensive Income and Expenditure Statement
Gro
up
No
tes
Gro
ss
Exp
en
dit
ure
Gro
ss In
co
me
Net
Exp
en
dit
ure
£'000 £'000 £'000
Business Services 71,723 (61,327) 10,046
Chief Executive 733 (18) 715
Communications & Culture 5,877 (1,132) 4,745
Regeneration & Growth 14,962 (11,156) 3,686
Neighbourhoods 18,671 (7,469) 11,202
Housing Revenue Account 3,899 (70,299) (66,400)
Norwich Regeneration Ltd 212 (4) 208
Cost of Services 116,077 (151,405) (35,328)
Other Operating Expenditure #VALUE! #VALUE! (3,290)
Financing and Investment Income
and Expenditure 9 #VALUE! #VALUE! 9,208
Taxation and Non-Specific Grant
Income - - (28,420)
(Surplus) / Deficit on Provision of
Services (57,830)
(Surplus) / deficit on revaluation of
non-current assets (14,699)
Actuarial (gains) / losses on
pension assets / liabilities (10,618)
Other Comprehensive (Income)
and Expenditure (25,317)
Total Comprehensive (Income)
and Expenditure (83,147)
2017/18
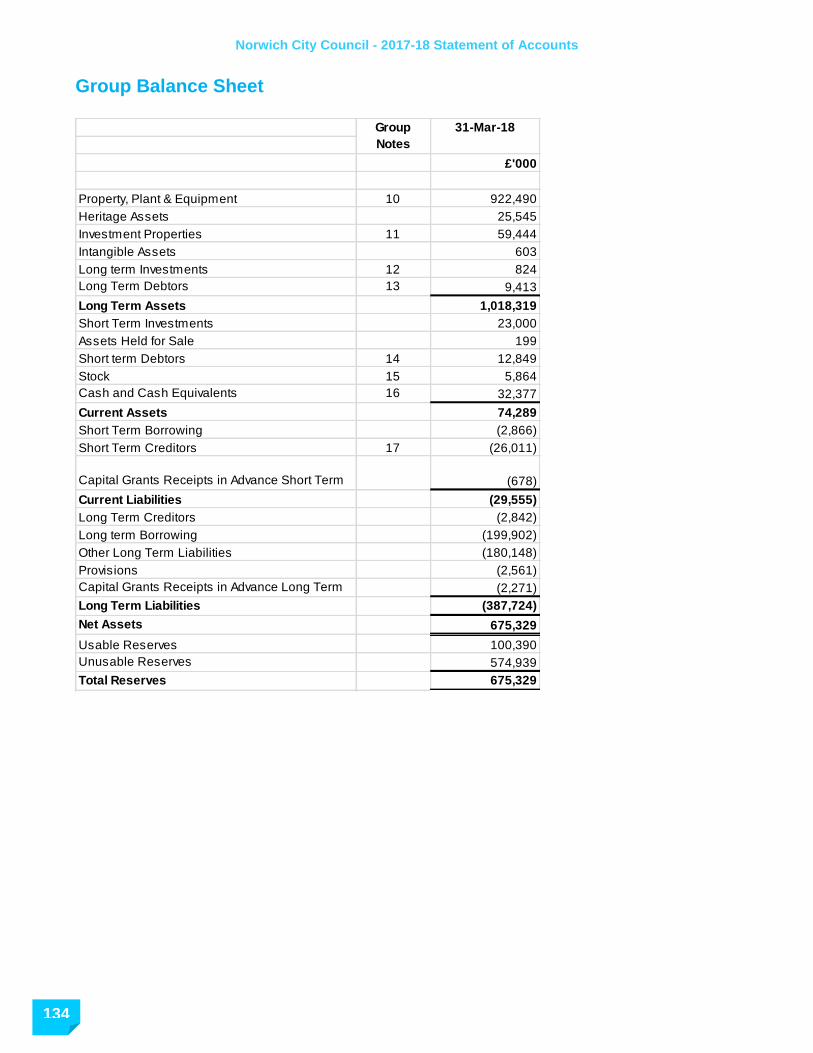
Norwich City Council - 2017-18 Statement of Accounts
134 134
134
134
Group Balance Sheet
£'000
Property, Plant & Equipment 10 922,490
Heritage Assets 25,545
Investment Properties 11 59,444
Intangible Assets 603
Long term Investments 12 824
Long Term Debtors 13 9,413
Long Term Assets 1,018,319
Short Term Investments 23,000
Assets Held for Sale 199
Short term Debtors 14 12,849
Stock 15 5,864
Cash and Cash Equivalents 16 32,377
Current Assets 74,289
Short Term Borrowing (2,866)
Short Term Creditors 17 (26,011)
Capital Grants Receipts in Advance Short Term (678)
Current Liabilities (29,555)
Long Term Creditors (2,842)
Long term Borrowing (199,902)
Other Long Term Liabilities (180,148)
Provisions (2,561)
Capital Grants Receipts in Advance Long Term (2,271)
Long Term Liabilities (387,724)
Net Assets 675,329
Usable Reserves 100,390
Unusable Reserves 574,939
Total Reserves 675,329
Group
Notes
31-Mar-18
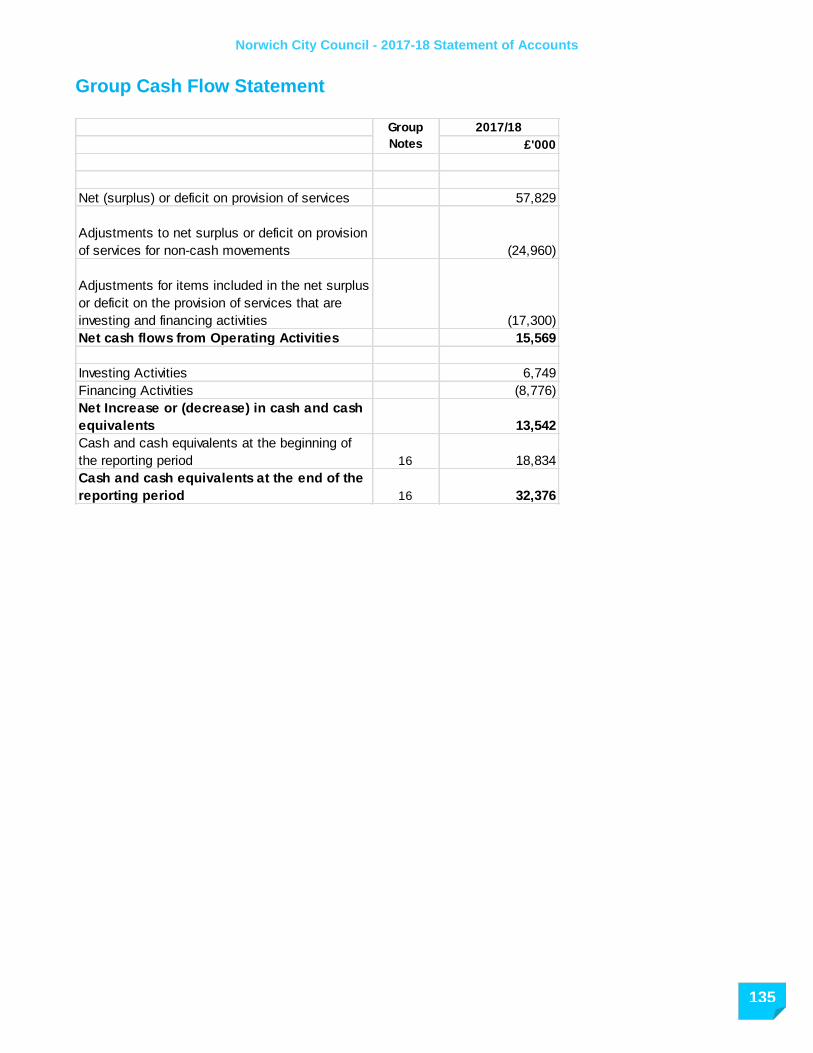
Norwich City Council - 2017-18 Statement of Accounts
135
Group Cash Flow Statement
2017/18
£'000
Net (surplus) or deficit on provision of services 57,829
Adjustments to net surplus or deficit on provision
of services for non-cash movements (24,960)
Adjustments for items included in the net surplus
or deficit on the provision of services that are
investing and financing activities (17,300)
Net cash flows from Operating Activities 15,569
Investing Activities 6,749
Financing Activities (8,776)
Net Increase or (decrease) in cash and cash
equivalents 13,542
Cash and cash equivalents at the beginning of
the reporting period 16 18,834
Cash and cash equivalents at the end of the
reporting period 16 32,376
Group
Notes

Norwich City Council - 2017-18 Statement of Accounts
136 136
136
136
Notes to the Group Accounts Group Boundary Norwich Regeneration Limited was incorporated on 13 November 2015. On 7 October 2016, the Council transferred 3.35 hectares of land at Bowthorpe at full market value to its wholly owned subsidiary Norwich Regeneration Limited in exchange for 22,000 £100 shares in the company. It is a subsidiary for accounting purposes, and has been consolidated into the Council’s group accounts. The Council has determined its associate relationships as follows:
NPS Norwich Ltd Associate Consolidated
Norwich Norse (Environmental) Limited Associate Consolidated
Norwich Norse (Building) Limited Associate Consolidated
Accounting Policies NRL has prepared 2017/18 accounts using accounting policies consistent with those applied by the Council, and no adjustments have been required to align accounting policies. Both entities have a financial year end of 31 March. Disclosure notes have only been restated in the group accounts section where they are materially different from those of the Council’s single entity accounts.
9. Financing and investment Income and Expenditure
2017/18
£'000
Interest payable and similar charges 8,791
Pension interest cost and expected return on
pension assets 4,634
Interest Receivable and similar income (302)
Income and expenditure in relation to
investment properties and changes in their
fair value (3,683)
Other investment income (12)
Impairment of Soft Loans 45
Total 9,208
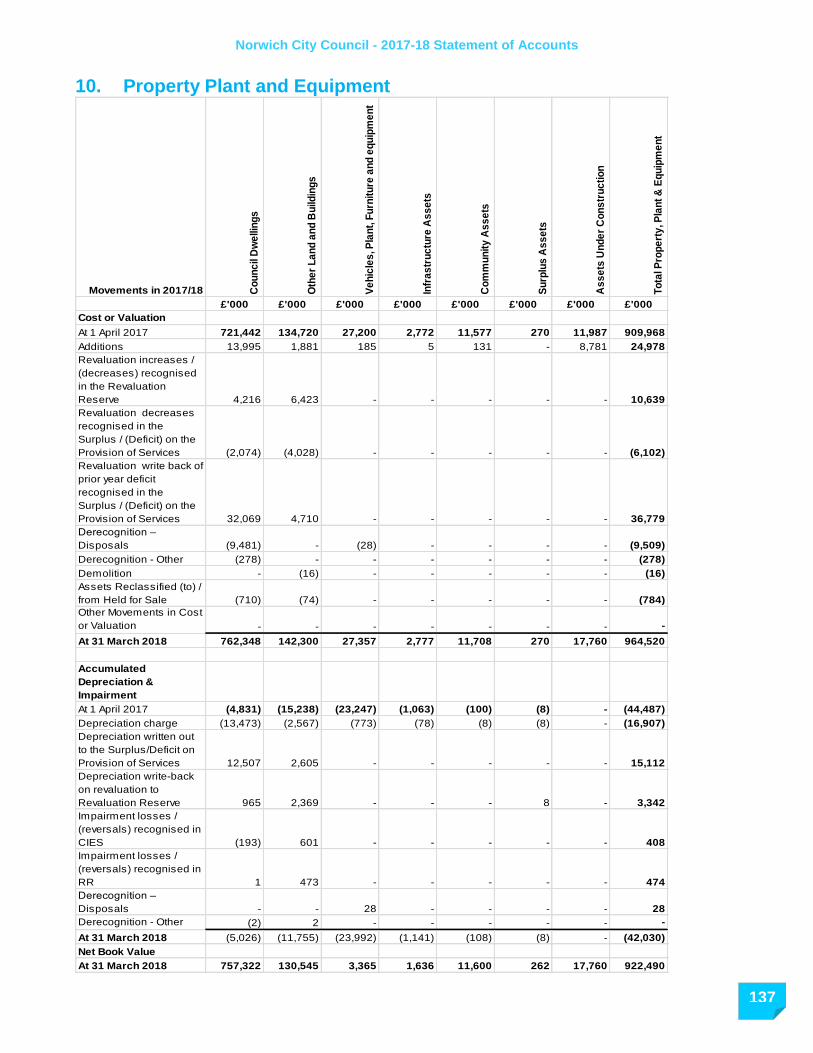
Norwich City Council - 2017-18 Statement of Accounts
137
10. Property Plant and Equipment
Movements in 2017/18 Co
un
cil
Dw
elli
ng
s
Oth
er
La
nd
an
d B
uild
ing
s
Ve
hic
les
, Pla
nt,
Fu
rnit
ure
an
d e
qu
ipm
en
t
Infr
as
tru
ctu
re A
ss
ets
Co
mm
un
ity
As
se
ts
Su
rplu
s A
ss
ets
As
se
ts U
nd
er
Co
ns
tru
cti
on
To
tal P
rop
ert
y, P
lan
t &
Eq
uip
me
nt
£'000 £'000 £'000 £'000 £'000 £'000 £'000 £'000
Cost or Valuation
At 1 April 2017 721,442 134,720 27,200 2,772 11,577 270 11,987 909,968
Additions 13,995 1,881 185 5 131 - 8,781 24,978
Revaluation increases /
(decreases) recognised
in the Revaluation
Reserve 4,216 6,423 - - - - - 10,639
Revaluation decreases
recognised in the
Surplus / (Deficit) on the
Provision of Services (2,074) (4,028) - - - - - (6,102)
Revaluation write back of
prior year deficit
recognised in the
Surplus / (Deficit) on the
Provision of Services 32,069 4,710 - - - - - 36,779
Derecognition –
Disposals (9,481) - (28) - - - - (9,509)
Derecognition - Other (278) - - - - - - (278)
Demolition - (16) - - - - - (16)
Assets Reclassified (to) /
from Held for Sale (710) (74) - - - - - (784)
Other Movements in Cost
or Valuation - - - - - - - -
At 31 March 2018 762,348 142,300 27,357 2,777 11,708 270 17,760 964,520
Accumulated
Depreciation &
Impairment
At 1 April 2017 (4,831) (15,238) (23,247) (1,063) (100) (8) - (44,487)
Depreciation charge (13,473) (2,567) (773) (78) (8) (8) - (16,907)
Depreciation written out
to the Surplus/Deficit on
Provision of Services 12,507 2,605 - - - - - 15,112
Depreciation write-back
on revaluation to
Revaluation Reserve 965 2,369 - - - 8 - 3,342
Impairment losses /
(reversals) recognised in
CIES (193) 601 - - - - - 408
Impairment losses /
(reversals) recognised in
RR 1 473 - - - - - 474
Derecognition –
Disposals - - 28 - - - - 28
Derecognition - Other (2) 2 - - - - - -
At 31 March 2018 (5,026) (11,755) (23,992) (1,141) (108) (8) - (42,030)
Net Book Value
At 31 March 2018 757,322 130,545 3,365 1,636 11,600 262 17,760 922,490

Norwich City Council - 2017-18 Statement of Accounts
138 138
138
138
The Council operates a 5-year rolling programme of revaluations in relation to land and buildings except for revaluation of Housing Revenue Account Assets which is carried out on an annual basis. The only non-current asset included in NRL’s Balance Sheet at the 31 March 2018 is land held by the NRL which is as yet undeveloped. It has been valued at cost (£1.045m at 31.03.18). Property, plant and equipment for the single entity is measured at current value and revalued at least every five years, by the Council’s external valuers NPS. The valuation cycle is shown in the table below and more details on the valuations can be found at note 14 to the single entity accounts.
VALUATION CYCLE
'000s Co
un
cil d
we
llin
gs
Oth
er
La
nd
&
Bu
ild
ing
s
Co
mm
un
ity
as
se
ts
Infr
as
tru
ctu
re
Ve
hic
les
, P
lan
t, &
Eq
uip
me
nt
AU
C
Su
rplu
s
pro
pe
rtie
s
To
tal P
PE
Valued at historical cost - 1,045 11,600 1,636 3,365 17,760 - 35,406
Valued at current value - - - - - - - -
2017-18 757,322 72,496 - - - - 262 830,080
2016-17 - 8,098 - - - - - 8,098
2015-16 - 18,508 - - - - - 18,508
2014-15 - 4,078 - - - - - 4,078
2013-14 - 26,320 - - - - - 26,320
Total 757,322 130,545 11,600 1,636 3,365 17,760 262 922,490
11. Investment Properties The following table summarises the movement in the fair value of investment properties over the year:
2017/18
£000
Balance at 1 April 41,773
Additions: 2,524
Purchases 13,433
Transfers
Disposals (414)
Net gains / (losses) from fair value adjustments 1,755
Transfers (to) / from Property, Plant & Equipment -
Balance at 31 March 59,443 The table above includes the investment properties which are held on NRL’s Balance Sheet. These are houses being built which will be held by the company when complete for rental to the private sector. This will generate an income stream for the company. The assets are included at cost.

Norwich City Council - 2017-18 Statement of Accounts
139
12. Long Term Investments
2017/18
£000
Equity Shareholding in Subsidiary 0
Norwich Airport Ltd 824
Norwich Preservation Trust 144
Total Long Term Investments 968
13. Long Term Debtors
Debtors Provision for
Bad Debt
Net Debtors
£000 £000 £000
Advances for House Purchase: Council
Houses Sold 3 - 3
Housing Act Advances - - -
Norfolk County Council Transferred Debt 865 - 865
Deferred Capital Receipt Sale of Airport
Shares 400 - 400
Deferred Capital Receipt – Livestock
Market - - -
Decent Home Loans 2,240 - 2,240
Finance Lease > 1 year 1,267 - 1,267
Home Improvement Loans 203 - 203
Local Authority Mortgage Scheme 1,000 - 1,000
Housing Benefit Overpayments 7,254 (4,918) 2,336
Shared Equity Dwellings 282 - 282
SALIX 334 - 334
Debts with legal charge over property 43 - 43
Wholly owned subsidiary - - -
Other Long Term Debtors 440 - 440
Total 14,331 (4,918) 9,413
2017/18
14. Short Term Debtors
2017/18
£000
Central Government Bodies 3,689
Other entities & individuals 7,260
Other Local Authorities 1,900
National Health Bodies -
Total Short Term Debtors 12,849

Norwich City Council - 2017-18 Statement of Accounts
140 140
140
140
15. Stock
2017/18
Property acquired or constructed for sale £000
Balance at start of year 28
Purchases 6,323
Recognised as an expense in year (1,270)
Transfers 783
Balance at end of year 5,864 The stock held on the balance sheet, relating to NRL, is the houses under construction that once complete will be sold on the open market
16. Cash and Cash Equivalents
2017/18
£000
Cash held by Council 11
Bank current accounts 7,876
Short term deposits with banks 3,590
Short term deposits with building societies 1,650
Short term deposits with Debt Management Office -
Short term deposits with local authorities 4,250
Money Markets 15,000
Total Cash & Cash Equivalents 32,377
17. Short Term Creditors
2017/18
£000
Central Government Bodies 1,971
Other Local Authorities 10,226
National Health Bodies 27
Trade Creditors 7,880
Receipts in Advance 2,737
Other entities & individuals 3,171
Total Short Term Creditors 26,012
Norwich City Council - 2017-18 Statement of Accounts
141
Glossary of Terms Accounting Period The period of time covered by the accounts, normally a period of twelve months, that commences on 1 April for local authority accounts. The end of the accounting period, i.e. 31 March, is the balance sheet date. Accrual A sum included in the final accounts attributable to the accounting period but for which payment has yet to be made or income received. Amortisation A measure of the consumption of the value of intangible assets, based on the remaining economic life. Asset An item having a value measurable in monetary terms. Assets can either be defined as fixed or current. A fixed asset has use and value for more than one year where a current asset (e.g. stocks or short-term debtors) can readily be converted into cash. Audit of Accounts An independent examination of the Council’s financial affairs, which ensures that the relevant legal obligations and codes of practice have been followed. Balance Sheet A financial statement that summarises the Council’s assets, liabilities and other balances at the end of the accounting period. Billing Authority A local authority charged by statute with the responsibility for the collection of and accounting for council tax, NNDR and residual community charge. These in the main are district council’s, such as Norwich, and unitary authorities. Budget A financial statement that expresses the council’s service delivery plans in monetary terms. This covers as a minimum the same period as the financial year but increasingly council’s are preparing medium-term financial plans covering 3 to 5 years. Capital Expenditure Expenditure to acquire fixed assets that will be used in providing services beyond the current accounting period or expenditure that adds value to an existing fixed asset. Capital Financing The raising of money to pay for capital expenditure. There are various methods of financing capital expenditure including borrowing, direct revenue financing, usable capital receipts, capital grants, capital contributions and revenue reserves. Capital Financing Requirement The capital financing requirement reflects the Council’s underlying need to borrow for a capital purpose. Capital Programme The capital schemes the council intends to carry out over a specified time period, often within a 6 to 10 year timeframe. Capital Receipt The proceeds from the disposal of land and other assets. Proportions of capital receipts can be used to finance new capital expenditure, within rules set down by the government, but they cannot be used for revenue purposes.

Norwich City Council - 2017-18 Statement of Accounts
142 142
142
142
Cash Equivalents Investments that mature in 90 days or less from the date of acquisition and that are readily convertible to known amounts of cash with insignificant risk of change in value. Chartered Institute Of Public Finance and Accountancy (CIPFA) The principal accountancy body dealing with local government finance. CIPFA Code of Practice on Local Authority Accounting This specifies the principles and practices of accounting to be followed when preparing the Statement of Accounts. It constitutes “proper accounting practice” and is recognised as such by statute. Collection Fund A separate fund maintained by a billing authority which records the expenditure and income relating to council tax, NNDR and residual community charges. Community Assets Assets that the Council intends to hold in perpetuity, that have no determinable useful life and that may have restrictions in their disposal. Examples of community assets are parks. Comprehensive Income and Expenditure Statement This statement reports the net cost for the year of all the functions for which the Council is responsible, and demonstrates how that cost has been financed from general government grants, and income from local taxpayers. It brings together expenditure and income relating to all the local authority’s functions. Consistency The concept that the accounting treatment of like items within an accounting period, and from one period to the next one is the same. Contingent Liability A possible obligation arising from past events, whose existence will be confirmed only by the occurrence of one or more uncertain future events, that are not wholly within the Council’s control. Creditor Amounts owed by the Council for work done, goods received or services rendered before the end of the accounting period but for which payments have not been made by the end of that accounting period. Debtor Amounts due to the Council for work done, goods received or services rendered before the end of the accounting period but for which payments have not been received by the end of that accounting period. Depreciation The measure of the cost or revalued amount of the benefits of a fixed asset that have been consumed during the accounting period. Effective Rate of Interest The rate of interest that will discount the estimated cash flows over the life of a financial instrument to the amount in the balance at initial measurement. Exceptional Items Material items which derive from events or transactions that fall within the ordinary activities of the Council, and which need to be disclosed separately, by virtue of their size or incidence, such that the financial statements give a true and fair view. Fair Value The amount for which an asset could be exchanged, or a liability settled, between knowledgeable, willing parties in an arm’s length transaction.
Norwich City Council - 2017-18 Statement of Accounts
143
Finance Lease A lease which transfers substantially all of the risks and rewards of ownership of a fixed asset to the lessee. Not the same as an Operating Lease (q.v.). Financial Instruments Any contract that gives rise to a financial asset of one entity and a financial liability or equity instrument of another. The term ‘financial instrument’ covers both financial assets (e.g. bank deposits and investments), and financial liabilities (e.g. trade payables and borrowings). Financial Reporting Standard (FRS) Financial Reporting Standards cover particular aspects of accounting practice, and set out the correct accounting treatment, for example, of depreciation. Compliance with these standards is normally mandatory and any departure from them must be disclosed and explained. Fixed Assets Tangible assets that yield benefits to the Council, and to the services it provides, for a period of more than one year. Housing Revenue Account A separate account to the General Fund, which includes the expenditure and income arising from the provision of housing accommodation owned by the Council. Impairment The term used where the estimated recoverable amount from an asset is less than the amortised cost at which the asset is being carried on the balance sheet. Infrastructure Assets Fixed assets belonging to the Council which do not necessarily have a resale value (e.g. highways), and for which a useful life-span cannot be readily assessed. Intangible Fixed Assets These are assets which do not have a physical substance, e.g. software licences, but which yield benefits to the Council and the services it provides, for a period of more than one year. Minimum Revenue Provision MRP is a charge to the revenue account in relation to capital expenditure financed from borrowing or credit arrangements Movement in Reserves Statement This statement precedes the Comprehensive Income and Expenditure Statement. It takes into account items, in addition to the Income and Expenditure Account surplus or deficit, which are required by statute, and non-statutory proper practices, to be charged or credited to the General Fund, Housing Revenue Account & other reserves Movement in Reserves Statement – Housing Revenue Account This statement follows the Housing Revenue Account Income and Expenditure Statement. It takes into account items, in addition to the Income and Expenditure Account surplus or deficit, which are required by statute, and non-statutory proper practices, to be charged or credited to the Housing Revenue Account. NNDR (National Non-Domestic Rate) National Non-Domestic Rate is a standard rate in the pound, set by the government, on the assessed rateable value of properties used for business purposes. Non-Current Asset Tangible assets that yield benefits to the Council, and to the services it provides, for a period of more than one year. Operating Lease A lease where the ownership of the fixed asset remains with the lessor. Not the same as a Finance Lease (q.v.).

Norwich City Council - 2017-18 Statement of Accounts
144 144
144
144
Outturn Refers to actual income and expenditure or balances as opposed to budgeted amounts. Precept The amount which a local authority, which cannot level a council tax directly on the public, requires to be collected on its behalf. The major precepting authorities are Norfolk County Council and Norfolk Police Authority. Provisions Monies set aside for liabilities which are likely to be incurred, but where exact amounts or dates are uncertain. Prudential Code The Prudential Code, introduced in April 2004, sets out the arrangements for capital finance in local authorities. It constitutes ‘proper accounting practice’ and is recognised as such by statute. Rateable Value The annual assumed rental value of a property, which is used for business purposes. Reserves The accumulation of surpluses and deficits over past years. Reserves of a revenue nature can be spent or earmarked at the discretion of the Council. Reserves of a capital nature may have some restrictions placed on them as to their use. Revenue Expenditure Spending on day to day items, such as employees’ pay, premises costs and supplies and services. Revenue Expenditure Funded from Capital under Statute (REFCUS) Expenditure which legislation allows to be classified as capital for funding purposes when it does not result in expenditure being carried on the Balance Sheet as a fixed asset. The purpose of this is to enable the expenditure to be funded from capital resources rather than be charged to the General Fund and impact on that years’ council tax. Revenue Support Grant The main grant paid by central government to a local authority towards the costs of their services. SERCOP (Service Reporting Code of Practice) The Service Reporting Code of Practice provides guidance on the content and presentation of costs of service activities within the CIES. It constitutes ‘proper accounting practice’ and is recognised as such by statute. Tangible Assets See Fixed Assets (q.v.) Transfer of Undertakings (Protection of Employment) Regulations (TUPE) This protects employees' terms and conditions of employment when a business is transferred from one owner to another. Employees of the previous owner when the business changes hands automatically become employees of the new employer on the same terms and conditions. Trust Funds Funds administered by the Council for such purposes as prizes, charities and specific projects, usually as a result of individual legacies and donations. Two Tier Authority In most areas of England, local government functions are divided between two tiers of local authority, county council’s, known as “upper tier” authorities and city, borough or district council’s, known as “lower tier” authorities.
145