report - tartu Ülikool · contents activity report 2011 rector’s foreword general data on the...
TRANSCRIPT

AN
NU
AL
REP
OR
T 20
11

University of tartUannUal report 2011
Name: University of TartuRegistration number: 74001073Address: Ülikooli 18, 50090 Tartu, EstoniaPhone: 372 737 5100Fax: 372 737 5440E-mail: [email protected]: http://www.ut.eeOwnership: legal person in public lawCore activities: 1) academic research activities 2) provision of higher education through integrated academic and research activities 3) provision of academic and research activities-based services to societyFinancial year: 1 January 2011 – 31 December 2011Auditor: PricewaterhouseCoopers ASCouncil: 50 membersChairman of the Council: Professor Alar KarisAttached: Auditor’s report
3
4
6
7
10
10
11
15
16
18
20
21
22
24
26
26
28
29
29
30
30
30
31
32
32
36
38
39
41
41
43
45
46
51
54
56
57
58
59
95
96

CONTENTSaCtivity report 2011reCtor’s foreWorD
General Data on tHe University of tartU, 2007–2011
strUCtUre of tHe University of tartU
stUDies
General DesCription of tHe stUDent BoDy
aDMission of stUDents
international stUDents anD stUDent eXCHanGe
DevelopMent of stUDy proGraMMes
teaCHinG QUality anD stUDy sUpport
GraDUation anD ContinUation of stUDies
DoCtoral stUDies
alUMni feeDBaCK
teaCHinG, DevelopMent anD Creative aCtivities in tHe reGions
researCH
pUBliCations
researCH aWarDs anD otHer reCoGnition
DevelopMent fUnD
Centres of eXCellenCe
researCH anD DevelopMent ContraCts
Cooperation WitH inDUstry
iDea laB
patents, patent appliCations anD inventions
ContriBUtion to soCiety
ContinUinG eDUCation
aCtivities of Ut MeMory institUtions
proMotinG sCienCe
CUltUre anD sports aCtivities
orGanisation
eMployees
partnersHips anD internationalisation
DevelopMent aCtivities
finanCinG aCtivities
ConsoliDateD finanCial stateMents 2011ConsoliDateD stateMent of finanCial position
ConsoliDateD stateMent of finanCial perforManCe
ConsoliDateD stateMent of CasH floWs
ConsoliDateD stateMent of CHanGes in net assets
notes to tHe ConsoliDateD finanCial stateMents
inDepenDent aUDitor's report
siGnatUres to annUal report 2011
3
4
6
7
10
10
11
15
16
18
20
21
22
24
26
26
28
29
29
30
30
30
31
32
32
36
38
39
41
41
43
45
46
51
54
56
57
58
59
95
96

2 3

UNIVERSITY OF TARTU
ACTIVITY REPORT 2011
2 3

For the University of Tartu, the year 2011 was marked by several important research initiatives and by preparations for significant reforms in the university’s governance. The year also brought a significant increase in the university’s international visibility.
According to the results of the Times Higher Education Ranking 2011 the University of Tartu is placed among the top 3% of universities worldwide. UT is the only one from the Baltics to have achieved such a high ranking. The uni-versity continues to hold a place on the top rung in life sciences (QS University Rankings). UT is also the first Estonian university to have achieved the top 1% ranking in engineering (Thomson Reuters Web of Science). These results are something that we can truly take pride in.
Another reason for satisfaction is that UT is attracting more and more school-leavers who have shown exceptional academic achievement and high results in international academic competitions. The 2011 reform of the univer-sity’s admissions system focused on academic quality: our threshold-based system was replaced with one based on rank lists. We have seen an almost 50% increase in the number of international students, and their academic qualifications have improved markedly. Another significant achievement lies in the record number of 152 PhD defences successfully completed in 2011 at UT. The university has also become the largest provider of continuing education in Estonia – the courses offered by UT in 2011 attracted over 30,000 learners.
The research conducted at UT is evaluated as top qual-ity in several fields. This is reflected in the international recognition of the university as well as by the number of research prizes granted to UT academics. It should not be underestimated that in addition to the fundamental research, the year 2011 at UT has seen the creation of exciting and innovative technological applications, and the launch of several research cooperation initiatives of considerable importance to the university and to Estonia as a whole. In 2011, UT established a 6.1m EUR research develop-ment fund which makes it possible to support outstanding research in the university in selected breakthrough fields.
RECTOR'S FOREWORD
4 5

RECTOR'S FOREWORD
UT’s development as an international university with an extensive network of international relations holds consider-able promise. During the year, public lectures were held at UT by a number of internationally renowned researchers, including Robert Gallo, Keith Devlin, Ronald Inglehart and others. UT also received visits from famous politicians. Un-der the aegis of the Coimbra Group, the university organised an international symposion on language and identity which brought together semioticians, linguists, social scientists and philosophers from across Europe. At the same time, many of the university’s teachers and researchers were working at universities abroad.
The university is a flexible and adaptable organisation. The year 2011 was a year of preparations for the transition to a new system of governance. A new council whose tasks and composition have been significantly modified and a senate – a novel body in the university’s structure – were convened. The university’s external partners are now directly involved in governing the university, which will forge stronger links between the university and the Estonian society.
UT’s finances are sound and our receipts show an increase largely on account of assistance from the EU’s structural funds. In 2011, the Philosophy Building at 2 Jakobi St and the Social Sciences and Education Building at 36 Lossi St were both overhauled. Construction work started on an academic building for the university’s Narva College. The university has also invested in renovating the Old Observa-tory and in design work for a new Physics building. All these projects improve the conditions that the University of Tartu offers for research and studies.
The results of 2011 show that the university has performed well. I wish all of you continued success in the future and I am sure that the university will continue to be seen as a reliable partner in the Estonian society and in the world at large.
Alar KarisRector of the University of Tartu
4 5

GENERALDATAONTHEUNIVERSITYOFTARTU,2007–2011
2007 2008 2009 2010 2011
EMPLOYEES
Number of employees 3 445 3 476 3 517 3 493 3 596
incl. academic staff 49.3% 48.5% 48.8% 49.4% 48.6%
Number of teaching and research staff 1 698 1 687 1 729 1 725 1 748
incl. PhD holders 54.8% 56.7% 58.8% 63.6% 67.3%
Number of professors 176 169 180 179 191
incl. female professors 19.3% 20.7% 21.1% 18.4% 19.4%
Percentage of international academic staff 4.5% 4.1% 4.5% 6.0% 6.4%
STUDENTS
Number of students 16 992 16 944 17 493 18 136 18 047
incl. first cycle of higher education 71.7% 70.4% 69.2% 68.0% 66.1%
incl. master's studies 21.3% 22.2% 23.2% 24.1% 25.7%
incl. doctoral studies 7.0% 7.4% 7.6% 7.9% 8.3%
Number of female students 11 807 11 792 12 127 12 325 12 172
incl. regular studies 67.5% 67.2% 66.7% 64.9% 64.1%
incl. Open University studies 74.2% 75.2% 75.7% 75.8% 75.9%
Number of students age 30 and over 4 115 4 039 4 032 4 224 4 418
incl. regular studies 10.3% 10.7% 11.1% 11.5% 12.9%
incl. Open University studies 56.5% 54.6% 52.2% 53.0% 53.7%
Number of international students 294 314 343 438 484
as a proportion of all students 1.7% 1.9% 2.0% 2.4% 2.7%
Number of graduates 3 549 2 937 2 726 3 145 3 132
incl. PhD graduates 97 77 100 109 152
RESEARCH PUBLICATONS
Number of publications 2742 2023 2127 2507 2479
incl. high-level (1.1, 1.2, 2.1, 3.1) publica-tions
45.4% 58.2% 58.7% 62.4% 64.3%
incl. number of publications of the ETIS category 1.1
670 651 775 943 952
STRUCTURE
Number of faculties 12 10 10 9 9
Number of study programmes 273 271 273 238 198
incl. number of English taught study pro-grammes in the first and the second cycles of higher education
2 3 6 8 9
BUDGET
Total budget revenues, mln € 109.0 116.8 123.9 114.1 118.2
incl. main budget revenues 85.9 102.0 96.5 101.3 106.2
incl. state-commissioned education 24.9 32.5 33.1 31.4 32.2
Research activities revenues percentage from the main budget revenues
43.4% 41.0% 40.0% 42.1% 41.3%
Total budget expenditures, mln € 101.4 124.6 118.5 113.0 127.2
incl. personnel expenditures 43.2% 42.4% 45.9% 49.8% 46.7%
All data as of 31.12.2011.The number of students does not include exchange students and medical residents.The first cycle of higher education includes professional higher education, Bachelor’s studies, integrated Bachelor’s and Master’s studies and what was formerly known as diploma studies. Master’s studies include the former one-year teacher training.References to publications are based on the classification scheme of the Estonian Research Information System. The number of study programmes includes programmes in which students were enrolled at the end of the year, and joint study programmes listed include only those in which UT is the coordinator.
6 7
STRUCTURE OF THE UNIVERSITY OF TARTU
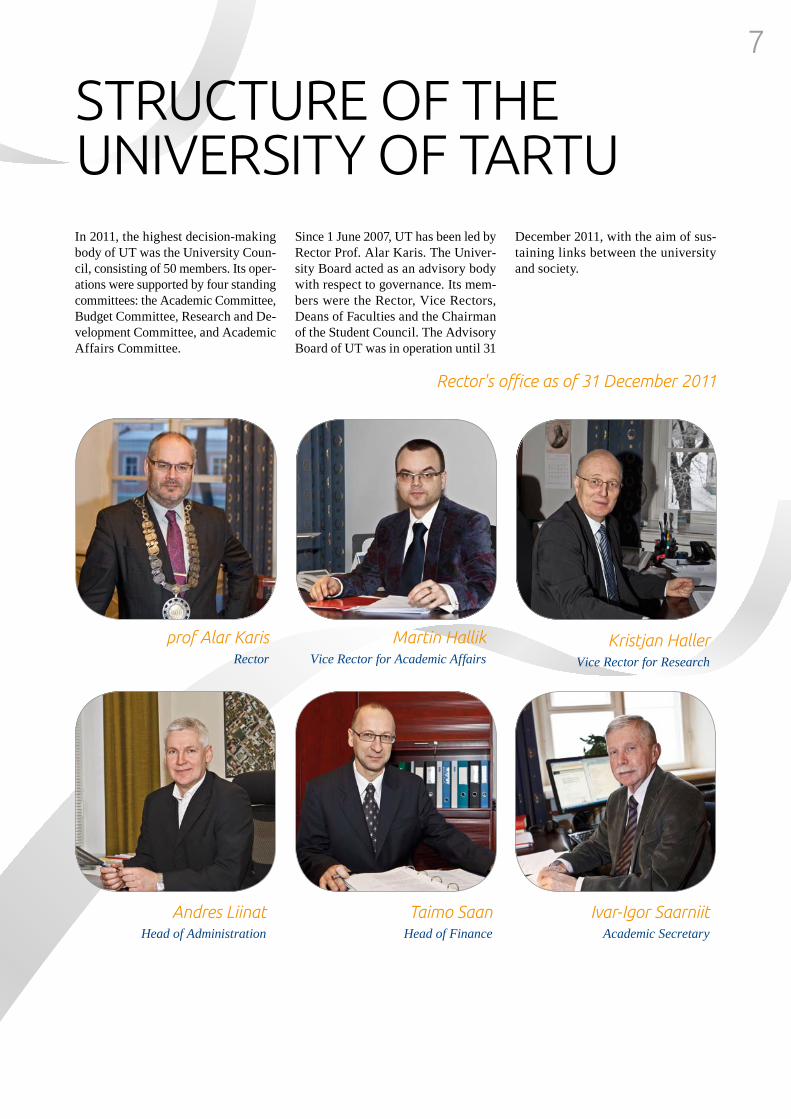
Rector'sofficeasof31December2011
AndresLiinatHead of Administration
profAlarKarisRector
MartinHallikVice Rector for Academic Affairs
KristjanHallerVice Rector for Research
TaimoSaanHead of Finance
Ivar-IgorSaarniitAcademic Secretary
In 2011, the highest decision-making body of UT was the University Coun-cil, consisting of 50 members. Its oper-ations were supported by four standing committees: the Academic Committee, Budget Committee, Research and De-velopment Committee, and Academic Affairs Committee.
Since 1 June 2007, UT has been led by Rector Prof. Alar Karis. The Univer-sity Board acted as an advisory body with respect to governance. Its mem-bers were the Rector, Vice Rectors, Deans of Faculties and the Chairman of the Student Council. The Advisory Board of UT was in operation until 31
December 2011, with the aim of sus-taining links between the university and society.
6 7
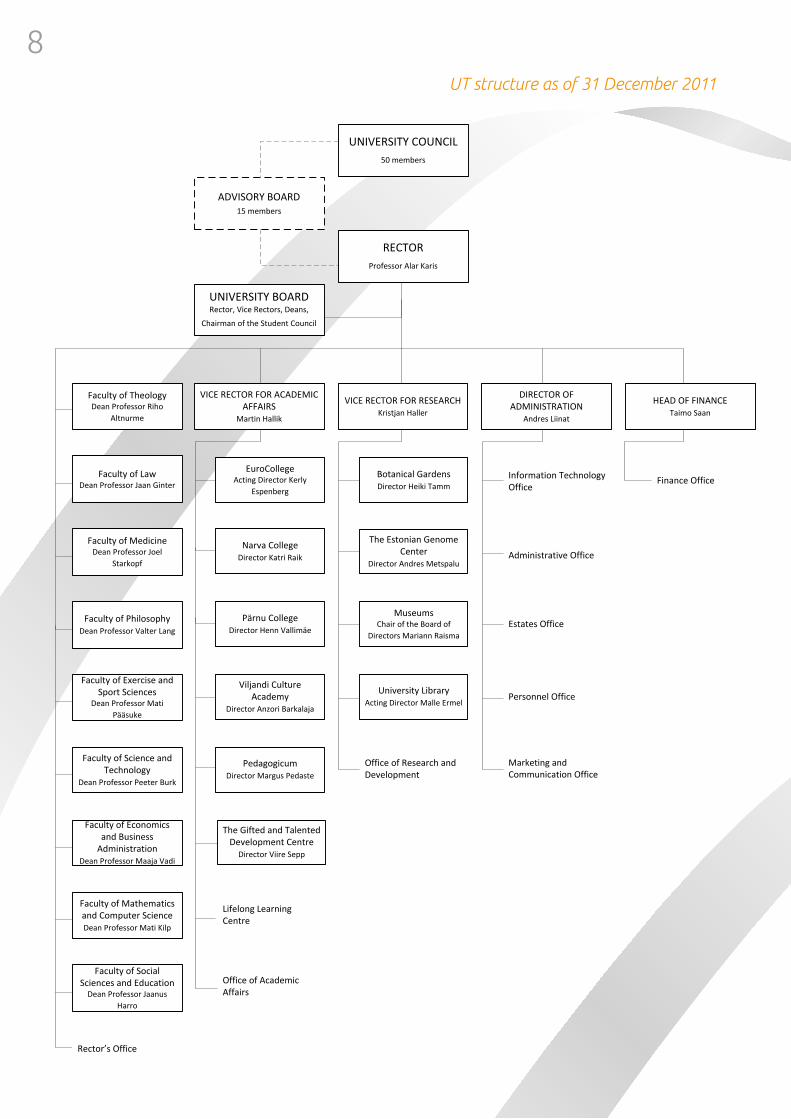
UTstructureasof31December2011
UNIVERSITY COUNCIL50 members
ADVISORY BOARD15 members
UNIVERSITY BOARDRector, Vice Rectors, Deans,
Chairman of the Student Council
RECTORProfessor Alar Karis
Office of Academic Affairs
Lifelong Learning Centre
EuroCollegeActing Director Kerly
Espenberg
Pärnu CollegeDirector Henn Vallimäe
Narva CollegeDirector Katri Raik
Viljandi Culture Academy
Director Anzori Barkalaja
The Gifted and Talented Development Centre
Director Viire Sepp
Office of Research and Development
University LibraryActing Director Malle Ermel
The Estonian Genome Center
Director Andres Metspalu
Botanical GardensDirector Heiki Tamm
MuseumsChair of the Board of
Directors Mariann Raisma
Administrative Office
Personnel Office
Marketing and Communication Office
Estates Office
Information Technology Office
Finance Office
Faculty of Science and Technology
Dean Professor Peeter Burk
Faculty of Exercise and Sport Sciences
Dean Professor Mati Pääsuke
Faculty of PhilosophyDean Professor Valter Lang
Faculty of MedicineDean Professor Joel
Starkopf
Faculty of LawDean Professor Jaan Ginter
Faculty of TheologyDean Professor Riho
Altnurme
Faculty of Economics and Business
AdministrationDean Professor Maaja Vadi
Faculty of Mathematics and Computer Science Dean Professor Mati Kilp
Faculty of Social Sciences and Education
Dean Professor Jaanus Harro
Rector’s Office
VICE RECTOR FOR ACADEMIC AFFAIRS
Martin Hallik
VICE RECTOR FOR RESEARCHKristjan Haller
DIRECTOR OF ADMINISTRATION
Andres Liinat
HEAD OF FINANCETaimo Saan
PedagogicumDirector Margus Pedaste
8 9
On 16 February 2011, the Estonian Parliament adopted the University of Tartu Act and amended the Universi-ties Act. These changed the govern-ance structure of UT and set out the responsibilities of UT as Estonia’s National University. The changes in the governance scheme include the es-tablishment of two parallel governing boards, the Senate and the Council; these take effect gradually, starting from 1 January 2012, but prepara-tions for the transition began in 2011. The elections for the UT Senate took place on 17-21 October. Sixteen of its 21 members (four representatives from each of four broad areas of teaching and research: humaniora, medicina, realia et naturalia, and socialia) were elected by the academic staff, and five student representatives were appointed by the Student Council. The Senate will be chaired by the Rector. The Government of the Republic, acting on a recommendation from the Minister for Education and Research, appointed the new University Council, consisting of 11 members, on 22 December 2011. The University Council and Senate be-gan work on 1 January 2012.
The structure of UT is divided into academic and support departments. At the end of 2011, the academic branch consisted of nine faculties, four col-leges and 12 other institutions (includ-ing six R&D institutes in the Faculty of Science and Technology). The ad-ministrative branch consisted of 10 subunits.
Türi College ceased activity on 29 August 2011, with its students trans-ferred to the Faculty of Science and Technology.
Over the course of the year, the Fac-ulties of Philosophy, Medicine, and Social Sciences and Education, Vil-jandi Culture Academy and the UT Museums modernised their internal structure. Under the Director of Ad-ministration, the functions of the In-ternational Relations Office and Com-munication Office were changed, and the two offices were merged to form the Marketing and Communication Office, which began operations on 1
June 2011. Its purpose is to increase UT’s competitiveness and visibility in Estonia and abroad.
Several university bylaws were amended to end the formal organisa-tional functions of the four broad areas of teaching and research. These four areas continue to be the informal basis for teaching and research cooperation between academic units.
Breakdownoffacultiesandcollegesintofourareasof
teachingandresearch:
humanioraFaculty of Theology, Faculty of Philos-opy, Viljandi Culture Academy
socialiaFaculty of Law, Faculty of Economics and Business Administration, Faculty of Social Sciences and Education, Eu-roCollege, Narva College, Pärnu Col-lege
medicinaFaculty of Medicine, Faculty of Exer-cise and Sport Sciences
realia et naturaliaFaculty of Science and Technology, Faculty of Mathematics and Com-puter Science, Türi College (until 29.08.2011)
8 9

STUDIES GENERALDESCRIPTIONOFTHESTUDENTBODYAs of the end of 2011, 18,047 students were enrolled at UT. Of these, 183 were enrolled in joint study programmes coordinated by UT (54 students), Tallinn University of Technology (122 students) and Tallinn University (7 students).
The number of students attending regular studies, Open University studies and in total, 2002–2011
28% of UT’s students (5106 persons) attended the Open University in 2011. 36% of all our students (6515 persons) were in state-commissioned student places. In 2006, this figure exceeded 44%. In the academic year 2011/2012, the share of non-state-commissioned student places decreased by 6% and that of state-commissioned student places increased by 3%.
The number of UT students in state-commissioned and non-state-commissioned student places in the period 2002–2011
The share of doctoral and master’s students has increased over the last five years, exceeding one-third of the whole student body in 2011/2012. Whereas the number of students in the first cycle of higher education, including integrated bachelor’s and master’s studies, has decreased by 3%, compared to 2010/2011, the numbers of master’s and doctoral students have increased by 6% and 4%, respectively.
10 111 9 574 9 700 10 279 9 846 9 567 9 744 10 384 11 220 11 532
7 028 7 461 7 652 7 988 7 898 7 425 7 200 7 109 6 916 6 515
0% 20% 40% 60% 80% 100%
2002 2003 2004 2005 2006 2007 2008 2009 2010 2011
State-commissioned student places Non-state-commissioned student places
12 6
75
12 4
43
12 5
05
12 8
81
12 3
23
11 8
68
11 8
65
12 3
93
12 9
79
12 9
41
4 46
4
4 59
3
4 85
1
5 38
6
5 42
1
5 12
4
5 07
9
5 10
0
5 15
7
5 10
6
17 036 18 267
16 992 17 493 18 047
0
5 000
10 000
15 000
2002 2003 2004 2005 2006 2007 2008 2009 2010 2011
Regular studies Open University studies Total number of students
10 11

In the 2011/2012 academic year, UT’s nine faculties had 15,220 students. The two faculties with the largest number of students were the Faculty of Philosophy and the Faculty of Social Sciences and Education, with 3062 each, while the two smallest faculties in student numbers, the Faculty of Theology and the Faculty of Exercise and Sport Sciences, had 288 and 574 students, respectively.
The number of students enrolled in UT faculties, 2011/2012
UT’s four colleges had 2827 students (16% of the student body). Their distribution varied: while Viljandi Culture Academy had 1035 students, EuroCollege had only 103. The greatest increase in student numbers was in Narva College (by 7%) and the Faculty of Science and Technology (by 6%, due to the transfer of students from Türi College). The greatest decrease in student numbers occurred in the Faculty of Law (by 6%) and Pärnu College (by 3%).
The number of students enrolled in UT colleges, 2010–2011
Breakdown of UT students by areas of teaching and re-search in 2011/2012: 45% in socialia, 24% in humaniora, 19% in realia et naturalia and 12% in medicina.
The number of students in the four areas of teaching and research in 2002, 2007 and 2011
The number of students in the four areas of teaching and research and cycles, 2011/2012
ADMISSIONOFSTUDENTSGOAL: UT seeks to attract an international, talented, dedicated and motivated student body
4578 students began their studies at UT in the academic year 2011/2012; this is 735 less than in 2010/2011. Fewer students were admitted due to plans to review our teach-ing capacity, increase academic requirements and admit student can-didates on the basis of their ranking list, not a certain threshold.
According to the Min-istry of Education and Research, 10,080 young people received general secondary education in Estonia in 2010/2011 (ca. 5% less than in the previous academic year). A bit more than 57% of them went to a university in Estonia in 2011/2012 (62% in 2010/2011). Of all upper secondary school graduates who entered a university, 74% chose public universities in Estonia.
2011/2012 breakdown of new students who had completed general secondary education in the academic year 2010/2011 (Source: Estonian Education Information System EHIS)
Of all Estonian upper secondary school leavers who scored 90 or more points in at least one national examination, 46% chose UT, and 55% of those who scored 100 points in at least one national examination chose UT for their studies.
137
100
694
972
991
103
742
947
1 035
0 250 500 750 1000
Türi College
EuroCollege
Narva College
Pärnu College
Viljandi Culture Academy
2011
2010
288 574
944 1 300
1 509 2 044
2 437 3 062 3 062
0 1000 2000 3000
Faculty of Philosophy Faculty of Social Sciences and Education
Faculty of Science and Technology Faculty of Law
Faculty of Medicine Faculty of Economics and Business
Administration Faculty of Mathematics and Computer Science
Faculty of Exercise and Sport Sciences
2 949 5 544 1 814 1 616
1 063
2 311
998 259
373
343
569
208
0
2 000
4 000
6 000
8 000
humaniora socialia realia et naturalia medicina
First cycle of higher education Master's studies Doctoral studies
3 069
3 898
4 385
3 377
2 962
3 381
2 421
1 969
2 083
8 272
8 163
8 198
0% 25% 50% 75% 100%
2002
2007
2011
humaniora realia et naturalia medicina socialia
Out of all Estonian upper secondary school leavers who entered a university, 26% chose UT
28%
8%
16%
22%
26%
0% 10% 20% 30%
Other Estonian higher education institutions
Estonian University of Life Sciences
Tallinn University
Tallinn University of Technology
University of Tartu
10 11

Schools with the greatest number of 2011 graduates con-tinuing their studies in UT in the academic year 2011/2012:
Miina Härma Gymnasium 66%
Hugo Treffner Gymnasium 63%
Tallinn French Lyceum 49%
Tallinn Secondary Science School 47%
Pärnu Sütevaka Private High School of Humanities
42%
Tartu Tamme Gymnasium 41%
UT was the only university that attracted upper-secondary graduates from both Tartu County and Harju County (pop-ulation register data, November 2011). According to the county-based breakdown of all general secondary school graduates in 2011 who were admitted into the first cycle of higher education, and the county-based breakdown of those admitted to UT, the share of new students from the northern Estonian regions is slightly below the average.
Proportions of upper secondary school graduates of Tartu and Harju Counties among those in the first cycle of higher education, 2011/2012 (Source: EHIS)
Of the young people admitted to the first cycle of higher education in Estonia in 2011/2012, 11% had graduated from an upper secondary school with Russian as the language of instruction. The share of such students in public universities differed greatly, from 4% in the Estonian Academy of Music and Theatre to 19% in Tallinn University of Technology. UT had 6% of such students in the first cycle.
Proportion of graduates from Russian schools in public universities in 2010 and 2011 (Source: EHIS)
Breakdown of upper-secondary graduates admitted to UT in 2011/2012, by place of residence and compared to all gradu-ates; number of students admitted and their share among all school-leavers who continued their studies (Source: EHIS)
37%
7%
47%
50%
28%
14%
31%
7%
4%
26%
0% 10% 20% 30% 40% 50% 60%
Harju County Tartu County
University of Tartu
Tallinn University
Tallinn University of Technology
Estonian University of Life Sciences
All higher education institutions
4%
5%
4%
21%
9%
6%
6%
4%
5%
19%
9%
6%
0% 3% 6% 9% 12% 15% 18% 21%
a.y. 2011/2012
a.y. 2010/2011 University of Tartu
Tallinn University of Technology
Tallinn University
Estonian University of Life Sciences
Estonian Academy of Music and Theatre
Estonian Academy of Arts
Hiiu County8 (14%)
Saare County43 (24%)
counties with above-average university enrolment rate
Lääne County32 (30%)
Harju County430 (20%)
Rapla County35 (23%)
Pärnu County127 (29%)
Viljandi County71 (30%)
Järva County35 (23%)
Lääne-Viru County56 (16%)
Ida-Viru County116 (22%)
Jõgeva County49 (28%)
Tartu County387 (50%)
Põlva County37 (25%)
Võru County53 (27%)
Valga County30 (24%)
counties with average university enrolment rate
counties with below-average university enrolment rate
12 13

129 successful participants in olympiads enrolled in UT in 2011/2012 (a 42% increase). Law, Medicine, Physics, Informatics and Chemistry were their most popular fields of study. Of the best upper-secondary graduates who chose UT in 2011/2012, 433 had been awarded a gold or silver medal for outstanding grades or had the highest grade point average in their year. The most popular subjects among the medallists were Medicine (85 students), Law (34), Biol-ogy (23), Economics (20), Special Education (16) and Gene Technology (16). 1083 student candidates took an academic test in 2011. Of these, 39 opted for the respective studies on special conditions, preferring the faculties of Medicine and Law.
Access to the first cycle of higher education was granted to 2864 students in 2011/2012. 2141 students started regular studies, 27% of them in non-state-commissioned student places. 723 students began studies at the Open University, 73% of them in non-state-commissioned student places. Due to the changes in admission requirements, the number of students who were granted access to the first cycle of higher education in 2010/2011 decreased by 686 from the previous year.
In the following study programmes, the student in the ranking list with the lowest entrance exam score of those who were admitted received over 90 points: Law, English Language and Literature, Romance Studies, Scandinavian Languages and Cultures, Entrepreneurship, and Dance Arts. Ten first-year students at UT had received 100 points in their entrance exams. They came from Valga Gymnasi-um, Jõgeva Gymnasium, Tallinn French Lyceum, Tallinn German Gymnasium, Haapsalu Wiedemann Gymnasium, Pärnu Sütevaka Private High School of Humanities, Tallinn School No. 21, Hugo Treffner Gymna-sium and Gustav Adolf Gymnasium.
The fiercest competition for access to the first cycle of higher education (regular studies) was in the following study pro-grammes:
Study programme / No. of applicants per student place
Psychology 16.9
Romance Studies (Spanish Language and Literature)
16.7
Entrepreneurship and Project Management 14.6
Physiotherapy 13.5
Business Administration (in English) 12.5
Law 12.4
Scandinavian Languages and Cultures (Danish philology)
11.7
English Language and Literature 10.7
Environmental Management and Planning 10.5
The number of new master’s students admitted in the 2011/2012 academic year was 1465. 941 students began regular studies, 18% of them in non-state-commissioned student places. 524 students were admitted to the Open University, 66% of them to non-state-commissioned places. The number of new students in master’s programmes in this academic year was similar to that of the previous year; however, the number of state-commissioned student places increased.
Of the new master’s students, 77% were UT graduates; 5% had graduated from Tallinn University and 2% from the Estonian University of Life Sciences, Tallinn University of Technology and Tartu Health Care College (each). 40 students who had graduated with honours (cum laude) from Estonian universities were admitted to state-commissioned student places on special conditions.
Access to doctoral programmes was requested by 465 stu-dents in 2011/2012; the figure is similar to that of the previ-ous academic year. 249 of the applicants were enrolled, 161 of them to state-commissioned student places. 25 of the new doctoral students (10% of all admitted PhD students)
were from abroad.
Every fourth first-year stu-dent at UT in regular studies is either a medallist or one of the best performers in an olympiad
Study programmes in which the minimum score of students admitted to state-commissioned places increased the most from the previous year
Study programme 2010 minimum score 2011 minimum score
Environmental Management and Planning 70.7 86.7
Theology 66.0 78.0
Computer Science 59.3 69.5
Mathematical Statistics 76.3 86.3
Special Education 75.0 84.2
School Music 81.0 90.0
12 13

2 046 1 567
650 574 197 196
657 527
748
776
188 165
170 179
391 345
0
500
1 000
1 500
2 000
2 500
3 000
2010 2011 2010 2011 2010 2011 2010 2011
State-commissioned Non-state-commissioned State-commissioned Non-state-commissioned
Regular studies Open University studies
Master's studies
First cycle of higher education
The number of students granted access to the first two cycles of higher education at UT in 2010 and 2011, by source of funding and form of study
Responses of first-cycle, first-year students in 2011/2012 to the question ‘Please assess the relevance of the following factors in starting your studies at UT.’
Responses of first-cycle, first-year students in 2011/2012 to the question ‘Please assess the relevance of the following fac-tors in choosing your study programme’
In the autumn of 2011, a feedback survey was conducted for the third time among first-year students of the two first cy-cles of higher education at UT, with a response rate of 45% (1854 students responded to the survey). Reasons given by the respondents for choosing UT included the quality of education, the location of the university and favourable admission requirements.
99% of the students in the first and second cycles of higher education claimed to have chosen their study programme
in the field of study that interested them. 81% of students in the first cycle also wanted the field of study to guarantee easy access to the labour market. 71% of master’s students men-tioned that a master’s degree was necessary for finding a suitable job. Students in both these cycles considered it to be important to have access to state-commissioned student places, or that the tuition fee be affordable.
First-year students at UT con-sider their education to be of high quality. They chose their study programme on the basis of their interests, affordability of tuition fees and employment perspectives
3%
2%
9%
25%
36%
34%
29%
80%
6%
9%
12%
30%
30%
39%
40%
19%
21%
19%
23%
29%
20%
19%
23%
70%
70%
56%
16%
14%
8%
8%
0% 20% 40% 60% 80% 100%
I was not admitted elsewhere
My parent(s) studied at the University of Tartu
The tuition fee was more affordable than elsewhere
The speciality is not taught in other institutions of higher education
The speciality is not taught elsewhere in the form of Open University
Location
The admission rules were favourable for me
I believe that the education provided by UT is of high-quality
very important important not important not important at all
5%
7%
12%
30%
39%
32%
75%
7%
10%
32%
20%
39%
30%
49%
24%
18%
18%
41%
25%
16%
14%
16%
74%
66%
20%
43%
15%
17%
3%
0% 20% 40% 60% 80% 100%
I made a decision following career consulting
I was not admitted to the study programme of my first preference
Parents/relatives/acquaintances and others recommended it
My prior learning and professional experience are recognised (RPL) upon completion of the curriculum
I want to raise my qualifications (i.e due to my job)
Money (tuition-free studies/affordable tuition fee)
It is easy to find a job in this field after graduation
The specialisation is of interest
very important important not very important not important at all
14 15

New international students in each cycle in Estonia’s universities in the academic year 2011/2012 (Source: EHIS)
INTERNATIONALSTUDENTSANDSTUDENTEXCHANGE
At the end of 2011, there were 484 international degree students at UT (2.7% of the student body). The proportion of international students in PhD programmes, master’s pro-grammes and the first cycle of higher education was 6.7%, 4.7% and 1.4%, respectively. They came from Finland, Russia, Latvia, Ukraine, the USA and 59 other countries.
The areas of teaching and research with the highest numbers of international students, all cycles included, were realia et naturalia and humaniora. In the last five years, the share of international students has increased every year in realia et naturalia and decreased slightly in medicina. The percent-age of international students in socialia almost doubled in 2011/2012, compared to the previous academic year.
International students at UT by areas of teaching and re-search, 2007–2011
The share of bachelor’s programmes and professional higher education in programmes offered to international students has been decreasing. The number of international students enrolled in the first cycle of higher education, including integrated bachelor’s and master’s studies, was 165 (34% of all international students) at the end of 2011.
The number of international students in master’s and doc-toral programmes was 216 and 103, respectively (24% and 8% more than at the end of 2010). 45% of all international students at UT were master’s and 21% doctoral students.
International students at UT, by cycles of higher education, 2002–2011
Every other international doctoral student who began his/her studies in Estonia in 2011/2012 came to UT, and UT was the choice of 40% of the master’s students who started their studies in Estonia.
An overview of international student exchange in the aca-demic year 2010/2011 can be made at the end of 2011. 380 international exchange stu-dents were admitted to UT in 2010/2011, which is almost 12% more than in the previ-ous year. Within the EU’s student exchange programme Erasmus, 203 exchange students attended UT (a 15% in-crease). A quarter of the exchange students in the Erasmus Programme came from one of UT's partner universities in Germany.
Students from Poland, Italy and the Netherlands were also very interested in studying at UT. 61 students came to UT on the basis of bilateral agreements: 21 from Russia and 15 from the USA. The DoRa Programme for internation-alisation and doctoral studies has been in place with sup-port from the EU structural funds since 2008/2009. It has brought international exchange students to our PhD pro-grammes and supported short-term doctoral studies and research here. A total of 30 students from 22 countries used this opportunity in 2010/2011 (22 students from 16 countries in 2009/2010).
The numbers of inter-national degree stu-dents and international exchange students grew 10% and 12% in a year
34
40
57
121
151
46
46
48
57
109
74
87
109
123
122
116
116
110
110
102
0% 20% 40% 60% 80% 100%
2007
2008
2009
2010
2011
realia et naturalia socialia humaniora medicina
238 239
227 224
213 191
189 170
168 165
19 15
16 26
32 44
56 92
175 216
11 18
23 37
46 59
69 81 95 103
0% 20% 40% 60% 80% 100%
2002 2003 2004 2005 2006 2007 2008 2009 2010 2011
First cycle of higher education Master's studies Doctoral studies
24
82
23
17
67
101
3
19
44
3
4
1
24
6
1
9
2
5
120
0% 10% 20% 30% 40% 50% 60% 70% 80% 90% 100%
Doctoral studies
Master's studies
Bachelor's studies
University of Tartu Tallinn University of Technology Tallinn University Estonian University of Life Sciences Estonian Academy of Music and Theatre Estonian Academy of Arts Estonian Business School
14 15

According to our data, the number of UT students who went abroad as exchange students was 479 in 2010/2011. Their number increased by 19% (77 people) from the previous academic year. Of the students who studied or received practical training abroad, 284 or 60% used the Erasmus Programme. The number of Erasmus exchange agreements signed by UT’s faculties and colleges reached 700 by the end of 2011, which is 50 more than in 2010. The most popular destination countries were Spain (30% of the exchange students), France (13%) and Germany (13%).
150 students applied for a study abroad period on the basis of bilateral agreements, but only 66 were granted due to limited places. Their number increased by almost 18%, compared to 2009/2010. The biggest number of outgoing exchange students went to the USA, Germany and Russia.
In addition to the Erasmus Programme and bilateral co-operation agreements with partner universities, also other programmes were used for study abroad. These were: In-ternational Student Exchange Program (ISEP); AEN and MAUI, student exchange programmes of the Utrecht Net-work; the scholarship programmes of Kristjan Jaak and DoRa; the Nordplus Programme; and intergovernmental partnership agreements. The DoRa programme was the most popular of these, supporting 47 students in studies abroad. The grants from the Kristjan Jaak Scholarship Programme were used by 25 students.
80 exchange students from UT went to other higher educational institutions in Estonia in the academic year 2010/2011. Of these, the most popular ones among our students in the last three years were Tallinn University (50–60%), Tallinn University of Technology and the Esto-nian University of Life Sciences. UT received 677 exchange students from other Estonian institutions of higher educa-tion, mainly from the Estonian Aviation Academy (35%), Estonian University of Life Sciences (31%) and Tallinn University (10%).
DEVELOPMENTOFSTUDYPROGRAMMES
GOAL: UT provides education through study pro-grammes that have passed quality assessment; and aims to reduce their fragmentation and develop international study programmes
The number of UT’s study programmes has been constantly decreasing. While at the end of 2010, UT had 238 study programmes, by the end of 2011 their number was reduced to only 198. In 2011/2012, students were admitted to 177 study programmes, including six joint programmes.
Transitional evaluation of Estonian higher education in-stitutions was completed in 2011. 77 of UT's study pro-grammes in 14 groups passed the evaluation in 2011. During the period 2009–2011, a total of 22 programme groups of UT were evaluated. 14 of these were evaluated without evaluation visits. As the evaluation took place by cycles of education, a total of 65 evaluation decisions were made regarding UT. In the following six programme groups UT was granted the right to conduct studies for a specified term: languages and culture (professional higher education), arts (bachelor’s and master’s studies), performing arts (master’s studies), teacher training and education science (master’s and doctoral studies).
The number and breakdown of study programmes by levels of study, 2011/2012 admission:
Professional higher education 16 9%
Bachelor’s studies 45 25%
Integrated bachelor’s and master’s studies
5 3%
Master’s studies 77 44%
Doctoral studies 34 19%
Total 177 100%
International study programmes and joint programmes, 2011/2012:
Erasmus Mundus joint programmes Academic unit
International Masters in Economy, State & Society (IMESS) Faculty of Social Sciences and Education
International Masters in Russian, Central and East European Studies (IMRCEES)
Faculty of Social Sciences and Education
NordSecMob-Master’s programme in Security and Mobile Computing Faculty of Mathematics and Computer Sci-ence
16 17
GOAL: UT supports the development of various teach-ing and study methods and the daily use of technology in classrooms
The number of online courses at UT increased in 2010. Online courses are mostly used in combination with class work in order to facilitate students’ individual work. Fully online courses amounted to 13% of all online courses. In 2011, the university had nine educational technologists who advised our teaching staff in developing and conducting online courses.
According to the Study Information Sys-tem, in 2011 UT had 850 web-based or partially web-based courses (526 in 2010) with 26,870 participants (12,857 more than in 2010).
At the end of 2011, Moodle, UT’s web-based study environ-ment, had 18,902 users (1.8 times as many as a year earlier) and 1475 courses. A new e-learning training course, ‘My online course worthy of a quality mark’, was developed within the framework of the Primus Programme with the support of EU structural funds in 2011. E-learning training courses were offered within 11 courses, and regular online luncheons on various topics were conducted for teaching staff. The BeSt Programme, an e-learning programme, re-sulted in 68 new online courses and 115 learning objects in 2011.
The Best Online Course of the Year Award 2011 with a grant was given to Riina Runnel, Assistant in Oral and Dental Diseases of the UT Clinic of Stomatology, for an online course entitled ‘Propaedeutics in Oral and Dental Diseases’. The competition was organised among higher and vocational education institutions by the Estonian E-Learning Development Centre.
UTTV (UT Television), the video portal of UT, was launched in 2010. At the end of 2011, it contained 229 publicly accessible video lectures. In their administrative work, teaching or research, our academic staff and students can use the online-seminar
software that allows for synchronous presentations, audio and video conferences, sharing files in various formats and a feed from their computer monitor, and a common chatroom and whiteboard. 49 members of teaching staff used 67 seminar rooms in 2011, and online-seminar facilities were used for 3147 hours and 18 minutes.
Two issues of e-TÜ, UT’s web-based e-learning magazine (http://www.etu.ut.ee/), were published in 2011; it had 891 readers in April and 817 readers in October.
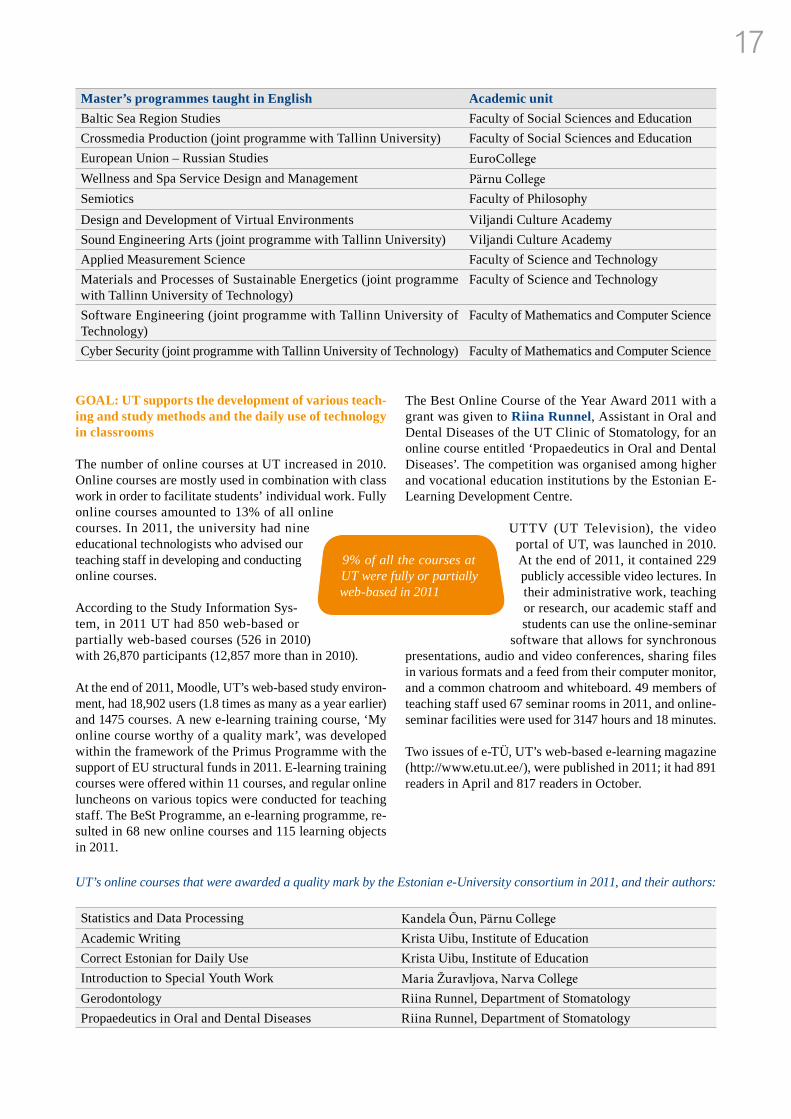
Master’s programmes taught in English Academic unit
Baltic Sea Region Studies Faculty of Social Sciences and Education
Crossmedia Production (joint programme with Tallinn University) Faculty of Social Sciences and Education
European Union – Russian Studies EuroCollegeWellness and Spa Service Design and Management Pärnu CollegeSemiotics Faculty of Philosophy
Design and Development of Virtual Environments Viljandi Culture Academy
Sound Engineering Arts (joint programme with Tallinn University) Viljandi Culture Academy
Applied Measurement Science Faculty of Science and Technology
Materials and Processes of Sustainable Energetics (joint programme with Tallinn University of Technology)
Faculty of Science and Technology
Software Engineering (joint programme with Tallinn University of Technology)
Faculty of Mathematics and Computer Science
Cyber Security (joint programme with Tallinn University of Technology) Faculty of Mathematics and Computer Science
UT’s online courses that were awarded a quality mark by the Estonian e-University consortium in 2011, and their authors:
Statistics and Data Processing Kandela Õun, Pärnu CollegeAcademic Writing Krista Uibu, Institute of Education
Correct Estonian for Daily Use Krista Uibu, Institute of Education
Introduction to Special Youth Work Maria Žuravljova, Narva CollegeGerodontology Riina Runnel, Department of Stomatology
Propaedeutics in Oral and Dental Diseases Riina Runnel, Department of Stomatology
9% of all the courses at UT were fully or partially web-based in 2011
16 17

TEACHINGQUALITYANDSTUDYSUPPORT
GOAL: UT takes into account the needs and expecta-tions of students to improve study-support services
Each year, students are asked for feedback on the courses and teaching and instruction skills of the teaching staff. The surveys were conducted at the end of each course and were compulsory for all students, except medical residents, exchange students and external students. 102,402 quali-fying responses were received from students of the first and second cycles of higher education and 704 from PhD students in 2010/2011. The feedback received covered 2283 teaching staff members.
The feedback indicated that the lectures, seminars, practical training courses and web-based activities began and ended on time and that the reference materials required for the courses were accessible. With respect to the teaching staff,
students agreed (fully or in general) that the lecturer treated them impartially (89%) and explained the objectives of the course, the requirements to complete it and the grading criteria adequately (88%).
Fewer students (79%) agreed that the lecturer provided clear and exhaustive feedback on individual or other graded work. When considering all aspects of a course and the teaching skills of the lecturer, students graded the courses as follows: A (excellent) – 36%; B (very good) – 34%; and C (good) – 17%.
PhD students agreed most (94–96%) with the statements that all classes took place, the reference materials required for the course were accessible and their instructor facilitated their active participation in classwork. The lowest percent-age (85%) of doctoral students agreed (fully or in general) with the statement that their instructor helped and guided them enough in solving research problems. In total, doctoral students graded their courses with A (excellent) in 56% of the cases and B (very good) in 28% of the cases.
54%
48%
52%
48%
57%
67%
55%
48%
34%
36%
33%
32%
29%
22%
30%
31%
6%
8%
6%
6%
10%
7%
7%
13%
5%
6%
7%
9%
6%
6%
4%
0% 20% 40% 60% 80% 100%
absolutely agree generally agree hard to say do not agree absolutely disagree
Lecturer gave appropriate and sufficient feedback on independent work and other parts of the course that were evaluated
Lecturer encouraged active student participation in the course
Lecturer treated participating students impartially and fairly
Lecturer took into account students’ interests and needs, if possible
Lecturer presented the subject in a creative and engaging way
Lecturer presented the subject in a clear and systematic way
Lecturer explained the applications of the course and its relationship with ohter courses and subjects
Lecturer provided sufficient explanations regarding the objective of the course, the conditions for passing it and the evaluation criteria
UT student feedback to selected questions on teaching and courses in 2010/2011
The link between activities of lecturers and learning of the subject, as seen by respondents in 2010/2011
0
10000
20000
30000
40000
50000
absolutely disagree
do not agree
hard to say generally agree
absolutely agree
Num
ber
of r
espo
nses
absolutely disagree
do not agree
hard to say
generally agree
absolutely agree
Lecturer gave appropriate and sufficient feedback on independent work and other parts of the course that were evaluated
In my opinion, I achieved most of the learning outcomes set in the course syllabus
18 19

Each year, based on the student feedback, UT acknowledges the members of teaching staff who excel in teaching. In each of the four areas of teaching and research, the award is given to the lecturer who received the highest grades in the teacher and course evaluation survey of that year, provided that at least 50 questionnaires were received with respect to one or several of their courses in that academic year.
In the academic year 2010/2011, our best teachers were: Pille Põiklik, Assistant in English Language and Literature, Faculty of Philosophy (humaniora); Kristel Ruutmets, Lecturer in Didactics of English, Faculty of Social Sciences and Education (socialia); Koit Herodes, Senior Lecturer of Analytical Chemistry, Faculty of Science and Technology (realia et naturalia); Mihkel Zilmer, Professor of Medical Biochemis-try, Faculty of Medicine (medicina).
At the beginning of 2011, students’ views and preferences were asked regarding feedback. A pilot survey based on the new, shorter questionnaire on courses was conducted in the summer. At the end of the year, the rector established the new pro-cedures for asking feedback and analysing, publishing and using the results. Once a semester, the councils of faculties and colleges are required to discuss the survey results, and deans and college directors must submit to the Vice Rector for Academic Affairs a report containing an assessment of the feedback and an action plan to eliminate shortcomings.
Student tutors have proven to be necessary. The survey conducted among freshmen in 2011/2012 indicated that 71% of the respondents had acquired the required information on the organi-sation of studies from tu-
tors. 92% of the students were satisfied with the advice received from tutors. The feedback praised tutors for being active, friendly and helpful and for finding answers to all questions.
126 students acted as tutors in UT in 2011. At a traditional acknowledgement ceremony, 93 new tutors who had com-pleted the tutors’ training programme in 2011 were rec-ognised.
In the 2011/2012 academic year, 77 students registered as special needs students: 32 of them were studying on state-commissioned student places, and 13 of the remaining 45 on non-state-commissioned student places with tuition fee waived. Most such students were full-time students (72) in regular studies (43).
The accessibility of UT academic buildings was assessed, and proposals to reduce or eliminate the shortcomings were made in 2009. Due to the preparatory work done, in 2011, structural assistance (from the EU) was received to improve the wheelchair accessibility of 12 academic build-ings. Development of support services to special-needs
students continued under the Primus Pro-gramme with the support of EU structural
funds: audio and digital study materials were recorded, support students were trained, and various support services were provided to 18 students. Before the academic year began, a training event on special needs and opportuni-ties to support special-needs students entitled ‘Diverse student body: noticing
and supporting special-needs students’, was conducted for the first time.
The Spring Student Days 2011 focused on drawing atten-tion to charity work, helping others and being considerate. For the first time, a Day of Senses was organised where people could play floorball and navigate an obstacle course in a wheelchair, study sign language and Braille alphabet, paint with a brush between their toes. The program included specialists’ lectures, a thematic round-table discussion and the annual charity concert.
Festive event to acknowledge active student tutors on 14 December 2011 in the assembly hall of the Estonian Ministry of Education and Research
A total of 126 student tutors contributed to the improvement of teaching in 2011
Kristel Ruutmets, Lec-turer in Didactics of English, is a four-time recipient of the University-Teacher-of-the-Year Award
18 19

GRADUATIONANDCONTINUATIONOFSTUDIES
GOAL: UT graduates either find a job or continue in our graduate programmes
A total of 3132 students graduated from UT in 2011. The breakdown of graduates by the four areas of teaching and research was: 46% in socialia, 23% in humaniora, 20% in realia et naturalia and 11% in medicina. The number of cum laude graduates in 2011 was 172.
UT graduates by cycles of higher education, 2002–2011
In 2011, the number of students who dropped out was 2360, or 5% less than the year before. The main reason was de-letion of a student from the matriculation register at the student’s own request (38%).
Throughout the years, the most common reasons have included expiration of the study period and insufficient academic progress. The number of students who were de-leted from the matriculation register on their own request or because they failed to pay the tuition fee increased from 2010. The number of those whose study period has expired has decreased in the last four years. This is due to changes in the organisation of studies: students can continue their studies during academic leave and receive an extension. In 2011, 41% of drop-outs were deleted from the matriculation register in their first year, 62% of them being in the first cycle of higher education..
Main reasons for deletion from the matriculation register in 2010 and 2011
51% of UT graduates in 2010/2011 continued their studies in our master's programmes in 2011/2012. The areas of study where the most graduates continued their stud-ies in our master’s programmes were natural and exact sciences (73%) and service (61%).
2010/2011 graduates of UT bachelor’s programmes continu-ing in one of our master's programmes in 2011/2012
13% of our 2010/2011 graduates of master’s programmes continued in our doctoral programmes, the most popular areas being engineering, manufacturing and construction (48%) and natural and exact sciences (35%).
2010/2011 graduates of UT master’s programmes continuing in one of our doctoral programmes in 2011/2012
12%
21%
33%
34%
12%
21%
29%
38%
0% 10% 20% 30% 40%
Other reasons
Insufficient academic progress
Expiration of the study period
At own request
2011
2010
91
156
70
377
26
1
19
58
157
186
302
41
3
10
0% 25% 50% 75% 100%
did not continue at master's level continued at master's level
Health and welfare
Engineering, manufacturing and construction
Services
Social sciences, business and law
Science
Humanities and arts
Education
Every second BA graduate from UT continued his/her studies in one of our master's programmes
138
98
107
332
41
13
35
3
19
57
15
9
12
4
0% 25% 50% 75% 100%
did not continue at doctoral level continued at doctoral level
Health and welfare
Engineering, manufacturing and construction
Services
Social sciences, business and law
Science
Humanities and arts
Education
1 346 1 599 1 588
2 074 2 001
2 539
1 926 1 702 1 740 1 812 568
621 729
719 762
913
934 924
1 296 1 168 47
67 79
73 98
97
77 100
109 152
0
500
1 000
1 500
2 000
2 500
3 000
3 500
2002 2003 2004 2005 2006 2007 2008 2009 2010 2011
First cycle of higher education Master's studies Doctoral studies
20 21
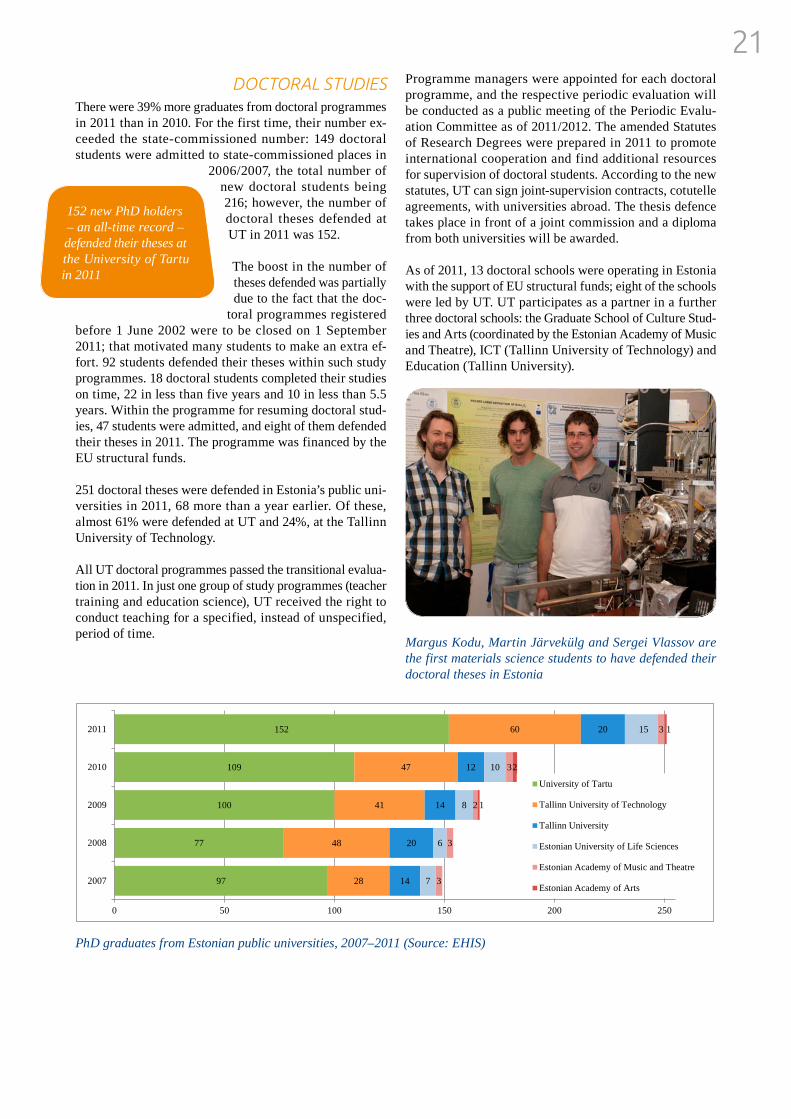
DOCTORALSTUDIESThere were 39% more graduates from doctoral programmes in 2011 than in 2010. For the first time, their number ex-ceeded the state-commissioned number: 149 doctoral students were admitted to state-commissioned places in
2006/2007, the total number of new doctoral students being 216; however, the number of doctoral theses defended at UT in 2011 was 152.
The boost in the number of theses defended was partially due to the fact that the doc-
toral programmes registered before 1 June 2002 were to be closed on 1 September 2011; that motivated many students to make an extra ef-fort. 92 students defended their theses within such study programmes. 18 doctoral students completed their studies on time, 22 in less than five years and 10 in less than 5.5 years. Within the programme for resuming doctoral stud-ies, 47 students were admitted, and eight of them defended their theses in 2011. The programme was financed by the EU structural funds.
251 doctoral theses were defended in Estonia’s public uni-versities in 2011, 68 more than a year earlier. Of these, almost 61% were defended at UT and 24%, at the Tallinn University of Technology.
All UT doctoral programmes passed the transitional evalua-tion in 2011. In just one group of study programmes (teacher training and education science), UT received the right to conduct teaching for a specified, instead of unspecified, period of time.
Programme managers were appointed for each doctoral programme, and the respective periodic evaluation will be conducted as a public meeting of the Periodic Evalu-ation Committee as of 2011/2012. The amended Statutes of Research Degrees were prepared in 2011 to promote international cooperation and find additional resources for supervision of doctoral students. According to the new statutes, UT can sign joint-supervision contracts, cotutelle agreements, with universities abroad. The thesis defence takes place in front of a joint commission and a diploma from both universities will be awarded.
As of 2011, 13 doctoral schools were operating in Estonia with the support of EU structural funds; eight of the schools were led by UT. UT participates as a partner in a further three doctoral schools: the Graduate School of Culture Stud-ies and Arts (coordinated by the Estonian Academy of Music and Theatre), ICT (Tallinn University of Technology) and Education (Tallinn University).
152 new PhD holders – an all-time record – defended their theses at the University of Tartu in 2011
97
77
100
109
152
28
48
41
47
60
14
20
14
12
20
7
6
8
10
15
3
3
2
3
3
1
2
1
0 50 100 150 200 250
2007
2008
2009
2010
2011
University of Tartu
Tallinn University of Technology
Tallinn University
Estonian University of Life Sciences
Estonian Academy of Music and Theatre
Estonian Academy of Arts
PhD graduates from Estonian public universities, 2007–2011 (Source: EHIS)
Margus Kodu, Martin Järvekülg and Sergei Vlassov are the first materials science students to have defended their doctoral theses in Estonia
20 21

ALUMNIFEEDBACK
In the autumn of 2011, the UT Centre for Applied Social Sciences (CASS) conducted a survey among UT graduates of 2010. 50% of the 1263 alumni who answered the ques-tionnaire (response rate 42%) reported they were currently
working, 14% were studying and 30% both working and studying. Only 1% of the respondents were unemployed.
Almost all graduates found that they cope well in their present job, and 84% con-sidered themselves to be competitive on the labour market.
41%
57%
48%
43%
41%
41%
14%
2%
8%
3%
3%
0% 20% 40% 60% 80% 100%
I feel competitive in the labour market
I cope well in my current job
I am satisfied with my current job
I totally agree I rather agree I rather disagree I totally disagree
4%
8%
12%
18%
19%
31%
38%
43%
62%
64%
82%
84%
97%
0% 25% 50% 75% 100%
I made the decision after professional career coaching
I was not admitted to the study programme of my first preference
It was the easiest study programme to enroll in
Parents/relatives/acquaintances and others recommended it
My prior learning and professional experience (RPL) are taken into account in completing the study programme
The location of the school was suitable/near my home
I am working in an associated field and wanted to raise my qualifications
Money (tuition-free studies/affordable tuition fee)
Good pay in the future
It is easy to find a job in this field after graduation
I am strong in this field
Opportunities for self-fulfilment
The field/specialty interested me
A year from graduation, 89% of UT graduates reported sat-isfaction with their jobs
Job satisfaction and coping on the labour market, N=1153
Reasons for choosing a study programme or field of study. Percentage of respondents who considered the reason to be very important or important, N=1263
22 23

The reasons given by respondents for choosing a certain field of study included their interest in the subject, an op-portunity for self-actualisation and being good at this area. Good salary and job opportunities were important as well. The graduates had a positive opinion of the objectives of the study programmes they completed: 81% of the respondents knew the objectives of the programme and 76% confirmed that the programme met their expectations.
Most of the alumni were happy with their cho-sen field of study and the university. They were satisfied with the quality of teaching, study programme and organisation of studies as well (76–83%). However, only slightly more than half were happy with the practical training opportunities offered during their studies. The main problem areas highlighted by respondents included receiving little support from the university with respect to studies and a greater need for acquiring transferable skills. The role of UT in teaching such skills was generally considered to be important; the highest points in this area were given to the ability to apply theory in practice and teamwork skills. UT’s contribution to the development of ICT skills, foreign language skills, management skills, assertiveness, negotiation skills, entre-preneurship skills and initiative was rated lower. The skills considered to be the most important for their job were time management, oral presentation and writing skills.
70% of the respondents worked during their studies, with half of them having already worked earlier. According to the respondents, working mostly interfered with their stud-ies. The statistics confirmed this as well: two thirds of the students who did not work during their studies managed to complete their studies on time, while only half of those who worked could do the same.
The main reasons given for working during studies were economic factors (38%) and already having a job earlier (27%); the number of alumni who had worked during their studies with professional experience in mind was consid-erably smaller (13%). The employment held during their
studies was usually (four-fifths of the cases) related to students’ field of study. Two-thirds of working alumni were employed as managers, profession-als or senior officials. As expected, the higher the
education cycle completed, the more competitive the graduate was on the labour mar-ket. In general, those who had completed a lower cycle of education received a lower salary and worked in less-demanding positions. Furthermore, alumni with a higher cycle completed more often had a job that was related to their field of study.
Breakdown of alumni (percentage of employed respondents, N=951) by gross salary from their main job (FTE)
A year from graduation, the average gross salary of UT alumni (€1105 a month) was significantly higher than the national average
21%
20%
38%
21%
28%
26%
60%
73%
34%
48%
40%
55%
51%
57%
32%
24%
28%
22%
16%
19%
18%
15%
6%
3%
17%
9%
6%
4%
3%
3%
2%
0% 20% 40% 60% 80% 100%
I am satisfied with practical training opportunities offered
I am satisfied with the counselling services offered by the university
I am satisfied with supervision
I am satisfied with the organisation of studies
I am satisfied with the completed study programme (structure, options)
I am satisfied with the level of lecturers and teaching
I am satisfied with my choice of study programme / speciality
I am satisfied with my choice of university
I totally agree I rather agree I rather disagree I totally disagree
8%
25% 26%
22%
14%
5%
0%
5%
10%
15%
20%
25%
less than 500 euros
500-750 euros
751-1000 euros
1001-1500 euros
more than 1500 euros
do not know/do not
reveal
Satisfaction with study-related aspects, N=1153
22 23

TEACHING,DEVELOPMENTANDCREATIVEACTIVITIESINTHEREGIONS
GOAL: UT promotes Estonia’s balanced development by sharing knowledge and skills
UT has set the goal of developing and strengthening its col-leges as teaching, development and creative centres. UT's three regional colleges are specialised in different areas of teaching and research. By applying the scientific potential of UT, promoting local cooperation and establishing inter-national contacts, the colleges contribute to improving the socio-economic quality of life in their respective regions.
Entrepreneurship and service design in PärnuThe teaching and development in UT Pärnu College, which celebrated its 15th anniversary in 2011, focuses on service design, service management and entrepreneurship, espe-cially in the social sector and tourism.
In the academic year 2011/2012, the international study programme on spa-service design attracted 10 international students, from Thailand, South Korea, Cameroon and Eu-ropean countries.
The 50th Annual Congress of EUHOFA surprised partici-pants with its smooth linking of theory and practice: the academic lecture took place in the Tervise Paradiis spa hotel.
Creative industry and Estonian culture in ViljandiThe research and development at UT Viljandi Culture Acad-emy focuses on linking cultural heritage - including manual
skills, musical, visual and verbal expression - to modern entrepre-neurship and forms of culture.
A rapid prototyping centre was opened at Viljandi Culture Academy in 2011. A 3D printer makes coloured 3D proto-types or product samples from a gypsum-like powder and special glue on the basis of an object that has been scanned into the computer or designed there.
Loomiselugu (Story of Creation), a complete oratorio ac-companied by folk-jazz band Paabel, premiered at the XVI Student Song and Dance Festival Gaudeamus, held in Lithua-nia in summer 2011. It was created specifically for this event by Tauno Aints, alumnus of Viljandi Culture Academy (com-poser) and Anzori Barkalaja, Director of the Viljandi Culture Academy (author of the lyrics).
24 25

Multilingualism and multiculturalism in NarvaThe research carried out at UT Narva College focuses es-pecially on the study of multicultural society, education and the city of Narva, and the education focuses on teacher training for multilingual educational institutions. The latter includes formal education acquired within the adult educa-tion system, retraining and in-service training.
Narva College has been active in outreach activities, creat-ing free holiday programmes for pupils, excursions, quizzes, drawing and photo competitions, and Native Language and Citizens Day events.
The Parenting Academy started its activities at Narva Col-lege in 2011 to help parents who are interested in good parenting and supporting their children’s development. This series of events became so popular that it will expand to Sillamäe and Rakvere as well.
For the 12th time, Narva College invited educators of Esto-nia’s multilingual educational institutions to Jõhvi Concert Hall. The pedagogical conference took place on 25 August 2011 and focussed on key educational topics in the country – this year, on national curricula.
Narva College has been celebrating Tatiana Day – the Russian Students' Day at the end of Janu-ary – for more than ten years. The dark winter’s night begins with a torch-light procession, during which one monument or institution is named an honorary student. That night after the mid-term exams, the students wear the blue-and-yellow caps of Narva College and re-cite the student oath.
24 25

RESEARCHGOAL: All UT's fields of teaching and research are internation-ally recognised and the best in Estonia
PUBLICATIONSAccording to the Estonian Research Information System (ETIS), the academic community of UT produced 2479 publications in 2011 (2507 in 2010), i.e. about 1.7 publications per academic staff member (FTE). The number of high-level publications (categories 1.1, 1.2, 2.1 and 3.1 in ETIS) has increased each year, reaching 64% of all publications in 2011; 952 publications by UT staff members were classified as 1.1 in ETIS.
Publications by members of UT academic staff, 2007–2011
Of all the category 1.1 publications affiliated with the four major public uni-versities in Estonia, those of UT amounted to over half (62%). The number of our category 1.1 publications per academic staff member was also nearly twice that of any other Estonian university.
Category 1.1 publications at the four major public universities in 2010 (Source: Ministry of Education and Research, data on baseline financing of R&D institu-tions, and personnel offices of the universities)
According to the Thomson Reuters Web of Science database, UT was among the top 1% of the most cited universities and research institutions in the fields of clinical medicine, chem-istry, environmental science and ecol-ogy, plant and animal sciences and gen-eral social science throughout the year, and, in various reporting periods, also in biology and biochemistry, geosciences, materials science and engineering
943
299
141 126 0,65 0,32 0,32 0,35
0,0
0,2
0,4
0,6
0,8
1,0
0
200
400
600
800
1000
University of Tartu
Tallinn University of Technology
Tallinn University
Estonian University of Life
Sciences
Number of publications of the ETIS category 1.1
Number of publications per faculty (FTE)
2742
2023 2127
2507 2479
45%
58%
59%
62%
64%
0%
20%
40%
60%
80%
100%
0
500
1000
1500
2000
2500
3000
2007 2008 2009 2010 2011
Number of publications
Proportion of high-level publications (1.1, 1.2, 2.1, 3.1)
26 27

According to the Thomson Reuters Web of Science, mem-bers of UT academic staff co-authored almost 4300 publi-cations in the period 2007-2011. Most of the publications are papers published in scientific journals (78%) and con-ference proceedings (11%), and conference theses (10%). International co-authors have mainly been based in Finland, Sweden, the USA, Germany and the UK. During this period, more publications were co-authored with the researchers of the University of Helsinki than with those of any other Estonian university. UT researchers have co-authored pub-lications with researchers from 108 countries.
According to the OECD, the number of internationally co-authored articles has increased in recent years, and the broader the cooperation, the higher the average number of citations per article. Articles written without any institu-tional cooperation (national or international) have a greater likelihood of high impact if the ratio between total number of publications and population number is higher, or if the author works in a larger than average research institution, with greater access to cooperation opportunities.
Distribution of internationally co-authored publications by UT researchers, by state of co-author’s affiliation (Source: Thomson Reuters WoS; OECD Science, Technology and Industry Scoreboard 2011)
UT researchers among the world’s top 1% of most-cited scientists, according to the Thomson Reuters Essential Science Indicators database (as of 3 January 2012)
Field Publications Citations
Marlon Dumas Computer Science 40 377
Ülo LangelBiology & Biochemistry/ Pharmacology & Toxicology
60/24 1211/699
Jaan Liira Environment/Ecology 28 715
Martin Zobel Environment/Ecology 35 1038
Meelis Pärtel Environment/Ecology 32 531
Kaupo Kukli Materials Science 49 875
Richard Villems Molecular Biology & Genetics 38 1658
Toomas Kivisild Molecular Biology & Genetics 42 2472
Risto-Kalervo Näätänen Neuroscience & Behaviour/ Psychiatry/ Psychology 97/22 2442/669
Jüri Allik Psychiatry/ Psychology 44 779
Hannes Kollist Plant & Animal Science 18 606
Urmas Kõljalg Plant & Animal Science 19 1005
Leho Tedersoo Plant & Animal Science 16 592
Mikael Brosche Plant & Animal Science 22 719
Russia (145)
Publications per thousand inhabitants
Poland (116)
Czech Rep. (77)Spain (179)
Australia (102)
Norway (83)Finland (444)
Sweden (405)
Great Britain (331)
USA (363)
Average citation rate
Canada (94)Belgium (90)
Denmark (134)
Switzerland (89)
Netherlands (149)
Italy (176)France (168) Germany (341)
15105
4
3
2
1
more than 300 publications100–300 publicationsless than 100 publications
26 27

RESEARCHAWARDSANDOTHERRECOGNITION
Physicist and academician Vladimir Hižnjakov, UT Profes-sor Emeritus, received a national research award for his long-term significant research and development work. UT researchers received research awards in five areas. National awards in eight research areas are given by the Government of the Republic of Estonia to researchers and research teams for remarkable research results. In addition, two lifetime achievement awards are given for successful, long-term research and development activities.
For outstanding services in researching, teaching, promot-ing and using the Estonian language and planning its corpus, the government presents an annual Ferdinand Johann Wie-demann Language Award. In 2011, this award was given to UT Professor Emeritus Tiit-Rein Viitso for researching the development of the Estonian language, describing its systems of phonemes and forms and drawing attention to their many options, principled corpus-planning, accurate editing and his charming academic mindset.
The Young Scientist Award of the Cultural Foundation of the President of the Republic is also a high recognition. Established in 2000, it has since been awarded to UT re-searchers under the age of 35 nine times. In 2011, it was given to Peeter Laud, Professor of Cryptography at the UT Institute of Computer Science.
For Women in Science, a prestigious international competi-tion organised each year by L’Oréal and UNESCO, culmi-nates with the presentation of the award to one outstanding female scientist from each continent and announcing three promising talents from each region. The 2011 European and North American award was given to Triin Vahisalu, a researcher at the University of Helsinki and UT. In the 13-year history of the competition, this was the first time when a researcher from a Baltic country received the award.
The Estonian Academy of Sciences elected seven new members on 7 Decem-ber 2011. Their number included Toomas Asser, Head of the UT Neurology Clinic and Professor of Neurosurgery (Academician in the field of medical science), Urmas Kõljalg, Director of the UT Natural History Museum and Professor of Mycology (in the field of biosystematics and ecology), and Karl Pajusalu, UT Professor of the History of the Estonian Language and Dialects (in the field of linguistics).
Ülo Mander, UT Professor of Natural Geography and Landscape Ecology, received the prestigious Karl Ernst von Baer medal from the Estonian Academy of Sciences. The medal is the highest recognition to an Estonian scientist with outstanding achievements in life and earth sciences; this bronze medal is only given once every four years.
Andres Kasekamp, UT Professor of Baltic Politics, re-ceived the 2011 Baltic Assembly Prize for Science for his comprehensive monograph on the history of the Baltic States (Balti riikide ajalugu, 2010). The Baltic Assembly Prize was established in 1994 to promote the development of literature, the arts and science in the Baltic States and recognise outstanding results in these fields.
Viimase viie aasta jook-sul on neli Tartu Ülik-ooli teadlast pälvinud riigi teaduspreemia pikaajalise tulemusliku teadus- ja aren-dustöö eest.
Researcher Field Title of the award-winning study
Vladimir Hižnjakov Long-standing significant research and development work
Gennadi Vainikko Exat Sciences Series of studies on Cordial Volterra Integral Equations
Eduard Maron MedicineSeries of studies on Neurobiological Factors Affecting the Emer-gence and Course of Panic Disorders
Asko Lõhmus Agricultural Sciences Series of studies on Promoting Ecologically Sustainable Forestry
Tiit Tammaru Social SciencesSeries of studies on Urbanisation, Suburbanisation and Coun-terurbanisation of Population Groups in Estonia
Valter Lang HumanitiesSeries of studies on Bronze and Iron Age in Estonia and the Baltic Countries
In the past five years, four UT researchers have re-ceived national awards for their fruitful long-term re-search and development work
Three UT professors were given the title ‘Academician’
28 29

Geoffrey Alan Ozin, Professor of Nanochemistry at the University of Toronto, was given the annual Albert Einstein World Award of Science in the Assembly Hall of UT. The Leonardo da Vinci World Award of Arts was bestowed upon Todd Siler, an American artist, writer and inventor. In addition to its main awards, the World Cultural Coun-cil also recognised eminent members of the UT academic community by presenting them with special recognition diplomas. In consideration of their contribution to Estonian education, science and culture, the diplomas were awarded to Professors Rein Taagepera, Urmas Varblane, Jüri Talvet, Kalle Kasemaa, Toomas Asser, Richard Villems, Jaan Einasto and Peeter Saari, and choir conduc-tor Vaike Uibopuu. Rec-tor Alar Karis received a special service medal for his contribution to excellence in Estonian higher education.
Indrek Saar, a doc-toral student of the UT Faculty of Economics, received the research award of the Bank of Estonia for his study ‘Optimal alcohol taxa-
tion: Simulation results for Estonia’. The aim of the
ninth national student-research contest of the Bank of Es-tonia was to recognise doctoral studies, stimulate research activities in the field of economics and praise outstanding research.
DEVELOPMENTFUNDThe UT Development Fund was established in 2009 to sup-port the teaching and research areas capable of becoming centres of international importance and other innovative activities in the university. The Rector announced the first call for proposals in 2010, and in March 2011, the decision was made, based on expert opinions, to provide financing to three projects until 2015: 1.6 million euros to the Centre of EU-Russia Studies, 3.5 million euros to the Centre of Transitional Genomics and 1 million euros to the Centre of Disease Models and Biomedical Imaging.
The Centre for EU-Russia Studies (CEURUS) aims to provide international study programmes and short-term courses as well as research-based knowledge to policy developers to enrich public discussion. CEURUS capitalises on the geographic location of Estonia. Europe has no other academic centre fo-cussed on relations between the EU and Russia. The Centre for Transitional Genomics brings together the
expertise of three UT centres of excellence (genom-ics, computer science and translational medicine) to set up, based on the Estonian Genome Centre, a database on the transmission of genetic material from one generation to the next in order to gain a better understanding of personality and causes for diseases. The Centre for Disease Models, unique in the Nordic region, will provide new opportunities for investigating neurodegenerative diseases and developing medications for these.
CENTRESOFEXCELLENCEIn the period 2007–2013, UT is managing four centres of excellence that received support from EU structural funds in 2008 and two such centres that received support in 2011. In addition, we are partners in another four centres of excel-lence. The aim of the centres of excellence is to create the necessary preconditions for strengthening the cooperation and competitive ability of Estonian researchers through supporting high-quality research and development.
In 2011, the 28th World Cul-tural Council award ceremo-ny was held at the University of Tartu, for the first time in the Baltic countries
Every sixth award in the national student research contests, including 13 first prizes, went to students of the University of Tartu
Centre of Excellence Head
Centre of Excellence in Biodiversity Research (2008) Martin Zobel
Centre of Excellence for Translational Medicine (2008) Eero Vasar
Centre of Excellence in Chemical Biology (2008) Tanel Tenson
Centre of Excellence in Cultural Theory (2008) Valter Lang
Centre of Excellence in Mesosystems – Theory and Applications (2011) Vladimir Hižnjakov
Centre of Excellence in High-technology Materials for Sustainable Development (2011)
Enn Lust
Centre of Excellence in Computer Science (2008)Tarmo Uustalu (Tallinn University of Technology)
Centre of Excellence in Genomics (2008) Maido Remm (Estonian Biocentre)
Centre of Excellence in Nonlinear Studies (2011)Jüri Engelbrecht (Tallinn University of Technology)
Centre of Excellence in Environmental Adaptation ENVIRON (2011)Ülo Niinemets (Estonian University of Life Sciences)
28 29

RESEARCHANDDEVELOPMENTCONTRACTS
The value of R&D contracts, excluding the national R&D financing schemes, increased by almost one-third in 2011, reaching 42 million euros. A total of 377 contracts were signed in 2011; in 2010, the number was 394.
The bulk of the increase in value of R&D contracts is due to the implementation of the R&D and Higher Education measures of the EU structural funds. The Estonian Centre for Genomics, the High-Perform-ance Computing Centre, the National Centre for Translational and Clinical Research, the Estonian e-Repository and Conservation of Collections, Estonian Environmental Observatory and Natural History Archives and Information Net-work are research infrastructure objects of national importance that received more than half of the structural support given to UT in 2011 (a growth of more than 50% from 2010).
Number and value (EUR million) of UT’s R&D contracts (excl. national financing) in 2009–2011
COOPERATIONWITHINDUSTRYGOAL: UT is characterised by a focus on innovation and promotion of research-intensive enterprise
In January, Entrepreneurs’ Day was organised for the sec-ond time to provide information on training, cooperation and innovation opportunities. In addition to the seminar where practitioners talked about research-intensive business opportunities and possibilities in Estonia, UT’s research-ers presented their main inventions of the recent years: the robotic mannequin, a cleaning robot, a prototype of a device for diagnosing cataracts, a new radiation detector and a ‘great fin’ which helps windsurfers to find balance. The events attracted more than 160 participants, among whom there were more beginning entrepreneurs and small-business operators than in the previous year.
In the key industries (biotechnology, nanotechnology and materials technology), UT already has contracts with Es-tonia’s companies. We aim now to develop more extensive cooperation with the chemical and food industries. The cooperation has been funded by various support measures. Of the support mediated by Enterprise Estonia, innovation vouchers are the most popular. These almost doubled the
number and value of UT’s contracts with industry in 2011.
Some examples of innovative coop-eration with Estonia’s SMEs focuss-ing on exports show the diversity in fields covered: improvement of a salt-aerosol generator (Kokkonen OÜ), development of an innovative camera stabiliser (HotShot Studios OÜ), development of a method for diagnosing breast cancer at a dis-
tance (Interspectrum OÜ), develop-ment of neuropsychological computer programmes (Cog-nuse OÜ), and devisal of biometric-ID security systems (Biometry OÜ). UT also cooperates with Estonia’s leading architectural companies in energy performance of buildings to provide new energy-efficient design and construction solutions.
UT signed 103 new cooperation agreements with industry in 2011. The total value of the contracts amounted to 1.43 million euros, which is 70% of that of 2010. This is due to the fact that some long-term contracts with competence centres were signed in 2010.
IDEALABAt the end of 2011, an Idea Lab was launched at UT to provide supportive environment for students to foster crea-tivity, interdisciplinary mindset, and joyful enthusiasm in initiating or developing interesting and unusual project ideas. Each semester, ten to fifteen teams will be selected to carry out their projects over 11 weeks under the supervision of scientific and business mentors. If necessary, the teams will be given access to UT labs to develop their project. At the end of each semester money prizes will be awarded to the best teams in each field, as well as four special awards.
UT is cooperating with Krimelte OÜ, Estonia’s biggest exporter and one of Europe’s biggest producers of construction foams, to devel-op a new, unique type of con-struction foam that contains no isocyanate
194 130 152 136
19
25
119
87
51
46
48
51
58
63
75
103
0
5
10
15
20
25
30
35
40
45
50
2008 2009 2010 2011
mln
€
Contracts with the business sector
European Commission and other international R&D grants
EU structural funds
Other Estonian contracts
30 31

PATENTS,PATENTAPPLICATIONSANDINVENTIONS
By the end of 2011, UT had patents on 48 inventions. Each year, an average of seven patent applications are submitted. Before submittal, the question of whether economic opera-tors would be interested in the invention must be analysed. Thus, the number of invention disclosures exceeds that of the patent applications.
UT’s intellectual property has been an important input for many spin-off companies: AS Quattromed, OÜ Müomeetria, AS Regio, OÜ Positium, OÜ Kinasera, KPA Scientific OÜ, technology development centres, and others. More than 10 years of work has resulted in a significant growth in income from commercialisation of intellectual property, which reached 76 000 euros in 2011. Until the end of 2011, this income included only amounts for the use of industrial property, excluding those from copyrights.
40
2
39
21
38
25
8
47
16
39
29
16
60
22
91
48
25
70
60
76
0
10
20
30
40
50
60
70
80
90
100
University of Tartu Tallinn University of Technology
University of Tartu Tallinn University of Technology
University of Tartu
Number of patents Number of patent aplications Income (thous €)**
2008 2009 2010 2011*
Entrepreneur’s Day and a seminar on Research-Intensive Business Opportunities in Estonia took place on 21 January 2011. Priit Priimägi presenting the robotic vacuum cleaner in the inventions workshop.
A group of UT computer scientists, led by Senior Research Fellow Satish Srirama unveiled Estonia’s first home care robot, designed to assist the elderly and patients with heart conditions. The robot enables caregivers to monitor the pa-tient’s condition at a distance, which in turn allows patients to continue living independently, in the privacy of their own homes.
Patents and patent applications of UT and Tallinn University of Technology in the period 2008–2011 (*initial data on 2011) and income from our industrial property rights (** excl. income from copyright licences)
30 31

CONTRIBUTION TO SOCIETY
CONTINUINGEDUCATIONGOAL: UT promotes a mentality of life-long learning by being open to various target groups
In 2011, the number of participants in UT’s continuing education courses increased by 20%. More than 30 000 learners participated in nearly 1600 different courses.
The income from such courses increased 16%, compared to 2010, reaching 3.36 million euros. Continuing education was also provided with the support of various development projects.
UT continuing education courses and their participants, 2007–2011
The number of continuing education courses with online support has been con-stantly increasing. In 2011, more than 5000 learners attended courses either entirely or partially online (17% growth). Almost 2000 of them attended 84 fully web-based courses.
UT continuing education e-courses and their participants, 2007–2011
The Faculty of Social Sciences and Education offered the greatest number of training courses, mainly on teaching and psychology. The courses of the Life-long Learning Centre had the biggest number of participants (5190), followed by those of the Faculty of Social Sciences and Education (4582), Faculty of Medicine (4268) and Narva College (2583).
UT has become the largest provider of con-tinuing education in Esto-nia
950 986
1 385 1 465 1 599 19 123
20 945 21 308
25 138
30 160
0
9 000
18 000
27 000
36 000
0
600
1 200
1 800
2 400
2007 2008 2009 2010 2011
Number of courses Number of participants
185 189
315
234 235
3 293 3 461
4 156 4 307
5 057
0
1 000
2 000
3 000
4 000
5 000
6 000
0
100
200
300
400
500
600
2007 2008 2009 2010 2011
Number of courses Number of participants
32 33

The most popular courses that took place five or more times in 2011 were: ‘Business environment and society of Rus-sia and the states covered by its neighbourhood policy’, ‘Know thyself: a practical introduction to the psychology of individual differences’, ‘Conversation management’, ‘Field observations and collections in nature education’, ‘Estonian orthography and official documents’, ‘Mentor training: supervision of beginning teachers and trainees in educational institutions’, ‘Better legislation and assessment of the impacts of legislative acts’, and ‘Drawing up memos in the policy-making process’.
Thematic breakdown of UT continuing education courses in 2011
In accordance with the aims of our Strategic Plan, continu-ing education was successfully provided outside Tartu as well. The participation rate was the highest in Harju, Ida-Viru, Pärnu and Viljandi Counties, i.e. the regions where our colleges or representations are.
Participants in UT continuing education courses by loca-tion (excl. Tartu and Harju Counties, abroad and online and distance courses)
A bit over 5500 learners participated in 312 continuing edu-cation courses offered by UT in Tallinn and Harju County in 2011.
In Tallinn, the ‘UT in Tallinn’ programme was continued with free seminars, short-term training courses and lectures. In 2011, the most important partners in Tallinn were Erics-son Eesti AS, OÜ Eesti Energia Jaotusvõrk, AS Eesti Post, the Ministry of Economic Affairs and Communications, the Ministry of Finance and Tallinn City Government. In addi-tion, information on our services and continuing education courses was provided to 53 organisations.
The participation rate in UT continuing education courses in Tartu and Harju counties, 2009–2011
The Primus Programme, financed by the ESF, aims to im-prove university teaching and provide university teachers with continuing education opportunities. The UT Centre of Excellence in Teaching and Learning was one of the partners of the programme in 2011, coordinating and or-ganising the development of teaching and supervisory skills (in cooperation with Tallinn University).
The participation rate of UT continuing education courses increased by 1.9 in Tallinn and Harju County in 2011
2745
119
294
76
320
277
1106
59
96
266
1472
353
3 429
297
288
117
379
149
2 125
45
209
275
1 351
232
0 1 000 2 000 3 000 4 000
Ida-Viru County
Jõgeva County
Järva County
Lääne County
Lääne-Viru County
Põlva County
Pärnu County
Rapla County
Saare County
Valga County
Viljandi County
Võru County 2011
2010
1%
5%
6%
10%
15%
29%
34%
0% 5% 10% 15% 20% 25% 30% 35%
Sport sciences
Exact sciences
Natural sciences
Humanities
Medicine
Social sciences
Education sciences
2 219
10 476
2 911
10 656
5 543
12 361
0 3 000 6 000 9 000 12 000 15 000
Harju County
Tartu County
2011
2010
2009
32 33

Teachers of Estonia’s higher education institutions, teaching doctoral students and specialists involved in active teaching attended UT courses on teaching and supervisory skills
1363 times in 2011: the teaching staff of UT made up 654 of these and those of other high-er education institutions in 709 instances. The total number of teachers participating in these courses was 998: 448 from UT and 550 from other higher education institutions of Estonia.
Within the same programme, UT offered continuing education courses to develop-
ers of output-oriented study programmes, specialists dealing with recognition of prior learning and professional experience, student advisors and academic affairs specialists, with a participation rate of 485. 70% of the participants were from other higher education institu-tions of Estonia.
Breakdown of UT continuing education courses for other higher education institutions of Estonia through the Primus Programme in 2011
Participation in UT continuing education courses for other higher educational institutions through the Primus Pro-gramme in 2011
654 709
27 77 55
192
64
70
0
200
400
600
800
1000
1200
UT employees Employees of the other Estonian
HEIs
Courses to improve counselling skills (for enhancing students' coping skills)
Courses regarding the recognition of prior learning and professional experience
Courses to develop output-oriented study programme in higher education
Courses to improve teaching competence and supervising
74%
6%
13%
7%
Courses to improve teaching competence and supervising
Courses to develop output-oriented study programme in higher education
Courses regarding the recognition of prior learning and professional experience
Courses to improve counselling skills (for enhancing students' coping skills)
Almost 1000 university teachers, 55% of them from other higher education insti-tutions of Estonia, participat-ed in UT continuing education courses on teaching in 2011
A three-day international conference “Is teaching art or sci-ence?” was held in Tartu from 24-26 January 2011, through a cooperative effort between the state and institutions of higher education, to increase the readiness of Estonian lec-turers and professors to develop and reflect on their teaching skills. The best projects in the Primus Programme 2010 were acknowledged at the evening reception. The University of Tartu was selected Best Partner of the Year.
34 35

UT Summer University offered 44 courses to 753 partici-pants. In 2011, the aim was to offer fewer courses in Esto-nian. Furthermore, these were targeted to a more limited target group. Thus, the number of participants dropped, compared to 2010.
In 2011, 27 summer courses in Estonian had 532 partici-pants, mostly from the education sector. The most popular courses were: ‘Self-management and relations management at work’, ‘Summer academy for leisure managers’, ‘Summer academy for university teachers’, ‘Grief counselling and grief therapy’, ‘Supporting the development of children up to three years of age’, ‘Introduction to Japan’ and ‘Nutrition, psyche and cultural differences’.
UT Winter University offered 16 courses for 234 partici-pants from Estonia and Finland. In addition to the training courses contributing to professional development, continu-ing education programmes for a wider audience were es-tablished as well to accommodate the growing interest in health, sports, culture and art. The most popular winter courses were: ‘Legal translation and interpretation’, ‘Winter academy for cultural workers’, ‘Ethics and data protection for officials’, ‘How narrators depict life and themselves in it’, ‘Normal eating’, ‘Gifted students and natural sci-ences’, ‘Sports psychology for parents of sporty children’, and ‘Estonian for Finns’.
13 17 21 13 17 42 36 27 48 27
197 232 268
132 221
687 674
534
1 023
532
0
200
400
600
800
1 000
1 200
0
20
40
60
80
100
120
2007 2008 2009 2010 2011
Num
ber
of p
arti
cipa
nts
Num
ber
of c
ours
es
Number of international courses Number of courses taught in Estonian
Number of participants (intl. courses) Number of participants (courses in Estonian)
The Internat iona l Summer University of 2011 was more successful than the year before: its 17 courses had 221 participants from 26 states. For the first time, courses were offered by Pärnu College and Viljandi Cul-ture Academy, their participation rate being 29 and 28, respectively. Estonian as a Foreign Language courses continued to be popular. Programmes in social sciences were organised in co-operation with the University of Latvia, Vilnius University, St. Petersburg State University, Kiev-Mohyla Academy and Utrecht University. The studies and excursions took place in Tallinn, Tartu, Pärnu and Saaremaa. The Three-Universities Programme included studies in Tallinn, St. Petersburg State University in Russia and Kiev-Mohyla Academy in Ukraine, a week in each. Students at the In-ternational Summer University came from San Diego State University, Shanghai University, Southeast University and the University of Shanghai for Science and Technology.
The UT Seniors’ Programme started in Pärnu College in the spring of 2010, expanded to Tartu, and in 2011, to Tallinn and Saaremaa as well. In the first year, there were 925 participants in the programme, but in 2011,
their number doubled (1723). The lectures were conducted in cooperation with the re-spective municipalities in Tartu, Tallinn, Pärnu and Saaremaa.
The UT Seniors' Programme graduation ceremony on 26 May 2011 in the University Assembly Hall
UT Summer University courses and participants, 2007–2011
In the summer of 2011, UT opened its Summer Univer-sity programmes to Chi-nese partner universities
The oldest participant in the popular UT Seniors' Programme was 97 years old
34 35

ACTIVITIESOFUTMEMORYINSTITUTIONS
GOAL: UT’s memory institutions offer educational, cultural and information services to diverse groups of visitors and participate in R&D and popularisation of science
In 2011, the UT Library had 53,159 registered users, 60% (31,398) of them from UT. The number of external users increased 2.5% from 2010. The main building of the library saw 228,528 visits and lent 823,945 information carriers. There were 4,462,404 online visits, which is about 70% more than the year before. Its collections exceed 3.7 mil-lion items. In 2011, our computer network offered access to 113 scientific databases and 20,823 online magazines.
In 2011, the library focussed on the development of its digit-al collections and online services. The second robotic book-scanner was purchased with the help of the Department of State Information Systems of the Ministry of Economic Affairs and Communications. This increased the avail-ability of electronic textbooks and collections of old books and other materials of scientific and cultural importance. Our DSpace digital archive provided access to millions of
articles and full texts from more than 1200 content providers through var ious search engines (e.g. FirstSearch, Scien-tific Commons and Base).
The first stage of the Estonian e-Repository and Conserva-tion of Collections Project was included in the Estonian Research Infrastructures Roadmap. Among other activities of the project, a centre for mass deacidification of paper will be established at the UT library. This will be the first of its kind in Estonia and Northern Europe. The technology to be used makes it possible to significantly extend the life of publications on acidic paper.
The Night Library project continued in cooperation with the Student Council. During the exam period, students could use all the special collections, lend materials, use comput-ers, have a snack and enjoy some entertainment. Children could spend time in the Nimmik-Nummik playroom, with babysitting services provided by library staff, Corp! Filiae Patriae (sorority) members and Student Council members.
In April 2011, the Old Observatory of Tartu – formerly one of the top astronomy centres in the world – celebrated its 200th anniversary and was reopened as a modern museum after thorough renova-tions. Friedrich Georg Wilhelm Struve, Director of the Observa-tory at the time, was one of the first to measure the dis-tance between a star and the Solar System (in 1835–1836). In the period 1816–1852, he and Carl Friedrich Tenner supervised the measurement of a meridian arc from north-ern Norway to the Black Sea (the Struve Geodetic Arc), and UT’s Old Observatory marks one of the points on the arc. The arc was added to the UNESCO World Heritage List in 2005. The ERDF provided financial support for the renovation work. Support for the celebrations was given by the Ministry of Culture, Tartu City Government, Cultural Endowment of Estonia and the Council of Gambling Tax.
Opening of the museum in the Old Observatory on its 200th anniversary on 27 April 2011
UT museums received 76,730 visits in 2011. This surge in visitor numbers can be attributed to the reopening and new
exhibition at the Old Observatory and to various attractive events, exhibitions and programmes promoting science and UT.
The materials in DSpace, the UT digital archive managed by the UT library, were accessed on 3.55 million instances in 2011
Old Observatory reopened as mu-seum on its bicen-tennial anniversary
The number of visitors to UT museums increased by 1.6 in 2011
36 37

Visitors to UT museums, 2008–2011
UT History Museum, including the Old Observatory, the Dome Cathedral and its towers and the Anatomical Theatre, had almost 42,500 visits in 2011. Over 12,200 more people participated in receptions and festive events organised at the museum.
The History Museum had two major exhibitions in 2011: one pertained to archaeology and the other, to the history of the University of Tartu. The exhibition on the Kukruse grave site – the richest in Estonia, from the beginning of the 13th century – was accompanied by lectures, a Hid-den Treasures programme for young people and The Dead Are Talking programme for older pupils. An exhibition of student life showed how UT students lived outside of class, from the 17th century to modern days.
The Estonian research infrastructure project Natural History Archives and Information Network (NATARC) was also launched and the development of the related IT applications (PlutoF cloud, Estonian eBiodiversity database) continued. The NATARC was mentioned in the National open access and preservation policies in Europe (2011) by the EU DG for Research and Innovation.
COBWEB – Communicating the Baltic, an international project cofinanced by Central Baltic Interreg IV A Pro-gramme, aiming to popularise environmental education, ended in 2011, having contributed to the birth of the FOOD-WEB Programme, which is a new international environ-mental information programme of the national institutes of Finland, the University of Latvia and the AHHAA Science Centre. It mainly deals with the environmental problems of the Baltic and the surrounding areas and related food quality issues. COBWEB also helped to launch the Baltic-Diversity Project of UT, the national museums of Sweden and Finland, the Tallinn University of Technology and the Estonian University of Life Sciences. Its aim is to develop biodiversity information systems.
The UT Natural History Museum, under the aegis of the Estonian Academy of Sciences, gained full membership in the Consortium of European Taxonomic Facilities (CE-TAF) which unites the biggest natural history museums. The museum also participates in planning the EU flagship initiatives on biosystematics. It had 18,890 visitors, 6769 of them in connection with studies (educational programmes and training courses for pupils and teachers).
Our Art Museum hosted the exhibition Pictures Cut in Wood – Albrecht Dürer and German Woodcutting Art in the 16th Century. On the 540th anniversary of the painter, engraver and printmaker, visitors could see his original masterpieces, works of his contemporaries, and some books with woodcut illustrations. To promote humanities and the art collection of the university, the museum organised a Sci-entists’ Night and a series of Art Wednesdays. This popular series, where specialists discussed various aspects of art in relation to an exhibition piece at the museum, took place once a month. In 2011, the Art Museum had 15,375 visi-tors and offered guide’s services to 274 groups and in five languages.
The size and increase in the collections of UT museums in 2011
Our Botanical Gardens had 16,746 visitors with tickets, and its open-air collections had 113,900 visits. According to the stocktaking data from the autumn of 2010, the gar-dens had 7,995 species and varieties of plants. In 2011, a 100-square-metre herb garden with 100 species was planted to support teaching and studying and a service contract was signed with the Road Administration to bring back the Large Pink (Dianthus superbus) to a construction site on the Tallinn–Narva–Loo–Maardu section of road No 1.
17 930 20 005 21 378
42 483 9 000 9 500 7 000
15 357
16 445 18 769 19 892
18 890
0
10 000
20 000
30 000
40 000
50 000
60 000
70 000
80 000
2008 2009 2010 2011
Num
ber
of v
isit
ors
Natural History Museum
Art Museum
History Museum
70 968
30 298 80 701
597 888
405 786 1
696
867
119
8 17
2
7 40
7
0
2 000
4 000
6 000
8 000
0
100 000
200 000
300 000
400 000
500 000
600 000
His
tory
Mus
eum
Art
Mus
eum
Geo
logi
cal M
useu
m
Zoo
logi
cal M
useu
m
Bot
anic
al a
nd
Myc
olog
ical
Mus
eum
stored items
increase 2011
36 37

Smart Botanic Gardens, a joint project of the National Bo-tanic Gardens of Latvia, the UT Botanical Gardens, its society of friends and the Latvian Environmental Develop-ment Association, was approved within the Estonia–Latvia Programme and received structural support. The aim of the project is to create an interactive map, topographic maps and a common plant database, and to pool experience of the two botanical gardens to make them more interesting.
PROMOTINGSCIENCEGOAL: The University has close cooperation with sec-ondary-education institutions, offering advanced study opportunities for gifted pupils
We provide information on various fields of study, involve pupils and promote science with increasing visibility. The physics, chemistry and biology programme launched by the Faculty of Science and Technology, the Gifted and Talented Development Centre and the Estonian Physical Society provided empirical knowledge to 600 pupils in 26 schools in 2010/2011 and to almost 1200 pupils in 35 schools in 2011/2012.
The courses of our Gifted and Talented Development Centre had more than 1300 participants from 178 schools. Of its six subject contests, the math competition was the biggest with 13,400 participants from 360 schools. ‘From the university to pupils’, a section on the webpage of the development centre, had 1000 registered users in 2011.
In addition to the numerous courses, competitions and study sessions, the centre coordinated national olympiads that at-tracted almost 10 000 pupils. 91 pupils coached at the centre participated in 16 international subject contests, including nine international olympiads, two European olympiads, three Baltic olympiads and two Estonian–Finnish contests. Our pupils won 33 individual and team medals: 5 gold, 7 silver, and 21 bronze medals.
Tartu Hanseatic Days: Measuring the Universe, Toomemägi, 22–24 July 2011
Our museums and botanical gardens were active providers of educational programmes for pupils and teachers. In 2011, an exhibition on astronomy and other related sciences was opened in the Old Observatory and the permanent exhibition of the Natural History Museum and its study environment were brushed up with structural assistance. Our museums, supported by the structural funds and the Environmental Investment Centre, also organised camps, lectures, quiz-zes, observations, subject nights and courses on astronomy, nature and environment.
GOAL: UT presents research outcomes and research careers attractively to the wider public
The Children’s University was launched in Narva in 2007. Later, it was also extended to Tartu and Tallinn. The lec-tures took place each weekend in Narva, during the au-tumn break in Tallinn and during the spring break in Tartu. 500 8–12-year-olds attended the lectures in the University Council hall. A trip from Tartu to Narva was organised for them as well.
Children’s University: Kaarel Vana mölder, Lecturer of Estonian History, Narva College
The Novaator portal provides sci-ence news in Estonian to every-one, from pupils to top scientists. It also provides information on the scientific achievements of top and early-career researchers of UT. An additional video portal was created to host a competition of science videos by students and pupils of general education schools. The best videos were also shown on Estonian Television. The competition of popular science articles by PhD students has become a tradition. In 2011, 35 articles were submitted.
Novaator, the science news portal of the University of Tartu, has 60,000 readers each month
38 39

CULTUREANDSPORTSACTIVITIESGOAL: UT provides supportive conditions for our staff members to participate in cultural activities and rec-reational and competitive sports
The work of people involved in creative cultural activities is organised and coordinated by MTÜ Tartu Üliõpilasmaja (Tartu Students’ Club), whose members are UT and the Estonian University of Life Sciences. In 2011, there were 13 groups in the club, most of them uniting students, em-ployees and alumni of UT.
The UT Academic Fe-male Choir and the UT Chamber Choir gave a Christmas concert in the former church building of the university. The two choirs joined forces for this evening only to sing the most beautiful Christmas songs.
On International Music Day, the Cultural Endowment and the Music Council gave annual awards to Estonian musi-cians. Triin Koch, Chief Conductor of the UT Chamber Choir since 2001 and Chief Conductor of the UT Academic Female Choir since 2005, was given the annual award of the Musical Arts Foundation for her outstanding achievements as a conductor and promoter of choir music. The award for top-quality recording of Estonian music was given to Maido Maadik, an honorary member of the Female Choir since 2005. Triin Koch’s interpretations of choir songs have inspired awe at several competitions. She also conducted the girls’ choirs at the 11th Youth Song Festival in 2011. Our Academic Female Choir came first among female choirs at the Tallinn 2011 International Choir Festival and performed in the Grand Prix round. Triin Koch was given a special Estonian conductor’s award. The Tallinn Choir Festival is the only inter-national choir competi-tion in Estonia. It brought together 35 choirs and 7 vocal ensembles from Es-tonia, the Czech Republic, Finland, Germany, Iceland, Latvia, Lithuania, Norway, Slovenia, Sweden, Switzerland, Ukraine and the United States.
2011 was a busy year for the Tartu Academic Male Choir (TAM): they performed about 30 times. TAM and the En-gineers’ Male Choir celebrated the 75th birthdays of Alo Ritsing and Ants Üleoja, their chief conductors, with a series of anniversary concerts that were held in cooperation with the Estonian National Male Choir in Pärnu, Tartu, Tallinn and Jõhvi.
One of the delightful events of Tartu University’s Folk Art Ensemble (artistic director: Aveli Asber) was a joint
concert show with Dancis dance ensemble of the Uni-versity of Latvia to celebrate the 65th anniversary of Dancis, one of the best known dance ensembles in Latvia. All the groups of the Folk Art Ensemble, with 140 dancers in total, performed there. The ensemble had eight dance groups in its 66th season: an alumni group, mixed student groups, girls groups and a chil-dren’s group.
The UT Brass Band Popsid (conductor: Enno Tubli) gained popularity as a unique concert and dance or-
chestra with a high-quality, interesting repertoire and many performances in 2011. Popsid represented UT and academic members of the National Defence League at various events and performed at several concerts in Estonia and abroad.
At the spring concert of the UT Symphony Orchestra, con-ducted by Lauri Sirp, the academic prelude for a symphony orchestra by Tauno Aints was premiered, and modern film-music was played as well: known soundtracks from ‘Gladi-ator’, ‘Titanic’, ‘Pirates of the Caribbean’, ‘The Lord of the Rings’ and ‘Nimed marmortahvlil’ (Names in Marble).
Tartu Student Theatre opened its 12th season and admit-ted nine new actors to its ensemble in 2011. ‘Christmas at the Ivanovs’ by Alexander Vvedensky and ‘The High Seas’ by Slawomir Mrozhek were performed both in Tartu and Tallinn. The first of these, produced by Kalev Kudu, Art Director of the theatre, was also performed at the Theatre Festival in Valka, the trip being supported by the Culture
Department of Tartu.
The 2011 programme of the Y Gallery (curator: Kaisa Eiche) presented 81 creative persons. In addition to the traditional Art Month ‘Art ist KuKu Nu Ut’, meetings with various creative persons and Topofon Literature
Nights continued. It showed the works of many known and as-yet-unknown artists and photographers.
The UT Chamber Choir celebrated its 40th anniver-sary with a concert ‘Life is just beginning’ in the former church of the university
UT Academic Female Choir once again the best
38 39

The UT Academic Sports Club was a member of 19 sports federations, the Estonian Academic Sports Federation and Tartu County Sports Federation. As of the end of the year, it had 1261 members: 372 competitive athletes, 1004 young athletes, and 85 coaches. The number of competitive athletes increased by 23%: three basketball teams became members and many sports-school graduates continued with the club as competitive athletes. Each day, about 350 people are going in for recreational sports at the club.
The track and field athletes of the UT Aca-demic Sports Club have become the Champions of Estonia 89 times (all age groups included) and set 12 national records. High jumper Anna Iljuštšenko was voted Female Ath-lete of the Year and coach Martin Kutman became Coach of the Year. Anna Iljuštšenko won a bronze medal at the international Summer Universiade in Shenzhen. This was her first medal at a title game.
Grit Šadeiko, a heptathlete and European Champion in the U23 age group, was voted the best junior athlete of the Esto-nian Athletic Association, and Anne and Taivo Mägi were named Coaches of the Year of the juniors’ group. 400-metre hurdler Rasmus Mägi, was the best in the juniors’ group and the most successful record-maker.
Tartu Ülikool/Rock basketball team (named Tartu Ülikool since the autumn of 2011) won the Es-tonian Cup and silver medals at the 2011 Championships. Our women’s basketball team won the silver at the Estonian wom-
en’s championships last season and Tartu Ülikool/Eeden women’s volleyball team was in the third place at the end of the season.
The anniversary tournament of the Estonian Academic Sports Federation brought more than 200 people from higher education institutions to the UT sports building. Employees of the city governments of Tartu and Tallinn, the Ministry of Culture, the Ministry of Education and Research, and Estonian Public Broadcasting participated as well. The events included basketball, volleyball, chess and table ten-nis, plus a race on indoor rowers.
In spring, the second sports afternoon for UT staff and their families took place in Tähtvere recreational park. The participants could participate in running, roller-skating and Nordic-walking tracks and take bicycle training courses for beginners and advanced cyclists. The programme included fun events for children as well, and all participants could check their health indicators. The sports afternoon and two UT staff sports days were organised by the UT Academic Sports Club.
UT Academic Sports Club once again the best in Estonia
UT won the anniver-sary tournament of the Estonian Academic Sports Federation
UT Winter Sports Day in Kääriku, 4 March 2011
40 41

EMPLOYEESGOAL: UT employs highly qualified, international academic staff
At the end of 2011, UT had 3596 employees, 126 of them from abroad. About 49% of our employees have held an academic job for the last five years. The number of non-academic employees was lowest (less than 1 600) in the period 2002–2004 and grew until 2008. Among other factors, this was due to the increase in the number of EU structural-fund measures and other project-based funding. The number of non-academic employees increased by 80 (slightly more than 4%) in 2011.
The number of teaching staf f, researchers and other employees at UT, 2002–2011
63% of non-academic employees were working in the academic units, 22% in the support structure and 15% in other UT institutions. The number of non-academic employees grew 6% in the academic units, 4% in other university institutions and remained the same in the support structure.
Non-academic positions in the UT structure in 2002, 2007 and 2011
UT employee numbers by positions, 2002–2011
ORgANISATION
854 853 879 923 954 943 942 951 925 955
383 439 489 583 675 755 745 778 800 793
1 591 1 568 1 573 1 694 1 733 1 747 1 789 1 788 1 768 1 848
0% 50% 100%
2002 2003 2004 2005 2006 2007 2008 2009 2010 2011
Teaching staff Research staff Other staff
797 1 062 1 160
457 422 403
337 263 285
0%
20%
40%
60%
80%
100%
2002 2007 2011
Other institutions
Support structure
Academic units
137 139 151 161 167 176 169 180 179 191
198 197 195 189 195 192 196 189 198 190
274 277 291 303 321 301 310 316 318 337
245 240 242 270 271 274 267 266 230 237
148 147 154
206 242 264 271 289
297 299
235 292
335 377
433 491 474
489 503 494
0 200 400 600 800 1000 1200 1400 1600 1800
2002 2003 2004 2005 2006 2007 2008 2009 2010 2011
Professor Senior Lecturer Lecturer, Senior Assistant Assistant, Teacher Senior/Lead Research Fellow Research Fellow
40 41

As regards the positions of teaching and research staff, the number of research fellows was the biggest (494) at the end of 2011, its growth being the fastest in the last five years and it being the biggest group of academic employees in abso-lute numbers.
The requirement to have a PhD degree or a correspond-ing qualification applies to professors, senior lecturers, leading research fellows and senior research fellows of UT, plus lecturers as of 2018. In 2007, only 55% of our academic staff were PhD hold-ers. By 2011, however, the figure increased to 67%, and 74% among full-time academic employees. 83% of all academic staff members and 45% of all UT employees had a degree.
At the end of 2011, 58% of all our employees and 48% of our academic staff were women. The percent-age of women is largest in the positions of assistants and teachers (69%) and lecturers and senior assistants (63%). The gender-balance is more even among the positions of research fellows, lead research fellows and senior lecturers. At the end of 2011, the university had 37 female professors (19%), four more than in 2010. When looking at the gender ratio of our academic staff by age groups, the percentage of women is smallest among the employees who are older than 60 years; in other age groups, however, the ratio is more even.
The gender ratio of UT employees by positions in 2011
Breakdown of UT employees by gender and age in 2011
The average age of our employees was 44 in 2011. The average age of the academic staff was 46, and 15% of them were older than 60. The average UT research fellow was 39
years old, and the average UT professor was 54 years old.
The average gross monthly salary of our employees was 1,188 euros in 2011, and it increased 3.6% dur-ing 2011. As is the case in our labour market as a whole, the salary of the men working at UT was slightly higher than that of the women with similar duties. The gap is mainly due to the fact that women
often work in lower positions and lower-paid areas of teaching and research.
Our staff are inter-nationally diverse. At the end of 2011, the UT had 126 foreign employees
from 34 states. 24 first-time contracts were signed with foreign employees in 2011. The number of foreign teachers and researchers increased 9%, compared to 2010 (from 103 to 112), and amounted to a bit more than 6% of all our staff.
International teachers and researchers in UT areas of teach-ing and research and in total, 2009–2011
Throughout the years, the area of teaching and research where the share of international teachers and researchers is the greatest (6% or more) is humaniora, and that where the share has grown the fastest is realia et naturalia. 57% (64) of all foreign teachers and researchers were in the area of realia et naturalia in 2011. Most (44%) of the foreign aca-demic staff were research fellows, 21 of them were senior research fellows and 17 were professors.
Two out of three UT academic staff members hold the highest univer-sity degree
Academic staff from abroad form slightly more than 6% of total aca-demic staff
52%
68%
57%
31%
37%
54%
81%
48%
32%
43%
69%
63%
46%
19%
0% 50% 100%
Research Fellow
Senior Research Fellow
Lead Research Fellow
Assistant, Teacher
Lecturer, Senior Assistant
Senior Lecturer
Professor
Men Women
8%
32% 25%
17% 18% 9%
33%
25%
21% 12%
0%
10%
20%
30%
40%
50%
60%
70%
<=30 31-40 41-50 51-60 >60
Women Men
6,7%
3,2%
5,8%
1,0%
4,5%
7,7%
4,5%
7,3%
3,1%
6,0%
7,4%
4,3%
9,3%
1,5%
6,4%
0%
2%
4%
6%
8%
10%
humaniora socialia realia et naturalia
medicina University's total
2009
2010
2011
University's total
42 43

GOAL: UT facilitates the self-development and mobility of our employees and development of support services for international staff
To help international employees and visiting lecturers settle into the new work environ-ment and culture and to ensure their smooth work, they and their family members are given the opportunity to study Estonian. In 2011, 34 foreign teachers and research-ers and eight of their family members took courses of Estonian. In addition, foreign employees and their family members were offered a course on Estonia and Estonian culture. This course took place for the second time.
At the beginning of the academic year, the international community of the university was invited to the rector’s reception and a city tour. Dorpater Dotzentenabend club meetings have been organised for foreign researchers and teachers since 2002 with the aim of providing cultural en-tertainment and communica-tion opportunities for the international community and other staff members of the university.
1 061 employees (30%) at-tended at least one inter-nal training event in 2011. Training events on teaching skills were the most popular among our academic staff, and information seminars at-tracted the biggest number of non-academic staff members. The university organised several internal training courses primarily targeting the academic staff and heads of aca-demic units (courses on intellectual property and govern-ance). Courses of English were offered to our workers in a more systematic way, providing them with more study opportunities.
The university had 14 teacher mentors who supported 26 beginning university teachers with the help of the Primus Programme. A governance mentoring pro-gramme was launched in the autumn of 2011. With-in the programme, seven mentor and mentee pairs started cooperation that would last up to a year. The mentors were former vice rectors, deans and other experienced managers.
Surveys covering the whole university were organised for the first time in 2011 to find out how satisfied our employees are with their work environment and how satisfied our man-
agers are with the support units. The questionnaires were sent to all employees with an e-mail ad-dress in the ut.ee domain (3 250 people). The response rate was 36% (1 185 people). The ques-tions pertained to satisfaction with governance, work atmos-phere, workspace, work condi-tions, work and remuneration arrangements, information
flow and development oppor-tunities. To sum up, our staff were happy with their work: more than 94% of the respondents agreed (fully, in general or more likely) with a statement to that effect. In addition, our staff considered their work to be important (98%) and interesting (98%), and they were proud to be working at UT (94%). Feedback on the work of support units was given by 31 out of 69 managers (45%). The questions pertained to the pertinence of the solutions offered by the support unites, upholding agreements, availability of services, communication skills and meeting the needs of the units. On average, nine out of ten respondents were happy with the work of the units.
In the autumn of 2011, our second Family Day took place. All staff members were expected to bring along
their children, spouses, partners, siblings, parents, grand-parents and/or other relatives, colleagues or friends. There were tours, workshops and lectures for adults and children in the Philosophicum, Chemicum, botanical gardens and museums.
PARTNERSHIPSANDINTERNATIONALISATION
According to the Times Higher Education World University Ranking 2011–2012, UT is placed in the 351–400 brack-et. In this annual ranking, only the top 200 universi-ties are individually ranked, with the following 200 are listed in groups. For the first
time, the universities that had made significant progress in the last few years and had the potential to become one of the top 200 were named as well. Along with some promising Czech, Polish, Turkish, Iranian and Indian universities, UT is expected to enter the top 200 soon.
Almost every 3rd em-ployee of the UT at-tended an internal train-ing event in 2011
The survey on satisfaction with working conditions showed that UT employees consider their work to be important and interesting and hey are proud to work at the University of Tartu.
Of all Baltic universi-ties, UT is now the only one among the top 3% of the world’s leading uni-versities
42 43

The list of international dignitaries who visited UT in 2011 included H.E. Bronisław Komorowski, President of the Republic of Poland, and H.E. Dalia Grybauskaité, Presi-dent of the Republic of Lithuania. In spring, Rector of the University of Latvia Marcis Auzinš and Rector of Vilnius University Benediktas Juodka, visited UT to discuss further cooperation opportunities with Rector Alar Ka-ris. The three rectors signed a joint memorandum listing the common objectives of their universities with respect to research, teaching, internationalisation and marketing. The primary aim of the joint statement was to draw the at-tention of the government leaders of the three countries to the important role these research universities play in their respective societies.
In August, a high-level delegation from Tongji University, led by Vice President Prof. Chen Xiaolong and Prof. Lou Yongqi, Executive Vice Director of the Sino-Finnish Cen-tre of Tongji University, visited UT on a fact-finding mis-sion signed an institutional cooperation agreement. Tongji University, which operates under the direct supervision of the Chinese Ministry of Education, has opened eight cooperation centres with universities abroad that develop joint curricula and other joint programmes, and develop business relations between the countries.
On 21 April 2011, Rector of the University of Tartu Alar Karis, Rector of the University of Latvia Marcis Auzin, and Rector of Vilnius University Benediktas Juodka, signed a memorandum listing the common objectives of the three universities
In September, virologist Dr. Robert Gallo, one of the dis-coverers of HIV and one of the first to prove that HIV causes AIDS, delivered a public lecture at UT. Other no-table scholars who visited UT and gave public lectures in 2011 included mathematician Keith Devlin from Stanford University and Ronald Inglehart, one of the world’s lead-ing political scientists and the recipient of the 2011 Johan Skytte Prize.
Rankings of Estonia’s universities
International ranking table
Number of universi-ties included
Criteria and indicators Position of Estonian univer-sities
Times Higher Education World University Rank-ings (THE)
400 world’s best-per-forming institutions. Top 200 are ranked individually, the rest are grouped.
13 performance indicators, grouped into 5 areas: teaching, research, cita-tions, industry income, international outlook.
THE 2011–2012 edition:UT in the 351–400 group
QS World Uni-versity Rankings (QS)
Over 2,000 universi-ties are considered, 700 evaluated and the top 400 are ranked individually.
Six indicators are drawn together to form an overall score: academic peer review, employer review, faculty-student ratio, citations per faculty, international faculty, international students.
QS ranking 2011: UT in 501–550 range
Leiden Ranking, Centre for Sci-ence and Technol-ogy Studies at Leiden University
500 largest universities worldwide in terms of published papers, based on publications in Thomson Reuters’ Web of Science database in the period 2005–2009.
Universities are ranked according to scientific performance in two cat-egories: scientific impact indicators (various citation scores of publica-tions) and scientific collaboration indicators for publications.
The threshold for the 2011/2012 edition was 3,200 publications, therefore UT was not included.In 2010, UT ranked 201 in Europe and 396 in the world according to Number of cita-tions per paper
Webometrics Ranking of World Universities
More than 20,000 universities with an independent domain are considered, 12,000 included in the list.
Measures the volume, visibility and impact of the web pages published by universities.
January 2012: University of Tartu – 501Tallinn University of Tech-nology – 764Estonian University of Life Sciences – 1486Tallinn University – 1645
44 45

In October, UT hosted an international symposium on language and identity that was the result of cooperation between the Culture, Arts and Humanities task force of the Coimbra Group of Universities and the Graduate School of Linguistics, Semiotics and Philosophy, focussing on the prospects of smaller European linguistic communities in a globalising world and on university lan-guage policies. The 15th German-Estonian academic week Academica welcomed the University of Greifswald, UT’s partner university in Germany.
DEVELOPMENTACTIVITIESGOAL: UT is modernising the management of processes and units
The University of Tartu Act was amended in 2011: UT’s responsibilities as Es-tonia’s National University were elaborated and our governance structure was changed as of 2012. Among other responsibilities, the act states that ‘In order to preserve and refine the Estonian culture and the Estonian language, the uni-versity advances learning in disciplines that investigate Estonia and its people, promotes Estonian-language education, preserves the nation’s cultural heritage and offers to the public services related to these activities.’ As of 2012, our highest decision-making body will be the Council, consisting of five members from the university and six members from outside. The Senate, consisting of 22 members from among the academic staff and students will be the academic decision-making body responsible for teaching, research and development ac-tivities. It will be chaired by the rector. 2011 was the year of preparations for implementing the amendments: elections of the Senate were held, the councillors from the university were appointed and a plan for amending the Statutes of the University of Tartu was drawn up.
Implementation of performance management methods continued in 2011 as well. For the first time, all faculties, colleges and support units set their goals according to a common balanced scorecard methodology.
The University Council adopted marketing principles to link our marketing activities with the expectations and needs of the target groups, thus, moving away from the study-programme, service or structural-unit-based approach. In spring, the first marketing campaign targeting the Russian community in Estonia was organised to increase the share of students who have finished a school where Russian was the language of instruction and to draw attention to the Russian version of our website. Almost 42 000 visits (al-most 29 000 first visits) were made to our Russian website in two months.
The reputation survey of Estonia’s universities conducted by TNS Emor among 15–74-year-olds (1018 respondents) in Estonia confirmed that UT continues to be the best. 72% and 42% of respondents thought that the University of Tartu and Tallinn University of Technology (respectively) were the two most reputable universities in Estonia. Our reputation profile was compiled on the basis of respondents’ choices from among a set of adjectives. The most frequent choices were: high-level, academic, international, traditional and prestigious. The latter was used to characterise only us. Our reliability was also above average.
44 45

FINANCINGACTIVITIES GOAL: UT’s financial strategy contributes to achiev-ing our mission, vision and the targets listed in our Strategic Plan The consolidated group of UT consisted of the university and ten other legal entities, and its total operating costs in the financial year amounted to 127 million euros. OÜ Tartu Tehnoloogiapark, a technology park of UT, was liquidated in 2011.
The University Council approved the 2011 budget of 128.9 million euros. The actual input to the budget amounted to 118.2 million euros, which is 4.1 million more than in 2010. The revenues of UT per academic employee increased 3%, compared to 2010.
UT budget and execution of the budget (EUR million), 2007–2011
Main budget revenues in 2011
Payments for state-commissioned education amounted to slightly more than 56% of the teaching-related income of UT in 2011. The 0.8-million-euro increase in receipts from state-commissioned education was due to a slight upward adjustment in the baseline cost of a student place and the university’s most successful year so far in terms of the number of doctoral theses defended. Estonian people con-tinue to show a high interest in studying at UT: in spite of the difficult economic situation, the tuition receipts have remained stable through the last four years.
Research revenues
41%
43,9 mln €
Tuition revenues
54%
57,1 mln €
Other revenues 5%
5,2 mln € 0
10
20
30
40
50
60
mln
€
105,
5
129,
8
105,
1
111,
9
121,
1
109,
0
116,
8
123,
9
114,
1
118,
2
0
20
40
60
80
100
120
140
2007 2008 2009 2010 2011
mln
€ budget execution of the budget
OÜ Tartu Ülikooli Kirjastus (Tartu University Press)
100%
OÜ Tartu Ülikooli Tamme Apteek (Tartu University Tamme Pharmacy)
100%
MTÜ Tartu Üliõpilasmaja (Tartu Students Club)
100%
MTÜ Tartu Ülikooli Akadeemiline Spordiklubi (Tartu University Academic Sports Club) 100%
OÜ Tartu Üliõpilasküla Hostel (Tartu Student Village Hostel)
100%
MTÜ Tartu Üliõpilasküla (Tartu Student Village)
100%
Eesti Nanotehnoloogiate Arendus- keskuse AS (Estonian Nanotechnology
Competence Centre) 23,8%
OÜ Kääriku Puhke- ja Spordikeskus (Kääriku Leisure and Sports Centre)
100%
OÜ Tervisliku Piima Biotehnoloogiate Arenduskeskus (Bio-Competence Centre
of Healthy Dairy Products) 20%
OÜ Tartu Ülikooli Kesklinna Apteek (Tartu University Downtown Pharmacy)
100%
UNiVErSiTy Of TArTU
46 47

KEYFIGURES(CONSOLIDATED)
2007 2008 2009 2010 2011
FINANCIAL FIGURES (euros)
Operating income 96 819,86 140 043 204 129 836 514 118 098 960 127 016 281
Operating expenses 91 757 954 112 279 984 117 367 351 127 218 304 129 010 250
Financial income and expenses -300 385 -287 602 57 520 -244 463 -354 567
Result for financial year 4 767 809 27 475 618 12 526 683 -9 438 967 -2 348 536
Balance sheet total 225 294 952 259 781 678 259 142 561 248 026 146 251 068 082
Current assets 26 318 817 33 854 000 31 016 323 34 134 013 35 196 814
Fixed assets 198 976 135 225 934 069 228 132 629 213 892 133 215 871 269
Current liabilities 27 245 536 27 922 999 20 803 242 17 083 933 19 725 480
Non-current liabilities and provisions 15 076 758 20 688 201 14 642 159 16 677 297 19 426 222
Net assets 182 972 659 211 176 869 223 703 552 214 264 916 211 916 380
Loans from banks 18 617 463 22 503 291 20 055 475 18 938 965 22 033 722
FINANCIAL RATIOS
Operating expenses / operating income 94,8% 80,2% 90,4% 107,7% 101,6%
Loans / operating income 19,2% 16,1% 15,4% 16,0% 17,3%
Current assets / current liabilities 96,6% 121,2% 149,1% 199,8% 178,4%
Fixed assets / balance sheet total 88,3% 86,9% 88,0% 86,2% 86,0%
Loans / balance sheet total 8,3% 8,7% 7,7% 7,6% 8,8%
Net assets / balance sheet total 81,2% 81,3% 86,3% 86,4% 84,4%
Due to Estonia’s conservative fiscal policy, UT receipts of government funding for research (targeted funding of research topics, baseline funding and targeted funding of infrastructure costs) remained at 2010 levels. Structural assistance made up a significant part of the increase in receipts. All in all, we received 13.8 million euros from the structural funds, accounting for almost 12% of total receipts in 2011. Of the research receipts, the structural assistance amounted to more than 21%.
Our expenditure reached 127.2 million euros in 2011. The cash flow was negative by nine million euros. However, this simply reflects the logic of structural assistance: the expenditure must be made first, and it will be reimbursed once the respective report is submitted and scrutinised. Since structural assistance made up a considerable share of our budget, its influence on the general cash flow was significant.
The revenue from R&D activities increased 2.8%, compared to 2010, accounting for slightly more than 41% of our main budget (43.9 million euros). International contracts and grants accounted for almost 13% of our R&D revenues that amounted to 25 093 euros per academic staff member in 2011.
Teaching revenues in our main budget in 2011
R&D revenues in our main budget in 2011
56%
14%
8%
8%
7% 4% 3%
State-commissioned education (32,2 mln €)
Medical-residents' training (8,0 mln €)
Tuition fees, regular studies (4,7 mln €)
Tuition fees, Open University studies (4,4 mln €)
EU structural funds (4,0 mln €)
Other tuition receipts (2,2 mln €)
Continuing education (1,7 mln €)
26%
15%
13%
13%
10%
8%
8%
7%
Targeted funding of research topics (11,4 mln €)
Research and development contracts (6,5 mln €)
International contracts and grants (5,9 mln €)
Estonian Science Foundation grants (5,7 mln €)
Other research receipts (4,2 mln €)
Infrastructure programmes (3,5 mln €)
Baseline funding (3,4 mln €)
Targeted funding of infrastructure costs (3,3 mln €)
46 47

Baseline funding data indicate that the R&D performance indicators of UT have improved each year.
Revenues from national and international R&D grants to the R&D institutions of the four public universities in Estonia, their revenues from contracts pertaining directly to their R&D activities and revenues from licences and patents (EUR million), 2007–2010 (Source: baseline funding data of the Ministry of Education and Research)
Estonia’s R&D institutions were given public research fi-nances in the amount of 52.1 million euros in 2011. 50% of that amount went to UT. Tallinn University of Technol-ogy received the second largest amount of public financing (almost 23%).
Resources (EUR million) allocated to UT and other R&D institutions in 2011. (Source: Ministry of Education and Research)
GOAL: UT has developed an attractive study, work and creative environment for supporting its core activities
Contributions to our capital budget amounted to 7.9 million euros (excl. transfers from the main budget), i.e. more than a million less than in 2010. Our infrastructure development and purchasing of research equipment receive considerable support from the structural funds.
Contributions to our capital budget in 2011
2011 saw full renovation of two important academic build-ings: those of the Faculty of Philosophy at Jakobi 2 and of the Faculty of Social Sciences and Education at Lossi 36. The total area renovated was 12 698 m2, and the renova-tion was financed with loans and receipts from our core activities. The construction of the new academic build-ing of Narva College, designing a physics building and a translational medicine centre and preparations for their construction continued as well. These projects will be fi-nanced mostly from structural assistance. In the past five years, we have invested more than 70 million euros into our buildings.
Our faculties and colleges were using 43 academic build-ings and rental premises with a total area of 164 751 m2 at the end of 2011.
We transferred eight immovables (at Baeri 6, Lätte 4, a residency on Lake Pühajärv and 5 apartments) and sur-rendered possession of two immovables (at Veski 6 and the academic building of Türi College at Viljandi mnt 13b). At the end of 2011, we owned 77 immovables with a total area of 204.5 ha in 10 urban areas and possessed 281 500 m2 in 108 buildings. We also owned 16 buildings that are architectural or historical monuments.
Opening of the academic building of the Faculty of Philoso-phy at Jakobi 2 on 23 September 2011
6,2 5,4
11,4
3,9 3,1
7,6
1,2 1,6
3,3
2,2 1,5
3,4
0
5
10
15
20
25
Other R&D institutions Tallinn University of Technology
University of Tartu
mln
€
Baseline funding
Financing of infrastructure costs
Estonian Science foundation grants and mobility grants Targeted funding of research topics
0,8
2,7
7,3
8,6
1,4
3,3
6,8
10,7
1,3
3,3
6,6
11,2
1,1
4,5
8,0
12,5
0 5 10 15
Tallinn University
Estonian University of Life Sciences
Tallinn University of Technology
University of Tartu
mln €
2010
2009
2008
2007
26%
50%
7%
4%
13% Receipts from the main budget (2,8 mln €)
Investment loan (5,4 mln €)
Dormitories programme receipts (0,8 mln €)
EU structural funds (0,4 mln €)
Other receipts (1,4 mln €)
48 49

RECEIPTS 2008 2009 2010 2011
1. Tuition receipts
1.1. Government-funded provision of higher education
32 471,2 33 129,2 31 369,1 32 175,8
1.2. Non-distance tuition fees 4 386,2 4 821,1 4 851,7 4 743,5
1.3. UT open university tuition fees 4 258,7 4 391,9 4 389,1 4 363,2
1.4. Continuing education fees 1 764,7 1 410,9 1 367,4 1 654,0
1.5. Fees for medical residents’ training 7 748,2 7 212,6 7 778,8 7 997,9
1.6. Assistance from EU structural funds 3 290,4 1 372,3 2 150,5 4 002,8
1.7. Other tuition receipts 2 366,5 2 080,7 2 756,6 2 161,6
Total tuition receipts 56 286,0 54 418,7 54 663,2 57 098,8
2. Research receipts
2.1. Targeted funding of research themes 12 056,2 11 573,9 11 247,2 11 405,6
2.2. Grants from Estonian Science Foundation
4 981,7 5 076,8 5 095,8 5 688,1
2.3. Research and development contracts 5 686,5 5 109,5 5 825,6 6 476,3
2.4. International contracts and grants 5 356,8 5 460,1 6 158,7 5 871,8
2.5. Targeted funding of infrastructure expenditure
3 528,3 3 304,9 3 242,5 3 282,4
2.6. Baseline funding 3 815,0 3 716,1 3 414,1 3 402,0
2.7. Other research receipts 6 424,6 4 346,5 7 692,1 7 738,0
Total research receipts 41 849,0 38 587,9 42 675,9 43 864,2
3. Other receipts
3.1. Student allowance funds 5 075,9 2 315,4 2 207,5 2 462,9
3.2. Investment loan 5 752,0 0,0 4 320,0 5 400,0
3.3. EU’s structural funds for infrastructure investments
61,4 18 620,6 1 778,0 359,8
3.4. Other receipts 7 728,8 9 961,5 8 487,5 8 991,6
Total other receipts 18 618,0 30 897,5 16 792,9 17 214,2
TOTAL RECEIPTS 116 753,1 123 904,2 114 132,0 118 177,3
EXPENDITURE 2008 2009 2010 2011
1. Research areas
1.1. Humaniora 9 973,1 10 517,2 10 906,7 12 442,9
1.2. Medicina 20 389,0 21 355,6 23 193,7 22 734,3
1.3. Realia et naturalia 31 904,2 33 407,0 36 593,0 40 112,8
1.4. Socialia 14 212,6 13 574,3 13 621,6 15 447,4
Total for research areas 76 479,0 78 854,2 84 315,1 90 737,3
2. University institutions 5 479,9 5 900,2 5 880,8 6 245,6
3. Administrative and support structure 8 576,9 9 415,7 8 999,4 9 456,0
4. Members' fees 1 085,6 1 122,1 1 066,8 1 212,4
5. Investments in construction projects 23 495,5 16 360,8 5 504,4 11 666,6
6. Loan repayments 1 947,8 1 641,8 2 275,4 2 251,6
7. Student allowances 4 906,1 2 597,0 2 474,2 2 378,1
8. Other expenditures 2 653,2 2 581,1 2 473,2 3 205,8
TOTAL EXPENDITURES 124 624,0 118 473,0 112 989,4 127 153,4
Receiptsandexpenditure(thousandeuros)
Comment: The principles of drawing up and executing UT budget have been established by the budget-ing rules and regulations approved by the University of Tartu Academic Council. Since they differ from those used in accounting, the data cannot be compared.
48 49


UNIVERSITY OF TARTU
CONSOLIDATED
FINANCIAL STATEMENTS
2011


UNIVERSITY OF TARTU
CONSOLIDATED FINANCIAL STATEMENTS 2011
53
CONTENTS OF THE CONSOLIDATED FINANCIAL STATEMENTS
Note 1. Significant accounting policies ............................................................................................................ 59
Note 2. Cash and cash equivalents ................................................................................................................... 70
Note 3. Trade receivables ................................................................................................................................. 71
Note 4. Prepaid taxes and taxes payable .......................................................................................................... 71
Note 5. Other receivables ................................................................................................................................. 71
Note 6. Government grants receivable ............................................................................................................. 72
Note 7. Prepayments for services ..................................................................................................................... 73
Note 8. Inventories ........................................................................................................................................... 73
Note 9. Investments in associates ..................................................................................................................... 74
Note 10. Investment property ........................................................................................................................... 75
Note 11. Property and equipment ..................................................................................................................... 76
Note 12. Intangible assets ................................................................................................................................. 77
Note 13. Finance and operating leases ............................................................................................................. 78
Note 14. Bank loans and assets pledged as collateral ....................................................................................... 79
Note 15. Payables to employees ....................................................................................................................... 81
Note 16. Other accrued expenses ..................................................................................................................... 81
Note 17. Deferred income ................................................................................................................................ 82
Note 18. Revenue from operating activities ..................................................................................................... 83
Note 19. State budget transfers for teaching activities ..................................................................................... 83
Note 20. State budget transfers for research activities ..................................................................................... 83
Note 21. Grants related to assets ...................................................................................................................... 84
Note 22. Grants related to income .................................................................................................................... 84
Note 23. Other income ..................................................................................................................................... 85
Note 24. Goods, materials and services used ................................................................................................... 85
Note 25. Operating expenses ............................................................................................................................ 85
Note 26. Personnel expenses ............................................................................................................................ 86
Note 27. Depreciation, amortisation and impairment losses ............................................................................ 86
Note 28. Other expenses ................................................................................................................................... 87
Note 29. Related party disclosures ................................................................................................................... 87
Note 30. Contingent liabilities .......................................................................................................................... 88
Note 31. Assets accounted for off the statement of financial position ............................................................. 89
Note 32. Events after the reporting date ........................................................................................................... 89
Note 33. Unconsolidated financial statements of the University of Tartu ........................................................ 90
CONSOLIDATED STATEMENT OF FINANCIAL POSITION .........................................................................54
CONSOLIDATED STATEMENT OF FINANCIAL PERFORMANCE .............................................................56
CONSOLIDATED STATEMENT OF CASH FLOWS ........................................................................................57
CONSOLIDATED STATEMENT OF CHANGES IN NET ASSETS .................................................................58
NOTES TO THE CONSOLIDATED FINANCIAL STATEMENTS ...................................................................59
INDEPENDENT AUDITOR’S REPORT .............................................................................................................95
SIGNATURES TO ANNUAL REPORT 2011......................................................................................................96

UNIVERSITY OF TARTU
CONSOLIDATED FINANCIAL STATEMENTS 2011
54
CONSOLIDATED STATEMENT OF FINANCIAL POSITION
ASSETS Note 31 December 2011 31 December 2010
(In thousands of euros)
Current assets
Cash and cash equivalents 2 10,093 19,949
Other current financial assets 1,500 0
Receivables and prepayments
Trade receivables 3 1,978 1,779
Prepaid and recoverable taxes 4 204 360
Other receivables 5 61 106
Government grants receivable 6 20,125 10,838
Prepayments for services 7 691 573
Total receivables and prepayments 23,059 13,656
Inventories 8 545 529
Total current assets 35,197 34,134
Non-current assets
Non-current financial assets
Investments in associates 9 61 46
Other non-current financial assets 14 15
Total non-current financial assets 75 61
Investment property 10 1,902 2,218
Property and equipment 11
Land 2,252 2,276
Buildings and structures 179,303 178,809
Equipment and vehicles 15,624 13,639
Library collections 7,218 6,502
Other equipment and fixtures 1,525 1,852
Assets under construction 5,307 5,513
Prepayments for property and equipment 61 442
Total property and equipment 211,290 209,033
Intangible assets 12 2,604 2,580
Total non-current assets 215,871 213,892
TOTAL ASSETS 251,068 248,026
The notes on pages 59 to 94 are an integral part of these consolidated financial statements.

UNIVERSITY OF TARTU
CONSOLIDATED FINANCIAL STATEMENTS 2011
55
LIABILITIES AND NET ASSETS Note 31 December 2011 31 December 2010
(In thousands of euros)
Liabilities
Current liabilities
Loans and borrowings
Security deposit liabilities 131 133
Finance lease liabilities 13 21 8
Current portion of
14 2,620 2,276 long-term loans
Total loans and borrowings 2,772 2,417
Derivative financial instruments 148 108
Trade payables 3,750 2,540
Taxes payable 4 2,895 2,607
Accrued expenses
Payables to employees 15 2,217 1,901
Other accrued expenses 16 1,587 996
Total accrued expenses 3,804 2,897
Deferred income 17 6,356 6,515
Total current liabilities 19,725 17,084
Non-current liabilities
Finance lease liabilities 13 13 15
Bank loans 14 19,414 16,663
Total non-current liabilities 19,427 16,678
Total liabilities 39,152 33,762
Net assets
Capital of the University 144,182 144,182
Accumulated surpluses 70,082 79,521
Deficit for the year -2,348 -9,439
Total net assets 211,916 214,264
TOTAL LIABILITIES AND NET ASSETS 251,068 248,026
The notes on pages 59 to 94 are an integral part of these consolidated financial statements.

UNIVERSITY OF TARTU
CONSOLIDATED FINANCIAL STATEMENTS 2011
56
CONSOLIDATED STATEMENT OF FINANCIAL PERFORMANCE (In thousands of euros)
Note 2011 2010
Revenue
Revenue from operating activities 18 22,477 22,859
State budget transfers for teaching activities 19 41,128 40,044
State budget transfers for research activities 20 19,813 19,589
Grants related to assets 21 9,370 6,874
Grants related to income 22 32,653 26,715
Other income 23 1,575 2,018
Total revenue 127,016 118,099
Expenses
Goods, materials and services used 24 -11,039 -11,393
Operating expenses 25 -31,335 -26,766
Scholarships -7,008 -6,059
Personnel expenses 26 -61,533 -58,125
Depreciation, amortisation and impairment losses 27 -16,536 -23,549
Other expenses 28 -1,558 -1,326
Total expenses -129,009 -127,218
Deficit on operating activities -1,993 -9,119
Finance income and costs
Loss on sale of a subsidiary 0 -8
Share of profit of associates 15 19
Interest income 94 208
Interest expense -465 -465
Net foreign exchange gain 0 1
Other finance income 1 0
Net finance costs -355 -245
Deficit before income tax -2,348 -9,364
Income tax expense 0 -75
Deficit for the year -2,348 -9,439
The notes on pages 59 to 94 are an integral part of these consolidated financial statements.

UNIVERSITY OF TARTU
CONSOLIDATED FINANCIAL STATEMENTS 2011
57
CONSOLIDATED STATEMENT OF CASH FLOWS
(In thousands of euros) Note 2011 2010
Cash flows from operating activities
Deficit on operating activities -1,993 -9,119
Adjustments for
Depreciation, amortisation and impairment losses 27 16,536 23,549
Recognition of assets under construction as an expense 11 68 157
Other non-monetary transactions with non-current assets 19 -47
Gain on sale of non-current assets 23 -455 -739
Non-monetary grants related to assets 11 0 -101
Change in receivables and prepayments -9,416 -3,023
Change in inventories 8 -16 310
Change in payables 1,067 -756
Interest paid -462 -457
Income tax paid 0 -75
Net cash from operating activities 5,348 9,699
Cash flows from investing activities
Proceeds from sale of investment property 10 174 0
Acquisition of property and equipment 11, 13 -7,250 -6,618
Proceeds from sale of property and equipment 766 849
Paid for assets under construction -9,499 -1,315
Prepayments for property and equipment 11 -843 -863
Acquisition of intangible assets 12 -157 -453
Prepayments for intangible assets 12 -66 -41
Proceeds from sale of a subsidiary 0 32
Recovery of a non-current receivable 2 0
Acquisition of other financial assets -1,500 0
Interest received 107 373
Net cash used in investing activities -18,266 -8,036
Cash flows from financing activities
Proceeds from loans received 14 5,400 4,320
Repayment of loans -2,305 -5,407
Payment of finance lease liabilities 13 -33 -5
Net cash from/used in financing activities 3,062 -1,092
Net cash flow -9,856 571
Cash and cash equivalents at beginning of year 2 19,949 19,377
Decrease/increase in cash and cash equivalents -9,856 571
Effect of movements in exchange rates 0 1
Cash and cash equivalents at end of year 2 10,093 19,949
The notes on pages 59 to 94 are an integral part of these consolidated financial statements.

UNIVERSITY OF TARTU
CONSOLIDATED FINANCIAL STATEMENTS 2011
58
CONSOLIDATED STATEMENT OF CHANGES IN NET ASSETS (In thousands of euros) Capital of the
University
Accumulated
surpluses
Surplus/deficit
for the year
Total
Balance at 31 December 2009 144,182 66,995 12,526 223,703
Transfer of surplus to accumulated surpluses 0 12,526 -12,526 0
Deficit for the year 0 0 -9,439 -9,439
Balance at 31 December 2010 144,182 79,521 -9,439 214,264
Transfer of deficit to accumulated surpluses 0 -9,439 9,439 0
Deficit for the year 0 0 -2,348 -2,348
Balance at 31 December 2011 144,182 70,082 -2,348 211,916
The notes on pages 59 to 94 are an integral part of these consolidated financial statements.

UNIVERSITY OF TARTU
CONSOLIDATED FINANCIAL STATEMENTS 2011
59
NOTES TO THE CONSOLIDATED FINANCIAL STATEMENTS
Note 1. Significant accounting policies The consolidated financial statements of the University of Tartu as at and for the year ended 31 December 2011
have been prepared in accordance with accounting principles generally accepted in the Republic of Estonia (the
Estonian GAAP). The principal requirements of the Estonian GAAP are provided in the Estonian Accounting
Act and the guidelines issued by the Estonian Accounting Standards Board. The University of Tartu also
observes General Rules for State Accounting, which are based on the Estonian GAAP.
The consolidated financial statements have been prepared on a historical cost basis except where described
otherwise in these accounting policies.
The consolidated financial statements for 2011 have been prepared on the assumption that the University of
Tartu and its consolidation group are going concerns. The financial year began on 1 January 2011 and ended on
31 December 2011. The financial statements are presented in euros. All amounts are in thousands of euros,
rounded to the nearest thousand.
The consolidated statement of financial performance has been prepared based on format 1 in annex 2 to the
Accounting Act. Because of the specific nature of the activity of the University of Tartu as a legal person
governed by public law, certain account titles in the statements of financial performance and net assets as well as
the structure of the statements have been modified.
The consolidated financial statements for the year ended 31 December 2011 comprise the financial information
of the University of Tartu (the parent), its subsidiaries OÜ Tartu Ülikooli Kirjastus, OÜ Tartu Ülikooli Tamme
Apteek, OÜ Tartu Ülikooli Kesklinna Apteek, OÜ Tartu Tehnoloogiapark, OÜ Kääriku Puhke- ja Spordikeskus,
OÜ Tartu Üliõpilasküla Hostel, MTÜ Tartu Üliõpilasküla, MTÜ Tartu Üliõpilasmaja and MTÜ Tartu Ülikooli
Akadeemiline Spordiklubi, and its associates Eesti Nanotehnoloogiate Arenduskeskuse AS and OÜ Tervisliku
Piima Biotehnoloogiate Arenduskeskus. All subsidiaries, which are business entities, are wholly owned by the
University of Tartu. The University of Tartu has a 20-50% interest in the associates (see note 9) and control
(over 50% of voting power) over all subsidiaries that are non-profit associations. Accordingly, non-profit
associations are fully consolidated. All subsidiaries and associates operate in Estonia.
In 2010, the University of Tartu sold its 100% stake in the subsidiary OÜ Tartu Ülikooli Raamatupood. The
financial statements of the subsidiary have been included in the consolidated financial statements for 2010 until
the date of sale, i.e. 31 August 2010. In 2010, the University started the liquidation of the subsidiary OÜ Tartu
Tehnoloogiapark. The final balance sheet of OÜ Tartu Tehnoloogiapark (under liquidation) was prepared as at
18 October 2010 and the liquidation proceedings were completed in March 2011.
A. Changes in presentation of information On 1 January 2011 the Republic of Estonia joined the euro-zone and adopted as its national currency the euro,
which replaced the Estonian kroon. Accordingly, as from 1 January 2011 the functional currency of the
University of Tartu is the euro. The change in functional currency has been recognised prospectively. The parent
and the subsidiaries and the associates translated their accounting balances as at 1 January 2011 into euros using
the exchange rate of 15.6466 kroons per 1 euro.
The consolidated financial statements for 2011 are presented in euros. Comparative prior period data has been
translated from Estonian kroons to euros using the official exchange rate of the switchover of 15.6466 kroons per
1 euro. Since the Estonian kroon was previously pegged to the euro at the same exchange rate, the translation did
not give rise to any exchange differences.
B. Preparation of consolidated financial statements
B1. Basis of consolidation In preparing the consolidated financial statements, the financial statements of the University of Tartu and all the
subsidiaries under its control are combined line by line.

UNIVERSITY OF TARTU
CONSOLIDATED FINANCIAL STATEMENTS 2011
60
Intra-group balances and intra-group transactions and resulting unrealised profits are eliminated in preparing the
consolidated financial statements. Unrealised losses resulting from intra-group transactions are also eliminated
unless the costs cannot be recovered. The accounting policies of the subsidiaries are adjusted where necessary to
ensure consistency with the policies adopted by the group.
B2. Subsidiaries Subsidiaries are entities controlled by the University of Tartu. Control is presumed to exist when the parent
holds, directly or indirectly, over 50% of the voting power of an entity or has the power to govern an entity’s
operating and financial policies by some other means.
The term “subsidiary” also covers non-corporate entities such as foundations and non-profit associations. The
existence of control and significant influence over non-corporate entities is determined considering, among other
factors, whether the assets of the entity will transfer to the group when the entity is liquidated. When the group
has control over a foundation or a non-profit association (generally over 50% of voting power), the investment is
accounted for as a wholly-held investment.
Acquisitions of subsidiaries are accounted for by applying the purchase method (except for business
combinations involving entities under common control that are accounted for using the modified purchase
method). Under the purchase method, the acquired subsidiary’s assets, liabilities and contingent liabilities (i.e.
the net assets acquired) are recognised at their fair values and any difference between the cost of the business
combination and the fair value of the net assets acquired is recognised as positive or negative goodwill.
From the date of acquisition, the group’s interest in an acquired entity’s assets, liabilities and contingent
liabilities and any goodwill acquired is recognised in the consolidated statement of financial position and the
group’s interest in the acquired entity’s revenues and expenses is recognised in the consolidated statement of
financial performance. Positive goodwill is recognised as an intangible asset in the consolidated statement of
financial position.
When a subsidiary is sold during the reporting period, its revenues and expenses are included in the consolidated
statement of financial performance until the date of sale. The difference between the sales price and the carrying
amount of the subsidiary’s net assets (including goodwill) as at the date of sale is recognised as a gain/loss on the
sale of the subsidiary. If part of a subsidiary is sold and the group’s interest in the entity decreases below 50%
(the group loses control) but the group does not lose all influence, consolidation of the entity is discontinued as
of the date of sale and the group’s remaining interest in the entity’s assets, liabilities and goodwill is accounted
for as an investment in an associate, an investment in a joint venture or other financial asset. The remaining
carrying amount of an investment at the date it ceases to be a subsidiary is regarded as its cost thereafter.
B3. Associates Associates are entities over which the University of Tartu has significant influence but not control. Significant
influence is presumed to exist when the group holds, directly or indirectly, 20-50% of the voting power of an
entity.
When the group has significant influence (generally 20-50% of voting power) in a foundation or non-profit
association, no investment or financial asset is recognised in the statement of financial position. Contributions to
the capital of such an entity are recognised as an expense (support provided).
In the consolidated statement of financial position, investments in associates are accounted for using the equity
method. Under the equity method, an investment is initially recognised at cost and its carrying amount is
adjusted in subsequent periods for the investor’s share of changes in the investee’s equity (both changes in the
investee’s profit or loss and other items of equity), for the elimination of any difference identified in the purchase
price allocation between the net fair value and the carrying amount of the investee’s assets, liabilities and
contingent liabilities, and for depreciation. Unrealised profits on transactions between the investor and the
associate are eliminated to the extent of the investor’s interest in the investee. Unrealised losses are also
eliminated unless they result from impairment. If the group’s share of losses of an associate exceeds the carrying
amount of the investment in the associate, the carrying amount of the investment is reduced to zero and such
non-current receivables that in substance form part of the investment are written down. Recognition of further
losses is discontinued. If the group has incurred legal or constructive obligations on behalf of the associate, both
the liability and loss under the equity method are recognised in the consolidated financial statements. Other
receivables from the associate are measured based on their recoverability.

UNIVERSITY OF TARTU
CONSOLIDATED FINANCIAL STATEMENTS 2011
61
The interest acquired in an associate’s assets and liabilities and any goodwill acquired on the business
combination is recognised in the consolidated statement of financial position in the net amount within
Investments in associates.
At each reporting date the group assesses if there is any indication that the recoverable amount of an investment
may have decreased below its carrying amount. If such indication exists, the investment is tested for impairment.
The recoverable amounts of investments are estimated as described in policy L. Impairment of assets.
Investments in subsidiaries and associates that meet the criteria for non-current assets held for sale (i.e. their sale
within the next 12 months is highly probable), are accounted for as follows:
(a) the assets and liabilities of such subsidiaries are presented in the consolidated statement of financial position
on separate lines Non-current assets held for sale and Liabilities related to non-current assets held for sale
respectively (measured at the lower of their carrying amount and fair value less costs to sell);
(b) investments in such associates are presented in the consolidated statement of financial position on a separate
line Non-current assets held for sale and they are measured at the lower of their carrying amount and fair
value less costs to sell.
B4. Interests in foundations and non-profit associations The group’s interests in entities under control and significant influence (including foundations and non-profit
associations) are accounted for as follows:
(a) when a group entity has control over a foundation or a non-profit association (generally over 50% of voting
power), the interest is accounted for as a wholly-held investment;
(b) when the group has significant influence over a foundation or a non-profit association (generally 20-50% of
voting power), no investment or financial asset is recognised in the consolidated statement of financial
position (contributions to the investee’s capital are accounted for as expenses from support provided).
The existence of control and significant influence over non-corporate entities is determined considering, among
other factors, whether the assets of the entity will transfer to the group when the entity is liquidated.
The University is involved in the activities of ten foundations through the councils of the foundations to which it
has appointed its representative(s). The University is a founding member in the following foundations:
1) Tartu University Hospital Foundation
2) Science Centre AHHAA Foundation
3) Estonian Information Technology Foundation
4) Tartu Science Park Foundation
5) University of Tartu Foundation
6) Estonian Agrenska Foundation
7) Saaremaa University Centre Foundation
8) Viljandi County Creative Incubators Foundation
9) Iuridicum Foundation
10) Centre for Strategic Initiatives Foundation.
The group’s interest in larger foundations (the net assets of the foundation and the group’s representation):
(In thousands of euros)
Foundation
Tartu
University
Hospital
Foundation
Science
Centre
AHHAA
Foundation
Estonian
Information
Technology
Foundation
Tartu Science
Park Foundation
University of
Tartu
Foundation
Net assets
As at 31 December 2010 81,887 7,829 5,448 4,124 2,187
As at 31 December 2011 83,144 10,391 5,496 4,542 2,481
Representation of the University of Tartu
In the council 3 members of 8 2 members of 6 1 member of 5 3 members of 10 X
On the board of trustees X X X X 1 member of 7

UNIVERSITY OF TARTU
CONSOLIDATED FINANCIAL STATEMENTS 2011
62
B5. Other financial assets – shares and other equity instruments Other current and non-current financial assets consisting of shares and other equity instruments whose fair value
cannot be measured reliably are measured at cost less any impairment losses.
The University of Tartu has equity interests in two companies:
1) Reproduktiivmeditsiini TAK AS – ownership interest 7.69%
2) Tarkvara Tehnoloogia Arenduskeskus AS – ownership interest 2%
B6. Parent entity’s unconsolidated financial statements presented in the notes to the consolidated financial statements In conformity with the Estonian Accounting Act, the notes to the consolidated financial statements have to
include the separate unconsolidated primary financial statements of the group’s parent (the consolidating entity):
the statements of financial position, financial performance and cash flows and the statement of changes in net
assets. The parent entity’s unconsolidated financial statements are prepared using the same accounting policies
as those applied on the preparation of the consolidated financial statements except that in the unconsolidated
financial statements investments in subsidiaries and associates are measured at cost less any impairment losses.
C. Financial assets The group has the following financial assets: cash and cash equivalents (see also accounting policy D), trade
receivables (see also accounting policy E), other receivables and other current and non-current financial assets
(other investments). Purchases and sales of financial assets are recognised using trade date accounting, i.e. at the
date the group commits itself to purchase or sell an asset.
Cash and cash equivalents, trade receivables and other receivables (accrued income, loans granted and other
current and non-current receivables) except for items acquired for resale are measured at their amortised cost. As
a rule, the amortised cost of a current receivable is equal to its nominal value (less any repayments and possible
impairments). Therefore, current receivables are stated at the amount that is expected to be recoverable.
Current and non-current investments in shares and other equity instruments (except for investments in
subsidiaries and associates that are accounted for using the consolidation and the equity method respectively) are
measured at their fair value if the latter can be measured reliably. Shares and other equity instruments whose fair
value cannot be determined reliably are measured at cost (less any impairment losses when the recoverable
amount of the asset has decreased below its carrying amount).
Other current financial assets comprise a non-cancellable term deposit whose maturity date is after 12 months of
the reporting date.
Other non-current financial assets (other investments in securities and non-current receivables) comprise
investments in securities (shares, debt securities, debentures, fund units, etc) that will probably not be sold within
the next 12 months (except for investments in subsidiaries and associates).
At each reporting date the group assesses whether there is any evidence that financial assets may be impaired. If
there is such evidence, financial assets are written down as follows:
(a) a financial asset measured at amortised cost (such as a receivable) is written down to the present value of its
estimated future cash flows (discounted at the asset’s original effective interest rate);
(b) a financial asset measured at cost (such as a share or other equity instrument whose fair value cannot be
measured reliably) is written down to the present value of its estimated future cash flows (discounted at the
current market rate of return for a similar financial asset).
An impairment loss is recognised as an expense in the statement of financial performance.
Reversals impairment losses:
(a) If the value of a financial asset measured at amortised cost that has been written down in a previous period
increases, the previously recognised impairment loss is reversed, resulting in the carrying amount of the
asset to be the lower of (1) the present value of the asset’s estimated future cash flows and (2) the amortised
cost of the asset that would have been measured had the impairment loss not been recognised. Reversals of
impairment losses are recognised in the statement of financial performance.
(b) Impairment losses recognised for financial assets measured at cost because their fair value cannot be
measured reliably are not reversed.

UNIVERSITY OF TARTU
CONSOLIDATED FINANCIAL STATEMENTS 2011
63
D. Cash and cash equivalents Cash and cash equivalents comprise cash on hand, current accounts, term deposits with a maturity of up to three
months, liquid units in the banks’ money market funds and card payments made but not yet received.
In the statement of cash flows, cash flows from operating activities are reported using the indirect method. Cash
flows from investing and financing activities are reported using the direct method.
E. Trade receivables Trade receivables comprise receivables arising in the ordinary course of the group’s operations excluding
receivables from subsidiaries and associates. Trade receivables are measured at their amortised cost, i.e. at their
original cost less any reduction for impairment.
In the statement of financial position, receivables are carried in the amount that is expected to be recoverable.
The recoverability of receivables is assessed on an individual basis: the recoverability of each invoice is
reviewed separately. In estimating the recoverability of receivables, the group takes into account both the
information available at the reporting date and the information that may affect the recoverability of receivables
that becomes available by the date the financial statements are authorised fort issue. A receivable is written down
if there is objective evidence indicating that the receivable will not be settled in accordance with the originally
agreed settlement terms. Evidence that a receivable may be impaired includes the debtor’s bankruptcy or
significant financial difficulty and non-adherence to settlement terms.
Impaired (doubtful) receivables are recognised as an expense. Impaired receivables are carried in the trade
receivables ledger until they are collected or considered irrecoverable and written off the statement of financial
position.
When it becomes apparent that a receivable cannot be expected to be collected, the item is considered
irrecoverable and is written off the statement of financial position. A receivable is considered irrecoverable when
the group has no means for collecting it (the debtor has been liquidated or has gone bankrupt and the assets in the
bankrupt’s estate are not sufficient for settling the debt, etc) or when the costs of collecting the receivable would
exceed estimated income from the recovery of the receivable.
When a receivable that has been classified as impaired (doubtful) or irrecoverable is collected, the previously
recognised impairment expense is reduced in the period in which the item is recovered.
F. Inventories Inventories are assets held for sale in the ordinary course of the group’s activity; in the process of production for
such sale; in the form of materials or supplies to be consumed in the production process or in the rendering of
services. Inventories encompass not only goods purchased for resale, materials, work in progress and finished
goods but also equipment and properties held for resale and the costs of services.
Finished goods and work in progress are measured at their cost of conversion, which comprises all direct and
indirect costs of production incurred in bringing the inventories to their present location and condition.
Goods and materials are initially recognised at cost. The cost of goods and materials comprises their purchase
price and transport, handling and other costs directly attributable to their acquisition.
In accordance with General Rules for State Accounting, non-recoverable duties and taxes paid on the acquisition
of inventories are recognised as an expense.
The cost of inventories is assigned using the FIFO formula. In the statement of financial position, inventories are
measured at the lower of cost and net realisable value. Net realisable value is the estimated selling price in the
ordinary course of business less the estimated costs of completion and the estimated costs necessary to make the
sale.

UNIVERSITY OF TARTU
CONSOLIDATED FINANCIAL STATEMENTS 2011
64
G. Investment property Investment property comprises property (land or a building or part of a building) that the group leases out to a
non-public sector entity to earn rentals or holds for capital appreciation but does not use in its operating activity.
Buildings and premises that are used by group entities are recognised as items of property and equipment.
An investment property is measured initially at its cost that includes any directly attributable transaction charges
(e.g. notary’s fees, stamp duties, fees for legal and advisory services, and other expenditures without which the
transaction would probably not have occurred). After initial recognition, an investment property is measured
using the cost model, i.e. at cost less any accumulated depreciation and any impairment losses.
Depreciation is charged using the straight-line method. Each item of investment property is assigned a
depreciation rate that corresponds to its useful life. Where an investment property consists of significant parts
that have different useful lives, the parts are accounted for separately and assigned depreciation rates that
correspond to their useful lives. The depreciation rates of the group’s investment properties range from 2-20%
per year.
Subsequent costs on an item of investment property are added to the carrying amount of the property if it is
probable that future economic benefits associated with item will flow to the group and the costs can be measured
reliably. Current maintenance and repair costs are recognised as an expense as incurred. When part of an
investment property is replaced, the cost of the new part is added to the carrying amount of the property if it
meets the definition of investment property and the recognition criteria and the carrying amount of the replaced
part is written off the statement of financial position.
An item of investment property is derecognised on disposal or when no future economic benefits are expected
from its use or disposal. Gains and losses arising from derecognition of investment property are recognised in the
period in which the property is derecognised in the statement of financial performance in Other income and
Other expenses respectively.
When the purpose of use of an investment property is changed, the property is reclassified. From the date of
transfer, the asset is accounted for using the accounting policies applied to the class of assets it is transferred to.
H. Property and equipment Property and equipment are assets that the group uses for meeting its statutory responsibilities, rendering
services or for administrative purposes, which it expects to use for a period exceeding one year, and whose cost
amounts to at least 2,000 euros. As an exception, land, books acquired for the library collections (see accounting
policy I), assets belonging to museum collections (museum exhibits) and assets belonging to and in the
possession of the University of Tartu that have been entered in the national register of cultural property are
recognised as items of property and equipment regardless of cost.
Assets acquired for museum collections are recognised as items of property and equipment in an aggregated set
(in the total amount). Accounts in unit and item terms are kept in the museums’ information systems. Items of
cultural property that are not recognised as assets of museum collections or assets entered in the national register
of cultural property are recognised as items of property and equipment when their cost exceeds the threshold for
recognising tangible items as items of property and equipment and they are depreciated over their estimated
useful lives.
Assets whose useful lives exceed a year but cost is less than 2,000 euros are recognised as an expense on
implementation. Expensed items of immaterial value whose cost extends from 640 to 1,999.99 euros are
accounted for off the statement of financial position.
Items of property and equipment are initially recognised at cost. The cost of an item of property and equipment
comprises its purchase price and any costs directly attributable to bringing the item to the location and condition
necessary for it to be capable of operating in the manner intended by the group. In accordance with General
Rules for State Accounting, non-recoverable duties and taxes and borrowing costs are not capitalised as part of
the cost of an item of property and equipment. In the statement of financial position, property and equipment is
carried at cost less any accumulated depreciation and any impairment losses. Assets acquired with finance leases
are accounted for similarly to assets that have been purchased.

UNIVERSITY OF TARTU
CONSOLIDATED FINANCIAL STATEMENTS 2011
65
Subsequent costs on an item of property and equipment are capitalised if it is probable that future economic
benefits associated with item will flow to the group and the costs can be measured reliably. Current repair and
maintenance costs are expensed as incurred.
Depreciation is charged using the straight-line method. Each item of property and equipment is assigned a
depreciation rate that corresponds to its useful life. In the case of an asset with significant residual value only the
depreciable amount (cost less residual value) is charged to expenses over the estimated useful life of the asset.
When an asset’s residual value increases to an amount greater than the asset’s carrying amount, depreciation of
the asset is discontinued.
Where an item of property and equipment consists of significant parts that have different useful lives, the parts
are accounted for separately and assigned depreciation rates that correspond to their useful lives.
The group assigns classes of property and equipment the following annual depreciation rates:
• Land 0%
• Buildings and structures 2-30%
• Equipment and vehicles 15-50%
• Library collections 0%
• Other items of property and equipment 2-35%
Assets with an unlimited useful life (land, assets entered in the national register of cultural property, assets
belonging to museum collections, books belonging to the library collections, publications and data media) are
not depreciated.
Depreciation of an asset begins when it is available for use, i.e. in the location and condition necessary for it to
be operating in the manner intended by management. Depreciation of an asset ceases when the asset is fully
depreciated, derecognised or classified as held for sale. Depreciation rates and methods and residual values are
reviewed at each reporting date.
When the recoverable amount of an item of property and equipment (i.e. the higher of its fair value less costs to
sell and value in use) is less than its carrying amount, the carrying amount of the item is written down to its
recoverable amount (see also accounting policy L).
The carrying amount of an item of property and equipment is derecognised on disposal or when no future
economic benefits are expected from its use or disposal. Gains and losses arising from derecognition of property
and equipment are recognised in the statement of financial performance in the period of derecognition.
I. Library collections Under section 41 subsection 2 of General Rules for State Accounting, public libraries whose core activity is
storage and lending of books may recognise the books as items of property and equipment regardless of cost. In
line with the requirements of General Rules for State Accounting, the group’s statement of financial position
includes the books acquired for the university library collections since January 2004. Books, publications and
other data media acquired for library collections are recognised as items of property and equipment in an
aggregated set (in the total amount). Accounts in unit and item terms are kept in the library’s information system.
The following books of the library collections are recognised in the consolidated statement of financial position:
(a) books, publications and other data media that University of Tartu has acquired since 2004;
(b) books, publications and other data media received from other libraries by means of exchange (measured at
their cost in the library’s exchange collection);
(c) data media paid for by the ELNET consortium that has been acquired for the University of Tartu
(recognised in revenue as non-monetary grants related to assets).
The following books of the library collections whose cost is unknown and fair value cannot be measured reliably
are accounted for in unit terms off the statement of financial position:
(a) books, publications and other data media acquired before 2004;
(b) books, publications and other data media received as donations;
(c) legal deposit copies sent to the university library by Estonian publishing houses.
The books, publications and other data media recognised in the statement of financial position are not
depreciated. A book is expensed in full when it is retired from use or it becomes apparent that it has been lost.
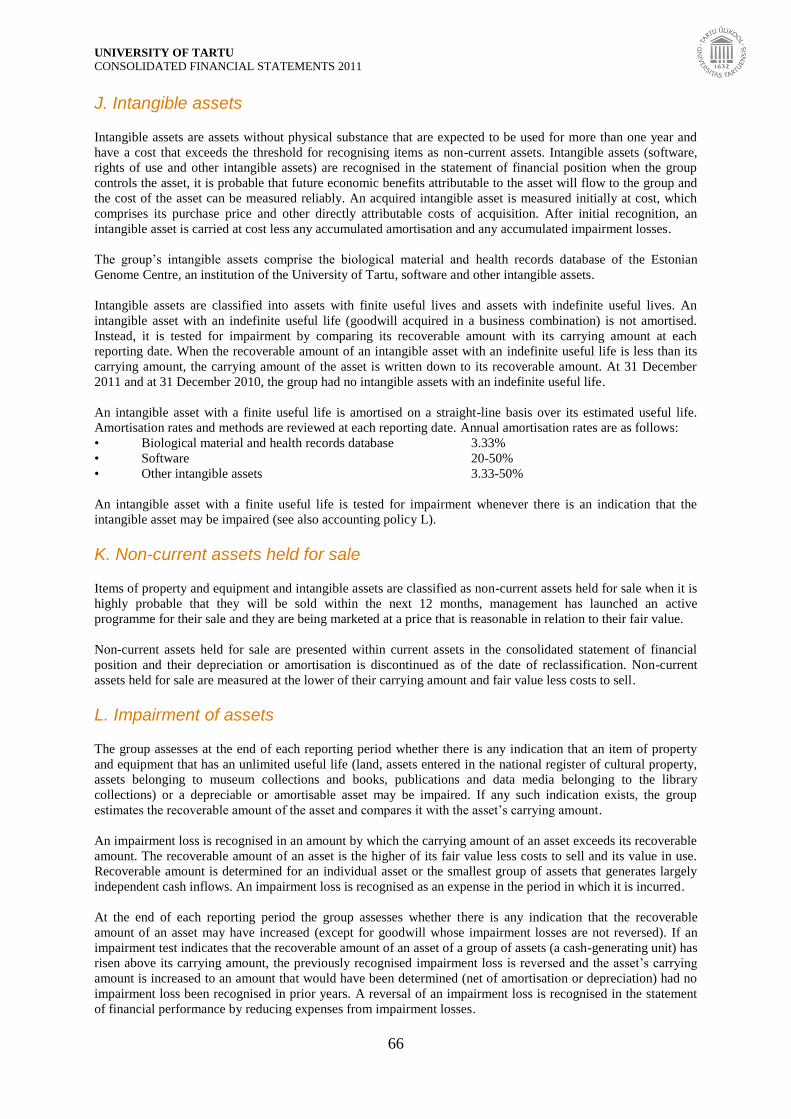
UNIVERSITY OF TARTU
CONSOLIDATED FINANCIAL STATEMENTS 2011
66
J. Intangible assets Intangible assets are assets without physical substance that are expected to be used for more than one year and
have a cost that exceeds the threshold for recognising items as non-current assets. Intangible assets (software,
rights of use and other intangible assets) are recognised in the statement of financial position when the group
controls the asset, it is probable that future economic benefits attributable to the asset will flow to the group and
the cost of the asset can be measured reliably. An acquired intangible asset is measured initially at cost, which
comprises its purchase price and other directly attributable costs of acquisition. After initial recognition, an
intangible asset is carried at cost less any accumulated amortisation and any accumulated impairment losses.
The group’s intangible assets comprise the biological material and health records database of the Estonian
Genome Centre, an institution of the University of Tartu, software and other intangible assets.
Intangible assets are classified into assets with finite useful lives and assets with indefinite useful lives. An
intangible asset with an indefinite useful life (goodwill acquired in a business combination) is not amortised.
Instead, it is tested for impairment by comparing its recoverable amount with its carrying amount at each
reporting date. When the recoverable amount of an intangible asset with an indefinite useful life is less than its
carrying amount, the carrying amount of the asset is written down to its recoverable amount. At 31 December
2011 and at 31 December 2010, the group had no intangible assets with an indefinite useful life.
An intangible asset with a finite useful life is amortised on a straight-line basis over its estimated useful life.
Amortisation rates and methods are reviewed at each reporting date. Annual amortisation rates are as follows:
• Biological material and health records database 3.33%
• Software 20-50%
• Other intangible assets 3.33-50%
An intangible asset with a finite useful life is tested for impairment whenever there is an indication that the
intangible asset may be impaired (see also accounting policy L).
K. Non-current assets held for sale Items of property and equipment and intangible assets are classified as non-current assets held for sale when it is
highly probable that they will be sold within the next 12 months, management has launched an active
programme for their sale and they are being marketed at a price that is reasonable in relation to their fair value.
Non-current assets held for sale are presented within current assets in the consolidated statement of financial
position and their depreciation or amortisation is discontinued as of the date of reclassification. Non-current
assets held for sale are measured at the lower of their carrying amount and fair value less costs to sell.
L. Impairment of assets The group assesses at the end of each reporting period whether there is any indication that an item of property
and equipment that has an unlimited useful life (land, assets entered in the national register of cultural property,
assets belonging to museum collections and books, publications and data media belonging to the library
collections) or a depreciable or amortisable asset may be impaired. If any such indication exists, the group
estimates the recoverable amount of the asset and compares it with the asset’s carrying amount.
An impairment loss is recognised in an amount by which the carrying amount of an asset exceeds its recoverable
amount. The recoverable amount of an asset is the higher of its fair value less costs to sell and its value in use.
Recoverable amount is determined for an individual asset or the smallest group of assets that generates largely
independent cash inflows. An impairment loss is recognised as an expense in the period in which it is incurred.
At the end of each reporting period the group assesses whether there is any indication that the recoverable
amount of an asset may have increased (except for goodwill whose impairment losses are not reversed). If an
impairment test indicates that the recoverable amount of an asset of a group of assets (a cash-generating unit) has
risen above its carrying amount, the previously recognised impairment loss is reversed and the asset’s carrying
amount is increased to an amount that would have been determined (net of amortisation or depreciation) had no
impairment loss been recognised in prior years. A reversal of an impairment loss is recognised in the statement
of financial performance by reducing expenses from impairment losses.

UNIVERSITY OF TARTU
CONSOLIDATED FINANCIAL STATEMENTS 2011
67
M. Deferred income Deferred income comprises tuition fees received for the next financial year, grants received in advance under
research and development contracts and other deferred income received in the reporting year but not recognised
in the revenue for the reporting year.
Out of the tuition fees paid for the autumn term of the 2011/2012 academic year, 80% have been included in the
revenue for 2011. The remaining 20% has been recognised as deferred income and will be taken to revenue in
2012.
At the end of the reporting period, revenue and expenses from designated-purpose grants are reviewed and
recognised in accordance with the accrual accounting and matching principles (see also accounting policy R).
When a grant has been received but has not yet been used, it is recognised as deferred income.
N. Finance and operating leases A finance lease is a lease that transfers all significant risks and rewards of ownership to the lessee. An operating
lease is a lease other than a finance lease.
The group as a lessee As a lessee, the group recognises finance leases as assets and liabilities in the statement of financial position at
amounts equal to the fair value of the leased property or, if lower, the present value of the minimum lease
payments. Lease payments are apportioned between the finance charge (interest expense) and the reduction of
the outstanding liability. Interest expense on the lease is recognised in the period in which it is incurred in
Interest expense in the statement of financial performance. The finance lease liability (net of the finance charge)
is classified into the current and non-current portions. Assets acquired with finance leases are depreciated
similarly to assets that are owned, over the shorter of their estimated useful life and lease term. Depreciation
expense is recognised in the statement of financial performance in Depreciation, amortisation and impairment
losses.
In the case of operating leases, lease payments are recognised as an expense on an accrual basis over the lease
term. Assets used under operating leases are not recognised in the lessee’s statement of financial position.
The group as a lessor Assets leased out under operating leases are presented in the group’s statement of financial position according to
the nature of the asset, i.e. similarly to other assets. The assets are depreciated using a depreciation policy that is
consistent with the group’s normal depreciation policy for similar assets. Operating lease payments received are
recognised as income on a straight-line basis over the lease term.
O. Financial liabilities A financial liability is measured initially at its cost, which includes any transaction costs that are directly
attributable to the acquisition of the financial liability. After initial recognition, a financial liability is measured
at its amortised cost using the effective interest rate method. Derivative financial instruments are measured at
their fair value. Derivative financial instruments whose fair value is negative are recognised as financial
liabilities.
The amortised cost of current financial liabilities is generally equal to their nominal value. Therefore, current
financial liabilities are carried in the amount payable. Non-current financial liabilities are recognised initially at
the fair value of the consideration received (less any transaction costs). Thereafter non-current financial
liabilities are measured at their amortised cost using the effective interest rate method. Interest expense on
financial liabilities is recognised on an accrual basis in the statement of financial performance in Interest
expense.

UNIVERSITY OF TARTU
CONSOLIDATED FINANCIAL STATEMENTS 2011
68
A financial liability is classified as current when it is due to be settled within 12 months after the reporting date
or the group does not have an unconditional right to defer settlement of the financial liability for at least 12
months after the reporting date. A loan liability that is due to be settled within 12 months after the reporting date
is classified as current unless the group expects and has the discretion to refinance or roll over the liability for at
least 12 months after the reporting date. When the group expects to refinance or reschedule loan repayments on a
long-term basis but at the reporting date there is no certainty as to whether the intention can be realised, the loan
is classified as current even if an agreement to refinance or reschedule payments is completed after the reporting
date and before the financial statements are authorised for issue. Liabilities which become payable on demand
due to breach of the provisions of the loan contract are also classified as current. A financial liability is
derecognised when it is discharged or cancelled or expires.
P. Derivative financial instruments When a derivative financial instrument is recognised initially, it is measured at its fair value at the date of
signature of the underlying contract. After initial recognition, derivatives are re-measured to fair value at each
reporting date. Gains and losses on changes in the fair value of derivative financial instruments are recognised as
income and expenses respectively in the statement of financial performance in the period in which they arise.
Q. Provisions and contingent liabilities Provisions are recognised for present obligations of uncertain timing or amount that have arisen as a result of
past events.
Other possible or present obligations whose realisation is not probable or amount cannot be measured
sufficiently reliably but which may transform into obligations under certain circumstances are disclosed in the
notes to the financial statements as contingent liabilities.
R. Government grants Government grants are accounted for in accordance with General Rules for State Accounting and Estonian
Accounting Standards Board Guideline RTJ 12, using the gross method.
A government grant is recognised when cash is transferred or received or at the date of accrual. Grants are
recognised in revenue and expenses using the accrual accounting principle. When the provider (donor) or
intermediary of a grant has set the condition that a payment application and/or expense documents have to be
submitted, the date recorded in the payment application as the date of incurrence of expenses or acquisition of
the asset (in the case of incurrence of expenses or performance of work that may be capitalised, the date of
completion of the work) is regarded as the date of receipt or intermediation of the grant. Government grants are
classified into domestic and foreign grants which are further classified into grants related to income and grants
related to assets. In revenue and expense accounts, distinction is made between provision and intermediation of
grants.
When a grant has been received but some of its conditions have not yet been complied with, or when the
provider or intermediary of a grant or co-financing has made a prepayment to the University of Tartu, the
amount received is recognised as deferred income.
Grants related to income Grants related to income are recognised as income over the periods necessary to match them with the costs
which they are intended to compensate. Grants related to income are recognised as revenue when there is
assurance that the grant will be received, the University of Tartu complies with the conditions attaching to the
grant and the costs that the grant is intended to compensate have been incurred.
Grants related to assets The main condition for grants related to assets is that the University of Tartu as the grant recipient has to
purchase, build or otherwise acquire a certain non-current asset. The University of Tartu recognises grants
related to assets as revenue in the period in which the non-current asset is acquired.

UNIVERSITY OF TARTU
CONSOLIDATED FINANCIAL STATEMENTS 2011
69
Non-designated grants Non-designated grants are grants provided without a designated purpose and special conditions, which the
University of Tartu as the recipient may use at its discretion. Non-designated grants are recognised as revenue as
of the date of receipt.
S. Foreign currency transactions and financial assets and liabilities denominated in foreign currency All currencies other than the group’s functional currency, the euro (until 31 December 2010 the Estonian kroon),
are regarded as foreign currencies. A transaction in foreign currency is recorded by applying the official
exchange rate of the European Central Bank quoted at the date of the transaction (until 31 December 2010 the
exchange rate of the Bank of Estonia). At the reporting date, monetary assets and liabilities denominated in
foreign currency (receivables and loans to be settled in cash) are retranslated into the functional currency using
the exchange rates of the European Central Bank (until 31 December 2010 the exchange rates of the Bank of
Estonia) ruling at that date. Exchange gains and losses arising on translation are recognised in the statement of
financial performance in the period in which they arise. Non-monetary assets and liabilities denominated in
foreign currency that are not measured at fair value are not retranslated at the reporting date but are continuously
measured by applying the exchange rate of the European Central Bank (until 31 December 2010 the exchange
rate of the Bank of Estonia) quoted at the date of the transaction.
T. Revenue and expenses Revenue and expenses are recognised on an accrual basis.
Revenue is measured at the fair value of consideration received or receivable for the sale of goods or rendering
of services in the ordinary course of the group’s activities, taking into account any discounts and rebates allowed
by the group. Revenue is recognised only when the amount of revenue can be measured reliably, it is probable
that the economic benefits associated with the transaction will flow to the group, the significant risks and
rewards of ownership have been transferred to the buyer, the group retains neither continuing managerial
involvement to the degree usually associated with ownership nor effective control over the goods sold, and the
costs incurred or to be incurred in respect of the transaction can be measured reliably. Revenue from the
rendering of services is recognised as the service is rendered or, if the service is rendered over an extended
period, using the percentage of completion method. Under the latter, the revenue and outcome of the provision of
a service are recognised in proportion to and in the same periods as associated expenses.
Revenue from teaching activities comprises tuition fees collected and to be collected from day-time students,
open university students, participants in further training programmes, etc. Revenue is recognised in the same
academic term during which the service was rendered. When part of the tuition fee transfers to the next financial
year, it is recognised in the statement of financial position within Deferred income.
Revenue from the sale of goods comprises revenue from the sale of goods produced or created for sale by the
group itself as well as revenue from the sale of goods purchased for resale.
Revenue from rental and lease activities comprises lease and rental payments received from legal persons and
individuals who lease or rent premises from the group, income from intermediation of ancillary lease or rental
costs, and rental payments received from students who live in hostels.
Revenue from research and development contracts comprises revenue from both domestic and international
R&D contracts. The contracts may be both current and non-current. At the reporting date, revenue has to be
recognised in the correct period and matched with the costs incurred as required by the matching principle.
Revenue from other services comprises revenue from education and training services provided to legal persons,
revenue from organising seminars and conferences and revenue from the sale of other products (books,
publications, plants, etc) and services (copying, laboratory services, etc).
State budget transfers for teaching activities comprise allocations and support payments received from the
Ministry of Education and Research and other public sector institutions.

UNIVERSITY OF TARTU
CONSOLIDATED FINANCIAL STATEMENTS 2011
70
State budget transfers for teaching activities comprise: allocations for state-funded higher education (state-
funded study places); funding for medical residents; the investment component of state-funded higher education;
allocations for the remuneration of professors emeritus; funding for the Gifted and Talented Development
Centre; funding for EuroCollege; funding for special education in the field of natural sciences; funding for
organising disbursement of study allowances, etc.
State budget transfers for research activities comprise: government grants for research topics; base financing for
research institutions; financing for research institutions’ infrastructure expenses; funding for national
programmes; state budget funding for scientific and research information for the library, etc.
Grants are transfers of resources provided for a designated purpose. Grants are provided for the acquisition of
non-current assets and for covering operating expenses. Revenue from grants is recognised on an accrual basis
when the grant has been received (see accounting policy R).
Other income comprises net gain on sale of inventories and non-current assets, contractual penalty payments
received, membership fees, non-designated funding from residents and non-residents, marketing services
provided by pharmacies, donations from legal persons and individuals, etc.
Finance income comprises income on financial assets. Finance income on investments in subsidiaries consists of
gain on the sale of subsidiaries. Finance income on investments in associates comprises gain on the sale of
investments in associates and the group’s share of profits of associates.
Interest income is recognised when it is probable that economic benefits associated with the transaction will flow
to the group and the amount of the income can be measured reliably. Interest income is recognised using the
effective interest rate method except where collection is uncertain. In the latter case, interest income is
recognised on a cash basis.
U. Events after the reporting period The consolidated financial statements reflect all significant events affecting the valuation of assets and liabilities
that became evident between the reporting date and the date on which the financial statements were authorised
for issue but are related to the reporting or prior periods. Subsequent events that are indicative of conditions that
arose after the reporting date but which will have a significant effect on the result of the next financial year are
disclosed in the notes to the consolidated financial statements.
Note 2. Cash and cash equivalents
(In thousands of euros) 31 December 2011 31 December 2010
Cash on hand 39 29
Current accounts and overnight deposits 6,580 11,286
Term deposits with a short maturity 3,469 8,619
Card payments made but not yet received 5 15
Total 10,093 19,949
In 2011, interest income on current accounts and term deposits with a short maturity amounted to 94 thousand
euros (2010: 207 thousand euros). Interest rates for deposits and current accounts ranged from 0.08-2.25% per
year (2010: 0.96-6.30%).

UNIVERSITY OF TARTU
CONSOLIDATED FINANCIAL STATEMENTS 2011
71
Note 3. Trade receivables (In thousands of euros) 31 December 2011 31 December 2010
Trade receivables 2,060 1,833
Allowance for impairment -82 -54
Total 1,978 1,779
Movements in the impairment allowance:
(In thousands of euros) 2011 2010
Impairment allowance at beginning g of year -54 -117
Recovery of receivables considered impaired in prior years 25 19
Items considered impaired during the year -59 -30
Items considered irrecoverable during the year 6 74
Impairment allowance at end of year -82 -54
Note 4. Prepaid taxes and taxes payable (In thousands of euros) 31 December 2011 31 December 2010
Prepaid taxes
Prepayment 204 360
Total 204 360
Taxes payable
Social security tax 1,530 1,442
Personal income tax 831 784
Value added tax 281 158
Unemployment insurance contributions 176 167
Funded pension contributions 51 36
Corporate income tax 26 20
Total 2,895 2,607
Note 5. Other receivables (In thousands of euros) 31 December 2011 31 December 2010
Grants and co-financing reclaimed from partners 31 31
Advances to staff authorised to conduct transactions 18 18
Interest receivable 7 23
Security deposits receivable 2 21
Miscellaneous receivables 3 13
Total 61 106

UNIVERSITY OF TARTU
CONSOLIDATED FINANCIAL STATEMENTS 2011
72
Note 6. Government grants receivable (In thousands of euros)
31 December 2011 31 December 2010
In the project for the construction of the academic building of Narva
College (Archimedes Foundation) 3,363 462
In projects of the measure for modernising research apparatus and
equipment (Archimedes Foundation) 3,216 844
In centres of excellence projects (Archimedes Foundation) 2,100 1,200
In projects of the European Territorial Cooperation Objective
programme 1,841 799
In projects of the measure for modernising small-scale research
infrastructure (Archimedes Foundation) 1,676 2,202
In projects of programmes funded by the European Social Fund
(Archimedes Foundation) 1,659 1,430
Programme Mobilitas 683 579
Programme Primus 332 279
Programme Dora 301 182
Programme Eduko 201 218
Programme BeSt 142 172
In doctoral schools 1,347 689
In projects funded by the Enterprise Estonia Foundation 1,008 1,116
In projects funded by the European Fisheries Fund
(Agricultural Registers and Information Board) 685 0
In projects of the measure for supporting the development of energy
technology R&D (Archimedes Foundation) 600 0
In projects of the sub-measure for modernising research infrastructure
of national priority (Archimedes Foundation) 400 0
In projects of the sub-measure for cooperation of universities and
enterprises (Archimedes Foundation) 337 139
In projects of the 7th
EC Framework Programme 291 170
In international support projects 281 215
In CO2 investment projects (Ministry of Finance) 238 0
In projects funded by the Foundation for Lifelong Learning
Development (INNOVE Foundation) 186 94
In biomedical research projects supported by MTÜ Wellcome Trust 176 158
In projects funded by the Environmental Investment Centre 159 150
In projects of the 6th
EC Framework Programme 150 277
In projects of the Norwegian/EEA financial mechanisms 140 661
In projects of the program for monitoring research and innovation
policy (Archimedes Foundation) 114 0
In projects of the sub-measure for popularisation of science “Teeme”
(Archimedes Foundation) 54 0
In other projects funded by Archimedes Foundation 40 70
In the project for developing the Centre of Translational Medicine
(Archimedes Foundation) 24 113
Other 40 49
Total 20,125 10,838

UNIVERSITY OF TARTU
CONSOLIDATED FINANCIAL STATEMENTS 2011
73
Note 7. Prepayments for services (In thousands of euros) 31 December 2011 31 December 2010
Subscriptions to teaching and study publications and periodicals 363 377
Prepayments related to teaching and research activities 177 80
Prepaid work-related travel expenses 73 73
Prepaid participation and membership fees 30 3
Prepayments to employees 27 21
Other prepayments 21 19
Total 691 573
Note 8. Inventories (In thousands of euros) 31 December 2011 31 December 2010
Materials 10 6
Finished goods 22 13
Goods purchased for resale 308 317
Prepayments to suppliers 205 193
Total 545 529
In the reporting period, the group wrote down inventories whose net realisable value had decreased below cost
and expensed unusable inventories as follows:
(In thousands of euros) 2011 2010
Finished goods 38 27
Goods purchased for resale 12 2
Total 50 29

UNIVERSITY OF TARTU
CONSOLIDATED FINANCIAL STATEMENTS 2011
74
Note 9. Investments in associates (In thousands of euros) OÜ Tervisliku
Piima
Biotehnoloogiate
Arenduskeskus
Eesti Nano-
tehnoloogiate
Arenduskeskuse
AS
Total
Carrying amount at 31 December 2009 18 9 27
Cost at 31 December 2009 1 7 8
University of Tartu share of profit for 2010 8 11 19
Carrying amount at 31 December 2010 26 20 46
Cost at 31 December 2010 1 7 8
University of Tartu share of profit/loss for 2011 19 -4 15
Carrying amount at 31 December 2011 45 16 61
Cost at 31 December 2011 1 7 8
Interest of University of Tartu
As at 31 December 2010 20% 23.80%
As at 31 December 2011 20% 23.80%
Both associates operate in Estonia. Neither associate is listed on a stock exchange.
OÜ Tervisliku Piima Biotehnoloogiate Arenduskeskus ended the financial year with a profit of 95 thousand
euros, which increased the year-end value of the investment of the University of Tartu by 19 thousand euros.
Eesti Nanotehnoloogiate Arenduskeskuse AS ended the reporting year with a loss of 19 thousand euros, which
reduced the value of the investment of the University of Tartu by 4 thousand euros.
The following table provides an overview of movements in the associates’ equity:
(In thousands of euros) OÜ Tervisliku
Piima
Biotehnoloogiate
Arenduskeskus
Eesti
Nanotehnoloogiate
Arenduskeskuse AS
Total
As at 31 December 2010
Share capital 6 27 33
Statutory capital reserve 1 3 4
Retained earnings 84 7 91
Profit for the year 42 45 87
Total equity 133 82 215
Share of University of Tartu 26 20 46
Interest of University of Tartu 20% 23.80%
As at 31 December 2011
Share capital 6 29 35
Statutory capital reserve 1 3 4
Retained earnings 126 50 176
Profit/loss for the year 95 -16 79
Total equity 228 66 294
Share of University of Tartu 45 16 61
Interest of University of Tartu 20% 23.80%

UNIVERSITY OF TARTU
CONSOLIDATED FINANCIAL STATEMENTS 2011
75
In 2011 the associates’ share capital was converted into euros. Conversion of the amounts from Estonian kroons
into euros and rounding the new amounts had no effect on the rights carried by the shares and the ratio of the par
value of a share to share capital. On the conversion of the share capital of OÜ Tervisliku Piima Biotehnoloogiate
Arenduskeskus from kroons into euros, the entity’s share capital decreased by 0.39 thousand euros, which was
transferred to retained earnings. On the conversion of the share capital of Eesti Nanotehnoloogiate
Arenduskeskuse AS from kroons into euros, the entity’s share capital was increased through a bonus issue by
2.57 thousand euros using retained earnings.
Note 10. Investment property (In thousands of euros) Riia 191 Ülikooli 20 Apartments Total
Cost
As at 31 December 2009 94 1,953 513 2,560
Rental income for 2010 0 26 9 35
Property management expenses for 2010 0 39 14 53
Of which expenses re-invoiced to tenants 0 38 14 52
As at 31 December 2010 94 1,953 513 2,560
Disposals 0 0 -258 -258
Rental income for 2011 0 26 7 33
Property management expenses for 2011 0 24 10 34
Of which expenses re-invoiced to tenants 0 18 9 27
As at 31 December 2011 94 1,953 255 2,302
Depreciation
As at 31 December 2009 0 146 109 255
Depreciation for the year (note 27) 0 48 39 87
As at 31 December 2010 0 194 148 342
Depreciation for the year (note 27) 0 49 33 82
Disposals 0 0 -24 -24
As at 31 December 2011 0 243 157 400
Carrying amount
As at 31 December 2009 94 1,807 404 2,305
As at 31 December 2010 94 1,759 365 2,218
As at 31 December 2011 94 1,710 98 1,902

TARTU ÜLIKOOL
2011. AASTA KONSOLIDEERITUD RAAMATUPIDAMISE AASTAARUANNE
76
Note 11. Property and equipment (In thousands of euros) Land Buildings and
structures
Equipment and
vehicles
Library
collections
Other items of
property and
equipment
Assets under
construction
Prepayments for
property and
equipment
Total
Cost
As at 31 December 2009 2,376 221,146 38,429 5,891 5,083 4,413 77 277,415
Additions 1 7 5,866 701 43 1,476 863 8,957
Non-monetary additions 5 92 4 0 0 0 0 101
Transfers 0 160 557 0 0 -219 -498 0
Transfers to non-current assets held for sale -34 -2 0 0 0 0 0 -36
Recognition as an expense 0 0 0 0 0 -157 0 -157
Disposals -72 -90 -4,209 -90 -714 0 0 -5,175
Disposals through disposal of a subsidiary 0 0 0 0 -13 0 0 -13
As at 31 December 2010 2,276 221,313 40,647 6,502 4,399 5,513 442 281,092
Additions 0 31 6,476 754 33 10,711 843 18,848
Transfers 0 10,577 1,390 0 105 -10,849 -1,223 0
Recognition as an expense 0 0 0 0 -18 -68 -1 -87
Disposals -24 -5,269 -447 -38 -36 0 0 -5,814
As at 31 December 2011 2,252 226,652 48,066 7,218 4,483 5,307 61 294,039
Depreciation
As at 31 December 2009 0 24,960 26,224 0 2,675 0 0 53,859
Depreciation for the year (note 27) 0 7,693 4,979 0 593 0 0 13,265
Write-down (note 27) 0 9,857 0 0 0 0 0 9,857
Disposals 0 -6 -4,195 0 -710 0 0 -4,911
Disposals through disposal of a subsidiary 0 0 0 0 -11 0 0 -11
As at 31 December 2010 0 42,504 27,008 0 2,547 0 0 72,059
Depreciation for the year (note 27) 0 6,870 5,854 0 446 0 0 13,170
Disposals 0 -2,025 -420 0 -35 0 0 -2,480
As at 31 December 2011 0 47,349 32,442 0 2,958 0 0 82,749
Carrying amount
As at 31 December 2009 2,376 196,186 12,205 5,891 2,408 4,413 77 223,556
As at 31 December 2010 2,276 178,809 13,639 6,502 1,852 5,513 442 209,033
As at 31 December 2011 2,252 179,303 15,624 7,218 1,525 5,307 61 211,290

TARTU ÜLIKOOL
2011. AASTA KONSOLIDEERITUD RAAMATUPIDAMISE AASTAARUANNE
77
Note 12. Intangible assets (In thousands of euros)
Biological
material and
health records
database
Software Other
intangible
assets
Prepayments
for intangible
assets
Total
Cost
As at 31 December 2009 2,205 336 65 0 2,606
Additions 299 129 25 41 494
Transfers 0 41 0 -41 0
Disposals through disposal of a
subsidiary 0 -4 0 0 -4
As at 31 December 2010 2,504 502 90 0 3,096
Additions 41 116 0 66 223
Transfers 0 56 10 -66 0
Disposals 0 -70 0 0 -70
As at 31 December 2011 2,545 604 100 0 3,249
Amortisation
As at 31 December 2009 134 204 26 0 364
Amortisation for the year (note 27) 81 59 14 0 154
Disposals through disposal of a
subsidiary 0 -2 0 0 -2
As at 31 December 2010 215 261 40 0 516
Amortisation for the year (note 27) 83 91 25 0 199
Disposals 0 -70 0 0 -70
As at 31 December 2011 298 282 65 0 645
Carrying amount
As at 31 December 2009 2,071 132 39 0 2,242
As at 31 December 2010 2,289 241 50 0 2,580
As at 31 December 2011 2,247 322 35 0 2,604
As at 31 December 2011, the biological material and health records database included 51,843 samples, which
comprised the gene donors’ biological material (chromosomal DNA, white blood cells and blood plasma) and a
description of their state of health (their health, health behaviour and environment). As at 31 December 2010, the
database included 51,515 samples.

UNIVERSITY OF TARTU
CONSOLIDATED FINANCIAL STATEMENTS 2011
78
Note 13. Finance and operating leases
Finance leases – the group as a lessee (In thousands of euros) Equipment and
vehicles
As at 31 December 2010
Cost as at 31 December 2010 52
Accumulated depreciation as at 31 December 2010 -29
Of which depreciation for 2010 -8
Carrying amount as at 31 December 2010 23
Principal payments made in 2010 5
Interest payments made in 2010 2
As at 31 December 2011
Cost as at 31 December 2011 96
Accumulated depreciation as at 31 December 2011 -45
Of which depreciation for 2011 -16
Carrying amount as at 31 December 2011 51
Principal payments made in 2011 33
Interest payments made in 2011 1
Finance lease liabilities as at 31 December 2010 23
Finance lease liabilities as at 31 December 2011 34
Payable within 1 year 21
Payable between 1 and 5 years 13
Interest rates 0-5.97%
Maturity date 2015
At the beginning of the reporting year, the group had two effective finance lease contracts: one on a commercial
vehicle, Volkswagen Multivan Comfortline, leased by MTÜ Tartu Üliõpilasmaja and the other on a commercial
vehicle, Ford Mondeo, leased by MTÜ Tartu Üliõpilasküla. During the year, the number of contracts increased
as the University of Tartu acquired a digital copying-printing press Xerox 700 (with a cost of 44 thousand euros)
with a finance lease. The contract on the commercial vehicle Ford Mondeo, leased by MTÜ Tartu Üliõpilasküla,
expired in 2011.
Operating leases – the group as a lessor
(In thousands of euros) Buildings and structures
31 December 2011 31 December 2010
Operating lease income for the reporting year 328 288
Rentals receivable within 1 year 247 258
Rentals receivable between 1 and 5 years 762 810
Rentals receivable in more than 5 years 284 393
Cost of assets leased out 8,269 7,003
Carrying amount of assets leased out 5,346 4,633

UNIVERSITY OF TARTU
CONSOLIDATED FINANCIAL STATEMENTS 2011
79
The figures on operating lease income include rental income earned on both investment property and items of
property and equipment. Information on the carrying amounts of investment properties that have been leased out
is provided in note 10.
Where part of a non-current asset (a property) has been leased out under the terms of an operating lease, the cost
and carrying amount of the asset are determined based on the proportion of the asset that has been leased out.
Operating leases – the group as a lessee (In thousands of euros) Buildings and
structures
Equipment
and vehicles
As at 31 December 2010
Operating lease payments made in 2010 498 21
Payable within 1 year 305 5
Payable between 1 and 5 years 304 6
As at 31 December 2011
Operating lease payments made in 2011 490 19
Payable within 1 year 155 17
Payable between 1 and 5 years 229 28
Note 14. Bank loans and assets pledged as collateral The group uses bank loans for making long-term investments and financing the construction and renovation of
buildings. Loan agreements (1) - (3), (5), (6) and (9) are linked to 6 month Euribor. Loan agreement (4) is linked
to 1 month Euribor. Agreements (7) and (8) are linked to 3 month Euribor.
In the tables below, loan (1) has been taken by OÜ Tartu Üliõpilasküla Hostel and loans (2) – (9) have been
taken by the University of Tartu.
In 2011 the University of Tartu took Tartu took a loan of 5.40 million euros from Pohjola Bank Plc to finance
the construction work at Lossi 36 (in the city of Tartu). Other group entities did not take new loans in 2011. In
2011, loan (9), which had been taken by the University of Tartu, was repaid.
(In thousands of euros) Balance at
31 December 2011 Repayable Maturity
date
Interest
rate* Within 12
months
Between 1
and 5 years
In over
5 years
Swedbank (1) 136 20 116 0 26 Mar 2013 Eur6+0.82%
SEB (2) 388 274 114 0 1 Jun 2013 Eur6+0.98%
SEB (3) 758 217 541 0 1 Jun 2015 Eur6+0.55%
Nordea Pank (4) 3,906 710 2,840 356 14 Jun 2017 Eur1+0.13%
Nordea Pank (5) 4,473 639 2,556 1,278 29 Dec 2018 Eur6+1.00%
SEB (6) 2,693 310 1,315 1,068 3 Nov 2019 Eur6+0.49%
Pohjola (7) 4,280 400 1,920 1,960 28 Dec 2020 Eur3+0.80%
Pohjola (8) 5,400 50 2,400 2,950 8 Dec 2021 Eur3+0.96%
Total 22,034 2,620 11,802 7,612

UNIVERSITY OF TARTU
CONSOLIDATED FINANCIAL STATEMENTS 2011
80
(In thousands of euros) Balance at
31 December 2010 Repayable
Maturity
date
Interest
rate*
Within 12
months
Between 1
and 5 years
In over
5 years
Swedbank (1) 189 18 171 0 26 Mar 2013 Eur6+0.82%
SEB (2) 662 274 388 0 1 Jun 2013 Eur6+0.98%
SEB (3) 974 217 757 0 1 Jun 2015 Eur6+0.55%
Nordea Pank (4) 4,616 710 2,840 1,066 14 Jun 2017 Eur1+0.13%
Nordea Pank (5) 5,113 640 2,556 1,917 29 Dec 2018 Eur6+1.00%
SEB (6) 3,000 312 1,285 1,403 3 Nov 2019 Eur6+0.49%
Pohjola (7) 4,320 40 1,920 2,360 28 Dec 2020 Eur3+0.80%
SEB (9) 65 65 0 0 19 Jun 2011 Eur6+1.80%
Total 18,939 2,276 9,917 6,746
* The contractual interest rates of all loans are equal to their effective interest rates.
Loan (1) taken from Swedbank AS is secured with mortgages of apartments at Ujula 2-9, Ujula 2-17, Ujula 2-24
and Ujula 2-32 (in the city of Tartu). The total value of the mortgages is 0.33 million euros. At 31 December
2011, the total carrying amount of the apartments was 0.19 million euros (31 December 2010: 0.20 million
euros).
Loans (2), (3), (6) and (9) taken from SEB Pank AS are secured with a mortgage of an immovable property with
three buildings located at Ülikooli 16, Jakobi 2 and Lossi 3 (in the city of Tartu). The mortgage amounts to 4.79
million euros and the group may be submitted collateral claims of 0.48 million euros. At 31 December 2011, the
carrying amount of the property was 12.18 million euros (31 December 2010: 11.52 million euros).
Loan (7) from Pohjola Bank Plc is secured with a mortgage of a property with a building at Raatuse 22 (in the
city of Tartu). The mortgage amounts to 4.32 million euros. At 31 December 2011, the carrying amount of the
property was 4.77 million euros (31 December 2010: 4.88 million euros).
Loan (8) from Pohjola Bank Plc is secured with a mortgage of a property with a building at Lossi 36 (in the city
of Tartu), which was renovated in 2011. The mortgage amounts to 5.94 million euros. At 31 December 2011, the
carrying amount of the property was 6.48 million euros (31 December 2010: 3.26 million euros).
Repayments of loan principal by year (in thousands of euros)
0
500
1000
1500
2000
2500
3000
3500
2012 2013 2014 2015 2016 2017 2018 2019 2020 2021

UNIVERSITY OF TARTU
CONSOLIDATED FINANCIAL STATEMENTS 2011
81
Note 15. Payables to employees (In thousands of euros) 31 December 2011 31 December 2010
Vacation pay liabilities 2,163 1,858
Payables for office and similar expenses 22 19
Payables for work-related travel expenses 17 17
Other payables to employees 15 7
Total 2,217 1,901
Note 16. Other accrued expenses (In thousands of euros) 31 December 2011 31 December 2010
Intermediation of grants and co-financing 1,005 517
State-provided study allowances 341 256
Designated scholarships 198 158
Other accruals 43 65
Total 1,587 996

TARTU ÜLIKOOL
2011. AASTA KONSOLIDEERITUD RAAMATUPIDAMISE AASTAARUANNE
82
Note 17. Deferred income (In thousands of euros) 31 December 2011 31 December 2010
Prepaid government grants and co-financing 5,438 5,519
Prepaid tuition fees 914 991
Other deferred income 4 5
Total 6,356 6,515
Prepaid grants and co-financing received under research and development contracts by provider:
(In thousands of euros)
31 December 2011 31 December 2010
Grant and co-financing prepayments from Estonian residents
Archimedes Foundation 1,094 1,178
Estonian Science Foundation 1,004 890
Ministry of Education and Research 376 471
Environmental Investment Centre 58 31
Ministry of Defence 46 16
Integration and Migration Foundation 39 28
Estonian Patent Office 30 0
Estonian Information Technology Foundation 25 21
Tiger Leap Foundation 25 15
Ministry of Foreign Affairs 24 21
Ministry of Justice 0 74
Ministry of Social Affairs 0 15
Enterprise Estonia Foundation 0 4
Other Estonian residents 52 14
Grant and co-financing prepayments from non-residents
7th
EC Framework Programme 1,807 1,691
6th
EC Framework Programme 0 12
Other foreign residents 858 1,038
Total 5,438 5,519

TARTU ÜLIKOOL
2011. AASTA KONSOLIDEERITUD RAAMATUPIDAMISE AASTAARUANNE
83
Note 18. Revenue from operating activities (In thousands of euros) 2011 2010
Teaching activities 10,757 11,027
Rental and lease activities 3,850 3,580
Research and development contracts 3,052 3,062
Sale of goods 2,878 3,422
Other services 1,940 1,768
Total 22,477 22,859
Revenue from operating activities by geographical area:
(In thousands of euros) 2011 2010
Estonia 22,077 22,724
Other EU member states 313 132
Other countries 87 3
Total 22,477 22,859
Note 19. State budget transfers for teaching activities (In thousands of euros) 2011 2010
Allocations for state-funded higher education 32,187 31,358
Funding for medical residents 7,986 7,766
Allocations for the remuneration professors emeritus 361 359
Funding for the Gifted and Talented Development Centre 303 273
Funding for special education in the field of natural sciences 157 155
Funding for EuroCollege 108 108
Funding for organising disbursement of study allowances 26 25
Total 41,128 40,044
Note 20. State budget transfers for research activities (In thousands of euros) 2011 2010
Government grants for research topics 11,406 11,247
Base financing for research institutions 3,402 3,414
Financing for research institutions’ infrastructure expenses 3,282 3,243
Funding for national programmes 904 860
State budget funding for scientific and research information for the library 819 825
Total 19,813 19,589

UNIVERSITY OF TARTU
CONSOLIDATED FINANCIAL STATEMENTS 2011
84
Note 21. Grants related to assets (In thousands of euros) 2011 2010
Acquisition of assets in projects of the measure for modernising research apparatus and
equipment (Archimedes Foundation) 3,277 2,376
Construction of the academic building of Narva College (Archimedes Foundation) 2,375 454
Acquisition of assets in projects of the measure for modernising small-scale research
infrastructure (Archimedes Foundation) 1,976 2,581
Acquisition of assets in projects of the measure for supporting the development of
energy technology R&D (Archimedes Foundation) 367 0
Acquisition of assets in projects of the European Territorial Cooperation Objective
programme 318 8
CO2 investment projects (Ministry of Finance) 275 0
Acquisition of assets in projects of funded by the European Fisheries Fund
(Agricultural Registers and Information Board) 207 0
Acquisition of research equipment for centres of excellence (Archimedes Foundation) 198 154
Acquisition of assets in projects of the sub-measure for modernising research
infrastructure of national priority (Archimedes Foundation) 79 0
Renovation of the Old Observatory (Enterprise Estonia Foundation) 70 325
Acquisition of a robotic scanner for the library
(Estonian Information Systems Authority) 68 0
Hostel programme (City of Tartu) 37 73
Acquisition of assets in projects of the 7th
EC Framework Programme 23 428
Development of the Centre of Translational Medicine (Archimedes Foundation) 20 92
Acquisition of research equipment in projects funded by the Enterprise Estonia
Foundation 0 161
Immovable property at Õpetaja 12 (foreign grant) 0 92
Other grants related to assets (domestic) 62 116
Other grants related to assets (foreign) 18 14
Total 9,370 6,874
Note 22. Grants related to income (In thousands of euros) 2011 2010
Domestic grants for covering operating expenses 11,482 10,616
Including
Grants from the Estonian Science Foundation 4,780 4,749
Grants from Archimedes Foundation 2,412 2,117
Grants from the Ministry of Education and Research 2,117 2,061
Foreign grants for covering operating expenses 21,171 16,099
Including
Intermediated grants from Archimedes Foundation 9,284 6,617
Grants from the EU and its institutions 2,961 2,781
Intermediated grants from the Estonian Science Foundation 1,231 1,066
Intermediated grants from the Estonian Biocentre 1,092 128
Total 32,653 26,715
In 2011, the University of Tartu as a recipient and intermediary of grants reduced grant revenue by 59 thousand
euros (consisting of 20 thousand euros of domestic grant revenue and 39 thousand euros of foreign grant
revenue) because of reclamations received.

UNIVERSITY OF TARTU
CONSOLIDATED FINANCIAL STATEMENTS 2011
85
In 2010, the University of Tartu reduced grant revenue by 47 thousand euros (consisting of 20 thousand euros of
domestic grant revenue and 27 thousand euros of foreign grant revenue).
Note 23. Other income (In thousands of euros) 2011 2010
Donations from individuals and legal persons 515 31
Net gain on sale of non-current assets 455 739
Non-designated funding from non-residents 248 143
Marketing services provided by pharmacies 118 125
Non-designated funding from Estonian residents 86 85
Membership fees 50 153
Contractual penalty payments received 18 639
Miscellaneous income 85 103
Total 1,575 2,018
Note 24. Goods, materials and services used (In thousands of euros) 2011 2010
Services purchased 8,504 8,261
Goods purchased 2,499 3,097
Materials purchased 36 35
Total 11,039 11,393
Note 25. Operating expenses (In thousands of euros) 2011 2010
Costs of teaching and research activities 8,682 6,502
Value added tax 6,558 4,659
Work-related travel expenses 2,635 2,449
Cost of office expenses and fixtures and fittings 1,572 1,253
Electricity costs 1,504 1,367
Utilities and maintenance costs (except heating and electricity) 1,408 1,599
Heating costs 1,317 1,462
Office equipment maintenance and software expenses 1,108 1,096
Repair costs 981 980
Transport costs 930 779
Rental and lease expenses 789 735
Costs of assets of immaterial value 738 670
Professional publications expenses 524 610
Costs of research apparatus and equipment maintenance and supplies 445 425
Advertising expenses 381 310
Communications and postal expenses 307 367
Miscellaneous operating expenses 1,456 1,503
Total 31,335 26,766

UNIVERSITY OF TARTU
CONSOLIDATED FINANCIAL STATEMENTS 2011
86
Note 26. Personnel expenses (In thousands of euros) 2011 2010
Salaries 45,914 43,330
Social security charges 15,619 14,795
Total 61,533 58,125
Average number of staff per year converted to the full-time equivalent 3,134 3,097
Remuneration provided to members of the councils and supervisory and management boards of group entities:
(In thousands of euros) 2011 2010
University of Tartu 1,634 1,598
MTÜ Tartu Ülikooli Akadeemiline Spordiklubi 109 83
MTÜ Tartu Üliõpilasmaja 32 32
MTÜ Tartu Üliõpilasküla 30 30
OÜ Tartu Ülikooli Kirjastus 26 27
OÜ Tartu Ülikooli Kesklinna Apteek 20 20
OÜ Tartu Üliõpilasküla Hostel 9 5
OÜ Tartu Ülikooli Tamme Apteek 6 8
OÜ Kääriku Puhke- ja Spordikeskus 0 19
OÜ Tartu Tehnoloogiapark 0 10
OÜ Tartu Ülikooli Raamatupood 0 5
Total 1,866 1,837
The group has no obligation to provide termination benefits to members of the executive and higher management
of the University of Tartu (the rector, vice rectors, deans, heads of functions and directors of academic and
research institutions)
Subsidiaries’ management board members are entitled to termination benefits as provided in their service
contracts. Members of the executive and higher management are eligible to termination benefits only if
termination proceedings are instigated by the entity. When a board member is recalled without just cause, he or
she is entitled to termination benefits of up to his or her six-fold monthly service fee. Related expense will be
recognised on an accrual basis. When a board member steps down or is recalled with just cause, no termination
benefits will be paid. At the end of 2011, contingent termination benefits payable to members of group entities’
executive and higher management totalled 94 thousand euros (2010: 92 thousand euros).
Note 27. Depreciation, amortisation and impairment losses (In thousands of euros) 2011 2010
Depreciation of property and equipment (note 11) 13,170 13,265
Loss on write-off of property and equipment 3,047 96
Amortisation of intangible assets (note 12) 199 154
Depreciation of investment property (note 10) 82 87
Write-off of items in library collections (note 11) 38 90
Impairment losses (note 11) 0 9,857
Total 16,536 23,549

UNIVERSITY OF TARTU
CONSOLIDATED FINANCIAL STATEMENTS 2011
87
Losses on the write-off of property and equipment recognised in 2011 comprise losses of 2.43 million euros
incurred on the write-off of components replaced on the renovation of university buildings at Jakobi 2 (in the
city of Tartu), Jakobi 5 (in the city of Tartu), and Lossi 40 (in the city of Tartu); losses of 0.55 million euros
incurred on the termination of the lease of the hostel of the University of Tartu Türi College at Mehaanika 1 (in
the town of Türi) and the transfer of its academic building at Viljandi 13b (in the town of Türi) in connection
with discontinuance of operations; losses of 0.05 million euros incurred in connection with the termination of the
usufruct on the building at Veski 6 (in the city of Tartu) and losses of 0.02 million euros incurred on the write-
off of other items of property and equipment.
In 2010, losses on the write-off of property and equipment comprised losses of 0.06 million euros incurred on
the write off of the components replaced on the renovation of a university building at Poe 8 (in the city of Tartu)
and a loss of 0.03 million euros incurred on the termination of the right of superficies at Raatuse 22 (in the city
of Tartu) and Viljandi 21 (in the city of Viljandi).
In 2011 no non-current assets were written down. In 2010 group wrote down its non-current assets at Riia street
142 (in the city of Tartu) and at Tähe street 4 (in the city of Tartu) by 2.86 million euros and 7.00 million euros
respectively. The group is planning to build a new Physics Building and does not intend to use the old buildings
in its operating activity. Therefore, the buildings were written down to their recoverable amounts. The write-
downs were performed based on value in use by applying an 11% discount rate.
Note 28. Other expenses (In thousands of euros) 2011 2010
Entertainment expenses 791 648
Fringe benefits 467 369
Membership fees 121 128
Miscellaneous expenses 179 181
Total 1,558 1,326
Note 29. Related party disclosures For the purposes of these consolidated financial statements, related parties include:
(a) the group’s associates;
(b) non-profit associations in which the University of Tartu is a member but which are not part of its
consolidation group;
(c) foundations in which the University of Tartu is a founder;
(d) members of the executive and higher management (the rector, vice rectors, deans, heads of functions and
directors of academic and research institutions) and economic entities connected with them;
(e) close family members of, and economic entities controlled or significantly influenced by, members of the
executive and higher management;
(f) members of the subsidiaries’ management and supervisory boards and economic entities controlled or
significantly influenced by them.
(In thousands of euros) Sales Purchases
2011 2010 2011 2010
Associates 564 700 166 295
Non-profit associations 8 4 195 99
Associations and societies 19 25 12 12
Foundations 299 351 3,637 3,661
Companies 127 242 247 264
Total 1,017 1,322 4,257 4,331

UNIVERSITY OF TARTU
CONSOLIDATED FINANCIAL STATEMENTS 2011
88
(In thousands of euros) Receivables Prepayments
31 December 2011 31 December 2010 31 December 2011 31 December 2010
Associates 72 58 0 0
Non-profit associations 1 0 74 0
Associations and societies 1 0 0 0
Foundations 26 15 0 0
Companies 38 34 0 0
Total 138 107 74 0
(In thousands of euros) Payables
31 December 2011 31 December 2010
Associates 0 31
Non-profit associations 1 0
Foundations 314 268
Companies 1 5
Total 316 304
Transactions with related parties consist of purchases and sales of goods and services. No receivables from
related parties were written down in 2011 or in 2010.
For information on the remuneration of the executive and higher management, please refer to note 26.
Note 30. Contingent liabilities
Potential liabilities from a tax audit The tax administrator may audit the group’s tax accounting within six years after the deadline for the submission
of a tax return. On the detection of a misstatement or omission, the tax administrator may charge additional tax,
late payment interest and penalty payments. The group’s management is not aware of any circumstances that
might cause the tax administrator to determine significant additional tax to be paid by the group.
Mortgages The group has mortgaged two properties to Swedbank: Vanemuise 46 (in the city of Tartu) and Pepleri 14 (in the
city of Tartu). The mortgage on Vanemuise 46 amounts to 1.60 million euros and associated collateral claims
may total 0.16 million euros. The mortgage on Pepleri 14 amounts to 0.32 million euros and associated collateral
claims may total 0.03 million euros. The group has mortgaged one property to SEB Pank AS: Nooruse 1 (in the
city of Tartu). The mortgage amounts to 4.79 million euros. At the end of 2011, the above mortgages did not
secure any effective contractual commitments of the University of Tartu.
Other contingent liabilities Based on an agreement on the termination of the contract of the right of superficies, the contract of the right of
superficies, and agreement no 4831/2009 on the creation of the right of pre-emption, the contract of the right of
superficies on the property located at Riia street 23b in the city of Tartu, entered into by the University of Tartu
and Citrina Foundation UK Limited on 27 May 1998, was terminated, a new right of superficies was created for
the benefit of the administrator of state assets, the Ministry of Education and Research, for a term of 50 years
and it was decided that the buildings would remain in the ownership of the University of Tartu. In conformity
with the agreement, the University of Tartu undertook to sing a no-charge rental agreement with the Estonian
Biocentre for a term of at least 50 years on the premises of the research building at Riia street 23b in the city of
Tartu, as outlined in the building plans attached to the agreement. The Estonian Biocentre will pay the utilities
charges and other management expenses arising from the part of the building placed at its disposal. If the
University of Tartu does not meet the said obligation, Citrina Foundation UK Limited may charge a contractual
penalty of 1.02 million euros.

UNIVERSITY OF TARTU
CONSOLIDATED FINANCIAL STATEMENTS 2011
89
Note 31. Assets accounted for off the statement of financial position In 2011, assets with a cost of 640 euros to 1,999 euros were accounted for off the statement of financial position.
At the year-end, the total cost of such assets was 9.79 million euros (31 December 2010: 9.38 million euros).
The books of the library of the University of Tartu are accounted for in detail in the library information system
ESTER. At 31 December 2011, the estimated total value of the library’s collections was 30.58 million euros (31
December 2010: 28.28 million euros) of which 7.22 million euros (31 December 2010: 6.50 million euros) was
recognised in the statement of financial position (see note 11).
At 31 December 2011, the collection of the Botanical Garden of the University of Tartu included 7,995
taxonomic units (species and varieties) of trees, bushes and other plants (31 December 2010: 7,086 units).
Detailed accounts of the items stored at the collections of the museums of the University of Tartu are kept at the
museums. As from 2011, assets included in the museum collections are recognised in the statement of financial
position in an aggregated set. At the year-end, the aggregate value of the museum collections was 0.01 million
euros. Altogether, at the reporting date the museums had 1,186,748 stored items (31 December 2010: 1,169,077
stored items): the History Museum had 72,022 stored items (31 December 2010: 70,968), the Art Museum had
30,298 stored items (31 December 2010: 29,432), the Natural History Museum had 1,084,375 stored items (31
December 2010: 1,068,677), the library had 30 stored items (31 December 2010: 0) and the faculty of medicine
had 23 stored items (31 December 2010: 0).
Note 32. Events after the reporting date In accordance with agreement no 716 on the creation of usufruct and a real right contract signed between the
University of Tartu and the Tehvandi Sports Centre Foundation on 22 March 2012, a fixed-term usufruct of 50
years as from 1 April 2012 was created on the Kääriku property for the benefit of the Tehvandi Sports Centre
Foundation.
In accordance with an agreement signed on 27 July 2003 between MTÜ Tartu Ülikooli Akadeemiline
Spordiklubi and OÜ Kääriku Puhke- ja Spordikeskus, entered into on the basis of an agreement signed on 12
February 2003 between the University of Tartu and MTÜ Tartu Ülikooli Akadeemiline Spordiklubi, OÜ Kääriku
Puhke- ja Spordikeskus acted as the operator of the leisure and sports centre located on the Kääriku property. OÜ
Kääriku Puhke- ja Spordikeskus discontinued its business as the operator of the leisure and sports centre located
on the Kääriku property on 31 March 2012 and from 1 April 2012 the business was taken over by the Tehvandi
Sports Centre Foundation (SA Tehvandi Spordikeskus). According to plan, the liquidation of OÜ Kääriku
Puhke- ja Spordikeskus will commence in 2012.

UNIVERSITY OF TARTU
CONSOLIDATED FINANCIAL STATEMENTS 2011
90
Note 33. Unconsolidated financial statements of the University of Tartu
UNIVERSITY OF TARTU statement of financial position (unconsolidated)
ASSETS 31 December 2011 31 December 2010
(In thousands of euros)
Current assets
Cash and cash equivalents 8,904 18,779
Other current financial assets 1,500 0
Receivables and prepayments
Trade receivables 1,643 1,441
Receivables from subsidiaries 83 90
Prepayments to subsidiaries 11 13
Prepaid and recoverable taxes 190 330
Other receivables 51 80
Government grants receivable 20,125 10,837
Prepayments for services 676 563
Total receivables and prepayments 22,779 13,354
Inventories 319 292
Total current assets 33,502 32,425
Non-current assets
Non-current financial assets
Investments in subsidiaries 61 130
Investments in associates 8 8
Other non-current financial assets 14 15
Total non-current financial assets 83 153
Investment property 1,902 2,218
Property and equipment
Land 2,252 2,276
Buildings and structures 179,002 178,531
Equipment and vehicles 15,482 13,527
Library collections 7,218 6,502
Other equipment and fixtures 1,484 1,829
Assets under construction 5,307 5,513
Prepayments for property and equipment 61 386
Total property and equipment 210,806 208,564
Intangible assets 2,593 2,556
Total non-current assets 215,384 213,491
TOTAL ASSETS 248,886 245,916

UNIVERSITY OF TARTU
CONSOLIDATED FINANCIAL STATEMENTS 2011
91
LIABILITIES AND NET ASSETS 31 December 2011 31 December 2010
(In thousands of euros)
Liabilities
Current liabilities
Loans and borrowings
Security deposit liabilities 9 6
Finance lease liabilities 6 0
Current portion of long-term loans 2,600 2,258
Total loans and borrowings 2,615 2,264
Derivative financial instruments 148 108
Trade payables 3,160 1,759
Payables to subsidiaries 19 18
Taxes payable 2,803 2,508
Accrued expenses
Payables to employees 2,132 1,824
Other accrued expenses 1,571 964
Total accrued expenses 3,703 2,788
Deferred income 6,340 6,507
Total current liabilities 18,788 15,952
Non-current liabilities
Finance lease liabilities 13 0
Bank loans 19,298 16,492
Total non-current liabilities 19,311 16,492
Total liabilities 38,099 32,444
Net assets
Capital of the University 144,182 144,182
Accumulated surpluses 69,290 78,194
Deficit for the year -2,685 -8,904
Total net assets 210,787 213,472
TOTAL LIABILITIES AND NET ASSETS 248,886 245,916

UNIVERSITY OF TARTU
CONSOLIDATED FINANCIAL STATEMENTS 2011
92
UNIVERSITY OF TARTU statement of financial performance (unconsolidated) (In thousands of euros)
2011 2010
Revenue
Revenue from operating activities 16,935 16,738
State budget transfers for teaching activities 41,128 40,044
State budget transfers for research activities 19,813 19,589
Grants related to assets 9,370 6,874
Grants related to income 31,953 26,267
Other income 1,341 1,946
Total revenue 120,540 111,458
Expenses
Goods, materials and services used -7,233 -6,998
Operating expenses -30,530 -25,782
Scholarships -6,221 -5,230
Personnel expenses -59,710 -56,147
Depreciation, amortisation and impairment losses -16,417 -23,490
Other expenses -2,743 -2,388
Total expenses -122,854 -120,035
Deficit on operating activities -2,314 -8,577
Finance income and costs
Finance income and expenses on investments in subsidiaries 0 -120
Interest income 87 190
Interest expense -459 -398
Other finance income 1 1
Net finance costs -371 -327
Deficit for the year -2,685 -8,904

UNIVERSITY OF TARTU
CONSOLIDATED FINANCIAL STATEMENTS 2011
93
UNIVERSITY OF TARTU statement of cash flows (unconsolidated)
(In thousands of euros) 2011 2010
Cash flows from operating activities
Deficit on operating activities -2,314 -8,577
Adjustments for
Depreciation, amortisation and impairment losses 16,417 23,490
Recognition of assets under construction as an expense 68 157
Other non-monetary transactions with non-current assets 19 -15
Gain on sale of non-current assets -441 -739
Non-monetary grants related to assets 0 -101
Change in receivables and prepayments -9,442 -3,130
Change in inventories -27 66
Change in payables 1,270 -490
Interest paid -456 -390
Net cash from operating activities 5,094 10,271
Cash flows from investing activities
Acquisition of investment property 0 -303
Proceeds from sale of investment property 174 0
Acquisition of property and equipment -7,153 -9,984
Proceeds from sale of property and equipment 740 849
Paid for assets under construction -9,484 -1,316
Prepayments for property and equipment -822 -807
Acquisition of intangible assets -157 -428
Prepayments for intangible assets -66 -41
Proceeds from sale of a subsidiary 0 32
Repayment of shares on liquidation of a subsidiary 70 0
Recovery of a long-term financial asset from a subsidiary 0 5
Recovery of a non-current receivable 2 0
Acquisition of other financial assets -1,500 0
Interest received 104 354
Dividends received 0 283
Net cash used in investing activities -18,092 -11,356
Cash flows from financing activities
Proceeds from loans received 5,400 4,320
Repayment of loans -2,251 -2,275
Payment of finance lease principal -26 0
Net cash from financing activities 3,123 2,045
Net cash flow -9,875 960
Cash and cash equivalents at beginning of year 18,779 17,819
Decrease/increase in cash and cash equivalents -9,875 960
Cash and cash equivalents at end of year 8,904 18,779

UNIVERSITY OF TARTU
CONSOLIDATED FINANCIAL STATEMENTS 2011
94
UNIVERSITY OF TARTU statement of changes in net assets (unconsolidated) (In thousands of euros) Capital of the
University
Accumulated
surpluses
Surplus/deficit
for the year
Total
Balance at 31 December 2009 144,182 65,654 12,540 222,376
Transfer of surplus to accumulated surpluses 0 12,540 -12,540 0
Deficit for the year 0 0 -8,904 -8,904
Balance at 31 December 2010 144,182 78,194 -8,904 213,472
Transfer of deficit to accumulated surpluses 0 -8,904 8,904 0
Deficit for the year 0 0 -2,685 -2,685
Balance at 31 December 2011 144,182 69,290 -2,685 210,787
UNIVERSITY OF TARTU adjusted unconsolidated net assets (In thousands of euros) 31 December 2011 31 December 2010
Unconsolidated net assets of the University of Tartu 210,787 213,472
Less: carrying amount of interests in subsidiaries and associates -68 -138
Plus: value of interests in subsidiaries and associates
under the equity method 1,197 930
Total 211,916 214,264


UNIVERSITY OF TARTU
CONSOLIDATED FINANCIAL STATEMENTS 2011
96
Signatures to annual report 2011
The annual report for of the University of Tartu for the year ended 31 December 2011 consists of an activity
report and consolidated financial statements.
The management of the University of Tartu has prepared the activity report and the consolidated financial
statements. The Rector of the University of Tartu has reviewed the annual report and has approved it for
presentation to the Council of the University.
______________________
Alar Karis
Rector, professor
______________________ ______________________
Taimo Saan Signe Võsoberg-Pastik
Head of Finance Chief Accountant