report: study of the ct homeowner insurance market and ... · study of the connecticut homeowner...
TRANSCRIPT

Study of the Connecticut Homeowner Insurance Market
And Coastal Affordability and Availability
Katharine L. Wade Insurance Commissioner
January 12, 2017

Our homes are among our most important investments. The ability to access homeowners insurance helps us protect that investment from a variety of risks that exist in Connecticut – from coastal storms to severe winter weather. All homeowners benefit when there is a competitive insurance market in the state. Competition means more choices with plans that best suit your needs and your budget.
The Connecticut Insurance Department (CID) has taken the pulse of the market in a data collection that took place over multi-year period stretching from 2013 through June 2015. We wanted to make sure that carriers were writing policies in all corners of the state and that the impacts of recent damaging weather events – Tropical Storm Irene, Superstorm Sandy and record winters – did not have a detrimental effect on the availability of coverage, particularly for coastal homeowners.
The CID worked with the National Association of Insurance Commissioners (NAIC) to compile information from a voluntary data call of 94 homeowner insurance companies in the traditional Personal Lines Homeowner market. The data included the number of policies for each carrier and where those policies were issued. We also tracked premium rates over the last three years. The CID reviews rates proposed by a company to ensure they are actuarially justified and reports those results annually. CID reviews have helped save homeowners more than $56 million in premium increases since 2012.
Some highlights of the report include: • 65% of all new business written in 2014 was in the coastal counties • Average CT premium for new policies has increased by 6.5% since 2013 • Average CT premium for new coastal policies had decreased by 1.4% between
2013 and mid-2015 • Since 2010, 19 new licensed insurers have begun or expanded their homeowners
business in Connecticut. Our data show that the homeowners market remains competitive throughout the state and with new carriers entering the state, there is availability along the coast. The CID will continue to closely monitor availability, particularly in areas where this report has identified trends that may affect future availability and affordability issues.
The CID is committed to our mission of protecting the insurance consumer. I encourage anyone with questions or concerns about their insurance to contact the CID either online or by phone at 800-203-3447.
Katharine L. Wade
Insurance Commissioner

Background
A previous CID study on the availability of coastal homeowners insurance was issued in December 2006. That study focused solely on availability. The report identified three main factors that contributed to availability concerns for property owners who lived certain distances from the shoreline. They were:
• More conservative reviews of insurers by rating agencies • Cost and availability of reinsurance • Enhanced and more detailed catastrophe models
Based on our more recent study, it is clear that those three factors no longer have the
same impact on narrowing coverage availability as had been the case in 2006. This is due primarily due to the increased availability and affordability of reinsurance1, and the industry’s development of other risk-transfer innovations which have resulted in greater capacity in the retail homeowners market.
Although not a new factor in coverage availability, companies still depend on catastrophe models and continue to fine tune those models. Rating agencies, regulators and in-house risk managers all conduct financial stress tests on carriers to ensure they are adequately capitalized to withstand the impacts of significant events.
Since that 2006 report, the state has experienced several significant weather events over a period of several years that caused significant damage in all corners of the state.
1 Reinsurance cost and availability became very difficult following 2004 and 2005 hurricane seasons. Florida, which was hit by four hurricanes in 2004: Charley, Frances, Ivan, and Jeanne, was impacted again by several more in 2005 including Dennis, Katrina, Rita, and Wilma.

The events underscored the big risks inherent in this small New England state: • $675 billion worth of property insured on CT coastline, 6th highest of 18 Atlantic
states • 64% of all insured property in the state is on the coastline, 3rd behind FL and NY • Nearly 60% of CT is forested and the state is among the most densely populated
In 2011, Tropical Storm Irene and a powerful October nor’easter struck within two
months of each other. A year later in 2012 Superstorm Sandy, a storm of historic proportions, slammed Connecticut again. The state also experienced record winter snowfalls that collapsed roofs and pipe-bursting extreme cold around the same time.
Insurers paid more than $1 billion in claims from those events. Until 2014, carriers in
the state-regulated market could decline new business if a homeowner didn’t have pre-drilled or cut plywood on the premises for windows to mitigate future losses. State lawmakers responded with public policy changes in Public Act No. 14-175 that, in part, prohibited this practice to ensure homeowners could obtain insurance without the plywood conditions.
In the wake of the weather events, public policy changes and other factors, the CID felt
it necessary to re-examine the market with a voluntary data call of state-regulated Personal Lines homeowner carriers in Connecticut.
This study was compiled with the assistance of the NAIC and presents the findings of
that data call and other market trends.
2015 Data Call Summary
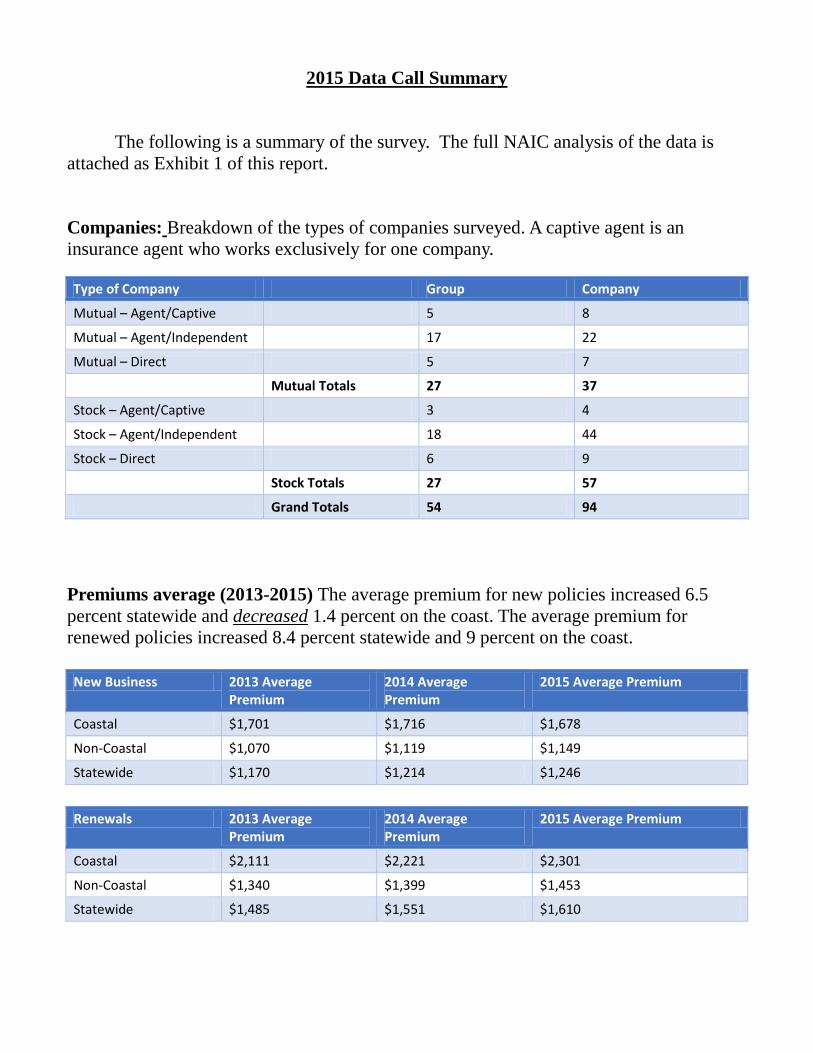
The following is a summary of the survey. The full NAIC analysis of the data is attached as Exhibit 1 of this report. Companies: Breakdown of the types of companies surveyed. A captive agent is an insurance agent who works exclusively for one company. Type of Company Group Company
Mutual – Agent/Captive 5 8
Mutual – Agent/Independent 17 22
Mutual – Direct 5 7
Mutual Totals 27 37
Stock – Agent/Captive 3 4
Stock – Agent/Independent 18 44
Stock – Direct 6 9
Stock Totals 27 57
Grand Totals 54 94
Premiums average (2013-2015) The average premium for new policies increased 6.5 percent statewide and decreased 1.4 percent on the coast. The average premium for renewed policies increased 8.4 percent statewide and 9 percent on the coast. New Business 2013 Average
Premium 2014 Average Premium
2015 Average Premium
Coastal $1,701 $1,716 $1,678
Non-Coastal $1,070 $1,119 $1,149
Statewide $1,170 $1,214 $1,246
Renewals 2013 Average
Premium 2014 Average Premium
2015 Average Premium
Coastal $2,111 $2,221 $2,301
Non-Coastal $1,340 $1,399 $1,453
Statewide $1,485 $1,551 $1,610

New entrants to the CT homeowners market:
New Carriers entering CT Homeowner Market 2012
Universal North American American Commerce
ACE Pacific Specialty Old Dominion Ohio Mutual
AAA Fidelity National
PURE Cincinnati Companies
2015 MapFre
Stillwater United Property & Casualty
National Specialty 2016
Narragansett Ironshore AM Trust
Nationwide Change in number of companies writing homeowner insurance on the coast: Fairfield County Middlesex County New Haven County New London County
2013 43 42 43 44
2014 46 42 45 44
2015 42 39 44 44
Market Trends – Claims costs, rates and underwriting
Since 2011 Connecticut direct written premium (DWP) has grown from $1.12 billion to $1.40 billion2 which represents 25 percent growth. Most of this growth is due to rate increases following the weather events the state experienced starting in 2010. The charts
2 A.M. Best Market Share report
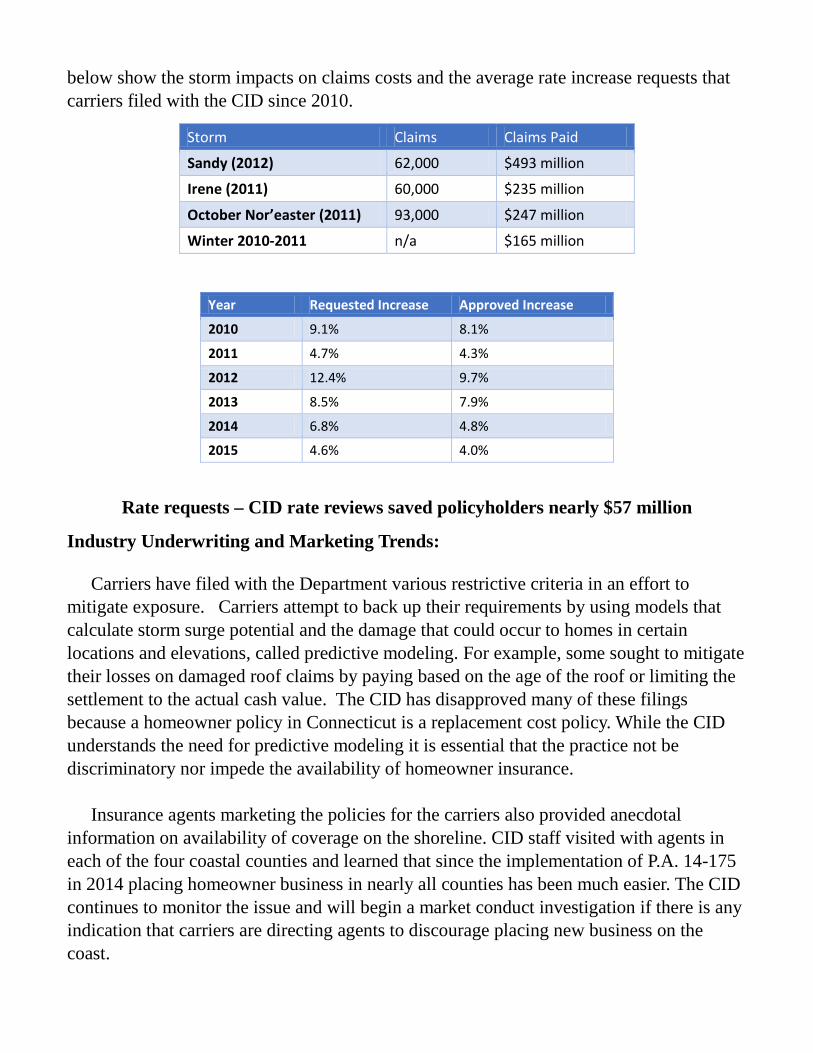
below show the storm impacts on claims costs and the average rate increase requests that carriers filed with the CID since 2010.
Storm Claims Claims Paid
Sandy (2012) 62,000 $493 million
Irene (2011) 60,000 $235 million
October Nor’easter (2011) 93,000 $247 million
Winter 2010-2011 n/a $165 million
Year Requested Increase Approved Increase
2010 9.1% 8.1%
2011 4.7% 4.3%
2012 12.4% 9.7%
2013 8.5% 7.9%
2014 6.8% 4.8%
2015 4.6% 4.0%
Rate requests – CID rate reviews saved policyholders nearly $57 million
Industry Underwriting and Marketing Trends:
Carriers have filed with the Department various restrictive criteria in an effort to mitigate exposure. Carriers attempt to back up their requirements by using models that calculate storm surge potential and the damage that could occur to homes in certain locations and elevations, called predictive modeling. For example, some sought to mitigate their losses on damaged roof claims by paying based on the age of the roof or limiting the settlement to the actual cash value. The CID has disapproved many of these filings because a homeowner policy in Connecticut is a replacement cost policy. While the CID understands the need for predictive modeling it is essential that the practice not be discriminatory nor impede the availability of homeowner insurance.
Insurance agents marketing the policies for the carriers also provided anecdotal
information on availability of coverage on the shoreline. CID staff visited with agents in each of the four coastal counties and learned that since the implementation of P.A. 14-175 in 2014 placing homeowner business in nearly all counties has been much easier. The CID continues to monitor the issue and will begin a market conduct investigation if there is any indication that carriers are directing agents to discourage placing new business on the coast.

Coverage Through Non-Traditional Markets
The CID also has examined trends in the non-traditional markets such as Excess & Surplus Lines (E&S), which is not regulated by the CID and the FAIR Plan, the plan of “last resort.”
The FAIR Plan does not compete in the voluntary market. It is an insurance association that provides coverage for property owners who have been unable to obtain it elsewhere. The policies have generally higher average premiums and provide limited coverage, significantly lower than that found in the standard market. Since 2007, the number of policies issued by FAIR Plan has been decreasing:
Year No. of FAIR Plan Policies Written Premium
2016 2,345 $3.22M
2015 2,538 $3.47M
2014 2,779 $3.67M
2013 2,829 $3.48M
2012 2,964 $3.29M
2010 3,178 $3.30M
2009 3,436 $3.23M
2008 3,817 $3.51M
2007 4,207 $3.90M The E&S market is also a market of last resort. The carriers whose policies are placed
through the E&S market are not admitted in Connecticut, meaning the carriers and the products in this market are not regulated by the CID to the same extent the admitted personal and commercial markets are. Therefore consumers do not have the same regulatory protections afforded to policyholders within the traditional or “admitted” market and may also be offered policies with less coverage than required in the admitted market. For example, a homeowner with an E&S policy is not protected by the Guaranty Fund, should the carrier become insolvent. It is important for homeowners to be aware of the regulatory distinction between the traditional and non-traditional markets. There have been indications, however, that the E&S homeowners’ market has been growing, and this is a trend the CID will be closely monitoring. The CID encourages homeowners to talk to their agents or contact the CID with any questions. Ensuring Future Availability & Affordability of Coverage
Based upon our findings, the homeowners market is currently competitive throughout Connecticut, including the coastline. New carriers continue to enter the state and provide

consumers with competitive choices. However, the CID has identified some potential areas of concern that require regulatory vigilance to ensure the market remains robust. Those areas are:
Credit Ratings
An insurance company’s access to capital is linked to its credit rating. Additionally, financial resilience, along with the continued ability to market products, are affected by a company’s credit rating and its financial strength rating. The higher the credit rating, the greater flexibility a company has to acquire additional capital when necessary. Access to new capital can be vital in order for a company to continue to pay claims and remain solvent after a catastrophic event. The Department will continue to monitor changes to rating agencies’ standards to gauge how they may affect company ratings.
Excess & Surplus Lines Trend
The passage of Public Act 14-175 was intended to provide more coastal homeowners with greater access to the admitted (i.e., fully regulated) market by prohibiting carriers from refusing to issue or renew a homeowners’ policy simply because the homeowner did not have pre-drilled and cut plywood on the premises or any type of storm shutters installed on the house. However, the CID has identified some growth in the E&S market as the overall premium volume has increased. One driver of such growth could be that premiums are generally lower for the pared down offerings in an E&S homeowner policy. The CID believes that the pricing dynamic may be inducing many consumers or their brokers to seek out this “non-admitted” market, despite the reduced coverage and lack of Guaranty Fund protection. As a result, the CID will include E&S carriers in subsequent data calls for purposes of assessing availability and affordability of homeowner policies.
The CID will continue to monitor the business practices of agents, reminding them moving a customer into the E&S market because of lower premium is not an acceptable reason for leaving the admitted market and ultimately jeopardizes consumer protection.
Coastal Business Practices
The CID will continue to ensure that neither insurance carriers nor their agents are engaging in business practices that discourage the marketing of policies along the coast. The CID will remind the industry that this practice is unacceptable and may result in market conduct investigations and penalties.

Exhibit 1
NAIC Analysis of Connecticut Homeowner Insurance Data Call

Connecticut Homeowner Market Study 2016

Introduction & Background The reason for the study is to determine the availability and affordability of homeowners
insurance along the coast of Connecticut.
A total of 94 companies submitted their information for this study. Forty-four companies classified themselves as Stock-Agent/Independent, 22 Mutual-Agent/Independent, 9 Stock-Direct, 8 Mutual-Agent/Captive, 7 Mutual-Direct, and 4 Stock-Agent/Captive.
This study will take a look at the total business written across the state as well as and in comparison to business written in the coastal zip codes, as provided by the Connecticut Department of Insurance.
The NAIC obtained all information contained in the study from companies who submitted individual company data in a prescribed format.
The accuracy of the reports included in this publication depends on the accuracy of the information contained in the company submissions. While the NAIC exercises a great deal of care in validating and capturing data, as with any statistical project, errors can occur. Consequently, the NAIC makes no representations or warranties with respect to the accuracy of the data and statistics in this report.
2

2014 New Business Written
65% of all new business written in 2014 was in the coastal counties. Approximately 50% of business written in the coastal zip codes is in Fairfield County.
New 2014 Written Premium
3% 4% 7%
32%
21%
5% 21% 7%
Fairfield County
Hartford County
Litchfield County
Middlesex County
New Haven County
New London County
Tolland County
Windham County
New 2014 Written Premium - Coastal Zip Codes
15%
48%
32%
5%
Fairfield County
Middlesex County
New Haven County
New London County
3

2014 Renewal Business Written
68% of all renewal business written in 2014 was in the coastal counties. Approximately 50% of business written in the coastal zip codes is in Fairfield County.
Renewal 2014 Written Premium - Coastal Zip Codes
15%
50%
30%
5%
Fairfield County
Middlesex County
New Haven County
New London County
4
2014 Renewal Written Premium
4% 2%
8%
34%
21%
5%
7% 19%
Fairfield County
Hartford County
Litchfield County
Middlesex County
New Haven County
New London County
Tolland County
Windham County

Average Premiums for New Written Premium
Average premium cost has increased by 6.5% over the past three years for the state. Average premium cost in coastal zip codes has decreased by 1.4% over the past three years. *2015 represents 6 months of data.
NEW BUSINESS 2013 Average Premium 2014 Average Premium 2015 Average Premium
Coastal $1,701 $1,716 $1,678
Non-Coastal $1,070 $1,119 $1,149
Statewide $1,170 $1,214 $1,246
5
$0
$200
$400
$600
$800
$1,000
$1,200
$1,400
$1,600
$1,800
$2,000
Coastal Non-Coastal Statewide
Average New Premiums
2013 Average Premium 2014 Average Premium 2015 Average Premium

Average Premiums for Renewal Written Premium
Average renewal premiums has increased by 8.4% over the past three years for the state. Average renewal premiums in the coastal zip codes increased by approximately 9% over the past three years. *2015 represents 6 months of data.
RENEWALS 2013 Average Premium 2014 Average Premium 2015 Average Premium
Coastal $2,111 $2,221 $2,301
Non-Coastal $1,340 $1,399 $1,453
Statewide $1,485 $1,551 $1,610
6
$0
$500
$1,000
$1,500
$2,000
$2,500
Coastal Non-Coastal Statewide
Average Renewal Premiums
2013 Average Premium 2014 Average Premium 2015 Average Premium

Average 2014 HO3 New and Renewal Premiums by County $200,000-$399,999 Exposure Range
Fairfield County
Hartford County
Litchfield County
Middlesex County
New Haven County
New London County
Tolland County
Windham County
2014 New HO3 Average Premium $200,000-$399,999 $1,041 $838 $876 $985 $1,029 $1,050 $874 $852
2014 Renewal HO3 Average Premium $200,000-$399,999 $1,283 $1,014 $1,025 $1,196 $1,261 $1,269 $1,071 $1,052
$-
$200
$400
$600
$800
$1,000
$1,200
$1,400
2014
Ave
rage
Pre
miu
m
2014 HO3 New and Renewal Average Premiums $200,000-$399,999 Range
7

Average 2014 HO5 New and Renewal Premiums by County $200,000-$399,999 Exposure Range
Fairfield County
Hartford County
Litchfield County
Middlesex County
New Haven County
New London County
Tolland County
Windham County
2014 New HO5 Average Premium $200,000-$399,999 $1,083 $813 $1,040 $894 $1,112 $990 $861 $927
2014 Renewal HO5 Average Premium $200,000-$399,999 $1,134 $964 $1,040 $1,058 $1,247 $1,099 $956 $989
$-
$200
$400
$600
$800
$1,000
$1,200
$1,400
2014
Ave
rage
Pre
miu
m
2014 HO5 New and Renewal Average Premiums $200,000-$399,999 Range
8

Average Premiums by County - New and Renewal 2013 to 2014
9
Fairfield County
Hartford County
Litchfield County
Middlesex County
New Haven County
New London County
Tolland County
Windham County
Total 2013 Total Average Premium 2,076 1,112 1,365 1,322 1,353 1,376 1,104 1,047 Total 2014 Total Average Premium 2,156 1,156 1,433 1,391 1,422 1,451 1,159 1,108
0
500
1,000
1,500
2,000
2,500
Aver
age
Prem
ium
Change in Total Average Premium by County

Exposures by County - New and Renewal 2013 to 2014
10
Hartford County
Fairfield County
New Haven County
New London County
Litchfield County
Middlesex County
Tolland County
Windham County
2013 Total Exposures 191,335 184,770 170,294 60,375 54,098 43,960 35,400 26,935 2014 Total Exposures 199,011 189,260 173,555 62,051 55,362 45,494 37,460 27,817
-
50,000
100,000
150,000
200,000
250,000
Aver
age
Prem
ium
Change in Total Exposures by County

Change in New Written Premium - 2013 to 2014
The increase in new business written in the coastal zip codes was only 4.55%, compared to 7.59% statewide.
Statewide Coastal Zip Codes 2013 New Written Premium $111,452,207 $25,633,736 2014 New Written Premium $119,908,405 $26,800,257 Percentage Change 7.59% 4.55%
0.00%
1.00%
2.00%
3.00%
4.00%
5.00%
6.00%
7.00%
8.00%
$-
$20,000,000
$40,000,000
$60,000,000
$80,000,000
$100,000,000
$120,000,000
$140,000,000
New
Pre
miu
m W
ritte
n
Change in New Written Premium
11

Change in Renewal Written Premium - 2013 to 2014
Statewide Coastal Zip Codes 2013 Renewal Written Premium $997,719,760 $265,848,654 2014 Renewal Written Premium $1,071,915,692 $283,735,295 Percentage Change 7.44% 6.73%
6.20%
6.40%
6.60%
6.80%
7.00%
7.20%
7.40%
7.60%
$-
$200,000,000
$400,000,000
$600,000,000
$800,000,000
$1,000,000,000
$1,200,000,000
Prem
ium
Writ
ten
Change in Renewal Written Premium
Renewal business written in the coastal zip codes increased by 6.73% compared to 7.44% statewide.
12

Change in Exposures - 2013 to 2014
Exposures increased by 1.68% in the coastal zip codes in 2014 (the latest year with a full 12 months of data) compared to an increase of 2.98% statewide .
13
Statewide Coastal Zip Codes 2013 Total Exposures 767,168 140,981 2014 Total Exposures 790,010 143,344 Percentage Change 2.98% 1.68%
0.00%
0.50%
1.00%
1.50%
2.00%
2.50%
3.00%
3.50%
-
100,000
200,000
300,000
400,000
500,000
600,000
700,000
800,000
900,000
Expo
sure
s
Change in Exposures

Fairfield County
Hartford County
New Haven County
New London County
Litchfield County
Middlesex County
Tolland County
Windham County
New 2013 Written Premium Total $35,032,581 $23,498,310 $24,558,403 $8,349,751 $7,243,438 $5,663,180 $4,168,255 $2,938,289 New 2014 Written Premium Total $38,481,354 $25,606,112 $25,365,099 $8,414,752 $7,667,388 $6,365,534 $4,695,030 $3,313,136 Percent Change 10% 9% 3% 1% 6% 12% 13% 13%
0%
2%
4%
6%
8%
10%
12%
14%
$0
$5,000,000
$10,000,000
$15,000,000
$20,000,000
$25,000,000
$30,000,000
$35,000,000
$40,000,000
$45,000,000
New
Writ
ten
Prem
ium
Annual Change in New Written Premium by County
Change in New Written Premium by County - 2013 to 2014
New London County experienced the least growth from 2013 to 2014.
14

Change in New Written Premium by County 2013 to 2014 – Coastal Zip Codes
New London County experienced most of its growth in new premium along the coast.
Fairfield County New Haven County New London County Middlesex County 2013 New Written Premium Total $12,120,015 $8,487,123 $3,734,565 $1,292,034 2014 New Written Premium Total $12,805,517 $8,479,752 $4,150,754 $1,364,235 Premium Percentage Change 6% 0% 11% 6%
-2%
0%
2%
4%
6%
8%
10%
12%
$0
$2,000,000
$4,000,000
$6,000,000
$8,000,000
$10,000,000
$12,000,000
$14,000,000
New
Writ
ten
Prem
ium
Annual Change in New Written Premium by County - Coastal Zip Codes
15

Change in Renewal Written Premium by County 2013 to 2014
Fairfield County
New Haven County
Hartford County
New London County
Litchfield County
Middlesex County
Tolland County
Windham County
Renewal 2013 Written Premium $348,592,856 $205,897,905 $189,268,263 $74,728,636 $66,599,350 $52,438,909 $34,917,919 $25,275,922 Renewal 2014 Written Premium $369,573,625 $221,462,702 $204,486,332 $81,590,873 $71,673,815 $56,912,468 $38,721,239 $27,494,637 Sum of Renewal Premium Change 6% 8% 8% 9% 8% 9% 11% 9%
0%
2%
4%
6%
8%
10%
12%
$0
$50,000,000
$100,000,000
$150,000,000
$200,000,000
$250,000,000
$300,000,000
$350,000,000
$400,000,000
Rene
wal
Pre
miu
m W
ritte
n
Annual Change in Renewal Written Premium by County
16

Change in Renewal Written Premium by County 2013 to 2014 – Coastal Zip Codes
17
Fairfield County New Haven County New London County Middlesex County Renewal 2013 Written Premium $134,089,551 $80,054,393 $37,619,342 $14,085,367 Renewal 2014 Written Premium $141,621,727 $85,809,606 $40,985,776 $15,318,186 Sum of Renewal Premium Change 6% 7% 9% 9%
0%
1%
2%
3%
4%
5%
6%
7%
8%
9%
10%
$0
$20,000,000
$40,000,000
$60,000,000
$80,000,000
$100,000,000
$120,000,000
$140,000,000
$160,000,000
Rene
wal
Bus
ines
s Writ
ten
Annual Change in Renewal Written Premium by County

Coastal Business by Company Type
18
Stock-Agent/Independ
ent
Mutual-Agent/Independ
ent
Mutual - Agent/Captive Stock-Direct Mutual - Direct Stock -
Agent/Captive
New 2014 Written Premium Total $13,843,913 $4,617,839 $4,536,773 $1,959,287 $1,424,255 $418,189 Renewal 2014 Written Premium $130,328,895 $73,134,669 $42,085,014 $12,851,994 $22,536,458 $2,798,266
$0
$20,000,000
$40,000,000
$60,000,000
$80,000,000
$100,000,000
$120,000,000
$140,000,000
2014
Writ
ten
Prem
ium
2014 Premiums in Coastal Zip Codes by Company Type

List of Companies by Type Mutual – Agent/Captive
CSAA Fire & Casualty Insurance Company
Liberty Insurance Corporation
Liberty Mutual Fire Insurance Company
Nationwide General Insurance Company
Nationwide Mutual Fire Insurance Company
Nationwide Property & Casualty Insurance
State Farm Fire and Casualty Company
California Casualty Indemnity Exchange
Mutual - Agent/Independent Allstate Indemnity Company
Allstate Insurance Company
Cambridge Mutual Fire Insurance Company
Casco Indemnity Company
Central Mutual Insurance Company
Employers Mutual Casualty Company
General Insurance Company of America
Graphic Arts Mutual Insurance Company
Harleysville Preferred Insurance Company
Harleysville Worcester Insurance Company
Merrimack Mutual Fire Insurance Company
Middlesex Mutual Assurance Company
National Grange Mutual
New England Mutual Insurance Company
New London County Mutual Insurance Company
Patrons Mutual Insurance Company of Connecticut
Providence Mutual Fire Insurance Company
Republic-Franklin Insurance Company
Safeco Insurance Company of America
Union Mutual Fire Insurance Company
Utica First Insurance Company
Vermont Mutual Insurance Company
Mutual – Direct Amica Mutual Insurance Company
Homesite Insurance Company
LM Insurance Corporation
United Services Automobile Association
USAA Casualty Insurance Company
USAA General Indemnity Company
21st Century Premier Insurance Company
19

List of Companies by Type Stock – Agent/Independent AIG Property Casualty Company American Automobile Insurance
Company American Commerce Insurance
Company ASIC Connecticut Associate Indemnity Corporation Automobile Insurance Company
of Hartford Bankers Standard Insurance
Company Bunker Hill Insurance Company Chubb National Insurance
Company Cincinnati Insurance Company Citizen’s Insurance Company of
America Economy Premier Assurance
Company Encompass Indemnity Company Encompass Insurance Company
of America Federal Insurance Company Fireman’s Fund Insurance
Companies
General Casualty Company of Wisconsin
Great Northern Insurance Company
Hartford Casualty Insurance Company
Hartford Fire Insurance Company Hartford Insurance Company of
the Southeast Hartford Underwriters Insurance
Company Integon National Insurance
Company Kemper Independence Insurance
Company Mass Bay Insurance Company Massachusetts Homeland
Insurance Company Merastar Insurance Company Metropolitan Property and
Casualty Insurance National Surety Corporation Pacific Indemnity Company Praetorian Insurance Company Priviledge Underwriters
Reciprocal Exchange
Sentinel Insurance Company, Limited
Standard Fire Insurance Company
The Hanover American Insurance Company
The Hanover Insurance Company Tower Insurance Company of NH Travelers Home and Marine
Insurance Company Travelers Indemnity Company of
America Travelers Personal Security
Insurance Company Twin City Fire Insurance
Company Unitrin Direct Property and
Casualty Company Unitrin Preferred Insurance
Company Universal North America
Insurance Company Vigilant Insurance Company
20

List of Companies by Type Stock – Direct
Electric Insurance Company
Hartford Accident and indemnity Company
IDS Property & Casualty Insurance Company
Metropolitan Group Property and Casualty
Property and Casualty Insurance Company
Trumbull Insurance Company
Hartford Insurance Company of the Midwest
Pacific Specialty Insurance Company
Stillwater Property and Casualty Insurance
Stock – Agent/Captive Covenant Insurance Company
Farm Family Casualty Insurance Company
Horace Mann Insurance Company
Teachers Insurance Company
21

Coastal Business by Distance From Shore
22
0
5,000
10,000
15,000
20,000
25,000
30,000
35,000
40,000
$0
$10,000,000
$20,000,000
$30,000,000
$40,000,000
$50,000,000
$60,000,000
$70,000,000
$80,000,000
0-1000 Feet 1001-2600 Feet 2601-1Mile 1.1-2 Miles 2.1-3 Miles 3 Miles+ Unknown
2014 Premiums & Exposures by Feet from Shore Coastal Zip Codes
New 2014 Written Premium Total Renewal 2014 Written Premium Total New and Renewal 2014 Exposures

Average Premiums by Distance from Shore
23
0-1000 Feet 1001-2600 Feet 2601-1Mile 1.1-2 Miles 2.1-3 Miles 3 Miles+ Unknown New 2014 Average Premium $2,768 $1,780 $1,479 $1,874 $1,600 $1,781 $1,393 Renewal 2014 Average Premium $2,900 $2,252 $1,983 $2,638 $2,172 $1,989 $1,850
$0
$500
$1,000
$1,500
$2,000
$2,500
$3,000
$3,500
Aver
age
Prem
ium
s
2014 Average Premiums by Feet from Shore Coastal Zip Codes
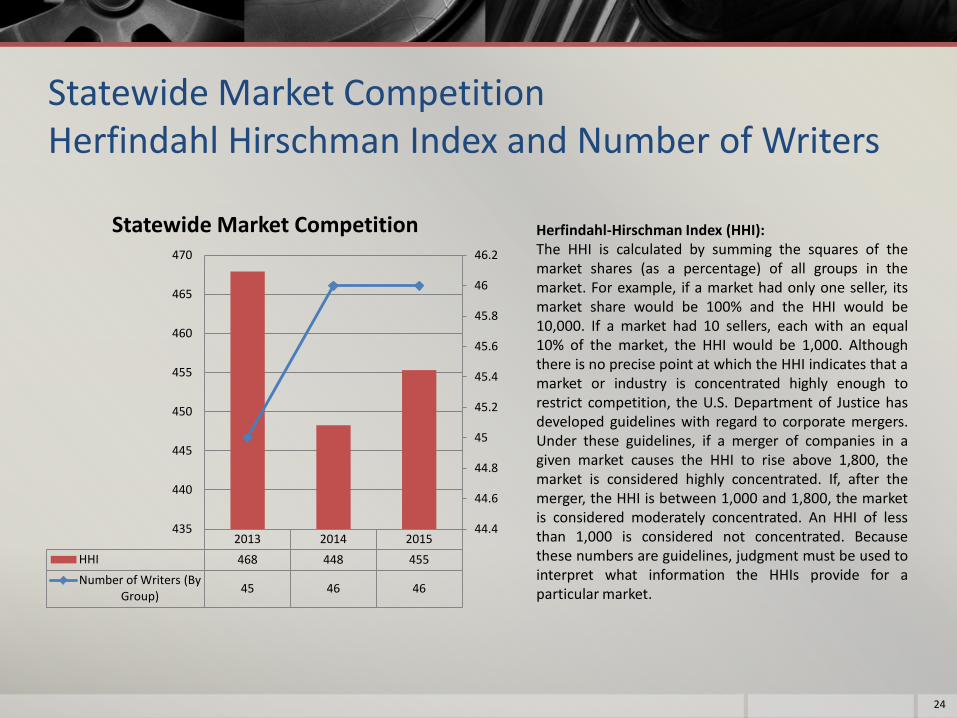
Statewide Market Competition Herfindahl Hirschman Index and Number of Writers
Herfindahl-Hirschman Index (HHI): The HHI is calculated by summing the squares of the market shares (as a percentage) of all groups in the market. For example, if a market had only one seller, its market share would be 100% and the HHI would be 10,000. If a market had 10 sellers, each with an equal 10% of the market, the HHI would be 1,000. Although there is no precise point at which the HHI indicates that a market or industry is concentrated highly enough to restrict competition, the U.S. Department of Justice has developed guidelines with regard to corporate mergers. Under these guidelines, if a merger of companies in a given market causes the HHI to rise above 1,800, the market is considered highly concentrated. If, after the merger, the HHI is between 1,000 and 1,800, the market is considered moderately concentrated. An HHI of less than 1,000 is considered not concentrated. Because these numbers are guidelines, judgment must be used to interpret what information the HHIs provide for a particular market.
24
2013 2014 2015 HHI 468 448 455 Number of Writers (By
Group) 45 46 46
44.4
44.6
44.8
45
45.2
45.4
45.6
45.8
46
46.2
435
440
445
450
455
460
465
470
Statewide Market Competition

2014 Market Competition – Coastal Zip Codes
The greater the Herfindahl Hirschman Index number, the less competitive the market. An HHI of less than 1,000 is considered not concentrated.
25
Fairfield County Middlesex County New Haven County New London County Herfindahl Hirschman Index 817 500 516 447 Number of Companies Writing New Business 46 42 45 44
-
100
200
300
400
500
600
700
800
900
40
41
42
43
44
45
46
47
Market Competition in Coastal Counties

Annual Market Competition – Coastal Zip Codes
26
Fairfield County
Middlesex County
New Haven County
New London County
2013 Herfindahl Hirschman Index 889 480 611 460
2014 Herfindahl Hirschman Index 817 500 516 447
2015 Herfindahl Hirschman Index 639 632 522 536
-
100
200
300
400
500
600
700
800
900
1,000
Herf
inda
hl-H
irsch
man
Inde
x
Change in Market Competition by County
Fairfield County
Middlesex County
New Haven County
New London County
2013 43 42 43 44 2014 46 42 45 44 2015 42 39 44 44
34
36
38
40
42
44
46
48
Num
ber o
f Com
pani
es W
ritin
g N
ew B
usin
ess
Change in Number of Groups Writing New Business by County -
Coastal Zips Only