report resumes - eric resumes. ed 013 281. ... the effectiveness-of elementary and secondary act...
TRANSCRIPT

REPORT RESUMESED 013 281 UD 004 021A COST-EFFECTIVENESS MODEL FOR THE ANALYSIS OF TITLE I ESEAPROJECT PROPOSALS, PART I-VII.BY- AST, CLARK C.AST ASSOCIATES INC., CAMBRIDGE, MASS.REPORT NUMBER 7N-14-THROUGH-I0 PUB DATE 9 DEC 66NATIONAL CENTER FOR EDUCATIONAL STATISTICS ADHEWWCONTRACT OEC-1-6-001681-1681EDRS PRICE MF-$0.50 HC-$4.96 124P.
DESCRIPTORS- *MODELS, *PROGRAM EVALUATION, *PROGRAM COSTS,EVALUATION TECHNIQUES, INSTRUCTION, COMMUNITY CHANGE,SCHOOLS, STATISTICAL ANALYSIS, DISADVANTAGED YOUTH, *PROGRAMEFFECTIVENESS, ACADEMIC ACHIEVEMENT, STUDENT ATTITUDES, ESEATITLE I
SEVEN SEPARATE REPORTS DESCRIBE AN OVERVIEW OF ACOST-EFFECTIVENESS MODEL AND FIVE SUBMODELS FOR EVALUATING.THE EFFECTIVENESS-Of ELEMENTARY AND SECONDARY ACT TITLE IPROPOSALS. THE DESIGN FOR THE MODEL ATTEMPTS A QUANTITATIVEDESCRIPTION OF EDUCATION SYSTEMS WHICH MAY BE PROGRAMED AS ACOMPUTER SIMULATION TO INDICATE THE IMPACT OF A TITLE IPROJECT ON THE SCHOOL, THE STUDENTS, AND THE COMMUNITY. THEOVERALL COST-EFFECTIVENESS MODEL FOCUSES ON CHANGES INSTUDENT ACHIEVEMENT, ATTITUDINAL AND ENVIRONMENTAL FACTORSINFLUENCING ACHIEVEMENT, AND SOCIAL BEHAVIORS AND COMMUNITYIMPACTS OF IMPROVED ACHIEVEMENT IN THE DISADVANTAGED. THEFIVE SUBMODELS COMPRISING THE OVERALL MODEL ARE--(I) SCHOOL,AND (2) INSTRUCTIONAL PROCESS, (3),COMMUNITY INTERACTIONS,(4) COSTS, AND (5) COST-EFFECTIVENESS. THE SCHOOL SUBMODELREPRESENTS THE PROCESS IN WHICH FOUR STUDENT TYPES (WHITE ANDNONWHITE WITH FAMILY INCOMES ABOVE AND BELOW $210013) ANDEDUCATION RESOURCES (TEACHERS, EQUIPMENT, ETC.) ARE CONVERTEDINTO BETTER-EDUCATED INDIVIDUALS. THE INSTRUCTIONAL PROCESSSUBMODEL INDICATES THE STUDENT ACHIEVEMENT AND.ATTITUDECHANGES RESULTING FROM TITLE I PROGRAMS. THE COMMUNITYINTERACTIONS SUBMODEL ESTIMATES THE IMPACT ON SEVEN COMMUNITYVARIABLES OF CHANGES IN THE EDUCATIONAL SYSTEM DUE TO TITLE I
. PROGRAMS. THE COST SUBMODEL ACCOUNTS FOR BOTH THE DIRECT ANDINDIRECT COSTS OF TITLE I PROGRAMS. THE EFFECTIVENESSSUBMODEL ANALYZES'THE OUTPUT OF THE RESULTS OF THE OTHERSUBMODELS. ONE OF THESE SEVEN REPORTS DESCRIBES THE OFFICE OFEDUCATION COST-EFFECTIVENESS SIMULATION. (JL)
11511015itaallaiRlaixiAskasaisc

Mx... 1. "two_
U.S. DEPARTMENT OF HEALTH, EDUCATION & WELFARE
OFFICE OF EDUCATION
THIS DOCUMENT HAS BEEN REPRODUCEDEXACTLY AS RECEIVED FROM THE
PERSON OR ORGANIZATION 0E11100 IT. POINTS OF VIEW OR OPINIONS
STATED DO NOT NECESSARILY REPRESENTOFFICIAL OFFICE OF EDUCATION
POSITION OR POLICY..
vi7001/01-1
NATIONAL CENTER FOR EDUCATIONAL STATISTICS
Division of Operations Analysis
A COST-EFFECTIVENESS MODEL FOR THEANALYSIS OF TITLE I ESEA PROJECT PROPOSALS
PART I
AN OVERVIEW OF THE COST-EFFECTIVENESS MODELAND SUBMODELS FOR THE EVALUATION OF
TITLE ESEA PROPOSALS
Prepared for the Division of Operations Analysis :
by .
Abt Associates, Inc.Under Contract .No.. OEC 1-6-001681-1681"
. .
Technical. Note.."". Number 14 .
December 9, 1966
:
.
; -
- ..-;=
'OFFICE OF EDUCATION/U.S. DEPARTMENT. OF HEALTH, EDUCATION, AND WELFARE

- ,..-:-,."7.,;,',;, -
''` .','.'.I. -,1,; -',..tr, i ....7
A-.' A .. - -. A .. c.1 *t'l ''
- 1,::... . .' .- .-':::.S.(-.:.' -.j,'.-
4
,
NATIONAL CENTER ",.OR EDUCATIONAL STATISTICS
Alexander N. }food, Assistant Commissioner
DIVISION OF OPERATIONS ANALYSISDavid S. Stoller, Director
;*. "*:..": '',..'
''''''-; ',,::_r
, ,

r
PREFACE
This Technical Note is the first of a seven-part issue which
describes a Cost-Effectiveness Model for the analysis of Title I
ESEA, Project Proposals. The seven parts are:
TN-14 Part I -
TN -15 Part II
TN-16
TN-17 Part
An Overview of the Cost-Effective-ness Model and Submodels for the
Evaluation of Title I ESEA Proposals
The School Submodel
Instructional Process Submodel
Community Submodel
Cost Submodel
Effectiveness Submodel
Simulation
Part III - The
IV - The
TN-18 Part V - The
TN-19 Part VI - The
TN-20 Part VII - The
The model was developed by Abt Associates, of Cambridge,
Massachusetts, for the Division of Operations Analysis, National
Center for Educational Statistics, under contract number OEC 1-6-
001681-1681.

t
,
DESIGN FOR AN
EDUCATION SYSTEM COST-EFFECTIVENESS MODEL
byDr. Clark C. Abt
Abt Associates Inc.Cambridge, Massachusetts
This presents a design for an elementary and secondary
education cost-effectiveness model, emphasizing evaluation of the U.S.
Elementary and Secondary Education Act's Title I programs for the dis-
advantaged. Substantively, the design reflects a concern for the exploit-
ation of all available data on results accomplished by educational sys-
terns, as well as what is known about learning and influence processes.Methodologically, the design attempts a quantitative description of edu-
cation systems, that may be programmed as a computer simulation that
will produce quantitative indications of the impact of a Title I project
on the school, the students and the community.The model at this writing has been partly programmed for com-
puter simulation, and empirical data are being collected fOr the van--) dation.
The model was developed in 1966 under contract for the U. S.
Office of Education's Division of Operations Analysis, by an interdis-ciplinary team at Abt Associates Inc. , a private research firm located
in Cambridge, Massachusetts. Some five man-years of professional
effort were expended by fifteen professionals under the direction of the
writer. The writer gratefully acknowledges the inspiration and encour-
agement given by Dr. Alexander Mood, Assistant Commissioner forEducational Statistics; the wise direction and warm support of Dr.
David Stoller, Director of the Division of Operations Analysis; Dr.
Richard Powers, Chief of the Education Economics Analysis Branch;
and Mr. Martin Spickler; all of the U.S. Office of Education. Signifi-
cant parts of the model design are the work of my colleagues at Abt
Associates Inc. , Stephen Bornstein, Louis Cutrona, Stephen Fitzsim-
mons (deputy project director), Raymond Glazier, James Hodder,
I

Holly Kin ley, Peter Miller (deputy project director), M. Keith Moore,Martha Mulloy, Michael Pritchett, Robert Rea, Martha Rosen, and
Richard Rosen. Professor Andre Danier6 and Mr. George Thomas
of Harvard University generously gave advice and information.
a

THE OVERALL MODEL AND THE SUBMODELS
The purpose of the overall education Cost-effectiveness modelis to evaluate the relative school, student, and community effectsand associated costs of alternative ESEA Title I programs for the dis-advantaged.
Since such programs are directed toward increasing learning,the model focuses strongly on the changes in student achievement,the attitudes and environmental factors influencing achievement, andthe social behaviors and community impacts of improved achievementin the target population.
The model may be described as a micro-educational model, be-cause of its representation of some of the detail components of theeducation process. However, the model does not pretend to be a micro-analysis of learning and influence processes, although these processesare represented by whatever objective correlatives are available in theform of qualitative numerical indices.
The model also does not pretend to be an exhaustive representa-tion of what leads to changed student achievement, attitudes, 'earningpotential, and equality of educational opportunity. The attempt was toemphasize those aspects of the education process that seem most rele-vant to achievement increases in students affected by Title I programs,and for which quantitative data is widely available.
Some attitudinal variables believed decisive for the learning pro-cess are not yet quantitatively defined, and there is only qualitative, im-pressionistic data available on them. Rather than simply omit suchtroublesome but significant variables, and thus falsely imply insignifi-cance by omission, the qualitative variables are sometimes given nu-merical index ratings roughly corresponding to such qualitative distinc-tions as are offered by empirical but impressionistic data. In othercases, qualitative variables are built up numerically from components
.
for which better data is available, or assigned index values by user.judgment.- In all cases, the attempt has been made to achieve a usefulbalance among the demands of data input., model complexity and validity..of output.
3
s

The model's emphasis is on what the education system producesin terms of quantities and qualities, rather than how it does so. How?ever, a certain amount of detail on how it produces its effects was es-sential to simulate for forecasting what it will do.
The model is not initially expected to be predictive., but onlyindicative of the relative cost-effectiveness of alternative Title I pro-
.
grams. 'Prediction requires regularity of process, and no two schools,student populations, or communities are alike. Even the calibration ofthe model with previous Title I before-and-after data will only improveits indication of the probable relative effectiveness of programs, becauseof the uniqueness of each case. Only to the': extent that Title I situation::are similar and are accurately measured and modeled, can their impactbe forecast. However, even such a limited cost-effectiveness forecast-ing and evaluation model as that described here offers a substantial aidto education planners and policy - makers.
The overall model consists of five submodels: (See Figure I below)--School .
--Instructional Process--Community Interactions--Costs--Cost-Effectiveness
The School Submodel represents the production process wherebythe inputs of four partially educated students types (white and non-white,above and below $2, 000 family income) and education resources (teach-ers, equipment, facilities, community environment) are transformed .
into better educated individuals, graduates, and dropouts. Inputs includeTitle I programs, previous school achievement and student sociologicaldata, and specific improved achievement in the target population. Out-puts are the change in numbers of graduates, dropouts, achievementlevels by grade and student type, and critical achievement areas.
The Instructional Process Submodel, represents the specific im-provementi in student achievement and attitude resulting from a Title Iprogram. It attempts to reproduce the effects of the influence processwhereby behavior and attitude are modified by exposures to teacher,
4

TIT
LE
IPR
OG
RA
MS
USE
RJU
DG
ME
NT v.
orpt
SCH
OO
L &
CO
M-
MU
NIT
Y D
AT
AB
ASE
-
Aw
ning
41
SCH
OO
L
: "
I MO
O=
Iam
mo
CO
MM
UN
ITY
01;T
TPU
T
INST
RU
CT
ION
AL
,PR
OC
ESS
CO
STS
CO
MPU
TE
R S
IMU
LA
TIO
N
v
CO
ST-
FFE
CT
IVE
NE
S1
4A
MM
O
CO
MM
UN
ITY
LE
AR
NIN
GPO
TE
NT
IAL
dEQ
UA
LIT
Y O
F E
DU
CA
TIO
NA
L'
OPP
OR
TU
NIT
YSC
HO
OL
AG
RA
DU
AT
ES
AD
RO
POU
TS
STU
DE
NT
AA
CH
IEV
EM
EN
TS
QA
TT
ITU
DE
S(I
ND
EX
OF
LE
AR
NIN
GD
IFFI
CU
LT
Y)
'EFF
ICIE
NC
Y'
AE
FFE
CT
SPE
R $
AE
FFE
CT
SPE
R R
ESO
UR
CE
Figu
re 1
: Cot
t-E
ffec
tiven
ess
Mod
elO
verv
iew
Sho
win
g In
puts
, 5 S
ubm
od-
els,
and
Out
puts
.

.
parent, and peer of varying duration and intensity. Inputs are the
Title I program, previous and current changes in attitudes and achieve-
ments, and sociological data. Outputs are changes in achievement anf.I
attitude ('Inckic of Learning Difficulty') by student type.
The Community Interactions Submodel estimates the impact on
seven community variables of the changes in education system output
due to Title I programs. The inputs are the School Submodel outputs of
changes in numbers of graduates, dropouts, and achievement levels;
the Instructional Process outputs of changed student achievement and at-
titude; and community characteristics from the Data Base. Outputs are
the community changes in terms of changes in lifetime earning potential
and equality of educational opportunity.
. The Cost Submodel accounts for all direct and indirect costs rel-
quired to implement Title I programs. It allows the user to associate
specific costs with specific components of the program and their effects.
Inputs are the Title I program description and costs, and the real national
average costs of typical Title I items. The submodel compares typical
and proposed costs to allow the user to evaluate the efficiency of the pro-
posed expenditures, Outputs are the total costs of the program, the
added resources bought, and total program costs broken down by com-
ponent parts.The Effectiveness Submodel is the submodel in which the analysis
land the output of the results determined by the other submodels takes
.place. The inputs to the Effectiveness Submodel are all of the variables
which are in the Data Base at any time, the outputs of all of the above:submodels (i. e. , student, school, and community effects), and their
associated costs. Outputs are efficiency data, measures of education
effectiveness, and descriptive school, student and community data.
Specific efficiency measures are effects per cost, values per cost,
effects per resource, and values per resource.The outputs of each Title I program would be evaluated by at least
one model 'run, ' and comparison of alternate programs can be made by
comparing respective effects and costs. Both different programs for
-6..

the same target population, and the same or different programs fordifferent target populations may thus be compared. The tables beloware examples of typical computer printouts .(output) of a model. run for
a single specific school improvement project, giving before-projectand after-project achievement, attitude and economic data on students
by population type.
BEFOREenuYEAR:1 965
AFTERPROJYEAR:1 90. . ..-
SUMMARY OUTPUf
U.S.O.E. COST-EFFECTIVENESS MODEL
COMMUNIi?i. FERNDALEMASS
TARGET 62-3POPULATION: SCHOOL.
/POP.' AVERAGE INDEX- NO: NO. 10005 CORRTYPE ACHIEVEMENT -LEARN. DROP-;..GRADS LIFE SES
-IGT-6.
1.2. 8:62 2..0 10433 '7.44 32 127.
...
PRO3ECT REMEDIALTYPE: READING
ANNUALCOST: 85000.
1 13 -110:2-2 2:6 11:03 2:4
3":2 *t
4-12 ZARNS-ACHMT.
66 20 28 140 043b;64 -16 31 190 0.40:80 21 27 . 175 060'56 9 46' 210 030
- e.e) .16 32 . 195 0.65;84 12 35 220 060
. 80 17 31 215 050:.56 . 47 280: 0:30"
: POPULATION TYPES1..NON-WHITES UNDER 2000 INCOME2/NOW-WHITES OVER 2000 INCOME3 WHITES UNDER 2000 INCOME4 WHITES OVER 2000 INCOME
- 7 -

; 4.* II
V
ACHIEVEMENT OUTPUTS:GRADE. SUBJECTS, AND POPULATION TYPES'
COMMUNITY: FERNDALEMASS
PROJECT REMEDIALTYPE: READIN5
TARGET G2-3 ANNUAL.
__POPULATION: SCHOOL.B......._:_COST:._ 85000 .
GRADE 1 2 3
POP .
- TYPEBE. FORE 1 6PROJCT 2 .8
. YEAR: 3 .81965 r .. 4 .1 .2
iAFTER 1 .6PROJCTI .2 .8YEAR: i 3 .81.968 4 1.2
POP. -.TYPE
1 5 1 1.8 293 3.0 3.6 4.4 5.0
4 5 6 7 8
GRADt.LEVELS ._ IN LANGUAGE.
9 10 11 12
.1.1 1.6 2.3 3.0 3.8 4.5 5.2 7.01.2 1.9 2..9 3.4 4.5. 5.1 6.0 7.?.1.3 2.0 31 3.7 4.9 5.8 6.6 8..6
2.1. 2.9 4.0 5.0 6.2 7.1 8.0 _9.3
1 .4 2.9 3.0 .3.9 5.8 6.7 ''1.6 8.51.5 3.0 4.0 5.0 6.0 6.9 1:/-. 9 8.91.7 3.1 4.0 5.2 7.1 8.0 9602.1 2.9 4.0 5.0 6.2 7 I 8.0 9.3
__GRADE LEVELS IN MATHEMATICS
B EFOR E.PROJCTrEAR:1 965
1.3 2:2 2:9 403 .99 1.5 2'97 3.91 4491
4 10 2:0 29 39 5VOAFTER 1
PROJCT 2YEAR: 31 968 4
POPTYPE
BEFORE IPROJCT gYEAR: 31 965 4
AFTER 1
P ROJCT 2YEAR: 31966 .4
POP TYPES:
.5 1.36 1.89 2'90
1...0 241
2.2 3o029 3:930 .6;130 '42
4:6 595. 6150 6:7 6:6.
_6:2. .761
4.0 4.650 565'90 6:0591 6:0
7.6 8.2 8.96.4 9.3 10;09.2 9.9 1069
10.2 11.0. 12.0
.
5.87.07:29:1
5.4 6.0 6.76:5 79I 8:1700 8:0 8:87'90 GO. 99.0
....G.RADE_LEVELS .IN . SCIENCE
6 1.4 2.98 15 30*.*8 31
1.92 2:1 2:0
4:04904:0
.6 . 1.1 1.6 2.38 1 2 1:9 2.9VC 1:3 2:0 3:1
1:2 2V1 29 4:0
3.9500.525:0
3.03.4
5:0
5.8606:26:2
3.84:54.09
6:2
1-NONWHITES, LESS THAN 2000'2.-NONWHITES) MORE THAN 2003
6.7 7.6 8.569 7'99 047:1 80 9.07:1 80 . 9:3
9.4 10.3 11.09.09 .10.9 11.610.0 11.0 126010.2 11.0.12.0.
6.3 7.08V0 8180 8:11.00 11:1
7.2 6.08:4 8:59:0 2:1100 .11:0
9.49.9
10'90.10.2
8°C9009:4
12:0
10.3 11.0.10.9.1Y061100 12;0110 12:0
4.13 : 5.2 790 7.6 8.2 8.95.91 60 7:7 8...4 93 IVO5..3 66 8.96 92 909 10:9701 E.i:0 903 102 11.0 12:0
3-WHITES o L(SS THAN 2000A.-WHITES) MORE THAN 2050

0
NATIONAL CENTER FOR EDUCATIONAL STATISTICS
Division of Operations Analysis
A COST-EFFECTIVENESS MODEL FOR 'THEANALYSIS OF TITLE I ESEA PROJECT PROPOSALS
PART II
THE SCHOOL SUBMODEL
Prepared for the Division of Operations Analysis'
by
Abt Associates, Inc.Under Contract No. OEC 1-6-001681-1681.
Technical NoteNumber 15
December 9, 1966
.
OFFICE OF EDUCATION/U.S. DEPARTMENT OF HEALTH, EDUCATION, AND WELFARE
r 4104 ,,

NATIONAL CENTER FOR EDUCATIONAL STATISTICS.Alexander M. Mood, Assistant Commissioner
DIVISION OF OPERATIONS ANALYSISDavid S. Stoller, Director

PREFACE
This Technical Note is the second part of a seven-part issuewhich describes a Cost-Effectiveness Modal for the analysis ofTitle I ESEA Project Proposals. The seven parts are:
TN-14 Part I - An Overview of the Cost-Effective-ness Model and Submodels for theEvaluation of Title I ESEA Proposals
TN-15 Part 'II - The School Submodel
TN-16 Part III- The Instructional Process Submodel
TN-17 Part IV - The Community Submodel
TN-18 Part V - The Cost Submodel
TN-19 Part VI - The .Effectiveness Submodel
TN-20 Part VII- The Simulation
The model was developed by Abt Associates, of Cambridge,Massachusetts, for the Division of Operations Analysis, NationalCenter for Educational Statistics, under contract number OEC 1 -6-001681 -1681.

$
THE SCHOOL SUi3MODEL
The School Submodel is similar to a production process withquality controls. The inputs of four student types .(white and.non-:.
.' white, above and below $2, 000 family income) and education re-sources (teachers, equipment, facilities, community environment)are transformed into better educated individuals, graduates anddropouts. Inputs include Title I.programs, previous school achieve-ment and student sociological data, and specific improved achieve-ment in the target population. Outputs are the.change in numbers ofgraduates, dropouts, achievement levels by age or grade, and criti-cal achievement areas.
. There are five subroutines: the school flow matrix;.course.of study selection and allocation, truancy and dropout, andgraduation (see rig. 1). The school flow matrix representsthe flow of students through parallel achievement category tracks"sub-assembly production lines, " in a sequehce of achievement levelswithin each track "quality control checkpoints." The achievementcategories in various combinations form subjects such as math or Eng-lish.. The achievement levels may represent grades or promotion thres-holds (where schools are graded), but in any case are prerequisitegates for further achievement in the same and in related achievementcategories. Any combination of achievement categories, achievementlevels, and student types may be the target area of a Title I program(see Fig.' 2).
At the eighth grade achievement level of the school flow matrix,the course of study selection routine is usually triggered. Studentsare allocated to college prep, clerical, general, or vocational highschool courses of study, depending on their achievement levels and theentry requirements.
Truancy and absence rates are .computed at all achievement orgrade levels on the basis of external attitudinal and past achievementdata. 'Dropouts are computed on the basis of past achievement, ab-sence, attitudes, and community factors. Graduates are computed onthe basis of achievement at the final level or grade, and graduation cri..teria. Finally, critical achievement areas, in terms of age /grade and
ea,
subject and population, can be identified by, iterated runs of the schoolflowmatrixunder various 'conditions.

STU
DE
NT
AC
HIE
VE
ME
NT
.SC
HO
OL
PRO
MO
TIO
NPO
LIC
Y
N 'JU
DG
ME
NT
:SU
BJE
CT
INT
ER
DE
PEN
-.
_DE
NC
IES
TIT
LE
IA
AC
HIE
VE
ME
NT
TA
RG
ET
S.
PER
TA
RG
ET
-ISC
HO
OL
FL
OW
MA
TR
IX
RIP
PLE
S O
FA
CH
IEV
EM
EN
T G
APS
NO
N-
PRO
MO
TIO
N
AC
HIE
VE
-M
EN
T
1 A
CH
IEV
EM
EN
T
CO
UR
SE O
F ST
UD
YA
LL
OC
AT
ION
QU
AN
TIT
Y A
ND
AC
HIE
VE
ME
NT
SO
F G
RA
DU
A T
ES
TR
UA
NC
YSU
BR
OU
TIN
E
i!T
AB
SEN
CE
DR
OPO
UT
SUB
RO
UT
INE
AT
TIT
UD
ES
CO
MM
UN
ITY
IN
PUT
S
GR
AD
UA
TIO
NR
EQ
UIR
EM
EN
TS
FIG
. 1 S
CH
OO
L S
UB
MO
DE
L
OU
TPU
T:
DR
OPO
UT
S
AG
RA
DU
AT
ES
AC
HIE
VE
ME
NT
LE
VE
LS
BY
GR
AD
E /A
GE
.C
RIT
ICA
LA
CH
IEV
EM
EN
TA
RE
AS
twat
amos
alas
sivi
2aM
MIU
,111
1411
1111
6Rar
°..r

. . 11 Ow oft
1.... A-
0441 00
- .4.
. . .
et
so? ort.\,...04sts
.. - . ..rvisme.olvrfrAl0$.1o.osissairet-.4......s.a......
-I
1,.
-4... ,
i 11$fillil <1
I
1J Q4
P.-K6-1!
li 14
,
***0111~.'
I
4_
iejil
MaraNTS
e
.,
,rs.......i-
a ttiketvotmiZ.T.'1:49.7.1.11.i,
11`4":10.,.grata:AC
.
yomorarales 4.
: 1 rs%11'41
`it,qiikJ ef 11
1.4,1 01,
il- 3 co
,
..............
6u ,..moora. ..
t4 f3)
1.0 *or-41 44,1ti1.- 4
Fr
w .
..,1 I..,41;:iili... i 141- rti:
_Tr--
.4,........,..........
. .
.
. .
03
014
2
b)
1,0 g W
< 414 u 4.1pc cft. < cD
14iZ
144 21** k°4.0,
.47.77 nIC,IPILV90, 04>tist.V-A313.
..

THE SCHOOL FLOW NETWORKIntroduction
Forecasting long-range education effects as a result ofTitle I is accomplished in the school model by propagating, changesin achievement resulting from the application of those Title Iprograms. The propagation starts at.the next highest grade andworks forward by the successive application of a set of decisionrules. The decision rules are based on predicted performance asa result of meeting ctirrie.illum prerequisites. The past perform-ance for each student type and course type is stored. The schoolflow. network, is overlayed upon the historic data. The achieve-ment change is then overlayed upon the network, propagated, and anupgraded performance profile is generated.
,..
.
IleAcitiorl.The school flow network consists of nodes at each grade/age
....achievement point. Nodes are connected by solid lines to indicate a pri-mary prerequisite exists in the previous grade for that achievement cate-gory. Dotted lines indicate that the preVious grade acts as a secrinc:aryprerequisite in that achievement category...
grade, (g) .
/ReadingLanguage
(p) Soc. studiesMath.
Science
6 8 10 12
The school flow network is used to infer the results of aTitle I program on graduates and drop-outs. For example, if aTitle I program is designed to improve the reading level achieve-ment of second graders, this improvement will result in an increasedchance of improvement in most other fourth grade achievements(except possibly, 'shop'). The network provides the prerequisites,and the historical achievement scores provide the basis for extra-polating 'downstream' effects.
I

Assumptions A29 Propagationat i on.1The network is designed to operate in conjunction with a
Title I program aimed at upgrading achiev.ement. Several assump-tions about operations are required:
1) We assume tha t in all cases:
A rcruir.:s AA , thatp, p, g-1is,a change in any achievement (A p) for
any gradelg) requires the presence of achange in the same achievement at theprevious grade. This is the horizontalprerequisite.
2) We assume that, in all cases, any lostrequirement prevents a change in achieve-.ment at the next level. This is the gatingfunction effect. The result is that any nodehaving more than one prerequisite musthave a change present on all its entry lines toassure passing a change to the next higherlevel. (If only weak prerequisities are notpresent, we may reduce the probability ofa change to the next level. )
Title I 'Case A Title I Case13
ft -A-
3) The "ripple effect" can die out after a fewgrades if insufficient nodes have been activated.
MM.
4) A change will be generated whenever the levelof the prerequisite is higher than or equal to thenext level and the line is a diagonal. This assump-tion prevents the change from "washing-out" furth-er. up the network due to loss of only one of therequisites.
5

- .
Title I
4MI ell
Al
0 US
q1=1
I
Grf 2 Gr. 3 Gr. 4
Results in Achievements of:
2 3
2A 36,
2 3
a
4
I
I
I
4A'
4 I
1
6
Gr. 2 Gr. 3
Results in:
2 3L

f.
So
In caseA, the change was not propagateddiagonally because the historic achievementindicates a lag in only the center subject. Incase B, the change was propagated up by theearlier second grade achievement in the topsubject, but was not propagated down becauseno network link was provided.
5) Only estimates of standard improvementsare forecast by the network. No attempt hasbeen made to analyze the historic data for en-hancing effects which would allow faster achieve-ments due to superior facilities or teachersfurther up the network. In other words, thenetwork is sensitive to the correction of achieve-ment gaps or deficiencies, but will not in itspresent simplified form reflect improvementsfrom average to superior levels.
kts-ationEach of the decision rules is applied at each of the network
nodes beyond the nodes affected by Title I. A_chievement perform-ance is predicted for each population segment carried in the model.Drop-outs, secondary school course of study requirements, andexpected graduates are based on.the predicted performance.
Display
The "shadow effect" of early achievement failure and itsremoval or reduction after Title I programs will be displayedas shown in Figure I. The numbers represent level of achievementin terms of grade. The x's are used for graphical purposes to re-present the shadow.
-7

V
*Before Title I:
Reading
Language
Soc. studies
Mat h
Science
FIGURE ILONG RANGE EDUCATIONAL EFFECTS
Low Income - Negro
x x x x x x x x x x x xxKx xlx xlx x2x x2x x3x x3x x4x x4x x4x x4x x4xx x x x x x x x x x x x
x x x x x x x x x x x xxKx xlx x1X x2x x2x x3x x3x x4x x4x x4x x4xx x x x x x x x x x x
x x x x x x x.xxlx x2x x3x x4x x4x x4x x4x x4xx x x x x x x x
x x x x x x x.x x x x xxKx xKx xlx xlx x2x x2x x3x x3x x4x x4x x4x x4x.x x x x x x x x x x x.
'XIX XiX AX XIX XiX AX XiX XiX4 5 6 7 8 9 10 11 12
grade
Title I Program: Headstart for Low Income - Negro
Reading
Language
Soc. studies
Math
Science
x x 'x x1 2 3 4 5 6 7 8 x8x x8x x8x x8xx x x x.
x x x x x x x2 3 4 5 x5x x6x x7x x7x x7x x7x x7xx x x x x x x
x x x x x x5 6 x6x x6x x7x x7x x7x x7xx x x x x x
xnx x x x x x x x x xxxKx xlx x2x x3x x4x x5x x6x x7x x7x x7x x7x x7x
x x x x. x x x x x x x xx.x x x x x x xx3x x4x x5x x6x x7x x7x x7x x7x
1 2 3 4 5 6 7 8 9 10 11 12grade
The shadow cast over the entire performance before headstarthas been partially removed. Remedial Arithmetic would further increase'achievement bit secondary school failure may still be possible due to lowrelative achievement and poor attitude towaxd school.

.
i . ;THE USE OF ACHIEVEMENT TEST SCORES
)
The achievement test scores to be used as data by the model (e. g.Standford Achievement Test, STEP, Iowa MP, etc.) will provide statisticaldistributions of scores by grade or age level. For example, the typicallyexpected level of achievement of fourth graders in reading will be the meanlevel of achievement for the fourth grade. A student who scores, let ussay, one standard deviation below the mean can be classified as a thirdgrade reader; two standard deviations above, might constitute a sixth gradereading ability.
Each of the student types has a set of achievement scores (gradelevels) for each grade determined from historic records. When the 'rawdata are in terms other than grade level--for example, grades or percentile s7-the 'scores are converted to grade level before being used in the model.
The network propagation results are maintained for each student typeindependently and can be combined later for a presentation of mean achieve-ment and distribution by grade or age. Student types are defined as the basesOf white (W) vs. non-white (N) and family iacome above $2, 000 vs. below $2, 000.

4'
COURSE OF STUDY SELECTION SUBROUTINE
Early in his high school years the student may choose a course ofstudy designed to prepare him for college, for 'commerce, or for the voca-tions. Some students develop their curriculums within these courses ofstudy while others select a general course of study. The "Course of StudySelection Subroutine" indicates changes in Title I apportionment of studentsamong the courses of study. .
After a Title I input, students are allocated among the courses ofstudy by reconciling the demand for each course of study with the supply ofslots in that course of study. The student choices are made from a list ofthose courses of study fOr which he has the required record of achievement.
The student eligibility and preference for a course of study are basedupon his characteristics. However, restricting the definition of studenttypes to the average (mean) of the distributions of characteristics precludessimulating the process by which the various individuals within a student typeselect different courses of study. Therefore, it is necessary to distributethe characteristics which determine eligibility and preference along a dis-tribution the shape of which is a judgmental input.
The minimum standards for eligibility are expressed in terms of re-quired minimum levels of previous student achievement. The allowed studentchoices are those for which the student, generated from the distribution ofcharacteristics for the student type, meets the minimum requirements. Alist of allowed courses for that student is thereby created.
The student makes his actual choices from this list of allowed choices)upon the basis of his attitude toward education. The course of study which ismost compatible with the student attitude toward education is chosen.
The choices of individual students are aggregated to determine thetotal demand for the available openings in each course of study. A check ismade to determine if the demand for any course of study is greater than thesupply, the excess demands are eliminated by allocating the appropriatenumber of students among the unfilled openings according to their secondpreferences for allowed choices. An output report is generated when thereis unfilled demand.
a
10

s
FORM DISTRIBUTIONOF ACHIEVEMENT &ATTITUDE FROMMEANS AND STAND-ARD DEVIATIONS
After supply and demand have been reconciled, or if the demanddoes not exceed the supply for any course, the changes in the apportion-ment of students among the courses of study is determined, by comparingthe Title I. apportionment with the historical apportionment.
1
INSTRUCTIONALPROCESS
SUBMODEL-CHANGES IN
ACHIEVEMENT
CHANGES N ATTITUDETOWARD EDUCATION
1111
1 11.111
ELIGIBILITY DATA
STANDARDS FOROURSE, OF
STUDY (BASE
CHANGES IN .
ALLOWED CHOICES
SUPPLY OF OPENINGSCHANGES INSTUDENT DEMAND
IN COURSES OFDATA t STUDY
UNSATISFIEDDEMAND
BASE
libmwororms maws.,
411410M=1.11.
1
-HISTORICAL APPOR-TIONMENT OF STU-DENTS AMONG THE
NEW APPORT-IONMENTAMONG THECOURSES OFSTUDY
TITLE I CHANGES INAPPORTIONMENT
.4.
COURSES OFSTUDY
COURSE OFSTUDY ENROLLMENTS
SCHOOL FLOW MATRIX
1

C.
. THE TRUANCY SUBROUTINE
i
The truancy subroutine computes an index of truancy for thegrades 9 - 12. The truancy index is used to compute dropouts.
Research Findings
The following findings summarize the elements considered in ourmodel of truancy.
Self
A study of truants (1) studied 338 truant students in San Fran6sco.Sixty percent of the students were boys. Their I. Q. 's averaged belownormal. Average I.Q. for their schools were 100; their curve 95 (range43 - 153). Student had low opinions of self, felt isolated.
School
53% of student s were in junior high school17% elementary30% high school70% had been left back at least once and were below averageAll achieved an average of-C grade or below.
Home4. 45% of the students came from disrupted or broken homes
50% of families received public, assistance.
OutcomesTruants were treated by case workers. Younger students in elcinc.n-
tary levels improved their attendance rates after treatment. Older studentsshowed no improvement.
SummaryBoth this study and a British one (2) agree that the truant's family
situation is poor economically and interpersonally. The school situation ispoor: the student performs below average grade-wise and has been leftbehind. He responds by being out of school approximately 3 times as oftenas the non-truant.
(1) John 14. Roberts, "Factors Associated with Truancy", Personnel andGuidance journal, March, 1956, pp. 431-436.(2) .Maurice J. Tyerman, "Research in Truancy", British Journal of
tional November, 1958, pp. 225-229.
-12
.

r
ir
The. Model of Truancy
The following figure depicts the factors considered in computingthe index of truancy. The factors are weighted and combined into an indexof likelihood of a change in truant behavior. The index is compared to athreshold and will determine the actual change passed along to the dropoutsubroutine.
Equations for Computation
The change in truancy for grades 9 -12 caused by a Title I programis computed as:
where:
T = a *t, g o 1 EP + E csp cs >7% CS
CS
ATto.g = change in truancy for student type (t) and grade (g)
AAp, t, g, cs
,Ar.Et, g, cs
= change in target group achievement by category (p)type (t), irade (g) and course of study (cs).
change in target-group Self-Esteem
ao = Scaling parameter
a1, a2 = weighting coefficients

II
TRUANCY SUBROUTINE.
INDICATORS OF POTENTIAL TRUANCY
4.r
EXT...4 PREVIOUS NON-I PROMOTION
i
I
I
I"EXT. 1
1
STRESS.IN FAMILY 1_,...1I
EXT,......1 LOW FAMILY IN-1 COME
iIOW IOW SOW IMO NOW MoS IWO . MOO SO MOM
1
I
I
s
IUMW OMO MOM a SSW WS SUM ONO IBM WM MOO
1 LOW ACHIEVEMENT 1........IP.I LEVEL RELATIVE TO 1
TARGET GROUP. INORM .
iI LOW SELF-ESTEEM I.......IP.I
-i I
ILao ONNO SS ..0 f/UMW 01110 IWO WOW WM WW1 SWO
Q vi
COMPUTE INDEXOF LIKELIHOOD OFA CHANGE IN TRU-ANT BEHAVIOR
TRUANCY(20% ABSENCE)
THRESHOLDFROMRESEARCH
TO DROP-OUT. SUBROUTINE .
1

.14
).
DROPOUT SUBROUTINE
The change in dropouts as a result of the application of a Title Iprogram is computed for each of the grades between 9 and 12 for each ofthe student types. The change is basically the difference between the his-torical dropouts who attended the school affected by Title I, and thedropouts anticipated from the neighborhood school after Title I.
Research Findings-.
The chief variables pointing to dropouts are:
Homeoweliproormo
School
.
1. Family of Dropout.a. Dropout rate of parentOne study revealed that 78. 5% of mothers dropped out.80. 3% of fathers dropped out.Majority of parents had completed 9th grade or less.(Percy V. William's, "Dropouts", NEA Journal,Feb., 1963, 11-12.)
b. Dropout rate of siblings58% of dropouts come from families where all biothersand sisters dropped out.(Eli E. Cohen, "The Dropout Problem., A Crowing Edu-cational Concern", National Association of SecondarySchool Principals Bulletin, April 1961.)
2. Occupation of ParentMajority of parents of dropouts were unskilled or unemployed.(Morris Williams, "What Are the Schools Doing about SchoolLeavers", NASSP Bulletin, XXXVII, 1953, p. 54.)
3. Divorce Rate in FamilyMany dropouts come from broken homes.
ir
4. ReadingRuth Penty studied 1169 ninth graders entering 10th grade- -593 in poorest quartile and 593 in top quartile as readers.(Poor readers ranged 4. 3 - 6. 9 on reading test per gradelevel. )49. 9% of the poor readers and 14. 5% of the good readersleft school in the lath grade.
-IV-

45.5% of the poor readers graduated as compared to81.2% of the good readers.Dropouts peaked in 10th grade.(Ruth C. Penty, Reading Ability of High School Dropoutst .
New York, Teachers' College, Columbia University, 1956. )
5. SubjectsMost dropouts are failing.Most failures occur in 1st, 2nd knd 9th grades.
Dropoutsticipa...te in extra curricular schoolactivities.85% rated low in participation60% isolated
(Livingston A. Hugh, "High School Graduates and Dropouts,A New Look at a Persistent Problem, " School ReviewLXVI (1958) 195-203)
7. AttendanceMore truancy and more long periods of absences indropout than graduate history.
8. TransferMany dropouts transferred from other schools..More transfers than in graduate population.
9. Dropout has few friends in school, associates With olderyoungsters and does not feel he belongs.
Variables not important between dropouts. and non-dropouts:1. 0. Penty study showed median I. Q. of dropouts average--notsignificant difference from graduating groups.(Bert I. Greene, Eastern Michigan University's Work Shop on theDropout, Eastern Michigan University, 1963.)
Model of Dropouts
The figure on thil following page depicts the interaction of the basicfactors used in the model. Community characteristics describing theeconomic advantages available in the community are compared with studentattitudes and behavior to predict the change in dropouts.

r
Com
%) h
i VT
YC
lihR
AC
TE
Rt S
T1C
Sem
s on
eW
eb W
m*
OM
OM
ail
firlis
Moo
awl
Err
111
,4 C
O. M
S ti
ST
RA
T 0
%3
vOtW
tt.)
CoN
lkO
r4rr
YI
1
.r
.
I;E
rrivo
or
MA
LLS
Wu°
I tA
RE
EM
PLO
YE
D1
I.
1
ExT
......
1 F
AM
ILY
Zrz
.E.
.1-
(mum
ME
.ik o
r to
sPE
MD
E:ta
rs)
I.
1
EX
T-1
Pto
PLE
Ptil
t Roo
tA
I
MIN
S41
11=
1). O
ne A
MM
O 1
1111
1.al
iaeo
n, a
ol o
re1
ON
O
TA
Rot
.)G
lk 1
14S
TF
LVC
Tto
4AL
PR
oCeS
S M
OD
EL.
.
5TV
DE
141"
CIA
RR
AC
TE
RIS
TIC
S
DR
oroa
ra I
Rov
TIN
IE.
ecom
owc
tom
ytum
rs'Y
Nov
AN
.vrik
SF
.C
P0.
..eU
taro
1 11
. .11
airy
aw
n M
OW
ED
em
ail 1
anal
* *a
.m. 6
.741
4I1
OM
NI e
nvie .1
4.cC
IA1C
:VE
MC
-.M
Tvs
sAvi
s 'T
A-R
GE
T G
RO
UP
NO
RM
AC
1 S
pace
. RP
TC
.
.1IP
I
EX
TI
ip
AT
TIT
UD
E T
OW
AR
D S
CM
Oot
..
.
ttOM
DM
IC. C
oMiu
tth4I
TY
Avv
kAT
AG
E L
EV
et.
NJe
stV
rtt4
G7
FRO
MR
ESE
AR
CH
OR
31)
DG
ME
INIT
A.m
ouN
rr O
FE
XT
RA
-CLA
RK
-V
IAR
AC
TIV
ITY
1+ I I1+
PEE
R G
RO
UP
°let
t)?
ovi-
RA
-re
.I
11.1
TE
.G-R
AT
1ox)
--A
LIE
optr
tota
. LE
VE
:t.
N-1
iS
TR
CS
S L
EV
EL
11.1
FA
MIL
YU
rn ..
. 1 S
imim
b el
mob
4~0.
111
1b II
NN
som
e
1 1-
OM
NI
.111
111
11
.111
110.
111.
1111
.111
1.11
.WIN
NO
MM
OR
EM
EN
IMM
INII
IIII
IIM
ININ
IM
c....
4,1.
. ....
...i..
..::.:
. ...
TA
RG
C-x
' Pot
-Jot
-A-r
ib'
vict
eb 1
111,
1A00
6gA
AC
% 1
(Cfi
ri
D E
.111
1.Ja
vk4
WA
R S
t Ak1
CO
MM
) ',M
Y D
RO
POU
TL
EN
, E L
.pa
emA
CT
IOkl
.
cow
AV
t..1%
Ty
Dft
povf
PrO
PEN
ISIT
y
FDR
oPov
arr:
13C
.M10
1.1
FUN
C.T
07.3
ST
Ute
hn.
AT
TIT
VoE
4aN
IVIR
eo.)
mst
ager
EV
ALv
AT
oR
DA
oPou
gt°
S T
ooet
rr P
I oP
emsr
rY.
TO
Voa
tSK
IstG
%; s
cAbo
t. .4

s
1'
.,
Dropout Decision Function
We define the dropout decision function, e = e(s) where s is anystudent, and
e >0 implies that student s drops out,
0 implies that student s stays in.
0 = D(A) (KD PD - Kr P1) + Ko
wheie A is the present age of student s;D(x) is the probability that a student who is going to drop outwill drop out at age x;
PD is the community dropout propensity;
PF is the student's propensity to finish high school;
and KD,KF, Ko. are appropriately chosen constants,
KD > 0, KF > 0.

GRADUATION COMPUTATION
We wish to compute the expected change in the number of graduatesto be expected fromincreased academic achievement in the Title I targetgroup. Basically, we need several historically derived sets of data.
t
1. The numbers of last year's graduates who were previouslyenrolled in the target population school by student type ;
2. The set of minimum acceptable achievement levels by categoryfor graduation.
3.. The number of students directly affected by Title I by studenttype.
4. The propagated achievements of the target grotip in thetwelfth grade.
The equation for the expected graduation change is:
A GRAD = Nt - GRt if ( 5 [DIM (Ap, 12, t, cs Gp)p, cs
where:
GRADS = Change in graduates by student type (t)
Nt = Number of students by type in the target population.
GRt = Last year's graduates from the target neighborhood schoolsby student type.
Ap, 12, t, cs =Propagated Achievement by category (p), for thetwelfth grade (12), by student type (t), and bycourse of study (cs)
G Minimum acceptable achievement by category for graduation.
DIM = function which computes the positive difference or zero.
-19

NATIONAL CENTER FOR EDUCATIONAL STATISTICS
Division of Operations Analysis
A COST-EFFECTIVENESS MODEL FOR THE
ANALYSIS OF TITLE I ESEA PROJECT PROPOSALS
PART III
THE INSTRUCTIONAL PROCESS SUBMODEL
Prepared for the Division of Operations Analysis
by
Abt Associates, Inc.Under Contract No. OEC 1-6-001681-1681
Technical NoteNumber 16
December 9, 1966
OFFICE OF EDUCATION/U.S. DEPARTMENT OF HEALTH, EDUCATION, AND WELFARE

NATIONAL CENTER FOR EDUCATIONAL STATISTICSAlexander M. Rood, Assistant Commissioner
DIVISION OF OPERATIONS ANALYSISDavid S. Stoller, Director

PREFACE
This Technical Note is the third part of El seven-part issue
which describes a Cost-Effectiveness Model for the analysis ofTitle I ESEA Project Proposals. The seven parts are:
TN-14 Part I - An Overview of the Cost-Effective-ness Model and Submodels for the
Evaluation of Title I ESEA Proposals
TN-15 Part II - The School Submodel
TN-16 Part III- The Instructional Process. Submodel
TN-17 Part IV - The Community Submodel
TN-18 Part V - The Cost Submodel
TN-19 Part VI - The EffectivenesS Submodal
TN-20 Part VII- The Simulation
The model was developed by Abt Associates, of Cambridge,
Massachusetts, for the Division of Operations Analysis, National
Center for Educational Statistics, under contract number OEC 1 -6-001681- 1681.

THE INSTRUCTIONAL PROCESS SUBMODEL
From the Cost-Effectiveness Model overview it should beapparent that the principal thrust of a Title I .project is directed atthe student himself. Notwithstanding the impact of Title I funds onthe community as a whole, the primary 'emphasis of Title I is theimprovement of individual personalities and achievements. As a resulta fundamental process in the overall Education Cost-EffectivenessModel is the determination of the differential scholastic effects ofalternate Title I proposals. This r:oniputation is carried out by theInstructional Process Submodel (t.-ce Chart I), which accepts thechanges in the school environment wrought by the proposed project,and converts these changes into expected educational outcomes. Theseoutcomes are then sent on to the School Submodel, where they are aggre-gated and their effects projected over time, and similarly to the CommunitySubmodel where they affect the community propensities for social andcultural change. Underlying the Instructional Process Submodel isthe hypothesis that the culturally-disadvantaged child initially fails inschool because he is not sensitized to the scholastic environment.The student perceives his immediate world as the only relevant one,and that the language forms and cultural norms extant in the classroomare totally remote. He falls behind very early in his scliool career,receives no incentive to make up the gap, falls back even further, andoften drops out of the system altogether. Title I is devoted to thereversal of this trend, and some of its effects are estimated in theInstructional Process.
Charts II and III illustrate the logic of the Instructional ProcessModel. Title I Project Description data is received by the SchoolSubmodel, and makes changes in both the curriculum and operatingconditions. Then the School Submodel compares the pre- and post-Title I conditions, and the differences are used to evaluate the extent towhich the target population will become more sensitized to the academicenvironment. The sensitivity indicators are what may be called "Learning

''14
f14,
`,11
.N't
INPU
TS
TIT
LE
IPR
OG
RA
MS
USE
R
JUD
GM
EN
T
I L
ON
IMM
OI1
MIN
IM
DA
TA
BA
SE
NO
INM
EM
.MIN
,NY
'AV
X, \
i",/
",,.
Vfh
CO
ST -
EFF
EC
TIV
EN
ESS
MO
DE
L O
VE
RV
IEW
Mim
sM
M..
Sa
SCH
OO
L
V
>1
INST
RU
CT
-IO
NA
LPR
OC
ESS
S
CO
ST
CO
MM
UN
ITY
INT
ER
-A
CT
ION
S
OU
TPU
TS
..
CO
MPU
TE
R S
IMU
LA
TIO
N
1111
1111
11iii
lv
EFF
EC
TS/
.C
OST
S
cif/
Mam
e/6.
RO
41
STU
DE
NT
-
A A
CH
IEV
EM
EN
TS
Q, A
TT
ITU
DE
S
SCH
OO
LA
GR
AD
UA
TE
SA
AT
TE
ND
AN
CE
.d
DR
OPO
UT
S
CO
MM
UN
ITY
,E
AR
NIN
G P
OT
EN
TIA
L,
EQ
UA
LIT
Y, E
FFI.
LC
AC
Y, C
ON
FLIC
T,
INV
OL
VE
ME
NT
,G
UL
7UR
AL
PA
RT
I-C
IPA
TIO
N, C
RIM
E
EFF
EC
TS/
$V
AL
UE
S/$
EFF
EC
TS/
RE
SOU
RC
EV
AL
UE
S /R
ESO
UR
CE
CH
AR
T I
v.,
A.
.,:'

PAST
PRE
SEN
T111
wm
ilo
FUT
UR
E
WH
AT
WE
RE
TH
ESC
HO
OL
AN
DST
UD
EN
TS L
IKE
LA
ST Y
EA
R ?
V
WH
AT
DID
TH
EY
AC
HIE
VE
?
I 111110
qs
.
INST
RU
CT
ION
AL
PRO
CE
SS
.....:\-
WH
AT
AR
ET
HE
\.
DIFFE
RE
NC
ES
TH
IS' YE
AR
?
P
-VO
W W
ILL
EX
PEC
TE
DA
CH
IEV
EM
EN
TS D
IFFER
FRO
M PA
ST R
ESU
LT
S?
=111111
WH
AT
FUR
TH
ER
DIFFE
RE
NC
ES
WIL
L T
ITL
E .1
VA
KE
?
(-HO
WW
ILL
TH
ESE
CH
AN
GE
S AFFE
CT
TH
E ST
UD
EN
T'S
PER
SON
AL
ITY
AN
DA
TT
ITU
DE
S ?..w
ma
CH
AR
T II

. .
TIT
LE
IT
AR
GE
T G
RO
UP
CU
RR
EN
TSC
HO
OL
DA
TA
HIS
TO
RIC
SCH
OO
L D
AT
A
1.
INST
RU
CT
ION
AL
PR
OC
ESS
111
0.11
111M
OV
ER
VIE
W
4111
0111
10al
mill
ill.1
101
11II
MII
III
~1
TIT
LE
I C
UR
RIC
UL
UM
1
IA
ND
/OR
iO
PER
AT
ING
CO
ND
ITIO
NS
1I
11.
0011
11m
ow.
(
EM
PIR
ICA
L R
ESU
LT
SJU
DG
ME
NT
PA
RA
ME
TE
RS
OO
PER
AT
ION
S
oC
AT
AL
YST
S
e A
CH
IEV
EM
EN
TC
ON
VE
RT
ER
. . -
>E
XPE
CT
ED
CH
AN
GE
(A
)IN
AT
TIT
UD
E
4'
(AN
D)
EX
PEC
TE
D C
HA
NG
E(a
).IN
AC
HIE
VE
ME
NT
FO
RT
AR
GE
T G
RO
UP
CH
AR
T n
-a

CU
RR
ICU
LU
M A
ND
.
OPE
RA
TIN
G C
ON
DIT
ION
S
MIIM
IDm
iaow
..1
1111
1111
.
I I
INST
RU
CT
ION
AL
PR
OC
ESS
DE
TA
IL
;ST
UD
EN
TSO
CIO
LO
GY
AC
HIE
VE
ME
NT
S
IC
UR
RE
NT
......
..
CU
RR
EN
T1
>H
IST
OR
IC> -7
......
.....
......
......
..E
MPI
RIC
AL
IR
ESU
LT
Si
&I
RE
SEA
RC
H&
I
1 I
HIS
TO
RIC
!..-
r-O
PE:::
.2%
T I
ON
S
JUD
GM
EN
T[
AC
HIE
VE
ME
NT
1C
ON
VE
RT
ER
i-T
ITL
EI
IC U
RR
IC *
CIL
UM
'1
AN
D /O
RO
PER
A T
ING
I C
ON
DIT
ION
S,
I
.11
1.
' 6.-
>A
TT
ITU
DE
TT
ITU
DH
IE V
EM
ET
t,
CH
AR
TII
I

r
catalysts," or accelerators of the learning process, These "catalysts"consist of a set of personality characteristics which, if stimulated atcertain stages of the student's development, will greatly enhance hiseducational productivity. (See Chart IV.) Expected change in studentproductivity is computed in Scholastic Achievements as measured bystandardized tests. * These test scores, in addition to the changesin learning catalysts, are the outputs of Instructional ProcessSubrnodel, and the fundamental indicatdrs of the Title I impact on thestudent population (See Chart V).
Clearly, the mathematical equations that transform changes inthe environment to changes in student attitudes, personality, andachievements are difficult to formulate on the basis of current research.Consequently, these relationships will initially be calibrated with empiricaldata collected from school records, and, if possible, from Title I CaseHistories.
First, the curriculum node to be affected by Title I is defined(by subject, grade, student types, teacher/student ratio, and timeallocation). Then, assuming-the subject is not new to the school, thesame curriculum node characteristics are defined for the previous year.If there are no differences between curriculum node descriptions forboth the past and the present year, then the same amount of achievementchange for each student type as occurred last year can be expected.On the other hand, if the student populations, or the curriculum contents,or the operating conditions, are different for the two nodes, then thesedifferences can be correlated with the learning catalysts, and these inturn with scholastic achievements. The model will then compute theexpected outcomes, and these can be checked with the actual achievementsof the previous year's student population. The internal relationshipsamong model variables can thus be calibrated by successive tuningsuntil the predictions approximate the empirical results. When Title Iis introduced, these same relationships are assumed to hold, andenvironmental .changes are siniiia rly c:nverted into expected educationaloutcomes.
*Stanford Achievement Test for Elementary and Secondary, Metropolitan .
Readiness for Kindergarten.

A.
Def
initi
on:
Lea
rnin
g ca
taly
sts
child
dev
elop
men
t,
Age
inY
ears 20 19 18 17 16 15 14 13 12 11 10 9 8 6 5 4 3 2 1
LE
AR
NIN
G C
AT
AL
YST
S
are
attit
udes
and
per
sona
lity
trai
ts w
hich
, if
stim
ulat
ed a
t cer
tain
sta
ges
ofw
ill f
acili
tate
pro
duct
ive
resp
onse
s to
a s
chol
astic
env
iron
men
t.o'
er o.4
"..0
,c.
z.-e
-0.
-19,
.9.
.N.
oe'
°ov
., ,0
%.,-
ic,
41.'/'
el4,
N7
c.0-
Aef
cos
*-1
)0' _
o oi
ve.
4`'
co,..
.,.
,.....
..ca
_,-,
...,
4 00
.A
e,*
4Ic
s .4
74.-
v-v
is".
-'ic
,'t
>-(
z,
KA
...c.
4-
.%
,--A
-.,..
. czy
;No
N.s
,N'
0'..-
100
otv
ic...
oc7
Qo
.y07
4N
,g,
oz0.
S;N
,c)
cog,
. 0oi
014
;%'
ON
1CV
'0'
9%N
CP
.0i
0e,
Cs
+e,
zt.
Az
0,
k5`'
CC
"S tc
-;.0
44'C
`O
c' c
reA
It
VIP
°le
.9
"?`v
0° 4
redz
.r
N,tP
,1:-
c.%
,2P
S.
B.
CR
ITE
RIA
FO
R I
NC
LU
SIO
N:
Lea
rnin
g ca
taly
sts
mus
t sat
isfy
at l
east
one
of
the
follo
win
g fo
ur c
ondi
tions
:1.
Mot
ivat
e th
e st
uden
t to
take
ris
ks in
are
as o
f un
cert
aint
y;2.
Acc
eler
ate
the
stud
ent's
soc
io-e
mot
iona
l dev
elop
men
t;3.
Sens
itize
the
stud
ent t
o th
e le
arni
ng c
ues
of th
e cl
assr
oom
;4.
Exp
edite
the
.stu
dent
's "
lear
ning
to le
arn!
' (he
uris
tics)
.
ay*
CH
AR
T I
V
Age
inY
ears
20 19 17 16 15 14 13 12 11 10 8 7 6 5 4 3. 2 .1

INST
RU
CT
ION
AL
PR
OC
ESS
OU
TPU
TS
MO
DE
L O
UT
PUT
VA
RIA
BL
ES
1
STA
ND
AR
DIZ
ED
TE
ST. M
EA
SUR
ES
TE
STG
RA
DE
TE
STIN
GT
IME
(MIN
.).
MA
JOR
AR
EA
S M
EA
SUR
ED
1. 2. 3. 4. 5. 6.
't co I1. Z
. 3. 4. 5: 6. 7. 8. 9. 10.
11.
12.
7. .
AC
HIE
VE
ME
NT
SR
eadi
ngL
angu
age
Mat
hem
atic
sSc
ienc
eSo
cial
Stu
dies
Mec
hani
cal
.,
AT
TIT
UD
ES
AN
D P
ER
-SO
NA
LIT
Y T
RA
ITS
.
Bas
ic T
rust
Cur
iosi
tySe
lf-E
stee
mN
eed-
Ach
ieve
men
tPe
rcep
tion
of E
duca
tiona
lO
ppor
tuni
tyE
mpa
thy
Con
fide
nce
in a
Log
ical
Wor
ldPe
rcep
tion
of S
ocio
-E
cono
mic
Opp
ortu
nity
Anx
iety
Nee
d-A
uton
omy
Cog
nitiv
e St
yle
Nee
d-A
ffili
atio
n
-
-1
I i
-
Met
ropo
litan
Rea
dine
ss.
Stan
ford
Ach
ieve
men
t-
Ele
men
tary
Lev
els
- H
igh
Scho
ol L
evel
.
Kud
er P
refe
renc
e R
ecor
d-
Voc
atio
nal
- Pe
rson
al.
- O
ccup
atio
nal
Stro
ng V
ocat
iona
l Int
eres
tB
lank
.
Cal
ifor
nia
Tes
t of
Pers
onal
itySR
A I
nven
tori
esT
hem
atic
App
erce
ptio
n T
est
Ros
enzw
eig
Pict
ure,
-Fr
ustr
atio
n St
udy
.
STA
ND
AR
ME
NT
TE
K-1
1-9
9-12
IER
SON
AIT
UD
E A
.ST
IN
VE
9-12
9-12
.9-1
2
11-1
2
K-1
2
4-12
K-1
2K
-12 .
.
AC
HIE
VE
TS 60 12
7-25
5
282
ITY
, AT
-D
IN
TE
R-
TO
RIE
S
40-5
0
40-5
020
-30
40 40-6
0
30 100
,
15
.
- ,
Rea
ding
rea
dine
ss a
ndnu
mbe
r re
adin
ess
Rea
ding
, ari
thm
etic
,la
ngua
ge, s
cien
ce, s
ocia
lst
udie
s, w
ork-
stud
y sk
ills
Rea
ding
, mat
hem
atic
s,la
ngua
ge, s
cien
ce, s
ocia
l.st
udie
s, s
tudy
ski
lls
Gen
eral
voc
atio
nal i
nter
est
Types
of s
ocia
l rel
atio
nsSc
ores
for
occ
upat
ions
Scor
es f
or o
ccup
atio
ns,
gene
ral v
ocat
iona
l are
as,
and
spec
ial a
reas
.
Pers
onal
ity, a
ttitu
des
.
.
CH
AR
T'V
.
.
.-
.
.

Schematic representations of the model logic are given inCharts VI and VII. In the first chart, student characteristics,operating conditions, and curriculum descriptions for pre- and post-Title I school environments are compared, related to the appropriatelearning catalysts, and evaluated for their ultimate impact. In thesecond chart changes in learning catalysts are used to modify thehistoric or ba se-line achievement gains mentioned above. In bothcharts, Title I Projects have been subdivided into a "curriculum"category, for all subject matter related programs, and an "operatingconditions" category, for all service related activities. Differencesin student characteristics are determined by comparing the historicstudent populations with the Title I target group.
A more detailed, example of how a changed learning catalyst canaffect scholastic achievement is presented in Chart VIII. If the catalystcalled EMPATHY (the ability to take another person's point of view) isstimulated between the ages of six and nine, the corresponding effectson three appropriate achievements (Mathematics, Social Studies, andLanguage) are computed from the empirically set relationships. Thechoice of appropriate ach'evement§ is made from both qualitative andquantitative research results, just as the choice of the appropriatecatalysts affected by environmental changes is derived. These choices,and the relative weights associated with them, are subject to userjudgment and modification. They also imply needed research areasand, sincO they are flexible, can be adjusted at any time with the dis-covery of more precise empirical results.
The last chart (number IX) identifies the required input categoriesfor the operation of the Instructional. Process Submodel. There are fourof these: Title I Project Descriptions, Title I Case Histories, CurrentSchool Data &Historic School Data, and Research, Theory, and UserJudgment. Each is given with some exemplary data and the sourcefrom which the data is derived. Special attention has been paid to dataavailability and an attempt has been made to exploit to the fullest the mostaccessible data, and to avoid the problems of sensitive data collection.
To recapitulate, the problem for the Instructional Process Subrnodelis "How much will each Title I Project affect the achievements and
9-

STU
DE
NT
TIT
LE
ISO
CIO
LO
GY
HIS
TO
RIC
SOC
IOL
OG
Y
RE
SEA
RC
HFI
ND
ING
S
A D
AT
A
TY
PIC
AL
LO
GIC CA
TA
LY
ST
OPE
RA
TIN
G C
ON
DIT
ION
Sa.
.1"
--:
TIT
LE
IC
UR
RE
NT
YE
S
VA
NY
A T
s
TH
RE
SHO
LD
?
.1..\
YE
S
CU
RR
ICU
LU
M
TIT
LE
IC
UR
RE
NT
NO
,
YE
S
>(
RE
SEA
RC
H
EM
PIR
ICA
LR
ESU
LT
S
......
......
......
......
.-_-
......
..R
EL
AT
EA
isT
O>
6A
PPR
OPR
IAT
EC
AT
AL
YST
S
CO
MB
INE
A ts
AN
D C
OM
PUT
Ed
CA
TA
LY
STS
CH
AR
T V
I

TY
PIC
AL
LO
GIC
AC
AT
AL
YST
>-
AA
CH
IEV
EM
EN
T
AC
AT
AL
YST
A
RE
SEA
RC
HC
AT
AL
YST
JUD
GM
EN
TN
TH
RE
SHO
LD
?
YE
S
NO
CO
NV
ER
T A
CA
TA
LY
STR
ESE
AR
CH
)T
OSE
T O
F A
AC
HIE
VE
ME
NT
SJU
DG
ME
NT
EM
PIR
ICA
L R
ESU
LT
,>
CO
MPU
TE
CO
MPO
SIT
ER
ESE
AR
CH
, JU
DG
ME
NT
IMPA
CT
ON
EX
PEC
TE
DA
CH
IEV
EM
EN
T
NI/
CO
MB
INE
SE
T A
ND
STO
P
CU
RR
EN
Tj
AC
HIE
VE
ME
NT
.
iHIS
TO
RIC
AC
HIE
VE
ME
NT
CH
AR
T V
t.

EFF
EC
T O
F A
CH
AN
GE
D L
EA
RN
ING
CA
TA
LY
ST' O
N A
CI-
IIE
VM
EN
T
TIT
LE
I
TE
AC
HE
R.
CH
AR
AC
TE
RIS
TIC
S
STU
DE
NT
SOC
IOL
OG
Y
SCH
OO
LI
CU
RR
ICU
LU
M... t.,
AN
D O
PE R
--.
->.
)I
A T
ING
CO
N-
DIT
ION
Si
I
/
..--;
.-.-E
MPA
TH
Y -
AT
EA
CH
ER
EM
PAT
HY
A F
AM
ILY
EM
PAT
HY
LN
EIG
HB
OR
HO
OD
PEE
RSO
CIA
LIN
TE
RA
CT
ION
ASC
HO
OL
PE
E
WE
IGH
TE
DC
OM
BIN
AT
ION
SOC
IAL
IN
TE
RA
CT
ION
/4. /
HIS
TO
RIC
AL
OPE
RA
TIN
GC
ON
DIT
ION
SR
ESE
AR
CH
-JU
DG
ME
NT
AO
TH
ER
LA
CA
TA
LY
STS
4
WE
IGH
TE
DC
OM
BIN
AT
ION
RE
SEA
RC
H -
JU G
ME
NT
EIG
HT
S
AC
HIE
VE
ME
NT
S
A M
AT
H
A S
OC
. ST
UD
Y
A L
AN
GU
AG
E
CH
AR
T V
III,

INPU
T C
AT
EG
OR
Y
1.T
ITL
E I
PR
OJE
CT
DE
SCR
IPT
ION
2.T
ITL
E I
CA
SEH
IST
OR
Y
CA
I3.
CU
RR
EN
T A
ND
HIS
TO
RIC
AL
SCH
OO
L D
AT
A
4.R
ESE
AR
CH
, USE
RJU
DG
ME
NT
...pr
p-in
amm
TIM
PIN
EIR
IPN
IEN
EW
ES
INST
RU
CT
ION
AL
PR
OC
ESS
INPU
TS
DA
TA
EX
AM
PLE
SSO
UR
CE
1 (A
) C
UR
RIC
UL
AR
CH
AN
GE
SI.
DA
TA
BA
SE(e
. g. T
EX
T, I
NST
RU
CT
ION
AL
TE
CH
NIQ
UE
,A
UD
IO-V
ISU
AL
S, S
UB
JEC
TM
AT
TE
R, W
OR
KE
XPE
RIE
NC
E,
etc.
)I(
B)
CH
AN
GE
S IN
OPE
RA
TIN
G C
ON
DIT
ION
S(e
. g. A
DD
ITIO
NA
L T
EA
CH
ING
PER
SON
NE
L,
GU
IDA
NC
E A
ND
CO
UN
SEL
ING
, FR
EE
LU
NC
H,
EX
TR
A -
CU
RR
ICU
LA
RE
NR
ICH
ME
NT
EX
PER
I-E
NC
ES,
etc.
)
2(A
) PR
!2V
IOU
S A
CH
IEV
EM
EN
TG
AIN
S B
Y C
UR
RIi
-2.
DA
TA
BA
SEN
OD
E A
ND
ST
UD
EN
T T
YPE
2(3)
PR
.IO
US
CU
RR
ICU
LU
M A
ND
OPE
RA
TIN
GC
iT I
ON
S
3(A
) SO
C:O
LO
GY
OF
(TA
RG
ET
PO
PUL
AT
ION
(e. g
.R
AC
E, F
AM
ILY
IN
CO
ME
, OR
GA
NIZ
A-
AT
ION
, SIB
LIN
G, B
IRT
HO
RD
ER
, NE
IGH
-B
OR
HO
OD
CO
MPO
SIT
ION
,et
c. )
3(A
) D
AT
A B
ASE
3(B
) A
CH
IEV
EM
EN
T L
EV
EL
SB
Y S
TU
DE
NT
TY
PE,
3(B
) SC
HO
OL
CU
RR
ICU
LU
M N
OD
E
4(A
) W
EIG
HT
ED
CO
RR
EL
AT
ION
SB
ET
WE
EN
CH
AN
GE
S IN
EN
VIR
ON
ME
NT
,A
ND
CH
AN
GE
SIN
LE
AR
NIN
G C
AT
AL
YST
S4(
B)
WE
IGH
TE
D C
OR
RE
LA
TIO
NS
BE
TW
EE
NC
HA
NG
ES
IN C
AT
AL
YST
S A
ND
CH
AN
GE
SIN
SC
HO
LA
STIC
AC
HIE
VE
ME
NT
SUB
MO
DE
L
4.D
AT
A B
ASE

attitudes of the target population?" The Instructional Process definesa set of learning catalysts which must be stimulated before anyaccelerated learning can take place. Title I projects change thecurriculum, or the operating conditions, or the student population,
. or combinations of these, and these changes activate the learning.....41-..i.....4."1.qm ca.sy D L.b If the catalysts are increased above a given threshold,then they will in turn affect scholastic achievements. These changesin scholastic achievements represent the impact of the Title I Projecton the student population.

ow.19--prlwro,rx, -t,, tm
NATIONAL CENTER FOR EDUCATIONAL STATISTICS
Division of Operations Analysis
A COST-EFFECTIVENESS MODEL FOR THE
ANALYSIS OF TITLE I ESEA PROJECT PROPOSALS
PART IV
THE COMMUNITY SUBMODEL
Prepared for the Division of Operations Analysis
by
Abt Associates, Inc.Under Contract No. OEC 1-6-001681-1681
Technical NoteNumber 17
December 9, 1966
r
,
1
a
OFFICE OF EDUCATION/U.S. DEPARTMENT OF HEALTH, EUUCATION, AND WELFARE
- ."

1
NATIONAL CENTER FOR EDUCATIONAL STATISTICSAlexander M. Mood, Assistant Commissioner
DIVISION OF OPERATIONS ANALYSISDavid S. Stoller, Director
PREFACE
This Technical Note is the fourth part of a seven-part issue
which describes a Cost-Effectiveness Model for the analysis of
Title I ESEA Project Proposals. The seven parts are:
TN-14 Part I - An Overview of the Cost-Effective-
ness Model and Submodels for the
Evaluation of Title I ESEA Proposals
TN-15 Part II - The School Submodel
TN-16 Part III- The Instructional Process Submodel
TN -l7 Part IV - The Community Submodel
TN-18 Part V - The Cost Submodel
TN-19 Part VI - The Effectivenes6 Submodel
TN-20 Part VII- The Simulation
The model was developed by Abt Associates, of Cambridge,
Massachusetts, for the Division of Operations Analysis, National
Center for Educational Statistics, under contract number OEC 1 -6-
001681 -1681.

Ay.
4
THE COMMUNITY SUBMODEL
The Community Submodel as it now stands is a set of independentlye,era4;nailyerminea which n v . r t D11 1> e information, Tnntrnrtionaig l i s .
Process Submodel attitudinal and School Submodel achievementdata into indicators of selected community factors in which a change isexpected or desired ( See Chart C.1 ). These outputs are selected on thebasis of presumed interest to Title I evaluators. Present and past valuesfor these outputs for a particular community will be already known; theTitle I evaluator's concern is the predicted future values which incorporateboth Title I inputs,. tracing their community effects, and extrapolatedcommunity trends contributing to a change in these indicators relativelyindependent of Title I.
For long-range planning it would also be desirable to cycle these .
outputs back through the community to see how they affect the School andthe Instructional Process (presumably a sort of 'snowball' process). Acomplete full-scale working model of the community would perform all threede sired functions. However, data gaps and the absence of systematicresearch findings on the majority of the many components of a completeCommunity Model leave too much to speculation. * The current Community'Submodel represents the alternative of higher reliability on a somewhatmore limited scale. The two criteria for selection were relative reliability,i.e., areas in which extant research has at least pointed the direction ofrelationships, and interest for immediate Title I evaluation needs.
Each of the seven submodel outputs, with the exception of thecomposite community involvement indicator, has a separate subroutinelogic, although they share many of the 'same Instructional Process inputs.The logics produce target population community effects, with and withoutTitle I changes in Instructional Process variables used.
*This finding is based on a full-scale theoretical modeling effort carriedcut earlier in the history of this contract and reported in the Appendix. Theresults of this feasibility study are nevertheless generally favorable, giventhe possibility of a larger scale effort with an associated research program.

INPU
TS
C H O O L
D A T A B A S E , S U B M O i!la
CO
MM
UN
ITY
SU
BM
OD
EL
ST
RU
CT
UR
AL
OV
ER
VIE
WC
-1
I J -
"
EA
RN
ING
SUB
RO
UT
INE
ED
UC
AT
ION
AL
EQ
UA
LIT
YSU
BR
OU
TIN
E
EFF
ICA
CY
SUB
RO
UT
INE
OU
TPU
TS
EA
RN
ING
POT
EN
TIA
L
EQ
UA
LIT
Y O
F--
----
-->
ED
UC
AT
ION
AL
OPP
OR
T U
NIT
Y
VSO
CIA
LC
OM
MU
NIT
YSO
CIA
LPA
RT
ICIP
AT
ION
INV
OL
VE
ME
NT
SUB
RO
UT
INE
PRO
PEN
SIT
YSU
BR
OU
TIN
E'"
UI
-1
141°
M44
44 4
.1b
E L
INPU
TS
.M
PIN
NIS
II
CU
LT
UR
AL
SUB
RO
UT
INE
A
SOC
IAL
CO
NFL
IC T
SUB
RO
UT
INE
JUV
EN
ILE
CR
IMIN
AL
ITY
YSU
BR
OU
TIN
E
CO
MM
UN
ITY
SU
BM
OD
EL
ST
RU
CT
UR
AL
OV
ER
VIE
W C
-1
EFF
ICA
CY
CO
MM
UN
ITY
INV
OL
VE
Mr_
qTT
PRO
PEN
S13:
Y
CU
LT
UR
AL
->
PAR
TIC
IPA
TIO
NPR
OPE
NSI
TY
DE
STR
UC
TIV
E.SO
CIA
Lk
CO
NFL
ICT
PRO
PEN
SIT
Y
JUV
EN
ILE
CR
IMIN
AL
PRO
PEN
SIT
Y
.L
OU
TPU
TS

INST
RU
CT
ION
AL
PRO
CE
SSA
ND
SCH
OO
LM
OD
EL
BA
SE L
IN'E
OU
T/
TIT
LE
IO
UT
PUT
S
sa
CO
MM
UN
ITY
SU
BM
OD
EL
C-2
DY
NA
MIC
OV
ER
VIE
W
CO
MM
UN
ITY
DA
TA
BA
SE
CO
MM
UN
ITY
SUB
MO
DE
L
O
p E
AR
NIN
G P
OT
EN
TIA
LA
EQ
UA
LIT
Y O
F E
DU
CA
-T
ION
AL
OPP
OR
TU
NIT
Y.6
, EFF
ICA
CY
: DE
STR
UC
TIV
E S
OC
IAL
,64
CO
NFL
ICT
PR
OPE
Nai
.TY
A C
OM
MU
NIT
Y I
NV
OI.
.
ME
NT
PR
OPE
NSI
TY
6, C
UL
TU
RA
L P
AR
TIC
I-PA
TIO
N P
RO
PEN
SIT
YA
JU
VE
NIL
E C
RIM
INA
LPR
OPE
NSI
TY
it 7'
',
. ,.,4
'

I
The future value pre:I.:xi:10.-1 f.or Community Submodel outputs, andthus .for community changes (L 's) resultant of Title I inputs, are derivedfrom the process common to all of the simulation. (See Chart C-2 for thedynamics). The main implication of the first Base Line Run for theCommunity Subroutine logics is the establishment of threshold values; thisis the 'tuning' of the submodel. Once these threshold values are established,the Model is run with the projected Title I > r -gram inputs. Resultantchanges in Instructional ProCess achievements and attitudes are passed onto the Community subroutines where they are combined in various ways andtested for threshold value. The result is a set of projected propensitiesfor community effects on the part of the target population. By subtractingthe Base Line Run outputs from the 'future' outputs we get the changesresultant from the particular Title I program being evaluated. Theseeffects are independent of other changes due to extensions of currentcommunity trends or exogenous inputs other than Title I. Hence the out-
pute are in terms of tendencies rather than predictions of specific behavior.
-4

EA
RN
ING
POT
EN
TIA
LSU
BR
OU
TIN
E
CO
UR
SE O
F ST
UD
YST
UD
EN
T T
YPE
NO
. OF
STU
DE
NT
S---
4b-
(ThI
STR
UC
TIO
NA
LPR
OC
ESS
)
DR
OPO
UT
DA
TA
(SC
HO
OL
)
C-3
AC
HIE
VE
ME
NT
LE
VE
L.
(SC
HO
OL
MO
DE
L)
.
USI
NE
S,A
ND
1
RO
FES-
SIO
NA
L
(VO
CA
TIO
NA
L)
NO
ilr
NO
UN
SKIL
LE
D
tom
om...
......
......
......
......
..:...
......
.a.

TRANSLATION OF OCCUPATION TO INCOME C-3 a
BASE LINE TITLE I
DISTRIBUTIONOF
OCCUPATIONS
L.,EXPECTED EARNINGSPREDICTOR
A COMMUNITY EARNING. POTENTIAL
EARNINGPREDICT IONDATA

EARNING PO TEI,TTIAL SUBROUTINE
The Earning Potential Subroutine is a simple but reliableprocedure for quantitatively assessing the impact of any proposed Title Iprogram upon the ability of the target population to earn a living. Itsoperation is straightforward: predict on the basis of course of study(Academic, Commercial, General, Vocational), achievement level inschool, and graduation/dropout statistics, that occupational class(Business/Professional, White Collar/Clerical, Skilled, Semi-Skilled,Unskilled) in which each of the distinguishable student groups withinthe model will earn a living (Fig. C-3). From this prediction, andfrom correlation study data relating occupational class with expectedlifetime earnings, we can compute a rough figure for total predictedearnings of the model population. Comparing total predicted earningsfigures from the base line run and the run with Title I programs, we elmget an index of change in Community Earning Potential, i. e. , largeincrease, increase, no change, decrease, large decreases (Fig. C-3a).
In point of fact, the procedure described above is one part ofa subroutine created for the current project which models the economiclife of a community in greater detail. While this subroutine is at a-levelof detail too high for the purposes of the current overall model, adescription is included of it as Appendix A to indicate the direction whichmight profitably be taken should a decison to expand the scope of theCommunity Submodel be taken.
-7

S C H
' .
EQ
UA
LIT
Y O
F E
DU
CA
TIO
NA
L O
PPO
RT
UN
ITY
SU
BR
OU
TIN
E
r Iri
ll.11
.1
1111
1111
1.M
INIM
INIM
INIII
D -
ME
MO
* =
ON
O
S ..
S1
0.I
AM
I.MIN
IIIM
I,
OrR
EA
DIN
G A
CH
IEV
E: I
L1
ME
NT
....-
4>.(
SOC
. ST
UD
IES.
AC
H-
M!S
CIE
NC
E0
!SC
IEN
CE
AC
HIE
VE
-D
iM
EN
TE
1ME
CH
AN
ICA
Lr-
-'L
1A
CH
IEV
EM
EN
T!L
AN
GU
AG
E.
IA
CH
IEV
EM
EN
TIM
AT
HA
CH
IEV
EM
EN
11-
L...
.....
_ -
- ...
. -.N
O. -
IOW
1 1
C-4
NO
N -
WH
ITE
, $19
99 -
,..i
ON
- W
HIT
E, $
2, 0
00+
1
WH
ITE
, $19
99 -
i 1
WH
ITE
, 200
0+C
OM
PUT
E M
EA
N.A
CH
. LE
VE
L
HIG
H D
EG
RE
EQ
UA
LIT
Y O
FE
DU
CA
TIO
NA
LO
PPO
RT
UN
ITY
F
CO
MPt
JTSM
AL
LR
AN
GE
OF
RA
NG
E ?
ME
AN
S
i
LO
W D
EG
RE
EE
DU
CA
TIO
NA
LO
PPO
RT
UN
ITY

EQUALITY OF EDUCATIONAL OPPORTUNITY
The primary aim of Title I is to equalize educational opportunitiesthroughout the country. Since "opportunities" themselves are difficult, ifnot impossible to measure directly, this subroutine utilizes Coleman's'logic in deriving an indicator of the equality of educational opportunity.His method was to correlate achievement scores with social origins.Where equality of educational opportunity was high, there would be nocorrelation with social origin.
This subroutine computes a mean achievement score for each ofthe four population groups, based on data from the School Model. It thenprints out a distribution of means and computes the range. If the range issmall, a high degree' of equality of educational opportunity is indicated,and-the opposite is shown by a large range. Any Title I program whichsucceeds in raising the achievement level of any of the population groupbwhose mean is low will reduce the inequality of educational opportunity.
1111,
1 James Coleman, ''Equal Schools or Equal Students", The Public Interest,Vol. 4, Summer, 1966.

) t
EFFICACY SUBROUTINE C-5
SCHO
.oL
L P.NEED FORACHIEVEMENT
SOCIAL STUDIES .......ACHIEVEMENT
....00.%**/*....
NO}-110.:,;: i()Jj
9
-. YES
COMPUTELEVEL OF
ORGANIZATIONALM LANGUAGE 1. ABILITY0 -ACHIEVEMENTD
fiL
%,.
NO>
I. P.LEVEL OFCONFIDENCE ---->IN A LOGICAL
WORLD
I. P.PERCEPTION OFSOCIO-ECONOMICOPPORTUNITY
"-10-
LOWEFFICACY
LOWEFFICACY
10.00.../W.:
LOWEFFICACY
MEDIUMEFFICACY

eni f.1or & 1lAr
. EFFICACY SUBROUTINE
The function of the efficacy subroutine. is to produce an indicatorpopulation group's power over its environment and hence its
ability to bring about a desired' result. It implies both the willingness andability to effect change, and a belief that ordered change and improvementare possible. In evaluating the effectiveness of' a Title I program, it isworthwhile to examine changes in a community's likelihood for undertakingsuch activities as self-help projects. This routine translates attitude andachievement indices of the target population, (outputs of the instructionalprocess and school models) into a series of decision thresholds. Each
..
. threshold acts as a screen to filter off those population groups who donot meet minimum success criteria at each level of decision.
For example, a Title I sponsored work-study program in whichstudents could apply newly acquiree4 skills to remunerative work mightincrease their need achievement level. If this were greater than theestablished threshold, one would then examine their organizational ability.For the purposes of the model, social studies achievement and languageskills, determined by standardiyc.i :c.::1 ; cores and aggregated by populationtype are used to" yield an index of organizational ability. Such a work-study program could enhance social studies achievement but might not affectcommunication skills. If the population group did not meet the minimumrequirement for organizational ability their efficacy index would be low.If their organizational ability were adequate, two attitudinal variableswould be considered: the population group's level of confidence in alogical world and their perception of their socio-economic. opportunity.Unless there exists a high level of confidence in a rational, ordered worldwhere, given the proper channels, one can effect change, a population groupwould not attempt a community action project. Both of these attitudesmight be 'enhanced by a work-study program by acquainting the studentswith a real-world example of cause and effect in the work situation andbe increasing their socio-economic level. The population groups whosuccessfully pass through the four decision thresholds and have the pre-requisite organizational ability will receive a high efficacy rating.

vs '
i
"ts
SOCIAL PARTI:JP.ATION PROPENSITY C-6
...... NEED FORAFFILIATION
NEED > NO> THRESHOL?-r/-1 YES
I. P. '''''-'> EMPATHY --> COMPUTESOCIAL SKILL:
EMPATHY XI, P. ---> SELF- ESTEEM ---> SELF-ESTEEM
NO SOCIALA R TICIPA TIONPROPENSITY
C D0 AM T NO. FORMALAF A 'N, ORGANIZATIONSU '' PER 1000 POP-.N B ULATIONI AT S ,
Y E
NO
YES
YES
VHIGH
SOCIA LPARTICI-PATION
PROPENSITY
;12
NO
LOW SOCIALAR TICIPA TIONPROPENSITY
MEDIUMSOCIAL
PARTICIPATIONPROPENSITY

SOCIAL PARTICIPATIUN PROPENSITY SUBROUTINE
For present model purposes the function of this subroutine is the
production of a social participation prdpensity output which is definedas formal organizational participation (voluntary associations like civicgroups, fraternal orders, as well as churches, political parties, laborand commerce associations, etc. ) The importance of this factor tocommunity involvement, especially as a sort of marker of the traditionalAmerican cultural pattern, has been recognized since it was first notedin DeToqueville's Democracy ericam . We therefore expect it tocontribute to the expected effect of Title I on the community.
Within the subroutine certain attitudinal indices for thetarget population are input from the Instructional Process Submodel; theyare combined and tested for threshold value to produce social participationpropensity. A positive social pp.rticipation propensity value is 'multiplied'by the availability of formal organizations, a data base input.
Need for affiliation is a necessary but not sufficient input. Thisneed is compared with the calibrated threshold need value. If it is greaterthan threshold, we have satisfied the need condition and move to thecapability condition. Capability here is social skills sufficient to enableone to join formal organizations. Social skills equal interpersonal skills.An index of social skills is computed from Empathy and Self-Esteemattitudinal variables (inputs from IP). These two factors are both deemednecessary in some degree for successful social interaction; a high degreeof both self-esteem and empathy is considered, ouch more favorable thana high on one and low on the other .
Therefore the scale values are multiplied to insure that anextraordinarily high value on one does not compensate in the index foran extraordinarily low value on the other, as might occur were this anadditive function.
Example:Self-Esteem
Empathy1 . 10
-13

Sample values:
SE = 6 SE = 4EM = 2 EM = 4'Fair' 'Good'
If additive:SE + EM = Social Skills Index6 + 2 = 84 + 4 = 8 Can't distinguish
If multiplicative:SE X EM = Social Skills Index6 x 2 = 12 'Fair'4. x 4 = 16 'Good'
.4.;Social skills index is then tested for threshold value. If the
threshold is passed, the result is 'medium' social participation propensity.Propensity, however, also includes some measure of availability, in thiscase possible formal organizations per population. An increase in numberof formal organizations extant (available) per population therefore' results
in high change in social participation propensity.A Title I program involving field trips for cultural and educational
development might be expected to raise Empathy directly,and indirectly,increase Self-Esteem, thus contributing greatly to the Social Skills Indexwhich' multiplies the two. It is therefore a good example of how Title Ican produce considerable effects in social participation propensity.
-14-

PRO
PEN
SIT
Y F
OR
CO
MM
UN
ITY
IN
VO
LV
EM
EN
T S
UB
RO
UT
INE
JUD
GM
EN
TA
LW
EIG
HT
ING
S
,C 0
CU
LT
UR
AL
PA
RT
ICIP
AT
ION
ML
EV
EL
MSO
CIA
L P
AR
TIC
IPA
TIO
NU
LE
VE
L.
NE
FFIC
AC
Y L
EV
EL
I T Y
CO
MPU
TE
WE
IGH
TE
DSU
M
C-7
>IN
DE
X O
F PR
OPE
NSI
TY
(LO
W, M
ED
IUM
, HIG
H)
FOR
CO
MM
UN
ITY
INV
OL
VE
ME
NT

PROPENSITY FOR COI4MUNITY INVOLVEMENT
One of the important factors in maintaining or achievingcommunity cohesiveness is the level of involvement or vestment variouspopulation groups may have in the community. The propensity forcommunity involvement is a combination of a group's propensity forcultural and social participation, as described above, and their desireand ability to act, or their efficacy rating. The indices derived fromthese three subroutines are weighted and summed to provide an index of.community involvement.
16--
4

CULTURAL PARTICIPATION SUBROUTINE
__L.: CURIOSITYit P. ' INDEX
SC
.140 READING0 -.ACHIEVE -L -D> MENT
LEVELM0DEL
C-8
NO.CULTURALAR TICIPATIOPROPENSITY
CURIOSITY>HRESHOLD
?
NO
YES
NO
JUDGMENT ---4>DATA BASE .
YES
EADING SKIL>8TH GRADE NORM
?
..........0ip
NO
YES
LOWCULTURAL
AR TICIPATIOPROPENSITY
MEDIUMCULTURAL
PARTICIPATION. PROPENSIT Y
ARECULTURAL
FACILITIESSATURATED
NO
vHIGH
CULTURALPARTICIPATION
PROPENSITY
t
YES

CULTURAL PARP.CICIPATION SUBROUTINE
Cultural participation propensity is defined in this model as at.population group's tendency to acquire the values, beliefs and norms'which their community has drawn from the nationally shared culture.This subroutine serves two purposes in the model. First, it provides aroughindication of the extent to which an exogenous 'Title I program maychange the disparity between the culture of the target group and the remainderof the population. Second, when combined with social participation propensityand efficacy, this subroutine yields an indicator of community involvement.The process for determining cultural participation propensity isa series of decision thresholds through v.hich each target population passes,yielding an indicator of the level of participation. The theory underlyingthe routine is that, given a level of curiosity greater than an established
.
.threshold, a reading achievement of sixth grade level or better and adequatecultural facilities, a population group will have the tendency to share in thenational culture. Reading achievement level is included because it is thebest available indicator of the kinds of mass media a group may utilize. Tothe extent that curiosity, or "need-to-know" and reading achievement areincreased', the depth and breadth of the target pOPulation's cultural aware-ness will also increase. If cultural facilities are not saturated,. participationpropensity is also increased.For example, assuming an adequate curiosity threshold, let usconsider the effects of a remedial reading program on non-whites of highschool age with incomes of less than $2, 000. If it does not succeed inincreasing the reading skill of this population to sixth grade level, theirpropensity for cultural participation will be low and probably include onlyradio and television as available communication media. If this programis successful in upgrading reading achievement to this level, newspapersand magazines become possible sources of information. If reading achieve-
;ment is at the eighth grade level, then the- propensity for cultural participation
4
-18

4.
will be high, provided adequate facilities are available. A judgmentalinput is required to determine ,Whether current facilities are saturated.If the Title I program increases cultural facilities, a negative responseat this decision threshold would yield a high propensity for culturalparticipation. It is possible for the subroutine to show that additionalfacilities may themselves attract new participants and hence enhancethe cultural participation propensity rating for their population group.

DA
TA
BA
SE>
(JU
DG
ME
NT
)
L P
..
--,
CO
MM
UN
ITY
SOC
IAL
CO
NFL
ICT
HIS
TO
RIC
AL
PRE
CE
DE
NT
NO
N-W
HIT
E, $
2000
41N
ON
-WH
ITE
, $19
99-
1
WH
ITE
, $19
99-
-1
SOC
IAL
CO
NFL
ICT
SU
BR
OU
TIN
E
YE
S
.
WH
ITE
, $20
00+
ME
AN
PE
RC
EPT
ION
OF
SE O
PPO
RT
UN
ITY
IP I
DE
NT
. WIT
H.6
.17.
.=28
.SC
AL
E(F
OR
EA
CH
GR
OU
P)IP
CO
NFI
DE
NC
EIN
A L
OG
ICA
L W
OR
LSC
AL
E (
FOR
EA
CH
GR
OU
P)
NO
..
or...
..-1.
,
LO
DE
STR
UC
TIV
E..
SOC
IAL
CO
NFL
ICT
PRO
PEN
SIT
Y
)C
OM
PAR
EM
EA
NS
(
YE
S
A
ME
DIU
M D
ES
T .T
.--;
U!_
: -T
IVE
SO
CIA
L C
ON
-FL
ICT
. PR
OPE
N-
SIT
Y
CO
MPU
TE
AG
GR
ESS
ION
iNI5
EX
tID
EN
TIF
ICA
TIO
N W
ITH
AU
TH
O-
RIT
Y S
CA
LE
--:
- C
ON
2ID
EN
CE
IN A
LO
GIC
AL
WO
RL
D S
CA
LE
(FO
R E
AC
H O
F 4
POPU
LA
TIO
NG
RO
UPS
)
NO
YE
S
.
SOC
IAL
CO
NFL
ICT
SU
BR
OU
TIN
EC
-9
-.--
-->
-,
HIG
H D
EST
RU
C-
TIV
E S
OC
IAL
CO
NFL
ICT
PR
O-
PEN
SIT
Y

SOCIAL COITF:L,T.0 T SUBROUTINE
This subroutine is intended to generate a propensity for destructivesocial conflict in. the community. While there is without doubt a certainlevel of social conflict implicit in increased community involvement ourconcern in this subroutine is A.vith disruptive, 'unhealthy' conflict levels.The subroutine output is a rough indicator of propensity for high levelsocial conflict; it is not sufficiently detailed to give scale values.
A community history judgment of incidence of destructive social." conflict is input to the subroutine from the Data Bank. A recent precedent
.of destructive social conflict is one of the three contributors to socialconflict propensity, although like the others it is not absolutely necessary.This input is not affected by Title I.
Socio-economic grievances are a second factor. It should benoted that actual socio-economic inequalities are not as relevant asperceptions of socio-economic opportunity. Means by population groupof perception of socio-economic opportunity (from the InstructionalProcess Submodel) are compared by taking the range of the means,an indicator of the spread of the disparity. The range . threshold is setby model calibration. If, at a later date, research demonstrates thatthis part of the subroutine has greater predictive value, we maybe able to connect size of range of the means with specific levels(scope and intensity), rather than employ the present simple thresholdtest (YES, NO). .
In addition we need an attitudinal indicator of aggressive actionorientation. A rough index is computed from the Identification WithAuthority (not orientation.to authority) and confidence in logical world.The two scales are multiplied in accordance with the hypothesis that a high
*This variable is a more general version of "Negative Attitude towardScience" found by Adorno, et. al. , (The Authoritarian Personality, Harper,1950, p. 464) to be highly correlated with high Ethnic Prejudice Scoresand to some extent with aggressive behavior. The advantage in using"confidence in worldly logic" is that it is less tied to factual scientificknowledge.

1score on both is necessary for an aggression index. This indeX is computedfor each population group so that high values will not be washed out byaggregation. A high aggression index value for any group is consideredsufficient to contribute to community social conflict.
Keeping in mind the roughness of these three indices, we considerthe presence of a "YES" on any one factor an indication of low propensity, two!'YES's" medium propensity, three "YES's" high propensity.
School-job coordinators input to the School Model is a goodexample of how Title I may affect disparity of perception of socio-economicopportunity. Good job coordination guidance could be expected to raiselow means for certain groups of perception of socio-economic opportunity.
. Similarly a school-job coordinator or other Title I program mayaffect "confidence in a logical world" and by increasing the denominat or .
of the Aggression Index computation lower the index value. If either orboth 11 these changes lowers the index value to less than the threshold value,we can expect a reduction of propensity for social conflict.

EX
T.
EX
T.
EX
T.
EX
T.
EX
T.
EX
T.
I N P U T S
JUV
EN
ILE
CR
IMIN
AL
ITY
SU
BR
OU
TIN
EC
-10
SCH
OO
LL
.P.
CO
MM
UN
ITY
CH
AR
AC
TE
RIS
TIC
S:H
IGH
HO
USI
NG
DE
NSI
TY
(0-
1)H
IGH
DE
TE
RIO
RA
TE
D H
OU
SIN
G (
0-2)
LA
RG
E T
RA
NSI
EN
T P
OPU
LA
TIO
N (
0-2
HIG
H S
OC
IAL
UPH
EA
VA
L (
0-1)
DO
UB
LE
ST
AN
DA
RD
JU
STIC
E (
0-2)
LO
W I
NC
OM
E L
EV
EL
(0
-2)
.
EX
T.
MiT
.A B
ASE
SCH
OO
L
TIT
LE
I P
RO
GR
AM
ST
HR
OU
GH
IN
STR
UC
-T
ION
AL
. PR
OC
ESS
MO
DE
L.
I
STU
DE
NT
CH
AR
AC
TE
RIS
TIC
S:L
OW
AC
HIE
VE
ME
NT
LE
VE
L (
0-2)
INT
EG
RA
TIO
N -
AL
IEN
TA
TIO
N L
EV
EL
(0-
2)ST
RE
SS L
EV
EL
IN
FA
MIL
Y (
0-2)
NE
GR
O/M
INO
RIT
Y M
EM
BE
R (
0-2)
MA
LE
AD
OL
ESC
EN
T (
0-2)
CO
MPU
TE
IND
EX
OF
CO
MM
UN
ITY
CR
IME
PR
OPE
NSI
TY
=(
0 -
10 )
CO
MPU
TE
STU
DE
NT
/EN
VIR
ON
ME
NT
CR
IME
PR
OPE
NSI
TY
4<20
=(
0 -
20 )
HIG
H P
RO
PEN
SIFO
R C
RIM
INA
Lr:
A
IND
EX
IIN
TD
EX
OF
STU
DE
NT
C R
IME
PR
OPE
NSI
TY
VI
=(
0 -
10 )
YE
S
PR O
PEN
SIT
TH
RE
SHO
LD
NO
Ni
LO
W P
RO
PEN
S.FO
R C
RIM
INA
L:

CRI ME SUB-ROUTINE.
Results from empirical research attempting to establishuniversal or area causes (e. g. personality based, physiologically based)of criminal behavior have been uniformly disappointing. Researchers andtheoreticians have been unable to isolate clear cut causes of crime. It isfelt that this is due to cultural and individual differences which interact indiffering ways. Attempting to' cut across such differences may well involvethe summation of variables which negatively correlate with one-another,thus cancelling out each other when aggregated.
A second approach which does not attempt to establish causative re-lationships seeks to determineconditions under which criminal behavior ismost likely to emerge. Here correlations rather than causes are the-basisof examination. The Crime Sub-Routine makes use of information about cer-tain variables which appear to be significant corollaries to crime. Basedupon the literature the variables are divided into two groupings: Communityand Student characteristics. Then variables in each of the sub-groups areweighted as contributing either 1 or 2 points. Data is insufficient to justifyusing any stronger mathematical treatment than summation. It is assumedthat the greater the number of conditions favorable to crime for a definedpopulation, the greater the probability that criminal behavior will occur fora segment of that population. Thus, when conditions cumulate to 15 or morepoints on a 20-point scale, the outcome is probabilistically assumed to becriminal behavior. Where such is the case, exogenous OE programs likelyto deal with the corollaries to crime are recommended; following developmentof such programs, the student population characteristics are updp.ted and re-turned to the Data Base and crime propensities recalculated.
Use of the scale requires the user to determine the characteristics ofhis 'community as described. If for example his school system is in a neighbor-hood with high-density but well kept homes, he would score 2 points for HousingDensity and 0 for Deteriorated Housing. The maximum score for all communitycharacteristics is 10; likewise for student characteriitics. Where the sum ofall propensity indicators exceeds 15, the Crime Decision Function outputs anincreased propensity for criminal behavior.

The following studies provide the rationale for the variables includedin the Community and Student Characteristics boxes: High Housing Density,High Deteriorated Housing, Hi21, at Population, High Ethnic Hetero-geniety and High Social Upheaval are all reported by Freedman et al, 1956,as being correlated with criminal and delinquent behavior in the city. It isin areas so characterized that a disproportionate amount of crime is perpe-trated, and where the greatest number of convictions are generated. Asidefrom empirical studies of correlations, police records support these. variablesas corresponding to the individual criminal behavior. These groups, it may bespeculated, are also most vulnerable to the pressures of organized criminalactivity. The existence of a double standard of justice (as for example withNegro populations) is considered by many psychologists and legal specialistsas both reinforcing criminal behavior, and as a basis for disregard of civilrights by police, leading to further reinforcement.
Turning to the more individually oriented variables contained in thestudent characteristics box, the following empirical support exists. Raaband Selznick, 1959, found that lowidentification with society as seen in brokenhomes and Marriages, lack of integration with neighborhood, was signi-ficantly correlated to delitiquency rates. Sykes, 1956, repbrts that frequentlythe problem of delinquency rate is a function not of deviate behavioi frOm atotal society, but rather of conformity to a primary peer group which promotesbehaviors inconsistent with society; i. e., a cultural-subculture discrepancy.Crime rates are also very high among adolescents, particularly among males,as contrasted with other age groups (and females) -See Cressey, 1961. Workby Cohen and Short, 1961, indicates that among minority groups and particu-larly Negroes crime is disproportionately high.

S
NATIONAL CENTER FOR EDUCATIONAL STATISTICS
Division of Operations Analysis
A COST-EFFECTIVENESS MODEL FOR THEANALYSIS OF TITLE' I ESEA PROJECT 'PROPOSALS
PART V
THE COST SUBMODEL
Prepared fo r'.the Division of Operations Analysis
by
Abt Associates, Inc.thider. Contract No: 'OEC..1-6401681-1681
Technical NoteNumber 18
December 9 , 1966
.
. I
S.
OFFICE OF EDUCATION/U.S. DEPARTMENT OF HEALTH, EDUCATION, AND ,WELFARE

. .
, ,
;..
$ .
^ 4
,
r
NATIONAL CENTER FOR EDUCATIONAL STATISTICSAlexander M. Mood, Assistant Commissioner
DIVISION OF OPERATIONS ANALYSISDavid S. Stoller, Director

PREFACE
This Technical Note is the fifth part of a seven-part issue
which describes a Cost-Effectiveness Model for the analysis of
Title I ESEA Project Proposals. The seven parts axe:
TN-14
TN-15
TN-16
TN-17
TN -l&
TN-19
TN-20
Part I - An Overview of the Cost-Effective-
ness Model and Submodels for theEvaluation of Title I ESEA Proposals
Part II - The School Submodel
Part III- The Instructional Process Submodel
Part IV The Community Submodel
Part V - The. Cost Submodel
Part VI - The Effectiveness Submodel
Part VII- The Simulation
The model was developed by Abt Associates, of Cambridge,
Massachusetts, for the Division of Operations Analysis, National
Center for Educational Statistics, under contract number OEC 1 -6-
001681 -1681.

. . .
THE COST SUBMODEL
. In order to assign meaningful cost-effectiveness weightings toa proposed Title I program, the Cost Sub-Model has been developed.This model is designed to compute the total cost of a Title I program
'including both direct and indirect expenditures required for the program.Actual average costs of direct requirements, such as reading machines,teachers' salaries, salaries of health personnel, audio-visual equipment,etc. will be stored in the data base of the model for every Title I.program which the model will be able to handle.
In addition, costs of supporting requirements, such as anempty classroom and additional administrative personnel Often-times available within the school system itself, though not necessarilytaken into consideration by the user, will be stored with each programpackage. Hence, when a Title I program is introduced into the CostModel, not only its direct requirements, but also its supporting require-rnents will be examined. As illustrated. by Figure II, the model com-pare current resources available in the school with their utilization rate toarrive at an evaluation of resources available to fulfill supporting require-ments for the Title I program. Thus, when the cost computation isexecuted, total cost of the project is obtained, not just the obvious costof the major portion of the program in question.
The methodology to be used by the Cost Sub-Model in determiningthis total cost figure is outlined in Fii;ure III. Both direct and indirectpurChases required for the program package are listed, including both theinitial expenditure required for the first year of operation and the dis-counted present value of the future costs where applicable. These costsare printed out for the benefit of the user according to the format inFigure III. Total cost of the package is also sent to the cost-effectivenesssub-model as an input to be used in calculating relative cost-effectivenessmeasures.

.
..t-P
lt t..
.,1-'(
...)S
k..:L
)
RE
SOU
RC
ES
V
AN
AL
YSI
S O
FSU
PPO
RT
RE
QU
IRE
ME
NT
S
STO
RE
DPR
ICE
LIS
T
L
CO
MM
UN
ITY
RE
SOU
RC
ES
CO
MPU
TE
NE
ED
ED
RE
SOU
RC
E&
CO
ST
Nee
ded
Item
s
TO
TA
L P
RO
GR
AM
CO
ST T
O C
OST
-E
FFE
CT
IVE
NE
SSSU
B-M
OD
EL
V
Dat
a B
ase
t
NE
W R
ESO
UR
CE
ST
O S
CH
OO
LSU
B-M
OD
EL
N,
$
RE
POR
TG
EN
ER
AT
OR
EX
CE
PTIO
NR
EPO
RT
CO
MPU
TE
DC
OST
LIS
TIN
G
FIG
UR
E I
PRO
POSE
DE
XPE
ND
ITU
RE
S
'CO
STO
MPA
RA
TO
R
JV
Dat
a B
ase
."
.t
...
...
I

Prop
osed
Res
ourc
ePE
ha s
e s
.r
7771
71,..
.«,
f'1,1
4 T
O, (
^
S
DIR
EC
TR
EQ
UIR
EM
EN
TS
# of
Pup
ils
Tim
e-T
able
for
Dir
ect
Purc
hase
s
SUPP
OR
TR
EQ
UIR
EM
EN
TS
TA
BL
E o
r SU
PPO
RT
RE
QU
IRE
ME
NT
S FO
;7;,
VA
RIO
US
PAC
KA
GE
S
1--- CU
RR
EN
T R
ESO
UR
CE
S:C
APA
CIT
Y
CU
RR
EN
T R
ESO
UR
CE
S:U
TIL
IZA
TIO
N
RE
QU
IRE
D S
UPP
OR
TPU
RC
HA
SES
=R
EQ
UIR
EM
EN
TS
-A
VA
ILA
BIL
IIT
Y
1
RE
SOU
RC
EA
VA
ILA
BIL
ITY
. =C
APA
CIT
Y -
UT
ILIZ
AT
ION
Dir
ect P
urch
ases
Req
uire
d an
dSc
hedu
le o
f Pu
rcha
ses
FIG
UR
E I
I--
AN
AL
YSI
S O
F SU
PPO
RT
RE
QU
IRE
ME
NT
S
Supp
ort
Purc
hase
san
d T
imes
'a
.

Com
pute
Nee
ded
Res
ourc
es a
nd C
ost
Purc
hase
s.4
- T
imes
Supp
ort
Purc
hase
sT
imes
'
Pric
eL
ist
Pric
eL
ist
Out
lays
for
Dir
ect P
urch
ases
Yea
rly
Dol
lars
for
Dir
ect P
urch
ases
(Dis
coun
ted
to P
rese
ntV
alue
)
Out
lays
for
Sup
port
Purc
hase
s
Yea
rly
Dol
lars
for
Supp
ort P
urch
ases
(Dis
coun
ted
to P
rese
ntV
alue
)
P>I
FIG
UR
E I
II
...04
101.
0
Cos
ts o
f T
itle
I Pa
ckag
e,
I.C
osts
of
dire
ct o
utla
ys in
firs
t.ye
arof
prog
ram
.2.
Cos
ts o
f su
ppor
ting
requ
irem
ents
in f
irst
year
ofpr
ogra
m.
3.D
isco
unte
d co
sts
of d
irec
t out
lays
in s
ubse
quen
tye
ars
of p
rogr
am o
pera
-tio
n..
4.D
isco
unte
d co
sts
of s
uppo
rtin
gou
tlays
in s
ubse
quen
t yea
rs o
fpr
ogra
mop
erat
ion.
5.D
irec
t and
sup
port
ing
requ
irem
ent
tota
ls e
ach
year
.6.
Tot
al y
earl
you
tlays
.7.
Cum
ulat
ive
annu
al to
tals
for
eac
hye
arof
prog
ram
ope
ratio
ns..

1
,,
I I
.4
r
Once the total cost of the program has been determined, thiscost estimate will be compared with the cost estimates prepared by theuser in those cases where he has already estimated the cost of the project,and discrepancies between the two estimates will be listed for the user.In addition, the total cost of the program will be compared with thetotal supply of funds available for the project and if the cost estimateexceeds the expenditure limit, the computer will stop and indicatethis fact to the user. (Refer to Figure IV) Both of these diagnosticroutines serve as a check to the user when the cost of the program issignificantly greater than the amount of money he had originally plannedto expend.
.. The cost sub-model is integrated with both the instructional
process and exposure sub models. The program package being evaluatedis fed into the instructional process sub model after its characteristicsare translated in a series of descriptors able to be processed by theinstructional process model. The exposure sub-model receives thenew resources which the cost model indicates .are required to execute theTitle I program in question, and updates the data base accordingly.The exposure model also supplies the cost model with the number ofstudents included in a particular target group selected by the user asthe recipients of the Title I program, thereby allowing the cost modelto determine the quantity (and thereby costs) of resources required inany given Title I program.

.
Req
uire
d ite
ms
indi
cate
d by
mod
el in
$ (
each
item
and
by
vari
ous
aggr
ega-
tions
)
Prop
osed
expe
nditu
res
(by
item
)
Exp
endi
ture
Lim
itsI E". 1
Cos
t Com
para
tor
>.L
ist:
.
1.A
n re
quir
edite
ms
acco
rdin
g to
mod
el,
mod
el li
st p
rice
s.2.
An
diff
eren
ces
7107
0:m
odel
list
pric
e an
d pr
opos
edex
pend
iture
s pr
ide.
3.A
ll ite
ms
on m
odel
list o
r pr
opos
edlis
t,bu
t not
on
both
.
V
I. L
ist o
f ite
ms
2. E
xcep
tions
.(E
stim
ates
)...
----
-"'
FIG
UR
E I
VT
.L
ist:
.... A
ll co
mpu
ted
aggr
egat
e>
cost
s th
at a
reco
rres
pond
ing
expe
n-di
ture
lim
its4

01;0 ° Afr
. 42 00. 46 9,0
40'.4$'4142,0*tke r
c)
NATIONAL CENTER FOR EDUCATIONAL STATISTICS
Division of Operations Analysis
1
A COST-EFFECTIVENESS MODEL FOR THEANALYSIS OF TITLE I ESEA PROJECT PROPOSALS
PART VI
THE EFFECTIVENESS SUBMODEL
Prepared for the Division of Operations Analysis
by
Abt Associates, Inc.Under Contract No. OEC 1-6-00160171681
Technical NoteNumber 19
December 9, 1966
'I*
'
OFFICE OF EDUCAT1ON/U.S. DEPARTMENT OF HEALTH, EDUCATION, AND WELFARE

ti
ACIMAM *TV
NATIONAL CENTER FOR EDUCATIONAL STATISTICSAlexander M. Mood, Assistant Commissioner
DIVISION OF OPERATIONS ANALYSISDavid S. Stoller, Director

PREFACE
This Tochnical Note is the sixth part of a seven-part issuewhich describes a Cost-Effectiveness Morlel for the analysis ofTitle I ESEA Project Proposals. The seven parts are:
TN-14 Part I -
TN-15
TN-16
TN-17
TN-18
TN-19
TN-20
Part II -
Part III-
Part IV -
An Overview of the Cost-Effective-ness Model and Submodels for theEvaluatiQn of Title I ESEA. Proposals
The School Submodel
The Instructional Process Submodel
The Community Submodel
Part V - TheCostSubmodel
Part VI - The Effectiveness Submodel
Part VII- The Simulation
The modelwas developed .by Abt Associates, of Cambridge,Massachusetts, for the Division of Operations Analysis, NationalCenter for Educational Statistics, under contract number OEC 1 -6-001651 -1651,

THE EFFECTIVENESS SUBMODEL.* ?"*Wo........0.,....
The overall model will simulate particular school distriets andtheir output in terms of student changes and community impacts. Thissimulation is done, in particular, by the School subinodel, the Instruc-tional Process submodel and the Community submodel. The Cost sub-model determines the costs of the various Title I inputs and the on-goingschool expenses. It is the job of the Effectiveness submodel to re-.
ceive the outputs of these four submodels and the updated data base andprovide output for the user.
What kirids of outputs are there?
. Chart 1 shows two kinds of outputs which are generated by the sim-ulation. If we operate the model without any Title I programs (the baserun), the output will be in terms of pre-Title I levels; this type of studenthad an achievement level in math. of such-and-such, for example. Thesepre-Title I levels are important for testing the model and tuning the judg-ment parameters in it - this is the first kind of output.
After making the base run, we will run the simulation with a pro-posed Title I program present. 'The output of this run will be another setof levels of student change and community impact,but these are not veryuseful by themselves. The information we seek describes the impact ofthe possible Title I program on the school. The only way to determinethis is to compare the base run with the Title I run.
Thus, the second kind of output derived from the simulation is 'aSet of changes (or deltas) for each of the variables of interest.: Let usexamine the two kinds of outputs in detail, and see what they consist of.
Baseline output .. ,Chart 2 .shows the bastline output for a target population consisting
of the fourth. grz.de in a particular school. Described are:
The target populationA set of aggregate resultsResults broken down iii. detail

BA
SE.
RU
N
BA
SE R
UN
LE
VE
LS
7.31
1ffl
ifik
k
in:V
aria
ble
Res
ultin
g fr
omT
itle
I
1111
..mar
mal
laN
iaca
y
EX
AM
PLE
S:FO
UR
TH
GR
AD
E
RE
AD
ING
LE
VE
L =
1
SEC
ON
D G
RA
DE
CH
AR
T 1
SIM
UL
AT
ION
RE
SUL
TS
FOU
RT
HG
RA
DE
A R
EA
DIN
G L
EV
EL
=4-
ON
E G
RA
DE

BAS:ELINE RESULTS
r.CARGET POPULATION: 4th GRADE
AGGRT.',CTATli.', RESULTS - GRADE 4
ACHIEVEMENT LEVEL (I. Q.) 95.
READING LEVEL 3rd GRADE
SOCIAL ADJUSTMENT POOR
MATH SKILL POOR
LANGUAGE SKILL POOR
PERSONALITY DEVELOPMENT FAIR. .
EMOTIONAL CONTROL POOR
DISTRIBUTED RESULTS - GRADE 4
TYPE NUMBER
1. 2 . .3 4
ACHIEVEMENT 95 95 NO 110.
READING 3 3 3 4
SOCIAL ADJUSTMENT P P P G
MATH P ., P P G
LANGUAGE P P. F G
PERSONALITY F F P 0.
EMOTION P P F G
75 50 20 10
. , STUDENT POPULATION
CHART 2 - I3ASELINE OUTPUT.o

This bv.seline output shows the target population at a particUlar1;oint in . It is a snapshot of the fourth graders; its source is theinstructional process model. Another type of baseline output is thatprovided by the school model. Chart 3 shows the curriculum flow networkfor the school in question and lets us see what the expected future is forthe children in question without Title X inputs.
Chart 4 shows the delta results derived from the simulation and theoutputs which are drawn from them. We are interested in the effects whichoccur as a result of the introduction of the Title I input. ( Effects and
Resources). However, this sort of output may not be very useful forcomparison of alternative Title I programs, since different resources
. are likely to be used by different programs. It is therefore necessary. toconvert resources into some common unit; the most obvious unit is thatof dollars. We can then calculate the effect per dollar change; a usefulnumber. For the same reason that we converted resources into commonunits, it is necessary to convert effects into common units; that is, wewant to compare alternative programs with different effects and resourcesalong some common dimension.
The unit for the comparison of effects. is value. The value forchanges in the various effects is of course a judgment input - this inputmay be obtained from the user by means of the Churchman-Ackoff approx-imate measure of value procedure or other -means. Given changes in effectsweighted-by their associated values and the resource changes described interms of dollars, we can derive the necessary index of value/dollar derived
. from the Title I pregra.m.In the case _where only one resource (e. g. , textbooks, teachers,
. schoolrooms, etc.) is being introduced by a Title I program, the amount ofa value resulting from an increased- unit of that resource may be a desir-
able output.
What do these outputs look like?. Chart 5 shows the information needed to determine the incremental
value per dollar ,v,onich results when a Title I program is introduced into aschool. The total cost of the program, the magnitude of the effects derived
-4-

CI-.1A1-7(T
LONG RANGE EDUCATIONAL ;EFFECTS
Beforc Title I :. Low Income - Negr.o .
x X. x x x, X,X x X.>: X- xReading XI<X xlx xlx x2x x2x x3x 3x x4x x4x x4x x4x x4x .
. x x x x.-xLanguage x.Xx xlx xlx x2x x2x x3x x3x x4.x x4x x4x x4x
x x x x x xSoc. wt.udies xlx x2x x3x x4x x4x x4x x4x x4x
X X X X > x X x X X X xMat h xlCx xi x xlx xlx x2x x2x x3x x3x x4x x4x x4x x4x
Science xlx x2x x3x x4x x4x x4x x4x x4x1 2 .3 4 5 6. 7 B 9 10 11 12
grade
Title I Program: Headstart for Low Income - Negro-
. Reading
Language
Soc. ctuclies
Math
Scipnce
1 2
2
3
3
4
.4
5
5
5
6 7 x8x x8x x8x x8x x8x
x5x x6x x7x x7x x7x x7x x7x
6 x6x x6x x7x x7x x7x x7x
-x:Ixxx x x x x x x x xx.Kx xlx x2x x3x x4x x5x x6x x7x x7x x7x x7x x7xxxx'xxxxxxxxxx.:xxxxxxx
x3x x4x x5x x6x x7x x7x x7x x7x1 2 3 4 5 6 7 8 9 10 11 12
gradeThe shadow cast over the entire performance before headstart
has.been partially removed. Remedial Arithmetic would further increaseachievement but secondary school failure may still be possible due to lowrelative achieveMent and poor attitude toward school.
-5

EDUCATIONALPr: o GI A. m
DESCRIPTION
. ...... /or. lmraro ono..................0 /*
DATAB.ASE
VP 41 e 4
JUDGMENT .
VALUES FOREFFECTS
\/ V
ACOST
/ 4./. 111tl
SIMULATION -- simulates theoperation of school and cornmu- .
rtity over time.
\I
011. Ild
With and withoutTitle I
,01111110.141.11114111M.4..1111.......
VI
AilESOURCES
USED
1
CHANGE INCOMMUNITYCHARACTER'-
ISTICS
V
CHANGE INSTUDENT
CHARACTER-ISTICS
......... ............. 14110
if Vaaboal 4 aammisa IIMIIMING.1.11111,
4
CHART 4 ApUTPUTS 'FROM THE SIMULATION4.-

0
CO
MM
UN
ITY
:FE
LII
/DA
LE
, MA
SSA
CH
USE
TT
S.
TIT
LE
I P
RO
GR
AM
S:
VA
LU
E/$
TA
BL
E:
A. T
EA
CH
ER
IN
CR
EA
SEI.
AU
DIO
- V
ISU
AL
, DE
VIC
ES
C.
:11V
SE
TS
D. N
EW
TE
XT
BO
OK
S
::
PRO
GR
AM
-
CO
STT
OT
AL
VA
LU
EV
AL
UE
/$
X 1
04R
EFE
R.
PAG
E
A C B.
D
$50,
000
.70
, 000
15, 0
0.0
5, 0
00
.
.
.
.
.
65 10 12.
3.
.
. '
.
.
..
.
13 10 .8 6
23 25 24 26
VA
LU
E B
Y E
PPE
CT
3 T
AB
LE
:PR
OG
RA
MV
AL
UE
FR
OM
AC
HIE
VE
ME
NT
A 'S
FRO
M A
TT
ITU
DE
A 'S
FRO
M C
ON
.i .
SCIE
NC
EM
AT
HSO
CIA
L'
STU
DIE
SE
NG
LIS
HR
EA
D-
ING
LO
GIC
AL
WO
RL
D.
N-
AC
HIE
VSE
LF
TR
UST
EST
EE
M'
SOC
.C
ON
F.T
O T
.t2).
.I
A B C D
5 1 1 1-7
.
5 1 1 mow
6 2 1
.
31
6 3 2 O.
NM
6 4 3
'
11
1 1M
o --8-
.
11.
.
10
NM
IND
40 NM
7
al.
1 am INI
CO
O
.
.
65 . 1? 10 3
.
CH
AR
T .5
- V
AL
UE
/$T
AB
LE

'VALUE'
PROGRAM A65
0,000ST
0,000
..12 10
1D3
'EFFICIENCY'
I.
CHART SA VALUE/DOLLAR GRAPH

. . .
aria the relative values of chz..nizes in thr.! elf3cts vari;:,bles are necessary.
The valuz.-:-vic..isht,-_,.d changes are sun-in-lea and this total is divided by the
totcbl co 3t: to give valueidollz...,:s. Chart 5A is a graphical representation
of this information.Chart 6 shows how effects a.nd total cost may be related.In Chart 7, we see the combination of Effects and Resources in the
case. where more than one resource has been used.. This output is essen-tially a list of effects and resources with little demonstration of trade-offs. Chart 8, on the other hand, gives a possible output which we might
see when only one resource has beer. used in a Title I program. in eachcase, the simple calculation of value and resource is appended to the
output.
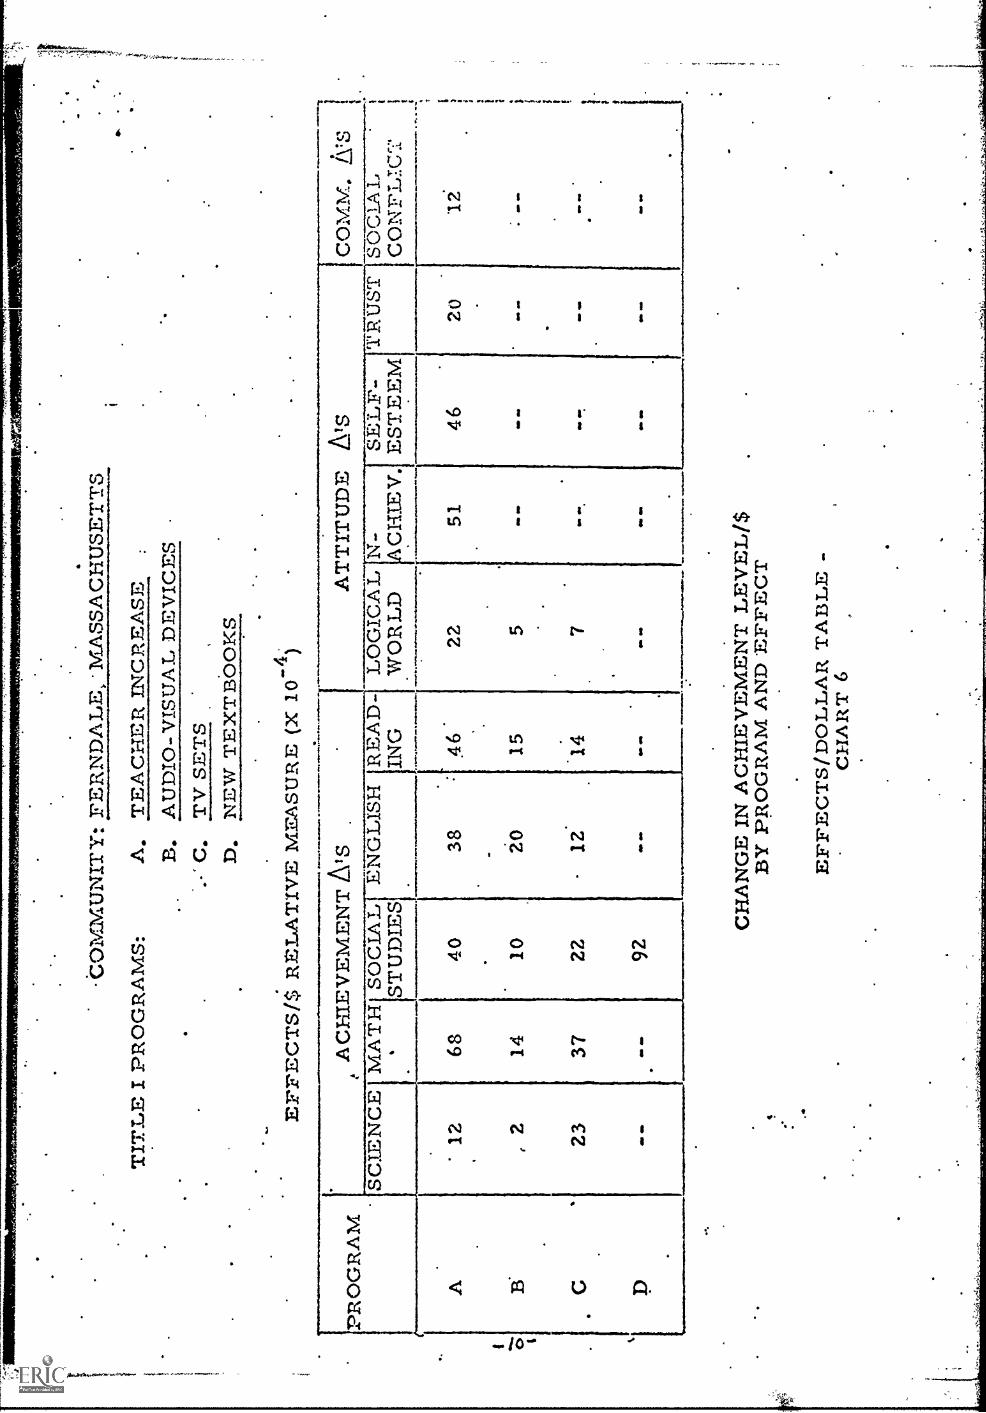
0
ZSI
PON
IMM
OV
NIM
MIN
EFl
ir...
""1.
51":
7`',5
S
CO
MM
UN
ITY
: FE
RN
DA
LE
, MA
SSA
CH
USE
TT
S
TIT
LE
I P
RO
GR
AM
S:A
. TE
AC
HE
R I
NC
RE
ASE
.
B. A
UD
IO-V
ISU
AL
DE
VIC
ES
.-*
C. T
V S
ET
SD
. NE
W T
EX
TB
OO
KS
EFF
EC
TS/
5,i R
EL
AT
IVE
ME
ASU
RE
(X10
-4)
PRO
GR
AM
A B.
C
SCIE
NC
E'
12 2 23
AC
HIE
VE
ME
NT
Ats
AT
TIT
UD
E A
'SM
AT
H S
OC
IAL
EN
GL
ISH
RE
AD
- L
OG
ICA
L N
-ST
UD
IES
ING
WO
RL
DA
CH
IEV
.
68 14 37
40 10 22 92
38 20 12.
a M
O
46 15 .14
22 5 7
OS
a
51 Gte
OW
on
com
m:.
A's
SEL
F-E
STE
EM
TR
UST
SO C
IA L
CO
NFL
ICT
46 SO
a
20
811
11
CH
AN
GE
IN
AC
HIE
VE
ME
NT
LE
VE
L/$
BY
PR
OG
RA
M A
ND
EFF
EC
T
EFF
EC
TS/
DO
LL
AR
TA
BL
E -
CH
AR
T 6

CHANGES GREATER THAN 1% L VARIABLES(EFFECTS AND RESOURCES) LE;TWEEN BASERUN AND RUN WITH TITLE I PROGRAM .
EFFECTS:INCREASES PERCENT
MATH ACHIEVEMENT 10%
SOCIAL ADJUSTMENT 5%-
DECREASES
LANGUAGE SKILL -
RESOURCES:
INCREASES
. TEACHERS + 10%
AUDIO-VISUAL DEVICES + 20%
(TOTAL CHANGE +54 VALUE UNITS)
CHART 7 - EFFECTS AND SEVERAL RESOURCE INPUTS

CO
MM
UN
ITY
:FE
RN
DA
LE
L M
ASS
AC
HU
SET
TS
PRO
GR
AM
C. T
V S
ET
S
RE
SOU
RC
E: 1
0 T
V S
ET
S
.1
.1
.2
.2,1
1111
.0~1
111,
.3
.
A A
Cth
EV
EM
EN
T/T
V S
ET
SCIE
NC
EM
AT
H S
OC
IAL
EN
GL
ISH
RE
AD
ING
LO
GIC
AL
N-
SEL
F-T
RU
STST
UD
IES
WO
RL
DA
CH
IEV
. EST
EE
M.
AC
HIE
VE
ME
NT
AT
TIT
UD
E
% C
HA
NG
E B
Y C
AT
EG
OR
Y P
ER
RE
SOU
RC
E U
NIT
CH
AR
T 8
- E
FFE
CT
S/R
ESO
UR
CE
S O
UT
PUT
1011
1111
0/11
111.
1111
.110
1/1/
0101
111.
11..
SOC
IAL
CO
NFL
IC
CO
MM
.

c
.
Hot doe:, the simulation oper;.:ttf to produce these results?Chart 9 shen s the simulation and its operation. For further detail,
on this rather technical side of the cost-effectiveness model design. See
the memo written by Hodder and Miller which covers the subject in moredetail.
41
A problem which may be of more interest to the user is: how doesthe simulation look to me? Chart 10 describes the interaction of the userand tin computer from the data-gathering stage until the final output is re-ceived from the simulation. This chart also is described in the memo
.referenced above.
If the user desires more detailed information on the simulation pro-
cess in general or the three parts of the computer program shown in Chart9, this detail will also be found in the simulation memo. There areflowcharts which show, in more detail, the operation of each of the three
parts of the computer operation of the overall evaluation tool.

COST-EI.'FECT/VY:N.r..:SS 53.M.ULT:ON - OEDATA PRY.;PARATION
ETITLE?POPOSAL1:1EQUESTS
COMM..DATA
QUESTION..N.AIRE
c_____ ..r\ cosi%,_,.:. NA LI'SJ..-.
JUDGMENTME T 14-2, RS
.m0 1. 0 %ammo= wwwe 40.0.1m ...aaa.
SII\ILTLA TION
MODELOPERATION
Oewmen Orem
ANALYSIS
EDIT
I
EXECUTIVECONTROLSYSTEM
SIMULATIONHISTORY TAPE
COST-EFFECTIVENESSi*GENERATOR
ANALYSISEXECUTIVE
SYSTEM
V
DATA BASEMGMT,SYSTEM
TITLE IPROPOSA
NA LYSIS
EXCEPTIONREPORT
RUN CONTROL
144,
-DATA BASEINPUT TAPE1
I
)
4ASELINE ?ESULTSITLE I IM A C.1.M. CHANGE
EFFECTSPERCOSTS
CHART 9
.14-
,....,
COMPARISON OFTITLE I PROPOSALRESULTS AGAINST.BASE LINE.

TA
0 0U 1 C C06606-
ITS*24. T ION DIA..../Oneration
i 11Field Filled cut ques-
tionnaire andTitle I proposal
PictorialComm. data
Data processing I Convert data to 1
facility punched cardsLLECt.C101\17 Machine pro-
' cessing
User error7 -analysis
TA
User errorcorrection
I Run editing andcost analysisprograms
I Determine cox...I rections needed
Prepare datadecks
I
SE User run control! Prepare.EPARATION preparation 1
I Machine pro--1 cessing
1
;
1
run deck
Run data base1.managementsystem
Data processing I Save data baseI tapeT facility
w ft 06 I. ft I.
ERA TIONMachineccssinss
06 06 or . 41. a. 06
ALYSIS
pro-..
J User dataanalysis
1
User request fors Run analysis,r additional in- system with con- I
formation trol cardi
Further detaileddata analysis
4.
1
Comm. datacontrol
run deck
't
i Run simulation 9Save output tape 1
IData Analysis
1
1
1 .
Data Base Input Tape
. Title I
cost-.u analy.
Title Idata
data base mgrnt.
outputtape--
resultsTitle I CE1baselineresults otp
.1 -
---,1 User analysis Ig I.800 a 06 4 16 ant ..... . . Om . . . ......... elt
-CHART 10
.

NATIONAL CENTER FOR EDUCATIONAL STATISTICS
Division of Operations Analysis
.A COST-EFFECTIVENESS MODEL FOR THEANALYSIS OF TITLE I ESEA PROJECT PROPOSALS
PART VII
THE SIMULATION
Prepared for the Division of Operations Analysis
by
Abt Associates, Inc.Under Contract No. OEC 1-6-001681-1681
(
Technical NoteNumber 20
December 9, 1966
1
OFFICE OF EDUCATION/U.S. DEPARTMENT OF HEALTH, EDUCATION, AND WELFARE

'' ,
4"
fa. 1,444.Y* 14441.
4 e 'Cr".

PREFACE
This Technical Note is the seventh part of a seven -part issuewhich describes a Cost-Effectiveness Model for the analysis of.Title I ESEA Project Proposa13. 'The seven parts aie:
TN-14 Part I - An Overview of the Cost-Effective-ness Model and Submodels for the
"Evaluation of Title I ESEA Proposals
TN-15
TN-16
TN-17
TN-18
TN-19
TN-20
Part II - The School Submodel
Part III- The Instructional Process Submodel-
Part IV - The Community Submodel
Part V - The Cost Submodel
Part VI - The Effectiveness Submodel
Part VII- The Simulation
The model was developed by Abt Associates, of Cambridge,Massachusetts, for the Division of Operations Analysis, NationalCenter for Educational Statistics, under contract number OEC 1 -6-001681 -1681.

4
7
1. Introduction
...
THE SIMULATION .
C,
1..444
The simulation will be used by the Office of Education to evaluateprograms in particular communities. It will not be used explicitly to allo-cate all Title I money in an optimal way; the model will not tell us to spend.$300, 000 in district A, $20, 000 in district B, and so on for all of Title I..Rather it will tell the user that for community A, program I yields betterresults for less money than program 2. The simulation will be an evalua-tion and planning tool, not a research instrument.
The model will compare the effects and costs of programs or corn-.binations of programs with a set of basic effects and costs which derive fromthe school districts' operation without changes. In computer terms, we willcompare alternative program runs with the base run.
Although research use is not the goal of our model development effort,it will be necessary for the user to have the opportunity to investigate indepth the results of program's a lid the working of the model. This option forin-depth investigation will enabit: tic user to develop his confidence in andfacility with the model to whatever level of detail he desires. The user mayhave a particular area of interest in which he wishes to observe changes invariables which are not summarized in the print;.out for the ordinary user.He should be able to investigate these changes.
The three areas of concern for the simulation are:1) Data base preparation,2) Model. operation, and3) Cost-effectiveness analysis and presentation of results.
These three areas are linked by three executive systems:1) The Data Base Management System,2) The Executive Control System for model operation,ana3). The Analysis Control System for cost-effectiveness compu-tation and output display.
Each of the three executive systems handles. the computer operations of data
input, sequencing of activities, 'and generation of output.
1--

Figure I shows these three systems separated by clashed.horizontallines. The Title I proposal and community data are connected to punchedcards, examined for error, combined with the judgment parameters set bythe designers, and assembled on the database input tape. After modeloperatiOn, the collected data is analyzed and user reports are produced.
,
. -2
.
,r, , C,0` 0.

COST-EFFECTIvENESS SIMULATION -.OEA TA PREPARATION
COSTNALYSI
TITLE IPROPOSA
NALYSIS
&IP
*
COMM.DATA -.4:4 I
QUESTIONNAIRE
1
EXCEPTIONREPORT
JUDGMENTPARAMETERS
OINNIOD Manna. OMMIO MIMEO MOINES* GOMM&
SIMULATION
MODELOPERATION -II-
..
to11
EXECUTIVECONTROLSYSTEM
- aANALYSIS
SIMULA TIONHISTORY TAPE
I COST-EFFECTIVENESS
GENERATOR I>.
_ammo; amiam
DATA BASEMGMT.SYSTEM 4
DATA BASEINPUT TAPE 1
I
I
I
.1
-i
RUN CONTROL
..-0- ITLE I IMPAC
EP
4
ASELINE " ESULTS
. I 0 M CH NGEFFECTSPERCOST
ANALYSISEXECUTIVE
SYSTEM --4t COMPARISON OFTITLE I PROPOSALRESULTS AGAINSTBASE LINE....
FIGURE I -3-

Z. Umr Interactions
The simulation has been designed to maximize the quality of the dataused. Editing and analysis routines have been provided to check for errorsof omission, inconsistencies, and reasonableness of both the Title I and
.1..
community data.Outputs are prepared automatically' when exceptions occur, pinpointing
source data errors. Model and Cost-Effective results are presented asoverviews, but the simulation allows further in-depth analysis upon requestwithout rerunning the model.
Community data is saved on the data base input tape. Title I resultsare saved on the simulation output tape. These two tapes separate the three
.
main simulation areas. Operation of the data base management system resultsin the data base input tape, simulation operation results in the simulation outputtape, and analysis results in user displays.
Figure II depicts the interaction points and shows the sequence ofevents (vertically), the source of the operation (field, data processing, or user),the actual operation performed (data preparation, system operation, or dataanalysis), and the major stop points (horizontal dotted lines). An example of atypical sequence might be as follows: A Title I proposal has been received andis to be evaluated. The proposal data is key punched and checked and an errorreport is produced. The errors are corrected and the data base tape is prepared.This tape is saved in case other Title I proposals are made for this school dis-trict. The. model is then operated and a Simulation Output Tape is generated.This tape is also saved to allow in-depth analysis of results at a later time.Analysis of generate.d data takes place using the Output Tape and reports areproduced for the Title I target population. After user analyses of these reports,a request may be made to produc certain in-depth data. In this event, a control'card containing the data request will produce further specified reports.
a
-4.-
,`,. 1 ...7. -,.. , ; ... .4.8.../T,v1 ,

1
T Field
-L
Source
TA1
OLLECTIONT1
USER INTERACTION DIAGRAdi
Data processingfacility.
Machine pro-cessing;
User erroranalysis
Operation.Filled-out ques-tionnaire and
I Title I proposalConvert-data to.punched cardsRun editing andcost analysisprogramsDetermine cor-rections needed
1
!Comm. data
1>
1
1
1
i edit--ling
Pictorial'
4. User error Prepare dataTA I correction decksSE. .i.. User run contra Prepare run deck
REPARATION preparationMachine pro- ' Run data basecessing management
systemData processing I Save data basefacility I tape
p.
ERATION I
Machine pro-ceasing
MD MO
ALYSIS
0 40010.80010411.
tiv;-.4.,' A"'
1
User dataanalysis
Run simulationI Save output tape 1
Comm. datacontrol
run dick
Title I
---costanaly.
owaw...4
Title Idata
data base mgmt.
Data .Babe Input Tape
IData Analysis
I
St
I User request4+ additional in-
! formation .
T User analysis
fort Run analysisI system with con-trol card
1.
I Further detailedI data analysis
atioou°
out put-taseline Title I
results results
FIGURE II
5-

3. The Data Base Management System
The management system performs three basic functions:1) Cost Analysis of the Title I proposals;2) Editing of the keypunched community data;3) Preparation of the data base input tape.
Figure III illustrates operation of the management system. The Edit and CostAnalysis programs are operated on the punched cards to produce exception*reports. This prevents erroneous data being used by the model, and wastedcomputer runs.
After these decks have been corrected, they are entered on the database input tape and sumrary profiles are reported to the user. The profilessummarize the data by target student population, by target curriculum, andby other Title I impacts.
3. 1 Cost Analysis
The cost analysis compares pre-stored item costs with proposedexpenditures and computes the total program cost for later use in the AnalysisExecutive Control System.
3.2 Edit
The edit functiorr picks up invalid keypunched characters, omissions,incorrect values, and inconsistent data. An exception report listing each in-correct card is produced to isolate problems.
3.3 Preparation of Data Base
The data base contains two basic kinds of data: 'empirical data des-cribing the community; and generated data based on statistical distributions,for example, student characteristics. A profile generator creates student,teacher, and curriculum profiles to be used by the, model. The data basegenerator combines these profiles, with the empirical data, and the Title Iprofile (the effects represented by the Title I request), and with other modelcoefficients, constants, and costs to create the data base tape. The tape con-sists of several records. Record I contains the basic cost data to be used bythe Analysis Executive. Record II contains the base-line data base, RecordsIII to N each contain the specific Title I profiles associated with the proposal.A control variable (NRUN) indicates the number of Title I profiles to theExecutive Control System. 6-

DIT (KEY-PUNCH ERRORS,MAJOR INCON-SISTENCIES, &
(CORRECTED)
f
PROFILEGENERATO
DATA BASEGENERATO
FOR MODEL.
FIGURE III
DATA BASE MANAGEMENT SYSTEM
a
o in a a a =, ..4SII I a
ERRORLISTING
CARDPUNCH
(CORRECTED).
BASIC ..,OST V
ATA TITLE ICOST
ANALYSIS
PER ONAL--....--.01. (STUDENT
TEACHER)PROFILES
JudgmentParameter
(
ATA BASEAPE
8
Yr-NTKVTO EXECUTIVE6-iNTROL SYSTEM FORSIMULATION(MODEL OPERATION)
3.11==.10...
RUN CONTROL

4. A Method for Operating, the Simulation
There is a need to make each simulation run rapidly and efficientlyin order to analyze many communities and many proposals at minimum cost.One way to achieve this is to operate the simulation only over the subset ofthe total school district directly affected by the Title I proposal. The re-quirement for data with which to operate the simulation will be directlyaffected by this operation. Only micro-data specific to the proposal targetgroup need be collected from the school system.. For example, a proposedremedial reading program for the elementary school will not require thecollection of all Junior and Senior High Schonl statistics. The school super-intendent will be required to collect only the data needed to support his proposal.
4. 1. Implications for Simulation Operation & Display
Exposing only the target population to the Title I programs impliesadded constraints on the simulation control system. Parameters must beprovided to adjust operation of the simulation chosen target group. Thesimulation display can be tailored directly to the Title I target group.
Simulation control must be able to expose as small a populationgroup as a single classroom, and as large a population group as the entireschool district. Decision rules for aggregating displays for the latter caseare needed, to prevent exposing ;:e. user to a large amount of data.
4.2 Trade-offs and Costs
Consider two alternative methods of operating the simulation:1) Focussed s:raulation runs exposing only the target group,2) Fixed runs exposing the entire school district.
Focussed Simulation Runs increase the cost of construction, and decrease thecost of data collection to provide increased flexibility of use and short runtime. Fixed Simulation Runs decrease the cost of construction, maintain a.high fixed cost of data collection, but.'decrease ale flexibility and speed of
.
recom-mended,
Alternative one affords direct user benefits and is therefore recom-mended,

5. Executive Control System
The executive control system performs three principal functions:Run control, Model operation, and Simulation result recording. Figure IVrepresents the Control System operations. Input is from the data base inputtape and output is recorded on the Simulation Output tape. The cost-datarecorded in Record I of the data base input tape is written as Record I onthe output recording tape for later use by the analysis control system. Suc-cessive files on the output tape represent sequential run results. The fiNstrun is defined as th4 baseline . There is a run for each Title I proposal.The output tape provides a history of simulated results for each communityboth with and without Title I programs.
5.1 Run Sequencing
4.
The function of run sequencing is to reset the model data base withthe proper settings in order to execute each of the comparative simulationruns. The base-line run is followed by runs incorporating each of the Title Iproposals. The data base is restored from the. data base input tape. SpecificTitle I profiles are added and the model is operated.
5.2 Model Operation & Recording
The function of this aspect of executive control is the sequencing ofthe model subroutines and data bas.e recording. The order of model routinesis: Target Group Exposure, Instructional Process, School Network, Com-munity Effects at the end of each sequence the data base is recorded on tape.Separate parameters are used to identify the particular target groups who willbe exposed to the Title I programs.

DATA BASEINPUTCAPE..
FIGURE IVEXECUTIVE CONTROL SYSTEM
LINK START
COST PARAMETERECORDING
.
INITIALIZATIONBASE-LINEDATA BASE
at
CALIBRATION OFINSTRUCTIONAL
PROCESSPARAMETERS
BASELINERUN...
RUNEQUENCING
A
LINK ANALYSISU SYSTEM
MODELOPERATION
RECORDING
'-10--
CtUTPUTRECORDINGTAPE
.

e
6. Analysis Executive Control System_
The analysis system provides routines to evaluate the simulationresults in terms of educational effects, costs, value of the effects, andresources. Comparison of the effects with Title I are compared with thebase line to provide an indication of the value of each program proposed.The value of the program is.dividedby cost to yield an indication ofcost-effectiveness. Figure V illustrates the sequence. Input is derivedfrom the Simulation Output tape, and all output is in the form of user.reports. _
. r. -11

e
I.
-`,
Simulation(Base-Line)Results .
Simulation(Title I)Results
Emphasis-ImportanceValues
Program CostsandResource Needs
.
FIGURE V
ANALYSIS EXECUTIVE SYSTEM
Link Start
BASE-LINEANALYZER
I
BASE-LINERESULTS
comm71CHANGE REPORT
TITLE I TITLE 7EFFECT 0- IMPACT
GENERATOR REPORT
VALUEGENEP 4iTOR
d-COST-
FFECTIVENESSGENERATO
C x
6FFEcTisi
EFFECT
RESOURCE
-12-
VA LU
RESOURCE

TIT
IS
OU
TPU
T D
ISPL
AY
--D
ESI
GN :R
.
AN
AL
YSI
SE
XE
CU
TIV
E--
DE
SIG
N--
CO
NST
R.
EX
EC
UT
IVE
CO
NT
RO
LSY
STE
M
MO
DE
LD
ESI
GN
--C
ON
STR
.--
TE
ST
SIM
UL
AT
ION
PL
A \r
ictI
NG
SC
HE
DU
LE
I
DA
TA
MA
NA
GE
ME
NT
S1S
TE
M
SYN
TH
ESI
S
OPE
RA
TIO
N(D
..C. )
I
I
'
1101
1,.
c.
Sept
.O
ct.
Nov
.D
ec.
Jan.
.Fe
b.M
arch
Apr
.M
ayJu
ne
1966
196?
t

t" Estimated Computer Operating Time for Education Cost-EffectivenessModel1111111I'.1111.11
1. GeneralThe current design is presently estimated to have. about a five
minute operation cycle for each Title I proposal per community; cin theRCA 3301 computer. This excludes data base makeup and analysis of data.The contributions to the five minute cycle are:
Initialization 2:0 min.Instructional Process 1.0 minSchool Network .5 minRecording 1. 5 min
5.0 min
2. The School NetworkThe timing is dependent on two factors: The number of network
nodes or cells, and the number of operations/node or cell. The number ofnodes is :LI 3 courses of study x 2 income groups x 2 races x 6 achievementcategories x n grades affected
or 72n nodes.We can estimate 100 instructions/node @ 51.isec/instructor.
Hence: .036n seconds.
HeadstartFourth GradeSecondary School
n Time
12
8
4
1/2 second1/3 second1/6 second
The actual network operation time is not the critical factor. Ratherthe critical time factors are: calibrating the instructional process, ini-tializing the data base from tape, and recording data on tape.
ti
44rawrftwyscww.a....m.m.11r)wwpwron