report rep high-frequency trading in australian equities ... · trading. it analyses specific...
TRANSCRIPT

REPORT 597
High-frequency trading in Australian equities and the Australian–US dollar cross rate
November 2018
About this report
This report presents findings from ASIC’s 2018 review of high-frequency trading. It analyses specific trading attributes associated with high-frequency trading in equities and wholesale foreign exchange (FX) markets.
It builds on our previous reports into high-frequency trading: Report 331 Dark liquidity and high-frequency trading (REP 331) and Report 452 Review of high-frequency trading and dark liquidity (REP 452).
The purpose of this report is to inform investors and consumers, market participants and listed entities about the markets in which they invest, raise capital and manage risk.

REPORT 597: High-frequency trading in Australian equities and the Australian–US dollar cross rate
© Australian Securities and Investments Commission November 2018 Page 2
About ASIC regulatory documents
In administering legislation ASIC issues the following types of regulatory documents.
Consultation papers: seek feedback from stakeholders on matters ASIC is considering, such as proposed relief or proposed regulatory guidance.
Regulatory guides: give guidance to regulated entities by: explaining when and how ASIC will exercise specific powers under
legislation (primarily the Corporations Act) explaining how ASIC interprets the law describing the principles underlying ASIC’s approach giving practical guidance (e.g. describing the steps of a process such
as applying for a licence or giving practical examples of how regulated entities may decide to meet their obligations).
Information sheets: provide concise guidance on a specific process or compliance issue or an overview of detailed guidance.
Reports: describe ASIC compliance or relief activity or the results of a research project.
Disclaimer
This report does not constitute legal advice. We encourage you to seek your own professional advice to find out how the Corporations Act and other applicable laws apply to you, as it is your responsibility to determine your obligations.
Examples in this report are purely for illustration; they are not exhaustive and are not intended to impose or imply particular rules or requirements.

REPORT 597: High-frequency trading in Australian equities and the Australian–US dollar cross rate
© Australian Securities and Investments Commission November 2018 Page 3
Contents
Executive summary ................................................................................. 4 High-frequency trading review—Key findings.................................... 4
Australian equity markets ............................................................. 5 AUD/USD cross rate .................................................................... 5 Key statistics ................................................................................ 6
Next steps .......................................................................................... 6 A High-frequency trading ................................................................... 7
Purpose .............................................................................................. 7 Background ........................................................................................ 8 Our definition of high-frequency trading ............................................ 9 How we identified high-frequency trading .......................................... 9
B Australian equity markets ............................................................. 12 Purpose ............................................................................................ 12 Background ...................................................................................... 13 B1 High-frequency trading in Australian equity markets ................. 13
Our approach ............................................................................. 13 High-frequency traders............................................................... 14 Market turnover .......................................................................... 14 Market concentration .................................................................. 16 Percentage of book traded ......................................................... 17 Inventory holding time ................................................................ 18 Number of ‘fast messages’ ........................................................ 21 Behaviour of high-frequency traders’ order books ..................... 22 Order-to-trade ratios ................................................................... 24 Aggressive trading ..................................................................... 26 Cost to investors ........................................................................ 28
B2 Impact of high-frequency trading on price discovery ................. 30 Are market prices becoming more efficient?.............................. 30 Are high-frequency traders contributing to price discovery?...... 32
B3 Summary of key findings ............................................................ 33 C Australian–US dollar cross rate ................................................... 35
Purpose ............................................................................................ 35 Background ...................................................................................... 35 C1 High-frequency trading in AUD/USD cross rate ......................... 40
Our approach ............................................................................. 40 High-frequency traders............................................................... 42 Market turnover .......................................................................... 44 Orders submitted to market ....................................................... 46 Percentage of book traded ......................................................... 47 Inventory holding time ................................................................ 48 Number of ‘fast messages’ ........................................................ 49 Basis points earned .................................................................... 50 Order-to-trade ratios ................................................................... 51 Facilitation by high-frequency traders ........................................ 52
C2 Issues with high-frequency trading in AUD/USD ....................... 53 Intra-platform arbitrages ............................................................. 54 Transaction costs in the AUD/USD cross rate ........................... 56
C3 Summary of key findings ............................................................ 64 Key terms ............................................................................................... 65 Related information ............................................................................... 69

REPORT 597: High-frequency trading in Australian equities and the Australian–US dollar cross rate
© Australian Securities and Investments Commission November 2018 Page 4
Executive summary
1 Speculative trading on electronic markets is dominated by small groups of traders. These individuals and organisations rely on sophisticated and quantitative models to predict short-term price movements. They trade through automated systems that are programmed to assess opportunities, execute orders and manage risk—all conducted with minimal manual intervention. These are the high-frequency traders that have evolved to dominate our trading landscape.
2 While their toolsets have become widely adopted by other professionals, their speed of execution and tight management of risk set them apart from other classes of investors and market users. Their enormous contribution to market activity has made them a focus for regulators.
3 Our study throws light on many of the unobservable practices of high-frequency traders. Using privileged data, we analyse key characteristics of high-frequency trading and place them in the context of wider market practices. We look at measures of market quality affecting the wider market and determine how they are impacted by high-frequency trading.
4 High-frequency trading remains a topical market structure issue. In 2012 and 2015, ASIC taskforces assessed the impact of high-frequency trading on the quality and integrity of our equity and futures markets. These reviews culminated in:
(a) Report 331 Dark liquidity and high-frequency trading (REP 331) and Consultation Paper 202 Dark liquidity and high-frequency trading: Proposals (CP 202); and
(b) Report 452: Review of high-frequency trading and dark liquidity (REP 452).
5 Over 2018, we undertook a further review of high-frequency trading across the Australian equity and wholesale Australian–US dollar (AUD/USD) cross rate markets. This review builds on our earlier analysis of Australian equity markets and extends our oversight into the global FX markets.
High-frequency trading review—Key findings
6 Automated trading dominates the Australian equity markets and FX electronic platforms. Natural investors, risk managers and professional facilitators have embraced the use of algorithms within their executing businesses.

REPORT 597: High-frequency trading in Australian equities and the Australian–US dollar cross rate
© Australian Securities and Investments Commission November 2018 Page 5
7 High-frequency trading is a form of automated trading but is solely directed at extracting short-term, low-risk profits. The tactical advantages enjoyed by high-frequency traders have dissipated as algorithmic execution has grown into a mainstream tool—their industry’s growth has tapered off.
Australian equity markets
8 High-frequency traders retain a large presence within the Australian equity market but their contribution to turnover has weakened. In a growing market, turnover has fallen from 27% to 25%: see paragraphs 46–52.
9 The largest high-frequency traders continue to dominate turnover. Cross-sectional participation declined sharply across the cohort: see paragraphs 53–55.
10 These traders are investing in faster technologies and reacting to similar signals. Speed of execution gives them a competitive edge, but it is not their only measure of success. High-frequency traders are broadening their trading strategies and increasingly taking on more market risk: see paragraphs 56–74.
11 High-frequency traders contribute disproportionately to price discovery, but this utility declines as market volatility falls: see paragraphs 116–120.
AUD/USD cross rate
12 High-frequency traders have a significant presence across global electronic platforms. The market share of high-frequency traders peaked at 35% in May 2013 but has since fallen. They are currently responsible for 25% of multi-dealer platform turnover: see paragraphs 152–161.
13 The number of distinctly different high-frequency traders captured within our dataset continues to decline, but their relative concentration has increased. Volumes within the multi-dealer platforms are falling, and the traditionally dominant venues are losing market share to newer and unlicensed competitors. High-frequency traders are now able to interact with more investors within trading venues with lower regulatory oversight: see paragraphs 140–151.
14 High-frequency traders are adopting riskier strategies. Holding times are increasing and churn rates are falling. Lower liquidity has constrained opportunities; relative performance is better but falling volumes have curtailed industry profitability: see paragraphs 168–183.
15 High-frequency traders are facilitating dealers. They are supplying liquidity disproportionately into higher cost demand. Adverse selection costs borne and managed by high-frequency traders are exacerbated by dealers chasing volume: see paragraphs 224–229.

REPORT 597: High-frequency trading in Australian equities and the Australian–US dollar cross rate
© Australian Securities and Investments Commission November 2018 Page 6
Key statistics
16 Some of the key statistics from our analyses are summarised in Table 1. It shows the relative contribution of high-frequency traders in the Australian equity and AUD/USD cross rate markets. While representing a small portion of market users, high-frequency traders are responsible for a disproportionately large amount of activity.
Table 1: Key summary statistics on high-frequency trading
Measure Equities AUD/USD cross rate
Trading accounts < 0.5% 2%
Turnover 25% 25%
Number of trades 27% 31%
Number of orders 45% 38%
Next steps
17 We will continue to publish equity market data on our website.
18 We will also continue to monitor Australian equity markets and will be commencing a series of onsite visits to organisations involved in FX trading for Australian clients.
19 Changes to the cost recovery regime are impacting the business models of alternative market platforms operating within the Australian jurisdiction. We are progressively engaging with platform providers and will be reaching out to organisations offering institutional trading in foreign exchange to wholesale Australian clients.
20 Feedback on the issues raised in this report is welcome and may be sent to [email protected].
Note: To ensure confidentiality please mark any correspondence as ‘in confidence’.

REPORT 597: High-frequency trading in Australian equities and the Australian–US dollar cross rate
© Australian Securities and Investments Commission November 2018 Page 7
A High-frequency trading
Key points
The scope of our analysis is high-frequency trading within the Australian equity and the AUD/USD FX markets. We seek to inform investors on high-frequency trading and provide transparency on the nature of its interaction with their investments.
The International Organization of Securities Commissions (IOSCO) has defined high-frequency trading as a form of automated proprietary trading using high-speed algorithmic technology to pursue short-term, low-risk profits. Many professional investors also use automated tools to pursue investment mandates.
We constructed an objective index to identify high-frequency traders across the equity and AUD/USD cross rate markets. Inferences on participation, behaviour and impact were drawn out over the span of our surveillance data.
Our approach to identifying high-frequency traders was based on IOSCO’s defining principles. We did not prejudge individuals, entities or organisations. We found that a number of large proprietary trading organisations active within the Australian equity and AUD/USD cross rate markets were regularly captured by our methodology.
Purpose
21 Financial markets are a key component of infrastructure supporting Australian economic development. They facilitate and inform the flow of capital between investors and businesses, and provide tools for hedging and managing many types of economic risks. Their size and complexity have generated an ecosystem of financial intermediaries seeking to extract marginal value from this natural flow of funds.
22 High-frequency trading is an example of financial intermediation developed to exploit modern electronic markets. High-frequency traders do not invest and have no ongoing interest in the businesses or products of their transactions. They exploit technological advantages in pricing and execution to trade inefficiencies within an imperfect market. Their scale of activity, depth of presence and potential to affect price formation make them a point of interest to all custodians of market efficiency, fairness and integrity.
23 Concern with high-frequency trading peaked in 2014 following the release of Michael Lewis’ Flash Boys: A Wall Street Revolt. This book popularised the notion of a systemic fault in market microstructure allowing traders to

REPORT 597: High-frequency trading in Australian equities and the Australian–US dollar cross rate
© Australian Securities and Investments Commission November 2018 Page 8
front-run investor orders using high-speed computerised trading systems. Our 2015 report found no evidence of this behaviour within our equity or futures markets, and industry’s immediate concerns with this form of trading have abated.
24 In this study we update our estimates of high-frequency activity within the Australian equity market and provide an additional measure of impact on market quality by high-frequency trading. We also extend our study into the global AUD/USD FX market. We analyse trading by global market participants and traders—many of whom operate outside our immediate geographical jurisdiction—and comment on their presence in, and effect on, Australia’s dominant FX market.
25 This section outlines how we defined and identified high-frequency trading within our markets. In particular, we discuss:
(a) our approach to defining a behaviour that constitutes high-frequency trading (see paragraphs 29–31); and
(b) how we profiled our surveillance data to identify high-frequency traders (see paragraphs 32–38).
Background
26 High-frequency trading remains an area of interest to ASIC. Our market surveillance system continues to monitor the Australian equity, equity derivatives and futures markets for suspicious and disorderly activity.
27 In REP 452, we discussed our concerns about a practice of excessive trading by some traders in the ASX 24 futures roll market—a practice we considered was problematic to other users of that market. In 2017, we issued an infringement notice against a proprietary trading organisation in relation to its trading within the 10-year Commonwealth Treasury Bond roll. The Markets Disciplinary Panel alleged breaches of Rule 3.1.2 of the ASIC Market Integrity Rules (ASX 24 Market) 2010.
Note: See Media Release (17-461MR) Epoch Capital Pty Ltd pays $130,000 in infringement notice penalty.
28 We also investigated AUD/USD cross rate markets in the context of the Reserve Bank of Australia (RBA) cash rate announcements following concerns that early 2015 rate decisions may have been leaked. We found no evidence of informed trading. However, we did conclude that some high-frequency traders ran potentially dysfunctional algorithms. We noted simplistic scalping strategies that were ill-suited to markets of low liquidity. Much of the price volatility observed before rate announcements was driven by cascading high-frequency scalpers off-loading small but poorly timed risk inventory.
REPORT 597: High-frequency trading in Australian equities and the Australian–US dollar cross rate
© Australian Securities and Investments Commission November 2018 Page 9
Our definition of high-frequency trading
29 High-frequency trading has been described in various ways. Consistent with our previous approach, we relied on an IOSCO definition which identified high-frequency trading as:
(a) the use of sophisticated technological tools to pursue a range of strategies, such as market making and arbitrage;
(b) a highly quantitative tool that employs algorithms to analyse market data, deploy profit-seeking strategies, and minimise trading costs and execution instructions;
(c) characterised by a high daily turnover and high order-to-trade ratios (i.e. large numbers of orders are cancelled in comparison to trades executed);
(d) involving flat or near flat positions at the end of the trading day, meaning that little or no risk is carried overnight, with obvious savings on the cost of capital associated with margined positions;
(e) mostly employed by proprietary trading firms or desks; and
(f) latency sensitive. The implementation and execution of successful high-frequency trading strategies depend primarily on the ability to be faster than competitors and to take advantage of services such as direct electronic access and co-location.
Note: Technical Committee of IOSCO, Regulatory issues raised by the impact of technological changes on market integrity and efficiency (PDF 587 KB), consultation report, July 2011.
30 Many of these characteristics have been adopted by other participants across the market. Automation is now the norm among the market’s larger participants where economies of scale and modern trends have tilted businesses towards the adoption of algorithms.
31 Our analysis consistently identified a small cohort of entities with behaviours that matched the characteristics of high-frequency trading described by IOSCO. These entities represented a small percentage of market users but projected an enormous presence into the market. We refer to these entities as ‘high-frequency traders’.
How we identified high-frequency trading
32 To identify high-frequency trading we scored individual traders daily across six measures motivated by IOSCO’s characteristics (see paragraph 29) of high-frequency trading.
REPORT 597: High-frequency trading in Australian equities and the Australian–US dollar cross rate
© Australian Securities and Investments Commission November 2018 Page 10
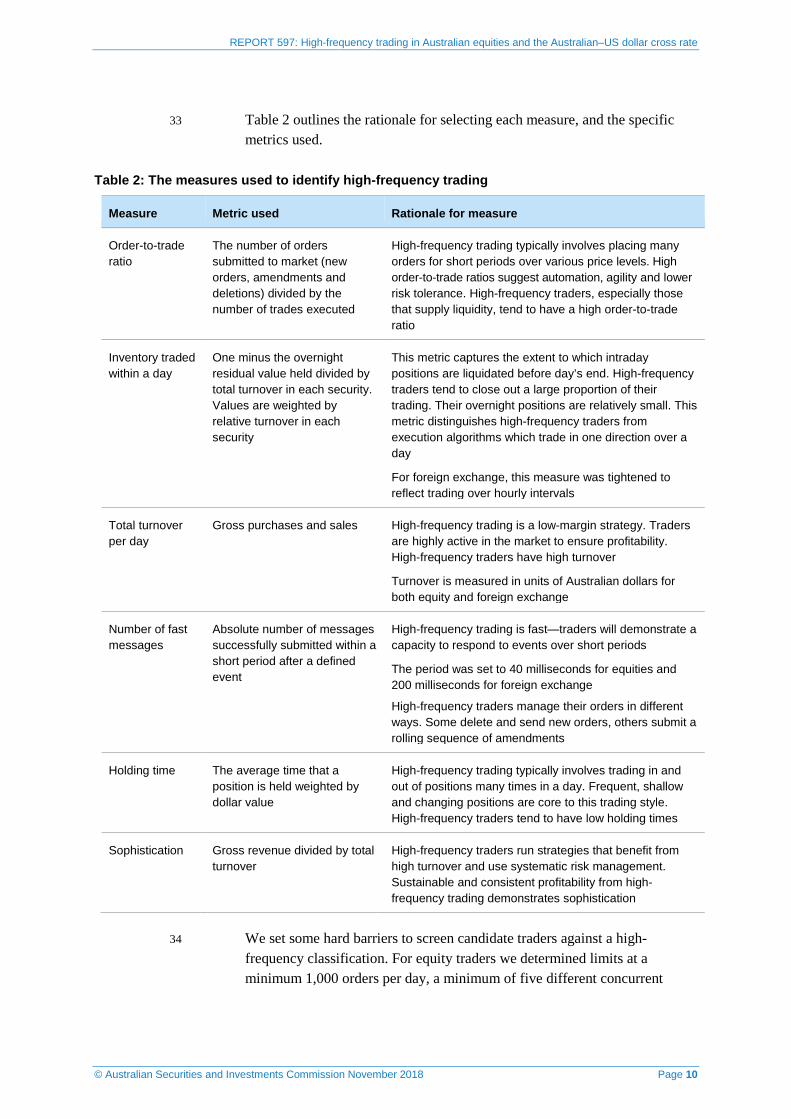
33 Table 2 outlines the rationale for selecting each measure, and the specific metrics used.
Table 2: The measures used to identify high-frequency trading
Measure Metric used Rationale for measure
Order-to-trade ratio
The number of orders submitted to market (new orders, amendments and deletions) divided by the number of trades executed
High-frequency trading typically involves placing many orders for short periods over various price levels. High order-to-trade ratios suggest automation, agility and lower risk tolerance. High-frequency traders, especially those that supply liquidity, tend to have a high order-to-trade ratio
Inventory traded within a day
One minus the overnight residual value held divided by total turnover in each security. Values are weighted by relative turnover in each security
This metric captures the extent to which intraday positions are liquidated before day’s end. High-frequency traders tend to close out a large proportion of their trading. Their overnight positions are relatively small. This metric distinguishes high-frequency traders from execution algorithms which trade in one direction over a day
For foreign exchange, this measure was tightened to reflect trading over hourly intervals
Total turnover per day
Gross purchases and sales High-frequency trading is a low-margin strategy. Traders are highly active in the market to ensure profitability. High-frequency traders have high turnover
Turnover is measured in units of Australian dollars for both equity and foreign exchange
Number of fast messages
Absolute number of messages successfully submitted within a short period after a defined event
High-frequency trading is fast—traders will demonstrate a capacity to respond to events over short periods
The period was set to 40 milliseconds for equities and 200 milliseconds for foreign exchange
High-frequency traders manage their orders in different ways. Some delete and send new orders, others submit a rolling sequence of amendments
Holding time The average time that a position is held weighted by dollar value
High-frequency trading typically involves trading in and out of positions many times in a day. Frequent, shallow and changing positions are core to this trading style. High-frequency traders tend to have low holding times
Sophistication Gross revenue divided by total turnover
High-frequency traders run strategies that benefit from high turnover and use systematic risk management. Sustainable and consistent profitability from high-frequency trading demonstrates sophistication
34 We set some hard barriers to screen candidate traders against a high-frequency classification. For equity traders we determined limits at a minimum 1,000 orders per day, a minimum of five different concurrent

REPORT 597: High-frequency trading in Australian equities and the Australian–US dollar cross rate
© Australian Securities and Investments Commission November 2018 Page 11
securities, a maximum three-hour holding period and a minimum turnover of $100,000 per day.
35 In foreign exchange, the minimum number of securities was removed and the turnover barrier raised to $20 million.
36 Individual traders were scored and ranked across each metric. Each trader’s score was then determined by adding together their six rankings. Traders with an overall score equal to, or greater than, a threshold percentage of the top score were identified as the day’s high-frequency traders. Respective thresholds of 50% and 70% were used for equity and foreign exchange.
37 This process was repeated daily for all traders within our surveillance data.
38 Our method of identifying high-frequency traders was data driven. It was objective and derived from observed behaviour. We made no predetermination on inclusion but some large omnibus-type accounts were specifically excluded. While there was movement into and out of the high-frequency trader classification, a number of identified trading accounts, and entities that operated business models generally considered to be high-frequency trading, did tend to fall into this category on a consistent basis.

REPORT 597: High-frequency trading in Australian equities and the Australian–US dollar cross rate
© Australian Securities and Investments Commission November 2018 Page 12
B Australian equity markets
Key points
We analysed trading in Australian equity markets over the period March 2015 to March 2018 to assess recent levels of high-frequency trading and the behaviour of high-frequency traders. We compared current findings with those made in our 2015 review.
The level of high-frequency trading in equity markets has fallen over the past three years. A steady downtrend in participation rates has high-frequency trading accounting for 25% of all turnover. Participation has fallen strongly across higher capitalisation securities. Concentration has weakened slightly with the 10 largest high-frequency traders accounting for 74% of all high-frequency trading turnover. Activity continues to increase outside of the top 200 securities.
High-frequency traders are becoming faster but the technological arms race is producing minimal gains. Profitability is stagnant, and the cost imposed on other intermediated market users is falling.
Order-to-trade ratios continue to fall but remain susceptible to price-sensitive events. Ratios can quickly revert with bursts in market volatility.
Predictive algorithms are feeding into short-term price moves. High-frequency traders are contributing disproportionately to short-term price discovery; however, the derived public benefit varies across both capitalisation and volatility. High-frequency traders are capturing economic liquidity rental in lower capitalised securities under conditions of low volatility.
Purpose
39 This section outlines the findings of our high-frequency trading review into the Australian equity markets.
(a) Section B1 High-frequency trading in Australian equity markets summarises the characteristics of high-frequency trading in the Australian equity markets in the 300 highest capitalised securities: see paragraphs 44–102.
(b) Section B2 Impact of high-frequency trading on price discovery presents our findings on the impact of high-frequency trading on the market’s price discovery process: see paragraphs 108–120.

REPORT 597: High-frequency trading in Australian equities and the Australian–US dollar cross rate
© Australian Securities and Investments Commission November 2018 Page 13
Background 40 REP 452 quantified the presence of high-frequency traders across the
Australian equity markets. In March 2015, they accounted for 27% of all market turnover and 45% of all orders submitted to market.
Note: We have revised REP 452’s estimate of order share from 47% to 45%. Paragraph 43 explains a slight change in methodology afforded by ASIC’s regulatory data feed introduced in March 2014.
41 REP 452 concluded that wider concerns with predatory behaviour could not be attributed to high-frequency trading across our market. While acknowledging the speed and operational advantages of these traders, we determined that most occurrences of latency arbitrages evident in the market history were artefacts of clock drift between exchanges.
42 In REP 452, we also examined high-frequency trading’s effect on institutional transaction costs and found little evidence of systematic front-running, price gouging or volatility creation. We placed a relatively benign estimate on high-frequency facilitation costs, marking trader liquidity as reasonably priced within the context of wider competitor flow.
43 This report looks at recent trading with minor changes to methodology. We now use ASIC regulatory data field ‘origin of order id’ to aggregate activity into individual traders. We also collate security quartiles by market capitalisation, rather than turnover. These changes are minor and created minimal revisions to previous estimates in earlier reports.
B1 High-frequency trading in Australian equity markets
Our approach
44 We analysed trading data across exchange markets and dark trading venues in equity market products over the period 1 January 2015 to 31 March 2018. Our estimates of presence and impact were calculated daily. Our observations focused on trends and patterns of behaviour. Any commentary on observations has been made against a three-month rolling average. Any commentary on change has been made over a three-year period commencing 31 March 2015 in line with the endpoint of our 2015 report.
45 Unless stated otherwise, our analysis was based on the top 300 securities for each trading day. We ranked all securities in the equity markets each day by market capitalisation (the largest security by capitalisation was ranked 1) and separated them into five bands:
(a) Quartile 1: Securities ranking 1 to 50;
(b) Quartile 2: Securities ranking 51 to 100;
(c) Quartile 3: Securities ranking 101 to 150;

REPORT 597: High-frequency trading in Australian equities and the Australian–US dollar cross rate
© Australian Securities and Investments Commission November 2018 Page 14
(d) Quartile 4: Securities ranking 151 to 200; and
(e) 200–300: Securities ranking 201 to 300.
High-frequency traders
46 The number of individual accounts identified as engaging in high-frequency trading remained small. Over the three-year period of our study there was minimal change in the number of high-frequency traders. A sharp increase in classification did occur over August 2015 following the shock devaluation of the Chinese yuan. Market volatility preceded a decline in market levels to January 2016 lows and led to a temporary increase in the number of identified high-frequency traders over an eight-month period. While their numbers fell in 2017, they reverted to end the period relatively unchanged.
47 Total market turnover by high-frequency traders reflected this dynamic. Strong growth in relative turnover peaked at 33% in October 2015 in line with market volatility (see paragraph 46), and participation fell as that volatility settled.
48 We found that high-frequency traders accounted for 25% of all market turnover. This represented a relative fall of 8% (or two percentage points) from its 27% level in March 2015.
Market turnover
Figure 1: Market turnover rates for high-frequency traders
16%
20%
24%
28%
32%
36%
Mar-15 Sep-15 Mar-16 Sep-16 Mar-17 Sep-17 Mar-18
Mar
ket s
hare
Quartile 1 Quartile 2 Quartile 3 Quartile 4 200-300
Note: The data and key trends shown in this graph are described in paragraphs 49–51 (accessible version). The selection criteria for the security categories are described in paragraph 45.

REPORT 597: High-frequency trading in Australian equities and the Australian–US dollar cross rate
© Australian Securities and Investments Commission November 2018 Page 15
49 Subtrends within the market data stood out and participation rates varied across the market over the period. Figure 1 illustrates this divergence. It charts the relative contribution of high-frequency traders to turnover across the market’s capitalisation bands.
50 High-frequency participation within the lower end of the market continued to grow. Outside of the top 200, within the 200–300 range, high-frequency trading accounted for 21% of all turnover, a 14% increase from March 2015. This is consistent with a trend in low dollar stocks noted in REP 452. Manual day-traders traditionally focused on scalping the bid–ask spread are now competing directly with sophisticated algorithms for the same strategy.
51 At the top end of the market, participation rates have fractured. The largest declines were in Quartile 1 where high-frequency participation fell 12%, to 24% of market turnover. Participation rates were highest across Quartile 3. Table 3 reproduces the trends observed in Figure 1. The increase in relative gains as capitalisation falls is clear across the rankings. These progressively rose from a fall of 12% to a rise of 14%.
Table 3: Market share of high-frequency traders across capitalisation ranks
Band March 15 March 18 Absolute move
Relative move
Quartile 1 27% 24% -3% -12%
Quartile 2 27% 26% -1% -3%
Quartile 3 27% 28% 1% 2%
Quartile 4 24% 25% 1% 3%
200–300 18% 21% 3% 14%
All securities 27% 25% -2% -8%
52 This divergence points to strong competitive pressures between traders. High-frequency participation is in relative decline within the market’s core; cross-sectional growth does exist but it is confined to lower capitalised securities and marginal turnover.

REPORT 597: High-frequency trading in Australian equities and the Australian–US dollar cross rate
© Australian Securities and Investments Commission November 2018 Page 16
Market concentration
Figure 2: Concentration of high-frequency trading activity for the top 10 and 20 traders
50%
60%
70%
80%
90%
100%
Mar-15 Sep-15 Mar-16 Sep-16 Mar-17 Sep-17 Mar-18
Shar
e of
hig
h-fre
quen
cy tr
adin
g
Top 20 Top 10
Note: The data and key trends shown in this graph are described in paragraphs 53–54 (accessible version).
53 In REP 452, we noted a growing trend among high-frequency traders towards greater concentration. Over 2012 to 2015, a smaller number of traders became responsible for a greater share of high-frequency turnover. This trend faltered post-2015 and concentration has levelled out to a more stable range over the past three years: see
54 Of all high-frequency turnover conducted on market, 74% could be attributed to the top 10 traders. This was a fall of 1% from March 2015 levels. Marginal growth across the top 20 traders grew by 1% to represent 95% of all high-frequency turnover.
55 Saturation among the dominant players builds on our observations in paragraph
Figure 2.
52. Larger traders have precipitated a broadening of the security base by expanding into smaller securities. Smaller securities carry different risks to their larger peers. Lower liquidity can leave these securities susceptible to demand imbalances and unpredictable price swings. The pricing models employed by high-frequency traders have adapted to these risks. Algorithmic pricing and order management, even at the lower end of the market, is now a common skill.

REPORT 597: High-frequency trading in Australian equities and the Australian–US dollar cross rate
© Australian Securities and Investments Commission November 2018 Page 17
Percentage of book traded
Figure 3: Percentage of high-frequency turnover that is traded within a day
65%
69%
73%
77%
81%
85%
Mar-15 Sep-15 Mar-16 Sep-16 Mar-17 Sep-17 Mar-18
Perc
enta
ge tr
aded
Simple average Weighted average
Note: The data and key trends shown in this graph are described in paragraphs 57–58 (accessible version).
56 Intraday trading is a key characteristic of high-frequency trading. Our ability to identify all transactions by a single entity is limited by our methodology. It is possible for a trader to use multiple accounts across a range of brokers. For example, many dark pools operate as private venues limited to a single broker’s clients. A trader may use a different account to access another broker’s venue. Under this scenario our ability to connect accounts may be limited.
57 Our previous report noted that traders were increasingly trading out inventory by day’s end. This trend continued into mid-2015 but has since reverted and fallen to 79%. This represented a decline of 2%: see Figure 3. The same trend was evident within the simple average.
58 The premium evident in the weighted average suggests a more focused approach to inventory reduction by larger traders. The downward trends of both estimates imply that a move to longer-term and riskier strategies has been adopted with greater vigour by smaller traders.

REPORT 597: High-frequency trading in Australian equities and the Australian–US dollar cross rate
© Australian Securities and Investments Commission November 2018 Page 18
Inventory holding time
Figure 4: Dollar weighted holding time of high-frequency inventory
40
45
50
55
60
65
70
Mar-15 Sep-15 Mar-16 Sep-16 Mar-17 Sep-17 Mar-18
Hold
ing
time
in m
inut
es
Simple average Weighted average
Note: The data and key trends shown in this graph are described in paragraph 59–63 (accessible version).
59 Our estimates of average inventory holding time ran into minutes rather than seconds. Our limitations in capturing positions may have biased the magnitude of our calculations but the rendering of trends was accurate.
60 We found that holding times decreased markedly over 2016, reaching their lowest point of 41 minutes in early 2016: see Figure 4. Coinciding with a time of low investor participation and marked volatility it suggests a determined bias from larger high-frequency traders to tightly manage risk to prevailing conditions. Against this trend, smaller traders tended towards longer holding periods suggesting:
(a) an inability to tighten risk within a lower-volume, higher-volatility environment; or
(b) an insensitivity within their models to these conditions.
Note: The S&P/ASX 200 bottomed out at 4,707 in February 2016. The summer period, while light on volume, was also a period of high volatility with the VIX (CBOE Market Volatility) Index reaching a high of 32 in late January 2016.
61 The smaller divergence evident in trends over January 2018 again reinforces this perception.
62 The broader trend painted over this contraction. Weighted average holding periods rose 3% to 53 minutes in March 2018. The simple average repeated this rising trend but on a sustained basis over the entire three-year period.

REPORT 597: High-frequency trading in Australian equities and the Australian–US dollar cross rate
© Australian Securities and Investments Commission November 2018 Page 19
63 This pointed to a general trend across all levels of high-frequency traders towards longer holding periods.
64 A trading day spans a six-hour period. Our estimations in paragraph 60 were exaggerated by longer-term holdings maintained over the course of the day. The distribution of holding periods provided information on the extent of ultra-short-term trading: see Table 4.
65 For each trader in each security, we marked every position taken and subsequently unwound. We found a clear association between market capitalisation and trade velocity. More short-term trading occurred in larger capitalisation securities; however, the differences in churn rates were marginal. Approximately 2% of all trading in Quartile 1 and Quartile 2 securities was unwound within a timespan of 10 milliseconds or less. Across Quartile 3, Quartile 4 and into the lower bound of the top 300, approximately 1% of all trading was unwound within 10 milliseconds. As consecutively longer periods were considered we found (within Quartile 1 securities) that:
(a) 3% of all trading was unwound within 1,000 milliseconds (or 1 second);
(b) 4% of all trading was unwound within 10,000 milliseconds (or 10 seconds);
(c) 13% of all trading was unwound within 100,000 milliseconds (or 1 minute and 40 seconds); and
(d) 47% of all trading was unwound within 1,000,000 milliseconds (or 16 minutes and 40 seconds).
66 The cumulative distributions of relative turnover by capitalisation are set out in Table 4. The distributions are estimated over units of milliseconds and progressively diverge over timescales greater than two minutes (or 120,000 milliseconds).
Table 4: Holding times for dollars traded split by capitalisation. Distribution estimated over integrated trading for period March 2017 to March 2018
Period (ms) Quartile 1 Quartile 2 Quartile 3 Quartile 4 200–300 Hedged
10 2% 2% 1% 1% 1% 1%
100 2% 2% 2% 2% 2% 3%
1,000 3% 3% 3% 2% 2% 4%
10,000 4% 5% 4% 4% 4% 6%
100,000 13% 11% 10% 10% 10% 27%
1,000,000 47% 40% 38% 36% 35% 74%

REPORT 597: High-frequency trading in Australian equities and the Australian–US dollar cross rate
© Australian Securities and Investments Commission November 2018 Page 20
67 We made a broader estimate on holding periods of market exposure by considering any equity trade as a possible hedge: see the column titled ‘Hedged’ in Table 4. Some traders overlay their strategies with a ‘statistical arbitrage’ in which securities sharing risk characteristics are traded in opposing directions. This provides a mechanism for reducing risk while pursuing a broader spectrum of opportunities. We found shorter effective holding periods for dollar-neutral exposures. However, the differences remained marginal up to a 10-second threshold. After 10 seconds, those velocity estimates accelerated out. We found that:
(a) 1% of all trading was hedged within 10 milliseconds;
(b) 3% of all trading was hedged within 100 milliseconds (or one-tenth of a second);
(c) 4% of all trading was hedged within 1,000 milliseconds (or 1 second);
(d) 6% of all trading was hedged within 10,000 milliseconds (or 10 seconds);
(e) 27% of all trading was hedged within 100,000 milliseconds (or 1 minute and 40 seconds); and
(f) 74% of all trading was hedged within 1,000,000 milliseconds (or 16 minutes and 40 seconds).
68 These effective holding periods are short and characterise how tightly market exposures are managed by risk-neutral traders. Dollar-neutral trading is a technique used by a broad spectrum of both high- and low-frequency strategies. As a hedging tool, it is available to low-speed traders too.
69 These estimates illustrate the inaccuracy of characterising high-frequency trading as solely focused on the rapid churn of volume. Our numbers suggest that, over the past year, $10.1 billion in trading was turned over in less than 100 milliseconds—this represented approximately 0.4% of total on-market turnover. The bulk of high-frequency trading was held for much longer periods. Speed is a defining feature of these traders, but its utility is tied to capturing opportunities rather than rapid arbitrages.
REPORT 597: High-frequency trading in Australian equities and the Australian–US dollar cross rate
© Australian Securities and Investments Commission November 2018 Page 21
Number of ‘fast messages’
Figure 5: Number of ‘fast messages’ posted to market
Mar-15 Sep-15 Mar-16 Sep-16 Mar-17 Sep-17 Mar-18
Num
ber o
f fas
t m
essa
ges
Simple average Weighted average
Note: The data and key trends shown in this graph are described in paragraph 72 (accessible version).
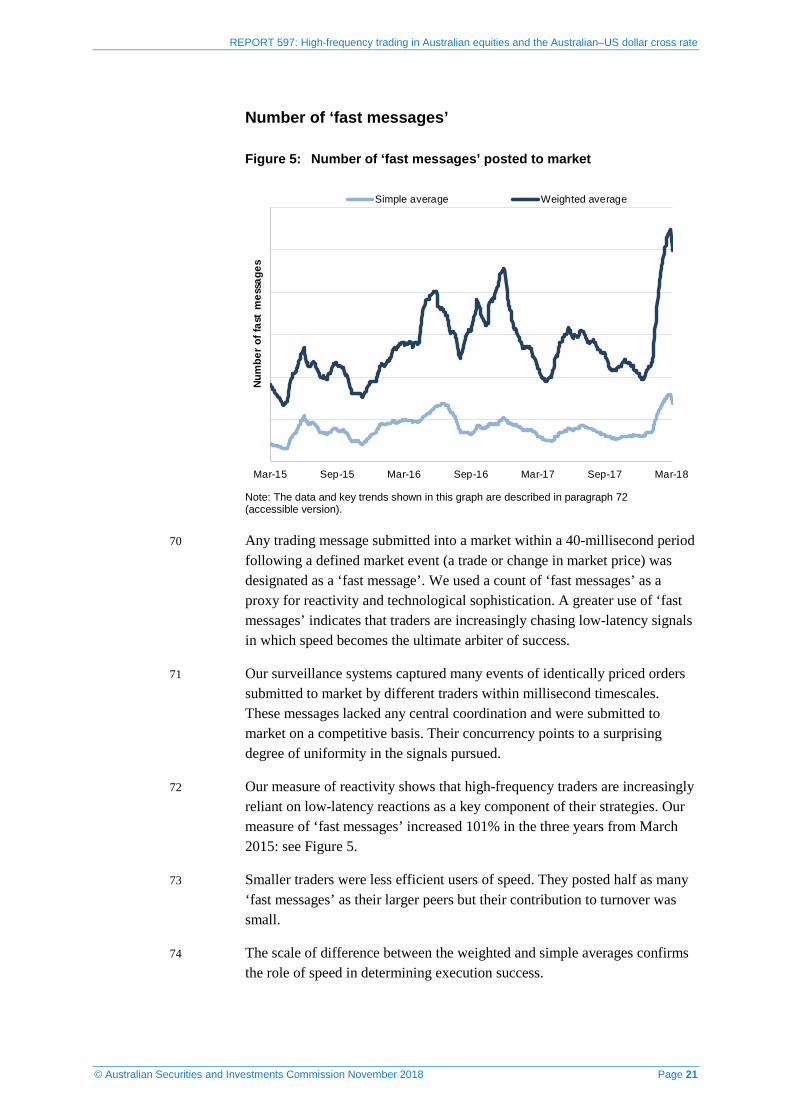
70 Any trading message submitted into a market within a 40-millisecond period following a defined market event (a trade or change in market price) was designated as a ‘fast message’. We used a count of ‘fast messages’ as a proxy for reactivity and technological sophistication. A greater use of ‘fast messages’ indicates that traders are increasingly chasing low-latency signals in which speed becomes the ultimate arbiter of success.
71 Our surveillance systems captured many events of identically priced orders submitted to market by different traders within millisecond timescales. These messages lacked any central coordination and were submitted to market on a competitive basis. Their concurrency points to a surprising degree of uniformity in the signals pursued.
72 Our measure of reactivity shows that high-frequency traders are increasingly reliant on low-latency reactions as a key component of their strategies. Our measure of ‘fast messages’ increased 101% in the three years from March 2015: see Figure 5.
73 Smaller traders were less efficient users of speed. They posted half as many ‘fast messages’ as their larger peers but their contribution to turnover was small.
74 The scale of difference between the weighted and simple averages confirms the role of speed in determining execution success.

REPORT 597: High-frequency trading in Australian equities and the Australian–US dollar cross rate
© Australian Securities and Investments Commission November 2018 Page 22
Behaviour of high-frequency traders’ order books
75 A focus of REP 331 and REP 452 was the presence of small and fleeting orders. This behaviour was associated with poorly programmed agency algorithms rather than any determined attempt by high-frequency traders to manipulate the market order book. The submission of small and fleeting orders has declined across the market.
Note: We defined a small and fleeting order as less than $500 in value and submitted to market for less than half a second.
76 The submission of fleeting orders—as opposed to small and fleeting—has become normalised. Approximately 6% of all orders submitted to market by high-frequency traders rested for a period of 10 milliseconds or less. Up to 39% of all orders were submitted, and then deleted, after 1.6 minutes: see Table 5.
77 There is also a special type of order, referred to as ‘fill and kill’, which never rests within the market. It will only take volume and remains hidden from all participants. Seven per cent of all orders were submitted on this basis. This order type is not a high-frequency strategy—it is available to all participants and is often used as a tool to minimise impact.
Table 5: Percentage of high-frequency orders submitted to market by period
Time rested Percentage of orders
≤ 10 milliseconds 6%
≤ 1,000 milliseconds (1 second) 17%
≤ 10,000 milliseconds (10 seconds) 28%
≤ 100,000 milliseconds (1.6 minutes) 39%
≤ 24 hours 93%
78 Short-lived orders declined across the market. The ASIC Supervisory Cost Recovery Levy has made this an expensive strategy. The submission of short-lived orders which did not trade appears to be associated with traders’ risk management strategies rather than any systematic attempt at manipulation.
Note: The ASIC Supervisory Cost Recovery Levy Regulations 2017, which supersedes previous cost recovery arrangements, applies a graduated levy on all market participants based on the number of trading messages submitted to market: see Report 535 ASIC cost recovery arrangements: 2017–18 (REP 535).
79 High-frequency traders have been adept at constraining order proliferation. Their contribution to market orders has remained steady despite earlier falls.
REPORT 597: High-frequency trading in Australian equities and the Australian–US dollar cross rate
© Australian Securities and Investments Commission November 2018 Page 23
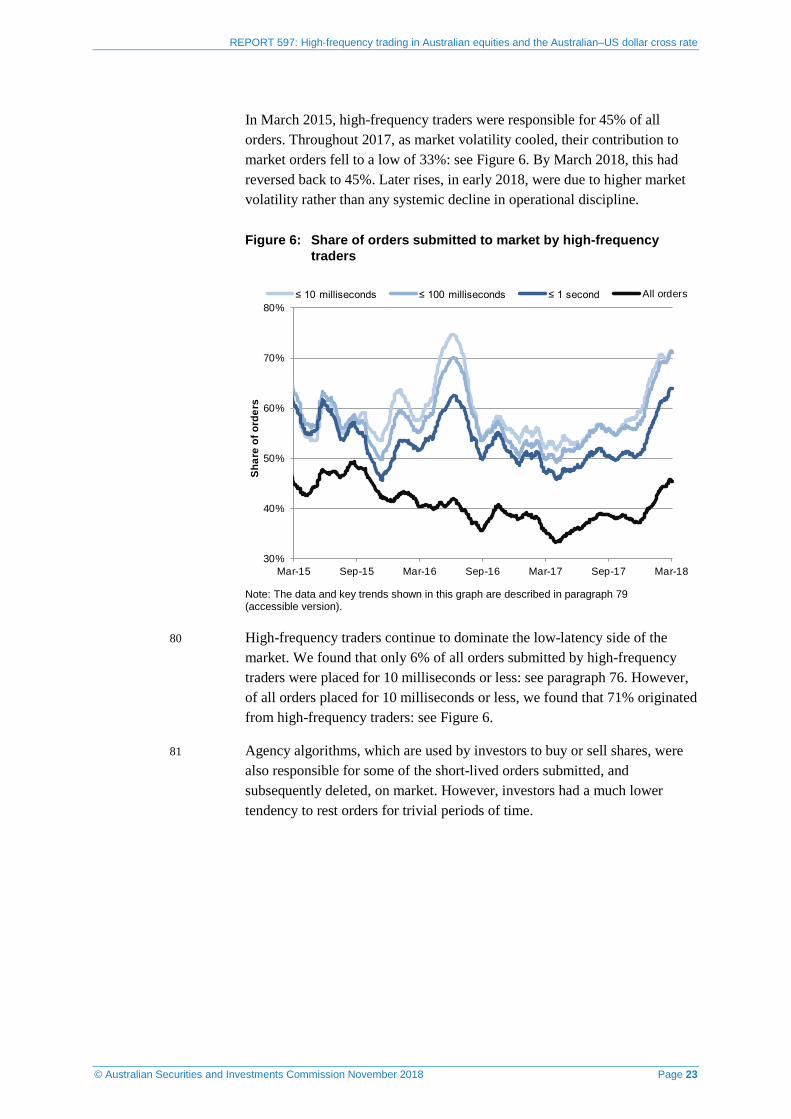
In March 2015, high-frequency traders were responsible for 45% of all orders. Throughout 2017, as market volatility cooled, their contribution to market orders fell to a low of 33%: see Figure 6. By March 2018, this had reversed back to 45%. Later rises, in early 2018, were due to higher market volatility rather than any systemic decline in operational discipline.
Figure 6: Share of orders submitted to market by high-frequency traders
30%
40%
50%
60%
70%
80%
Mar-15 Sep-15 Mar-16 Sep-16 Mar-17 Sep-17 Mar-18
Shar
e of
ord
ers
≤ 10 milliseconds ≤ 100 milliseconds ≤ 1 second All orders
Note: The data and key trends shown in this graph are described in paragraph 79 (accessible version).
80 High-frequency traders continue to dominate the low-latency side of the market. We found that only 6% of all orders submitted by high-frequency traders were placed for 10 milliseconds or less: see paragraph 76. However, of all orders placed for 10 milliseconds or less, we found that 71% originated from high-frequency traders: see Figure 6.
81 Agency algorithms, which are used by investors to buy or sell shares, were also responsible for some of the short-lived orders submitted, and subsequently deleted, on market. However, investors had a much lower tendency to rest orders for trivial periods of time.

REPORT 597: High-frequency trading in Australian equities and the Australian–US dollar cross rate
© Australian Securities and Investments Commission November 2018 Page 24
Order-to-trade ratios
Figure 7: Order-to-trade ratios across lit and dark markets
1
5
9
13
17
21
Mar-15 Sep-15 Mar-16 Sep-16 Mar-17 Sep-17 Mar-18
Ord
er-to
-trad
e ra
tio
High-frequency lit High-frequency darkNon-high-frequency lit Non-high-frequency dark
Note: The data and key trends shown in this graph are described in paragraph 82 (accessible version).
82 Order-to-trade ratios reflected the dynamic evident in orders and continued to fall across all trader and venue types. Recent volatility in early 2018 partially reversed this broader trend. Order-to-trade ratios for high-frequency traders rose 15% to 9:1 in the lit market and fell 43% to 8:1 in the dark market. Net ratios for all other traders fell too, down 9% to 4:1 for lit venues and 50% to 2:1 for dark venues: see Figure 7.
Note: Our estimates of dark order-to-trade ratios were restricted to the public dark venues managed by the market operators. ASIC surveillance systems monitor all orders and transactions within ASX Centre Point and Chi-X Mid-Point.
83 Changes in dark order management were particularly marked across the public dark venues. Traders have been adept at managing the market’s darker corners and a defining feature of early competition was traders’ capacity to vigorously explore dark venues for immediate hedges. The recent increase in below-block-size trading may indicate greater success of those searches.
Note: See ASIC’s quarterly equity market data.

REPORT 597: High-frequency trading in Australian equities and the Australian–US dollar cross rate
© Australian Securities and Investments Commission November 2018 Page 25
Figure 8: Order-to-trade ratios for high-frequency traders by capitalisation quartile
5
6
7
8
9
10
Mar-15 Sep-15 Mar-16 Sep-16 Mar-17 Sep-17 Mar-18
High
-freq
uenc
y or
der-t
o-tra
de r
atio
Quartile 1 Quartile 2 Quartile 3 Quartile 4
Note: The data and key trends shown in this graph are described in paragraph 84 (accessible version).
84 Breaking high-frequency order-to-trade ratios into capitalisation quartiles showed a marked relationship between the ratios and market capitalisation: see Figure 8. Order-to-trade ratios progressively increased with capitalisation. This increase contrasted sharply with the falling trends evident in turnover: see paragraph 51. High-frequency traders were more active in order book management for higher capitalised securities. Higher ratios, lower volumes and poorer margins suggest that their trading models operated with lower efficiency towards the top end of the market. The divergence in rates suggests that this efficiency may have decreased significantly over the last two years.
85 This trend is contrary to that of other traders and investors within the market. Figure 9 illustrates how order-to-trade ratios have fallen across the capitalisation quartiles for non-high-frequency traders. Ratios have progressively fallen in terms of magnitude and dispersion. The early 2016 fall in market prices marked the high point for agency order-to-trade ratios. A combination of low volumes, poor confidence and high volatility is associated with more ambit quoting. The crossover by Quartiles 1 and 2 suggests this effect was more pronounced for larger securities.

REPORT 597: High-frequency trading in Australian equities and the Australian–US dollar cross rate
© Australian Securities and Investments Commission November 2018 Page 26
Figure 9: Order-to-trade ratios for non-high-frequency traders by capitalisation quartile
3.5
4
4.5
5
5.5
6
Mar-15 Sep-15 Mar-16 Sep-16 Mar-17 Sep-17 Mar-18
Non-
high
-freq
uenc
y or
der-t
o-tra
de r
atio
Quartile 1 Quartile 2 Quartile 3 Quartile 4
Note: The data and key trends shown in this graph are described in paragraph 85 (accessible version).
86 In 2016, an unbroken rally in market values was associated with greater investor conviction. More trading occurred relative to the number of orders submitted. Order-to-trade ratios for larger securities reverted to a lower average suggesting a propensity for non-trading institutions to fill instructions, for size, with relatively less effort than their high-frequency counterparts.
Aggressive trading
87 REP 452 noted an increased tendency for high-frequency traders to post aggressively—that is, pay the spread to deal with immediacy. This was an idiosyncratic trend driven by a small number of traders responsible for a large amount of turnover. In line with stagnating concentration there has been little change to this behaviour. In our current review, high-frequency traders completed 60% of all turnover aggressively, up a marginal 1% from March 2015.
88 This was 9% more than the corresponding market share by number, which suggests a bias—aggressive orders are usually posted for larger transactions.

REPORT 597: High-frequency trading in Australian equities and the Australian–US dollar cross rate
© Australian Securities and Investments Commission November 2018 Page 27
Figure 10: Percentage of lit orders traded aggressively by high-frequency traders
45%
49%
53%
57%
61%
65%
Mar-15 Sep-15 Mar-16 Sep-16 Mar-17 Sep-17 Mar-18
High
-freq
uenc
y or
ders
pos
ted
aggr
essi
vely
Quartile 1 Quartile 2 Quartile 3 Quartile 4
Note: The data and key trends shown in this graph are described in paragraph 89 (accessible version).
89 Aggression was also biased towards higher capitalised securities. For most of the three-year period, high-frequency traders posted more than 50% of all orders on an aggressive basis: see Figure 10. In general, aggression has trended down, although the bout of volatility in early 2018 sharply reinvigorated their aggressive bias—particularly outside Quartile 1.
90 Aggressive high-frequency traders interact with passive orders on an entirely opportunistic basis. At trade junctures they assist price discovery, as the payment of spread publicly signals moments of relative mispricing. To operate sustainably they require sophisticated models to overcome their exposure to spreads. On a cumulative basis, this is substantial. In contrast, their passive counterparts are exposed solely to adverse selection risk which is only crystallised ex-post.
91 Agency algorithms mitigate this risk by fragmenting orders over extended time periods—this is the basis of a volume weighted average pricing (VWAP) strategy which breaks larger orders apart to reduce the likelihood of information leakage or price sensitivity. This fragmentation leads to order proliferation and, consequently, higher order-to-trade ratios.
92 We noted a correlation between trader aggression and agency order-to-trade ratios, and looked at the relative lag between trader aggression and agency ratios to determine whether there was a causal link. We found that trader aggression led, and agency algorithms adapted in response.

REPORT 597: High-frequency trading in Australian equities and the Australian–US dollar cross rate
© Australian Securities and Investments Commission November 2018 Page 28
Figure 11: Lagged correlations between investor order-to-trade ratios and high-frequency trader aggression
0.08
0.12
0.16
Corr
elat
ion
Number of days lagged
Correlation of order-to-trade ratio against lagged high-frequency market share
0.2
0.24
-30 -20 -10 0 10 20 30
Note: The data and key trends shown in this graph are described in paragraph 93 (accessible version).
93 Figure 11 details the correlation between high-frequency aggression and agency order-to-trade ratios as the respective daily time series are lagged. That is, we estimate correlations as the respective date of measurement for the two time series are progressively offset. A higher correlation after the passage of a few days can indicate that one time series tends to follow the other and so exhibits a lagged response.
94 The positive association confirms that agency algorithms tend towards:
(a) high order-to-trade ratios as trader aggression increases; and
(b) lower order-to-trade ratios as trader aggression decreases.
95 The rise in lagged correlation suggests that investors accommodate for trader behaviour over a 10-day period. That is, as high-frequency traders tone down the extent of aggressive price-taking, investor algorithms relax in response.
96 This may work through a gradual selection of different algorithmic strategies or tempered settings to better suit trading conditions.
Cost to investors
97 High-frequency traders have continued to trade profitably. We estimated that high-frequency traders extracted between $346 million and $528 million in trading profits during the period 2015–2018: see Table 6.
98 While headline profitability is large, the volumes transacted to realise these profits are enormous. Relative to turnover, the margins achieved by high-frequency traders are incredibly small. The difference between the market’s
REPORT 597: High-frequency trading in Australian equities and the Australian–US dollar cross rate
© Australian Securities and Investments Commission November 2018 Page 29
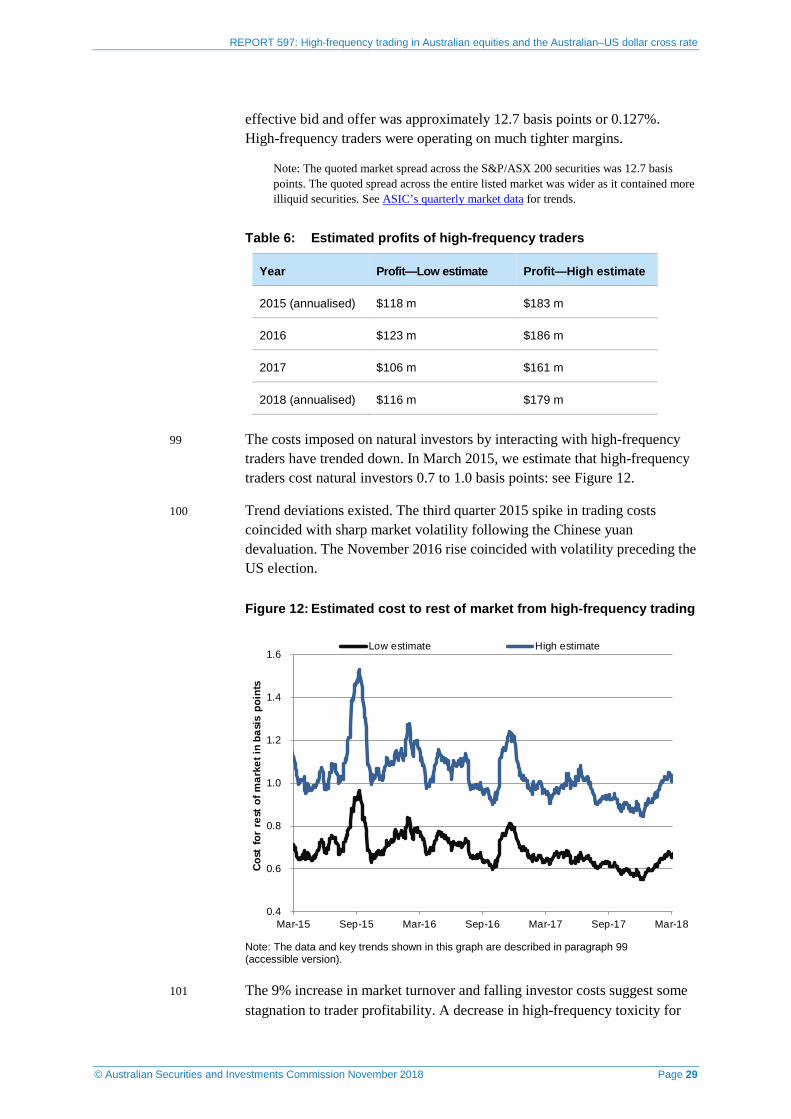
effective bid and offer was approximately 12.7 basis points or 0.127%. High-frequency traders were operating on much tighter margins.
Note: The quoted market spread across the S&P/ASX 200 securities was 12.7 basis points. The quoted spread across the entire listed market was wider as it contained more illiquid securities. See ASIC’s quarterly market data for trends.
Table 6: Estimated profits of high-frequency traders
Year Profit—Low estimate Profit—High estimate
2015 (annualised) $118 m $183 m
2016 $123 m $186 m
2017 $106 m $161 m
2018 (annualised) $116 m $179 m
99 The costs imposed on natural investors by interacting with high-frequency traders have trended down. In March 2015, we estimate that high-frequency traders cost natural investors 0.7 to 1.0 basis points: see Figure 12.
100 Trend deviations existed. The third quarter 2015 spike in trading costs coincided with sharp market volatility following the Chinese yuan devaluation. The November 2016 rise coincided with volatility preceding the US election.
Figure 12: Estimated cost to rest of market from high-frequency trading
0.4
0.6
0.8
1.0
1.2
1.4
1.6
Mar-15 Sep-15 Mar-16 Sep-16 Mar-17 Sep-17 Mar-18
Cost
for
res
t of m
arke
t in
basi
s po
ints
Low estimate High estimate
Note: The data and key trends shown in this graph are described in paragraph 99 (accessible version).
101 The 9% increase in market turnover and falling investor costs suggest some stagnation to trader profitability. A decrease in high-frequency toxicity for

REPORT 597: High-frequency trading in Australian equities and the Australian–US dollar cross rate
© Australian Securities and Investments Commission November 2018 Page 30
institutional users of the Australian equity market is also suggested by the decline in trader participation (see paragraph 47) and evident move towards strategies requiring:
(a) greater risk and more overnight positioning (see paragraph 57);
(b) less aggressive price taking (see paragraph 89); and
(c) a marginal increase in order complexity (see paragraph 84).
102 Structurally, outcomes are improving for natural users of the equity market. However, volatility is a dynamic caveat. Sharp increases in market volatility create favourable conditions for traders and can place natural users of the market at a disadvantage.
B2 Impact of high-frequency trading on price discovery
103 A key goal of market design is the improvement of price discovery.
104 Price discovery is the process by which market participants meet to determine the right price for a security to trade. The determined price is not an economic valuation of a market security; rather, it is the momentary point of market equilibrium between supply and demand in which non-financial factors such as sentiment, risk appetite and liquidity also play a role.
105 A process that improves price discovery also enhances market efficiency.
Note: ‘Market efficiency’ is a conceptual proposition in which security prices reflect all available information.
106 A good market balances public expectation for transparency against an individual’s expectation of privacy. High-frequency traders play a contentious role in this. Using quantitative and predictive models they generate their own private information from the public activity of investors. But the competitive pressure to trade at speed affords them marginal benefit. Their informational advantage is fleeting, and signals dissipate under their own transactions.
107 High-frequency trading can deliver the public benefit of market efficiency by acting to impound a diverse set of market signals into a security’s price. We examined the contribution of high-frequency trading to market efficiency by testing a short-term measure of efficiency and quantifying the extent to which high-frequency trading contributed to this measure.
Are market prices becoming more efficient?
108 We estimated the contribution of high-frequency traders to price discovery by determining their contribution to sustained price moves. Assisting the market to find an equilibrium is a public good.

REPORT 597: High-frequency trading in Australian equities and the Australian–US dollar cross rate
© Australian Securities and Investments Commission November 2018 Page 31
109 A path to equilibrium was used to quantify price discovery within the market. Across the market’s top 200 securities, we determined the series of price innovations taken to move a security towards its volume weighted future price. Scaled against the price-predictive capabilities of high-frequency traders we selected a 10-minute interval. All price innovations were separated into two categories:
(a) noise: those innovations which the market process subsequently reversed; and
(b) signal: those innovations impounded into the stock price and so predictive of its future level.
110 Security price returns were used to estimate market volatility. We calculated return covariances and, using capitalisation weights within a portfolio framework, estimated daily market volatility.
Note: Market volatility may be expressed in terms of a standard deviation of security returns and capitalisation weights.
111 We then broke down market risk by splitting returns into a noise and signal component. This separated market variance into a noise, signal and cross-term component.
Note: Mathematically, variance may be expressed as the square of the standard deviation and may be broken apart, or decomposed, and attributed to different effects.
112 Dividing any one of these into the total market volatility provides an estimate of its relative contribution.
Figure 13: Low and high (bounded) estimates of the market signal’s share of variance
10%
15%
20%
25%
30%
35%
40%
45%
50%
Jan-11 Jan-12 Jan-13 Jan-14 Jan-15 Jan-16 Jan-17 Jan-18
Shar
e of
var
ianc
e
Lower bound Upper bound
Note: The data and key trends shown in this graph are described in paragraphs 108–115 (accessible version).

REPORT 597: High-frequency trading in Australian equities and the Australian–US dollar cross rate
© Australian Securities and Investments Commission November 2018 Page 32
113 Charting the contribution of the market’s signal and cross-terms to total variance gives a lower and upper bound to the share of variance attributable to predictive moves. We found:
(a) an annualised increase in the share of variance attributable to the price signal of 3% to 2% culminating, respectively, in a relative share of 27% to 42%; and
(b) most of the improvement to signal variance arose from the contribution of individual securities and occurred over the first two years of market competition (i.e. 2011–2013).
Note: Signal variance is calculated as the product of security capitalisation weights and the signal covariance matrix. The signal covariance may be separated into diagonal and off-diagonal matrices representing the respective components of security and cross-security variance. We found greater improvement arising from the signal’s diagonal decomposition.
114 There are two possible interpretations to these observations:
(a) Interpretation 1: the price target itself had become more volatile. This could unbalance participants’ price estimates and lead to more changes in predicted prices. Greater signal variance would manifest as a poorer equilibrium; or
(b) Interpretation 2: security prices have tended towards future levels at a faster pace. The signal variance scales quadratically with the price change. So, for the same level of volatility, it can only increase by aggregation. That is, securities move towards their targeted levels in fewer steps of greater size.
115 Despite periodic bouts of market volatility, market variance has in general trended down—we estimated an annualised reduction of 4%. This eliminates our first interpretation, suggesting that the market has become better at trading towards its future price. That is, the price discovery process has improved.
Are high-frequency traders contributing to price discovery?
116 Our surveillance data allowed a detailed examination of the price discovery process. Having identified the permanent innovations, we attributed cause to aggregated groups of high-frequency, and other, traders.
117 We estimated that, in March 2018, high-frequency traders contributed 41% of the price signal variance. With a market share of 25% (see paragraph 48), this suggests their contribution to short-term price discovery was disproportionately higher than their level of trading.

REPORT 597: High-frequency trading in Australian equities and the Australian–US dollar cross rate
© Australian Securities and Investments Commission November 2018 Page 33
118 Their contribution to short-term price discovery was greatest for large securities and progressively fell with capitalisation. Over 2015–2018, their contribution fell uniformly across all quartiles: see Figure 14.
119 Over the three-year period of our study the lows in attribution tended to occur in periods of lower volatility. Traders’ contribution to price discovery fell as volatility ebbed. For example, the VIX Index fell to 10-year lows for an extended period in 2017. Over this time, high-frequency traders’ contribution to price signal variance, outside of the Top 50, slipped below that of other traders. This trend only reversed when price volatility rose.
Figure 14: Contribution to signal variance by high-frequency traders
20%
25%
30%
35%
40%
45%
50%
Mar-15 Sep-15 Mar-16 Sep-16 Mar-17 Sep-17 Mar-18
Shar
e of
sig
nal v
aria
nce
Quartile 1 Quartile 2 Quartile 3 Quartile 4
Note: The data and key trends shown in this graph are described in paragraphs 119–120 (accessible version).
120 While high-frequency traders make a substantial contribution to short-term price discovery, their utility to smaller securities can be overstated. Over periods of low volatility they add no more to the market than other participants. However, relative contributions pick up quickly with volatility.
B3 Summary of key findings
121 High-frequency traders retain their large presence within the market but market share figures suggest pressures. Overall profitability has remained constant but realised margins have contracted. Growing volumes across the market have not translated to larger profits.
122 Growth has been sourced in the lower end of the market. Margins are higher for smaller capitalised securities, but lower volumes constrain overall profitability.

REPORT 597: High-frequency trading in Australian equities and the Australian–US dollar cross rate
© Australian Securities and Investments Commission November 2018 Page 34
123 Every measure of high-frequency activity suggests a drift towards higher-risk activity. Holding times are increasing, market churn is decreasing, and their capacity to predict short-term price movements is falling. However, market volatility is the wildcard. As market volatility spikes, high-frequency efficiency and activity increases.
124 On a short-term basis market efficiency is improving. High-frequency traders are contributing to price discovery and other market users are deriving some benefit from these signals. However, the trend does suggest ongoing declines to their utility. This may reflect improvements in the cloaking strategies employed by institutional agency algorithms to reduce information leakage.
125 The costs imposed on natural users of the market, through high-frequency intermediation, are trending down. Our high-end estimate of 1 basis point translates to a cost of 1 cent for every $100 traded. While material, this cost cannot be separated from the impact and liquidity costs borne by all equity market users. A sizeable reduction of their 25% contribution to turnover could translate to higher execution costs.

REPORT 597: High-frequency trading in Australian equities and the Australian–US dollar cross rate
© Australian Securities and Investments Commission November 2018 Page 35
C Australian–US dollar cross rate
Key points
Turnover in the AUD/USD cross rate within multi-dealer electronic platforms has fallen markedly over the past five years. Liquidity is devolving into new platforms with lower regulatory oversight. Institutional participants are following the liquidity.
High-frequency traders are active in the FX markets. Much of this trading is conducted by proprietary organisations with no client affiliation. They are offshore entities engaged in global trading operations.
Our dataset of trading in the AUD/USD cross rate spans the five-year period March 2013 to March 2018. It is confined to transactions over some multi-dealer electronic platforms. Our findings show that high-frequency traders account for 25% of all turnover and submit 38% of all orders.
High-frequency traders are becoming faster but clearing less volume within subsecond intervals. They are progressively incorporating higher-risk strategies.
Client-driven transactions are facilitated by high-frequency traders within the electronic platforms. Traders are adept at locating and trading against these orders.
High-frequency facilitation increases as dealing banks make greater demands on remaining platform liquidity.
Purpose
126 This section outlines the findings of our high-frequency trading review for trading in the AUD/USD cross rate.
(a) Section C1 High-frequency trading in AUD/USD cross rate summarises the characteristics of high-frequency trading in the AUD/USD cross rate across a number of multi-dealer electronic platforms: see paragraphs 140–189.
(b) Section C2 Issues with high-frequency trading in AUD/USD presents our findings on the impact of high-frequency traders to orderly markets and dealer trading costs: see paragraphs 190–229.
Background
127 Turnover in the FX market is far larger than that of any national equity market. An estimated US$1.7 trillion turnover in spot FX transactions occurs

REPORT 597: High-frequency trading in Australian equities and the Australian–US dollar cross rate
© Australian Securities and Investments Commission November 2018 Page 36
every day. Foreign exchange volumes peaked in 2013 and have been in decline for the past five years. The decline is driven by two main factors:
(a) stagnating global trade; and
(b) changes in the nature of risk-taking by the dealing banks which facilitate capital flow. The banks have:
(i) reduced their proprietary trading activities; and
(ii) internalised client flow through the development of centralised risk books.
128 Australia is a small country by international standards—numerical measures of population, national wealth and gross domestic product place it below the larger G7 nations.
Note: The Group of Seven (G7) consists of Canada, France, Germany, Italy, Japan, the United Kingdom and the United States.
129 It has an export-focused economy engaged in open and competitive commerce. Australian demand and supply of both goods and services generates substantial FX flows. This activity underpins international demand for Australian dollars. It is now the fifth most heavily traded currency in the world. The Bank for International Settlements (BIS) Triennial Central Bank Survey of foreign exchange and OTC derivatives markets in 2016 estimated that 6.9% of all currency transactions involved the Australian dollar: see Figure 15.
Figure 15: Share of FX turnover by currency
Source: BIS, Triennial Central Bank Survey of foreign exchange and OTC derivatives markets in 2016.
Notes
1. EME collectively refers to a portfolio of emerging market economies.
2. The data and key trends shown in this graph are described in paragraph 129 (accessible version).
REPORT 597: High-frequency trading in Australian equities and the Australian–US dollar cross rate
© Australian Securities and Investments Commission November 2018 Page 37
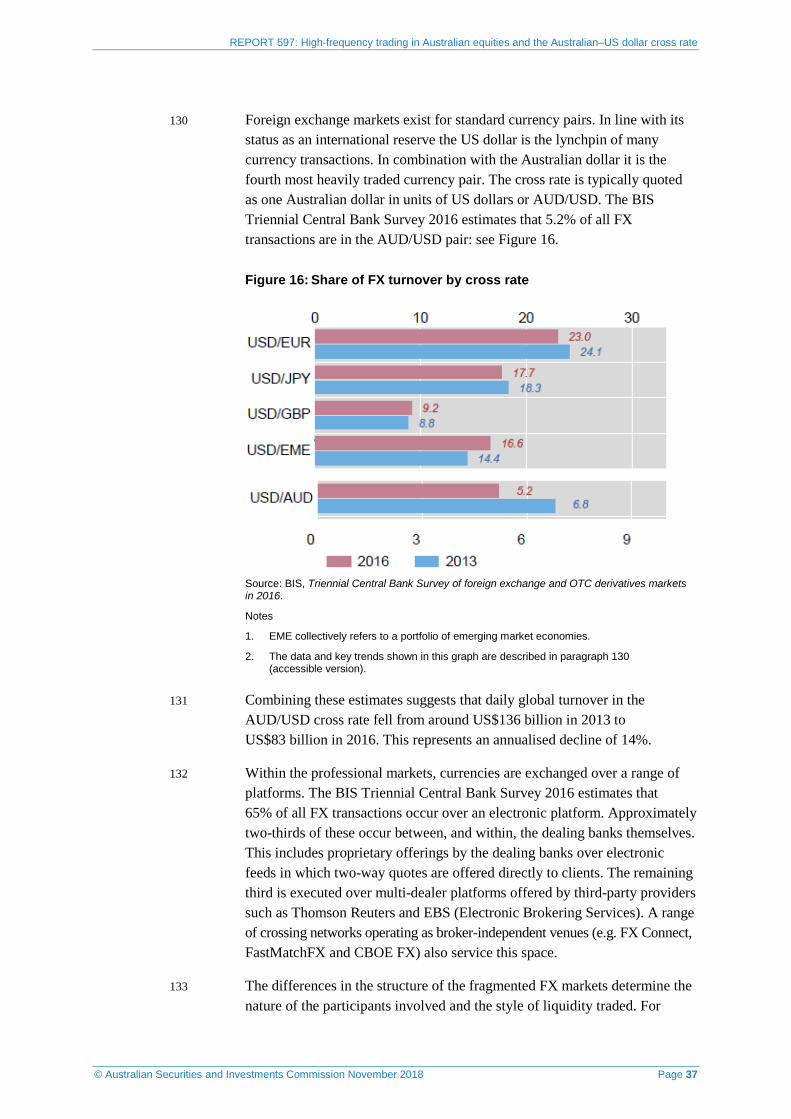
130 Foreign exchange markets exist for standard currency pairs. In line with its status as an international reserve the US dollar is the lynchpin of many currency transactions. In combination with the Australian dollar it is the fourth most heavily traded currency pair. The cross rate is typically quoted as one Australian dollar in units of US dollars or AUD/USD. The BIS Triennial Central Bank Survey 2016 estimates that 5.2% of all FX transactions are in the AUD/USD pair: see Figure 16.
Figure 16: Share of FX turnover by cross rate
Source: BIS, Triennial Central Bank Survey of foreign exchange and OTC derivatives markets in 2016.
Notes
1. EME collectively refers to a portfolio of emerging market economies.
2. The data and key trends shown in this graph are described in paragraph 130 (accessible version).
131 Combining these estimates suggests that daily global turnover in the AUD/USD cross rate fell from around US$136 billion in 2013 to US$83 billion in 2016. This represents an annualised decline of 14%.
132 Within the professional markets, currencies are exchanged over a range of platforms. The BIS Triennial Central Bank Survey 2016 estimates that 65% of all FX transactions occur over an electronic platform. Approximately two-thirds of these occur between, and within, the dealing banks themselves. This includes proprietary offerings by the dealing banks over electronic feeds in which two-way quotes are offered directly to clients. The remaining third is executed over multi-dealer platforms offered by third-party providers such as Thomson Reuters and EBS (Electronic Brokering Services). A range of crossing networks operating as broker-independent venues (e.g. FX Connect, FastMatchFX and CBOE FX) also service this space.
133 The differences in the structure of the fragmented FX markets determine the nature of the participants involved and the style of liquidity traded. For

REPORT 597: High-frequency trading in Australian equities and the Australian–US dollar cross rate
© Australian Securities and Investments Commission November 2018 Page 38
example, direct communication lends itself to negotiation. Alternatively, wholesale clients participating over the bank portals are offered taker-only prices. The multi-dealer platforms resemble a traditional equity market where an anonymous order book permits limit order posting on a competitive basis. The multi-dealer platforms have become a focal point in the inter-dealer market and are often used as the source of live rates for public consumption.
134 While Thomson Reuters Matching and EBS are the traditional sources of public rates, their market shares have been in relative decline for the past 10 years: see Figure 17. A range of factors are at play, namely:
(a) facilitating banks are internalising more client flow;
(b) proprietary trading organisations have infiltrated the interbank venues and are successfully transporting liquidity into the newer venues;
(c) crossing networks have successfully marketed themselves to new quasi-wholesale demand; and
(d) consolidation has concentrated and deepened broker-independent liquidity pools.
135 These factors have contributed to attracting wholesale banks into the newer venues and outside of their own traditional networks.
Figure 17: Market share of AUD/USD for Thomson Reuters and EBS, 2006 to 2014
Source: Association for Financial Markets in Europe (AFME) Liquidity Conference 2015.
Note: The data and key trends shown in this graph are described in paragraph 134 (accessible version).
136 A range of competitive differences exists between the platforms. Those targeting traditional wholesale banks retain minimum order sizes of million dollar lots; newer venues have reduced order sizes and opened wholesale trading to smaller dealers. All vie with each other for liquidity. Some offer incentives to attract market makers. Categorical differences exist in their capacity and ability to engage with regulatory frameworks. Many of the
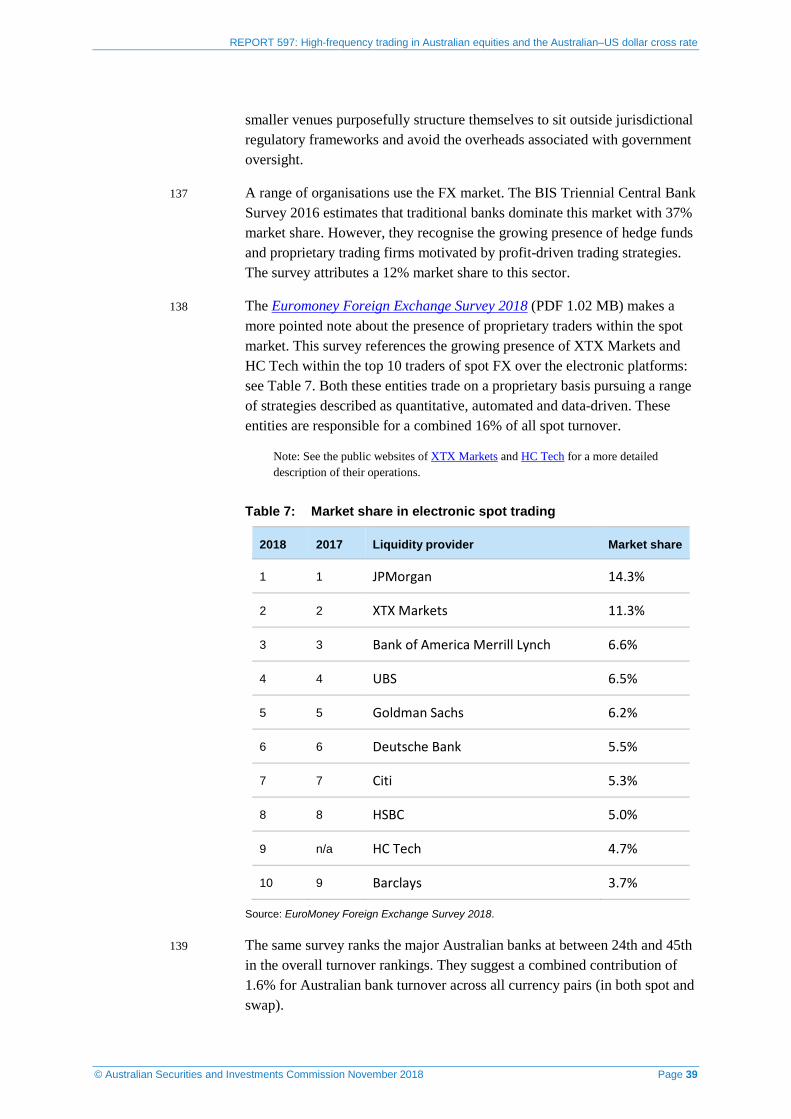
REPORT 597: High-frequency trading in Australian equities and the Australian–US dollar cross rate
© Australian Securities and Investments Commission November 2018 Page 39
smaller venues purposefully structure themselves to sit outside jurisdictional regulatory frameworks and avoid the overheads associated with government oversight.
137 A range of organisations use the FX market. The BIS Triennial Central Bank Survey 2016 estimates that traditional banks dominate this market with 37% market share. However, they recognise the growing presence of hedge funds and proprietary trading firms motivated by profit-driven trading strategies. The survey attributes a 12% market share to this sector.
138 The Euromoney Foreign Exchange Survey 2018 (PDF 1.02 MB) makes a more pointed note about the presence of proprietary traders within the spot market. This survey references the growing presence of XTX Markets and HC Tech within the top 10 traders of spot FX over the electronic platforms: see Table 7. Both these entities trade on a proprietary basis pursuing a range of strategies described as quantitative, automated and data-driven. These entities are responsible for a combined 16% of all spot turnover.
Note: See the public websites of XTX Markets and HC Tech for a more detailed description of their operations.
Table 7: Market share in electronic spot trading
2018 2017 Liquidity provider Market share
1 1 JPMorgan 14.3%
2 2 XTX Markets 11.3%
3 3 Bank of America Merrill Lynch 6.6%
4 4 UBS 6.5%
5 5 Goldman Sachs 6.2%
6 6 Deutsche Bank 5.5%
7 7 Citi 5.3%
8 8 HSBC 5.0%
9 n/a HC Tech 4.7%
10 9 Barclays 3.7%
Source: EuroMoney Foreign Exchange Survey 2018.
139 The same survey ranks the major Australian banks at between 24th and 45th in the overall turnover rankings. They suggest a combined contribution of 1.6% for Australian bank turnover across all currency pairs (in both spot and swap).

REPORT 597: High-frequency trading in Australian equities and the Australian–US dollar cross rate
© Australian Securities and Investments Commission November 2018 Page 40
C1 High-frequency trading in AUD/USD cross rate
Our approach
140 We looked at 24-hour trading in the AUD/USD cross rate over the period March 2013 to March 2018. Several electronic spot platforms were approached and asked to provide detailed transactional data for both orders and trades. All platforms were based offshore and dealt with a range of global participants.
141 The AUD/USD cross rate was the focus of our inquiries. There are other Australian dollar cross rate pairs which have active and liquid markets within these platforms. For example, markets exist for the Australian–New Zealand dollar, Australian dollar–Japanese yen and Australian dollar–euro cross rates. Given the US dollar’s dominance in foreign currency transactions we did not seek trading records outside of the AUD/USD pair.
142 Our study focused on AUD/USD trading within the multi-dealer electronic platforms. Trading in the AUD/USD over voice, message and proprietary bank platforms was not considered within the scope of our inquiries. It is possible for high-frequency traders to offer continuous markets within banks’ proprietary platforms as a white-labelled offering to clients.
Note: BIS has referred to a growing trend among proprietary trading firms to offer liquidity directly through banks’ client networks. See Monitoring of fast-paced electronic markets (PDF 789 KB), BIS Markets Committee report, September 2018. The practice of rebranding another entity’s service is often referred to as a ‘white-label’ product.
143 Total volume in the AUD/USD cross rate during 2016 was approximately A$116 billion per day. This suggests that our dataset represents around 17% of all trading in the AUD/USD cross rate.
144 The largest participants within our dataset can be classified into two groups: dealing banks that have, and are engaged with, an active client base; and proprietary traders that trade solely on their own account.
145 Dealing banks engage with the multi-dealer platforms for a variety of reasons. Some trading may be proprietary and so speculative in nature. A great deal is associated with hedging and the management of excess client demand. Banks often quote prices to their clients in their capacity as a market maker of foreign exchange. The platforms are used as a means of hedging risk. Some banks may offer direct market access to the platforms as agent. This is particularly the case when they wish to separate active clients from their wider client base.
146 Proprietary traders are also large users of the multi-dealer platforms. This user base has evolved and grown over the past 10 years. Foreign exchange platforms have courted this group as a means of developing additional

REPORT 597: High-frequency trading in Australian equities and the Australian–US dollar cross rate
© Australian Securities and Investments Commission November 2018 Page 41
liquidity within their venues. Proprietary traders dominate much of the short-term or high-frequency-like activity that we identified within our study.
147 Over the past five years the value of trading in the AUD/USD cross rate conducted within the multi-dealer platforms steadily declined. From a high of A$42 billion in March 2013, daily volumes progressively fell at an annualised rate of 11% to A$18 billion in March 2018. Along with falling volumes, the breadth of trading among the leading venues in the AUD/USD cross rate widened substantially. Our measure of diversity, based on the distribution of turnover across the venues, increased at an annualised rate of 27%: see Figure 18.
Note: We estimate ‘diversity’ as a measure of entropy in the distribution of turnover between the venues.
Figure 18: Estimate of volume and venue diversity for AUD/USD across a selection of platforms
0.30
0.36
0.42
0.48
0.54
0.60
0.66
0.72
0.78
0.84
10
15
20
25
30
35
40
45
50
55
Mar-13 Mar-14 Mar-15 Mar-16 Mar-17 Mar-18
Venu
e di
vers
ity
Volu
me
trade
d in
A$
billi
on
Volume traded in A$ billion Venue diversity
Note: The data and key trends shown in this graph are described in paragraphs 147–148 (accessible version).
148 Our measure of diversity takes a value within the range of 0 to 1. It is used to quantify the mix of trading between platforms. A value of 0 implies that all trading is conducted within a single platform (i.e. one platform dominates). A value of 1 implies that trading is shared equally among all competing platforms (i.e. no single platform dominates). Figure 18 shows that diversity has increased consistently over the past five years. This implies that market participants are finding liquidity among a wider selection of venues. Given the traditional dominance of Thomson Reuters Matching in AUD/USD trading (see Figure 17) and the fall in overall volumes, this suggests that newer platforms are developing additional pools of liquidity as well as capturing market share from incumbents.

REPORT 597: High-frequency trading in Australian equities and the Australian–US dollar cross rate
© Australian Securities and Investments Commission November 2018 Page 42
149 These developments have some impact on ASIC’s regulatory remit within FX markets. Unlike many overseas jurisdictions, Australian law views an FX transaction as a financial product if it is transacted with a two-day settlement period or longer.
Note: Section 764A(k) of the Corporations Act lists an FX contract as a financial product, except if it is:
• a derivative; or
• a contract to exchange one currency (whether Australian or not) for another that is to be settled immediately.
150 In line with Australian law, the larger incumbent platforms (such as Thomson Reuters Matching, EBS and FX Connect) operate within our jurisdiction as licensed markets.
151 Some of these platforms are signatories to the FX Global Code. While the Code provides guidance on responsible behaviour, it does not provide regulatory bodies with a fully effective framework for regulatory and conduct oversight.
Note: The FX Global Code is a common set of guidelines outlining a set of ethical, governance, transactional and compliance principles for responsible participation within the FX market.
High-frequency traders
152 The tagging of trading messages within our dataset lacked the detail of our corresponding equity set. To overcome this, we segmented all orders and trades based on entity name and account. Our behavioural profile was used to identify all traders engaged in high-frequency-like trading.
153 As with the equity study, we profiled all trading in the AUD/USD cross rate to identify high-frequency traders. The selection criteria were recalibrated daily and a range of estimates taken to identify high-frequency trading.
154 Foreign exchange markets differ considerably from equity markets. The main points of difference are:
(a) trading venues: the FX market lacks post-trade transparency. Transactions are conducted on a bilateral basis and there is no obligation to report trades transparently. Many electronic platforms report executions but much of this data is disseminated privately, to subscribed users, rather than publicly;
(b) order size: individual orders and trades are large and may be conducted in million-dollar multiples. Retail clients do not participate in these markets;
(c) participants: many of the dealing banks within these platforms are actively hedging client activity. Bi-directional trading may be driven by client demand rather than any speculative intent to profit; and

REPORT 597: High-frequency trading in Australian equities and the Australian–US dollar cross rate
© Australian Securities and Investments Commission November 2018 Page 43
(d) scale: FX markets are global. They operate on a 24-hour basis and match liquidity from all points of the globe. Many of the trading platforms segment matching by location. For example, instructions may meet locally and then match globally. Many participants may share activity across time zones.
155 Our modelling of transactions did not allow us to observe all the activity of traders. Disentangling active risk management from profit-driven, short-term trading is problematic. However, most of the high-frequency traders identified by our methodology belonged to proprietary trading entities with no agency business.
156 We found that the number of high-frequency traders fell over a five-year span at an annualised rate of 8%: see Figure 19. The fall was likely to have been driven by deteriorating volumes within the larger platforms and greater competition between participants. Normalising trader numbers to the remaining volume confirmed the extent of crowding across the platforms. The ratio of active traders per billion dollars of turnover increased annually at a rate of 5% over the period to March 2018. In relative terms, more high-frequency traders are now competing for the same unit of turnover.
Figure 19: Number of high-frequency traders, and the number per billion dollars of AUD/USD traded, identified within the dataset
Mar-13 Mar-14 Mar-15 Mar-16 Mar-17 Mar-18
Num
ber p
er A
$ bi
llion
trad
ed
Num
ber o
f hig
h-fre
quen
cy tr
ader
s
Number of high-frequency traders Number per A$ billion traded
Note: The data and key trends shown in this graph are described in paragraph 156 (accessible version).
157 Concentration among the largest traders was high. The top five traders accounted for 86% of all high-frequency turnover: see Figure 20. This growth was in part due to the fall in the number of traders. The share of high-frequency turnover captured by the top two traders has not changed materially over the past five years.

REPORT 597: High-frequency trading in Australian equities and the Australian–US dollar cross rate
© Australian Securities and Investments Commission November 2018 Page 44
Figure 20: Concentration levels among high-frequency cohort
0%
20%
40%
60%
80%
100%
Mar-13 Mar-14 Mar-15 Mar-16 Mar-17 Mar-18
Perc
enta
ge o
f hig
h-fre
quen
cy tu
rnov
er
Top trader Top two traders Top five traders
Note: The data and key trends shown in this graph are described in paragraph 157 (accessible version).
Market turnover
158 While the actual number of high-frequency traders was relatively small, they were responsible for an extensive amount of trading. Our analysis indicated that 25% of all trading in the AUD/USD dataset was executed by high-frequency traders: see Figure 21. This has fallen from 32% in March 2013, indicating an annualised decline of 4% in high-frequency turnover for the five-year period to March 2018.
Note: Our figure of 25% falls within the 24%–30% range for high-frequency trading (in spot) estimated by BIS: see High-frequency trading in the foreign exchange market, BIS Markets Committee paper, No. 5, September 2011.

REPORT 597: High-frequency trading in Australian equities and the Australian–US dollar cross rate
© Australian Securities and Investments Commission November 2018 Page 45
Figure 21: Percentage of trades and trade volume attributable to high-frequency traders
20%
25%
30%
35%
40%
45%
Mar-13 Mar-14 Mar-15 Mar-16 Mar-17 Mar-18
Perc
enta
ge o
f tra
des
Number of trades Value of trades
Note: The data and key trends shown in this graph are described in paragraphs 158–159 (accessible version).
159 The share of trades by number was much higher than their corresponding share by volume. We estimated that 31% of all transactions were conducted by high-frequency traders. This was down from 42% in March 2013 (or a fall of 5% on an annualised basis). The elevation of trades over volume implies that high-frequency traders tended to execute in small lots. Trade lots are still denominated in wholesale sizes.
160 As with equity, volatility can be an engine of growth for high-frequency trading. The May 2013 ‘taper tantrum’, weakness in the Australian market in September 2014 and the 460-point fall in US markets in October 2014 were all associated with a spike in FX high-frequency trading. Similar behaviour was evident in January 2018 following market volatility resulting from global trade tensions. Unlike its equity counterpart, however, the return to lower participatory levels occurred relatively quickly.
161 Our method of identifying high-frequency traders was more sensitive to the underlying assumptions than its equity equivalent. The main source of inaccuracy arose from clarifying the nature of trading accounts within the largest dealing banks—we believe our method underestimated participation levels. Loosening our calibrations expanded the cohort of high-frequency traders from 2% to 4% of all active accounts with a corresponding change in turnover from 25% to 40%.

REPORT 597: High-frequency trading in Australian equities and the Australian–US dollar cross rate
© Australian Securities and Investments Commission November 2018 Page 46
Orders submitted to market
162 The volume quoted in market for the AUD/USD cross rate reflects a complicated balance between the demand for liquidity and the risk appetite of active market makers. AUD/USD rates are often quoted in a half pip (point in percentage) spread. This equates to a market spread of approximately 0.7 basis points for million-dollar quotes. The risk of adverse selection (i.e. trading against the true demand) creates volatility in quoted levels.
163 Unlike equity, orders within the FX market do not tend to rest for extended periods of time. This holds for orders placed by all types of traders. We estimated that 41% of all untraded orders submitted and deleted within a 500-millisecond (i.e. half a second) period were submitted by high-frequency traders: see Figure 22. This fell at an annualised rate of 4% from 52% in March 2013.
164 In comparison, the proportion of all orders submitted by high-frequency traders within our dataset was 38%—an annualised fall of 6% from a much higher 56% in March 2013.
Figure 22: Share orders submitted to platforms by high-frequency traders
25%
30%
35%
40%
45%
50%
55%
60%
Mar-13 Mar-14 Mar-15 Mar-16 Mar-17 Mar-18
Perc
enta
ge o
f ord
ers
< 500 milliseconds < 10 seconds All orders
Note: The data and key trends shown in this graph are described in paragraphs 163–167 (accessible version).
165 The trends evident over the five-year period resemble the fall in turnover. The share of orders attributable to high-frequency traders was higher than their corresponding share of volume. There was minimal difference over the different periods, suggesting a relative consistency in proportions for other market users.

REPORT 597: High-frequency trading in Australian equities and the Australian–US dollar cross rate
© Australian Securities and Investments Commission November 2018 Page 47
166 Table 8 repeats this analysis cross-sectionally over the subset of high-frequency orders. It confirms that high-frequency traders submitted orders on an overwhelmingly short-term basis. Over half of all untraded orders rested for less than half a second. This tendency increased at an annualised rate of 5%. In 2013, 56% of all untraded high-frequency orders rested for less than half a second—by 2018, this had increased to 69%.
167 The trend is more pronounced at the spectrum’s shortest end. Orders resting for less than 100 milliseconds (or one-tenth of a second) increased from 6% to 42% of their order book. This change is pronounced.
Table 8: Relative lifetime of short-lived orders
Year ≤ 100 ms ≤ 500 ms ≤ 1 second ≤ 10 seconds
2013 6% 56% 72% 93%
2014 7% 62% 76% 93%
2015 7% 52% 70% 93%
2016 18% 58% 76% 94%
2017 27% 64% 80% 95%
2018 42% 69% 82% 96%
Percentage of book traded
168 Our measure of inventory churn differed markedly from its equity equivalent. We reduced the period of estimation from a day to a single hour, and turnover weighted the estimates to produce an effective 24-hour figure. Participants that consistently traded bi-directionally ranked higher. This simple change tended to rank proprietary traders higher, in our ‘high-frequency-like’ measure, than the dealing banks.
169 We found a clear downward trend in intraday trading by high-frequency traders. The dataset showed an annualised 2% decrease in inventory turnover. The percentage of book traded fell from 83% to a low of 74% over the five-year period: see Figure 23. This suggests a trend towards longer holding times: see paragraph 171.

REPORT 597: High-frequency trading in Australian equities and the Australian–US dollar cross rate
© Australian Securities and Investments Commission November 2018 Page 48
Figure 23: Percentage of high-frequency turnover that is traded within a 24-hour day
65%
70%
75%
80%
85%
90%
Mar-13 Mar-14 Mar-15 Mar-16 Mar-17 Mar-18
Perc
ent o
f boo
k tra
ded
Simple average Weighted average
Note: The data and key trends shown in this graph are described in paragraphs 168–170 (accessible version).
170 As our methodology did not amalgamate traders, our estimates did not capture movement of inventory between platforms. Many entities trade across multiple platforms, so our calculations underestimated the true extent of trading.
Inventory holding time
171 We found that holding times for FX inventory extended into minutes rather than seconds. High-frequency traders tended to hold Australian against US dollars for a period of 56 minutes. This was an annualised increase of 8% over the five-year period, from a low of 40 minutes: see Figure 24.
172 Since mid-2017, there has been a significant shortening in the turnover weighted average against the more inclusive simple average. This is consistent with the 2017 divergence noted in inventory churn (see Figure 23) and indicates that the larger traders are actively shortening holding times against less active peers. These movements suggest a break in behaviour developed between the larger and smaller traders in early 2017—larger traders are successfully trading more often. This may reflect an effort to reduce risk by exiting holdings for tighter margins.

REPORT 597: High-frequency trading in Australian equities and the Australian–US dollar cross rate
© Australian Securities and Investments Commission November 2018 Page 49
Figure 24: Holding time of high-frequency Australian and US dollar inventory
35
40
45
50
55
60
65
70
75
Mar-13 Mar-14 Mar-15 Mar-16 Mar-17 Mar-18
Hold
ing
time
in m
inut
es
Simple average Weighted average
Note: The data and key trends shown in this graph are described in paragraphs 171–172 (accessible version).
Number of ‘fast messages’
173 Low-latency responses are a key determinant of high-frequency behaviour. Within a global trading environment, interpreting the response time is complicated by the dispersal of matching engines. These are typically located in London, New York and Tokyo.
174 Latency between New York and London is approximately 70 milliseconds. This is much longer than the average response time of the fastest traders. Most low-latency opportunities are likely to be found within a locality, rather than across global sites.
Note: The Wonder Network website provides a table of communication times between major cities.
175 Improvements in network speed, router efficiency and hardware performance are the main drivers of trader responsiveness. Profiling the number of low-latency responses submitted to market shows that traders are improving responsiveness. We found an annualised 46% increase in ‘fast messages’ submitted to market over the five-year period of our dataset: see Figure 25.
176 Our dataset contained a small number of sporadic pulses of low-latency responses. These flushes were unsustained and removed from Figure 25 in order to highlight the trend. A more nuanced reading suggests occasional bouts of experimentation by traders. Overly aggressive trading at speed may harm trader performance.

REPORT 597: High-frequency trading in Australian equities and the Australian–US dollar cross rate
© Australian Securities and Investments Commission November 2018 Page 50
Figure 25: Number of ‘fast messages’ posted to platforms
Mar-13 Mar-14 Mar-15 Mar-16 Mar-17 Mar-18
Num
ber o
f fas
t m
essa
ges
Simple average Weighted average
Note: The data and key trends shown in this graph are described in paragraphs 175–177 (accessible version).
177 Smaller traders submitted more low-latency messages than their larger peers. This responsiveness spiked sharply over the early January 2018 period of market volatility. However, the lower turnover attributable to these traders suggests that speed is not the only determinant of execution success.
178 A disconnect is evident in the trade data, post March 2017, between capabilities and outcomes. Smaller traders were churning less volume, holding onto positions longer and taking on more market risk despite an increase in system responsiveness.
Basis points earned
179 We looked at industry profitability subject to the limitations of our dataset. While our estimates are not comprehensive, they may be framed as a marginal contribution to overall profitability from intraday trading within a single platform.
180 We found that high-frequency traders are extracting higher margins. We estimated an annualised increase of 15% in better returns: see Figure 26. However, higher margins did not compensate for falling volumes. Overall, profitability fell at an annualised rate of 13% over the five-year period.
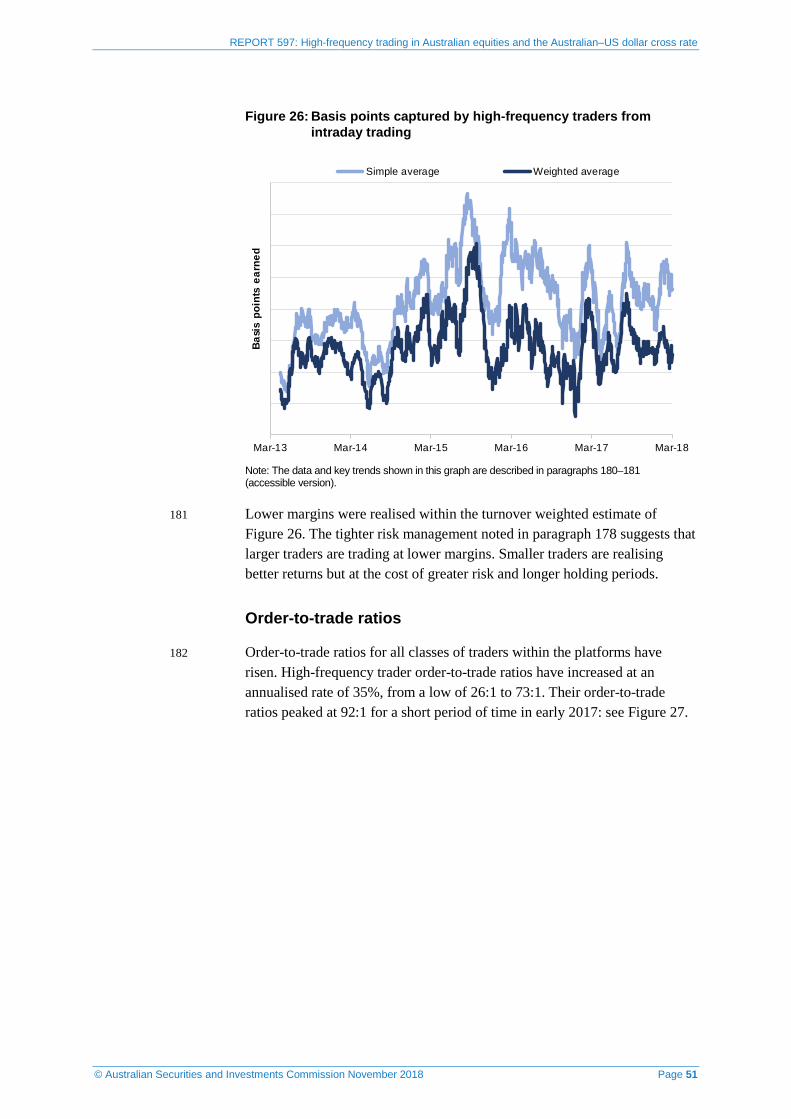
REPORT 597: High-frequency trading in Australian equities and the Australian–US dollar cross rate
© Australian Securities and Investments Commission November 2018 Page 51
Figure 26: Basis points captured by high-frequency traders from intraday trading
Mar-13 Mar-14 Mar-15 Mar-16 Mar-17 Mar-18
Basi
s po
ints
ear
ned
Simple average Weighted average
Note: The data and key trends shown in this graph are described in paragraphs 180–181 (accessible version).
181 Lower margins were realised within the turnover weighted estimate of Figure 26. The tighter risk management noted in paragraph 178 suggests that larger traders are trading at lower margins. Smaller traders are realising better returns but at the cost of greater risk and longer holding periods.
Order-to-trade ratios
182 Order-to-trade ratios for all classes of traders within the platforms have risen. High-frequency trader order-to-trade ratios have increased at an annualised rate of 35%, from a low of 26:1 to 73:1. Their order-to-trade ratios peaked at 92:1 for a short period of time in early 2017: see Figure 27.

REPORT 597: High-frequency trading in Australian equities and the Australian–US dollar cross rate
© Australian Securities and Investments Commission November 2018 Page 52
Figure 27: Order-to-trade ratios for high-frequency traders and all other participants across the trading platforms
15
25
35
45
55
65
75
85
95
Mar-13 Mar-14 Mar-15 Mar-16 Mar-17 Mar-18
Ord
er-to
-trad
e ra
tio
Non-high-frequency traders High-frequency traders
Note: The data and key trends shown in this graph are described in paragraphs 182–185 (accessible version).
183 Order-to-trade ratios for other participants have also tracked higher. Non-high-frequency traders posted consecutively higher order-to-trade ratios at an annualised rate of 40%. Their ratios lifted from 18:1 in March 2013 to 53:1 in March 2018.
184 Order-to-trade ratios in foreign exchange were much higher than their equity equivalents. There are a number of factors involved. Larger order sizes, smaller spreads and the pairing of correlated currencies all draw volatility into the market price. The parallel submission of multiple orders across fragmented platforms can lead to ambit quoting. Transactions completed in one platform can feed into multiple deletions elsewhere. Additionally, many proprietary participants function as market makers with little, or no, natural flow to buttress directionality.
185 The decline in platform volume also places upward pressure on order-to-ratios. As volumes decline, lower trade numbers naturally act to raise the numerical level of the ratio.
Facilitation by high-frequency traders
186 High-frequency traders facilitate transactions between dealing banks within the platforms. Many banks may prefer to deal exclusively with natural flow and have the option of selectively withdrawing from credit arrangements with proprietary traders. Others may find the immediate demand for liquidity overrules any desire to avoid toxic counterparts.

REPORT 597: High-frequency trading in Australian equities and the Australian–US dollar cross rate
© Australian Securities and Investments Commission November 2018 Page 53
187 Our observations indicate that high-frequency traders have been successful in interposing themselves between client-driven flow. The extent of facilitation within the platforms was higher than would be expected by random selection alone.
Figure 28: Share of transactions facilitated by high-frequency traders
38%
40%
42%
44%
46%
48%
50%
52%
54%
Mar-13 Mar-14 Mar-15 Mar-16 Mar-17 Mar-18
Shar
e of
tran
sact
ions
Percentage of transactions facilitated by high-frequency traders
Note: The data and key trends shown in this graph are described in paragraphs 188–189 (accessible version).
188 Our dataset indicates that 44% of all transactions were facilitated by high-frequency traders. This represented an annualised fall of 2% in facilitation rates from a high of 49% in early 2013: see Figure 28.
189 The fall in headline facilitation rates was driven by the overall fall in market share across the platforms: see paragraph 158. Normalising for market share, we found that high-frequency traders were extremely effective in finding and meeting non-high-frequency flow within the platforms. In March 2018, 18% more transactions were facilitated by high-frequency traders than would be expected by market share alone. It is possible that high-frequency traders are selectively deactivating credit lines between themselves. Alternatively, their strategies may function in a manner that biases natural counterparty flow.
C2 Issues with high-frequency trading in AUD/USD
190 The fragmented model of trading, lack of post-trade transparency and a predisposition to volatility can fracture foreign exchange’s price discovery process. Disequilibria may lead to disorderly markets which favour the type of nimble and fast execution techniques employed by high-frequency traders.

REPORT 597: High-frequency trading in Australian equities and the Australian–US dollar cross rate
© Australian Securities and Investments Commission November 2018 Page 54
191 Additionally, trades are not cleared centrally so it is possible for opposing orders to meet and cross but not match. This allows for arbitrage opportunities not only between platforms but also within them.
Intra-platform arbitrages
192 We scanned all intra-platform arbitrage opportunities conducted by traders in the AUD/USD cross rate over the five-year period of our study. For completeness we extended these trading events to all purchase and sale events conducted at a favourable margin within a subsecond interval. Most of these events represented traders exiting at-risk holdings due to price volatility. Approximately 15% were driven by credit arbitrages.
193 Short-term arbitrages were the simplest proxy for determining whether trends in execution inefficiencies or volatility were favouring short-term traders.
194 We found patterns of price dislocations over the trading day. These dislocations were associated with:
(a) the background volume profile of AUD/USD cross rate trading; and
(b) peak instances coinciding with the release of economic data by Australian and US government institutions.
Figure 29: Distribution of price dislocations by time
0%
1%
2%
3%
4%
5%
6%
7%
00:00 02:00 04:00 06:00 08:00 10:00 12:00 14:00 16:00 18:00 20:00 22:00
Dist
ribut
ion
of p
rice
disl
ocat
ions
11:30 am ABS economic data release
2:30 pm RBA cash rate announcement
10:30 pm US economic accounts release
Note: The data and key trends shown in this graph are described in paragraphs 194–197 (accessible version).
REPORT 597: High-frequency trading in Australian equities and the Australian–US dollar cross rate
© Australian Securities and Investments Commission November 2018 Page 55
195 Most events occurred in line with:
(a) the release of official Australian economic data (released at 11.30 am AEST (Australian Eastern Standard Time) and accounting for 6.5% of all events);
(b) the RBA’s statement on the official cash rate (released at 2.30 pm AEST and accounting for 2% of all events); and
(c) US National Economic Accounts data (released at 8.30 am PST (Pacific Standard Time) and accounting for 2.5% of all events).
196 Figure 29 charts the distribution of events over a 24-hour period. Combining all periods around data releases we note that 12% of these trading opportunities occurred consistently over less than 1% of the trading day.
197 These dislocations occur when official data is released outside of market expectations. Participants’ reassessment of relative demand may create sudden moves in currency cross rates.
Note: For example, an update on Australian CPI may be released as 2% against forecast consensus of 1.5%. This could suggest that inflationary pressures are stronger than expected and lead to upward pressure on the AUD/USD cross rate. Traders would begin purchasing foreign exchange in anticipation of further upward moves.
198 A secondary effect may be the release of liquidity held back in anticipation of shocks.
Note: Within the Australian time zone, on-market liquidity is often withdrawn by participants before the release of economic announcements. This leads to low volume and wide spreads. This is one factor in the exaggerated movements of cross rates often seen following sensitive economic announcements. Price movements are exaggerated by the lack of volume across price steps.
199 Both effects may create volatility as demand and supply recalibrate.
200 High-frequency traders are adept at operating within volatile markets. However, some platform operators have taken active steps to reduce the informational asymmetries afforded by high-frequency technology. We found these steps to be effective in reducing low-latency arbitrages.
Note: For example, Thompson Reuters Matching introduced a randomised matching barrier to all AUD/USD transactions in 2016: see H Melton, ‘Market mechanism refinement on a continuous limit order book venue: A case study’(PDF 256 KB), ACM SIGecom Exchanges, vol. 16, no. 1, August 2017.
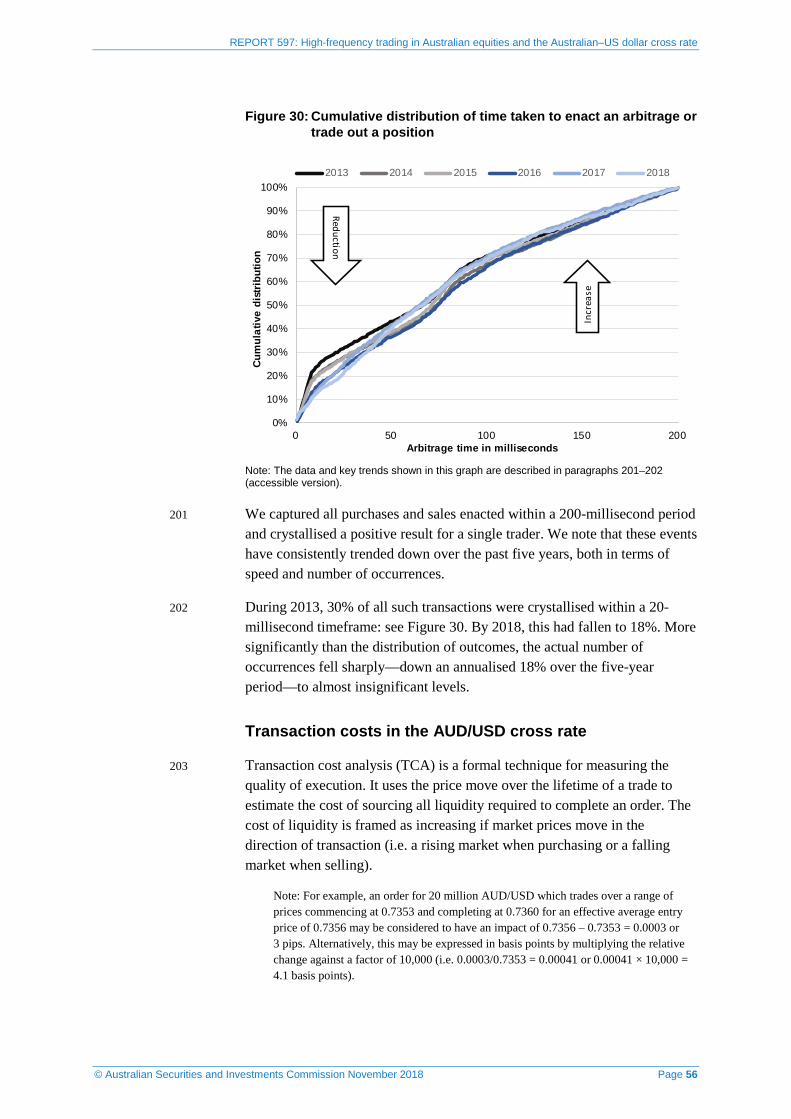
REPORT 597: High-frequency trading in Australian equities and the Australian–US dollar cross rate
© Australian Securities and Investments Commission November 2018 Page 56
Figure 30: Cumulative distribution of time taken to enact an arbitrage or trade out a position
0%
10%
20%
30%
40%
50%
60%
70%
80%
90%
100%
0 50 100 150 200
Cum
ulat
ive
dist
ribut
ion
Arbitrage time in milliseconds
2013 2014 2015 2016 2017 2018
Reduction
Incr
ease
Note: The data and key trends shown in this graph are described in paragraphs 201–202 (accessible version).
201 We captured all purchases and sales enacted within a 200-millisecond period and crystallised a positive result for a single trader. We note that these events have consistently trended down over the past five years, both in terms of speed and number of occurrences.
202 During 2013, 30% of all such transactions were crystallised within a 20-millisecond timeframe: see Figure 30. By 2018, this had fallen to 18%. More significantly than the distribution of outcomes, the actual number of occurrences fell sharply—down an annualised 18% over the five-year period—to almost insignificant levels.
Transaction costs in the AUD/USD cross rate
203 Transaction cost analysis (TCA) is a formal technique for measuring the quality of execution. It uses the price move over the lifetime of a trade to estimate the cost of sourcing all liquidity required to complete an order. The cost of liquidity is framed as increasing if market prices move in the direction of transaction (i.e. a rising market when purchasing or a falling market when selling).
Note: For example, an order for 20 million AUD/USD which trades over a range of prices commencing at 0.7353 and completing at 0.7360 for an effective average entry price of 0.7356 may be considered to have an impact of 0.7356 – 0.7353 = 0.0003 or 3 pips. Alternatively, this may be expressed in basis points by multiplying the relative change against a factor of 10,000 (i.e. 0.0003/0.7353 = 0.00041 or 0.00041 × 10,000 = 4.1 basis points).

REPORT 597: High-frequency trading in Australian equities and the Australian–US dollar cross rate
© Australian Securities and Investments Commission November 2018 Page 57
204 The process is commonly used by equity market participants to monitor for potential toxicity. Venues that consistently realise higher transaction costs may be considered a poor source of liquidity and avoided.
205 In 2005, Record Currency Management estimated transaction costs for FX transactions across a range of investment managers at 9 basis points. A more granular estimate by Investment Technology Group (ITG) estimated average transaction costs for the AUD/USD cross rate of 3.2 basis points. Normalised to volume, this suggested a possible range of 0.4–1.5 basis points for trades of A$100 million.
Notes
1. See Record Currency Management, ‘Report to Frank Russel on currency transaction costs’, February 2005.
2. See ITG research report, ‘The cost of liquidity in the FX market’ (PDF 664 KB), October 2014.
206 We used TCA to identify the relative contribution to execution costs from high-frequency trading. Using our dataset, we estimated transaction costs in the AUD/USD cross rate for non-high-frequency traders over a subset of transactions undertaken:
(a) over a uniform direction;
(b) over an extended period; and
(c) for a quantity of A$20 million or more.
207 We regressed transaction costs against the market share of high-frequency traders as the order was completed to determine whether traders were contributing to poorer outcomes by the dealing banks.
208 Our approach did not account for opportunity cost or limit exhaustion. However, we did account for the relative effects of size, timing, market share and volatility.
209 Our observations found that transaction costs were sensitive to size and aggression. Our visualisation of transaction costs (see Figure 31) normalises costs and size against time. It displays the cost of execution against the volume completed within the platforms. The chart confirms that large and urgent orders tend to complete with higher costs.

REPORT 597: High-frequency trading in Australian equities and the Australian–US dollar cross rate
© Australian Securities and Investments Commission November 2018 Page 58
Figure 31: Hourly transaction costs by size
-1
0
1
2
3
1 10 100
Basi
s po
ints
per
hou
r
A$ executed per hour
< 200 200-399 400-599 600-799 ≥ 800
Note: The data and key trends shown in this graph are described in paragraph 209–210 (accessible version).
210 We estimated an average transaction cost for the AUD/USD cross rate of 0.25 basis points for every A$10 million executed per hour. A tenfold increase in requested liquidity (to A$100 million) raised costs to 1.2 basis points.
211 A simple scatter plot of costs and size does not capture all the drivers of transaction costs. Structural differences within the market, modes of execution, and the motivations and styles of participants may all contribute to execution outcomes. As shown in Figure 32, transaction costs have not remained static over time. For most of the five-year period, transaction costs trended higher—rising from an average of 0.12 basis points to a high of 0.34 basis points in August 2016. After August 2016, those costs receded sharply.
212 Global macroeconomic events may be read clearly across our 2016 estimates. In June 2016, the explosive fallout of Brexit appeared as a sharp increase in transaction costs for large volume orders. After August 2016, Brexit’s aftermath precipitated a sharp 30% fall in AUD/USD price volatility coinciding with the observed retraction across the latter estimates.

REPORT 597: High-frequency trading in Australian equities and the Australian–US dollar cross rate
© Australian Securities and Investments Commission November 2018 Page 59
Figure 32: Hourly transaction costs by time
0
0.2
0.4
0.6
0.8
1
1.2
Mar-13 Mar-14 Mar-15 Mar-16 Mar-17 Mar-18
Wei
ghte
d ba
sis p
oint
s per
hou
r
All parent orders > A$10 m > A$50 m > A$100 m
Note: The data and key trends shown in this graph are described in paragraphs 211–212 (accessible version).
213 Market turnover also has a material effect on transaction costs. Examining average costs on an intraday basis clearly showed high- and low-cost zones aligned to the trading day’s volume profile. A sharp reduction within the average intraday profile was apparent at 11.30 am AEST coinciding with Australian official data releases and sharply raised volumes.
214 Discerning the effects of high-frequency trading on transaction costs requires analysis. As a first-order effect, any harm or benefit provided by high-frequency traders needs to be disentangled from the effects of volume. We used an exploratory multivariate regression to determine high-frequency trading’s association with trading costs and to correct for a range of other factors.
215 We considered the following regression parameters:
(a) size parent order: the size of the parent order executed as a series of individual child orders. This varied from a minimum of A$20 million to over A$1 billion;
(b) time to complete: the period over which the order was executed as measured by the difference between the last and first execution;
(c) volatility: a measure of intraday volatility calculated using one-minute returns around the time of execution;
(d) period progression: a progressive index indicating the day within the five-year dataset on which the trade occurred;
(e) market volume: a measure of market volume for the AUD/USD cross rate within the dataset;

REPORT 597: High-frequency trading in Australian equities and the Australian–US dollar cross rate
© Australian Securities and Investments Commission November 2018 Page 60
(f) share of HFT: a measure of high-frequency trader activity within the AUD/USD cross rate over the period in which the order was traded;
(g) competition: a measure of co-directional trading in the AUD/USD cross rate among larger non-high-frequency traders also active over the same period;
(h) share of turnover: a measure of the parent order’s size relative to total market activity;
(i) share of orders: a measure of the intensity of the parent order’s order book activity relative to the total market;
(j) is Australian bank: a binary flag (0 or 1) indicating whether the dealing bank was an Australian entity;
(k) is Euro time zone: a binary flag (0 or 1) indicating whether the order had been executed during the European time zone; and
(l) is US time zone: a binary flag (0 or 1) indicating whether the order had been executed during the US time zone.
216 We regressed our estimates of transaction costs for all large orders conducted by non-high-frequency traders over the five-year period against a range of parameters taken from paragraph 215. Results are displayed as a series of parallel calculations for the different linear models M1 to M8.
Note: A model represents an estimation of transaction costs of the form:
TransactionCost = a1.Variable1 + a2.Variable2 + ... + an.Variablen + constant
where the set {Variable1, Variable2, … Variablen} is a selection of associated regressors (such as order size, market volatility) and the regression coefficients a1, a2, … an are estimated from data.
217 The regression coefficients are listed in Table 9. The results for each separate linear model are listed down the table’s columns.
Table 9: Exploratory models across transaction costs
Regressor M1 M2 M3 M4 M5 M6 M7 M8
Size parent order 0.03 *** 0.03 *** 0.02 *** – – – – 0.02 ***
Time to complete -0.06 -0.09 -0.06 -0.17 -0.17 -0.18 – -0.09
Volatility 0.24 *** 0.20 ** 0.21 *** -0.05 -0.05 -0.05 – 0.20 ***
Period progression -0.07 0.08 0.05 0.08 0.09 0.12 – 0.09
Market volume -0.83 -0.80 *** -0.77 *** – – – – -0.76 ***
Share of HFT – 0.19 *** 0.16 *** 0.16 *** 0.13 *** 0.11 *** – 0.13 ***
Competition – – 0.48 *** 0.66 *** 0.64 *** 0.64 *** – 0.47 ***

REPORT 597: High-frequency trading in Australian equities and the Australian–US dollar cross rate
© Australian Securities and Investments Commission November 2018 Page 61
Regressor M1 M2 M3 M4 M5 M6 M7 M8
Share of turnover – – – 0.40 * 0.54 *** 0.46 *** – –
Share of orders – – – – -0.44 * -0.44 * – -0.29 **
Is Australian bank – – – – – -0.96 *** -1.16 *** -1.32 ***
Is Euro time zone – – – – – -0.05 -0.02 -0.12
Is US time zone – – – – – 0.01 0.00 -0.12
Constant -0.52 *** -0.60 *** -0.45 ** 0.52 *** 0.52 *** 0.63 ** 0.69 ** -0.24
R-squared 2.8% 2.9% 3.5% 1.8% 2.4% 2.6% 0.4% 4.2%
Note: Significance indicators: *** > 99.9%, ** > 99%, * > 95%, . > 90%
218 Regression coefficients are estimates of the relationship between the regressed variable and the dealing banks’ transaction costs. Regression coefficients that are positively signed indicate a positive correlation with transaction costs—that is, increases in the regressed variable are associated with an increase in transaction costs. Regression estimates that are negatively signed indicate a negative correlation—that is, increases in the regressed variable are associated with a decrease in transaction costs. The three-star standard indicates statistical significance. This is a measure of the likelihood that the observed association is due to chance alone, and is given as:
(a) three stars (***): 1 in a 1,000 chance;
(b) two stars (**): 1 in a 100 chance;
(c) one star (*): 1 in 20 chance; and
(d) dot (.): 1 in 10 chance.
219 The multivariate approach corrects for associations arising from other parallel changes. Our use of multiple models contextualises the relationship between high-frequency activity and investor transaction costs against other effects operating simultaneously within the market. For example, model M2 extends M1 by including a measure of high-frequency activity. After accounting for high-frequency activity, the sign of the period progression coefficient changes from negative to positive. This indicates that the effect of lower transaction costs over time suggested by M1 is better explained by the reduction of high-frequency turnover. That is, after adjusting for the decline in high-frequency participation, transaction costs have increased.
220 Our models suggest that transaction costs tend to be lower:
(a) as the amount of trading in the AUD/USD cross rate increases (i.e. as market liquidity increases);

REPORT 597: High-frequency trading in Australian equities and the Australian–US dollar cross rate
© Australian Securities and Investments Commission November 2018 Page 62
(b) when an Australian dealing bank executes the order;
Note: This may reflect:
• a competitive advantage of Australian or large banks to source further liquidity among a wider client base; or
• a lower level of aggression.
(c) when the executing bank executes a strategy of a relatively higher order-to-trade ratio; and
Note: This explanatory variable, while expressed as a behavioural factor, is more likely to be associated with the use of algorithms.
(d) as the time taken to complete the order is extended.
221 Our models also suggest that transaction costs tend to be higher:
(a) for parent orders which are large in absolute or relative terms;
(b) when other large non-high-frequency orders are executed in the same direction as the order; and
(c) when high-frequency traders are active.
222 The impact of volatility lacks consistency across the models. The observed fall in transaction costs noted in paragraph 212 suggests a clear positive relationship with volatility; however, the details are more nuanced. Volatility and volume have a complicated and non-linear relationship as both low and high volume are associated with higher volatility. The inclusion of market share, and removal of order size, in model M4 changes the direction of volatility’s association with costs as volatility and volume effects are confounded within the market share measure. Order size in absolute terms is the better regressor as it allows a cleaner separation between volume and volatility effects.
223 Transaction costs are positively associated with high-frequency trading. This relationship is both persistent and statistically significant across the various models. These estimates do not address causality; that is, the association does not address whether:
(a) high-frequency trading leads to higher transaction costs; or
(b) the higher costs paid to find liquidity are attracting more high-frequency traders.
224 We investigated causality by testing the directional bias and temporal responsiveness of high-frequency traders to larger orders. Regressing the net difference between co-directional and opposing high-frequency trades should indicate whether the traders were engaged in:
(a) a directional strategy—such as front-running, or momentum-surfing, demand; or
(b) a reversionary strategy—such as market making or stochastic trading.

REPORT 597: High-frequency trading in Australian equities and the Australian–US dollar cross rate
© Australian Securities and Investments Commission November 2018 Page 63
225 Adjusting the time of high-frequency activity relative to the time of transaction should indicate whether the traders are responding to, or are encouraged by, the high-cost demand.
226 As our regressed dataset is restricted to high-cost events over extended periods, short-term adverse selection cannot have a major effect.
Figure 33: High-frequency trading multiplier against larger institutional orders over a series of lagged intervals
-140%
-120%
-100%
-80%
-60%
-40%
-20%
0%-40 -30 -20 -10 0 10 20 30 40
High
-freq
uenc
y tra
ding
vol
ume
mul
tiplie
r
Seconds after child transaction
Net high-frequency volume (with - against)
Note: The data and key trends shown in this graph are described in paragraphs 227–229 (accessible version).
227 We regressed high-frequency responses against large unidirectional non-high-frequency trades. A positive multiplier indicates that high-frequency trades follow the direction of trade, while a negative multiplier indicates that high-frequency traders trade against it. Figure 33 charts the sign and magnitude of our estimates.
228 We found that the net response by high-frequency traders was to trade against the orders. High-frequency traders supplied liquidity to dealing bank demand at an average ratio of 1.2:1 per second. Adjusting the lag over relative steps of one second, we observed that dealing banks tended to follow high-frequency activity; that is, there was more high-frequency liquidity being supplied to the market immediately before the nominated transaction rather than after it. Figure 33 charts the relationship over a scale of seconds; the observed lagged bias repeats itself over shorter intervals.
229 There is no evidence of toxicity. On a net basis transaction costs are not exaggerated by front-running or any momentum explosive strategy. Higher costs are a product of higher demand. The temporal bias suggests a tendency by dealing banks to in-line into periods of high volume; that is, dealers

REPORT 597: High-frequency trading in Australian equities and the Australian–US dollar cross rate
© Australian Securities and Investments Commission November 2018 Page 64
managing larger orders and seeking additional liquidity are trading into pockets of high-frequency activity.
C3 Summary of key findings
230 High-frequency traders have a significant presence within the global multi-dealer platforms. Participation levels are coloured by significant declines in trading volumes and the broader fragmentation of institutional liquidity.
231 High-frequency traders in foreign exchange are exposed to the same pressures as their equity peers. Holding times have increased and intraday trading has decreased. Speed is important but is not the only driver of strategies. Lower volumes within the platforms have capped industry growth.
232 Order-to-trade ratios are high and growing. Greater fragmentation to FX liquidity suggests that order-to-trade ratios are unlikely to decline.
233 Price dislocations within the platforms have decreased. High-frequency traders participate in imbalanced markets, but dislocation arbitrages do not feature as a material driver of their activity.
234 Dealing banks and high-frequency traders are embedded in a symbiotic pairing and banks are using traders to clear risk. High-frequency trading is not a causal factor in poor execution outcomes.

REPORT 597: High-frequency trading in Australian equities and the Australian–US dollar cross rate
© Australian Securities and Investments Commission November 2018 Page 65
Key terms
Term Meaning in this document
AFS licence An Australian financial services licence under s913B of the Corporations Act that authorises a person who carries on a financial services business to provide financial services
Note: This is a definition contained in s761A of the Corporations Act.
agency Where a market participant acts on behalf of a client
aggressive order An order that is priced so that it is immediately executable (i.e. priced to buy at or above the current offer, or to sell at or below the current bid). An example of an aggressive order is a market order
algorithm Automated strategies using programmable logic/system-generated orders (rather than human-generated orders) based on a set of predetermined parameters, logic rules and conditions. These include algorithmic trading, automated order generation, high-frequency trading and automated market making
algorithmic trading Electronic trading activity where specific execution outcomes are delivered by predetermined parameters, logic rules and conditions
arbitrage The process of seeking to capture pricing inefficiencies between related products or markets
ASIC Australian Securities and Investments Commission
ASX ASX Limited or the exchange market operated by ASX Limited
ASX 24 The exchange market formerly known as Sydney Futures Exchange (SFE), operated by Australian Securities Exchange Limited
bid–offer spread The difference between the best bid and the best offer (also known as ‘bid–ask spread’)
buy-side Institutions typically concerned with buying, rather than selling, assets or products. Private equity funds, mutual funds, unit trusts, hedge funds, pension funds and proprietary trading desks are the most common types of buy-side entities
CBOE Chicago Board Options Exchange
Corporations Act Corporations Act 2001, including regulations made for the purposes of that Act
depth Volume of orders on an order book available to be traded
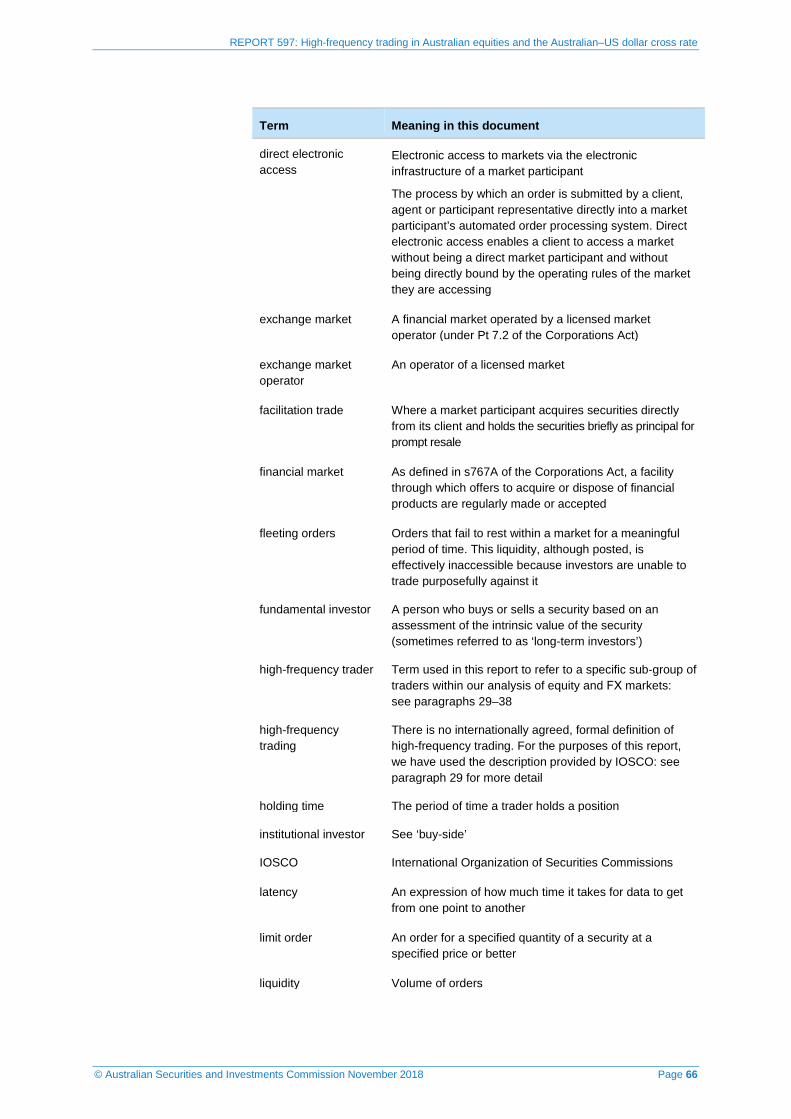
REPORT 597: High-frequency trading in Australian equities and the Australian–US dollar cross rate
© Australian Securities and Investments Commission November 2018 Page 66
Term Meaning in this document
direct electronic access
Electronic access to markets via the electronic infrastructure of a market participant
The process by which an order is submitted by a client, agent or participant representative directly into a market participant’s automated order processing system. Direct electronic access enables a client to access a market without being a direct market participant and without being directly bound by the operating rules of the market they are accessing
exchange market A financial market operated by a licensed market operator (under Pt 7.2 of the Corporations Act)
exchange market operator
An operator of a licensed market
facilitation trade Where a market participant acquires securities directly from its client and holds the securities briefly as principal for prompt resale
financial market As defined in s767A of the Corporations Act, a facility through which offers to acquire or dispose of financial products are regularly made or accepted
fleeting orders Orders that fail to rest within a market for a meaningful period of time. This liquidity, although posted, is effectively inaccessible because investors are unable to trade purposefully against it
fundamental investor A person who buys or sells a security based on an assessment of the intrinsic value of the security (sometimes referred to as ‘long-term investors’)
high-frequency trader Term used in this report to refer to a specific sub-group of traders within our analysis of equity and FX markets: see paragraphs 29–38
high-frequency trading
There is no internationally agreed, formal definition of high-frequency trading. For the purposes of this report, we have used the description provided by IOSCO: see paragraph 29 for more detail
holding time The period of time a trader holds a position
institutional investor See ‘buy-side’
IOSCO International Organization of Securities Commissions
latency An expression of how much time it takes for data to get from one point to another
limit order An order for a specified quantity of a security at a specified price or better
liquidity Volume of orders

REPORT 597: High-frequency trading in Australian equities and the Australian–US dollar cross rate
© Australian Securities and Investments Commission November 2018 Page 67
Term Meaning in this document
listed companies Companies that are listed on an exchange market
lit (exchange) market An exchange market where orders are displayed on the order book of a market operated by a market licensee and the orders are therefore pre-trade transparent
market integrity rules Rules made by ASIC, under s798G of the Corporations Act, for trading on domestic licensed markets
market licence An Australian market licence
market licensee Holder of an Australian market licence
market maker An entity that provides liquidity to a market when it is generally absent or weak, and manages short-term buy and sell imbalances in customer orders by taking the other side of transactions. Market makers often take on this role in return for fee rebates or other incentives
market manipulation As defined in Pt 7.10 of the Corporations Act
market order An order matched at the best price currently available
market participant A participant of a licensed market
order book An electronic list of buy orders and sell orders, maintained by or on behalf of a market operator, on which those orders are matched with other orders in the same list
order-to-trade ratio The number of times orders submitted into an order book are amended or cancelled relative to the execution of a trade
pip A percentage in point (or pip) is the quoted unit for an FX contract. For example, a single pip for the AUD/USD cross rate is a price move of US$0.0001
post-trade transparency
Information on executed transactions made publicly available after transactions occur
pre-trade transparency
Information on bids and offers made publicly available before transactions occur (i.e. displayed liquidity)
price formation The process of determining the price of a security through the interaction of buyers and sellers
principal trader A market participant that can only trade on behalf of itself. ‘Principal trader’ is the term used in the market integrity rules
profiling Where the operator of an exchange market or crossing system profiles clients or users of the market and groups them into categories or provides the capacity for market participants to profile their clients
RBA Reserve Bank of Australia

REPORT 597: High-frequency trading in Australian equities and the Australian–US dollar cross rate
© Australian Securities and Investments Commission November 2018 Page 68
Term Meaning in this document
REP 331 (for example) An ASIC report (in this example numbered 331)
retail client Has the meaning given in s761G and 761GA of the Corporations Act
retail investor A retail client as defined in s761G of the Corporations Act
RG 223 (for example) An ASIC regulatory guide (in this example numbered 223)
S&P/ASX 50 The index known as the S&P/ASX 50
S&P/ASX 200 The index known as the S&P/ASX 200
S&P/ASX 300 The index known as the S&P/ASX 300
s912 (for example) A section of the Corporations Act (in this example numbered 912), unless otherwise specified
sell-side Firms that sell investment services to the buy-side, or corporate entities, including broking–dealing, investment banking, advisory functions and investment research
SPI The ASX 24 futures contract over the S&P/ASX 200 Index
spread The difference between the best bid and offer prices
TCA Transaction cost analysis refers to a process that measures the cost of execution
tick size The minimum increment by which the price for an equity market product or Commonwealth Government Securities depository interest may increase or decrease
trading messages Messages submitted in relation to trading functions, such as orders, amendment or cancellation of orders, and the reporting or cancellation of market transactions
VIX Index Refers to the CBOE Volatility Index which is a market-based measure of expected future volatility

REPORT 597: High-frequency trading in Australian equities and the Australian–US dollar cross rate
© Australian Securities and Investments Commission November 2018 Page 69
Related information
Headnotes
algorithmic trading, bond roll, dealing banks, facilitation, foreign exchange, fundamental investor, fragmentation, high-frequency trading, IOSCO, latency arbitrage, liquidity segmentation, market integrity, market operator, market participant, market quality, price improvement, principal trader, profiling, trading venue
Regulatory guides
RG 172 Financial markets: Domestic and overseas operators
RG 241 Electronic trading
RG 265 Guidance on ASIC market integrity rules for participants of securities markets
RG 266 Guidance on ASIC market integrity rules for participants of futures markets
Legislation
Corporations Act, s761A, 761G, 761GA, 764A(k), 767A and 798G
Consultation papers and reports
CP 145 Australian equity market structure: Proposals
CP 168 Australian equity market structure: Further proposals
CP 202 Dark liquidity and high-frequency trading: Proposals
REP 215 Australian equity market structure
REP 331 Dark liquidity and high-frequency trading
REP 394 Review of recent rule changes affecting dark liquidity
REP 452 Review of high-frequency trading and dark liquidity
REP 535 ASIC cost recovery arrangements: 2017–18
Market integrity rules
ASIC Market Integrity Rules (Securities Markets) 2017
ASIC Market Integrity Rules (Securities Markets – Capital) 2017
REPORT 597: High-frequency trading in Australian equities and the Australian–US dollar cross rate
© Australian Securities and Investments Commission November 2018 Page 70
Media releases
17-461MR Epoch Capital Pty Ltd pays $130,000 in infringement notice penalty
Other publications
BIS 2011, High-frequency trading in the foreign exchange market, BIS Markets Committee paper, No. 5, September
BIS 2016, Triennial Central Bank Survey of foreign exchange and OTC derivatives markets in 2016
BIS 2018, Monitoring of fast-paced electronic markets (PDF 789 KB), BIS Markets Committee, report, September
Euromoney Foreign Exchange Survey 2018
Global Foreign Exchange Committee 2018, FX Global Code
IOSCO (Technical Committee) 2011, Regulatory issues raised by the impact of technological changes on market integrity and efficiency (PDF 587 KB), consultation report, July
ITG 2014, ‘The cost of liquidity in the FX Market’ (PDF 664 KB), research report, October
Lewis, M 2014, Flash Boys: A Wall Street Revolt, WW Norton & Co, NY
Melton, H 2017, ‘Market mechanism refinement on a continuous limit order book venue: A case study’(PDF 256 KB), ACM SIGecom Exchanges, vol. 16, no. 1, August