report - · pdf file29 reference markets 33 summary of financial ... › we reduced our...
TRANSCRIPT

CARRARO GROUPAnnual Report 2015
RE
PO
RT


REPORT
CARRARO GROUPAnnual Report 2015
—

INDEX
7 Letter from the Chairman 13 Ownership Structure 14 Consolidated Income Statement 15 Consolidated Statement of Financial Position 16 Cash Flow 17 Analisys of Net Working Capital 19 The Carraro Group
KEYFACTORSOFSUCCESS 23 Research and Innovation
HIGHLIGHTS 29 Reference Markets 33 Summary of Financial Year 2015 42 Breakdown by Sector of Application 44 Main Markets 46 Summary Data and Graphs 53 Significants Events in Financial Year 2015 55 Share Performance 57 Business Outlook and Projections for 2016
DIRECTORS’REPORT ONOPERATIONS 61 Balance Sheet and Financial Data 75 Performance and Results of Carraro Group Business Areas 77 BA Drivelines & Components 91 BA Vehicles 99 BA Electronics
CONSOLIDATEDFINANCIAL STATEMENTS 121 Consolidated Financial Statements 195 Report of the Board of Statutory Auditors 200 Auditors’ Report 202 Ordinary Shareholders’ Meeting

Annual Review 20156 – 7
Dear Shareholders, We leave behind a year characterised by both light and shadows. The negative market en-vironment has taken its toll on all players in our industry, and has developed in a different manner to that suggested by predictions at the beginning of the year.
Sales volumes have been uneven and from June onwards, both in the agriculture sector (with the exception of specialist tractors) and in the construction sector, there were ob-vious and progressive signs of slowdown. This resulted in a 7.4% decline in consolidated turnover, amounting to 674 million euros. This decline is due, on the one hand, to the reduction in sales volumes, and on the other, to the different scope of consolidation.
The year ended with a net loss of 8.9 million euros, demonstrating a further deteriora-tion following the 7.9 million euro loss recorded in 2014. We must take into account, how-ever, that only Elettronica Santerno registered a loss of 26 million euros following a radi-cal plan of reorganisation, which also includes a major goodwill amortisation of 16 million euros, offset by the positive effects arising from divestments implemented during the year, as fully described in the notes accompanying the financial statements. Despite the gener-alised compression of volumes across the market, Carraro Drive Tech, the Group’s main business, has progressively improved its results in terms of industrial margins, benefiting from the industrial actions undertaken so far. Carraro Agritalia, too, has seen a number of positive results recently - indeed, 2015 was a record year for the brand both in terms of sales and profitability.
The decline in volumes during the year gave further impetus to the reorganisation of the group, serving to accelerate this project. We can therefore look upon 2015 as a truly pivotal year, and the starting point for our new Three-Year Plan. Today, we are a long way from the extraordinary economic situation we found ourselves in during 2008, which saw every industrial sector and geographical region recording growth rates way above and beyond the norm. Today, the market environment is completely different: volumes are lower, but steady, customer warehouses are increasingly optimised, and greater flexibility is required. Our Group has succeeded in adapting to this reference framework, and we possess the strategic levers necessary for competing successfully, both with regard to tech-
Letter from the Chairman
Letter from the Chairman
nology, through the introduction of new products, and in terms of industrial platforms and service.
We launched this process in recent months, and draw your attention to the key actions already completed during the year 2015.
› We reduced our presence in the planetary gear sector through the transfer of control of the German company O&K Antriebstechnik to a major Italian industrial group (Bonfiglioli), with a view to further accelerating the development of O&KA and strengthening the capital and financial base of the core business.
› We wound up industrial activities at our office in Gorizia, concentrating produc-tion in the plants at Maniago and Campodarsego, with significant results in terms of efficiency for our Italian production plants.
› We have radically changed the focus of the Elettronica Santerno business, with a comprehensive reorganisation of the company and a simultaneous reconfiguration of its cost structure. The new course that this Group company specialising in power electronics will take is designed to capitalise on Elettronica Santerno’s solid techno-logical expertise, particularly in the broad field of industrial applications, looking to branch out into business areas with greater added value.
› We began to market several new products, the result of our R&D investments in recent years. This step falls within the new Product Development Plan, which pro-vides for the launch of over 30 projects in the three period, divided between tractors, transmissions and axles - all of which are designed to offer superlative solutions to meet the key requirements of efficiency and productivity, crucial for competing in to-day’s market. This will allow us to increase our market share. In addition, in order to provide additional support to the Group’s innovative activities, in 2015, we doubled the Testing area within our R&D centre at Campodarsego, where all of our Italian Research activities are concentrated.
› We have secured financial support for the new Strategic Plan for 2016-2019 from the Group’s key lenders, with whom we have signed an agreement aimed at restructuring the company debt. Added to this is the confirmation received from con-trolling shareholders of Carraro Spa, who have guaranteed a future capital increase for the plan.
And while 2016 cannot yet be called a profitable year, developments in recent months nonetheless confirm the validity and the positive effects of the actions undertaken. A real change of pace has occurred, driving the Group back towards a significant increase in profitability by the end of the Plan, with an anticipated increase in turnover of almost 100 million euros.
This will be made possible by the reinvigorated support that we are seeing from many of our customers; we have recently signed important commercial contracts for the medium

Annual Review 20158 – 9
to long term with a number of them. Among these, in particular, are the supply agree-ments finalised with some of the industry’s leading tractor manufacturers.
Even in the most difficult moments of our history as a company, we have always fo-cused on technology, innovation, human capital and the ability to change and evolve. This has allowed us to maintain our remarkable high levels of technological potential within the Group, both in terms of production and research. Indeed, these are the fundamental points that will enable us not only to further strengthen our relationships with our part-ners, but above all to expand the Group into developing geographic regions - on the quest for long-term relationships and mutual success.
ENRICO CARRARO
Chairman


Annual Review 201510 – 11
Carraro SpaHeadquartersVia Olmo, 3735011 Campodarsego(Padova), ItalyP +39 049 9219111F +39 049 [email protected]
Share CapitalEuro 23,914,696fully paid-upTax Code/VAT No.and Padua Registerof CompaniesNo. 00202040283Padua REA No. 84033
DISCLAIMERThis document contains forward-looking statements, in particular in the section “Business outlook and projections for 2014”, in relation to future events and the operating, economic and financial results of the Carraro Group. These forecasts have by
their very nature a component of risk and uncertainty, as they depend on the occurrence of future events and developments. The actual results may differ, even significantly, from those announced in relation to a multiplicity of factors.
Board of DirectorsIn office until approval of the 2017 Financial Statements (Appointments, Shareholders’ Meeting 23/03/2015)
Enrico CarraroChairman
Tomaso CarraroDeputy Chairman
Alberto Negri Chief Executive Officer
Fabio Buttignon 1/2
Director*
Riccardo ArduiniDirector (from 18/12/2015)
Marina Manna 1/3
Director*
Marina Pittini 2
Director*
Alexander Bossard 1/2
Director* (until 18/12/2015)
1 Members of the Auditing and Risk Committee2 Members of the Appointments and Remuneration Committee3 Members of the Supervisory Board* Independent Directors
Board of Statutory AuditorsIn office until approval of the 2017 Financial Statements (Appointments, Shareholders’ Meeting 23/03/2015)
Saverio BozzolanChairman
Stefania CentorbiRegular Auditor
Andrea CortellazzoRegular Auditor
Barbara CantoniAlternate Auditor
Gianmarco MilanatoAlternate Auditor
Independent Auditors2007–2015PricewaterhouseCoopers Spa
Parent CompanyFinaid Spa
Under the terms and for the purposes of Consob Communication no. 97001574 of 20 February 1997, we state that: The Chairman, Mr Enrico Carraro and the Chief Executive Officer, Mr Alberto Negri, have been given severally powers of legal representation and use of the corporate signature in relations with third parties and in court; they carry out their work within the limits of the powers conferred on them by the Board of Directors in the meeting of 23 March 2015 and on the CEO in the meeting of 29 October 2014, in accordance with applicable legal constraints, in terms of matters which cannot be delegated by the Board of Directors and of responsibilities reserved for the Board itself, as well as the principles and limits provided for in the Company’s Code of Conduct.
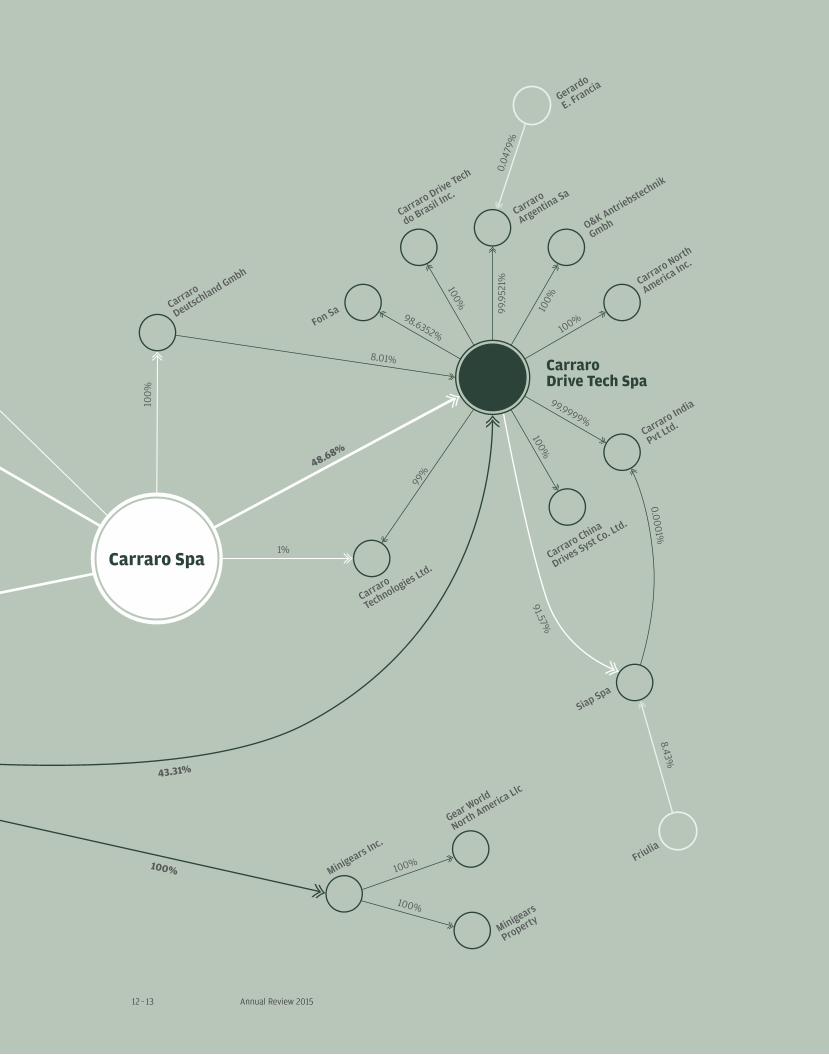
Ownership Structure

Carraro Spa
Carraro International Sa
Carraro Drive Tech Spa
ElettronicaSanterno Spa
Ownership Structure
100%
0.0001%
0.04
79%
8.43%
Friulia
Siap Spa
Minigears Inc.
Gear World
North America Llc
Minigears
Property
48.68%
43.31%
100%
99.9521%
8.01%
100%
1%
91.57%
98.6352%
Carraro
Deutschland Gmbh
Carraro
Technologies Ltd.
Carraro Drive Tech
do Brasil Inc.
Carraro
Argentina Sa
100%
100%
99.9999%
Carraro North
America Inc.
Carraro India
Pvt Ltd.
Carraro China
Drives Syst Co. Ltd.
O&K Antriebstechnik
Gmbh
100%
Fon Sa
100%
99%
100%
100%
100%
100%
67%33%
0.34%
99.66%
100%
Santerno Inc.
Santerno
India Pvt Ltd
Elettronica Santerno
España Sl
Santerno South Africa
Pvt Ltd
Santerno
Shangai Trad Ltd
Eletronica Santerno
Industria e Comercio Ltda Gerardo
E. Francia
100%
100%
Carraro Spa
Carraro International Sa
Carraro Drive Tech Spa
ElettronicaSanterno Spa
Annual Review 201512 – 13
100%
0.0001%
0.04
79%
8.43%
Friulia
Siap Spa
Minigears Inc.
Gear World
North America Llc
Minigears
Property
48.68%
43.31%
100%
99.9521%
8.01%
100%
1%
91.57%
98.6352%
Carraro
Deutschland Gmbh
Carraro
Technologies Ltd.
Carraro Drive Tech
do Brasil Inc.
Carraro
Argentina Sa
100%
100%
99.9999%
Carraro North
America Inc.
Carraro India
Pvt Ltd.
Carraro China
Drives Syst Co. Ltd.
O&K Antriebstechnik
Gmbh
100%
Fon Sa
100%
99%
100%
100%
100%
100%
67%
33%
0.34%
99.66%
100%
Santerno Inc.
Santerno
India Pvt Ltd
Elettronica Santerno
España Sl
Santerno South Africa
Pvt Ltd
Santerno
Shangai Trad Ltd
Eletronica Santerno
Industria e Comercio Ltda Gerardo
E. Francia
100%
100%

Directors' Report on Operations
Consolidated Income Statementas at 31/12/2015
31.12.15 % 31.12.14 % Changes
31.12.15 31.12.14
Revenues from sales 674,010 100.00% 727,757 100.00% –53,747 –7.39%
Purchases of goods and materials (net of changes in inventories)
–401,175 –59.52% –433,193 –59.52% 32,018 –7.39%
Services and Use of third-party goods and services
–109,690 –16.27% –118,739 –16.32% 9,049 –7.62%
Personnel costs –125,063 –18.56% –133,181 –18.30% 8,118 –6.10%
Amortisation, depreciation and impairment of assets
–48,908 –7.26% –28,130 –3.87% –20,778 73.86%
Provisions for risks –11,586 –1.72% –11,128 –1.53% –458 4.12%
Other income and expenses 17,758 2.63% 4,161 0.57% 13,597
Internal construction 4,985 0.74% 4,559 0.63% 426 9.34%
Operating costs –673,679 –99.95% –715,651 –98.34% 41,972 –5.86%
Operating profit/(loss) (Ebit) 331 0.05% 12,106 1.66% –11,775 –97.27%
Income from equity investments 22,825 3.39% 475 0.07% 22,350
Other financial income 3,764 0.56% 3,906 0.54% –142 –3.64%
Financial costs and expenses –20,182 –2.99% –18,552 –2.55% –1,630 8.79%
Net gains/(losses) on foreign exchange
–4,471 –0.66% –2,905 –0.40% –1,566 53.91%
Value adjustments of financial assets
– –0.00% –
Gains/(losses) on financial assets 1,936 0.29% –17,076 –2.35% 19,012
Profit/(loss) before taxes 2,267 0.34% –4,970 –0.68% 7,237
Current and deferred income taxes –11,373 –1.69% –2,871 –0.39% –8,502
Net profit/(loss) –9,106 –1.35% –7,841 –1.08% –1,265 16.13%
Profit/(loss) pertaining to minorities
191 0.03% –72 –0.01% 263
Group consolidated profit/(loss) –8,915 –1.32% –7,913 –1.09% –1,002 12.66%
Ebitda 46,938 6.96% 38,763 5.33% 8,175 21.09%
Am
ount
s in
Eur
o/0
00

Annual Review 201514 – 15
Consolidated Statement of Financial Position as at 31/12/2015
31.12.15 31.12.14
Property, plant and equipment 163,828 185,403
Intangible fixed assets 70,702 91,335
Real estate investments 695 708
Investments 16,552 -
Financial assets 8,896 2,064
Deferred tax assets 29,796 43,524
Trade receivables and other receivables 3,056 4,120
Non-current assets 293,525 327,154
Closing inventory 118,086 146,745
Trade receivables and other receivables 88,683 113,877
Financial assets 8,972 5,040
Cash and cash equivalents 70,758 62,822
Current assets 286,499 328,484
Total assets 580,024 655,638
Share Capital 23,915 23,915
Reserves 26,854 35,919
Foreign currency translation reserve -13,489 -13,562
Profit/loss for the year -8,915 -7,913
Minority interests 2,658 2,848
Shareholders’ equity 31,023 41,207
Financial liabilities 180,166 127,039
Trade payables and other payables 910 1,361
Deferred tax liabilities 3,214 5,353
Provision for severance indemnity and retirement benefits 11,643 19,387
Provisions for risks and liabilities 3,253 3,869
Non-current liabilities 199,186 157,009
Financial liabilities 135,465 164,673
Trade payables and other payables 190,944 271,797
Current taxes payables 5,384 5,178
Provisions for risks and liabilities 18,022 15,774
Current liabilities 349,815 457,422
Total shareholders’ equity and liabilities 580,024 655,638
Am
ount
s in
Eur
o/0
00
Directors' Report on Operations
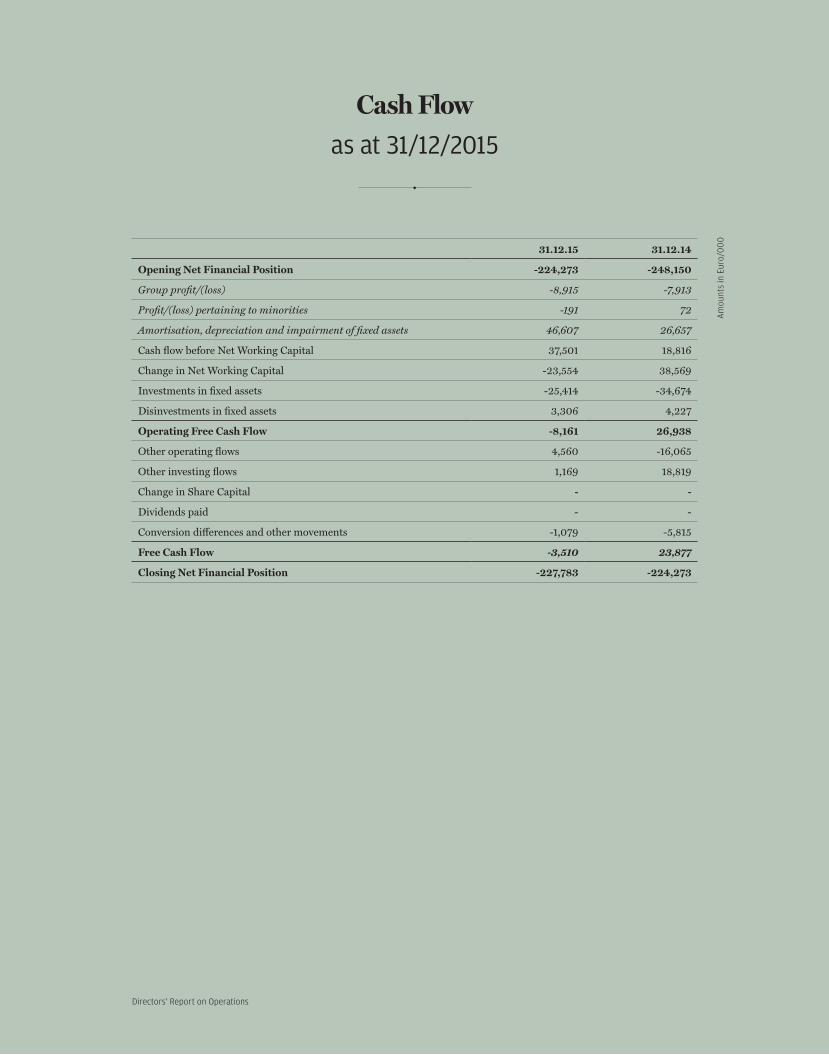
Cash Flowas at 31/12/2015
31.12.15 31.12.14
Opening Net Financial Position -224,273 -248,150
Group profit/(loss) -8,915 -7,913
Profit/(loss) pertaining to minorities -191 72
Amortisation, depreciation and impairment of fixed assets 46,607 26,657
Cash flow before Net Working Capital 37,501 18,816
Change in Net Working Capital -23,554 38,569
Investments in fixed assets -25,414 -34,674
Disinvestments in fixed assets 3,306 4,227
Operating Free Cash Flow -8,161 26,938
Other operating flows 4,560 -16,065
Other investing flows 1,169 18,819
Change in Share Capital - -
Dividends paid - -
Conversion differences and other movements -1,079 -5,815
Free Cash Flow -3,510 23,877
Closing Net Financial Position -227,783 -224,273
Am
ount
s in
Eur
o/0
00

Annual Review 201516 – 17
Analysis of Net Working Capitalas at 31/12/2015
31.12.15 31.12.14
Trade Receivables 61,954 75,244
Inventory 118,086 146,745
Trade Payables -167,283 -232,786
Net Working Capital (NwC) 12,757 -10,797
Am
ount
s in
Eur
o/0
00


Annual Review 201518 – 19
Carraro is an international industrial Group which is world leader in high-efficiency and eco-compatible power transmission systems, with headquarters in Italy, in Campodarsego (Padua).
Today the Group is increasingly focussed on high-technology solutions for off-highway applications in the agriculture and construction fields.
Completing the strategic plan to refocus the Group on its core business, in December 2015 a 55% stake in the German company O&K Antriebstechnik, engaged in the produc-tion of drives, was sold to Bonfiglioli Riduttori Spa.
The Group operates through three Business Areas:› Carraro Drive Tech (Transmission systems and components) Is specialised in the design, manufacture and sale of transmission systems (axles,
transmissions and drives) mainly for agricultural and construction equipment, and also markets a wide range of gears for very diverse sectors, from the automotive in-dustry to material handling, agricultural applications and construction equipment.
› Carraro Divisione Agritalia (Tractors) Designs and manufactures special tractors (for vineyards and orchards from 60 to
100 hp) for third-party brands, namely John Deere, Massey Ferguson and Claas, as well as a specialist own-brand range; Agritalia also provides engineering services for the design of innovative tractor ranges.
› Elettronica Santerno (Power electronics) Designs, develops, manufactures and markets inverters (electronic power convert-
ers) for the photovoltaic industry and industrial automation (HVAC, water treat-ment, lifting systems and large-scale transport).
The CarraroGroup


Key Factors

Annual Review 201522 – 23
Researchand Innovation
The Group’s key success factor
The Group is increasingly committed to developing power transmission systems with a fo-cus on greater efficiency and ecological sustainability - requisites that are fundamental in today’s world for tackling an increasingly demanding market in terms of performance and alignment with emissions legislation. In keeping with previous years, in 2015 the Group incurred R&D costs amounting to about 2% of turnover.
transmission systems and gearboxes
In the agricultural transmissions area, 2015 was a year full of activity, during which form and content was given to the new strategic products, which will represent the technologi-cal direction of Carraro in the near future.
As a result of the investments in innovation in recent years, the Group has been able to extend its range of tractor transmissions from 40hp to 230hp in a wide range of versions (mechanical, power hi-low, power reverser and power shift) from entry level – for emerg-ing markets – to premium versions, designed for more advanced vehicles, with highly competitive price-quality ratios. These skills make Carraro the only player worldwide able to offer such a wide range and lay the foundation for further business developments in the coming years.
The new family of Carraro Twin Shift™ agricultural transmissions based on automo-tive-derived Dual Clutch technology, was successfully presented at the Agritechnica in-ternational trade fair and during the prestigious VDI-Wissenforum technical conference held in Hanover in November, where Carraro’s growth path in recent years, that is gener-ating additional innovation scenarios, was especially appreciated.
Also in transmissions for the construction industry, innovative and important technolo-gies were introduced, such as the new TCH90 transmission for telehandlers and the TLB2 DD backhoe loaders that provides important results in terms of vehicle efficiency.

Key Factors of Success
axle range evolution
In 2015, major emphasis was given to the evolution of the axle range. With a common ap-proach for Agricultural and Construction Equipment, the various product families were integrated, enhancing the most representative performance parameters. Each family was optimised based on a weighted evaluation of the optimal technical solution. This analysis was applied to the different sub-groups/functions and a specific activity for the technical proposal was launched, in line with the most consolidated Carraro process technologies and the most stringent quality controls.
In parallel, the soil compactor axle range was reviewed with the introduction of techni-cal solutions aimed at reducing weight and size.
tractors
In 2015 a technical agreement was reached for the extension of a single powertrain plat-form to all Carraro Agritalia customers and significant development synergy was made possible that will allow the company to meet the challenge of regulatory alignment of four different highly customised customer platforms. Agritalia will thus be able to offer an even wider range of options than in the past, reducing, however, the development and management complexity.
Simultaneously, the foundations were laid for the development of a new tractor model which will for the first time allow entry in the important segment tractors with power between 50 and 70Hp. Also in this case, a number of customers have already clearly ex-pressed their interest to participate in the new platform.
Finally, in 2015 the Carraro Tractors range was expanded with three new specialised tractor models dedicated to canopy vineyards, olive groves and applications in hilly areas particularly in demand in the Mediterranean area. Again for Carraro Tractors, the design of a highly specialised cab tractor with total height of less than 2 metres was started. Three of these models met with the immediate interest of a number of Carraro Agritalia custom-ers who commissioned versions with their own brand.
During the year, a number of important technological partnerships with key suppliers, now close to completion, were initiated in order to achieve substantial benefits in terms of know-how and development lead times for certain fundamental vehicle subsystems.
power electronics
During 2015, research and development activities were mainly focused on products for industrial automation applications (completion of penta inverter offer, release of new interface cards for data communications and software developments on current and fu-ture products), without neglecting however completion of the design of the new family of
Annual Review 201524 – 25
modular utility scale photovoltaic inverters (with a decidedly wide range of application parameters and power sizes), while ensuring the contribution of R&D in the pro-active management of orders in progress regarding the photovoltaic market and in pre-sales and service support for both Santerno business lines.
Finally, 2015 saw the completion of the first phase of the control room project which envisages the implementation of a remote control and monitoring centre for remote-con-trolled Santerno systems, integrating the functions of the Sunway Portal for photovoltaic systems and the HydroFast Portal for lifting and water treatment equipment. The control room offers more value to the existing remote monitoring customers, being able to offer intelligent surveillance also on multiple shifts, predictive maintenance, control of system availability profiles and system productivity.


Highlights

Annual Review 201528 – 29
agriculture
For the whole of 2015, the low level of agricultural commodity prices affected spending ca-pacity and new investments, with negative effects on agricultural equipment sales which fell constantly in the course of the months.
The slowdown in demand in Western Europe increased in the last quarter, marking a setback also compared to the same period of 2014. The segment that was most affected was that of the larger and higher power machines, while medium-low power vehicles, where the Group is most present with its products, suffered a limited decrease in volumes. Special tractors (Vineyard-Orchard), in contrast, recorded a good level of sales. The de-cline in the production of agricultural machinery in Europe was further accentuated by the drastic reduction in demand in export markets such as CIS (embargo in Russia), the Middle East and North Africa. 2015 therefore closed with 10-20% decrease in volumes and the expectations for 2016 are broadly in line with the year just ended.
In Turkey the market trend for agricultural machinery developed in two distinct phas-es: positive and better than expected demand until the summer followed by a sharp de-cline in the second half of the year as a result of new domestic economic dynamics in the country. While the overall result of the year’s sales is not negative, the expectations for 2016 continue to be characterised by uncertainties.
In North America 2015 confirmed the significant decline in demand for larger size ma-chines (tractors and harvesters) which was offset by substantial stability in our target market, i.e that of small-medium power machines. No significant changes in trends are expected for 2016.
In China, thanks to government incentives, the market recorded strong demand for medium-high power tractors, while the slowdown became more pronounced for lower power machines. Also in this case the main market sources expect no reversal of the trend for 2016.
In India the domestic tractor market recorded a sharp decline due to the lower govern-ment subsidies, partially offset by export growth. A reversal of the trend is expected only from the second half of 2016.
ReferenceMarkets
Highlights
In South America the latter part of 2015 saw a further marked decline in the agricultur-al machinery market, considerably down compared to 2014 due to the substantial decline in agricultural commodity prices. The outlook for 2016 still remains uncertain, with poor visibility on a possible change in the current trend. A turnaround could be favoured by the devaluation of the Brazilian currency, with the dual effect of, on the one hand, facilitating raw materials exports and, on the other, stimulating investment capacity in agricultural machinery in the medium term.
construction equipment
2015 consolidated the slowdown in demand for new vehicles, now a constant feature since the end of last year, more pronounced for larger machines and relatively more modest for compact machines. The limited economic growth rates in the second half of the year in all World Regions, together with the growing problems in emerging economies, had the effect of postponing new investments previously announced, resulting in reduced demand for new machinery.
The signs of a slowdown in Europe became increasingly evident and generalised, lead-ing all operators to adopt a more cautious approach, also as regards expectations in the mid-term. The drop in demand recorded in the latter part of 2015 contrasts with the more optimistic outlook for 2016, albeit with continuing concrete concerns about a possible general economic slowdown.
In Turkey the market instability continued to significantly influence the demand for construction machines and this uncertainty also affects the expectations for 2016.
For the whole of 2015 the recovery in the construction industry in North America continued to drive demand for utility machines for rental fleets, despite signs of a slow-down in the latter part of the year. All OEMs adopted careful policies to manage vehi-cle stocks on the distribution network, taking prompt corrective action to keep unsold items at low levels. The trend in demand of medium-sized construction equipment had a fluctuating trend during most of the year, with a sharp decline in the latter months. The outlook for this type of vehicle in 2016 still remain uncertain and with a propensity for further decline.
In China, the downturn on the construction and mining equipment market continued for the entire year. What is considered the “New Normal” sees sales volumes much lower than in the past, more in line with those of a mature economy than a developing country. This slowdown was combined with a considerable decline in investments in construction and mining, excess production compared to actual demand for machines, considerable stocks of unsold vehicles at factories and in the distribution network, and an increase in the availability on the market of used vehicles with a low number of operating hours. In the medium term, the long-term investment plan in infrastructures called “One Belt, One Road” should contribute to relaunching the sector.

Annual Review 201530 – 31
renewable energy
The worldwide photovoltaic market in 2015 confirmed estimates, surpassing 50 GW of new plants. The expectations for 2016 are for more than 60 GW, characterised by great uncertainty. Incentive policies are still the key factors on the few major markets, but low and quickly falling prices are causing difficulties for various component manufacturers and are also leading to grid parity on various markets throughout the world.
China continues to occupy a prominent position, along with the US and Japan, while countries of North Africa and the Middle-East are entering with development programs in the GW order of magnitude.
industrial automation
Industrial automation markets in 2015 were marked by various crises and uncertainties, which were accentuated in the latter part of the year: The Brics slowdown, exchange rate instability, low oil prices and geopolitical crises in the Middle East.


Annual Review 201532 – 33
Summaryof Financial Year 2015
In the first few months of the year, turnover and margins were in line with expectations and the reorganisation of the business model, increasingly focused on the Off Highway segment, continued according to plan.
Starting from May, all target markets showed clear signs of a slowdown with wide-spread significant cuts in orders, both in the short and medium term, necessitating imme-diate revision of the expected volumes and production programmes for the second half of the year and, in view of the increasingly uncertainty, a critical analysis of the plans for the following years and preparation of a New 2016-2019 Plan.
The Group’s reaction was timely and determined, acting immediately on working cap-ital, also thanks to the support of partner suppliers, and therefore putting in place coun-termeasures of an industrial nature, starting with the closure of the Gorizia plant (68 people).
The New 2016-19 Plan, conceived in the light of the changing market scenarios, found the support of the Group’s main lending banks which, as better illustrated in Significant Events 2015, will ensure their backing and support in the development process. In addi-tion to these banks, agreements were signed with international financial institutions in China and Luxembourg.
The sale of assets no longer considered strategic, such as 80% of the industrial area (land and buildings) in Argentina and 55% of the company O&K Antriebstechnik Gmbh, further contributed to strengthening the Group’s balance sheet.
In this context is the renewed commitment of the Finaid controlling shareholder (Car-raro family) for a future capital increase, as more fully described below, in support of the new Plan.
The overall results of 2015, which closed with a loss of 8.915 million Euros, reflect the negative business trend in addition to the negative effects of the restructuring activities and the benefits arising from the aforementioned asset disposals.
The Group closed 2015 with a consolidated turnover of 674.010 million Euros, down 7.4% compared to 727.757 million Euros in 2014. In comparing the data it is necessary to consider that the 2014 turnover included 22 million Euros related to the Mini Gears busi-ness unit, the company disposed of during the month of April 2014. Net of this extraordi-

Highlights
nary item, the decrease in turnover would have amounted to 4.5%, all concentrated in the second half of the year. It is also pointed out that 2015 turnover benefited from a positive exchange rate effect of approximately 23 million Euros.
The business areas operating in the mechanical sector (Carraro Drive Tech and Agrita-lia) generated turnover from third parties with a decrease of 4.6% (net of the sale of the Mini Gears plants). While the Drive Tech Business Area recorded a decrease of 8.5% (with constant perimeter), Agritalia achieved an increase in sales of 17.1%.
The turnover of the Santerno Business Area, amounting to 35.157 million Euros com-pared to 36.633 million Euros in 2014, continues to be negatively affected by the man-agement of projects in the photovoltaic industry in South Africa, significantly behind schedule.
Consolidated margins (Ebitda and Ebit) for the year are affected by opposing non-re-curring items: the impairment of Santerno goodwill, amounting to 16 million Euros, which was necessary in the light of the negative performance of the company together with a review of future plans (more detailed in the following paragraphs), the capital gain from the sale of the property in Argentina amounting to approx. 12 million Euros and the Group’s restructuring costs totalling 9.3 million Euros, relating to the closure of the Gori-zia plant and the downsizing of personnel in Argentina and Italy. Net these effects, normal business operations is in terms of margins are in line with the previous year, a further confirmation of the effectiveness of the rationalisation of production activities, supplier partnerships and of the general cost reduction.
Ebitda as at 31 December 2015 came to 46.938 million Euros (7.0% of turnover), up 21.1% compared to 38.763 million Euros (5.3% of turnover) in 2014. 2015 Ebit amounted to 331 thousand Euros (0.1% of turnover), down 97.3% compared to 12.106 million Eu-ros (1.7% of turnover) in 2014. Net of the non-recurring items mentioned above, Ebitda in 2015 would amount to 42.627 million Euros (6.3% of turnover) compared to 45.418 million Euros (6.2% of turnover) and Ebit to 14.406 million Euros (2.1% of turnover) compared to 18.761 million Euros (2.6% of turnover).
Normalising the results of 2014, excluding the contribution of Mini Gears in the first four months, adjusted Ebitda in 2014 (excluding non-recurring costs) would have amounted to 42.669 million Euros (6.0% of turnover) compared to 17.800 million Euros (2.5% of turnover).
With reference to the BUs in the mechanical engineering segment, aggregated Ebitda amounted to 47.978 million Euros (7.2% of turnover) as at 31 December 2015 compared to 50.281 million Euros (7.0% of turnover) in the previous year. Ebit as at 31 December 2015 was equal to 24.416 million Euros (3.7% of turnover) compared to 28.394 million Euros (4.0% of turnover). Net of the non-recurring costs, aggregate Ebitda in 2015 would amount to 41.674 million Euros (6.3% of turnover) compared to 54.361 million Euros (7.6% of turnover) while Ebit would amount to 18.812 million Euros (2.8% of turnover) compared to 32.474 million Euros (4.6% of turnover).
Excluding Mini Gears, adjusted Ebitda in 2014 (excluding non-recurring costs) would have amounted to 51.612 million Euros (7.5% of turnover) and adjusted Ebit would have amounted to 31.513 million Euros (4.6% of turnover).
The Electronics Business Area (Elettronica Santerno) reported in 2015 a negative Ebit-
Annual Review 201534 – 35
da of 3.964 million Euros (-11.3% of turnover) compared to just as negative a value of 7.005 million Euros (-19.1% of turnover) as at 31 December 2014. Ebit was a negative 23.682 million Euros (-67.4% of turnover), against a negative figure of 9.897 million Euros (-27.0% of turnover) in 2014. Net of non-recurring costs, Ebitda was negative at 2.683 million Euros (-7.6% of turnover) compared to the negative value of 4.630 mil-lion Euros (-12.6% of turnover) in 2014, while Ebit was negative at 5.515 million Euros (-15.7% of turnover) compared to the negative value of 7.522 million Euros (-20.5% of turnover) in 2014.
Consolidated earnings before tax for the year, positive at 2.267 million Euros (0.3% of turnover) compared to the negative value of 4.970 million Euros (-0.7% of turnover) in 2014, are also affected by the positive effects of the capital gain on the sale of the stake in the company O&K amounting to approx. 23 million Euros and on the sale of the property in Argentina to approx. 12 million Euros, the financial charges related to renegotiation of the Banks Agreement, for the part relating to the confirmation of short-term credit lines, amounting to approx. 2.5 million Euros and the negative exchange rate effect, mainly resulting from the devaluation of the Argentine Peso which took place in December for a total of 2.7 million Euros.
Taxes for the period, amounting to a total of 11.373 million Euros (1.7% of turnover) compared to 2.871 million Euros (0.4% of turnover) of the previous year, include extraor-dinary items amounting to approx. 9.6 million Euros, better detailed in the following par-agraphs.
The Group closed with a loss of 8.915 million Euros (-1.3% of turnover) compared to a loss of 7.913 million Euros (-1.1% of turnover) in 2014. Net of non-recurring items, the loss would have amounted to 11.332 million Euros (-1.7% of turnover), of which 8.872 million Euros relating to the Santerno Business Area.
The net consolidated financial position as at 31 December 2015 is negative at 227.783 million Euros, an improvement compared to 30 June 2015, negative at 247.034 million Euros, in line with the 224.273 million Euros as at 31 December 2014, thanks to the new-found equilibrium of net working capital and the positive cash flows from disposals.The Group shareholders’ equity as at 31 December 2015 was equal to 31.023 million Euros compared to 41.207 million Euros as at 31 December 2014.

Highlights
Net Revenues
674,010f 727,757
Operating Income
331f 12,106
Net Income
–8,915f –7,913
Euro/000
2015f 2014
Shareholders’ Equity
31,023f 41,207
ROI
0.06 %f 1.85%
ROE
–31.43 %f –20.63%
Annual Review 201536 – 37
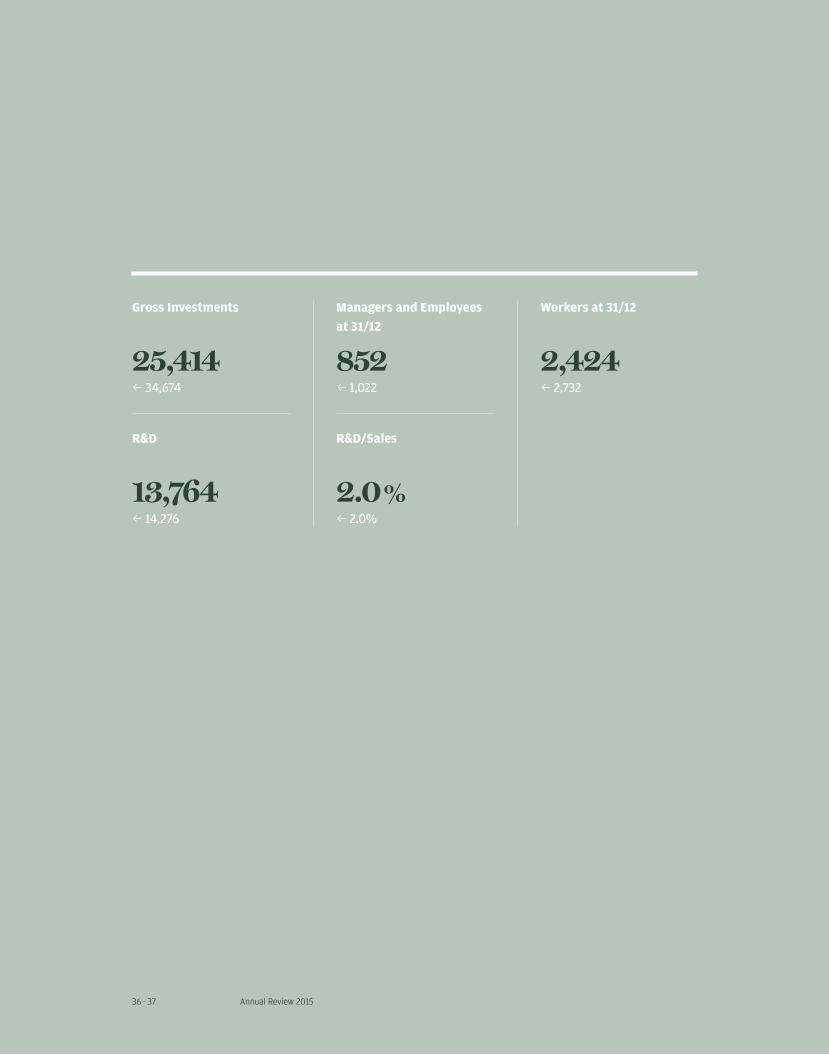
Gross Investments
25,414f 34,674
Managers and Employees
at 31/12
852f 1,022
R&D/Sales
2.0 %f 2.0%
R&D
13,764f 14,276
Workers at 31/12
2,424f 2,732
Highlights
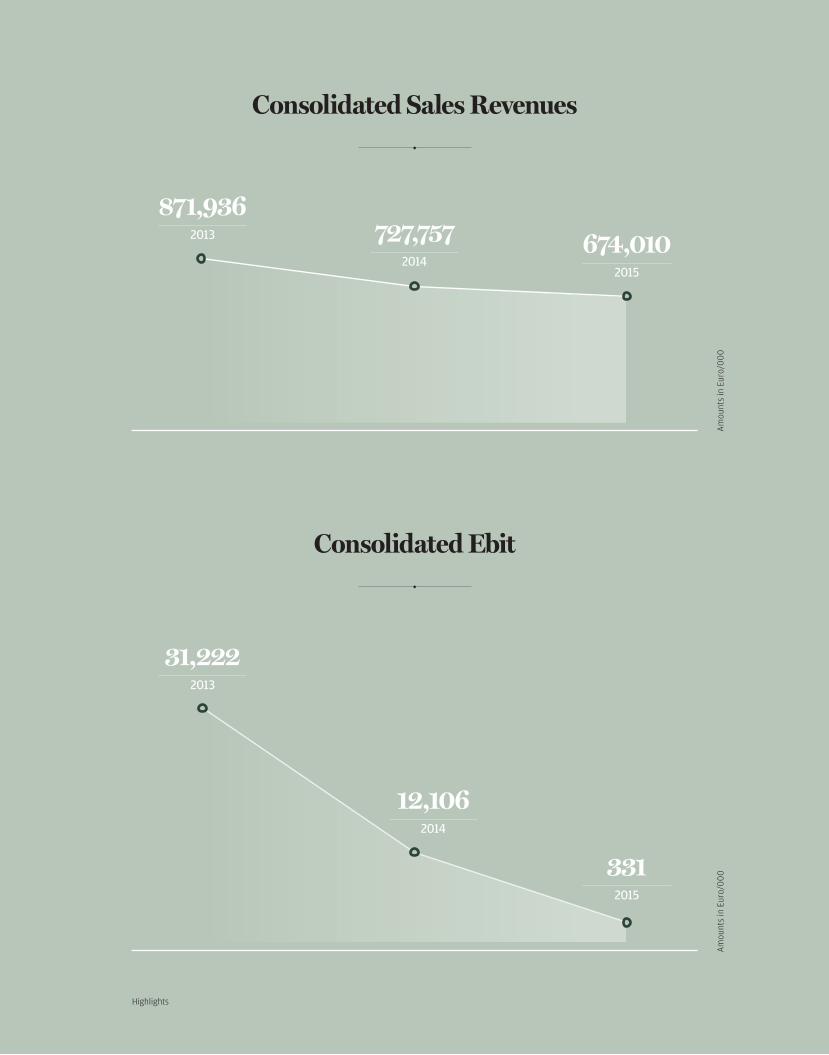
Consolidated Ebit
Consolidated Sales Revenues
Am
ount
s in
Eur
o/0
00
Am
ount
s in
Eur
o/0
00
871,9362013 727,757
2014674,010
2015
31,2222013
12,1062014
3312015

Annual Review 201538 – 39
Consolidated Net Income
Consolidated Net Financial Positiondebt balance
Am
ount
s in
Eur
o/0
00
Am
ount
s in
Eur
o/0
00
248,1502013 224,273
2014
227,7832015
1,2902013
– 7,9132014
– 8,9152015

Highlights
Am
ount
s in
Eur
o/0
00
Am
ount
s in
Eur
o/0
00
Carraro Group Investmentsgross of revenues from disposals
Carraro Group Researchand Innovation Expenditure
18,6712013 14,276
2014
13,7642015
37,5392013
34,6742014 25,414
2015

A
D FE G
B C
A
D
B C
GFE
A
D
B C
GFE
Annual Review 201540 – 41
Consolidated Equity Structure20
13 Sour
ces
Use
s
416,598190,080
19,349
54,863
2014 So
urce
sU
ses
327,154
41,207
2015 So
urce
sU
ses
293,525
31,023
A — Fixed assetsB — Working capitalC — Liquidity
D — Shareholders’ equityE — Sever, IndemF — M/L terms payablesG — Short-term payables
325,298 282,880 72,812
265,662 62,822
457,220137,824
19,387
215,741 70,758
349,793187,565
11,643
50+50+Y 36+64+Y
8+92+YHighlights
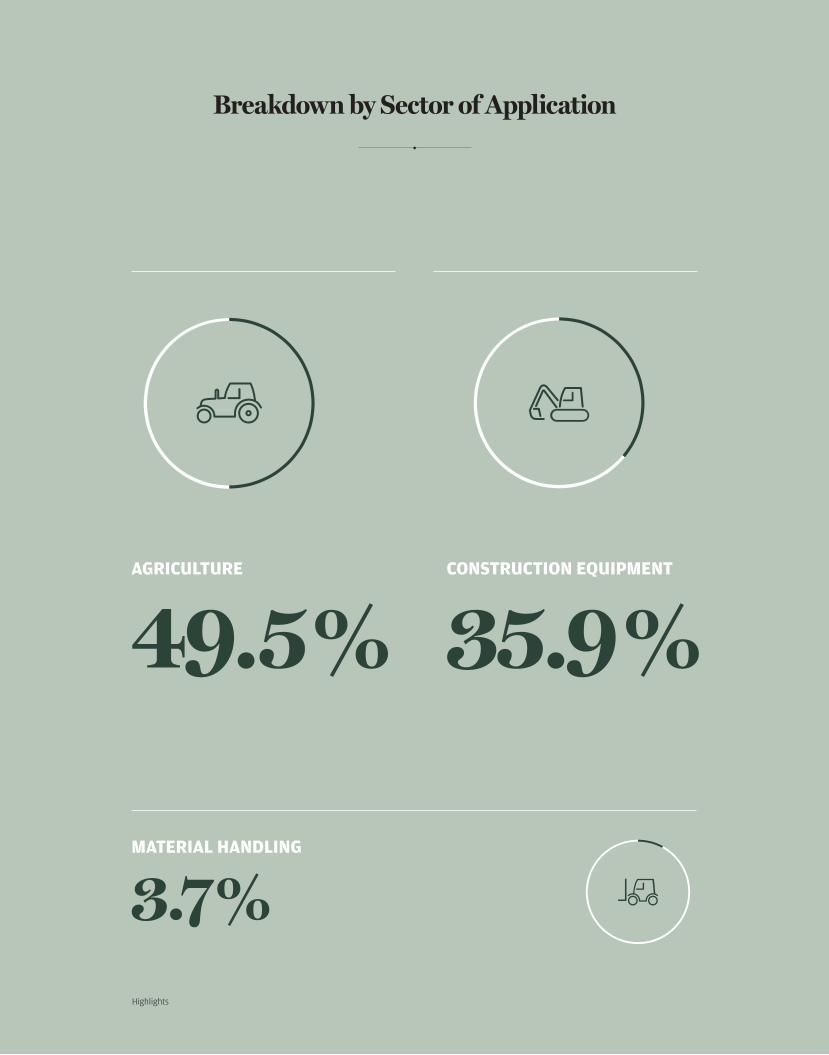
AGRICULTURE
49.5 %CONSTRUCTION EQUIPMENT
35.9 %
MATERIAL HANDLING
3.7 %
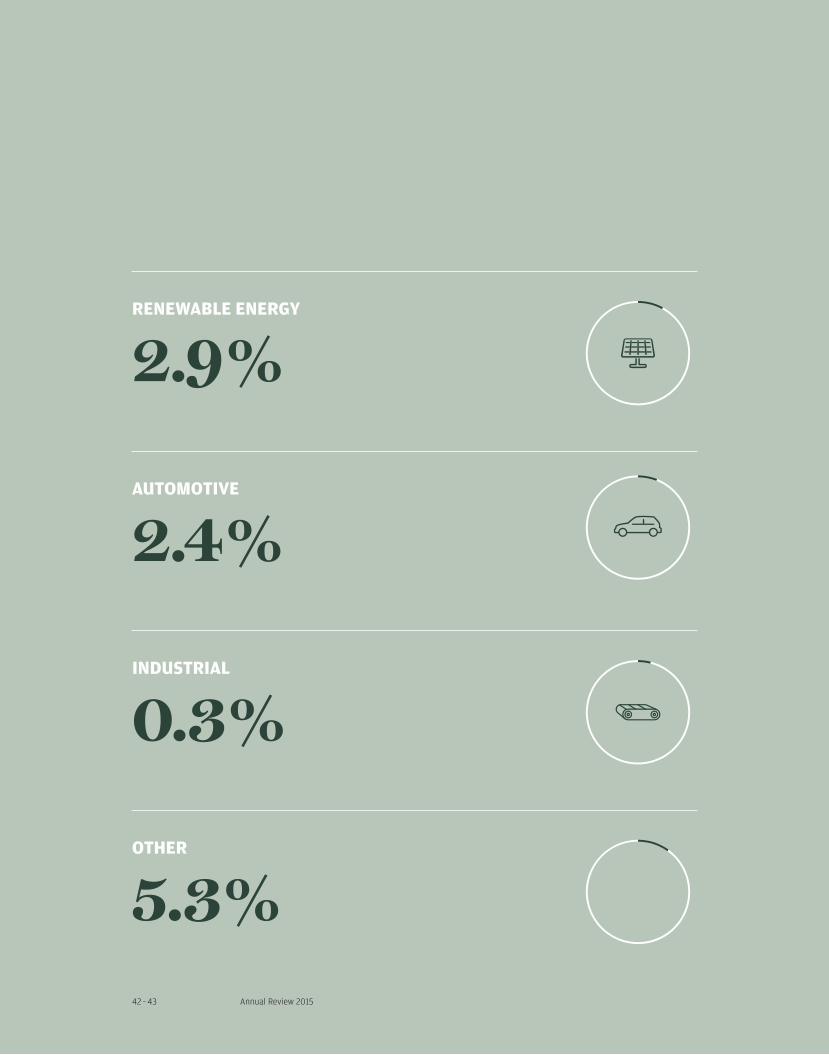
Breakdown by Sector of Application
8+92+Y
10+90+Y4+96+Y6+94+Y
Annual Review 201542 – 43
RENEWABLE ENERGY
2.9 %
OTHER
5.3 %
INDUSTRIAL
0.3 %
AUTOMOTIVE
2.4 %
0+0+0+0+0+0+0+0+100+1000+0+0+0+0+0+0+0+88+85
0+0+0+0+0+0+0+0+100+1000+0+0+0+0+0+0+0+9+120+0+0+0+0+0+0+0+100+1000+0+0+0+0+0+0+0+8+7
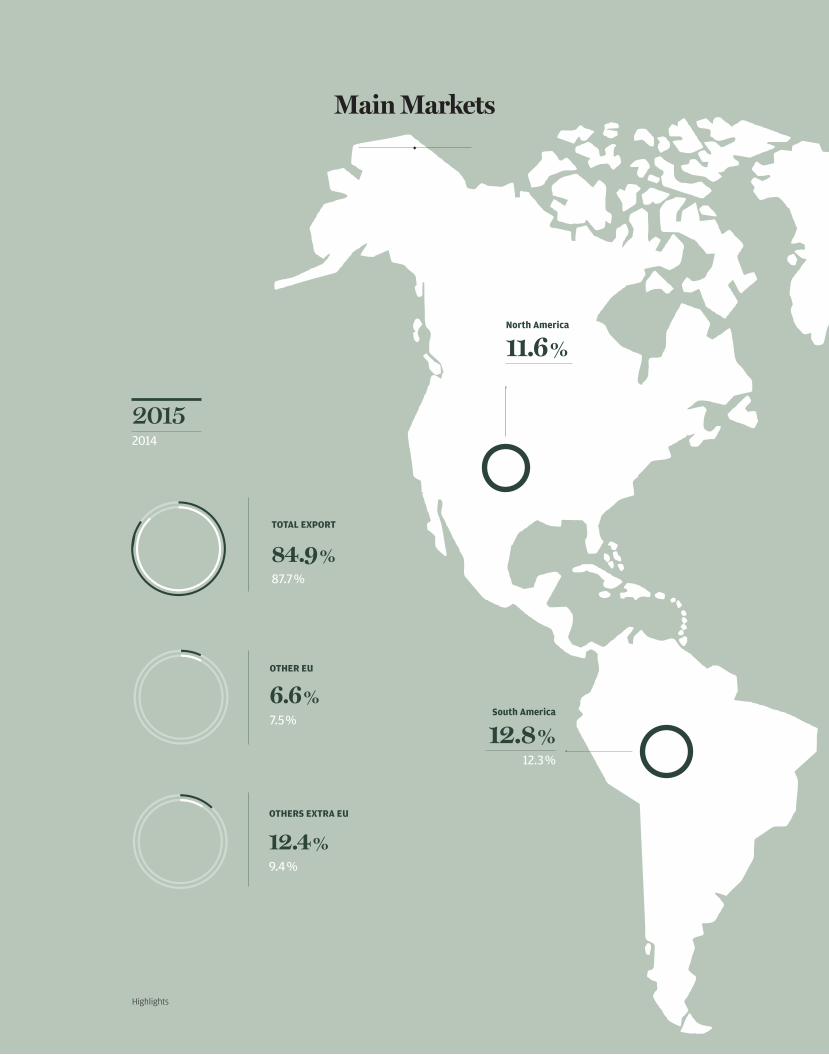
20152014
Highlights
6.6 %7.5 %
84.9 %87.7 %
12.4 %9.4 %
TOTAL EXPORT
OTHER EU
OTHERS EXTRA EU
South America
12.8 %12.3 %
North America
11.6 %f 13.3 %
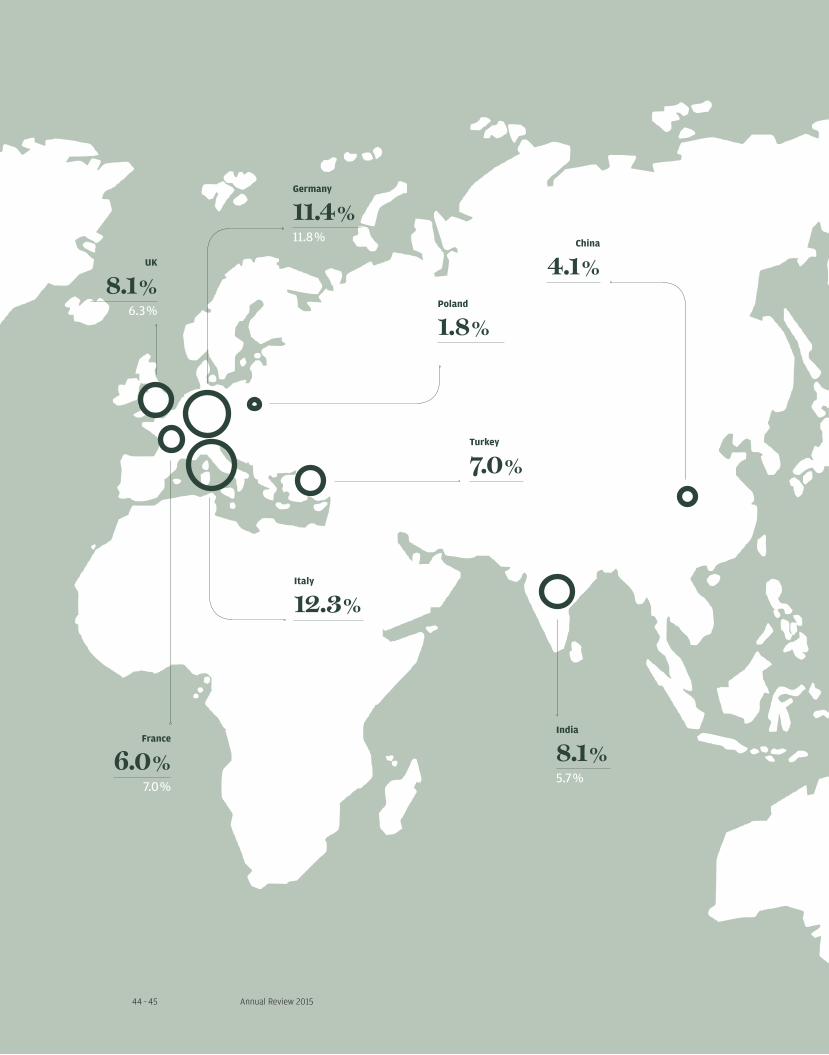
Main Markets
Annual Review 201544 – 45
France
6.0 %7.0 %
UK
8.1 %6.3 %
China
4.1 %5.9 %
Germany
11.4 %11.8 %
Italy
12.3 %11.4 %
India
8.1 %5.7 %
Turkey
7.0 %7.9 %
Poland
1.8 %2.2 %

Highlights
Am
ount
s in
Eur
o/0
00
In order to perform an analysis that is equal in termsof perimeter, the data should be considered net of those pertaining to MG Mini Gears Spa, which ceased producing and trading in April 2014.
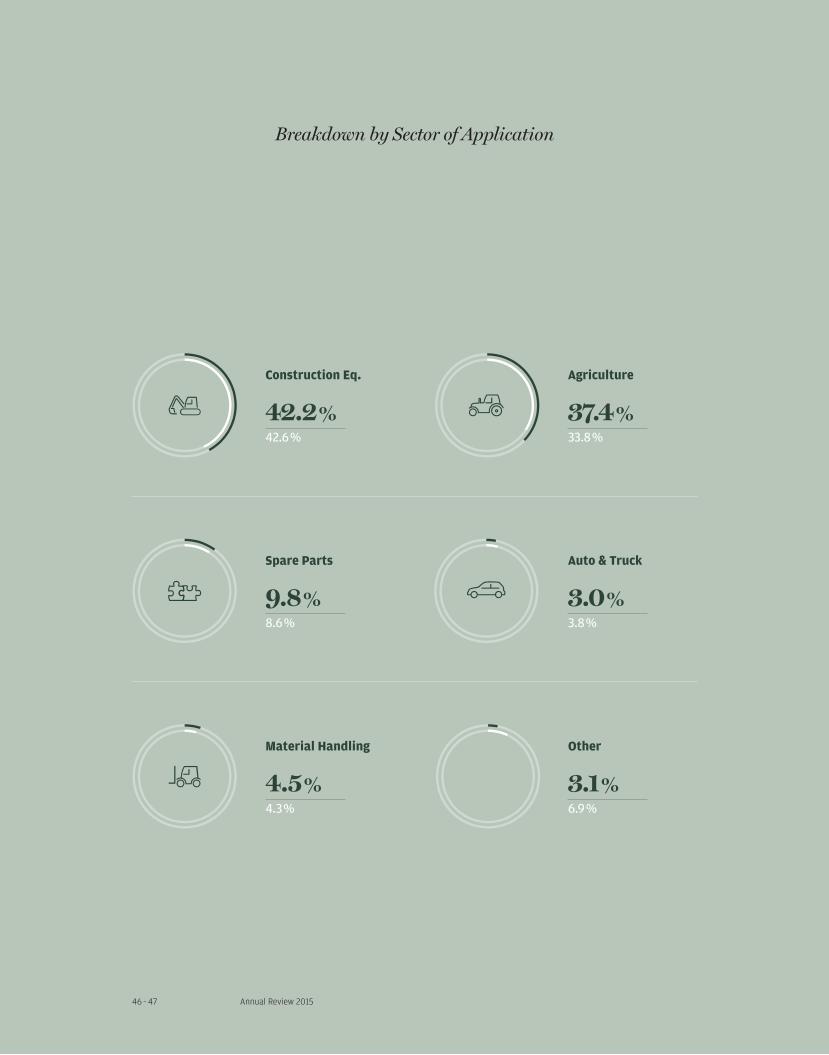
DrivetechSummary Data and Graphs
Shareholders’ equity
130,799f 107,965Net of minority interests 3 105,117
Gross investments
16,892f 34,293
Net income
26,182f 6,599Net of minority interests
Net revenues
543,676f 610,453
Euro/000
2015f 2014
Operating income
18,134f 28,766Adjusted for the effect of exchange differences
Workforce at 31/12
2,739f 3,253
Total Foreign Countries
89.4 %f 88.5%Turnover by Geographical Area
R&D
3,755f 9,673
Managers/Employees
506f 711Workforce Breakdown
Workers
2,233f 2,542Workforce Breakdown
Total Italy
10.6 %f 11.5%Turnover by Geographical Area
0+0+0+0+0+0+0+0+100+100 0+0+0+0+0+0+0+0+100+1000+0+0+0+0+0+0+0+9+10 0+0+0+0+0+0+0+0+4+30+0+0+0+0+0+0+0+100+1000+0+0+0+0+0+0+0+43+42 0+0+0+0+0+0+0+0+100+1000+0+0+0+0+0+0+0+34+37
0+0+0+0+0+0+0+0+100+100 0+0+0+0+0+0+0+0+100+1000+0+0+0+0+0+0+0+4+5 0+0+0+0+0+0+0+0+7+3Annual Review 201546 – 47
Breakdown by Sector of Application
9.8 %8.6 %
Spare Parts
3.0 %3.8 %
Auto & Truck
42.2 %42.6 %
Construction Eq.
37.4 %33.8 %
Agriculture
4.5 %4.3 %
Material Handling
3.1 %6.9 %
Other

Highlights
Am
ount
s in
Eur
o/0
00
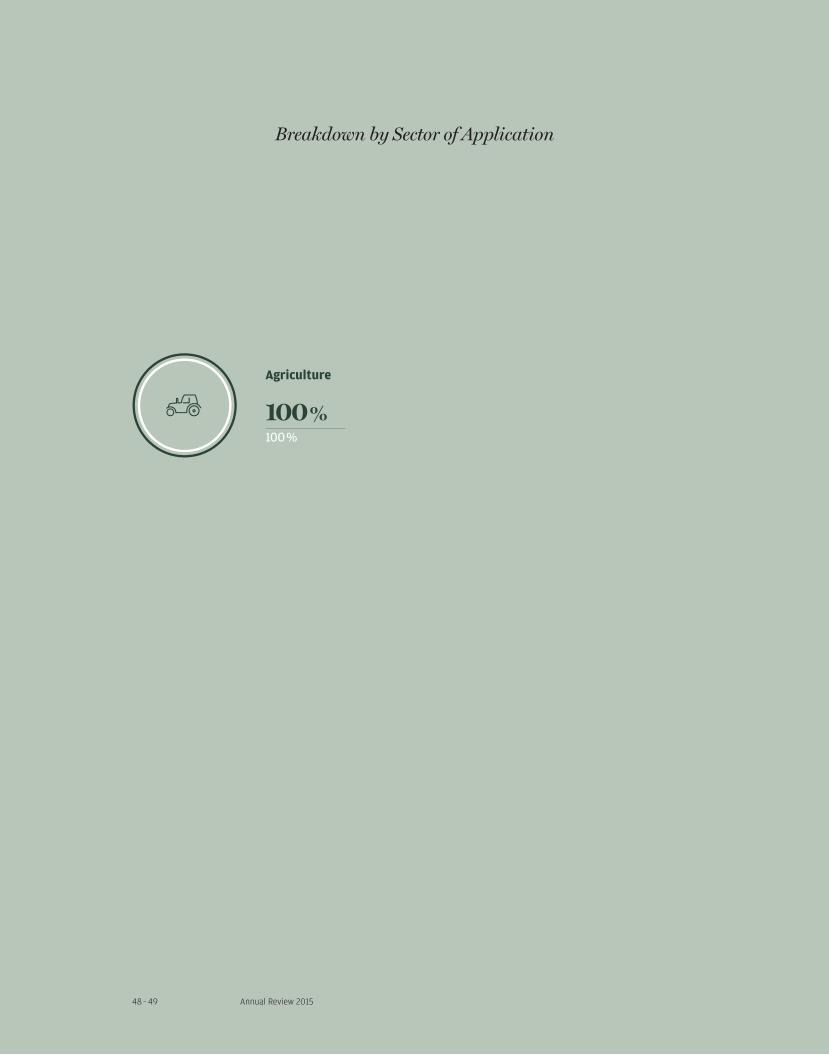
AgritaliaSummary Data and Graphs
Shareholders’ equity
8,408f 11,238
Gross investments
1,278f 3,733
Net income
5,902f –705Net of minority interests
Net revenues
120,429f 102,837
Euro/000
2015f 2014
Operating income
6,282f –372Adjusted for the effect of exchange differences
Workforce at 31/12
227f 275
Total Foreign Countries
66.2 %f 87.1%Turnover by Geographical Area
R&D
1,047f 3,733
Managers/Employees
77f 88Workforce Breakdown
Workers
150f 187Workforce Breakdown
Total Italy
33.8 %f 12.9%Turnover by Geographical Area
0+0+0+0+0+0+0+0+100+1000+0+0+0+0+0+0+0+100+100
Annual Review 201548 – 49
Breakdown by Sector of Application
100 %100 %
Agriculture
Highlights
Am
ount
s in
Eur
o/0
00
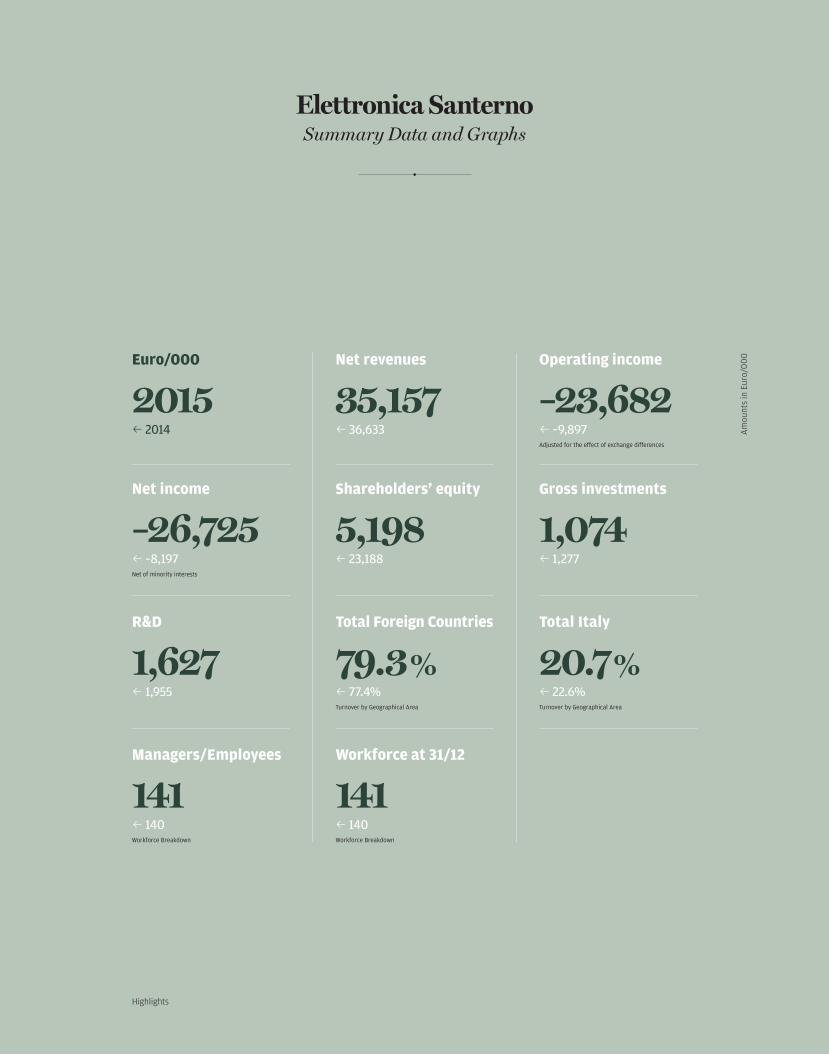
Elettronica SanternoSummary Data and Graphs
Shareholders’ equity
5,198f 23,188
Gross investments
1,074f 1,277
Net income
–26,725f –8,197Net of minority interests
Net revenues
35,157f 36,633
Euro/000
2015f 2014
Operating income
–23,682f –9,897Adjusted for the effect of exchange differences
Total Foreign Countries
79.3 %f 77.4%Turnover by Geographical Area
R&D
1,627f 1,955
Managers/Employees
141f 140Workforce Breakdown
Workforce at 31/12
141f 140Workforce Breakdown
Total Italy
20.7 %f 22.6%Turnover by Geographical Area
0+0+0+0+0+0+0+0+100+1000+0+0+0+0+0+0+0+18+190+0+0+0+0+0+0+0+100+1000+0+0+0+0+0+0+0+53+54 0+0+0+0+0+0+0+0+100+1000+0+0+0+0+0+0+0+30+27
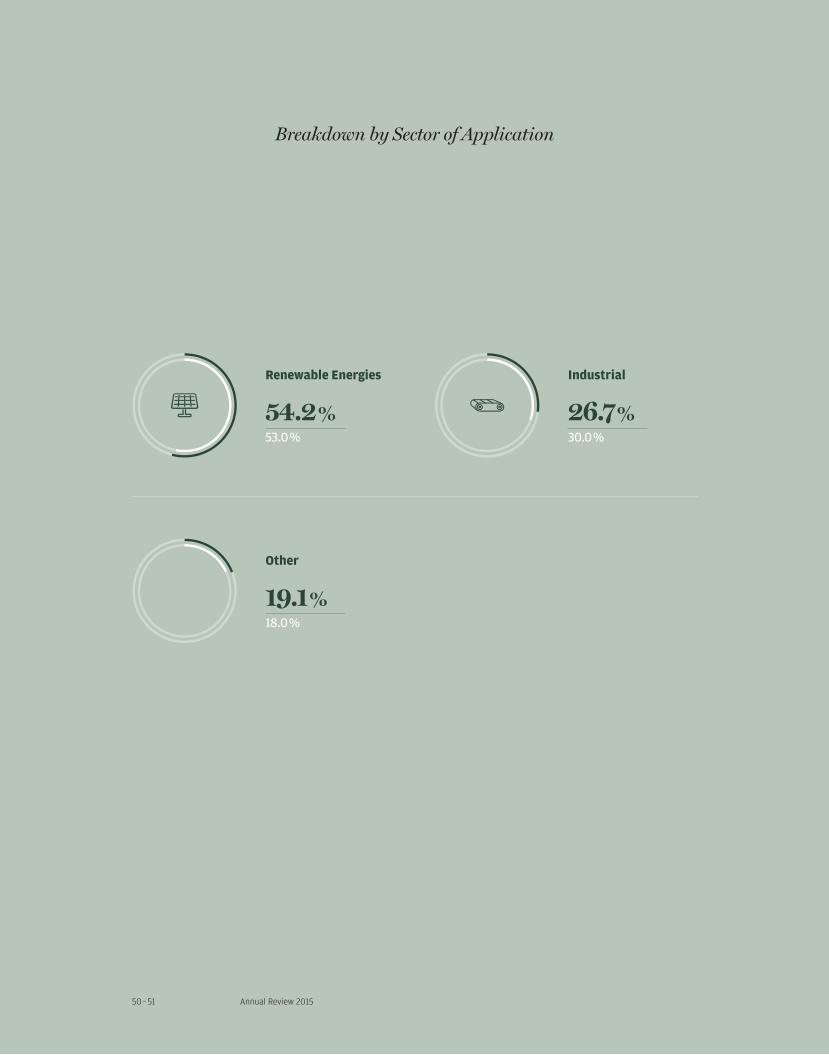
Annual Review 201550 – 51
19.1 %18.0 %
Other
54.2 %53.0 %
Renewable Energies
26.7 %30.0 %
Industrial
Breakdown by Sector of Application


Annual Review 201552 – 53
Significant Eventsin Financial Year
2015
As part of the company simplification process, on 15 January 2015, Carraro Drive Tech Poggiofiorito Spa was merged into Carraro Drive Tech Spa, with accounting and tax effect from 1 January 2015.
In May 2015, the union agreement was reached for closure of the Gorizia plant with 68 employees, who were given the option of relocating to the Campodarsego or Maniago plants or, alternatively, an incentive plan, as detailed below.
On 26 October 2015, an agreement was signed between Finaid Spa (Carraro Spa parent company) and the Arduini family through which the two shareholders may guarantee a capital increase in Carraro Spa for a minimum guaranteed amount of 34 million Euros.
In December, a portion (approximately 80%) of the land and buildings of the Carraro production plant in Argentina was sold to an Argentine real estate company. The company retains ownership of the remaining portion necessary continue its production activities.
On 18 December 2015, the Carraro Spa Board of Directors approved the New Business Plan 2016-19.
On 24 December 2015, a new agreement with the main lending banks of the Group was signed, which provides for the rescheduling of medium and long-term financial debts, with a suspension of principal repayments until 2017, confirmation of short-term credit lines to support the current operations of the Group and redefinition of the covenants based on the operating results envisaged by the Group’s New Business Plan 2016-19.
On 30 December 2015, the agreement for the sale of a shareholding of 55% in the Ger-man company O&K Antriebstechnik Gmbh to Bonfiglioli Riduttori Spa was finalized for the amount of 25.007 million Euros. The Carraro Group maintains a stake of 45% of the share capital in the company.
Subsequent eventsNothing to report.


+20 %
+10 %
–10 %
–20 %
–30 %
–40 %
0 %
04/
15
02/1
5
06/
15
08/
15
10/1
5
12/1
5
02/1
6
CARRARO
FTSE MIB
Annual Review 201554 – 55
In the course of 2015, the Carraro stock price was affected by the Group’s negative eco-nomic results and consequently recorded a downward trend, underperforming market indices (Ftse Mib).
The official average price of 2015 was 1.97 Euros, with a maximum listing at 2.4 Euros on 16 March and a minimum listing at 1.6 Euros on 2 October.
SharePerformance


Annual Review 201556 – 57
Business Outlookand Projections
for 2016
In line with the New 2016-2019 Plan, for 2016, a decrease in volumes compared to 2015 and slightly improved margins, net of extraordinary items related to certain further re-structuring activities, are expected.


Directors’ Report on Operations
Annual Report 201560 – 61
DIRECTORS’ REPORT ON OPERATIONSas at 31 December 2015
—
Balance Sheet and Financial Data
Report
Directors’ Report on Operations
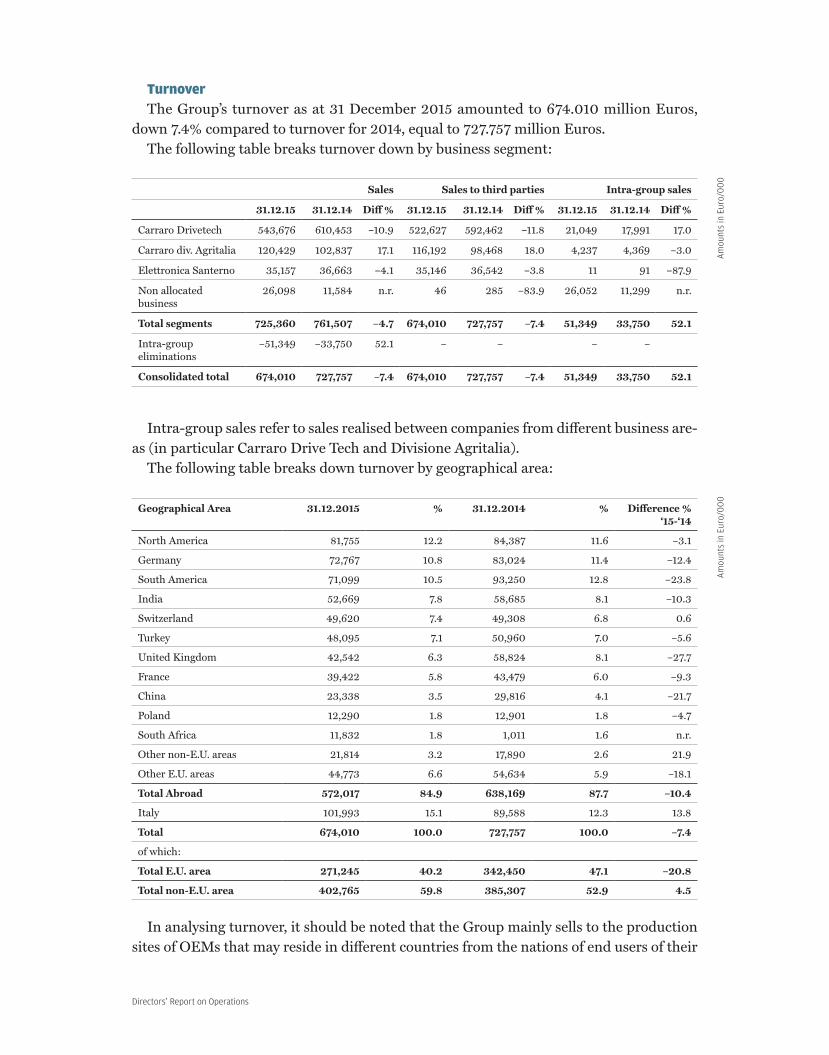
TurnoverThe Group’s turnover as at 31 December 2015 amounted to 674.010 million Euros,
down 7.4% compared to turnover for 2014, equal to 727.757 million Euros. The following table breaks turnover down by business segment:
Sales Sales to third parties Intra-group sales
31.12.15 31.12.14 Diff % 31.12.15 31.12.14 Diff % 31.12.15 31.12.14 Diff %
Carraro Drivetech 543,676 610,453 –10.9 522,627 592,462 –11.8 21,049 17,991 17.0
Carraro div. Agritalia 120,429 102,837 17.1 116,192 98,468 18.0 4,237 4,369 –3.0
Elettronica Santerno 35,157 36,663 –4.1 35,146 36,542 –3.8 11 91 –87.9
Non allocated business
26,098 11,584 n.r. 46 285 –83.9 26,052 11,299 n.r.
Total segments 725,360 761,507 –4.7 674,010 727,757 –7.4 51,349 33,750 52.1
Intra-groupeliminations
–51,349 –33,750 52.1 – – – –
Consolidated total 674,010 727,757 –7.4 674,010 727,757 –7.4 51,349 33,750 52.1
Intra-group sales refer to sales realised between companies from different business are-as (in particular Carraro Drive Tech and Divisione Agritalia).
The following table breaks down turnover by geographical area:
Geographical Area 31.12.2015 % 31.12.2014 % Difference % ‘15-‘14
North America 81,755 12.2 84,387 11.6 –3.1
Germany 72,767 10.8 83,024 11.4 –12.4
South America 71,099 10.5 93,250 12.8 –23.8
India 52,669 7.8 58,685 8.1 –10.3
Switzerland 49,620 7.4 49,308 6.8 0.6
Turkey 48,095 7.1 50,960 7.0 –5.6
United Kingdom 42,542 6.3 58,824 8.1 –27.7
France 39,422 5.8 43,479 6.0 –9.3
China 23,338 3.5 29,816 4.1 –21.7
Poland 12,290 1.8 12,901 1.8 –4.7
South Africa 11,832 1.8 1,011 1.6 n.r.
Other non-E.U. areas 21,814 3.2 17,890 2.6 21.9
Other E.U. areas 44,773 6.6 54,634 5.9 –18.1
Total Abroad 572,017 84.9 638,169 87.7 –10.4
Italy 101,993 15.1 89,588 12.3 13.8
Total 674,010 100.0 727,757 100.0 –7.4
of which:
Total E.U. area 271,245 40.2 342,450 47.1 –20.8
Total non-E.U. area 402,765 59.8 385,307 52.9 4.5
In analysing turnover, it should be noted that the Group mainly sells to the production sites of OEMs that may reside in different countries from the nations of end users of their
Am
ount
s in
Eur
o/0
00
Am
ount
s in
Eur
o/0
00

Annual Report 201562 – 63
products. The decrease in turnover is evident in all geographic areas, although some such as North America (-3.1%), Turkey (-5.6%) and Switzerland (0.6%) experienced less of a slowdown or were even in line with the previous year. In terms of positioning, this year North America is in first place, exchanging positions with South America, now in third place, while Germany gains a position, moving into second place, compared to the pre-vious year.
Worthy of mention is the turnover in South Africa in the photovoltaic segment achieved by Elettronica Santerno, amounting to 11.8 million Euros.
EbitdaeEbitFigures as at 31.12.2015
31.12.15 % of turnover 31.12.14 % of turnover Diff. %
Ebitda a 46,938 7.0 38,763 5.3 21.1
Non-recurrent costs/(income) –4,311 6,655
of which:
Capital gain on the sale of real estate in Argentina
–12,159
Costs for the closure of the Gorizia plant
2,659
Restructuring costs in Argentina 2,102
Other restructuring costs 3,087
Adjusted Ebitda 42,627 6.3 45,418 6.2 –6.1
Ebit b 331 0.0 12,106 1.7 –97.3
Non-recurrent costs/(income) 14,075 6,655
of which:
Capital gain on the sale of real estate in Argentina
–12,159
Costs for the closure of the Gorizia plant
2,659
Intang. assets impairment (16 mln Euros Santerno goodwill)
18,386
Restructuring costs in Argentina 2,102
Other restructuring costs 3,087
Adjusted Ebit 14,406 2.1 18,761 2.6 –23.2
a Understood as the sum of operating profit/(loss), amortisation, depreciation and impairment of fixed assetsb Understood as operating profit/(loss) in the income statement
Ebitda as at 31 December 2015 came to 46.938 million Euros (7.0% of turnover), up 21.1% compared to 38.763 million Euros (5.3% of turnover) in 2014. 2015 Ebit amounted to 331 thousand Euros (0.05% of turnover), down 97.3% compared to 12.106 million Eu-ros (1.7% of turnover) in 2014. Net of the non-recurring items mentioned above, Ebitda in 2015 would amount to 42.627 million Euros (6.3% of turnover) compared to 45.418 million Euros (6.2% of turnover) and Ebit to 14.406 million Euros (2.1% of turnover) compared to 18.761 million Euros (2.6% of turnover).
Am
ount
s in
Eur
o/0
00
Directors’ Report on Operations
It is pointed out that, in addition to the non-recurring costs mentioned above, also the consultancy costs linked to extraordinary operations and the costs for the transfer of the company O&K Antriebstechnik to the new premises, which took place prior to the sale of the same, impacted the profitability of the year.
Normalising the results of 2014, excluding the contribution of Mini Gears in the first four months, adjusted Ebitda in 2014 (excluding non-recurring costs) would have amounted to 42.669 million Euros (6.0% of turnover) compared to 17.800 million Euros (2.5% of turnover).
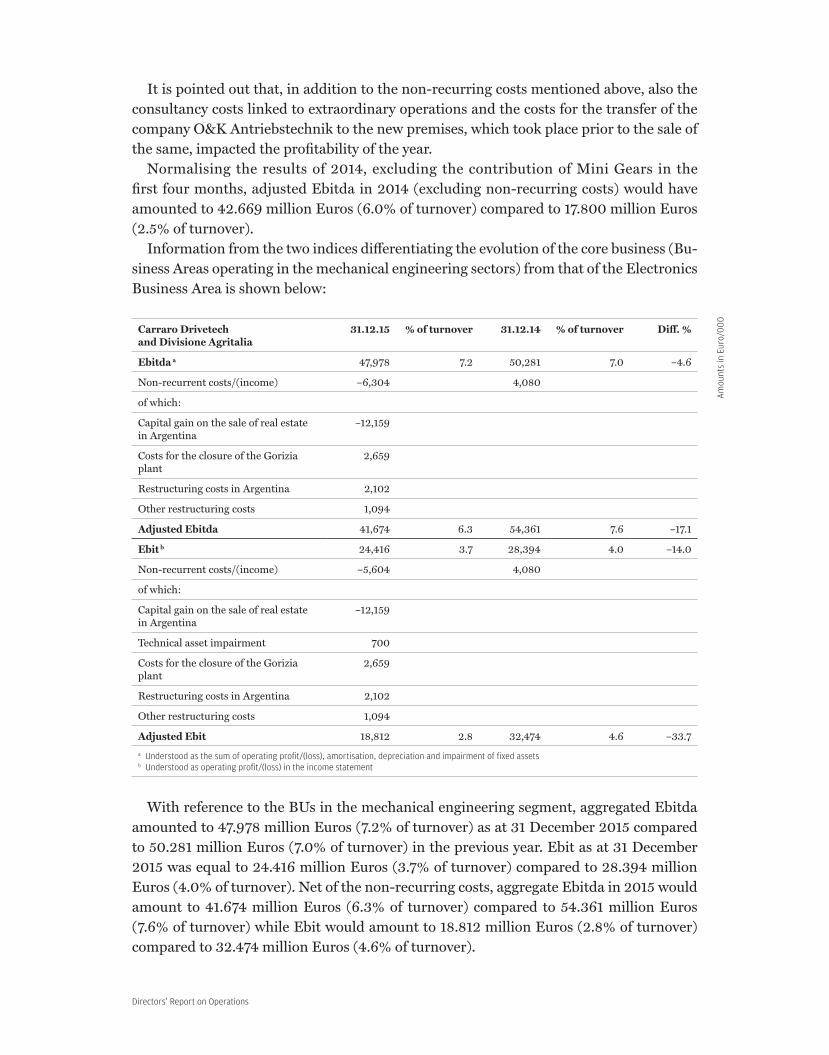
Information from the two indices differentiating the evolution of the core business (Bu-siness Areas operating in the mechanical engineering sectors) from that of the Electronics Business Area is shown below:
Carraro Drivetech and Divisione Agritalia
31.12.15 % of turnover 31.12.14 % of turnover Diff. %
Ebitda a 47,978 7.2 50,281 7.0 –4.6
Non-recurrent costs/(income) –6,304 4,080
of which:
Capital gain on the sale of real estate in Argentina
–12,159
Costs for the closure of the Gorizia plant
2,659
Restructuring costs in Argentina 2,102
Other restructuring costs 1,094
Adjusted Ebitda 41,674 6.3 54,361 7.6 –17.1
Ebit b 24,416 3.7 28,394 4.0 –14.0
Non-recurrent costs/(income) –5,604 4,080
of which:
Capital gain on the sale of real estate in Argentina
–12,159
Technical asset impairment 700
Costs for the closure of the Gorizia plant
2,659
Restructuring costs in Argentina 2,102
Other restructuring costs 1,094
Adjusted Ebit 18,812 2.8 32,474 4.6 –33.7
a Understood as the sum of operating profit/(loss), amortisation, depreciation and impairment of fixed assetsb Understood as operating profit/(loss) in the income statement
With reference to the BUs in the mechanical engineering segment, aggregated Ebitda amounted to 47.978 million Euros (7.2% of turnover) as at 31 December 2015 compared to 50.281 million Euros (7.0% of turnover) in the previous year. Ebit as at 31 December 2015 was equal to 24.416 million Euros (3.7% of turnover) compared to 28.394 million Euros (4.0% of turnover). Net of the non-recurring costs, aggregate Ebitda in 2015 would amount to 41.674 million Euros (6.3% of turnover) compared to 54.361 million Euros (7.6% of turnover) while Ebit would amount to 18.812 million Euros (2.8% of turnover) compared to 32.474 million Euros (4.6% of turnover).
Am
ount
s in
Eur
o/0
00

Annual Report 201564 – 65
Excluding Mini Gears, adjusted Ebitda in 2014 (excluding non-recurring costs) would have amounted to 51.612 million Euros (7.5% of turnover) and adjusted Ebit would have amounted to 31.513 million Euros (4.6% of turnover).
Electronics Business Area 31.12.15 % of turnover 31.12.14 % of turnover Diff. %
Ebitda (a) –3,964 –11.3 –7,005 –19.1 –43.4
Non-recurrent costs 1,281 2,375
Adjusted Ebitda –2,683 –7.6 –4,630 –12.6 –42.1
Ebit (b) –23,682 –67.4 –9,897 –27.0 n.r.
Non-recurrent costs 18,167 2,375
of which:
Restructuring costs 1,281
Intang. asset impairment 16,886
Adjusted Ebit –5,515 –15.7 –7,522 –20.5 –26.7
The profitability of the Business Area, in addition to the negative performance of the photovoltaic business, is also affected by restructuring costs amounting to 1.281 million Euros and impairment of intangible assets (mainly goodwill) amounting to 16.886 million Euros.
NetfinancialexpensesFigures as at 31.12.2015
31.12.15 % of turnover 31.12.14 % of turnover Diff. %
Net financial expenses –16,418 –2.4 –14,645 –2.0 12.1
The increase in net financial expenses, which rose from 14.645 million Euros in the previous year to 16.418 million Euros in 2015, is mainly attributable to expenses resulting from the signing of the new banks agreement for the part concerning the renewal of short-term credit lines, approx. 2.5 million Euros. The portion of fees related to the medium-long term loans is absorbed in the amortization plan of the same as provided for by the amortised cost.
IncomefromequityinvestmentsFigures as at 31.12.2015
31.12.15 % of turnover 31.12.14 % of turnover Diff. %
Income from equity investments 22,825 3.39 475 0.1 n.r.
These items mainly include the net capital gain on the sale of a stake of 55% in the Ger-man company O&K Antriebstechnik, sale formalised on 30 December 2015.
Am
ount
s in
Eur
o/0
00
Am
ount
s in
Eur
o/0
00
Am
ount
s in
Eur
o/0
00
Directors’ Report on Operations
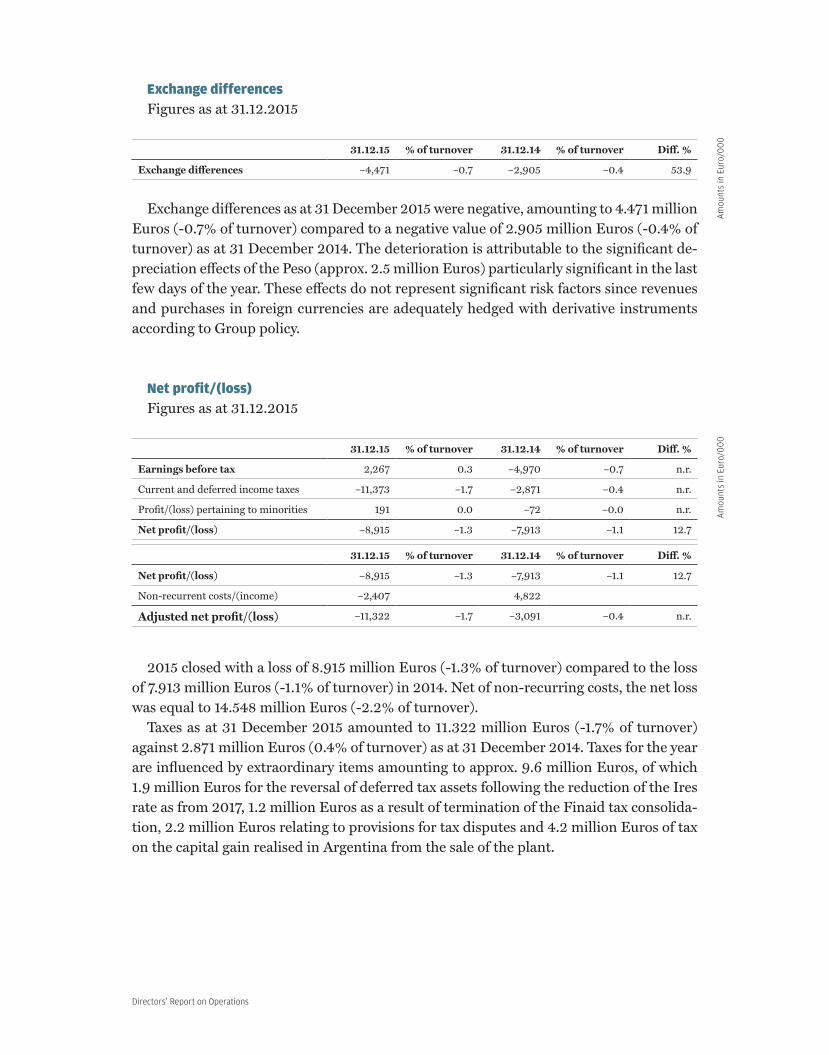
ExchangedifferencesFigures as at 31.12.2015
31.12.15 % of turnover 31.12.14 % of turnover Diff. %
Exchange differences –4,471 –0.7 –2,905 –0.4 53.9
Exchange differences as at 31 December 2015 were negative, amounting to 4.471 million Euros (-0.7% of turnover) compared to a negative value of 2.905 million Euros (-0.4% of turnover) as at 31 December 2014. The deterioration is attributable to the significant de-preciation effects of the Peso (approx. 2.5 million Euros) particularly significant in the last few days of the year. These effects do not represent significant risk factors since revenues and purchases in foreign currencies are adequately hedged with derivative instruments according to Group policy.
Netprofit/(loss)Figures as at 31.12.2015
31.12.15 % of turnover 31.12.14 % of turnover Diff. %
Earnings before tax 2,267 0.3 –4,970 –0.7 n.r.
Current and deferred income taxes –11,373 –1.7 –2,871 –0.4 n.r.
Profit/(loss) pertaining to minorities 191 0.0 –72 –0.0 n.r.
Net profit/(loss) –8,915 –1.3 –7,913 –1.1 12.7
31.12.15 % of turnover 31.12.14 % of turnover Diff. %
Net profit/(loss) –8,915 –1.3 –7,913 –1.1 12.7
Non-recurrent costs/(income) –2,407 4,822
Adjusted net profit/(loss) –11,322 –1.7 –3,091 –0.4 n.r.
2015 closed with a loss of 8.915 million Euros (-1.3% of turnover) compared to the loss of 7.913 million Euros (-1.1% of turnover) in 2014. Net of non-recurring costs, the net loss was equal to 14.548 million Euros (-2.2% of turnover).
Taxes as at 31 December 2015 amounted to 11.322 million Euros (-1.7% of turnover) against 2.871 million Euros (0.4% of turnover) as at 31 December 2014. Taxes for the year are influenced by extraordinary items amounting to approx. 9.6 million Euros, of which 1.9 million Euros for the reversal of deferred tax assets following the reduction of the Ires rate as from 2017, 1.2 million Euros as a result of termination of the Finaid tax consolida-tion, 2.2 million Euros relating to provisions for tax disputes and 4.2 million Euros of tax on the capital gain realised in Argentina from the sale of the plant.
Am
ount
s in
Eur
o/0
00
Am
ount
s in
Eur
o/0
00

Annual Report 201566 – 67
Amortisation,depreciationandimpairmentoffixedassetsFigures as at 31.12.2015
31.12.15 % of turnover 31.12.14 % of turnover Diff. %
Depreciation and amortisation 26,069 3.9 26,559 3.6 –1.8
Intang. asset impairment 20,538 3.0 98 0.0 n.r.
Depreciation amounted to 26.069 million Euros (3.9% of turnover), in line compa-red to 26.559 million Euros (3.7% of turnover) in 2014. The impairments of intangible fixed assets mainly relate to the impairment of goodwill of the Santerno Business Area amounting to 16 million Euros.
InvestmentsFigures as at 31.12.2015
31.12.15 31.12.14
Investments 25,414 34,674
In 2015, investments amounted to 25.414 million Euros compared to 34.674 million Euros in 2014, focussed on supporting the project for re-insourcing activities previously carried out externally and on systems efficiency and modernisation.
ResearchandinnovationExpenses for Research and Innovation, the purposes and applications of which are com-
mented on in a specific paragraph, amounted in 2015 to 13.764 million Euros, accounting for 2.0% of turnover, compared with 14.276 million Euros, representing 2.0% of turnover in 2014.
NetfinancialpositionFigures as at 31.12.2015
31.12.15 30.09.15 30.06.15 31.12.14
Net financial position * –227,783 –256,161 –247,034 –224,273
* Understood as the sum of amounts payable to banks, short-, medium- and long-term bonds and loans, net of cash and cash equivalents, negotiable securities and financial receivables.
The consolidated net financial position as at 31 December 2015 was negative at 227.783 million Euros, an improvement compared to the 247.034 million Euros as at 30 June 2015 and substantially in line with the 224.273 million Euros as at 31 December 2014. The im-provement over the first half was due to both the impact of asset disposals and rebalancing of net working capital.
Am
ount
s in
Eur
o/0
00
Am
ount
s in
Eur
o/0
00
Am
ount
s in
Eur
o/0
00

Directors’ Report on Operations
In accordance with the new agreement signed with the banks on 24 December 2015, recognition of the covenants as at 31 December 2015 is not envisaged.
Cash flow statements in the directors’ report on operations represent the movements of the net financial position during the year and include effects arising from the translation into Euros of financial items in local currencies.

Annual Report 201568 – 69
Personnel
WorkforcetrendFigures as at 31.12.2015
31.12.2015 31.12.2014 31.12.2013
Executives 29 43 50
Clerical staff 823 929 1,035
Factory workers 2,211 2,472 2,964
Temporary workers 213 310 314
Total 3,276 3,754 4,363
Group personnel as at 31 December 2015 (including temporary workers, trainees and interim workers), amounted to 3,276 resources compared to 3,754 actually working as at 31 December 2014.
The reduction in the workforce compared to 31 December 2014 is mainly due to the clo-sure of the Gorizia plant, the restructuring in progress in Argentina, the reduction of the workforce in China as a result of to the decrease in turnover, the lower use of temporary workers and the deconsolidation of O&K.
Actions takenOn 21 May 2015, an agreement with the national, regional and plant trade union organ-
isations was signed concerning the start of the 12-month redundancy procedure from 1 June 2015 which envisages the gradual closure of the Gorizia plant by mid 2016. Despite this agreement envisaged the possibility for employees to relocate to at the Maniago (PN) or Campodarsego (PD) plants, only 4 people accepted this proposal, while 63 people ac-cepted the incentive plan provided for by the agreement which envisaged the payment of variable amounts depending on the date of acceptance.
At the Poggiofiorito (CH) plant, recourse was made to the ordinary redundancy fund and collective stoppages through the use of individual holidays and leave, covering the pe-riod from August to December 2015, after which, on 20 January 2016, a collective agree-ment was signed for defensive solidarity contracts for a period of 24 months.
During the year, the process of rationalisation of management personnel also contin-ued, mainly in Carraro Spa and Elettronica Santerno Spa, and the redundancy procedure already initiated in 2014 in Carraro Drive Tech Spa was completed.
The Performance Management programme (management process to improve individ-ual and team performance) which is also related to the Management Review process (that identifies career and professional development plans to empower key resources), involved over 200 people in 2015, at all Group units and sites where it operates.
According to the implementation of the new Sap Erp system in Italy and the go-live in India, during the year, as planned, training on the new processes and on the new tools continued, involving both the Italian and the Indian subsidiary personnel.
Directors’ Report on Operations
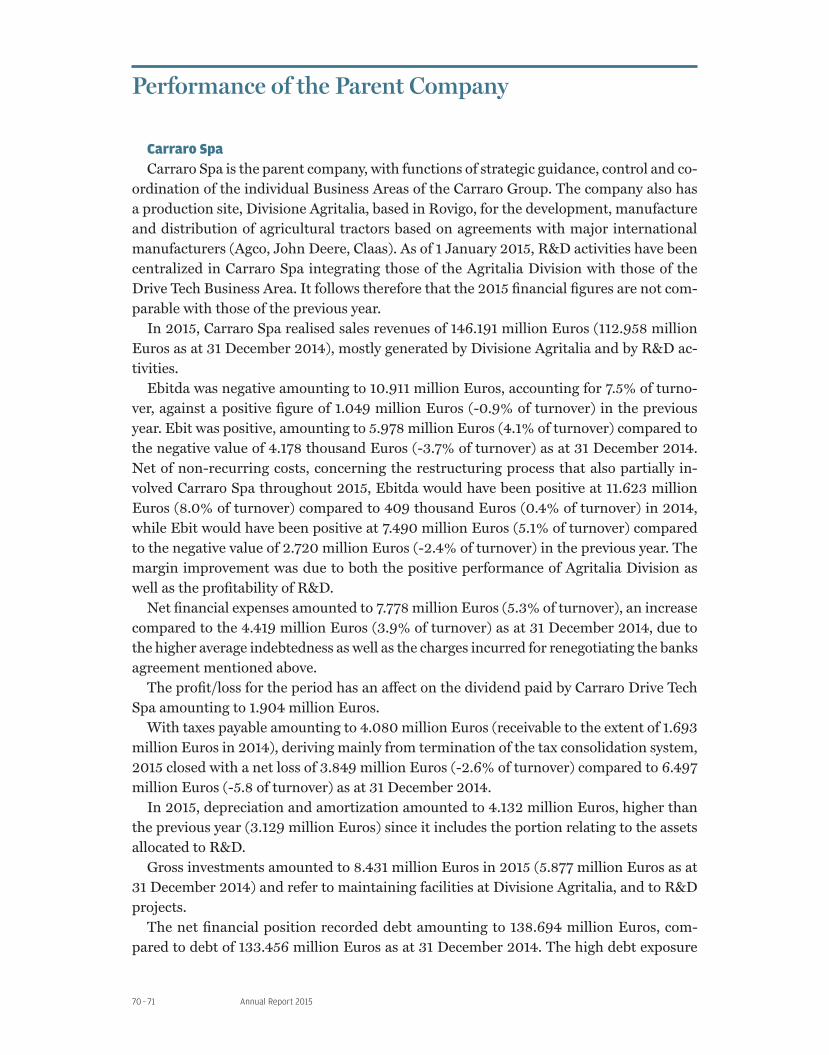
Risks regarding health and safety at workThe Group carries out industrial processes consisting to a large extent of machining,
assembly of mechanical components and, to a lesser extent, installation of inverters in the industrial and photovoltaic sectors. The safety, health and environmental impacts risks arising from work activities are mainly those typical of manufacturing and to a lesser extent those of construction sites-installation and service of electrical equipment.
During 2015, the Group continued implementation of its EH&S management sy-stem, compliant with ISO 14001, OHSAS 18001 standards and the UNI-INAIL guideli-nes, which constitutes the reference organisational model defined by Legislative Decree 231/2001. All operating units in Italy and also those abroad operate with reference to the Group standards and compliance with local requirements. The Group EH&S Service ensures a continuous improvement process through EH&S system audits and monthly review of the related improvement plans.
Also in 2015, the organisation was able to implement many new initiatives and certain EH&S programmes which allowed the objective to be achieved. Each local unit has exten-ded the approach of our EH&S Management System to many of the processes that have constituted the pillars for such developments. Compared to 2014, the Group reduced the overall number of recordable accidents by 27%.
Annual Report 201570 – 71
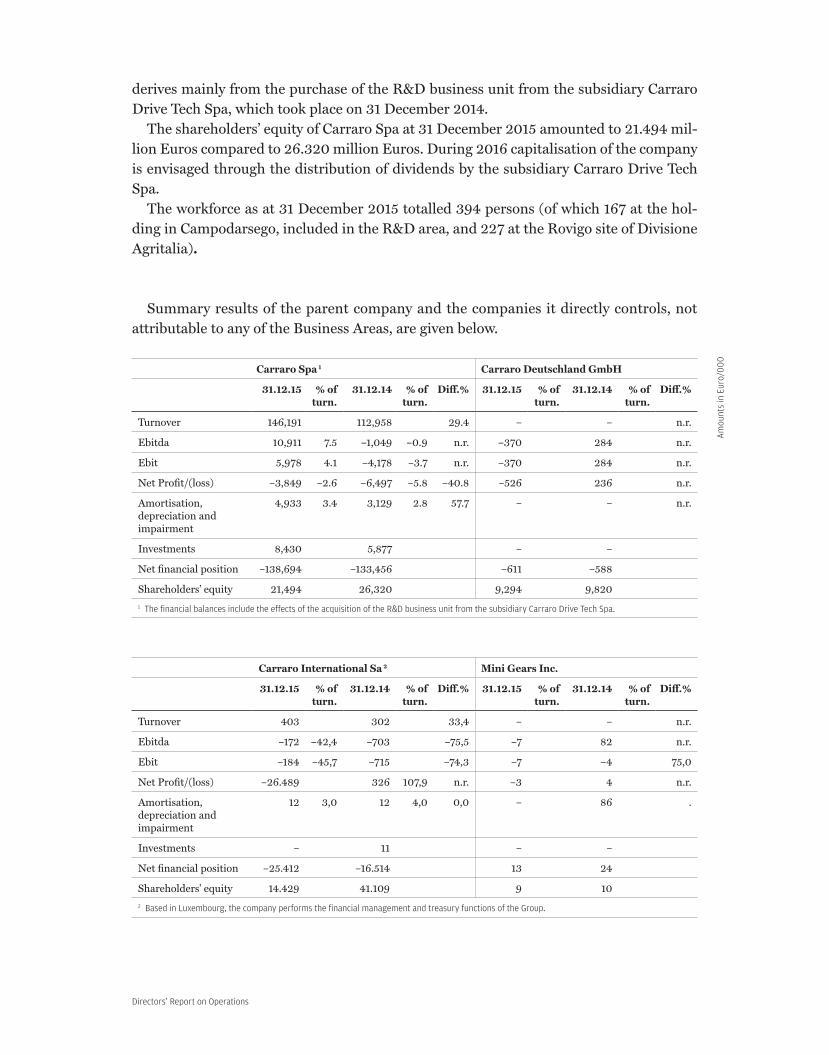
Performance of the Parent Company
CarraroSpaCarraro Spa is the parent company, with functions of strategic guidance, control and co-
ordination of the individual Business Areas of the Carraro Group. The company also has a production site, Divisione Agritalia, based in Rovigo, for the development, manufacture and distribution of agricultural tractors based on agreements with major international manufacturers (Agco, John Deere, Claas). As of 1 January 2015, R&D activities have been centralized in Carraro Spa integrating those of the Agritalia Division with those of the Drive Tech Business Area. It follows therefore that the 2015 financial figures are not com-parable with those of the previous year.
In 2015, Carraro Spa realised sales revenues of 146.191 million Euros (112.958 million Euros as at 31 December 2014), mostly generated by Divisione Agritalia and by R&D ac-tivities.
Ebitda was negative amounting to 10.911 million Euros, accounting for 7.5% of turno-ver, against a positive figure of 1.049 million Euros (-0.9% of turnover) in the previous year. Ebit was positive, amounting to 5.978 million Euros (4.1% of turnover) compared to the negative value of 4.178 thousand Euros (-3.7% of turnover) as at 31 December 2014. Net of non-recurring costs, concerning the restructuring process that also partially in-volved Carraro Spa throughout 2015, Ebitda would have been positive at 11.623 million Euros (8.0% of turnover) compared to 409 thousand Euros (0.4% of turnover) in 2014, while Ebit would have been positive at 7.490 million Euros (5.1% of turnover) compared to the negative value of 2.720 million Euros (-2.4% of turnover) in the previous year. The margin improvement was due to both the positive performance of Agritalia Division as well as the profitability of R&D.
Net financial expenses amounted to 7.778 million Euros (5.3% of turnover), an increase compared to the 4.419 million Euros (3.9% of turnover) as at 31 December 2014, due to the higher average indebtedness as well as the charges incurred for renegotiating the banks agreement mentioned above.
The profit/loss for the period has an affect on the dividend paid by Carraro Drive Tech Spa amounting to 1.904 million Euros.
With taxes payable amounting to 4.080 million Euros (receivable to the extent of 1.693 million Euros in 2014), deriving mainly from termination of the tax consolidation system, 2015 closed with a net loss of 3.849 million Euros (-2.6% of turnover) compared to 6.497 million Euros (-5.8 of turnover) as at 31 December 2014.
In 2015, depreciation and amortization amounted to 4.132 million Euros, higher than the previous year (3.129 million Euros) since it includes the portion relating to the assets allocated to R&D.
Gross investments amounted to 8.431 million Euros in 2015 (5.877 million Euros as at 31 December 2014) and refer to maintaining facilities at Divisione Agritalia, and to R&D projects.
The net financial position recorded debt amounting to 138.694 million Euros, com-pared to debt of 133.456 million Euros as at 31 December 2014. The high debt exposure
Directors’ Report on Operations
derives mainly from the purchase of the R&D business unit from the subsidiary Carraro Drive Tech Spa, which took place on 31 December 2014.
The shareholders’ equity of Carraro Spa at 31 December 2015 amounted to 21.494 mil-lion Euros compared to 26.320 million Euros. During 2016 capitalisation of the company is envisaged through the distribution of dividends by the subsidiary Carraro Drive Tech Spa.
The workforce as at 31 December 2015 totalled 394 persons (of which 167 at the hol-ding in Campodarsego, included in the R&D area, and 227 at the Rovigo site of Divisione Agritalia).
Summary results of the parent company and the companies it directly controls, not attributable to any of the Business Areas, are given below.
Carraro Spa 1 Carraro Deutschland GmbH
31.12.15 % of turn.
31.12.14 % of turn.
Diff.% 31.12.15 % of turn.
31.12.14 % of turn.
Diff.%
Turnover 146,191 112,958 29.4 – – n.r.
Ebitda 10,911 7.5 –1,049 –0.9 n.r. –370 284 n.r.
Ebit 5,978 4.1 –4,178 –3.7 n.r. –370 284 n.r.
Net Profit/(loss) –3,849 –2.6 –6,497 –5.8 –40.8 –526 236 n.r.
Amortisation, depreciation and impairment
4,933 3.4 3,129 2.8 57.7 – – n.r.
Investments 8,430 5,877 – –
Net financial position –138,694 –133,456 –611 –588
Shareholders’ equity 21,494 26,320 9,294 9,820
1 The financial balances include the effects of the acquisition of the R&D business unit from the subsidiary Carraro Drive Tech Spa.
Carraro International Sa 2 Mini Gears Inc.
31.12.15 % of turn.
31.12.14 % of turn.
Diff.% 31.12.15 % of turn.
31.12.14 % of turn.
Diff.%
Turnover 403 302 33,4 – – n.r.
Ebitda –172 –42,4 –703 –75,5 –7 82 n.r.
Ebit –184 –45,7 –715 –74,3 –7 –4 75,0
Net Profit/(loss) –26.489 326 107,9 n.r. –3 4 n.r.
Amortisation, depreciation and impairment
12 3,0 12 4,0 0,0 – 86 .
Investments – 11 – –
Net financial position –25.412 –16.514 13 24
Shareholders’ equity 14.429 41.109 9 10
2 Based in Luxembourg, the company performs the financial management and treasury functions of the Group.
Am
ount
s in
Eur
o/0
00

Annual Report 201572 – 73

Directors’ Report on Operations

Annual Report 201574 – 75
PERFORMANCE AND RESULTSCarraro Group Business Areas
—
BusinessAreas

Directors’ Report on Operations
Carraro Drive Tech Spa
48.68%
43.31%
100%
99.9521%
8.01%
100%
1%
98.6352%Carra
ro
Deutschland Gmbh
Carraro
Technologies Ltd.
Carraro Drive Tech
do Brasil Inc.
Carraro
Argentina Sa
45%
100%
99.9999%
Carraro North
America Inc.
Carraro India
Pvt Ltd.
Carraro China
Drives Syst Co. Ltd.
O&K Antriebstechnik
Gmbh
100%
Fon Sa
100%
99%
Carraro Spa
CarraroInternational Sa
0.0001%8.43%
FriuliaSiap Spa
91.57%
0.04
79%
Gerardo
E. Francia

Annual Report 201576 – 77
BUSINESS AREADrivelines & Components
—
Drivetech

Directors’ Report on Operations
SubconsolidatedIncomeStatementasat31.12.2015Drivelines & Components - Drivetech business area
31.12.15 % 31.12.14 % Changes
31.12.15 31.12.14
Revenues from sales 543,676 100.00% 610,453 100.00% –66,777 –10.94%
Purchases of goods and materials (net of changes in inventories)
–317,296 –58.36% –358,346 –58.70% 41,050 –11.46%
Services and Use of third-party goods and services
–103,657 –19.07% –102,541 –16.80% –1,116 1.09%
Personnel costs –90,800 –16.70% –99,188 –16.25% 8,388 –8.46%
Amortisation, depreciation and impairment of assets
–23,356 –4.30% –21,442 –3.51% –1,914 8.93%
Provisions for risks –6,495 –1.19% –7,648 –1.25% 1,153 –15.08%
Other income and expenses 15,719 2.89% 4,238 0.69% 11,481 270.39%
Internal construction 343 0.06% 3,240 0.53% –2,897 –89.41%
Operating costs –525,542 –96.66% –581,687 –95.29% 56,145 –9.65%
Operating profit/loss (Ebit) 18,134 3.34% 28,766 4.71% –10,632 –36.96%
Income from equity investments 22,985 4.23% 475 0.08% 22,510 4738.95%
Other financial income 3,863 0.71% 3,795 0.62% 68 1.79%
Financial costs and expenses –10,303 –1.90% –14,197 –2.33% 3,894 –27.43%
Net gains/(losses) on foreign exchange –3,783 –0.70% –2,568 –0.42% –1,215 47.31%
Value adjustments of financial assets #DIV/0!
Gains/(losses) on financial assets 12,762 2.35% –12,495 –2.05% 25,257 –202.14%
Profit/(loss) before taxes 30,896 5.68% 16,271 2.67% 14,625 89.88%
Current and deferred income taxes –4,714 –0.87% –9,600 –1.57% 4,886 –50.90%
Net profit/(loss) 26,182 4.82% 6,671 1.09% 19,511
Profit/(loss) pertaining to minorities 191 0.04% –72 –0.01% 263
Business Area consolidated result 26,373 4.85% 6,599 1.08% 19,774
Ebitda 40,086 7.37% 49,227 8.06% –9,141 –18.57%
Am
ount
s in
Eur
o/0
00
Annual Report 201578 – 79
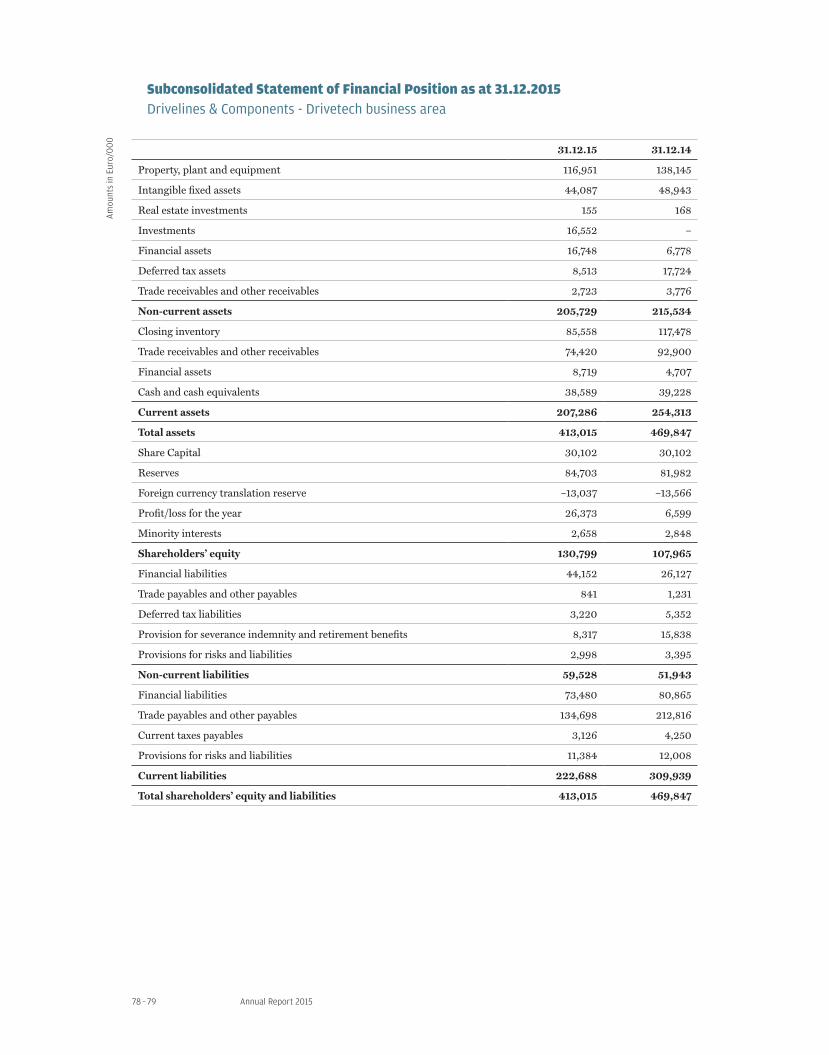
SubconsolidatedStatementofFinancialPositionasat31.12.2015Drivelines & Components - Drivetech business area
31.12.15 31.12.14
Property, plant and equipment 116,951 138,145
Intangible fixed assets 44,087 48,943
Real estate investments 155 168
Investments 16,552 –
Financial assets 16,748 6,778
Deferred tax assets 8,513 17,724
Trade receivables and other receivables 2,723 3,776
Non-current assets 205,729 215,534
Closing inventory 85,558 117,478
Trade receivables and other receivables 74,420 92,900
Financial assets 8,719 4,707
Cash and cash equivalents 38,589 39,228
Current assets 207,286 254,313
Total assets 413,015 469,847
Share Capital 30,102 30,102
Reserves 84,703 81,982
Foreign currency translation reserve –13,037 –13,566
Profit/loss for the year 26,373 6,599
Minority interests 2,658 2,848
Shareholders’ equity 130,799 107,965
Financial liabilities 44,152 26,127
Trade payables and other payables 841 1,231
Deferred tax liabilities 3,220 5,352
Provision for severance indemnity and retirement benefits 8,317 15,838
Provisions for risks and liabilities 2,998 3,395
Non-current liabilities 59,528 51,943
Financial liabilities 73,480 80,865
Trade payables and other payables 134,698 212,816
Current taxes payables 3,126 4,250
Provisions for risks and liabilities 11,384 12,008
Current liabilities 222,688 309,939
Total shareholders’ equity and liabilities 413,015 469,847
Am
ount
s in
Eur
o/0
00
Directors’ Report on Operations
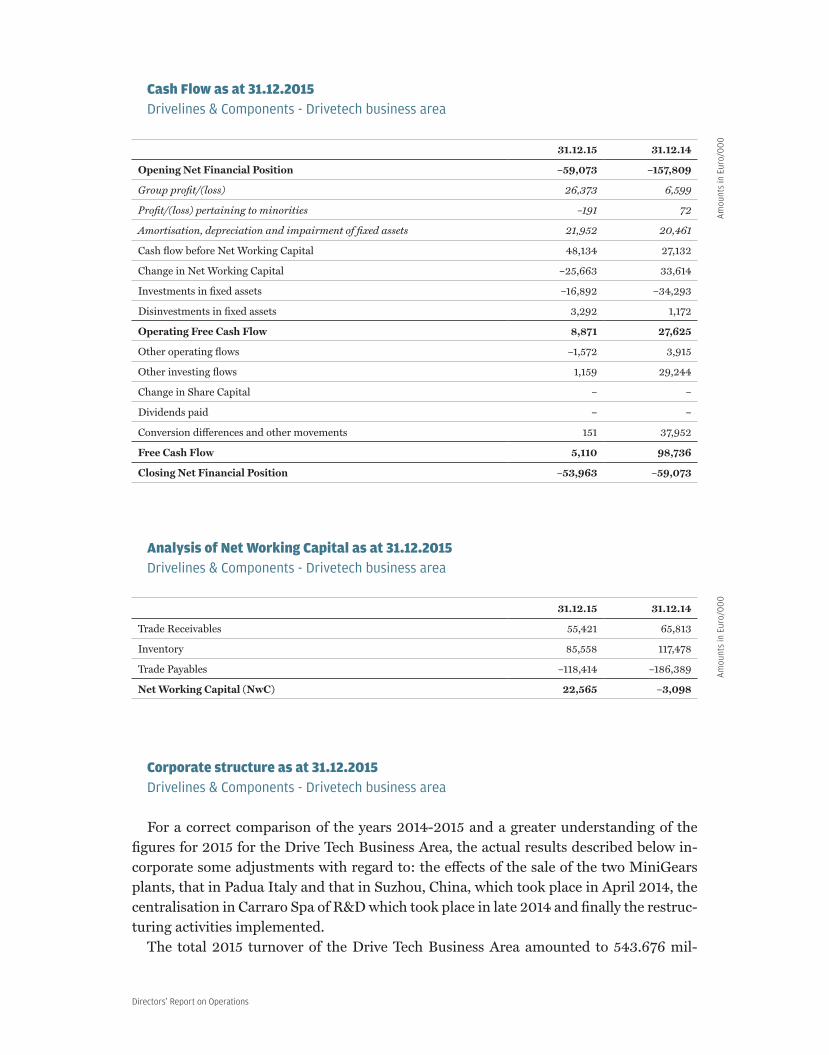
CashFlowasat31.12.2015Drivelines & Components - Drivetech business area
31.12.15 31.12.14
Opening Net Financial Position –59,073 –157,809
Group profit/(loss) 26,373 6,599
Profit/(loss) pertaining to minorities –191 72
Amortisation, depreciation and impairment of fixed assets 21,952 20,461
Cash flow before Net Working Capital 48,134 27,132
Change in Net Working Capital –25,663 33,614
Investments in fixed assets –16,892 –34,293
Disinvestments in fixed assets 3,292 1,172
Operating Free Cash Flow 8,871 27,625
Other operating flows –1,572 3,915
Other investing flows 1,159 29,244
Change in Share Capital – –
Dividends paid – –
Conversion differences and other movements 151 37,952
Free Cash Flow 5,110 98,736
Closing Net Financial Position –53,963 –59,073
AnalysisofNetWorkingCapitalasat31.12.2015Drivelines & Components - Drivetech business area
31.12.15 31.12.14
Trade Receivables 55,421 65,813
Inventory 85,558 117,478
Trade Payables –118,414 –186,389
Net Working Capital (NwC) 22,565 –3,098
Corporatestructureasat31.12.2015Drivelines & Components - Drivetech business area
For a correct comparison of the years 2014-2015 and a greater understanding of the figures for 2015 for the Drive Tech Business Area, the actual results described below in-corporate some adjustments with regard to: the effects of the sale of the two MiniGears plants, that in Padua Italy and that in Suzhou, China, which took place in April 2014, the centralisation in Carraro Spa of R&D which took place in late 2014 and finally the restruc-turing activities implemented.
The total 2015 turnover of the Drive Tech Business Area amounted to 543.676 mil-
Am
ount
s in
Eur
o/0
00
Am
ount
s in
Eur
o/0
00
Annual Report 201580 – 81
lion Euros, down by 10.9%, from 610.453 million Euros in 2014 with a favourable 2015 exchange rate effect of approx. 23 million Euros. It is appropriate to point out that, net of the effects of the operations mentioned in the previous paragraph, the reduction in turno-ver would have been 7.4%.
Turnover from third parties, which accounts for 96.1% of total turnover, was equal to 522.627 million Euros compared to 592.462 million for the previous year (96.1% of total turnover) down by 11.8%. Turnover from Group Companies amounted to 21.049 million Euros (3.9% of total turnover), with a 17.0% increase compared to 17.991 million Euros (2.9% of total turnover) in 2014.
The analyses carried out on demand, compared with 2014, highlight a continuing we-akness and uncertainty in the target markets throughout the year, deteriorating as from the end of the second quarter.
Below is the detailed analysis of the main target markets.
Agricultural marketSales in the agricultural market declined by 2.6% compared to 2014 mainly due to the
strong negative trend in China, Brazil, Italy and India, while the Turkish market, the first country for this market segment, remained slightly below the previous year. Interesting counter-trends, with significant increases in sales compared to the previous year, were recorded in France, Argentina, the US and Mexico.
The analysis by application highlights lower sales of transmissions while axles recorded a very slight decrease.
Construction equipment marketThe decrease in sales of construction machinery products was 12.7%, mainly due to the
reduction in Brazil, the UK, Turkey and Italy, while the Netherlands, India, France and Japan recorded encouraging increases.
Replacement partsReplacement parts sales were substantially stable compared to 2014 (+0.5%), thanks to
the development of sales on a growing installed base and to the commercial penetration initiatives in the After Market segment. The agricultural market, with a slight improve-ment over the previous year (+ 0.92%) remained, for the sale of spare parts, the main mar-ket, together with construction equipment whose turnover, on the other hand, decreased by 5.81%.
Automotive MarketIn the segment, the Drive Tech Business Area also operated under the miniGears brand,
a business unit of which is outside the Group perimeter since 30 April 2014. Turnover following this sale was down by 29.8% over the previous year. The Drive Tech Business Area remained present in the segment mainly with fast axles, which in 2015 recorded an increase of 20%, and with gears for the truck market.
Turnover by geographic area confirmed the main target markets to be the United States (15.4%), Germany (13.3%), Italy (10.6%), India (10.1%) and Turkey (8.5%). The Nether-
Directors’ Report on Operations
lands, Mexico, France and Argentina recorded an increase over the previous year while the Brazilian, UK and Italian markets recorded a decreases in sales.
Overall turnover from foreign markets as of 31 December 2015 was 89.4% of the total turnover from the business area, against 88.45% in the same period of 2014. Sales within the EU accounted for 46.69% compared to 47.51% in the previous year.
As for the target markets, the Construction Equipment market accounted for 42.2% of third party sales (down by 12.7% compared to the same period of the previous year) while the Agricultural market accounted for 37.4% (down 2.6% compared to 2014).
The improvement in variable profitability, already recorded in previous years, contin-ued, thanks mainly to production efficiencies, to insourcing and to the good performance of the supply chain related to the Partnership project, initiated with partner suppliers. A result which in 2015 was significantly penalised by fixed costs due to the negative volume effect.
Profitability in 2015 was also influenced by the effects of non-recurring events, such as the sale of the industrial area in Argentina, the Gorizia plant closure costs, the Argentine personnel restructuring costs and those of certain plants in Italy.
Ebitda stood at 40.086 million Euros compared to 49.227 million Euros in 2014, ac-counting for 7.4% of turnover as at 31 December 2015 compared to 8.1% of turnover as at 31 December 2014, a reduction of 18.6%. Excluding non-recurring costs, Ebitda in 2014 would have amounted to 33.782 million Euros (6.2% of turnover) compared to 52.049 million Euros (8.5% of turnover).
Ebit amounted to 18.134 million Euros (3.3% of turnover) down by 37.0% compared to 28.766 million Euros as at 31 December 2014 (4.7 % of turnover). Excluding non-recur-ring costs, it would have amounted to 12.530 million Euros (2.3% of turnover) compared to 31.588 million Euros (5.2% of turnover) of 2014.
Normalising the results by excluding Mini Gears, adjusted Ebitda in 2014 would have amounted to 46.478 million Euros (7.9% of turnover) and adjusted 2014 Ebit would have amounted to 27.805 million Euros (4.7% of turnover).
It is pointed out that the profitability of the Business Area in 2015 was impacted by the effects of centralisation of R&D in Carraro Spa, amounting to a total of 6 million Euros (arising from the payment of royalties).
Earnings before tax were affected by the proceeds from the sale of a stake of 55% in the German company O&K Antriebstechnik amounting to a total of 22.985 million Euros. This amount reflects not only the capital gain on the sale of the stake but also the fair va-lue of the remaining holding of 45%, according to the provisions of the contract terms, as explained in the preceding paragraphs.
Due to the above, net profit improved compared to the previous year, from a profit of 6.599 million Euros in 2014 (1.1% of turnover) to 26.373 million Euros in 2015 (4.9% of turnover). Net of non-recurrent costs, the net profit would have been 749 thousand Euros (0.1% of turnover).
The net financial position as at 31 December 2015 was negative, amounting to 53.963 million Euros, improving on the figures of 59.073 million Euros as at 31 December 2014 and 82.158 million Euros as at 30 June 2015, due to the positive cash flow from asset di-sposal and rebalancing of net working capital.

Annual Report 201582 – 83
TurnoverA breakdown of turnover between sales to third parties and intra-group is provided below:
Sales Salesto third parties
Intra-groupSales
31.12.15 31.12.14 Diff % 31.12.15 31.12.14 Diff % 31.12.15 31.12.14 Diff %
CarraroDrivetech
543,676 610,453 –10.9 522,627 592,461 –11.8 21,049 17,992 17.0
Intra-group sales refer to sales realised between companies from different business are-as (in particular Carraro Drive Tech and Divisione Agritalia).
The following table breaks down turnover from third parties by geographical area:
Geographical Area 31.12.15 % 31.12.14 % Diff. % ‘15-’14
North America 80,447 15.4 81,045 13.7 –0.7
Germany 69,695 13.3 77,072 13.0 –9.6
South America 59,237 11.3 78,070 13.2 –24.1
India 52,643 10.1 58,135 9.8 –9.4
Turkey 44,168 8.5 48,363 8.2 –8.7
United Kingdom 41,398 7.9 58,328 9.8 –29.0
France 31,065 5.9 23,033 3.9 34.9
China 22,884 4.4 29,227 4.9 –21.7
Poland 11,278 2.2 11,541 1.9 –2.3
Czech Republic 9,387 1.8 10,587 1.8 –11.3
Holland 7,726 1.5 3,351 0.6 130.6
Other 37,290 7.1 45,401 7.7 –17.9
Total Abroad 467,218 89.4 524,153 88.5 –10.9
Italy 55,409 10.6 68,309 11.5 –18.9
Total 522,627 100.0 592,462 100.0 –11.8
Within the context of a general contraction in sales, some differences emerge: North America still ranked first with a slight decrease (-0.7%) while South America suffered a sharp decline (-24.1%), as too did the United Kingdom (-29.0%) and China (-21.7%). Sales in France (+34.9%) and the Netherlands, on the other hand, improved (+130.6%).
It is pointed out that turnover from Germany, Great Britain and the United States mainly concerned the local production sites of customers who in turn generated sales mainly on non-European markets.
The following table breaks down sales to third parties by application segment:
Sector 31.12.15 % 31.12.14 % Diff. % ‘15-’14
Construction Equipment 220,647 42.2 252,642 42.6 –12.7
Agricultural 195,195 37.4 200,444 33.8 –2.6
Material Handling 23,448 4.5 25,280 4.3 –7.2
Am
ount
s in
Eur
o/0
00
Am
ount
s in
Eur
o/0
00
Am
ount
s in
Eur
o/0
00

Directors’ Report on Operations
Sector 31.12.15 % 31.12.14 % Diff. % ‘15-’14
Automotive 15,662 3.0 22,318 3.8 –29.8
Gardening & Powertools 2,252 0.4 10,710 1.8 –79.0
Industrial 1,704 0.3 3,452 0.6 –50.6
Renewable Energy 255 0.0 1,235 0.2 –79.4
Replacement parts 51,103 9.8 50,844 8.6 0.5
Other 12,361 2.4 25,537 4.3 –51.7
Totale 522,627 100.0 592,462 100.0 –11.8
In the overall decline in sales, the incidence of turnover in the agricultural market is highlighted, which increased from 33.8% in 2014 to 37.4% this year.
EbitdaeEbitFigures as at 31.12.2015
31.12.15 % of turnover 31.12.14 % of turnover Diff. %
Ebitda a 40,086 7.4 49,227 8.1 –18.6
Non-recurrent costs/(income) –6,304 2,822
of which:
Capital gain on the sale of real estate in Argentina
–12,159
Costs for the closure of the Gorizia plant
2,659
Restructuring costs in Argentina 2,102
Other restructuring costs 1,094
Adjusted Ebitda 33,782 6.2 52,049 8.5 –35.1
Ebit b 18,134 3.3 28,766 4.7 –37.0
Non-recurrent costs/(income) –5,604 2,822
of which:
Capital gain on the sale of real estate in Argentina
–12,159
Fixed asset impairment 700
Costs for the closure of the Gorizia plant
2,659
Restructuring costs in Argentina 2,102
Other restructuring costs 1,094
Adjusted Ebit 12,530 2.3 31,588 5.2 –60.3
a Understood as the sum of operating profit/(loss), amortisation, depreciation and impairment of fixed assetsb Understood as operating profit/(loss) in the income statement
Ebitda stood at 40.086 million Euros compared to 49.227 million Euros in 2014, ac-counting for 7.4% of turnover as at 31 December 2015 compared to 8.1% of turnover as at 31 December 2014, a reduction of 18.6%. Excluding non-recurring costs, Ebitda in 2014 would have amounted to 33.782 million Euros (6.2% of turnover) compared to 52.049 million Euros (8.5% of turnover).
Am
ount
s in
Eur
o/0
00
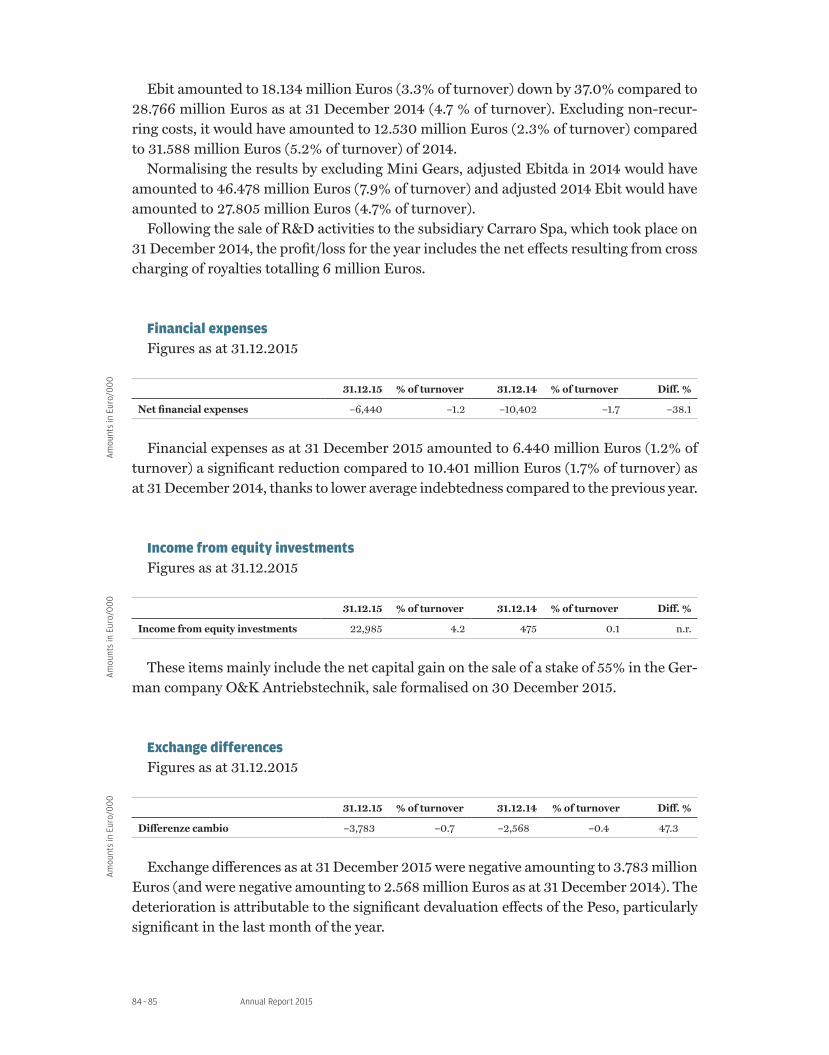
Annual Report 201584 – 85
Ebit amounted to 18.134 million Euros (3.3% of turnover) down by 37.0% compared to 28.766 million Euros as at 31 December 2014 (4.7 % of turnover). Excluding non-recur-ring costs, it would have amounted to 12.530 million Euros (2.3% of turnover) compared to 31.588 million Euros (5.2% of turnover) of 2014.
Normalising the results by excluding Mini Gears, adjusted Ebitda in 2014 would have amounted to 46.478 million Euros (7.9% of turnover) and adjusted 2014 Ebit would have amounted to 27.805 million Euros (4.7% of turnover).
Following the sale of R&D activities to the subsidiary Carraro Spa, which took place on 31 December 2014, the profit/loss for the year includes the net effects resulting from cross charging of royalties totalling 6 million Euros.
FinancialexpensesFigures as at 31.12.2015
31.12.15 % of turnover 31.12.14 % of turnover Diff. %
Net financial expenses –6,440 –1.2 –10,402 –1.7 –38.1
Financial expenses as at 31 December 2015 amounted to 6.440 million Euros (1.2% of turnover) a significant reduction compared to 10.401 million Euros (1.7% of turnover) as at 31 December 2014, thanks to lower average indebtedness compared to the previous year.
IncomefromequityinvestmentsFigures as at 31.12.2015
31.12.15 % of turnover 31.12.14 % of turnover Diff. %
Income from equity investments 22,985 4.2 475 0.1 n.r.
These items mainly include the net capital gain on the sale of a stake of 55% in the Ger-man company O&K Antriebstechnik, sale formalised on 30 December 2015.
ExchangedifferencesFigures as at 31.12.2015
31.12.15 % of turnover 31.12.14 % of turnover Diff. %
Differenze cambio –3,783 –0.7 –2,568 –0.4 47.3
Exchange differences as at 31 December 2015 were negative amounting to 3.783 million Euros (and were negative amounting to 2.568 million Euros as at 31 December 2014). The deterioration is attributable to the significant devaluation effects of the Peso, particularly significant in the last month of the year.
Am
ount
s in
Eur
o/0
00
Am
ount
s in
Eur
o/0
00
Am
ount
s in
Eur
o/0
00
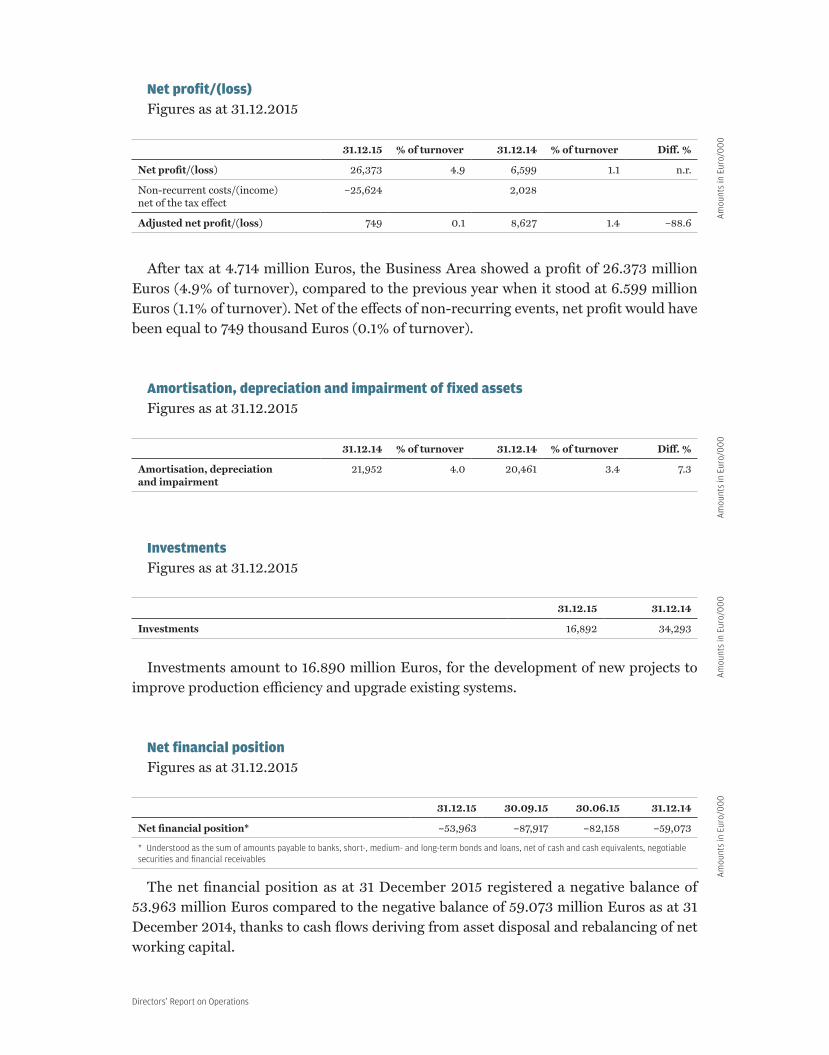
Directors’ Report on Operations
Netprofit/(loss)Figures as at 31.12.2015
31.12.15 % of turnover 31.12.14 % of turnover Diff. %
Net profit/(loss) 26,373 4.9 6,599 1.1 n.r.
Non-recurrent costs/(income) net of the tax effect
–25,624 2,028
Adjusted net profit/(loss) 749 0.1 8,627 1.4 –88.6
After tax at 4.714 million Euros, the Business Area showed a profit of 26.373 million Euros (4.9% of turnover), compared to the previous year when it stood at 6.599 million Euros (1.1% of turnover). Net of the effects of non-recurring events, net profit would have been equal to 749 thousand Euros (0.1% of turnover).
Amortisation,depreciationandimpairmentoffixedassetsFigures as at 31.12.2015
31.12.14 % of turnover 31.12.14 % of turnover Diff. %
Amortisation, depreciation and impairment
21,952 4.0 20,461 3.4 7.3
InvestmentsFigures as at 31.12.2015
31.12.15 31.12.14
Investments 16,892 34,293
Investments amount to 16.890 million Euros, for the development of new projects to improve production efficiency and upgrade existing systems.
NetfinancialpositionFigures as at 31.12.2015
31.12.15 30.09.15 30.06.15 31.12.14
Net financial position* –53,963 –87,917 –82,158 –59,073
* Understood as the sum of amounts payable to banks, short-, medium- and long-term bonds and loans, net of cash and cash equivalents, negotiable securities and financial receivables
The net financial position as at 31 December 2015 registered a negative balance of 53.963 million Euros compared to the negative balance of 59.073 million Euros as at 31 December 2014, thanks to cash flows deriving from asset disposal and rebalancing of net working capital.
Am
ount
s in
Eur
o/0
00
Am
ount
s in
Eur
o/0
00
Am
ount
s in
Eur
o/0
00
Am
ount
s in
Eur
o/0
00

Annual Report 201586 – 87
Personnel
WorkforcetrendFigures as at 31.12.2015
31.12.15 31.12.14 31.12.13
Executives 10 20 26
Clerical staff 496 644 706
Factory workers 2,022 2,328 2,819
Temporary workers 211 261 284
Total 2,739 3,253 3,835
The reduction in the workforce compared to 31 December 2014 is attributable to the re-structuring activities implemented during 2015 (through the closing of the Gorizia plant and a partial restructuring in Argentina), to the deconsolidation of O&K, to the transfer of the R&D area to Carraro Spa and the reduction of the workforce as a result of the con-traction in volumes (particularly in China).

Directors’ Report on Operations
SummarydataofcompaniesbelongingtotheBusiness area Drivelines & Components - Drivetech as at 31.12.2015
Carraro Drive Tech Spa 1 Carraro Argentina Sa
31.12.15 % ofturn.
31.12.14 % ofturn.
Diff.% 31.12.15 % ofturn.
31.12.14 % ofturn.
Diff.%
Turnover 263,424 236,442 11.4 50,268 56,460 –11.0
Ebitda 10,990 4.2 7,488 3.2 46.8 10,197 20.3 3,255 5.8 n.r.
Ebit 5,885 2.2 3,217 1.4 82.9 9,461 18.8 2,643 4.7 n.r.
Net profit/(loss) 24,813 9.4 1,157 0.5 n.r. 3,451 6.9 –1,336 –2.4 n.r.
Amortisation, depreciation and impairment
5,105 1.9 4,271 1.8 19.5 736 1.5 612 1.1 20.3
Investments 4,826 8,080 886 3,572
Net financial position
–41,383 –52,501 1,915 –4,875
Shareholders’ equity
94,121 72,934 9,139 9,092
1 Subholding and parent company of the Business Area
Fon Sa Carraro India Pvt. Ltd.
31.12.15 % ofturn.
31.12.14 % ofturn.
Diff.% 31.12.15 % ofturn.
31.12.14 % ofturn.
Diff.%
Turnover – – n.r. 125,499 136,146 –7.8
Ebitda –56 –145 n.r. 12,797 10.2 23,013 16.9 –44.4
Ebit –56 –145 n.r. 7,408 5.9 20,550 15.1 –64.0
Net profit/(loss) –55 –143 n.r. 3,042 2.4 13,655 10.0 –77.7
Amortisation, depreciation and impairment
– – n.r. 5,389 4.3 2,463 1.8 n.r.
Investments – – 3,503 3,541
Net financial position
4 126 –11,664 –2,062
Shareholders’ equity
–11 43 34,634 33,563
Carraro China Drives System Co. Ltd. Carraro Technologies Ltd 2
31.12.15 % ofturn.
31.12.14 % ofturn.
Diff.% 31.12.15 % ofturn.
31.12.14 % ofturn.
Diff.%
Turnover 63,181 80,439 –21.5 1,576 1,450 8.7
Ebitda 5,479 8.7 8,015 10.0 –31.6 426 27.0 435 30.0 -2.1
Ebit 3,325 5.3 5,297 6.6 –37.2 350 22.2 378 26.1 -7.4
Net profit/(loss) 1,773 2.8 3,334 4.1 –46.8 247 15.7 261 18.0 -5.4
Amortisation, depreciation and impairment
2,154 3.4 2,718 3.4 –20.8 76 4.8 57 3.9 33.3
Investments 378 2,063 64 193
Net financial position
2,696 1,011 736 848
Shareholders’ equity
25,780 23,116 1,587 1,260
2 This company carries out design, research and development for the Group and third parties and is based in Pune (India)
Am
ount
s in
Eur
o/0
00
Am
ount
s in
Eur
o/0
00
Am
ount
s in
Eur
o/0
00
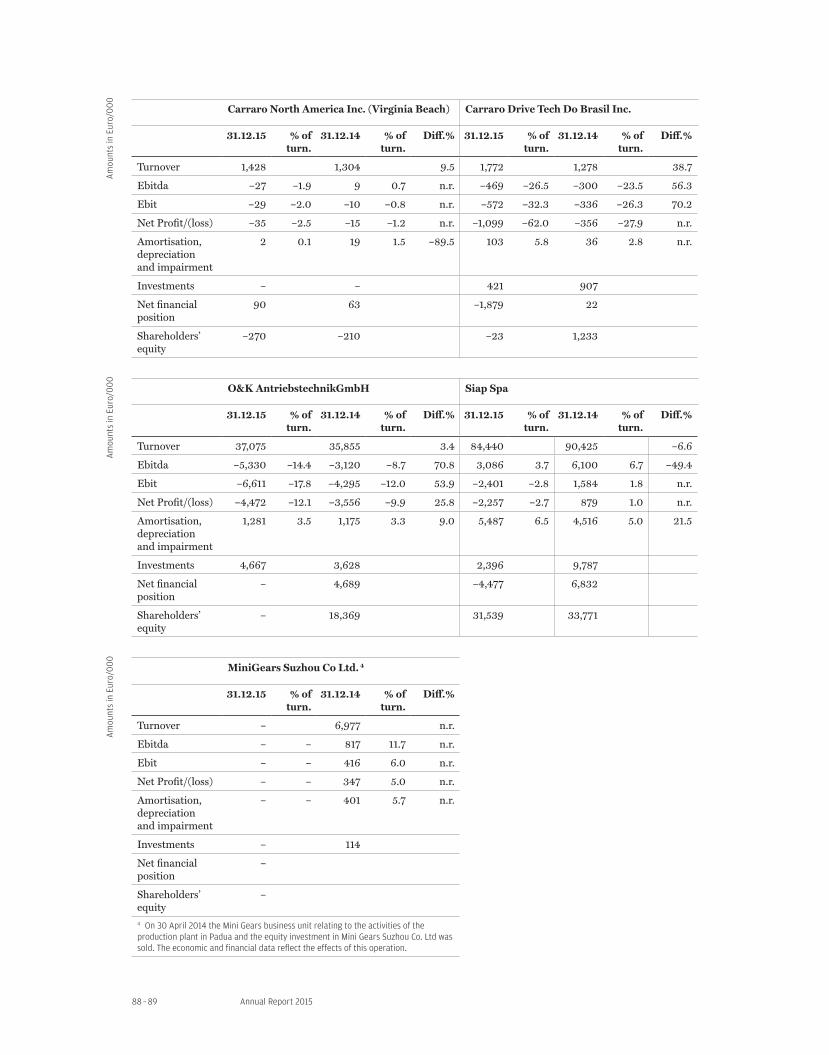
Annual Report 201588 – 89
Carraro North America Inc. (Virginia Beach) Carraro Drive Tech Do Brasil Inc.
31.12.15 % ofturn.
31.12.14 % ofturn.
Diff.% 31.12.15 % ofturn.
31.12.14 % ofturn.
Diff.%
Turnover 1,428 1,304 9.5 1,772 1,278 38.7
Ebitda –27 –1.9 9 0.7 n.r. –469 –26.5 –300 –23.5 56.3
Ebit –29 –2.0 –10 –0.8 n.r. –572 –32.3 –336 –26.3 70.2
Net Profit/(loss) –35 –2.5 –15 –1.2 n.r. –1,099 –62.0 –356 –27.9 n.r.
Amortisation, depreciation and impairment
2 0.1 19 1.5 –89.5 103 5.8 36 2.8 n.r.
Investments – – 421 907
Net financial position
90 63 –1,879 22
Shareholders’ equity
–270 –210 –23 1,233
O&K AntriebstechnikGmbH Siap Spa
31.12.15 % ofturn.
31.12.14 % ofturn.
Diff.% 31.12.15 % ofturn.
31.12.14 % ofturn.
Diff.%
Turnover 37,075 35,855 3.4 84,440 90,425 –6.6
Ebitda –5,330 –14.4 –3,120 –8.7 70.8 3,086 3.7 6,100 6.7 –49.4
Ebit –6,611 –17.8 –4,295 –12.0 53.9 –2,401 –2.8 1,584 1.8 n.r.
Net Profit/(loss) –4,472 –12.1 –3,556 –9.9 25.8 –2,257 –2.7 879 1.0 n.r.
Amortisation, depreciation and impairment
1,281 3.5 1,175 3.3 9.0 5,487 6.5 4,516 5.0 21.5
Investments 4,667 3,628 2,396 9,787
Net financial position
– 4,689 –4,477 6,832
Shareholders’ equity
– 18,369 31,539 33,771
MiniGears Suzhou Co Ltd. 4
31.12.15 % ofturn.
31.12.14 % ofturn.
Diff.%
Turnover – 6,977 n.r.
Ebitda – – 817 11.7 n.r.
Ebit – – 416 6.0 n.r.
Net Profit/(loss) – – 347 5.0 n.r.
Amortisation, depreciation and impairment
– – 401 5.7 n.r.
Investments – 114
Net financial position
–
Shareholders’ equity
–
4 On 30 April 2014 the Mini Gears business unit relating to the activities of the production plant in Padua and the equity investment in Mini Gears Suzhou Co. Ltd was sold. The economic and financial data reflect the effects of this operation.
Am
ount
s in
Eur
o/0
00
Am
ount
s in
Eur
o/0
00
Am
ount
s in
Eur
o/0
00

Directors’ Report on Operations
Annual Report 201590 – 91
BUSINESS AREAVehicles
—
Agritalia
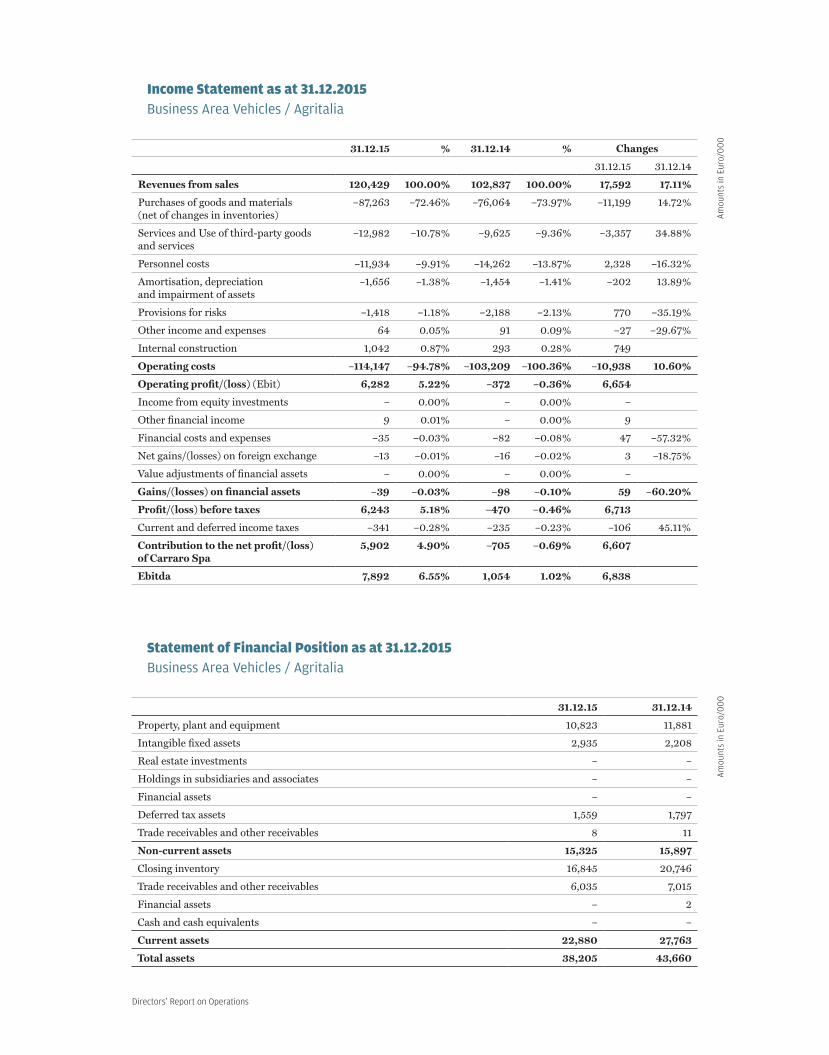
Directors’ Report on Operations
IncomeStatementasat31.12.2015Business Area Vehicles / Agritalia
31.12.15 % 31.12.14 % Changes
31.12.15 31.12.14
Revenues from sales 120,429 100.00% 102,837 100.00% 17,592 17.11%
Purchases of goods and materials (net of changes in inventories)
–87,263 –72.46% –76,064 –73.97% –11,199 14.72%
Services and Use of third-party goods and services
–12,982 –10.78% –9,625 –9.36% –3,357 34.88%
Personnel costs –11,934 –9.91% –14,262 –13.87% 2,328 –16.32%
Amortisation, depreciation and impairment of assets
–1,656 –1.38% –1,454 –1.41% –202 13.89%
Provisions for risks –1,418 –1.18% –2,188 –2.13% 770 –35.19%
Other income and expenses 64 0.05% 91 0.09% –27 –29.67%
Internal construction 1,042 0.87% 293 0.28% 749 255.63%
Operating costs –114,147 –94.78% –103,209 –100.36% –10,938 10.60%
Operating profit/(loss) (Ebit) 6,282 5.22% –372 –0.36% 6,654
Income from equity investments – 0.00% – 0.00% –
Other financial income 9 0.01% – 0.00% 9 #DIV/0!
Financial costs and expenses –35 –0.03% –82 –0.08% 47 –57.32%
Net gains/(losses) on foreign exchange –13 –0.01% –16 –0.02% 3 –18.75%
Value adjustments of financial assets – 0.00% – 0.00% – #DIV/0!
Gains/(losses) on financial assets –39 –0.03% –98 –0.10% 59 –60.20%
Profit/(loss) before taxes 6,243 5.18% –470 –0.46% 6,713
Current and deferred income taxes –341 –0.28% –235 –0.23% –106 45.11%
Contribution to the net profit/(loss) of Carraro Spa
5,902 4.90% –705 –0.69% 6,607
Ebitda 7,892 6.55% 1,054 1.02% 6,838
StatementofFinancialPositionasat31.12.2015Business Area Vehicles / Agritalia
31.12.15 31.12.14
Property, plant and equipment 10,823 11,881
Intangible fixed assets 2,935 2,208
Real estate investments – –
Holdings in subsidiaries and associates – –
Financial assets – –
Deferred tax assets 1,559 1,797
Trade receivables and other receivables 8 11
Non-current assets 15,325 15,897
Closing inventory 16,845 20,746
Trade receivables and other receivables 6,035 7,015
Financial assets – 2
Cash and cash equivalents – –
Current assets 22,880 27,763
Total assets 38,205 43,660
Am
ount
s in
Eur
o/0
00
Am
ount
s in
Eur
o/0
00
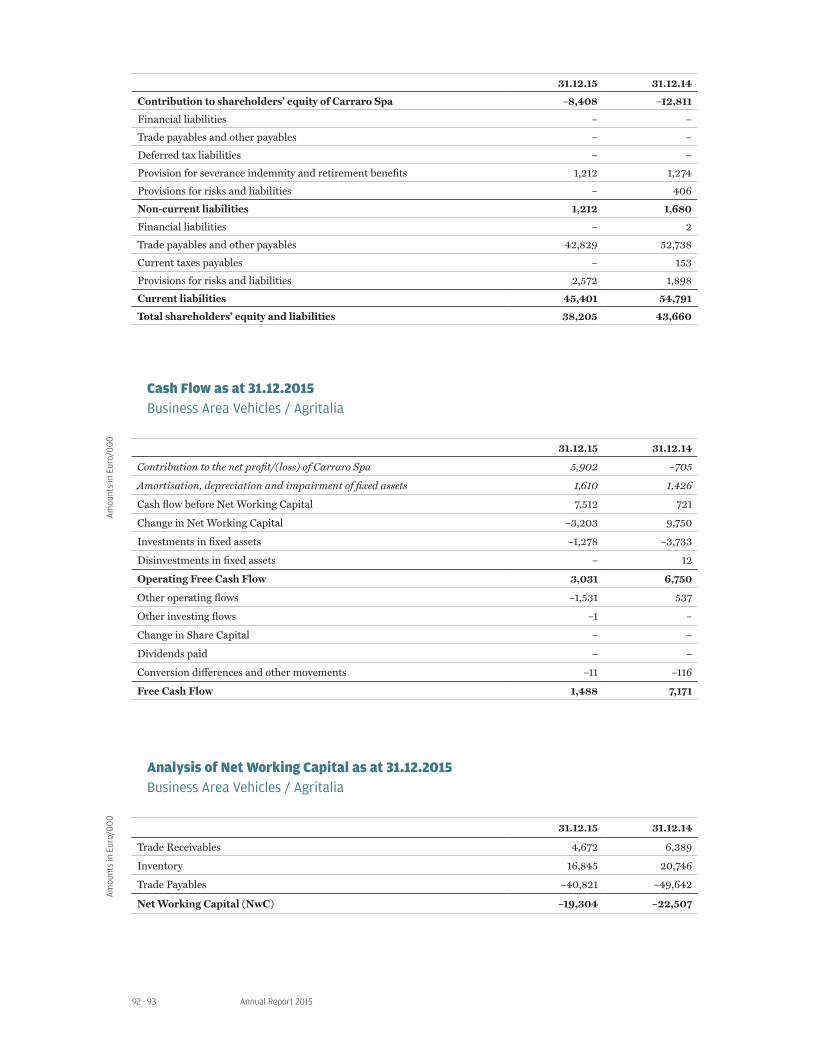
Annual Report 201592 – 93
31.12.15 31.12.14
Contribution to shareholders’ equity of Carraro Spa –8,408 –12,811
Financial liabilities – –
Trade payables and other payables – –
Deferred tax liabilities – –
Provision for severance indemnity and retirement benefits 1,212 1,274
Provisions for risks and liabilities – 406
Non-current liabilities 1,212 1,680
Financial liabilities – 2
Trade payables and other payables 42,829 52,738
Current taxes payables – 153
Provisions for risks and liabilities 2,572 1,898
Current liabilities 45,401 54,791
Total shareholders’ equity and liabilities 38,205 43,660
CashFlowasat31.12.2015Business Area Vehicles / Agritalia
31.12.15 31.12.14
Contribution to the net profit/(loss) of Carraro Spa 5,902 –705
Amortisation, depreciation and impairment of fixed assets 1,610 1,426
Cash flow before Net Working Capital 7,512 721
Change in Net Working Capital –3,203 9,750
Investments in fixed assets –1,278 –3,733
Disinvestments in fixed assets – 12
Operating Free Cash Flow 3,031 6,750
Other operating flows –1,531 537
Other investing flows –1 –
Change in Share Capital – –
Dividends paid – –
Conversion differences and other movements –11 –116
Free Cash Flow 1,488 7,171
AnalysisofNetWorkingCapitalasat31.12.2015Business Area Vehicles / Agritalia
31.12.15 31.12.14
Trade Receivables 4,672 6,389
Inventory 16,845 20,746
Trade Payables –40,821 –49,642
Net Working Capital (NwC) –19,304 –22,507
Am
ount
s in
Eur
o/0
00
Am
ount
s in
Eur
o/0
00

Directors’ Report on Operations
Corporatestructureasat31.12.2015Business Area Vehicles / Agritalia
Carraro Divisione Agritalia closed 2015 with a total turnover of 120.429 million Euros, up +17.1% compared to 102.837 million Euros in 2014. Although the market remained stable, Agritalia increased its market share, increasing the number of tractors sold from 3,722 units in 2014 to 4,258 in 2015, thanks to the market success of its new products.
The year was marked by the recovery of operating efficiency even in the presence of pro-duction start ups of the new tractor ranges. This, together with the increase in volumes, made it possible to improve the profitability of the period. The result was also positively influenced by attentive management of R&D costs.
Ebitda in 2015 amounted to 7.892 million Euros (6.6% of turnover), a significant in-crease compared to the 1.054 million Euros of 2014 (1.0% of turnover) characterised by a series of higher costs resulting from the simultaneous production start up of several new product ranges. Ebit as at 31 December 2015 was negative amounting to 6.282 million Euros (5.2% of turnover), an improvement compared to the negative value of 372 thou-sand Euros (-0.4% of turnover) in the previous year. Profit before tax as at 31 December 2015 amounted to 6.243 million Euros (5.2% of turnover) compared to a loss of 470 thou-sand Euros (-0.5% of turnover) in 2014.
Thanks to a continued policy of careful management of working capital, Divisione Agri-talia in 2015 generated a positive cash flow of 1.488 million Euros.
TurnoverTurnover from the Vehicles Business Area as at 31 December 2015 amounted to 120.429
million Euros (equal to 4,258 tractors) compared to 102.837 million Euros (equal to 3,722 tractors) as at 31 December 2014. A breakdown of turnover between sales to third parties and intra-group is provided below:
Sales Sales to third parties Intra-group sales
31.12.15 31.12.14 Diff % 31.12.15 31.12.14 Diff % 31.12.15 31.12.14 Diff %
Divisione Agritalia
120,429 102,837 17.1 116,192 98,468 18.0 4,237 4,369 –3.0
Intra-group sales refer to sales realised between companies from different business are-as (in particular Carraro Drive Tech and Divisione Agritalia).
The following table breaks down turnover from third parties by geographical area:
Geographical Area 31.12.15 % 31.12.14 % Diff. % ‘15-’14
Switzerland 44,017 37.9 43,217 43.9 1.8
France 8,346 7.2 20,424 20.7 –59.1
Spain 7,638 6.6 9,639 9.8 –20.8
Turkey 3,733 3,2 2,288 2,3 63.2
Am
ount
s in
Eur
o/0
00
Am
ount
s in
Eur
o/0
00
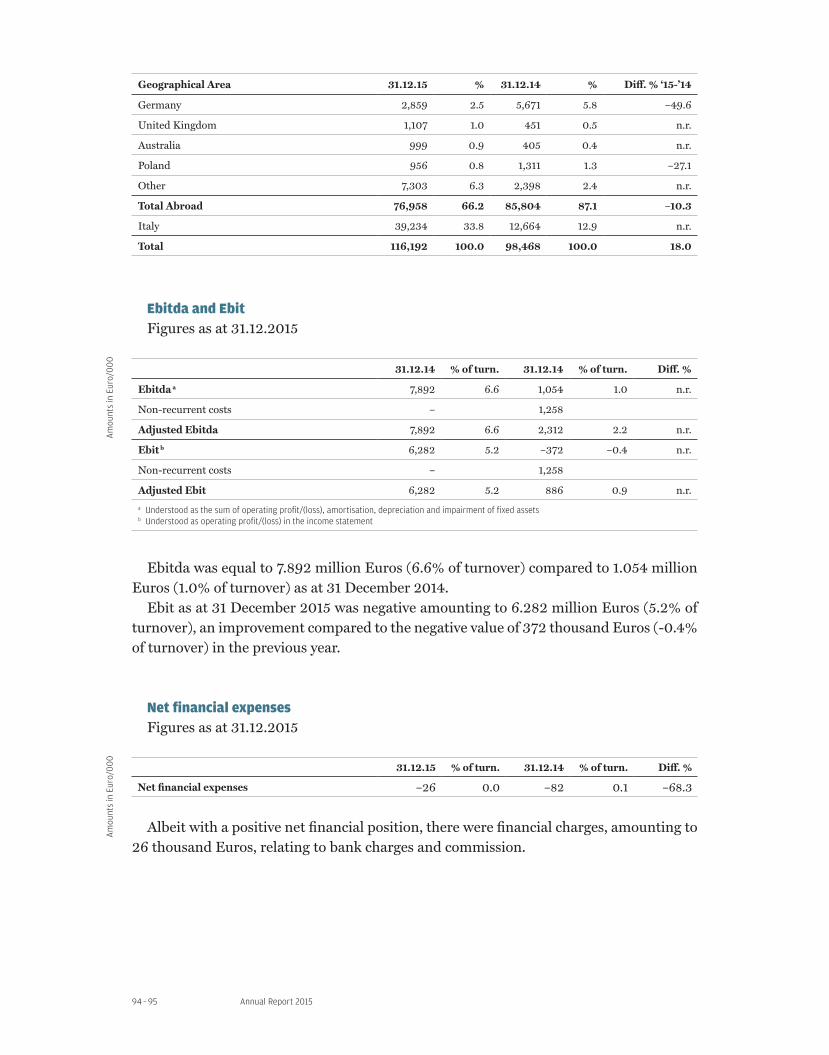
Annual Report 201594 – 95
Geographical Area 31.12.15 % 31.12.14 % Diff. % ‘15-’14
Germany 2,859 2.5 5,671 5.8 –49.6
United Kingdom 1,107 1.0 451 0.5 n.r.
Australia 999 0.9 405 0.4 n.r.
Poland 956 0.8 1,311 1.3 –27.1
Other 7,303 6.3 2,398 2.4 n.r.
Total Abroad 76,958 66.2 85,804 87.1 –10.3
Italy 39,234 33.8 12,664 12.9 n.r.
Total 116,192 100.0 98,468 100.0 18.0
EbitdaandEbitFigures as at 31.12.2015
31.12.14 % of turn. 31.12.14 % of turn. Diff. %
Ebitda a 7,892 6.6 1,054 1.0 n.r.
Non-recurrent costs – 1,258
Adjusted Ebitda 7,892 6.6 2,312 2.2 n.r.
Ebit b 6,282 5.2 –372 –0.4 n.r.
Non-recurrent costs – 1,258
Adjusted Ebit 6,282 5.2 886 0.9 n.r.
a Understood as the sum of operating profit/(loss), amortisation, depreciation and impairment of fixed assetsb Understood as operating profit/(loss) in the income statement
Ebitda was equal to 7.892 million Euros (6.6% of turnover) compared to 1.054 million Euros (1.0% of turnover) as at 31 December 2014.
Ebit as at 31 December 2015 was negative amounting to 6.282 million Euros (5.2% of turnover), an improvement compared to the negative value of 372 thousand Euros (-0.4% of turnover) in the previous year.
NetfinancialexpensesFigures as at 31.12.2015
31.12.15 % of turn. 31.12.14 % of turn. Diff. %
Net financial expenses –26 0.0 –82 0.1 –68.3
Albeit with a positive net financial position, there were financial charges, amounting to 26 thousand Euros, relating to bank charges and commission.
Am
ount
s in
Eur
o/0
00
Am
ount
s in
Eur
o/0
00

Directors’ Report on Operations
ExchangedifferencesFigures as at 31.12.2015
31.12.15 % of turn. 31.12.14 % of turn. Diff. %
Exchange differences –13 –0.0 –16 –0.0 –18.8
Contributiontothenetprofit/(loss)ofCarraroSpaFigures as at 31.12.2015
31.12.15 % of turn. 31.12.14 % of turn. Diff. %
Contribution to the net profit/(loss) of Carraro Spa
5,902 4.9 –705 –0.7 n.r.
Non-recurrent costs net of the tax effect
– 912
Adjusted contribution to the net profit/(loss) of Carraro Spa
5,902 4.9 207 0.2 n.r.
2015 closed with a net profit of 5.902 million Euros (4.9% of turnover) compared to the loss of 705 thousand Euros in the previous year (-0.7% of turnover), thanks to the recov-ery of turnover and actions put in place to improve production efficiency.
Amortisation,depreciationandimpairmentoffixedassetsFigures as at 31.12.2015
31.12.15 % of turn. 31.12.14 % of turn. Diff. %
Amortisation, depreciation and impairment 1,610 1.3 1,426 1.4 12.9
InvestmentsFigures as at 31.12.2015
31.12.15 31.12.14
Investments 1,278 3,733
Am
ount
s in
Eur
o/0
00
Am
ount
s in
Eur
o/0
00
Am
ount
s in
Eur
o/0
00
Am
ount
s in
Eur
o/0
00

Annual Report 201596 – 97
Personnel
WorkforcetrendFigures as at 31.12.2015
31.12.15 31.12.14 31.12.13
Executives 3 5 4
Clerical staff 74 80 81
Factory workers 148 141 142
Temporary workers 2 49 28
Total 227 275 255

Directors’ Report on Operations
Carraro Spa
CarraroInternational Sa
100%
100%
100%
100%
100%
55.83%
44.17%
0.34%
99.66%
100%
Santerno Inc.
Santerno
India Pvt Ltd
Santerno
South Africa
Pvt Ltd
Elettronica Santerno
España Sl
Santerno
Shangai Trad Ltd
Eletronica Santerno
Industria e Comercio Ltda
ElettronicaSanterno Spa

Annual Report 201598 – 99
BUSINESS AREAElectronics
—
Santerno

Directors’ Report on Operations
SubconsolidatedIncomeStatementasat31.12.2015Business Area Electronics / Elettronica Santerno
31.12.15 % 31.12.14 % Changes
31.12.15 31.12.14
Revenues from sales 35,157 100.00% 36,633 100.00% –1,476 –4.03%
Purchases of goods and materials (net of changes in inventories)
–17,963 –51.09% –20,519 –56.01% 2,556 –12.46%
Services and Use of third-party goods and services
–11,340 –32.26% –11,120 –30.36% –220 1.98%
Personnel costs –8,414 –23.93% –11,858 –32.37% 3,444 –29.04%
Amortisation, depreciation and impairment of assets
–20,569 –58.51% –3,181 –8.68% –17,388 546.62%
Provisions for risks –1,925 –5.48% –1,076 –2.94% –849 78.90%
Other income and expenses 587 1.67% 216 0.59% 371 171.76%
Internal construction 785 2.23% 1,008 2.75% –223 –22.12%
Operating costs –58,839 –167.36% –46,530 –127.02% –12,309 26.45%
Operating profit/(loss) (Ebit) –23,682 –67.36% –9,897 –27.02% –13,785
Income from equity investments –160 –0.46% – 0.00% –160 #DIV/0!
Other financial income 76 0.22% 162 0.44% –86 –53.09%
Financial costs and expenses –1,867 –5.31% –1,136 –3.10% –731 64.35%
Net gains/(losses) on foreign exchange –780 –2.22% –364 –0.99% –416 114.29%
Value adjustments of financial assets – –0.00% – –0.00% – !
Gains/(losses) on financial assets –2,731 –7.77% –1,338 –3.65% –1,393
Profit/(loss) before taxes –26,413 –75.13% –11,235 –30.67% –15,178
Current and deferred income taxes –312 –0.89% 3,038 8.29% –3,350
Business Area consolidated result –26,725 –76.02% –8,197 –22.38% –18,528
Ebitda –3,964 –11.28% –7,005 –19.12% 3,041 –43.41%
SubconsolidatedStatementofFinancialPositionasat31.12.2015Business Area Electronics / Elettronica Santerno
31.12.15 31.12.14
Property, plant and equipment 4,706 5,270
Intangible fixed assets 9,819 27,937
Real estate investments – –
Holdings in subsidiaries and associates – –
Financial assets – –
Deferred tax assets 2,260 2,957
Trade receivables and other receivables 195 196
Non-current assets 16,980 36,360
Closing inventory 17,408 10,418
Trade receivables and other receivables 11,542 13,085
Financial assets 137 49
Am
ount
s in
Eur
o/0
00
Am
ount
s in
Eur
o/0
00

Annual Report 2015100 – 101
31.12.15 31.12.14
Cash and cash equivalents 3,092 1,683
Current assets 32,179 25,235
Total assets 49,159 61,595
Share Capital 3,000 2,500
Reserves 29,551 29,068
Foreign currency translation reserve –628 –183
Profit/loss for the year –26,725 –8,197
Minority interests – –
Shareholders’ equity 5,198 23,188
Financial liabilities 20 –
Trade payables and other payables 71 130
Deferred tax liabilities – 2
Provision for severance indemnity and retirement benefits 531 537
Provisions for risks and liabilities 51 53
Non-current liabilities 673 722
Financial liabilities 12,190 16,604
Trade payables and other payables 28,978 20,005
Current taxes payables –120 –
Provisions for risks and liabilities 2,240 1,076
Current liabilities 43,288 37,685
Total shareholders’ equity and liabilities 49,159 61,595
CashFlowasat31.12.2015Business Area Electronics / Elettronica Santerno
31.12.15 31.12.14
Opening Net Financial Position –14,667 –5,110
Group profit/(loss) –26,725 –8,197
Profit/(loss) pertaining to minorities – –
Amortisation, depreciation and impairment of fixed assets 19,718 2,892
Cash flow before Net Working Capital –7,007 –5,305
Change in Net Working Capital 3,664 1,846
Investments in fixed assets –1,074 –1,277
Disinvestments in fixed assets 8 30
Operating Free Cash Flow –4,409 –4,706
Other operating flows 1,196 –4,704
Other investing flows 30 –14
Change in Share Capital – –
Dividends paid – –
Other equity flows 8,235 –133
Free Cash Flow 5,552 –9,557
Closing Net Financial Position –9,115 –14,667
Am
ount
s in
Eur
o/0
00

Directors’ Report on Operations
AnalysisofNetWorkingCapitalasat31.12.2015Business Area Electronics / Elettronica Santerno
31.12.15 31.12.14
Trade Receivables 9,285 7,831
Inventory 17,408 10,418
Trade Payables –28,011 –15,903
Net Working Capital (NwC) –1,318 2,346
Corporatestructureasat31.12.2015Business Area Electronics / Elettronica Santerno
2015 was a year of major changes for Santerno. In the presence of a continued negative operating performance that could have jeopardised business continuity, the Group decid-ed to pursue a profound business redefinition plan, entrusting the Group CEO with di-rect responsibility for management of the company. Subsequently a far-reaching plan was initiated that included the restructuring of the commercial networks, with a reduction in the number of branch offices in the various geographical areas, a change in the product strategy, with greater emphasis on industrial applications, and greater integration with Group functions.
All this was reflected in a new business plan which reduced volume growth and fo-cussed on substantially improved margins based on a redefinition of the product portfo-lio. This resulted in a goodwill impairment charge for the Business Area amounting to 16 million Euros based on the results of the impairment test, as will be better specified in the notes to the financial statements. There were also restructuring costs amounting to 1.281 million Euros, in addition to the 2.375 million Euros in 2014.
IndustrialapplicationsItaly, always the first target market for Santerno in the field of Industrial Automation,
showed a slight recovery, although less than expected at the beginning of the year, given the ongoing situation of uncertainty and difficulty of the general economic outlook, which improved slightly in the second half of the year. Brazil was substantially stable (-0.7%), despite a decidedly depressed domestic market situation which did not facilitate the ex-pected expansion. The situation was made even more difficult by the weakening of the local currency that has made price competition even more difficult compared to local producers. There were positive signs from Central European countries, which recorded a 40% increase over the previous year, and from Asia/Far East, which recorded a 20% increase compared to 2014. Evident difficulties characterised the Iranian market, down by 50% compared to the previous year (-770 thousand Euros) and Eastern European coun-tries which, however, were affected by the decline in the Russian market caused by both the severe economic recession in that country and also by the fact that Santerno opera-tionally closed the branch at the beginning of 2015; direct sales through exports failed to
Am
ount
s in
Eur
o/0
00
Annual Report 2015102 – 103
compensate for the lack of presence in that market. Turnover, amounting to of 9.380 million Euros, was 10.4% lower than that in 2014,
amounting to 10.712 million Euros.
ServiceDuring the year the growth of service and after sales activities continued, both on pho-
tovoltaic systems implemented by Santerno, in total 4.1 GW installed worldwide, as well as on the systems of third-party suppliers no longer on the market as a result of the con-solidation which has taken place and is partly still ongoing in the industry. Turnover rea-ched 6.722 million Euros, an increase of 6.5% compared to the previous year in which it amounted to 6.308 million Euros. In 2016, it is expected that this trend will result in further growth, also due to the O&M (Operation & Maintenance) contracts acquired at the beginning of 2016.
PhotovoltaicsFor Santerno 2015 was a very difficult year: the year based its assumptions on the par-
ticipation of Santerno in the start of the second phase of the South Africa project and on the consolidation of its position in the South American market, with the acquisition of contracts, especially in Chile, where its presence had already been well established in 2014. Unfortunately, due to the postponement of the project in South Africa, which saw deliveries starting later than projected at the beginning of the year, a Euro/Rand exchange rate with unfavourable trend throughout the year and the postponement of the start of a number of projects in the remaining countries of South America, the year did not bring the expected growth.
These are the reasons for the substantial confirmation of the level of turnover, which went from 19.7 million Euros in 2014 to 19.0 million Euros in 2015, with a contraction of around 2%, and profitability which was unfortunately affected by sub-optimal profi-tability of the contracts in progress in South Africa. Nevertheless, the ability of Santerno to remain one of the most respected manufacturers of utility scale photovoltaic inverters and the consolidation of business relations with some of the biggest investors in the sector enabled Santerno to acquire a very significant order and offer backlog for 2016 and 2017, consolidating the relationship with the leading Italian and worldwide investor and also initiating commercial relations with foreign EPC Contractors operating in emerging mar-kets which offer interesting future business development opportunities.
Elettronica Santerno closed the year with a total turnover of 35.157 million Euros, a de-crease of approximately 1.476 million Euros (-4.0%) compared to the previous year which stood at 36.633 million Euros
Margins were significantly affected by the drastic decline in volumes and by the extra-ordinary charges related to the reorganisation process.
Ebitda as at 31 December 2015 was negative amounting to 3.964 million Euros (-11.3% of turnover), compared to the negative figure of 7.005 million Euros (-19.1 % of turnover)

Directors’ Report on Operations
as at 31 December 2014. Net of non-recurrent costs, Ebitda would have been equal to -2.683 million Euros (-7.6% of turnover). Ebit was negative, equal to 23.682 million Eu-ros (-67.4% of turnover) compared to the negative value of 9.897 million Euros (-27.0% of turnover) in 2014. Net of non-recurring costs, Ebit would have been negative at 5.515 million Euros (-15.7% of turnover).
2015 closed with a loss of 26.725 million Euros (-76.0% of turnover), following a loss of 8.197 million Euros (-22.4% of turnover) in 2014. Net of non-recurring costs, this figure would have been negative at 8.735 million Euros (-24.8% of turnover).
The net financial position as at 31 December 2015 was negative at 9.115 million Euros, an improvement compared to the 14.667 million Euros as at 31 December 2014 and at 30 June 2015, when it stood at -17.812 due to the waiver of the financial receivable by the parent Carraro International, converted into a capital increase.
TurnoverTurnover as at 31 December 2015 amounted to 35.157 million Euros, down by approx-
imately 1.5 million Euros (-4.0%) compared to the previous year, when it was equal to 36.633 million Euros.
A breakdown of turnover between sales to third parties and intra-group is provided below:
Sales Sales to third parties Intra-group sales
31.12.15 31.12.14 Diff % 31.12.15 31.12.14 Diff % 31.12.15 31.12.14 Diff %
Electronics 35,157 36,633 –4.0 35,146 36,542 –3.8 11 91 –87.9
The following table breaks down turnover from third parties by geographical area:
Geographical Area 31.12.15 % 31.12.14 % Diff. % ‘15-’14
South America 11,065 31.5 15,579 42.6 –29.0
South Africa 11,387 32.4 797 2.2 n.r.
North America 1,207 3.4 3,050 8.3 –60.4
Europe 1,970 5.7 2,460 6.7 –19.9
Asia 957 2.7 4,274 11.7 –11.8
Other 1,277 3.6 2,126 5.8 –40.0
Total Abroad 27,863 79.3 28,284 77.4 –1.5
Italy 7,283 20.7 8,258 22.6 –11.8
Total 35,146 100.0 36,542 100.0 –4.0
The Italian market accounted for 20.7% of total turnover (in the previous three-year period it was 62.4% in 2012, 17.6% in 2013 and 22.6% in 2014). The most significant foreign markets in 2015 were South Africa (32.4% of sales) and South (with a total of ap-proximately 11.1 million Euros – of which 8.3 million in Chile and 2.6 million in Brazil), which accounted for 31.5% of total sales. Globally, foreign markets account for 79.3% of total turnover of the business area.
Am
ount
s in
Eur
o/0
00
Am
ount
s in
Eur
o/0
00
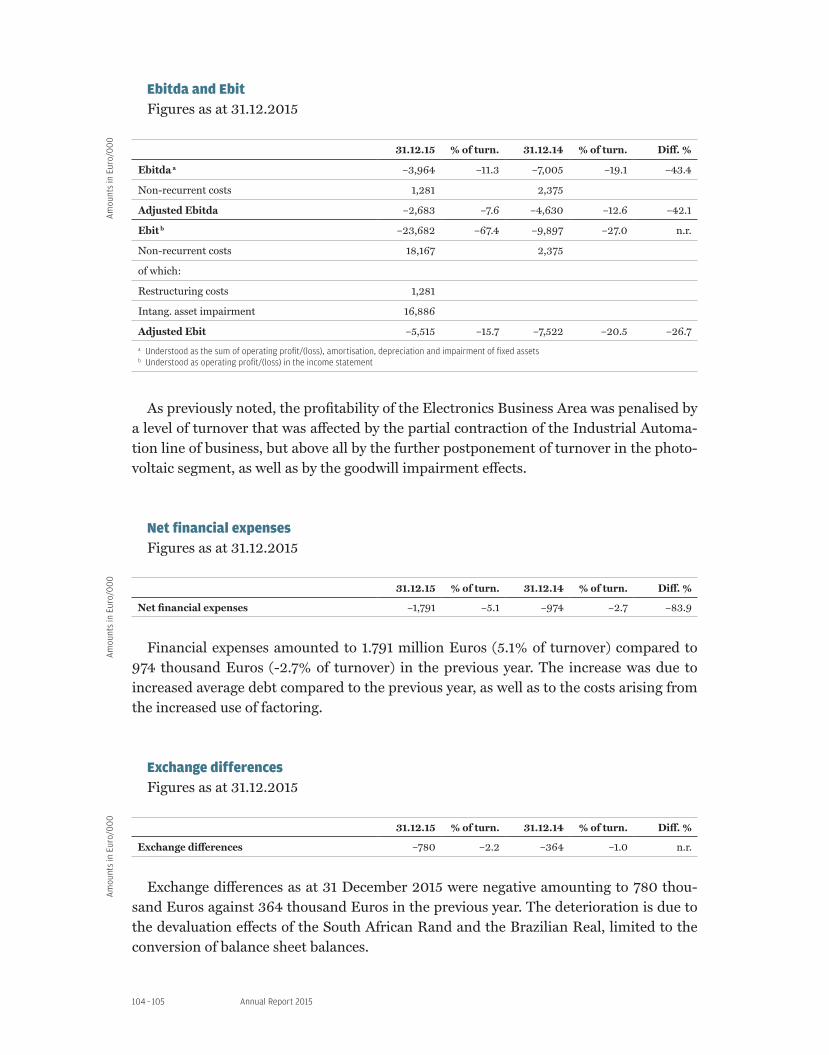
Annual Report 2015104 – 105
EbitdaandEbitFigures as at 31.12.2015
31.12.15 % of turn. 31.12.14 % of turn. Diff. %
Ebitda a –3,964 –11.3 –7,005 –19.1 –43.4
Non-recurrent costs 1,281 2,375
Adjusted Ebitda –2,683 –7.6 –4,630 –12.6 –42.1
Ebit b –23,682 –67.4 –9,897 –27.0 n.r.
Non-recurrent costs 18,167 2,375
of which:
Restructuring costs 1,281
Intang. asset impairment 16,886
Adjusted Ebit –5,515 –15.7 –7,522 –20.5 –26.7
a Understood as the sum of operating profit/(loss), amortisation, depreciation and impairment of fixed assetsb Understood as operating profit/(loss) in the income statement
As previously noted, the profitability of the Electronics Business Area was penalised by a level of turnover that was affected by the partial contraction of the Industrial Automa-tion line of business, but above all by the further postponement of turnover in the photo-voltaic segment, as well as by the goodwill impairment effects.
NetfinancialexpensesFigures as at 31.12.2015
31.12.15 % of turn. 31.12.14 % of turn. Diff. %
Net financial expenses –1,791 –5.1 –974 –2.7 –83.9
Financial expenses amounted to 1.791 million Euros (5.1% of turnover) compared to 974 thousand Euros (-2.7% of turnover) in the previous year. The increase was due to increased average debt compared to the previous year, as well as to the costs arising from the increased use of factoring.
ExchangedifferencesFigures as at 31.12.2015
31.12.15 % of turn. 31.12.14 % of turn. Diff. %
Exchange differences –780 –2.2 –364 –1.0 n.r.
Exchange differences as at 31 December 2015 were negative amounting to 780 thou-sand Euros against 364 thousand Euros in the previous year. The deterioration is due to the devaluation effects of the South African Rand and the Brazilian Real, limited to the conversion of balance sheet balances.
Am
ount
s in
Eur
o/0
00
Am
ount
s in
Eur
o/0
00
Am
ount
s in
Eur
o/0
00

Directors’ Report on Operations
Netprofit/(loss)Figures as at 31.12.2015
31.12.15 % of turn. 31.12.14 % of turn. Diff. %
Net profit/(loss) –26,725 –76.0 –8,197 –22.4 n.r.
Non-recurrent costs net of the tax effect 17,990 1,737
Adjusted net profit/(loss) –8,735 –24.8 –6,460 –17.6 –35.2
2015 closed with a loss of 26.725 million Euros (-76.0% of turnover), compared to the loss of 8.197 million Euros (-22.4% of turnover) posted in 2014. Net of non-recurring costs, this figure would have been negative at 8.735 million Euros (-24.8% of turnover).
Amortisation,depreciationandimpairmentoffixedassetsFigures as at 31.12.2015
31.12.15 % of turn. 31.12.14 % of turn. Diff. %
Depreciation and amortisation 2,832 8.1 2,892 7.9 –2.1
Asset impairment 16,886 48.0 – – –
Depreciation for the year was substantially in line with the previous year. Asset impai-rment mainly relates to the impairment of amounting to 16 million Euros and to other intangible assets.
InvestmentsFigures as at 31.12.2015
31.12.15 31.12.14
Investments 1,074 1,277
In 2015, investments for 1.074 million Euros (3.1% of turnover) were made, compared to 1.277 million Euros (3.4% of turnover) in testing systems and instruments to expand production capacity and basic software, patents and R&D projects for the development of new products.
ResearchandinnovationIn 2015 total research and innovation costs amounted to 1.627 million Euros compared
to costs of 1.955 million Euros incurred in 2014.
Am
ount
s in
Eur
o/0
00
Am
ount
s in
Eur
o/0
00
Am
ount
s in
Eur
o/0
00

Annual Report 2015106 – 107
NetfinancialpositionFigures as at 31.12.2015
31.12.15 30.09.15 30.06.15 31.12.14
Net financial position* –9,115 –17,796 –17,812 –14,667
* Understood as the sum of amounts payable to banks, short-, medium- and long-term bonds and loans, net of cash and cash equivalents, negotiable securities and financial receivables
The net financial position as at 31 December 2015 was negative amounting to 9.115 mil-lion Euros, improving compared to the figure of 14.667 million Euros as at 31 December 2014 due to the conversion of the financial receivable of the parent Carraro International into a capital increase amounting to 9 million Euros.
Personnel
WorkforcetrendFigures as at 31.12.2015
31.12.15 31.12.14 31.12.13
Executives 3 4 9
Clerical staff 138 136 182
Factory workers – – –
Temporary workers – – 1
Total 141 140 192
The number of employees as at 31 December 2015, equal to 141 units, was substantially unchanged compared to 31 December 2014. The only point worthy of note was the termi-nation of employment of the General Manager of Santerno Brazil.
During 2015 Elettronica Santerno Spa did not resort to the redundancy fund. Further restructuring is planned for 2016 that will involve both Italy and the Brazilian
branch.
Am
ount
s in
Eur
o/0
00
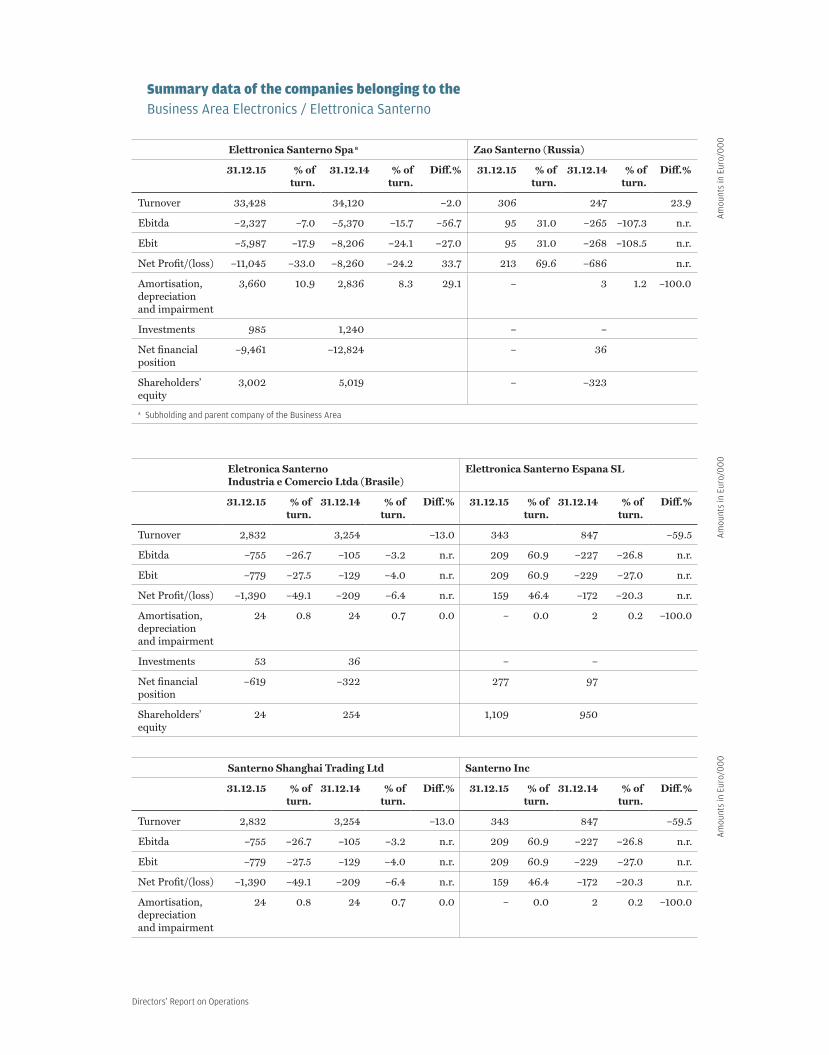
Directors’ Report on Operations
SummarydataofthecompaniesbelongingtotheBusiness Area Electronics / Elettronica Santerno
Elettronica Santerno Spa a Zao Santerno (Russia)
31.12.15 % of turn.
31.12.14 % of turn.
Diff.% 31.12.15 % of turn.
31.12.14 % of turn.
Diff.%
Turnover 33,428 34,120 –2.0 306 247 23.9
Ebitda –2,327 –7.0 –5,370 –15.7 –56.7 95 31.0 –265 –107.3 n.r.
Ebit –5,987 –17.9 –8,206 –24.1 –27.0 95 31.0 –268 –108.5 n.r.
Net Profit/(loss) –11,045 –33.0 –8,260 –24.2 33.7 213 69.6 –686 n.r.
Amortisation, depreciation and impairment
3,660 10.9 2,836 8.3 29.1 – 3 1.2 –100.0
Investments 985 1,240 – –
Net financial position
–9,461 –12,824 – 36
Shareholders’ equity
3,002 5,019 – –323
a Subholding and parent company of the Business Area
Eletronica SanternoIndustria e Comercio Ltda (Brasile)
Elettronica Santerno Espana SL
31.12.15 % of turn.
31.12.14 % of turn.
Diff.% 31.12.15 % of turn.
31.12.14 % of turn.
Diff.%
Turnover 2,832 3,254 –13.0 343 847 –59.5
Ebitda –755 –26.7 –105 –3.2 n.r. 209 60.9 –227 –26.8 n.r.
Ebit –779 –27.5 –129 –4.0 n.r. 209 60.9 –229 –27.0 n.r.
Net Profit/(loss) –1,390 –49.1 –209 –6.4 n.r. 159 46.4 –172 –20.3 n.r.
Amortisation, depreciation and impairment
24 0.8 24 0.7 0.0 – 0.0 2 0.2 –100.0
Investments 53 36 – –
Net financial position
–619 –322 277 97
Shareholders’ equity
24 254 1,109 950
Santerno Shanghai Trading Ltd Santerno Inc
31.12.15 % of turn.
31.12.14 % of turn.
Diff.% 31.12.15 % of turn.
31.12.14 % of turn.
Diff.%
Turnover 2,832 3,254 –13.0 343 847 –59.5
Ebitda –755 –26.7 –105 –3.2 n.r. 209 60.9 –227 –26.8 n.r.
Ebit –779 –27.5 –129 –4.0 n.r. 209 60.9 –229 –27.0 n.r.
Net Profit/(loss) –1,390 –49.1 –209 –6.4 n.r. 159 46.4 –172 –20.3 n.r.
Amortisation, depreciation and impairment
24 0.8 24 0.7 0.0 – 0.0 2 0.2 –100.0
Am
ount
s in
Eur
o/0
00
Am
ount
s in
Eur
o/0
00
Am
ount
s in
Eur
o/0
00
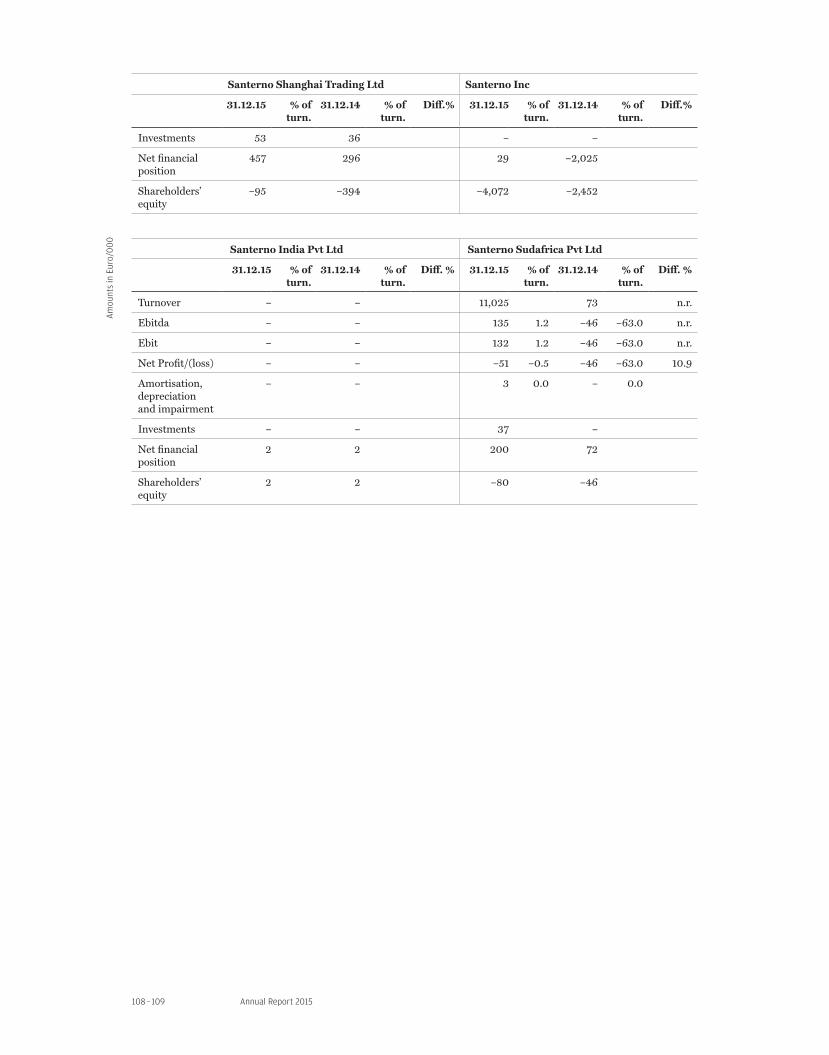
Annual Report 2015108 – 109
Santerno Shanghai Trading Ltd Santerno Inc
31.12.15 % of turn.
31.12.14 % of turn.
Diff.% 31.12.15 % of turn.
31.12.14 % of turn.
Diff.%
Investments 53 36 – –
Net financial position
457 296 29 –2,025
Shareholders’ equity
–95 –394 –4,072 –2,452
Santerno India Pvt Ltd Santerno Sudafrica Pvt Ltd
31.12.15 % of turn.
31.12.14 % of turn.
Diff. % 31.12.15 % of turn.
31.12.14 % of turn.
Diff. %
Turnover – – 11,025 73 n.r.
Ebitda – – 135 1.2 –46 –63.0 n.r.
Ebit – – 132 1.2 –46 –63.0 n.r.
Net Profit/(loss) – – –51 –0.5 –46 –63.0 10.9
Amortisation, depreciation and impairment
– – 3 0.0 – 0.0
Investments – – 37 –
Net financial position
2 2 200 72
Shareholders’ equity
2 2 –80 –46
Am
ount
s in
Eur
o/0
00
Directors’ Report on Operations
Key Risks and Uncertaintiesto which Carraro Spa and the Group are exposed
RisksassociatedwiththegeneraleconomicconditionsThe Group’s financial, capital and borrowing situation is influenced by various factors
within the general macro-economic framework, such as changes to the gross national pro-duct, the state of the agricultural and construction industries, the cost of raw materials and the level of business confidence in the various countries in which the Group operates.
Also in 2015 the dynamics of the global economy and international trade were cha-racterised by instability, albeit with some signs of recovery, also in Italy, particularly in the second half.
The outlook for 2016 is for an improvement compared to the previous year in advan-ced countries, but the weakness of emerging economies is hindering the development of global trade and contributing to a reduction in raw material prices. The global outlook for 2016 is for a modest acceleration, even though significant new turmoil in the financial markets in China, due to concerns regarding the economic growth of the country, and in Europe with particular focus on the banking segment whose solidity is being questioned, emerged at the beginning of the year.
Significant risks for 2016 remain, including the possibility of a slowdown in emerging economies which may be more pronounced and long-lasting than hitherto assumed, with a major impact on financial markets. In Italy, the greatest risks derive from the financial sector which is currently in the spotlight for the fragility of the domestic and European banking system in general.
RiskshavinganeffectontheGroup’sresultsSignificant macro-economic events, such as a generalised and significant increase in
the prices of raw materials, a significant fall in demand in one of the key markets of the Group, enduring uncertainty and volatility of the financial and capital markets, falling interest rates and unfavourable changes in the exchange rates of the major currencies to which the Group is exposed are all negative factors for the Group’s operations and future, as well as its economic results and its financial position. Group’s profitability is affected by the risk of insolvency of its counterparties, as well as the general economic conditions of the country in which the Group carries out its industrial and commercial operations.
RisksassociatedwithfundingrequirementsThe Group’s liquidity risk is mainly linked to the activation and maintenance of suffi-
cient funding to support industrial operations. The raising of funds, consistent with the Group’s short- and medium-term development plans, is intended to finance both the wor-king capital and investments in fixed assets necessary to ensure sufficient and technologi-cally advanced production capacity. This requirement is directly proportional to the trend in customer orders and the consequent trend in business volumes.

Annual Report 2015110 – 111
The cash flows envisaged for 2016 include, besides the trend in working capital and investments, the effects of current liabilities and the short-term portions of medium- and long-term loans reaching maturity, as well as the effects (assuming the same rates of exchange with compared to 31.12.2015) of the closure of derivative financial instruments on currencies in existence at the reporting date.
The Group envisages meeting the needs arising from all of the above with the flows deriving from operations, available liquidity, the disposal of assets no longer considered strategic and the availability of additional credit facilities.
In view of the trend in sales volumes and the continuation of activities aimed at the re-duction of production inefficiencies, it is expected that the Group will be able to generate financial resources from operations such as to ensure adequate support for investment.
The management of liquidity, funding requirements and cash flows are under the direct control and management of the Group Treasury, which operates with the aim of managing the resources available as efficiently as possible.
Tensions on the Italian government bonds market and uncertainties of financial mar-kets have had an effect on the borrowing of banks and as a consequence on credit granted to businesses. This instability could also continue in 2016, preventing the normal execu-tion of financial transactions.
Lastly, regardless of the fact that the Group has continued refinancing its debts with the support of its banking counterparties and the financial markets, the situation could arise of having to seek additional financing in less favourable market conditions, with the limited availability of such sources and an increase in financial expenses.
RisksrelatingtofluctuatingexchangeandinterestratesThe Group is exposed to exchange rate risks by virtue of the fact that a significant por-
tion of sales and some of the purchases are made in currencies other than the Group’s functional currency, with trade transactions carried out by companies in the Euros area with counterparties that do not belong to the Euros area and vice versa.
Another aspect of exchange rate risk is the fact that several Group companies present their financial statements in currencies other than the Group’s functional currency.
Exposure to exchange rate risk with reference to each entity is regularly monitored by the Group Treasury according to a strategy which focuses, in particular, on the balance between purchases and sales in foreign currency and activating, for the remaining non-balanced portion and according to the criteria set by the company policy in terms of the management of financial risks, appropriate initiatives to hedge or reduce the risks identi-fied, using the instruments available on the market.
The Group is also exposed to interest rate risks in relation to financial liabilities as-sumed to fund either normal operations or, where applicable, the Group’s expansion by acquisitions. Changes in interest rates may have positive or negative effects on both the financial outcome and on cash flows.
The strategy adopted pursues the basic objective of achieving a balance between floa-ting-rate and fixed-rate debt. The interest rate risk on the floating portion is then reduced via specific hedging operations.
Directors’ Report on Operations
CreditriskThe Group includes among its customers leading international manufacturers of agri-
cultural machinery, construction equipment vehicles, industrial vehicles and light power tools as well as renewable energy producers, and designers and installers of photovoltaic systems. The risk concentration is associated with the size of these customers, which on a global context is on average high, yet balanced by the fact that credit exposure is distri-buted across a complex network of counterparties active in several geographic segments.
The management of credit is designed to prioritise the acquisition of customers of na-tional and international standing for multi-annual supplies; on this basis consolidated historical relationships have been built up with the main customers. Generally speaking, these relationships are governed by ad hoc supply contracts. Credit control requires perio-dic monitoring of the main financial and economic data (including the delivery schedules) relating to each customer.
Except in special circumstances to do with country or counterparty risk, guarantees are not normally obtained on credit.
Receivables are recognised in the accounts net of any write-downs determined by asses-sing the counterparty’s risk of insolvency based on the information available.
CountryriskThe Carraro Group operates in different countries and its exposure to them has gra-
dually increased over the years. On these markets, unstable economic-political conditions occur on a cyclical basis (for example in Argentina) that have had an impact and could negatively affect the financial situation and economic performance of the Group. A global presence is fundamental for the Group, encompassing a strategy serving clients and sei-zing opportunities on new markets for its product range.
EnvironmentalrisksThe Group operates across 10 manufacturing sites in 5 different nations.The manufacturing processes carried out at the Group’s industrial sites are essentially
mechanical processing of iron and steel and assembly of purchased components.These processes have accessory materials such as packaging, lubricants, paints and sol-
vents. The objective of limiting the impact of emissions into the environment has seen a significant improvement from 2008 onwards through an important investment in mo-ving from solvent-based coatings to water-based paints that reduce atmospheric emis-sions to zero.
Each site operates in compliance with local environmental regulations. Moreover the management pays continual attention to environmental issues adopting all the applica-tions that current technology has made available to reduce the risks of pollution.
In specific terms, activities continued to obtain Environmental Certification in accor-dance with the criteria of ISO 14001 in all of the Group’s facilities.
Particular attention has been paid to increasing the efficiency of processes in order to maximise energy savings.
Annual Report 2015112 – 113
In choices for the allocation of production and in making make/buy decisions the va-riable of the optimisation of transport has also been considered from a viewpoint of eco-sustainability and the reduction of CO2 emissions in line with the Group’s mission.
Transactions with related parties
Transactions with related parties carried out during the period gave rise to relationships of a commercial, financial or advisory nature and were expedited at market terms, in the economic interest of the individual companies involved in the transactions.
No transactions were carried out that were atypical or unusual with compared to nor-mal business operations, with the exception of the conferment of the business arm of Agritalia Spa to Carraro Spa, and the interest rates and terms applied to and by the com-panies in their reciprocal financial relationships are in line with market terms.
For detailed information, as required by Art. 2497-bis of the Civil Code, section 5, on transactions carried out with related parties, see the Explanatory Notes to the Individual Financial Statements.
Standards used in preparingthe Consolidated Financial Statements
The present financial statements are drawn up in compliance with the International Financial Reporting Standards (Ifrs) issued by the International Accounting Standard Board (“Iasb”) and endorsed by the European Union in accordance with Regulation no. 1606/2002 and with the provisions issued in implementation of Art. 9 of Italian Legisla-tive Decree no. 38/2005. Furthermore, these financial statements are based on the as-sumption that the company is a going concern.
Other information
With reference to the provisions of Articles 36 and 39 of Consob Regulation 16191 of 29/10/2007 (the so-called “Market Regulations”) and of Art. 2.6.2 paragraph 15 of the Stock Exchange Regulations we can confirm that the parent company Carraro Spa. meets the conditions required by points a), b) and c) of paragraph 1 of the aforementioned Art. 36 on the subject of accounting situations, articles of association, corporate bodies and

Directors’ Report on Operations
administrative and accounting control of its subsidiaries incorporated and regulated in countries that do not belong to the European Union.
The Group perimeter includes 20 companies of which 11 are established and regulated in non-European Union countries, specifically in Argentina, Brazil, China, India, Russia, South Africa and the United States; of these, 3, in Argentina, China and India, are signi-ficant under the terms of Title VI, Section II of the Issuer Regulations (Consob resolution 11971/1999).
For more complete disclosure on the system of corporate governance of Carraro Spa and its ownership structures, as required by Article 123-bis of Legislative Decree 58 of 24 February 1998, (Consolidated Finance Act – TUF), see the “Report on Corporate Gover-nance”, which can be consulted on the company’s website www.carraro.com, under the investor relations/corporate governance section, prepared under the terms of Article 89-bis of the Consob Issuers’ Regulations.
Reporting obligations pursuant to article 114,paragraph 5 of Italian Legislative Decree No. 58/1998
The information below is provided in compliance with Consob requirement no. 0075995/15 of 1 October 2015.
1.NetfinancialpositionofCarraroSpaandtheGroup,indicatingshort-termcomponentsseparatelyfrommedium-/long-termcomponents
Net financial position as at 31 December 2015 Carraro Spa Consolidated
Non-current loans payable 16,408 180,322
Current loans payable 128,366 133,645
Other non-current financial liabilities – –156
Other non-current financial liabilities 159 1,694
Financial liabilities: 144,933 315,503
Non-current loans and receivables –5,626 –8,668
Current loans and receivables –90 –7,731
Other non-current financial assets –21 –131
Other current financial assets –9 –432
Financial assets: –5,746 –16,962
Cash –66 –110
Bank current accounts and deposits –428 –70,648
Cash and cash equivalents: –493 –70,758
Net financial position 138,694 227,783
of which payables / (receivables):
- non-current 10,761 171,367
- current 127,933 56,416
Am
ount
s in
Eur
o/0
00

Annual Report 2015114 – 115
2.PositionofoutstandingpayablesofCarraroSpaandtheGroup,brokendownbynature(financial,commercial,taxes,welfarecontributionsandtoemployees),andrelativeactionsofcreditors(promptsforpayment,injunctions,suspendedsupplies,etc.)
Carraro Spa
Not yet due Past due
1 - 30 days 31 - 60 days 61 - 90 gg > 91 days Total
Trade payables 41,550 72 1,336 762 669 44,389
Other payables 7,797 – – – – 7,797
Total 49,347 72 1,336 762 669 52,186
Consolidated
Not yet due Past due
1 - 30 days 31 - 60 days 61 - 90 days > 91 days Total
Trade payables 146,679 9,719 2,354 1,521 7,010 167,283
Other payables 24,566 – – – 5 24,571
Total 171,245 9,719 2,354 1,521 7,015 191,854
The current payables of Carraro Spa to third parties and Group companies as at 31 De-cember 2015 totalled 52.186 million Euros of which 7.797 million Euros referred to other Payables (taxes, welfare contributions, to employees,…) due after the reporting period. Outstanding trade payables amounted to 2.839 million Euros.
The current payables of the Carraro Group as at 31 December 2015 amounted to 191.854 million Euros of which 24.571 million Euros referred to other Payables (taxes, welfare contributions, to employees,…) due after the reporting period. Outstanding trade payables amounted to 20.604 million Euros, of which 9.719 million Euros due within 30 days, mainly paid the following month, while those over 90 days mainly refer to non-compliant consignments under negotiation.
3.Related-partytransactionsofCarraroSpaandtheGroup
The most significant economic transactions of Carraro Spa with related parties concern business transactions for the purchase and sale of raw materials, semi-finished products and components relative to the production of drive systems; purchases of services refer mainly to services for industrial processing. The main sales of services include amounts charged for the utilisation of central information systems and the organisational support provided by the Parent Company in the various operating areas. Fees and royalties refer to specific commercial agency agreements and the sale of rights to use industrial know-how.
Interest income is generated by outstanding loans; interest expense is generated by the loan received from Carraro International.
The income and expenses from tax consolidation refer to the remuneration paid for taxa-ble income and losses transferred in the context of the tax consolidation under Finaid Spa.
Financial transactions relate to short and long-term loans.
Am
ount
s in
Eur
o/0
00
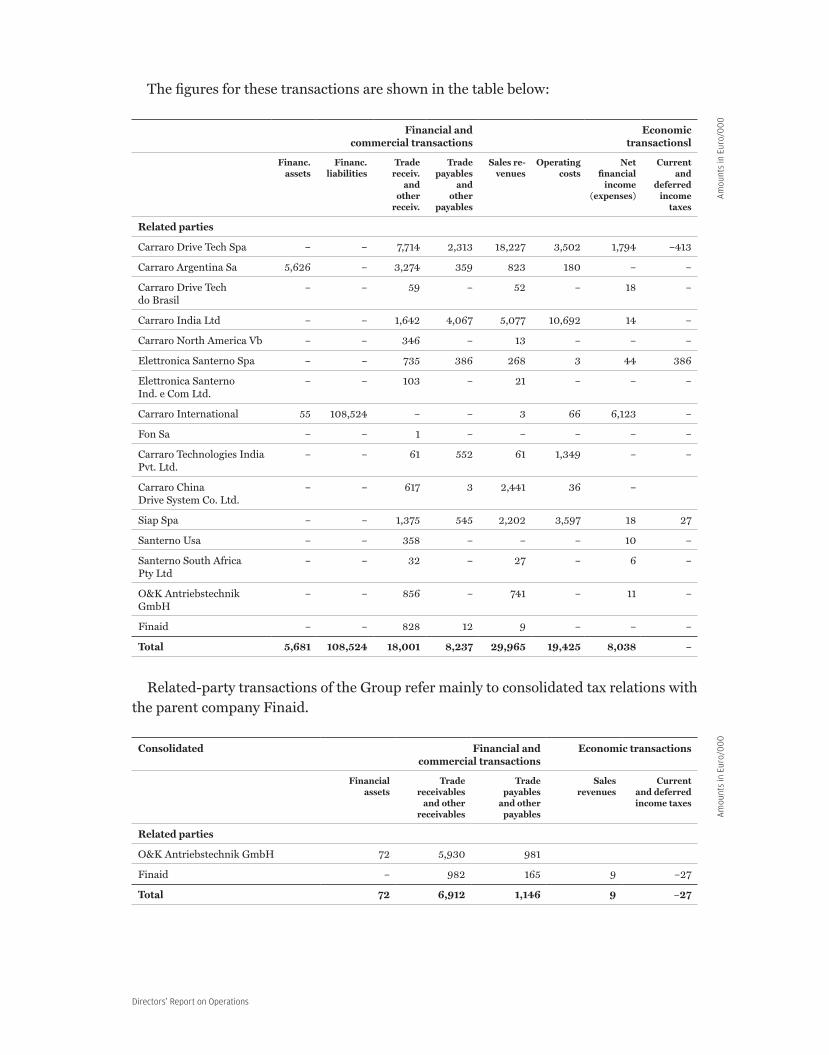
Directors’ Report on Operations
The figures for these transactions are shown in the table below:
Financial and commercial transactions
Economic transactionsl
Financ.assets
Financ. liabilities
Trade receiv.
and other
receiv.
Trade payables
and other
payables
Sales re-venues
Operating costs
Net financial
income (expenses)
Current and
deferred income
taxes
Related parties
Carraro Drive Tech Spa – – 7,714 2,313 18,227 3,502 1,794 –413
Carraro Argentina Sa 5,626 – 3,274 359 823 180 – –
Carraro Drive Tech do Brasil
– – 59 – 52 – 18 –
Carraro India Ltd – – 1,642 4,067 5,077 10,692 14 –
Carraro North America Vb – – 346 – 13 – – –
Elettronica Santerno Spa – – 735 386 268 3 44 386
Elettronica Santerno Ind. e Com Ltd.
– – 103 – 21 – – –
Carraro International 55 108,524 – – 3 66 6,123 –
Fon Sa – – 1 – – – – –
Carraro Technologies India Pvt. Ltd.
– – 61 552 61 1,349 – –
Carraro China Drive System Co. Ltd.
– – 617 3 2,441 36 –
Siap Spa – – 1,375 545 2,202 3,597 18 27
Santerno Usa – – 358 – – – 10 –
Santerno South Africa Pty Ltd
– – 32 – 27 – 6 –
O&K Antriebstechnik GmbH
– – 856 – 741 – 11 –
Finaid – – 828 12 9 – – –
Total 5,681 108,524 18,001 8,237 29,965 19,425 8,038 –
Related-party transactions of the Group refer mainly to consolidated tax relations with the parent company Finaid.
Consolidated Financial and commercial transactions
Economic transactions
Financial assets
Trade receivables
and other receivables
Trade payables
and other payables
Sales revenues
Current and deferred income taxes
Related parties
O&K Antriebstechnik GmbH 72 5,930 981
Finaid – 982 165 9 –27
Total 72 6,912 1,146 9 –27
Am
ount
s in
Eur
o/0
00
Am
ount
s in
Eur
o/0
00
Annual Report 2015116 – 117
4.Failuretocomplywithcovenants,negativepledgesandanyotherdebtclauseoftheGroupentailinglimitsontheuseoffinancialresources,withindicationofthelevelofcompliancewiththeseclauses(updated)
As at 31 December 2015, there was no failure to comply with the covenants, negative pledges or other clauses since the new agreement signed on 24 December 2015 with the banks updated the reference parameters (net financial debt/Ebitda and net financial debt/net equity) based on the results of the New Business Plan 2015-19 and having esta-blished the first monitoring date as 31 December 2016.
5.Implementationstatusofanyindustrialandfinancialplans,withindicationofdeviationsoffinaldatafromestimateddata
On 18 December 2015, the Board of Directors approved the New 2016-2019 Plan which includes extraordinary operations to consolidate assets and debt rescheduling to meet the Group’s new requirements. As regards the first point, on 26 October 2015, the holding Finaid Spa signed an agreement for the sale of approximately 18% of shares to an inde-pendent investor and a shareholders’ agreement for the new partner to participate in the operation to increase the share capital of Carraro Spa planned for 2016. With reference to the second point, the Group signed an agreement with the main reference banks in support of the Plan. This agreement provides for the rescheduling of the repayment plan of medium and long-term loans, the confirmation of short-term credit lines to support current operations and the redefinition of the covenants in line with the new Plan.

Directors’ Report on Operations
Statement of reconciliation of consolidatednet profit/(loss) and shareholders’ equitywith the net profit/(loss) and shareholders’ equityof the parent company
The following statement illustrates the reconciliation of the consolidated net income and shareholders’ equity as disclosed in the Consolidated Financial Statements and the net income and shareholders’ equity disclosed in the Financial Statements of Carraro Spa:
Items Net profit/(loss) for the
period
Shareholders’ equity for the
period
Net profit/(loss) for
the previous year
Shareholders’ equity for the previous year
Net profit/(loss) and shareholders’ equity of Carraro Spa
–3,849 21,494 –6,497 26,320
Net profit/(loss) and shareholders’ equity of subsidiaries
–15,074 220,108 4,636 251,769
Aggregate –18,923 241,602 –1,861 278,089
Elimination of carrying amount of subsidiaries 40,973 –246,895 1,774 –292,226
Consolidation adjustments –31,155 36,316 –7,754 55,344
Profit and shareholders’ equity –9,105 31,023 –7,841 41,207
Recognition of minority interests 191 –2,658 –72 –2,848
Profit and shareholders’ equity of the Group
–8,914 28,365 –7,913 38,359
The information required by Article 79 of the Issuers’ Regulations (information on the equity investments in the Parent Company Carraro Spa and its subsidiaries held by direc-tors, statutory auditors and …omitted…) is set forth in a specific statement annexed to the Explanatory Notes to the Financial Statements to which this Report refers.
Am
ount
s in
Eur
o/0
00
Annual Report 2015118 – 119
Proposal to allocate the loss for financial year 2015
Dear Shareholders,The Financial Statements of Carraro Spa as at 31 December 2015, which we invite you
to approve as presented, closed with a loss of 3,849,336 Euros which we propose to enti-rely carry forward.
ENRICO CARRARO
Chairman

Consolidated Financial Statements

Annual Report 2015120 – 121
CONSOLIDATED FINANCIAL STATEMENTSas at 31 December 2015
—
Statements
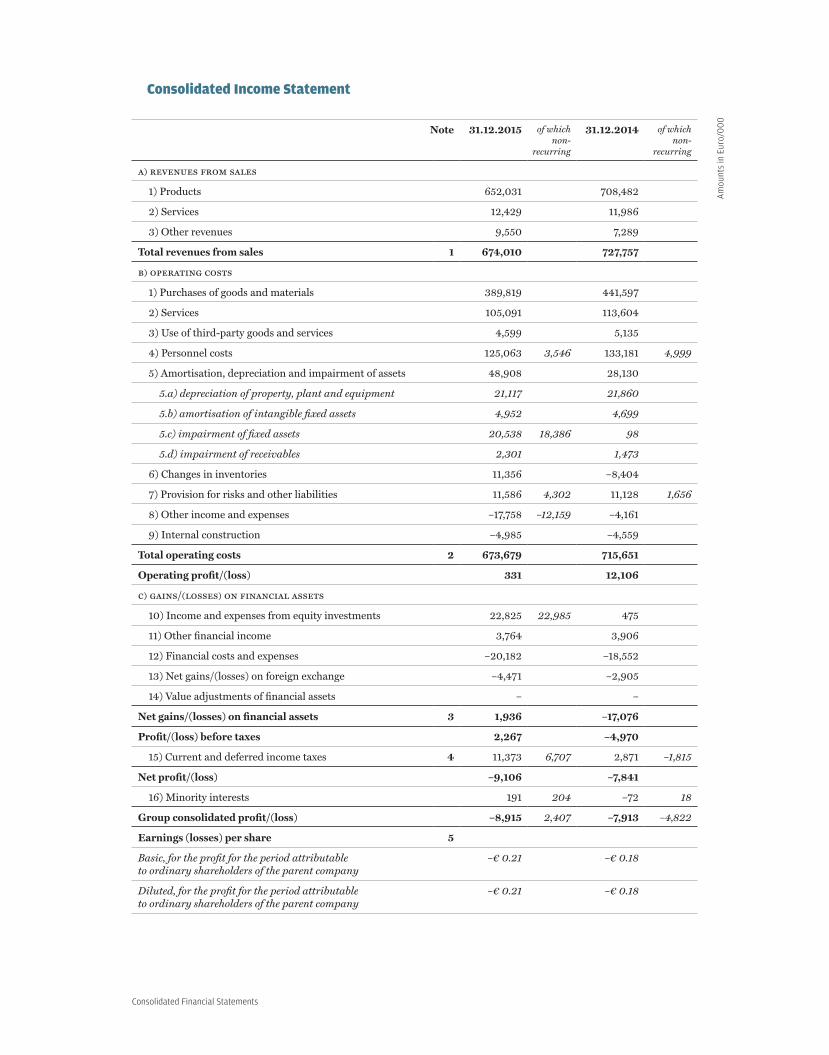
Consolidated Financial Statements
ConsolidatedIncomeStatement
Note 31.12.2015 of which non-
recurring
31.12.2014 of which non-
recurring
a) revenues from sales
1) Products 652,031 708,482
2) Services 12,429 11,986
3) Other revenues 9,550 7,289
Total revenues from sales 1 674,010 727,757
b) operating costs
1) Purchases of goods and materials 389,819 441,597
2) Services 105,091 113,604
3) Use of third-party goods and services 4,599 5,135
4) Personnel costs 125,063 3,546 133,181 4,999
5) Amortisation, depreciation and impairment of assets 48,908 28,130
5.a) depreciation of property, plant and equipment 21,117 21,860
5.b) amortisation of intangible fixed assets 4,952 4,699
5.c) impairment of fixed assets 20,538 18,386 98
5.d) impairment of receivables 2,301 1,473
6) Changes in inventories 11,356 –8,404
7) Provision for risks and other liabilities 11,586 4,302 11,128 1,656
8) Other income and expenses –17,758 –12,159 –4,161
9) Internal construction –4,985 –4,559
Total operating costs 2 673,679 715,651
Operating profit/(loss) 331 12,106
c) gains/(losses) on financial assets
10) Income and expenses from equity investments 22,825 22,985 475
11) Other financial income 3,764 3,906
12) Financial costs and expenses –20,182 –18,552
13) Net gains/(losses) on foreign exchange –4,471 –2,905
14) Value adjustments of financial assets – –
Net gains/(losses) on financial assets 3 1,936 –17,076
Profit/(loss) before taxes 2,267 –4,970
15) Current and deferred income taxes 4 11,373 6,707 2,871 –1,815
Net profit/(loss) –9,106 –7,841
16) Minority interests 191 204 –72 18
Group consolidated profit/(loss) –8,915 2,407 –7,913 –4,822
Earnings (losses) per share 5
Basic, for the profit for the period attributable to ordinary shareholders of the parent company
–€ 0.21 –€ 0.18
Diluted, for the profit for the period attributable to ordinary shareholders of the parent company
–€ 0.21 –€ 0.18
Am
ount
s in
Eur
o/0
00
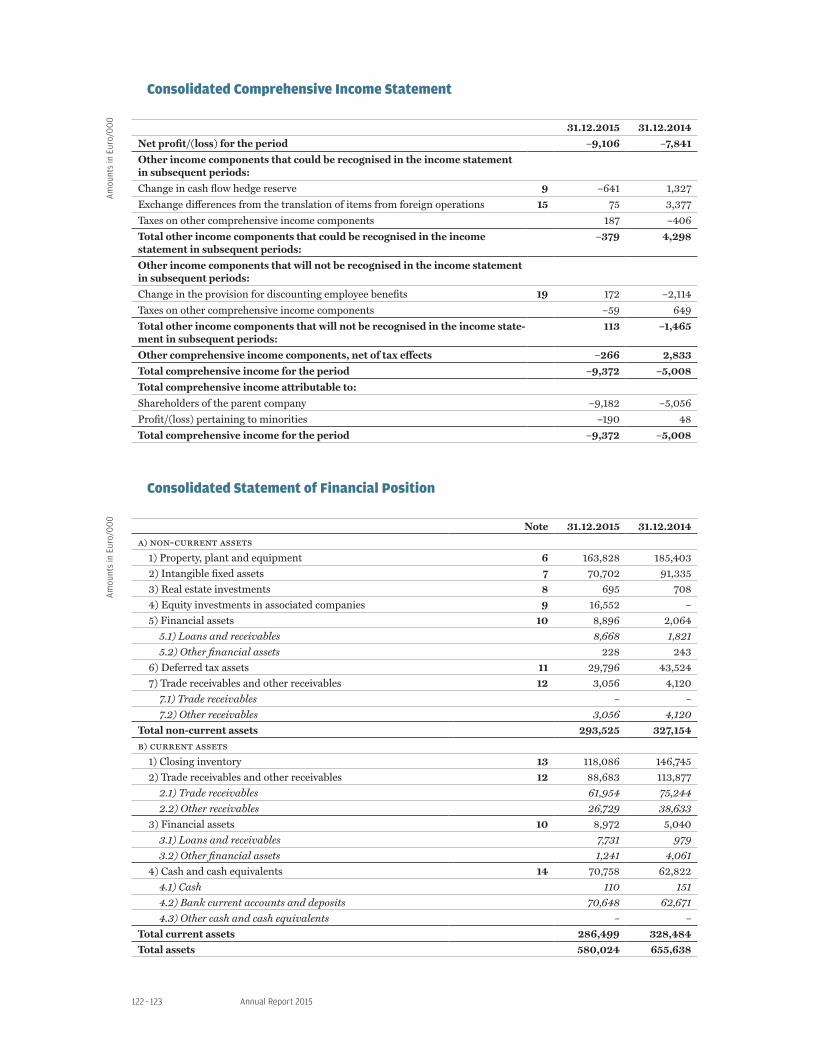
Annual Report 2015122 – 123
ConsolidatedComprehensiveIncomeStatement
31.12.2015 31.12.2014
Net profit/(loss) for the period –9,106 –7,841
Other income components that could be recognised in the income statement in subsequent periods:
Change in cash flow hedge reserve 9 –641 1,327
Exchange differences from the translation of items from foreign operations 15 75 3,377
Taxes on other comprehensive income components 187 –406
Total other income components that could be recognised in the income statement in subsequent periods:
–379 4,298
Other income components that will not be recognised in the income statement in subsequent periods:
Change in the provision for discounting employee benefits 19 172 –2,114
Taxes on other comprehensive income components –59 649
Total other income components that will not be recognised in the income state-ment in subsequent periods:
113 –1,465
Other comprehensive income components, net of tax effects –266 2,833
Total comprehensive income for the period –9,372 –5,008
Total comprehensive income attributable to:
Shareholders of the parent company –9,182 –5,056
Profit/(loss) pertaining to minorities –190 48
Total comprehensive income for the period –9,372 –5,008
ConsolidatedStatementofFinancialPosition
Note 31.12.2015 31.12.2014a) non-current assets
1) Property, plant and equipment 6 163,828 185,403 2) Intangible fixed assets 7 70,702 91,3353) Real estate investments 8 695 708 4) Equity investments in associated companies 9 16,552 – 5) Financial assets 10 8,896 2,064
5.1) Loans and receivables 8,668 1,821 5.2) Other financial assets 228 243
6) Deferred tax assets 11 29,796 43,524 7) Trade receivables and other receivables 12 3,056 4,120
7.1) Trade receivables – – 7.2) Other receivables 3,056 4,120
Total non-current assets 293,525 327,154 b) current assets
1) Closing inventory 13 118,086 146,7452) Trade receivables and other receivables 12 88,683 113,877
2.1) Trade receivables 61,954 75,244 2.2) Other receivables 26,729 38,633
3) Financial assets 10 8,972 5,040 3.1) Loans and receivables 7,731 979 3.2) Other financial assets 1,241 4,061
4) Cash and cash equivalents 14 70,758 62,822 4.1) Cash 110 151 4.2) Bank current accounts and deposits 70,648 62,671 4.3) Other cash and cash equivalents – –
Total current assets 286,499 328,484Total assets 580,024 655,638
Am
ount
s in
Eur
o/0
00
Am
ount
s in
Eur
o/0
00

Consolidated Financial Statements
Note 31.12.2015 31.12.2014
a) shareholders’ equity 15
1) Share Capital 23,915 23,915
2) Other Reserves 27,278 37,252
3) Profits/(Losses) brought forward – –
4) Other Ias/Ifrs reserves 169 624
5) Provision for discounting employee benefits –593 –1,957
6) Foreign currency translation reserve –13,489 –13,562
7) Profit/loss for the year pertaining to the group –8,915 –7,913
Group Shareholders’ Equity 28,365 38,359
8) Minority interests 2,658 2,848
Total Shareholders’ Equity 31,023 41,207
b) non-current liabilities
1) Financial liabilities 16 180,188 127,039
1.1) Bonds – –
1.2) Loans 180,344 126,985
1.3) Other financial liabilities –156 54
2) Trade payables and other payables 17 910 1,361
2.1) Trade payables – –
2.2) Other payables 910 1,361
3) Deferred tax liabilities 11 3,214 5,353
4) Provision for employee benefits/retirement 19 11,643 19,387
4.1) Provision for severance indemnity 11,130 12,240
4.2) Provision for retirement benefits 513 7,147
5) Provisions for risks and liabilities 20 3,253 3,869
5.1) Provision for warranties 1,682 1,709
5.2) Provision for legal claims 138 151
5.3) Provision for restructuring and reconversion – –
5.4) Other provisions 1,433 2,009
Total non-current liabilities 199,208 157,009
c) current liabilities
1) Financial liabilities 16 135,443 164,673
1.1) Bonds – –
1.2) Loans 133,621 162,960
1.3) Other financial liabilities 1,822 1,713
2) Trade payables and other payables 17 190,944 271,797
2.1) Trade payables 167,283 232,786
2.2) Other payables 23,661 39,011
3) Current taxes payables 18 5,384 5,178
4) Provisions for risks and liabilities 20 18,022 15,774
4.1) Provision for warranties 9,552 11,145
4.2) Provision for legal claims 1,879 1,364
4.3) Provision for restructuring and reconversion 5,486 2,613
4.4) Other provisions 1,105 652
Total current liabilities 349,793 457,422
Total liabilities 549,001 614,431
Total shareholders’ equity and liabilities 580,024 655,638
Am
ount
s in
Eur
o/0
00
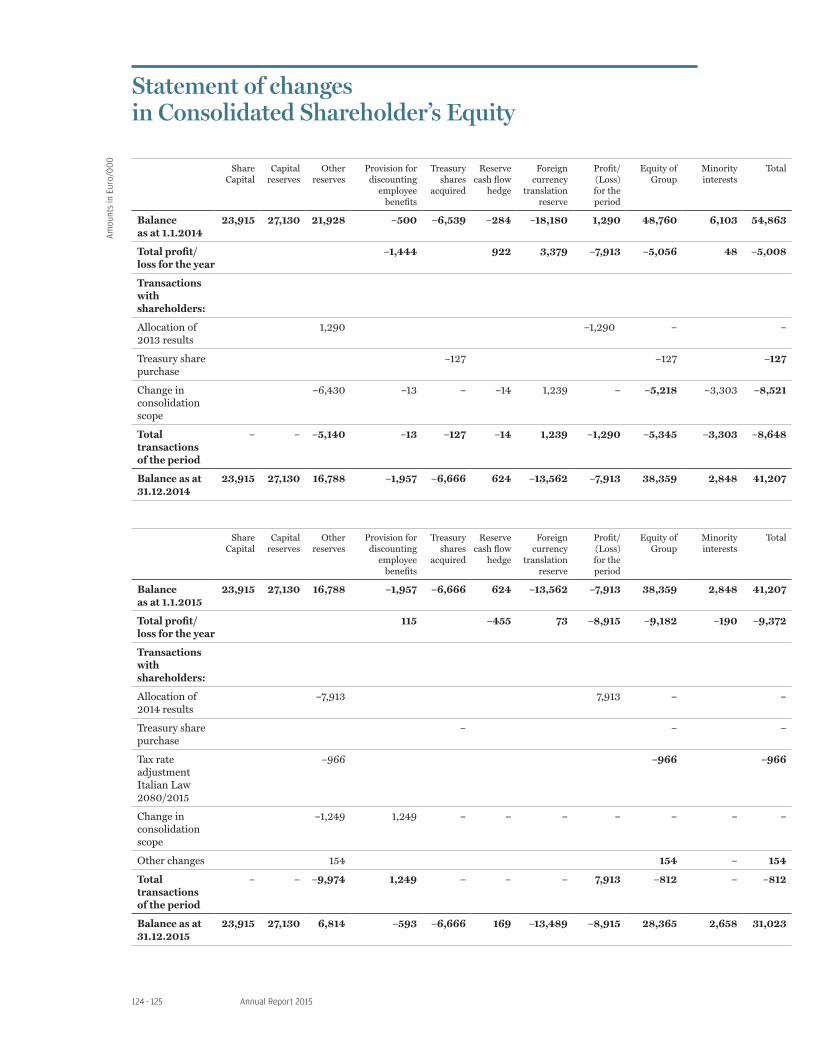
Annual Report 2015124 – 125
Statement of changesin Consolidated Shareholder’s Equity
Share Capital
Capital reserves
Other reserves
Provision for discounting
employee benefits
Treasury shares
acquired
Reservecash flow
hedge
Foreign currency
translation reserve
Profit/ (Loss) for the period
Equity of Group
Minority interests
Total
Balance as at 1.1.2014
23,915 27,130 21,928 –500 –6,539 –284 –18,180 1,290 48,760 6,103 54,863
Total profit/loss for the year
–1,444 922 3,379 –7,913 –5,056 48 –5,008
Transactions with shareholders:
Allocation of 2013 results
1,290 –1,290 – –
Treasury share purchase
–127 –127 –127
Change in consolidation scope
–6,430 –13 – –14 1,239 – –5,218 –3,303 –8,521
Total transactions of the period
– – –5,140 –13 –127 –14 1,239 –1,290 –5,345 –3,303 –8,648
Balance as at 31.12.2014
23,915 27,130 16,788 –1,957 –6,666 624 –13,562 –7,913 38,359 2,848 41,207
Share Capital
Capital reserves
Other reserves
Provision for discounting
employee benefits
Treasury shares
acquired
Reservecash flow
hedge
Foreign currency
translation reserve
Profit/ (Loss) for the period
Equity of Group
Minority interests
Total
Balance as at 1.1.2015
23,915 27,130 16,788 –1,957 –6,666 624 –13,562 –7,913 38,359 2,848 41,207
Total profit/loss for the year
115 –455 73 –8,915 –9,182 –190 –9,372
Transactions with shareholders:
Allocation of 2014 results
–7,913 7,913 – –
Treasury share purchase
– – –
Tax rate adjustment Italian Law 2080/2015
–966 –966 –966
Change in consolidation scope
–1,249 1,249 – – – – – – –
Other changes 154 154 – 154
Total transactions of the period
– – –9,974 1,249 – – – 7,913 –812 – –812
Balance as at 31.12.2015
23,915 27,130 6,814 –593 –6,666 169 –13,489 –8,915 28,365 2,658 31,023
Am
ount
s in
Eur
o/0
00
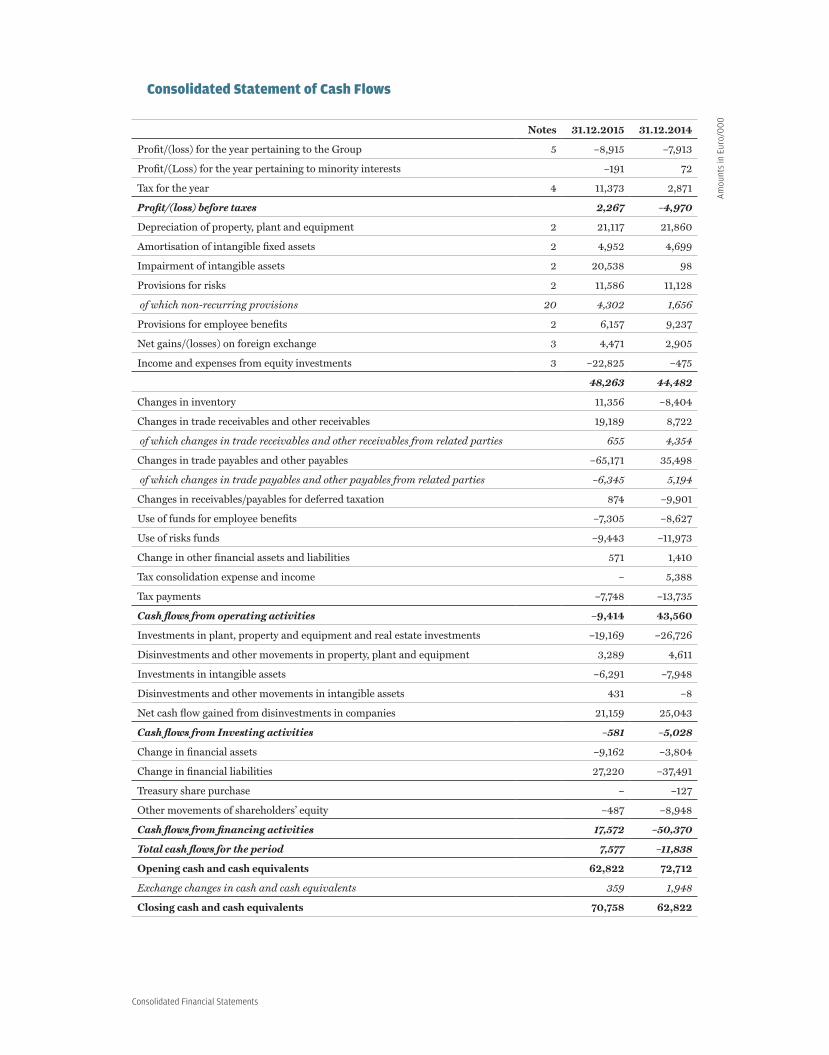
Consolidated Financial Statements
ConsolidatedStatementofCashFlows
Notes 31.12.2015 31.12.2014
Profit/(loss) for the year pertaining to the Group 5 –8,915 –7,913
Profit/(Loss) for the year pertaining to minority interests –191 72
Tax for the year 4 11,373 2,871
Profit/(loss) before taxes 2,267 –4,970
Depreciation of property, plant and equipment 2 21,117 21,860
Amortisation of intangible fixed assets 2 4,952 4,699
Impairment of intangible assets 2 20,538 98
Provisions for risks 2 11,586 11,128
of which non-recurring provisions 20 4,302 1,656
Provisions for employee benefits 2 6,157 9,237
Net gains/(losses) on foreign exchange 3 4,471 2,905
Income and expenses from equity investments 3 –22,825 –475
48,263 44,482
Changes in inventory 11,356 –8,404
Changes in trade receivables and other receivables 19,189 8,722
of which changes in trade receivables and other receivables from related parties 655 4,354
Changes in trade payables and other payables –65,171 35,498
of which changes in trade payables and other payables from related parties –6,345 5,194
Changes in receivables/payables for deferred taxation 874 –9,901
Use of funds for employee benefits –7,305 –8,627
Use of risks funds –9,443 –11,973
Change in other financial assets and liabilities 571 1,410
Tax consolidation expense and income – 5,388
Tax payments –7,748 –13,735
Cash flows from operating activities –9,414 43,560
Investments in plant, property and equipment and real estate investments –19,169 –26,726
Disinvestments and other movements in property, plant and equipment 3,289 4,611
Investments in intangible assets –6,291 –7,948
Disinvestments and other movements in intangible assets 431 –8
Net cash flow gained from disinvestments in companies 21,159 25,043
Cash flows from Investing activities –581 –5,028
Change in financial assets –9,162 –3,804
Change in financial liabilities 27,220 –37,491
Treasury share purchase – –127
Other movements of shareholders’ equity –487 –8,948
Cash flows from financing activities 17,572 –50,370
Total cash flows for the period 7,577 –11,838
Opening cash and cash equivalents 62,822 72,712
Exchange changes in cash and cash equivalents 359 1,948
Closing cash and cash equivalents 70,758 62,822
Am
ount
s in
Eur
o/0
00
Annual Report 2015126 – 127
Explanatory an supplementary notesto the Consolidated accounts as at 31 december 2015
1.IntroductionPublication of the Consolidated Financial Statements of Carraro Spa and “Carraro
Group” subsidiaries for the year ended 31 December 2015 was authorised by a resolution of the Board of Directors on 19 February 2016.
Carraro Spa is a joint-stock company registered in Italy at the Padua Companies Regis-ter and controlled by Finaid Spa.
Carraro Spa is not subject to management and coordination activities under the terms of Art. 2497 et seq of the Italian Civil Code.
The controlling shareholder of Finaid Spa does not direct and coordinate Carraro’s op-erations. More specifically:
› Finaid is a purely financial holding;› Finaid does not issue any directions to Carraro;› the Finaid Board of Directors does not approve Carraro’s strategic plans or business
plans nor does it “interfere” regularly in its operations; and› there are no relationships of a commercial or financial nature between Finaid and
Carraro.These financial statements are presented in Euros, as this is the currency in which most
of the group’s operations are conducted. The foreign companies are included in the con-solidated financial statements in accordance with the principles described in the notes that follow.
Amounts in these financial statements are given in Euro thousands, while amounts in the notes are indicated in Euro millions (mln).
The Carraro Group companies are principally engaged in the manufacture and market-ing of drive systems developed for agricultural tractors, construction equipment, material moving machinery, light commercial vehicles and automobiles, and electronic control and power systems.
The Carraro Group is organised in the three Cgu (Cash Generating Units): Carraro Drive Tech, Santerno and Agritalia.
Reporting criteria and accounting principlesThe annual Financial Statements are drawn up in compliance with the International
Financial Reporting Standards (‘Ifrs’) issued by the International Accounting Standards Board (“Iasb”) and endorsed by the European Union, and with the measures issued imple-menting Article 9 of Legislative Decree 38/2005. The term Ifrs also includes the revised International Accounting Standards (Ias) and all interpretations of the International Fi-nancial Reporting Interpretations Committee (Ifric) previously known as the Standard Interpretation Committee (Sic). These standards are the same as those used for the Finan-cial Statements as at 31 December 2014, with the exceptions described in the paragraph 3.3 “Accounting standards, amendments and interpretations adoptable since 1 January 2015”.

Consolidated Financial Statements
The financial statements were prepared assuming that the company is a going concern. For further details, please refer to the information in the Directors’ Report on Operations.
2.FormandcontentofthefinancialstatementsThese consolidated financial statements have been prepared in accordance with the
revised International Accounting Standards (Ias/Ifrs) ratified by the European Union and to this end the figures of financial statements of the consolidated subsidiary companies have been reclassified and adjusted appropriately.
This press release contains a number of “alternative performance indicators” not envis-aged by the Ifrs accounting standards: Ebitda (understood as the sum of operating profit/(loss), amortisation, depreciation and impairment of fixed assets); Ebit (understood as operating profit/(loss) in the income statement); Net Financial Position (the sum of bank borrowing, bonds and short-term and medium/long-term loans, net of cash and cash equivalents, marketable securities and financial receivables).
2.1 FormatoftheconsolidatedfinancialstatementsWith regard to the format of consolidated accounting schedules, the Group opted to
present the following accounting statements.
Income StatementItems on the consolidated income statement are classified by their nature. The income
statement separately indicates the effects of non-recurrent positive and negative income components relative to events or transactions the occurrence of which is non-current, or transactions or events that are not repeated frequently in carrying out normal activities.
Statement of Comprehensive IncomeThe statement of comprehensive income includes items of income and costs that are
not posted on the period income statement, as required or permitted by the Ifrss, such as changes to the cash flow hedge reserve, changes to the reserve for employee benefits - ac-tual gains and losses, changes to the translation reserve and the result of financial assets available for sale.
Statement of Financial PositionThe consolidated interim statement of financial position is presented with separate dis-
closure of Assets, Liabilities and Shareholders’ Equity.Assets and Liabilities are illustrated in the Consolidated Financial Statements accord-
ing to their classification as current and non-current.
Statement of Changes in Shareholders’ EquityThe statement of changes in shareholders’ equity is presented in accordance with the
requirements of the international accounting standards, showing the comprehensive in-come for the period and all changes generated from transactions with shareholders.

Annual Report 2015128 – 129
Statement of Cash FlowsThe consolidated statement of cash flows illustrates the changes in cash and cash equiv-
alents (as presented in the statement of financial position) divided by cash generating area, indicating financial flows in accordance with the “indirect method”, as permitted by Ias 7.
Accounting statements of transactions with related parties(Consob regulation 15519)With reference to the reporting of related-party transactions in the financial state-
ments, provided for in Consob Regulation 15519 of 27 July 2006, balances of a significant amount are specifically indicated, to facilitate understanding of the assets and liabilities, financial position and results of the Group, in the table of paragraph 8 below on related-party transactions.
2.2ContentoftheConsolidatedFinancialStatements
Consolidation scopeThe consolidated financial statements of the Group include the financial statements of
Carraro Spa and companies it directly or indirectly controls.
Subsidiaries are companies in which the Company exercises control. The Company controls another company when it is exposed, or has rights, to the variability of results of the subsidiary based on its involvement with said subsidiary and has the capacity to influ-ence such results through the exercise of its power.
Control may be exercised through directly or indirectly holding the majority of shares with voting rights, or on the basis of contractual or legal agreements, also regardless of shareholding relations. The existence of potential voting rights that may be exercised at the reporting date is considered for the purposes of determining control.
In general, the existence of control is assumed when the Parent Company holds, directly or indirectly, more than half the voting rights.
Subsidiaries are consolidated on a line-by-line basis, starting from the date when con-trol is actually acquired and stop being consolidated at the date when control is trans-ferred to third parties.

Consolidated Financial Statements
The following companies are consolidated using the line-by-line method:
Name Based in Currency Nominal valueShare capital
Group stake
Parent company:
Carraro Spa Campodarsego (Padua) Eur 23,914,696
Italian subsidiaries:
Carraro Drive Tech Spa Campodarsego (Padua) Eur 30,102,365 100.00%
Elettronica Santerno Spa Campodarsego (Padua) Eur 3,000,000 100.00%
Siap Spa Maniago (Pordenone) Eur 35,582,616 91.57%
Foreign subsidiaries:
Carraro International Sa Luxembourg Eur 39,318,000 100.00%
Carraro Deutschland Gmbh Hattingen (Germany) Eur 10,507,048 100.00%
Carraro Technologies India Pvt. Ltd. Pune (India) Inr 18,000,000 100.00%
Carraro Argentina Sa Haedo (Argentina) Ars 105,096,503 99.95%
Carraro China Drive System Qingdao (China) Cny 168,103,219 100.00%
Carraro India Ltd. Pune (India) Inr 586,492,900 100.00%
Carraro North America Inc. Norfolk (Usa) Usd 1,000 100.00%
Fon Sa Radomsko (Poland) Pln - 98.64%
Carraro Drive Tech Do Brasil Santo Andrè (State of Sao Paulo)
Brl 5,701,954 100.00%
Eletronica Santerno Industria E Comercio Ltda Minas Gerais (Brazil) Brl 12,692,257 100.00%
Elettronica Santerno Espana S.L. Valencia (Spain) Eur 1,003,006 100.00%
Santerno Inc. San Francisco (Usa) Usd 1,000 100.00%
Zao Santerno Moscow (Russia) Rub - 100.00%
Santerno Shanghai Trading Co Shanghai (China) Cny 8,111,930 100.00%
Santerno India Pvt Ltd Pune (India) Inr 166,560 100.00%
Santerno South Africa Pty Ltd Cape Town (South Africa)
Zar 100 100.00%
Mini Gears Inc Virginia Beach (Usa) Usd 8,910,000 100.00%
Gear World North America Inc. Virginia Beach (Usa) Usd 20,000 100.00%
Mini Gears Property Virginia Beach (Usa) Usd 20,000 100.00%
Foreign associated companies:
O&K Antriebstechnik Gmbh Hattingen (Germany) Eur 4,000,000 45.00%
Changes in the consolidation area and other operations of company reorganisation
Partial disposal of the subsidiary O&K AntriebstechnikOn 30 December 2015, upon completion of the strategic plan to refocus the Group on
its core business, the agreement for the disposal of a shareholding of 55% in the German company O&K Antriebstechnik GmbH to Bonfiglioli Spa was finalised for the amount of 25.007 million Euros.
The Carraro Group maintains a stake of 45% of the share capital in the company.
Am
ount
s in
Eur
o/0
00

Annual Report 2015130 – 131
According to paragraph 25 of accounting standard Ifrs 10, in the case of loss of control of a subsidiary, the parent company recognises the retained interest at fair value at the date of loss of control and subsequently accounts it together with any amounts owed by or to the former subsidiary in accordance with the provisions of the pertinent Ifrs standards.
Below is a summary of the main values:
Effect of partial disposal of the subsidiary “O&K Antriebstechnik”
1) Property, plant and equipment –16,031
2) Intangible fixed assets –3,165
5) Financial assets –10
6) Deferred tax assets –8,204
7) Trade receivables and other receivables –15
Total non-current assets –27,425
1) Closing inventory –13,552
2) Trade receivables and other receivables –5,853
4) Cash and cash equivalents transferred –665
Total current assets –12,758
Total assets –40,183
1) Financial liabilities –194
3) Differed liabilities –879
4) Provision for severance indemnity and retirement benefits –6,438
Total non-current liabilities –7,511
1) Financial liabilities –7,563
2) Trade payables and other payables –13,443
3) Current taxes payables –
4) Provision for risks and liabilities –405
Total current liabilities –21,411
Total liabilities –28,922
Net assets sold: 18,573
Sales price 25,007
Valuation of interest in associated company 16,552
Am
ount
s in
Eur
o/0
00

Consolidated Financial Statements
3.Consolidationcriteriaandaccountingstandards
3.1 ConsolidationcriteriaThe figures are consolidated using the line by line method, that is assuming the entire
amount of the assets, liabilities, costs and earnings of the individual companies, regard-less of the stock held in the company.
Foreign companies are consolidated using financial statement formats in line with the layout adopted by the parent company and compiled in accordance with common ac-counting standards, as applied for Carraro Spa. Where necessary, to achieve alignment with the reporting dates of the foreign companies, infra-annual financial statements as at 31 December 2015 have been provided by the directors, with the same criteria as those for year-end statements.
The carrying amount of consolidated equity interests, held by Carraro Spa or by other companies within the consolidation scope, was offset by the relevant amount of share-holders’ equity in the subsidiary companies.
The amount of shareholders’ equity and the net profit/(loss) of these third-party share-holders are shown in the Consolidated Statement of Financial Position, Consolidated In-come Statement and Consolidated Statement of Comprehensive Income respectively.
Payable and receivables, income and expenditure and all operations undertaken be-tween the companies included within the consolidation scope have been eliminated, in-cluding dividends distributed within the Group.
Profits not yet realised and capital gains and losses deriving from operations between companies of the Group have also been eliminated.
Intra-group losses that indicate impairment are recognised in the consolidated finan-cial statements.
Balances in foreign currencies have been converted into Euros using the exchange rate of the end of the period for assets and liabilities, historical exchange rates for sharehold-ers’ equity items and average exchange rates in the period for the income statement.
Exchange differences resulting from this conversion method are shown in a specific shareholders’ equity item entitled “Foreign currency translation reserve”.
The exchange rates applied for the translation of balances presented in foreign curren-cies were as follows:
Currency Averageexchange rate
for 2015
Exchange rate as at 31.12.2015
Averageexchange rate
for 2014
Exchange rate as at 31.12.2014
Indian Rupee 71.196 72.022 80.995 76.719
Polish Zloty 4.184 4.264 4.184 4.273
US Dollar 1.110 1.089 1.328 1.214
Chinese Renminbi 6.973 7.061 8.185 7.536
Argentine Peso 10.260 14.097 10.785 10.276
Russian Ruble 64.641 62.355 51.012 72.337
South African Rand 14.174 16.953 13.895 14.035
Brazilian Real 3.700 4.312 3.120 3.221
Annual Report 2015132 – 133
3.2 Discretionaryvaluationsandsignificantaccountingestimates
Estimates and assumptionsIn the application of the Group’s accounting standards, the directors have not made
decisions based on discretionary evaluations (excluding those which involve estimates) having a significant effect on the values in the financial statements.
We present below the key assumptions on the future and other significant sources of uncertainty in the estimates at the reporting date, which could bring about significant changes in the carrying amounts of assets and liabilities within the next financial year.
Impairment loss on goodwillGoodwill is examined for any impairment once a year. This test requires an estimate
of the value in use of the cash generating unit to which the goodwill is attributed, which in turn is based on an estimate of the anticipated cash flows from the unit and their dis-counting based on an appropriate discount rate. For further details see note 7.
Deferred tax assetsDeferred tax assets are recognised in compliance with Ias 12 and they include retained
tax losses, to the extent that it is likely there will be future tax profits to offset these losses with the returns of the temporary differences absorbed. A significant discretionary valu-ation is required of the directors to determine the amount of the deferred tax assets that can be accounted for. They must estimate the probable timing and the amount of future taxable profits as well as a planning strategy for future taxation. The details are provided in Note 11.
Pension funds and other post employment benefits The cost of defined-benefit pension plans is determined using actuarial valuations. The
actuarial valuation requires assumptions on the discount rates, the expected rate of return on investments, future salary increments, mortality rates and future pension increases. Because of the long-term nature of these plans, these estimates are subject to a significant level of uncertainty. Further information is provided in note 19.
Development costsDevelopment costs have been capitalised based on the following accounting principle.
In order to determine the amounts to be capitalised the directors must develop assump-tions on anticipated future cash flows from assets, the discount rates to apply and the periods of manifestation of the anticipated benefits.
Provisions for risks and liabilitiesThe Group used estimates for the valuation of the provisions for credit risks, for work
under warranties granted to customers, for company restructuring, for stock depreciation and for other risks and liabilities. Further details are provided in the notes relating to the individual financial statement items.
Consolidated Financial Statements
3.3 Accountingstandardsandmeasurementcriteria
Accounting standards, amendments and interpretations adoptable since 1 January 2015Ifric 21 – «Levies»The interpretation published by the Iasb on 20 May 2013 is applicable for annual peri-
ods starting after 17 June 2014. Ifric 21 is an interpretation of Ias 37 Provisions, Contin-gent Liabilities and Contingent Assets, which includes among the criteria for recognition of a liability that the entity has a current obligation as a result of a past event (so-called Obligating event). The Interpretation clarifies that the obligating event that results in rec-ognition of the liability for the tax to be paid is the asset giving rise to payment of the tax, as identified by law. The adoption of this new interpretation had no effect on the Group consolidated financial statements.
Annual Improvements to Ifrss - 2011–2013 CycleThe provisions approved made changes: (i) to Ifrs 3, clarifying that Ifrs 3 is not ap-
plicable for recognition of accounting effects related to the formation of a joint venture or joint operation (as defined by Ifrs 11) in the financial statements of joint ventures or joint operations; (ii) to Ifrs 13, clarifying that the provision contained in Ifrs 13 by which it is possible to measure the fair value of a group of financial assets and liabilities on a net basis, applies to all contracts (including non-financial contracts) falling within the scope of Ias 39 or Ifrs 9; (iii) to Ias 40, clarifying that in order to determine when purchasing a property investment constitutes a business combination, reference must be made to the provisions of Ifrs 3. The new provisions apply for annual periods starting on, or after, 1 January 2015. The adoption of these amendments had no effect on the Group consoli-dated financial statements.
Amendments to IAS 19 «Defined Benefit Plans: Employee Contributions»The amendments made allow accounting down of the current service cost for the pe-
riod of contributions paid by employees or third parties, which are not related to the num-ber of years of service, instead of allocation of such contributions over the period in which the service is rendered. The new provisions apply for annual periods starting on, or after, 1 February 2015. The adoption of these amendments had no effect on the Group consoli-dated financial statements.
Annual Improvements to Ifrs - 2010–2012 CycleThe provisions approved made changes: (i) to Ifrs 2, clarifying the definition of “vesting
condition” and introducing the definitions of service and result conditions; (ii) to Ifrs 3, clarifying that the obligations to pay a contingent consideration, other than those which meet the definition of equity instrument, are measured at fair value at each balance sheet date, with changes recognised in the income statement; (iii) to Ifrs 8, requesting informa-tion to be given concerning the assessments made by management in the aggregation of operating segments, describing the segments that have been aggregated and the economic indicators that were evaluated to determine that the aggregated segments have similar
Annual Report 2015134 – 135
economic characteristics: (iv) to Ias 16 and Ias 38, clarifying the procedures for determin-ing the gross carrying amount of assets, in the event of revaluation resulting from the application of the revaluation model; (v) to Ias 24, establishing the information to be pro-vided when there is a third entity that provides services related to the management of key managers of the reporting entity. The new provisions apply for annual periods starting on, or after, 1 February 2015. The adoption of these amendments had no effect on the Group consolidated financial statements.
Amendments and interpretations of existing standards, effective for periods beginning on or after 1 January 2016 and not adopted by the Group in advanceIfrs 9 – «Financial instruments»The final version of the standard, published on 24 July 2014, involves three steps (“clas-
sification and measurement”, “impairment” and “hedge accounting”) of the Iasb project aimed at replacing IAS 39 - Financial Instruments: recognition and measurement. Ifrs 9 introduces new requirements for classification and measurement of financial assets. The new standard reduces to three the number of categories of financial assets in Ias 39 and requires that all financial assets are (i) classified on the basis of the business model which the company uses to manage its financial assets and of the cash flows characteristic of the financial asset, (ii) initially measured at fair value plus, in the case of financial assets not at fair value with an entry in the income statement, certain ancillary costs (“transac-tion costs”), and (iii) subsequently measured at fair value or amortised cost. Ifrs 9 also envisages that the embedded derivatives that fall within the scope of application of the Ifrs standard in question must no longer be separated from the main contract contain-ing them, and that the company may decide to directly recognise in other comprehensive income the changes in fair value of investments that fall within the scope of application of the Ifrs standard in question. The new impairment model introduced by Ifrs 9 no longer requires a trigger event before being able to account an impairment loss; on the con-trary, it envisages that the expected impairment losses are recognised at any time and that their amount is reviewed and adjusted at each balance sheet date to reflect changes in the credit risk of financial instruments. Ifrs 9 introduces a three-stage model to account for the impairment loss. The methods of determining impairment losses vary depending on whether the financial assets are in one of the three phases. Ifrs 9 better aligns the account-ing treatment of hedging instruments with the risk management activities that companies put in place in order to reduce and/or eliminate exposure to financial and other risks. The new model introduced by Ifrs 9 allows the use of documentation produced internally as a basis for implementing hedge accounting. Ifrs 9 is effective for periods beginning as of 1 January 2018. Early adoption of the standard is permitted. At the date of these con-solidated financial statements the standard has not yet been approved by the European Union. The Group is evaluating the impact that this standard will have on its consolidated financial statements.
Ifrs 15 – «Revenue from contracts with customers»On 28 May 2014, the Fasb issued Ifrs 15 “Revenue from contract with customers”. The
new standard will be applicable as from the first quarter periods beginning on or after

Consolidated Financial Statements
1 January 2017. The standard replaces Ias 18 – «Revenues», Ias 11 «Construction Con-tracts», Ifric 13 «Customers Loyalty Programmes», «Ifric 15 - Agreements for the Con-struction of Real Estate», Ifric 18 – «Transfers of Assets from Customers», Sic 31 – «Rev-enue—Barter Transactions Involving Advertising Services». Revenue is recognised when the customer obtains control over the goods and services and, therefore, when it has the ability to direct the use and obtain the benefits of the same. When a company agrees to provide goods or services at a price that varies according to the occurrence or otherwise of some future event, an estimate of the variable part is included in the price only if its occur-rence is highly probable. For transactions involving the simultaneous sale of several goods and/or services, the sales price must be allocated according to the price that the company would apply to customers if the same goods and services included in the contract were to be sold individually. Companies sometimes incur costs, such as sales commission, to obtain or execute a contract. Such costs, if certain criteria are met, are capitalised and recognised in the income statement over the term of the contract. The standard specifies, moreover, that the sales price must be adjusted in the event that it contains a significant financial component. . The provisions of Ifrs 15 are effective for annual periods beginning on, or after, 1 January 2018, subject to any subsequent deferrals established during ap-proval by the European Union. The Group is evaluating the impact that adoption of the new standard will have on its consolidated financial statements. The new standard has not been approved by the European Union on the date on which these consolidated finan-cial statements were authorised for publication.
Ifrs 16 – «Leases»On 12 May 2014, the Iasb issued amendments to Ias 16 Property, Plant and Equipment
and to Ias 38 Intangibles Assets – “Clarification of acceptable methods of depreciation and amortisation”. The amendments to Ias 16 establish that amortisation criteria determined on the basis of revenues are not appropriate, since, according to the amendment, the rev-enues generated by an asset that includes the use of the asset subject to amortisation generally reflect factors other than the mere consumption of the economic benefits of the asset, a requisite that is, on the other hand, required for amortisation. The amendments to Ias 38 introduce a relative assumption, according to which a depreciation criterion based on revenues is normally considered inappropriate for the same reasons established by the amendments made to Ias 16. In the case of intangible assets, this assumption may, more-over, be overcome, but only in limited and specific circumstances.
The amendments will apply from 1 January 2016 but early application is allowed. The Group is evaluating the impact that this standard will have on its consolidated financial statements.
Amendments to Ias 16 and Ias 38 – «Clarification of Acceptable Methods of Depreciation and Amortisation»The amendments clarify the use of “revenue-based methods” to calculate the depre-
ciation of an asset. Application of the amendments is effective from 1 January 2016. The Group is evaluating the impact that this standard may have on its consolidated financial statements.

Annual Report 2015136 – 137
Amendments to Ifrs 11 – «Accounting for Acquisitions of Interests in Joint Operation»The amendments to the standard provide guidance on the proper accounting of acqui-
sitions resulting from “Interests in Joint Operations”. Application of the amendments is effective from 1 January 2016. The amendments to the standard will not have a significant impact on the consolidated financial statements of the Group.
Amendments to Ifrs 10 and Ias 28 – «Sale or Contribution of Assets between an Investor and its Associate or Joint Venture»The amendments introduced aim to better define the accounting treatment related to
gains or losses arising from transactions with joint ventures and associated companies measured using the equity method. At the date of these consolidated financial statements the standard has not yet been approved by the European Union. The Group is evaluating the impact that this standard will have on its consolidated financial statements.
Annual Improvements to Ifrss 2012–2014 CycleThe provisions will amend Ifrs 5, Ifrs 7, Ias 19 and Ias 34. Application of the amend-
ments is effective from 1 January 2016. The Group is evaluating the impact that this stan-dard will have on its consolidated financial statements.
Amendments to Ias1 - «Disclosure Initiative» The proposed amendments concern the materiality, the aggregation of items, the struc-
ture of the notes, the information on the accounting policies adopted and the presentation of other components of comprehensive income arising from measurement of investments using the equity method. Application of the amendments is effective from 1 January 2016. The Group is evaluating the impact that this standard will have on its consolidated finan-cial statements.
Amendments to Ifrs10, Ifrs 12 and Ias 28 - «Investment Entities: Applying the Consolidation Exception» The amendments introduced provide clarification in the application of the exception to
consolidation for investment entities. At the date of these financial statements the amend-ments to the standards have not yet been approved by the European Union. The Group is evaluating the impact that this standard will have on its consolidated financial statements.
Business Combinations and Goodwill Business combinations are accounted for according to the purchase method. This re-
quires the recognition at fair value of the identifiable assets (including intangible fixed assets previously not recognised) and identifiable liabilities (including potential liabilities and excluding future restructuring) of the business acquired.
The goodwill acquired through a business combination is initially measured at cost, represented by the amount by which the cost of the business combination exceeds the share attributable to the Group of the net fair value of the identifiable assets, liabilities and potential liabilities (of the business acquired). In order to analyse appropriateness,
Consolidated Financial Statements
goodwill acquired in a merger is allocated at the date of acquisition, to the individual cash generating units of the Group or to groups of cash generating units, which should benefit from the synergies of the combination, irrespective of whether other Group assets or li-abilities are allocated to such units or groups of units.
Each unit or group of units to which the goodwill is allocated:› represents the lowest level, within the Group, at which the goodwill is monitored for
internal management purposes; and › is no larger than the business segments identified on the basis of the Group’s primary
or secondary schedule of presentation of the segment reporting, determined on the basis of the indications of Ifrs 8 – «Operating Segments».
When the goodwill represents part of a cash generating unit (or group of cash generat-ing units) and part of the asset internal to that unit is transferred, the goodwill associated with the asset transferred is included in the carrying amount of the asset in order to de-termine the profit or loss generated by the transfer. Goodwill transferred in such cases is calculated on the basis of the values relating to the asset transferred and of the portion of the unit maintained in existence.
When the transfer concerns a subsidiary, the difference between the selling price and the net assets plus the accumulated translation differences and goodwill is recognised in the income statement
Acquisitions of additional equity interests after achieving controlIas 27 Revised states that, once control of an entity has been obtained, transactions in
which the controlling entity buys or sells further minority interests without affecting the control exercised over the subsidiary are transactions with owners and therefore must be recognised in shareholders’ equity. It follows that the carrying amount of the controlling and the minority interests must be adjusted to reflect the change in the equity investment in the subsidiary and any difference between the amount of the adjustment made to the minority interests and the fair value of the price paid or received in this transaction is recognised directly in shareholders’ equity and is attributed to the owners of the parent company. There will be no adjustments to the value of goodwill and profits or losses rec-ognised in the income statement. Any ancillary expenses deriving from these transactions, moreover, must by recognised in shareholders’ equity in accordance with the provisions of Ias 32, paragraph 35.
Previously, in the absence of a specific Standard or Interpretation on the subject, in the case of acquisition of minority interests in companies already controlled, the Car-raro Group had adopted the Parent Entity Extension Method, which involved recognition of the difference between the purchase price and the carrying amounts of assets and li-abilities under the item Goodwill. In the case of sale of minority interests without loss of control, instead, the Group recognised the difference between the carrying amount of the assets and liabilities sold and the sales price in the income statement.
The measurement criteria and accounting standards are illustrated below for the most significant items.

Annual Report 2015138 – 139
Property, plant and equipmentProperty, plant and equipment items are recognised at their historical cost, less the
related accumulated depreciation and cumulative impairment losses. This cost includes expenses for replacing parts of machinery and plant at the time they are incurred if this is in accordance with the recognition criteria.
Depreciation is calculated on a straight-line basis with reference to the estimated useful life of the assets.
Property, plant and equipment items are derecognised at the time of sale or once future economic benefits are no longer expected from their use or disposal. Any losses or profits (calculated as the difference between the net income on the sale and the carrying amount) are recognised in the income statement during the year of elimination as above.
Assets held under finance leases, through which all the risks and benefits of ownership are transferred to the Group, are recognised as Group assets at their current value or,
if lower, at the present value of the minimum lease payments. The corresponding liability to the lessor is included in the financial statements under
financial payables. Leases where the lessor substantially retains all the risks and benefits of ownership are classified as operating leases and the related costs are recognised in the income statement over the term of the contract.
The asset’s residual value, its useful life and the methods applied are reviewed annually and adjusted if necessary, at the end of each accounting period. On average the useful life, in years, is as follows:
Category Useful Life
Industrial Buildings 20–50
Plant 15–25
Machinery 15–18
Equipment 3–15
Dies and Models 5–8
Furniture and Fittings 15
Office Machines 5–10
Motor Vehicles 5–15
Real estate investmentsReal estate investments are recognised at fair value and are not depreciated.
Intangible fixed assetsIntangible assets are recognised in the accounts only if they can be identified and
checked, are expected to generate future economic benefits, and their cost can be reliably determined.
Intangible fixed assets with a limited life are carried at purchase or production cost net of amortisation and accumulated impairment losses.
Amortisation is calculated in relation to their anticipated useful life and starts when the asset becomes available for use.
Consolidated Financial Statements
GoodwillGoodwill represents the surplus of the purchase cost over the acquirer’s interest in the
fair value (referred to the identifiable net values of the assets or liabilities of the entity acquired).
After initial recognition, goodwill is carried at cost, less any cumulative impairment losses.
Goodwill is subject, at least once a year, to an impairment test, to identify any impair-ment losses. In order to perform a correct fair value analysis, the goodwill is allocated to each of the units generating financial flows that will benefit from the effects deriving from the acquisition.
Research and development costsThe costs of research are charged to the income statement when incurred, in accor-
dance with Ias 38.Again in compliance with Ias 38, development costs relating to specific projects are
recorded among the assets only if all the following conditions are fulfilled:› the asset can be identified;› the technical feasibility of completing the intangible asset so that it will be available
for use or sale exists;› the intention to complete the intangible asset and use or sell it exists;› the ability to use or sell the intangible asset exists;› the availability of adequate technical, financial and other resources to complete the
development and to use or sell the intangible asset exists;› it is likely that the asset created will generate future financial benefits;› the costs of the development of the asset can be reliably measured.Such intangible assets are amortised on a straight-line basis over their useful lives.
Licences, trademarks and similar rightsTrademarks and licences are stated at cost, net of amortisation and accumulated im-
pairment losses. The cost is amortised over the shorter of the duration of the contract and the limited useful life.
SoftwareThe cost of software licences, inclusive of ancillary expenses, is capitalised and recog-
nised net of amortisation and of any accumulated impairment losses. Such intangible assets are amortised on a straight-line basis over their useful lives.
Impairment lossesWhere there are specific signs of impairment, tangible and intangible fixed assets are
subject to an impairment test, estimating the recoverable value of the assets and compar-ing it with their net carrying amount. The recoverable value is the greater of the fair value of an asset net of selling costs and its value in use, which is determined as the present value of the cash flows that the company estimates will derive from the continuous use of the asset and from its disposal at the end of its useful life.
Annual Report 2015140 – 141
This recoverable value is determined for each individual asset except when the asset does not generate cash flows which are fully dependent on those generated by other assets.
If the recoverable value is lower than the carrying amount, the latter is reduced accord-ingly. This reduction represents an impairment loss, which is recognised in the income statement.
If there is no longer any reason for an impairment loss previously recognised to be maintained, with the exception of goodwill and of intangible assets with an unlimited useful life, the carrying amount is reinstated to the new value deriving from the estimate, provided that this value does not exceed the net carrying amount which the asset would have had, if no impairment had ever been made and net of amortisation that would have accumulated. The value written back is also recorded in the income statement.
Impairment tests are carried out annually in the case of goodwill and of intangible fixed assets with an unlimited useful life.
Impairment tests are also carried out on all assets with independent flows that show evidence of impairment.
Equity investments in associated companiesAn associated company is an entity over which the Group is able to exercise significant
influence, but does not have control or joint control, via the equity investment, over the financial and operating policies of the subsidiary.
The income, expenses, assets and liabilities of associated companies are shown in the consolidated financial statements using the net equity method, with the exception of cases that are classified as held for sale.
Equity investments in other companies and other securitiesIn accordance with the provisions of the standards Ias 39 and 32, equity investments
in companies other than subsidiaries and associates are classified as financial assets avail-able for sale and are carried at fair value except in cases where it is not possible to deter-mine the market price or the fair value: in this case the cost method is used.
Profits and losses deriving from value adjustments are recognised in the statement of comprehensive income and accumulated in a specific shareholders’ equity reserve.
In the presence of permanent impairment losses or in the event of a sale, profits and losses recognised up to that moment in shareholders’ equity are recognised in the income statement.
Financial assetsIas 39 envisages the following types of financial instruments: financial assets at fair
value through profit or loss, loans and receivables, investments held to maturity and as-sets available for sale. Initially, all financial assets are recognised at fair value, increased, in the case of assets other than those at fair value through profit or loss, by any ancillary expenses. The Group establishes the classification of its financial assets after initial regis-tration and, where appropriate and permitted, revises the classification at the end of each financial year.
All standardised (regular way) purchases and sales of financial assets are recognised at

Consolidated Financial Statements
the trade date, or at the date on which the Group undertakes to acquire the asset. Stan-dardised purchases and sales means all purchase/sale transactions on financial assets which require the handing over of the assets in the period generally envisaged by the regulations and by the practices of the market on which the trade occurs.
Financial assets at fair value through profit or lossThis category comprises financial assets held for trading, that is, all assets acquired for
the purpose of sale in the short term. Derivatives are classified as financial instruments held for trading unless they are designated as effective hedging instruments, in which case their accounting treatment is described in the paragraph “Derivative financial instru-ments and hedging transactions”, below. Profits or losses on assets held for trading are recorded in the income statement.
Investments held to maturityFinancial assets which are not derivative instruments and which are characterised by
payments with fixed or determinable maturities are classified as “investments held to ma-turity” when the Group has the intention and the capacity to maintain them in the port-folio until maturity. Financial assets that the Group decides to keep in the portfolio for an indefinite period do not fall within this category. Other long-term financial investments which are held to maturity, such as bonds, are subsequently measured using the amortised cost method. This cost is calculated as the value initially recognised, less the repayment of the principal, plus or minus the amortisation accumulated using the effective interest rate method on any difference between the value initially recognised and the amount at matu-rity. This calculation includes all the fees or points paid between the parties, which form an integral part of the effective interest rate, the transaction costs and other premiums or discounts. For investments measured at their amortised cost, profits and losses are recog-nised in the income statement at the moment in which the investment is derecognised or in the event of an impairment loss, as well as by means of the amortisation process.
Loans and receivablesLoans and receivables are non-derivative financial assets with fixed or determinable
payments which are not quoted on an active market. These assets are stated on the basis of amortised cost using the effective discount rate method. Profits and losses are recog-nised in the income statement when the loans and receivables are derecognised or on the occurrence of impairment losses, as well as by means of the amortisation process.
Available-for-sale financial assetsAvailable-for-sale financial assets are financial assets, excluding derivative instruments,
which are designated as such or not classified in any of the other three previous catego-ries. After initial recognition at cost, financial assets held for sale are carried at fair value and profits and losses are recorded in a separate shareholders’ equity item until the assets have been derecognised or until it is ascertained that they have suffered an impairment loss. Profits and losses accumulated up to that moment in shareholders’ equity are then charged to the income statement.
Annual Report 2015142 – 143
In the case of securities widely traded on regulated markets, the fair value is determined by making reference to the stock market price struck at the end of trading on the reporting date. For investments where there is no active market, fair value is determined using valu-ation techniques based on prices of recent transactions between unrelated parties; the current market value of a substantially similar instrument; discounted cash flow analysis; option pricing models.
Derecognition of financial assets and liabilitiesFinancial assetsA financial asset (or, if applicable, part of a financial asset or parts of a group of similar
financial assets) is derecognised when:› the right to receive the cash flows from the asset has expired;› the Company maintains the right to receive cash flows from the asset, but has un-
dertaken a contractual commitment to pay them in full and without delay to a third party;
› the Group has transferred the rights to receive cash flows from the asset and (a) has essentially transferred all the risks and benefits of the ownership of the financial asset or (b) has not transferred or essentially withheld all the risks and benefits of the asset, but has transferred control of the same.
In cases where the Group has transferred the rights to receive cash flows from an asset and has not essentially transferred or withheld all the risks and benefits or has not lost control over the same, the asset is recorded in the Group’s financial statements to the extent of the latter’s residual involvement in this asset. The residual involvement, which takes the form of a guarantee on the asset transferred, is measured at the lower of the initial carrying amount of the asset and the maximum amount which the Group could be obliged to pay.
In cases where the residual involvement takes the form of an option issued and/or ac-quired on the asset transferred (including options settled in cash or similar), the extent of the Group’s involvement corresponds to the amount of the asset transferred which the company could re-acquire; however, in the case of a put option issued on an asset mea-sured at fair value (including options settled in cash or by means of similar provisions), the extent of the Group’s residual involvement is limited to the lower of the fair value of the asset transferred and the exercise price of the option.
Financial liabilitiesA financial liability is derecognised when the underlying obligation is discharged, can-
celled or fulfilled.In cases where an existing financial liability is replaced by another of the same lender,
under essentially different conditions, or the conditions of an existing liability are essen-tially changed, this change or amendment is treated as derecognition of the original li-ability and recognition of a new liability. Any difference between the carrying amounts are recognised in the income statement.

Consolidated Financial Statements
Impairment losses on financial assetsThe Group assesses whether a financial asset or group of financial assets has undergone
a loss in value at the end of each accounting period.
Assets measured on the basis of amortised costIf there is objective evidence that a loan or receivable recognised at amortised cost has
suffered an impairment loss, the amount of the loss is measured as the difference between the carrying amount of the asset and the present value of the estimated future cash flows (excluding future receivable losses not yet incurred) discounted at the original effective interest rate of the financial asset (that is the effective interest rate calculated at the date of initial recognition). The carrying amount of the asset is reduced both directly and by set-ting aside provisions. The amount of the loss will be recognised in the income statement.
The Group assesses first of all the existence of objective evidence of impairment at the individual level. In the absence of objective evidence of an impairment loss for a financial asset measured individually, whether significant or otherwise, this asset is included in a group of financial assets with similar credit risk features and the group is subject to as-sessment for impairment losses in a collective manner. Assets assessed at the individual level, for which an impairment loss is seen or continues to be seen, will not be included in collective valuation.
If, in a subsequent accounting period, the amount of an impairment loss decreases and this reduction can objectively be traced back to an event which took place after the im-pairment loss was recognised, the value previously written down is reinstated. Any sub-sequent write-backs are recognised in the income statement, provided that the carrying amount of the asset does not exceed the amortised cost at the date of the reversal.
Assets recognised at cost If objective evidence exists of the loss in value of an unlisted instrument representing
equity which is not recognised at fair value because its value cannot be measured reliably, or of a derivative instrument which is linked to this equity instrument and must be settled by means of the consignment of the instrument, the amount of the impairment loss is given as the difference between the carrying amount of the asset and the present value of the expected future cash flows and discounted at the current market rate of return for a similar financial asset.
Available-for-sale financial assets In the event of an impairment loss of an available-for-sale financial asset, a value equal
to the difference between its cost (net of repayment of the principal and amortisation) and its current fair value, net of any losses in value previously recognised in the income state-ment, is transferred from the statement of comprehensive income to the income state-ment. Writebacks relating to equity instruments classified as available for sale are not recognised in the income statement. Writebacks relating to debt instruments are recog-nised in the income statement if the increase in the fair value of the instrument can be objectively traced back to an event which took place after the loss was recognised in the income statement.

Annual Report 2015144 – 145
InventoriesInventories are measured at the lower of the average purchase or production cost for
the period, and market value. Production cost includes materials, labour and direct and indirect manufacturing costs. Obsolete or slow-moving stocks are written down appropri-ately, as well as in consideration of their anticipated future use and their realisation value.
Works in progress to orderWorks in progress are recognised based on the progress method (or percentage of com-
pletion) according to which costs, revenues and the margin are recognised based on the progress of production activities. The Group adopts the percentage of completion meth-od. Job order revenues include sums paid under the contract, sums for changes in works and price revisions. Job order costs include all costs that refer directly to the job order, costs which may be attributable to job order activities in general and that may be allocated to the job order, in addition to any other cost that may be specifically charged to the client based on contract clauses.
If a loss is expected from completion of a job order, this is entirely recognised in the year in which it is reasonably foreseeable.
Trade receivables and other receivablesTrade receivables and other receivables are included among current assets, with the
exception of those falling due more than 12 months after the reporting date, which are classified as non-current assets. These assets are valued at amortised cost on the basis of the effective interest rate method.
Receivables which mature at more than one year, are interest-free or that earn less in-terest than the market, are discounted using market rates. Trade receivables are discount-ed when they have longer payment terms than the average term of extension granted.
If there is objective evidence of elements indicating an impairment loss, the asset is reduced by an amount that returns the discounted value of the cash flows obtainable in the future. Impairment losses are recognised in the income statement. Where reasons for previous writedowns are not maintained into subsequent trading periods, the value of the asset is reinstated until it corresponds to the value that would have derived from applica-tion of the amortised cost.
Cash and cash equivalentsCash and cash equivalents include cash on hand and cash deposits and investments
maturing within three months of the original date of acquisition.
Loans and bondsLoans are initially recognised at the fair value of the price received net of the related
loan acquisition costs. After initial recognition, loans are carried on the basis of their am-ortised cost calculated by means of the application of the effective interest rate. The amor-tised cost is calculated taking into account the issue costs and any discounts or premium provided for at the time of settlement.

Consolidated Financial Statements
Allowances and provisionsProvisions for risks and liabilitiesProvisions for risks and liabilities are made when the Group must meet a current legal
or implicit obligation deriving from a past event, a sacrifice of resources is likely in order to deal with this obligation and it is possible to make a reliable estimate of its amount. When the Group considers that a provision for risks and liabilities will be partly or fully reimbursed, for example in the case of risks covered by insurance policies, the indemnity is recognised separately among the assets if, and only if, it is practically certain. In this case, the cost of the possible related provisions, net of the amount recognised for the in-demnity, is presented in the income statement. If the effect of discounting to the present the value of the money is significant, the provisions are discounted back using a pre-tax discount rate which reflects, where appropriate, the specific risks of the liabilities. When the discounting is carried out, the increase of the provision due to the passage of time is recognised as a financial expense.
Employee and similar benefitsAccording to Ias 19, employee benefits to be paid out subsequent to the termination of
the employment relationship and other long-term benefits (including the Provision for severance indemnity) are subjected to actuarial valuations which have to take into ac-count a series of variables (such as mortality, the provisions of future salary changes, the anticipated rate of inflation, etc.).
Following this method, the liability recognised represents the current value of the obli-gation, net of any plan assets, adjusted for any actuarial losses or profits not accounted for.
As provided for by Ias 19 Revised, actuarial gains and losses were recognised directly in the income statement, without using the corridor approach.
Following the adoption of Ias 19 Revised, actuarial gains/losses are no longer directly recognised in the income statement, but are directly recognised in a reserve of sharehold-ers’ equity with immediate recognition in the Statement of Comprehensive Income. The item Interest cost is classified under Financial income/expenses and no longer under the item Personnel Costs.
Recognition of revenues and other positive income componentsSales of goods are recognised when the goods are shipped and the company has trans-
ferred to the purchaser the significant risks and rewards associated with ownership of the goods.
Revenues for services are recognised with reference to the stage of completion.Interest income is recognised in accordance with the accruals concept, on the basis of
the amount financed and the effective interest rate applicable, which represents the rate that discounts future collections estimated over the expected life of the financial asset so as to take them back to the carrying amount of the asset itself.
Revenues from dividends are recorded when the right to collection arises, which nor-mally corresponds to the resolution of the shareholders’ meeting approving distribution of the dividends. Dividends to shareholders are recognised as payable at the time of the distribution resolution.
Annual Report 2015146 – 147
Public grantsPublic grants are recognised when reasonable certainty exists that they will be received
and all the related conditions are satisfied. When the grants are associated with cost ele-ments, they are recorded as revenues, but they are systematically spread over the account-ing periods so that they are commensurate with the costs they are intended to offset. If the grant is linked to an asset, the fair value is suspended in long-term liabilities and the release to the income statement takes place progressively over the expected useful life of the asset concerned on a straight-line basis.
TaxesTaxation for the year represents the sum total of the current and deferred income taxes.
Current taxesCurrent income taxes have been provided for on the basis of an estimate of the taxable
income for the consolidated companies, in accordance with the provisions issued or es-sentially issued at the reporting date and taking any applicable exemptions into account.
Deferred taxesDeferred taxes are determined on the basis of the taxable temporary differences exist-
ing between the carrying amount of assets and liabilities and their value for tax purposes; they are classified under non-current assets and liabilities.
Deferred tax assets are provided for only to the extent that future tax burdens will prob-ably exist, against which this asset balance can be used.
The value of deferred tax assets which can be recognised is subject to an annual as-sessment and is written down to the extent that it is not likely that sufficient income for tax purposes will be available in the future so as to permit all or part of this credit to be used. Unrecognised deferred tax assets are reviewed annually at the reporting date and are recognised to the extent that it has become likely that income for tax purposes will be sufficient to permit these deferred tax assets to be recovered.
Deferred tax assets and liabilities are determined with reference to the tax rates which are expected to be applied in the period in which these deferments will be realised, taking into account the rates in force or those which it is known will be subsequently issued.
Deferred tax assets and liabilities are offset, if a legal right exists to offset the current tax assets with current tax liabilities and the deferred taxes refer to the same fiscal entity and the same tax authority.
Value added taxRevenues, costs, assets and liabilities are recognised net of value added tax, except
when: › the tax applied to the purchase of goods or services is non-deductible, in which case
it is recognised as part of the purchase cost of the asset or part of the cost item recog-nised in the income statement;
› it refers to trade receivables and payables recorded including the value of the tax.
Consolidated Financial Statements
Earnings (losses) per shareBasic earnings (losses) per share are calculated by dividing the net profit (net loss) for
the period attributable to ordinary shareholders of the Company by the weighted average number of ordinary shares outstanding in the period.
Diluted earnings (losses) per share are obtained by means of adjustment of the weighted average of outstanding shares, so as to take into account all the potential ordinary shares with diluting effects.
Translation of foreign currency balancesFunctional currencyThe companies of the Group provide their financial statements in the currency used in
the individual country.The Group’s functional currency is the Euros, which represents the currency in which
the separate financial statements are drawn up and published.
Accounting transactions and entriesTransactions carried out in a foreign currency are initially recognised using the ex-
change rates at the transaction date.At the reporting date, the monetary assets and liabilities denominated in a foreign cur-
rency are re-translated on the basis of the exchange rate in force at that date.Non-monetary foreign currency items measured at historical cost are translated using
the exchange rate in force at the date of the transaction.Non-monetary items recognised at fair value are translated using the exchange rate in
force at the date of determination of the value.
Strumenti finanziari derivati e operazioni di coperturaThe Company’s financial risk management strategy conforms to the company objec-
tives set out in the policies approved by the Board of Directors of Carraro Spa. In particu-lar, it aims to minimise interest rate and exchange rate risk and optimise the cost of debt.
These risks are managed in accordance with the principles of prudence and market best practices and all risk management transactions are centrally managed.
The main objectives indicated by the policy are as follows:
Exchange-rate risks:› to hedge all commercial and financial transactions against the risk of fluctuation;› to apply the “currency balancing” method of hedging the risk, where possible, favour-
ing the offsetting of revenues and expenses and payables and receivables in foreign currencies in order to engage in hedging solely for the excess balance not offset;
› not to permit the use and ownership of derivatives or similar instruments for mere trading purposes;
› to permit only the use of instruments traded on regulated markets for hedging trans-actions.

Annual Report 2015148 – 149
Interest-rate risks:› to hedge financial assets and liabilities against the risk of changes in interest rates;› in hedging against risk, to comply with the general criteria for balancing lending and
borrowing set at the Group level by the Board of Directors of Carraro Spa when it ap-proves long-term plans and budgets (fixed and floating interest rates, proportions at short-term and medium/long-term);
› to permit only the use of instruments traded on regulated markets for hedging trans-actions.
The Group uses derivative financial instruments such as currency futures contracts and interest rate swaps to hedge the risks deriving mainly from fluctuations in interest and exchange rates. These derivative financial instruments are initially recognised at their fair value at the date they were entered into; this fair value is periodically reviewed. They are accounted for as assets when the fair value is positive and as liabilities when it is negative.
Any profits or losses emerging from the changes in the fair value of derivatives not eligible for hedge accounting are charged directly to the income statement during the ac-counting period.
The fair value of currency futures contracts is determined with reference to the current forward exchange rates for contracts with a similar maturity profile. The fair value of in-terest rate swap agreements is determined with reference to the market value for similar instruments.
For hedge accounting purposes, hedges are classified as: › fair value hedges, if they hedge the risk of change in the fair value of an underlying
asset or liability; › cash flow hedges, if they hedge the risk of change in the cash flows deriving from ex-
isting assets and liabilities or from future transactions;› hedges of a net investment in a foreign operation (net investment hedges).Un’operazione di copertura a fronte del rischio di cambio afferente un impegno irrevo-
cabile è contabilizzata come copertura dei flussi finanziari.A transaction hedging the exchange-rate risk relating to an irrevocable commitment is
accounted for as a cash flow hedge.When implementing a hedging transaction, the Group formally designates and docu-
ments the hedging relationship to which it is intended to apply the hedge accounting, its risk management objectives and the strategy pursued. The documentation identifies the hedging instrument, the element or transaction subject to the hedge, the nature of the risk and the methods by means of which the entity intends to assess the effectiveness of the hedge in offsetting exposure to changes in the fair value of the element hedged or the cash flows attributable to the hedged risk.
These hedges are expected to be highly effective in offsetting exposure of the element hedged to changes in the fair value or in the cash flows attributable to the hedged risk. The assessment of whether these changes have effectively shown themselves to be highly effective is carried out on an ongoing basis during the accounting periods in which they were designated.
Consolidated Financial Statements
Transactions which meet the criteria for hedge accounting are accounted for as follows:
Fair value hedgesThe Group may use fair value hedging transactions against exposure to changes in the
fair value of accounting assets and liabilities or of an off-balance sheet irrevocable com-mitment, as well as an identified part of the said assets, liabilities or irrevocable commit-ments, attributable to a particular risk, which could have an impact on the income state-ment. As far as fair value hedges are concerned, the carrying amount of the element being hedged is adjusted to reflect the profits and losses attributable to the risk subject to the hedge, the derivative instrument is re-determined at fair value and the profits and losses of both are booked to the income statement.
With regard to fair value hedges referring to elements recognised on the basis of amor-tised cost, the adjustment of the carrying amount is amortised in the income statement over the period remaining until maturity. Any adjustments to the carrying amount of the hedged financial instrument to which the effective interest rate method is applied are am-ortised in the income statement.
The amortisation can start as soon as an adjustment exists but not after the date when the hedged element ceases to be adjusted due to the changes in its fair value attributable to the hedged risk.
When an unrecognised irrevocable commitment is designated as a hedged item, subse-quent cumulative changes in its fair value attributable to the hedged risk are recognised as assets or liabilities and the corresponding profits and losses are recognised in the in-come statement. Changes in the fair value of a hedging instrument are also booked to the income statement.
An instrument is no longer recognised as a fair value hedge when it matures or is sold, discharged or exercised, when the hedge no longer meets the requirements for hedge ac-counting purposes, or when the Group revokes its designation. Any adjustments to the carrying amount of the hedged financial instrument to which the effective interest rate method is applied are amortised in the income statement. The amortisation can start as soon as an adjustment exists but not after the date when the hedged element ceases to be adjusted due to changes in its fair value attributable to the hedged risk.
Cash flow hedgesCash flow hedges are transactions hedging the risk of fluctuations in cash flows at-
tributable to a specific risk, associated with a recognised asset or liability or with a highly likely future transaction which could influence the financial outcome. Profits or losses deriving from the hedging instrument are recognised in the statement of comprehensive income and accumulated in a specific shareholders’ equity reserve for the efficient part, while the remaining (inefficient) portion is recognised in the income statement.
The profit or loss booked to shareholders’ equity is reclassified in the income statement during the period when the transaction being hedged influences the income statement (for example, when the financial income or expense is recognised or when an anticipated sale or purchase takes place). When the element being hedged is the cost of a non-finan-cial asset or liability, the amounts recognised in shareholders’ equity are transferred at the

Annual Report 2015150 – 151
initial carrying amount of the asset or liability.If the transaction is no longer expected to take place, the amounts initially accumulated
in shareholders’ equity are transferred to the income statement. If the hedging instrument matures or is sold, cancelled or exercised without being replaced, or if its designation as a hedge is revoked, the amounts previously accumulated in shareholders’ equity remain recognised therein until the expected transaction takes place. If it is believed that this will no longer happen, the amounts are transferred to the income statement.
Hedges of a net investment in a foreign operationHedges of a net investment in a foreign operation, including hedges of a monetary item
recognised as part of a net investment, are recognised on a similar basis to cash flow hedg-es. Profits or losses deriving from the hedging instrument are recognised in the statement of comprehensive income and accumulated in a specific shareholders’ equity reserve for the efficient part of the hedge, while for the remaining (inefficient) portion they are rec-ognised in the income statement. On disposal of the foreign operation, the cumulative value of these profits or losses booked to shareholders’ equity is transferred to the income statement.
Credit risk The Group includes among its customers leading international manufacturers of agri-
cultural machinery, construction equipment vehicles, industrial vehicles and light power tools as well as renewable energy producers, and designers and installers of photovoltaic systems. The risk concentration is associated with the size of these customers, which on a global context is on average high, yet balanced by the fact that credit exposure is distrib-uted across a complex network of counterparties active in several geographic segments.
The management of credit is designed to prioritise the acquisition of customers of na-tional and international standing for multi-annual supplies; on this basis consolidated historical relationships have been built up with the main customers. Generally speaking, these relationships are governed by ad hoc supply contracts. Credit control requires peri-odic monitoring of the main financial and economic data (including the delivery sched-ules) relating to each customer.
Except in special circumstances to do with country or counterparty risk, guarantees are not normally obtained on credit.
Receivables are recognised in the accounts net of any write-downs determined by as-sessing the counterparty’s risk of insolvency based on the information available.
Liquidity riskThe Group’s liquidity risk is mainly linked to the activation and maintenance of suffi-
cient funding to support industrial operations. The raising of funds, consistent with the Group’s short- and medium-term develop-
ment plans, is intended to finance both the working capital and investments in fixed as-sets necessary to ensure sufficient and technologically advanced production capacity. This requirement is directly proportional to the trend in customer orders and the consequent trend in business volumes.

Consolidated Financial Statements
The cash flows envisaged for 2016 include, besides the trend in working capital and investments, the effects of current liabilities and the short-term portions of medium- and long-term loans reaching maturity, as well as the effects (assuming the same rates of ex-change with compared to 31.12.2015) of the closure of derivative financial instruments on currencies in existence at the reporting date.
The Group envisages meeting the needs arising from all of the above with the flows deriving from operations, available liquidity and the availability of additional credit facili-ties.
In 2016, the Group expects to be able to generate financial resources through its opera-tions such as to ensure adequate support for investments.
The management of liquidity, funding requirements and cash flows are under the direct control and management of the Group Treasury, which operates with the aim of managing the resources available as efficiently as possible.
Uncertainties of financial markets have had an effect on the borrowing of banks and as a consequence on credit granted to businesses. This instability could also continue in 2016, preventing the normal execution of financial transactions.
Lastly, regardless of the fact that the Group has continued refinancing its debts with the support of its banking counterparties and the financial markets, the situation could arise of having to seek additional financing in less favourable market conditions, with the limited availability of such sources and an increase in financial expenses.
The maturity features of the Group’s liabilities and assets are shown in notes 10 and 16 relating respectively to non-current financial receivables and non-current financial pay-ables. The maturity features of derivative financial instruments are described in para-graph 9.2.
Exchange-rate risk and interest rate riskThe Group is exposed to exchange rate risks by virtue of the fact that a significant por-
tion of sales and some of the purchases are made in currencies other than the Group’s functional currency, with trade transactions carried out by companies in the Euros area with counterparties that do not belong to the Euros area and vice versa.
Another aspect of exchange rate risk is the fact that several Group companies present their financial statements in currencies other than the Group’s functional currency.
Exposure to exchange rate risk with reference to each entity is regularly monitored by the Group Treasury according to a strategy which focuses, in particular, on the balance between purchases and sales in foreign currency and activating, for the remaining non-balanced portion and according to the criteria set by the company policy in terms of the management of financial risks, appropriate initiatives to hedge or reduce the risks identi-fied, using the instruments available on the market.
The Group is also exposed to interest rate risk in relation to financial liabilities under-taken for loans for both ordinary operations and investments. Changes in interest rates may have positive or negative effects on both the financial outcome and on cash flows.
The strategy adopted pursues the basic objective of achieving a balance between float-ing-rate and fixed-rate debt. The interest rate risk on the floating portion is then reduced via specific hedging operations.

Annual Report 2015152 – 153
Intra-group transactionsAs regards related-party transactions, including intra-group transactions, said transac-
tions cannot be qualified as atypical or unusual, and are part or the normal operations of Group companies. Said transactions take place in market conditions, considering the characteristics of the goods and services provided.
Information on related-party transactions, including the information required by Con-sob Communication of 28 July 2006, is given in section 8.
4.Informazionipersettoridiattivitàeareegeografiche
Information on Operating Segments is given on the basis of internal reporting provided as at 31 December 2015 to the highest operating decision-making level.
For operational purposes, the group manages and controls its business on the basis of the type of products supplied.
Three operating segments were identified, corresponding to the following Business Ar-eas:
› Carraro Drive Tech (Transmission systems and components): specialised in the design, manufacture and sale of transmission systems (axles, transmissions and planetary drives) mainly for agricultural and construction equipment, and also markets a wide range of components and gears for very diverse sectors, from the automotive industry to light power tools, material handling, agricultural applications and construction equipment;
› Carraro Divisione Agritalia (Vehicles): designs and manufactures special tractors (from 60 to 100 hp) for third-party brands;
› Elettronica Santerno (Power electronics) designs, develops, manufactures and markets inverters (electronic power converters) mainly for the photovoltaic industry and indus-trial automation (HVAC, water treatment, lifting systems and large-scale transport).
The item «other segments» brings together the Groups operations not allocated to the three operating segments, and comprises the central holding and management activities of the Group.
The Management examines separately the results achieved by the operating segments in order to take decisions on the allocation of resources and on assessment of the results.
4.1 Businesssegments
The most significant information by business segment is presented in the tables below, with comparisons between financial years 2015 and 2014.

Consolidated Financial Statements
A. Economic data
2015 Drive Tech Agritalia Elettronica Santerno
Eliminations and items
not allocated
Consolidated Total
Revenues from sales 543,676 120,429 35,157 -25,252 674,010
Sales to third parties 522,627 116,192 35,146 45 674,010
Sales between divisions 21,049 4,237 11 -25,297 -
Operating costs 525,542 114,147 58,839 -24,849 673,679
Purchases of goods and materials 300,720 83,363 26,911 -21,175 389,819
Services 83,690 12,982 10,950 -2,531 105,091
Use of third-party goods and services 19,967 - 390 -15,758 4,599
Personnel costs 90,800 11,934 8,414 13,915 125,063
Amortisation, depreciation and impairment of assets
23,356 1,656 20,569 3,327 48,908
Changes in inventories 16,576 3,900 -8,948 -172 11,356
Provisions for risks 6,495 1,418 1,925 1,748 11,586
Other income and expenses -15,719 -64 -587 -1,388 -17,758
Internal construction -343 -1,042 -785 -2,815 -4,985
Operating profit/(loss) 18,134 6,282 -23,682 -403 331
Gains/(losses) on financial assets 12,762 -39 -2,731 -8,056 1,936
Current and deferred income taxes 4,714 341 312 6,006 11,373
Minorities -191 - - - -191
Net profit/(loss) 26,373 5,902 -26,725 -14,465 -8,915
2014 Drive Tech Agritalia Elettronica Santerno
Eliminations and items
not allocated
Consolidated Total
Revenues from sales 610,453 102,837 36,633 –22,166 727,757
Sales to third parties 592,462 98,468 36,542 285 727,757
Sales between divisions 17,991 4,369 91 –22,451 –
Operating costs 581,687 103,209 46,530 –15,775 715,651
Purchases of goods and materials 356,646 87,353 19,705 –22,107 441,597
Services 95,972 9,620 10,599 –2,587 113,604
Use of third-party goods and services 6,569 5 521 –1,960 5,135
Personnel costs 99,188 14,262 11,858 7,873 133,181
Amortisation, depreciation and impairment of assets
21,442 1,454 3,181 2,053 28,130
Changes in inventories 1,700 –11,289 814 371 –8,404
Provisions for risks 7,648 2,188 1,076 216 11,128
Other income and expenses –4,238 –91 –216 384 –4,161
Internal construction –3,240 – 293 –1,008 –18 –4,559
Operating profit/(loss) 28,766 –372 –9,897 –6,391 12,106
Gains/(losses) on financial assets –12,495 –98 –1,338 –3,145 –17,076
Current and deferred income taxes 9,600 235 –3,038 –3,926 2,871
Minorities 72 – – – 72
Net profit/(loss) 6,599 –705 –8,197 –5,610 –7,913
Am
ount
s in
Eur
o/0
00
Dat
i in
Euro
/00
0
Am
ount
s in
Eur
o/0
00
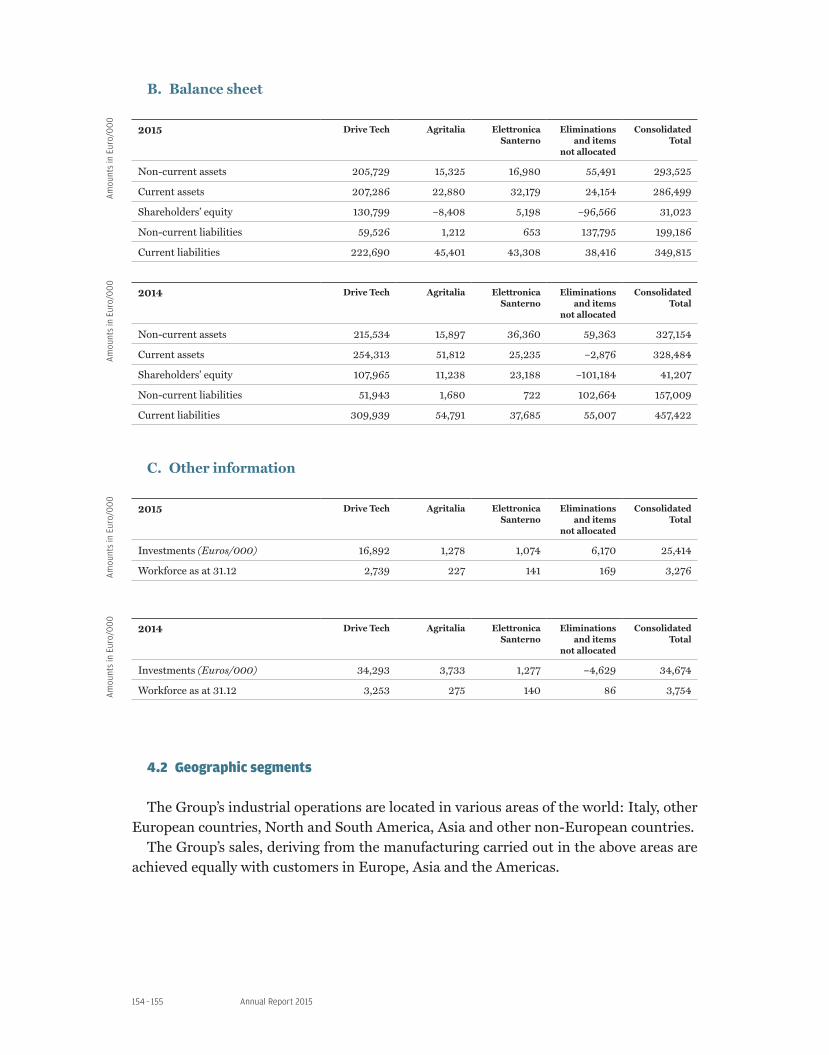
Annual Report 2015154 – 155
B. Balance sheet
2015 Drive Tech Agritalia Elettronica Santerno
Eliminations and items
not allocated
Consolidated Total
Non-current assets 205,729 15,325 16,980 55,491 293,525
Current assets 207,286 22,880 32,179 24,154 286,499
Shareholders’ equity 130,799 –8,408 5,198 –96,566 31,023
Non-current liabilities 59,526 1,212 653 137,795 199,186
Current liabilities 222,690 45,401 43,308 38,416 349,815
2014 Drive Tech Agritalia Elettronica Santerno
Eliminations and items
not allocated
Consolidated Total
Non-current assets 215,534 15,897 36,360 59,363 327,154
Current assets 254,313 51,812 25,235 –2,876 328,484
Shareholders’ equity 107,965 11,238 23,188 –101,184 41,207
Non-current liabilities 51,943 1,680 722 102,664 157,009
Current liabilities 309,939 54,791 37,685 55,007 457,422
C. Other information
2015 Drive Tech Agritalia Elettronica Santerno
Eliminations and items
not allocated
Consolidated Total
Investments (Euros/000) 16,892 1,278 1,074 6,170 25,414
Workforce as at 31.12 2,739 227 141 169 3,276
2014 Drive Tech Agritalia Elettronica Santerno
Eliminations and items
not allocated
Consolidated Total
Investments (Euros/000) 34,293 3,733 1,277 –4,629 34,674
Workforce as at 31.12 3,253 275 140 86 3,754
4.2 Geographicsegments
The Group’s industrial operations are located in various areas of the world: Italy, other European countries, North and South America, Asia and other non-European countries.
The Group’s sales, deriving from the manufacturing carried out in the above areas are achieved equally with customers in Europe, Asia and the Americas.
Am
ount
s in
Eur
o/0
00
Am
ount
s in
Eur
o/0
00
Am
ount
s in
Eur
o/0
00
Am
ount
s in
Eur
o/0
00
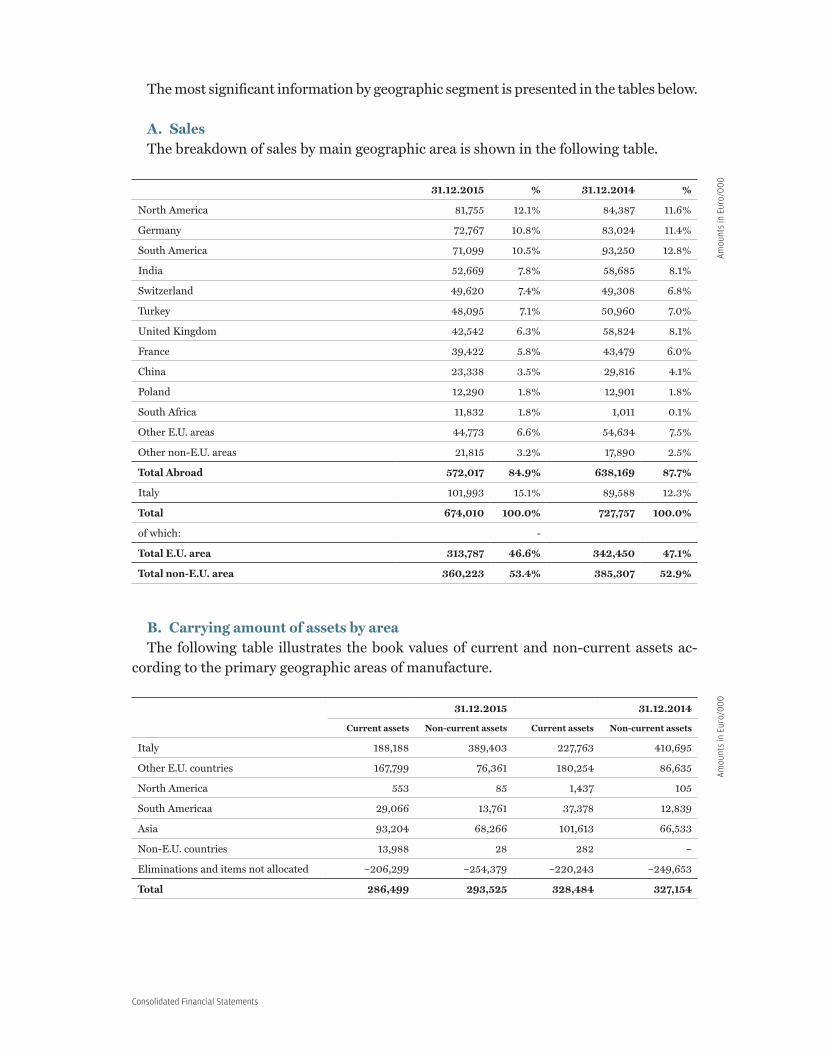
Consolidated Financial Statements
The most significant information by geographic segment is presented in the tables below.
A. SalesThe breakdown of sales by main geographic area is shown in the following table.
31.12.2015 % 31.12.2014 %
North America 81,755 12.1% 84,387 11.6%
Germany 72,767 10.8% 83,024 11.4%
South America 71,099 10.5% 93,250 12.8%
India 52,669 7.8% 58,685 8.1%
Switzerland 49,620 7.4% 49,308 6.8%
Turkey 48,095 7.1% 50,960 7.0%
United Kingdom 42,542 6.3% 58,824 8.1%
France 39,422 5.8% 43,479 6.0%
China 23,338 3.5% 29,816 4.1%
Poland 12,290 1.8% 12,901 1.8%
South Africa 11,832 1.8% 1,011 0.1%
Other E.U. areas 44,773 6.6% 54,634 7.5%
Other non-E.U. areas 21,815 3.2% 17,890 2.5%
Total Abroad 572,017 84.9% 638,169 87.7%
Italy 101,993 15.1% 89,588 12.3%
Total 674,010 100.0% 727,757 100.0%
of which: -
Total E.U. area 313,787 46.6% 342,450 47.1%
Total non-E.U. area 360,223 53.4% 385,307 52.9%
B. Carrying amount of assets by areaThe following table illustrates the book values of current and non-current assets ac-
cording to the primary geographic areas of manufacture.
31.12.2015 31.12.2014
Current assets Non-current assets Current assets Non-current assets
Italy 188,188 389,403 227,763 410,695
Other E.U. countries 167,799 76,361 180,254 86,635
North America 553 85 1,437 105
South Americaa 29,066 13,761 37,378 12,839
Asia 93,204 68,266 101,613 66,533
Non-E.U. countries 13,988 28 282 –
Eliminations and items not allocated –206,299 –254,379 –220,243 –249,653
Total 286,499 293,525 328,484 327,154
Am
ount
s in
Eur
o/0
00
Am
ount
s in
Eur
o/0
00
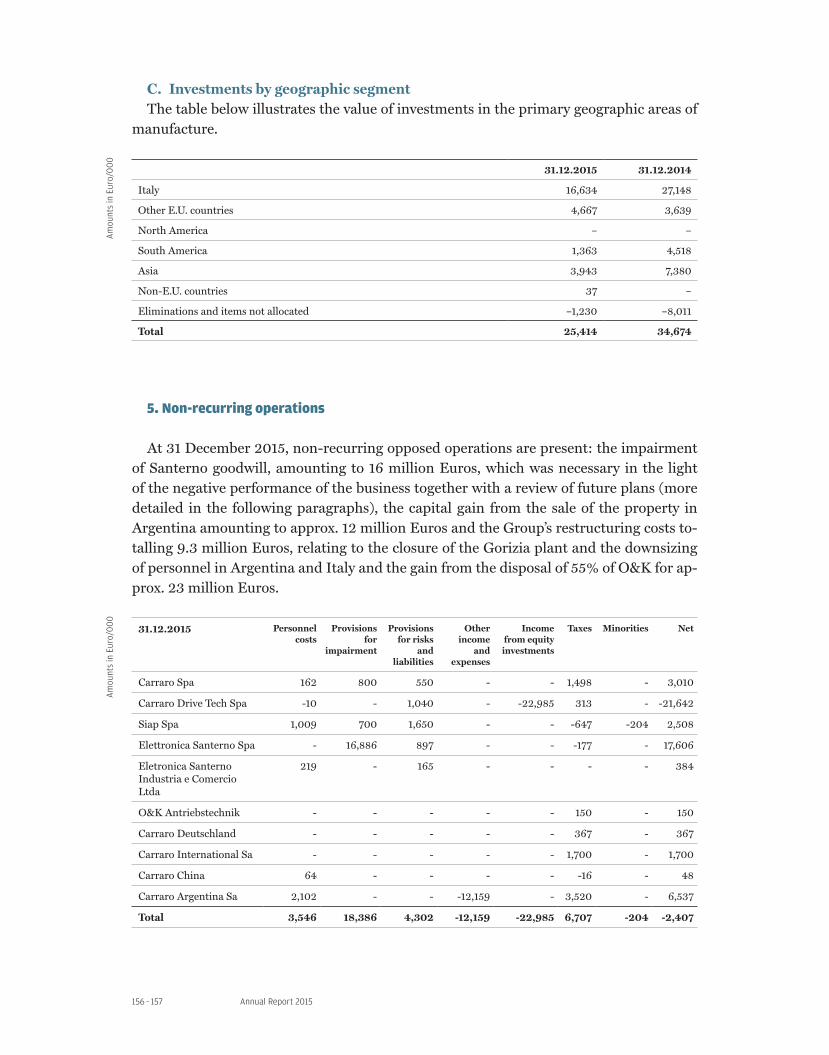
Annual Report 2015156 – 157
C. Investments by geographic segmentThe table below illustrates the value of investments in the primary geographic areas of
manufacture.
31.12.2015 31.12.2014
Italy 16,634 27,148
Other E.U. countries 4,667 3,639
North America – –
South America 1,363 4,518
Asia 3,943 7,380
Non-E.U. countries 37 –
Eliminations and items not allocated –1,230 –8,011
Total 25,414 34,674
5.Non-recurringoperations
At 31 December 2015, non-recurring opposed operations are present: the impairment of Santerno goodwill, amounting to 16 million Euros, which was necessary in the light of the negative performance of the business together with a review of future plans (more detailed in the following paragraphs), the capital gain from the sale of the property in Argentina amounting to approx. 12 million Euros and the Group’s restructuring costs to-talling 9.3 million Euros, relating to the closure of the Gorizia plant and the downsizing of personnel in Argentina and Italy and the gain from the disposal of 55% of O&K for ap-prox. 23 million Euros.
31.12.2015 Personnel costs
Provisionsfor
impairment
Provisions for risks
andliabilities
Other income
and expenses
Income from equity investments
Taxes Minorities Net
Carraro Spa 162 800 550 - - 1,498 - 3,010
Carraro Drive Tech Spa -10 - 1,040 - -22,985 313 - -21,642
Siap Spa 1,009 700 1,650 - - -647 -204 2,508
Elettronica Santerno Spa - 16,886 897 - - -177 - 17,606
Eletronica Santerno Industria e Comercio Ltda
219 - 165 - - - - 384
O&K Antriebstechnik - - - - - 150 - 150
Carraro Deutschland - - - - - 367 - 367
Carraro International Sa - - - - - 1,700 - 1,700
Carraro China 64 - - - - -16 - 48
Carraro Argentina Sa 2,102 - - -12,159 - 3,520 - 6,537
Total 3,546 18,386 4,302 -12,159 -22,985 6,707 -204 -2,407
Am
ount
s in
Eur
o/0
00
Am
ount
s in
Eur
o/0
00
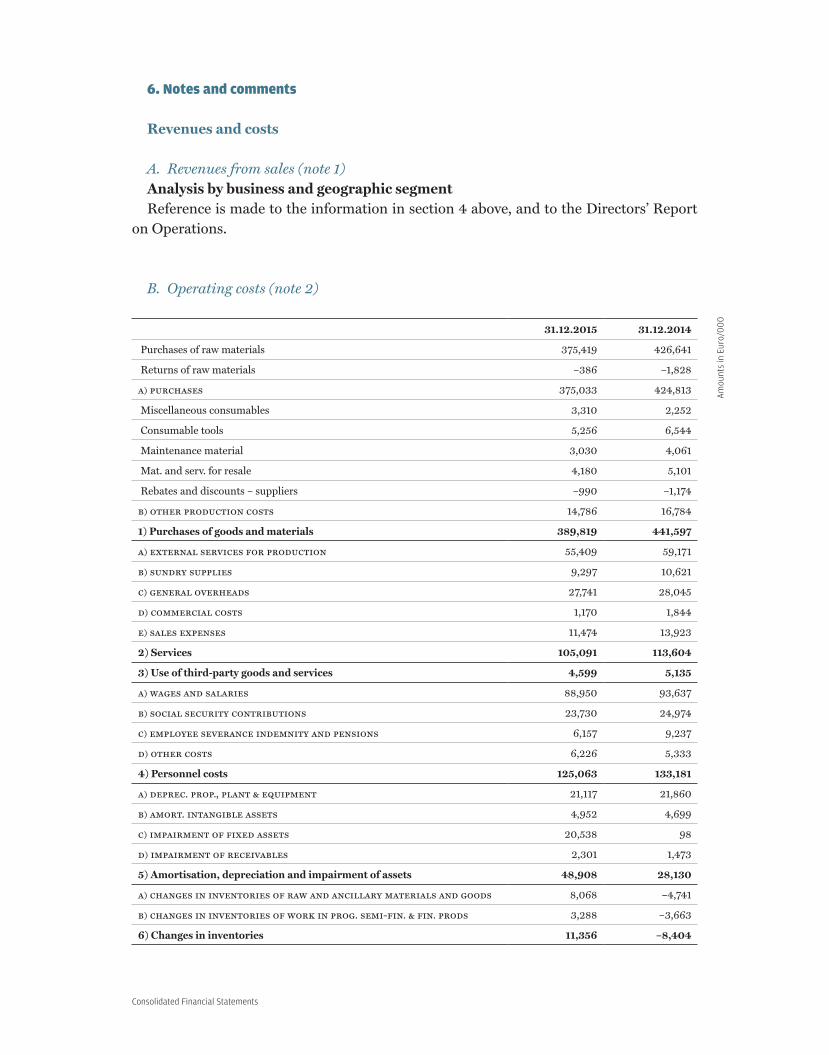
Consolidated Financial Statements
6.Notesandcomments
Revenues and costs
A. Revenues from sales (note 1)Analysis by business and geographic segmentReference is made to the information in section 4 above, and to the Directors’ Report
on Operations.
B. Operating costs (note 2)
31.12.2015 31.12.2014
Purchases of raw materials 375,419 426,641
Returns of raw materials –386 –1,828
a) purchases 375,033 424,813
Miscellaneous consumables 3,310 2,252
Consumable tools 5,256 6,544
Maintenance material 3,030 4,061
Mat. and serv. for resale 4,180 5,101
Rebates and discounts – suppliers –990 –1,174
b) other production costs 14,786 16,784
1) Purchases of goods and materials 389,819 441,597
a) external services for production 55,409 59,171
b) sundry supplies 9,297 10,621
c) general overheads 27,741 28,045
d) commercial costs 1,170 1,844
e) sales expenses 11,474 13,923
2) Services 105,091 113,604
3) Use of third-party goods and services 4,599 5,135
a) wages and salaries 88,950 93,637
b) social security contributions 23,730 24,974
c) employee severance indemnity and pensions 6,157 9,237
d) other costs 6,226 5,333
4) Personnel costs 125,063 133,181
a) deprec. prop., plant & equipment 21,117 21,860
b) amort. intangible assets 4,952 4,699
c) impairment of fixed assets 20,538 98
d) impairment of receivables 2,301 1,473
5) Amortisation, depreciation and impairment of assets 48,908 28,130
a) changes in inventories of raw and ancillary materials and goods 8,068 –4,741
b) changes in inventories of work in prog. semi-fin. & fin. prods 3,288 –3,663
6) Changes in inventories 11,356 –8,404
Am
ount
s in
Eur
o/0
00

Annual Report 2015158 – 159
31.12.2015 31.12.2014
a) warranty 5,240 7,963
b) costs of legal claims 564 317
c) renovation and conv. 4,310 1,656
d) other provisions 1,472 1,192
7) Provision for risks and other liabilities 11,586 11,128
a) sundry income –19,109 –8,714
b) grants –336 –290
c) other operating expenses 2,744 5,692
d) other non-ordinary operating income/expenses –1,057 –849
8) Other Income and Expenses –17,758 –4,161
9) Internal Construction –4,985 –4,559
C. Net income from financial assets (note 3)
31.12.2015 31.12.2014
10) Income/expenses from equity investments 22,825 475
a) from financial assets 11 166
b) from bank current accounts and deposits 167 47
c) from other cash equivalents 139 242
d) income other than the above 3,448 3,450
e) from fair value changes, interest rate derivatives –1 1
11) Other financial income 3,764 3,906
a) from financial liabilities –12,687 –12,860
b) from bank current accounts and deposits –6,435 –4,206
c) expenses other than the above –1,047 –1,415
d) from fair value changes, interest rate derivatives –13 –71
12) Financial costs and expenses –20,182 –18,552
From derivative transactions on exchange rates –10,878 –9,326
From changes in fair value of derivative transactions on exchange rates 597 –353
Other –26,511 –12,760
Negative exchange differences: –36,792 –22,439
From derivative transactions on exchange rates 9,853 4,508
From changes in fair value of derivative transactions on exchange rates –1,837 1,682
Other 24,305 13,344
Positive exchange differences: 32,321 19,534
13) Net gains/(losses) on foreign exchange –4,471 –2,905
Net gains/(losses) on financial assets 1,936 –17,076
Income from equity investments mainly refers to the gain realised on the partial dis-posal of the subsidiary O&K Antriebstechnik. For further details, please refer to the previ-ous paragraph “Changes in the scope of consolidation and other company reorganisation operations”.
Am
ount
s in
Eur
o/0
00

Consolidated Financial Statements
In 2015, the increase in net financial expenses, which rose from 14.646 million Euros in the previous year to 16.418 million Euros in 2015, is mainly attributable to expenses re-sulting from the signing of the new banks agreement for the part concerning the renewal of short-term credit lines, approx. 2.5 million Euros.
Exchange differences as at 31 December 2015 were negative, amounting to 4.5 million Euros (-0.7% of turnover) compared to a negative value of 2.905 million Euros (-0.4% of turnover) as at 31 December 2014. The deterioration is attributable to the significant depreciation effects of the Peso (approx. 2.5 million Euros) particularly significant in the last few days of the year.
In addition, the change in exchange differences includes the economic effect of the change in the fair value of derivatives to hedge the exchange risk, equal to -1.2 million Euros as at 31 December 2015 (1.3 million Euros in 2014).
For further details and analysis, see section 9.1 “General summary of the effects on the Income Statement deriving from financial instruments”.
Current and deferred income taxes (note 4)
31.12.2015 31.12.2014
Current taxes 5,471 13,001
Tax consolidation expense and income – –5,388
Taxes from previous years 2,259 –616
Deferred taxes 3,126 –4,126
Provision for tax risks relative to direct taxes 517 –
15) Current and deferred income taxes 11,373 2,871
Current taxesTax on the income of Italian companies is calculated at 27.50%, for Ires (corporation
tax), and at 3.90% for Irap (regional business tax) on the respective taxable income for the period. Taxes for the other foreign companies are calculated at the rates in force in the various countries.
Tax consolidation expense and incomeCarraro Spa, Carraro Drive Tech Spa, Siap Spa, Carraro International Sa and Elettroni-
ca Santerno Spa adhere to the tax consolidation area of the parent company Carraro Spa. The option is valid for the three years 2015-2017. The charges/income deriving from the transfer of the Ires taxable base are booked under current taxes.
Taxes from previous yearsWith regard to the Verification with Acceptance procedure, initiated in February 2015,
following verification by the Tax Police of Venice of the Carraro Group with regard to for-eign companies (Carraro India Pvt Ltd, Turbo Gears Pvt Ltd, Carraro Technologies Pvt Ltd, Elettronica Santerno Espana Sl, Carraro China Drives Co. Ltd, Mg MiniGears Su-
Am
ount
s in
Eur
o/0
00

Annual Report 2015160 – 161
zhou Co. Ltd, Mg MiniGears Shanghai Co. Ltd, Carraro International Sa) for 2008/2012, the same was settled on 27 May 2015 with the abandonment by the Office of the find-ings against Carraro India Pvt Ltd, Turbo Gears Pvt Ltd, Carraro Technologies Pvt Ltd, Elettronica Santerno Espana Sl, Carraro China Drives Co. Ltd, Mg MiniGears Suzhou Co. Ltd, Mg MiniGears Shanghai Co. Ltd and acceptance of Carraro International Sa. This procedure involves a liability of approx. 1.7 million fully recognised.
Deferred taxesThese are set aside on the temporary differences between the carrying amount of the
assets and liabilities and the corresponding tax value.Among deferred taxes, the adjustment as a result of Law 208/2015 of 2.2 million Euros
is pointed out. The adjustment involves, for Italian companies of the Carraro Group, the transition
from the current corporate income tax (Ires) rate of 27.5% to the new rate of 24% with effect from the tax year subsequent to 31.12.2016.
The provisions for taxation for the year can be reconciled with the result recorded in the financial statements as follows:
31.12.2015 % 31.12.2014 %
Earnings before tax 2,267 –4,970
Theoretical tax rate 712 31.40% –1,561 31.40%
Tax effects related to:
Effect of non-deductible costs 10,883 480.07% 2,351 –47.30%
Untaxable income –10,681 –471.13% –605 12.17%
Unrecognised deferred taxes on tax losses –27 –1.17% 2,123 –42.71%
Other unrecognised deferred tax assets 3,384 149.27% 2,798 –56.30%
Change in deferred tax rate – – – –
Adjustment of deferred taxes of previous year 1,219 53.77% –4,280 86.12%
Use of previous tax losses –67 –2.93% –2,128 42.82%
Foreign companies rate difference –142 –6.35% 239 –4.81%
Provisions for tax risks 517 22.80% – –
Withheld at source 1,763 77.77% 4,550 –91.55%
Deferred tax adjustment Italian Law 208/2015
2,207 97.35%
Taxes from previous years 1,605 70.80% –616 12.39%
Taxation at effective rate 11,373 501.62% 2,871 –57.77%
Withholding taxes refer to the impairment, due to the uncertain recoverability, of re-ceivables for withholding taxes on foreign income (1.7 million Euros).
As well as taxes recognised in the income statement for the year, deferred tax liabilities of 0.1 million Euros were directly recognised in the statement of comprehensive income.
Am
ount
s in
Eur
o/0
00

Consolidated Financial Statements
Earning (loss) per share (note 5)Basic earnings (losses) per share are calculated by dividing the net earnings (net losses)
for the year attributable to the company’s ordinary shareholders by the weighted average number of outstanding ordinary shares during the year.
31.12.2015 31.12.2014
Results
Earnings (Losses) for the purposes of calculating basic earnings per share –8,915 –7,913
Diluting effect deriving from potential ordinary shares – –
Earnings (Losses) for the purposes of calculating diluted earnings per share –8,915 –7,913
Number of shares
Weighted average number of ordinary shares for calculating
basic earnings (losses) per share 43,362,812 43,246,626
diluted earnings (losses) per share 43,362,812 43,246,626
Basic earnings (losses) per share (Euros) –0.21 –0.18
Diluted earnings (losses) per share (Euros) –0.21 –0.18
DividendsCarraro Spa did not pay dividends in 2015 and 2014.
Property, plant and equipment (note 6)These items present a net balance of 163.83 million Euros compared with 185.40 mil-
lion Euros in the previous period. The breakdown is as follows:
Items Land and buildings
Plant and machinery
Industrial equipment
Other assets
Investments in progress
and deposits
Total
Historical cost 79,732 210,250 123,805 19,665 9,798 443,250
Provisions for amortisation and depreciations
–21,570 –115,814 –88,817 –14,819 – –241,020
Net as at 31.12.2013 58,162 94,436 34,988 4,846 9,798 202,230
Movements in 2014:
Increases 853 10,241 5,879 1,005 8,748 26,726
Decreases –2,568 –1,131 –155 –132 –99 –4,085
Capitalisation 162 5,991 675 44 –6,870 2
Change in consolidation scope 1 –15,212 –4,978 –453 –1,665 –22,307
Depreciation and amortisa-tion
–1,958 –11,018 –7,734 –1,150 – –21,860
Reclassification –11 534 80 37 –795 – 155
Impairment – –98 – – – –98
Foreign exchange translation difference
1,189 2,320 696 91 654 4,950
Net as at 31.12.2014 55,830 86,063 29,451 4,288 9,771 185,403
Am
ount
s in
Eur
o/0
00
Am
ount
s in
Eur
o/0
00
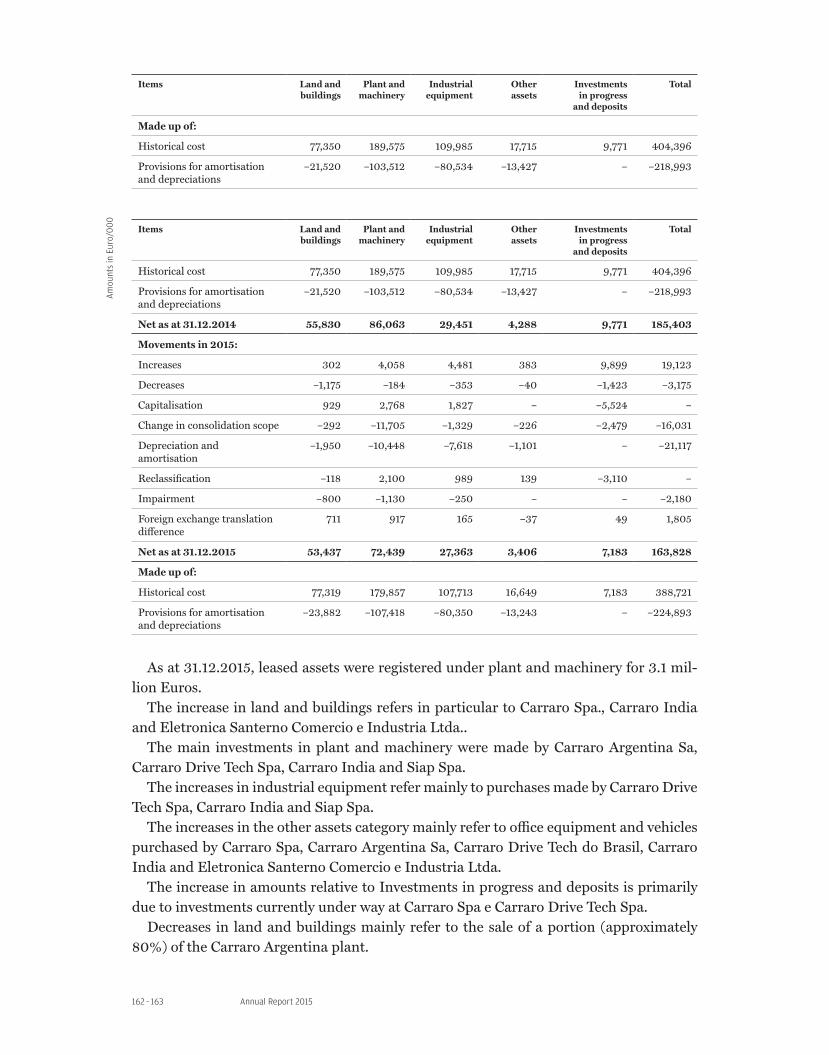
Annual Report 2015162 – 163
Items Land and buildings
Plant and machinery
Industrial equipment
Other assets
Investments in progress
and deposits
Total
Made up of:
Historical cost 77,350 189,575 109,985 17,715 9,771 404,396
Provisions for amortisation and depreciations
–21,520 –103,512 –80,534 –13,427 – –218,993
Items Land and buildings
Plant and machinery
Industrial equipment
Other assets
Investments in progress
and deposits
Total
Historical cost 77,350 189,575 109,985 17,715 9,771 404,396
Provisions for amortisation and depreciations
–21,520 –103,512 –80,534 –13,427 – –218,993
Net as at 31.12.2014 55,830 86,063 29,451 4,288 9,771 185,403
Movements in 2015:
Increases 302 4,058 4,481 383 9,899 19,123
Decreases –1,175 –184 –353 –40 –1,423 –3,175
Capitalisation 929 2,768 1,827 – –5,524 –
Change in consolidation scope –292 –11,705 –1,329 –226 –2,479 –16,031
Depreciation and amortisation
–1,950 –10,448 –7,618 –1,101 – –21,117
Reclassification –118 2,100 989 139 –3,110 –
Impairment –800 –1,130 –250 – – –2,180
Foreign exchange translation difference
711 917 165 –37 49 1,805
Net as at 31.12.2015 53,437 72,439 27,363 3,406 7,183 163,828
Made up of:
Historical cost 77,319 179,857 107,713 16,649 7,183 388,721
Provisions for amortisation and depreciations
–23,882 –107,418 –80,350 –13,243 – –224,893
As at 31.12.2015, leased assets were registered under plant and machinery for 3.1 mil-lion Euros.
The increase in land and buildings refers in particular to Carraro Spa., Carraro India and Eletronica Santerno Comercio e Industria Ltda..
The main investments in plant and machinery were made by Carraro Argentina Sa, Carraro Drive Tech Spa, Carraro India and Siap Spa.
The increases in industrial equipment refer mainly to purchases made by Carraro Drive Tech Spa, Carraro India and Siap Spa.
The increases in the other assets category mainly refer to office equipment and vehicles purchased by Carraro Spa, Carraro Argentina Sa, Carraro Drive Tech do Brasil, Carraro India and Eletronica Santerno Comercio e Industria Ltda.
The increase in amounts relative to Investments in progress and deposits is primarily due to investments currently under way at Carraro Spa e Carraro Drive Tech Spa.
Decreases in land and buildings mainly refer to the sale of a portion (approximately 80%) of the Carraro Argentina plant.
Am
ount
s in
Eur
o/0
00
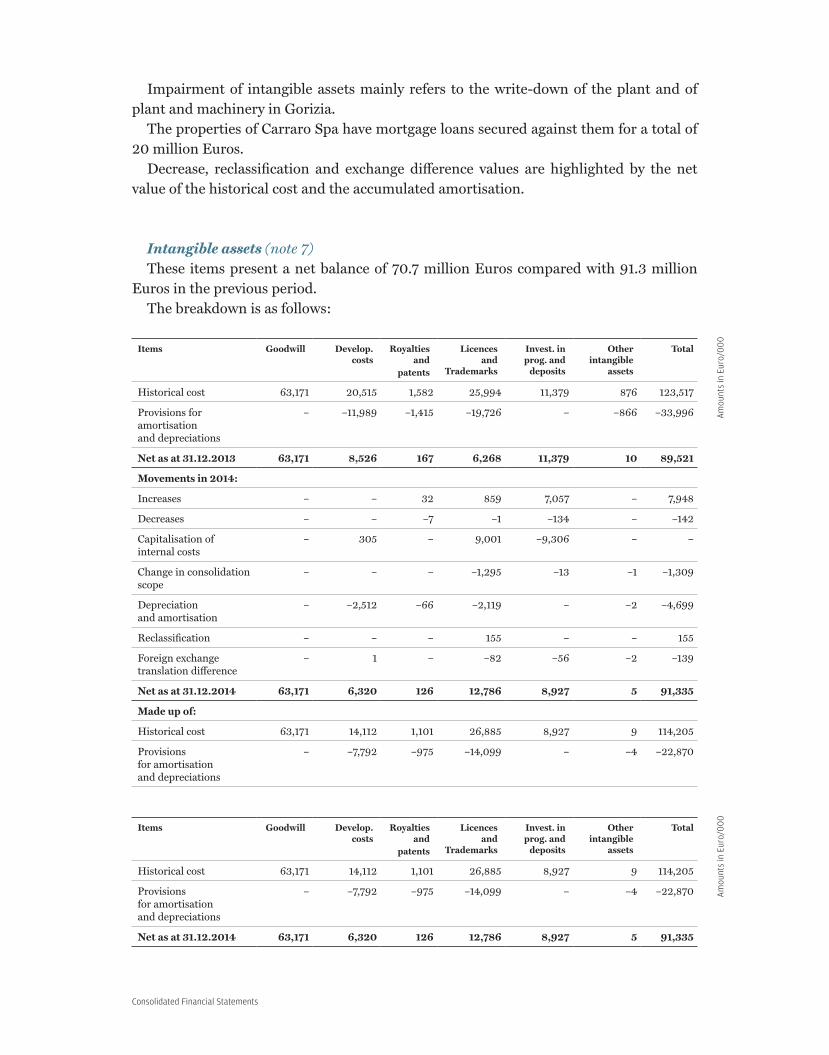
Consolidated Financial Statements
Impairment of intangible assets mainly refers to the write-down of the plant and of plant and machinery in Gorizia.
The properties of Carraro Spa have mortgage loans secured against them for a total of 20 million Euros.
Decrease, reclassification and exchange difference values are highlighted by the net value of the historical cost and the accumulated amortisation.
Intangible assets (note 7)These items present a net balance of 70.7 million Euros compared with 91.3 million
Euros in the previous period.The breakdown is as follows:
Items Goodwill Develop.costs
Royalties and
patents
Licences and
Trademarks
Invest. in prog. and
deposits
Other intangible
assets
Total
Historical cost 63,171 20,515 1,582 25,994 11,379 876 123,517
Provisions for amortisation and depreciations
– –11,989 –1,415 –19,726 – –866 –33,996
Net as at 31.12.2013 63,171 8,526 167 6,268 11,379 10 89,521
Movements in 2014:
Increases – – 32 859 7,057 – 7,948
Decreases – – –7 –1 –134 – –142
Capitalisation of internal costs
– 305 – 9,001 –9,306 – –
Change in consolidation scope
– – – –1,295 –13 –1 –1,309
Depreciation and amortisation
– –2,512 –66 –2,119 – –2 –4,699
Reclassification – – – 155 – – 155
Foreign exchange translation difference
– 1 – –82 –56 –2 –139
Net as at 31.12.2014 63,171 6,320 126 12,786 8,927 5 91,335
Made up of:
Historical cost 63,171 14,112 1,101 26,885 8,927 9 114,205
Provisions for amortisation and depreciations
– –7,792 –975 –14,099 – –4 –22,870
Items Goodwill Develop.costs
Royalties and
patents
Licences and
Trademarks
Invest. in prog. and
deposits
Other intangible
assets
Total
Historical cost 63,171 14,112 1,101 26,885 8,927 9 114,205
Provisions for amortisation and depreciations
– –7,792 –975 –14,099 – –4 –22,870
Net as at 31.12.2014 63,171 6,320 126 12,786 8,927 5 91,335
Am
ount
s in
Eur
o/0
00
Am
ount
s in
Eur
o/0
00

Annual Report 2015164 – 165
Items Goodwill Develop.costs
Royalties and
patents
Licences and
Trademarks
Invest. in prog. and
deposits
Other intangible
assets
Total
Movements in 2015:
Increases – – 55 944 5,292 – 6,291
Decreases – – – –433 – – –433
Capitalisation of internal costs
– 1,820 – 484 –2,304 – –
Change in consolidation scope
–3,000 – – –163 – –3 –3,166
Depreciation and amortisation
– –2,683 –54 –2,213 – –2 –4,952
Impairment –17,500 –858 – – – – –18,358
Foreign exchange translation difference
– – – 942 –957 – –15
Net as at 31.12.2015 42,671 4,599 127 12,347 10,958 – 70,702
Made up of:
Historical cost 60,171 15,933 1,156 28,269 10,958 – 116,487
Provisions for amortisation and depreciations
–17,500 –11,334 –1,029 –15,922 – – –45,785
The other intangible fixed assets with a limited useful life are amortised on a straight-line basis over terms estimated at between 3 and 5 years.
Decrease, reclassification and exchange difference values are highlighted by the net value of the historical cost and the accumulated amortisation.
Goodwill and Impairment TestsGoodwillGoodwill is attributed to the Cgus (cash generating units) as shown in the following
table.
Business Area (Cgu) 2014 Changes 2015
Drivetech 41,294 –4,500 36,794
Santerno 21,877 –16,000 5,877
Total 63,171 –20,500 42,671
The assets of the Cgus were tested for impairment as described below.
Impairment TestsImpairment tests were carried out, applying the provisions of Ias 36, with the applica-
tion criteria described below, also considering guidelines on methodologies issued by the OIV (Italian Valuation Standard Setter), in particular the indications provided by: i) Ap-plication no. 2 published by the OIC in December 2009; ii) the Guidelines with regard to Impairment Tests, published by the OIV on 14 June 2012; iii) Consob communication no. 0003907 of 19 January 2015; iv) guidelines (in terms of plans) of the Italian Valuation Standards issued by the OIV in July 2015:
Am
ount
s in
Eur
o/0
00

Consolidated Financial Statements
› the recoverable value of the assets of the cash generating units (henceforth “CGUs”) was ascertained by identifying their “value in use” obtained from the present value of the expected operating cash flows of these assets applying a rate expressing the risks of the single “CGUs” considered;
› for the purpose of impairment testing for the Consolidated Financial Statements as at 31 December 2015, and as for the previous year, the “CGUs” were identified as the three business areas: “Drivetech”, “Santerno” and “Agritalia”. As in previous years, testing was also carried out at a Group level overall, although impairment indicators were not identified and in particular, the average Stock Exchange capitalisation value was higher than the carrying amount of shareholders’ equity;
› the reference time horizon for the estimate of future cash flows is a period of four years, subsequently using the perpetual return criterion;
› the expected cash flow projections are based on: i) the 2016 budget approved by the Board of Directors on 18 December 2015; ii) the 2017-19 Business Plan approved by the Board of Directors on 23 September 2015;
› the future cash flow estimates were determined based on criteria of prudence with regard to both growth rates as well as margin evolution. The cash flow projections refer to current operating conditions and therefore do not include the cash flows aris-ing from any extraordinary interventions;
› the terminal value was estimated based on the values of the last year of analytical forecasting; a “standard” tax rate was applied, which, for conservative purposes, does not consider any tax recovery arising from the use of previous losses. The estimated, forward-looking growth rate (“g”) is equal to zero. The figures of the projections are expressed in real terms;
› for the Santerno Cgu, considering the previous losses, a multi-scenario cash flow projection has been developed with reference to: (i) a base case, corresponding to the Plan approved by the Board of Directors; (ii) a worst case, corresponding to the forecasts drawn up by Roland Berger in October 2015 as part of the Independent Business Review of the 2016-19 Business Plan;
› Wacc (weighted average cost of capital) rates were used to discount flows, calculated analysing comparable company data in relation to each Cgu (cash generating unit), so as to reflect the risk level of each segment of activity, as well as uncertainties re-lated to the current economic context. The rates were determined net of the tax ef-fect. The change in taxes from one year to another is affected, among others, by the change in the cost of money and update to the basket of comparable companies for each segment of activity. In line with the decisions taken in previous years, for each Cgu a degree of “historical” error (in terms of overstatement) inherent in the fore-casts prepared by the Group’s management has been measured. This margin of error gave rise an increase in the rate used. Unlike previous years and in line with the OIV document of June 2012, a second and further increase has also been considered, de-termined by comparing the Ebitda margin envisaged in the data used for the 2014 impairment test with that envisaged in the Plan used for the test as at 31 December 2015. This calculation gave rise to a second and further increase in the rate used.

Annual Report 2015166 – 167
The rates used for each Cgu and for the Group overall, are indicated below:
WACCDiscount rate net of taxes
Carraro Group 8.71%
Drive Tech Cgu 8.50%
Santerno Cgu 9.43%
Agritalia Cgu 6.11%
› the sensitivity analysis of the difference between the value in use and the carrying amount was performed:
– varying some of the basic parameters of the estimate made, in compliance with the Consob Communication of 19 January 2015. In particular, a sensitivity analy-sis was carried out on the following variables: Wacc (increased, in the light of the trend in market rates, by 25 bp and 50 bp, and determination of the rate that elimi-nates the difference between Enterprise Value and Nic), Ebit (decreased by 5% and 10% and determination of the percentage reduction that eliminates the difference between Enterprise Value and Nic), Turnover (for the Santerno Cgu reduction in turnover of the “photovoltaic” sector of 5%, for the Drive Tech Cgu, reduction in “base” turnover of 10%)
– taking into account the different business risk levels of the CGUs.
Parameters used for sensitivity analysis are indicated below: in particular, the discount rate and the Ebit reduction in the period in question which makes recoverable values equal to the carrying amounts is indicated:
Wacc Ebit
Carraro Group 12.49% –33.12%
Drive Tech Cgu 14.45% –45.22%
Santerno Cgu (°) (°)
Agritalia Cgu (° °) (° °)
° in the Santerno Cgu, considering that the delta between Enterprise Value and Net Invested Capital is negative, the zeroing Wacc would be lower than that of the test and Ebit would be higher than that of the test.° ° in the case of the Agritalia Cgu, the negative value of Net Invested Capital means that sensitivity analysis cannot be applied.
Sensitivity analysis was not carried out for the Agritalia CGU, as the carrying amount of net invested capital as at 31 December 2015 was negative (-7 million Euros).
The impairment test conducted on the three CGUs according to the criteria explained above was negative for the Santerno CGU, both in the case of base cash flow projections as well as in the worst case. The Group, in relation to the historical trends of the company in recent years and in view of the change in the management of the CGU in the second part, considered it appropriate to write down the goodwill based on the results of the impair-ment test in the worst case, with an overall impact of 16 million Euros.
The procedure adopted and impairment testing were approved by the Board of Direc-tors independently and before approval of the financial statements.
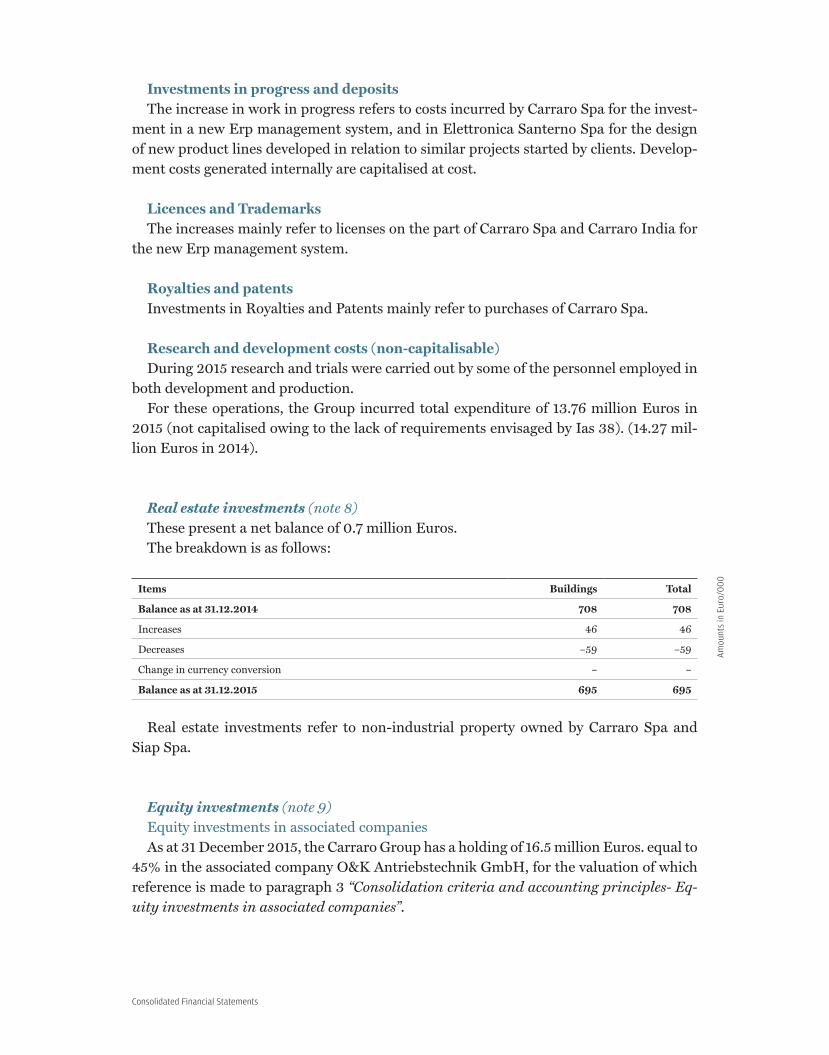
Consolidated Financial Statements
Investments in progress and depositsThe increase in work in progress refers to costs incurred by Carraro Spa for the invest-
ment in a new Erp management system, and in Elettronica Santerno Spa for the design of new product lines developed in relation to similar projects started by clients. Develop-ment costs generated internally are capitalised at cost.
Licences and TrademarksThe increases mainly refer to licenses on the part of Carraro Spa and Carraro India for
the new Erp management system.
Royalties and patentsInvestments in Royalties and Patents mainly refer to purchases of Carraro Spa.
Research and development costs (non-capitalisable)During 2015 research and trials were carried out by some of the personnel employed in
both development and production.For these operations, the Group incurred total expenditure of 13.76 million Euros in
2015 (not capitalised owing to the lack of requirements envisaged by Ias 38). (14.27 mil-lion Euros in 2014).
Real estate investments (note 8)These present a net balance of 0.7 million Euros.The breakdown is as follows:
Items Buildings Total
Balance as at 31.12.2014 708 708
Increases 46 46
Decreases –59 –59
Change in currency conversion – –
Balance as at 31.12.2015 695 695
Real estate investments refer to non-industrial property owned by Carraro Spa and Siap Spa.
Equity investments (note 9)Equity investments in associated companiesAs at 31 December 2015, the Carraro Group has a holding of 16.5 million Euros. equal to
45% in the associated company O&K Antriebstechnik GmbH, for the valuation of which reference is made to paragraph 3 “Consolidation criteria and accounting principles- Eq-uity investments in associated companies”.
Am
ount
s in
Eur
o/0
00
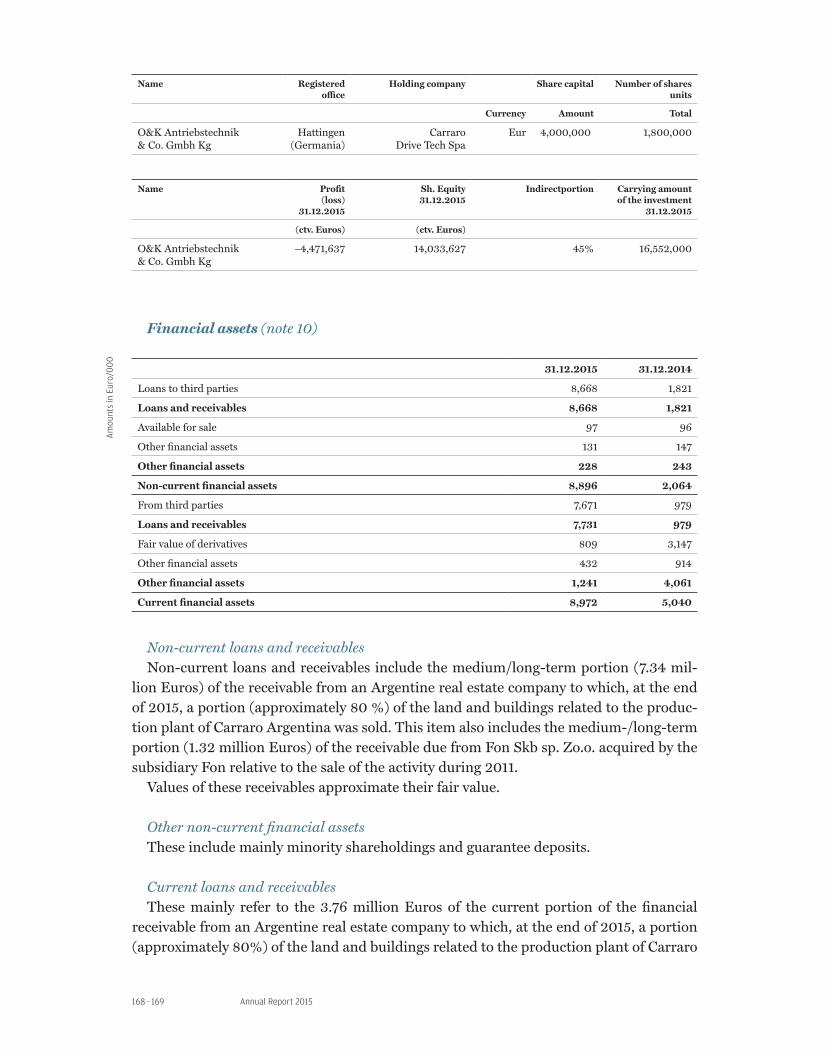
Annual Report 2015168 – 169
Name Registered office
Holding company Share capital Number of sharesunits
Currency Amount Total
O&K Antriebstechnik & Co. Gmbh Kg
Hattingen (Germania)
Carraro Drive Tech Spa
Eur 4,000,000 1,800,000
Name Profit(loss)
31.12.2015
Sh. Equity 31.12.2015
Indirectportion Carrying amount of the investment
31.12.2015
(ctv. Euros) (ctv. Euros)
O&K Antriebstechnik & Co. Gmbh Kg
–4,471,637 14,033,627 45% 16,552,000
Financial assets (note 10)
31.12.2015 31.12.2014
Loans to third parties 8,668 1,821
Loans and receivables 8,668 1,821
Available for sale 97 96
Other financial assets 131 147
Other financial assets 228 243
Non-current financial assets 8,896 2,064
From third parties 7,671 979
Loans and receivables 7,731 979
Fair value of derivatives 809 3,147
Other financial assets 432 914
Other financial assets 1,241 4,061
Current financial assets 8,972 5,040
Non-current loans and receivablesNon-current loans and receivables include the medium/long-term portion (7.34 mil-
lion Euros) of the receivable from an Argentine real estate company to which, at the end of 2015, a portion (approximately 80 %) of the land and buildings related to the produc-tion plant of Carraro Argentina was sold. This item also includes the medium-/long-term portion (1.32 million Euros) of the receivable due from Fon Skb sp. Zo.o. acquired by the subsidiary Fon relative to the sale of the activity during 2011.
Values of these receivables approximate their fair value.
Other non-current financial assetsThese include mainly minority shareholdings and guarantee deposits.
Current loans and receivablesThese mainly refer to the 3.76 million Euros of the current portion of the financial
receivable from an Argentine real estate company to which, at the end of 2015, a portion (approximately 80%) of the land and buildings related to the production plant of Carraro
Am
ount
s in
Eur
o/0
00

Consolidated Financial Statements
Argentina was sold. They also include the remaining receivable of 3.18 million Euros con-cerning the sale, which took place on 30 December 2015, of 55% of the German company O&K Antriebstechnik GmbH to Bonfiglioli Riduttori Spa.
Other current financial assetsThis item includes “cash flow hedge” derivatives for 0.8 million Euros. The amount re-
fers to the fair value calculated as at 31.12.2015 on current instruments on currencies. As described in detail in the section on derivative financial instruments (Paragraph 9), profits or losses deriving from hedging instruments are recognised in the statement of compre-hensive income and accumulated in a specific shareholders’ equity reserve for the efficient part, while the remaining (inefficient) portion is recognised in the income statement.
Deferred tax assets and liabilities (note 11)The table below illustrates the composition of deferred taxation by the nature of the
temporary differences that determine it. The change corresponds to the effect of deferred taxes on net equity and income.
Description of differences Opening31.12.2014
Reclassific.
Change in consolidation
scope
Effect Differenceexchange
Closing31.12.2015
on income statement
on net equity
Assets
Depreciation and amortisation
21,018 – –1,083 –4,058 –2,113 – 13,764
Measurement of receivables 476 – – –321 234 – 389
Measurement of financial assets/liabilities
48 –7 – 2 98 – 141
Discounting of employee severance indemnity
271 – –850 867 –54 – 234
Allocations to provisions 15,768 – –811 –4,148 368 36 11,213
Tax losses 3,738 – 100 –4,582 3,624 – – 2,680
Other 2,187 100 – –868 –6 –43 1,370
Personnel bonuses 18 – – –13 – – 5
Total 43,524 –7 –7,326 –4,915 –1,473 –7 29,796
Liabilities
Depreciation and amortisation
–5,620 – – 543 1,150 – –3,927
Measurement of receivables 234 – – – –234 – –
Measurement of financial assets/liabilities
–87 7 – – 112 – 32
Discounting of employee severance indemnity
8 – – –8 –
Allocations to provisions 855 – – 445 –368 – 288 644
Other –743 – – 801 –17 –4 37
Total –5,353 7 – 1,789 635 –292 –3,214
Balance 38,171 – –7,326 –3,126 –838 –299 26,582
Am
ount
s in
Eur
o/0
00
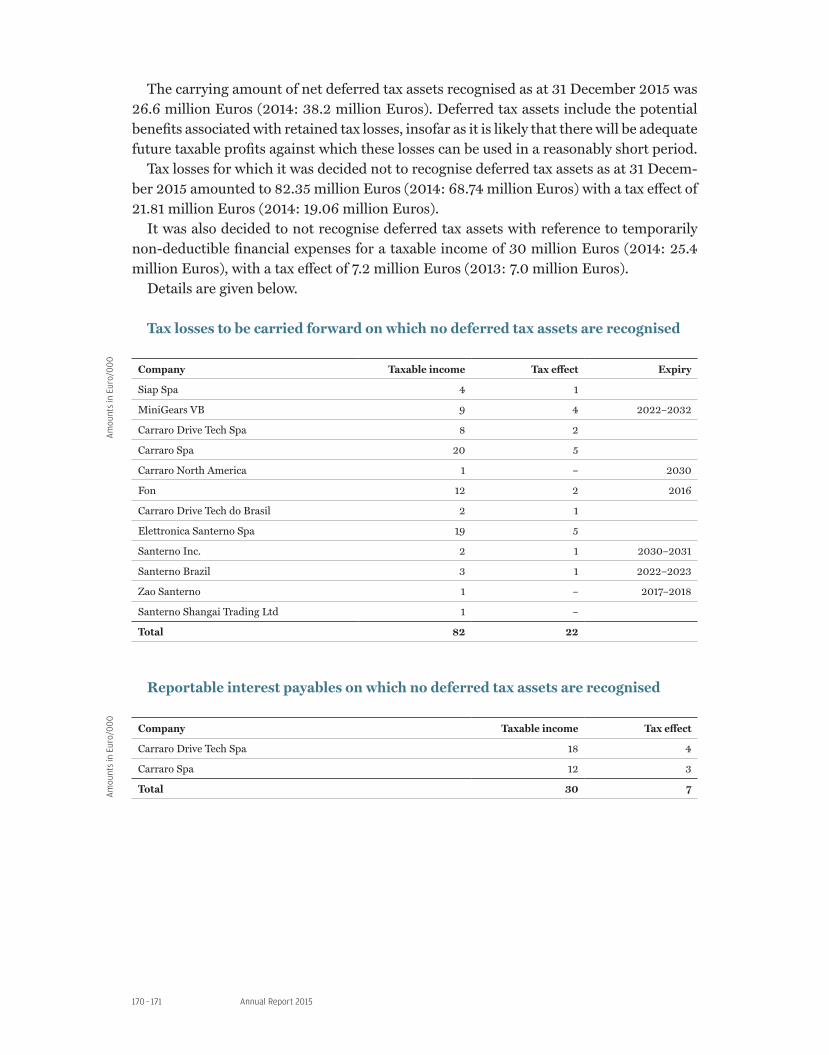
Annual Report 2015170 – 171
The carrying amount of net deferred tax assets recognised as at 31 December 2015 was 26.6 million Euros (2014: 38.2 million Euros). Deferred tax assets include the potential benefits associated with retained tax losses, insofar as it is likely that there will be adequate future taxable profits against which these losses can be used in a reasonably short period.
Tax losses for which it was decided not to recognise deferred tax assets as at 31 Decem-ber 2015 amounted to 82.35 million Euros (2014: 68.74 million Euros) with a tax effect of 21.81 million Euros (2014: 19.06 million Euros).
It was also decided to not recognise deferred tax assets with reference to temporarily non-deductible financial expenses for a taxable income of 30 million Euros (2014: 25.4 million Euros), with a tax effect of 7.2 million Euros (2013: 7.0 million Euros).
Details are given below.
Tax losses to be carried forward on which no deferred tax assets are recognised
Company Taxable income Tax effect Expiry
Siap Spa 4 1
MiniGears VB 9 4 2022–2032
Carraro Drive Tech Spa 8 2
Carraro Spa 20 5
Carraro North America 1 – 2030
Fon 12 2 2016
Carraro Drive Tech do Brasil 2 1
Elettronica Santerno Spa 19 5
Santerno Inc. 2 1 2030–2031
Santerno Brazil 3 1 2022–2023
Zao Santerno 1 – 2017–2018
Santerno Shangai Trading Ltd 1 –
Total 82 22
Reportable interest payables on which no deferred tax assets are recognised
Company Taxable income Tax effect
Carraro Drive Tech Spa 18 4
Carraro Spa 12 3
Total 30 7
Am
ount
s in
Eur
o/0
00
Am
ount
s in
Eur
o/0
00

Consolidated Financial Statements
Trade receivables and other receivables (note 12)
31.12.2015 31.12.2014
Non current trade receivables – –
From third parties 3,056 4,120
Other non-current receivables 3,056 4,120
Non-current trade receivables and other receivables 3,056 4,120
From related parties 5,955 87
From third parties 55,999 75,157
Current trade receivables 61,954 75,244
From related parties 957 6,221
From third parties 25,772 32,412
Other current receivables 26,729 38,633
Current trade receivables and other receivables 88,683 113,877
Other non-current receivables (3.1 million Euros) consist mainly of guarantee deposits, portions of costs accruing in subsequent periods and advance payments and tax receiv-ables of the subsidiary Carraro India Pvt Ltd..
Trade receivables bear no interest and mature on average at 60 days.Other current receivables due from third parties can be analysed as follows:
31.12.2015 31.12.2014
Vat credits 4,347 9,282
Vat credits due for rebate 1,589 1,663
Other tax credits 8,042 7,807
Receivables for current taxes 7,529 7,667
Receivables from employees 702 878
Receivables from pensions agencies 255 495
Provisions for impairment of other receivables –878 –281
Other receivables 4,186 4,901
Other current receivables from third parties 25,772 32,412
Other current receivables from third parties equal to 26 million Euros (32 million Eu-ros in 2014) decreased, mainly due to the decrease in tax receivables.
The breakdown of trade and other receivables (including provisions for impairment of receivables) by maturity is shown in the following table:
31.12.2015
Past due Not yet due
Less than 1 year More than 1 year Less than 1 year More than 1 year Total
Trade receivables 14,155 2,511 49,816 – 66,482
Other receivables 27 – 27,580 3,056 30,663
Total 14,182 2,511 77,396 3,056 97,145
Am
ount
s in
Eur
o/0
00
Am
ount
s in
Eur
o/0
00
Am
ount
s in
Eur
o/0
00
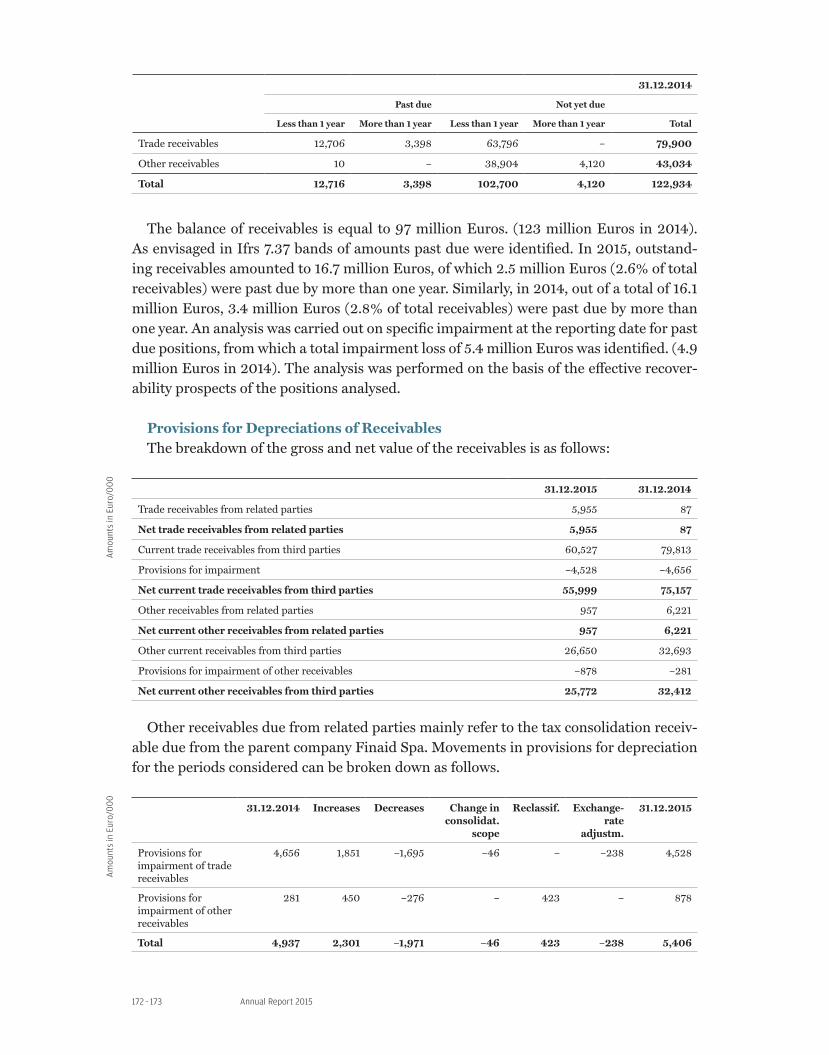
Annual Report 2015172 – 173
31.12.2014
Past due Not yet due
Less than 1 year More than 1 year Less than 1 year More than 1 year Total
Trade receivables 12,706 3,398 63,796 – 79,900
Other receivables 10 – 38,904 4,120 43,034
Total 12,716 3,398 102,700 4,120 122,934
The balance of receivables is equal to 97 million Euros. (123 million Euros in 2014). As envisaged in Ifrs 7.37 bands of amounts past due were identified. In 2015, outstand-ing receivables amounted to 16.7 million Euros, of which 2.5 million Euros (2.6% of total receivables) were past due by more than one year. Similarly, in 2014, out of a total of 16.1 million Euros, 3.4 million Euros (2.8% of total receivables) were past due by more than one year. An analysis was carried out on specific impairment at the reporting date for past due positions, from which a total impairment loss of 5.4 million Euros was identified. (4.9 million Euros in 2014). The analysis was performed on the basis of the effective recover-ability prospects of the positions analysed.
Provisions for Depreciations of ReceivablesThe breakdown of the gross and net value of the receivables is as follows:
31.12.2015 31.12.2014
Trade receivables from related parties 5,955 87
Net trade receivables from related parties 5,955 87
Current trade receivables from third parties 60,527 79,813
Provisions for impairment –4,528 –4,656
Net current trade receivables from third parties 55,999 75,157
Other receivables from related parties 957 6,221
Net current other receivables from related parties 957 6,221
Other current receivables from third parties 26,650 32,693
Provisions for impairment of other receivables –878 –281
Net current other receivables from third parties 25,772 32,412
Other receivables due from related parties mainly refer to the tax consolidation receiv-able due from the parent company Finaid Spa. Movements in provisions for depreciation for the periods considered can be broken down as follows.
31.12.2014 Increases Decreases Change in consolidat.
scope
Reclassif. Exchange-rate
adjustm.
31.12.2015
Provisions for impairment of trade receivables
4,656 1,851 –1,695 –46 – –238 4,528
Provisions for impairment of other receivables
281 450 –276 – 423 – 878
Total 4,937 2,301 –1,971 –46 423 –238 5,406
Am
ount
s in
Eur
o/0
00
Am
ount
s in
Eur
o/0
00

Consolidated Financial Statements
Closing inventory (note 13)
Items 31.12.2015 31.12.2014
Raw materials 85,869 108,708
Work in progress and semi-finished products 26,422 30,448
Finished products 27,105 33,772
Goods in transit 1,296 295
Total inventories 140,692 173,223
Provision for impairment of inventories –22,606 –26,478
Total inventories 118,086 146,745
Movements in provisions for depreciation of inventories are shown in detail below:
Balance as at 31 December 2014 26,478
Provisions set aside 2,662
Utilisation –4,556
Changes in the scope of consolidation 6
Translation differences – 1,984
Balance as at 31 December 2015 22,606
Cash and cash equivalents (note 14)
31.12.2015 31.12.2014
Cash 110 151
Bank current accounts and deposits 70,648 62,671
Other liquid funds or equivalent assets – –
Total 70,758 62,822
Short-term bank deposits are remunerated at a floating rate.
Shareholders’ equity (note 15)
31.12.2015 31.12.2014
1) Share Capital 23,915 23,915
2) Other Reserves 27,278 37,252
3) Profits/(Losses) brought forward – –
4) Other Ias/Ifrs reserves 169 624
5) Provision for discounting employee benefits –593 –1,957
6) Foreign currency translation reserve –13,489 –13,562
7) Result for the period pertaining to the group –8,915 –7,913
Group Shareholders’ Equity 28,365 38,359
8) Minority interests 2,658 2,848
Am
ount
s in
Eur
o/0
00
Am
ount
s in
Eur
o/0
00
Am
ount
s in
Eur
o/0
00
Am
ount
s in
Eur
o/0
00

Annual Report 2015174 – 175
The Shareholders’ Meeting of Carraro Spa held on 23 March 2015 approved a purchase of treasury shares and disposal plan involving no more than 10% of paid up shares, for a term of 18 months, which provides for: a price for the purchase of each common share not less than, at the minimum, 30% and, at the maximum, 20% below the reference price of the share on the stock market on the day preceding each individual transaction; a price for the sale of each common share not less than, at the minimum, 20% below and, at the maximum, not more than 20% above the reference price of the share on the stock market on the day preceding each individual transaction.
The same Shareholders’ Meeting resolved to carry forward the loss for 2014, amounting to 6,479,472 Euros.
With effect from 31 December 2009, the share capital of Carraro Spa amounts to 23,914,696 Euros, corresponding to 45,989,800 shares with a face value of 0.52 Euros each. The company has issued a single category of ordinary shares which do not give the right to a fixed dividend. No other financial instruments which assign equity and invest-ment rights have been issued.
As at 31 December 2015, 2,626,988 shares had been purchased for a total investment of 6.666 million Euros.
Other reservesThe item “Other reserves” of 27.278 million Euros, includes reserves of Carraro Spa
relating to profits not distributed or carried forward and others as follows:› 27.130 million Euros relating to the Carraro Spa share premium reserve;› 4.761 million Euros relating to the Carraro Spa legal reserve;› less 4.610 million Euros relating to the extraordinary reserve and retained profits of
Carraro Spa;› less 6.666 million Euros for deduction of the reserve corresponding to treasury share
purchase of Carraro Spa;› 44.384 million Euros relating to the first adoption reserve of Ias/Ifrs;› less 37.721 million arising from the reduction in the shareholders’ equities of con-
solidated companies with respect to the corresponding carrying amounts of equity investments and consolidation adjustments.
Other Ias/Ifrs reservesThis includes the values arising from application of the criterion prescribed for cash
flow hedging of 0.17 million Euros.
Provision for discounting employee benefitsThis reserve, which is negative amounting to 0.59 million Euros, includes Employee
benefit actuarial gains/losses, as provided for by Ias 19 Revised.For further details, see section 3.3 «Accounting standards and measurement criteria».
Foreign currency translation reserveThis reserve, which is negative amounting to 13.49 million Euros, is used to record ex-
change differences arising from translation of the financial statements of foreign subsidiaries.

Consolidated Financial Statements
It should be noted that, as required by Ias 1 Revised paragraph 83, the movements in the period of the foreign currency translation reserve were recognised in the statement of comprehensive income, as detailed below:
31.12.2014 Changes in the Statement of
Comprehensive Income
Changes by area
31.12.2015
Exchange reserve of the parent company’s shareholders
–13,562 73 – –13,489
Exchange reserve of minority interests – – – –13,489
Effect of the translation reserve on the statement of comprehensive income
–13,562 73 – –13,489
Minority interestsFor an analysis of the change in minority interests, see paragraph 2.2.
Financial liabilities (note 16)On 24 December 2015, the Carraro Group signed a new agreement with its main lend-
ing banks, which provides for the rescheduling of medium and long-term financial debts, with a suspension of principal repayments until 2017, confirmation of short-term credit lines to support the current operations of the Group and redefinition of the covenants based on the operating results envisaged by the Group’s New Business Plan 2016-19. In accordance with the new agreement signed with the banks on 24 December 2015, recog-nition of the covenants as at 31 December 2015 is not envisaged.
The classification of financial liabilities is shown below:
31.12.2015 31.12.2014
Medium/long-term loans 180,344 126,985
Non-current financial liabilities 180,344 126,985
Fair value of non-current interest rate derivatives –156 54
Other non-current financial liabilities –156 54
Non-current financial liabilities 180,166 127,039
Medium-/long-term loans – short-term portion 9,385 55,592
Loans to others 124,236 107,368
Current financial liabilities 133,621 162,960
Fair value of interest rate derivatives – 13
Fair value of exchange rate derivatives 128 743
Other current financial liabilities 1,694 957
Other current financial liabilities 1,822 1,713
Current financial liabilities 135,443 164,673
Short-term loans include current accounts payable and loans taken out during 2015, with a short-term maturity.
Am
ount
s in
Eur
o/0
00
Am
ount
s in
Eur
o/0
00
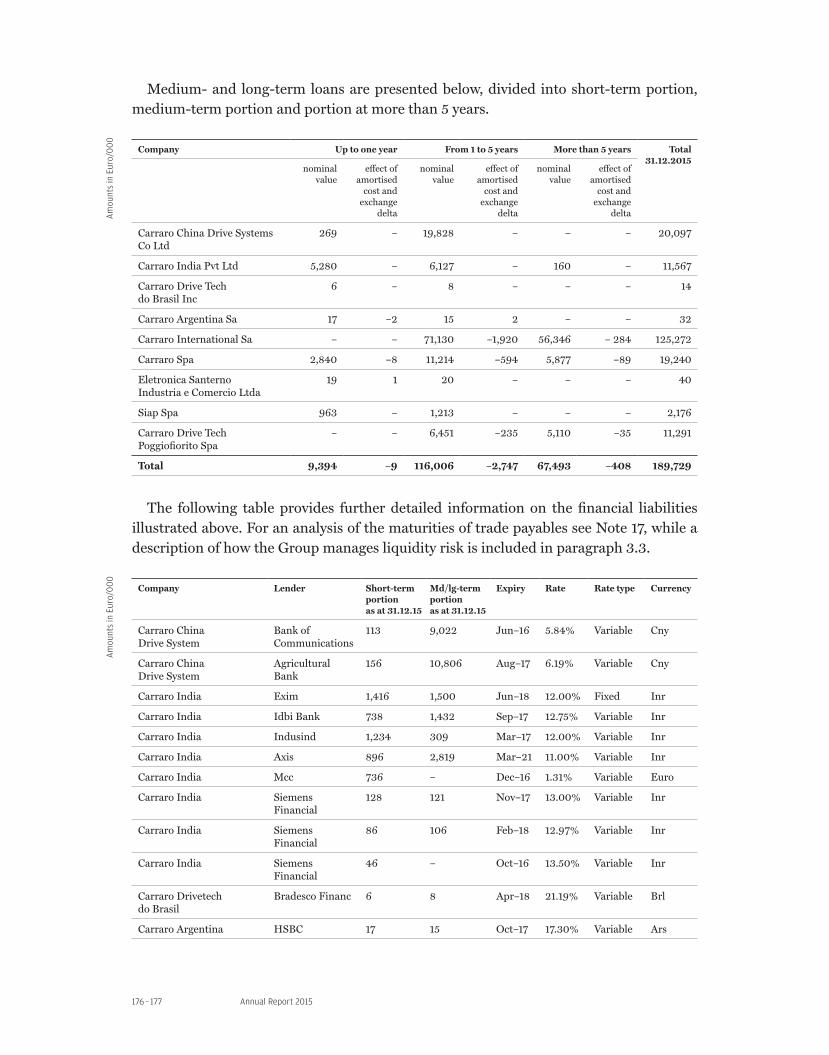
Annual Report 2015176 – 177
Medium- and long-term loans are presented below, divided into short-term portion, medium-term portion and portion at more than 5 years.
Company Up to one year From 1 to 5 years More than 5 years Total 31.12.2015
nominal value
effect of amortised
cost and exchange
delta
nominal value
effect of amortised
cost and exchange
delta
nominal value
effect of amortised
cost and exchange
delta
Carraro China Drive Systems Co Ltd
269 – 19,828 – – – 20,097
Carraro India Pvt Ltd 5,280 – 6,127 – 160 – 11,567
Carraro Drive Techdo Brasil Inc
6 – 8 – – – 14
Carraro Argentina Sa 17 –2 15 2 – – 32
Carraro International Sa – – 71,130 –1,920 56,346 – 284 125,272
Carraro Spa 2,840 –8 11,214 –594 5,877 –89 19,240
Eletronica SanternoIndustria e Comercio Ltda
19 1 20 – – – 40
Siap Spa 963 – 1,213 – – – 2,176
Carraro Drive TechPoggiofiorito Spa
– – 6,451 –235 5,110 –35 11,291
Total 9,394 –9 116,006 –2,747 67,493 –408 189,729
The following table provides further detailed information on the financial liabilities illustrated above. For an analysis of the maturities of trade payables see Note 17, while a description of how the Group manages liquidity risk is included in paragraph 3.3.
Company Lender Short-term portion as at 31.12.15
Md/lg-term portion as at 31.12.15
Expiry Rate Rate type Currency
Carraro China Drive System
Bank of Communications
113 9,022 Jun–16 5.84% Variable Cny
Carraro China Drive System
Agricultural Bank
156 10,806 Aug–17 6.19% Variable Cny
Carraro India Exim 1,416 1,500 Jun–18 12.00% Fixed Inr
Carraro India Idbi Bank 738 1,432 Sep–17 12.75% Variable Inr
Carraro India Indusind 1,234 309 Mar–17 12.00% Variable Inr
Carraro India Axis 896 2,819 Mar–21 11.00% Variable Inr
Carraro India Mcc 736 – Dec–16 1.31% Variable Euro
Carraro India Siemens Financial
128 121 Nov–17 13.00% Variable Inr
Carraro India Siemens Financial
86 106 Feb–18 12.97% Variable Inr
Carraro India Siemens Financial
46 – Oct–16 13.50% Variable Inr
Carraro Drivetech do Brasil
Bradesco Financ 6 8 Apr–18 21.19% Variable Brl
Carraro Argentina HSBC 17 15 Oct–17 17.30% Variable Ars
Am
ount
s in
Eur
o/0
00
Am
ount
s in
Eur
o/0
00

Consolidated Financial Statements
Company Lender Short-term portion as at 31.12.15
Md/lg-term portion as at 31.12.15
Expiry Rate Rate type Currency
Carraro International BPV Finance – 16,000 Jun–19 4.16% Variable Euro
Carraro International Banca Antonveneta
– 5,459 Jun–17 3.55% Variable Euro
Carraro International Mps – 3,446 Mar–17 3.59% Variable Euro
Carraro International Pool banche – 66,176 May–17 3.46% Variable Euro
Carraro International Pool banche (revolving)
– 36,395 May–16 3.62% Variable Euro
Carraro Spa Mps – 13,296 Dec–20 3.55% Variable Euro
Carraro Spa Banca Popolare di Ravenna
1,763 907 Jun–17 3.57% Variable Euro
Carraro Spa Cassa Risparmio di Bolzano
1,077 2,888 Jun–19 3.78% Variable Euro
Eletronica Santerno Industria e Comercio Ltda
Banca Santander 8 5 Jul–17 18.00% Variable Brl
Eletronica Santerno Industria e Comercio Ltda
Itau Leasing 11 15 Apr–18 18.00% Variable Brl
Siap Friulia 526 – Jun–16 3.00% Variable Euro
Siap De Lage Landen 112 432 Jun–20 3.75% Fixed Euro
Siap Albaleasing 65 146 Jan–19 3.14% Variable Euro
Siap Albaleasing 165 446 Jul–19 3.14% Variable Euro
Siap Credit Agricole Leasing
32 53 Jul–18 3.62% Variable Euro
Siap Credit Agricole Leasing
63 136 Feb–19 3.62% Variable Euro
Carraro Drive Tech Spa Banca Pop.Verona
– 11,561 Mar–17 3.47% Variable Euro
Totale 9,394 183,499
The net financial position is broken down below.
Net financial position 31.12.2015 31.12.2014
Non-current loans payable 180,344 126,985
Current loans payable 133,621 162,960
Other non-current financial liabilities –156 53
Other current financial liabilities 1,694 957
Financial liabilities 315,503 290,956
Non-current loans and receivables –8,668 –1,821
Current loans and receivables –7,731 –979
Other non-current financial assets –131 –147
Other current financial assets –432 –914
Financial assets –16,962 –3,861
Cash –110 –151
Bank current accounts and deposits and other cash and cash equivalents –70,648 –62,671
Am
ount
s in
Eur
o/0
00

Annual Report 2015178 – 179
Net financial position 31.12.2015 31.12.2014
Cash and cash equivalents –70,758 –62,822
Net financial position 227,783 224,273
of which payables / (receivables)
Non-current 171,389 125,071
Current 56,394 99,202
The Group has available short-term banking credit facilities for a total of 160 million Euros. These credit facilities are callable and may be used for various current-account purposes and short-term financing of a maximum term of 12 months, with the total bal-ance equal to 122.9 million Euros.
The rate terms vary according to the country of usage and can be summarised as follows:› Europe: 3.6%› India: 11.1%› China: 6.75%
The medium- and long-term banking credit facilities amounted to a total of 203.9 mil-lion Euros, against a utilisation of 192.9 million Euros.
Fair ValueThe fair value of medium/long-term financial liabilities, taking account of the fact that
these are almost exclusively for variable-rate funding and that the terms being renegoti-ated with the banking counterparties are in line with the average levels for the market and the segment – even considering the residual volatility of the markets and the relative uncertainty in identifying “reference” conditions – as measured is not significantly differ-ent overall from the carrying amounts.
Trade payables and other payables (note 17)
31.12.2015 31.12.2014
From third parties 910 1,361
Other non-current payables 910 1,361
Trade payables and other non-current payables 910 1,361
From related parties 981 3
From third parties 166,302 232,783
Current trade payables 167,283 232,786
From related parties 165 7,488
From third parties 23,496 31,523
Other current payables 23,661 39,011
Trade payables and other current payables 190,944 271,797
Trade payables do not produce interest and on average are settled at 120 days.
Am
ount
s in
Eur
o/0
00
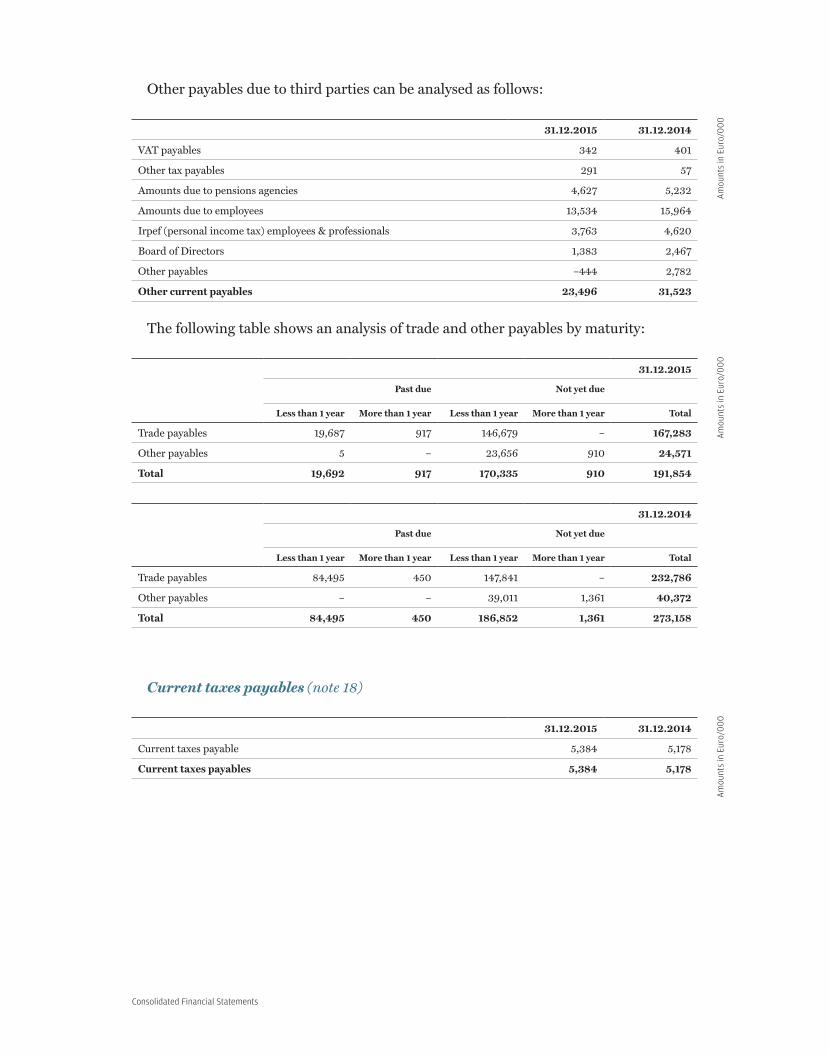
Consolidated Financial Statements
Other payables due to third parties can be analysed as follows:
31.12.2015 31.12.2014
VAT payables 342 401
Other tax payables 291 57
Amounts due to pensions agencies 4,627 5,232
Amounts due to employees 13,534 15,964
Irpef (personal income tax) employees & professionals 3,763 4,620
Board of Directors 1,383 2,467
Other payables –444 2,782
Other current payables 23,496 31,523
The following table shows an analysis of trade and other payables by maturity:
31.12.2015
Past due Not yet due
Less than 1 year More than 1 year Less than 1 year More than 1 year Total
Trade payables 19,687 917 146,679 – 167,283
Other payables 5 – 23,656 910 24,571
Total 19,692 917 170,335 910 191,854
31.12.2014
Past due Not yet due
Less than 1 year More than 1 year Less than 1 year More than 1 year Total
Trade payables 84,495 450 147,841 – 232,786
Other payables – – 39,011 1,361 40,372
Total 84,495 450 186,852 1,361 273,158
Current taxes payables (note 18)
31.12.2015 31.12.2014
Current taxes payable 5,384 5,178
Current taxes payables 5,384 5,178
Am
ount
s in
Eur
o/0
00
Am
ount
s in
Eur
o/0
00
Am
ount
s in
Eur
o/0
00

Annual Report 2015180 – 181
Employee severance indemnities and retirement benefits (note 19)Provision for severance indemnity and retirement benefits
31.12.2015 31.12.2014
Opening severance indemnities in accordance with Ias 19 12,240 13,591
Utilisation of employee severance indemnities –1,310 –783
Interest Cost 170 312
Actuarial Gains/Losses 30 1,187
Change in consolidation scope – –2,066
Closing severance indemnities in accordance with Ias 19 11,130 12,240
The severance indemnity, calculated according to current Italian laws, is treated for ac-counting purposes as a defined-benefit fund and as such is recalculated at the end of each accounting period according to a statistical-actuarial criterion which also takes account of the effects of financial discounting.
The actuarial valuation of this obligation is carried out according to the actuarial crite-rion of the “projected unit credit method” with the support of the data issued by Istat, the Inps and the Ania. The parameters used are as follows: 1) annual discount rate: 1.39%, 2) personnel rotation rate 5%, 3) annual inflation index 2%, 4) advances rate 2%, 5) remu-neration increase rate 3%.
The accounting treatment of employee benefits recorded in the financial statements complies with Ias 19 Revised for defined-benefit plans. For further details, see section 3.3.
Termination benefits are benefits to employees regulated by the laws in force in Italy and recognised in the financial statements of Italian companies.
On the basis of the changes introduced in Law 296/06, with effect from 30 June 2007, termination benefits maturing after 1 January 2007 must be paid into a specific treasury reserve established at the pensions agency Inps, or, if the employee so chooses, into a spe-cial complementary pension fund. There are no more provisions for termination benefits with these contributions.
Sensitivity analysis Ias 19 RevisedThe table below indicates the values of the Employee benefits provision as at 31.12.2015
calculated in the case of changes in actuarial assumptions reasonably possible at that date with the following variables:
› turnover frequency› discount rate (taken from the Iboxx Corporate AA 7-10 index)› inflation rate
Turnover frequency
Inflation rate
Discount rate
+1 % –1 % +0.25 % –0.25 % +0.25 % –0.25 %
Provisions for employee benefits 31.12.2015 11,069 11,193 11,263 10,995 10,916 11,338
Am
ount
s in
Eur
o/0
00
Am
ount
s in
Eur
o/0
00
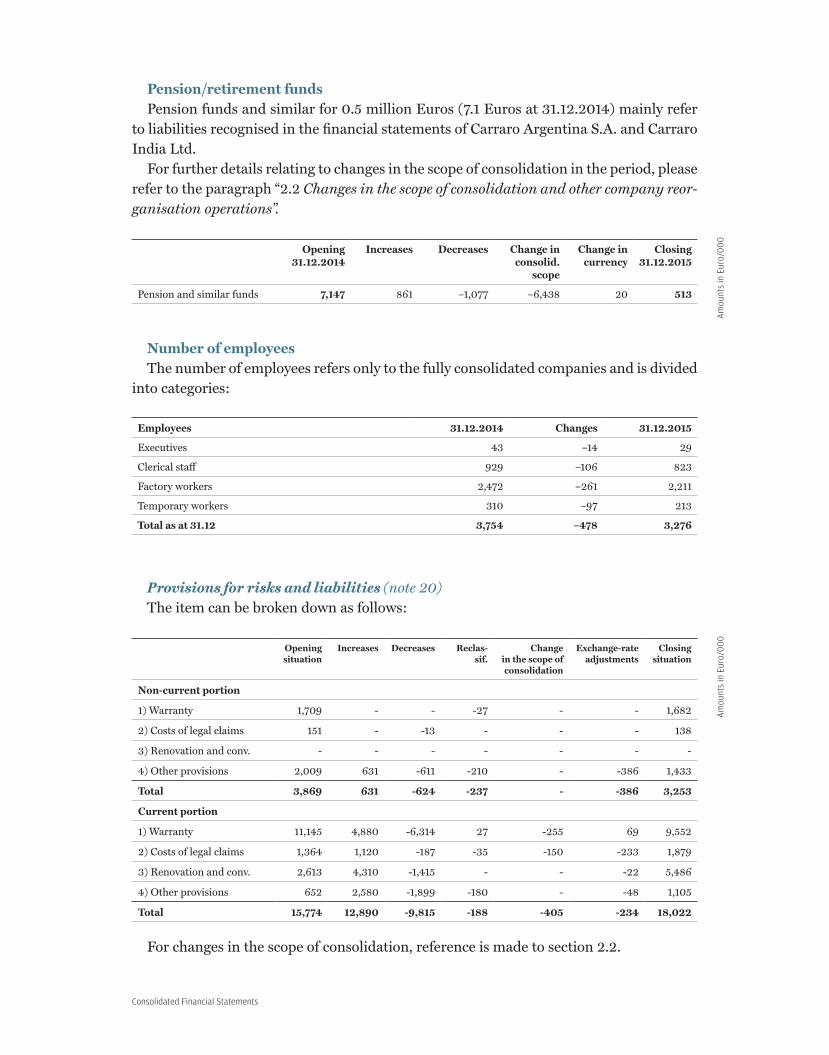
Consolidated Financial Statements
Pension/retirement fundsPension funds and similar for 0.5 million Euros (7.1 Euros at 31.12.2014) mainly refer
to liabilities recognised in the financial statements of Carraro Argentina S.A. and Carraro India Ltd.
For further details relating to changes in the scope of consolidation in the period, please refer to the paragraph “2.2 Changes in the scope of consolidation and other company reor-ganisation operations”.
Opening 31.12.2014
Increases Decreases Change in consolid.
scope
Change in currency
Closing 31.12.2015
Pension and similar funds 7,147 861 –1,077 –6,438 20 513
Number of employeesThe number of employees refers only to the fully consolidated companies and is divided
into categories:
Employees 31.12.2014 Changes 31.12.2015
Executives 43 –14 29
Clerical staff 929 –106 823
Factory workers 2,472 –261 2,211
Temporary workers 310 –97 213
Total as at 31.12 3,754 –478 3,276
Provisions for risks and liabilities (note 20)The item can be broken down as follows:
Opening situation
Increases Decreases Reclas-sif.
Change in the scope of consolidation
Exchange-rate adjustments
Closing situation
Non-current portion
1) Warranty 1,709 - - -27 - - 1,682
2) Costs of legal claims 151 - -13 - - - 138
3) Renovation and conv. - - - - - - -
4) Other provisions 2,009 631 -611 -210 - -386 1,433
Total 3,869 631 -624 -237 - -386 3,253
Current portion
1) Warranty 11,145 4,880 -6,314 27 -255 69 9,552
2) Costs of legal claims 1,364 1,120 -187 -35 -150 -233 1,879
3) Renovation and conv. 2,613 4,310 -1,415 - - -22 5,486
4) Other provisions 652 2,580 -1,899 -180 - -48 1,105
Total 15,774 12,890 -9,815 -188 -405 -234 18,022
For changes in the scope of consolidation, reference is made to section 2.2.
Am
ount
s in
Eur
o/0
00
Am
ount
s in
Eur
o/0
00

Annual Report 2015182 – 183
Warranty reserveFrom the product warranty reserve, 6.3 million Euros was used for customer claims
accepted and the reserve was increased by 4.9 million Euros on the basis of the expected warranty costs which will be incurred in relation to sales made.
Provision for costs of legal claimsThe provision for costs of legal claims refers to tax liabilities that have been defined or
are being defined and litigation concerning employees.
Provision for restructuring and reconversionThe detailed movements of provisions for restructuring are shown below:
Provisions 31.12.14
Increases Decreases Reclassif. Exchange-rate adjustments
Provisions 31.12.15
Carraro Spa 946 550 –946 – – 550
Carraro Drive Tech Spa 800 1,040 –259 234 – 1,815
Carraro Drive Tech Poggiofiorito Spa
234 – – –234 – –
Siap Spa 359 1,650 – – – 2,009
Elettronica Santerno Spa 150 897 –77 – – 970
Elettronica Santerno Ind. e Com Ltd.
– 165 – – –23 142
Fon Sa – – – – – –
O&K Antriebstechnik GmbH 117 8 –125 – – –
Santerno Shangai Trading Co 7 – –8 – 1 –
Total 2,613 4,310 –1,415 – –22 5,486
Other provisionsThe item “Other provisions” includes amounts recognised for individual companies for
future expenses and liabilities.
7.Commitmentsandrisks
There are no commitments and risks such as to have any effect on the financial state-ments and related disclosure.
8.Transactionswithrelatedparties(note21)
The Carraro Group is controlled directly by Finaid Spa, which as at 31.12.2015 held 46.701% of the shares outstanding. Carraro Spa and all Italian subsidiaries are included in the tax consolidation area of the parent company Carraro Spa. The charges/income deriving from the transfer of the Ires taxable base are booked under current taxes.
Am
ount
s in
Eur
o/0
00

Consolidated Financial Statements
The transactions between Carraro Spa and its subsidiaries which are affiliated enti-ties of Carraro Spa, were eliminated in the consolidated financial statements and are not pointed out in these notes. Significant transactions include the purchase of the R&D busi-ness unit, to which reference is made in section 4.
The details of the transactions between Carraro Group and other affiliated companies according to principle Ias 24 and Consob requirements, are indicated below.
Financial and equity transactions
Economic transactions
Financial assets
Trade receivables
and other receivables
Trade payables
and other payables
Sales of services
Current and deferred income taxes
Other related parties:
Finaid Spa – 982 165 9 –27
O&K Antriebstechnik Gmbh 72 5,930 981
Total 72 6,912 1,146 9 –27
9.Financialinstruments
9.1 GeneralsummaryoftheeffectsontheIncomeStatementderivingfromfinancialinstruments
31.12.2015 Financial income
Financial expenses
Positive exchange
diff.
Negative exchange
diff.
Suspensioncosts
revenues
A) financial assets
A.1) Cash and Cash Equivalents:
Bank accounts, positive balance 167 – – – –
A.2) Non-derivative Financial Instruments:
A.2.1) Financial instruments at fair value (Fvtpl):
A.2.2) Financial instruments held to maturity (Htm):
A.2.3) Loans and receivables (L&R):
A.2.3.1) Loans:
Loans receivable 11 – – – –
A.2.3.2) Other assets:
Trade receivables – – 14,354 –8,503 –
Other financial assets 3,587 – 6,775 – –
A.2.4) Financial instruments available for sale(Avs):
A.3) Derivative Financial Instruments:
A.3.1) Hedging derivatives:
A.3.1.2) Cash Flow Hedging Derivatives on currencies:
Fair value through profit or loss – – 1,837 – –
Am
ount
s in
Eur
o/0
00
Am
ount
s in
Eur
o/0
00

Annual Report 2015184 – 185
31.12.2015 Financial income
Financial expenses
Positive exchange
diff.
Negative exchange
diff.
Suspensioncosts
revenues
Profit realised – – 9,853 – –
A.3.1.2) Cash Flow Hedging Derivatives on interest rates:
Fair value in shareholders’ equity – – – – 260
Profit realised –
A.3.2) Speculative derivatives (Trading): – – – – –
B) financial liabilities
B.1) Non-derivative Financial Instruments:
B.1.1) Financial Instruments at fair value:
B.1.2) Other Financial Instruments:
Bank accounts, negative balance – –6,435 – – –
Trade payables – – 3,176 –11,709 –
Loans payable –12,687 – – –
Other financial liabilities – –1,047 – –6,299 –
B.2) Derivative Financial Instruments:
B.2.1) Hedging derivatives:
B.2.1.1) Cash Flow Hedging Derivatives on currencies:
Fair value through profit or loss – – – 597 –
Fair value in shareholders’ equity – – – – –22
Loss realised – – – –10,878 –
B.2.1.2) Cash Flow Hedging Derivatives on interest rates:
Loss realised – –13 – – –
B.2.2) Speculative derivatives (Trading): – – – – –
Total 3,764 –20,182 32,321 –36,792 238
31.12.2014 Financial income
Financial expenses
Positive exchange
diff.
Negative exchange
diff.
Suspensioncosts
revenues
A) financial assets
A.1) Cash and Cash Equivalents:
Bank accounts, positive balance 47 – – – –
A.2) Non-derivative Financial Instruments:
A.2.1) Financial instruments at fair value (Fvtpl):
A.2.2) Financial instruments held to maturity (Htm):
A.2.3) Loans and receivables (L&R):
A.2.3.1) Loans:
Loans receivable 166 – – – –
A.2.3.2) Other assets:
Trade receivables – – 8,912 –3,776 –
Other financial assets 3,692 – 2,238 – –
A.2.4) Financial instruments available for sale (Avs):
Am
ount
s in
Eur
o/0
00
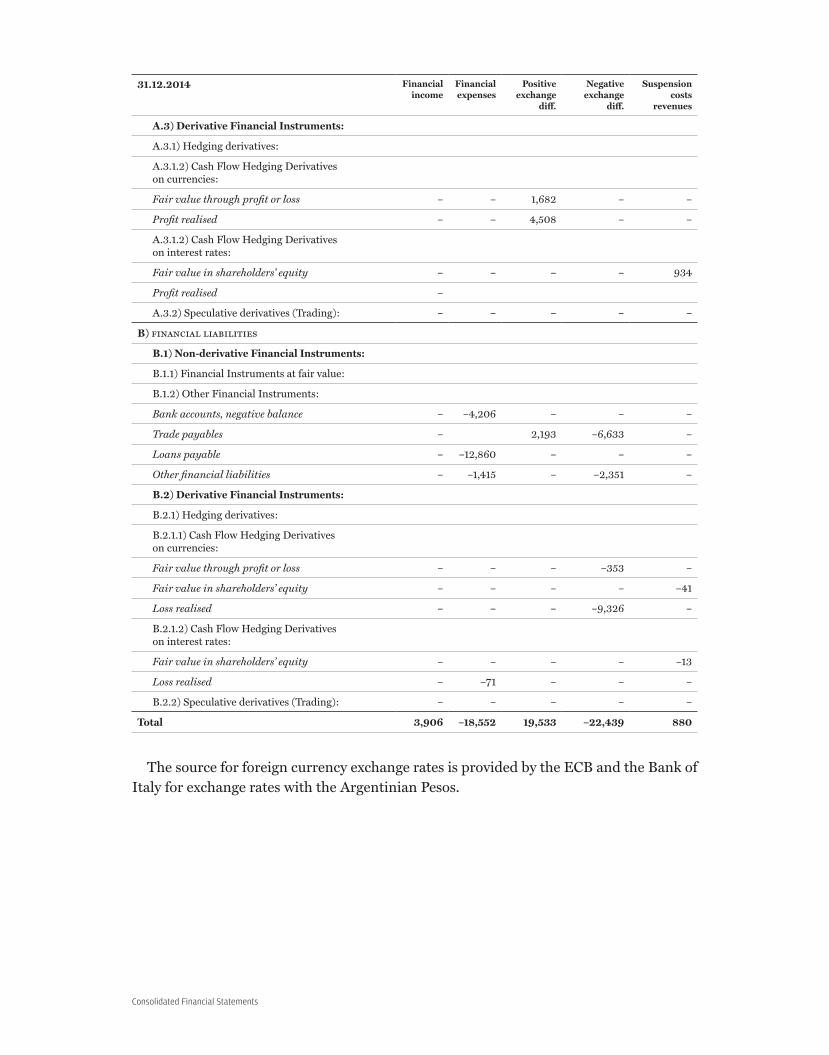
Consolidated Financial Statements
31.12.2014 Financial income
Financial expenses
Positive exchange
diff.
Negative exchange
diff.
Suspensioncosts
revenues
A.3) Derivative Financial Instruments:
A.3.1) Hedging derivatives:
A.3.1.2) Cash Flow Hedging Derivatives on currencies:
Fair value through profit or loss – – 1,682 – –
Profit realised – – 4,508 – –
A.3.1.2) Cash Flow Hedging Derivatives on interest rates:
Fair value in shareholders’ equity – – – – 934
Profit realised –
A.3.2) Speculative derivatives (Trading): – – – – –
B) financial liabilities
B.1) Non-derivative Financial Instruments:
B.1.1) Financial Instruments at fair value:
B.1.2) Other Financial Instruments:
Bank accounts, negative balance – –4,206 – – –
Trade payables – 2,193 –6,633 –
Loans payable – –12,860 – – –
Other financial liabilities – –1,415 – –2,351 –
B.2) Derivative Financial Instruments:
B.2.1) Hedging derivatives:
B.2.1.1) Cash Flow Hedging Derivatives on currencies:
Fair value through profit or loss – – – –353 –
Fair value in shareholders’ equity – – – – –41
Loss realised – – – –9,326 –
B.2.1.2) Cash Flow Hedging Derivatives on interest rates:
Fair value in shareholders’ equity – – – – –13
Loss realised – –71 – – –
B.2.2) Speculative derivatives (Trading): – – – – –
Total 3,906 –18,552 19,533 –22,439 880
The source for foreign currency exchange rates is provided by the ECB and the Bank of Italy for exchange rates with the Argentinian Pesos.

Annual Report 2015186 – 187
9.2 Derivativefinancialinstrumentsoncurrencies
The following tables indicate all the key information relating to the portfolio of deriva-tive financial instruments on currencies outstanding as at 31.12.2015. These are instru-ments designated to cover:
› foreign currency sales budgets› imbalances of current receivables and payables in foreign currencies
A. Notional values
Contract Swap (DCS) 1 Swap (DCS) 2 Totalnotional values
Carraro Spa – 8,908 8,908
Carraro Drive Tech –39,233 7,421 –31,812
Carraro India 1,245 –722 523
Elettronica Santerno – 12,728 12,728
Siap 562 942 1,504
Carraro China – 2,353 2,353
Group Total 31.12.2015 –37,426 31,630 –5,796
Group Total 31.12.2014 –12,218 14,029 1,811 1 Instruments hedging foreign currency sales budget2 Instruments hedging imbalances of current receivables and payables in foreign currencies
B. Reference currencies and expiry dates of contracts
Contract Swap (DCS) 1 Swap (DCS) 2
Currencies Expiry dates Currencies Expiry dates
Carraro Spa – – Usd/Eur Jan 16
Carraro Drive Tech Usd/EurCny/EurInr/Eur
Jan 16 – Feb 17 Usd/Eur Jan – Feb 16
Carraro India Inr/Eur Mar – Nov 16 Inr/Eur May 16
Elettronica Santerno – – Usd/EurZar/Eur
Jan 16
Siap Usd/Eur Apr 16 – Mar 17 Usd/Eur Jan 16
Carraro China – – Usd/Eur Jan – Feb 16
1 Instruments hedging foreign currency sales budget2 Instruments hedging imbalances of current receivables and payables in foreign currencies
C. Fair value
Contract Swap (DCS) 1 Swap (DCS) 2 Total
Carraro Spa – 170 170
Carraro Drive Tech 389 65 454
Carraro India –9 3 –6
Am
ount
s in
Eur
o/0
00
Am
ount
s in
Eur
o/0
00

Consolidated Financial Statements
Contract Swap (DCS) 1 Swap (DCS) 2 Total
Elettronica Santerno – 134 134
Siap 10 22 32
Carraro China – –104 –104
Group Total 31.12.2015 390 290 680
Group Total 31.12.2014 3,090 –686 2,404
1 Instruments hedging foreign currency sales budget2 Instruments hedging imbalances of current receivables and payables in foreign currencies
D. Details of fair value
31.12.2015 31.12.2014
Positive fair value
Negative fair value
Positive fair value
Negative fair value
Cash Flow Hedge Exchange rate risk
809 –128 3,147 –742
E. Summary of fair values recognised before tax effect according to their accounting treatment
FV recognised in the income
statement
FV recognised in net equity
Total
Carraro Spa 170 – 170
Carraro Drive Tech 204 250 454
Carraro India 16 –22 –6
Elettronica Santerno 134 – 134
Siap 21 11 32
Carraro China –104 – –104
Group Total 31.12.2015 441 239 680
Group Total 31.12.2014 1,511 893 2,404
In relation to the positioning in the hierarchy of fair values pursuant to Ifrs 7 par. 27 the financial instruments described are classifiable as level 2; there were no transfers of level during the period.
The fair values as at 31.12.2015 of financial instruments on exchange rates were calcu-lated using the forward exchange rate method.
The counterparties with which the contracts are stipulated are leading national and international banking institutions.
The financial instruments on currencies are used, on a basis consistent with the finan-cial risk management policy adopted by the group, to hedge the risks deriving from ex-change rate fluctuations and concern sales volumes compared with the budget exchange rate and the collections and payment of short and medium-term receivables and payables with respect to the historical value.
Am
ount
s in
Eur
o/0
00
Am
ount
s in
Eur
o/0
00

Annual Report 2015188 – 189
For accounting purposes in relation to contracts hedging sales budgets in foreign cur-rencies effective at the reporting date, it should be noted that for the transactions ex-ecuted, especially Domestic Currency Swaps, and in accordance with all the conditions provided by the Ias/Ifrs standards, hedge accounting was applied with reference to the type of “cash flow hedge”. Consequently, the corresponding changes in fair values are re-flected in a shareholders’ equity reserve, net of the tax effect.
9.3 Derivativefinancialinstrumentsoninterestrates
A. Notional values and fair valuesThe table shows the details of the notional and fair values and other information regard-
ing the various types of derivative contracts on interest rates in existence as at 31.12.2015; on this date the ongoing contracts involved exclusively Carraro International Sa.
Contract Cur-rency
Expiry Notional 31.12.2015
Notional 31.12.2014
Fair Value 31.12.2015
Fair Value 31.12.2014
Interest Rate Swap Eur 30.06.2015 – 3,000 – –13
Total derivatives fromCash Flow Hedge
– 3,000 – –13
In relation to the positioning in the hierarchy of fair values pursuant to Ifrs 7 par. 27 the financial instruments described are classifiable as level 2; there were no transfers of level during the period.
For determination of the fair value of Interest Rate Swaps the discounted cash flow method was applied.
Below is a summary table of the assets and liabilities measured at fair value as at 31 December 2015, as required by Ifrs 13, described in section 3.2:
Level 2 31.12.2015
Level 2 31.12.2014
Assets
Foreign exchange derivative assets 809 3,147
Total Assets 809 3,147
Liabilities
Foreign exchange derivative liabilities 128 742
Interest rate derivative liabilities – 13
Total Liabilities 128 755
Sensitivity analysisThe table below shows the economic and financial effects generated by financial state-
ment assets and liabilities (as at 31.12.2015 and 31.12.2014 respectively), in the event of sudden changes in the following market variables:
› main foreign currencies with respect to the Euros: +/- 10%› interest rates: +100/-15 “basis points”
Am
ount
s in
Eur
o/0
00
Am
ount
s in
Eur
o/0
00

Consolidated Financial Statements
The interest rate oscillation bands represent the average expectations of maximum change that the markets currently express.
The following methods were used:› for Interest Rate Swaps the discounted cash flow method was applied;› Domestic Currency Swap contracts were calculated using the forward exchange rate
method;The exchange-rate risks deriving from translation of the financial statements of foreign
subsidiaries from local currency into Euros were not considered.
Balances as at 31.12.2015 Interest rate risk Exchange rate risk
+1% –0.15% +10% –10%
Financial effect
Effect on equity
Financial effect
Effect on equity
Financial effect
Effect on equity
Financial effect
Effect on equity
Assets
Trade receivables –1,236 1,831
Other fin. ass. - derivatives on currencies
2,908 –4,350 –2,548 4,310
Other fin. ass. - derivatives on interest rates
– – – –
Loans – –
Cash and cash equivalents
403 –385
Total gross effect – – – – 2,075 –4,350 –1,102 4,310
Taxes (27.50%) – – – – –571 1,196 303 –1,185
Total net effect – – – – 1,504 –3,154 –799 3,125
Liabilities
Trade payables 231 –29
Loans 1,865 –280 –1,621 1,621
Total gross effect 1,865 – –280 – –1,390 – 1,592 –
Taxes (27.50%) –513 – 77 – 382 – –438 –
Total net effect 1,352 – –203 – –1,008 – 1,154 –
Total 1,352 – –203 – 496 –3,154 355 3,125
Balances as at 31.12.2014 Interest rate risk Exchange rate risk
+1% –0.15% +10% –10%
Financial effect
Effect on equity
Financial effect
Effect on equity
Financial effect
Effect on equity
Financial effect
Effect on equity
Assets
Trade receivables –381 879
Other fin. ass. - derivatives on currencies
7,683 –10,370 –10,304 13,597
Other fin. ass. - derivatives on interest rates
– –
Loans – –
Cash and cash equivalents
1,094 –1,057
Am
ount
s in
Eur
o/0
00
Am
ount
s in
Eur
o/0
00

Annual Report 2015190 – 191
Balances as at 31.12.2014 Interest rate risk Exchange rate risk
+1% –0.15% +10% –10%
Financial effect
Effect on equity
Financial effect
Effect on equity
Financial effect
Effect on equity
Financial effect
Effect on equity
Total gross effect – – – – 8,396 –10,370 –10,482 13,597
Taxes (27.50%) – – – – –2,309 2,852 2,883 –3,739
Total net effect – – – – 6,087 –7,518 –7,599 9,858
Liabilities
Trade payables 1,558 –1,470
Loans 2,163 –324 –1,365 1,344
Total gross effect 2,163 – –324 – 193 – –126 –
Taxes (27.50%) –595 – 89 – –53 – 35 –
Total net effect 1,568 – –235 – 140 – –91 –
Total 1,568 – –235 – 6,227 –7,518 –7,690 9,858
Positive sign: expense (economic) - decrease (equity)Negative sign: income (economic) - increase (equity)
10. Eventssubsequenttothereportingdate
There were no events such as to have any significant effect on the financial statements and the related disclosures.
11. Informationinaccordancewitharticle149-duodeciesoftheConsobIssuers’Regulations
The Carraro Group financial statements will be audited, up to the year ending 31 De-cember 2015, by PricewaterhouseCoopers Spa. The fees accruing to the financial year, for auditing and other services, paid to PricewaterhouseCoopers Spa are summarised below.
2015 2014
Accounting audit
Carraro Spa 250 294
Subsidiary companies 507 590
Total independent auditing services 757 884
Other services
Carraro Spa 1 5
Subsidiary companies 149 276
Total other services 150 281
Total fees 907 1,165
Am
ount
s in
Eur
o/0
00

Consolidated Financial Statements
Equity investments held byDirectors, Statutory Auditors and General Managersand immediate family members
Name and surname Subsidiary company:Carraro Spa
No. of shares
held as at 31/12/2014
No. of shares
purchased
No.of shares
sold
No. of shares
held as at 31/12/2015
Mario Carraro Directly held 1,903,250 – – 1,903,250
through Finaid Spa 26,775,564 – –8,403,361 18,372,203
Julia Dora Koranyi Arduini Directly held 695,088 8,403,361 – 9,098,449
Alexander Josef Bossard Directly held 10,000 – – 10,000
Antonio Cortellazzo Directly held 37,500 – – 37,500
ENRICO CARRAROChairman
Annual Report 2015192 – 193
Certification of the consolidated financial statementsfor the year pursuant to Art. 154-bis, subsection 5of Leg. Dec. 58/1998 (Consolidated Finance Act)and Article 81-ter of Consob Regulation no. 11971of 14 May 1999 as amended
1. The undersigned Alberto Negri, Chief Executive Officer, and Enrico Gomiero, Fi-nancial Reporting Officer, also taking into account also the provisions of Article 154-bis, paragraphs 3 and 4, of Legislative Decree 58 of 24 February 1998, certify:
› the adequacy in relation to the characteristics of the enterprise;› the effective application of the administrative and accounting procedures used to
prepare the consolidated financial statements for 2015;
2. In this regard no significant aspects emerged which require disclosure.
3. We can also certify that:
3.1 The consolidated financial statements:› were prepared in conformity with the applicable international accounting stan-
dards endorsed by the European Community under the terms of Regulation (EC) N° 1606/2002 of the European Parliament and Council, of July 19, 2002;
› correspond to the accounting records;› give a true and fair picture of the financial position and performance of the Group
and of all the companies included in the scope of consolidation;
3.2 The report on operations includes a reliable analysis of the progress and results of operations, as well as the situation of the issuer and of the set of companies included in the consolidation, together with a description of the key risks and uncertainties they are exposed to.
Date: 19 February 2016
ALBERTO NEGRI ENRICO GOMIEROChief Executive Officer Financial Reporting Office

Relazioni

Annual Report 2015194 – 195
Report of the Board of Statutory Auditorsto the shareholders’ meeting pursuantto art. 153 of legislative decree 58/98 and art. 2429, paragraph 3 of the italian civil code
Dear Shareholders,During the year ended 31 December 2015, we carried out the supervisory activities re-
quired by law (in particular by Article 149 of Legislative Decree 58/1998 or “Consolidated Finance Act – Tuf”), in accordance with the Rules of Conduct of the Boards of Statutory Auditors of listed companies of the National Association of Certified Public Accountants, the Consob recommendations concerning corporate controls and activities of the Board of Statutory Auditors, the guidelines of the Code of Conduct, as well as in our capacity as the Internal Control and Auditing Committee pursuant to Article 19 of Legislative Decree 39/2010.
› We monitored compliance with the law and the Articles of Association without any observations or findings;
› We monitored compliance with the disclosure requirements relating to regulated and insider information and the requests of the supervisory authorities received pur-suant to Article 114 of Legislative Decree 58/1998.
› On at least a quarterly basis, we received information from the Directors about busi-ness conducted and about transactions having a significant effect on the Company’s financial position and performance and on its subsidiaries. We can reasonably as-sure you that actions adopted and undertaken are in conformity with law and with the Articles of Association, were not manifestly imprudent, risky, or in conflict with resolutions adopted by the Meeting of the Shareholders, and did not compromise the integrity of the Company’s assets. In particular, we monitored the activities related to the renegotiation of the agreement with the main lending banks that was signed on 24 December 2015 and which provided for rescheduling of medium and long-term borrowings and confirmation of short-term lines, as well as the redefinition of the covenants. The transactions related to the renegotiation of the agreement with the lending banks, as well as transactions having a significant effect on the Company’s financial position and performance, also at a Group level, have been documented in detail by the Directors in their Report on Operations, to which we make reference;
› During 2015, the Company did not carry out any atypical and/or unusual transac-tions, as defined in Note 2 of Consob Communication no. DEM/1025564 of 6/4/2001.
› With regard to transactions entered into with Group companies or with related par-ties pursuant to Arts. 2391 and 2391-bis of the Italian Civil Code, we noted:
Relazioni
~ the existence of intra-Group transactions concerning ordinary financial relation-ships with subsidiaries and associated companies, with the parent company, and with other related parties. Such relationships have been described in detail in the attached notes to the Financial Statements and Consolidated Financial State-ments. In particular, we point out:
− that such transactions of an ordinary nature primarily concern transactions of a financial or commercial nature, the provision of services and advisory services;
− that financial data of the parent company are primarily derived from the Com-pany being assessed on a consolidated basis for tax purposes through the parent company;
− that such transactions with subsidiaries and associated companies, with the parent company, and with other related parties are considered as being made against suitable payments and conforming to the interests of the Company;
~ we did not note the existence of atypical and/or unusual transactions entered into with related parties and/or capable of having a significant impact on the Compa-ny’s financial position and performance;
~ the information provided by the Directors in Report on Operations and in the notes to the Financial Statements on intra-Group transactions and/or transactions with related parties and atypical or unusual transactions, is considered to be adequate.
› The reports pursuant to Arts. 156 Tuf and 19, paragraph 3, of Legislative Decree 39/2010 issued by the independent auditors on the financial statements and con-solidated financial statements did not contain any findings or requests for further information. During 2015:
~ we held periodic meetings with the independent auditors, during which they pre-sented the auditing plan, results and key issues arising during the statutory audit pursuant to Article 19 of Legislative Decree 39/2010. Such reports did not, howev-er, reveal any pertinent data or information that would need to be highlighted in this report;
~ pursuant to Article 17 of Legislative Decree 39/2010, the independent auditors also confirmed their independence and that they had also been engaged within the Carraro Group to perform other non-audit services for a total fee of 4,000 Euros, of which 4,000 Euros for services to Carraro Spa. No other standing assignments were awarded to the independent auditors. In any event, for our part we constantly monitored the independence of the independent auditors without needing to make any findings.
› During the course of the fiscal year, no complaints were received pursuant to Article 2408 of the Italian Civil Code, nor were any petitions received from shareholders and/or third parties.
› We have verified and ascertained that the Articles of Association conform to and are adequate for legal requirements.

Annual Report 2015196 – 197
› The Board of Statutory Auditors did issue and formulate, in the course of 2015, opin-ions required by Law and issued the advisory opinions required by the Code of Con-duct and by policies and procedures adopted by the Company.
› During the year, twenty three meetings of the Board of Statutory Auditors were held. The Board of Statutory Auditors also participated;
~ in its collegial composition, in twelve meetings of the Board of Directors pursuant to Article 149, paragraph 2 of Legislative Decree 58/98;
~ in its collegial composition, in seven meetings of the Control and Risk Committee and of the Board of Statutory Auditors;
~ in five meetings of the Appointments and Remuneration Committee, in general, with only the Chairman and/or a standing auditor attending.
› The Board of Statutory Auditors collected evidence concerning the adequacy of the
composition, size and operation of the Board of Directors with reference to the prepa-ration of the strategic guidelines of the company, in the definition of the corporate structure of the group, as well as in the existence of adequate information flows to the Board required to monitor the performance of the company and of the group.
› The Board, pursuant to Legislative Decree 39/2010, in addition to sharing control objectives and procedures with the Independent Directors that comprise the Internal Control and Risk Committee, based on the provisions of the Code of Conduct, exer-cised specific monitoring of internal audit procedures and of the audits carried out by the same, of financial disclosures and of risk mapping. In particular, meetings were held with the company management concerning risks analysis and assessment proce-dures, mainly of a financial nature related to the renegotiation of the agreement with the main lending banks that was signed on 24 December 2015 and which provided for rescheduling of medium and long-term borrowings and confirmation of short-term lines, as well as the redefinition of the covenants.
› We became familiar with and monitored, within our area of responsibility, compli-ance with the principles of proper management, the adequacy of the Company’s or-ganisational structure, and of regulations issued by the Company for subsidiaries pursuant to Article 114, paragraph 2 of Legislative Decree 58/1998, by collecting in-formation from relative responsible parties and meeting with the independent audi-tors appointed to audit the accounts.
› We maintained contact with the corresponding control bodies of Italian subsidiar-ies, obtaining information from members of the Board of Statutory Auditors of such subsidiaries; the purpose of this was the reciprocal exchange of data and relevant information.
› We evaluated and monitored the sufficiency of the internal control and accounting systems, as well as the reliability of the accounting system for correctly presenting
Relazioni
the actions of management, by obtaining information from the responsible parties in the various departments, examining company documents, and analysing the results of work carried out by the outside auditors, with the objective of monitoring the work of those in charge of internal control. In particular:
~ we monitored the constant updating and sufficiency of internal procedures con-cerning the main Company cycles, as well as the verification activities put in place by internal control;
~ we monitored the adoption of administrative procedures designed to provide nec-essary information about operations and the financial position and performance of companies established and regulated by the laws of non-EU member states that have significant relevance, within the meaning of the combined provisions of Arti-cles 36 and 39 of the so-called “Markets Regulations”.
› The Board agrees with the contents of the Report on Corporate Governance attached to the Financial Statements, where an analytical description is given of the specif-ic implementation of corporate governance rules required by the Code of Conduct, which the Company, in disclosure to the public, has declared it adopts. This report was prepared in accordance with the instructions of the Regulations of the Organ-ised Markets managed by the Italian Stock Exchange and of the Tuf. As required by Article 149, paragraph one, letter c-bis, of Legislative Decree 58/1998 and by Code of Conduct, we monitored:
~ the methods of implementing the rules of corporate governance required by the aforementioned code without needing to make any qualifications;
~ the correct application of the criteria and the verification procedures adopted by the Board of Directors to evaluate the independence of its members, as well as other public tender procedures.
› The Board agrees with the contents of the Report of the Appointments and Remu-neration Committee attached to the Financial Statements, providing a detailed illus-tration of the concrete implementation of remuneration policies.
› The Board agrees with the contents of the Report of the Control and Risk Committee attached to the Financial Statements, providing a detailed illustration of the activi-ties carried out and the assessments of the internal control system.
› Pursuant to and in accordance with the requirements of Section 8 paragraph 1 of the Corporate Governance Code, we acknowledge that in verifying the existence of requisites for the independence of members of the Board of Statutory Auditors, the same criteria were adopted as required by the Code of Conduct for directors and that verification was carried out with reference to each member in accordance with pro-cedures designed to ensure impartial and truthful evaluation.
› In 2015, in conformity with the requirements of Legislative Decree 231/2001, as amended, as well as with its compliance programme and relative code of ethics, the

Annual Report 2015198 – 199
Company continued to pursue activities intended to ensure the functioning of an effective system that is capable of preventing any liability concerning unlawful acts punishable under Legislative Decree 231/2001, as amended.
› During the year, we constantly carried out monitoring activities as required by Article
149 of Legislative Decree 58/1998, and we can conclusively confirm that in carrying out our activities, we did not ascertain any irregularities, omissions, or punishable acts and therefore do not have any proposals to make to the Shareholders’ Meeting pursuant to Article 153, paragraph 2 of Legislative Decree 58/1998.
The Financial Statements as at 31 December 2015 of Carraro S.p.A. and the Consolidat-ed Financial Statements as at the same date, were prepared in accordance with the inter-national accounting standards Ias/Ifrs issued by the International Accounting Standards Board (Iasb), in conformity with the provisions of Legislative Decree of 28 February 2005, no. 38, enacted pursuant to Regulation (EC) No 1606/2002 of the European Parliament and of the Council of 19 July 2002. <The Board of Statutory Auditors has examined the criteria adopted in preparation of the above-mentioned Financial Statements, with par-ticular reference to the content and structure, the basis of consolidation and uniformity of application of accounting standards, the existence of adequate disclosure on corporate performance and on evaluations carried out for impairment testing and on the continua-tion of the business as a going concern.
Since analytical control of the content of the Financial Statements is not our responsi-bility, we have monitored the general structure of the Financial Statements and Consoli-dated Financial Statements, their compliance with the law with regard to their formation and structure and in this regard we have no particular observations to make.
To the best of our knowledge, the Directors, in preparing the Financial Statements, did not depart from the rules of law pursuant to Article 2423, paragraph four of the Italian Civil Code. We have verified that the Financial Statements and the Directors’ Report on Operations are consistent with the facts and information of which we are aware as a result of the execution of our duties and we have no observations in this regard. The statutory Fi-nancial Statements and Consolidated Financial Statements of Carraro Spa are accompa-nied by the required report of the independent auditors, to which we refer. In light of the foregoing, the Board gives its favourable opinion for approval of the Financial Statements for the fiscal year closed on 31 December 2015 as submitted by the Board of Directors, and is in agreement with the Board concerning the carryforward of operating losses.
Campodarsego, March 2016
the board of statutory auditors
SAVERIO BOZZOLAN STEFANIA CENTORBI ANDREA CORTELLAZZO
INDEPENDENT AUDITORS’ REPORT IN ACCORDANCE WITH ARTICLES 14 AND 16 OF LEGISLATIVE DECREE N° 39 OF 27 JANUARY 2010 To the shareholders of Carraro SpA Report on the consolidated financial statements We have audited the accompanying consolidated financial statements of the Carraro Group, which comprise the statement of financial position as of 31 December 2015, the income statement, the statement of comprehensive income, the statement of changes in shareholders’ equity and the statement of cash flows for the year then ended, a summary of significant accounting policies and the related explanatory and supplementary notes. Directors’ responsibility for the consolidated financial statements The directors of Carraro SpA are responsible for the preparation of consolidated financial statements that give a true and fair view in compliance with International Financial Reporting Standards as adopted by the European Union, as well as with the regulations issued to implement article 9 of Legislative Decree n° 38/2005. Auditors’ responsibility Our responsibility is to express an opinion on these consolidated financial statements based on our audit. We conducted our audit in accordance with International Standards on Auditing (ISA Italia) drawn up pursuant to article 11, paragraph 3, of Legislative Decree n° 39 of 27 January 2010. Those standards require that we comply with ethical requirements and plan and perform the audit to obtain reasonable assurance about whether the consolidated financial statements are free from material misstatement. An audit involves performing audit procedures to obtain audit evidence about the amounts and disclosures in the consolidated financial statements. The audit procedures selected depend on the auditor’s professional judgment, including the assessment of the risks of material misstatement of the consolidated financial statements, whether due to fraud or error. In making those risk assessments, the auditor considers internal control relevant to the entity’s preparation of consolidated financial statements that give a true and fair view, in order to design audit procedures that are appropriate in the circumstances, but not for the purpose of expressing an opinion on the effectiveness of the entity’s internal control. An audit also includes evaluating the appropriateness of accounting policies used and
2 of 2
the reasonableness of accounting estimates made by the directors, as well as evaluating the overall presentation of the consolidated financial statements. We believe that the audit evidence we have obtained is sufficient and appropriate to provide a basis for our audit opinion. Opinion In our opinion, the consolidated financial statements give a true and fair view of the financial position of the Carraro Group as of 31 December 2015 and of the result of its operations and cash flows for the year then ended in compliance with International Financial Reporting Standards as adopted by the European Union, as well as with the regulations issued to implement article 9 of Legislative Decree n° 38/2005. Report on compliance with other laws and regulations Opinion on the consistency with the consolidated financial statements of the report on operations and of certain information set out in the report on corporate governance and ownership structure We have performed the procedures required under auditing standard (SA Italia) n° 720B in order to express an opinion, as required by law, on the consistency of the report on operations and of the information set out in the report on corporate governance and ownership structure referred to in article 123-bis, paragraph 4, of Legislative Decree n° 58/98, which are the responsibility of the directors of Carraro SpA, with the consolidated financial statements of the Carraro Group as of 31 December 2015. In our opinion, the report on operations and the information in the report on corporate governance and ownership structure mentioned above are consistent with the consolidated financial statements of the Carraro Group as of 31 December 2015. Padua, 23 March 2016 PricewaterhouseCoopers SpA Signed by Massimo Dal Lago (Partner) This report has been translated into English from the Italian original solely for the convenience of international readers.

Relazioni
Ordinary and Extraordinary Shareholders’ Meetingof Carraro Spa of 15 April 2016
Chairman: Enrico Carraro
Shareholders present: 8 shareholders in person or by proxy representing 65.304% of total share capital amounting to 30.033.370 ordinary shares with voting rights.
The Ordinary Shareholders’ Meeting:
› approved the Financial Statements at 31/12/2015 and the Report of the Board of Direc-tors on the operations of 2015 and to carry forward the loss for the year of 3.849.335,89 Euros;
› approved the first section of the Report on the Remuneration of Directors and Key Managers;
› confirmed annual fees for 2015, established as 50,000 Euros for each Director and de-termined a total annual amount of 2.150.000 Euros, in effect until the date of approval of the 2016 Financial Statements by the Shareholders’ Meeting, for fees to assign to members of the Board of Directors with particular positions, including the Chairman, Deputy Chairman, Chief Executive Officer and members of committees, giving the Board of Directors the power to distribute the amount among its members;
› approved the proposal of the Board of Statutory Auditors concerning the appointment of the statutory audit for the 2016-2024 financial years to Deloitte & Touche Spa in ac-cordance with the terms and conditions proposed by the Board of Statutory Auditors;
› approved the appointment of Mr. Riccardo Arduini as a new member of the Board of Directors of Carraro Spa. Mr. Arduini, who replaces Mr. Alexander Josef Bossard who resigned on 9.12.2015, will remain in office until the Shareholders’ Meeting called to approve the financial statements for 2017.
The Extraordinary Shareholders’ Meeting:
› approved the Amendment to Article 5 of the Articles of Association pursuant to Article 127-quinquies (voting majority) of Legislative Decree 58/1998.

Annual Report 2015202 – 203

Relazioni

Annual Report 2015204 – 205

Relazioni

Annual Report 2015206 – 207
design
Bunker{bnkr.it}
composto in
Amplitude{Schwartz, 2003}Miller{Carter, 2002}

Relazioni

carraro.com