report prepared for department of trade, industry and
TRANSCRIPT

Import Tracker Quarter 4 2019
Report prepared for Department of Trade, Industry and Competition
March 2020
Trade & Industrial
Policy Strategies
(TIPS) is a research
organisation that
facilitates policy
development and
dialogue across
three focus areas:
trade and industrial
policy, inequality
and economic
inclusion, and
sustainable growth
PROJECT LEAD
Nokwanda Maseko
CONTRIBUTORS
Rhulani Hobyani
Kelello Mashiane
Sandra Makumbirofa
Kudzai Mataba
Musa Mkhabela
Tshepo Semenya
EDITORIAL INPUTS
Saul Levin
+27 12 433 9340
www.tips.org.za
Trade & Industrial
Policy Strategies
(TIPS) is a research
organisation that
facilitates policy
development and
dialogue across
three focus areas:
trade and industrial
policy, inequality
and economic
inclusion, and
sustainable growth
PROJECT LEAD
Nokwanda Maseko
CONTRIBUTORS
Kelello Mashiane
Kudzai Mataba
Rhulani Hobyani
Musa Mkhabela
Tshepo Semenya
EDITORIAL INPUTS
Saul Levin
+27 12 433 9340
www.tips.org.za
1
Contents
Introduction ............................................................................................................................................ 2
Section 1: Fourth quarter trade trends ................................................................................................... 2
Trade context .................................................................................................................................. 2
Major imports ................................................................................................................................. 2
Import surges .................................................................................................................................. 3
Explanation of import surges .............................................................................................................. 4
Finding 1: Ongoing monitoring of previously identified surges ...................................................... 4
Finding 2: Plywood consisting solely of sheets of wood <= 6 mm thick ......................................... 4
Finding 3: Disodium sulphate .......................................................................................................... 5
Finding 4: Double salts and mixtures of calcium nitrate and ammonium nitrate .......................... 6
Finding 5: Raw cane sugar, in solid form, not containing added flavouring or colouring matter .. 7
Finding 6: Fibreboard of wood or other ligneous materials ........................................................... 9
Finding 7: Manganese dioxide cells and batteries (HS 85061090 and HS 85061010) .................. 10
Finding 8: Refractory bricks block tiles and similar refractory ceramic constructional goods ..... 11
Finding 9: Data errors and other issues ........................................................................................ 12
Section 2: review of import surges for 2019 ......................................................................................... 13
Data annexures ..................................................................................................................................... 16
Graph 1: Trade balance, Q4 2010 – Q4 2019 .......................................................................................... 2
Graph 2: Imports of plywood, Q4 2010 – Q4 2019 ................................................................................. 5
Graph 3: Imports of disodium sulphate, Q4 2010 – Q4 2019 ................................................................. 6
Graph 4: Top five countries from which South Africa imported double salts and mixtures of calcium
nitrate and ammonium nitrate, Q4 2010 – Q4 2019 .............................................................................. 7
Graph 5: South African sugar trade (quantities – HS 1701), Q4 2010 – Q4 2019 ................................... 8
Graph 6: Sugar imports by type, Q4 2010 – Q4 2019 ............................................................................. 8
Graph 7: Top five countries from which South Africa imported fibreboard of wood or other ligneous
materials, Q4 2010 – Q4 2019 ................................................................................................................ 9
Graph 8: Imports of manganese dioxide cells and batteries (excluding spent): Other (HS 85061010) 10
Graph 9: Top five countries from which South Africa imported manganese dioxide cells and batteries
(excluding spent): Other (HS 85061090) ............................................................................................... 11
Graph 10: Top five countries from which South Africa imported refractory bricks block tiles and
similar refractory ceramic constructional goods, Q4 2010 – Q4 2019 ................................................. 12
Table 1: Decline in imports, Q4 2019 ...................................................................................................... 3
Table 2: Ongoing monitoring of import surges from Q1 2018 – Q3 2019 .............................................. 4
Table 3: Data errors and other issues ................................................................................................... 12
Table 4: Status of surge for previously analysed items, Q1 2019 – Q3 2019 (with 2 items from 2018)
.............................................................................................................................................................. 14

2
Introduction
This fourth quarter report of the Import Tracker is in two sections. The first section focuses on import
trends for the fourth quarter of 2019, similar to previous reports. The second section of the report
provides a brief review of some of the major trends for 2019. The review focuses on the major imports
in both Rand and quantity terms.
Section 1: Fourth quarter trade trends
Trade context
The trade balance grew for the third consecutive quarter, from R3 billion in the second quarter of 2019
to R23.2 billion in the third quarter of 2019, mainly the result of a significant decline in imports
(see Graph 1). Both imports and exports show quarter-on-quarter and year-on-year declines. Year-on-
year, imports declined by 6% (from R341 billion in the fourth quarter of 2018 to R319 billion in the
fourth quarter of 2019), while exports declined by 4% (from R358 billion to R342 billion over the same
period). Imports for the quarter are driven by crude oil (R40.3 billion), automotive components
(R10.1 billion), and diesel (R9.3 billion). Exports, which amounted to R342 billion in the fourth quarter
of 2019, were driven by exports of gold (R22.6 billion), bituminous coal (R17.9 billion), as well as
agglomerated iron ores and concentrates (R13.8 billion).
Graph 1: Trade balance, Q4 2010 – Q4 2019
Source: Calculated from South African Reserve Bank (SARS) Trade Statistics and South African Reserve Bank
(SARB).
Major imports
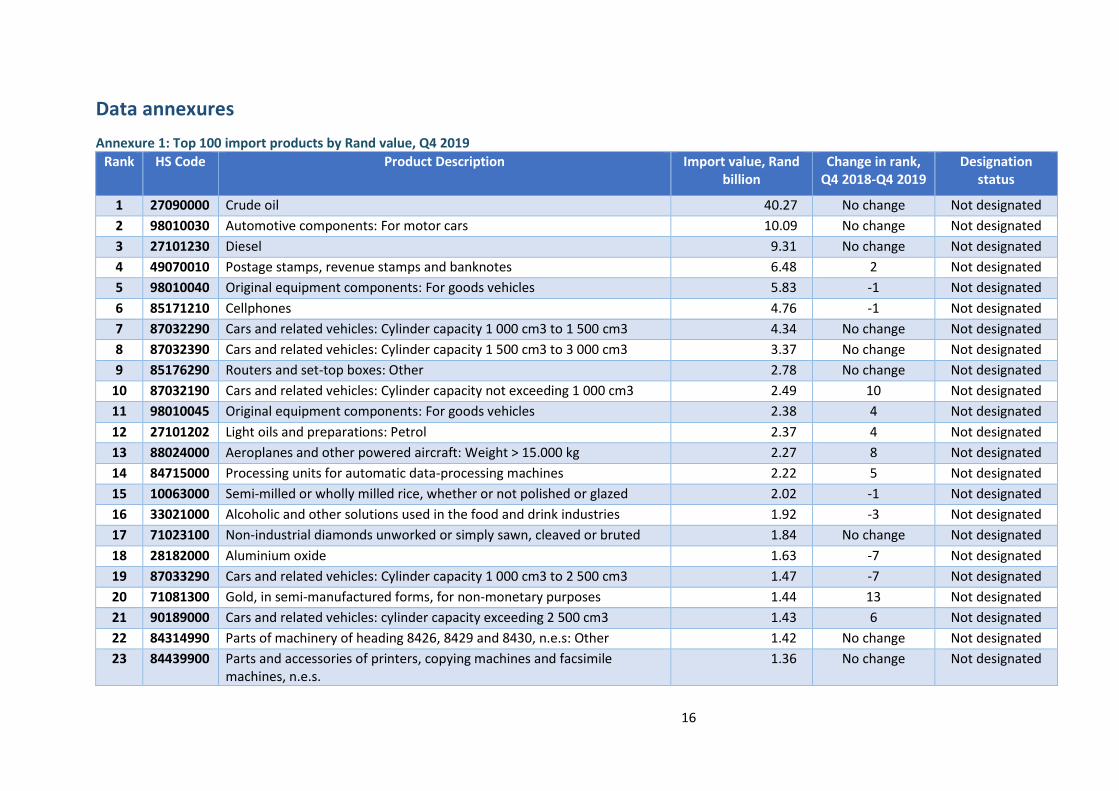
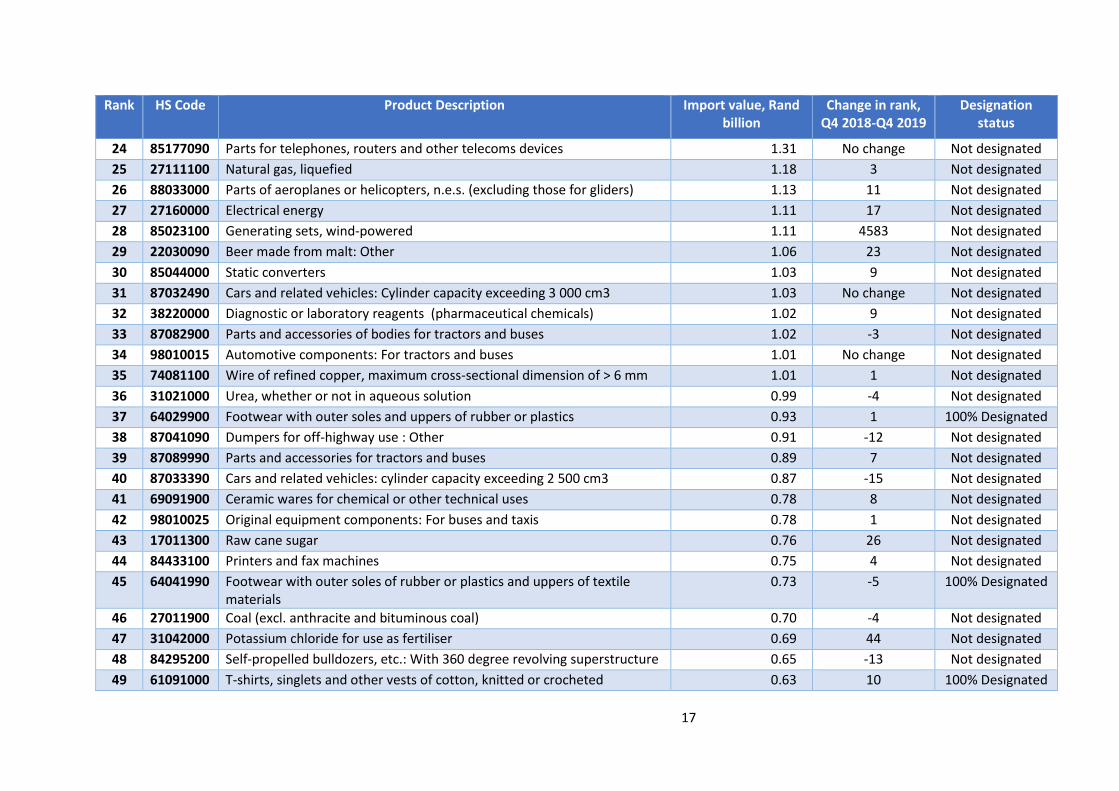
The top 100 imports by Rand value, which amount to R160.5 billion, are listed in Annexure 1. The list
is dominated by commodities such as production metals, petroleum and other liquid fuels, aircraft
and aircraft components, information and communications technology (ICT) equipment, automotive
(including automotive components), food and beverage products, and medical equipment.
-
200
400
600
800
1 000
1 200
1 400
1 600
-
50
100
150
200
250
300
350
400
2010 2011 2012 2013 2014 2015 2016 2017 2018 2019
Exch
ange
rat
e, Z
AR
Cen
t/U
SD
Trad
e, B
illio
ns
of
con
stan
t 2
01
9 R
and
Imports Exports US Dollar/ZAR Exchange rate
3
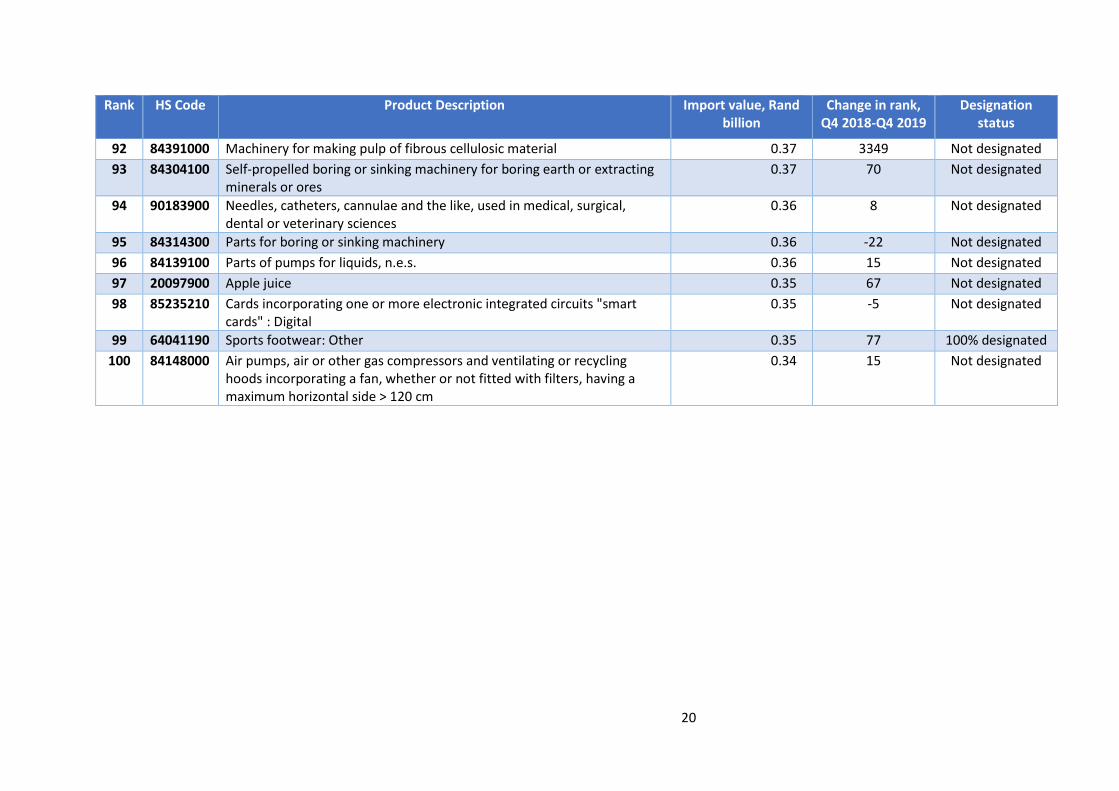
In addition, some items that were flagged in previous quarters continue to see high imports in Rand
terms. These include wind-powered generating sets, which amounted to R1.1 billion; maize (excluding
seed for sowing) which amounted to R0.44 billion; as well as machinery for making pulp of fibrous
cellulosic material, which amounted to R0.37 billion. Other new items that have surged in Rand value
include apple juice, which surged to R350.9 million from R235.5 million in the fourth quarter of 2018.
The imports are driven by an increase in imports from China. This appears to be linked to lower apple
production in South Africa since the drought (based on 2018 apple production data from the Abstract
of Agricultural Statistics; 2019 data is not available yet). Imports of self-propelled front-end shovel
loaders also surged, amounting to R402.5 million from R163.1 million in the fourth quarter of 2018.
More than 80 000 units were imported, from 549 in the fourth quarter of 2018. The reason for the
surge is unclear, but this might be a data error in reporting quantities from Finland, which are the
cause of the surge. Based on the data, the unit price of each item declined from R297 009 to R5 007
between the fourth quarters of 2018 and 2019.
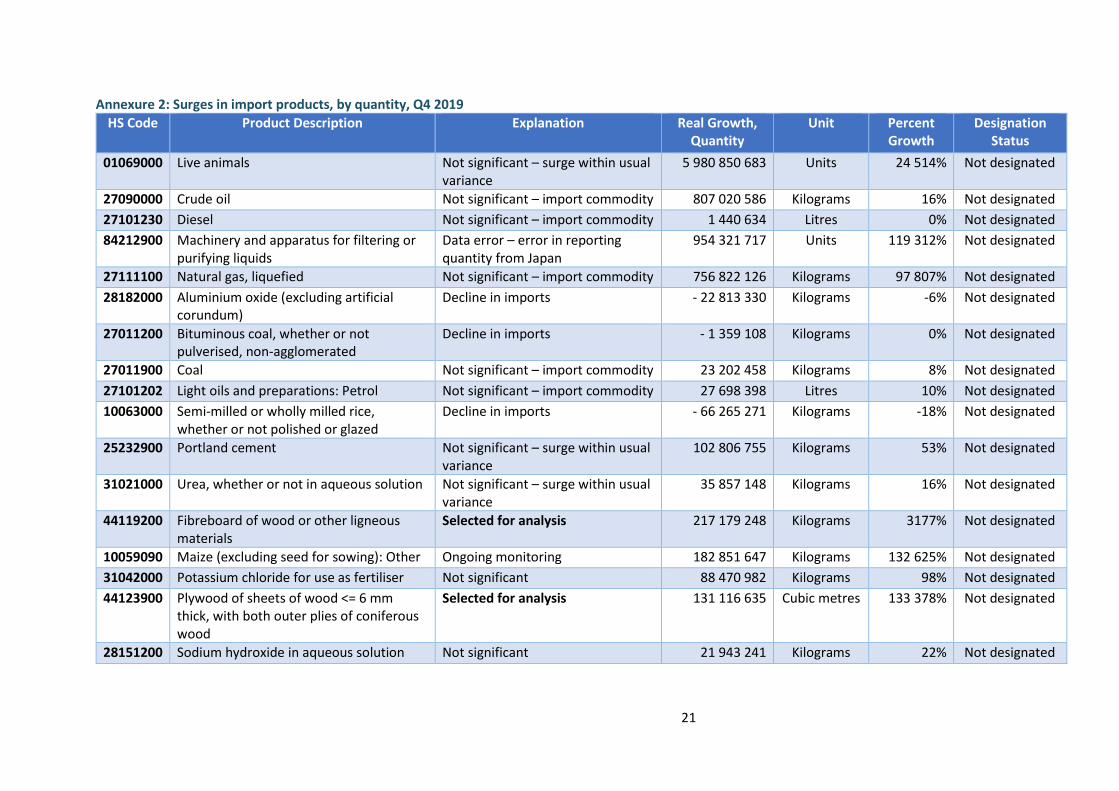
Import surges
Annexure 1 provides a list of the top 50 imports by quantity for the fourth quarter of 2019. This also
shows which import trend is normal, which is a possible data error, and which needs further analysis.
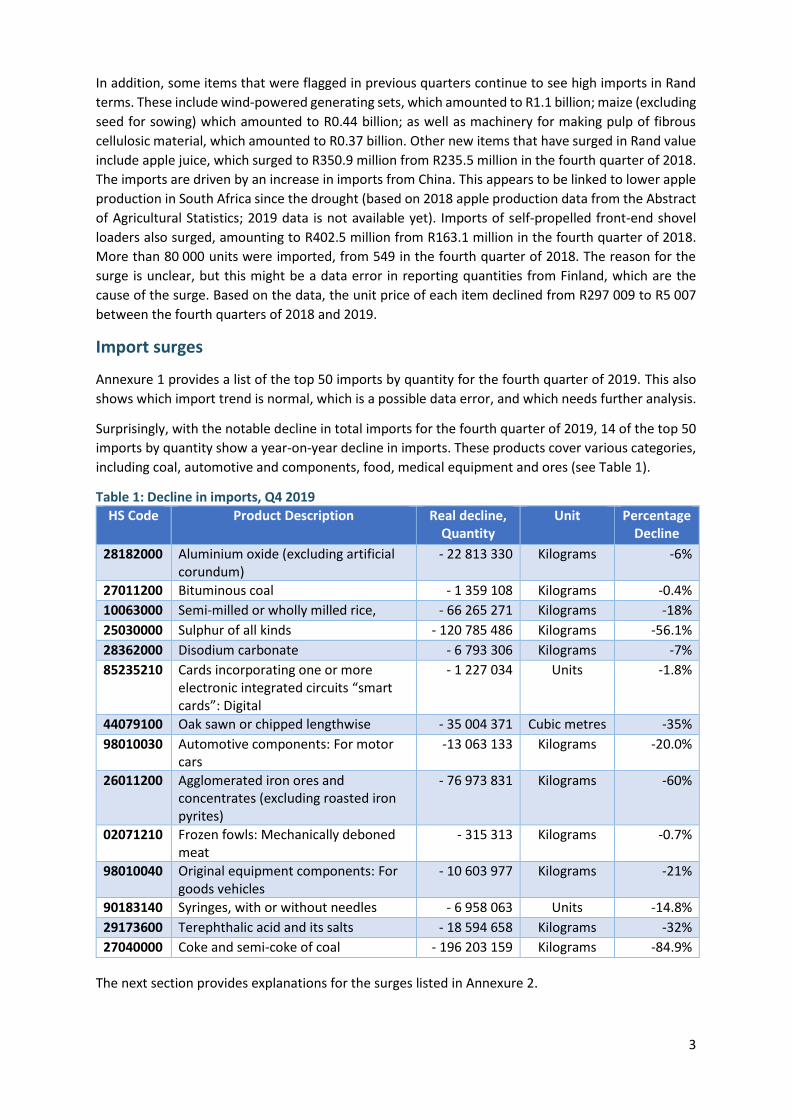
Surprisingly, with the notable decline in total imports for the fourth quarter of 2019, 14 of the top 50
imports by quantity show a year-on-year decline in imports. These products cover various categories,
including coal, automotive and components, food, medical equipment and ores (see Table 1).
Table 1: Decline in imports, Q4 2019
HS Code Product Description Real decline, Quantity
Unit Percentage Decline
28182000 Aluminium oxide (excluding artificial corundum)
- 22 813 330 Kilograms -6%
27011200 Bituminous coal - 1 359 108 Kilograms -0.4%
10063000 Semi-milled or wholly milled rice, - 66 265 271 Kilograms -18%
25030000 Sulphur of all kinds - 120 785 486 Kilograms -56.1%
28362000 Disodium carbonate - 6 793 306 Kilograms -7%
85235210 Cards incorporating one or more electronic integrated circuits “smart cards”: Digital
- 1 227 034 Units -1.8%
44079100 Oak sawn or chipped lengthwise - 35 004 371 Cubic metres -35%
98010030 Automotive components: For motor cars
-13 063 133 Kilograms -20.0%
26011200 Agglomerated iron ores and concentrates (excluding roasted iron pyrites)
- 76 973 831 Kilograms -60%
02071210 Frozen fowls: Mechanically deboned meat
- 315 313 Kilograms -0.7%
98010040 Original equipment components: For goods vehicles
- 10 603 977 Kilograms -21%
90183140 Syringes, with or without needles - 6 958 063 Units -14.8%
29173600 Terephthalic acid and its salts - 18 594 658 Kilograms -32%
27040000 Coke and semi-coke of coal - 196 203 159 Kilograms -84.9%
The next section provides explanations for the surges listed in Annexure 2.

4
Explanation of import surges
Finding 1: Ongoing monitoring of previously identified surges
Table 2Table 2 shows one item that remains on the list of monitored items. Imports of this product
have been high for a number of quarters. Monitoring of this product will continue. None of the other
products on the list in the third quarter showed any considerable increases during the fourth quarter,
hence only one item remains on the list.
Table 2: Ongoing monitoring of import surges from Q1 2018 – Q3 2019
HS Code Product description Status of surge Explanations
10059090 Maize (excluding seed for sowing): Other
Ongoing The growth is driven by imports from Argentina. This appears to be driven by decreased production of maize in South Africa in 2018.
Finding 2: Plywood consisting solely of sheets of wood <= 6 mm thick
Plywood consisting solely of sheets of wood <= 6 mm thick, with both outer plies of coniferous wood
(excluding of bamboo, sheets of compressed wood, cellular wood panels, inlaid wood and sheets
identifiable as furniture components) (HS 44123900) is one of the oldest forms of engineered wood
products. It is used in roof sheathing, wall siding, floor underlayment and structural diaphragms. It is
also used in the manufacture of packaging materials, decorative panels and doors. Plywood is graded
based the appearance and finish of its exposed face and back faces, with grading levels varying across
countries.
The latest surge began in the third quarter of 2019, and was initially reported as a data error
(see Import Tracker Q3 report for explanation). However, its recurrence suggests that it is not a data
error. Plywood imports surged to more than 131 million cubic metres in the fourth quarter of 2019
(see Graph 2).
The surge appears to be the result of the ongoing legal dispute between the United States of America
(US) and Brazil.1 The US is traditionally the largest importer of Brazilian plywood. However, in
September a group of US plywood manufacturers instituted legal proceedings against several US
certification agencies for fraudulently and negligently certifying Brazilian plywood.2 It is alleged that
Brazilian manufactured plywood has been found to be defective due to widespread failure in quality
control during testing and use. The lawsuit also alleges that Brazil has an unfair pricing advantage,
which has caused many US producers to operate at a loss since September 2017. With Brazil losing
market share in the US, it is likely they are exporting to South Africa to make up for
the loses.
1 US Plywood Producers Sue Claiming Brazil’s Exports Flunk Industry Strength Standards. 6 September 2019. https://www.law.com/dailybusinessreview/2019/09/06/us-plywood-producers-sue-claiming-brazils-exports-flunk-industry-strength-standards/ 2 Trade Map. Brazil Tariff line 44123900 exports. https://www.trademap.org/Country_SelCountry_MQ_TS.aspx?nvpm=1%7c076%7c%7c%7c%7c441239%7c%7c%7c6%7c1%7c1%7c2%7c2%7c2%7c2%7c2%7c1 (accessed 26 February 2020)

5
Graph 2: Imports of plywood, Q4 2010 – Q4 2019
Source: Authors. Calculated from ITC Trade Map. Downloaded from https://www.trademap.orgt in February
2020. Note: Data for 2010, 2011, 2014, 2015, 2016 and 2018 is too low, hence it is not visible on the graph.
In addition, from the second quarter of 2018, Brazilian plywood manufacturers have also been under
increasing pressure within the European market, which is traditionally another significant importer of
this product. Russia, China, Belarus and Ukraine have jointly increased their market share in Europe,
which has resulted in the decreasing of Brazilian imports.3 It is plausible that the weakening of the
position of Brazilian plywood in Europe has also led to a trade diversion to the South African market.
Last, as part of the merger and restructuring of Mondi Plc and Mondi Ltd, one of the big importers of
this product, the Competition Tribunal mandated in 2019 that the company invest R8 billion into its
South African enterprise within the next five years.4 It is thus plausible that Mondi is absorbing a
significant portion of the imports for its operations.
Finding 3: Disodium sulphate
According to the United States Geological Survey (USGS) 5 disodium sulphate is a synonym for sodium
sulfate. It is described as an inorganic chemical with several industrial uses including in soaps and
detergents, pulp and paper, and textiles. The chemical is produced from naturally occurring sodium-
sulfate-bearing salt water or crystalline evaporite (individual minerals found in deposits of soluble salts
that come from the evaporation of water deposits).6 It can also be produced as a by-product from
different chemical processes, such as ascorbic acid, battery acid recycling, among others.
Data on local production is not readily available, however, there are exports from South Africa. In the
fourth quarter 2019 South Africa exported 66 548 kg valued at approximately R1.3 million compared
3 European Plywood Markets Facing Multiple Pressures. 2 September 2019. https://www.fordaq.com/news/plywood_market_European_64669.html 4 Mondi Must Invest R8 billion in next 5 years. 15 July 2019. https://www.iol.co.za/business-report/companies/mondi-must-invest-r8bn-in-next-5-years-29226736 5 United States Geological Survey (USGS).= https://www.usgs.gov/centers/nmic/sodium-sulfate-statistics-and-information?qt-science_support_page_related_con=0#qt-science_support_page_related_con 6 Britannica https://www.britannica.com/science/evaporite
-
20 000
40 000
60 000
80 000
100 000
120 000
-
20 000
40 000
60 000
80 000
100 000
120 000
140 000
Val
ue
of
imp
ort
s ('
00
0 R
and
s)
Qu
anti
ty (
'00
0 c
ub
ic m
etre
s)
Quantity Value of imports

6
to R1.7 million for 359 403 kg in quarter four 2018. By country, exports mainly went to Zambia,
Zimbabwe, the Democratic Republic of Congo and Botswana.
Imports of disodium sulphate rose to 53.5 million kg in the fourth quarter of 2019, from 16.8 million kg
in the fourth quarter of 2018 (see Graph 3), driven by a surge from China and Spain. In the year to the
fourth quarter of 2019 imports from China surged more than tenfold to 35.6 million kg, compared to
imports from Spain, which grew by 50% to 17.2 million kg. The reason for the surge is unclear. The
trend will be monitored in coming quarters.
Graph 3: Imports of disodium sulphate, Q4 2010 – Q4 2019
Source: Authors. Calculated from ITC Trade Map. Downloaded from https://www.trademap.org in February 2020.
Finding 4: Double salts and mixtures of calcium nitrate and ammonium nitrate
Double salts and mixtures of calcium nitrate and ammonium nitrate (excluding those in pellet or
similar forms, or in packages with a gross weight of <= 10 kg) (HS 31026000) are used as fertiliser
(particularly ammonium nitrate) or as chemical inputs in the production of nitrogen fertiliser. Given
its importance in plant growth, nitrogen fertiliser is viewed as “especially appropriate for young
plants”.7 Although South Africa, through various companies, does produce fertiliser, the country is a
net importer of fertiliser, with R2.9 billion worth of fertiliser imported in the fourth quarter of 2019,
compared to R1.2 billion in exports. During the fourth quarter of 2019, 69.3 million kg of double salts
and mixtures of calcium nitrate and ammonium nitrate were imported, compared to 22.5 million kg
in exports.
The surge in imports during the fourth quarter of 2019 was driven by the re-entry of Germany into the
local double salts and mixtures of calcium nitrate and ammonium nitrate market for the first time
since the second quarter of 2017, along with a more than 84-fold increase in imports from Russian
(see Graph 4). The unit prices for imports from both Germany and Russia are more or less in line with
the unit prices from South Africa’s other major sources such as China and the Netherlands, suggesting
that these are legitimate imports, and not market-seeking based on low prices.
7 https://homeguides.sfgate.com/effects-nitrogen-fertilizer-45896.html
-
10 000
20 000
30 000
40 000
50 000
60 000
70 000
-
10 000
20 000
30 000
40 000
50 000
60 000
Imp
ort
s va
lue
('0
00
Ran
d t
ho
usa
nd
)
Qu
anti
ty (
'00
0 k
g)
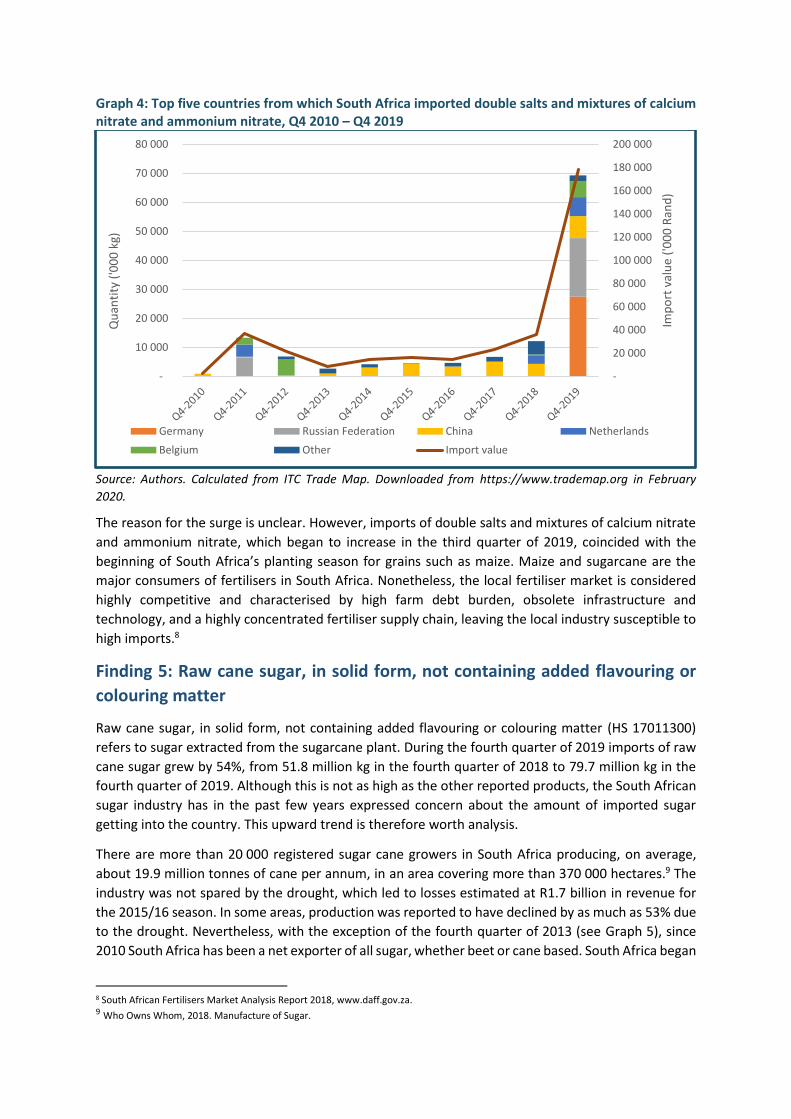
Graph 4: Top five countries from which South Africa imported double salts and mixtures of calcium nitrate and ammonium nitrate, Q4 2010 – Q4 2019
Source: Authors. Calculated from ITC Trade Map. Downloaded from https://www.trademap.org in February
2020.
The reason for the surge is unclear. However, imports of double salts and mixtures of calcium nitrate
and ammonium nitrate, which began to increase in the third quarter of 2019, coincided with the
beginning of South Africa’s planting season for grains such as maize. Maize and sugarcane are the
major consumers of fertilisers in South Africa. Nonetheless, the local fertiliser market is considered
highly competitive and characterised by high farm debt burden, obsolete infrastructure and
technology, and a highly concentrated fertiliser supply chain, leaving the local industry susceptible to
high imports.8
Finding 5: Raw cane sugar, in solid form, not containing added flavouring or
colouring matter
Raw cane sugar, in solid form, not containing added flavouring or colouring matter (HS 17011300)
refers to sugar extracted from the sugarcane plant. During the fourth quarter of 2019 imports of raw
cane sugar grew by 54%, from 51.8 million kg in the fourth quarter of 2018 to 79.7 million kg in the
fourth quarter of 2019. Although this is not as high as the other reported products, the South African
sugar industry has in the past few years expressed concern about the amount of imported sugar
getting into the country. This upward trend is therefore worth analysis.
There are more than 20 000 registered sugar cane growers in South Africa producing, on average,
about 19.9 million tonnes of cane per annum, in an area covering more than 370 000 hectares.9 The
industry was not spared by the drought, which led to losses estimated at R1.7 billion in revenue for
the 2015/16 season. In some areas, production was reported to have declined by as much as 53% due
to the drought. Nevertheless, with the exception of the fourth quarter of 2013 (see Graph 5), since
2010 South Africa has been a net exporter of all sugar, whether beet or cane based. South Africa began
8 South African Fertilisers Market Analysis Report 2018, www.daff.gov.za. 9 Who Owns Whom, 2018. Manufacture of Sugar.
-
20 000
40 000
60 000
80 000
100 000
120 000
140 000
160 000
180 000
200 000
-
10 000
20 000
30 000
40 000
50 000
60 000
70 000
80 000
Imp
ort
val
ue
('0
00
Ran
d)
Qu
anti
ty (
'00
0 k
g)
Germany Russian Federation China Netherlands
Belgium Other Import value
8
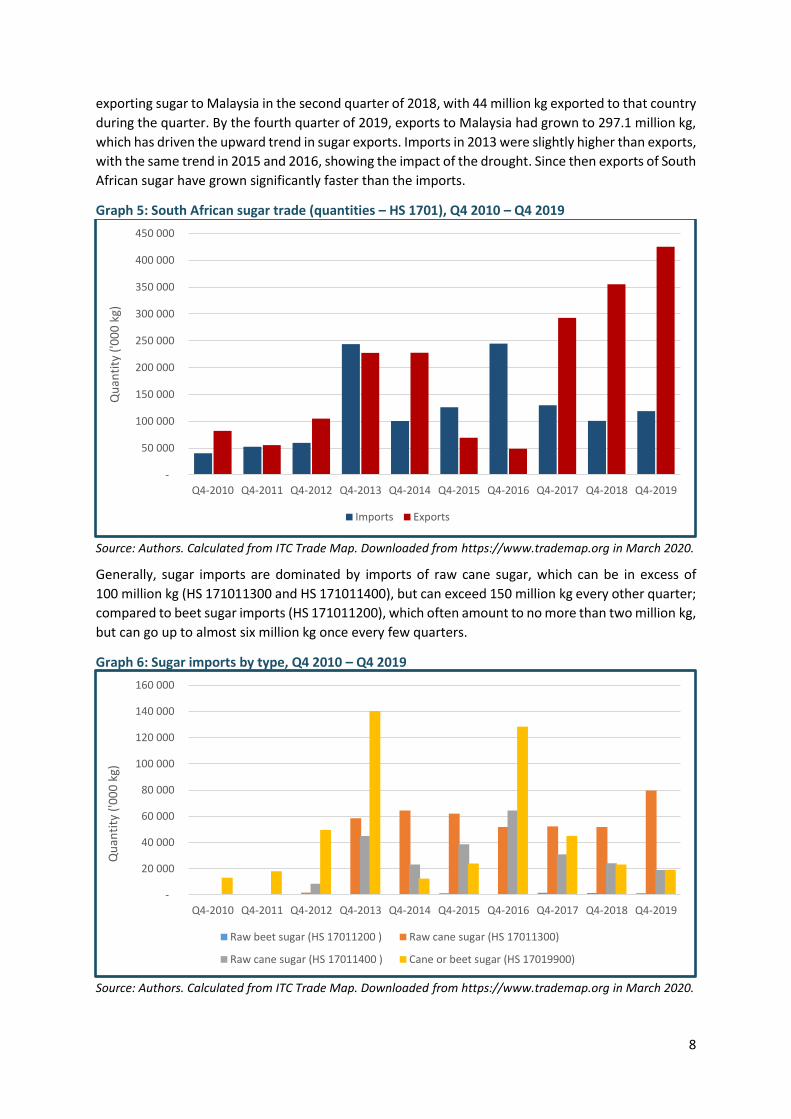
exporting sugar to Malaysia in the second quarter of 2018, with 44 million kg exported to that country
during the quarter. By the fourth quarter of 2019, exports to Malaysia had grown to 297.1 million kg,
which has driven the upward trend in sugar exports. Imports in 2013 were slightly higher than exports,
with the same trend in 2015 and 2016, showing the impact of the drought. Since then exports of South
African sugar have grown significantly faster than the imports.
Graph 5: South African sugar trade (quantities – HS 1701), Q4 2010 – Q4 2019
Source: Authors. Calculated from ITC Trade Map. Downloaded from https://www.trademap.org in March 2020.
Generally, sugar imports are dominated by imports of raw cane sugar, which can be in excess of
100 million kg (HS 171011300 and HS 171011400), but can exceed 150 million kg every other quarter;
compared to beet sugar imports (HS 171011200), which often amount to no more than two million kg,
but can go up to almost six million kg once every few quarters.
Graph 6: Sugar imports by type, Q4 2010 – Q4 2019
Source: Authors. Calculated from ITC Trade Map. Downloaded from https://www.trademap.org in March 2020.
-
50 000
100 000
150 000
200 000
250 000
300 000
350 000
400 000
450 000
Q4-2010 Q4-2011 Q4-2012 Q4-2013 Q4-2014 Q4-2015 Q4-2016 Q4-2017 Q4-2018 Q4-2019
Qu
anti
ty (
'00
0 k
g)
Imports Exports
-
20 000
40 000
60 000
80 000
100 000
120 000
140 000
160 000
Q4-2010 Q4-2011 Q4-2012 Q4-2013 Q4-2014 Q4-2015 Q4-2016 Q4-2017 Q4-2018 Q4-2019
Qu
anti
ty (
'00
0 k
g)
Raw beet sugar (HS 17011200 ) Raw cane sugar (HS 17011300)
Raw cane sugar (HS 17011400 ) Cane or beet sugar (HS 17019900)
9
Eswatini dominates all sugar imports into South Africa, in some cases accounting for 99% of sugar
imports. As a member of the Southern African Customs Union (SACU), Eswatini enjoys duty free entry
into South Africa.10 Generally, imports from Eswatini tend to fluctuate. The surge occurred in
November, when monthly imports rose from 26.4 million kg in the previous month to 32.4 million kg.
In December imports declined to 20.5 million, a level not seen since October 2018 when 19 million kg
was imported.
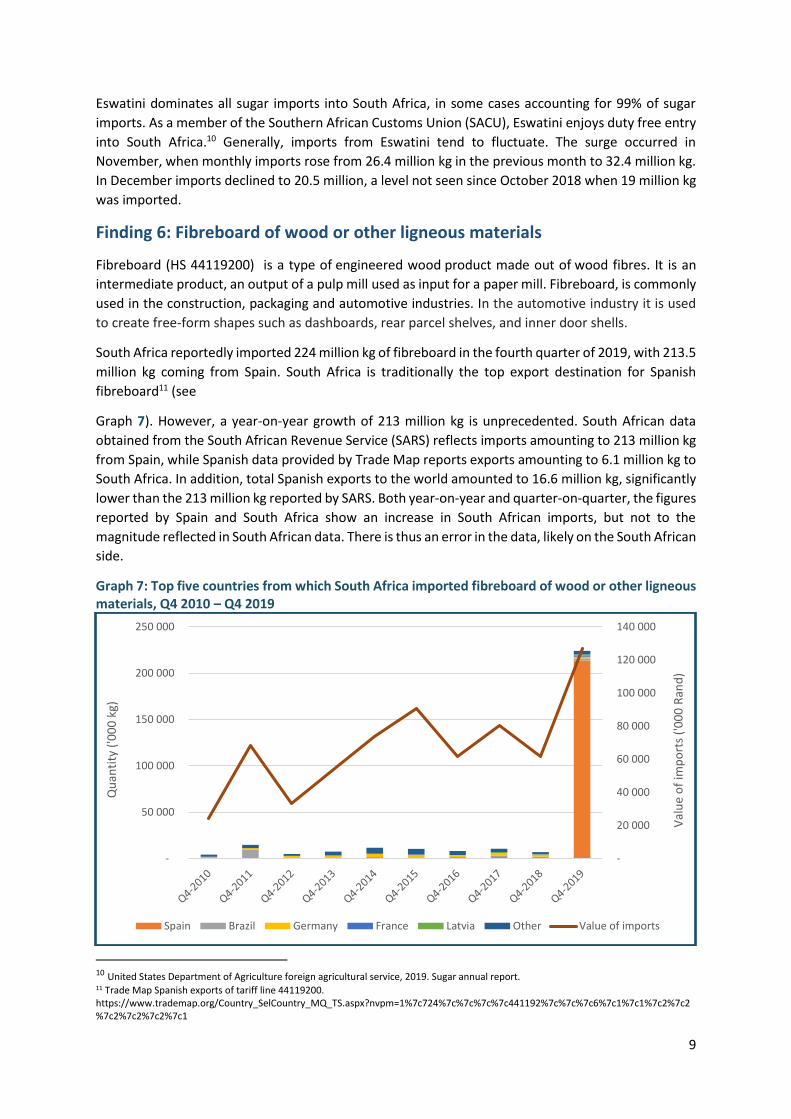
Finding 6: Fibreboard of wood or other ligneous materials
Fibreboard (HS 44119200) is a type of engineered wood product made out of wood fibres. It is an
intermediate product, an output of a pulp mill used as input for a paper mill. Fibreboard, is commonly
used in the construction, packaging and automotive industries. In the automotive industry it is used
to create free-form shapes such as dashboards, rear parcel shelves, and inner door shells.
South Africa reportedly imported 224 million kg of fibreboard in the fourth quarter of 2019, with 213.5
million kg coming from Spain. South Africa is traditionally the top export destination for Spanish
fibreboard11 (see
Graph 7). However, a year-on-year growth of 213 million kg is unprecedented. South African data
obtained from the South African Revenue Service (SARS) reflects imports amounting to 213 million kg
from Spain, while Spanish data provided by Trade Map reports exports amounting to 6.1 million kg to
South Africa. In addition, total Spanish exports to the world amounted to 16.6 million kg, significantly
lower than the 213 million kg reported by SARS. Both year-on-year and quarter-on-quarter, the figures
reported by Spain and South Africa show an increase in South African imports, but not to the
magnitude reflected in South African data. There is thus an error in the data, likely on the South African
side.
Graph 7: Top five countries from which South Africa imported fibreboard of wood or other ligneous materials, Q4 2010 – Q4 2019
10 United States Department of Agriculture foreign agricultural service, 2019. Sugar annual report. 11 Trade Map Spanish exports of tariff line 44119200. https://www.trademap.org/Country_SelCountry_MQ_TS.aspx?nvpm=1%7c724%7c%7c%7c%7c441192%7c%7c%7c6%7c1%7c1%7c2%7c2%7c2%7c2%7c2%7c1
-
20 000
40 000
60 000
80 000
100 000
120 000
140 000
-
50 000
100 000
150 000
200 000
250 000
Val
ue
of
imp
ort
s ('
00
0 R
and
)
Qu
anti
ty (
'00
0 k
g)
Spain Brazil Germany France Latvia Other Value of imports

10
Source: Authors. Calculated from ITC Trade Map. Downloaded from https://www.trademap.org in March 2020.
Nevertheless, the increase in South African imports of fibreboard coincided with the restructuring of
the Mondi Group, which is a significant importer of the product, and the Competition Tribunal
mandate that the company to invest R8 billion into its South African enterprise over the next five
years. The increase in fibreboard, like the increase in plywood imports, could therefore likely be
because of the company’s expansion in production capacity.
Last, as Graph 7 shows, the growth in import quantities was accompanied by growth in the value of
imports, with the value of imports from Spain growing by more than 8 000%. The reason for the
discrepancy in the import quantities reported by SARS and Spain cannot, however, be explained at
present, and therefore this item will be monitored in the coming quarters.
Finding 7: Manganese dioxide cells and batteries (HS 85061090 and
HS 85061010)
Manganese dioxide cells and batteries (HS 85061010) are single-use non-rechargeable batteries. From
the literature, these are actually lithium ion manganese oxide batteries and cells that use manganese
dioxide as the cathode material. Given the stated height of 7mm or less, this is most likely the kind of
cells and batteries used in household and personal devices such as digital cameras, torchlights and
toys. Imports of this item surged to 65.21 million units in the fourth quarter of 2019 (see Graph 8),
driven by a surge from China in December 2019, which exported 64.8 million units during that month.
Total quarterly imports of the product have never reached two million units, suggesting a possible
data error. While there is an increase in the value of all manganese dioxide cells and batteries imports
for the fourth quarter, the unit price for the December imports amounts to R0.02, significantly lower
than the R13.91 average unit price of the balance of imports from China.
Graph 8: Imports of manganese dioxide cells and batteries (excluding spent): Other (HS 85061010)
Source: Authors. Calculated from ITC Trade Map. Downloaded from https://www.trademap.org in March 2020. Note: data for 2011, 2010 and 2016 is too low, hence it is not visible on the graph.
The view that this might be a data error is enforced by other factors. First, the one listed importer of
this product reported that it had not significantly increased imports during the first quarter. Second,
imports of manganese dioxide cells and batteries (HS 85061090) also surged during the fourth quarter
of 2019 (see Graph 9). The surge was driven by an exponential growth in imports from China, which
-
500
1 000
1 500
2 000
2 500
3 000
3 500
4 000
-
10 000
20 000
30 000
40 000
50 000
60 000
70 000
Val
ue
of
imp
ort
s ('
00
0 R
and
)
Qu
anti
ty (
'00
0 u
nit
s)
World Value of imports

11
amounted to 35.4 million units, from 5.5 million units in the fourth quarter of 2018. Unlike with
HS 85061010, the growth in imports of HS 85061090 was not accompanied by a corresponding
increase in the value of the Chinese imports, but rather shows a decline. The trend for both items will
be monitored to ascertain if these are data errors or legitimate imports.
Graph 9: Top five countries from which South Africa imported manganese dioxide cells and batteries (excluding spent): Other (HS 85061090)
Source: Authors. Calculated from ITC Trade Map. Downloaded from https://www.trademap.org in March 2020.
Finding 8: Refractory bricks block tiles and similar refractory ceramic constructional goods
Refractory bricks, blocks, tiles and similar refractory ceramic constructional goods (HS 69022000) are
made to withstand high temperatures as they are used as lining for furnaces, fireboxes and
fireplaces.12 This group of products is the 1 613th most traded product, with the top exporters being
China, Germany, India and Italy.13 The extent of local production is not clear, but exports amounted
to 57 528 kg in the fourth quarter of 2019, or R1.5 million.
Imports for the fourth quarter of 2019 surged to 41.2 million kg, driven by a surge in imports from
India amounting to 37.9 million kg (see Graph 10). The reason for the surge is unclear. Based on further
analysis, this does not appear to be a reclassification or misclassification of the data from different
HS codes. Data for India for the fourth quarter of 2019 is not available for comparison. However, one
notable change is that in the second quarter of 2019, the last quarter for which there is available data
for India, a change in the unit of measurement was used for this product, from tons to kilograms (albeit
only on Trade Map). The result is that, for the second quarter of 2019, there is a discrepancy in the
quantities reported by SARS, compared to quantities reported for India by Trade Map. Additional
comparisons cannot be made as data for India does not go beyond the second quarter of 2019. The
trend will be monitored in the coming quarters.
12 https://mmpgroup.co.in/refractory-bricks-tiles-blocks/ 13 https://oec.world/en/profile/hs07/690220/
-
5 000
10 000
15 000
20 000
25 000
30 000
35 000
40 000
-
5 000
10 000
15 000
20 000
25 000
30 000
35 000
40 000
45 000
50 000
Imp
ort
val
ue
('0
00
Ran
d)
Qu
anti
ty (
'00
0 u
nit
s)
China Singapore BelgiumUnited States of America Germany OtherValue of imports

12
Graph 10: Top five countries from which South Africa imported refractory bricks block tiles and similar refractory ceramic constructional goods, Q4 2010 – Q4 2019
Source: Authors. Calculated from ITC Trade Map. Downloaded from https://www.trademap.org in February
2020.
Finding 9: Data errors and other issues
Table 3 provides a list of possible data errors for the fourth quarter of 2019.
Table 3: Data errors and other issues
HS Code Product Description Description of error
84212900 Machinery and apparatus for filtering or purifying liquids
Error in reporting quantity from Japan for December. The data shows a more than 954 million units increase in quantities imported from Japan, while the value of the imports declined compared to the fourth quarter of 2018. Based on the data, the unit price for Japan for this product would be R0,004.
71051000 Dust and powder of diamonds, including synthetic diamonds
Error in reporting quantity from Ireland for October. Imports show a 951% year-on-year quantity increase, while the value of the imports over the same period declined by 61%. Data for Ireland was not available for comparison.
84831000 Transmission shafts, including cam shafts and crank shafts, and cranks
Error in reporting quantity from Germany for October. As with the two other errors, the surge in quantity coincides with a decline in the value of the imports. In this case, while there is an almost 100 000% increase in the quantity from Germany, there is a 10% decline in the value of the imports, resulting in a unit price decline from R320 in the fourth quarter of 2018 to R0.30 in the fourth quarter of 2019.
-
20 000
40 000
60 000
80 000
100 000
120 000
140 000
-
5 000
10 000
15 000
20 000
25 000
30 000
35 000
40 000
45 000
Q4-2010Q4-2011Q4-2012Q4-2013Q4-2014Q4-2015Q4-2016Q4-2017Q4-2018Q4-2019
Imp
ort
val
ue
('0
00
Ran
d)
Qu
anti
ty (
'00
0 k
g)
India China Germany Netherlands Spain Other Import value

13
Section 2: review of import surges for 2019
A review of changes in imports year-on-year shows that crude oil, automotive components for motor
cars and diesel were consistently the top import commodities by Rand value for 2019. The list was
dominated by similar categories throughout the year, including but not limited to petroleum and other
liquid fuels, ICT equipment, automotive (including automotive components), medical equipment,
aircraft and aircraft components, as well as production metals, and food and beverage products.
In addition, maize, a staple food in South Africa, and for which there is local production, saw surges in
quantity and price throughout 2019. This is a result of the drought that began in 2015. Due to the
drought, local production of maize has been limited, with both hectares planted and total yield
remaining low even after the recovery. Unlike with maize, items such as wind-powered generating
sets, fuel elements, and machinery for making pulp of fibrous cellulosic material repeatedly appeared
in the top 100 imports by Rand value list, but did not show surges in quantity. These items appear to
be linked to specific and once-off projects. For instance, the increase in imports of wind-powered
generating power sets amounted to R4.5 billion in 2019, up from R947 million in 2018. Imports of this
product appear to be driven by the ongoing construction of three wind farms: the Nxuba wind farm
and the Oyster Bay wind farm in the Eastern Cape and the Garob wind farm in the Northern Cape.
Imports of machinery for making pulp of fibrous cellulosic material amounted to R1.4 billion in 2019,
up from R5.9 million in 2018.
Last, were notable increases in imports of ICT equipment. The rise in imports of portable computers
stood out within this category. Portable computers are used across a wide range of industries. While
the reasons for the surge are not immediately clear, notable developments in the industry might be
contributing factors. These developments include Amazons Africa expansion, which, following the
establishment of new offices in Cape Town, is preparing to launch a special Amazon Web Services
(AWS) Africa region based in Cape Town. Other notable projects include the Nihilent Use Experience
Lab, as well as the R10 million Cisco Edge Incubation Hub and the Tigers South Africa e-commerce
centre. The Nihilent Lab uses technology to compile consumer data to identify cognitive and emotional
triggers in assessing consumer experience. Government is also a procurer of portable computers and
several tenders were fulfilled in 2019 in relation to these products.
Imports of several other products surged during 2019. These include maize, which, besides showing a
significant increase in Rand value of imports, also saw quantity surges. Other products include wine,
hydrocarbons in gaseous state, non-agglomerated iron ore and concentrates, as well as smart cards.
Argentina and Spain were the main sources of imported wine. The surge appeared to have been driven
by low local production as a result of the drought. The cause of the surge in imports of hydrocarbons
has never been clear, but in the fourth quarter of 2019, quantities declined. The surge in imports of
non-agglomerated iron ores and concentrates was driven by imports from Australia and Chile, which
took advantage of Vale’s misfortune in Brazil, which had to briefly close operations as a result of a
dam collapse. At the same time, iron ore production declined in South Africa. As iron ore prices rose
during Vale’s closure, Chile increased its exports, at a relatively low price. Imports normalised in the
fourth quarter of 2019, returning to the usual quantity of below one million kg.
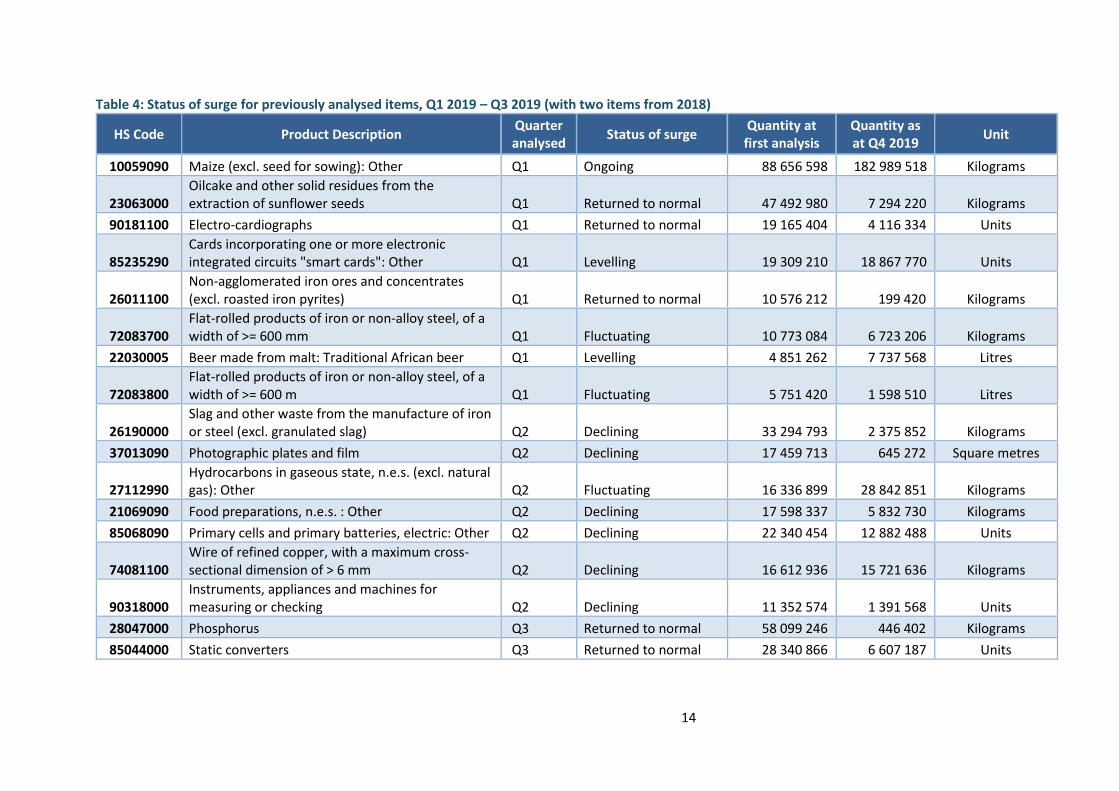
Table 4 shows the status of surges analysed between the first and third quarters of 2019. Most of the
items show declining quantities as at the fourth quarter of 2019, while others are levelling out at new
higher quantities, including malt beer and smart cards, while maize shows consistently high imports.
The table includes two items that began surging in 2018, portland cement and cement clinkers. Given
the entry of a new cement and concrete plant into the local market, the trend for these two items will
be monitored.
14
Table 4: Status of surge for previously analysed items, Q1 2019 – Q3 2019 (with two items from 2018)
HS Code Product Description Quarter analysed
Status of surge Quantity at first analysis
Quantity as at Q4 2019
Unit
10059090 Maize (excl. seed for sowing): Other Q1 Ongoing 88 656 598 182 989 518 Kilograms
23063000 Oilcake and other solid residues from the extraction of sunflower seeds Q1 Returned to normal 47 492 980 7 294 220 Kilograms
90181100 Electro-cardiographs Q1 Returned to normal 19 165 404 4 116 334 Units
85235290 Cards incorporating one or more electronic integrated circuits "smart cards": Other Q1 Levelling 19 309 210 18 867 770 Units
26011100 Non-agglomerated iron ores and concentrates (excl. roasted iron pyrites) Q1 Returned to normal 10 576 212 199 420 Kilograms
72083700 Flat-rolled products of iron or non-alloy steel, of a width of >= 600 mm Q1 Fluctuating 10 773 084 6 723 206 Kilograms
22030005 Beer made from malt: Traditional African beer Q1 Levelling 4 851 262 7 737 568 Litres
72083800 Flat-rolled products of iron or non-alloy steel, of a width of >= 600 m Q1 Fluctuating 5 751 420 1 598 510 Litres
26190000 Slag and other waste from the manufacture of iron or steel (excl. granulated slag) Q2 Declining 33 294 793 2 375 852 Kilograms
37013090 Photographic plates and film Q2 Declining 17 459 713 645 272 Square metres
27112990 Hydrocarbons in gaseous state, n.e.s. (excl. natural gas): Other Q2 Fluctuating 16 336 899 28 842 851 Kilograms
21069090 Food preparations, n.e.s. : Other Q2 Declining 17 598 337 5 832 730 Kilograms
85068090 Primary cells and primary batteries, electric: Other Q2 Declining 22 340 454 12 882 488 Units
74081100 Wire of refined copper, with a maximum cross-sectional dimension of > 6 mm Q2 Declining 16 612 936 15 721 636 Kilograms
90318000 Instruments, appliances and machines for measuring or checking Q2 Declining 11 352 574 1 391 568 Units
28047000 Phosphorus Q3 Returned to normal 58 099 246 446 402 Kilograms
85044000 Static converters Q3 Returned to normal 28 340 866 6 607 187 Units

15
HS Code Product Description Quarter analysed
Status of surge Quantity at first analysis
Quantity as at Q4 2019
Unit
64061015 Uppers and parts thereof: Protective metal toe caps Q3 Returned to normal 19 121 602 113 224 Kilograms
39072090 Polyethers, in primary forms: Other Q3 Returned to normal 26 925 874 10 585 155 Kilograms
96039090 Brooms and brushes, n.e.s. : Other Q3 Returned to normal 22 764 487 6 173 681 Units
70051090 Float glass and surface ground or polished glass (excl. wired glass): Other Q3 Declining 17 375 096 3 451 205 Square metres
72083700 Flat-rolled products of iron or non-alloy steel, of a width of >= 600 mm Q3 Declining 10 180 414 6 723 206 Kilograms
82122000 Safety razor blades of base metal, incl. razor blade blanks in strips Q3 Ongoing 7 067 552 8 082 483 Units
25232900 Portland cement Q1 (2018) Ongoing 187 691 290 295 985 980 Kilograms
25231000 Cement clinkers Q3 (2018) Fluctuating 51 607 995 51 585 423 Kilograms
16
Data annexures
Annexure 1: Top 100 import products by Rand value, Q4 2019
Rank HS Code Product Description Import value, Rand billion
Change in rank, Q4 2018-Q4 2019
Designation status
1 27090000 Crude oil 40.27 No change Not designated
2 98010030 Automotive components: For motor cars 10.09 No change Not designated
3 27101230 Diesel 9.31 No change Not designated
4 49070010 Postage stamps, revenue stamps and banknotes 6.48 2 Not designated
5 98010040 Original equipment components: For goods vehicles 5.83 -1 Not designated
6 85171210 Cellphones 4.76 -1 Not designated
7 87032290 Cars and related vehicles: Cylinder capacity 1 000 cm3 to 1 500 cm3 4.34 No change Not designated
8 87032390 Cars and related vehicles: Cylinder capacity 1 500 cm3 to 3 000 cm3 3.37 No change Not designated
9 85176290 Routers and set-top boxes: Other 2.78 No change Not designated
10 87032190 Cars and related vehicles: Cylinder capacity not exceeding 1 000 cm3 2.49 10 Not designated
11 98010045 Original equipment components: For goods vehicles 2.38 4 Not designated
12 27101202 Light oils and preparations: Petrol 2.37 4 Not designated
13 88024000 Aeroplanes and other powered aircraft: Weight > 15.000 kg 2.27 8 Not designated
14 84715000 Processing units for automatic data-processing machines 2.22 5 Not designated
15 10063000 Semi-milled or wholly milled rice, whether or not polished or glazed 2.02 -1 Not designated
16 33021000 Alcoholic and other solutions used in the food and drink industries 1.92 -3 Not designated
17 71023100 Non-industrial diamonds unworked or simply sawn, cleaved or bruted 1.84 No change Not designated
18 28182000 Aluminium oxide 1.63 -7 Not designated
19 87033290 Cars and related vehicles: Cylinder capacity 1 000 cm3 to 2 500 cm3 1.47 -7 Not designated
20 71081300 Gold, in semi-manufactured forms, for non-monetary purposes 1.44 13 Not designated
21 90189000 Cars and related vehicles: cylinder capacity exceeding 2 500 cm3 1.43 6 Not designated
22 84314990 Parts of machinery of heading 8426, 8429 and 8430, n.e.s: Other 1.42 No change Not designated
23 84439900 Parts and accessories of printers, copying machines and facsimile machines, n.e.s.
1.36 No change Not designated
17
Rank HS Code Product Description Import value, Rand billion
Change in rank, Q4 2018-Q4 2019
Designation status
24 85177090 Parts for telephones, routers and other telecoms devices 1.31 No change Not designated
25 27111100 Natural gas, liquefied 1.18 3 Not designated
26 88033000 Parts of aeroplanes or helicopters, n.e.s. (excluding those for gliders) 1.13 11 Not designated
27 27160000 Electrical energy 1.11 17 Not designated
28 85023100 Generating sets, wind-powered 1.11 4583 Not designated
29 22030090 Beer made from malt: Other 1.06 23 Not designated
30 85044000 Static converters 1.03 9 Not designated
31 87032490 Cars and related vehicles: Cylinder capacity exceeding 3 000 cm3 1.03 No change Not designated
32 38220000 Diagnostic or laboratory reagents (pharmaceutical chemicals) 1.02 9 Not designated
33 87082900 Parts and accessories of bodies for tractors and buses 1.02 -3 Not designated
34 98010015 Automotive components: For tractors and buses 1.01 No change Not designated
35 74081100 Wire of refined copper, maximum cross-sectional dimension of > 6 mm 1.01 1 Not designated
36 31021000 Urea, whether or not in aqueous solution 0.99 -4 Not designated
37 64029900 Footwear with outer soles and uppers of rubber or plastics 0.93 1 100% Designated
38 87041090 Dumpers for off-highway use : Other 0.91 -12 Not designated
39 87089990 Parts and accessories for tractors and buses 0.89 7 Not designated
40 87033390 Cars and related vehicles: cylinder capacity exceeding 2 500 cm3 0.87 -15 Not designated
41 69091900 Ceramic wares for chemical or other technical uses 0.78 8 Not designated
42 98010025 Original equipment components: For buses and taxis 0.78 1 Not designated
43 17011300 Raw cane sugar 0.76 26 Not designated
44 84433100 Printers and fax machines 0.75 4 Not designated
45 64041990 Footwear with outer soles of rubber or plastics and uppers of textile materials
0.73 -5 100% Designated
46 27011900 Coal (excl. anthracite and bituminous coal) 0.70 -4 Not designated
47 31042000 Potassium chloride for use as fertiliser 0.69 44 Not designated
48 84295200 Self-propelled bulldozers, etc.: With 360 degree revolving superstructure 0.65 -13 Not designated
49 61091000 T-shirts, singlets and other vests of cotton, knitted or crocheted 0.63 10 100% Designated

18
Rank HS Code Product Description Import value, Rand billion
Change in rank, Q4 2018-Q4 2019
Designation status
50 22083010 Whiskies: In containers holding 2li or less 0.62 4 Not designated
51 39269090 Articles of plastics and articles of other materials of heading 3901 to 3914, n.e.s: Other
0.59 9 Not designated
52 84733000 Parts and accessories of automatic data-processing machines 0.59 -1 Not designated
53 33049990 Beauty or make-up preparations and preparations for the care of the skin: Other
0.58 8 Not designated
54 30022000 Vaccines for human medicine 0.58 26 Not designated
55 84717000 Storage units for automatic data-processing machines 0.57 -2 Not designated
56 95030090 Tricycles, scooters, pedal cars and similar wheeled toys: Other 0.56 2 Not designated
57 94019090 Parts of seats, n.e.s: Other 0.54 7 85% - 100% designated
58 27011200 Bituminous coal, whether or not pulverised, non-agglomerated 0.54 -11 Not designated
59 87042181 Cars and related vehicles: Double-cab trucks 0.53 -9 Not designated
60 21069090 Food preparations, n.e.s: Other 0.53 12 Not designated
61 84798990 Machines and mechanical appliances, n.e.s: Other 0.51 -5 Not designated
62 23040000 Oilcake and other solid residues from the extraction of soya-bean oil 0.51 12 Not designated
63 31054000 Ammonium dihydrogenorthophosphate 0.51 No change Not designated
64 74031100 Refined copper 0.50 105 Not designated
65 84291100 Self-propelled bulldozers and angle dozers 0.49 69 Not designated
66 38112100 Additives for oil lubricants containing petroleum oil or bituminous mineral oil
0.48 2 Not designated
67 27101290 Light oils and preparations (excluding containing biodiesel): Other 0.48 104 Not designated
68 27101207 Light oils and preparations: Other 0.46 10 Not designated
69 48115990 Paper and paperboard (excluding bleached and weighing > 150 g/m², and adhesives): Other
0.45 15 Not designated
70 84749000 Parts of machinery for working mineral substances of heading 8474, 0.45 12 Not designated
71 10059090 Maize (excluding seed for sowing): Other 0.45 4444 Not designated
72 84834000 Gears and gearing for machinery 0.44 15 Not designated

19
Rank HS Code Product Description Import value, Rand billion
Change in rank, Q4 2018-Q4 2019
Designation status
73 85258090 Television cameras, digital cameras and video camera recorders: Other 0.44 23 Not designated
74 85437000 Electrical machines and apparatus, having individual functions 0.44 2 Not designated
75 49019900 Printed books, brochures and similar printed matter 0.44 8 Not designated
76 62034210 Trousers, bib and brace overalls, breeches and shorts, of cotton: Other 0.43 -10 100% designated
77 64039990 Footwear with outer soles: Other 0.43 20 100% designated
78 84271000 Self-propelled trucks fitted with lifting or handling equipment, powered by an electric motor
0.43 -8 Not designated
79 84099990 Parts suitable for use solely or principally with diesel or semi-diesel engine, n.e.s: Other
0.42 6 Not designated
80 85299075 Parts for use with transmission and reception apparatus for radio or television, television cameras
0.42 9 30% - 60%, 20% - 100% designated for components
81 85443000 Ignition wiring sets and other wiring sets for vehicles, aircraft or ships 0.41 -14 90% designated
82 84224000 Packing or wrapping machinery, including heat-shrink wrapping machinery
0.41 93 Not designated
83 84295190 Self-propelled front-end shovel loaders: Other 0.40 179 Not designated
84 85371090 Boards, cabinets and similar apparatus for electric control for a voltage <= 1.000 V: Other
0.40 20 Not designated
85 29173600 Terephthalic acid and its salts 0.40 -40 Not designated
86 73269090 Articles of iron or steel, n.e.s: Other 0.40 -5 100% designated
87 84089090 Compression-ignition internal combustion piston engine “diesel or semi-diesel engine”: Other
0.40 12 Not designated
88 90318000 Instruments, appliances and machines for measuring or checking (excluding optical)
0.40 40 Not designated
89 87042183 Motor vehicles for the transport of goods 0.37 -27 Not designated
90 87083090 Brakes and servo-brakes and their parts: Other 0.37 10 Not designated
91 33029090 Mixtures of odoriferous substances and mixtures, incl. alcoholic solutions: Other
0.37 28 Not designated
20
Rank HS Code Product Description Import value, Rand billion
Change in rank, Q4 2018-Q4 2019
Designation status
92 84391000 Machinery for making pulp of fibrous cellulosic material 0.37 3349 Not designated
93 84304100 Self-propelled boring or sinking machinery for boring earth or extracting minerals or ores
0.37 70 Not designated
94 90183900 Needles, catheters, cannulae and the like, used in medical, surgical, dental or veterinary sciences
0.36 8 Not designated
95 84314300 Parts for boring or sinking machinery 0.36 -22 Not designated
96 84139100 Parts of pumps for liquids, n.e.s. 0.36 15 Not designated
97 20097900 Apple juice 0.35 67 Not designated
98 85235210 Cards incorporating one or more electronic integrated circuits "smart cards" : Digital
0.35 -5 Not designated
99 64041190 Sports footwear: Other 0.35 77 100% designated
100 84148000 Air pumps, air or other gas compressors and ventilating or recycling hoods incorporating a fan, whether or not fitted with filters, having a maximum horizontal side > 120 cm
0.34 15 Not designated
21
Annexure 2: Surges in import products, by quantity, Q4 2019
HS Code Product Description Explanation Real Growth, Quantity
Unit Percent Growth
Designation Status
01069000 Live animals Not significant – surge within usual variance
5 980 850 683 Units 24 514% Not designated
27090000 Crude oil Not significant – import commodity 807 020 586 Kilograms 16% Not designated
27101230 Diesel Not significant – import commodity 1 440 634 Litres 0% Not designated
84212900 Machinery and apparatus for filtering or purifying liquids
Data error – error in reporting quantity from Japan
954 321 717 Units 119 312% Not designated
27111100 Natural gas, liquefied Not significant – import commodity 756 822 126 Kilograms 97 807% Not designated
28182000 Aluminium oxide (excluding artificial corundum)
Decline in imports - 22 813 330 Kilograms -6% Not designated
27011200 Bituminous coal, whether or not pulverised, non-agglomerated
Decline in imports - 1 359 108 Kilograms 0% Not designated
27011900 Coal Not significant – import commodity 23 202 458 Kilograms 8% Not designated
27101202 Light oils and preparations: Petrol Not significant – import commodity 27 698 398 Litres 10% Not designated
10063000 Semi-milled or wholly milled rice, whether or not polished or glazed
Decline in imports - 66 265 271 Kilograms -18% Not designated
25232900 Portland cement Not significant – surge within usual variance
102 806 755 Kilograms 53% Not designated
31021000 Urea, whether or not in aqueous solution Not significant – surge within usual variance
35 857 148 Kilograms 16% Not designated
44119200 Fibreboard of wood or other ligneous materials
Selected for analysis 217 179 248 Kilograms 3177% Not designated
10059090 Maize (excluding seed for sowing): Other Ongoing monitoring 182 851 647 Kilograms 132 625% Not designated
31042000 Potassium chloride for use as fertiliser Not significant 88 470 982 Kilograms 98% Not designated
44123900 Plywood of sheets of wood <= 6 mm thick, with both outer plies of coniferous wood
Selected for analysis 131 116 635 Cubic metres 133 378% Not designated
28151200 Sodium hydroxide in aqueous solution Not significant 21 943 241 Kilograms 22% Not designated

22
HS Code Product Description Explanation Real Growth, Quantity
Unit Percent Growth
Designation Status
23040000 Oilcake and other solid residues from the extraction of soya-bean oil
Not significant – surge within usual variance
12 126 740 Kilograms 12% Not designated
31054000 Ammonium dihydrogenorthophosphate Not significant 18 902 188 Kilograms 22% Not designated
71051000 Dust and powder of diamonds, including synthetic diamonds
Data error – error in reporting quantity from Ireland
85 590 792 Carats 501% Not designated
25030000 Sulphur of all kinds (excluding sublimed sulphur, precipitated sulphur and colloidal sulphur)
Decline in imports -120 785 486 Kilograms -56% Not designated
28362000 Disodium carbonate Decline in imports - 6 793 306 Kilograms -7% Not designated
84831000 Transmission shafts, including cam shafts and crank shafts, and cranks
Data error – error in reporting quantity from Germany
82 181 323 Units 15310% Not designated
17011300 Raw cane sugar Selected for analysis 27 881 044 Kilograms 54% Not designated
22030090 Beer made from malt: Other Not significant 24 443 180 Litres 49% Not designated
27131200 Petroleum coke, calcined Not significant 14 407 587 Kilograms 24% Not designated
31026000 Double salts and mixtures of calcium nitrate and ammonium nitrate
Selected for analysis 57 094 461 Kilograms 468% Not designated
25201000 Gypsum; anhydrite Not significant – surge within usual variance
24 688 877 Kilograms 56% Not designated
85235210 Cards incorporating one or more electronic integrated circuits “smart cards”: Digital
Decline in imports - 1 227 034 Units -2% Not designated
85061010 Manganese dioxide cells and batteries (excluding spent): Other
Selected for analysis 64 927 327 Units 22588% Not designated
44079100 Oak “Quercus spp.”, sawn or chipped lengthwise
Decline in imports - 35 004 371 Cubic metres -35% Not designated
27101207 Light oils and preparations: Other Not significant 6 255 722 Litres 11% Not designated
28365000 Calcium carbonate Not significant 2 700 590 Kilograms 5% Not designated
27101290 Light oils and preparations (excluding containing biodiesel): Other
Not significant – surge within usual variance
29 695 926 Litres 123% Not designated

23
HS Code Product Description Explanation Real Growth, Quantity
Unit Percent Growth
Designation Status
28331100 Disodium sulphate Selected for analysis 36 650 137 Kilograms 218% Not designated
31022100 Ammonium sulphate Not significant 7 592 579 Kilograms 17% Not designated
98010030 Automotive components: For motor cars Decline in imports - 13 063 133 Kilograms -20% Not designated
25231000 Cement clinkers Not significant 16 221 881 Kilograms 46% Not designated
26011200 Agglomerated iron ores and concentrates (excl. roasted iron pyrites)
Decline in imports - 76 973 831 Kilograms -60% Not designated
85061090 Manganese dioxide cells and batteries (excluding spent): Other
Selected for analysis 33 568 609 Units 324% Not designated
08039010 Fresh or dried bananas (excluding plantains): Fresh
Not significant 3 398 681 Kilograms 9% Not designated
02071210 Frozen fowls: Mechanically deboned meat
Decline in imports - 315 313 Kilograms -1% Not designated
69022000 Refractory bricks, blocks, tiles and similar refractory ceramic constructional goods
Selected for analysis 35 232 466 Kilograms 586% Not designated
98010040 Original equipment components: For goods vehicles
Decline in imports - 10 603 977 Kilograms -21% Not designated
90183140 Syringes, with or without needles: Disposable hypodermic syringes of plastics
Decline in imports - 6 958 063 Units -15% Not designated
29173600 Terephthalic acid and its salts Decline in imports - 18 594 658 Kilograms -32% Not designated
85423900 Electronic integrated circuits (excl. such as processors, controllers, memories and amplifiers)
Not significant 12 574 298 Units 50% Not designated
90189000 Medical instruments and appliances, n.e.s.
Not significant 7 010 073 Units 23% Not designated
17031000 Cane molasses resulting from the extraction or refining of sugar
Not significant – within usual variance
1 377 461 Kilograms 4% Not designated
27040000 Coke and semi-coke of coal Decline in imports - 196 203 159 Kilograms -85% Not designated