report on vulnerabilities in the eu commercial real estate ... · vulnerabilities in the collateral...
TRANSCRIPT

Report on vulnerabilities in the EU commercial real estate sector November 2018

Report on vulnerabilities in the EU commercial real estate sector / November 2018 Contents 1
Executive summary 3
Introduction 8
1 The importance of CRE markets for financial stability and the real economy 10
1.1 Market structure, size and cross-border activities 10
1.2 Transmission channels from CRE markets to financial stability and the real economy 17
1.3 The role of foreign investment in financial stability 19
2 Risk analysis framework 21
2.1 Analysing vulnerabilities in CRE: four “stretches’’ 21
2.2 Sources of information: scoreboard and survey 22
2.2.1 Scoreboard 22
2.2.2 Survey 24
2.3 Data gaps and limitations of the analysis 28
3 Risk analysis 31
3.1 CRE price trends (collateral stretch) 31
3.2 CRE sector activity (income and activity stretch) 37
3.3 Bank and non-bank financing of CRE (financing stretch) 42
3.4 The exposure of the financial system to CRE (potential for spillovers stretch) 51
3.5 Summary of the identified vulnerabilities 55
4 Policy analysis 59
4.1 Available macroprudential policy measures for addressing financial stability risks related to CRE and their limitations 59
4.2 Implemented macroprudential policy measures related to CRE 65
4.3 The appropriateness of macroprudential measures related to CRE 68
4.4 Summary of the policy analysis 77
Conclusion 79
References 81
Contents

Report on vulnerabilities in the EU commercial real estate sector / November 2018 Contents 2
Annex 84
A.1 Indicators in the scoreboard 84
A.2 Summary of the scoreboard and survey results at the country level 91
A.2.1 Austria 91
A.2.2 Belgium 93
A.2.3 Bulgaria 95
A.2.4 Croatia 97
A.2.5 Cyprus 99
A.2.6 Czech Republic 101
A.2.7 Denmark 103
A.2.8 Estonia 105
A.2.9 Finland 107
A.2.10 France 109
A.2.11 Germany 111
A.2.12 Greece 113
A.2.13 Hungary 115
A.2.14 Ireland 117
A.2.15 Italy 119
A.2.16 Latvia 121
A.2.17 Lithuania 123
A.2.18 Luxembourg 125
A.2.19 Malta 127
A.2.20 The Netherlands 129
A.2.21 Norway 131
A.2.22 Poland 133
A.2.23 Portugal 135
A.2.24 Romania 137
A.2.25 Slovakia 139
A.2.26 Slovenia 141
A.2.27 Spain 143
A.2.28 Sweden 145
A.2.29 United Kingdom 147
Abbreviations 149
Imprint and acknowledgements 150

Report on vulnerabilities in the EU commercial real estate sector / November 2018 Executive summary 3
The commercial real estate (CRE) sector is important for financial stability due to its size and its strong interconnectedness with both the financial system and other parts of the real economy. CRE is a capital-intensive industry and investors in these markets are often leveraged. Past crises episodes, including the global financial crisis of 2007-09, have shown that disorderly adjustments in CRE markets can have an important effect on financial stability. Whilst it is rare for CRE markets alone to trigger a financial crisis, they represent an important source of systemic risk. In fact, default rates have been among the highest in the CRE segment of EU banks’ loan portfolios in recent years. Given CRE’s importance to financial stability, the European Systemic Risk Board (ESRB) needs to conduct an analysis of risks and vulnerabilities in CRE markets in order to fulfil its mandate with regard to macroprudential oversight in the EU.1
The goal of this report is to analyse the financial stability risks and vulnerabilities related to EU CRE markets, as well as to discuss the possible policy instruments available to address such vulnerabilities.2 The report studies both common trends across EU countries as well as country-specific vulnerabilities. Countries are in different phases of the macroeconomic and financial cycles: in some countries vulnerabilities are building up, while other countries are still suffering from the recent global financial crisis. The report focuses mainly on the detection of risks related to the build-up of vulnerabilities, although it is important to note that financial stability risks are present in both the upswing and the downswing phases of the cycle.
Macroprudential analysis and the monitoring of EU CRE markets are severely hampered by the scarcity of accurate and comparable data. Several initiatives are under way to harmonise definitions and improve data availability, most notably those undertaken by the ESRB with its recommendations on closing real estate data gaps.3 It will, however, take some time to fill these gaps. Given the risks to financial stability that CRE can pose, an analysis based on existing information is warranted. To fill this need, the ESRB and the European Central Bank (ECB) have jointly collected data and prepared a risk analysis framework to analyse CRE markets using available data.4 Nevertheless, numerous data gaps, data quality issues and differences in data definitions remain, making it difficult to describe risks accurately and to compare them in and across national markets. In particular, many of the indicators employed in this report have been obtained from private providers, and their representativeness and comparability across countries remains to be tested. It is therefore not possible to analyse vulnerabilities and policies in the EU CRE sector in the same depth as it is, for example, in the residential real estate (RRE) sector.
The report analyses risks and vulnerabilities in CRE markets across four conceptual categories, called “stretches”. This methodological framework is based on an approach that is
1 The ESRB is mandated to carry out the macroprudential oversight of the financial system within the EU in order to
contribute to the prevention or mitigation of systemic risks (see Regulation (EU) No 1092/2010 of the European Parliament and of the Council of 24 November 2010 on European Union macroprudential oversight of the financial system and establishing a European Systemic Risk Board (OJ L 331, 15.12.2010, p. 1)).
2 This report builds on earlier work on CRE markets by the ESRB in its “Report on commercial real estate and financial stability in the EU”, Frankfurt am Main, December 2015.
3 See Recommendation of The European Systemic Risk Board of 31 October 2016 on closing real estate data gaps (ESRB/2016/14), (OJ C 31, 31.1.2017, p. 1).
4 In parallel with this risk analysis, the ESRB Working Group “Real Estate Methodologies” works with the goal of delivering steady state approaches to risk and policy assessments for residential and commercial real estate markets.
Executive summary

Report on vulnerabilities in the EU commercial real estate sector / November 2018 Executive summary 4
also used to analyse vulnerabilities in the RRE sector.5 The framework has been modified to take into account the specificities of the CRE market as well as data limitations in EU CRE markets. The four stretches are the collateral stretch, which captures price growth and valuations in CRE markets; the income and activity stretch, which gauges the income generating capacity and the level of activity in CRE markets; the financing stretch, which analyses the conditions and sources of financing of CRE; and the potential for spillovers stretch, which assesses to what extent negative shocks in CRE markets can be transmitted to the broader financial sector and the real economy. Each stretch is analysed on the basis of a scoreboard consisting of quantitative indicators and a qualitative survey completed by the national authorities.
From a financial stability perspective, the main identified source of vulnerability in the CRE markets across several EU countries relates to investors’ search for yield in the low interest rate environment, which has increased CRE prices and, potentially, made them vulnerable to a repricing of risk premia. The search for yield has contributed to a combination of both high CRE prices and low CRE yields, by historical standards, across EU countries. A reassessment of risk premia could potentially lead to significant decreases in future expected cash flows for investors. This could act as a common trigger, causing abrupt and widespread price reversals as well as a correlated unwinding of positions of high-yield and risky assets, including CRE assets. Sudden price reversals in CRE tend to result in higher loan-to-value ratios and potentially larger investor losses, which are then transmitted to the financial sector and the real economy. Indeed, the empirical literature and the recent financial crisis have shown that disorderly adjustments in CRE markets interacting, in addition, with other parts of the real estate sector, can play an important role in putting financial stability at risk.
Well-located, high quality properties (especially those in capital and major cities) appear to be particularly attractive to investors. Several EU countries are experiencing a combination of double-digit price growth, peak price levels and all-time low yields in their prime CRE markets. The high demand for these properties can, at least, partially be explained by the fact that CRE investments have been seen as relatively attractive by yield-seeking investors. However, it is difficult to establish exactly how much of the recent investor activity and price developments are the result of favourable fundamentals, an abundance of investor optimism, or a lack of alternative profitable investment opportunities in the low interest rate environment. With regard to vulnerabilities in the collateral stretch, both the survey and the scoreboard indicators signal particularly high and increasing CRE prices, as well as low yields, in the Czech Republic, France, Germany, and Sweden. In addition, either available scoreboard indicators or survey answers signal high prices and low yields in the prime CRE markets in Finland, Luxembourg, the Netherlands, Norway, Portugal and Spain.
High investor demand in CRE markets seems to have contributed to the observed price growth. Although vacancy rates have generally declined from their peak, they are still above their historical average in Europe, although significant heterogeneity can be observed across countries and sub-segments. High vacancies in some countries indicate that investors will have to rely on future increases in demand from end-users to achieve their expected returns. In addition, investors are more likely to engage in a correlated unwinding in markets where they have been more active than the average, or where their returns are at risk. This is captured, to some extent, in the income and activity stretch. Available data from both the survey and the scoreboard indicators provide 5 See ESRB, “Vulnerabilities in the EU residential real estate sector’’, Frankfurt am Main, November 2016.

Report on vulnerabilities in the EU commercial real estate sector / November 2018 Executive summary 5
extremely clear signals of high investor activity and potential concerns regarding the income-generating capacity of CRE (such as low yields and high vacancy rates) in Belgium, Denmark, the Netherlands and Romania. In addition, there are similar signals either from the scoreboard or the survey in Austria, the Czech Republic, Estonia, Finland, Germany, Greece, Ireland, Italy, Lithuania, Luxembourg, Poland, Portugal, Slovenia and the United Kingdom.
The banking sector in some countries remains highly exposed to CRE, but non-banks and foreign investors seem to be playing an increasingly important role in CRE markets. Borrowed capital, via both bank loans and market-based funding, constitutes a non-negligible part of overall CRE financing, which indicates a significant degree of ongoing credit risk, interest rate risk and refinancing risk for banks. In some countries, CRE-collateralised bank lending has also increased at a faster rate than that justified by the current macroeconomic environment, although this is not widespread across the EU. Significantly, equity financing from non-banks and international investors appears to have increased in CRE markets since 2007. For example, in many countries real estate investment funds (REIFs) and real estate investment trusts (REITs) are playing an increasingly important role in channelling funding into CRE. In addition, almost half of the EU countries indicated that a large proportion of investor activity is undertaken by foreign investors, and the role played by these investors is also becoming more significant in many countries.
While changes in the investor base and funding sources have increased risk sharing, they have also opened up other forms of interconnectedness and transmission channels to financial stability. The increasing role of non-bank funding sources and the large proportion of foreign investors can increase risk sharing, as losses from CRE can be spread across numerous entities and countries. However, investment vehicles, such as open-ended REIFs, face redemption risks that can lead to CRE price corrections if funds are forced to sell their assets rapidly. Foreign investors can also increase the risk of rapid price corrections, since they may decide to remove their funds quickly if yield prospects become more favourable elsewhere or if market uncertainty rises. Foreign investors can reduce risk as they may be more diversified than domestic investors. However, foreign investors may also cause countries’ CRE cycles to become more synchronous, given their diversified CRE investment exposures, with domestic CRE markets thereby becoming more vulnerable to global risk factors. Due to data gaps regarding foreign investments as well as the numerous possible transmission mechanisms, it is not possible to make an overall assessment of the net effects of foreign investors on financial stability. The available data on domestic financing sources is captured in the financing stretch, where there are indications of rapid growth in REIFs or CRE-collateralised bank lending from either the survey or the scoreboard indicators in Austria, Belgium, Finland, France, Hungary, Ireland, Lithuania and Malta.
Almost half of the EU countries indicate that CRE markets warrant specialised monitoring from a financial stability perspective. CRE markets are often large relative to domestic GDP and are interconnected with the financial system and other parts of the real economy in many countries. For example, there are tight links between CRE markets and RRE markets and the construction sector, which means that any downturn in these markets is likely to be correlated with a downturn in CRE markets. According to either the scoreboard or the survey of the potential for spillovers stretch, the largest relative CRE exposures are in Cyprus, Denmark, Finland, the Netherlands, Norway, Sweden and the United Kingdom. These countries mainly have large exposures of banks to CRE, or their CRE markets are large and interconnected with the financial system and other parts of the real economy.

Report on vulnerabilities in the EU commercial real estate sector / November 2018 Executive summary 6
Some instruments and measures, which mainly target the banking sector, are available to macroprudential authorities seeking to address CRE-related vulnerabilities. EU legislation, through CRD IV, provides instruments that can address CRE-related vulnerabilities in the banking sector using capital-based measures which include increased risk weights, loss given default (LGD), or own fund requirements. Moreover, the Alternative Investment Fund Managers Directive (AIFMD) includes instruments that can be used to address CRE-related vulnerabilities in investment funds through leverage limits, as well as liquidity management tools such as the suspension of redemptions. Depending on the availability of borrower-based measures in national legislation, measures such as loan to value (LTV) limits and debt service coverage ratio/interest coverage ratio (DSCR/ICR) floors can also be used to address CRE-related vulnerabilities. Beyond macroprudential measures, countries can use other measures, such as microprudential measures to the extent that these pertain to institution-specific vulnerabilities as well as other policies, such as fiscal policy, to reduce CRE vulnerabilities. For example, taxes can influence the relevant parties’ incentives (e.g. by discouraging short-term investments) to address CRE-related vulnerabilities that are, in particular, related to the increasing role of cross-border and foreign investments.
Few macroprudential measures have been implemented so far in the EU countries that directly target CRE vulnerabilities. The most commonly used measure to date has been an increase in the risk weights for CRE exposures over the minimum (50%) required by EU regulation. Increased risk weights are usually applied using the standardised approach. Only three countries have implemented borrower-based measures – mainly to address RRE risks. Moreover, although they were not targeted at CRE directly, some countries have partly justified their activations of the systemic risk buffer and the countercyclical capital buffer as being aimed at addressing CRE-related vulnerabilities.
Current risks and vulnerabilities in the EU CRE markets need to be appropriately addressed. In general, the appropriateness of a policy response depends on the nature of the identified risk or vulnerability. Although instruments interact with each other, borrower-based measures are more appropriate when vulnerabilities stem from expanding CRE markets, while capital-based measures may be more effective when vulnerabilities are within lenders. Ideally, any measure should also be introduced early in the upswing to maximise its effectiveness. Currently, the EU CRE markets are facing risks of a cyclical nature (e.g. high and rapidly increasing CRE prices, low yields, rapid growth in CRE investment transactions, some signs of easing of lending standards, etc.).
Borrower-based measures could be directed at the risky activity itself, and could counteract the build-up of financial imbalances by safeguarding prudent lending standards. Nevertheless, a great deal of flexibility should ideally be applied to the calibration of measures in order to handle the highly heterogeneous nature of CRE projects (e.g. different LTV limits in different segments or the usage of speed limits), and calibration is also complicated by the existing data gaps. Borrowers may also obtain financing from abroad. While the reciprocity of measures in the EU limits potential leakages and regulatory arbitrage, reciprocity is not required for all types of measures and is not extended to countries outside the EU. Therefore, it is important that the authorities have the relevant instruments available to address potential CRE-related risks, given the changing role of funding and investment in the EU CRE market, particularly in the light of the increasing role of non-bank as well as cross-border investments.
Capital-based measures may also be implemented to increase the resilience of the financial sector and to influence cyclical developments in CRE markets. Although there is limited empirical evidence of the impact of capital-based measures on cyclical developments in CRE

Report on vulnerabilities in the EU commercial real estate sector / November 2018 Executive summary 7
markets, the measures increase the resilience of the domestic banking sector. The effective regulation of risk weights for CRE exposures in many countries would require adjustments under the IRB approach. This is because risk weights for most of the banks’ exposures are based on IRB models in many countries although, currently, most countries have implemented measures to increase CRE risk weights using the standardised approach. However, EU legislation limits countries’ possibilities with regard to correcting or increasing risk weights for IRB banks in order to address CRE vulnerabilities.
Given the rising importance of non-bank and cross-border financing in CRE markets, it is important to investigate whether new instruments should be made available and, in addition, implemented beyond banking. The larger role played by non-banks since the global financial crisis is likely to open up additional channels for the transmission of CRE shocks to the financial sector and the real economy. It is therefore important for the macroprudential authorities to have the necessary tools available to address potential CRE-related risks and vulnerabilities. For example, when more equity is involved in the financing (e.g. through open-ended REIFs as is currently the case in the EU), the main risk is a run on the funds involved. Therefore, if current market conditions deteriorate, it is important that measures such as the suspension of redemptions can be implemented at short notice to limit the risks of fire sales of CRE in EU-based funds. However, there are only limited opportunities for addressing the increasing role of investors outside the EU as well as investors financed in bond markets or leveraged in multiple layers. A combination of macroprudential measures and those from other policy areas may therefore be most effective in tackling risks and avoiding leakages.
As a minimum, national authorities should monitor their CRE markets more extensively and should increase their efforts to fill current data gaps. Current developments in Europe highlight how important it is for authorities to remain vigilant with regard to potential financial stability risks stemming from CRE markets. It is therefore important for national authorities to monitor their CRE markets more extensively, as well as to strive to reach a better understanding of the investor base, the funding sources, and the interconnectedness of their domestic CRE markets with other relevant factors. This includes improving their understanding of how developments in CRE markets and the actions of CRE investors can be transmitted, leading to adverse developments in the financial system and the real economy. Stress testing should also be used in order to assess the resilience of financial institutions and market participants to adverse market developments in CRE markets. However, increased monitoring and analysis requires more granular data in order to be comprehensive. Countries with significant data gaps should therefore step up their work to improve data availability, especially in the light of the ESRB recommendation on closing real estate data gaps.
Keywords: commercial real estate, financial stability, macroprudential measures, cross-border financing, bank and non-bank financing.
JEL codes: E58, G21, G23.

Report on vulnerabilities in the EU commercial real estate sector / November 2018 Introduction 8
CRE markets are important for financial stability due to their size, volatility, and tight interconnectedness with financial markets and other parts of the real economy. The value of CRE in the EU owned by professional investors was estimated to be €2 trillion in 2016, equivalent to approximately 14% of EU GDP.6 In addition, CRE is a capital-intensive industry and investors in these markets often have high levels of debt. The CRE exposures of many financial institutions are also large and are concentrated in the banking sector. The materialisation of the credit risk of CRE loan portfolios therefore directly impacts the financial system through loan defaults. CRE price changes may also be transmitted to the financial system via the collateral channel, as businesses use CRE as loan collateral. In addition, CRE markets affect the real economy directly through construction demand.
The current low interest rate environment makes CRE a particularly important sector to follow from a financial stability perspective.7 In an environment of low long-term interest rates, investors’ search for yield has contributed to a combination of both high CRE prices and low CRE yields across the EU countries, by historical standards. A reassessment of risk premia could, potentially, lead to significant decreases in investors’ future expected cash flows. This could act as a common trigger, causing abrupt and widespread price reversals as well as a correlated unwinding of positions of high-yield and risky assets, including CRE. Sudden price reversals in CRE tend to result in higher loan-to-value ratios and potentially larger investor losses, which are then transmitted to the financial sector and the real economy if risks materialise after the initial shock. Indeed, the empirical literature and the recent financial crisis have shown that disorderly adjustments in CRE markets, interacting, in addition, with other parts of the real estate sector, can play an important role in financial stability.
The goal of this report is to analyse the financial stability risks and vulnerabilities related to EU CRE markets, as well as to discuss the possible policy instruments available to address such vulnerabilities. The report investigates both common trends across EU countries and country-specific vulnerabilities. It should be noted that countries are in different phases of the macroeconomic and financial cycles: in some countries vulnerabilities are building up while other countries are still suffering from legacy issues from the global financial crisis of 2007-09. The high amount of non-performing loans (NPLs) stemming from the CRE sector in several countries are a reminder of the financial stability risks related to CRE. The report focuses mainly on the detection of risks related to the build-up of vulnerabilities, although it is important to note that financial stability risks are present in both the upswing and downswing phases of the cycle. Risks typically build up during the upswing, increasing the potential severity of a downswing. If CRE risks do not materialise during the downswing, vulnerabilities could still be present and could, potentially, materialise at a later stage.
Analyses of EU CRE markets are significantly hampered by the scarcity of accurate and comparable data. While it is possible to identify certain common risks and vulnerabilities in EU CRE markets, the scarcity and quality of data make it more difficult to analyse vulnerabilities at the
6 According to Morgan Stanley Capital International (MSCI). 7 See ESRB, “Macroprudential policy issues arising from low interest rates and structural changes in the EU
financial system”, Frankfurt am Main, November 2016.
Introduction

Report on vulnerabilities in the EU commercial real estate sector / November 2018 Introduction 9
country level. The focus of this report is on income-generating CRE, in accordance with the ESRB recommendation on closing data gaps8. However, data based on several different definitions are used to gain further insights into the situation of scarce comparable data. In addition, limited experience in the use of macroprudential measures related to CRE complicates the policy analysis. Nevertheless, current developments in Europe highlight how important it is for the authorities to increase their monitoring of CRE markets, and to intensify their efforts to improve data availability in line with the ESRB recommendation on closing real estate data gaps.
The report is organised into four chapters. The first chapter outlines the main characteristics of the CRE market and demonstrates its importance to financial stability and the real economy. It includes a discussion of the transmission mechanisms between CRE markets, the financial system and other parts of the real economy.
For this report, each EU country’s CRE market was analysed using a risk analysis framework that builds on the ESRB framework for residential real estate analysis and has been developed together with the ECB. The framework consists of a scoreboard, which includes a large set of indicators and their associated risk thresholds. The analysis is complemented by information provided by the national authorities in response to a survey of their domestic CRE markets. The framework and a discussion of the data are presented in Chapter 2.
Chapter 3 presents the risk analysis and discusses identified common themes and trends in the European CRE sector as well as the risks and vulnerabilities at the country level. It outlines the risks and vulnerabilities stemming from CRE price growth, increased activity, declining yields, investor indebtedness and CRE financing. It also examines the exposures of the financial system and the real economy to CRE. The Annex provides a summary of the scoreboard and the survey results at the country level as well as a more in-depth description of the data.
Chapter 4 focuses on the policy analysis and consists of three parts: the macroprudential measures available in relation to CRE, the measures which have been implemented, and the measures which could be implemented to address current vulnerabilities.
8 In the recommendation on closing real estate data gaps (ESRB/2016/14) CRE is defined as follows: “…any income-
producing real estate, either existing or under development, and excludes: (a) social housing; (b) property owned by end-users; (c) buy-to-let housing. If a property has a mixed CRE and RRE use, it should be considered as different properties (based for example on the surface areas dedicated to each use) whenever it is feasible to make such a breakdown; otherwise, the property can be classified according to its dominant use.”

Report on vulnerabilities in the EU commercial real estate sector / November 2018 The importance of CRE markets for financial stability and the real economy 10
This chapter provides an overview of the characteristics of CRE markets and their relevance to financial stability and the real economy.9 Section 1.1 describes the structure and size of CRE markets, while Section 1.2 details the transmission channels through which the CRE sector can affect financial stability and other parts of the real economy. The role of foreign investors in financial stability is discussed in Section 1.3.
1.1 Market structure, size and cross-border activities
There is currently no common definition of CRE. For the purpose of this report, the definition from the ESRB recommendation on closing real estate data gaps10 is used, which defines CRE as any income-producing real estate, either existing or under development, excluding social housing, property owned by end-users, and buy-to-let housing. This definition implies that CRE premises encompass a wide range of different uses, including offices, retail properties, manufacturing facilities, and even some types of residential property, such as multiple dwelling units. Notably, CRE property is excluded from this definition if it is owned by entities that are involved in activities other than real estate (i.e. property owned by end users) such as self-owned company headquarters or production plants. Data limitations lead to deviations from the definition given above in some cases. For example, data on bank lending for CRE are only available based on broader definitions of CRE (either CRE-collateralised loans or loans to non-financial companies involved mainly in real estate activities and construction).
CRE markets are characterised by a high degree of heterogeneity. The market for a given property is greatly affected by a number of different factors, including location, size and function. For instance, market demand for CRE in prime locations in capital cities and other large metropolitan areas can differ substantially from demand in other CRE markets within the same country. Moreover, in addition to cyclical developments, long-term trends, such as demographic change or urbanisation, also shape the market.
CRE markets are important for the financial sector and the economy as a whole for several reasons, and particularly due to their size. Estimating the size of CRE markets is difficult due to the largely fragmented and private nature of the market.11 Based on estimates from the private data provider MSCI for 16 EU countries, the market value of CRE owned by investors averages 14% of GDP (Chart 1) and, of these countries, nine had markets equivalent to more than 10% of their respective GDPs. There are various explanations for the heterogeneity in the investable CRE markets across countries – it could, for example, be due to differences in ownership practices. In some countries (e.g. the Nordic countries) it is more common to rent real estate premises, also from self-owned firms established to own the property, in which case it counts as CRE. This practice seems less common in other countries (e.g. Spain and Italy), where it is usual for firms to own the 9 For a more detailed description, see ESRB, “Report on commercial real estate and financial stability in the EU”,
Frankfurt am Main, December 2015. 10 See ESRB, “Recommendation ESRB/2016/14 on closing real estate data gaps”, Frankfurt am Main, October 2016. 11 See, for example, Tiwari, P. and White, M., “International real estate economics”, Palgrave Macmillan, London, 2010.
1 The importance of CRE markets for financial stability and the real economy

Report on vulnerabilities in the EU commercial real estate sector / November 2018 The importance of CRE markets for financial stability and the real economy 11
required real estate premises, thereby excluding the property from the definition of CRE. Using a broader definition of CRE (including all non-financial companies involved in real estate activities and the construction sector), bank loans to the sector total an average of 12% of GDP in the EU, albeit with significant heterogeneity across countries (Chart 2). For most countries, the real estate sector is larger than the construction sector, but in some countries (Croatia, Cyprus, Greece, Spain and Portugal) the construction sector is larger. However, this broad definition may also include substantial loans not related to CRE, such as loans for RRE activities or infrastructure construction projects.12
Chart 1 Estimated market value of CRE for investment purposes as a share of GDP
(percentage of GDP)
Source: Morgan Stanley Capital International (MSCI). Notes: The market size is the estimated market value of the invested CRE market. Invested commercial property is the share of the overall CRE market which is not owner-occupied, and is thus owned by professional real estate investors for investment purposes. Data are for 2016. For a detailed explanation on how the size of the CRE market is calculated, see MSCI ‘’Real Estate Market Size 2016’’, June 2017.
12 Note that some RRE activities in these figures, in particular the activities of housing companies, are included in the
definition of CRE according to the ESRB’s recommendation on closing data gaps. However, social housing activities are also included in RRE activities, although they are not included in the ESRB’s definition of CRE. Also note that the figures are based on the residence of the immediate counterparty of the loan. This might not be where the activity or the property is located.
0
5
10
15
20
25
30
35
SE FI UK NL DK FR DE PT BE AT IE CZ PL HU ES IT
EU average

Report on vulnerabilities in the EU commercial real estate sector / November 2018 The importance of CRE markets for financial stability and the real economy 12
Chart 2 Banks’ lending for real estate activities and construction as a share of GDP
(percentage of GDP)
Source: ESRB based on aggregated supervisory information (FINREP) provided by the EBA. Notes: Based on FINREP series from Q4 2017. For bank exposures to the real estate and construction sectors we take “Geographical breakdown by residence of the counterparty of loans and advances other than held for trading to non-financial corporations by NACE codes” in sectors “F Construction” and “L Real estate activities” (FINREP Template F_20.07, Rows 060 and 110, Column 010). Data are country aggregated on the basis of the residence of the immediate counterparty. Figures across countries may differ due to differences in data coverage. See the EBA’s Risk Dashboard for Q4 2017 for more details.
About 50% of the existing stock of CRE properties in the EU is funded by debt. Bank loans to CRE make up a significant part of bank lending, and account for approximately 90% of CRE debt.13 In the majority of European countries the share of CRE-collateralised bank loans exceeds 10% of total loans (Chart 3). Other financial market institutions, such as insurance companies, pension funds, REITs and various types of mutual funds (e.g. REIFs) are also exposed to CRE.14 In addition, CRE is financed by commercial mortgage-backed securities (CMBS) in a few countries, most notably the United Kingdom.15
13 See ESRB, “Report on commercial real estate and financial stability in the EU”, Frankfurt am Main, December 2015,
for more information, including sources. 14 REITs are joint stock companies that own and operate CRE property for income generating purposes. They are attractive to
investors due to their treatment under tax legislation. REIFs, on the other hand, are mutual funds that invest in real estate. 15 See ESRB, “Report on commercial real estate and financial stability in the EU”, Frankfurt am Main, December 2015.
0
10
20
30
40
50
60
70
LU CY SE DK FI EE NL AT FR PT BE LV MT ES GR CZ UK LT IT IE DE BG SK HR HU PL RO SI
RE activitiesConstructionEU average

Report on vulnerabilities in the EU commercial real estate sector / November 2018 The importance of CRE markets for financial stability and the real economy 13
Chart 3 CRE-collateralised loans as a share of total loans and bank equity
(percentages; blue dots represent countries; x-axis: CRE lending as share of bank equity; y-axis: CRE lending as share of total lending)
Source: ESRB based on aggregated supervisory information (FINREP) provided by the EBA. Notes: For each country the ratios are calculated as follows using the FINREP series at Q4 2017 (data for LU are not available). For CRE lending we take “Loans collateralised by commercial immovable property” (FINREP Template F_18.00.a, Row 140, Column 010), for total loans we take “Loans and advances” (FINREP Template F_18.00.a, Row 070, Column 010) and for bank equity we take “Total equity” (FINREP Template F_01.03, Row 300, Column 010). Figures across countries might differ due to differences in data coverage.
Foreign investors play an important (although heterogeneous) role in CRE markets across Europe. Foreign intra-regional (within the EU) and cross-regional (from outside the EU) investments accounted for an average of 42% of CRE investments between 2006 and 2015. Non-domestic investors are the primary source of funds in Central and Eastern Europe, the Baltic States and Luxembourg. In absolute size, the largest inflows from abroad target France, Germany and the United Kingdom.16
There is limited information available on the place of origin of foreign CRE investors, or whether inflows of capital are backed by equity or debt. The intra-regional CRE exposures of European banks provide some information about cross-border flows through the European banking sector (Chart 4). These data cover all lending collateralised by CRE, and therefore also include owner-occupied CRE. For banks in Austria, Germany, Hungary, the Netherlands and Sweden, CRE lending in other EU countries makes up more than 20% of total CRE lending, measured as CRE-collateralised loans. This is partly due to multinational banking groups in these countries with subsidiaries in other EU countries, where the subsidiaries are partly funded domestically.
16 ibid.
AT
BE
BG
CY
CZ DEDK
EE
ES
FI
FR
GR
HR
HU
IE
IT
LTLV
MT NL
PL
PTROSE
SI
SK
UK
NO
EU
0
5
10
15
20
25
0 50 100 150 200 250

Report on vulnerabilities in the EU commercial real estate sector / November 2018 The importance of CRE markets for financial stability and the real economy 14
Chart 4 Banks’ CRE exposures in other EU countries
(share of total CRE exposure in EU; percentages)
Source: ESRB based on aggregated supervisory information (FINREP) provided by the EBA. Notes: Consolidated banking data which include loans from subsidiaries. For each country the figure for loans to other countries as a share of total loans to all EU countries is calculated based on FINREP data for Q4 2017. For bank exposures in EU countries we take “Geographical breakdown of assets by residence of the counterparty” – “Loans and advances” – “Of which: Loans collateralised by commercial immovable property” (FINREP Template F_20.04, Row 210, Column 010). For total loans we take “Loans and advances” (FINREP Template F_18.00.a, Row 070, Column 010). Figures across countries might differ due to differences in data coverage. The data do not cover loans to countries outside the EU. Data for BE, BG, EE, HR, LV and MT only show domestic exposures. Data missing for CY, DK, FI, IE, NO, PL, RO and SK.
Price and yield developments in CRE markets can, in principle, be rationalised by simple asset pricing models such as the dividend discount model. According to this model, the price of CRE depends on the net present value of future expected rents, discounted by the risk-free interest rate plus a risk premium demanded by investors, and a residual term. Either an increase in expected returns (for instance during an upswing in the economy) or a reduction in the risk-free rate would cause CRE prices to increase. Additional factors that could impact the residual amount, such as changes in risk and liquidity premia or search-for-yield behaviour in a situation of abundant financial resources can drive CRE prices up. Although a higher risk premium would have a negative effect on prices, search-for-yield behaviour may drive up CRE prices when alternative profitable investment opportunities are scarce. This simplistic model takes an investment perspective, but it does not capture all the CRE market-specific and supply factors that are important drivers of CRE prices and yields. In particular, regulations that limit the supply of buildings and land, such as prescribed green belts around cities or height restrictions for buildings, have been shown to drive up CRE prices.17
Yield spreads between CRE and other asset classes can also be explained by differences in asset liquidity. As real estate is usually difficult to resell at short notice, yields on CRE should be relatively higher than yields on highly liquid assets with a similar risk profile, in order to compensate investors for lower liquidity. The valuation of liquidity by market participants, and hence liquidity spreads, may be particularly high in situations of higher market uncertainty.
17 See Cheshire, P. and Hilber, C., “Office Space Supply Restrictions in Britain: the Political Economy of Market Revenge”,
The Economic Journal, Vol. 118(529), 2008, pp. F185-F221.
BEBG
BG
CYCZ
DEDK
EE
ES
FI
FR
FR
FR
UK
HR
HR
HR
HU
HU
IT
LT
LU
NL
NO
PL PL
PL
PL
PT
RO
RO
RO
SK
SK
0
10
20
30
40
50
60
SE AT HU DE NL PT GR FR ES SI UK IT CZ LT
Other EU countries

Report on vulnerabilities in the EU commercial real estate sector / November 2018 The importance of CRE markets for financial stability and the real economy 15
Chart 5 EU commercial and residential property values and the economic cycle
(percentage change per annum)
Sources: ECB, Experimental ECB estimates based on IPD, Jones Lang LaSalle and national authorities. Notes: Nominal prices. Last observations: CRE Q3 2017, prime CRE, RRE and GDP Q4 2017.
Historically, there have been co-movements between CRE prices and the economic cycle (Chart 5). The economic cycle is affected by the CRE cycle and vice versa.18 In the past, CRE price cycles in the EU have had higher amplitudes than the overall economic cycle, partly due to the relatively low elasticity of supply. CRE price cycles are also more volatile than RRE price cycles. This is, to some extent, due to differences in terms of their purpose and their financing structure. While RRE tends to be financed mostly by domestic banks, CRE is, to a larger degree, dependent on international capital markets. Moreover, irrespective of the business cycle, people need housing services and are reluctant to reduce their housing consumption, while businesses close and downsize during recessions.
The supply of CRE lags behind changes in demand, leading to long market adjustment times and increased short-term price volatility. The construction of new CRE units often takes several years, thereby causing undersupply during economic upswings and oversupply during downswings. Moreover, newly constructed CRE properties increase supply inelastically because CRE buildings tend to have a relatively long operating life and are costly to convert to other purposes. This can imply large, persistent price declines if large quantities of new supply come onto the market simultaneously.
The strong cyclicality of CRE and the large exposures of banks and other financial institutions to CRE emphasise the importance of CRE markets for financial stability. In recent years default rates on bank loans in the EU have been among the highest in the CRE segment of banks’ loan portfolios (Chart 6). In most countries CRE-collateralised loans represent a larger share of NPLs than their share of total lending would imply, suggesting that default rates in the CRE segment are higher than in other segments in most countries (Chart 7). For this reason, banks’ overall losses on CRE lending are often higher than those on RRE lending, even though exposures
18 For a detailed explanation of these mechanisms, see ESRB, “Report on commercial real estate and financial stability
in the EU”, Frankfurt am Main, December 2015.
-20
-15
-10
-5
0
5
10
15
20
25
2004 2006 2008 2010 2012 2014 2016
GDP growthPrime commercial property growth
Commercial property prices growthResidential property prices growth

Report on vulnerabilities in the EU commercial real estate sector / November 2018 The importance of CRE markets for financial stability and the real economy 16
to the latter are typically larger. The higher default rate of CRE compared with RRE lending is linked to the fact that CRE is generally operated to generate profits, and because CRE lending tends to be on a non-recourse basis. By contrast, RRE is not only an investment, but also a consumption good which households purchase to live in.
Previous financial crisis episodes have shown that disorderly adjustments in CRE markets can play an important role in financial crises. This was, for example, the case in the Nordic countries and in the United States in the early 1990s, in some Asian economies in the late 1990s, as well as in the United States and some EU countries during the recent global financial crisis.19 While RRE was one of the main drivers of the 2007 crisis, strong interactions between the CRE market and the RRE market mean that many countries in the EU, including Cyprus, Greece, Ireland, Italy, Hungary, Spain and Portugal are still suffering from legacy CRE exposures (considered under the broader CRE definition) for which credit risk materialised at that time.20
Chart 6 Non-performing loan ratios for banks in the EU
(percentage of total loans in respective segment)
Source: ESRB based on aggregated supervisory information (FINREP) provided by the EBA. Notes: Data from the FINREP series for Q4 in 2015, 2016 and 2017. Ratios calculated by dividing non-performing loans by total loans and advances in each category (FINREP Template F_18.00a, Column 060 divided by Column 010, for Rows 070 and 120-170). “Total” refers to total loans and advances, for which non-financial corporations (“NFC”) are a sub-category, “SME” refers to NFC loans of for small and medium-sized enterprises, “CRE” refers to NFC loans collateralised by commercial immovable property, “RRE” refers to household loans collateralised by residential immovable property and “Consumer” refers to household loans which are credit for consumption.
19 See Englund, P., “The Swedish Banking Crisis: Roots and Consequences”, Oxford Review of Economic Policy, Vol. 15(3),
2004, pp. 80-97; Herring, R. and Wachter, S., “Real Estate Booms and Banking Busts: An International Perspective”, The Wharton School Research Paper, 1999; and Kim, L., “Time-Varying Macroeconomic Risk and Commercial Real Estate: An Asset Pricing Perspective”, Journal of Real Estate Portfolio Management, Vol. 10(1), 2004, pp. 47-57.
20 Data on the US banking sector from 2008 to 2012 show that the failure rate of institutions with high CRE loan concentrations was 12 percentage points higher than the nationwide failure rate; see Fessenden H. and Muething, C., “Understanding the Surge in Commercial Real Estate Lending”, Federal Reserve Bank of Richmond Economic Brief, 2017, pp. 17-08.
0
5
10
15
20
Total NFC SME CRE Household RRE Consumer
201520162017

Report on vulnerabilities in the EU commercial real estate sector / November 2018 The importance of CRE markets for financial stability and the real economy 17
Chart 7 Non-performing loan ratios for CRE and CRE exposures
(percentages; blue dots represent countries; x-axis: CRE lending as share of total lending; y-axis: CRE NPLs as share of total NPLs)
Source: ESRB based on aggregated supervisory information (FINREP) provided by the EBA. Notes: Data from the FINREP series for Q4 2017 (data for LU not available). The vertical axis shows, for each country, non-performing loans “collateralised by commercial immovable property” divided by total non-performing loans (FINREP Template F_18.00 data in Row 140, Column 060 divided by Row 070, Column 060). The horizontal axis shows, for each country, loans and advances “collateralised by commercial immovable property” divided by total loans and advances (FINREP Template F_18.00.a data in Row 140, Column 010 divided by data in Row 070, Column 010). Figures across countries might differ due to differences in data coverage.
1.2 Transmission channels from CRE markets to financial stability and the real economy
There are a number of transmission channels through which adverse developments in the real estate sector can have a systemic impact on the financial system and the real economy.21 Financial stability can be affected directly in the event of losses suffered by financial institutions and through the interconnectedness of financial markets, and also indirectly via real activity.
The materialisation of CRE loan portfolios’ credit risk directly impacts the financial system through loan defaults. Banks and other financial institutions make loans to investors for the purchase of CRE, and these loans must be repaid from investors’ income streams. However, CRE yields are often dependent on end-user profitability, and sudden changes in expectations of that profitability can lead to rapid price corrections, rendering borrowers unable to meet their debt-servicing obligations. One reason why defaults on CRE lending tend to be high relative to defaults on RRE lending is that loans to CRE tend to be made on a non-recourse basis, meaning that a loan is secured by a pledge of collateral for which the borrower is not personally liable.
21 See Jordà, O., Schularick, M. and Taylor, A. M., “The Great Mortgaging: Housing Finance, Crises and Business
Cycles”, Economic Policy, Vol. 31, Issue 85, 2016, pp. 107-152.
AT
BE
BG
CY
DE
DK
EE
ES
FR UK
GR
HR
HUIE
IT
LT
LV
MT
NL
NO
PL
PTRO
SE
SI
SK
CZ
EU
0
10
20
30
40
50
0 10 20 30 40 50
45°-line

Report on vulnerabilities in the EU commercial real estate sector / November 2018 The importance of CRE markets for financial stability and the real economy 18
CRE price changes can be transmitted to the financial system via the collateral channel. In some countries, owner-occupied CRE is used by businesses as collateral for their working capital loans, particularly in small and medium-sized enterprises (SMEs). As the market value of the CRE assets rises, firms are able to borrow more while maintaining the same LTV ratio. Consequently, CRE prices and lending tend to show correlated increases during economic upswings and correlated decreases during economic downturns. A sudden decline in the market value of CRE assets (while not necessarily affecting the businesses using that CRE directly) can lead to sharp increases in LTV ratios. Higher LTVs, in turn, increase the banks’ LGD, may increase their capital holding requirements, and may reduce their ability to create new lending.
In either case, the additional burden on the financial system can have an effect on the real economy. At a minimum, higher default or LGD rates are likely to result in a decline in the banks’ ability to create new loans, which can lead to credit tightening and a reduction in new investment in the economy. In more extreme circumstances, high rates of default could threaten the financial sustainability of individual lenders. Furthermore, due to the high rates of interconnectedness in the banking sector, contagion effects can lead to broader systemic failure.
Equity investments in CRE by non-banks can also affect financial stability and the real economy. For instance, in several EU countries real estate investment funds and trusts are either already significant in size or are growing rapidly. While such funds may partly finance their activities by debt (real estate funds are usually the most leveraged investment funds due to the nature of their activity22), they usually have lower debt ratios than other CRE investors. However, some of these investment vehicles (namely open-ended funds) are subject to redemption risks. If investors attempt to withdraw capital quickly due to, for instance, higher liquidity needs in stressed market conditions, this may lead to fire sales of the underlying assets and to a sudden decline in CRE prices. To avoid fire sales, redemptions can be met by larger loans or by banks and other financial institutions buying the units that are being redeemed. This could therefore mask additional contagion risks arising from the interconnectedness of the financial system. This is especially the case where there is a strong concentration of these vehicles in financial groups (e.g. due to funding channels or the materialisation of step-in risk).23 Furthermore, as pension funds represent an important component of household wealth, lower returns or losses on CRE suffered by these funds can impair private spending via their impact on household wealth. The resulting reduction in real activity can, in turn, lead to further losses to the financial system.
CRE market downturns can affect the real economy directly through decreasing construction demand. In most EU countries the construction sector accounts for a significant share of GDP. Negative developments in CRE markets can reduce demand for new constructions, leading to a decline in employment and GDP. This can increase vulnerabilities in the financial sector via rebound effects when the default rates for loans to construction firms are rising.
Risks in the RRE sector are likely to be transmitted to the CRE sector, as both segments have similar characteristics from an investor’s point of view. Prices in RRE markets are closely related to prices in CRE markets, as both sectors often compete for the same parcels of land and because existing properties can often be repurposed as either type. Moreover, the constructors and developers can be involved in both RRE and CRE projects, adding a link through 22 See ESRB, “EU Shadow Banking Monitor’’, Frankfurt am Main, May 2017. 23 For example, banks in Portugal held around 44% of REIF units in December 2015. See Banco de Portugal (2016),
“Financial Stability Report”.

Report on vulnerabilities in the EU commercial real estate sector / November 2018 The importance of CRE markets for financial stability and the real economy 19
supply. Banks and other financial institutions are therefore sensitive to a downturn in either market, since difficulties in one market are likely to be reflected in the other. The similarity of the two asset classes also makes regulatory arbitrage more likely. For example, tighter capital regulations for RRE markets can lead to an increase of lending to the CRE market, thereby shifting risks to this sector.24
1.3 The role of foreign investment in financial stability
The diversification of CRE financing sources across borders can increase liquidity and risk sharing. Recent developments have highlighted the growing importance of foreign investors in CRE markets, and their increasing but uncertain influence on financial system stability. Cross-border financing increases risk sharing and decrease the concentration of losses from CRE exposures by transferring a part of those losses to investors or banks outside the domestic market. Thus, international risk sharing is particularly beneficial when it extends beyond the EU and when the inflow of funds is in the form of equity rather than debt.25
The presence of foreign investors may help to shorten a boom and facilitate recovery after a crisis. In particular, if a CRE price boom is driven mainly by domestic investors, foreign investors may exit an overheating market early, thereby dampening the boom. Furthermore, in the event of distress in the domestic financial sector, access to foreign banks and other credit providers can provide CRE investors with alternative sources of finance. Attracting capital inflows at such a moment may, therefore, shorten the bust and foster the recovery.26
However, foreign investors and cross-border flows to CRE markets can increase risks to financial stability by amplifying boom-bust cycles.27 There is strong evidence of a high correlation between capital inflows and price booms in real estate markets.28 Moreover, empirical studies document the presence of global financial cycles that direct international capital flows.29 Domestic CRE markets may therefore become more synchronised with global CRE cycles when, for example, international investors chase yields in the same prime locations across countries. Furthermore, since foreign investors may remove their funds from CRE markets more quickly than domestic investors if yield prospects become more favourable abroad or if market uncertainty rises, the volatility of the CRE cycle is likely to increase. A sudden stop or reversal of foreign investor
24 This behaviour of banks is shown by Auer, R. and Ongena, S., “The countercyclical capital buffer and the composition
of bank lending”, Bank for International Settlements Working Paper, No 593, 2016, using Swiss bank lending data around a policy change that implied higher capital requirements for residential mortgages in 2012.
25 See Committee on International Economic Policy and Reform, “Banks and Cross-Border Capital Flows: Policy Challenges and Regulatory Responses”, Washington D.C., September 2012.
26 The latter point may be particularly relevant for countries that host important international financial centres, such as Ireland. See Lane, P., “International Financial Flows and the Irish Crisis”, CESifo Forum, 2/2014, 2014.
27 See Jordà, O., Schularick, M. and Taylor, A. M., “Financial Crises, Credit Booms, and External Imbalances: 140 Years of Lessons”, IMF Economic Review, Palgrave Macmillan, International Monetary Fund, Vol. 59(2), 2011, pp. 340-378.
28 See, amongst others, contributions by Aizenman, J. and Jinjarak, Y., “Current Account Patterns and National Real Estate Markets”, Journal of Urban Economics, Vol. 66(2), 2009, pp. 75-89; Aizenman, J. and Jinjarak, Y., “Real Estate Valuation, Current Account and Credit Growth Patterns, Before and After the 2008-9 Crisis”, Journal of International Money and Finance, Vol. 48, 2014, pp. 249-270; Jara, A. and Olaberría, E., “Are all Capital Inflows Associated with Booms in House Prices? An Empirical Evaluation”, Central Bank of Chile Working Paper 696, 2013; Ferrero, A., “House Price Booms, Current Account Deficits, and Low Interest Rates”, Journal of Money, Credit and Banking, Vol. 47(1), 2015, pp. 261-293.
29 See, for instance, Fratzscher, M., “Capital Flows, Push Versus Pull Factors and the Global Financial Crisis”, Journal of International Economics, Vol. 88, 2012, pp. 341-356 and Rey, H., “Dilemma not Trilemma: The global Financial Cycle and Monetary Policy Independence”, NBER Working Paper, No 21162, 2015.

Report on vulnerabilities in the EU commercial real estate sector / November 2018 The importance of CRE markets for financial stability and the real economy 20
demand could increase the probability of a sharp decline in CRE prices, which could be transmitted to domestic financial markets and the real economy through the channels discussed in Section 1.2.
If foreign investments are financed by cross-border bank lending, a CRE market downturn can generate contagion risks for other countries’ banking systems. A crisis in the CRE sector of one country may be transmitted via banks to other countries due to the interconnectedness of the banking sector. Empirical research emphasises that adverse shocks to international financial markets are transmitted to domestic markets more rapidly in the presence of a large share of foreign investors and that cross-border bank lending is a particularly volatile component of international capital flows.30 In fact, sudden halts in capital flows are mainly concentrated in bank-related flows.31 Vulnerabilities in CRE markets will, accordingly, be particularly high when capital inflows stem from the global banking system.
Debt-type capital inflows to the domestic banking sector can increase both the leverage of banks and domestic CRE lending. It has been found that banks use inflows from the global banking system and from international money market funds as an additional source of finance, besides domestic depositors, to increase their lending activities. Hence, a domestic credit boom in CRE markets may be amplified by cross-border debt inflows into the domestic banking system, allowing a further expansion in domestic CRE lending, but also potentially contributing to more severe contagion effects under stress.32
CRE market volatility may rise when international banks and investors engage in regulatory arbitrage by channelling their funds to less regulated markets.33 Maintaining an effective regulatory regime requires the continuous harmonisation and reciprocity of rules. Unilateral changes to regulations may, otherwise, contribute to the volatility of CRE markets when investors transfer funds to markets whose regulation they consider to be more favourable. Besides regulatory arbitrage, other areas of policy can directly affect capital flows. For example, in the current low-yield environment, international investors may be particularly sensitive to changes in monetary policy in other jurisdictions.34 Tax optimisation, due to different tax rules and treaties across countries, and tax evasion might also significantly influence international capital flows, including in CRE markets. These capital flows might be particularly difficult to identify.
30 See Committee on International Economic Policy and Reform, “Banks and Cross-Border Capital Flows: Policy
Challenges and Regulatory Responses”, Washington D.C., September 2012. 31 See Milesi-Ferretti, G. and Tille, C., “The Great Retrenchment: International Capital Flows during the Global Financial
Crisis”, Economic Policy, Vol 26, 2011, pp. 285-342. 32 See Bruno, V. and Shin, H., “Cross-Border Banking and Global Liquidity”, Review of Economic Studies, Vol. 82, 2015,
pp. 535-564. 33 Houston, J., Lin, C. and Ma, Y., “Regulatory Arbitrage and International Bank Flows”, Journal of Finance, Vol. 67(5),
2012, pp. 1845-1895 provide empirical evidence for this behaviour in the case of banks. 34 See the findings by Bruno, V. and Shin, H., “Capital Flows and the Risk-taking Channel of Monetary Policy”, Journal of
Monetary Economics, Vol. 71, 2015, pp. 119-132 on this point.

Report on vulnerabilities in the EU commercial real estate sector / November 2018 Risk analysis framework 21
This chapter describes the framework that has been used to identify risks and vulnerabilities in CRE markets. The framework is based on the approach used by the ESRB to analyse RRE markets and was developed jointly with the ECB.35 The CRE risk analysis framework has been modified to account for the specificities and data limitations of the CRE market, and also to better incorporate information available to national authorities. Consistent with the RRE framework, the CRE framework takes a mainly counter-cyclical perspective and focuses on identifying risks and vulnerabilities early – before they materialise. The risk analysis covers all 28 EU Member States, as well as Norway.
2.1 Analysing vulnerabilities in CRE: four “stretches’’
The risk analysis framework analyses CRE markets across four conceptual categories called “stretches”. The first three stretches capture the cyclical dynamics of CRE markets, while the fourth stretch captures the importance of CRE for financial stability and the real economy. The four stretches are as follows:
• The collateral stretch analyses CRE price growth and valuations with the goal of assessing risks related to asset price valuations and the potential for rapid price reversals. The price of CRE depends on various factors, such as the discounted value of the future stream of expected rents, risk and liquidity premia, or search-for-yield behaviour (see Section 1.1). These factors have the potential to change suddenly and substantially, resulting in sharp changes to income streams and prices. Rapid price reversals lead to lower collateral values, and in some cases higher loan-to-value ratios and larger investor losses. Such losses can have an impact on financial stability.
• The income and activity stretch quantifies the income-generating capacity of CRE and the level of activity in the sector. This stretch assesses the risks related to market liquidity and the sustainability of current investor portfolios. If investors are unable to generate a positive income stream, they will suffer a loss that could be transmitted to the financial sector (e.g. through a default on CRE loans) or to the real economy (through a decline in investment).
• The financing stretch looks at the financing of CRE activity with the goal of identifying risks related to funding dynamics and lending standards. It examines bank credit, non-bank sources of financing, and lending from domestic and foreign sources.
• Finally, the potential for spillovers stretch assesses the risk of negative spillovers from CRE to the broader financial sector and to the real economy. The analysis of spillovers is based on the measurement of CRE exposures of financial intermediaries and on the overall importance of the CRE sector to the economy.
35 See ESRB, “Vulnerabilities in the EU residential real estate sector”, Frankfurt am Main, November 2016.
2 Risk analysis framework

Report on vulnerabilities in the EU commercial real estate sector / November 2018 Risk analysis framework 22
There are close links between the four stretches and they should be examined together in order to generate a more complete picture of the risks and vulnerabilities in CRE markets. For example, the value of properties (collateral stretch) is closely connected to the income they produce (income and activity stretch). At the same time, even if rental incomes are high, prices will only be sustained if investors are able to secure the necessary financing to secure the purchases (financing stretch). Larger total exposures, in turn, increase the potential for spillovers to the financial system and to the real economy. Vulnerabilities in one stretch should therefore be examined together with vulnerabilities in the other stretches in order to gain a complete understanding of the vulnerabilities in the CRE market.
2.2 Sources of information: scoreboard and survey
Each stretch has been analysed on the basis of scoreboard indicators and a survey of national authorities. As the survey captures more granular information than the scoreboard, the two data sources are not directly comparable. However, combining the information from both sources helps to overcome some data limitations and to understand country-specific information.
2.2.1 Scoreboard
The scoreboard comprises a set of indicators for each stretch. The scoreboard takes the form of a heat map where each indicator is assessed against risk thresholds. Table 1 and Table A.1 in the Annex provide a reason for each indicator choice.36 Choice of indicator has been constrained by data availability.
36 Some of the indicators could be placed under more than one stretch. For example, yields and vacancy rates provide
information on both the collateral stretch and the income and activity stretch. Moreover, REIFs growth is an indicator in the financing stretch, but also could be seen as an indicator for the income and activity stretch. The interpretation of risk signals could also be different if indicators were placed under a different stretch. For example, low vacancy rates suggest low risks in the income and activity stretch, but they could suggest high risks in the collateral stretch, as CRE prices in that case would most probably be high and increased vacancy rates could lead to a fall in prices.

Report on vulnerabilities in the EU commercial real estate sector / November 2018 Risk analysis framework 23
Table 1 Overview and reason for scoreboard indicators
Stretch Indicator Reason
Collateral
1. Real CRE price index change over the last year
If price growth does not reflect underlying market fundamentals then the market may be prone to sudden, rapid adjustments.
2. Ratio of current real CRE price index to historical maximum
Prices close to previous peak levels could be unsustainable.
3. Real prime CRE price index change over the last year
If prime price growth does not reflect underlying market fundamentals then the market may be prone to sudden, rapid adjustments.
4. Ratio of current real prime CRE price index to historical maximum
Prime prices close to previous peak levels could be unsustainable.
5. Yield deviation from historical average
A decline in yields indicates a fall in the return generated by investors. Low returns could make the market more vulnerable to a sudden, rapid price adjustment if more profitable opportunities emerge.
6. Deviation between current and historical CRE yield and government bond spread
This indicator measures the size of the risk premium for CRE relative to its historical average. A low risk premium suggests that investors are not fully taking the risks related to CRE into account when purchasing assets, making investors more vulnerable to sudden, rapid price adjustments.
Income and activity
7. Prime yields (office and retail)
A decline in yields indicates a fall in the return generated by investors. Low returns could make the market more vulnerable to a sudden, rapid price adjustment if more profitable opportunities emerge.
8. Investment transaction growth over the last 12 months
High growth in investment transactions suggests that market activity and investor demand are increasing.
9. Investment transactions relative to GDP
Large and growing investment transactions and values relative to the size of the economy suggest a pickup in investor activity, which may result in overheating.
10. Vacancy rate (average across cities)
High vacancy rates suggest that end-user demand is low. As a consequence, investor returns are likely to be more fragile, and there is potential for oversupply.
Financing
11. Real estate investment fund growth over the last 12 months
Growth in real estate investment funds suggests that investors in these funds are becoming more active in the market and that their exposures are increasing.
12. Bank lending collateralised by CRE, annual growth
Increases in bank lending collateralised by CRE suggest that banks are becoming more active in the CRE market and that their exposures are increasing.
Potential for spillovers
13. Loans collateralised by CRE, as a proportion of total loans
A high share of CRE-collateralised loans of total loans suggests that banks are highly exposed to this market, and hence have a greater risk of making a substantial loss in the event that risks materialise.
14. Bank exposures collateralised by CRE, relative to Tier 1 capital
A high exposure to CRE compared with capitalisation suggests that banks are highly exposed to this market, and hence have a greater risk of making a substantial loss in the event that risks materialise.
15. Real estate investment fund size, relative to GDP
Large exposures of investment funds compared with the size of the economy suggest that the risks of spillovers to the real economy could also be high if CRE risks materialise.
16. Exposure of insurers as a proportion of total assets
Large exposures of insurers compared with their total assets suggest that they would be more exposed to CRE and hence risk suffering a relatively larger loss if CRE risks were to materialise.
17. Total market size estimate as a share of GDP
A large CRE market generates more opportunity for spillovers to the real economy if CRE risks materialise.

Report on vulnerabilities in the EU commercial real estate sector / November 2018 Risk analysis framework 24
For each indicator, thresholds are used to signal possible risks and vulnerabilities. The thresholds have been used in order to assign one of four categories of risk (no risk, low risk, medium risk or pronounced risk) to each indicator. Risk thresholds have been selected for each indicator by referring to statistical criteria or expert judgement. Where sufficient periods of historical data are available, statistical criteria have been used as a guiding principle. However, this is only feasible where data span back to least 2007. Data have been pooled across countries and over time to calculate the reference moments of the distribution. Risk thresholds are therefore generally set at around the 60th, 75th and 90th percentiles of the distribution (no risk below the 60th percentile, low risk below the 75th percentile, medium risk below the 90th percentile and pronounced risk above the 90th percentile).
Composite indicators summarise risks and vulnerabilities for each individual stretch. For each of the stretches, composite indicators were calculated in the form of a rating ranging from 0 (“no risk”) to 3 (“pronounced risk”). First, each individual indicator was transformed into a discrete variable ranging from 0 to 3 on the basis of the number of thresholds breached (0 = no thresholds breached, 1 = one threshold breached, 2 = two thresholds breached, 3 = all thresholds breached). The discrete transformations of all indicators in one stretch were then averaged into one composite indicator (or scoreboard average rating) for the stretch (ranging from 0 to 3).37 To judge the level of risk in each stretch the composite indicators were then also compared with composite risk thresholds. Risk thresholds for composite indicators are set on the basis of judgement, due to the lack of a reliable statistical approach. Specifically, it is assumed that an indicator flags “no risk” when it is below 0.8, “low risk” when it is at least 0.8 but below 1.4; “medium risk” when it is at least 1.4 but below 2.1; “pronounced risk” when it is at least 2.1.
2.2.2 Survey
The survey contains national authorities’ self-assessments. The survey was conducted in the first half of 2017 and updated in September 2017, and is divided into two sections:
• The first section asked national authorities to assign a risk rating (“no risk”, “low risk”, “medium risk” or “pronounced risk”) to the following potential sources of CRE related risks: overvaluation of CRE; rise in CRE prices; exuberance of lending dynamics; bank lending standards for CRE; risks associated with CRE financing from non-banks; risks related to the financial position of CRE investors; and risks related to income streams of CRE investors.
• The second section asked national authorities to assign a rating of the potential impact (“no impact”, “low impact”, “medium impact” or “pronounced impact”) that the materialisation of CRE-related risks could have on their financial systems and the real economy. Specifically, national authorities were asked to assess the potential impact through three types of exposures: the exposures of banks to CRE; the exposures of non-banks to CRE; and the potential for systemic spillovers (i.e. the size of CRE relative to GDP and interconnectedness with the rest of the economy and the financial system).
37 Where one or more answers are not available for one stretch, the average rating is based only on the available answers.
Where no answers are available for one stretch, the average rating reports “No data”.

Report on vulnerabilities in the EU commercial real estate sector / November 2018 Risk analysis framework 25
A specific definition of what the different risk categories mean was included in the survey questionnaire in order to ensure that different survey respondents did not attach different meanings to each of the questions when assigning ratings (see Table 2 for the predefined answers). National authorities were also given the possibility to briefly explain the ratings for each question, as they may use different indicators and analyses to assess the ratings.
The survey also contained some qualitative questions regarding broader trends and asked national authorities to highlight other risks in their CRE market. For example, some questions explicitly dealt with the cross-border aspects of CRE, while others referred to construction activity. The survey also asked national authorities to provide country-specific data, which could then be used in the analysis. Where data provided by national authorities were consistent with the data used for the scoreboard indicators, the scoreboard has included these figures. In the case of inconsistencies in respect of the underlying source, the additional data provided are reflected in the more granular information about the country provided in Annex A.2.
Composite indicators, similar to those used in the scoreboard, were calculated to summarise the risks for each individual stretch. The composite indicators are calculated in the form of a rating ranging from 0 (no risk) to 3 (pronounced risk), and are averages of the discrete variables for each individual answer.38 The composite indicators were then compared with risk thresholds, which are the same as the thresholds for the composite indicators used in the scoreboard (“no risk” when an indicator is below 0.8, “low risk” when it is at least 0.8 but below 1.4; “medium risk” when it is at least 1.4 but below 2.1; “pronounced risk” when it is at least 2.1).
38 Where one or more answers are not available for one stretch, the average rating is based only on the available answers.
Where no answers are available for one stretch, the average rating reports “No data”.

Report on vulnerabilities in the EU commercial real estate sector / November 2018 Contents 26
Table 2 Predefined answers in the survey
Stretch Question 0 – No risk 1 – Low risk 2 – Medium risk 3 – Pronounced risk
Collateral
Overvaluation of CRE CRE is assessed to be undervalued.
CRE is assessed to be broadly in line with fundamentals.
Tentative indications of overvaluation.
CRE is clearly overvalued.
Exuberance of CRE price dynamics
Prices are either declining or growing weakly
Prices are on a moderate increasing path
Prices are increasing by more than the macro environment justifies.
Price dynamics are clearly exuberant relative to the overall macro environment.
Income and activity
Risks related to the financial position of CRE investors – excessive indebtedness/leverage of CRE investors
CRE investors are de-leveraging The current level of indebtedness of CRE investors is clearly sustainable
If debt continues to grow at the current pace the level of indebtedness of CRE investors may soon become increasingly difficult to sustain.
The current level of indebtedness of CRE investors is unsustainable and vulnerable to negative shocks.
Income and activity stretch: risks related to income generation for CRE investors
The market is characterised by a situation of persistent undersupply of CRE spaces which will support the income streams of CRE investors
A situation of oversupply of CRE spaces seems unlikely. There are therefore few risks to the income streams of CRE investors
The risk of a situation of oversupply of CRE spaces in the medium term (within three years) exists but appears to be contained. Risks to the income stream of CRE investors are present.
The risk of a situation of oversupply of CRE spaces in the medium term (within three years) appears to be material. Risks to the income stream of CRE investors are significant.
Financing
Exuberance of lending dynamics Lending to CRE is either declining or growing weakly
CRE lending growth is moderate or appears consistent with the macro environment
CRE lending growth appears above what may be considered consistent with the macro environment.
CRE lending growth appears clearly exuberant relative to the macro environment.
Risks related to bank lending standards for CRE
Lending standards are already tight
Lending standards are being gradually loosened
Lending standards already appear to be relatively loose.
Lending standards are too loose given the vulnerabilities in the CRE sector.
Risks associated to CRE funding sources other than bank lending
CRE has problems in attracting sufficient non-bank funding
CRE currently relies on a well-diversified and stable set of funding sources
There are signs of a rapid and unbalanced growth in specific non-bank sources of funding, which could be vulnerable to a reversal in the future.
CRE is already over-reliant on non-bank sources of finance which are vulnerable to an abrupt reversal.

Report on vulnerabilities in the EU commercial real estate sector / November 2018 Contents 27
Stretch Question 0 – No risk 1 – Low risk 2 – Medium risk 3 – Pronounced risk
Potential for spillovers
Exposures of banks to CRE – focus on domestic CRE
Banks' risk exposure to CRE is small and not concentrated
Banks' risk exposure to CRE is significant but banks are managing their risk exposures to CRE appropriately
There are signs that banks may be underestimating their risk exposures to CRE.
The banking sector is excessively exposed to CRE risks.
Exposures of non-banks to CRE – focus on domestic CRE
Non-banks’ exposure to CRE risks is small and not concentrated
Non-banks are managing their risk exposures to CRE appropriately
There are signs that non-banks may be underestimating their risk exposures to CRE.
Non-banks are excessively exposed to CRE risks.
Potential for spillovers: size of CRE in the overall economy and interconnectedness of CRE with the financial system and other sectors of the economy – focus on domestic CRE
The potential for negative spillovers from CRE is negligible
The potential for negative spillovers from CRE is limited but present.
The potential for negative spillovers from CRE is important enough to warrant specialised monitoring from a financial stability perspective.
The potential for negative spillovers from CRE is considerable. CRE is large and interconnected with the financial system and the rest of the economy.

Report on vulnerabilities in the EU commercial real estate sector / November 2018 Risk analysis framework 28
2.3 Data gaps and limitations of the analysis
As data on CRE are generally scarce, incomplete, and/or inconsistent across countries, a number of caveats apply to the analysis. For example, the supervisory data used in the analysis for banks and non-banks are imperfect.39 In addition, some of the definitions used for the indicators in the scoreboard are not consistent with the CRE definition from the ESRB recommendation on closing data gaps.40 As the ESRB recommendation has not yet been implemented, the framework relies on the currently available data. Furthermore, CRE markets are characterised by a high degree of heterogeneity across different types of CRE within a country (although there are also large differences between regions and countries) with regard to the importance and features of the market (see also Section 1.1). Some of the indicators therefore have better data coverage or a higher degree of accuracy for some countries than for others. There are also relatively few CRE transactions in some countries, which complicates the analysis.
Consequently, it has been necessary to rely on proxies in many cases. Prime yields and price indices have been used to track recent developments in some countries. Some of these proxies rely on data collected from private sources, and the methodologies underlying their collection have not been harmonised. The representativeness and comparability across countries of the data collected from private sources also still needs to be tested. Where possible, proxies have therefore been supplemented by information provided by the national authorities through the survey. Across the EU, even proxies are sometimes unavailable for some countries (Chart 8). To overcome some of the drawbacks with regard to the existing data, different sources of information and different definitions of CRE are often used in the analysis to describe the same features of the CRE sector.41
39 For example, the scoreboard indicator for CRE-collateralised bank loans is based on FINREP data. The loans include all
loans collateralised by CRE, including owner-occupied CRE, but exclude the volume of loans collateralised by RRE used by housing companies (although this would be a part of CRE according to the ESRB definition). In some countries the quality of the aggregate FINREP data is significantly influenced by the reporting of a few banks which have a large impact on the aggregate figure. The figures should therefore be treated with caution (see Table A.1 in the Annex for a complete discussion of the caveats regarding the data.).
40 In the ESRB, “Recommendation ESRB/2016/14 on closing real estate data gaps”, Frankfurt am Main, October 2016, CRE is defined as follows: “…any income-producing real estate, either existing or under development, and excludes: (a) social housing; (b) property owned by end-users; (c) buy-to-let housing. If a property has a mixed CRE and RRE use, it should be considered as different properties (based for example on the surface areas dedicated to each use) whenever it is feasible to make such a breakdown; otherwise, the property can be classified according to its dominant use.”
41 For example, for bank lending, data for both loans collateralised by CRE and NFC loans to real estate activities and construction are used, while data from two different private data providers are used for both yields and vacancy rates.

Report on vulnerabilities in the EU commercial real estate sector / November 2018 Risk analysis framework 29
Chart 8 Number of missing scoreboard indicators and survey answers by country
(x-axis: number of scoreboard indicators that could not be calculated, and number of survey questions with no response)
Sources: ECB and ESRB, scoreboard and survey results. Notes: The chart shows the number of indicators without data for the indicators used in the scoreboard and the predefined survey answers. NO is not in the EU and only limited data are available for the scoreboard. However, NO and SK have provided additional data which are captured in Annex A.2.
The scarcity of data affects any overall risk analysis at the country level. For example, it is not possible to conduct a comprehensive analysis of risks and vulnerabilities in countries where data gaps are significant. In addition, the complex interactions between the stretches complicate the overall risk assessment of CRE markets in any given country, even when all data are available. Where data gaps exist, these interactions make the signals even more difficult to interpret. The numerous data gaps, data quality issues and differences in data definitions make it difficult to describe vulnerabilities accurately and compare risks in and across national markets. In addition, countries are in different phases of the economic and the financial cycle. Therefore, any conclusions drawn from these data are tentative.
Due to the data limitations, the risk analysis is performed stretch-by-stretch, without proposing an overall risk rating for individual countries. For each stretch, the vulnerabilities are identified in individual countries and across countries based on the scoreboard and the survey. The analysis is carried out without prioritising any stretches and without proposing an overall risk rating for a country’s CRE sector.
The limitations of the analysis illustrate the importance of the initiatives under way to harmonise definitions and improve data availability. Most notably, the ESRB issued its
0 2 4 6 8 10 12 14 16 18
MTHRCYSI
ROSKEELVBGLTDKLUFI
ESGRPTBESEATCZFRHUIE
PLDEIT
NLUK
Collateral stretch - scoreboardCollateral stretch - surveyIncome and activity stretch - scoreboardIncome and activity stretch - survey
Financing stretch - scoreboardFinancing stretch - surveyPotential for spillovers stretch - scoreboardPotential for spillovers stretch - survey

Report on vulnerabilities in the EU commercial real estate sector / November 2018 Risk analysis framework 30
recommendation on closing real estate data gaps in 2016.42 A dedicated follow up of the recommendation will significantly improve the analysis of CRE risks and vulnerabilities at both the EU level and the country level. Improvements to data and the risk analysis will also expand the policy analysis, although it will take some time to fill the data gaps. Given the risks to financial stability that CRE can pose, an analysis based on existing information is warranted.
42 See “Recommendation ESRB/2016/14 on closing real estate data gaps”. Two groups were established concurrently to
look at the issues raised by the ESRB recommendation: an ECB/Eurostat joint expert group for the market indicators and an STC task force for the financial variables.

Report on vulnerabilities in the EU commercial real estate sector / November 2018 Risk analysis 31
This chapter presents the risk analysis, which includes an analysis of both common trends in Europe and country-specific vulnerabilities. More granular information from the scoreboard and the survey at the country level can be found in Annex A.2.
3.1 CRE price trends (collateral stretch)
The widespread search for yield across asset classes in the low interest rate environment has also affected the EU CRE market. Many countries experienced significant falls in CRE prices during the global financial crisis. Due to the strong growth in overall CRE prices in the EU in recent years (see Chart 5 in Section 1.1) real prices are close to the peak they reached before the crisis (Chart 9). In fact, all countries, except the Czech Republic, Denmark, Ireland and Hungary, have a real price-to-peak ratio of above 70% (see Table 3, which shows the scoreboard indicators and survey answers for this stretch). In particular, France, Germany and Sweden are experiencing peak-level or close to peak-level real CRE prices and rapidly increasing real prices in their overall CRE market. These high prices are combined with historically low CRE yields in almost all EU countries, suggesting that investors expect future rents to be high, or risk premia to be low, or the low interest rate environment to persist. Thus, if risk premia adjust or growth prospects decline, prices will need to adjust for investors to maintain their long-run expected returns.
Chart 9 Real CRE prices in the EU
(index: Q1 2006 = 100)
Source: ECB calculations. Notes: CRE prices are deflated by CPI. For CRE overall prices, available headline data are generally compiled from commercial data supplied by MSCI. Estimated prime retail and office prices are from an ECB calculation based on Jones Lang LaSalle data and SDW, and prime overall is an average of the retail and the office capital value indices. Final observation: Q3 2017 for CRE (overall) and Q4 2017 for prime CRE.
CRE prices are increasing more rapidly in prime markets across the EU (Chart 9), and there are clear signs of overvaluation. Well-located, high-quality properties, especially offices in capitals and other major cities, appear to be a particular target for investors (Chart 13). In all except
60
100
140
180
220
260
2006 2007 2008 2009 2010 2011 2012 2013 2014 2015 2016 2017 2018
CRE (overall)Prime CRE (overall)
Prime CRE (office)Prime CRE (retail)
3 Risk analysis
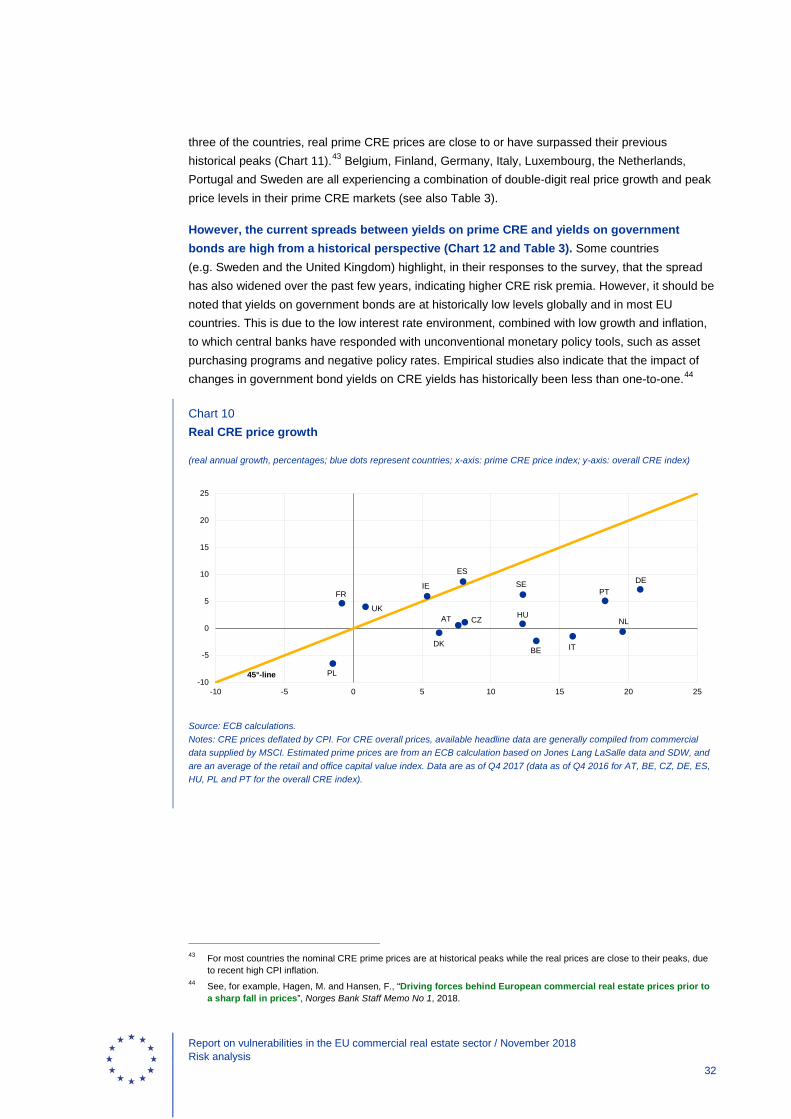
Report on vulnerabilities in the EU commercial real estate sector / November 2018 Risk analysis 32
three of the countries, real prime CRE prices are close to or have surpassed their previous historical peaks (Chart 11).43 Belgium, Finland, Germany, Italy, Luxembourg, the Netherlands, Portugal and Sweden are all experiencing a combination of double-digit real price growth and peak price levels in their prime CRE markets (see also Table 3).
However, the current spreads between yields on prime CRE and yields on government bonds are high from a historical perspective (Chart 12 and Table 3). Some countries (e.g. Sweden and the United Kingdom) highlight, in their responses to the survey, that the spread has also widened over the past few years, indicating higher CRE risk premia. However, it should be noted that yields on government bonds are at historically low levels globally and in most EU countries. This is due to the low interest rate environment, combined with low growth and inflation, to which central banks have responded with unconventional monetary policy tools, such as asset purchasing programs and negative policy rates. Empirical studies also indicate that the impact of changes in government bond yields on CRE yields has historically been less than one-to-one.44
Chart 10 Real CRE price growth
(real annual growth, percentages; blue dots represent countries; x-axis: prime CRE price index; y-axis: overall CRE index)
Source: ECB calculations. Notes: CRE prices deflated by CPI. For CRE overall prices, available headline data are generally compiled from commercial data supplied by MSCI. Estimated prime prices are from an ECB calculation based on Jones Lang LaSalle data and SDW, and are an average of the retail and office capital value index. Data are as of Q4 2017 (data as of Q4 2016 for AT, BE, CZ, DE, ES, HU, PL and PT for the overall CRE index).
43 For most countries the nominal CRE prime prices are at historical peaks while the real prices are close to their peaks, due
to recent high CPI inflation. 44 See, for example, Hagen, M. and Hansen, F., “Driving forces behind European commercial real estate prices prior to
a sharp fall in prices”, Norges Bank Staff Memo No 1, 2018.
AT
BE
DEES
FRIE
IT
NL
PT
CZ
DK
HU
PL
SE
UK
-10
-5
0
5
10
15
20
25
-10 -5 0 5 10 15 20 25
45°-line

Report on vulnerabilities in the EU commercial real estate sector / November 2018 Risk analysis 33
Chart 11 Real prime CRE price growth and price levels relative to historical values
(percentages; blue dots represent countries; x-axis: prime CRE annual price growth (2016-2017); y-axis: ratio of current price to historical maximum)
Source: ECB calculations. Notes: CRE prices deflated by CPI. Estimated prime prices are from an ECB calculation based on Jones Lang LaSalle data and SDW, and are an average of the retail and office capital value index. Data are as of Q4 2017. The ratios of current prices to historical maximums are based on a data series starting in 1998 for all countries except Finland (1999), Greece (1999), Hungary (2002) and Portugal (2003).
Chart 12 Yields on prime CRE in the EU and on German government bonds
(percentages)
Sources: Bloomberg and Jones Lang LaSalle. Notes: Ten-year German government bond yield. See Table A.1, indicator 5, for more details on the yield calculation. Last observation: Q4 2017.
ATBE DE
ESFR
IE
IT NLPTCZDK
HU
SEUK
FI
GR
LU
PL
50
60
70
80
90
100
-10 -5 0 5 10 15 20 25
0
2
4
6
8
10
12
2000 2001 2002 2003 2004 2005 2006 2007 2008 2009 2010 2011 2012 2013 2014 2015 2016 2017
Yield prime CREYield German government bonds
Average prime CREMinimum and maximum prime CRE

Report on vulnerabilities in the EU commercial real estate sector / November 2018 Risk analysis 34
Chart 13 Yields on prime CRE in some large European cities
(percentages)
Source: CBRE Research. Notes: CBRE estimates illustrating current yields for prime offices. For London the yield is an average of City and West End.
The combination of record high prices and low CRE yields constitutes a clear source of vulnerability for financial stability in several EU countries. To the extent that the historical pre-crisis peaks may have reflected overvaluations, it should be noted that in several EU countries valuations have already surpassed those of pre-crisis peaks and are at all-time high levels, particularly in the prime segment. It is also important to remember that even those countries with relatively low price indices are at risk of price corrections if investors’ expectations change, as discussed earlier. Moreover, while it is difficult to determine overvaluation in real time, around one-third of national authorities in the EU report that either CRE prices may not be on a sustainable growth path or they are already showing signs of overvaluation. In France and the United Kingdom, for example, the authorities report that valuations in some segments in Paris and London appear to be stretched. While high valuations do not necessarily lead to large falls in CRE prices, they do pose risks to financial stability and the real economy by increasing the probability of such an occurrence.
0
1
2
3
4
5
6
7
Ham
burg
Mun
ich
Paris
Berli
n
Fran
kfur
t
Mila
n
Stoc
khol
m
Amst
erda
m
Mad
rid
Lond
on
Dub
lin
Barc
elon
a
Brus
sels
War
saw
Q1 2008Q1 2013Q1 2018

Report on vulnerabilities in the EU commercial real estate sector November 2018 Contents 35
Table 3 Scoreboard indicators and survey answers for the collateral stretch
Country
Scoreboard Survey Average rating
1 2 3 4 5 6 1.a 1.b
Real CRE price index growth over
the last year, %
Ratio of current real CRE price
index to historical maximum, %
Real prime CRE price index
growth over the last year, %
Ratio of current real prime CRE price index to
historical maximum, %
Yield deviation from historical
average, in basis points
Deviation between current
and historical CRE yield and
gov. bond spread, in basis points
Over-valuation of CRE
Exuberance of CRE price dynamics Score-board Survey
AT 0.6 85 8 99 -107 200 1 1.2 1
BE -2.3 76 13 100 -162 131 0 1.3 0
BG 0 1 0.5
CY 1 0 0.5
CZ 1.1 69 8 100 -268 -33 2 2 1.7 2
DE 7.2 100 21 100 -138 133 2 2 2.5 2
DK -0.8 63 6 100 -168 123 1 1.2 1
EE 1 1
ES 8.7 74 8 100 -168 84 0 1 1.7 0.5
FI 17 100 -184 89 1 2.0 1
FR 4.6 100 -1 99 -198 66 3 1 1.8 2
GR 14 56 -4 357 0 0 0.5 0
HR 0 0
HU 0.8 60 12 62 -199 298 1 1 0.8 1
IE 5.9 52 5 55 -98 275 1 1 0.8 1
IT -1.5 76 16 100 -116 102 0 0 1.2 0
LT 1 1 1
LU 11 100 -167 1 1 2.7 1

Report on vulnerabilities in the EU commercial real estate sector November 2018 Contents 36
Country
Scoreboard Survey Average rating
1 2 3 4 5 6 1.a 1.b
Real CRE price index growth over
the last year, %
Ratio of current real CRE price
index to historical maximum, %
Real prime CRE price index
growth over the last year, %
Ratio of current real prime CRE price index to
historical maximum, %
Yield deviation from historical
average, in basis points
Deviation between current
and historical CRE yield and
gov. bond spread, in basis points
Over-valuation of CRE
Exuberance of CRE price dynamics Score-board Survey
LV 1 0 0.5
MT 1 1
NL -0.6 78 20 100 -166 114 2 1 1.3 1.5
NO 2 2 2
PL -6.5 73 -1 84 -249 64 0 0.7 0
PT 5.1 79 18 100 -211 82 1 1 1.7 1
RO
SE 6.2 100 12 100 -150 110 2 1 2.2 1.5
SI 1 0 0.5
SK 1 1
UK 4.0 73 1 98 -135 125 2 0 1.3 1
Thresholds
Low 1.0 80 5 80 -45 25 1.0 1.0 0.8 0.8
Medium 3.0 90 10 90 -70 -10 2.0 2.0 1.4 1.4
High 7.0 95 20 95 -130 -60 3.0 3.0 2.1 2.1
Sources: ECB and ESRB, scoreboard and survey results. Notes: See Table 2 in Section 2.2 and Table A.1 in the Annex for further details of survey questions and scoreboard indicators. The figures in the scoreboard are based on common data sources for the purposes of consistency. However, some countries have provided additional data. According to the data for NO from Norges Bank, the annual growth rate for the real CRE price index for high-standard offices in Oslo is 5.8%, CRE yield is 199 basis points below the historical average and the spread between CRE and sovereign yields is 10 basis points below the historical average. According to the data for SK from Nàrodnà Banka Slovenska, the spread between CRE and sovereign yields is 212 basis points below the historical average. Some other countries emphasise that the CRE price index only covers a limited share of total CRE markets and so the figures might not be representative. See Annex A.2 for more country-specific information.

Report on vulnerabilities in the EU commercial real estate sector / November 2018 Contents 37
3.2 CRE sector activity (income and activity stretch)
Investor activity in CRE is at high levels and is increasing, suggesting that high demand is contributing to CRE price growth. Current historically low prime CRE yields are putting pressure on investors’ income streams. However, spreads between yields on prime CRE and yields on government bonds have increased (see Section 3.1), suggesting that CRE investments are still relatively attractive to yield-seeking investors. As a consequence, investor activity is high in CRE markets across Europe. While the investment market in the United Kingdom showed some weakness in anticipation of and following the referendum on EU membership, almost all countries have experienced rapid growth in investment transactions over the past few years (Chart 14). For example, Austria, Finland, Portugal, Denmark, Hungary and Romania had all experienced an annual increase in CRE transactions of over 50% at the end of September 2016, and growth rates of 25-50% were observed in seven other countries (Table 4).
Chart 14 CRE investment transactions by country
(EUR millions)
Source: Real Capital Analytics (RCA). Notes: Includes property or portfolio sales of USD 10 million or greater. Last observation: Q1 2018.
The increase in CRE transactions across Europe has, to a large degree, been driven by the office segment (Chart 15). Even though high price growth has been seen in the prime retail segment (see Section 3.1), the overall retail market appears to be less of a target for investors as transaction volumes have fallen over the past few years. More recently, transaction volumes in the industrial segment have increased rapidly. The changing composition of property types, i.e. from retail to industry, might reflect the increase of e-commerce.
0
50,000
100,000
150,000
200,000
250,000
2008 2009 2010 2011 2012 2013 2014 2015 2016 2017 2018
EuropeEurope excl. UKUK
GermanyFrance

Report on vulnerabilities in the EU commercial real estate sector / November 2018 Contents 38
Chart 15 European CRE investment transactions by property type
(EUR millions)
Source: Real Capital Analytics (RCA). Notes: Includes property or portfolio sales of USD 10 million or greater. Last observation: Q1 2018.
While large and growing CRE transactions improve liquidity, they can also indicate exuberant market behaviour. This is particularly notable in cases where growth is combined with a large amount of existing CRE transactions. For example, in Finland, Ireland, the Netherlands and Portugal CRE transactions already exceed 1.5% of GDP and grew at an annual rate of close to or over 40% in 2016. On the other hand, sharp growth in small markets can sometimes be the result of only a few large transactions which, while less likely to cause systemic issues, may result in significant liquidity risk.
At the same time, vacancy rates remain relatively high, giving some indication that much of the demand is investor driven rather than user driven. Although there is significant heterogeneity across countries and across subsectors, vacancy rates are medium or high in almost half of the countries for which data are available. In Finland, Italy and Poland, average vacancy rates in major cities exceed 10% (Table 4). Even though the average vacancy rate for offices in Europe has decreased over the past few years (Chart 16), it remains above its historical average. Some countries highlight the possibility that the relatively high level of vacancy rates could, to some extent, be due to structural changes in the economy. For example, the increasing role of e-commerce, as well as shared offices and co-working spaces, is reducing the demand for CRE premises from the corporate sector. Other countries highlight the fact that data for vacancy rates are only available for limited parts of the CRE market.
0
25,000
50,000
75,000
100,000
125,000
150,000
2008 2009 2010 2011 2012 2013 2014 2015 2016 2017 2018
RetailOfficeIndustrial
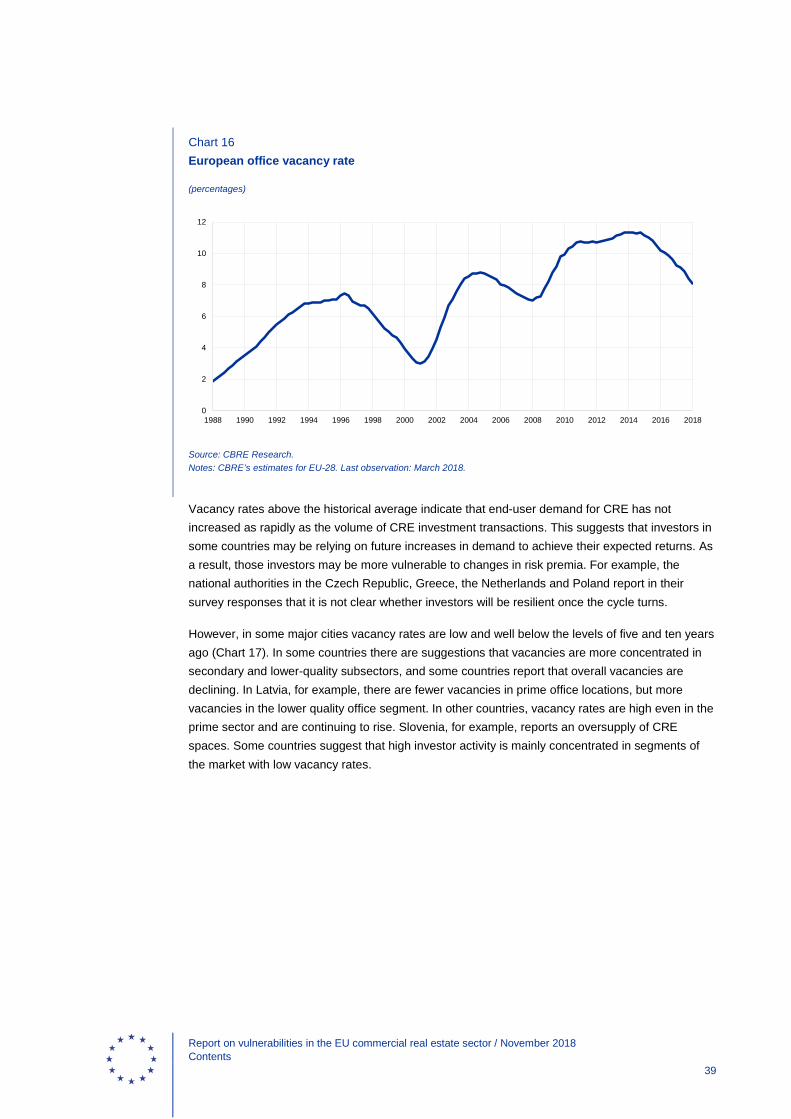
Report on vulnerabilities in the EU commercial real estate sector / November 2018 Contents 39
Chart 16 European office vacancy rate
(percentages)
Source: CBRE Research. Notes: CBRE’s estimates for EU-28. Last observation: March 2018.
Vacancy rates above the historical average indicate that end-user demand for CRE has not increased as rapidly as the volume of CRE investment transactions. This suggests that investors in some countries may be relying on future increases in demand to achieve their expected returns. As a result, those investors may be more vulnerable to changes in risk premia. For example, the national authorities in the Czech Republic, Greece, the Netherlands and Poland report in their survey responses that it is not clear whether investors will be resilient once the cycle turns.
However, in some major cities vacancy rates are low and well below the levels of five and ten years ago (Chart 17). In some countries there are suggestions that vacancies are more concentrated in secondary and lower-quality subsectors, and some countries report that overall vacancies are declining. In Latvia, for example, there are fewer vacancies in prime office locations, but more vacancies in the lower quality office segment. In other countries, vacancy rates are high even in the prime sector and are continuing to rise. Slovenia, for example, reports an oversupply of CRE spaces. Some countries suggest that high investor activity is mainly concentrated in segments of the market with low vacancy rates.
0
2
4
6
8
10
12
1988 1990 1992 1994 1996 1998 2000 2002 2004 2006 2008 2010 2012 2014 2016 2018

Report on vulnerabilities in the EU commercial real estate sector / November 2018 Contents 40
Chart 17 Office vacancy rate in some large European cities
(percentages)
Source: CBRE Research. Notes: CBRE’s estimates. For London the vacancy rate is an average of City and West End.
While there is limited data on construction activity, some countries report that the development of new construction projects appears to be somewhat subdued. Only a few countries (Estonia, Ireland, Lithuania, Slovakia, Poland and the United Kingdom) indicate in their responses to the survey that construction activity is sufficiently significant to have a potential impact on net market supply in the medium term. In addition, the national authorities in Belgium indicate that their current situation of oversupply in the non-prime office market is likely to persist due to structural changes in the country’s economy (e.g. reduced demand for office space due to changes in the labour force, increased teleworking, and flexible offices). The remaining countries that provided information all indicated that CRE construction was either low or stable. Even in countries where vacancy rates are low (e.g. Sweden and Norway), the number of CRE building permits has remained more or less unchanged over the past few years. While a muted supply response reduces the risk associated with the current high vacancy rates, undersupply would push medium-term prices higher and could have an effect on economic efficiency in the longer run. In addition, undersupply in central business districts and other prime segments (which can be observed in some countries in Europe) could push investors to invest in more peripheral and risky areas where there is greater availability of land.
0
4
8
12
16
20
Berli
n
Mun
ich
Lond
on
Ham
burg
Paris
Amst
erda
m
Dub
lin
Brus
sels
Fran
kfur
t
Barc
elon
a
Mad
rid
War
saw
Mila
n
Q1 2008Q1 2013Q1 2018

Report on vulnerabilities in the EU commercial real estate sector / November 2018 Contents 41
Table 4 Scoreboard indicators and survey answers for the income and activity stretch
Country
Scoreboard Survey Average rating
7 8 9 10 1.f 1.g
Prime yields
(office and retail), %
Investment transactions growth over the last 12 months, %
Investment transactions as share of
GDP, %
Vacancy rate (avg.
across cities), %
Risks related to the financial
position of CRE investors
Risks related to income generation
for CRE investors
Score-board Survey
AT 4.00 78.4 1.4 5.3 1 1 2.0 1
BE 3.88 42.1 0.9 8.8 1 2 1.8 1.5
BG 1 1 1
CY
CZ 4.18 48.5 0.0 2 2 1.0 2
DE 3.08 23.4 1.6 5.3 1 1 1.5 1
DK 3.50 52.0 0.3 6.2 2 1.5 2
EE 1 2 1.5
ES 3.45 46.8 0.2 8.5 1.3
FI 3.80 52.4 2.9 13.7 1 2.8 1
FR 2.88 18.6 1.2 5.5 1 1 1.3 1
GR 6.38 -64.0 0.0 3 0.0 3
HR 0 1 0.5
HU 5.63 63.7 0.0 1 1 0.7 1
IE 3.75 45.5 1.6 9.3 1 2.0 1
IT 3.58 20.9 0.5 12.0 0 1 1.8 0.5
LT 1 2 1.5
LU 3.88 7.7 1.9 1 0 2.0 0.5
LV 1 0 0.5
MT
NL 3.25 38.9 1.9 7.4 1 2 1.8 1.5
NO 6.8 1 1 0.0 1
PL 4.95 27.5 0.5 12.9 2 3 1.3 2.5
PT 4.63 57.9 2.7 1.8
RO 50.2 2 1 2.0 1.5
SE 3.50 32.0 0.0 1 1 1.3 1
SI 2 2
SK 1 1
UK 2.75 16.7 0.2 6.7 1 2 0.8 1.5

Report on vulnerabilities in the EU commercial real estate sector / November 2018 Contents 42
Country
Scoreboard Survey Average rating
7 8 9 10 1.f 1.g
Prime yields
(office and retail), %
Investment transactions growth over the last 12 months, %
Investment transactions as share of
GDP, %
Vacancy rate (avg.
across cities), %
Risks related to the financial
position of CRE investors
Risks related to income generation
for CRE investors
Score-board Survey
Thresholds
Low 5.00 25.0 0.30 8.0 1.0 1.0 0.8 0.8
Medium 4.60 50.0 0.85 10.0 2.0 2.0 1.4 1.4
High 4.15 80.0 1.35 12.0 3.0 3.0 2.1 2.1
Sources: ECB and ESRB, scoreboard and survey results. Notes: See Table 2 in Section 2.2 and Table A.1 in the Annex for further details on survey questions and scoreboard indicators. The figures in the scoreboard are based on common data sources for consistency purposes, although some countries have provided additional data. According to data for DE from Deutsche Bundesbank, the vacancy rate across 127 cities was 4.8% in 2017. According to data for FI from Suomen Pankki, the investment transactions growth rate was 36.5% in 2016 and the vacancy rate in the Helsinki metropolitan area was 9.3% on average in Q2 2017. According to data for HU from Magyar Nemzeti Bank, the average office vacancy rate in Budapest was 7.3% in Q1 2018. According to data for NO from Norges Bank, prime yields for offices are 3.75%. According to data for PL from Narodowy Bank Polski, the value of investment transactions was almost the same in 2017 as in 2016 and the vacancy rate for retail spaces was 4%. According to data for SK from Nàrodnà Banka Slovenska, prime yields are 6.50%, the vacancy rate is 6.17%, the investment transactions growth rate is −38.5% and investment transactions represent 1.1% of GDP. According to data for the UK from the Bank of England, the investment transactions growth rate is −5% and investment transactions represent 2.7% of GDP. See Annex A.2 for more country-specific information.
3.3 Bank and non-bank financing of CRE (financing stretch)
High and rising debt and real estate prices, combined with a loosening of credit standards, have often been identified as the main underlying vulnerability in past systemic financial crises. The currently available bank lending data cover either all CRE-collateralised loans, or loans to non-financial companies involved in real estate activities and the construction sector (i.e. not only loans dedicated to CRE activities). This hampers the adequate monitoring of CRE credit provision. However, from these figures it appears that CRE-collateralised loans have increased faster than the general macroeconomic conditions in some countries justify (Chart 18). For example, Austria, Finland, France and Ireland all experienced annual lending growth rates that were greater than 25%.45 In a number of other countries (e.g. Croatia, Malta and Slovakia), loans collateralised by CRE have also grown robustly. In addition, Lithuania and Slovakia indicate in their survey responses that lending has increased faster than the macroeconomic environment justifies (Table 5). However, in some countries (e.g. France) the amount of CRE-collateralised loans is small compared with total bank lending (see Table 6). Strong CRE lending was also observed in Belgium, where credit register data indicated that bank lending to non-financial corporations active in the real estate and construction sectors has increased faster than lending to NFCs overall over the past 10-15 years.
45 However, as can be seen in Annex A.2, data provided by the Dutch authorities provide a more muted picture of lending
growth than can be observed on the scoreboard. Moreover, the strong growth rate in Austria in Q4 2017 is due to improvements in data granularity and data mapping quality, and does not necessarily reflect an increase in CRE lending activity (in Q4 2016 the annual growth rate was 8%).

Report on vulnerabilities in the EU commercial real estate sector / November 2018 Contents 43
Chart 18 Growth in banks’ CRE-collateralised lending and real estate investment funds
(annual growth, percentages; blue dots represent countries); x-axis: real estate investment funds growth; y-axis: CRE lending growth)
Sources: ECB Investment fund series and ESRB, based on aggregated supervisory information (FINREP) provided by the EBA. Notes: For each country the year-on-year growth rate is calculated for the following FINREP series from Q4 2017: Loans and advances “collateralised by commercial immovable property” (FINREP Template F_18.00.a data in Row 140, Column 010). Figures across countries might differ. Data for real estate investment funds as of December 2017. Real estate investment trusts (REITs) are included in these data for some but not all countries as they are defined by national legislation and there is no harmonised Europe-wide definition for these types of entities. The indicator should therefore be seen as a proxy for CRE investment activities.
In some EU countries lending growth for real estate activities, including CRE, is strong. There are, however, no significant indications of an overall credit boom in the EU. While in some EU countries lending growth is strong, a number of countries are experiencing negative growth in CRE-collateralised bank lending. Data on loans for real estate activities and construction (which include lending for both CRE and RRE construction) also indicate that credit growth is muted in around half of the countries (Chart 19). In addition, most countries indicate in their survey responses that lending is in line with developments in the macroeconomic environment and that banks are managing their exposures appropriately. Likewise, while there are only limited data on bank lending standards, most countries report that bank lending standards remain more prudent than they were prior to the 2007 crisis. While there are some signs from the survey that lending standards are loosening gradually, standards for CRE lending do not appear to have loosened relative to standards for lending to non-financial corporations in general.
AT
BG
CZDE
EE
ES
FI
FR
GR HU
IE
IT
LTNL
PL
PT
SK
UK
-20
-10
0
10
20
30
40
50
60
-20 -10 0 10 20 30 40

Report on vulnerabilities in the EU commercial real estate sector / November 2018 Contents 44
Chart 19 Total growth in banks’ lending to real estate activities and construction
(annual growth, percentages)
Source: ESRB, based on aggregated supervisory information (FINREP) provided by the EBA. Notes: For each country the annual growth rate, calculated based on two-year growth, is calculated for the following FINREP series from Q4 2017: Gross carrying amount to non-financial corporations in sectors “F Construction” and “L Real estate activities” (FINREP Template F_20.07 data in Row 060 and 110, Column 010). The growth rate is the growth for the two sectors added together. Data are country aggregated on the basis of the residence of the immediate counterparty. Figures across countries and the sample of banks across time might differ. See the EBAs Risk Dashboard for Q4 2017 for more details.
Market-based funding has increased rapidly and is an important source of funding in some countries. Bond issuance by CRE corporations in the euro area has increased over the past few years from its low levels during and after the global financial crisis. Some countries also report in the survey that market-based funding is significant and increasing. Sweden, for example, reports that bank loans and market-based funding are more or less equally common financing sources for the largest CRE companies and that both sources have increased over the past year.
Non-banks and international investors appear to be playing a larger role in CRE markets than they did before the crisis. For example, REIFs and REITs are playing an increasingly important role in channelling funding for CRE investments in many countries. The assets managed by REIFs are largest, as a proportion of GDP, in Luxembourg, where many international funds are domiciled with investments in several different countries, although funds are also large relative to GDP in the Netherlands, Germany and Portugal (see Table 6). In Austria, Bulgaria, the Czech Republic, Estonia, Finland, France, Hungary, Ireland, Italy, Lithuania and Slovakia growth in REIFs has exceeded 10% in the past year (Chart 18). However, in some countries (e.g. Portugal) REIFs have declined since the global financial crisis of 2007-09 and in a number of countries REIFs are small in comparison with GDP (e.g. the Czech Republic and Hungary). Non-banks and international investors are also playing an important role in the CRE bond markets. Insurance companies, pension funds and investment funds are the largest holders of euro area CRE bonds.
Almost half of the EU countries highlighted that an increasing proportion of investor activity has been undertaken by foreign investors (Chart 20). Almost half of the countries also indicated in their survey responses that foreign investors already play a significant role in their individual CRE markets. Europe remains, according to Cushman & Wakefield, the most attractive cross-border
-20
-15
-10
-5
0
5
10
15
20
FI ES FR EE SK LU BE CZ NO LT SE AT LV DK DE NL PL GR MT HU SI PT BG IT IE UK CY RO HR
ConstructionRE activities

Report on vulnerabilities in the EU commercial real estate sector / November 2018 Contents 45
market in the world owing to its wide range of well-established, liquid markets.46 Information from Real Capital Analytics (RCA) indicates that more than half of the investor activity in Europe derives from non-domestic sources, and this share has increased in recent years (Chart 21). This increase in activity has been particularly high among investors from outside Europe. In 2017, more than 60% of investor activity from non-domestic sources stemmed from investors from outside Europe – mainly US and Asian investors – while less than 40% was from cross-border investor activity inside Europe.
Chart 20 Changing role of foreign investors in CRE markets
(share of countries)
Sources: ECB and ESRB survey results. Note: Share of countries answering the question on the change in the role of foreign investors in recent years in their CRE market.
46 See Cushman and Wakefield (2017), “Investment Atlas summary 2017”.
Less active
No change Moderately larger
Substantially more active

Report on vulnerabilities in the EU commercial real estate sector / November 2018 Contents 46
Chart 21 CRE transactions in Europe by investor origin
(left-hand scale: EUR millions; right-hand scale: percentages)
Source: Real Capital Analytics (RCA). Note: Last observation 2017.
The greater role played by non-banks (especially by REIFs and REITs) has increased the proportion of equity financing in CRE markets. Estimates from CBRE indicate that investments in CRE were mainly financed by debt until the global financial crisis. After the crisis, equity become a more important financing source and is still slightly more important than debt (Chart 22). The increase in equity in CRE transactions may be due to increasing CRE prices, which have increased existing investors’ equity substantially due to valuation effects. An increase in equity potentially reduces the risks associated with high debt levels, owing to better risk sharing (see Sections 1.2 and 1.3).47
47 The potential risks stemming from REIFs were highlighted after the UK referendum on EU membership when commercial
property-focused funds were subject to high redemption calls, with a number of funds either directly suspending redemptions to protect the interests of long-term investors or introducing other measures to limit withdrawals.
0
10
20
30
40
50
60
0
50,000
100,000
150,000
200,000
250,000
2008 2009 2010 2011 2012 2013 2014 2015 2016 2017
Domestic investors (left-hand scale)Cross-border investors (left-hand scale)Cross-border share (right-hand scale)

Report on vulnerabilities in the EU commercial real estate sector / November 2018 Contents 47
Chart 22 CRE transactions by financing source
(left-hand scale: EUR millions; right-hand scale: percentages)
Source: CBRE Research. Notes: CBRE’s estimates from 2017 of the debt and equity split in the European CRE investment market. Last observation: 2016
Nevertheless, debt still constitutes a significant part of CRE financing. A substantial part of CRE debt has a relatively short maturity, indicating a refinancing risk for investors. It is important to note that REIFs are also partly financing their activity by debt, and their leverage is the highest compared with other investment funds in the EU (Chart 23). In addition, given the characteristics of real estate as an asset, REIFs have a large share of illiquid assets in proportion to total assets (Chart 24). This makes open-ended funds vulnerable to redemption risks, which may lead to fire sales of the underlying assets and a sudden decline in CRE prices if investors attempt to withdraw capital quickly. The value of open-ended REIFs in the euro area has increased significantly since the global financial crisis and the value of open-ended funds is over four times larger than that of close-end funds (Chart 25). However, there is significant heterogeneity in terms of the size and share of open-ended funds for the few countries for which data are available (Chart 26). Also, the redemption periods of open-ended funds vary widely between countries – longer redemption periods could reduce the risk of fire sales.
0
10
20
30
40
50
60
70
80
0
50,000
100,000
150,000
200,000
250,000
300,000
2001 2002 2003 2004 2005 2006 2007 2008 2009 2010 2011 2012 2013 2014 2015 2016
Debt (left-hand scale)Equity (left-hand scale)Debt share (right-hand scale)

Report on vulnerabilities in the EU commercial real estate sector / November 2018 Contents 48
Chart 23 Financial leverage in EU investment funds
(LEV1; percentages)
Source: ECB. Notes: Based on available data for the EU: Bulgaria, Croatia, Denmark, Sweden and the United Kingdom are not included. Financial leverage (LEV1) is calculated as the ratio of loans received to total liabilities. Last observation: Q3 2017.
Chart 24 Liquidity transformation in EU investment funds
(LIQ1; percentages)
Source: ECB. Notes: Based on available data for the EU: Bulgaria, Croatia, Denmark, Sweden and the United Kingdom are not included. Liquidity transformation by investment funds (LIQ1) expressed as total assets minus liquid assets (deposits, sovereign bonds, debt securities issued by MFIs and equity and investment fund shares), as a share of total assets. Closed-end funds are not included. Estimates are made for holdings of non-euro area securities and funds not resident in the euro area. Last observation: Q3 2017.
0
5
10
15
20
25
2010 2011 2012 2013 2014 2015 2016 2017
Total investment fundsMoney market fundsEquity fundsBond funds
Mixed fundsReal estate fundsHedge fundsOther funds
0
10
20
30
40
50
60
70
80
2010 2011 2012 2013 2014 2015 2016 2017
Total investment fundsMoney market fundsEquity fundsBond funds
Mixed fundsReal estate fundsHedge fundsOther funds

Report on vulnerabilities in the EU commercial real estate sector / November 2018 Contents 49
Chart 25 Real estate investment funds in the euro area
(EUR millions)
Source: ECB. Notes: SDW, Investment Funds Balance Sheet Statistics, Investment fund shares/units issued by open-ended and closed-end real estate funds in the euro area (stock) with codes: IVF.M.U2.N.4A.L30.A.1.Z5.0000.Z01.E and IVF.M.U2.N.4B.L30.A.1.Z5.0000.Z01.E. Last observation: January 2018.
Chart 26 Share of open-ended and closed-end real estate investment funds
(percentages)
Source: ECB. Notes: SDW, Investment Funds Balance Sheet Statistics, Investment fund shares/units issued by open-ended and closed-end real estate funds (stock). Only covers countries where both codes are available: IVF.M.??.N.4A.L30.A.1.Z5.0000.Z01.E and IVF.M.??.N.4B.L30.A.1.Z5.0000.Z01.E (where ?? is a country code). Data as of January 2018.
0
100,000
200,000
300,000
400,000
500,000
600,000
2009 2010 2011 2012 2013 2014 2015 2016 2017 2018
Open-endClosed-end
0
20
40
60
80
100
AT IE HU LU DE NL CZ FI PT
Open-endedClosed-ended

Report on vulnerabilities in the EU commercial real estate sector / November 2018 Contents 50
Table 5 Scoreboard indicators and survey answers for the financing stretch
Country
Scoreboard Survey Average rating
11 12 1.c 1.d 1.e
Real estate investment
funds growth over the last 12 months, %
Bank lending collateralised
by CRE, annual
growth, %
Exuberance of lending
dynamics
Risks related to bank lending
standards for CRE
Risks associated with CRE
funding sources other than bank
lending Score-board Survey
AT 8.8 58.1 1 1 1 1.5 1
BE 1.9 2 1 0.0 1.5
BG 13.4 4.7 0 0 1 0.5 0.3
CY -9.9 0 0 0 0.0 0
CZ 17.0 1.5 1 1 0 1.0 0.7
DE 7.5 -1.9 1 1 1 0.0 1
DK -1.2 1 0.0 1
EE 17.0 4.5 1 0 1 1.0 0.7
ES -8.1 -7.4 0 0 0.0 0
FI 16.9 38.2 0 2.5 0
FR 12.1 55.3 1 0 2.0 0.5
GR 2.1 -4.6 0 0 1 0.0 0.3
HR 9.5 0 1 1.0 0.5
HU 34.2 -1.4 1 1 1 1.5 1
IE 20.3 26.3 1 0 1 3.0 0.7
IT 10.9 -1.1 0 0 0 0.5 0
LT 17.0 8.4 2 1 1 1.5 1.3
LU 1.2 1 1 1 0.0 1
LV 3.8 1 1 1 0.0 1
MT 11.7 1 0 2.0 0.5
NL 3.7 6.4 0 1 1 0.5 0.7
NO 1 1 1 1
PL -12.1 6.4 1 0 2 0.5 1
PT -0.1 -9.1 0 0 0.0 0
RO -9.1 0 2 1 0.0 1
SE -0.2 1 0 1 0.0 0.7
SI -6.4 0 0 0.0 0
SK 14.5 10.0 2 1 1 1.0 1.3
UK -11.4 -5.2 1 1 1 0.0 1

Report on vulnerabilities in the EU commercial real estate sector / November 2018 Contents 51
Country
Scoreboard Survey Average rating
11 12 1.c 1.d 1.e
Real estate investment
funds growth over the last
12 months, %
Bank lending collateralised
by CRE, annual
growth, %
Exuberance of lending
dynamics
Risks related to bank lending
standards for CRE
Risks associated with CRE
funding sources other than bank
lending Score-board Survey
Thresholds
Low 10.0 5.0 1.0 1.0 1.0 0.8 0.8
Medium 15.0 10.0 2.0 2.0 2.0 1.4 1.4
High 20.0 15.0 3.0 3.0 3.0 2.1 2.1
Source: ECB and ESRB, scoreboard and survey results. Note: See Table 2 in Section 2.2 and Table A.1 in the Annex for further details on survey questions and scoreboard indicators. The figures in the scoreboard are based on common data sources for consistency purposes, although some countries have provided additional data. According to AT authorities, CRE lending annual growth cannot be measured precisely for AT due to an amendment of the definition of this reporting item at two major institutions. According to data for NO from Norges Bank, CRE lending annual growth was 3% in August 2017. See Annex A.2 for more country-specific information.
3.4 The exposure of the financial system to CRE (potential for spillovers stretch)
Although banks’ exposures are heterogeneous across countries and recent lending growth has varied, in some countries the banking sector remains highly exposed to CRE (see also Section 1.1). In half of the EU countries, the share of banks’ CRE-collateralised loans exceeds 10% of total loans (Table 6). In addition, the majority of countries report in the survey that banks' have significant exposures to CRE. However, some countries also highlight the fact that these exposures have decreased in recent years. The United Kingdom, for example, reports that the stock of banks’ CRE lending has more than halved in value since 2008. Moreover, most countries also feel that banks are managing their risk exposures to CRE appropriately, and that asset quality has improved in recent years. Nevertheless, in some countries where CRE risks have already materialised and where banks are currently not heavily engaged in providing new CRE lending (e.g. Cyprus and Ireland), the conditions of these countries’ existing loan books leave them vulnerable to downward adjustments in CRE prices.
Non-banks are also important for CRE financing in some countries, and the non-banking sector is growing in size. The scoreboard indicator suggests that the exposure of insurance companies to CRE represents more than 5% of their total assets in Cyprus, Croatia, Finland and the Netherlands (see Table 6). The Netherlands, for example, also reports that pension funds are large institutional investors in Dutch CRE, although the vast majority of their investments are located abroad and are managed through investment funds. In addition, the authorities in the United Kingdom report that some REIFs are focusing on the riskier part of CRE lending by providing loans with high LTV ratios. Although many national authorities have assessed the exposures of non-banks as small (see Table 5), these exposures are growing rapidly in many countries (see also Section 3.3). The larger role played by non-banks since the crisis has potentially increased risk sharing in the financial sector by reducing the pressure the banking sector would be under in the event of large-scale defaults. However, this intensified role is also likely to open up other channels for the transmission of CRE shocks to the financial sector and the real economy

Report on vulnerabilities in the EU commercial real estate sector / November 2018 Contents 52
(see Section 1.2). In addition, some countries highlight that a material reduction in the appetite of foreign investors would tighten financing conditions for domestic borrowers and reduce CRE prices.
Consequently, almost half of the countries indicate that CRE markets warrant special monitoring. In most of the Nordic countries, the CRE market is very large relative to GDP and there is a high degree of interconnectedness between financial institutions (see Table 6). This could result in a broader impact in an adverse scenario if risks were to materialise. Moreover, some countries (e.g. France, Portugal, Spain and Belgium) have highlighted the tight links that CRE markets have with RRE markets and the construction sector, which means that any downturn in these markets is likely to correlate with a downturn in CRE markets. In addition, some countries also highlight the importance of the collateral channel, as CRE is widely used as collateral for corporate borrowing (see also Section 1.2). An amplified downturn in the CRE market could be transmitted to the real economy by reducing companies’ access to bank loans and their ability to make new investments. While it is rare for CRE markets alone to trigger a crisis, they nevertheless represent an important source of systemic risk. Consequently, any materialisation of risks in the CRE market may exacerbate a future economic or financial system event.

Report on vulnerabilities in the EU commercial real estate sector / November 2018 Contents 53
Table 6 Scoreboard indicators and survey answers for the potential for spillovers stretch
Country
Scoreboard Survey Average rating
13 14 15 16 17 2.a 2.b 2.c
Loans collateralised by CRE, % of total
loans
Bank exposures collateralised by CRE as share of Tier 1 capital, %
Real estate investment funds size as share of
GDP, %
Exposure of insurers as share of total assets, %
Total market size estimated as
share of GDP, % Exposures of banks to CRE
Exposures of non-banks to CRE
Size of CRE and inter-connectedness of CRE with financial
markets and the economy Score-board Survey
AT 13 56 2.0 4.3 9.2 1 1 1 0.6 1
BE 2 4.6 11.7 1 1 2 0.3 1.3
BG 25 47 0.002 3.2 1 0 1 0.8 0.7
CY 21 9 7.1 3 0 1 1.3 1.7
CZ 8 26 0.1 1.1 9.0 1 0 2 0.0 1
DE 10 41 6.2 2.3 12.0 1 1 1 0.4 1
DK 8 180 0.5 17.1 1 2 1.0 1.5
EE 16 53 1.6 1.1 1 1 1 0.5 1
ES 6 13 0.1 3.1 6.2 0 0.2 0
FI 11 26 2.7 6.5 27.1 1 1 2 1.4 1.3
FR 3 21 3.5 1.2 15.1 0 0 1 0.4 0.3
GR 19 83 1.3 4.6 0 0 1 1.0 0.3
HR 10 1 14.3 0 2 1.3 1
HU 15 35 0.01 1.6 6.9 1 1 1 0.2 1
IE 10 15 4.9 1.1 9.1 1 1 2 0.2 1.3
IT 12 71 2.6 0.9 6.0 0 0 1 0.6 0.3
LT 18 94 0.9 2.6 1 1 2 1.0 1.3

Report on vulnerabilities in the EU commercial real estate sector / November 2018 Contents 54
Country
Scoreboard Survey Average rating
13 14 15 16 17 2.a 2.b 2.c
Loans collateralised by CRE, % of total
loans
Bank exposures collateralised by CRE as share of Tier 1 capital, %
Real estate investment funds size as share of
GDP, %
Exposure of insurers as share of total assets, %
Total market size estimated as
share of GDP, % Exposures of banks to CRE
Exposures of non-banks to
CRE
Size of CRE and inter-connectedness of CRE with financial
markets and the economy Score-board Survey
LU 10 116.0 0.4 1 1 1 1.0 1
LV 19 48 0.2 3.4 1 0 1 0.5 0.7
MT 8 10 1.9 1 0 0 0.0 0.3
NL 9 64 14.5 5.4 17.4 1 1 2 1.4 1.3
NO 13 1.7 1 1 3 0.5 1.7
PL 11 34 0.05 2.5 8.4 0 0 1 0.2 0.3
PT 9 16 5.8 1.3 12.0 0 0 0.4 0
RO 10 19 3.6 2 0 2 0.3 1.3
SE 11 91 2.3 33.9 1 1 2 1.5 1.3
SI 17 34 4.0 0 0 0 0.7 0
SK 9 6 1.2 4.2 1 1 2 0.3 1.3
UK 5 56 1.9 3.8 24.0 1 2 2 0.8 1.7
Thresholds
Low 10 50 2.5 2.5 15.0 1.0 1.0 1.0 0.8 0.8
Medium 20 75 5.0 5.0 20.0 2.0 2.0 2.0 1.4 1.4
High 30 100 10.0 10.0 25.0 3.0 3.0 3.0 2.1 2.1
Sources: ECB and ESRB, scoreboard and survey results. Notes: See Table 2 in Section 2.2 and Table A.1 in the Annex for further details on survey questions and scoreboard indicators. The figures in the scoreboard are based on common data sources for consistency purposes, although some countries have provided additional data. According to data for CY from the Central Bank of Cyprus, total loans collateralised by CRE amount to 17% of total lending. According to market-based data (KTI) from Suomen Pankki, the estimate for total CRE market size in relation to GDP was 19% in 2016. See Annex A.2 for more country-specific information.

Report on vulnerabilities in the EU commercial real estate sector / November 2018 Risk analysis 55
3.5 Summary of the identified vulnerabilities
The main source of vulnerability identified in the CRE markets across several EU countries relates to investors’ search for yield in the low interest rate environment, which has increased CRE prices and made them potentially vulnerable to a repricing of risk premia. The search for yield has contributed to a combination of both high CRE prices and low CRE yields, by historical standards, across EU countries, especially in the prime segments. However, CRE yields remain relatively high compared with other sectors. With regard to vulnerabilities in the collateral stretch, both the survey and the scoreboard indicators signal particularly high and increasing CRE prices, as well as low yields, in the Czech Republic, France, Germany and Sweden (Chart 27). In addition, available scoreboard indicators signal high prices and low yields in Finland, Luxembourg, Portugal and Spain and, from the survey, in the Netherlands and Norway.
Chart 27 Collateral stretch – composite ratings
(blue dots represent countries; x-axis: scoreboard; y-axis: survey)
Sources: ECB and ESRB, scoreboard and survey results. Notes: Figures report the average ratings from the scoreboard (x-axis) and the survey (y-axis). “N” stands for no risk; “L” stands for low risk; “M” for medium risk, and “P” for pronounced risk. Countries with missing data for composite indicators are not included in the chart.
A repricing of risk premia could act as a common trigger, potentially causing investors to rapidly unwind their exposures in several CRE markets simultaneously. A reassessment of risk premia could potentially lead to significant decreases in investors’ future expected cash flows. This could act as a common trigger of abrupt and widespread price reversals as well as a correlated unwinding of high-yield and risky asset positions, including CRE. Such price reversals could negatively impact financial stability and the real economy. Investors are more likely to engage in a correlated unwinding in markets where they have been more active than on average, when they have unsustainably high debt levels, or where their returns are at risk (due, for example, to high vacancy rates). This is, to some extent, captured in the income and activity stretch. Available data from both the survey and the scoreboard indicators give the clearest signals of high investor activity and potential concerns regarding the income-generating capacity of CRE (such as low yields and high vacancy rates) in Belgium, Denmark, the Netherlands and Romania (Chart 28). In
AT
BE
FI
FR DE
GR
IE
IT
LU
NL
PT
ES
CZ
DK
HU
PL
SE
UK
P
P
M
L
N
N L M

Report on vulnerabilities in the EU commercial real estate sector / November 2018 Risk analysis 56
addition, there are similar signals from the scoreboard in Austria, Finland, Germany, Ireland, Italy, Luxembourg, and Portugal and from the survey in the Czech Republic, Estonia, Greece, Lithuania, Poland, Slovenia and the United Kingdom.
Chart 28 Income and activity stretch – composite ratings
(blue dots represent countries; x-axis: scoreboard; y-axis: survey)
Sources: ECB and ESRB, scoreboard and survey results. Notes: Figures report the average ratings from the scoreboard (x-axis) and the survey (y-axis). “N” stands for no risk; “L” stands for low risk; “M” for medium risk, and “P” for pronounced risk. Countries with missing data for composite indicators are not included in the chart.
The banking sector in some countries remains highly exposed to CRE, although non-banks seem to be playing an increasingly important role in CRE markets. Borrowed capital, both via bank loans and market-based funding, still constitutes a non-negligible part of overall CRE financing, which indicates a substantial degree of ongoing credit risk, interest rate risk and refinancing risk for banks. In some countries, CRE-collateralised bank lending has also increased faster than can be justified by the current macroeconomic environment, although this is not widespread across the EU. Equity financing appears to have increased in CRE markets since 2007, due to non-banks and international investors. For example, in many countries real estate investment funds (REIFs) and real estate investment trusts (REITs) are now playing an increasingly important role in channelling funding into CRE. In addition, almost half of the EU countries highlighted that a large proportion of investor activity is being undertaken by foreign investors, and that foreign investors are playing a greater role in many countries. The available data on domestic financing sources are captured in the financing stretch. There are no countries with clear signals from either the survey or the scoreboard indicators, in part because of the recent increases in the proportion of CRE funding sourced through equity. However, there are indications of rapid growth in REIFs or banks’ CRE lending from the scoreboards in Austria, Finland, France, Hungary, Ireland, Lithuania and Malta, and from the survey in Belgium (Chart 29).
AT
BE
FIFR DE
GR
IE
IT LU
NL
CZDK
HU
PL
RO
SE
UK
NO
M
P
L
N
PMLN

Report on vulnerabilities in the EU commercial real estate sector / November 2018 Risk analysis 57
Chart 29 Financing stretch – composite ratings
(blue dots represent countries; x-axis: scoreboard; y-axis: survey)
Sources: ECB and ESRB, scoreboard and survey results. Notes: Figures report the average ratings from the scoreboard (x-axis) and the survey (y-axis). “N” stands for no risk; “L” stands for low risk; “M” for medium risk, and “P” for pronounced risk. Countries with missing data for composite indicators are not included in the chart.
There are a number of transmission channels through which possible adverse developments in the CRE sector might have a systemic impact on the financial system and the real economy. The impact of such adverse developments depends on the size of the CRE market and its direct and indirect linkages with the financial system and the real economy, and is captured in the potential for spillovers stretch. This stretch indicates that the banking sector remains highly exposed to CRE in some countries and, also, that non-banks are important for CRE financing in a number of countries. In addition, in many countries CRE markets are very large relative to GDP and are interconnected with financial markets and other parts of the real economy. Given that exposures are not large across all sectors at the same time, there are no countries where both the survey and the scoreboard indicators signal large exposures. However, the scoreboard provides evidence of major exposures in Finland, the Netherlands and Sweden, as does the survey for Cyprus, Denmark, Norway and the United Kingdom (Chart 30). These countries mainly have large exposures of banks to CRE, or their CRE market is large and interconnected with the financial system and the real economy. In addition, almost half of the countries indicate that CRE markets warrant specialised monitoring from a financial stability perspective.
AT
BE
CY
EE
FI
FR
DE
GR
IE
IT
LV
LTLU
MT
NL
PT
SK
SI ES
BG
CZ
DK
HR
HUPLRO
SE
UK
N L M P
N
L
M
P

Report on vulnerabilities in the EU commercial real estate sector / November 2018 Risk analysis 58
Chart 30 Potential for spillovers stretch – composite ratings
(blue dots represent countries; x-axis: scoreboard; y-axis: survey)
Sources: ECB and ESRB, scoreboard and survey results. Notes: Figures report the average ratings from the scoreboard (x-axis) and the survey (y-axis). “N” stands for no risk; “L” stands for low risk; “M” for medium risk, and “P” for pronounced risk. Countries with missing data for composite indicators are not included in the chart.
AT
BE
CY
EEFI
FR
DE
GR
IE
IT
LV
LT
LU
MT
NL
PT
SK
SIES
BG
CZ
DK
HRHU
PL
RO SE
UKNO
N L M P
N
L
M
P

Report on vulnerabilities in the EU commercial real estate sector / November 2018 Policy analysis 59
This chapter provides a policy analysis from a macroprudential perspective of the EU CRE markets in the context of the risks and vulnerabilities identified in Chapter 3. Section 4.1 discusses potential policy instruments that could be used to address risks and vulnerabilities in the CRE markets and their limitations. These instruments are also matched to the four different stretches of the risk analysis framework. Subsequently, Section 4.2 gives an overview of the current CRE-related policy measures implemented by EU countries. Section 4.3 analyses the appropriateness of the policy measures used to address CRE-related vulnerabilities, i.e. whether the measures implemented are conceptually suited to addressing the vulnerabilities that have been identified.
4.1 Available macroprudential policy measures for addressing financial stability risks related to CRE and their limitations
Capital-based and borrower-based macroprudential instruments can be used to address CRE-related vulnerabilities. The list of macroprudential measures (Table 7) comprises those measures available to Member States either via national regulation or through CRD IV and the AIFMD. In general, the available instruments can be divided into capital-based measures (which target banks or alternative investment funds) and borrower-based measures (which may be applied to all credit providers). In addition to the measures in Table 7, other macroprudential measures could be implemented to partly address CRE, as well as other vulnerabilities, such as the counter-cyclical capital buffer (CCyB) and the systemic risk buffer (SRB). A detailed description of all measures is provided in the ESRB Handbook on operationalising macroprudential policy in the banking sector and the ESRB’s Report on commercial real estate and financial stability in the EU.48
48 See ESRB, “Handbook on operationalising macro-prudential policy in the banking sector”, Frankfurt am Main,
March 2014; and ESRB, “Report on commercial real estate and financial stability in the EU”, Frankfurt am Main, December 2015.
4 Policy analysis

Report on vulnerabilities in the EU commercial real estate sector / November 2018 Policy analysis 60
Table 7 Measures of a macroprudential nature currently available for addressing CRE vulnerabilities
Intermediate objective Target Measure
Excessive credit growth and leverage
Borrowers Limits on loan to value (LTV) (national legislation)
Limits on debt service coverage ratio (DSCR) or interest coverage ratio (ICR) (national legislation)
Mortgage lending value requirement (national legislation)
Banks Increase risk weights for banks using the standardised approach (Article 124(2) of the CRR)
Increase loss given default (LGD) of retail exposures for IRB banks (Article 164(5) of the CRR)
Higher own funds requirements or risk weights (Article 458 of the CRR)
Pillar 2 requirements for CRE exposures (Article 103 of CRD IV)
Alternative investment funds
Leverage limits (Article 25 of the AIFMD)
Direct and indirect exposure concentration
Banks Tightened large exposure limits (Article 458 of the CRR)
Excessive maturity and liquidity mismatch
Alternative investment funds
Suspension of redemptions (Article 46 of the AIFMD)
Most of the instruments currently available can be used to address CRE-related risks in the banking sector. The measures seek to increase the resilience of the banks involved in CRE lending (e.g. increased risk weights for CRE exposures), while CRE vulnerabilities could partly justify measures to increase general banking system resilience (e.g. the countercyclical and the systemic risk buffers). These capital-based measures have the advantage that they can be applied to both the stock of existing loans and the flow of new loans. The higher risk weights for banks using the standardised approach (SA) can be set on the basis of financial stability, and other, considerations (Article 124(2) of the CRR). However, there are fewer possibilities for correcting or increasing risk weights for banks using the internal ratings-based (IRB) approach to address CRE vulnerabilities. The competent authorities at the national level could set higher loss given default (LGD) values for CRE (Article 164(5) of the CRR). However, the option of increasing LGD values only applies to banks’ retail customer portfolios which are secured by CRE property, despite the fact that the majority of banks’ CRE exposures are in their corporate portfolio. This is a consequence of the inconsistency between the regulation of risk weights under the SA and the IRB approach, since the competent authorities could set higher risk weights under the SA for any exposure secured by CRE in both the corporate and the retail portfolios (Article 124(2)). Under the new Basel III rules49, which are yet to be incorporated into EU law, the risk weights for CRE in the SA will depend on LTV ratios.
Risk weights for banks using the IRB approach could be based on the so-called “slotting” approach for specialised lending (Article 153(5) of the CRR), such as that involving income-producing real estate for IRB banks. However, this only applies when banks do not meet the requirements for the
49 Basel Committee on Banking Supervision, “Basel III: Finalising post-crisis reforms”, December 2017.

Report on vulnerabilities in the EU commercial real estate sector / November 2018 Policy analysis 61
estimation of probability of default (PD) under the corporate IRB approach, and is not a macroprudential measure. The approach implies that CRE loans can be assigned different “slots”, depending on a range of factors designed to reflect the level of risk, with risk weights ranging from 50% to 250%. Under the new Basel III rules, loans for income-producing real estate and high-volatility CRE (CRE financing that exhibits higher loss rate volatility compared with other types of specialised lending) are treated as specialised lending exposures. The risk weights are also somewhat increased, especially for high-volatility lending. The new rules also include a floor for LGD on loans secured by CRE for banks using advanced IRB models.
In the current EU legal framework, very few macroprudential measures are available that address CRE-related risks in the non-bank sector. Given the rising importance of non-bank financing in CRE markets (e.g. insurance companies and investment funds), it is important to investigate whether new instruments should be made available and implemented beyond banking. For example, with regard to the insurance sector, the Solvency II Directive imposes capital charges for property and concentration risks. The latter, however, only prevent the concentration of investment on individual name-based exposures, but not the concentration of exposures in specific sectors and geographical regions. It may not, therefore, be considered to be an appropriate tool for preventing an excessive build-up of CRE exposures from a macroprudential perspective. The symmetric equity dampener under Solvency II provides for countercyclical adjustments in the equity capital charge for indirect CRE exposures, such as holding shares of REITs. However, these measures are not of a purely macroprudential nature in terms of targeting the CRE market. As opposed to CRD IV for the banking sector, Solvency II does not currently provide a way of enhancing resilience against rising CRE vulnerabilities at the country level. To address risks and vulnerabilities stemming from Alternative Investment Funds (AIFs), including REIFs, the AIFMD allows the national competent authorities to impose leverage limits or other restrictions on the management of these funds. To address liquidity mismatch and redemption risks in open-ended investment funds, the national competent authorities could, under extraordinary circumstances, order the suspension of redemption of these funds50. In addition, most EU countries also make a range of liquidity management tools available to fund managers.51 However, there are currently no macroprudential measures that can be applied to bond markets to address potential risks related to CRE bond financing.
The availability and use of borrower-based measures (e.g. LTV limits and DSCR/ICR floors) is not harmonised at the EU level. Instead, these instruments are implemented under national legislation and their availability to national macroprudential authorities therefore varies by country. An advantage of borrower-based instruments is that they can be applied to all domestic lenders, including banks, branches of foreign banks and insurance companies. This feature makes these measures particularly attractive in the light of current developments in the European CRE markets, where the importance of foreign funding sources and the role of non-banks is increasingly significant (see Section 3.3). However, the calibration of debt service coverage ratio (DSCR) and interest coverage ratio (ICR) floors can be particularly complex due to difficulties in calculating profit measures for CRE investments. For example, in the case of newly constructed CRE premises, this often requires approximations of expected future income streams. Loan to income (LTI) and debt
50 For instance, several UK property funds had to temporarily suspend their redemptions following the UK referendum to leave
the EU on 23 June 2016. 51 For more information see Annex II of ESRB, “Recommendation on liquidity and leverage risks in investment funds”,
Recommendation ESRB/2017/6, February 2018.

Report on vulnerabilities in the EU commercial real estate sector / November 2018 Policy analysis 62
service to income (DSTI) measures are more commonly used for RRE lending, where households often have stable and predetermined income streams. In contrast, CRE investors are often affected by cyclical factors, which impact rent and vacancy levels. Moreover, the implementation of more conservative valuations of CRE property than market values for mortgage lending – mortgage lending value (MLV) could also help to contain potential financial stability risks. Incorrect valuations can lead to misconceptions over the actual risks taken and can imply overvaluations of property due to conflicts of interest for lenders. This could, in turn, exacerbate existing price trends.52
The effectiveness of the policy measures may be impaired by leakages and regulatory arbitrage. In relation to sectoral capital requirements (e.g. floors for risk weights), banks may shift lending to riskier CRE exposures to compensate for the increased cost of capital. To avoid the regulation, institutions may also shift their exposures to other parts of financial markets, i.e. non-banks or the bond market. Therefore, through an investigation of the interaction between CRE exposures across financial sectors, it should be ensured that regulatory arbitrage due to mere differences in the regulatory treatment of the exposures is, as far as possible, avoided. Leakages could also occur across borders. For example, local subsidiaries may rebook loans to their foreign parents in order to avoid stricter regulations in local markets. Borrower-based measures could also create certain types of evasions. For example, lenders may have an incentive to overvalue properties as well as the operating incomes of borrowers in order to further expand their credit. Moreover, since these measures only apply to new lending, there could be an incentive to frontload loans after an announcement of new measures or a change of existing measures. This could, in the short term, exacerbate the developments the policy adjustment originally intended to address.
Designing macroprudential measures to be as widely encompassing as possible can contribute to reducing leakages and regulatory arbitrage. This includes considering a wider application of the regulation to include all financial institutions that provide a targeted service, e.g. by applying the same or a similar regulation beyond the banking sector to non-bank financial institutions. Moreover, the reciprocity of measures is crucial to prevent cross-border leakages.53 Reciprocity is mandatory for some rules under CRD IV, such as increased risk weights under the standardised approach, although in the case of borrower-based measures in particular, reciprocity is voluntary.54 Moreover, the reciprocation rules expand to all EEA jurisdictions, but not beyond.
Most macroprudential measures can potentially address risks and vulnerabilities in multiple stretches simultaneously, albeit with varying levels of strength. Table 8 describes the transmission mechanisms for the various measures in Table 7 for the four different stretches of the risk analysis framework. For example, higher sectoral risk weights increase the capital maintained by banks for their CRE exposures which, in turn, increases the resilience of the banks to loan defaults in the CRE segment. This implies that adverse spillovers to other markets are less likely (potential for spillovers stretch). In addition, increased risk weights may lead to a higher cost of
52 For example, an analysis by the Central Bank of Ireland showed that valuation procedures in Irish banks were often found
to be flawed before the crisis, see Central Bank of Ireland, “Valuation Processes in the Banking Crisis – Lessons Learned – Guiding the Future”, Dublin, December 2011 and Olszewski, K., “The Commercial Real Estate market, Central Bank Monitoring and Macroprudential Policy”, Review of Economic Analysis, Vol. 5, 2013, pp. 213-250.
53 Reciprocity is “an arrangement whereby the relevant authority in one jurisdiction applies the same, or equivalent, macroprudential measure, as is set by the activating relevant authority in another jurisdiction, to any financial institutions under its jurisdiction, when they are exposed to the same risk in the latter jurisdiction.” See Part 4 of Chapter 11 on reciprocity in ESRB, “Handbook on Operationalising Macroprudential Policy in the Banking Sector“, Frankfurt am Main, March 2014.
54 Mandatory, e.g. directly applicable, as harmonised by Union legislation i.e. Articles 124 and 164 of the CRR, or voluntary, for example as provided for in the ESRB recommendation on reciprocity.

Report on vulnerabilities in the EU commercial real estate sector / November 2018 Policy analysis 63
capital in the banking sector, which could translate to higher interest rates on CRE loans. This may lead to lower CRE credit growth (financing stretch) and less investor activity (income and activity stretch). Fewer CRE transactions, in turn, may imply lower CRE price growth (collateral stretch). Moreover, the measures presented to address risks and vulnerabilities in the respective stretches have varying degrees of effectiveness.55 For example, increased risk weights may not lead to increased interest rates as there may be substitution to other sources of financing, and may therefore not affect the collateral stretch, or the financing stretch or the income and activity stretch. However, increased risk weights could still increase the resilience of banks with CRE exposures and could reduce the potential for spillovers. This also applies to the tightening of exposure limits, although this measure only limits individual banks’ exposures to certain lenders. Hence, its effect on the collateral, financing and income, and activity stretches is even more uncertain, although it could still limit the potential for spillovers by increasing bank resilience. Broader capital measures, such as the countercyclical capital buffer and the systemic risk buffer, could also lead to more general increases in interest rates and could increase resilience throughout the banking sector. However, these measures would not be targeted at CRE markets specifically, and would not, therefore, be the most efficient way to address CRE-specific vulnerabilities.
55 This ultimately remains an empirical question. As a starting point, some evidence on the effects of borrower-based and
bank-based measures is reviewed in ESRB, “Handbook on operationalising macro-prudential policy in the banking sector”, Frankfurt am Main, March 2014, although there are many more recent papers.

Report on vulnerabilities in the EU commercial real estate sector / November 2018 Policy analysis 64
Table 8 Main transmission mechanisms by stretches for macroprudential measures related to CRE markets
Targeted sector Measure Collateral stretch
Income and activity stretch Financing stretch
Potential for spillovers stretch
Investors/ borrowers
Limit on loan-to-value (LTV) ratios
Reduces demand from CRE investors with high LTV which may reduce CRE price growth
Reduces demand from CRE investors with high LTV and hence reduces CRE investor activity
Reduces demand from CRE investors with high LTV and hence reduces CRE credit growth
Increases the resilience of CRE investors and hence also the resilience of lenders
Limit on Debt-service-coverage-ratios (DSCR)/ interest-coverage-ratios (ICR)
Reduces demand from CRE investors with high DSCR/ICR which may reduce CRE price growth
Reduces demand from CRE investors with high DSCR/ICR and hence reduces CRE investor activity, making investors less vulnerable to a fall in income or a rise in interest rates
Reduces demand from CRE investors with high DSCR/ICR and hence reduces CRE credit growth
Increases the resilience of CRE investors and hence also the resilience of lenders
Mortgage lending value (MLV)
Reduces demand from CRE investors with high LTV from the alternative valuation method which may reduce CRE price growth
Reduces demand from CRE investors with high LTV from the alternative valuation method and hence reduces CRE investor activity
Reduces demand from CRE investors with high LTV from the alternative valuation method and hence reduces CRE credit growth
Increases the resilience of CRE investors and hence also resilience of lenders
Banks
Sectoral capital requirements (e.g. risk weights, LGDs)
(May increase interest rates on CRE loans and hence reduce CRE price growth)
(May increase interest rates on CRE loans and hence reduce CRE investor activity)
(May increase interest rates on CRE loans and hence reduce CRE credit growth)
Increases the resilience of banks with high CRE exposures
Tightened exposure limits
(May limit lending to CRE and hence reduce CRE price growth)
(May limit lending to CRE and hence investor activity)
(May limit lending to CRE and hence reduce CRE credit growth)
Increases the resilience of banks by limiting exposure to CRE companies
Non-banks
Leverage limits for investment funds
(May limit CRE investor activity and hence reduce CRE price growth)
(May limit CRE investor activity)
Limits leverage for investment funds, and hence may also limit CRE credit growth
Increases resilience of investment funds
Suspension of redemption for investment funds
(The possibility of suspending redemption may reduce the demand for funds, which may reduce CRE price growth)
(The possibility of suspending redemption may reduce the demand for funds, which may reduce CRE investor activity)
(The possibility of suspending redemption may reduce the demand for funds, which may reduce growth of funds)
May limit risks of liquidity mismatch and fire sales, thereby reducing contagion effects of deteriorating asset prices
Notes: Only measures targeted at CRE markets are included in the table. Transmission mechanisms shown in bold indicate where the measures are expected to be the most appropriate for addressing the vulnerabilities in the stretch, while those shown in brackets indicate that the measures could have an effect.
Although most macroprudential measures address all stretches concurrently, the different scope of the instruments should be kept in mind. While the borrower-based measures may apply to the CRE market in general, mainly addressing borrower-side vulnerabilities, and capital

Report on vulnerabilities in the EU commercial real estate sector / November 2018 Policy analysis 65
buffers may increase the general resilience of the banking sector, many of the targeted measures apply only to certain segments or specific types of exposures in CRE markets.
Beyond macroprudential measures, other types of policy measures could also be used to address risks and vulnerabilities in CRE markets. Policies of a microprudential nature, such as the imposition of managerial controls, can be used to affect lending standards for CRE. Introducing tighter managerial controls by setting up guidelines on credit provisioning by lending institutions could act as a means of ensuring that lending standards are prudent. When an institution has a concentration of CRE, the establishment of sound lending policies becomes even more critical.56 Certain fiscal policies can have a direct effect on CRE price growth and leverage.57 For instance, stamp duty could be used to discourage short-term CRE investments. Other possibilities could be increased property taxation, decreased tax deductibility of interest payments or higher capital gains taxes, which would lower the return on a CRE investment and, hence, affect the incentives to invest in CRE. In addition, adjusting land and urban planning policies that impact the regulation of building permits (e.g. areas for construction and limits to the height of the buildings) could reduce the elasticity of supply as well as CRE price growth. Well-designed environmental policies and land and urban planning policies could also help to prevent excessive supply and demand imbalances stemming from structural and technological changes in the economy (e.g. flexibility in regulation to convert CRE premises to RRE could help to smooth the transition).
4.2 Implemented macroprudential policy measures related to CRE
There is limited experience of the use of macroprudential measures to address CRE-related financial stability risks, both in terms of the measures implemented and the number of years’ experience of their effectiveness. A total of eleven ESRB Member States have each implemented at least one policy measure to directly address vulnerabilities in the CRE market, while only two countries have implemented more than one measure (Table 9). The majority of measures have been implemented in the past four years, so there is limited experience and potential to analyse their effects.
56 See Basset, W. and Marsh, B., “Assessing targeted macroprudential financial regulation: The case of the 2006 commercial
real estate guidance for banks”, Journal of Financial Stability, Vol. 30, 2017, pp. 209-228 for a US experience of such a policy.
57 Kuttner, K. and Shim, I., “Can non-interest rate policies stabilize housing markets? Evidence from a panel of 57 economies”, Journal of Financial Stability, Vol. 26, 2016, pp. 31-44, showing that tax policies can be particularly effective for this purpose.

Report on vulnerabilities in the EU commercial real estate sector / November 2018 Policy analysis 66
Table 9 CRE-related macroprudential measures in ESRB Member States
Intermediate objective Measure Country
Introduced in year Key detail on current measures
Excessive credit growth and leverage
Risk weights
Ireland 2007 Risk weight of 100% on CRE lending for banks using the standardised approach.
Romania 2007 Risk weight of 100% on CRE lending for banks using the standardised approach.
UK 2011 Risk weight of 100% on CRE lending for banks using the standardised approach. Slotting regime for IRB banks, whereby loans are required to be allocated to buckets of riskiness with risk weights ranging from 50% to 250%.
UK 2013 Stricter criteria for eligibility when assigning the 50% risk weight to exposures fully and completely secured by mortgages on commercial immovable property located in the UK, depending on annual average loss rates over a representative period.
UK 2014 Stricter criteria for eligibility when assigning the 50% risk weight to exposures fully and completely secured by mortgages on commercial immovable property located in a jurisdiction that is not an EEA country, depending on annual average loss rates over a representative period.
Latvia 2014 Risk weight of 100% on CRE lending for banks using the standardised approach.
Norway 2014 Risk weight of 100% on CRE lending for banks using the standardised approach.
Croatia 2015 Risk weight of 100% on CRE lending for banks using the standardised approach.
Sweden 2015 Risk weight of 100% on CRE lending for banks using the standardised approach.
Sweden 2016 Tightened supervisory methods over risk weights for corporate exposures for banks using IRB. Banks will be required to change their models to meet the FSA’s requirements, resulting in higher pillar 1 requirements. Banks not following the FSA's supervisory methods are subject to a capital surcharge under pillar 2.
Poland 2017 Risk weight of 100% on CRE lending for banks using the standardised approach.
LTV limit
Poland 2014 LTV limit of 75%.
Cyprus LTV limits of 70% for loans for property that is not the primary residence of the borrower.
Debt servicing
Cyprus 2014 DSTI ratio should not exceed 80% for loans for all property that is not the primary residence of the borrower (65% for loans in foreign currency).
Denmark 2014 DSTI ratio should not exceed 100%. The denominator is defined as EBITVA (i.e. excluding value gains) whereas the numerator also requires the loan to be amortised over a maximum of 30 years. The measure is only applicable to banks (i.e. not for mortgage credit institutions).
Direct and indirect exposure concentration
Other measures
Luxembourg 2013 Limit on exposures to real estate development as a share of capital.
Denmark 2010 25% limit on lending to construction companies and real estate companies as a share of total lending (banks)
Denmark 2015 15% lending growth cap for mortgage credit companies on lending segments
Sources: EBA, ECB and ESRB survey results. Notes: Information on risk weights taken from the EBA homepage on the supervisory disclosure of applied options and national

Report on vulnerabilities in the EU commercial real estate sector / November 2018 Policy analysis 67
discretions, table on “Risk weights and criteria applied to exposures secured by mortgages on immovable property.”
The measure most commonly used by ESRB member countries has been an increase in the banks’ risk weights for CRE exposures to over the minimum (50%) required under EU regulation.58 Moreover, three countries (Cyprus, Denmark and Poland) have implemented borrower-based measures. In particular, Poland has set a general LTV limit of 75%; Cyprus has set an LTV limit of 70% and a DSTI limit of 80% for property that is not the primary residence of the borrower, which includes income-generating CRE; and Denmark has introduced a DSTI limit of 100% for CRE-collateralised bank lending. Moreover, Denmark and Luxembourg are the only countries that have applied a measure through national legislation to limit direct and indirect exposure concentrations. Finally, no EU country has taken measures to limit excessive maturity and liquidity mismatch.
CRE-related vulnerabilities have been part of the reason the systemic risk buffer and the countercyclical capital buffer have been activated in some countries. Croatia, Estonia and Hungary have implemented a systemic risk buffer, while Slovakia has raised its countercyclical capital buffer, a decision taken by the national authorities partly in response to vulnerabilities in the CRE market. However, even though CRE vulnerabilities are one of the reasons the measures have been implemented, the measures are broad capital buffers and do not specifically target CRE-related vulnerabilities. Only Hungary has set its systemic risk buffer rate for different banks based on the bank-specific CRE portfolio.
Stress tests have been used as a tool to assess the resilience of financial institutions or market participants to adverse market developments in CRE markets. Supervisory stress tests have often been designed to assess how the resilience of financial institutions, such as banks, insurance companies as well as pension and investment funds, could be impacted by a macro-financial stress scenario that included a drop in real estate prices. In general, downturns in real estate markets, including the CRE markets, play an important role in the EBA EU-wide biannual stress tests for banks, in the EIOPA stress tests for insurers, as well as in the national authorities’ own stress tests.59 In addition, the resilience of REIFs may also be analysed in scenarios involving substantial outflows of initial liabilities. Stress tests of this type have recently been conducted by the authorities in France.60 Moreover, more micro-oriented stress tests of particular CRE investment projects may also be carried out in order to establish when leverage makes certain investments vulnerable to interest rate shocks or increases in vacancy rates.
58 Under the standardised approach, as defined in the CRR, exposures secured by CRE should be assigned a risk weight
(RW) of between 50% and 150% (Article 124). RWs of below 100% can only be assigned to these exposures if certain criteria are met (the criteria are described in Articles 126 and 208). Several countries have applied RWs which are higher than the minimum 50%.They have done this either for financial stability considerations (Article 124) or because the criteria allowing the use of the minimum RWs have not been met.
59 See, for example, the European Systemic Risk Board, “Adverse macro-financial scenario for the 2018 EU-wide banking stress test”, Frankfurt am Main, January 2018 and Bank of England, ‘’Stress testing the UK banking system: 2017 results’’, London, November 2017.
60 HCSF, ‘’French commercial real estate market: Updated analysis and stress test results’’, Paris, March 2017.

Report on vulnerabilities in the EU commercial real estate sector / November 2018 Policy analysis 68
4.3 The appropriateness of macroprudential measures related to CRE
Policy analysis needs to take into account the broader environment within which macroprudential policy actions are being implemented. This section builds on the available measures (Section 4.1) and the implemented measures (Section 4.2) to explore whether additional measures could be considered to address the vulnerabilities in CRE markets identified in Chapter 3. However, this policy analysis is limited to considering only whether the implemented measures are appropriate, i.e. whether they are conceptually suited to tackling the vulnerabilities in question in an efficient manner. The scope is not to consider how measures should be calibrated to be sufficient, i.e. how they could quantitatively tackle the vulnerabilities in question. Hence, the overall policy stance is not considered (authorities often employ a combination of policies to mitigate systemic risk), nor is the fact that issues outside the direct control of the macroprudential authority are likely to influence the risk environment.
In general, the appropriateness of a policy response depends on the nature of the identified risk or vulnerability. More specifically, macroprudential policy actions may be directed at addressing the risk or vulnerability directly (i.e. at lowering the probability of the risk materialising or its impact) or at strengthening the resilience of the financial system to cope with the impact. The choice will depend, among other factors, on the specific risks identified, the phase in the financial cycle the country is in and the policy tools available to the policymaker. Table 10 summarises the considerations involved in assessing the appropriateness of policy for CRE, building on the risk analysis framework presented in Chapter 2 and the available CRE-related policy measures in Section 4.1. The table describes, for each of the four stretches, the main considerations that determine the appropriateness of a certain instrument or policy action, depending on the identified risks and vulnerabilities as well as the policymaker’s policy objectives. The table includes primarily macroprudential policy instruments and policy actions aimed at addressing CRE vulnerabilities. A number of instruments from other policy areas are also included, such as tax policy and land and urban planning. Although these instruments can be effective in addressing CRE vulnerabilities, they are not usually available to macroprudential authorities.
Borrower-based measures could be used to address vulnerabilities related to current cyclical risks identified in EU CRE markets. Investors’ search for yield has contributed to both high and rapidly rising CRE prices as well as CRE yields that are low by historical standards, especially in the prime segments. CRE investor activity is also high, especially for investors outside the EU. There is also high CRE lending growth in some countries (although this is not widespread across the EU) as well as some signs of an easing of lending standards. When vulnerabilities stem from such expanding CRE market developments, borrower-based measures are considered to be appropriate for tackling these risks, as can be seen in Table 10. Borrower-based measures could, in these circumstances, be directed towards the risky activity itself, and could counteract the build-up of financial imbalances by safeguarding prudent lending standards and influencing, for example, the supply of or demand for credit. However, only limited information is currently available on the lending standards and risk characteristics of CRE loans secured by different property types, and there is significant heterogeneity in CRE projects, which complicates the calibration and implementation of borrower-based measures. The heterogeneity in projects might be addressed by regulation flexibility (e.g. different LTV limits in different segments or the usage of quotas for loans in breach of the requirements – so-called “speed limits”). Moreover, when more equity is involved in the financing, especially through open-ended REIFs, as is currently the case in the EU, the main

Report on vulnerabilities in the EU commercial real estate sector / November 2018 Policy analysis 69
risk is a run on the funds involved. Therefore, if market conditions deteriorate, it is important that measures such as the suspension of redemptions can be enacted at short notice to limit the risk of fire sales of CRE in EU-based funds.
Given that EU countries are in different phases of the financial cycle, it should be remembered that measures should ideally be introduced early in the upswing to be most effective. Some countries are experiencing a build-up of vulnerabilities, while others are still suffering from recent negative shocks. It is important to introduce measures at an early stage in the build-up of vulnerabilities phase.61 This could help to curb the cycle and make the financial system more resilient to shocks. Measures introduced late in the cycle could, potentially, exacerbate the downturn and become pro-cyclical.
61 ESRB, “Handbook on operationalising macro-prudential policy in the banking sector”, Frankfurt am Main,
March 2014.

Report on vulnerabilities in the EU commercial real estate sector / November 2018 Policy analysis 70
Table 10 The relationship between CRE risks and vulnerabilities, policy objectives and policy instruments
Stretch Identified CRE risks and
vulnerabilities Policy priorities and objectives Potential policy actions and policy
instruments
Collateral
Exuberant CRE price growth.
Overvaluation of CRE.
Contain the risk of excessive and self-reinforcing leverage CRE price spirals by ensuring that credit standards and funding conditions remain appropriate.
Strengthen the resilience of banks and non-banks to the potential materialisation of risks related to CRE price reversals
Borrower-based measures:
- LTV, DSCR/ICR limits and mortgage lending value (national legislation).
Capital-based measures:
- Article 124(2) to increase SA RWs; - Article 164(5) to raise IRB-model LGDs.
Income and activity
CRE demand mainly driven by speculative motives.
Vulnerable financial positions of key market players (investors / construction firms / developers).
Excessive supply or demand imbalances stemming from cyclical dynamics.
Excessive supply or demand imbalances stemming from structural/technological changes in the economy.
Contain speculative demand.
Ensure that the financial position of agents is sound and resilient to adverse shocks (limit the build-up of excessive leverage by bank and non-bank investors).
Ensure smooth transition to new market/economic structure.
Borrower-based measures:
- LTV, DSCR/ICR limits and mortgage lending value (national legislation).
Non-macroprudential measures:
- Adjust tax policies (e.g. to discourage short-term CRE investments); - Adjust land and urban planning policies to prevent the build-up of excessive over-capacity (e.g. regulation flexibility with regard to converting premises).
Financing
Exuberant bank credit growth to CRE and RE companies (potential risk taking).
Loosening of bank lending standards to CRE/RE companies.
Exuberant lending to CRE and RE activities from non-bank market players (insurance and pension funds).
Excessively easy market funding conditions for CRE market players (bond and equity issuance for funds and firms active in CRE).
Increasing role of open-ended real estate investments funds
Contain the risk of excessive and self-reinforcing leverage and CRE price spirals.
Prevent excessive risk-taking by banks and their underpricing and underestimation of potential CRE-related lending losses.
Limit the growth of leverage of non-bank investors in CRE.
Encourage more diversified and stable sources of funding for CRE.
Contain buoyant and unsustainable growth of non-bank sources of financing.
Limit the risk of high liquidity needs for open-ended REIFs in stressed market conditions, which may lead to fire sales of the underlying assets and to a sudden decline in CRE prices.
Borrower-based measures:
- LTV, DSCR/ICR limits and mortgage lending value (national legislation).
Capital-based measures:
- Article 124(2) to increase SA RWs; - Article 164(5) to raise IRB-model LGDs.
Suspension of redemption and leverage limits on AIMFD and REITs (national legislation).
Potential for spillovers
Large concentrated exposures of banks to CRE and RE companies
Large concentrated exposures of non-banks to CRE
Large size of CRE sector relative to GDP.
Significant interconnectedness of CRE with other sectors of the economy
Contain excessive exposure of banks towards CRE.
Ensure that financial institutions are resilient to the potential materialisation of risks in the light of their exposures to CRE.
Capital-based measures:
- Higher own funds requirements for CRE exposures (Article 103 CRD IV); - Pillar 2 requirements for CRE exposures (Article 103 CRD IV); - Tightened large exposure limits (Article 458 of the CRR).
Other
Risk measurement uncertainty and potential unidentified risks due to data gaps.
Obtain data at a higher frequency and with broader geographical coverage and more subsector categories.
Enhance the risk identification and assessment framework.
In the case of data gaps: faster implementation of the ESRB recommendation for filling CRE data gaps.

Report on vulnerabilities in the EU commercial real estate sector / November 2018 Policy analysis 71
Capital-based measures increase banks’ resilience, and might also help to mitigate cyclical developments. Non-banks seem to be playing an increasingly important role in CRE markets (see Chapter 3), highlighting the need to investigate whether tools aimed at addressing sectoral risks and vulnerabilities related to CRE should be implemented beyond banking (Section 4.1). Although the increasing role of non-banks has given rise to new risks, the banking sector in many EU countries still constitutes the majority of overall CRE financing. However, as Section 4.1 highlights, the effectiveness of capital-based measures on influencing cyclical developments primarily depends on their impact on lending rates to CRE. However, there is limited empirical evidence of this impact in the case of CRE. Nevertheless, capital-based measures increase the resilience of the domestic banking sector. Consequently, based on the vulnerabilities that appear to be building up in EU CRE markets, it is important to investigate whether banks’ loss-absorbing capacities currently appear sufficient if potential losses are sustained in CRE markets, and how implemented macroprudential measures have affected current capital levels.
The overall resilience of the banking sector has improved in recent years, which has enhanced its capacity to withstand adverse shocks, including those stemming from the CRE sector. Various capital requirements for the banking sector have been implemented through CRD IV. Tier 1 capital ratios in the banking sector increased substantially in most EU countries between 2010 and the beginning of 2017 (Chart 31), and are now well above 15% in most countries. Moreover, leverage ratios also increased for most countries (Chart 32). It should be noted, however, that for most countries the increase in the banks’ leverage ratios has not been as large as the increase in their Tier 1 capital ratios implies. This indicates that the banks have more equity to absorb losses in the event of an adverse scenario. Even though the implemented capital requirements are not targeted at CRE markets specifically, the increased capital has also improved the capacity of the banking sector to withstand CRE shocks.
Chart 31 Banks’ Tier 1 ratios in EU countries
(Tier 1 capital to risk weighted assets; percentages)
Source: ECB Statistical Data Warehouse. Notes: Simple average of Tier 1 capital divided by risk weighted assets for banks in each country. Consolidated banking data for all domestic banking groups and standalone banks, foreign-controlled (EU and non-EU) subsidiaries and foreign-controlled (EU and non-EU) branches.
0
5
10
15
20
25
30
35
40
45
50
EE IE LT LU SE FI LV BG HR SI MT DK GR RO NL PL CZ SK DE BE CY AT UK HU FR PT IT ES
2017Q32014Q42010Q4

Report on vulnerabilities in the EU commercial real estate sector / November 2018 Policy analysis 72
Chart 32 Banks’ leverage ratios in EU countries
(total equity to total assets; percentages)
Source: ECB Statistical Data Warehouse. Notes: Simple average of total equity divided by total assets for banks in each country. Consolidated banking data for all domestic banking groups and standalone banks, foreign-controlled (EU and non-EU) subsidiaries and foreign-controlled (EU and non-EU) branches.
The increase in the risk weights for CRE exposures for banks using the standardised approach, the most commonly used CRE-related macroprudential measure, may not have contributed to significant increases in capital in a few countries. Eight countries have increased risk weights, using the standardised approach (SA), to over the 50% minimum required under EU regulation (see Section 4.2).62 However, an analysis of bank credit portfolios reveals that banks in many EU countries and Norway primarily use the IRB approach when calculating risk weights (Chart 33).63 Banks in three (Croatia, Poland and Romania) of the eight countries which increased risk weights to CRE exposures under the SA would appear to apply the SA exclusively. By contrast, in Sweden banks rely almost completely on the IRB approach, while in the United Kingdom, Norway and Latvia approximately 25-30% of credit exposures are subject to the SA. In Ireland, slightly more than 50% of credit exposures are subject to the SA. The increased risk weights for CRE exposures under the SA are therefore likely to be of limited effect in the latter five countries.64 However, even in the countries which apply only the SA, increasing risk weights to a minimum of 100% might have a limited effect, as only loans to companies with the best risk rating can have risk weights of below 100%, according to CRD IV.
62 Following the standardised approach, as defined in the CRR, exposures secured by CRE should be assigned a risk weight
(RW) of between 50% and 150% (Article 124). RWs of below 100% can only be assigned to these exposures if certain criteria are met (these criteria are described in Articles 126 and 208). Several countries have applied RWs which are higher than the minimum of 50%, either for financial stability considerations (Article 124) or because the criteria allowing the use of the minimum RWs have not been met.
63 Similar figures have also been found by Turk-Ariss, R., “Heterogeneity of Bank Risk Weights in the EU: Evidence by Asset Class and Country of Counterparty Exposure”, IMF Working Paper WP/17/137, 2017.
64 A more detailed analysis and comparison of the shares of CRE exposures using the two approaches would be warranted. This has, however, been impeded to some extent by the inconsistent treatment of CRE exposures using the two approaches, which is discussed above.
0
5
10
15
20
EE IE HR BG SI LV GR PL RO SK HU PT LT CY AT IT CZ ES LU BE MT UK FR DK NL DE SE FI
2017Q32014Q42010Q4

Report on vulnerabilities in the EU commercial real estate sector / November 2018 Policy analysis 73
Chart 33 Credit risk portfolios using an IRB and an SA approach
(percentage of credit portfolio)
Source: ESRB based on aggregated supervisory information (COREP) provided by the EBA. Notes: Countries providing only data for the standardised approach are not included in the chart. For each country the ratio between the following COREP series from Q4 2017 is calculated: risk weighted exposures using the standardised approach (SA) and using the internal ratings-based (IRB) approach (COREP Template C_02.00 data in Row 050 and 240).Figures across countries might differ due to differences in data coverage.
Only a few countries have adjusted risk weights for CRE exposures for banks using the IRB approach. So far, the United Kingdom is the only country that has increased risk weights – only for CRE loans for IRB banks. The Bank of England considers that, for the income-producing real estate asset class, it is particularly difficult to build effective rating systems which comply with the CRR’s requirements for the IRB approach.65 Banks in the United Kingdom therefore have to use a “slotting” exercise for CRE loans, and are required to assign one of four different risk weights, ranging from 50% to 250%, to their income-producing real estate loans.
In Sweden, tighter supervisory methods have also been adopted for banks' internal models for corporate exposures (including exposures to CRE). Swedish IRB banks should assume that at least every fifth year is a downturn year in probability of default calculations. Moreover, Article 164(5) of the CRR allows countries to set higher LGD values than the minimum floor of 15%. However, the option of increasing LGD values applies only to the retail portfolio and not to corporate loans, even though the majority of banks’ CRE exposures are in their corporate portfolio. This possible inconsistency was mentioned by the ESRB earlier.66
Most countries have not implemented any macroprudential measures to address current CRE vulnerabilities. Table 11 provides a joint overview of the average risk ratings from the scoreboard and the survey for the four stretches in the risk analysis framework as well as the macroprudential instruments, specifically targeted at CRE markets, which have been implemented
65 See Chapter 18 of the Bank of England, “Internal Ratings Based (IRB) approaches”, Supervisory Statement SS11/13,
London, October 2017. 66 See the ESRB’s response to the call for advice by the European Commission on macroprudential rules in the CRR/CRD,
30 April 2014, p. 24: “there might be an inconsistency in scope between Articles 124 and 164 CRR, the coverage of Article 164(4) CRR being limited to ‘retail exposures secured by immovable property’, while Article 124(2) CRR applies to ‘exposures secured by mortgages on immovable property’ in general.”
0
20
40
60
80
100
GR HU PT ES LU IE IT AT FR EU BE LV DE NO UK SK SE DK NL CZ
IRBSA

Report on vulnerabilities in the EU commercial real estate sector / November 2018 Policy analysis 74
by countries in recent years.67 Apart from increased risk weights, only a few measures have been implemented to specifically address CRE vulnerabilities. While increased risk weights may affect all stretches, they are considered to be best suited to increasing resilience in the banking sector, thereby addressing the potential for spillovers. As previously stated, borrower-based measures are viewed as better suited to appropriately impacting all stretches as they directly target the resilience of investors or have a direct impact on the flow of lending. However, only three countries have implemented borrower-based measures.
The various types of financing involved in CRE markets, such as investment funds and bond markets, add to the policy challenge of addressing CRE-related vulnerabilities. Excessively tight measures applied to banks might push CRE investors even further towards other types of financing, such as bond markets. This will reduce the effectiveness of the measures. Even though borrower-based measures might be extended to certain non-banks, such as insurers or pension funds, it will be difficult to apply these measures to bond markets, especially since bonds can be issued abroad. For CRE projects financed by both banks and other lenders, this could be addressed by requiring banks to include investors’ total debt, i.e. also bonds and other type of debt, to satisfy the borrower-based measures. However, it is difficult to address CRE projects leveraged in multiple layers, e.g. through complicated company structures or leveraged investors holding shares in REIFs. Strict regulation of banks could also drive more investors into using bond markets as their only source of debt financing. However, the bond markets are usually only available to larger investors, while smaller investors still need to be financed through banks or other financial institutions. Moreover, banks and other financial institutions may also acquire CRE bonds as an investment, potentially leading to financial stability risks which are similar to those that would arise if loans were provided directly by the financial institutions.
The significant role of cross-border activity in CRE markets also adds to the policy challenges. Reciprocity of measures in the EU limits leakages and regulatory arbitrage, although reciprocity is not required for all types of measures and is not extended to countries outside the EU. As Chapter 3 emphasises, many CRE investors are from outside the EU, and both domestic and foreign investors may also be able to finance their CRE investments in the EU through financial institutions located outside the EU. Hence, it is difficult to mitigate all types of leakages and regulatory arbitrage when implementing measures addressing CRE vulnerabilities. The international character of capital flows in the CRE market is one of the main challenges to implementing a macroprudential policy which successfully addresses the risks arising in this market. On these grounds, non-macroprudential measures might usefully address CRE risks, such as those related to large cross-border activities. For example, if CRE markets are highly volatile due to short-term investments, taxes could disincentivise these investments and could stabilise market developments. As an example of this, stamp duties on CRE transactions will increase transaction costs, which might heavily impact short-term profits from CRE investments. Corporate taxation, e.g. by reducing the deductibility of interest costs, or land taxation, could also reduce the attractiveness of CRE investments. However, taxes also lead to leakages so, for example, stamp duties and corporate taxes could be avoided by establishing firms for the sole purpose of owning a property. In addition to leakages, tax policy also needs to take other considerations into account, including
67 It should be noted that the average ratings from the scoreboard and the survey cover different aspects of the financial
sector. For example, in some countries average risk ratings are high due to vulnerabilities in the non-banking sector (e.g. rapid growth in REIFs). In these cases, measures increasing banking sector resilience or implementing borrower-based measures may not be the most appropriate.

Report on vulnerabilities in the EU commercial real estate sector / November 2018 Policy analysis 75
effectiveness, equal treatment of different assets and investors, and compliance and administration costs.
Nevertheless, the authorities can increase the resilience of their own financial systems by applying capital-based and borrower-based measures, where available, to domestic financial institutions. In some countries the domestic non-banking sector plays a larger role in the CRE market. To avoid arbitrage and leakages to the non-banking sector when capital-based measures for banks are tightened, it could be worth implementing the few measures available for non-banks, such as leverage limits for alternative investment funds. Some non-banking activity involves more equity, e.g. through REIFs. The main risk related to this is a run on the funds involved, which may be addressed by suspending redemption in the case of REIFs. In addition, borrower-based measures can be applied to a broader set of financial institutions, such as banks and insurance companies. Even though it is not possible to avoid all types of leakages and regulatory arbitrage, especially from abroad, a resilient domestic financial system is important. For example, a situation in which foreign investors withdraw their CRE investments may lead to fire sales and potentially large corrections in domestic CRE prices. This will also harm domestic investors and losses in domestic financial institutions might be incurred. Second round effects may also materialise, increasing the losses in the financial system. In such a situation, it is essential that the domestic financial system is resilient to safeguard financial stability and limit the impact on the real economy. However, the negative consequences of leakages and regulatory arbitrage for financial stability, e.g. the risks of significant substitution from domestic to foreign lending, should be taken into account before any measures are implemented.68
A combination of measures from different policy areas may be the most effective way to tackle risks and avoid leakages. Given that capital-based measures apply to banks, excessively strict risk weights for CRE loans could increase borrowing from non-banks. Borrower-based measures might also apply to some non-banks, but the lack of automatic and broad reciprocity of CRE measures as well as financing through bond markets and foreign investors may still lead to leakages. A combination of macroprudential policy measures may build up resilience among financial institutions, preventing risks and vulnerabilities from building up further and spreading across the financial system. More structural measures, such as tax and supply-side polices, could similarly influence investor incentives or supply and demand imbalances.
Finally, national authorities should, as a minimum, step up their monitoring of their CRE sector in order to reach a better understanding of its investor base and the interconnectedness of the CRE market. In order to facilitate this, it is important for authorities to work towards improving data availability, especially in line with the ESRB recommendation on closing data gaps.69 This applies to both national authorities and to European institutions, and cooperation between all institutions will be necessary in order to agree common definitions and improve comparability of data across countries and sources.
68 See also “Staff guidance note on macroprudential policy – detailed guidance on instruments”, International Monetary Fund,
Washington D.C., December 2014. 69 European Systemic Risk Board, “Recommendation on closing real estate data gaps”, Recommendation ESRB/2016/14,
October 2016.

Report on vulnerabilities in the EU commercial real estate sector / November 2018 Policy analysis 76
Table 11 Average risk ratings for the stretches and macroprudential measures specifically targeted at CRE markets
Country
Collateral stretch Income and activity
stretch Financing stretch Potential for spillovers
stretch
Scoreboard Survey Scoreboard Survey Scoreboard Survey Scoreboard Survey
AT
BE
BG
CY LTV and DSTI
LTV and DSTI
LTV and DSTI
LTV and DSTI
LTV and DSTI
LTV and DSTI
LTV and DSTI
LTV and DSTI
CZ
DE
DK DSTI (lending growth and exposure cap)
DSTI (lending growth and exposure cap)
DSTI (lending growth and exposure cap)
DSTI (lending growth and exposure cap)
DSTI, lending growth and exposure cap
DSTI, lending growth and exposure cap
DSTI, lending growth and exposure cap
DSTI, lending growth and exposure cap
EE
ES
FI
FR
GR
HR (RW) (RW) (RW) (RW) (RW) (RW) RW RW
HU
IE (RW) (RW) (RW) (RW) (RW) (RW) RW RW
IT
LT
LU (Exposure limit)
(Exposure limit)
(Exposure limit)
(Exposure limit)
(Exposure limit)
(Exposure limit)
Exposure limit
Exposure limit
LV (RW) (RW) (RW) (RW) (RW) (RW) RW RW
MT
NL
NO (RW) (RW) (RW) (RW) (RW) (RW) RW RW
PL LTV (and RW)
LTV (and RW)
LTV (and RW)
LTV (and RW)
LTV (and RW)
LTV (and RW)
RW and LTV
RW and LTV
PT
RO (RW) (RW) (RW) (RW) (RW) (RW) RW RW
SE (RW) (RW) (RW) (RW) (RW) (RW) RW RW
SI
SK
UK (RW) (RW) (RW) (RW) (RW) (RW) RW RW
Notes: The colours for the scoreboard and survey are the colours for the average ratings in Tables 3-6. The grey colouring indicates data gaps. Only measures specifically targeted at CRE markets are included in the table. Measures in bold are assessed as being the most appropriate for addressing a stretch, while measures in brackets could also have an effect (see Table 8 for a description of expected transmission mechanisms for different measures). The sufficiency of the measures is not assessed.

Report on vulnerabilities in the EU commercial real estate sector / November 2018 Policy analysis 77
4.4 Summary of the policy analysis
A number of instruments and measures are available to macroprudential authorities to address CRE-related vulnerabilities. Through CRD IV, EU legislation provides instruments that can address CRE-related vulnerabilities in the banking sector using capital-based measures, which include increased risk weights, LGD or own fund requirements. Moreover, the AIFMD includes instruments that can be used to address CRE-related vulnerabilities in investment funds through leverage limits as well as liquidity management tools such as the suspension of redemptions. Depending on the availability of borrower-based measures in national legislation, measures such as LTV limits and DSCR/ICR floors can also be used to address CRE-related vulnerabilities. Beyond macroprudential measures, countries can use other measures, such as microprudential measures to the extent that these pertain to institution-specific vulnerabilities as well as other policies, such as fiscal policy, to reduce CRE vulnerabilities. For example, taxes can influence relevant parties’ incentives (e.g. by discouraging short-term investments) to address CRE-related vulnerabilities that are, in particular, related to the increasing role of cross-border and foreign investments.
A few macroprudential measures have been implemented so far by ESRB member countries to directly target CRE vulnerabilities. The most commonly used measure has been an increase in the risk weights for CRE exposures to over the minimum (50%) required under EU regulation. The increased risk weights are usually applied following the standardised approach. Moreover, only three countries have implemented borrower-based measures, which are mainly implemented to address RRE risks. Importantly, almost no measures have been taken to address the increasing role of non-banks in CRE financing. Finally, although it was not targeted at CRE directly, some countries have partially explained their activation of the systemic risk buffer and the countercyclical capital buffer by referring to CRE-related vulnerabilities.
Current risks and vulnerabilities in EU CRE markets need to be addressed appropriately. In general, the suitability of a policy response depends on the nature of the identified risk or vulnerability. Borrower-based measures are appropriate when vulnerabilities stem from expanding CRE market developments, while capital-based measures may be more effective when vulnerabilities are within lenders. Ideally, any measure with macroprudential intent should also be introduced early in the upswing in order to be most effective. Currently, EU CRE markets are facing risks of a cyclical nature (e.g. high and rapidly increasing CRE prices, low yields, rapid growth in CRE investment transactions, some signs of an easing of lending standards, etc.). Borrower-based measures could, in these circumstances, be directed at the risky activity itself, and could counteract the build-up of financial imbalances by safeguarding prudent lending standards. Nevertheless, a great deal of flexibility should be applied to the calibration in order to handle the high degree of heterogeneity of CRE projects (e.g. different LTV limits in different segments or the usage of speed limits), but the calibration is also complicated by the existing data gaps. Borrowers may also obtain financing from abroad. While the reciprocity of measures in the EU limits potential leakages and regulatory arbitrage, reciprocity is not required for all types of measures and is not extended to countries outside the EU.
Capital-based measures will increase the resilience of the banking sector. Although there is limited empirical evidence of capital-based measures’ influence on cyclical developments in CRE markets, these measures will increase the resilience of the banking sector. The effective regulation of risk weights for CRE exposures in many EU countries would require adjustments under the IRB approach, given that in many countries risk weights for most of the banks’ exposures are based on

Report on vulnerabilities in the EU commercial real estate sector / November 2018 Policy analysis 78
IRB models while, currently, most countries implement measures to increase CRE risk weights following the standardised approach. However, EU legislation places limits on the possibility of countries’ correcting or increasing risk weights for IRB banks in order to address CRE vulnerabilities.
Given the rising importance of non-bank and cross-border financing in CRE markets, it is also important to investigate whether new instruments should be made available and, also, implemented beyond banking. The greater role played by non-banks and cross-border investors since the global financial crisis is likely to open up new channels for the transmission of CRE shocks to the financial sector and the real economy, so it is important to investigate whether new instruments should be made available and, also, implemented for a range of institutions beyond banking. For example, when more equity is involved in the financing (e.g. through open-ended REIFs as is currently the case in the EU), the main risk is a run on the funds involved. Therefore, if current market conditions deteriorate it is important that measures such as the suspension of redemptions can be implemented at short notice, to limit the risk of fire sales of CRE in EU-based funds. From a policy perspective, another possible complication arises when CRE projects are financed in bond markets or leveraged in multiple layers, e.g. through complicated company structures or leveraged investors holding shares in REIFs. A combination of macroprudential measures as well as measures from other policy areas may therefore be the most effective way to tackle risks and avoid leakages.
As a minimum, national authorities should monitor their CRE markets more intensively and should step up the work they do to fill current data gaps. Current developments in Europe underline how important it is for the authorities to remain vigilant in respect of potential financial stability risks stemming from CRE markets, and to consider potential policy actions that could address CRE risks and vulnerabilities. It is therefore important for national authorities to monitor their CRE sectors more intensively. They should strive to reach a better understanding of the investor base and funding sources and improve their knowledge of the interconnectedness of their domestic CRE market with other CRE markets across Europe. This includes national authorities improving their understanding of how developments in CRE markets and the actions of CRE investors can be transmitted in a way that could lead to adverse developments in the financial system and the real economy. Stress testing could also be used in order to assess the resilience of financial institutions or market participants to adverse market developments in CRE markets. Needless to say, increased monitoring and analysis requires more granular data in order to be comprehensive. Countries with significant data gaps should therefore step up their efforts to improve data availability in accordance with, in particular, the ESRB’s recommendation on closing real estate data gaps.

Report on vulnerabilities in the EU commercial real estate sector / November 2018 Conclusion 79
Commercial real estate (CRE) markets are important for financial stability due to their size and their high degree of interconnectedness with both the financial system and other parts of the real economy. Although it is rare for CRE markets alone to trigger a financial crisis, they represent an important source of systemic risk. Past crises episodes, including the recent global financial crisis, have shown that disorderly adjustments in CRE markets can play an important role in financial stability. During the crisis, activity in CRE markets fell, as did CRE prices. However, in recent years activity in CRE markets has increased, coupled with rapid CRE price growth and low yields.
From a financial stability perspective, the main source of vulnerability identified in CRE markets across several EU countries relates to investors’ search for yield in the low interest rate environment. This has increased CRE prices and made them potentially vulnerable to a repricing of risk premia. The search for yield has contributed to a combination of high CRE prices and low CRE yields, by historical standards, across several EU countries, especially in the prime segments.
At this juncture, a repricing of risk premia could therefore act as a common trigger, potentially causing investors to rapidly unwind their exposures from several CRE markets simultaneously. A reassessment of risk premia could potentially lead to significant decreases in investors’ future expected cash flows. This could act as a common trigger of abrupt and widespread price reversals alongside a correlated unwinding of positions of high-yield and risky assets, including CRE.
There are a number of transmission channels through which such adverse developments in the CRE sector might have a systemic impact on the financial system and the real economy. A direct channel would be through lenders providing CRE loans. Although the share of other forms of CRE financing is increasing, banks continue to finance a significant proportion of CRE activities, and they hold the dominant share of existing loan stock. In some EU countries CRE-related bank lending has also increased rapidly, although this does not appear to be widespread across the EU.
Although they have the potential to increase risk sharing and reduce spillovers, changes to the investor base also open up additional transmission channels through which CRE shocks can impact financial stability. One risk-mitigating factor is that there is some evidence that there has been more equity financing of CRE investments since the global financial crisis. Moreover, non-banks and foreign investors, including those from outside Europe, now play a greater role in CRE markets than they did before the crisis. The increasing role of non-bank funding sources and the large proportion of foreign investors could increase risk sharing, as losses from CRE can be spread across numerous entities and countries. However, foreign investors can also increase the risk of rapid price corrections, since they may decide to remove their funds quickly if yield prospects become more favourable elsewhere or if market uncertainty rises. Foreign investors may also cause countries’ CRE cycles to become more synchronous and, hence, may cause domestic CRE markets to become more vulnerable to global risk factors. In addition, investment vehicles, such as open-ended REIFs, face redemption risks that can lead to CRE price corrections if funds are forced to sell their assets rapidly.
Conclusion

Report on vulnerabilities in the EU commercial real estate sector / November 2018 Conclusion 80
There are some measures available to macroprudential authorities to mitigate CRE related financial stability risks, although only a few ESRB member countries have implemented these. So far, ESRB member countries have mainly implemented capital-based measures, which primarily increase the resilience of the banking sector. Borrower-based measures, where available under national legislation, may also be used to tackle current vulnerabilities in EU CRE markets, as they can target the risky activity itself and counteract the build-up of financial imbalances by safeguarding prudent lending standards and influencing the supply of or demand for credit. Moreover, given the rising importance of non-bank financing in CRE markets, it is important to investigate whether new instruments should be made available and also implemented beyond banking. In addition, the international character of capital flows in the CRE market is one of the main challenges facing the conduct of successful macroprudential policy in respect of the risks arising from this market. A great deal of flexibility in calibrating the measures is also important to handle the high degree of heterogeneity in CRE projects, and a combination of measures may be the most effective way to tackle risks. In addition, all measures apply mainly to domestic financial institutions, but may be extended to other EU countries through reciprocity if this is possible. However, there are limited opportunities for addressing the increasing role of investors outside the EU, as well as investors financed in bond markets or leveraged in multiple layers. A combination of measures, both macroprudential and those from other policy areas, may therefore be the best way to tackle risks and avoid leakages.
Analyses of CRE markets are significantly hampered by the scarcity of accurate and comparable data. While it is possible to identify certain common risks and vulnerabilities in EU CRE markets, the scarcity of data makes it more difficult to carry out a detailed analysis of vulnerabilities at the country level. In addition to data gaps, limited experience of the use of CRE-related macroprudential measures complicates the policy analysis. Nevertheless, current developments in Europe highlight how important it is for authorities to increase their monitoring of CRE markets and improve their understanding of transmission channels, and to intensify their efforts to improve data availability, in accordance with the ESRB recommendation on closing real estate data gaps.

Report on vulnerabilities in the EU commercial real estate sector / November 2018 References 81
Aizenman, J. and Jinjarak, Y. (2009), “Current account patterns and national real estate markets”, Journal of Urban Economics, Vol. 66(2), pp. 75-89.
Aizenman, J. and Jinjarak, Y. (2014), “Real estate valuation, current account and credit growth patterns, before and after the 2008-9 crisis”, Journal of International Money and Finance, Vol. 48, pp. 249-270.
Auer, R. and Ongena, S. (2016), “The countercyclical capital buffer and the composition of bank lending”, Bank for International Settlements Working Papers, No 593, December.
Bank of England (2017), “Internal Ratings Based (IRB) approaches”, Supervisory Statement SS11/13, London, October.
Bank of England (2017), ‘’Stress testing the UK banking system: 2017 results’’, London, November..
Basel Committee on Banking Supervision (2017), “Basel III: Finalising post-crisis reforms”, December.
Basset, W. and Marsh, B. (2017), “Assessing targeted macroprudential financial regulation: The case of the 2006 commercial real estate guidance for banks”, Journal of Financial Stability, Vol. 30, pp. 209-228.
Bruno, V. and Shin, H.S. (2015), “Cross-Border Banking and Global Liquidity”, Review of Economic Studies, Vol. 82(2), pp. 535-564.
Bruno, V. and Shin, H.S. (2015), “Capital Flows and the Risk-taking Channel of Monetary Policy”, Journal of Monetary Economics, Vol. 71, pp. 119-132.
Central Bank of Ireland (2011), “Valuation Processes in the Banking Crisis – Lessons Learned – Guiding the Future”, Dublin, December.
Cheshire, P. and Hilber, C. (2008), “Office Space Supply Restrictions in Britain: the Political Economy of Market Revenge”, The Economic Journal, Vol. 118(529), pp. F185-F221.
Committee on International Economic Policy and Reform (2012), “Banks and Cross-Border Capital Flows: Policy Challenges and Regulatory Responses”, Washington D.C., September.
Cushman and Wakefield (2017), “Investment Atlas summary 2017”, March.
Englund, P. (1999), “The Swedish Banking Crisis: Roots and Consequences”, Oxford Review of Economic Policy, Vol. 15(3), pp. 80-97.
European Central Bank (2017), “Financial Stability Review”, Frankfurt am Main, November.
European Systemic Risk Board (2014), “Handbook on operationalizing macro-prudential policy in the banking sector”, Frankfurt am Main, March 2014.
References

Report on vulnerabilities in the EU commercial real estate sector / November 2018 References 82
European Systemic Risk Board (2015), “Report on commercial real estate and financial stability in the EU”, Frankfurt am Main, December.
European Systemic Risk Board (2016), “Macroprudential policy issues arising from low interest rates and structural changes in the EU financial system”, Frankfurt am Main, November.
European Systemic Risk Board (2016), “Recommendation of The European Systemic Risk Board of 31 October 2016 on closing real estate data gaps (ESRB/2016/14)”, Frankfurt am Main, October.
European Systemic Risk Board (2016), “Vulnerabilities in the EU residential real estate sector”, Frankfurt am Main, November.
European Systemic Risk Board (2017), “EU Shadow Banking Monitor”, Frankfurt am Main, May.
European Systemic Risk Board (2018), “Adverse macro-financial scenario for the 2018 EU-wide banking stress test”, Frankfurt am Main, January.
European Systemic Risk Board (2018), “Recommendation on leverage and liquidity risks in investment funds”, (ESRB/2017/6), Frankfurt am Main, February.
Ferrero, A. (2015), “House Price Booms, Current Account Deficits, and Low Interest Rates”, Journal of Money, Credit and Banking, Vol. 47(1), pp. 261-293.
Fessenden H. and Muething, C. (2017), “Understanding the Surge in Commercial Real Estate Lending”, Federal Reserve Bank of Richmond Economic Brief, 17-08.
Fratzscher, M. (2012), “Capital flows, push versus pull factors and the global financial crisis”, Journal of International Economics, Vol. 88, pp. 341-356.
Hagen, M. and Hansen, F. (2018), “Driving forces behind European commercial real estate prices prior to a sharp fall in prices”, Norges Bank Staff Memo, No 1.
HCSF (2017), ‘’French commercial real estate market: Updated analysis and stress test results’’, Paris, March.
Herring, R. and Wachter, S. (1999), “Real Estate Booms and Banking Busts: An International Perspective”, Wharton School Research Paper, No 99-27.
Houston, J., Lin, C. and Ma, Y. (2012), "Regulatory Arbitrage and International Bank Flows”, Journal of Finance, Vol. 67(5), pp. 1845-1895.
International Monetary Fund (2014), “Staff Guidance Note on Macroprudential Policy – Detailed Guidance on Instruments”, Washington, D.C., December.
Jara, A. and Olaberría, E. (2013), “Are all Capital Inflows Associated with Booms in House Prices? An Empirical Evaluation”, Central Bank of Chile Working Paper 696.
Jordà, O., Schularick, M. and Taylor, A. M. (2011), “Financial Crises, Credit Booms, and External Imbalances: 140 Years of Lessons”, IMF Economic Review, Palgrave Macmillan, International Monetary Fund, Vol. 59(2), pp. 340-378.

Report on vulnerabilities in the EU commercial real estate sector / November 2018 References 83
Jordà, O., Schularick, M. and Taylor, A. M. (2016), “The Great Mortgaging: Housing Finance, Crises and Business Cycles”, Economic Policy, Vol. 31, Issue 85, pp. 107-152.
Kim, L. (2004), “Time-Varying Macroeconomic Risk and Commercial Real Estate: An Asset Pricing Perspective”, Journal of Real Estate Portfolio Management, Vol. 10(1), pp. 47-57.
Kuttner, K. and Shim, I. (2016), “Can non-interest rate policies stabilize housing markets? Evidence from a panel of 57 economies”, Journal of Financial Stability, Vol. 26, pp. 31-44
Lane, P. (2014), “International Financial Flows and the Irish Crisis”, CESifo Forum 2/2014.
Milesi-Ferretti, G. and Tille, C. (2011), “The Great Retrenchment: International Capital Flows during the Global Financial Crisis”, Economic Policy, Vol 26, No 66, pp. 285-342.
Olszewski, K. (2013), “The Commercial Real Estate Market, Central Bank Monitoring and Macroprudential Policy”, Review of Economic Analysis, Vol. 5, pp. 213-250.
Rey, H. (2015), “Dilemma not Trilemma: The Global Financial Cycle and Monetary Policy Independence”, NBER Working Paper 21162.
Tiwari, P. and White, M. (2010), “International Real Estate Economics”, Palgrave Macmillan, London.
Turk-Ariss, R. (2017), “Heterogeneity of Bank Risk Weights in the EU: Evidence by Asset Class and Country of Counterparty Exposure”, IMF Working Paper, No 17/137.

Report on vulnerabilities in the EU commercial real estate sector / November 2018 Annex 84
A.1 Indicators in the scoreboard
Table A.1 Overview of indicators used in the scoreboard
Indicator Description Threshold1)
(1)
Real CRE price index growth over the last year
The indicator measures growth in CRE prices. If price growth does not reflect underlying market fundamentals then the market may be prone to sudden, rapid adjustments. The calculation of the indicator is based on the annual growth rate of the CRE price index, net of inflation.
Data have been compiled from commercial data supplied by MSCI. The data are heterogeneous in terms of whether transaction or valuation-based methodologies are used (depending on country preferences). Comparisons between countries or between different sources within individual countries should therefore be made with caution. Annual series are calculated based on the annual quarterly averages of the time series available.
Unit of measurement: annual growth in %
Codes in SDW for CRE:
CPP.A.??.N.VB.CVAL.TP.5.INX for AT, BE, CZ, FR, HU, PT and ES (where “??” is a country code)
CPP.A.??.N.TH.TVAL.TP.5.INX for NL, SE, IE and FR
CPP.A.??.N.TB.TVAL.TP.2.INX for DK, IT and PL
CPP.Q.DE.N.TH.TVAL.TP.3.INX for DE
CPP.Q.GB.N.TH.TVAL.TP.5.INX for GB
CPP.A.I8.N.TH.TVAL.TP.3.INX for EA
Codes in SDW for inflation rate: ICP.M.??.N.000000.4.ANR (where “??” is a country code)
Thresholds are defined as percentiles based on the historical and cross-country distribution of the real price changes:
T1: ≥ 1%
T2: ≥ 3%
T3: ≥ 7%
(2)
Ratio of current real CRE price index to historical maximum
The indicator measures the ratio of the CRE price index to its historical maximum. Prices close to previous peak levels could be unsustainable. The historical maximum price has been adjusted using an inflation index. The same data caveats apply as for indicator 1.
Unit of measurement: % of peak value
Codes in SDW: Same as for indicator 1.
Thresholds are defined as prices as a share of historical peak values:
T1: ≥ 80%
T2: ≥ 90%
T3: ≥ 95%
(3)
Real prime CRE price index growth over the last year
The indicator measures growth in prime CRE prices, expressed as the annual growth of the average retail and office capital value index, net of inflation. If price growth does not reflect underlying market fundamentals then the market may be prone to sudden, rapid adjustments. The index is the ratio of current and previous capital value (local currency/m2) multiplied by the previous value of the index.
Unit of measurement: %
Source: ECB calculations based on Jones Lang LaSalle data and SDW
Codes in SDW for inflation rate: ICP.M.??.N.000000.4.ANR (where “??” is a country code)
Thresholds are defined as large percentiles based on the historical and cross-country distribution of the real price changes:
T1: ≥ 5%
T2: ≥ 10%
T3: ≥ 20%
Annex

Report on vulnerabilities in the EU commercial real estate sector / November 2018 Annex 85
Indicator Description Threshold1
(4)
Ratio of current real prime CRE price index to historical maximum
The indicator measures the ratio of the average prime office and retail capital value index to the historical maximum for this index. The historical maximum price has been adjusted using an inflation index. The source of the data is the same as for indicator 3.
Coverage varies between countries. The data series starts in 1998 for all countries except Finland (1999), Greece (1999), Hungary (2002) and Portugal (2003).
Unit of measurement: % of peak value
Source: ECB calculation based on Jones Lang LaSalle data and SDW
Codes in SDW for inflation rate: ICP.M.??.N.000000.4.ANR (where “??” is a country code)
Thresholds are defined as prices as a share of historical peak values:
T1: ≥ 80%
T2: ≥ 90%
T3: ≥ 95%
(5)
Yield deviation from historical average (since 1997)
The indicator measures the difference between office and retail prime yields (calculated as an average of the two individual yields from these categories) and the historical average of those yields (since 1999 for Greece, 2002 for Portugal and 1997 for the rest of the countries). A decline in yields indicates a fall in the return generated by investors. Low returns could make the market more vulnerable to a sudden, rapid price adjustment if more profitable opportunities were to emerge. However, the deviation between yields and their historical averages will also be influenced by the interest rate environment.
The prime yield represents Jones Lang LaSalle’s “market view”, based on a combination of market evidence (where available) and a survey of expert opinion. This yield represents the best (i.e. lowest) “rack-rented” yield estimated to be achievable for a notional property of the highest quality and specification in the best location in a market, as at the survey date (normally at the end of each quarter). The representative property should be let at the prevailing market rent to a first class tenant with an occupational lease that is standard for the local market. The prime initial net yield is quoted, i.e. the initial net income at the date of purchase expressed as a percentage of the total purchase price (including acquisition costs and transfer taxes).
Unit of measurement: basis points
Source: ECB calculations based on Jones Lang LaSalle data
Thresholds are defined as a ‘larger’ deviation of CRE yields from historical norms. The deviation is defined using the historical and cross-country distribution of the yield deviation:
T1: ≤ -45%
T2: ≤ -70%
T3: ≤ -130%
(6)
Deviation between current and historical (since 1997) commercial real estate yield and government bond spread
The indicator measures the spread between current CRE prime yields and government bonds, and compares it with its historical average (since 1999 for Greece, 2002 for Portugal and 1997 for the rest of the countries). This indicator measures the size of the risk premium for CRE relative to its historical average. A low risk premium suggests that investors are not fully taking CRE-related risks into account when purchasing assets, making them more vulnerable to sudden, rapid price adjustments. However, it could also reflect the fact that risks linked to CRE have declined.
Unit of measurement: basis points
Source: ECB calculation based on Jones Lang LaSalle and Bloomberg data
Thresholds are defined as a ‘larger’ deviation of spreads between CRE yields and government bond yields from historical averages. The deviation is defined using the historical and cross-country distribution of the spread:
T1: ≤ 25%
T2: ≤ -10%
T3: ≤ -60%
(7)
Prime yields (office and retail)
The indicator measures the average yield from prime office and retail properties. A decline in yields indicates a fall in the return generated by investors. Low returns could make the market more vulnerable to a sudden, rapid price adjustment if more profitable opportunities were to emerge. However, the deviation between yields and their historical averages will also be influenced by the interest rate environment.
Unit of measurement: %
Source: ECB calculation based on Jones Lang LaSalle data
Thresholds are defined as large percentiles based on the historical and cross-country distribution of prime yields:
T1: ≤ 5%
T2: ≤ 4.6%
T3: ≤ 4.15%

Report on vulnerabilities in the EU commercial real estate sector / November 2018 Annex 86
Indicator Description Threshold1
(8)
Investment transactions’ growth over the last 12 months
The indicator measures the growth rate of the four-quarter moving average for investment transactions. Data on investment transactions cover all CRE transactions carried out by professional CRE investors. High transaction growth suggests that market activity and investor demand are increasing.
Unit of measurement: %
Source: Cushman & Wakefield
Thresholds are defined as large percentiles based on the historical and cross-country distribution of the variation in investment transactions:
T1: ≥ 25%
T2: ≥ 50%
T3: ≥ 80%
(9)
Investment transaction as a share of GDP
The indicator measures the relationship between the four-quarter moving average for investment transactions and the level of GDP in a given quarter. Investment transaction data cover all CRE transactions carried out by professional CRE investors. Large and growing transactions and values relative to the size of the market suggest a pickup in investor activity, which may lead to overheating.
Unit of measurement: %
Source: Cushman & Wakefield
Thresholds are defined as large percentiles based on the historical and cross-country distribution of the investment transactions relative to GDP:
T1: ≥ 0.3%
T2: ≥ 0.85%
T3: ≥ 1.35%
(10)
Average vacancy rates across cities
The indicator measures the average vacancy rate across the largest cities in a given country. High vacancy rates suggest that end-user demand is low. As a consequence investor returns are likely to be more fragile, and there is potential for oversupply.
The data is from Q3 2017.
Unit of measurement: %
Source: Savills
The thresholds are based on expert judgement:
T1: ≥ 8%
T2: ≥ 10%
T3: ≥ 12%
(11)
Real estate investment funds’ growth over the last 12 months
The indicator measures the annual growth of real estate investment funds. Growth in real estate investment funds suggests that their investors are becoming more active in the market and that their exposures are increasing.
Real Estate Investment Trusts are only included in these data for some countries, as REITS are defined by national legislation and this has not been harmonised across the EU. REITS are therefore considered to be investment funds in some countries, but not in others.
Unit of measurement: %
Codes in SDW:
IVF.M.??.N.40.L30.A.I.Z5.0000.Z01.A (where “??” is a country code)
Data for BG are from the Bulgarian National Bank.
Thresholds are defined as large percentiles based on the historical and cross-country distribution of the growth in investment funds:
T1: ≥ 10%
T2: ≥ 15%
T3: ≥ 20%
(12)
Bank lending collateralised by CRE, annual growth
The indicator measures the annual growth rate for loans collateralised by CRE, calculated as the ratio of the data reported in one quarter to that for the same quarter one year before. Increases in bank lending suggest that banks are becoming more active in the CRE market and that their risks are increasing.
Data refer to loans collateralised by CRE, which are taken from “Loans collateralised by commercial immovable property”, from “Loans and advances” under “Information on performing and non-performing exposures” (FINREP Template 18.00.a, Row 140, Column 010). Data are based on consolidated reporting for all institutions reporting in the FINREP template. Figures across countries might differ due to the use of different templates or different bank coverage in FINREP. Country-specific notes and discrepancies are outlined in the country pages. The robustness of the assessment was checked in the case of discrepancies.
Unit of measurement: %
Source: ECB/ESRB calculations based on aggregated supervisory information (FINREP) provided by the European Banking Authority (EBA).
The thresholds are based on expert judgement:
T1: ≥ 5%
T2: ≥ 10%
T3: ≥ 15%

Report on vulnerabilities in the EU commercial real estate sector / November 2018 Annex 87
Indicator Description Threshold1
(13)
Bank loans collateralised by CRE as a share of total loans
The indicator measures the proportion of total bank loans that is collateralised by CRE. A high share of loans collateralised by CRE of total loans suggests that banks are highly exposed to this market, and would therefore be at a greater risk of incurring a substantial loss if risks were to materialise.
The indicator is calculated as the ratio between loans collateralised by CRE and total loans, for the same quarter. Loans collateralised by CRE are taken from “Loans collateralised by commercial immovable property”, from “Loans and advances ” under “Information on performing and non-performing exposures” (FINREP Template 18.00.a, Row 140, Column 010) and total loans are “Loans and advances” under “Information on performing and non-performing exposures” (FINREP Template 18.00.a, Row 70, Column 010). It therefore represents a proxy for the proportion of loans made to CRE by banks. Data are based on consolidated reporting for all institutions reporting in the FINREP template. Figures across countries might differ due to the use of different templates or different bank coverage in FINREP. Country-specific notes and discrepancies are reported in the country pages. The robustness of the assessment was checked in the case of discrepancies.
Unit of measurement: %
Source: ECB/ESRB calculations based on aggregated supervisory information (FINREP) provided by the European Banking Authority (EBA).
The thresholds are based on expert judgement:
T1: ≥ 10%
T2: ≥ 20%
T3: ≥ 30%
(14)
Bank exposures collateralised by commercial property as a share of Tier 1 capital
The indicator measures the ratio of total exposures collateralised by immovable commercial property (in thousands of euros) to Tier 1 Capital (in thousands of euros). A high exposure to CRE compared with capitalisation suggests that banks are highly exposed to this market, and would therefore run a greater risk of incurring a substantial loss if risks materialised.
Unit of measurement: %
Codes in SDW:
CBD2.A.??.??.67._Z._Z.A.A.E1020._X.ALL.EV._Z.LE._T.EUR
for total exposures, where “??” is a country code,
CBD2.A.??.W0.67._Z._Z.A.A.O1000._X.ALL.CM._Z.LE._T.EUR
for Tier 1 Capital, where “??” is a country code
Thresholds are defined as ‘large’ values of exposures compared to capital (Tier1) by using expert judgment:
T1: ≥ 50%
T2: ≥ 75%
T3: ≥ 100%
(15)
Real estate investment funds’ size as a share of GDP
The indicator measures the ratio of investment fund shares/units to the level of annual GDP. Large exposures of investment funds compared with the size of the economy suggest that there could be a high risks of spillovers to the real economy if CRE risks materialised.
Real estate investment trusts are only included in this data for some countries, as REITS are defined by national legislation, which has not been harmonised across the EU. Therefore, in some countries REITS are considered to be investment funds, while in others they are not.
Unit of measurement: %
Codes in SDW:
IVF.M.??.N.40.L30.A.1.Z5.0000.Z01.E
for funds size, where “??” is a country code
For BG we use data coming from the BNB
MNA.A.N.??.W2.S1.S1.B.B1GQ._Z._Z._Z.XDC.V.N
for GDP, where “??” is a country code
The thresholds are based on expert judgement:
T1: ≥ 2.5%
T2: ≥ 5%
T3: ≥ 10%

Report on vulnerabilities in the EU commercial real estate sector / November 2018 Annex 88
Indicator Description Threshold1
(16)
Exposure of insurers as a share of total assets
The indicator is based on Solvency 2 data and is the ratio of the stock of property investments in CRE (including for own use) and mortgages other than those for natural persons of insurance companies, to their total assets, excluding index-linked and unit-linked assets. Large exposures of insurers compared with their total assets suggest that they are more exposed to CRE and would therefore risk suffering relatively larger loss if CRE risks materialised.
Unit of measurement: %
Source: ECB/ESRB calculations based on information provided by the European Insurance and Occupational Pensions Authority (EIOPA).
Thresholds are based on expert judgement:
T1: ≥ 2.5%
T2: ≥ 5.0%
T3: ≥ 10.0%
(17)
Total market size estimate as a share of GDP
This indicator measures the size of the CRE market relative to GDP. A large CRE market generates more opportunities for spillovers to the real economy if CRE risks materialise.
The market size is the estimated market value of the whole invested CRE market. Invested commercial property is the share of the overall CRE market which is not owner-occupied, but is owned by professional real estate investors for investment purposes.
Unit of measurement: %
Source: ECB/ESRB calculations based on information from Morgan Stanley Capital International (MSCI).
The thresholds are based on expert judgement:
T1: ≥ 15%
T2: ≥ 20%
T3: ≥ 25%
1) When thresholds are calculated on the basis of statistical distributions, they are generally associated with values close to the 60th, the 75th and the 90th percentiles of the pooled distribution across countries.

Report on vulnerabilities in the EU commercial real estate sector / November 2018 Contents 89
Table A2 Date of indicators reported in the scoreboard
Country
Real CRE price index
change over the last 12 months
Ratio of current
real CRE price
index to historical maximum
Real prime
CRE price index
change over the last 12 months
Ratio of current
real prime CRE price index to
historical maximum
Yield deviation
from historical average
Deviation between
current and historical CRE yield
and government
bond spread
Prime yields (office
and retail)
Investment transaction
growth over the last 12 months
Investment transactions as share of
GDP
Vacancy rate (avg.
across cities)
Real estate investment
funds’ growth over the last 12 months
CRE lending collateralised
by CRE, annual growth
Loans collateralised by CRE as a share of total
loans
Bank exposures
collateralised by CRE as
share of Tier 1 capital
Real estate investment funds’ size as share of
GDP
Exposure of
insurers as a share
of total assets
Total market
size estimate
as a share of GDP
AT 31/12/2016 31/12/2016 31/12/2017 31/12/2017 31/12/2017 30/06/2017 31/12/2017 30/09/2016 30/09/2016 30/09/2017 31/12/2017 31/12/2017 31/12/2017 31/12/2016 31/12/2016 31/03/2017 31/12/2016
BE 31/12/2016 31/12/2016 31/12/2017 31/12/2017 31/12/2017 31/12/2017 31/12/2017 30/09/2016 30/09/2016 30/09/2017 31/12/2017 31/12/2017 31/03/2017 31/12/2016
BG 31/03/2017 31/12/2017 31/12/2017 31/12/2016 31/12/2016 31/03/2017
CY 31/12/2017 31/12/2017 31/12/2016 31/03/2017
CZ 31/12/2016 31/12/2016 31/12/2017 31/12/2017 31/12/2017 31/12/2017 31/12/2017 30/09/2016 30/09/2016 31/12/2017 31/12/2017 31/12/2017 31/12/2016 31/12/2016 31/03/2017 31/12/2016
DE 31/12/2016 31/12/2016 31/12/2017 31/12/2017 31/12/2017 31/12/2017 31/12/2017 30/09/2016 30/09/2016 30/09/2017 31/12/2017 31/12/2017 31/12/2017 31/12/2016 31/12/2017 31/03/2017 31/12/2016
DK 31/12/2017 31/12/2017 31/12/2017 31/12/2017 31/12/2017 31/12/2017 31/12/2017 30/09/2016 30/09/2016 30/09/2017 31/12/2017 31/12/2017 31/12/2016 31/03/2017 31/12/2016
EE 31/12/2017 31/12/2017 31/12/2017 31/12/2016 31/12/2016 31/03/2017
ES 31/12/2016 31/12/2016 31/12/2017 31/12/2017 31/12/2017 31/12/2017 31/12/2017 30/09/2016 30/09/2016 30/09/2017 31/12/2017 31/12/2017 31/12/2017 31/12/2016 31/12/2016 31/03/2017 31/12/2016
FI 31/12/2017 31/12/2017 31/12/2017 31/12/2017 31/12/2017 30/09/2016 30/09/2016 30/09/2017 31/12/2017 31/12/2017 31/12/2017 31/12/2016 31/12/2016 31/03/2017 31/12/2016
FR 31/12/2017 31/12/2017 31/12/2017 31/12/2017 31/12/2017 31/12/2017 31/12/2017 30/09/2016 30/09/2016 30/09/2017 31/12/2017 31/12/2017 31/12/2017 31/12/2016 31/12/2016 31/03/2017 31/12/2016
GR 31/12/2017 31/12/2017 31/12/2017 31/12/2017 31/12/2017 30/09/2016 30/09/2016 31/12/2017 31/12/2017 31/12/2017 31/12/2016 31/12/2016 31/03/2017
HR 31/12/2017 31/12/2017 31/12/2016 31/03/2017
HU 31/12/2016 31/12/2016 31/12/2017 31/12/2017 31/12/2017 31/12/2017 31/12/2017 30/09/2016 30/09/2016 31/12/2017 31/12/2017 31/12/2017 31/12/2016 31/12/2016 31/03/2017 31/12/2016
IE 31/12/2017 31/12/2017 31/12/2017 31/12/2017 31/12/2017 31/12/2017 31/12/2017 30/09/2016 30/09/2016 30/09/2017 31/12/2017 31/12/2017 31/12/2017 31/12/2016 31/12/2016 31/03/2017 31/12/2016
IT 31/12/2017 31/12/2017 31/12/2017 31/12/2017 31/12/2017 31/12/2017 31/12/2017 30/09/2016 30/09/2016 30/09/2017 31/12/2017 31/12/2017 31/12/2017 31/12/2016 31/12/2016 31/03/2017 31/12/2016
LT 31/12/2017 31/12/2017 31/12/2017 31/12/2016 31/12/2016 31/03/2017

Report on vulnerabilities in the EU commercial real estate sector / November 2018 Contents 90
Country
Real CRE price index
change over the last 12 months
Ratio of current
real CRE price
index to historical maximum
Real prime
CRE price index
change over the last 12 months
Ratio of current
real prime CRE price index to
historical maximum
Yield deviation
from historical average
Deviation between
current and historical CRE yield
and government
bond spread
Prime yields (office
and retail)
Investment transaction
growth over the last 12 months
Investment transactions as share of
GDP
Vacancy rate (avg.
across cities)
Real estate investment
funds’ growth over the last 12 months
CRE lending collateralised
by CRE, annual growth
Loans collateralised by CRE as a share of total
loans
Bank exposures
collateralised by CRE as
share of Tier 1 capital
Real estate investment funds’ size as share of
GDP
Exposure of
insurers as a share
of total assets
Total market
size estimate
as a share of GDP
LU 31/12/2017 31/12/2017 31/12/2017 31/12/2017 30/09/2016 30/09/2016 31/12/2017 31/12/2016 31/12/2016 31/03/2017
LV 31/12/2017 31/12/2017 31/12/2016 31/12/2016 31/03/2017
MT 31/12/2017 31/12/2017 31/12/2016 31/03/2017
NL 31/12/2017 31/12/2017 31/12/2017 31/12/2017 31/12/2017 31/12/2017 31/12/2017 30/09/2016 30/09/2016 30/09/2017 31/12/2017 31/12/2017 31/12/2017 31/12/2016 31/12/2017 31/03/2017 31/12/2016
NO 30/09/2017 31/12/2017 31/03/2017
PL 31/12/2016 31/12/2016 31/12/2017 31/12/2017 31/12/2017 31/12/2017 31/12/2017 30/09/2016 30/09/2016 30/09/2017 31/12/2017 31/12/2017 31/12/2017 31/12/2016 31/12/2016 31/03/2017 31/12/2016
PT 31/12/2016 31/12/2016 31/12/2017 31/12/2017 31/12/2017 31/12/2017 31/12/2017 30/09/2016 30/09/2016 31/12/2017 31/12/2017 31/12/2017 31/12/2016 31/12/2016 31/03/2017 31/12/2016
RO 30/09/2016 31/12/2017 31/12/2017 31/12/2016 31/03/2017
SE 31/12/2017 31/12/2017 31/12/2017 31/12/2017 31/12/2017 31/12/2017 31/12/2017 30/09/2016 30/09/2016 31/12/2017 31/12/2017 31/12/2016 31/03/2017 31/12/2016
SI 31/12/2017 31/12/2017 31/12/2016 31/03/2017
SK 31/12/2017 31/12/2017 31/12/2017 31/12/2016 31/12/2016 31/03/2017
UK 31/12/2017 31/12/2017 31/12/2017 31/12/2017 31/12/2017 31/12/2017 31/12/2017 30/09/2016 30/09/2016 30/09/2017 31/04/2017 31/12/2017 31/12/2017 31/03/2017 31/12/2016 31/03/2017 31/12/2016
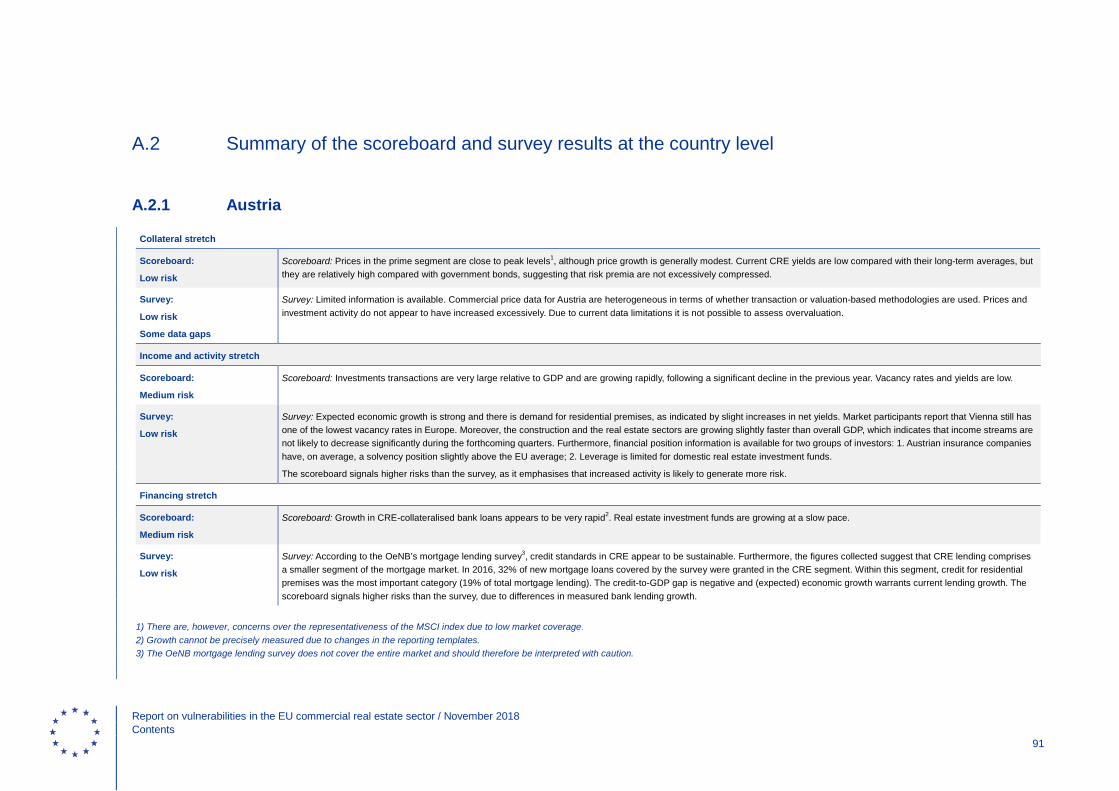
Report on vulnerabilities in the EU commercial real estate sector / November 2018 Contents 91
A.2 Summary of the scoreboard and survey results at the country level
A.2.1 Austria
Collateral stretch
Scoreboard:
Low risk
Scoreboard: Prices in the prime segment are close to peak levels1, although price growth is generally modest. Current CRE yields are low compared with their long-term averages, but they are relatively high compared with government bonds, suggesting that risk premia are not excessively compressed.
Survey:
Low risk
Some data gaps
Survey: Limited information is available. Commercial price data for Austria are heterogeneous in terms of whether transaction or valuation-based methodologies are used. Prices and investment activity do not appear to have increased excessively. Due to current data limitations it is not possible to assess overvaluation.
Income and activity stretch
Scoreboard:
Medium risk
Scoreboard: Investments transactions are very large relative to GDP and are growing rapidly, following a significant decline in the previous year. Vacancy rates and yields are low.
Survey:
Low risk
Survey: Expected economic growth is strong and there is demand for residential premises, as indicated by slight increases in net yields. Market participants report that Vienna still has one of the lowest vacancy rates in Europe. Moreover, the construction and the real estate sectors are growing slightly faster than overall GDP, which indicates that income streams are not likely to decrease significantly during the forthcoming quarters. Furthermore, financial position information is available for two groups of investors: 1. Austrian insurance companies have, on average, a solvency position slightly above the EU average; 2. Leverage is limited for domestic real estate investment funds.
The scoreboard signals higher risks than the survey, as it emphasises that increased activity is likely to generate more risk.
Financing stretch
Scoreboard:
Medium risk
Scoreboard: Growth in CRE-collateralised bank loans appears to be very rapid2. Real estate investment funds are growing at a slow pace.
Survey:
Low risk
Survey: According to the OeNB’s mortgage lending survey3, credit standards in CRE appear to be sustainable. Furthermore, the figures collected suggest that CRE lending comprises a smaller segment of the mortgage market. In 2016, 32% of new mortgage loans covered by the survey were granted in the CRE segment. Within this segment, credit for residential premises was the most important category (19% of total mortgage lending). The credit-to-GDP gap is negative and (expected) economic growth warrants current lending growth. The scoreboard signals higher risks than the survey, due to differences in measured bank lending growth.
1) There are, however, concerns over the representativeness of the MSCI index due to low market coverage. 2) Growth cannot be precisely measured due to changes in the reporting templates. 3) The OeNB mortgage lending survey does not cover the entire market and should therefore be interpreted with caution.

Report on vulnerabilities in the EU commercial real estate sector / November 2018 Contents 92
Potential for spillovers
Scoreboard:
Low risk
Scoreboard: Banks’ exposures collateralised by commercial property are moderate relative to their Tier 1 capital, and loans collateralised by CRE companies represent a moderate proportion of total loans. Real estate investment funds are small relative to GDP, while insurers’ exposures to CRE as a proportion of their total assets are also moderate. The CRE market is small relative to GDP.
Survey:
No risk
Survey: The share of bank exposures collateralised by commercial property of total assets is below 5%. Insurance companies’ and pension funds’ exposures are less than 5% of assets and around 5% of assets respectively. Loans to NFCs in the real estate sector were 18% of GDP (CBD) in 2017.
Additional information
Policies
In 2017 the Austrian national parliament passed a bill which provides the legal basis for the activation of borrower-based instruments (LTV, DSTI, DTI as well as amortisation and maturity requirements) that could also be applied to CRE lending by banks. National macroprudential authorities will be able to activate those measures from July 2018 for up to three years. After a re-evaluation, the activation can be prolonged for an additional two years.
Country-specific comments from national authorities
Since 2003 CRE price growth in Austria has been moderate, with annual nominal growth rates ranging from -1.1% in 2009 to 1.8% in 2017. After correcting for inflation, real price growth dropped from 0.6% in 2016 to -0.4% in 20174.
The Austrian CRE market appears to be quite small in terms of transaction growth. Private market research estimates that the aggregate CRE transaction volume in 2017 was €5 billion. Considering the size of the market and the relatively high capital intensity of the CRE sector, the numbers for annual transaction growth should be interpreted carefully, since single transactions can lead to significant changes in aggregate growth rates. Against this backdrop, private market research has found a clear positive trend for CRE transactions since the financial crisis, mainly driven by investments in the office and retail market, and with strong foreign investor participation.
For Austrian significant institutions, CRE-collateralised lending to non-financial corporations accounted for 10% of total assets, and preliminary numbers indicate a growth rate of -1.9% in Q1 2018. For the whole Austrian banking sector, the aggregate outstanding amount of domestic lending for the funding of non-residential real estate and investment in real estate funds was about €27 billion and accounted for roughly 3.2% of total assets in the same period.
In April 2018 the outstanding amount of investment fund units issued by Austrian real estate funds was €7.9 billion, which accounted for 4.3% of all outstanding units issued by Austrian investment funds. This share has increased continuously since 2009 because of relatively high growth rates. However, there are signs of a gradual slowdown in the growth of real estate investment funds.
4) There are, however, concerns over the representativeness of the MSCI index due to low market coverage.

Report on vulnerabilities in the EU commercial real estate sector / November 2018 Contents 93
A.2.2 Belgium
Collateral stretch
Scoreboard:
Low risk
Scoreboard: Prices are currently at peak levels in the prime segment, and are continuing to grow rapidly. This is not the case in the CRE market as a whole, where prices are actually decreasing. Current CRE yields are low compared with their long-term averages, although they are relatively high compared with government bonds, suggesting that risk premia are not excessively compressed.
Survey:
No risk
Some data gaps
Survey: CRE prices decreased by 0.6% in 2016, continuing the downward trend observed since 2008 (-9.4% in cumulative terms). Price developments are heterogeneous across segments: Prices of retail properties are rising considerably faster than they are for industrial properties, while office prices are falling. Due to current data limitations it is difficult to assess valuations. However, price growth has been subdued in relation to GDP growth in recent years, suggesting that CRE prices are probably experiencing a soft-landing scenario.
Income and activity stretch
Scoreboard:
Medium risk
Scoreboard: Investment transactions are large relative to GDP and are growing at a moderate pace. Vacancy rates are moderate, but yields are low.
Survey:
Medium risk
Survey: So far there is no evidence to suggest that leverage in Belgian CRE markets has increased or that overall investment is excessive. However, some parts of the CRE market are considered to be experiencing oversupply. This is mainly the case for the office property market as other property types are generally more owner-occupied driven, with limited investor interest. According to private actors, aggregate vacancy rates for offices in Brussels (covering both the Brussels central district and Greater Brussels) have been gradually decreasing since 2008, but remain high at around 9%.
Financing stretch
Scoreboard:
No risk
Some data gaps
Scoreboard: Bank lending collateralised by CRE is growing slowly. There are no data available for the growth of real estate investment funds.
Survey:
Medium risk
Some data gaps
Survey: Limited data availability complicates the assessment of lending dynamics and standards. Credit register data suggest that in recent years bank lending to CRE has increased more than lending to NFCs overall. Financial accounts data indicate that the total balance sheet of the REITs sector has almost doubled since 2011. Overall, CRE currently relies on a well-diversified and stable set of funding sources.
The survey signals higher risks than the scoreboard, due to differences in measured bank lending growth.
Potential for spillovers
Scoreboard:
No risk
Some data gaps
Scoreboard: Loans collateralised by CRE companies represent a small proportion of banks’ total loans. Real estate investment funds are small relative to GDP, and insurers’ exposures to CRE as a proportion of their total assets are moderate. The CRE market is small relative to GDP. There are no data available for the percentage of banks’ Tier 1 capital exposures collateralised by commercial property.
Survey:
Low risk
Survey: Banks' total exposure to CRE as a share of the banking sector's total assets is relatively limited. The exposure of other non-bank financial intermediaries to CRE is also limited. It has been reported that the risks in the CRE sector are related to the risks observed in the RRE sector: any difficulties experienced in one of the sectors would most likely be reflected in the other.

Report on vulnerabilities in the EU commercial real estate sector / November 2018 Contents 94
Additional information
FSR: The growing exposure of financial institutions to CRE calls for vigilance (Belgian FSR 2015 and 2016). The Nationale Bank van België/Banque Nationale de Belgique is paying particular attention to developments affecting specific sub‑segments of the CRE, and is prepared to adopt appropriate additional measures to prevent the emergence of risks or to mitigate existing vulnerabilities (Belgian FSR 2017).
ATC BUS: CRE is the third most significant source of systemic risk. In particular, the authorities are flagging up the significant growth in lending for CRE and flows into REITs. Mitigating factors include moderate price/credit developments, diversified exposures and the strict regulation of REITs.
Policies
Country-specific comments from national authorities
The Nationale Bank van België/Banque Nationale de Belgique (NBB/BNB) notes that the risk assessment for Belgium shows some discrepancies between the risk scores derived from the scoreboards and its own assessment in the country survey input. This is especially the case for the financing stretch (see Chart 28), for which the NBB/BNB self-assessment is mainly based on the strong growth in bank loans to domestic NFCs active in the construction and real estate sectors over the past 10-15 years. This is admittedly a broader definition of CRE than that used in the scoreboard, as part of this also relates to the dynamic Belgian RRE sector, e.g. in the subsector of property development. The NBB/BNB also agrees on the presence of data gaps that hinder a more in-depth analysis for some CRE market segments. However, some progress has already been made regarding the analysis of REITs, property dealers and real estate developers (the results of these analyses are described in a thematic article on real estate in the NBB/BNB 2018 Financial Stability Report: https://www.nbb.be/doc/ts/publications/fsr/fsr_2018.pdf). The NBB is also currently exploring possibilities to access additional data sets, in line with the ESRB recommendation on closing data gaps.

Report on vulnerabilities in the EU commercial real estate sector / November 2018 Contents 95
A.2.3 Bulgaria
Collateral stretch
Scoreboard:
No risk rating due to data gaps
Scoreboard: No data.
Survey:
No risk
Survey: Only limited information is available and the “no risk” rating is based on expert judgment. It should be noted that the lack of data also reflects the lack of depth and development of the CRE market in Bulgaria, as is also reflected by the low exposures of financial intermediaries to this market (see the spillovers stretch). REITs in Bulgaria (special investment purpose companies, securitising in real estate and/or agricultural land) are traded on the Bulgarian Stock Exchange and there is a sectoral BGREIT market index with daily values which is a proxy indicator of price trends for the Bulgarian REIT sector.
Income and activity stretch
Scoreboard:
No risk rating due to data gaps
Scoreboard: No data.
Survey:
Low risk
Survey: Various reports from international CRE companies reveal expectations of stable developments in terms of supply, lease rates and rental rates in different sub-segments of the CRE market.
Financing stretch
Scoreboard:
No risk
Some data gaps
Scoreboard: Bank lending collateralised by CRE is growing slowly. Real estate investment funds are growing at a moderate pace.
Survey:
No risk
Survey: If REITs are also taken into account, the assets of REIFs and REITs together grew slowly in 2017 (+4.7%) from -4.9% in 2016, and data for bank lending to CRE showed negative lending growth in 2016. Moreover, the data for the fourth quarter of 2016 show no change in bank lending standards in respect of non-financial corporations.

Report on vulnerabilities in the EU commercial real estate sector / November 2018 Contents 96
Potential for spillovers
Scoreboard:
No risk
Some data gaps
Scoreboard: Banks’ exposures collateralised by commercial property are small relative to their Tier 1 capital, although loans collateralised by CRE represent a substantial proportion of total loans. Insurers’ exposures to CRE as a proportion of their total assets are moderate, but real estate investment funds are small relative to GDP. There are no data available for the size of the CRE market relative to GDP.
Survey:
No risk
Survey: Banks’ exposures to CRE are not considered to be small, but they are adequately collateralised and growth in CRE-related bank lending has been subdued. Other financial sectors' exposure to real estate markets is very low. For example, REIFs and REITs have a combined share of 1.5% of GDP. The regular monitoring of banks’ exposures to CRE shows that the impact of CRE on the banking system is low and is under control – this was confirmed by the results of the Asset Quality Review.
Additional information
Policies
Country-specific comments from national authorities
Due to data gaps, the report uses two proxy indicators to measure the amount of bank lending to the CRE sector: (1) loans to non-financial companies in real estate activities and the construction sector, and (2) total loans collateralised by commercial immovable property. It should be borne in mind that an assessment of CRE sector systemic importance using indicators based on these broad definitions may be misleading. The reason for this is that the former scope also includes exposures to residential real estate investors, while the latter definition encompasses loans to non-CRE sector companies collateralised by own-used commercial immovable property. Moreover, the higher share of CRE-collateralised loans in Bulgaria compared with the EU average should not be viewed as a risk but rather as a result of the widespread use of CRE as a natural hedge against substantial losses in the event of potential credit risk materialising.
With regard to the non-banking sector, a top-down risk assessment of CRE sector developments almost overlaps with the survey assessment. In addition to the information from the top-down indicators, the Financial Supervision Commission has provided ad hoc information on the development of REITs (the availability of REITs’ stock market price index, annual growth rate of assets and share of GDP), which are not covered by the reported top-down indicators of Bulgarian REIFs. Taking this information into account in the risk (survey) assessment does not result in a significant change, but implies a slight decrease compared with the top-down risk assessment.

Report on vulnerabilities in the EU commercial real estate sector / November 2018 Contents 97
A.2.4 Croatia
Collateral stretch
Scoreboard:
No risk rating due to data gaps
Scoreboard: No data.
Survey:
No risk
Some data gaps
Survey: The results of a survey conducted by Hrvatska narodna banka in mid-2014 showed a high level of illiquidity of CRE properties in Croatia and that prices, at the time the survey was conducted, were on a declining trajectory. The majority assessment of respondents was that prices of commercial property in the period from 2008 to 2014 had fallen by 35%. Further CRE price changes were predicted for 2015 (-10% to 2%).
Income and activity stretch
Scoreboard:
No risk rating due to data gaps
Scoreboard: No data.
Survey:
No risk
Survey: Obsolete tourist infrastructure (hotels, camps, restaurants etc.) is being renovated and new, predominantly high-end projects are under development or are in the pipeline. In addition, the increasing activity in the retail sector in recent years is a consequence of the consolidation that this CRE sub-segment is undergoing.
Financing stretch
Scoreboard:
Low risk
Some data gaps
Scoreboard: CRE-collateralised bank lending is growing at a moderate pace. There are no data available for the growth of real estate investment funds.
Survey:
No risk
Some data gaps
Survey: Banks are starting to increase their CRE lending after several years of cutbacks. However, credit growth remains at the rather modest level of around 7.5% per annum. Lending standards for the entire corporate sector (which includes CRE) have been loosening at a medium pace for the last two years. The overall assessment is based on the Bank Lending Survey, which does not break lending standards down by type of business activity. There is limited information on the growth of real estate investment funds.

Report on vulnerabilities in the EU commercial real estate sector / November 2018 Contents 98
Potential for spillovers
Scoreboard:
Low risk
Some data gaps
Scoreboard: Banks’ exposures collateralised by commercial property are small relative to their Tier 1 capital, and CRE-collateralised loans represent a moderate proportion of total loans. Insurers’ exposures to CRE as a proportion of their total assets are the highest in the EU. There are no data available on the size of real estate investment funds relative to GDP, nor on the size of the CRE market relative to GDP.
Survey:
Low risk
Some data gaps
Survey: The available data show that the domestic real estate market (RRE and CRE) is characterised by low turnover, which complicates the valuation of collateral and increases the risks to the financial system from large existing non-performing loans. Moreover, financial institutions' exposures to NFC from business activities (construction and real estate) amounted to only around 3.6% of GDP (or 3% of total credit institutions' assets). For the last few years CRE investors (non-financial construction corporates and corporates dealing with real estate) have been deleveraging, with the debt-to-equity ratio for the sector falling from 3.0 in 2014 to 2.5 in 2016.
Additional information
Policies
2014 – The systemic risk buffer was imposed to address some of the risks.
2014 – Hrvatska narodna banka issued a notification to credit institutions that CRE in Croatia did not satisfy the conditions regarding the liquidity of credit protection prescribed by Articles 194 and 208 (paragraph 2) of the CRR, as data collected by Hrvatska narodna banka had shown that the CRE market was not sufficiently liquid. The CNB was therefore of the opinion that credit institutions should harmonise their standards and should not apply a 50% risk weight to exposures secured by CRE until the market had become more liquid and the process of forced data collection had shown a satisfactory improvement in effectiveness.
Country-specific comments from national authorities

Report on vulnerabilities in the EU commercial real estate sector / November 2018 Contents 99
A.2.5 Cyprus
Collateral stretch
Scoreboard:
No risk rating due to data gaps
Scoreboard: No data.
Survey:
No risk
Survey: CRE prices have declined further in the years since the crisis (Central Bank of Cyprus CPPI), reflecting the correction experienced in the Cyprus real estate market. According to the same source, CRE prices in Cyprus recorded minor decreases in 2016. Finally, rents and yields are around their historical averages, suggesting that there is no overvaluation at this stage. Confidence in the real estate market appears to be improving and construction activity has started to pick up. The construction production index recorded an annual increase of 29.6% in Q3 2016 (8.1% in Q3 2015), but remains at low levels.
Income and activity stretch
Scoreboard:
No risk rating due to data gaps
Scoreboard: No data.
Survey:
No risk rating due to data gaps
Survey: A lack of data limited the assessment. Construction activity was severely affected in Cyprus during the financial crisis. Despite a small pickup in activity driven by increases in demand, construction remains at low levels. There therefore appears to be no oversupply in the CRE market at the moment.
Financing stretch
Scoreboard:
No risk
Some data gaps
Scoreboard: CRE-collateralised bank lending has decreased over the past year1. There are no data available for the growth of real estate investment funds.
Survey:
No risk
Survey: A lack of data is making it difficult to assess sectoral lending developments for CRE. Overall credit growth (including CRE credit) is weak and, in addition, lending standards appear to be tight (LTV requirements).
1) According to the Central Bank of Cyprus, annual growth in CRE lending was slightly less negative compared with the numbers in the scoreboard, at -11.7% in Q1 2017. If this number is used in the scoreboard, the risk rating is unchanged.

Report on vulnerabilities in the EU commercial real estate sector / November 2018 Contents 100
Potential for spillovers
Scoreboard:
Low risk
Some data gaps
Scoreboard: Banks’ exposures collateralised by commercial property are small relative to their Tier 1 capital, although CRE-collateralised loans represent a substantial proportion of total loans2. Also, insurers’ exposures to CRE as a proportion of their total assets are among the highest in the EU. There are no data available for the size of real estate investment funds relative to GDP or for the size of the CRE market relative to GDP.
Survey:
Medium risk
Survey: The banking sector appears to be highly exposed to CRE risks. CRE loans stood at 67.8% of GDP and accounted for 17.7% of total loans and advances in Q4 2016. Non-performing loans to CRE projects are significant: 58.1% of CRE loans are non-performing. The construction sector and the real estate management sector have the most NPLs, comprising 34.6% and 18.0% respectively of the total NPLs of non-financial corporations. Negative spillovers from CRE to the financial sector and the real economy have already materialised, so the potential for future negative spillovers has decreased significantly. Nevertheless, the authorities have reported that they are monitoring this risk from a financial stability perspective.
The survey signals higher risks than the scoreboard due to the authorities’ emphasis on the large exposures of banks.
Additional information
Additional information from the survey: The main CRE risks are the result of legacy issues, in particular the high indebtedness of SMEs. Some of these businesses (which currently rent CRE property), may be driven out of the market due to indebtedness, thus decreasing demand for CRE.
The figures for Cyprus in relation to CRE exposures include exposures related to Special Purpose Entities (SPEs). SPEs mainly comprise ship-owning entities which are classified as residents, although a large proportion of their activities are not related to domestic economic activity. These types of loans, even if they defaulted, would therefore not have an impact on the Cypriot economy.
FSR: The fall in property prices and the illiquidity of property markets constitutes a risk for investors (FSR, 2015, p. 27). Large amounts of NPLs remain in sectors related to CRE (FSR 2016, p. 25).
Policies
LTV limits of 70% apply for loans for any property that is not the primary residence of the borrower. Furthermore, the DSTI should not exceed 80% (65% for loans in foreign currency).
Country-specific comments from national authorities
Given the significant data gaps that exist in the CRE market, any conclusions drawn in relation to the CRE risk assessment may be premature. More time is needed for the collection of relevant data that would facilitate a deeper analysis. For Cyprus, spillover effects have already materialised, so the potential for future negative spillovers has decreased significantly. This should be taken into account when interpreting the scoreboard results. Overall, the real estate market continues its gradual recovery, reflecting the positive developments in the macroeconomic environment. Demand for real estate continues on its upward trend, supported by low interest rates and improved confidence in the real estate market. On the supply side, activity in the construction sector continues to recover gradually, reflecting the increase in demand. Despite the downward trend shown by CRE prices during the period 2010-16, as recorded by the Central Bank of Cyprus (CBC) CPPI index, the increased demand supported a modest recovery in CRE prices during 2017 (CBC Economic Bulletin, June 2018). Developments in the commercial real estate sector and the broader real estate sector in general are continuously monitored by the CBC. The CBC is vested with legal powers and possesses the necessary tools to address potential systemic risks in the real estate sector.
2) According to additional data from the Central Bank of Cyprus, CRE-collateralised loans as a share of total loans amount to 17%, which is slightly lower than the figures reported in the scoreboard. Moreover, newer data on banks exposures in relation to capital are lower than data reported in the scoreboard (0.4 as of Q1 2017). If these numbers are used in the scoreboard the risk rating for the potential for spillovers stretch remains unchanged. The figures for Cyprus in relation to CRE exposures include exposures related to Special Purpose Entities (SPEs). SPEs mainly comprise ship-owning entities which are classified as residents, although a large proportion of their activities are not related to domestic economic activity. These types of loans, even if they defaulted, would therefore not have an impact on the Cypriot economy.

Report on vulnerabilities in the EU commercial real estate sector / November 2018 Contents 101
A.2.6 Czech Republic
Collateral stretch
Scoreboard:
Medium risk
Scoreboard: Prices in the overall CRE market and those in the prime segment are growing at a moderate pace. Prices in the prime segment are, however, currently at their historical peak levels. Current CRE yields are very low compared with their long-term averages, but they are relatively high compared with government bond yields, suggesting that risk premia are not excessively compressed.
Survey:
Medium risk
Survey: Prices are increasing by more than might be justified by the macroeconomic environment, reflecting demand from foreign investors. At end-2015, it was estimated that offices were overvalued by approximately 18%, industrial and logistic property by 8%, and retail property by 6%.
Income and activity stretch
Scoreboard:
Low risk
Some data gaps
Scoreboard: Investment transactions are small relative to GDP, and are increasing at a moderate pace. Yields are low, and no data on vacancy rates are available.
Survey:
Medium risk
Survey: The vacancy rate for prime office property peaked at a high level at the beginning of 2015, but has declined significantly since then (from 17% to about 10% at end-2016). The volume of prime property transactions has reached pre-crisis levels. From a historical perspective, the stock of newly completed premises fell or remained at low levels in 2016. This stock was mostly for prime logistic property, but the vacancy rate in this segment is low and declining. Overall, there is a risk of oversupply of CRE in the medium term if economic activity turns down, although this appears to be contained. Furthermore, the indebtedness of CRE investors has increased in recent years and if debt continues to grow at its current pace may soon become difficult to sustain.
The survey signals higher risks than the scoreboard, due to the authorities’ indications that investors have become more indebted, and that there is a risk of oversupply in the medium term if economic activity turns down.
Financing stretch
Scoreboard:
Low risk
Scoreboard: Growth in bank exposures to CRE appears to be slow. Nonetheless, real estate investment funds are growing at a rapid pace.
Survey:
No risk
Survey: CRE-collateralised bank lending growth appears to be in line with levels consistent with the macroeconomic environment. According to a recent Czech survey on lending conditions, lending standards have gradually loosened, although they have recently shown signs of turning more conservative again. There are no data on lending from non-bank financial intermediaries to CRE, although this appears to be on the rise.
The scoreboard signals higher risks than the survey, due to differences in measured bank lending growth.

Report on vulnerabilities in the EU commercial real estate sector / November 2018 Contents 102
Potential for spillovers
Scoreboard:
No risk
Scoreboard: Banks’ exposures collateralised by commercial property are small relative to their Tier 1 capital, and CRE-collateralised loans represent a small proportion of total loans. Real estate investment funds are also small relative to GDP, and insurers have little exposure to CRE relative to their total assets. The CRE market is small relative to GDP.
Survey:
Low risk
Survey: Banks are mostly managing their risk exposures to CRE appropriately. A recent survey suggested that the volume of new loans collateralised by CRE was equivalent to around one-third of new loans collateralised by RRE in the second half of 2016. Non-banks' exposure to CRE risks appears to be small and spread widely. Nevertheless, the potential for negative spillovers from CRE is significant enough to warrant specialised monitoring from a financial stability perspective.
Additional information
FSR: The Czech FSR 2017 highlights the fact that the prices of CRE increased in 2016, and also flags up potential overvaluation. Prime yields were at their lowest levels since 2000 in all CRE segments. At the same time, 2016 was a record year in terms of transaction volume, which exceeded the previous high recorded in 2007 by 25%. Foreign entities accounted for 75% and Czech entities 25% of this. However, the amount of new CRE financing loans provided by domestic banks is not rising significantly and lending standards have recently shown signs of turning more conservative again. The majority of new loans were provided with LTV ratios of 60-70%.
ATC BUS: CRE risk was ranked second, highlighting the potential for overvaluation in some market segments.
Policies
Country-specific comments from national authorities
As is the case for a number of other EU countries, the data relating to the CRE market in the Czech Republic are rather incomplete and should be interpreted with caution, taking into account the character of the Czech economy.
First, the existing data on CRE prices and yields suffer from low coverage for the Czech Republic – either they only cover a small part of the overall market (MSCI data; variables 1 and 2 in the scoreboard) or they only cover the prime market (JLL data; variables 3, 4, 5, 6 and 7 in the scoreboard). It is also rather difficult to assess the current values of CRE prices and yields by comparing them with their past values (either with the historical maximum or the long-run average as per the report; variables 2, 4, 5 and 6 in the scoreboard). The reason for this is that the CRE market in the Czech Republic was far from mature in the past and has been converging towards the advanced countries in the past few years. This means that the past values of CRE prices and yields corresponded to a country with a different level of development (and therefore riskiness) compared with the Czech Republic of today. As a result, a comparison of the current prices and yields with their past values may overstate the risks which are currently present, to some extent, in the market in the Czech Republic.
Another deficiency relates to the data on CRE-collateralised bank lending as provided by the EBA (variables 12, 13 and 14 in the scoreboard). These data only cover the three largest banks on a consolidated basis and, for this reason, must be interpreted with caution.
Finally, the data on vacancy rates as provided by Savills (variable 10 in the scoreboard) are missing for the Czech Republic. Alternative data for vacancy rates in the prime CRE segment, which are provided to Česká národní banka (CNB) by the JLL, show a low vacancy rate for industrial and logistic property and a decreasing vacancy rate for office property.
Finally, CNB would like to emphasise that, according to the information received from market participants, approximately two-thirds of investments in Czech Republic CRE are made by foreign investors. This means that any potential risks associated with the CRE market in the Czech Republic would largely be exported abroad.

Report on vulnerabilities in the EU commercial real estate sector / November 2018 Contents 103
A.2.7 Denmark
Collateral stretch
Scoreboard:
Low risk
Scoreboard: While prices in the prime segments have reached their historical peaks and are continuing to grow at a moderate pace, prices for the CRE sector as a whole are well below historical peaks and are declining. Current CRE yields are low compared with their long-term averages, but are relatively high compared with government bond yields, suggesting that risk premia are not excessively compressed.
Survey:
Low risk
Some data gaps
Survey: According to Danmarks Nationalbank, prices (provided by the Danish Statistics Office) for apartment buildings grew by 5-11%. Over the year to Q1 2017 prices for office spaces grew by 11%. There is not enough information to make a full assessment of the possible overvaluation of CRE properties.
Income and activity stretch
Scoreboard:
Medium risk
Scoreboard: Investment transactions are moderate relative to GDP, but are increasing rapidly. Vacancy rates are relatively low, although yields are very low.
Survey:
Medium risk
Some data gaps
Survey: Foreign investors are becoming more active in the market, driving CRE investments. The current level of indebtedness of CRE investors may soon become increasingly difficult to sustain. There are few very large players and debt take-up seems contained.
Financing stretch
Scoreboard:
No risk
Some data gaps
Scoreboard: CRE-collateralised bank lending has decreased over the past year. There are no data available on the growth of real estate investment funds.
Survey:
Low risk
Some data gaps
Survey: There is little information about the lending standards of banks or the lending of non-banks to CRE. The lending growth of banks is reported to be low and is in line with the macroeconomic environment.

Report on vulnerabilities in the EU commercial real estate sector / November 2018 Contents 104
Potential for spillovers
Scoreboard:
Low risk
Some data gaps
Scoreboard: Danish banks have the largest CRE-collateralised exposures in the EU, exceeding 100% of Tier 1 capital. However, banks’ CRE-collateralised loans represent a small proportion of total loans, and insurers’ exposures to CRE as a proportion of their total assets are low. The CRE market is moderately sized compared with GDP. There are no data available on the size of real estate investment funds relative to GDP.
Survey:
Medium risk
Some data gaps
Survey: The Danish authorities report that the potential for negative spillovers from CRE is significant enough to warrant specialised monitoring from a financial stability perspective. There is no information on the exposures of non-banks.
The survey signals higher risks than the scoreboard, due to the authorities’ emphasis of the interconnectedness of CRE with financial markets.
Additional information
In the FSR and the ATC BUS (fourth-highest risk) Danish authorities have indicated that prices are at pre-crisis levels and are increasing due to search-for-yield behaviour. They also report that banks are heavily exposed to CRE. Furthermore, it is reported that foreign and institutional investors are major players in the market.
Policies
Mortgage loans for CRE cannot be extended to borrowers with negative cash flows. There is an LTV limit of 60-70% for loans for CRE provided by mortgage credit banks.
Country-specific comments from national authorities
Overall, Danmarks Nationalbank and Finanstilsynet agree with the risk assessment provided to the ESRB. Although the analytical data contain some weaknesses they reflect the current situation and trends in the Danish CRE market.
Many of the banks that ceased to exist during the crisis suffered substantial losses on their commercial property exposures. Accordingly, the current strong activity in the CRE market calls for caution. Today’s CRE market is characterised by strong price increases, falling yields and very high transaction volumes. Copenhagen, in particular, has seen strong growth in nominal prices, which are now higher than they were at their pre-crisis peak. Lending growth has not followed suit, however. The property companies are generally better capitalised than they were during the pre-crisis years, although there are signs of higher risk-taking in certain segments. The largest property companies, in particular, have started to raise new debts. On the other hand, lending against CRE is more regulated by, for example, the supervisory diamonds which set the framework for lending by banks and mortgage banks against CRE.

Report on vulnerabilities in the EU commercial real estate sector / November 2018 Contents 105
A.2.8 Estonia
Collateral stretch
Scoreboard:
No risk rating due to data gaps
Scoreboard: No data.
Survey:
Low risk
Some data gaps
Survey: There are no data on the prices and other characteristics of CRE transactions. The market is small and illiquid. It should be noted that the lack of data also reflects the lack of depth and development of the CRE market in Estonia.
Income and activity stretch
Scoreboard:
No risk rating due to data gaps
Scoreboard: No data.
Survey:
Medium risk
Survey: The low interest rate environment is driving investor interest in CRE. Demand has been strong, but there are signs of market saturation. Vacancy rates have increased and average rental prices have levelled off. If a situation of oversupply develops, companies with holdings of lower quality office buildings may face a shortage of tenants and possible debt servicing problems. However, there is a lack of data on the financial position of CRE investors, which makes it difficult to assess how large this risk might be. Banks have been rather conservative when selecting CRE projects since the economic downturn and their exposure to lower quality/non-prime office buildings is not significant.
Financing stretch
Scoreboard:
Low risk
Scoreboard: Real estate investment funds are growing rapidly. CRE-collateralised bank lending is growing at a slow pace.
Survey:
No risk
Survey: Demand is strong and institutional investors (pension and real estate investment funds) are active in the market. There is some interest from foreign investors (via real estate investment funds), although this is concentrated in Tallinn, the capital.
The scoreboard signals higher risks than the survey, due to differences in the interpretation of the financing environment and the issues with data availability.

Report on vulnerabilities in the EU commercial real estate sector / November 2018 Contents 106
Potential for spillovers
Scoreboard:
No risk
Some data gaps
Scoreboard: Banks’ CRE-collateralised exposures are moderate relative to their Tier 1 capital, and CRE-collateralised loans represent a moderate proportion of total loans. However, real estate investment funds are small relative to GDP, and insurers have little exposure to CRE relative to their total assets. There are no data available on the size of the CRE market relative to GDP.
Survey:
Low risk
Survey: Banks’ exposures are significant, although they increased only slightly in 2016. There is a lack of data on the CRE investor base, but both domestic and foreign investors are active in the market. The share of real estate and construction activities has remained at 16% of GDP in recent years. The size of real estate investment funds is assessed as small (€360 million at end-2016 or 1.7% of GDP).
Additional information
Eesti Pank (CB): In the FSR 2017:1 Eesti Pank reports that more new office space has come onto the market and the average vacancy in the CRE market has increased. The increase in the supply of commercial space and the stabilisation of rent prices in the fourth quarter of 2016 indicate that the market for office space may be reaching saturation point. The volume of loans granted by banks to real estate companies increased strongly in the second half of 2016, although it only increased slightly as a share of the loan portfolio of the banking sector.
Policies
The systemic risk buffer has been imposed to address some of the risks related to CRE.
Country-specific comments from national authorities
The latest data for 2017 and the beginning of 2018 indicate that, in general, the developments described above have continued. In other words there has been a lot of activity in the commercial property market. A notable amount of new office space has come onto the market and bank loans to real estate companies have increased. However, due to an increase in economic activity, demand has also increased. As a result, the average occupancy and rental prices of office buildings have not changed notably and vacancy rates have decreased slightly. With regard to the lack of data, the national authorities, in cooperation with the private sector, are looking to fill in data gaps.

Report on vulnerabilities in the EU commercial real estate sector / November 2018 Contents 107
A.2.9 Finland
Collateral stretch
Scoreboard:
Medium risk
Some data gaps
Scoreboard: Prices in the prime segments have reached their historical peak levels and are continuing to grow rapidly. Current CRE yields are low compared with their long term averages, although they are relatively high compared with government bonds, suggesting that risk premia are not excessively compressed. No price index is available for the CRE market as a whole.
Survey:
Low risk
Some data gaps
Survey: There are no adequate national hard data to make the assessment. However, according to market sources (Catella), investors are prepared to pay considerable sums for high-quality prime real estate targets. However, prices are considerably lower for metropolitan real estate targets that can be exploited opportunistically.
The scoreboard signals higher risks than the survey, given the information available on price developments in the prime segments.
Income and activity stretch
Scoreboard:
Pronounced risk
Scoreboard: Investment transactions relative to GDP are the largest in the EU, and are continuing to increase rapidly1. Vacancy rates are very high, and yields are very low.
Survey:
Low risk
Some data gaps
Survey: Risks related to a potential oversupply of CRE spaces in Finland are perceived to be low. Although the supply of new office spaces, new shopping centres and retail spaces increased in 2016, around half the volume was attributable to a few shopping centre projects. According to private sources (Catella), old offices are being demolished and transformed into flats or other premises. Prime yields are high relative to other EU countries. No information is available on the risks related to the financial position of CRE investors.
The survey signals lower risks than the scoreboard, due in part to the authorities’ indications that new supply is limited.
Financing stretch
Scoreboard:
Pronounced risk
Scoreboard: CRE-collateralised bank lending is increasing very rapidly; real estate investment funds are growing rapidly.
Survey:
No risk
Some data gaps
Survey: There is limited information available. The Finnish authorities are unable to make qualified assessments of funding conditions and lending standards. However, market sources suggest that there has been a tightening of credit standards since 2016. While there are no data on lending for CRE, this is perceived to be either declining or growing weakly.
1) Suomen Pankki – Finlands Bank reports that based on private sector information (Catella) the annual growth rate of transactions was 36.5% in 2016. This value is lower than in the scoreboard although it still breaches a risk threshold, albeit with no impact on the risk rating for the stretch.

Report on vulnerabilities in the EU commercial real estate sector / November 2018 Contents 108
Potential for spillovers
Scoreboard:
Medium risk
Scoreboard: The CRE market is very large relative to GDP. Real estate investment funds are of moderate size relative to GDP2, although insurers’ exposures to CRE as a proportion of their total assets are the third highest in the EU. Banks’ exposures collateralised by commercial property are small relative to their Tier 1 capital, while CRE-collateralised loans represent a moderate proportion of total loans.
Survey:
Low risk
Survey: The potential for negative spillovers from CRE is significant enough to warrant specialised monitoring from a financial stability perspective. However, spillovers would be of most concern in the event of a general macroeconomic downturn, when CRE-related losses could combine with losses from other sectors to generate systemic effects. CRE on its own is not considered to be a source of systemic risk. Banks’ exposures are reported to pose only limited risks; the insurance sector’s CRE investments are not seen as significant for the sector's resilience and solvency; alternative investment funds’ exposures to CRE are low.
Additional information
Catella: Finland is attracting foreign investors due to high yields. Although the CRE market is concentrated in Helsinki, demand outside the metropolitan area strengthened in 2016. Growth centres outside the capital area are attractive due to their higher yields and the low availability of prime CRE in the Helsinki area. These data suggest a different rate of growth in investment transactions (36.5% year-on-year in 2016) from that indicated by the scoreboard (52.4% year-on-year in 2016).
Policies
Country-specific comments from national authorities
The risk assessment of the Suomen Pankki – Finlands Bank is mainly in line with the assessment of the ESRB. Rental growth and good market liquidity have attracted investors to the Helsinki central business district. Transaction volumes reached record levels in 2017 as did the share of foreign investors of transactions. The valuations of prime CRE are at an all-time high and yields are at a record low. However, there are significant differences in terms of location and purpose. Our analysis suffers from some data gaps, although it recently acquired more detailed data from an independent information source which should enable us to sharpen it. Moreover, the forthcoming AnaCredit data will soon offer a rich data source for our analysis. The forthcoming new data sources should help us to produce the new data required by the ESRB recommendation on closing real estate data gaps. We note that the indicator “Bank lending collateralised by CRE, annual growth, %” for Finland in Table 5 “Scoreboard indicators and survey answers for the financing stretch” (p. 34) gives a misleading picture of market development. The annual growth of 38.2% comes mainly from changes to the reporting agents’ coverage between end-2016 and end-2017. Our figure for annual growth is 9% when the changes in coverage are taken into account.
2) According to market-based data (KTI) from Suomen Pankki – Finlands Bank the estimate for total CRE market size in relation to GDP was 19% in 2016. The scoreboard indicator is likely to overestimate total market size as it also includes housing portfolios and buy-to-let housing. If this number is used in the scoreboard, the risk rating in the potential for spillovers stretch changes to “low risk”.

Report on vulnerabilities in the EU commercial real estate sector / November 2018 Contents 109
A.2.10 France
Collateral stretch
Scoreboard:
Medium risk
Scoreboard: Prices for the CRE sector as a whole have reached their historical peaks and are continuing to grow rapidly. Prices in the prime segment are also close to their historical peaks, although a slight decline in prices is currently being recorded in this segment. Current CRE yields are low compared with their long term averages, but they are relatively high compared with government bonds, suggesting that risk premia are not excessively compressed.
Survey:
Medium risk
Survey: Prices have increased continuously over the last 20 years. CRE appears to be overvalued based on the deviation of yields from the historical average, rent dynamics, and relative to recent GDP figures. Prices are driven by strong demand, given the low interest rate environment. Early figures showed a moderation of price growth in 2016.
Income and activity stretch
Scoreboard:
Low risk
Scoreboard: While investment transactions are large relative to GDP, the growth in transactions over the past twelve months has been modest. Furthermore, while yields are very low, vacancy rates are also low.
Survey:
Low risk
Survey: There are limited data available on the financial position of CRE investors, although LTV ratios appear to be low. Some areas are in a situation of undersupply (Paris offices) but this does not characterise the entire French CRE market. Vacancy rates for Paris office space are decreasing due to low levels of completions and an active leasing market.
Financing stretch
Scoreboard:
Medium risk
Scoreboard: CRE-collateralised bank lending is growing very rapidly. Real estate investment funds are growing at a moderate pace.
Survey:
No risk
Survey: While new bank lending to CRE is growing rapidly, banks’ total outstanding exposures have increased only slightly, suggesting that a large proportion of new lending has been offset by high levels of (early) redemptions. Data on bank lending standards do not indicate significant vulnerabilities. For example, three-quarters of outstanding loans have been contracted with an LTV of below 60%. However, data issues prevent a full assessment of lending standards.
Potential for spillovers
Scoreboard:
No risk
Scoreboard: Banks’ CRE-collateralised exposures are small relative to their Tier 1 capital, and CRE-collateralised loans represent a small proportion of total loans. Real estate investment funds are moderate in size relative to GDP, and insurers’ exposures to CRE as a proportion of their total assets are low. The CRE market is of moderate size compared with GDP.
Survey:
No risk
Survey: French banks have limited exposure to the CRE market. The stress-test performed in Autumn 2016 at the request of the HCSF suggested that banks would be almost unaffected by a strong price shock in the French CRE market. Excluding pension funds, other financial intermediaries’ exposures to CRE also appears to be limited. The main channel of transmission of negative spillovers from the CRE market to the real economy would be through activity in the construction sector (that comprises 7% of the value added in France) and would have only a moderate impact. At end-2015, French CRE assets represented 16.6% of GDP.

Report on vulnerabilities in the EU commercial real estate sector / November 2018 Contents 110
Additional information
Additional information from the survey: The main risk to CRE is that low yields will result in a decrease in risk premia if interest rates rise. CRE assets will become too expensive, driven by the low yields. As credit costs rise, CRE assets will become too expensive relative to their returns and CRE prices will fall.
ATC BUS: CRE is mentioned as risk number four. An abrupt decline of CRE prices could hit the financial sector.
Policies
Country-specific comments from national authorities
The strong increase in CRE loans reflects a “jump” in CRE-collateralised loans to corporates in September 2017 – since then outstanding loans have remained as illustrated in the chart below:
Chart
Source: FINREP (F18.00) for the six main French banking groups.
Two banks are involved:
• One bank recorded 100% growth between June 2017 and September 2017 following the reclassification of exposures from the retail portfolio at the request of a recent on-site inspection;
• Another bank recorded 600% growth between June 2017 and September 2017 following an improvement of the reporting system of some of its subsidiaries that had not been able to populate row 140 of FIN18.00 template until September 2017.
Finally, according to the ACPR semi-annual survey, French banks’ lending to CRE increased by 12.5% in 2017 – an increase which is more consistent with the change shown in Chart 20.
-20%
-10%
+0%
+10%
+20%
+30%
+40%
+50%
0
20
40
60
80
100
120
140
Loans to corporates collateralised by CREproperty (EUR bns, lhs)
Quarterly change (rhs)

Report on vulnerabilities in the EU commercial real estate sector / November 2018 Contents 111
A.2.11 Germany
Collateral stretch
Scoreboard:
Pronounced risk
Scoreboard: Prices in both prime segments and across the CRE sector as a whole have reached historical peaks and are continuing to grow very rapidly. Current CRE yields are low compared with their long-term averages, although they are relatively high compared with government bonds, suggesting that risk premia are not excessively compressed.
Survey:
Medium risk
Survey: Prices are increasing at a faster pace than might be justified by the macroeconomic environment, but the biggest increases have been in prime locations in the seven biggest cities. Price increases appear to stem from an increase in the valuations of stock (which is not necessarily traded). Demand is strong, although supply does not appear to be sufficient.
The scoreboard signals higher risks than the survey, due to the authorities’ indications that some of the price increases are driven by changes in the valuations of untraded stock, and their indications that supply is not reacting to the growth in demand.
Income and activity stretch
Scoreboard:
Medium risk
Scoreboard: Investment transactions are very large relative to GDP but are growing moderately. While vacancy rates are low, yields are also very low.70
Survey:
Low risk
Survey: Attractive prices and relatively high yields compared with other European countries are fostering CRE investment from foreign investors – a trend which is likely to continue in the future. LTV data appear to indicate that CRE investors’ leverage is sustainable.
The scoreboard signals higher risks than the survey, given the authorities’ indications that investors’ leverage is sustainable.
Financing stretch
Scoreboard:
No risk
Scoreboard: Real estate investment funds are growing slowly. CRE-collateralised bank lending has decreased over the past year.
Survey:
Low risk
Survey: Banks are starting to increase their CRE lending at a moderate pace. LTVs and DSCRs remain conservative, although there is anecdotal evidence of looser lending standards with regard to other covenants. Foreign investors account for a high share of total CRE investments in Germany.
70 According to data from bulwiengesa provided by the Bundesbank, the average vacancy rate across 127 cities was 4.8% in 2017. If this number is used in the scoreboard, the risk rating for the income and activity
stretch is unchanged.

Report on vulnerabilities in the EU commercial real estate sector / November 2018 Contents 112
Potential for spillovers
Scoreboard:
No risk
Scoreboard: Banks’ exposures collateralised by commercial property are small relative to their Tier 1 capital, and loans collateralised by CRE companies represent a small proportion of total loans. In addition, insurers have comparatively small exposures to CRE as a proportion of their total assets. Nonetheless, real estate investment funds are large relative to GDP, while the CRE market is small relative to GDP.
Survey:
Low risk
Survey: Banks' domestic exposures to CRE amounted to about half the volume of residential real estate loans. Two stress tests (one historical scenario and one adverse scenario) suggest only minor losses for banks in the event of an isolated shock to the CRE market. For the non-bank sector, the assessment of low risk is based on the relatively small volume of exposures (especially for insurers) and on stricter regulations regarding the permitted leverage of investment funds and the redemption rules for shareholders. The data currently show no build-up of systemic risks. Investment in building activities remains subdued.
Additional information
Additional information from the survey: The main risk to CRE is considered to be a decrease in demand, and the adverse effects that would arise in the event of an interest turnaround.
Policies
Country-specific comments from national authorities

Report on vulnerabilities in the EU commercial real estate sector / November 2018 Contents 113
A.2.12 Greece
Collateral stretch
Scoreboard:
No risk
Scoreboard: Prices in prime segments are growing rapidly, although they remain well below their historical peaks. Yields are at their historical averages and are relatively high compared with government bonds. There is no price index available for the CRE market as a whole.
Survey:
No risk
Survey: CRE prices are either still declining or growing weakly due to the prolonged economic crisis. Retail prices seem to have stabilised, while office prices increased marginally in 2016. There are no signs of overvaluation.
Income and activity stretch
Scoreboard:
No risk
Some data gaps
Scoreboard: The volume of investment transactions is small relative to GDP, and has declined significantly over the past two years. Yields are relatively high. No data on vacancy rates are available.
Survey:
Pronounced risk
Survey: The recession has reduced demand for CRE spaces, increasing the vacancy rate in secondary and lower-quality markets. New CRE developments have also been limited by economic uncertainty. However, investor interest in tourism property increased throughout 2016 and the first half of 2017, driven by high nominal yields. The overall number of CRE transactions is limited and funding is scarce. With the exception of the hotel sector, the lack of investment and new development is seen as an issue. The high aggregate debt level of CRE investors makes them potentially vulnerable to negative shocks. The NPE ratio of CRE exposures stood at 54.2% in June 2017, 10 percentage points higher than the average NPE ratio for business loans (both at the solo level).
The survey signals higher risks than the scoreboard, given the authorities’ indications that investors are highly indebted and vulnerable to negative shocks.
Financing stretch
Scoreboard:
No risk
Scoreboard: Real estate investment funds are growing at a slow pace, and growth in bank exposures to CRE is negative.
Survey:
No risk
Survey: Lending to CRE has fluctuated within a narrow range since 2011 and lending standards remain tight. Bank lending for CRE investments is not considered to be high. Data from the Greek authorities indicate that the banking sector’s total exposure to CRE was €6,508 million in Q1 2017, up 3.4% year-on-year. REITs with predominantly foreign shareholders seem to be an important lending channel for CRE. The outlook for foreign investor interest remains positive although it is dependent on overall sentiment and developments relating to the implementation of the ESM Programme.

Report on vulnerabilities in the EU commercial real estate sector / November 2018 Contents 114
Potential for spillovers
Scoreboard:
Low risk
Some data gaps
Scoreboard: Even though banks’ CRE-collateralised exposures are large compared with their Tier 1 capital, CRE-collateralised loans represent a moderate proportion of total loans. Real estate investment funds are small relative to GDP, but insurers’ exposures to CRE as a proportion of their total assets are moderate. There are no data available on the size of the CRE market relative to GDP.
Survey:
No risk
Survey: The potential for negative spillovers from CRE is limited. Banks have little exposure to CRE (which comprises only 4.4% of total business loans). Based on data provided by the Greek authorities, insurers’ and pension funds’ CRE exposures are also limited.
Additional information
Policies
Country-specific comments from national authorities
Bank of Greece publishes Office and Retail Price Indices covering the prime as well as the upper-secondary property market. Therefore, the observed differences between CRE indices based on private data sources obtained by the ESRB and Bank of Greece published indices may be due to coverage, data sample and definitions. For example, while real prime CRE annual price growth for 2017 is 14% in the report (Chart 12), according to Bank of Greece data annual growth is below 4% for both Office and Retail. Moreover, the reported transaction activity figure (−64% annual change) does not seem to be in line with heightened investor interest and increased demand in the prime market. Notwithstanding these discrepancies, the scoreboard and the country survey both attest that CRE does not pose a systemic risk to the financial sector in Greece.

Report on vulnerabilities in the EU commercial real estate sector / November 2018 Contents 115
A.2.13 Hungary
Collateral stretch
Scoreboard:
Low risk
Scoreboard: Prices in both prime segments and across the CRE sector as a whole remain well below their historical peaks. Prices are stagnating across the CRE sector as a whole, although they are growing rapidly in prime segments. Current CRE yields are low compared with their long-term averages, but they are relatively high compared with government bond yields, suggesting that risk premia are not excessively compressed.
Survey:
Low risk
Survey: Prices are being driven by demand-side factors. The increase in prime CRE yields relative to yields in other market segments has resulted in an increase in prices for prime CRE. However, there do not appear to be any signs of overvaluation so far.
Income and activity stretch
Scoreboard:
No risk
Some data gaps
Scoreboard: Although they are increasing rapidly, investment transaction volumes remain very small relative to GDP. Furthermore, CRE yields are relatively high. No data on vacancy rates are available in the scoreboard.71
Survey:
Low risk
Survey: Vacancy rates in the office and logistics segment have decreased, particularly for larger premises, and rents have increased slightly. The supply of retail CRE is also limited due to the lack of new developments over the past few years. However, there have been a relatively large number of new developments in the office segment, so the Budapest office vacancy rate is expected to increase. Both Hungarian and foreign institutional investors are interested in acquiring high quality prime assets. As banks continue to sell off their NPLs, activity in the non-prime sector is also expected to increase.
Financing stretch
Scoreboard:
Medium risk
Scoreboard: While bank lending collateralised by CRE decreased over the past year, real estate investment funds are growing very rapidly – at the highest rate among the EU countries.
Survey:
Low risk
Survey: Lending standards appear to be gradually loosening. New CRE lending by banks (mostly for offices) amounted to €1.4 billion in 2016, 72% higher than in 2015. Although this new lending equated to 39.5% of the total stock of outstanding CRE loans held by banks, this outstanding stock did not change substantially due to the high volume of repayments. Moreover, despite the fact that REIFs are growing rapidly, most of the growth of the net asset value of the five largest Hungarian public real estate funds went into liquid assets. The current share of these stands at 54% of the aggregated net asset value. At the same time, the amount invested in real estate has been lagging behind the growth of the net asset value of these funds. Their exposure to the real estate sector has therefore grown at a more moderate pace. Thus, from the point of view of these funds’ risk profiles, the growth in net asset value does not accurately represent the increase in the riskiness of real estate funds, as in the event of a shock the redemption of the investment notes would not cause a significant problem, given the increased liquidity buffers.
The survey signals lower risks than the scoreboard. The scoreboard only measures the growth in real estate investment funds, while the survey indicates that investment in these funds is lagging behind their net asset growth and that over 50% of the funds are invested in liquid assets.
71 According to data for HU from Budapest Research Forum Data and provided by the Magyar Nemzeti Bank, the average office vacancy rate in Budapest was 7.3% in Q1 2018, having fallen continuously from 11.3% in
Q1 2016. If this number is used in the scoreboard, the risk rating for the income and activity stretch is unchanged.

Report on vulnerabilities in the EU commercial real estate sector / November 2018 Contents 116
Potential for spillovers
Scoreboard:
No risk
Scoreboard: CRE-collateralised loans represent a moderate proportion of total loans, and banks’ exposures collateralised by commercial property are small relative to their Tier 1 capital. Real estate investment funds are small relative to GDP, and insurers have little exposure to CRE relative to their total assets. The CRE market is small relative to GDP.
Survey:
Low risk
Survey: Bank exposures collateralised by commercial property amount to 52% of Tier 1 capital, which is high compared with other countries. The six largest banks provide 72% of the total bank financing for CRE. Domestic banks have reduced the size of their CRE portfolios over the past two years, although NPLs remain high. In addition to banks, real estate investment funds are also large domestic institutional investors in CRE (responsible for almost 30% of investment in 2016). There is also interest from foreign investors, who account for a large part of domestic CRE investment.
Additional information
Policies
2015 – The institution-specific systemic risk buffer was set in the range of 0% to 2%, depending on the contribution of the institution to the systemic risk stemming from problem domestic CRE exposures. These problem exposures included CRE project finance exposures and CRE assets which are held-for-sale on the balance sheet.
2016 – The asset management company dedicated to purchasing distressed CRE portfolios from financial institutions and catalysing the market for distressed assets commenced operations. As a result of the major portfolio cleaning and due to the recovering domestic real estate market, the Magyar Nemzeti Bank sold the asset management company in June 2017.
Country-specific comments from national authorities
While the scoreboard highlights the most important market developments, it does not capture all aspects of local specificities. The indicators measuring CRE-collateralised bank lending are not fully representative of the whole market, as they rely on only three Hungarian financial institutions’ data, ignoring the most active institution in CRE lending. This has led to a bias in these indicators. When all institutions are taken into account, CRE-collateralised bank lending shows an increase of 9.6% for 2017 as opposed to the -1.4% shown in the scoreboard. Nevertheless, this figure would still correspond to a low risk according to the risk thresholds in the scoreboard, and the role of banks in financing this segment still remains moderate; the actual growth level does not, therefore, currently pose a systemic risk.
Overall, a broader analysis of different CRE segments could also give a more detailed picture of the state of the market. Apart from the office vacancy rates highlighted in the report, the vacancy rates in the industrial real estate segment are also of importance, as they differ significantly from the office segment. In Budapest, the industrial vacancy rate in Q1 2018 was only 4.2%, while in the office segment the rate was 7.3%. The office vacancy rate is expected to increase in the near future, due to a relatively large number of new developments. At the same time, the industrial vacancy rate is expected to remain low, as most of the in-progress industrial developments are already pre-let. The industrial yield is also higher than the office yield, standing at 7.75% compared with 6% in Q1 2018.
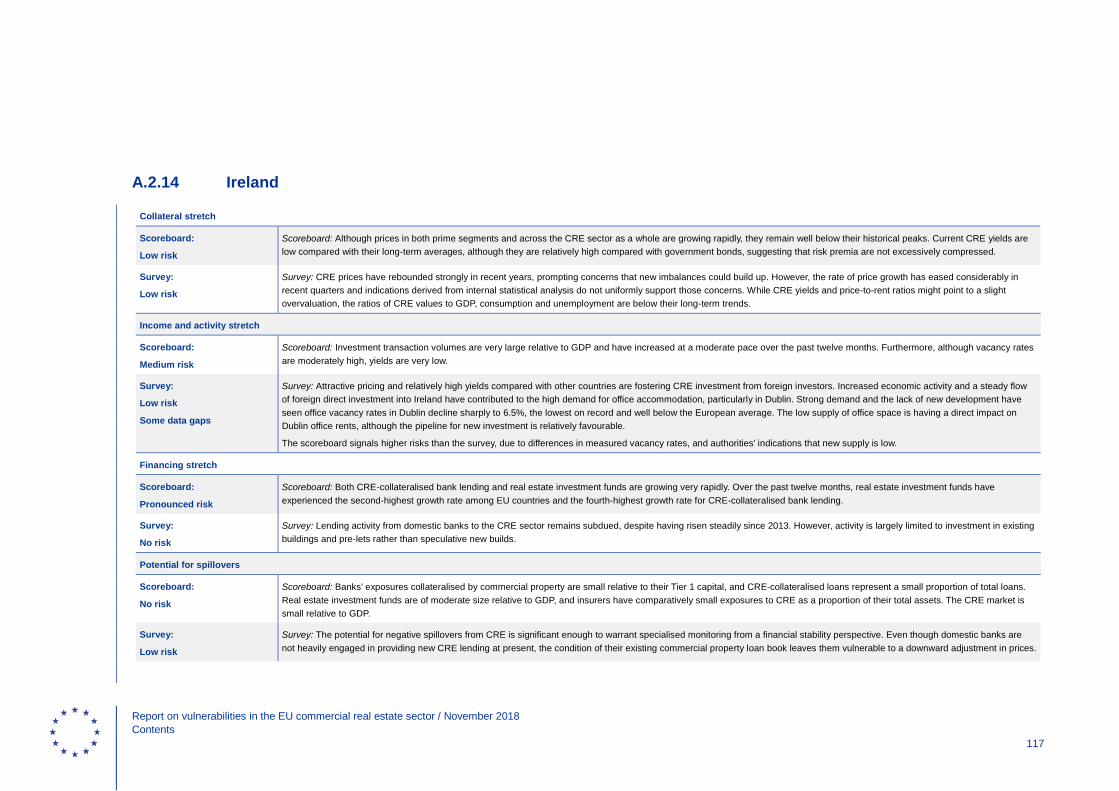
Report on vulnerabilities in the EU commercial real estate sector / November 2018 Contents 117
A.2.14 Ireland
Collateral stretch
Scoreboard:
Low risk
Scoreboard: Although prices in both prime segments and across the CRE sector as a whole are growing rapidly, they remain well below their historical peaks. Current CRE yields are low compared with their long-term averages, although they are relatively high compared with government bonds, suggesting that risk premia are not excessively compressed.
Survey:
Low risk
Survey: CRE prices have rebounded strongly in recent years, prompting concerns that new imbalances could build up. However, the rate of price growth has eased considerably in recent quarters and indications derived from internal statistical analysis do not uniformly support those concerns. While CRE yields and price-to-rent ratios might point to a slight overvaluation, the ratios of CRE values to GDP, consumption and unemployment are below their long-term trends.
Income and activity stretch
Scoreboard:
Medium risk
Scoreboard: Investment transaction volumes are very large relative to GDP and have increased at a moderate pace over the past twelve months. Furthermore, although vacancy rates are moderately high, yields are very low.
Survey:
Low risk
Some data gaps
Survey: Attractive pricing and relatively high yields compared with other countries are fostering CRE investment from foreign investors. Increased economic activity and a steady flow of foreign direct investment into Ireland have contributed to the high demand for office accommodation, particularly in Dublin. Strong demand and the lack of new development have seen office vacancy rates in Dublin decline sharply to 6.5%, the lowest on record and well below the European average. The low supply of office space is having a direct impact on Dublin office rents, although the pipeline for new investment is relatively favourable.
The scoreboard signals higher risks than the survey, due to differences in measured vacancy rates, and authorities’ indications that new supply is low.
Financing stretch
Scoreboard:
Pronounced risk
Scoreboard: Both CRE-collateralised bank lending and real estate investment funds are growing very rapidly. Over the past twelve months, real estate investment funds have experienced the second-highest growth rate among EU countries and the fourth-highest growth rate for CRE-collateralised bank lending.
Survey:
No risk
Survey: Lending activity from domestic banks to the CRE sector remains subdued, despite having risen steadily since 2013. However, activity is largely limited to investment in existing buildings and pre-lets rather than speculative new builds.
Potential for spillovers
Scoreboard:
No risk
Scoreboard: Banks’ exposures collateralised by commercial property are small relative to their Tier 1 capital, and CRE-collateralised loans represent a small proportion of total loans. Real estate investment funds are of moderate size relative to GDP, and insurers have comparatively small exposures to CRE as a proportion of their total assets. The CRE market is small relative to GDP.
Survey:
Low risk
Survey: The potential for negative spillovers from CRE is significant enough to warrant specialised monitoring from a financial stability perspective. Even though domestic banks are not heavily engaged in providing new CRE lending at present, the condition of their existing commercial property loan book leaves them vulnerable to a downward adjustment in prices.

Report on vulnerabilities in the EU commercial real estate sector / November 2018 Contents 118
Additional information
ATC BUS: CRE risks are mentioned as the fifth-highest risk: Irish CRE is susceptible to global economic and financial uncertainty due to the high rate of activity of foreign investors. Returns on CRE declined in 2016, but remain higher than in other countries. Until recently there has been a lack of new property development, which has driven vacancies down. Rental values and capital continue to grow.
Policies
Since 2007, some CRE risks have been addressed by increasing banks’ risk weights. The minimum risk weight on CRE lending for banks using the standardised approach (which covers approximately 25% of banks’ CRE exposures) is set at 100%, in comparison with the requirement of 50% in Article 126 of the CRR.
Country-specific comments from national authorities
Annual CRE price growth has moderated notably, from a high of 30% in 2014, to 2.1% in the opening quarter of 2018. Demand in the Dublin office sector, which constitutes a large portion of the market and has driven much of the recovery in capital and rental values, remains strong. Record levels of office space were rented or leased in Q1 2018. The high volume of leasing which has occurred in recent years has seen the overall vacancy rate in the Dublin office market drop to 6%, lower than in many other European cities.
Substantial sums of investment expenditure have been attracted to the Irish commercial property market in recent years. Following record sums of over €4 billion in both 2014 and 2016, the value of transactions slowed to €2.3 billion in 2017. Part of last year’s decline in CRE expenditure was due to a fall in the number of “big ticket items”, such as shopping centres, for sale in comparison with previous years, although the number of CRE transactions remained relatively stable.
While the data reported here records significant growth in the stock of CRE holdings of real estate investment funds, we would note the absence of insurance fund and Irish REIT data from these figures. Data on the flow of investment expenditure in the Irish CRE market by investor category suggests that the portion of activity accounted for by REITS has slowed in the past couple of years (approx. 2% in 2017 vs. 30% in 2014). In contrast, institutional investors (such as pension funds), which tend to favour longer investment horizons, as well as property companies, private investors and developers, are the groups responsible for the majority of operations in the market at this time.
Substantial deleveraging, loan write-offs and ongoing amortisations have seen the stock of outstanding commercial property lending at Irish retail banks fall steadily since 2012, to approximately €19 billion.
Irish retail banks have played a relatively limited role in the direct funding of commercial property-related activity, with most of the new finance they have provided in recent years going towards investment in existing buildings and in pre-lets rather than on expenditure on speculative new builds.
There was a pick-up in new CRE lending activity amongst the Irish retail banks throughout 2017. New lending activity reached €3.5 billion, up from €3.1 billion in 2016. A large portion of this increase related to refinancing activity and the provision of additional funding for residential property development. Notwithstanding this latest increase, new CRE lending activity constituted a relatively small portion of overall new lending by the Irish retail banks (12.1%) during 2017.
In our opinion, it is important to distinguish between direct CRE lending and CRE-collateralised lending, as the former speaks more to potential vulnerabilities in the financing stretch while the latter highlights possible concerns in the spillover stretch. We therefore think it makes more sense to view the issues raised in these stretches as complimentary rather than separate.

Report on vulnerabilities in the EU commercial real estate sector / November 2018 Contents 119
A.2.15 Italy
Collateral stretch
Scoreboard:
Low risk
Scoreboard: Across the CRE sector as a whole, prices remain below historical peaks and are declining1. However, in the prime segment prices have reached historical peaks and are rising rapidly. Current CRE yields are low compared with their long-term averages, although they are relatively high compared with government bonds, suggesting that risk premia are not excessively compressed.
Survey:
No risk
Survey: According to Banca d’Italia’s quarterly indicator (based on actual transactions), at end-2016 CRE prices were still 12% below their 2008 levels. Moreover, the ratio of CRE prices to nominal GDP remains 7 percentage points below its 1997-2013 average. The fall in CRE prices affected all CRE sectors, but was sharpest for the retail segment. The low prices reflect the slow economic recovery and subdued profits of NFCs. Investment in CRE has also fallen, leading to a decline in new supply. According to the survey, the data used in the scoreboard are not representative of the nationwide price developments in CRE, as they mainly cover the prime sector.
Income and activity stretch
Scoreboard:
Medium risk
Scoreboard: Vacancy rates are high and yields are very low. However, investment transactions relative to GDP are moderate in size, and are increasing slowly.
Survey:
No risk
Survey: Banks, who are the main investors in CRE, are deleveraging in order to reduce their large holdings of CRE NPLs. Many real estate investment funds and real estate companies are also deleveraging, although they remain fragile. Insurers and other institutional investors have little exposure to the sector.
The scoreboard signals higher risks than the survey, due to differences in the measurement of vacancy rates and yields, and authorities’ indications that banks and investors are deleveraging.
Financing stretch
Scoreboard:
No risk
Scoreboard: CRE-collateralised bank lending has decreased over the past year. Real estate investment funds are growing at a moderate pace.
Survey:
No risk
Survey: Overall lending to CRE has declined since end-2011. Lending to construction firms continues to decline (-6.8% in 2016), while lending to real estate agencies is currently fairly flat (-0.2% in 2016). The results of a recent business confidence survey for Q4 2016 indicate that lending conditions remain tight for construction firms: the net percentage of construction firms reporting difficulty in obtaining credit was 6.8%.
1) The index only covers a very limited share of total CRE property (not higher than 20%) and it is concentrated in a very small number of large cities.

Report on vulnerabilities in the EU commercial real estate sector / November 2018 Contents 120
Potential for spillovers
Scoreboard:
No risk
Scoreboard: Banks’ exposures collateralised by commercial property are moderate in size relative to their Tier 1 capital, and CRE-collateralised loans represent a moderate proportion of total loans. Real estate investment funds are moderate in size relative to GDP, and insurers have comparatively small exposures to CRE as a proportion of their total assets. The CRE market is small relative to GDP.
Survey:
No risk
Survey: Although only 20% of total banks loans are for CRE, the NPLs of construction firms and real estate agencies account for 43% of total bank NPLs due to prolonged weakness in the CRE sector. However, recent improvements in the CRE market are reducing banks' vulnerability: in H2 2016 the overall flow of new bad debts to construction and real estate firms declined. Based on QIS data at end-2015 banks' total exposures to CRE accounted for 5.3% of total EAD. Of the non-bank financial intermediaries, real estate closed-end funds were the most exposed to CRE, with net assets of around €44 billion at end-2016.
Additional information
Adt-OMI: In 2015 the ratio of CRE transactions to RRE transactions was around 10% by volume, and 17% by turnover. CRE turnover represented roughly 1% of gross value added in Italy.
National Statistical Agency: In 2015 CRE assets represented about 29% of total real estate assets in the economy.
Policies
Country-specific comments from national authorities
Banca d’Italia reiterates its comment that the prime segment price indicator used in the scoreboard is not representative of the countrywide CRE price dynamics.

Report on vulnerabilities in the EU commercial real estate sector / November 2018 Contents 121
A.2.16 Latvia
Collateral stretch
Scoreboard:
No risk rating due to data gaps
Scoreboard: No data.
Survey:
No risk
Survey: No official indices are available for CRE market prices. Private sector sources indicate that CRE rental rates are rather high, although they show no definite signs of overheating. Structural features of the market may be limiting speculative pressures. However, a comprehensive assessment is hindered by the limited availability of data.
Income and activity stretch
Scoreboard:
No risk rating due to data gaps
Scoreboard: No data.
Survey:
No risk
Survey: According to the assessment of CRE companies, CRE market dynamics remain moderate. Office rents remained stable during 2016, while some minor fluctuations in vacancy levels were observed. A slight decrease in the vacancy level has been observed in the retail sector, partly due to low rates of new construction. A prolonged low interest rate environment might foster investor interest in the future, although this would be limited by the size and depth of the market. Non-financial companies in the real estate sector are generally not highly leveraged and other CRE investors have deleveraged since the 2008 crisis.
Financing stretch
Scoreboard:
No risk
Some data gaps
Scoreboard: CRE-collateralised bank lending is growing at a slow pace. No data are available on the growth of real estate investment funds.
Survey:
Low risk
Survey: Recent lending growth for CRE appears to be in line with the general recovery of lending after the prolonged period of deleveraging in Latvia. New lending to the real estate and construction sectors amounted to around €0.6 billion in 2016, while the stock of loans to those sectors remained broadly unchanged.

Report on vulnerabilities in the EU commercial real estate sector / November 2018 Contents 122
Potential for spillovers
Scoreboard:
No risk
Some data gaps
Scoreboard: CRE-collateralised loans represent a moderate proportion of total loans. Real estate investment funds are small relative to GDP, although insurers’ exposures to CRE as a proportion of their total assets are moderate. No data are available on the size of the CRE market relative to GDP.
Survey:
No risk
Survey: In Dec-2016, CRE loans (proxied by their total exposure to the real estate and construction industries) comprised 16.7% of the total banking sector loan portfolio and were diversified among banks. The quality of domestic CRE loan portfolios has improved significantly and the share of loans due over 90 days has decreased from its peak of 31.3% in Feb-2010 to 3.5% in Dec-2016. Currently, more prudent lending standards are applied by banks than was the case prior to the crisis. Non-banks' exposure to CRE is less than 0.15% of the financial system’s total assets. Non-banks exposures are mainly to Latvia, but there are also small exposures to Estonia and Lithuania.
Additional information
Additional information from survey: According to Colliers International Ltd, the Class A office vacancy rate is 4.1%. At the same time, there are signs of an oversupply of low quality CRE (Class B and Class C offices), although these are not usually financed by banks.
Policies
Country-specific comments from national authorities
The CRE market in Latvia is small and heterogeneous, and the number of transactions is low and irregular. Developments in the CRE market can therefore be affected by some large one-off projects and transactions. In addition, official, comparable and homogeneous data are scarce.

Report on vulnerabilities in the EU commercial real estate sector / November 2018 Contents 123
A.2.17 Lithuania
Collateral stretch
Scoreboard:
No risk rating due to data gaps
Scoreboard: No data.
Survey:
Low risk
Survey: Prices have been growing continuously since 2014 (averaging 7.4% p.a., higher than GDP growth over the same period). However, the latest data suggest that annual CRE price growth has slowed significantly (to 0.9% in 2017) due to the recent rise of supply. During the period 2014-16 average CRE sale price growth and average CRE rental price growth were practically identical at 7.4% and 7.5% respectively, indicating that CRE prices were in line with fundamentals.
Income and activity stretch
Scoreboard:
No risk rating due to data gaps
Scoreboard: No data.
Survey:
Medium risk
Survey: Attractive rental yields are the main driving force behind attracting capital in an environment where vacancy levels are low. The Lithuanian CRE market is rather small and illiquid, but interest from foreign investors is expected to increase as the market continues to develop. The large portion of new construction projects indicates that there is a risk that forthcoming supply will not match demand. Vacancy dynamics therefore warrant close monitoring going forward1. Moreover, the current level of indebtedness of CRE investors appears to be sustainable. For example, the leverage ratio (liabilities-to equity ratio) of RE companies declined from 140% in 2008 to around 100% in 2016. In addition, the banks’ financial situation is considered to be stable. Data on non-bank credit providers are limited.
Financing stretch
Scoreboard:
Medium risk
Scoreboard: Real estate investment funds are growing rapidly. CRE-collateralised bank lending is growing at a moderate pace.
Survey:
Low risk
Survey: CRE lending growth appears to be above what may be considered consistent with the macroeconomic environment. According to the National Credit Register, compared with 2015 new credit issued by banks to real estate and construction companies increased by 56.0% in value terms and by 76.5% in volume terms. There is a lack of hard data for monitoring banks' lending standards, but there are signs that standards are gradually being loosened. On the one hand, market intelligence meetings suggest that banks usually require a proposed building to be at least 30% pre-let in order to issue loans for a CRE project. On the other hand, 1) BLS data indicate somewhat less restrictive lending to RE sector companies in 2017 than was the case in 2016; 2) in general, the share of uncollateralised funding to NFC increased in 2016 compared with 2015; 3) the RE sector has seen one of the largest increases in the banks’ loan portfolios in 2016 compared with other economic sectors; 4) banks might be more willing to increase their risk appetite for RE, as the level of NPL in the RE sector has declined substantially over the last couple of years.
1) Office buildings further away from the city centre have higher vacancy rates. According to recent data, the overall vacancy rate in Q1 2017 stood at 5.8% (3.2% vacancy rate for Class A office buildings), up from 4.1% at

Report on vulnerabilities in the EU commercial real estate sector / November 2018 Contents 124
the same time the previous year.
Potential for spillovers
Scoreboard:
Low risk
Some data gaps
Scoreboard: Banks’ exposures collateralised by commercial property are large relative to their Tier 1 capital, and CRE-collateralised loans represent a moderate proportion of total loans. Besides this, real estate investment funds are small relative to GDP, and insurers have comparatively moderate exposures to CRE as a proportion of their total assets. There are no data available on the size of the CRE market relative to GDP.
Survey:
Low risk
Survey: Banks' risk exposures to CRE are significant, although it has been assessed that banks are managing their risks appropriately. In general, there are signs that non-banks’ exposures to CRE are increasing, although these still appear to be considerably smaller than banks' exposures. The potential for negative spillovers from CRE is significant enough to warrant specialised monitoring from a financial stability perspective. The main channels of transmission would be through construction sector and real estate activities.
Additional information
FSR: The 2016 FSR stressed that demand is driven by foreign companies. In Vilnius the office vacancy rate is only 0.6% for Class A offices in the CBD. Office buildings further away from the city centre have higher vacancy rates.
ATC BUS: According to the ATC BUS (third risk), activity in both the residential and the CRE markets is significant and might add to over-optimistic expectations for both real estate companies and households in the medium term.
Policies
Country-specific comments from national authorities
Investor activity in the Lithuanian CRE market increased further throughout 2017, with the value of investment transactions rising by almost a quarter compared with 2016, reaching 0.7% of GDP. Most of the investment flow was directed into offices and retail space, with each of these segments consisting of around 40% of investment volume. The supply of newly built CRE has increased significantly since 2016. However, stable economic growth has increased demand from both local and foreign businesses, especially for new offices and logistics warehouses. As a result, office vacancy rates in Vilnius, the capital city, remain historically low and are coupled with historically low yields, averaging 3.1% and 6.5% respectively as of Q1 2018. Office prices in Vilnius increased by around 6% in real terms during 2017 and were still about 30% lower than the historical maximum reached in Q2 2008. Office rents remained stable throughout 2017.
The comments were prepared in accordance with the data provided by Ober-Haus and CBRE.

Report on vulnerabilities in the EU commercial real estate sector / November 2018 Contents 125
A.2.18 Luxembourg
Collateral stretch
Scoreboard:
Pronounced risk
Some data gaps
Scoreboard: Prices in prime segments are rising rapidly and are already at historical peak levels. Current CRE yields are low compared with their long term averages. No price index is available for the CRE market as a whole, and no time series is available for government bond yields.
Survey:
Low risk
Survey: The authorities’ annual price growth rate series seems to suggest that there is no overvaluation at this time, although this is difficult to assess given that the series is highly volatile. Due to data limitations, no model is currently available to assess the overvaluation of CRE prices.
The scoreboard signals higher risks than the survey, due to differences in measured price growth and issues with data availability.
Income and activity stretch
Scoreboard:
Medium risk
Some data gaps
Scoreboard: Investment transactions are very large relative to GDP, although they are only growing slowly. Yields are low. No data on vacancy rates are available.
Survey:
No risk
Survey: Data limitations mean that it is difficult to provide a detailed assessment at this time. The market is characterised by a situation of persistent undersupply of CRE needed to support the current stream of income from CRE investors. New construction projects appear to be hindered by supply-side constraints.
The scoreboard signals higher risks than the survey, given that the survey indicates that there is an undersupply of CRE. The scoreboard does not measure supply directly, although it indicates that yields are low.
Financing stretch
Scoreboard:
No risk
Some data gaps
Scoreboard: Real estate investment funds are growing slowly. There are no data available on growth in bank lending.
Survey:
Low risk
Survey: The CRE market relies on a diversified set of funding sources. However, due to data limitations it is difficult to provide a more detailed assessment at this time.
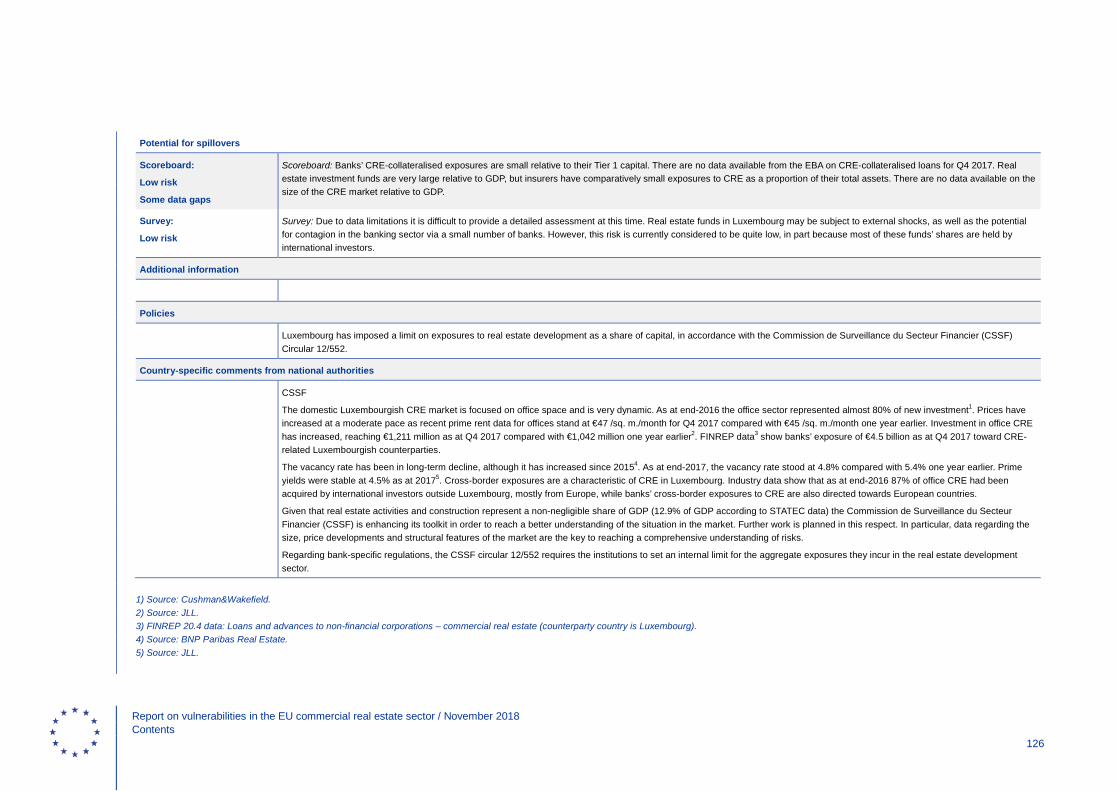
Report on vulnerabilities in the EU commercial real estate sector / November 2018 Contents 126
Potential for spillovers
Scoreboard:
Low risk
Some data gaps
Scoreboard: Banks’ CRE-collateralised exposures are small relative to their Tier 1 capital. There are no data available from the EBA on CRE-collateralised loans for Q4 2017. Real estate investment funds are very large relative to GDP, but insurers have comparatively small exposures to CRE as a proportion of their total assets. There are no data available on the size of the CRE market relative to GDP.
Survey:
Low risk
Survey: Due to data limitations it is difficult to provide a detailed assessment at this time. Real estate funds in Luxembourg may be subject to external shocks, as well as the potential for contagion in the banking sector via a small number of banks. However, this risk is currently considered to be quite low, in part because most of these funds’ shares are held by international investors.
Additional information
Policies
Luxembourg has imposed a limit on exposures to real estate development as a share of capital, in accordance with the Commission de Surveillance du Secteur Financier (CSSF) Circular 12/552.
Country-specific comments from national authorities
CSSF
The domestic Luxembourgish CRE market is focused on office space and is very dynamic. As at end-2016 the office sector represented almost 80% of new investment1. Prices have increased at a moderate pace as recent prime rent data for offices stand at €47 /sq. m./month for Q4 2017 compared with €45 /sq. m./month one year earlier. Investment in office CRE has increased, reaching €1,211 million as at Q4 2017 compared with €1,042 million one year earlier2. FINREP data3 show banks’ exposure of €4.5 billion as at Q4 2017 toward CRE-related Luxembourgish counterparties.
The vacancy rate has been in long-term decline, although it has increased since 20154. As at end-2017, the vacancy rate stood at 4.8% compared with 5.4% one year earlier. Prime yields were stable at 4.5% as at 20175. Cross-border exposures are a characteristic of CRE in Luxembourg. Industry data show that as at end-2016 87% of office CRE had been acquired by international investors outside Luxembourg, mostly from Europe, while banks’ cross-border exposures to CRE are also directed towards European countries.
Given that real estate activities and construction represent a non-negligible share of GDP (12.9% of GDP according to STATEC data) the Commission de Surveillance du Secteur Financier (CSSF) is enhancing its toolkit in order to reach a better understanding of the situation in the market. Further work is planned in this respect. In particular, data regarding the size, price developments and structural features of the market are the key to reaching a comprehensive understanding of risks.
Regarding bank-specific regulations, the CSSF circular 12/552 requires the institutions to set an internal limit for the aggregate exposures they incur in the real estate development sector.
1) Source: Cushman&Wakefield. 2) Source: JLL. 3) FINREP 20.4 data: Loans and advances to non-financial corporations – commercial real estate (counterparty country is Luxembourg). 4) Source: BNP Paribas Real Estate. 5) Source: JLL.

Report on vulnerabilities in the EU commercial real estate sector / November 2018 Contents 127
A.2.19 Malta
Collateral stretch
Scoreboard:
No risk rating due to data gaps
Scoreboard: No data.
Survey:
Low risk
Some data gaps
Survey: No price data are available for Malta. Based on a survey of real estate agents, the CRE sector is assessed as correctly-priced, suggesting that the risk of overvaluation is low. A lack of data means that price dynamics cannot be evaluated.
Income and activity stretch
Scoreboard:
No risk rating due to data gaps
Scoreboard: No data.
Survey:
No risk rating due to data gaps
Survey: Limited information is available. According to the authorities, CRE loans in 2016 had a generally low loan-to-EBITDA ratio, which hovered at around 425%, with a debt service-to-EBITDA ratio of about 40%. For loans granted in Q1 2017, the loan-to-EBITDA ratio stood at around 215%, while the debt service-to-EBITDA ratio was 21%. This variability reflects the relatively small size of the Maltese market.
Financing stretch
Scoreboard:
Medium risk
Some data gaps
Scoreboard: There appears to be rapid growth in bank exposures to CRE. No data are available on the growth of real estate investment funds.
Survey:
Low risk
Some data gaps
Survey: There are no data on CRE lending. However, lending to residential construction and to real estate is used as a proxy. In June 2017, this lending decreased marginally by 0.4% compared with the previous year. The same indicator reveals that CRE lending is very limited, as lending to residential construction and real estate made up for less than 2% of the total number of loans (in 2016 as well as in Q1 2017). Lending standards are reported to be tight: the median LTV for commercial real estate stands at around 55%. Finally, there are no real estate investment funds or pension funds that invest in domestic CRE, and domestically-oriented insurance companies do not lend to CRE.
The scoreboard signals higher risks than the survey, due to differences in measured bank lending growth.

Report on vulnerabilities in the EU commercial real estate sector / November 2018 Contents 128
Potential for spillovers
Scoreboard:
No risk
Some data gaps
Scoreboard: Banks’ CRE-collateralised exposures are small relative to their Tier 1 capital, and CRE-collateralised loans represent a small proportion of total loans. Insurers’ exposures to CRE as a proportion of their total assets are also low. No data are available on the size of real estate investment funds relative to GDP, or on the size of the CRE market relative to GDP.
Survey:
No risk
Survey: The risks of spillover effects are considered to be low. Since 2007, banks have reduced their exposures to CRE to a low level. Non-banks also have limited exposures and domestic insurers and pension funds do not generally invest in CRE at all. Only 0.04% of domestically-oriented insurance companies' bond holdings and 1.5% of their equity holdings are issued by construction and real estate companies. Similarly, bonds and equities issued by construction and real estate firms account for only 0.4% and 0.8% of investment funds’ total assets respectively.
Additional information
FSR: The authorities report that property markets have continued to recover and that the majority of real estate agents consider CRE properties to be correctly priced (a minority consider them to be overpriced).
Policies
Country-specific comments from national authorities
An assessment of CRE in Malta is hindered by the significant data gaps relating to this sector – a situation which is common to most other EU countries. In this regard, the Maltese authorities are actively trying to address these gaps, and welcome the efforts made to analyse the sector, but are of the opinion that country-specific results should be interpreted with caution. A number of key indicators are based on proxies that might not provide a precise assessment of CRE developments. One specific concern is the indicator for CRE-collateralised loans, which is being used as a proxy for CRE lending. This could potentially include loans for purposes other than commercial real estate but which are backed by CRE. While such data will show the extent of the potential CRE exposures for banks in the case of price reductions, through a drop in the value of the collateral, it nonetheless does not show the extent of growth in CRE lending per se. Indeed, while the assessment indicates that CRE-collateralised loans increased by 11.7% in the case of Malta, loans for construction and real estate activities, which could also serve as a proxy for CRE activity, decreased by about 5%. These diverging trends strengthen the argument for showing caution in interpreting country-specific results. The latest Central Bank of Malta survey results confirm that in 2017 lending standards for exposures to CRE remained conservative, with the average LTV at origination standing at around 65%, the loan-to-EBITDA ratio hovering at around 255%, and the debt service-to-EBITDA ratio at about 25%. CRE activity continued to be limited, representing just 1.5% of all property-related loans granted during the year, confirming the relatively small size of the Maltese CRE market.

Report on vulnerabilities in the EU commercial real estate sector / November 2018 Contents 129
A.2.20 The Netherlands
Collateral stretch
Scoreboard:
Low risk
Scoreboard: Prices have reached historical peaks in the prime segments and are continuing to grow rapidly. However, prices are not growing across the CRE segment as whole, and remain below their historical peaks. Current CRE yields are low compared with their long-term averages, but are relatively high compared with government bond yields, suggesting that risk premia are not excessively compressed1.
Survey:
Medium risk
Survey: The recent growth in prices can only be partially justified by fundamentals, as the low interest rate environment makes the CRE sector relatively attractive to investors. As office use is picking up in cities, prime real estate, unlike non-prime real estate, shows signs of overvaluation. Country-wide prices are increasing steadily, but this trend began only recently and slowly after a long period of decline.
The differences between the scoreboard and the survey might be due to the fact that the survey was last updated in September 2017, while the scoreboard has been updated with the most recent data available.
Income and activity stretch
Scoreboard:
Medium risk
Scoreboard: Investment transactions are very large relative to GDP and are continuing to increase at a moderate pace. Vacancy rates are relatively low, and yields are very low.
Survey:
Medium risk
Survey: Rapid CRE price growth and relatively high yields compared with other countries are fostering significant CRE investment activity from both domestic and foreign investors. However, investments made in the current low interest rate environment may not prove to be resilient when the cycle turns. In some peripheral locations there is an oversupply of office and retail space due to structural changes, although prices in these areas are relatively flat. Other types of real estate are less affected by structural factors: for instance industrial property (including logistics), historically a relatively small segment, is growing in popularity.
Financing stretch
Scoreboard:
No risk
Scoreboard: Growth in CRE-collateralised bank lending appears to be moderate. Real estate investment fund growth has been slow over the last 12 months.
Survey:
No risk
Survey: Banks are starting to increase their CRE lending, after several years of cutting back, and lending standards are being gradually loosened. While investors have deleveraged since the crisis, LTV ratios are once again increasing slowly. Non-bank investors, especially those from abroad, are increasing their investment.
1) The MSCI capital-based price index shows yearly price growth of 6.2% in Q4 2016. This figure breaches a lower threshold but would not affect the overall rating of the collateral stretch in the scoreboard – this would remain at “medium”.

Report on vulnerabilities in the EU commercial real estate sector / November 2018 Contents 130
Potential for spillovers
Scoreboard:
Medium risk
Scoreboard: Real estate investment funds are very large relative to GDP, and insurers’ exposures to CRE as a proportion of their total assets are among the highest in the EU2. CRE-collateralised loans represent a small proportion of total loans, while banks’ CRE-collateralised exposures are also of moderate size relative to their Tier 1 capital. The CRE market is of moderate size compared with GDP.
Survey:
No risk
Survey: Although their exposures to CRE are significant, banks appear to be managing these exposures appropriately. CRE loans represent less than 3.6% of the total assets and around 11% of the risk weighted assets of the largest Dutch banks. Other large domestic investors include pension funds and insurance companies, and foreign investors are very active through managed investment funds. Institutional investors (pension funds, insurers and investment funds) are not highly leveraged.
Additional information
FSR: The risks to Dutch institutions are limited as the CRE market is being driven largely by foreign equity investments. Banks have reduced their CRE exposure and have improved the resilience of their CRE portfolios.
ATC BUS: De Nederlandsche Bank highlights CRE as the fifth-highest risk. Internet shopping and flexible working arrangements have fundamentally decreased the demand for CRE, especially for office and retail spaces in non-prime locations.
Policies
Country-specific comments from national authorities
The risk analysis in the report provides a good overview of recent development in the Netherlands. Over the last few years, there have been strong price increases and decreasing yields in the prime real estate market. Transaction volumes are increasing and are dominated by foreign investors. These developments have been, to a large extent, spurred by a search for yield. Risks may be incurred if sentiment changes and the current favorable economic developments reverse. The impact of such a shock could be amplified by the relatively high leverage compared with the corporate sector and the short rate fixation periods for commercial real estate finance. From a structural perspective, there is a clear divide in the market between core and periphery markets. Vacancy rates and yields in prime locations (mainly cities) are low, whereas outside these locations long-term vacancy rates remain high (more than three years). This reflects structural demand and supply developments in office and retail markets. Furthermore, loan level data for the largest domestic banks show that there is no growth in banks’ CRE lending. The size of these banks’ portfolios remains broadly constant, with some banks cutting back exposure and others increasing it slightly. This means that foreign players and nonbanks are playing a greater role in the current upturn – monitoring efforts should be directed towards these sectors. Real estate investment funds in the Netherlands are large, but they are also internationally diversified. Moreover, they invest mainly on behalf of pension funds and insurers, who invest long term, which limits their funding risk.
2) It is important to note that Dutch investment funds invest 65% of their assets abroad. Moreover, real estate investment funds invest 75% of their assets on behalf of pension funds and insurers, so there is a risk of exposure double-counting.

Report on vulnerabilities in the EU commercial real estate sector / November 2018 Contents 131
A.2.21 Norway
Collateral stretch
Scoreboard:
Norway is not part of the scoreboard
Scoreboard: Norway is not part of the scoreboard, as only data for EU countries are available. However, data provided by the national authorities indicate that prices for high-standard centrally located offices in Oslo have reached their historical peaks and are continuing to grow very rapidly (5.8% over the last 12 months at end-2016). CRE prime office yields are very low relative to their historical averages (-199 basis points below the historical average at end-June 2017), which provides tentative evidence of overvaluation. The spread between CRE prime office yields and sovereign yields is almost equal to its historical average (around 10 basis points). Using these numbers in the scoreboard would result in a “pronounced risk” rating for the collateral stretch.
Survey:
Medium risk
Survey: CRE price growth has been heterogeneous across cities: prices for prime offices in Oslo are at peak levels and the authorities believe that they have increased by more than the current macroeconomic environment currently justifies. In contrast, price growth has been more moderate in the fringe zones in Oslo and in other large cities. While prime segment yields are historically low, the spread between prime segment yields and government bond yields remains approximately at its historical average.
Income and activity stretch
Scoreboard:
No risk
Some data gaps
Scoreboard: Vacancy rates are relatively low. Norway is not part of the scoreboard for the other indicators, as only data for EU countries are available. Nonetheless, data provided by the national authorities indicate that prime office yields are low (3.75% at end-June 2017). Data on the other indicators of the stretch are not available.
Survey:
Low risk
Survey: While total CRE transactions are large (probably driven by investors’ search for yield), new building activity remains subdued, limiting the risk of oversupply in the short to medium term. Foreign investors are active in the market.
Financing stretch
Scoreboard:
Norway is not part of the scoreboard
Scoreboard: Norway is not part of the scoreboard, as data are only available for EU countries. However, data provided by the national authorities suggest that CRE-collateralised bank lending is growing slowly (3% between August 2017 and August 2016). No data are available on the growth of real estate investment funds.
Survey:
Low risk
Survey: Lending standards are tight and lending growth has moderated since the rapid growth seen in 2015. Consequently, CRE companies are increasingly turning to the bond market for financing. The authorities see this as a positive development, as it reduces the CRE market’s historical reliance on banks and contributes to a more stable and diverse funding structure.
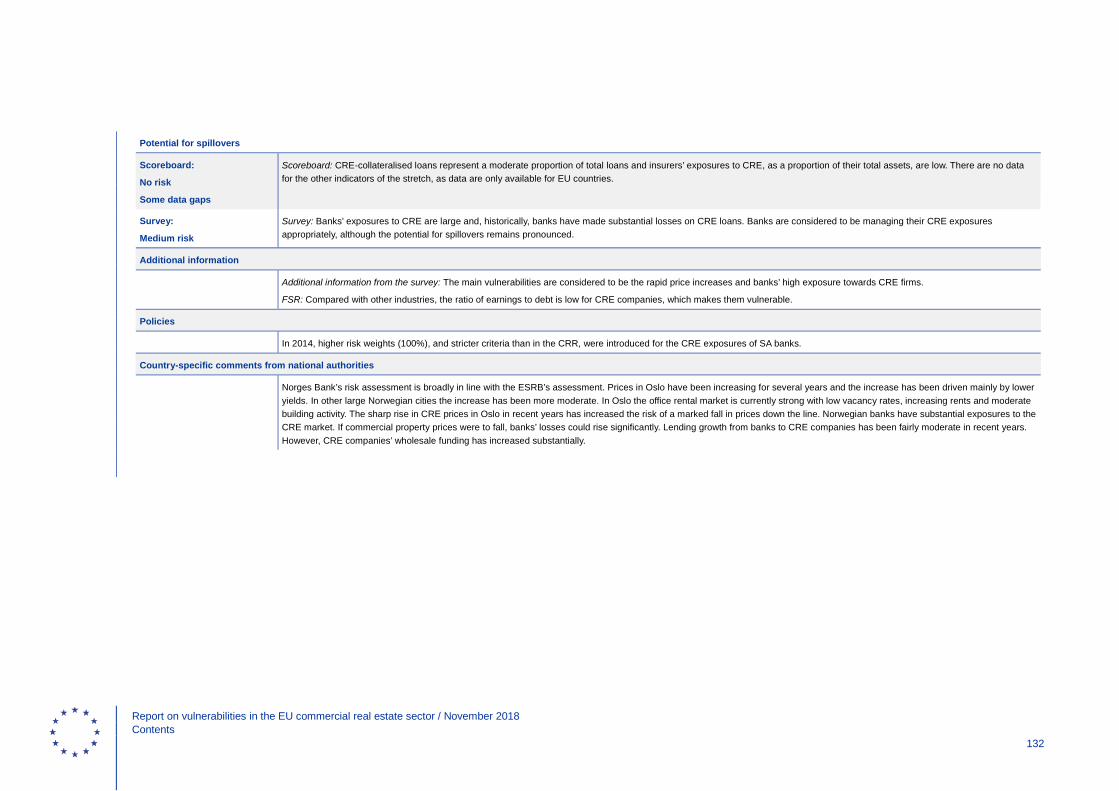
Report on vulnerabilities in the EU commercial real estate sector / November 2018 Contents 132
Potential for spillovers
Scoreboard:
No risk
Some data gaps
Scoreboard: CRE-collateralised loans represent a moderate proportion of total loans and insurers’ exposures to CRE, as a proportion of their total assets, are low. There are no data for the other indicators of the stretch, as data are only available for EU countries.
Survey:
Medium risk
Survey: Banks’ exposures to CRE are large and, historically, banks have made substantial losses on CRE loans. Banks are considered to be managing their CRE exposures appropriately, although the potential for spillovers remains pronounced.
Additional information
Additional information from the survey: The main vulnerabilities are considered to be the rapid price increases and banks’ high exposure towards CRE firms.
FSR: Compared with other industries, the ratio of earnings to debt is low for CRE companies, which makes them vulnerable.
Policies
In 2014, higher risk weights (100%), and stricter criteria than in the CRR, were introduced for the CRE exposures of SA banks.
Country-specific comments from national authorities
Norges Bank’s risk assessment is broadly in line with the ESRB’s assessment. Prices in Oslo have been increasing for several years and the increase has been driven mainly by lower yields. In other large Norwegian cities the increase has been more moderate. In Oslo the office rental market is currently strong with low vacancy rates, increasing rents and moderate building activity. The sharp rise in CRE prices in Oslo in recent years has increased the risk of a marked fall in prices down the line. Norwegian banks have substantial exposures to the CRE market. If commercial property prices were to fall, banks’ losses could rise significantly. Lending growth from banks to CRE companies has been fairly moderate in recent years. However, CRE companies’ wholesale funding has increased substantially.

Report on vulnerabilities in the EU commercial real estate sector / November 2018 Contents 133
A.2.22 Poland
Collateral stretch
Scoreboard:
No risk
Scoreboard: Prices for the CRE sector as a whole are well below their historical peaks and are declining. Prices are also below their historical peaks in the prime segment, and do not appear to be growing at any measurable pace. Current CRE yields are low compared with their long-term averages, although they are relatively high compared with government bonds, suggesting that risk premia are not excessively compressed.
Survey:
No risk
Some data gaps
Survey: Prices appear to be broadly stable. However, because the market is thin it is difficult to obtain a clear assessment of price undervaluation/overvaluation. In addition, the declining capitalisation rate for the Warsaw office and retail spaces (5.5% for prime offices and 5% for prime shopping centres) indicates that the overall profitability and returns on investments in CRE projects are becoming more vulnerable and volatile.
Income and activity stretch
Scoreboard:
Low risk
Scoreboard: Investment transactions are of moderate size relative to GDP, and are growing at a moderate pace. Vacancy rates are very high, but yields are relatively high compared with other countries.
Survey:
Pronounced risk
Survey: There has been a significant inflow of capital into the CRE sector since 2010, most of which has come from foreign investors. Vacancy rates for offices in Warsaw have decreased (from 15% in 2015 to 14.1% at end-2016 and 11.7% at end-2017). Office space vacancy rates for the largest nine cities decreased from 12.7% at end-2016 to 10.8% at end-2017. Vacancy rates for retail space amounted to around 4% at end-2017. Returns on CRE investments have diminished and have become more volatile. The Polish authorities have little information with regard to the financial robustness of foreign investors, although they report that a number of these investors are likely to be vulnerable, as some segments of the CRE market in Poland are characterised by oversupply and imbalances.
The survey signals higher risks than the scoreboard, due to differences in the measured growth rate of transactions and the authorities’ concerns regarding the vulnerability of foreign investors.
Financing stretch
Scoreboard:
No risk
Scoreboard: Real estate investment funds are shrinking, and CRE-collateralised bank lending is only growing slowly.
Survey:
Low risk
Survey: There are substantial inflows of capital from foreign investment funds and trusts which are very active in the CRE market. However, bank lending standards are tight, and the overall risks to the bank and non-bank sectors are low.

Report on vulnerabilities in the EU commercial real estate sector / November 2018 Contents 134
Potential for spillovers
Scoreboard:
No risk
Scoreboard: Banks’ CRE-collateralised exposures are small relative to their Tier 1 capital, and CRE-collateralised loans represent a moderate proportion of total loans. Real estate investment funds are small relative to GDP, and insurers have comparatively small exposures to CRE as a proportion of their total assets. The CRE market is small relative to GDP.
Survey:
No risk
Survey: Outside the construction sector, the potential for spillovers to the Polish economy and financial system is low, given the limited nature of Polish banks and non-banks’ CRE exposures.
Additional information
NBP annual report: Building owners are competing for tenants by lowering rents. Moreover, the increasing offer of new high-quality buildings may represent an additional significant challenge for the owners of older buildings.
Polish macroprudential authority: In its meeting on 2 June 2017, the authority reported that the growing imbalances in the CRE market were one of the sources of risk discussed by the authority. However, as most CRE financing does not come from domestic banks, CRE does not appear to play an important role in the stability of the banking system.
Policies
Since June 2014 an LTV limit of 75% has been in place in Poland. This can be extended to 80% if the part above 75% is insured or collateralised by funds on a bank account, or government or NBP securities.
Risk weights on exposures secured on commercial immovable property were increased to 100% (for banks using the standardised approach, on the basis of Article 124 of the CRR). This was done through an Ordinance of the Minister of Finance and Development published on 1 June 2017. The higher risk weights came into force six months after the ordinance was published. Previous risk weights were equal to 50%, in accordance with the CRR.
Country-specific comments from national authorities
The CRE market in Poland is generally stable, although there are some signs of imbalance. These mostly relate to a relatively high vacancy rate index, amplified by a rapidly growing supply of new office space. Once buildings currently under construction are completed they will enhance the supply of office space by nearly 20%. In the future, this might increase vacancy rates and further depress tenancy prices, especially for older buildings. In addition, potential risk factors in the medium term might include an increase in the cost of construction materials and the lack of a qualified workforce. Consequently, the Polish authorities are advising domestic banks to be extra cautious when generating exposures to the CRE market, even though those exposures are limited at the moment.
The effect of growing supply is currently offset by even stronger demand growth as tenants have recently been exhibiting considerable demand for offices, especially those of high quality. This is mainly due to the favorable economic situation, including new job creation. Vacancy rates have recently decreased as a result.
Transaction volumes on the CRE market in Poland have reached record levels – in 1Q 2018 they amounted to over €2 billion, the second-highest quarterly result of all time. Forecasts for the whole of 2018 estimated the value of transactions at a record level of around €6 billion (vs. €5 billion in 2017). It is worth noting that record results in Poland in 1Q 2018 were in a context of decreasing transaction volumes in the broad European market and in the regional market.
New regulations restricting trade on Sundays have been in force in Poland since March 2018, affecting the vast majority of stores located in shopping centers. It is too early to evaluate the potential effects of this restriction on the CRE market. It is, however, likely that tenants will expect to renegotiate rental costs due to the lower average number of shopping center visitors. This could be a significant risk factor for investments in shopping centers.

Report on vulnerabilities in the EU commercial real estate sector / November 2018 Contents 135
A.2.23 Portugal
Collateral stretch
Scoreboard:
Medium risk
Scoreboard: Prices remain below their historical peaks across the CRE sector as a whole, although they are growing rapidly. Prices are also growing rapidly in the prime sector, even though they have already reached their historical peaks. CRE yields are very low relative to their historical averages. The spread between CRE yields and sovereign yields is also low compared with its historical average, although the number might be affected by the elevated risk premium of sovereign bonds1.
Survey:
Low risk
Survey: There is minimal information available. A transactions-based commercial property price index has been developed by Statistics Portugal in partnership with the Banco de Portugal. The index shows a recovery in prices since mid-2013, with an increase of 2.8% in the first three quarters of 2016. However, prices remain volatile due to the low volume of transactions in the sector. The index also indicates strong co-movement of prices in the CRE and RRE markets.
The scoreboard signals higher risks than the survey due to the measurement of yields and spreads. The scoreboard’s indications should be treated with caution.
Income and activity stretch
Scoreboard:
Medium risk
Some data gaps
Scoreboard: Investment transactions are very large relative to GDP, and are still increasing rapidly. Yields are relatively high compared with other countries. Data on vacancy rates are not available.
Survey:
No risk rating due to data gaps
Survey: No information is available.
Financing stretch
Scoreboard:
No risk
Scoreboard: CRE-collateralised bank lending has decreased over the past year, while real estate investment funds have stabilised.
Survey:
No risk
Some data gaps
Survey: There is minimal information available. Outstanding bank loans for construction and real estate activities have decreased over recent years. Non-banking funding sources are limited compared with direct banking funding (please note that this analysis only refers to funding provided by domestic entities).
1) According to the Banco de Portugal data from MCSI, the difference between the deviation of current office and retail yields from their historical average and the ten-year government bond yield was 370 basis points in December 2016. If this number is used in the scoreboard, the risk rating for the collateral stretch is unchanged.

Report on vulnerabilities in the EU commercial real estate sector / November 2018 Contents 136
Potential for spillovers
Scoreboard:
No risk
Scoreboard: Banks’ CRE-collateralised exposures are small relative to their Tier 1 capital, and CRE-collateralised loans represent a small proportion of total loans. Real estate investment funds are large relative to GDP2, but insurers have comparatively small exposures to CRE as a proportion of their total assets. The CRE market is small relative to GDP.
Survey:
No risk
Some data gaps
Survey: Only limited information is available. Banks' risk exposure to CRE is considered to be small and is not concentrated. Non-banking funding sources are limited compared with direct banking funding (this only refers to funding provided by domestic entities). Even though this points to a dampening of the potential impact of CRE relative to the real economy, further work is considered necessary to evaluate potential CRE spillover effects.
Additional information
Policies
Country-specific comments from national authorities
The risk analysis of the CRE market in Portugal presented in this report is, to a large extent, based on private data sources. Although this is generally the case for other countries, market coverage tends to be lower for small countries like Portugal. In addition, the scoreboard focuses excessively on the CRE prime market which, in Portugal, records a limited number of transactions per year.
Collateral Stretch In Portugal, there are only two price indexes available for the CRE market. According to ECB data based on appraisal values for CRE, prices in the CRE market peaked in 2007 and troughed in 2014, falling 21% in real terms over this period. According to Statistics Portugal data based on transaction values and with data only available from 2009 onwards, the CRE market troughed in 2013. According to the ECB index, prices in the CRE market have increased by around 11% in real terms since 2014, while according to Statistics Portugal prices have recovered by around 10% in real terms since 2013. As such, prices in the Portuguese CRE market are a long way off their historical highs. The recovery in CRE prices reflects favourable developments in the global economy, improved dynamics in the Portuguese tourism sector, an increase in Portuguese consumer and entrepreneur confidence, and the low level of interest rates.
The net initial yield (NIY) for the Portuguese CRE market was 5.8% in 2017, which represents a decline of 88 basis points from the value recorded in 2005, according to MSCI information. However, in 2017 Portugal had the second-highest NIY within a set of Euro Area countries (Austria, Belgium, France, Germany, Italy, Spain, Netherlands and Ireland).
At the end of 2017, the spread between the NIY in the CRE market and the sovereign yield was 270 basis points. The historical average has been affected by the abnormally high government debt yield in the context of the sovereign debt crisis. This is distinct from the scoreboard which illustrates 1) the difference between average office and retail prime yields and the historical averages for those yields and 2) the difference between the figure calculated in 1) and the sovereign yield. Using historical averages, particularly within a limited timeframe, can interfere with the analysis and lead to misinterpretations.
Income and activity stretch In 2017, the total vacancy rate in the Portuguese CRE market stood at 10.3%, continuing the downward trend initiated in 2013, according to MSCI data. However, there is a significant difference across CRE subsectors. The vacancy rate for offices is higher than the average vacancy rate for the CRE market. This can be explained by the fact that the existing supply of offices does not match demand in terms of quality and location. The large reduction and the lower level of the vacancy rate for the retail segment reflect the increase in consumers’ disposable income as well as the momentum seen in the tourism sector in Portugal.
From 2013 onwards, investment in the CRE market recovered significantly, in particular investment by non-residents investors (in 2017 this was around 80% of the total, according to JLL information).This is in line with what has been observed in Europe. In addition, investment funds represented 76% of total transaction volume. The relatively low return on the Portuguese CRE market seen until 2013 and improving investor confidence in the Portuguese economy explain the increasing participation of foreign investors in Portugal. Increased demand for CRE from foreign investors brings advantages for domestic credit institutions in the current environment. On the one hand, it facilitates the sale of real estate assets held by credit institutions, while on the other it contributes to a decline in NPLs associated with credit secured by CRE.
2) However, Portugal only has a low share of open-end funds which are subject to redemption risk (see section 3.3).

Report on vulnerabilities in the EU commercial real estate sector / November 2018 Contents 137
A.2.24 Romania
Collateral stretch
Scoreboard:
No risk rating due to data gaps
Scoreboard: No data.
Survey:
No risk rating due to data gaps
Survey: No information.
Income and activity stretch
Scoreboard:
Medium risk
Some data gaps
Scoreboard: Investment transaction numbers are increasing rapidly. No data are available for yields, investment transactions relative to GDP, or vacancy rates.
Survey:
Medium risk
Survey: A situation of CRE oversupply seems unlikely, as the number of non-residential building permits has continued to decline. The debt-to-equity ratio for companies with CRE-guaranteed loans remained above the average level for NFCs from 2007 to 2015. The leverage ratio also increased between 2007 and 2014, although it improved slightly in 2015.
Financing stretch
Scoreboard:
No risk
Some data gaps
Scoreboard: CRE-collateralised bank lending has decreased over the past year. No data are available on the growth of real estate investment funds.
Survey:
Low risk
Survey: New lending for CRE declined steadily in 2016, falling to 38% below its 2009 peak. According to the Banca Naţională a României's Bank Lending Survey, lending standards for CRE-collateralised loans have returned to their pre-crisis values. According to the Romanian authorities, CRE currently relies on a stable and well-diversified set of funding sources.
Potential for spillovers
Scoreboard:
No risk
Some data gaps
Scoreboard: Banks’ CRE-collateralised exposures are small relative to their Tier 1 capital, and CRE-collateralised loans represent a small proportion of total loans. Insurers have moderate exposures to CRE as a proportion of their total assets. No data are available on the size of real estate investment funds relative to GDP, or on the size of the CRE market relative to GDP.
Survey:
Low risk
Survey: The main risks relate to the high banking exposure, but also to the quality of this portfolio. As at end-2016 total banks’ exposures to CRE companies amounted to almost 70% of their total exposures. In addition, banks’ largest NPL ratios were for the CRE and the construction sectors, with CRE alone having an NPL ratio of 24.4%. More than a half of exposures backed by commercial property had an LTV of over 100%, as at end-2016. These vulnerabilities could flow through to the real economy, as real estate and construction companies account for approximately 11% of NFC’s GVA, and employ around 8% of the total workforce.

Report on vulnerabilities in the EU commercial real estate sector / November 2018 Contents 138
Additional information
ATC BUS: CRE is not signalled as a major source of risk.
Policies
Romania introduced higher risk weights (100%) and stricter criteria than that stipulated in the CRR for the CRE exposures of SA banks on 1 January 2007 through national legislation. The risk weights have been maintained using the national option under the CRR.
Country-specific comments from national authorities
The following are the main results obtained from a survey of CRE exposures carried out by Banca Naţională a României and the Financial Supervisory Authority in Q2 2017, covering the period Q1 2015 to Q1 2017: (i) CRE exposures are concentrated in the banking sector, (ii) there is just one investment company with such exposures and (iii) there are no specialised real estate investment funds operating in Romania. Accordingly, although potential risks are concentrated in the banking sector and there are some existing data gaps, especially for the collateral stretch, we consider that the monitoring framework benefits from access to good quality data from the Central Credit Register.
Total CRE exposures are significant for the banking sector (65% of total NFC exposures, March 2018), having decreased from 70% (total share at the end of 2016). Additionally, we are witnessing a consistent decrease in NPL ratios for this category, especially for the construction sector (from 37.7% in December 2016 to 25.5% in March 2018) and real estate companies (from 26.9% to 12.1% in the same period).
In terms of the financial soundness of companies in the construction and real estate sectors, between June 2016 and June 2017 we note: (i) a decrease in the debt to equity ratio from 1.86 to 1.78 for construction companies, and from 2.52 to 2.06 for real estate companies; (ii) relatively constant profitability for the construction sector (ROE at around 3%) but a decrease for real estate companies (from 4.6% to 4.1%), and (iii) a GVA contribution of around 10% for both sectors.
In terms of CRE market developments, there were positive dynamics for investments in 2017 (an increase of 5%), although the share of investments to GDP remains the lowest in the region (around 0.5% compared with the regional average of 1.2%). According to these external reports, there was also an improvement in terms of a decrease in vacancy rates, especially for Bucharest. Expectations are positive for 2018, although they are still constrained by infrastructure quality; nevertheless, we do not expect there to be any significant risks for companies operating in this sector of activity.

Report on vulnerabilities in the EU commercial real estate sector / November 2018 Contents 139
A.2.25 Slovakia
Collateral stretch
Scoreboard:
No risk rating due to data gaps
Scoreboard: There are no data in the scoreboard. Nonetheless, data provided by the national authorities indicate that current CRE yields are low compared with their long-term average (-212 basis points). Data are not available for the other indicators of the stretch.
Survey:
Low risk
Survey: Due to the thin market there is no information on CRE prices. CRE price dynamics can be assessed by monitoring other indicators such as vacancy rates, rental rates, prime yields and stock-under-development. Vacancy rates have reached historically low levels, rental rates have increased slightly, and prime yields have decreased slightly. Stock-under-development is on the rise, although it is still significantly below pre-crisis levels for the years 2018 and 2019. These indicators suggest that CRE prices are on an increasing trajectory, although they are evolving in line with macroeconomic conditions.
Income and activity stretch
Scoreboard:
No risk rating due to data gaps
Scoreboard: There are no data in the scoreboard. However, data provided by the national authorities indicate that investment transaction volumes have been decreasing over the last 12 months (-38.5%, year-on-year growth) and are large relative to GDP (1.1%). However, prime yields are relatively high while vacancy rates are relatively low (6.50% and 6.17% respectively). If these numbers were used in the scoreboard, the result would be a “no risk” rating for the income and activity stretch.
Survey:
Low risk
Some data gaps
Survey: No information is available on the financial positions of CRE investors. Vacancy rates have fallen to historical lows. Investment activity decreased in 2017 (compared with 2016 levels), although it might still be viewed as high in a historical context. Relatively high demand caused rental rates to increase slightly, while prime yields decreased slightly. There is therefore limited risk to income streams from CRE, even though there is significant stock-under-development (of which 50% is already pre-let). Relatively high CRE space-under-development could, however, present some risk to income streams in the future (especially on the assumption of adverse shocks to demand).
Financing stretch
Scoreboard:
Low risk
Scoreboard: CRE-collateralised bank lending is growing at a moderate pace, as are real estate investment funds.
Survey:
Low risk
Some data gaps
Survey: According to the NCA, annual CRE lending growth fell to 6% during 2017, with a gradual slowdown over the year. At the same time, the situation changed towards the end of the year, when lending activity increased. The banks are the most prominent source of funding for the CRE market from the domestic financial sector. Based on a BLS data source, lending standards have gradually loosened over the past two years, although they remain relatively conservative. Additional attention should be paid to this development, as NACE code 68 indicates that bank exposures to CRE are significant, and that one-third of total loans to NACE 68 are concentrated among a limited number of borrowers.

Report on vulnerabilities in the EU commercial real estate sector / November 2018 Contents 140
Potential for spillovers
Scoreboard:
No risk
Some data gaps
Scoreboard: Banks’ CRE-collateralised exposures are small relative to their Tier 1 capital, and CRE-collateralised loans represent a small proportion of total loans. Real estate investment funds are also small relative to GDP, while insurers’ exposures to CRE as a proportion of their total assets are moderate. There are no data available on the size of the CRE market relative to GDP.
Survey:
Low risk
Survey: The share of CRE loans (NACE code 68) to total NFC loans decreased to below 22% in 2017. In spite of this figure, lending standards are considered to be tight. According to the NCA, non-banks’ exposure to CRE is negligible, except in the case of real estate investment funds, whose size increased in 2017. Given the size of the financial sector’s total CRE exposure, and because the banking sector is basically the only domestic source of financing for the real economy, specialised monitoring of the CRE market is warranted.
Additional information
Additional information from the survey:
Investor interest in CRE is being driven by improvements in the macroeconomic environment, including falling unemployment and an increasing appetite for risk. Recent trends are expected to continue for the near future. In the medium term there is a risk that excessive growth in CRE investment and an adverse shock to demand could lead to problems of oversupply. Other potential sources of risk include geopolitics as well as broader developments in the EU and the United States. Market data and information on lending standards are only available from private agencies and are not sufficiently granular.
Policies
Národná banka Slovenska introduced a CCyB rate of 0.5% applicable on Slovak exposures from 1 August 2017. This rate will be increased to 1.25% from 1 August 2018.
Country-specific comments from national authorities

Report on vulnerabilities in the EU commercial real estate sector / November 2018 Contents 141
A.2.26 Slovenia
Collateral stretch
Scoreboard:
No risk rating due to data gaps
Scoreboard: No data.
Survey:
No risk
Survey: CRE is concentrated in major towns and in large retail and commercial centres. Prices appear to be broadly in line with fundamentals and do not appear to be rising. However, the market for CRE sales is thin and is subject to heavy competition from the CRE rental market, so price measures are highly volatile. The number of transactions is increasing, but this trend is expected to reverse before it has had a significant impact on prices.
Income and activity stretch
Scoreboard:
No risk rating due to data gaps
Scoreboard: No data.
Survey:
Medium risk
Some data gaps
Survey: Rents are decreasing slowly but persistently due to an oversupply of CRE. Commercial rents did not adjust immediately at the beginning of the crisis, and this delay resulted in high vacancies and downward pressure on prices. No data are available on the financial position of CRE investors.
Financing stretch
Scoreboard:
No risk
Some data gaps
Scoreboard: CRE-collateralised bank lending has decreased over the past year1. No data are available on the growth of real estate investment funds.
Survey:
No risk
Some data gaps
Survey: Credit growth for CRE is weak, due to limited non-bank funding. Insurance companies and pension funds have investment policies that limit CRE lending. Leasing companies represent one of the main funding sources other than banks, but their CRE portfolios have shrunk over the past few years. No data are available on foreign investors or lending standards.
1) According to the figures provided by Banka Slovenije, at the end of 2016 €71 million had been granted in loans (in stock) for CRE purposes. At the end of 2016, new loans granted for CRE stood at €65 million. There are also approximately €1.1 billion in loans granted for construction, but not all of these loans may be counted as CRE. As a consequence, CRE lending growth might differ from the numbers reported in the scoreboard, although the risk rating would not change.

Report on vulnerabilities in the EU commercial real estate sector / November 2018 Contents 142
Potential for spillovers
Scoreboard:
No risk
Some data gaps
Scoreboard: Banks’ CRE-collateralised exposures are small relative to their Tier 1 capital, and CRE-collateralised loans represent a moderate proportion of total loans. Insurers have moderate exposures to CRE as a proportion of their total assets. No data are available on the size of real estate investment funds relative to GDP, or on the size of the CRE market relative to GDP.
Survey:
No risk
Survey: The potential for negative spillovers from CRE is negligible. Banks' and non-banks’ risk exposure to CRE is small and is not concentrated. Due to the low quantity of loans granted for CRE, potential spillovers appear to be limited.
Additional information
FSR: The increase in the number of transactions has not yet been reflected in higher CRE prices.
Policies
Country-specific comments from national authorities
After several years of decline or stagnation, price growth in the CRE market was evident in 2017, when average sale prices increased both for office space and for bars and retail premises. The national average price for office space was €1,230/m2 in 2017, up from €1,090/m2 in 2016, while the national average price for bars and retail premises was €1,236/m2 in 2017, compared with €996/m2 in 2016. By contrast, there was a fall in average sale prices in 2016 compared with 2015. This was a consequence of high price volatility due to the relatively small and heterogeneous sample taken of the CRE market in Slovenia. It was also the result of strong competition from the leasing market, as the leasing of business premises often has certain advantages for economic entities. However, rental prices in the CRE market increased slightly in 2017. The number of transactions crept up to 2,483 in 2017, compared with 2,297 in 2016. The significant price volatility makes it difficult to assess whether the downward trend has been reversed, but on the basis of recent figures we can estimate that the CRE market has started to follow the RRE market, albeit at a slower pace.

Report on vulnerabilities in the EU commercial real estate sector / November 2018 Contents 143
A.2.27 Spain
Collateral stretch
Scoreboard:
Medium risk
Scoreboard: Prices remain below their historical peaks across the CRE sector as a whole, although they are increasing very rapidly. Prices are also increasing rapidly in the prime segment, where they are at historical peaks. Current CRE yields are low compared with their long-term averages, but they are relatively high compared with government bonds, suggesting that risk premia are not excessively compressed.
Survey:
No risk
Survey: The negative growth rates of lending for CRE activities and the undervaluation of RRE suggest that CRE is far from overvalued. While authorities do not have detailed information on CRE prices, according to the information available prices are increasing, although they remain only slightly higher than they were at the crisis trough.
The scoreboard signals higher risks than the survey, due to differences in measured price growth.
Income and activity stretch
Scoreboard:
Low risk
Scoreboard: Vacancy rates are moderate and yields are very low. In addition, investment transactions are small relative to GDP, and are increasing at a moderate pace.
Survey:
No risk rating due to data gaps
Survey: No information.
Financing stretch
Scoreboard:
No risk
Scoreboard: Both CRE-collateralised bank lending and real estate investment funds decreased over the past year.
Survey:
No risk
Some data gaps
Survey: Banks' exposures to CRE have decreased continuously since the onset of the crisis. In 2016, total lending for construction and real estate activities decreased by 10.5%, more than the fall in total credit. Lending has fallen by around 60% relative to GDP, from 30% in 2010 to around 11% in 2016. The proportion of total NFC loans granted for construction and real estate has also decreased, from 51% in 2008 to 31% in September 2016. Detailed information is not available for investments and investor interests in CRE, but data from private firms do not appear to be consistent with the authorities’ observations.
The scoreboard signals higher risk than the survey. The scoreboard rating is driven by an abnormally high trend for Q4 2016 year-on-year lending to CRE (16.7%) which is at odds with the contractionary trend recorded in the previous quarters (e.g. -2.6% in Q3 2016).

Report on vulnerabilities in the EU commercial real estate sector / November 2018 Contents 144
Potential for spillovers
Scoreboard:
No risk
Scoreboard: Banks’ CRE-collateralised exposures are small relative to their Tier 1 capital, and CRE-collateralised loans represent a small proportion of total loans. Real estate investment funds are small relative to GDP, but insurers’ exposures to CRE as a proportion of their total assets are moderate. The CRE market is small relative to GDP.
Survey:
Low risk
Some data gaps
Survey: The Spanish authorities do not have specific indicators on the potential for spillovers. However, given the continuous decline in the concentration of credit to this sector, they believe that the potential for spillovers is very limited.
Additional information
Additional information from the survey: The Spanish authorities note that large discrepancies are often observed between price growth data from different sources. Most of these data are obtained from private firms and it is not clear whether the data are representative, or what exactly they measure. For instance, data from Jones Lang LaSalle cover only the prime CRE sector and reflect a combination of market evidence (where available) and a survey of expert opinion, rather than complete transaction or valuation information. Moreover, it is not clear how Jones Lang LaSalle obtains the final data combination they ultimately publish.
Coverage of the ECB’s investment fund statistics: The ECB’s RE investment fund statistics used in the scoreboard do not include Spanish real estate investment funds. A look at the balance sheet data of the largest listed real estate investment funds in Spain indicates that they are expanding rapidly, in part due to credit flows from the United States.
Policies
Country-specific comments from national authorities
The analysis conducted by the ESRB offers an interesting and insightful view of the Spanish CRE sector, although several caveats should be highlighted. First, attention should be drawn to the ESRB Recommendation on closing real estate data gaps (ESRB/2016/14). This definition does not include properties that are owned by end-users and does not, therefore, provide a full picture of CRE activities in Spain. Second, the report pays significant attention to the prime segment of the CRE market. However, the actual relevance of this subsector in Spain, from a systemic perspective, remains unclear. In addition, most of the indicators used in the ESRB’s risk assessment have been obtained from private stakeholders. The representativeness of the data collected by the ESRB may, presumably, differ across countries, thus giving rise to comparability issues.
Some divergences have been found between the outcome of the ESRB’s analysis and the Banco de España’s own preliminary study of the Spanish CRE market based on granular official sector datasets. In contrast to the ESRB’s assessment, and according to the available data, it seems that prices are still falling (although some stabilisation has been noted), in the main CRE categories nationwide. Besides, credit dynamics remain subdued in the segment, both for the stock of loans, which is still contracting markedly, and the flow of new loans. This is therefore at odds with the figure displayed for Spain in Chart 20, according to which credit to real estate activities and construction (a segment of CRE firms) appears to be expanding firmly (sample comparability problems are behind these discrepancies). Finally, the ESRB’s analysis points to the increasing participation of professional investors in the CRE market, including REITs. Nevertheless, it should be noted that these still account for a modest share of all the firms operating in the sector.
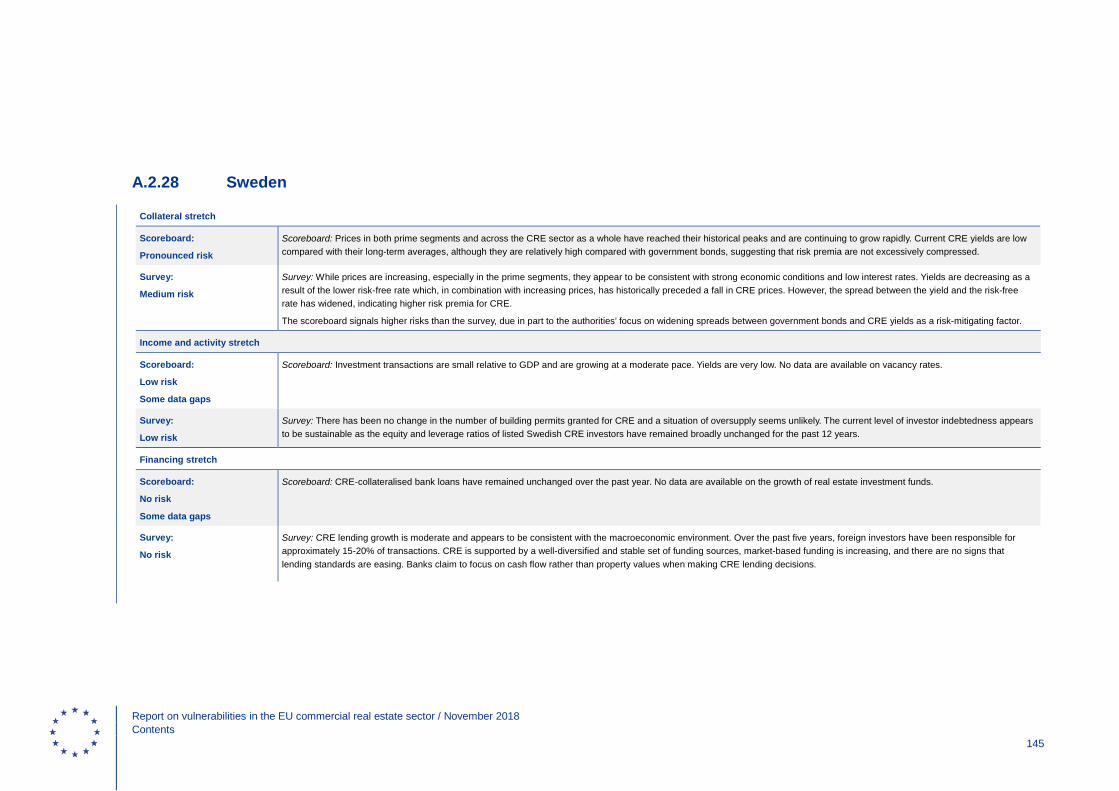
Report on vulnerabilities in the EU commercial real estate sector / November 2018 Contents 145
A.2.28 Sweden
Collateral stretch
Scoreboard:
Pronounced risk
Scoreboard: Prices in both prime segments and across the CRE sector as a whole have reached their historical peaks and are continuing to grow rapidly. Current CRE yields are low compared with their long-term averages, although they are relatively high compared with government bonds, suggesting that risk premia are not excessively compressed.
Survey:
Medium risk
Survey: While prices are increasing, especially in the prime segments, they appear to be consistent with strong economic conditions and low interest rates. Yields are decreasing as a result of the lower risk-free rate which, in combination with increasing prices, has historically preceded a fall in CRE prices. However, the spread between the yield and the risk-free rate has widened, indicating higher risk premia for CRE.
The scoreboard signals higher risks than the survey, due in part to the authorities’ focus on widening spreads between government bonds and CRE yields as a risk-mitigating factor.
Income and activity stretch
Scoreboard:
Low risk
Some data gaps
Scoreboard: Investment transactions are small relative to GDP and are growing at a moderate pace. Yields are very low. No data are available on vacancy rates.
Survey:
Low risk
Survey: There has been no change in the number of building permits granted for CRE and a situation of oversupply seems unlikely. The current level of investor indebtedness appears to be sustainable as the equity and leverage ratios of listed Swedish CRE investors have remained broadly unchanged for the past 12 years.
Financing stretch
Scoreboard:
No risk
Some data gaps
Scoreboard: CRE-collateralised bank loans have remained unchanged over the past year. No data are available on the growth of real estate investment funds.
Survey:
No risk
Survey: CRE lending growth is moderate and appears to be consistent with the macroeconomic environment. Over the past five years, foreign investors have been responsible for approximately 15-20% of transactions. CRE is supported by a well-diversified and stable set of funding sources, market-based funding is increasing, and there are no signs that lending standards are easing. Banks claim to focus on cash flow rather than property values when making CRE lending decisions.

Report on vulnerabilities in the EU commercial real estate sector / November 2018 Contents 146
Potential for spillovers
Scoreboard:
Medium risk
Some data gaps
Scoreboard: The CRE market is very large relative to GDP – the largest share among EU countries. Banks’ CRE-collateralised exposures are also large relative to their Tier 1 capital. CRE-collateralised loans represent a moderate proportion of total loans, and insurers’ exposures to CRE as a proportion of their total assets are small. There are no data on real estate investment funds relative to GDP.
Survey:
Low risk
Survey: The potential for negative spillovers from CRE is considerable, as the CRE sector is large and is strongly connected to the financial system and the real economy. CRE constitutes a significant share of GDP and insurance companies are moderately exposed to the sector. In addition, the CRE loans of the four largest banks amount to one-third of their total lending to domestic NFCs, or 5% of their total lending (including RRE). Nevertheless, the Swedish authorities report that banks are managing their risk exposures to CRE appropriately.
Additional information
Sveriges Riksbank (CB): The FSR 2017:1 reports that the search for yield has led to increased CRE investments. Transaction volumes are high and low interest rates have pushed both funding costs and yields down. Low vacancy rates have resulted in rising rents. CRE prices have risen and are now high relative to their historical averages. This price growth can largely be explained by fundamental factors such as high rent levels, low vacancy rates and low funding costs, although any of these factors could change quickly. Wholesale funding is increasing, which means that the market for corporate bonds and certificates could also be affected by changes to the CRE market. There is therefore a strong link between the CRE sector and the financial system.
Finansinspektionen (FSA): The FSR 2017:1 reports that prices for CRE have risen sharply, reaching their highest level since 2007, and that lending to the sector has increased. There is considerable demand for CRE, but the sector is sensitive to economic downturns. Finansinspektionen (FI) considers the risks stemming from the CRE market to be elevated and is currently monitoring this market more carefully.
Policies
Bank exposures to CRE are assigned a 100% risk weight under the standardised approach. In addition, FI has tightened its supervisory methods regarding risk weights for corporate exposures for banks using IRB. Banks will have to change their models to meet FI’s requirements, resulting in higher pillar 1 requirements. Banks that are not following FI's supervisory methods are subject to a capital surcharge under pillar 2.
Country-specific comments from national authorities
Overall, the risk assessment of Sveriges Riksbank and Finansinspektionen is similar to that of the ESRB. Despite containing some weaknesses, the analytical data reflect the current trends and situation of the Swedish CRE market well. Search for yield has increased prices, the number of investment transaction, and indebtedness. Furthermore, vacancy rates are currently low, rental growth (especially in the office segment) is high and supply is limited, all of which is continuing to attract both domestic and foreign investors. The CRE sector is sensitive to economic downturns and there is a strong link between CRE and the Swedish financial system. The increased indebtedness is not only via banks as CRE companies have also increased their wholesale funding, which means that the market for corporate bonds and certificates could also be affected by changes in the CRE market.

Report on vulnerabilities in the EU commercial real estate sector / November 2018 Contents 147
A.2.29 United Kingdom
Collateral stretch
Scoreboard:
Low risk
Scoreboard: Across the CRE sector as a whole, prices remain below their historical peaks but annual growth continues to rise. In the prime segment, prices remain above their historical peaks but are stable. Current CRE yields are low compared with their long-term averages, although they are relatively high compared with government bonds, suggesting that risk premia are not excessively compressed.
Survey:
Low risk
Survey: Across the United Kingdom as whole prices appear to be fairly valued, but there are pockets of overvaluation in certain sectors (e.g. London offices). The ratio of CRE yields to UK government bonds is higher than the historical average.
Income and activity stretch
Scoreboard:
No risk
Scoreboard: Investment transactions are small relative to GDP, and are only growing slowly. Yields are very low, and vacancy rates are relatively low.72
Survey:
Medium risk
Survey: CRE investors are less indebted than they were prior to the crisis. The volume of building activity in London offices has slowed over the last six months but remains higher than the long-term average. In the wider CRE market, there is less construction activity although there are concerns over the outlook for retail sector rental growth as online shopping becomes more prevalent.
Financing stretch
Scoreboard:
No risk
Scoreboard: CRE-collateralised bank loans decreased over the past year. At the same time, real estate investment funds have decreased in size73
Survey:
Low risk
Survey: Banks’ exposures to CRE have remained broadly constant since 2014. Credit conditions have tightened since the referendum, although credit remains available to borrowers (albeit at higher prices). Non-banks and foreign lenders have increased their market share of CRE lending while the market share of banks has decreased. The insurance sector has a relatively large market share and its lending is mostly conservative (low LTVs ratios). Some CRE debt funds are providing much riskier loans, although their market share is lower.
72 According to Bank of England prime yields are 4.2%, the investment transactions growth rate is 3.0% and investment transactions represent 3.1% of GDP. If these numbers are used in the scoreboard, the risk rating
for the income and activity stretch changes to medium risk. 73 According to Bank of England the CRE lending annual growth is 2%. If this number is used in the scoreboard, the risk rating for the financing stretch is unchanged.

Report on vulnerabilities in the EU commercial real estate sector / November 2018 Contents 148
Potential for spillovers
Scoreboard:
Low risk
Scoreboard: The CRE market is large relative to GDP, in comparison with other countries. While real estate investment funds are small relative to GDP, insurers have moderate exposures to CRE as a proportion of their total assets. CRE-collateralised loans represent a small proportion of total loans, and banks’ exposures collateralised by commercial property are moderate relative to their Tier 1 capital.
Survey:
Medium risk
Survey: Any materialisation of risk is likely to have a medium-level impact on the financial sector and the real economy. However, any impact on banks is likely to be low, despite their large exposures relative to capital. Stress tests show that banks could withstand even substantial CRE price falls and exposures have been decreasing since 2008. Furthermore, insurers are lending at conservative LTVs. Some real estate investment funds are focusing on the riskiest part of CRE lending and could therefore suffer in the event of a downturn. Spillovers could occur through the collateral channel as many SMEs use CRE properties as collateral against their loans.
The survey signals higher risks than the scoreboard, due to the authority’s assessment of exposures to non-banks.
Additional information
FSR: Future price falls in the CRE market could be amplified by the behaviour of investors in open-ended commercial property funds.
ATC BUS: Risks from an adjustment in the UK CRE market have partially crystallised. Further price falls could reduce companies’ access to finance, given the frequent use of CRE as collateral.
IMF: The CRE market warrants careful monitoring. Price growth was rapid during 2014-15, especially in prime London locations, where indicators point to some CRE overvaluation. A fall in prices could thus tighten corporate credit constraints via the collateral channel and reduce business investment and economic activity. A sharp reversal of CRE prices could also adversely affect financial stability via banks’ exposure to CRE, although the impact of this channel has been lessened by a post-crisis rebalancing of CRE funding away from domestic banks towards international investors and nonbanks.
Policies
IRB banks must use the slotting approach for CRE loans. Slotting requires banks to assign one of four different risk weights, ranging from 50% to 250%, to income-producing real estate loans on their books. In addition, CRE loans must carry a fixed 100% risk weighting under the standardised approach. This results in UK banks having higher risk weights against CRE exposure than other EU countries. Bank stress tests always specify falls in CRE prices (typically between 30% and 40%). There are yearly reviews of larger banks’ and insurers’ underwriting standards using loan level data.
Country-specific comments from national authorities

30BReport on vulnerabilities in the EU commercial real estate sector / November 2018 Abbreviations 149
Countries
BE Belgium
BG Bulgaria
CZ Czech Republic
DK Denmark
DE Germany
EE Estonia
IE Ireland
GR Greece
ES Spain
FR France
HR Croatia
IT Italy
CY Cyprus
LV Latvia
LT Lithuania
LU Luxembourg
HU Hungary
MT Malta
NL Netherlands
AT Austria
PL Poland
PT Portugal
RO Romania
SI Slovenia
SK Slovakia
FI Finland
SE Sweden
UK United Kingdom
NO Norway
US United States
Other
ASC Advisory Scientific Committee
ATC Advisory Technical Committee
CET1 Common Equity Tier 1
CRD Capital Requirements Directive
CRE Commercial real estate
CRR Capital Requirements Regulation
EBA European Banking Authority
DSTI Debt service-to-income ratio
ECB European Central Bank
EIOPA European Insurance and Occupational Pensions Authority
ESRB European Systemic Risk Board
EU European Union
LGD Loss given default
LTV Loan-to-value ratio
REIF Real estate investment fund
REIT Real estate investment trust
RRE Residential real estate
Abbreviations

The work was led by Tuomas Peltonen and the report was written by Simon Dagrain, Robert Emanuelsson, Christoph Kaufmann, Samantha Myers and Sverre Mæhlum (all at the ESRB Secretariat or formerly at the ESRB Secretariat).
The risk analysis framework was prepared jointly with Marco Lo Duca (ECB), Morten Niels Haastrup (formerly at the ESRB Secretariat), Giulio Nicoletti (ECB), Alvaro Santos Rivera (ECB) and Stefan Wredenborg (ECB).
The risk analysis framework benefitted from interactions with and input from the ESRB Working Group on Real Estate Methodologies (WG-REM) led by Francesco Zollino (Banca d’Italia).
For the policy analysis, contributions from Sascha Becker (formerly at the ESRB Secretariat), Dieter Hendrickx and Ľuboš Šesták (both at the ESRB Secretariat) are acknowledged.
The risk and the policy analyses also benefitted from contributions from Alexandra Morao and Eiko Sievert (both at the ESRB Secretariat).
Technical contributions and data assistance from Elena Banu (ESRB Secretariat), Pablo Gonzalez Dominguez (ECB), Michela Guarnero (ESRB Secretariat), Hana Hejlova (ESRB Secretariat), Cosimo Izzo (ECB), Marta Krystek (ECB), and Hannah Pfarr (formerly at the ESRB Secretariat) are also acknowledged.
The authors gratefully acknowledge data and input from the ECB, EBA, EIOPA and the national authorities of the EU Member States and Norway, as well as from Bloomberg, CBRE, Cushman & Wakefield, Jones Lang LaSalle, Morgan Stanley Capital International (MSCI), Real Capital Analytics (RCA), and Savills.
Imprint and acknowledgements
© European Systemic Risk Board, 2018
Postal address 60640 Frankfurt am Main, Germany Telephone +49 69 1344 0 Website www.esrb.europa.eu
All rights reserved. Reproduction for educational and non-commercial purposes is permitted provided that the source is acknowledged.
The cut-off date for the data included in this report was xx Month Year.
ISBN 978-92-9472-066-5 (pdf) DOI 10.2849/07201 (pdf) EU catalogue No DT-06-18-242-EN-N (pdf)