report on tuberculosis in california, 2015 - cdph home document library... · report on...
TRANSCRIPT
Report on Tuberculosis in California, 2015
Edmund G. Brown Jr, Governor State of California
Diana S. Dooley, Secretary California Health and Human Services Agency
Karen L. Smith, MD, MPH Director and State Health Officer
California Department of Public Health
Report on Tuberculosis
in California, 2015
Edmund G. Brown Jr. Governor
State of California
California Department of Public Health Center for Infectious Diseases
Division of Communicable Disease Control Tuberculosis Control Branch
850 Marina Bay Parkway Richmond, CA 94804-6403
(510) 620-3000
September 2016
Report on Tuberculosis in California, 2015 California Department of Public Health
Center for Infectious Diseases Division of Communicable Disease Control
Tuberculosis Control Branch
September 2016
Suggested Citation: Tuberculosis Control Branch, Report on Tuberculosis in California, 2015. California Department of Public Health, Richmond, CA. September 2016. Website: http://www.cdph.ca.gov/data/statistics/Pages/TuberculosisDiseaseData.aspx Tuberculosis Control Branch …..…………………………….. Jennifer Flood, MD, MPH, Chief Surveillance and Epidemiology Section ……………..………. Pennan Barry, MD, MPH, Chief Tuberculosis Registry ……………………………………….. Janice Westenhouse, MPH, Chief
Saul Kanowitz, MPH Tessa Mochizuki Varsha Hampole, MPH
Division of Communicable Disease Control ..…………………… James Watt, MD, MPH, Chief For more information, contact the Tuberculosis Control Branch at the following address and phone number: 850 Marina Bay Parkway Building P, 2nd Floor Richmond, CA 94804-6403 Phone: (510) 620-3000 Cover: The figures represent the 2,133 TB cases reported in California in 2015.
State of California—Health and Human Services Agency
California Department of Public Health
KAREN L. SMITH, MD, MPH EDMUND G. BROWN JR. Director and State Public Health Officer Governor
California Department of Public Health Tuberculosis Control Branch
850 Marina Bay Parkway Building P, 2nd
Floor Richmond, CA 94804-6403 (510) 620-3000 ● (510) 620-3034 FAX
Internet Address: http://cdph.ca.gov/programs/tb
September 1, 2016 Dear Colleagues, It is with great pleasure that I present to you the 2015 Report on Tuberculosis (TB) in California. Although TB disease did not decline in our state in 2015 compared to 2014, this report includes notable successes, including a decline in TB cases in very young children, and a steep decline in the rate of TB among black persons. Use of nucleic acid amplification testing to more rapidly diagnose TB increased across the state, as did HIV testing among our TB patients. Despite these successes, the lack of decline in TB cases highlights the need for increased TB prevention activities. In 2015, nearly 2.5 million Californians were estimated to have latent TB infection (LTBI). Identifying and treating high risk populations with LTBI can prevent future cases of TB disease. With prevention in mind, the report includes information that can help us identify subpopulations in which to focus our TB prevention efforts, including:
Asians and Pacific Islanders, who comprise more than half of California’s TB
cases
Older populations, as the median age of TB cases born outside the United States
increased to 57, while the median age of U.S.-born cases decreased to 34 in the
past decade
Long-term foreign-born residents, among whom 63 percent were in the United
States for more than 10 years at the time of TB diagnosis
The 31 percent of foreign-born persons with diabetes
In addition, for the first time this year, we report the results of genotyping of TB specimens, including genotyping surveillance coverage, the number and size of clusters, and characteristics of cases identified as Mycobacterium bovis. We also include information on the proportion of multidrug-resistant (MDR) TB cases by country of origin, information that can be used to identify patients for rapid molecular testing for drug resistance. As a reminder, the tables in this report are provided on our website in Excel format as a tool for your use, as well in PDF format (http://cdph.ca.gov/programs/tb).
Thank you for all you do to control TB in California. I look forward to our continued partnership to prevent and eliminate TB in our state. Sincerely,
Jennifer Flood, M.D., M.P.H., Chief Tuberculosis Control Branch Division of Communicable Disease Control Center for Infectious Diseases California Department of Public Health
CONTENTS Introduction
Acknowledgment
Executive Summary
Tuberculosis in California: 2015 and Recent Trends Table 1. Tuberculosis Cases and Case Rates per 100,000 Population:
California, 1985-2015 Table 2. Tuberculosis Cases by Race/Ethnicity, Age Group, Sex, and Birthplace:
California, 2006-2015 Table 3. Tuberculosis Case Rates per 100,000 Population by Race/Ethnicity, Age
Group, Sex, and Birthplace: California, 2006-2015 Table 4. Tuberculosis Cases by Race/Ethnicity and Age Group: California, 2006-2015 Table 5. Tuberculosis Case Rates per 100,000 Population by Race/Ethnicity and
Age Group: California, 2006-2015 Table 6. Tuberculosis Cases by Race/Ethnicity, Sex, and Age Group:
California, 2015 Table 7. Tuberculosis Case Rates per 100,000 Population by Race/Ethnicity, Sex,
and Age Group: California, 2015 Table 8. Tuberculosis Cases and Rates in U.S.-born Persons by Race/Ethnicity, Sex, and
Age Group: California, 2015 Table 9. Tuberculosis Cases and Rates in Foreign-born Persons by Race/Ethnicity, Sex,
and Age Group: California, 2015 Table 10. U.S.-born and Foreign-born Tuberculosis Cases by Race/Ethnicity: California,
2006-2015 Table 11. Tuberculosis Cases in Foreign-born Persons by Country of Origin and
Time in the United States: California, 2015 Table 12. HIV/AIDS-associated Tuberculosis by Demographic Characteristics and Risk
Factors for Tuberculosis: California, 2010-2015 Demographics of Tuberculosis Cases: Reporting Jurisdictions in California, 2015 and Recent Trends Table 13. Tuberculosis Cases, Rate per 100,000 Population, and Rank According
to Rate: Reporting Jurisdictions in California, 2014-2015 Table 14. Tuberculosis Cases by Year: Reporting Jurisdictions in California,
2006-2015 Table 15. Tuberculosis Case Rates per 100,000 Population: Reporting Jurisdictions
in California, 2006-2015 Table 16. Tuberculosis Cases by Age Group: Reporting Jurisdictions in
California, 2015 Table 17. Tuberculosis Cases in Persons 0-4 Years of Age: Reporting Jurisdictions
in California, 2007-2015 Table 18. Tuberculosis Cases 0-14 Years of Age that Lived Outside the United States for
Greater than Two Months: Reporting Jurisdictions in California, 2015 Table 19. Tuberculosis Cases by Race/Ethnicity: Reporting Jurisdictions in
California, 2015 Table 20. Tuberculosis Cases by U.S.-born and Foreign-born Persons: Reporting
Jurisdictions in California, 2015
Table 21. Tuberculosis Cases in Foreign-born Persons by Time in the United States: Reporting Jurisdictions in California, 2015
Table 22. Immigration Status of Foreign-born Tuberculosis Cases at First Entry into the United States: Reporting Jurisdictions in California, 2015 Characteristics of Tuberculosis Disease and its Management: Reporting Jurisdictions in California, 2013 and 2015 Table 23. Primary Reason Evaluated for Tuberculosis: Reporting Jurisdictions in California, 2015 Table 24. Tuberculosis Cases by Form of Disease: Reporting Jurisdictions in
California, 2015 Table 25. Verification Criteria by Diagnostic Classification of Tuberculosis: Reporting
Jurisdictions in California, 2015 Table 26. Tuberculosis Cases by Sputum Smear Status: Reporting
Jurisdictions in California, 2015 Table 27. Nucleic Acid Amplification Test Results at Time of Diagnosis: Reporting Jurisdictions in California, 2015 Table 28. Tuberculosis Cases by Chest X-ray Status: Reporting
Jurisdictions in California, 2015 Table 29. Tuberculosis Cases by Chest CT Scan or Other Chest Imaging Study: Reporting Jurisdictions in California, 2015 Table 30. Interferon Gamma Release Assay and Tuberculin Skin Test at Diagnosis: Reporting Jurisdictions in California, 2015 Table 31. Tuberculosis Cases by Vital Status at Diagnosis and Initiation of Treatment:
Reporting Jurisdictions in California, 2015 Table 32. Deaths in Persons with Tuberculosis: Reporting Jurisdictions in
California, 2013 Table 33. Tuberculosis Cases by Initial Drug Regimen: Reporting Jurisdictions
in California, 2015 Table 34. Tuberculosis Cases by Type of Health Care Provider: Reporting
Jurisdictions in California, 2013 Table 35. Tuberculosis Cases by Type of Therapy Administration: Reporting
Jurisdictions in California, 2013 Risk Factors for Tuberculosis: Reporting Jurisdictions in California, 2015 and Recent Trends Table 36. Tuberculosis Cases by HIV/AIDS Diagnosis: Reporting Jurisdictions in
California, 2010-2015 Table 37. HIV Status at Time of Tuberculosis Diagnosis: Reporting Jurisdictions in California, 2015 Table 38. Medical Risk Factors for Tuberculosis: Reporting Jurisdictions in California, 2015 Table 39. Non-medical Risk Factors for Tuberculosis: Reporting Jurisdictions in California, 2015 Table 40. Tuberculosis Cases Among Residents of Correctional Facilities:
Reporting Jurisdictions in California, 2015 Table 41. Tuberculosis Cases by Homeless Status: Reporting Jurisdictions in
California, 2015 Table 42. Tuberculosis Cases Among Persons in Long-term Care Facilities:
Reporting Jurisdictions in California, 2015
Table 43. Tuberculosis Cases Among Persons Using Injecting Drugs: Reporting Jurisdictions in California, 2015
Table 44. Tuberculosis Cases Among Persons Using Non-injecting Drugs: Reporting Jurisdictions in California, 2015
Table 45. Tuberculosis Cases Among Persons Using Excess Alcohol: Reporting Jurisdictions in California, 2015
Table 46. Tuberculosis Cases by Occupation, Age ≥ 15: Reporting Jurisdictions in California, 2015
Drug Resistance: Reporting Jurisdictions in California, 2015 and Recent Trends Table 47. Tuberculosis Cases by Initial Drug Susceptibility Testing: Reporting
Jurisdictions in California, 2015 Table 48. Tuberculosis Cases by Resistance to Isoniazid and History of Prior
Tuberculosis: Reporting Jurisdictions in California, 2015 Table 49. Tuberculosis Cases by Resistance to Rifampin and History of Prior
Tuberculosis: Reporting Jurisdictions in California, 2015 Table 50. Tuberculosis Cases by Resistance to Ethambutol and History of Prior
Tuberculosis: Reporting Jurisdictions in California, 2015 Table 51. Tuberculosis Cases by Resistance to Pyrazinamide and History of Prior
Tuberculosis: Reporting Jurisdictions in California, 2015 Table 52. Tuberculosis Cases by Resistance to Streptomycin and History of Prior
Tuberculosis: Reporting Jurisdictions in California, 2015 Table 53. Multidrug-resistant Tuberculosis Cases by History of Prior Tuberculosis: Reporting Jurisdictions in California, 2015 Table 54. Tuberculosis Cases by Resistance to at Least One First-line Drug and
History of Prior Tuberculosis: Reporting Jurisdictions in California, 2015 Table 55. Tuberculosis Cases by Resistance to Isoniazid: Reporting Jurisdictions
in California, 2009-2015 Table 56. Initial Multidrug-resistant Tuberculosis Cases: Reporting Jurisdictions
in California, 2009-2015 Table 57. Initial Multidrug-resistant Tuberculosis Cases by Country of Origin: Reporting Jurisdictions in California, 2011-2015 Treatment Outcomes: California and Reporting Jurisdictions, 2013 Table 58. Tuberculosis Cases by Outcome of Therapy: Reporting Jurisdictions
in California, 2013 Table 59. Outcome in Tuberculosis Cases for Whom One Year or Less of Therapy was
Indicated: Reporting Jurisdictions in California, 2013 Table 60. Completion of Therapy in Tuberculosis Cases for Whom One Year of Less of
Therapy was Indicated (CDC Algorithm): Reporting Jurisdictions in California, 2013
Table 61. Reason Tuberculosis Therapy Was Extended Beyond 12 Months: Reporting Jurisdictions in California, 2013 Table 62. Tuberculosis Cases by Outcome of Therapy and Risk Factor for Tuberculosis:
California, 2013 Table 63. Outcome in Tuberculosis Cases for Whom One Year or Less of Therapy was
Indicated, by Risk Factor for Tuberculosis: California, 2013
Genotyping of Mycobacterium tuberculosis specimens: California and Reporting Jurisdictions, 2011-2015
Table 64. Tuberculosis Genotyping Surveillance Coverage: Reporting Jurisdictions in California, 2011-2015
Table 65. Tuberculosis Cases and Clusters by Cluster Size: California, 2013-2015 Table 66. Characteristics of Tuberculosis Cases Identified with Mycobacterium bovis
(M.bovis): California, 2011-2015 Latent Tuberculosis Cases: California and Selected Counties, 2015 Table 67. Estimated Persons with Latent Tuberculosis Infections (LTBI): Selected Counties
in California, 2015 Figures Figure 1. Number of Tuberculosis Cases: California, 1930-2015 Figure 2. Number of Tuberculosis Cases and Case Rates: California, 2006-2015 Figure 3. Tuberculosis in California, 2015 Figure 4. Tuberculosis Cases by Race/Ethnicity: California, 2015 Figure 5. Tuberculosis Case Rates by Race/Ethnicity: California, 2006-2015 Figure 6. Tuberculosis Cases in Foreign-born and U.S.-born Persons: California, 2006-2015 Figure 7. Tuberculosis Cases by Country of Origin: California, 2015 Figure 8. Tuberculosis Cases in Persons 0−4 Years of Age: California, 2006-2015 Figure 9. Tuberculosis Cases by Verification Criteria: California, 2015 Figure 10. Deaths in Persons with Tuberculosis: California, 2004-2013 Figure 11. Tuberculosis Cases with HIV/AIDS Diagnosis: California, 2005-2015 Figure 12. HIV/AIDS-associated Tuberculosis by Race/Ethnicity: California, 2005-2015 Figure 13. Tuberculosis Cases with Multidrug Resistance (MDR) on Initial or Final Drug Susceptibility Testing: California, 2004-2013 Figure 14. Tuberculosis Cases with Initial Multidrug Resistance (MDR): California, 2011-2015 Figure 15. Tuberculosis Cases by Outcome of Therapy: California, 2013 Figure 16. Outcome in Tuberculosis Cases for Whom One Year or Less
of Treatment was Indicated: California, 2013 Figure 17. Completion of Tuberculosis Therapy (CDC Algorithm): California, 2004-2013 Technical Notes
1
Introduction Tuberculosis (TB) case reports are submitted to the California Department of Public Health (CDPH), TB Control Branch (TBCB), by 61 local health jurisdictions (58 counties, and the cities of Berkeley, Long Beach, and Pasadena). In 1993, the Centers for Disease Control and Prevention (CDC), in conjunction with state and local health departments, began using the Report of Verified Case of Tuberculosis (RVCT) to collect information on each case of TB. The RVCT includes demographic and clinical characteristics of TB cases, as well as information on drug resistance, risk factors for TB, and treatment outcomes. In 2009, CDC released an expanded RVCT that collects additional information to address the changing epidemiology of TB in terms of risk factors, new drug treatments, and enhanced laboratory capacity for diagnostic tests. California implemented this revised RVCT January 1, 2010. CDPH Division of Communicable Disease Control implemented an internet-based surveillance system for reportable diseases including TB in January 2010. This system, California Reportable Disease Information Exchange (CalREDIE), allows all jurisdictions in California to submit TB case reports and access their local data on-line in a timely manner. Acknowledgment TBCB would like to thank surveillance and reporting staff in all local reporting jurisdictions. Without their hard work we would not have data for this publication. We also acknowledge the support of our partners at CDC’s Division of Tuberculosis Elimination.
Executive Summary
The steady decline in tuberculosis (TB) in California seen over the last 25 years halted in 2015. The number of TB cases and the TB rate were unchanged in 2015 (2,133 cases and a rate of 5.5 per 100,000 population) compared with 2014 (Table 1). In contrast, the number of TB cases reported nationwide increased by nearly three percent, to 9,563 cases (3.0 per 1000,000). In 2015, California reported 20 percent of the nation’s cases. Although declines in TB have been small in recent years, TB cases in California have declined by 60 percent since the most recent peak in 1992. Finding and treating active TB cases continues to be the primary focus of public health programs, however, California’s goal is the elimination of TB in our state by 2040. TB elimination is defined as <1 case per million population, which translates to a target of approximately 40 cases per year in California. To reach this ambitious goal we need diverse strategies, and to expand our focus to include prevention of TB among populations at risk.
Geographic distribution of TB
Although TB continues to be diagnosed throughout California, 19 rural local health jurisdictions (LHJs) reported no TB cases in 2015 (Table 13). Of those, six LHJs have not reported a TB case in the past decade (Table 14). Twelve of 27 (44 percent) LHJs with five or more cases in 2015 reported an increase in the number of TB cases compared to 2014 (Table 14).
Disparities in TB among racial and ethnic groups
In 2015, TB case numbers and rates declined in all racial/ethnic groups except Asian and Pacific Islander, where cases increased by nearly five percent, and accounted for 53 percent of all California’s cases (Table 2). TB rates among the Asian and Pacific Islander group also increased by nearly three percent (Table 3). Of particular note, following several years of slower declines, TB among black non-Hispanic persons decreased by 17 percent from 2014 to 2015 (Table 2). Nevertheless, disparities continue to exist between racial/ethnic groups. In 2015, the TB rate among Asians and Pacific Islanders grew to nearly 22 times that of whites, while the rates among Hispanics and blacks were five and four times as great, respectively, compared to whites (Table 3). In 2015 the rate of TB among foreign-born persons (16.3 per 100,000) was nearly 12 times that of U.S.-born persons (1.4 per 100,000), an increase from 10 times greater in 2014. Ninety-three percent of Asians and Pacific Islander TB cases in California are born outside the United States (U.S.), contributing to the disparity in TB rates between U.S.-born and foreign-born persons (Tables 8, 9). The highest rates of TB among demographic groups are in Asians and Pacific Islanders born outside the U.S. (Table 9).
Age of TB patients
In 2015, 31 percent of TB patients were reported in persons 65 years of age or older (Table 2), in contrast to 2006, when only 24 percent were in the older age category. In the same time period, the median age of all TB cases rose to 54 from 46 years. The increase in age was predominately driven by foreign-born TB cases among whom the median age increased from 47 to 57 years between 2006 and 2015, while the median age of U.S.-born cases decreased from 44 to 34 years of age.
Thirty-six cases of TB were reported in children under the age of five in 2015, a dramatic decline from the previous year when 56 cases were reported in this most vulnerable group (Tables 2, 16, 17). Nearly 90 percent of these children were born in the U.S., and of those, two-thirds had at least one parent or guardian who was born in a country with an elevated rate of TB. TB in
very young children is often the result of transmission from a family member or caregiver whose TB had not been diagnosed and treated in a timely manner.
Foreign-born persons with TB
In 2015, 1,717 (80 percent) of California’s TB cases were reported in persons born outside the United States (Table 2), an increase of nearly 3 percent compared to 2014. Of these, 77 percent were born in Mexico, the Philippines, Vietnam, China, or India (Table 11). Sixty-three percent of all foreign-born cases have resided in the United States for more than ten years, and nearly three-quarters have been in the United States more than five years. TB in these persons may be the result of reactivation of infection acquired in their home country rather than recent infection in the United States. Identification and treatment of latent TB infection (LTBI) in foreign-born populations to prevent active TB disease is one strategy to move California toward TB elimination. The California Tuberculosis Control Branch (TBCB) and the California Tuberculosis Controllers Association (CTCA), along with Curry International TB Center have included foreign-born persons from a country with an elevated TB rate in a risk assessment tool to assist health care providers in identifying persons who have an increased likelihood of TB infection and would benefit from LTBI testing and treatment.
Nine percent of foreign-born cases were diagnosed with TB within one year of their arrival in the United States, indicating infection and progression to disease likely occurred in their country of origin (Table 11). Although overseas screening for infectious diseases, including active TB, is required for persons applying for permanent residency in the United States, undocumented persons and persons with non-permanent visa types are not screened for TB, nor are persons screened for LTBI. The Centers for Disease Control and Prevention (CDC) is currently in the planning stages for implementing overseas screening for long-term non-permanent visa holders, including students and workers. In 2015, 53 cases of TB were reported in persons who first entered the United States with a student visa, and 39 cases were reported in persons with an employment visa (Table 22). TB cases in these populations may result in extended contact investigations in school or work settings, possible transmission of disease to others, and can be resource intensive. The addition of overseas screening for LTBI, and treatment of LTBI among arrivers in the United States could further diminish the pool of persons who may progress to TB disease in the future.
Medical risk factors for TB
Persons with medical conditions that compromise the immune system may be at increased risk for TB. In 2015, 586 persons with TB (28 percent) also had a diagnosis of diabetes, 114 (five percent) had an immunosuppressive condition other than HIV, 83 (four percent) had end-stage renal disease, 9 had received an organ transplant, and 12 were on TNF-alpha antagonist therapy (Table 38). Thirty-five percent (n=757) of all TB cases had one or more of these medical risk factors known to increase the likelihood of progression from latent infection to active TB disease. Among foreign-born persons, 39 percent had one or more medical risk factor compared to 20 percent of U.S.-born persons. Forty-five percent of TB cases with diabetes were 65 or more years of age, and more than 90 percent were 45 years or older. Testing foreign-born patients with diabetes may be a reasonable way to prioritize TB testing when all foreign-born persons cannot be tested.
State and national guidelines recommend testing all TB patients for HIV. In 2015, 87 percent of all TB patients were tested for HIV (Table 37), an increase from 80 percent in 2011, the earliest year for which data are available. Of those tested in 2015, 60 (three percent) TB patients were co-infected with HIV, and 70 percent of those were foreign-born. Because untreated latent TB
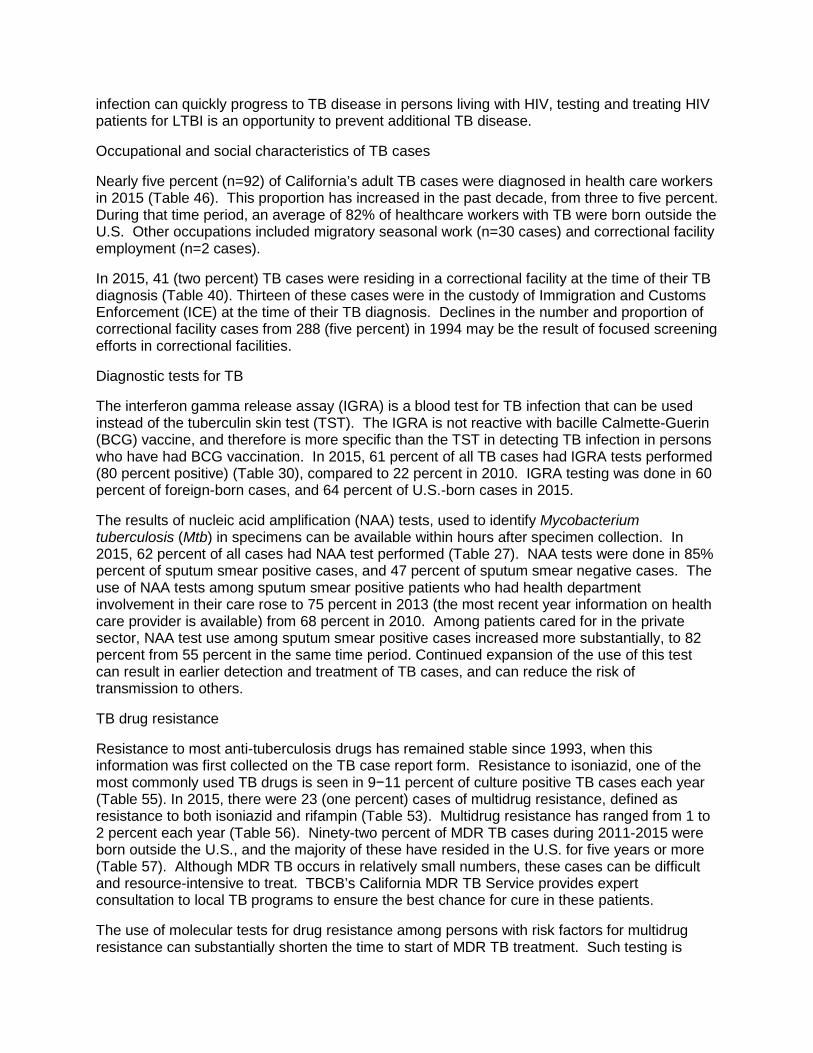
infection can quickly progress to TB disease in persons living with HIV, testing and treating HIV patients for LTBI is an opportunity to prevent additional TB disease.
Occupational and social characteristics of TB cases
Nearly five percent (n=92) of California’s adult TB cases were diagnosed in health care workers in 2015 (Table 46). This proportion has increased in the past decade, from three to five percent. During that time period, an average of 82% of healthcare workers with TB were born outside the U.S. Other occupations included migratory seasonal work (n=30 cases) and correctional facility employment (n=2 cases).
In 2015, 41 (two percent) TB cases were residing in a correctional facility at the time of their TB diagnosis (Table 40). Thirteen of these cases were in the custody of Immigration and Customs Enforcement (ICE) at the time of their TB diagnosis. Declines in the number and proportion of correctional facility cases from 288 (five percent) in 1994 may be the result of focused screening efforts in correctional facilities.
Diagnostic tests for TB
The interferon gamma release assay (IGRA) is a blood test for TB infection that can be used instead of the tuberculin skin test (TST). The IGRA is not reactive with bacille Calmette-Guerin (BCG) vaccine, and therefore is more specific than the TST in detecting TB infection in persons who have had BCG vaccination. In 2015, 61 percent of all TB cases had IGRA tests performed (80 percent positive) (Table 30), compared to 22 percent in 2010. IGRA testing was done in 60 percent of foreign-born cases, and 64 percent of U.S.-born cases in 2015.
The results of nucleic acid amplification (NAA) tests, used to identify Mycobacterium tuberculosis (Mtb) in specimens can be available within hours after specimen collection. In 2015, 62 percent of all cases had NAA test performed (Table 27). NAA tests were done in 85% percent of sputum smear positive cases, and 47 percent of sputum smear negative cases. The use of NAA tests among sputum smear positive patients who had health department involvement in their care rose to 75 percent in 2013 (the most recent year information on health care provider is available) from 68 percent in 2010. Among patients cared for in the private sector, NAA test use among sputum smear positive cases increased more substantially, to 82 percent from 55 percent in the same time period. Continued expansion of the use of this test can result in earlier detection and treatment of TB cases, and can reduce the risk of transmission to others.
TB drug resistance
Resistance to most anti-tuberculosis drugs has remained stable since 1993, when this information was first collected on the TB case report form. Resistance to isoniazid, one of the most commonly used TB drugs is seen in 9−11 percent of culture positive TB cases each year (Table 55). In 2015, there were 23 (one percent) cases of multidrug resistance, defined as resistance to both isoniazid and rifampin (Table 53). Multidrug resistance has ranged from 1 to 2 percent each year (Table 56). Ninety-two percent of MDR TB cases during 2011-2015 were born outside the U.S., and the majority of these have resided in the U.S. for five years or more (Table 57). Although MDR TB occurs in relatively small numbers, these cases can be difficult and resource-intensive to treat. TBCB’s California MDR TB Service provides expert consultation to local TB programs to ensure the best chance for cure in these patients.
The use of molecular tests for drug resistance among persons with risk factors for multidrug resistance can substantially shorten the time to start of MDR TB treatment. Such testing is
recommended in persons born in countries with high rates of MDR TB after immigration (Table 57), and persons who have immigrated recently. Additional risk factors include Hmong and Tibetan ethnicity, prior treatment for TB, contact to a patient with MDR TB, HIV infection, and failure of standard TB treatment.
Pyrazinamide (PZA) resistance has increased slightly among those tested, from 3−4 percent prior to 2002, to five percent in 2015 (Table 51). PZA resistance is typically suggestive of Mycobacterium bovis, a type of TB often caused by eating or drinking contaminated unpasteurized dairy products. Genotype testing can definitively identify M. bovis, which disproportionately affects children and immune-compromised adults, and is associated with extra-pulmonary disease (Table 66). In 2015, preliminary analysis of supplemental surveillance data linked to genotyping results found that more than 50 percent of persons with the M. bovis strain of TB reported consuming raw dairy products, which were predominately made in Mexico.
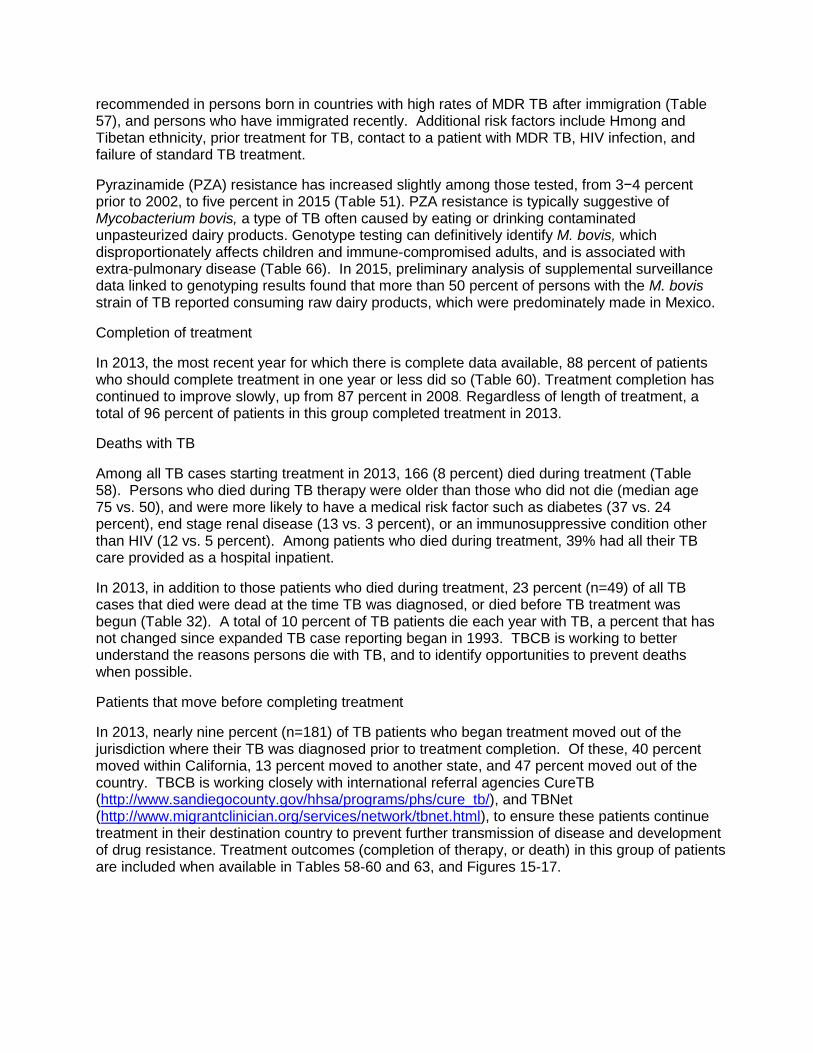
Completion of treatment
In 2013, the most recent year for which there is complete data available, 88 percent of patients who should complete treatment in one year or less did so (Table 60). Treatment completion has continued to improve slowly, up from 87 percent in 2008. Regardless of length of treatment, a total of 96 percent of patients in this group completed treatment in 2013.
Deaths with TB
Among all TB cases starting treatment in 2013, 166 (8 percent) died during treatment (Table 58). Persons who died during TB therapy were older than those who did not die (median age 75 vs. 50), and were more likely to have a medical risk factor such as diabetes (37 vs. 24 percent), end stage renal disease (13 vs. 3 percent), or an immunosuppressive condition other than HIV (12 vs. 5 percent). Among patients who died during treatment, 39% had all their TB care provided as a hospital inpatient.
In 2013, in addition to those patients who died during treatment, 23 percent (n=49) of all TB cases that died were dead at the time TB was diagnosed, or died before TB treatment was begun (Table 32). A total of 10 percent of TB patients die each year with TB, a percent that has not changed since expanded TB case reporting began in 1993. TBCB is working to better understand the reasons persons die with TB, and to identify opportunities to prevent deaths when possible.
Patients that move before completing treatment
In 2013, nearly nine percent (n=181) of TB patients who began treatment moved out of the jurisdiction where their TB was diagnosed prior to treatment completion. Of these, 40 percent moved within California, 13 percent moved to another state, and 47 percent moved out of the country. TBCB is working closely with international referral agencies CureTB (http://www.sandiegocounty.gov/hhsa/programs/phs/cure_tb/), and TBNet (http://www.migrantclinician.org/services/network/tbnet.html), to ensure these patients continue treatment in their destination country to prevent further transmission of disease and development of drug resistance. Treatment outcomes (completion of therapy, or death) in this group of patients are included when available in Tables 58-60 and 63, and Figures 15-17.
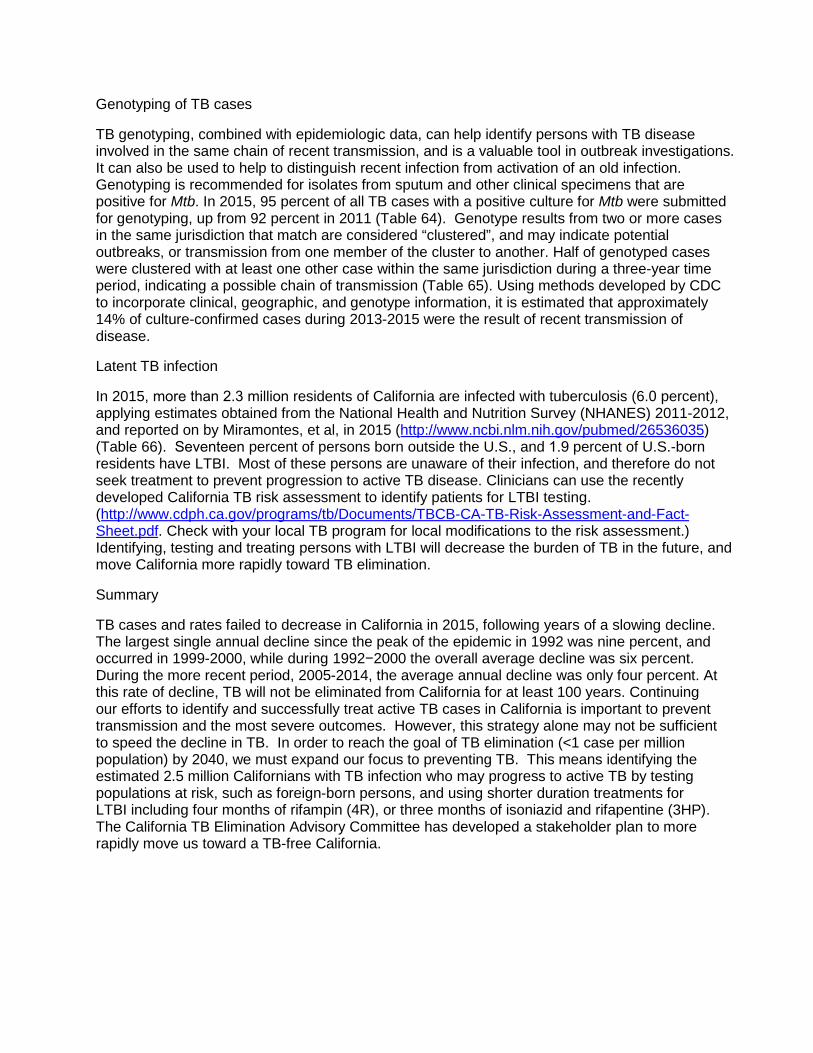
Genotyping of TB cases
TB genotyping, combined with epidemiologic data, can help identify persons with TB disease involved in the same chain of recent transmission, and is a valuable tool in outbreak investigations. It can also be used to help to distinguish recent infection from activation of an old infection. Genotyping is recommended for isolates from sputum and other clinical specimens that are positive for Mtb. In 2015, 95 percent of all TB cases with a positive culture for Mtb were submitted for genotyping, up from 92 percent in 2011 (Table 64). Genotype results from two or more cases in the same jurisdiction that match are considered “clustered”, and may indicate potential outbreaks, or transmission from one member of the cluster to another. Half of genotyped cases were clustered with at least one other case within the same jurisdiction during a three-year time period, indicating a possible chain of transmission (Table 65). Using methods developed by CDC to incorporate clinical, geographic, and genotype information, it is estimated that approximately 14% of culture-confirmed cases during 2013-2015 were the result of recent transmission of disease.
Latent TB infection
In 2015, more than 2.3 million residents of California are infected with tuberculosis (6.0 percent), applying estimates obtained from the National Health and Nutrition Survey (NHANES) 2011-2012, and reported on by Miramontes, et al, in 2015 (http://www.ncbi.nlm.nih.gov/pubmed/26536035) (Table 66). Seventeen percent of persons born outside the U.S., and 1.9 percent of U.S.-born residents have LTBI. Most of these persons are unaware of their infection, and therefore do not seek treatment to prevent progression to active TB disease. Clinicians can use the recently developed California TB risk assessment to identify patients for LTBI testing. (http://www.cdph.ca.gov/programs/tb/Documents/TBCB-CA-TB-Risk-Assessment-and-Fact-Sheet.pdf. Check with your local TB program for local modifications to the risk assessment.) Identifying, testing and treating persons with LTBI will decrease the burden of TB in the future, and move California more rapidly toward TB elimination.
Summary
TB cases and rates failed to decrease in California in 2015, following years of a slowing decline. The largest single annual decline since the peak of the epidemic in 1992 was nine percent, and occurred in 1999-2000, while during 1992−2000 the overall average decline was six percent. During the more recent period, 2005-2014, the average annual decline was only four percent. At this rate of decline, TB will not be eliminated from California for at least 100 years. Continuing our efforts to identify and successfully treat active TB cases in California is important to prevent transmission and the most severe outcomes. However, this strategy alone may not be sufficient to speed the decline in TB. In order to reach the goal of TB elimination (<1 case per million population) by 2040, we must expand our focus to preventing TB. This means identifying the estimated 2.5 million Californians with TB infection who may progress to active TB by testing populations at risk, such as foreign-born persons, and using shorter duration treatments for LTBI including four months of rifampin (4R), or three months of isoniazid and rifapentine (3HP). The California TB Elimination Advisory Committee has developed a stakeholder plan to more rapidly move us toward a TB-free California.
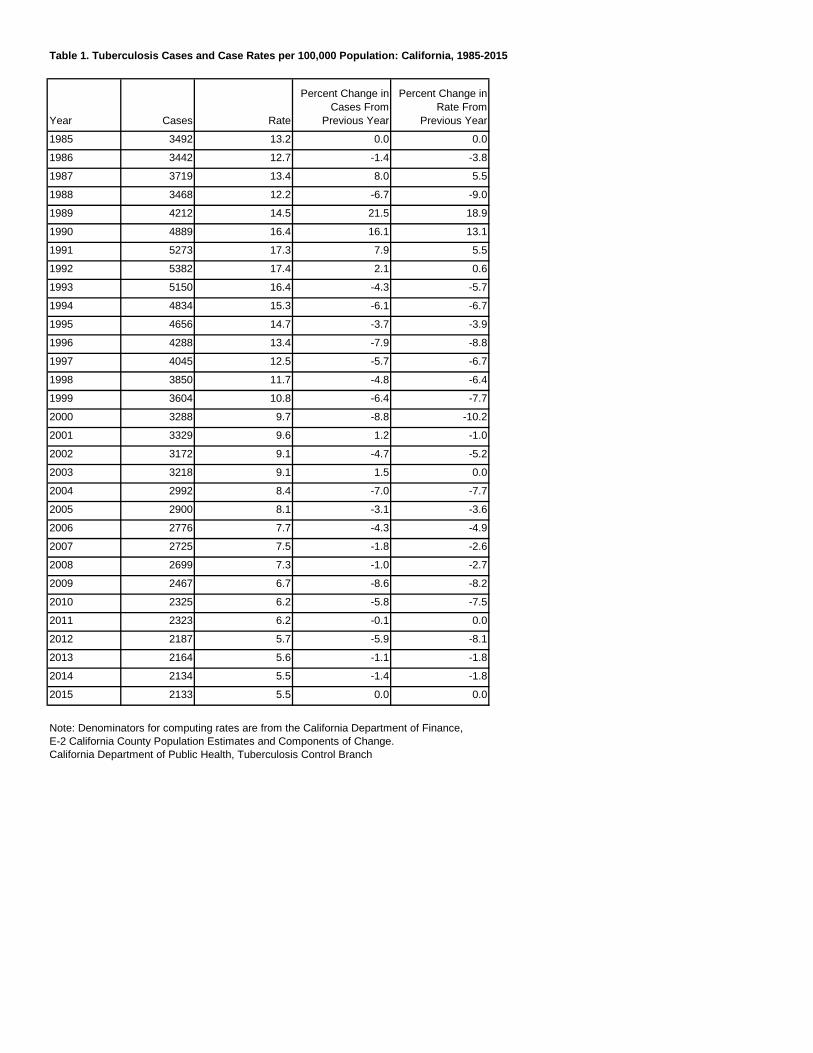
Table 1. Tuberculosis Cases and Case Rates per 100,000 Population: California, 1985-2015
Year Cases Rate
Percent Change inCases From
Previous Year
Percent Change inRate From
Previous Year
1985 3492 13.2 0.0 0.0
1986 3442 12.7 -1.4 -3.8
1987 3719 13.4 8.0 5.5
1988 3468 12.2 -6.7 -9.0
1989 4212 14.5 21.5 18.9
1990 4889 16.4 16.1 13.1
1991 5273 17.3 7.9 5.5
1992 5382 17.4 2.1 0.6
1993 5150 16.4 -4.3 -5.7
1994 4834 15.3 -6.1 -6.7
1995 4656 14.7 -3.7 -3.9
1996 4288 13.4 -7.9 -8.8
1997 4045 12.5 -5.7 -6.7
1998 3850 11.7 -4.8 -6.4
1999 3604 10.8 -6.4 -7.7
2000 3288 9.7 -8.8 -10.2
2001 3329 9.6 1.2 -1.0
2002 3172 9.1 -4.7 -5.2
2003 3218 9.1 1.5 0.0
2004 2992 8.4 -7.0 -7.7
2005 2900 8.1 -3.1 -3.6
2006 2776 7.7 -4.3 -4.9
2007 2725 7.5 -1.8 -2.6
2008 2699 7.3 -1.0 -2.7
2009 2467 6.7 -8.6 -8.2
2010 2325 6.2 -5.8 -7.5
2011 2323 6.2 -0.1 0.0
2012 2187 5.7 -5.9 -8.1
2013 2164 5.6 -1.1 -1.8
2014 2134 5.5 -1.4 -1.8
2015 2133 5.5 0.0 0.0
Note: Denominators for computing rates are from the California Department of Finance,E-2 California County Population Estimates and Components of Change.California Department of Public Health, Tuberculosis Control Branch
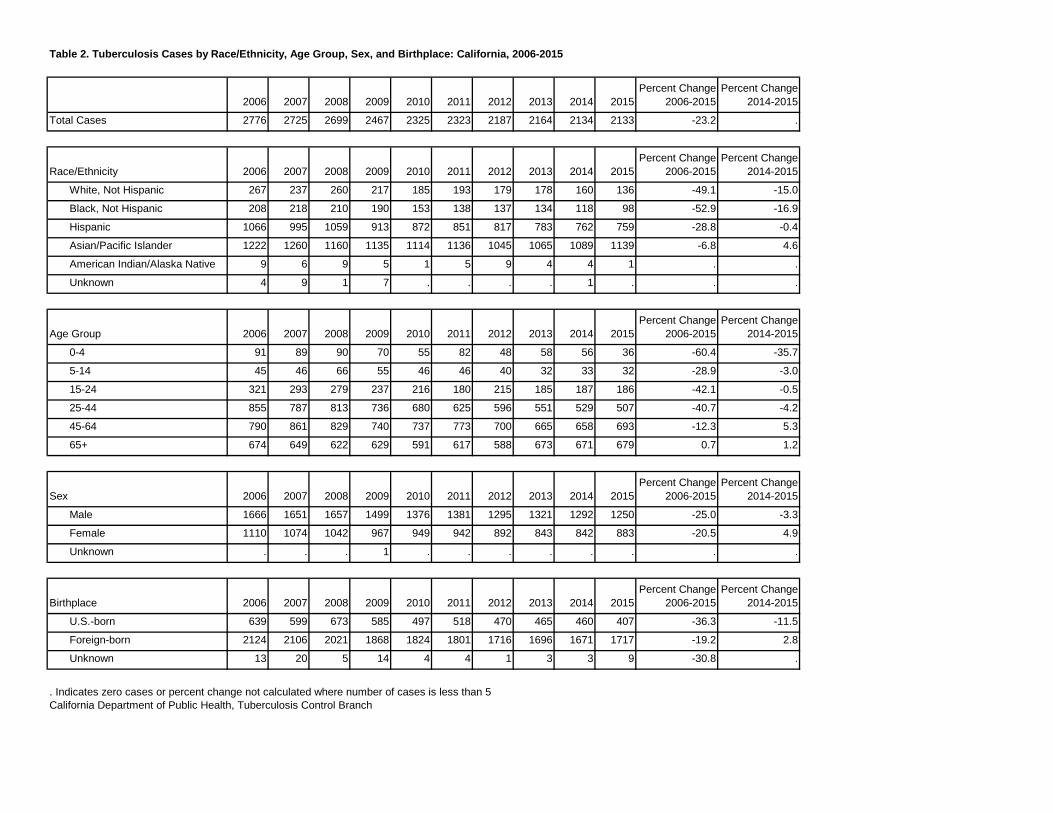
Table 2. Tuberculosis Cases by Race/Ethnicity, Age Group, Sex, and Birthplace: California, 2006-2015
2006 2007 2008 2009 2010 2011 2012 2013 2014 2015Percent Change
2006-2015Percent Change
2014-2015
Total Cases 2776 2725 2699 2467 2325 2323 2187 2164 2134 2133 -23.2 .
Race/Ethnicity 2006 2007 2008 2009 2010 2011 2012 2013 2014 2015Percent Change
2006-2015Percent Change
2014-2015
White, Not Hispanic 267 237 260 217 185 193 179 178 160 136 -49.1 -15.0
Black, Not Hispanic 208 218 210 190 153 138 137 134 118 98 -52.9 -16.9
Hispanic 1066 995 1059 913 872 851 817 783 762 759 -28.8 -0.4
Asian/Pacific Islander 1222 1260 1160 1135 1114 1136 1045 1065 1089 1139 -6.8 4.6
American Indian/Alaska Native 9 6 9 5 1 5 9 4 4 1 . .
Unknown 4 9 1 7 . . . . 1 . . .
Age Group 2006 2007 2008 2009 2010 2011 2012 2013 2014 2015Percent Change
2006-2015Percent Change
2014-2015
0-4 91 89 90 70 55 82 48 58 56 36 -60.4 -35.7
5-14 45 46 66 55 46 46 40 32 33 32 -28.9 -3.0
15-24 321 293 279 237 216 180 215 185 187 186 -42.1 -0.5
25-44 855 787 813 736 680 625 596 551 529 507 -40.7 -4.2
45-64 790 861 829 740 737 773 700 665 658 693 -12.3 5.3
65+ 674 649 622 629 591 617 588 673 671 679 0.7 1.2
Sex 2006 2007 2008 2009 2010 2011 2012 2013 2014 2015Percent Change
2006-2015Percent Change
2014-2015
Male 1666 1651 1657 1499 1376 1381 1295 1321 1292 1250 -25.0 -3.3
Female 1110 1074 1042 967 949 942 892 843 842 883 -20.5 4.9
Unknown . . . 1 . . . . . . . .
Birthplace 2006 2007 2008 2009 2010 2011 2012 2013 2014 2015Percent Change
2006-2015Percent Change
2014-2015
U.S.-born 639 599 673 585 497 518 470 465 460 407 -36.3 -11.5
Foreign-born 2124 2106 2021 1868 1824 1801 1716 1696 1671 1717 -19.2 2.8
Unknown 13 20 5 14 4 4 1 3 3 9 -30.8 .
. Indicates zero cases or percent change not calculated where number of cases is less than 5California Department of Public Health, Tuberculosis Control Branch
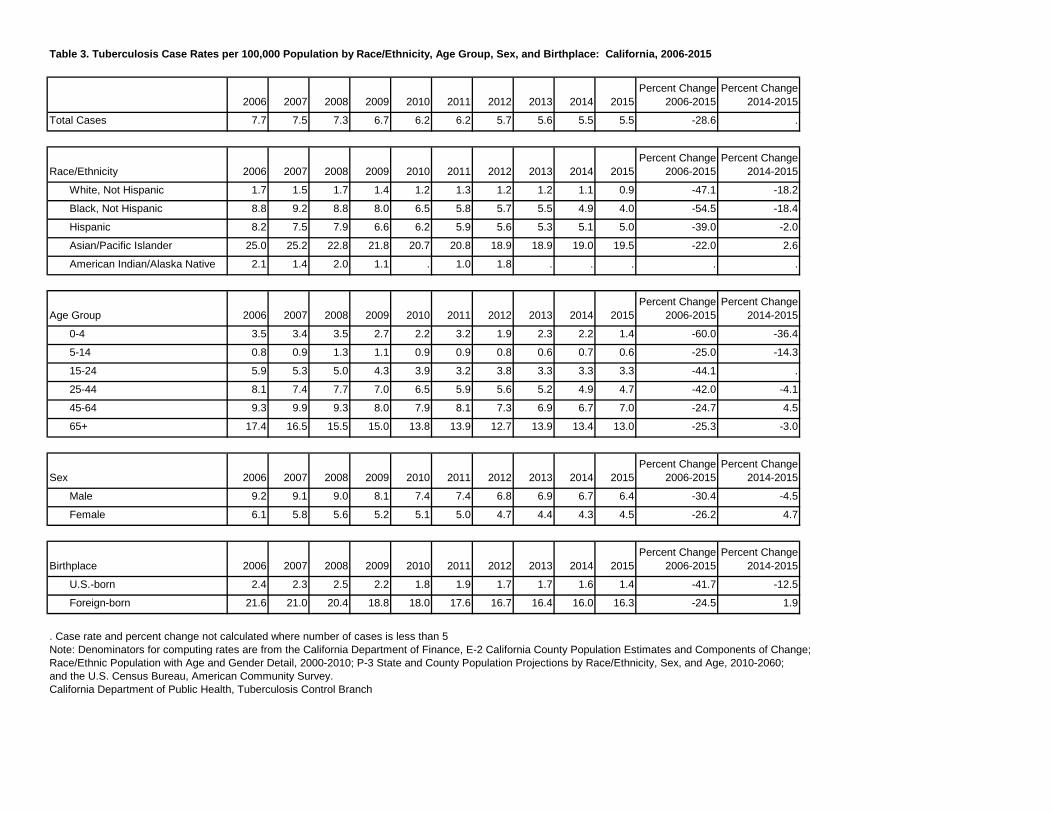
Table 3. Tuberculosis Case Rates per 100,000 Population by Race/Ethnicity, Age Group, Sex, and Birthplace: California, 2006-2015
2006 2007 2008 2009 2010 2011 2012 2013 2014 2015Percent Change
2006-2015Percent Change
2014-2015
Total Cases 7.7 7.5 7.3 6.7 6.2 6.2 5.7 5.6 5.5 5.5 -28.6 .
Race/Ethnicity 2006 2007 2008 2009 2010 2011 2012 2013 2014 2015Percent Change
2006-2015Percent Change
2014-2015
White, Not Hispanic 1.7 1.5 1.7 1.4 1.2 1.3 1.2 1.2 1.1 0.9 -47.1 -18.2
Black, Not Hispanic 8.8 9.2 8.8 8.0 6.5 5.8 5.7 5.5 4.9 4.0 -54.5 -18.4
Hispanic 8.2 7.5 7.9 6.6 6.2 5.9 5.6 5.3 5.1 5.0 -39.0 -2.0
Asian/Pacific Islander 25.0 25.2 22.8 21.8 20.7 20.8 18.9 18.9 19.0 19.5 -22.0 2.6
American Indian/Alaska Native 2.1 1.4 2.0 1.1 . 1.0 1.8 . . . . .
Age Group 2006 2007 2008 2009 2010 2011 2012 2013 2014 2015Percent Change
2006-2015Percent Change
2014-2015
0-4 3.5 3.4 3.5 2.7 2.2 3.2 1.9 2.3 2.2 1.4 -60.0 -36.4
5-14 0.8 0.9 1.3 1.1 0.9 0.9 0.8 0.6 0.7 0.6 -25.0 -14.3
15-24 5.9 5.3 5.0 4.3 3.9 3.2 3.8 3.3 3.3 3.3 -44.1 .
25-44 8.1 7.4 7.7 7.0 6.5 5.9 5.6 5.2 4.9 4.7 -42.0 -4.1
45-64 9.3 9.9 9.3 8.0 7.9 8.1 7.3 6.9 6.7 7.0 -24.7 4.5
65+ 17.4 16.5 15.5 15.0 13.8 13.9 12.7 13.9 13.4 13.0 -25.3 -3.0
Sex 2006 2007 2008 2009 2010 2011 2012 2013 2014 2015Percent Change
2006-2015Percent Change
2014-2015
Male 9.2 9.1 9.0 8.1 7.4 7.4 6.8 6.9 6.7 6.4 -30.4 -4.5
Female 6.1 5.8 5.6 5.2 5.1 5.0 4.7 4.4 4.3 4.5 -26.2 4.7
Birthplace 2006 2007 2008 2009 2010 2011 2012 2013 2014 2015Percent Change
2006-2015Percent Change
2014-2015
U.S.-born 2.4 2.3 2.5 2.2 1.8 1.9 1.7 1.7 1.6 1.4 -41.7 -12.5
Foreign-born 21.6 21.0 20.4 18.8 18.0 17.6 16.7 16.4 16.0 16.3 -24.5 1.9
. Case rate and percent change not calculated where number of cases is less than 5Note: Denominators for computing rates are from the California Department of Finance, E-2 California County Population Estimates and Components of Change;Race/Ethnic Population with Age and Gender Detail, 2000-2010; P-3 State and County Population Projections by Race/Ethnicity, Sex, and Age, 2010-2060;and the U.S. Census Bureau, American Community Survey.California Department of Public Health, Tuberculosis Control Branch
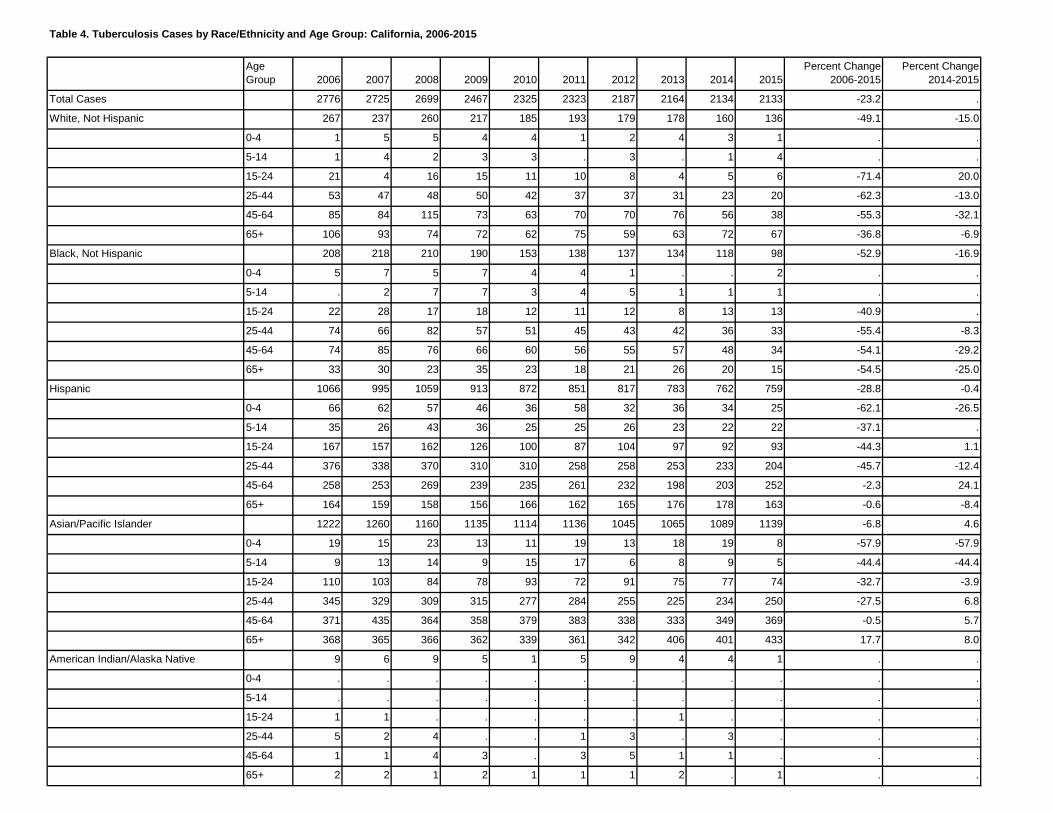
Table 4. Tuberculosis Cases by Race/Ethnicity and Age Group: California, 2006-2015
Age Group 2006 2007 2008 2009 2010 2011 2012 2013 2014 2015
Percent Change2006-2015
Percent Change2014-2015
Total Cases 2776 2725 2699 2467 2325 2323 2187 2164 2134 2133 -23.2 .
White, Not Hispanic 267 237 260 217 185 193 179 178 160 136 -49.1 -15.0
0-4 1 5 5 4 4 1 2 4 3 1 . .
5-14 1 4 2 3 3 . 3 . 1 4 . .
15-24 21 4 16 15 11 10 8 4 5 6 -71.4 20.0
25-44 53 47 48 50 42 37 37 31 23 20 -62.3 -13.0
45-64 85 84 115 73 63 70 70 76 56 38 -55.3 -32.1
65+ 106 93 74 72 62 75 59 63 72 67 -36.8 -6.9
Black, Not Hispanic 208 218 210 190 153 138 137 134 118 98 -52.9 -16.9
0-4 5 7 5 7 4 4 1 . . 2 . .
5-14 . 2 7 7 3 4 5 1 1 1 . .
15-24 22 28 17 18 12 11 12 8 13 13 -40.9 .
25-44 74 66 82 57 51 45 43 42 36 33 -55.4 -8.3
45-64 74 85 76 66 60 56 55 57 48 34 -54.1 -29.2
65+ 33 30 23 35 23 18 21 26 20 15 -54.5 -25.0
Hispanic 1066 995 1059 913 872 851 817 783 762 759 -28.8 -0.4
0-4 66 62 57 46 36 58 32 36 34 25 -62.1 -26.5
5-14 35 26 43 36 25 25 26 23 22 22 -37.1 .
15-24 167 157 162 126 100 87 104 97 92 93 -44.3 1.1
25-44 376 338 370 310 310 258 258 253 233 204 -45.7 -12.4
45-64 258 253 269 239 235 261 232 198 203 252 -2.3 24.1
65+ 164 159 158 156 166 162 165 176 178 163 -0.6 -8.4
Asian/Pacific Islander 1222 1260 1160 1135 1114 1136 1045 1065 1089 1139 -6.8 4.6
0-4 19 15 23 13 11 19 13 18 19 8 -57.9 -57.9
5-14 9 13 14 9 15 17 6 8 9 5 -44.4 -44.4
15-24 110 103 84 78 93 72 91 75 77 74 -32.7 -3.9
25-44 345 329 309 315 277 284 255 225 234 250 -27.5 6.8
45-64 371 435 364 358 379 383 338 333 349 369 -0.5 5.7
65+ 368 365 366 362 339 361 342 406 401 433 17.7 8.0
American Indian/Alaska Native 9 6 9 5 1 5 9 4 4 1 . .
0-4 . . . . . . . . . . . .
5-14 . . . . . . . . . . . .
15-24 1 1 . . . . . 1 . . . .
25-44 5 2 4 . . 1 3 . 3 . . .
45-64 1 1 4 3 . 3 5 1 1 . . .
65+ 2 2 1 2 1 1 1 2 . 1 . .
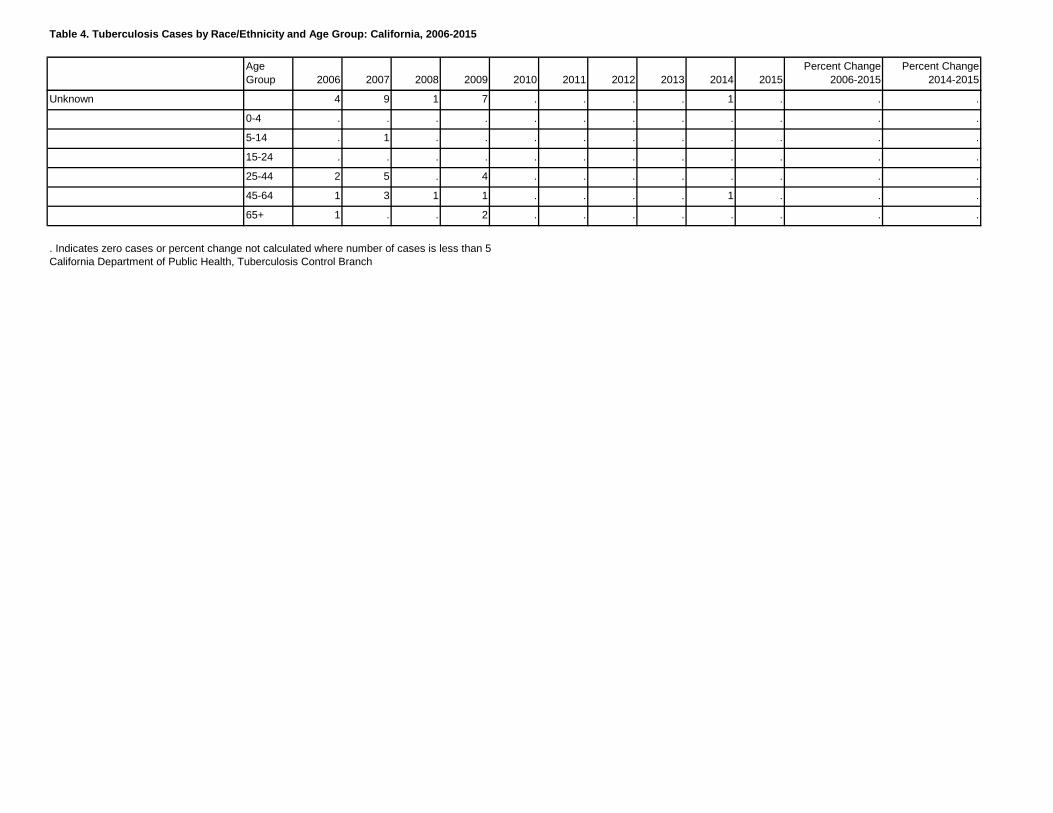
Table 4. Tuberculosis Cases by Race/Ethnicity and Age Group: California, 2006-2015
Age Group 2006 2007 2008 2009 2010 2011 2012 2013 2014 2015
Percent Change2006-2015
Percent Change2014-2015
Unknown 4 9 1 7 . . . . 1 . . .
0-4 . . . . . . . . . . . .
5-14 . 1 . . . . . . . . . .
15-24 . . . . . . . . . . . .
25-44 2 5 . 4 . . . . . . . .
45-64 1 3 1 1 . . . . 1 . . .
65+ 1 . . 2 . . . . . . . .
. Indicates zero cases or percent change not calculated where number of cases is less than 5California Department of Public Health, Tuberculosis Control Branch
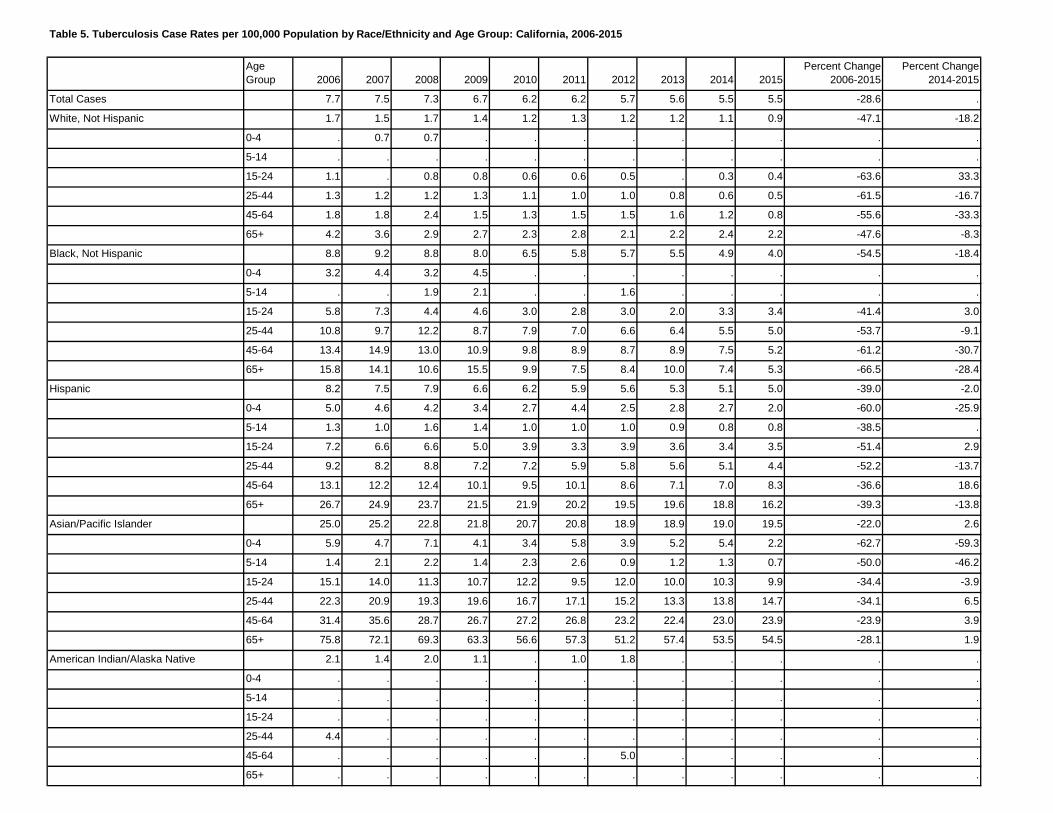
Table 5. Tuberculosis Case Rates per 100,000 Population by Race/Ethnicity and Age Group: California, 2006-2015
Age Group 2006 2007 2008 2009 2010 2011 2012 2013 2014 2015
Percent Change2006-2015
Percent Change2014-2015
Total Cases 7.7 7.5 7.3 6.7 6.2 6.2 5.7 5.6 5.5 5.5 -28.6 .
White, Not Hispanic 1.7 1.5 1.7 1.4 1.2 1.3 1.2 1.2 1.1 0.9 -47.1 -18.2
0-4 . 0.7 0.7 . . . . . . . . .
5-14 . . . . . . . . . . . .
15-24 1.1 . 0.8 0.8 0.6 0.6 0.5 . 0.3 0.4 -63.6 33.3
25-44 1.3 1.2 1.2 1.3 1.1 1.0 1.0 0.8 0.6 0.5 -61.5 -16.7
45-64 1.8 1.8 2.4 1.5 1.3 1.5 1.5 1.6 1.2 0.8 -55.6 -33.3
65+ 4.2 3.6 2.9 2.7 2.3 2.8 2.1 2.2 2.4 2.2 -47.6 -8.3
Black, Not Hispanic 8.8 9.2 8.8 8.0 6.5 5.8 5.7 5.5 4.9 4.0 -54.5 -18.4
0-4 3.2 4.4 3.2 4.5 . . . . . . . .
5-14 . . 1.9 2.1 . . 1.6 . . . . .
15-24 5.8 7.3 4.4 4.6 3.0 2.8 3.0 2.0 3.3 3.4 -41.4 3.0
25-44 10.8 9.7 12.2 8.7 7.9 7.0 6.6 6.4 5.5 5.0 -53.7 -9.1
45-64 13.4 14.9 13.0 10.9 9.8 8.9 8.7 8.9 7.5 5.2 -61.2 -30.7
65+ 15.8 14.1 10.6 15.5 9.9 7.5 8.4 10.0 7.4 5.3 -66.5 -28.4
Hispanic 8.2 7.5 7.9 6.6 6.2 5.9 5.6 5.3 5.1 5.0 -39.0 -2.0
0-4 5.0 4.6 4.2 3.4 2.7 4.4 2.5 2.8 2.7 2.0 -60.0 -25.9
5-14 1.3 1.0 1.6 1.4 1.0 1.0 1.0 0.9 0.8 0.8 -38.5 .
15-24 7.2 6.6 6.6 5.0 3.9 3.3 3.9 3.6 3.4 3.5 -51.4 2.9
25-44 9.2 8.2 8.8 7.2 7.2 5.9 5.8 5.6 5.1 4.4 -52.2 -13.7
45-64 13.1 12.2 12.4 10.1 9.5 10.1 8.6 7.1 7.0 8.3 -36.6 18.6
65+ 26.7 24.9 23.7 21.5 21.9 20.2 19.5 19.6 18.8 16.2 -39.3 -13.8
Asian/Pacific Islander 25.0 25.2 22.8 21.8 20.7 20.8 18.9 18.9 19.0 19.5 -22.0 2.6
0-4 5.9 4.7 7.1 4.1 3.4 5.8 3.9 5.2 5.4 2.2 -62.7 -59.3
5-14 1.4 2.1 2.2 1.4 2.3 2.6 0.9 1.2 1.3 0.7 -50.0 -46.2
15-24 15.1 14.0 11.3 10.7 12.2 9.5 12.0 10.0 10.3 9.9 -34.4 -3.9
25-44 22.3 20.9 19.3 19.6 16.7 17.1 15.2 13.3 13.8 14.7 -34.1 6.5
45-64 31.4 35.6 28.7 26.7 27.2 26.8 23.2 22.4 23.0 23.9 -23.9 3.9
65+ 75.8 72.1 69.3 63.3 56.6 57.3 51.2 57.4 53.5 54.5 -28.1 1.9
American Indian/Alaska Native 2.1 1.4 2.0 1.1 . 1.0 1.8 . . . . .
0-4 . . . . . . . . . . . .
5-14 . . . . . . . . . . . .
15-24 . . . . . . . . . . . .
25-44 4.4 . . . . . . . . . . .
45-64 . . . . . . 5.0 . . . . .
65+ . . . . . . . . . . . .
. Case rate and percent change not calculated where number of cases is less than 5Note: Denominators for computing rates are from the California Department of Finance, E-2 California County Population Estimates and Components of Change;Race/Hispanic Population with Age and Gender Detail, 2000-2010; P-3 State and County Population Projections by Race/Ethnicity, Sex, and Age, 2010-2060;and the U.S. Census Bureau, American Community Survey.California Department of Public Health, Tuberculosis Control Branch
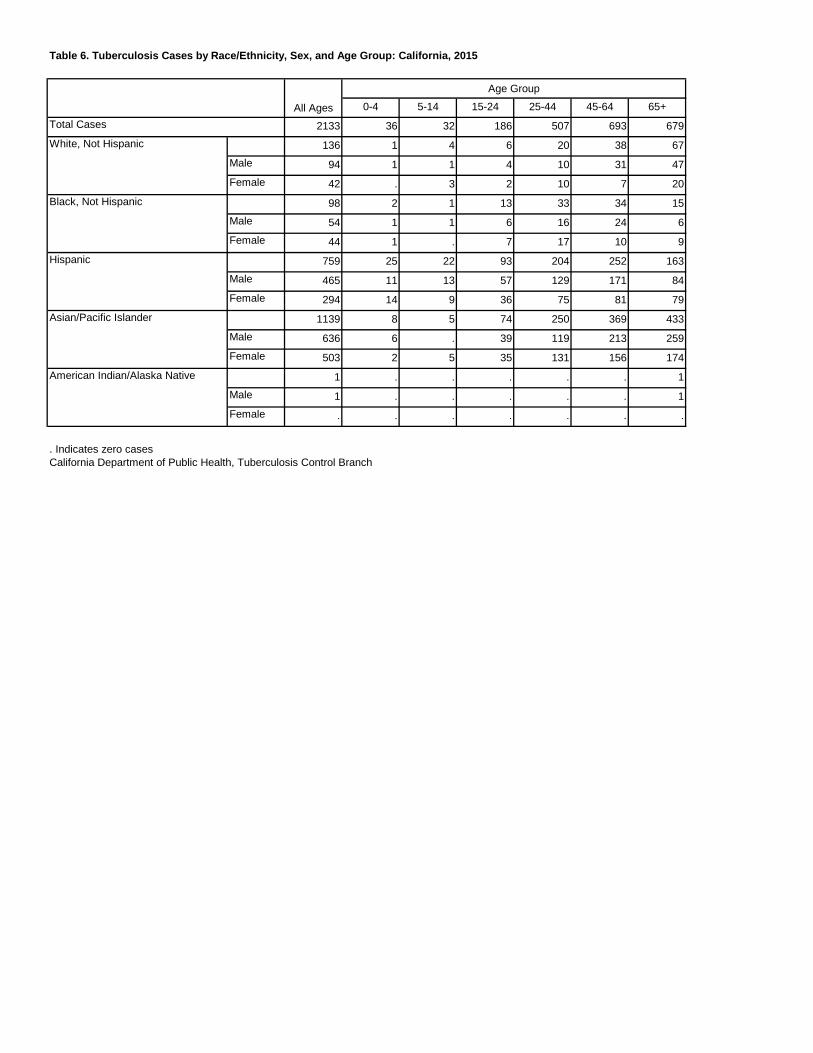
Table 6. Tuberculosis Cases by Race/Ethnicity, Sex, and Age Group: California, 2015
0-4 5-14 15-24 25-44 45-64 65+
2133 36 32 186 507 693 679
136 1 4 6 20 38 67Male 94 1 1 4 10 31 47Female 42 . 3 2 10 7 20
98 2 1 13 33 34 15Male 54 1 1 6 16 24 6Female 44 1 . 7 17 10 9
759 25 22 93 204 252 163Male 465 11 13 57 129 171 84Female 294 14 9 36 75 81 79
1139 8 5 74 250 369 433Male 636 6 . 39 119 213 259Female 503 2 5 35 131 156 174
1 . . . . . 1Male 1 . . . . . 1Female . . . . . . .
. Indicates zero casesCalifornia Department of Public Health, Tuberculosis Control Branch
Asian/Pacific Islander
American Indian/Alaska Native
All Ages
Age Group
Total Cases
White, Not Hispanic
Black, Not Hispanic
Hispanic
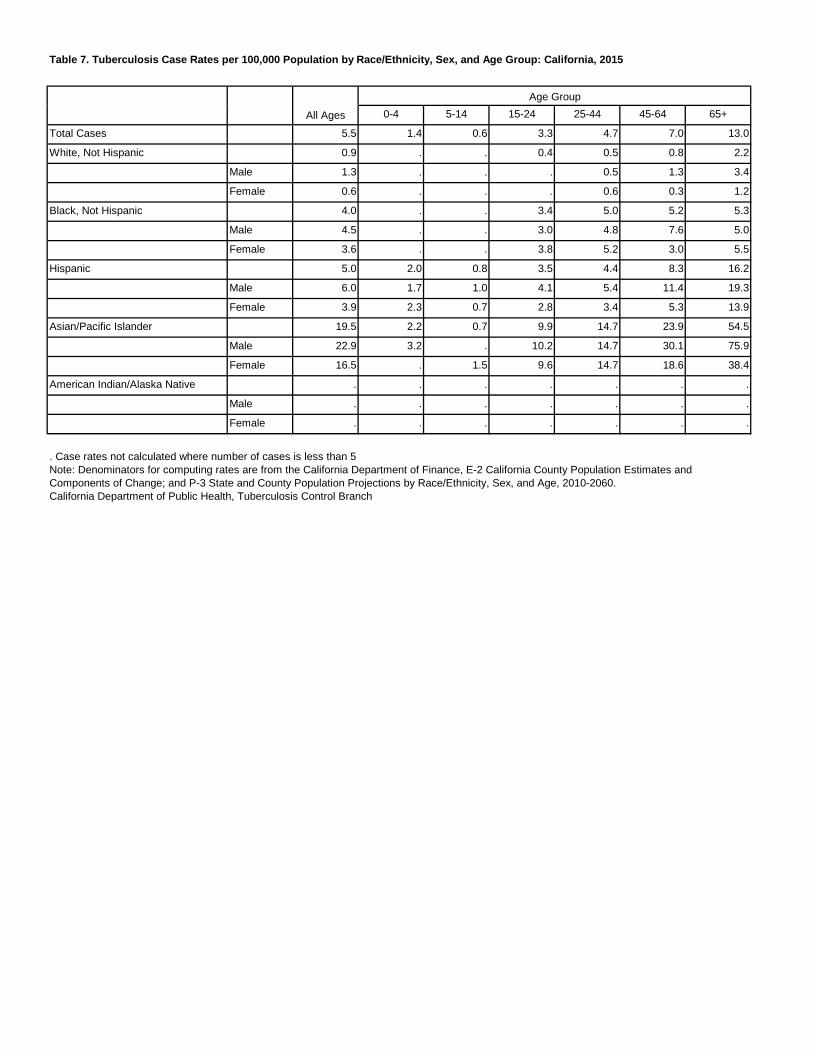
Table 7. Tuberculosis Case Rates per 100,000 Population by Race/Ethnicity, Sex, and Age Group: California, 2015
0-4 5-14 15-24 25-44 45-64 65+
Total Cases 5.5 1.4 0.6 3.3 4.7 7.0 13.0
White, Not Hispanic 0.9 . . 0.4 0.5 0.8 2.2
Male 1.3 . . . 0.5 1.3 3.4
Female 0.6 . . . 0.6 0.3 1.2
Black, Not Hispanic 4.0 . . 3.4 5.0 5.2 5.3
Male 4.5 . . 3.0 4.8 7.6 5.0
Female 3.6 . . 3.8 5.2 3.0 5.5
Hispanic 5.0 2.0 0.8 3.5 4.4 8.3 16.2
Male 6.0 1.7 1.0 4.1 5.4 11.4 19.3
Female 3.9 2.3 0.7 2.8 3.4 5.3 13.9
Asian/Pacific Islander 19.5 2.2 0.7 9.9 14.7 23.9 54.5
Male 22.9 3.2 . 10.2 14.7 30.1 75.9
Female 16.5 . 1.5 9.6 14.7 18.6 38.4
American Indian/Alaska Native . . . . . . .
Male . . . . . . .
Female . . . . . . .
. Case rates not calculated where number of cases is less than 5Note: Denominators for computing rates are from the California Department of Finance, E-2 California County Population Estimates andComponents of Change; and P-3 State and County Population Projections by Race/Ethnicity, Sex, and Age, 2010-2060.California Department of Public Health, Tuberculosis Control Branch
Age Group
All Ages
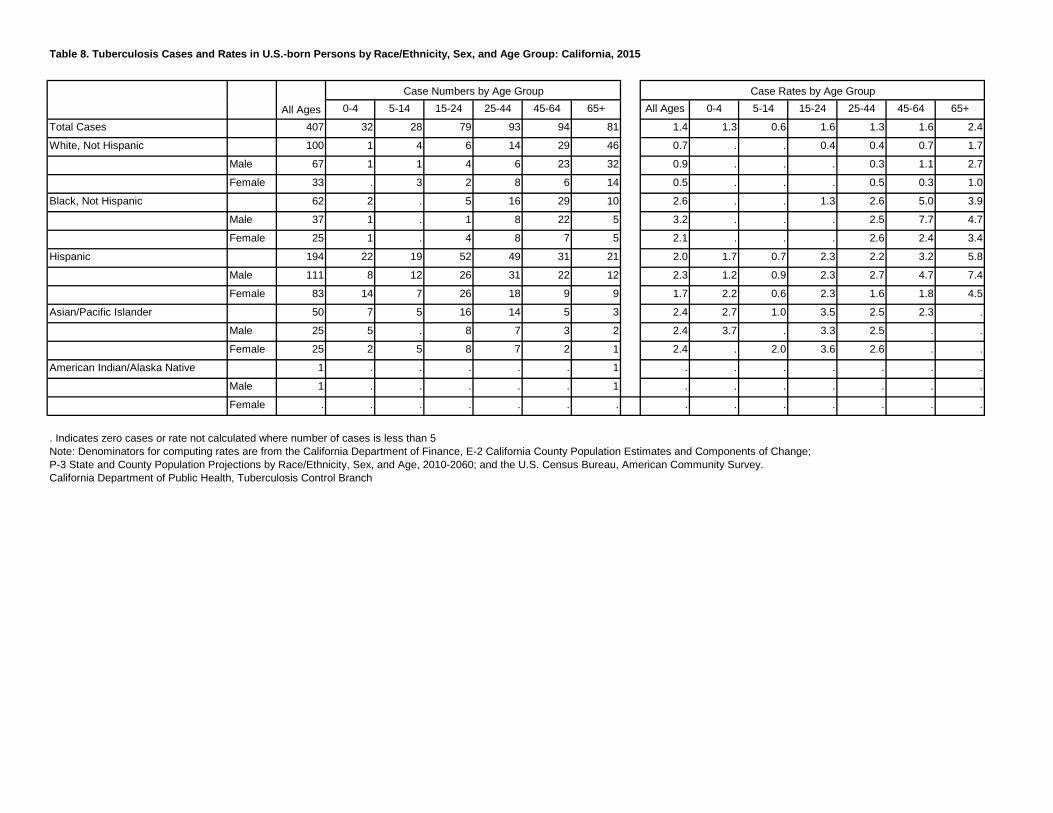
Table 8. Tuberculosis Cases and Rates in U.S.-born Persons by Race/Ethnicity, Sex, and Age Group: California, 2015
0-4 5-14 15-24 25-44 45-64 65+ All Ages 0-4 5-14 15-24 25-44 45-64 65+
Total Cases 407 32 28 79 93 94 81 1.4 1.3 0.6 1.6 1.3 1.6 2.4
White, Not Hispanic 100 1 4 6 14 29 46 0.7 . . 0.4 0.4 0.7 1.7
Male 67 1 1 4 6 23 32 0.9 . . . 0.3 1.1 2.7
Female 33 . 3 2 8 6 14 0.5 . . . 0.5 0.3 1.0
Black, Not Hispanic 62 2 . 5 16 29 10 2.6 . . 1.3 2.6 5.0 3.9
Male 37 1 . 1 8 22 5 3.2 . . . 2.5 7.7 4.7
Female 25 1 . 4 8 7 5 2.1 . . . 2.6 2.4 3.4
Hispanic 194 22 19 52 49 31 21 2.0 1.7 0.7 2.3 2.2 3.2 5.8
Male 111 8 12 26 31 22 12 2.3 1.2 0.9 2.3 2.7 4.7 7.4
Female 83 14 7 26 18 9 9 1.7 2.2 0.6 2.3 1.6 1.8 4.5
Asian/Pacific Islander 50 7 5 16 14 5 3 2.4 2.7 1.0 3.5 2.5 2.3 .
Male 25 5 . 8 7 3 2 2.4 3.7 . 3.3 2.5 . .
Female 25 2 5 8 7 2 1 2.4 . 2.0 3.6 2.6 . .
American Indian/Alaska Native 1 . . . . . 1 . . . . . . .
Male 1 . . . . . 1 . . . . . . .
Female . . . . . . . . . . . . . .
. Indicates zero cases or rate not calculated where number of cases is less than 5Note: Denominators for computing rates are from the California Department of Finance, E-2 California County Population Estimates and Components of Change;P-3 State and County Population Projections by Race/Ethnicity, Sex, and Age, 2010-2060; and the U.S. Census Bureau, American Community Survey.California Department of Public Health, Tuberculosis Control Branch
Case Numbers by Age Group Case Rates by Age Group
All Ages
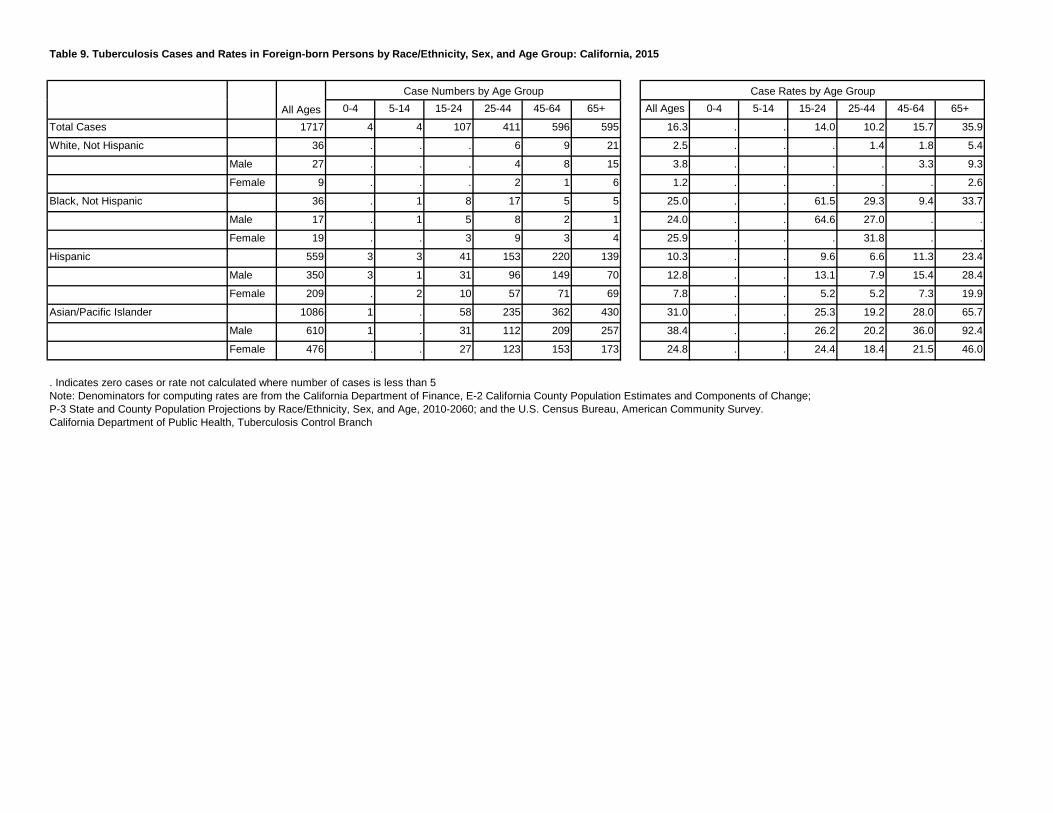
Table 9. Tuberculosis Cases and Rates in Foreign-born Persons by Race/Ethnicity, Sex, and Age Group: California, 2015
0-4 5-14 15-24 25-44 45-64 65+ All Ages 0-4 5-14 15-24 25-44 45-64 65+
Total Cases 1717 4 4 107 411 596 595 16.3 . . 14.0 10.2 15.7 35.9
White, Not Hispanic 36 . . . 6 9 21 2.5 . . . 1.4 1.8 5.4
Male 27 . . . 4 8 15 3.8 . . . . 3.3 9.3
Female 9 . . . 2 1 6 1.2 . . . . . 2.6
Black, Not Hispanic 36 . 1 8 17 5 5 25.0 . . 61.5 29.3 9.4 33.7
Male 17 . 1 5 8 2 1 24.0 . . 64.6 27.0 . .
Female 19 . . 3 9 3 4 25.9 . . . 31.8 . .
Hispanic 559 3 3 41 153 220 139 10.3 . . 9.6 6.6 11.3 23.4
Male 350 3 1 31 96 149 70 12.8 . . 13.1 7.9 15.4 28.4
Female 209 . 2 10 57 71 69 7.8 . . 5.2 5.2 7.3 19.9
Asian/Pacific Islander 1086 1 . 58 235 362 430 31.0 . . 25.3 19.2 28.0 65.7
Male 610 1 . 31 112 209 257 38.4 . . 26.2 20.2 36.0 92.4
Female 476 . . 27 123 153 173 24.8 . . 24.4 18.4 21.5 46.0
. Indicates zero cases or rate not calculated where number of cases is less than 5Note: Denominators for computing rates are from the California Department of Finance, E-2 California County Population Estimates and Components of Change;P-3 State and County Population Projections by Race/Ethnicity, Sex, and Age, 2010-2060; and the U.S. Census Bureau, American Community Survey.California Department of Public Health, Tuberculosis Control Branch
Case Numbers by Age Group Case Rates by Age Group
All Ages
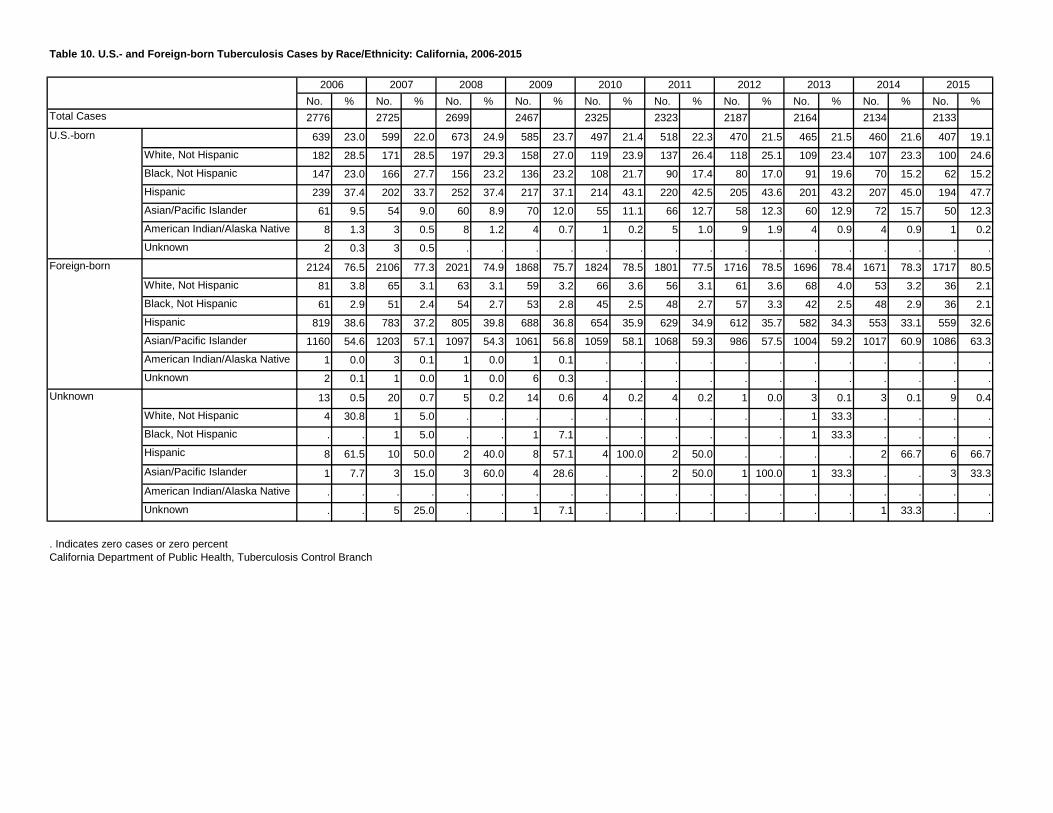
Table 10. U.S.- and Foreign-born Tuberculosis Cases by Race/Ethnicity: California, 2006-2015
No. % No. % No. % No. % No. % No. % No. % No. % No. % No. %2776 2725 2699 2467 2325 2323 2187 2164 2134 2133
639 23.0 599 22.0 673 24.9 585 23.7 497 21.4 518 22.3 470 21.5 465 21.5 460 21.6 407 19.1White, Not Hispanic 182 28.5 171 28.5 197 29.3 158 27.0 119 23.9 137 26.4 118 25.1 109 23.4 107 23.3 100 24.6Black, Not Hispanic 147 23.0 166 27.7 156 23.2 136 23.2 108 21.7 90 17.4 80 17.0 91 19.6 70 15.2 62 15.2Hispanic 239 37.4 202 33.7 252 37.4 217 37.1 214 43.1 220 42.5 205 43.6 201 43.2 207 45.0 194 47.7Asian/Pacific Islander 61 9.5 54 9.0 60 8.9 70 12.0 55 11.1 66 12.7 58 12.3 60 12.9 72 15.7 50 12.3American Indian/Alaska Native 8 1.3 3 0.5 8 1.2 4 0.7 1 0.2 5 1.0 9 1.9 4 0.9 4 0.9 1 0.2Unknown 2 0.3 3 0.5 . . . . . . . . . . . . . . . .
2124 76.5 2106 77.3 2021 74.9 1868 75.7 1824 78.5 1801 77.5 1716 78.5 1696 78.4 1671 78.3 1717 80.5White, Not Hispanic 81 3.8 65 3.1 63 3.1 59 3.2 66 3.6 56 3.1 61 3.6 68 4.0 53 3.2 36 2.1Black, Not Hispanic 61 2.9 51 2.4 54 2.7 53 2.8 45 2.5 48 2.7 57 3.3 42 2.5 48 2.9 36 2.1Hispanic 819 38.6 783 37.2 805 39.8 688 36.8 654 35.9 629 34.9 612 35.7 582 34.3 553 33.1 559 32.6Asian/Pacific Islander 1160 54.6 1203 57.1 1097 54.3 1061 56.8 1059 58.1 1068 59.3 986 57.5 1004 59.2 1017 60.9 1086 63.3American Indian/Alaska Native 1 0.0 3 0.1 1 0.0 1 0.1 . . . . . . . . . . . .Unknown 2 0.1 1 0.0 1 0.0 6 0.3 . . . . . . . . . . . .
13 0.5 20 0.7 5 0.2 14 0.6 4 0.2 4 0.2 1 0.0 3 0.1 3 0.1 9 0.4White, Not Hispanic 4 30.8 1 5.0 . . . . . . . . . . 1 33.3 . . . .Black, Not Hispanic . . 1 5.0 . . 1 7.1 . . . . . . 1 33.3 . . . .Hispanic 8 61.5 10 50.0 2 40.0 8 57.1 4 100.0 2 50.0 . . . . 2 66.7 6 66.7Asian/Pacific Islander 1 7.7 3 15.0 3 60.0 4 28.6 . . 2 50.0 1 100.0 1 33.3 . . 3 33.3American Indian/Alaska Native . . . . . . . . . . . . . . . . . . . .Unknown . . 5 25.0 . . 1 7.1 . . . . . . . . 1 33.3 . .
. Indicates zero cases or zero percentCalifornia Department of Public Health, Tuberculosis Control Branch
U.S.-born
Foreign-born
Unknown
2011 2012 2013 2014 2015
Total Cases
2006 2007 2008 2009 2010
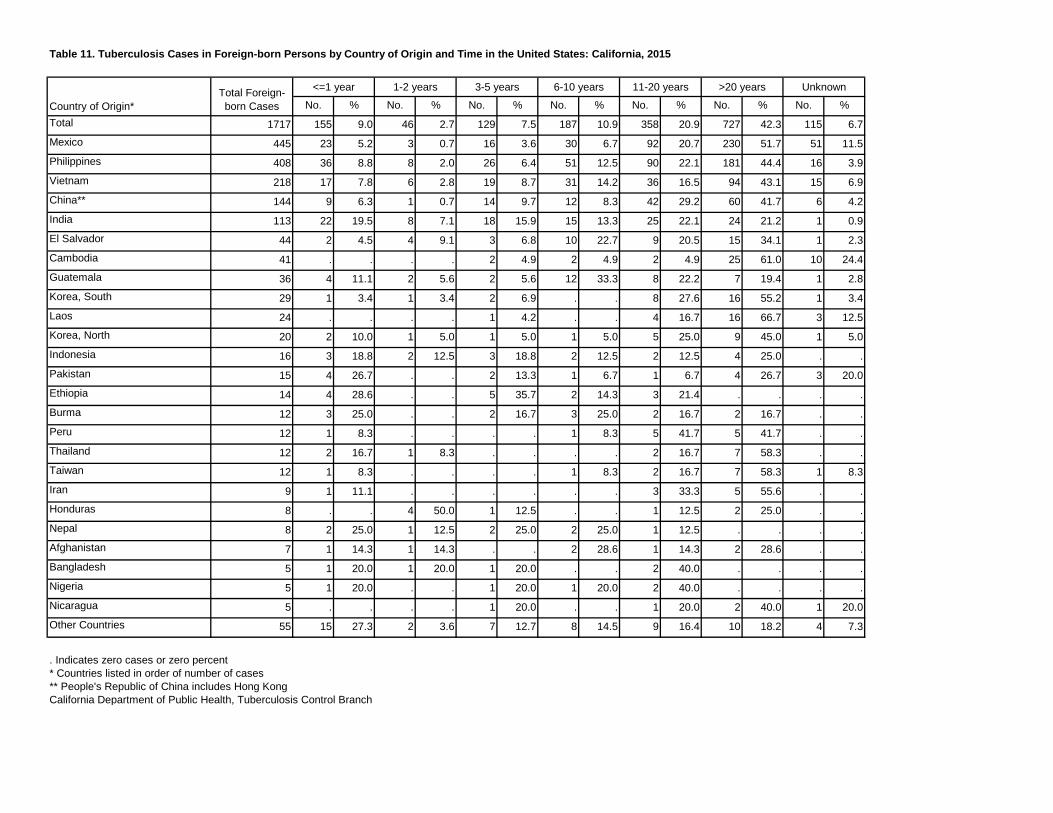
Table 11. Tuberculosis Cases in Foreign-born Persons by Country of Origin and Time in the United States: California, 2015
No. % No. % No. % No. % No. % No. % No. %Total 1717 155 9.0 46 2.7 129 7.5 187 10.9 358 20.9 727 42.3 115 6.7Mexico 445 23 5.2 3 0.7 16 3.6 30 6.7 92 20.7 230 51.7 51 11.5Philippines 408 36 8.8 8 2.0 26 6.4 51 12.5 90 22.1 181 44.4 16 3.9Vietnam 218 17 7.8 6 2.8 19 8.7 31 14.2 36 16.5 94 43.1 15 6.9China** 144 9 6.3 1 0.7 14 9.7 12 8.3 42 29.2 60 41.7 6 4.2India 113 22 19.5 8 7.1 18 15.9 15 13.3 25 22.1 24 21.2 1 0.9El Salvador 44 2 4.5 4 9.1 3 6.8 10 22.7 9 20.5 15 34.1 1 2.3Cambodia 41 . . . . 2 4.9 2 4.9 2 4.9 25 61.0 10 24.4Guatemala 36 4 11.1 2 5.6 2 5.6 12 33.3 8 22.2 7 19.4 1 2.8Korea, South 29 1 3.4 1 3.4 2 6.9 . . 8 27.6 16 55.2 1 3.4Laos 24 . . . . 1 4.2 . . 4 16.7 16 66.7 3 12.5Korea, North 20 2 10.0 1 5.0 1 5.0 1 5.0 5 25.0 9 45.0 1 5.0Indonesia 16 3 18.8 2 12.5 3 18.8 2 12.5 2 12.5 4 25.0 . .Pakistan 15 4 26.7 . . 2 13.3 1 6.7 1 6.7 4 26.7 3 20.0Ethiopia 14 4 28.6 . . 5 35.7 2 14.3 3 21.4 . . . .Burma 12 3 25.0 . . 2 16.7 3 25.0 2 16.7 2 16.7 . .Peru 12 1 8.3 . . . . 1 8.3 5 41.7 5 41.7 . .Thailand 12 2 16.7 1 8.3 . . . . 2 16.7 7 58.3 . .Taiwan 12 1 8.3 . . . . 1 8.3 2 16.7 7 58.3 1 8.3Iran 9 1 11.1 . . . . . . 3 33.3 5 55.6 . .Honduras 8 . . 4 50.0 1 12.5 . . 1 12.5 2 25.0 . .Nepal 8 2 25.0 1 12.5 2 25.0 2 25.0 1 12.5 . . . .Afghanistan 7 1 14.3 1 14.3 . . 2 28.6 1 14.3 2 28.6 . .Bangladesh 5 1 20.0 1 20.0 1 20.0 . . 2 40.0 . . . .Nigeria 5 1 20.0 . . 1 20.0 1 20.0 2 40.0 . . . .Nicaragua 5 . . . . 1 20.0 . . 1 20.0 2 40.0 1 20.0Other Countries 55 15 27.3 2 3.6 7 12.7 8 14.5 9 16.4 10 18.2 4 7.3
. Indicates zero cases or zero percent* Countries listed in order of number of cases** People's Republic of China includes Hong KongCalifornia Department of Public Health, Tuberculosis Control Branch
11-20 years >20 years Unknown
Country of Origin*Total Foreign-born Cases
<=1 year 1-2 years 3-5 years 6-10 years
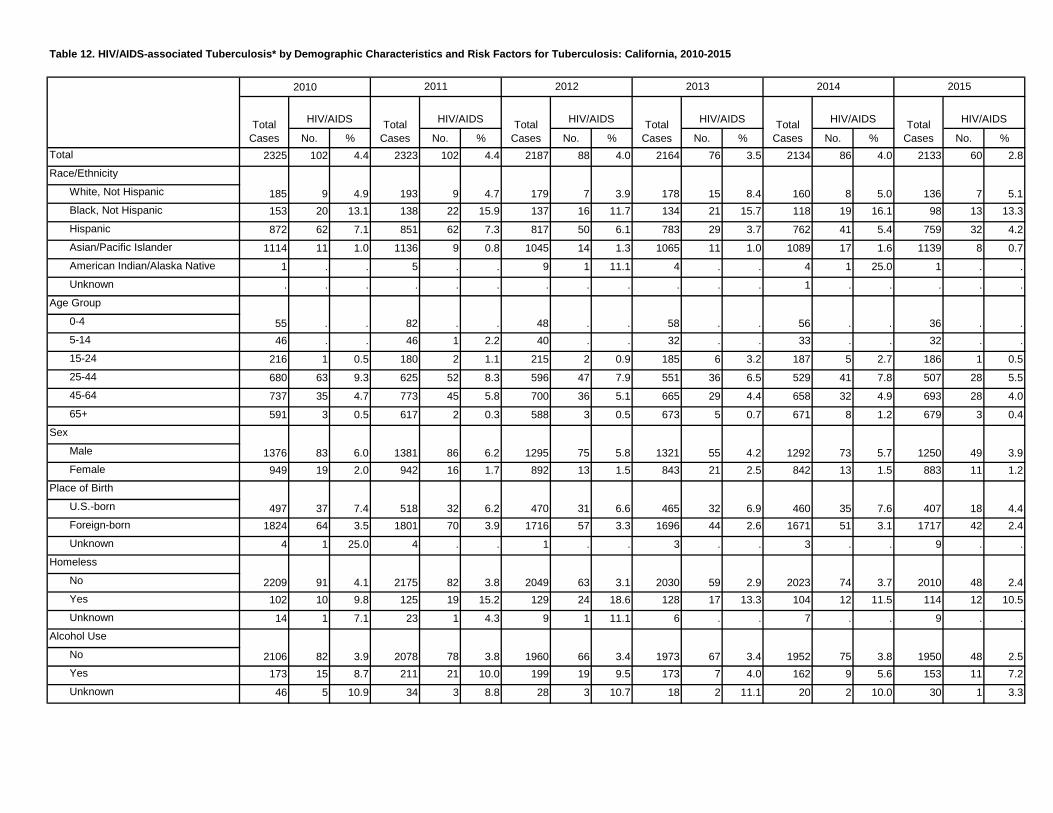
Table 12. HIV/AIDS-associated Tuberculosis* by Demographic Characteristics and Risk Factors for Tuberculosis: California, 2010-2015
No. % No. % No. % No. % No. % No. %Total 2325 102 4.4 2323 102 4.4 2187 88 4.0 2164 76 3.5 2134 86 4.0 2133 60 2.8Race/Ethnicity
White, Not Hispanic
Black, Not Hispanic 153 20 13.1 138 22 15.9 137 16 11.7 134 21 15.7 118 19 16.1 98 13 13.3Hispanic 872 62 7.1 851 62 7.3 817 50 6.1 783 29 3.7 762 41 5.4 759 32 4.2Asian/Pacific Islander 1114 11 1.0 1136 9 0.8 1045 14 1.3 1065 11 1.0 1089 17 1.6 1139 8 0.7American Indian/Alaska Native 1 . . 5 . . 9 1 11.1 4 . . 4 1 25.0 1 . .Unknown . . . . . . . . . . . . 1 . . . . .
Age Group
0-4
5-14 46 . . 46 1 2.2 40 . . 32 . . 33 . . 32 . .15-24 216 1 0.5 180 2 1.1 215 2 0.9 185 6 3.2 187 5 2.7 186 1 0.525-44 680 63 9.3 625 52 8.3 596 47 7.9 551 36 6.5 529 41 7.8 507 28 5.545-64 737 35 4.7 773 45 5.8 700 36 5.1 665 29 4.4 658 32 4.9 693 28 4.065+ 591 3 0.5 617 2 0.3 588 3 0.5 673 5 0.7 671 8 1.2 679 3 0.4
Sex
Male
Female 949 19 2.0 942 16 1.7 892 13 1.5 843 21 2.5 842 13 1.5 883 11 1.2Place of Birth
U.S.-born
Foreign-born 1824 64 3.5 1801 70 3.9 1716 57 3.3 1696 44 2.6 1671 51 3.1 1717 42 2.4Unknown 4 1 25.0 4 . . 1 . . 3 . . 3 . . 9 . .
Homeless
No
Yes 102 10 9.8 125 19 15.2 129 24 18.6 128 17 13.3 104 12 11.5 114 12 10.5Unknown 14 1 7.1 23 1 4.3 9 1 11.1 6 . . 7 . . 9 . .
Alcohol Use
No
Yes 173 15 8.7 211 21 10.0 199 19 9.5 173 7 4.0 162 9 5.6 153 11 7.2Unknown 46 5 10.9 34 3 8.8 28 3 10.7 18 2 11.1 20 2 10.0 30 1 3.3
1952 75 3.82106 82 3.9 2078 78 3.8 1950 48 2.51960 66 3.4 1973 67 3.4
2010 48 2.42049 63 3.1 2030 59 2.92209 91 4.1 2175 82 3.8
460 35 7.6497 37 7.4 518 32 6.2
2023 74 3.7
407 18 4.4470 31 6.6 465 32 6.9
1250 49 3.91295 75 5.8 1321 55 4.21376 83 6.0 1381 86 6.2
56 . .
1292 73 5.7
136 7 5.1
55 . . 82 . .
3.9 178 15 8.4 160 8
36 . .48 . . 58 . .
185 9 4.9 193 9 4.7 179 7 5.0
2010 2011 2012 2013 2014
HIV/AIDS
2015
Total Cases
HIV/AIDS Total Cases
HIV/AIDS Total Cases
HIV/AIDS Total Cases
HIV/AIDS Total Cases
Total Cases
HIV/AIDS
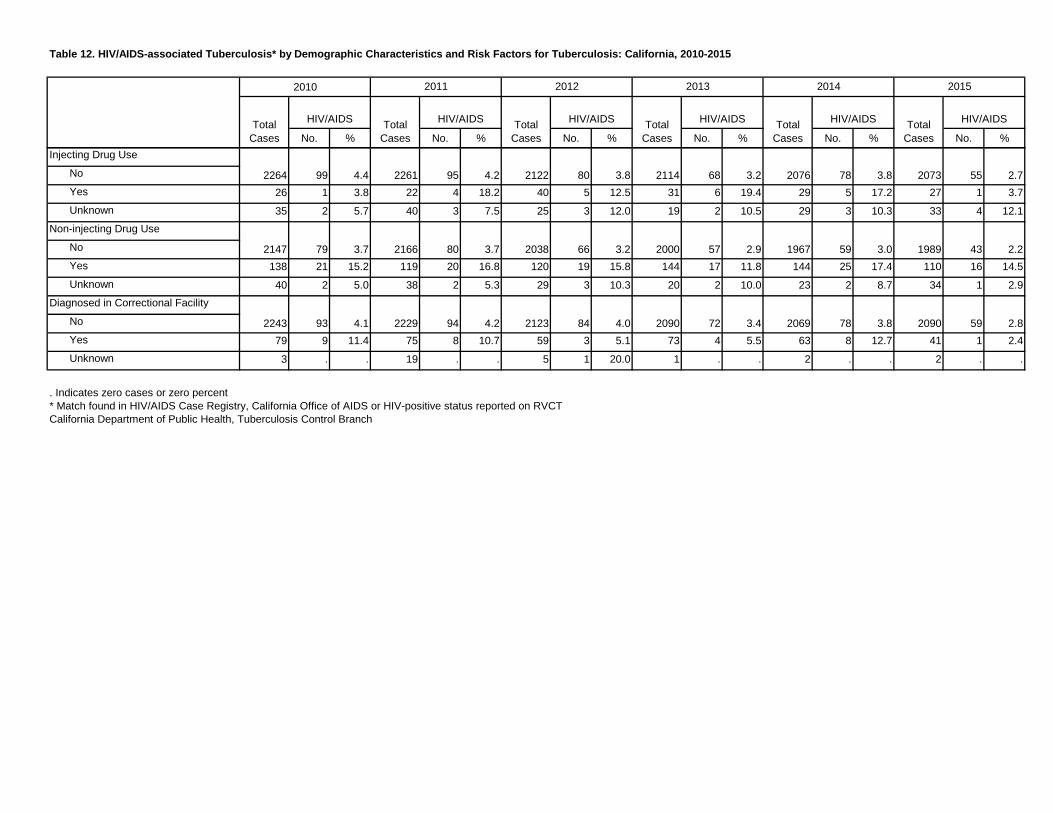
Table 12. HIV/AIDS-associated Tuberculosis* by Demographic Characteristics and Risk Factors for Tuberculosis: California, 2010-2015
No. % No. % No. % No. % No. % No. %
2010 2011 2012 2013 2014
HIV/AIDS
2015
Total Cases
HIV/AIDS Total Cases
HIV/AIDS Total Cases
HIV/AIDS Total Cases
HIV/AIDS Total Cases
Total Cases
HIV/AIDS
Injecting Drug Use
No
Yes 26 1 3.8 22 4 18.2 40 5 12.5 31 6 19.4 29 5 17.2 27 1 3.7Unknown 35 2 5.7 40 3 7.5 25 3 12.0 19 2 10.5 29 3 10.3 33 4 12.1
Non-injecting Drug Use
No
Yes 138 21 15.2 119 20 16.8 120 19 15.8 144 17 11.8 144 25 17.4 110 16 14.5Unknown 40 2 5.0 38 2 5.3 29 3 10.3 20 2 10.0 23 2 8.7 34 1 2.9
Diagnosed in Correctional Facility
No
Yes 79 9 11.4 75 8 10.7 59 3 5.1 73 4 5.5 63 8 12.7 41 1 2.4Unknown 3 . . 19 . . 5 1 20.0 1 . . 2 . . 2 . .
. Indicates zero cases or zero percent* Match found in HIV/AIDS Case Registry, California Office of AIDS or HIV-positive status reported on RVCTCalifornia Department of Public Health, Tuberculosis Control Branch
2090 59 2.82123 84 4.0 2090 72 3.42243 93 4.1 2229 94 4.2
1967 59 3.02147 79 3.7 2166 80 3.7
2069 78 3.8
1989 43 2.22038 66 3.2 2000 57 2.9
2073 55 2.72122 80 3.8 2114 68 3.22264 99 4.4 2261 95 4.2 2076 78 3.8
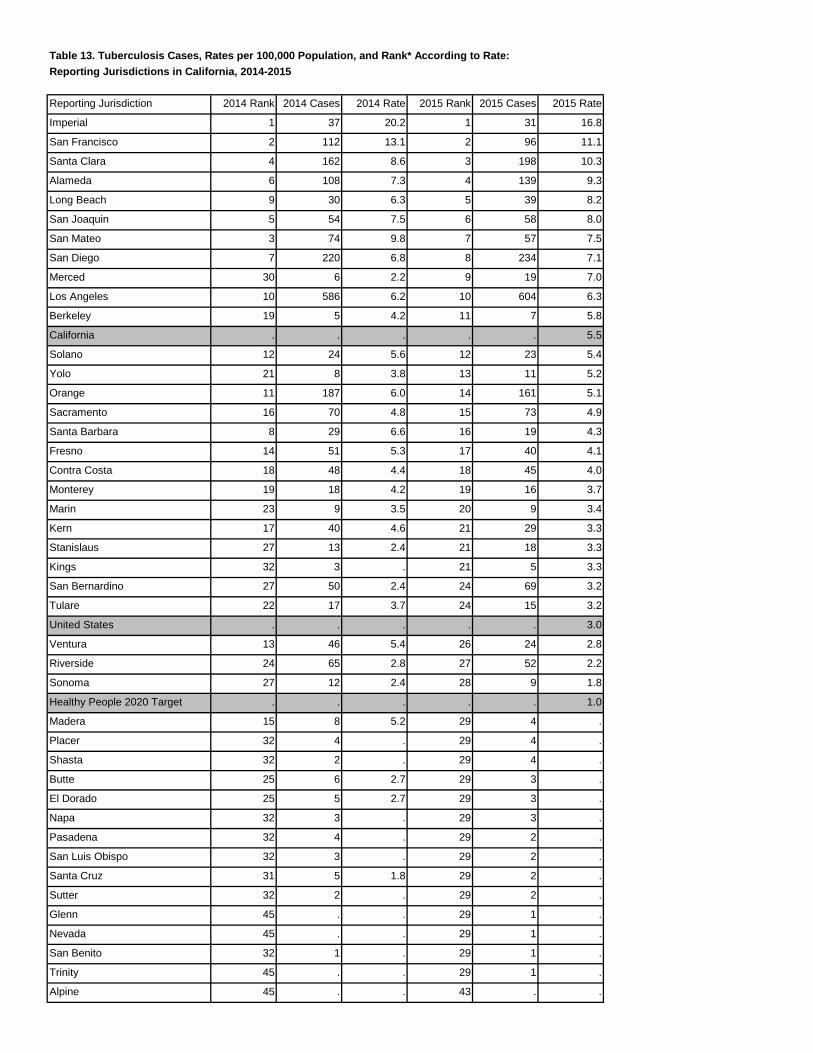
Table 13. Tuberculosis Cases, Rates per 100,000 Population, and Rank* According to Rate:Reporting Jurisdictions in California, 2014-2015
Reporting Jurisdiction 2014 Rank 2014 Cases 2014 Rate 2015 Rank 2015 Cases 2015 Rate
Imperial 1 37 20.2 1 31 16.8
San Francisco 2 112 13.1 2 96 11.1
Santa Clara 4 162 8.6 3 198 10.3
Alameda 6 108 7.3 4 139 9.3
Long Beach 9 30 6.3 5 39 8.2
San Joaquin 5 54 7.5 6 58 8.0
San Mateo 3 74 9.8 7 57 7.5
San Diego 7 220 6.8 8 234 7.1
Merced 30 6 2.2 9 19 7.0
Los Angeles 10 586 6.2 10 604 6.3
Berkeley 19 5 4.2 11 7 5.8
California . . . . . 5.5
Solano 12 24 5.6 12 23 5.4
Yolo 21 8 3.8 13 11 5.2
Orange 11 187 6.0 14 161 5.1
Sacramento 16 70 4.8 15 73 4.9
Santa Barbara 8 29 6.6 16 19 4.3
Fresno 14 51 5.3 17 40 4.1
Contra Costa 18 48 4.4 18 45 4.0
Monterey 19 18 4.2 19 16 3.7
Marin 23 9 3.5 20 9 3.4
Kern 17 40 4.6 21 29 3.3
Stanislaus 27 13 2.4 21 18 3.3
Kings 32 3 . 21 5 3.3
San Bernardino 27 50 2.4 24 69 3.2
Tulare 22 17 3.7 24 15 3.2
United States . . . . . 3.0
Ventura 13 46 5.4 26 24 2.8
Riverside 24 65 2.8 27 52 2.2
Sonoma 27 12 2.4 28 9 1.8
Healthy People 2020 Target . . . . . 1.0
Madera 15 8 5.2 29 4 .
Placer 32 4 . 29 4 .
Shasta 32 2 . 29 4 .
Butte 25 6 2.7 29 3 .
El Dorado 25 5 2.7 29 3 .
Napa 32 3 . 29 3 .
Pasadena 32 4 . 29 2 .
San Luis Obispo 32 3 . 29 2 .
Santa Cruz 31 5 1.8 29 2 .
Sutter 32 2 . 29 2 .
Glenn 45 . . 29 1 .
Nevada 45 . . 29 1 .
San Benito 32 1 . 29 1 .
Trinity 45 . . 29 1 .
Alpine 45 . . 43 . .
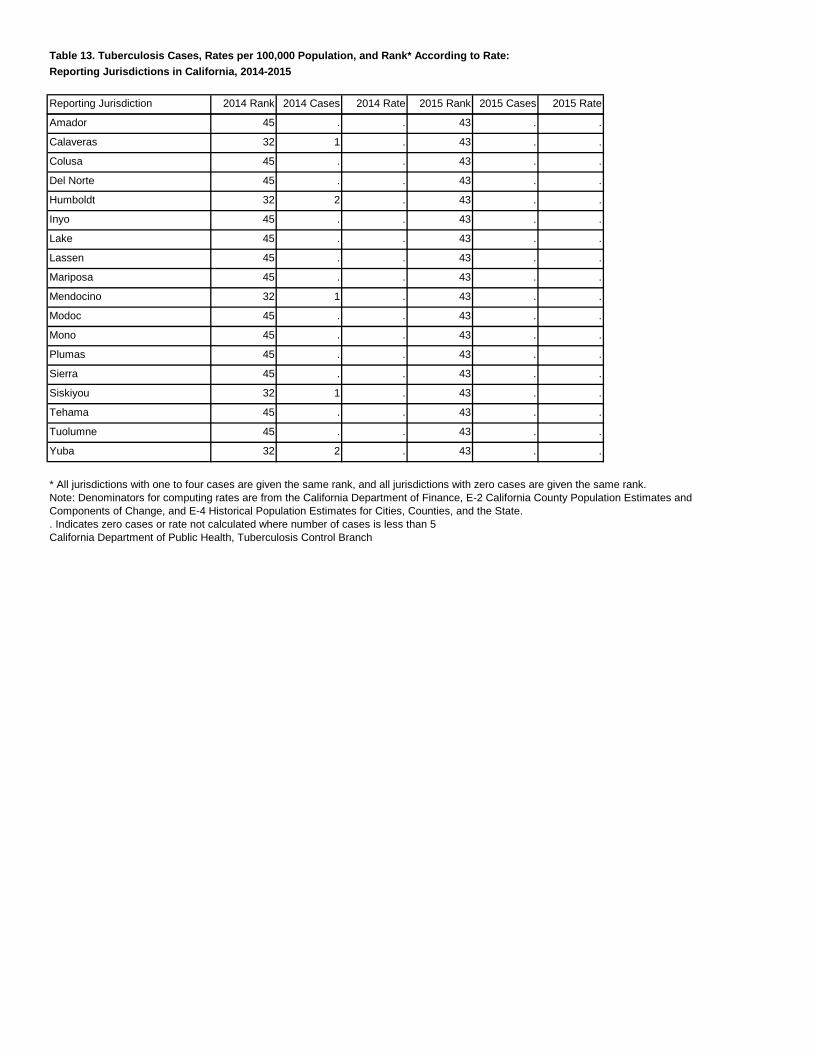
Table 13. Tuberculosis Cases, Rates per 100,000 Population, and Rank* According to Rate:Reporting Jurisdictions in California, 2014-2015
Reporting Jurisdiction 2014 Rank 2014 Cases 2014 Rate 2015 Rank 2015 Cases 2015 Rate
Amador 45 . . 43 . .
Calaveras 32 1 . 43 . .
Colusa 45 . . 43 . .
Del Norte 45 . . 43 . .
Humboldt 32 2 . 43 . .
Inyo 45 . . 43 . .
Lake 45 . . 43 . .
Lassen 45 . . 43 . .
Mariposa 45 . . 43 . .
Mendocino 32 1 . 43 . .
Modoc 45 . . 43 . .
Mono 45 . . 43 . .
Plumas 45 . . 43 . .
Sierra 45 . . 43 . .
Siskiyou 32 1 . 43 . .
Tehama 45 . . 43 . .
Tuolumne 45 . . 43 . .
Yuba 32 2 . 43 . .
* All jurisdictions with one to four cases are given the same rank, and all jurisdictions with zero cases are given the same rank.Note: Denominators for computing rates are from the California Department of Finance, E-2 California County Population Estimates andComponents of Change, and E-4 Historical Population Estimates for Cities, Counties, and the State.. Indicates zero cases or rate not calculated where number of cases is less than 5California Department of Public Health, Tuberculosis Control Branch
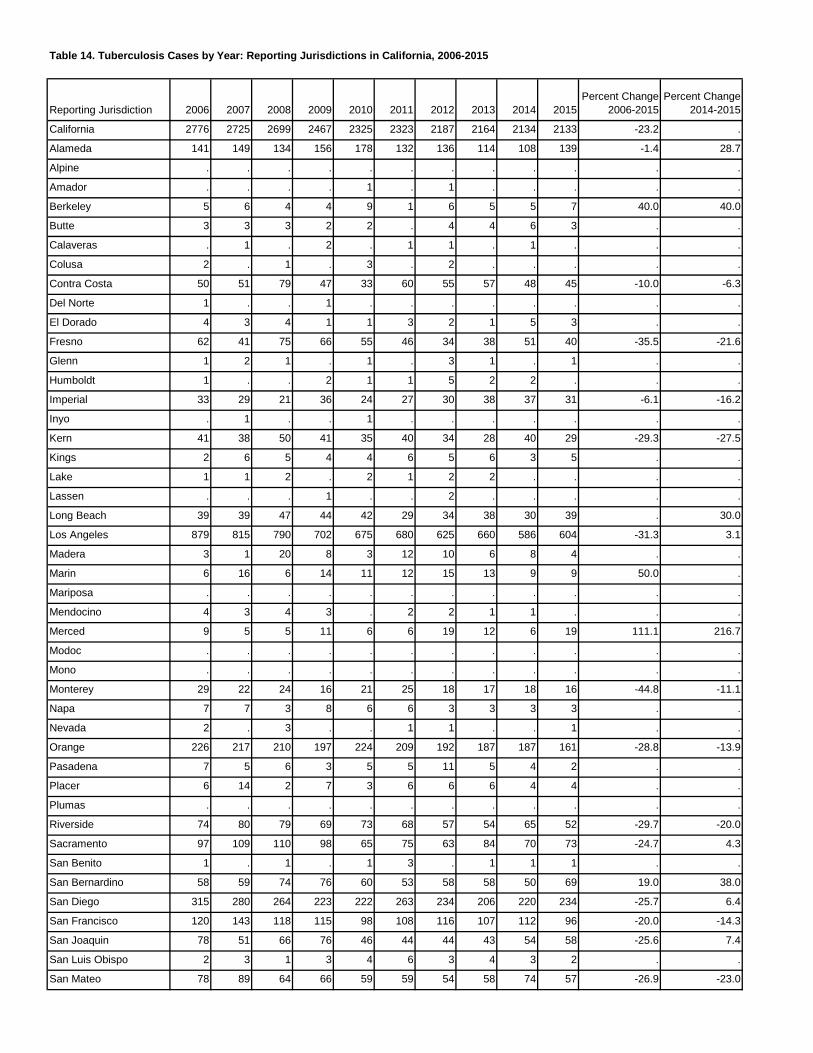
Table 14. Tuberculosis Cases by Year: Reporting Jurisdictions in California, 2006-2015
Reporting Jurisdiction 2006 2007 2008 2009 2010 2011 2012 2013 2014 2015Percent Change
2006-2015Percent Change
2014-2015
California 2776 2725 2699 2467 2325 2323 2187 2164 2134 2133 -23.2 .
Alameda 141 149 134 156 178 132 136 114 108 139 -1.4 28.7
Alpine . . . . . . . . . . . .
Amador . . . . 1 . 1 . . . . .
Berkeley 5 6 4 4 9 1 6 5 5 7 40.0 40.0
Butte 3 3 3 2 2 . 4 4 6 3 . .
Calaveras . 1 . 2 . 1 1 . 1 . . .
Colusa 2 . 1 . 3 . 2 . . . . .
Contra Costa 50 51 79 47 33 60 55 57 48 45 -10.0 -6.3
Del Norte 1 . . 1 . . . . . . . .
El Dorado 4 3 4 1 1 3 2 1 5 3 . .
Fresno 62 41 75 66 55 46 34 38 51 40 -35.5 -21.6
Glenn 1 2 1 . 1 . 3 1 . 1 . .
Humboldt 1 . . 2 1 1 5 2 2 . . .
Imperial 33 29 21 36 24 27 30 38 37 31 -6.1 -16.2
Inyo . 1 . . 1 . . . . . . .
Kern 41 38 50 41 35 40 34 28 40 29 -29.3 -27.5
Kings 2 6 5 4 4 6 5 6 3 5 . .
Lake 1 1 2 . 2 1 2 2 . . . .
Lassen . . . 1 . . 2 . . . . .
Long Beach 39 39 47 44 42 29 34 38 30 39 . 30.0
Los Angeles 879 815 790 702 675 680 625 660 586 604 -31.3 3.1
Madera 3 1 20 8 3 12 10 6 8 4 . .
Marin 6 16 6 14 11 12 15 13 9 9 50.0 .
Mariposa . . . . . . . . . . . .
Mendocino 4 3 4 3 . 2 2 1 1 . . .
Merced 9 5 5 11 6 6 19 12 6 19 111.1 216.7
Modoc . . . . . . . . . . . .
Mono . . . . . . . . . . . .
Monterey 29 22 24 16 21 25 18 17 18 16 -44.8 -11.1
Napa 7 7 3 8 6 6 3 3 3 3 . .
Nevada 2 . 3 . . 1 1 . . 1 . .
Orange 226 217 210 197 224 209 192 187 187 161 -28.8 -13.9
Pasadena 7 5 6 3 5 5 11 5 4 2 . .
Placer 6 14 2 7 3 6 6 6 4 4 . .
Plumas . . . . . . . . . . . .
Riverside 74 80 79 69 73 68 57 54 65 52 -29.7 -20.0
Sacramento 97 109 110 98 65 75 63 84 70 73 -24.7 4.3
San Benito 1 . 1 . 1 3 . 1 1 1 . .
San Bernardino 58 59 74 76 60 53 58 58 50 69 19.0 38.0
San Diego 315 280 264 223 222 263 234 206 220 234 -25.7 6.4
San Francisco 120 143 118 115 98 108 116 107 112 96 -20.0 -14.3
San Joaquin 78 51 66 76 46 44 44 43 54 58 -25.6 7.4
San Luis Obispo 2 3 1 3 4 6 3 4 3 2 . .
San Mateo 78 89 64 66 59 59 54 58 74 57 -26.9 -23.0
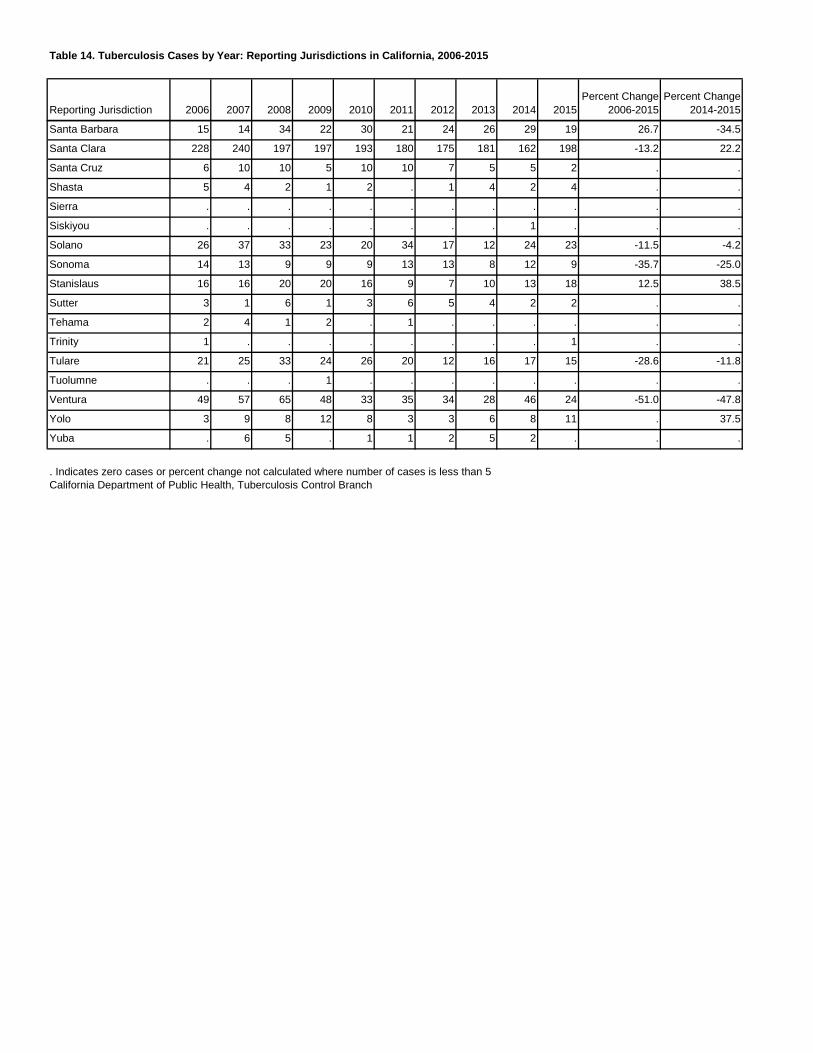
Table 14. Tuberculosis Cases by Year: Reporting Jurisdictions in California, 2006-2015
Reporting Jurisdiction 2006 2007 2008 2009 2010 2011 2012 2013 2014 2015Percent Change
2006-2015Percent Change
2014-2015
Santa Barbara 15 14 34 22 30 21 24 26 29 19 26.7 -34.5
Santa Clara 228 240 197 197 193 180 175 181 162 198 -13.2 22.2
Santa Cruz 6 10 10 5 10 10 7 5 5 2 . .
Shasta 5 4 2 1 2 . 1 4 2 4 . .
Sierra . . . . . . . . . . . .
Siskiyou . . . . . . . . 1 . . .
Solano 26 37 33 23 20 34 17 12 24 23 -11.5 -4.2
Sonoma 14 13 9 9 9 13 13 8 12 9 -35.7 -25.0
Stanislaus 16 16 20 20 16 9 7 10 13 18 12.5 38.5
Sutter 3 1 6 1 3 6 5 4 2 2 . .
Tehama 2 4 1 2 . 1 . . . . . .
Trinity 1 . . . . . . . . 1 . .
Tulare 21 25 33 24 26 20 12 16 17 15 -28.6 -11.8
Tuolumne . . . 1 . . . . . . . .
Ventura 49 57 65 48 33 35 34 28 46 24 -51.0 -47.8
Yolo 3 9 8 12 8 3 3 6 8 11 . 37.5
Yuba . 6 5 . 1 1 2 5 2 . . .
. Indicates zero cases or percent change not calculated where number of cases is less than 5California Department of Public Health, Tuberculosis Control Branch
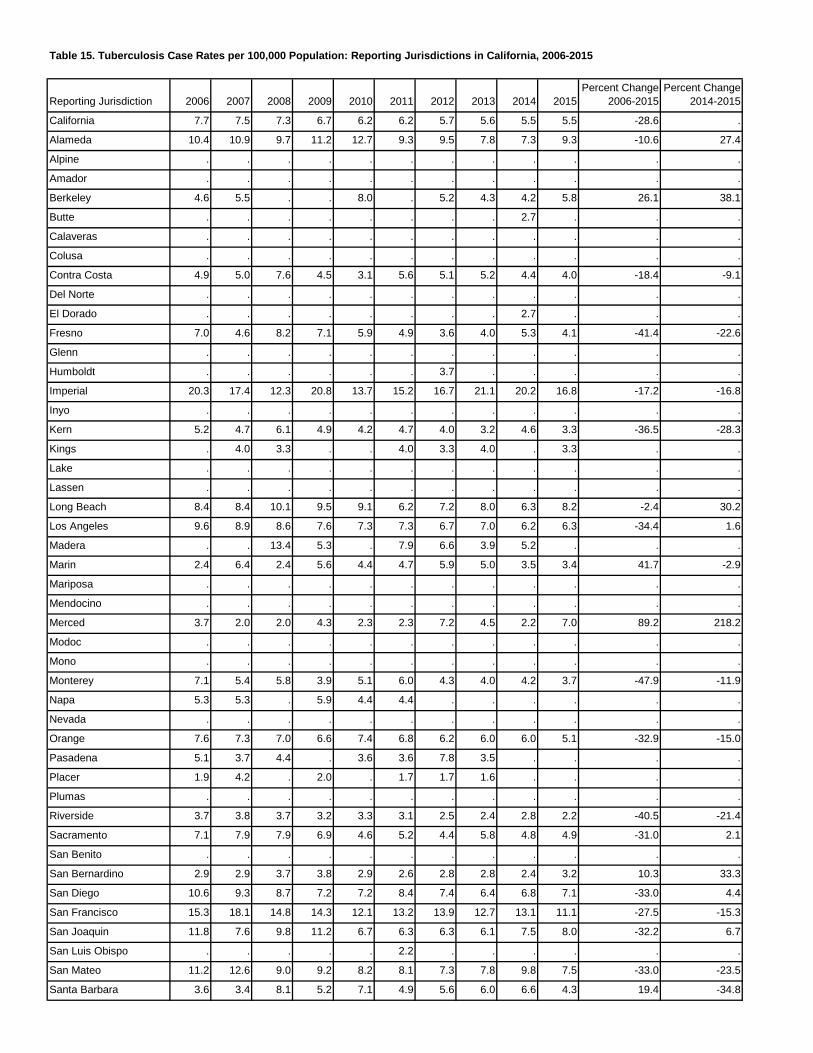
Table 15. Tuberculosis Case Rates per 100,000 Population: Reporting Jurisdictions in California, 2006-2015
Reporting Jurisdiction 2006 2007 2008 2009 2010 2011 2012 2013 2014 2015Percent Change
2006-2015Percent Change
2014-2015
California 7.7 7.5 7.3 6.7 6.2 6.2 5.7 5.6 5.5 5.5 -28.6 .
Alameda 10.4 10.9 9.7 11.2 12.7 9.3 9.5 7.8 7.3 9.3 -10.6 27.4
Alpine . . . . . . . . . . . .
Amador . . . . . . . . . . . .
Berkeley 4.6 5.5 . . 8.0 . 5.2 4.3 4.2 5.8 26.1 38.1
Butte . . . . . . . . 2.7 . . .
Calaveras . . . . . . . . . . . .
Colusa . . . . . . . . . . . .
Contra Costa 4.9 5.0 7.6 4.5 3.1 5.6 5.1 5.2 4.4 4.0 -18.4 -9.1
Del Norte . . . . . . . . . . . .
El Dorado . . . . . . . . 2.7 . . .
Fresno 7.0 4.6 8.2 7.1 5.9 4.9 3.6 4.0 5.3 4.1 -41.4 -22.6
Glenn . . . . . . . . . . . .
Humboldt . . . . . . 3.7 . . . . .
Imperial 20.3 17.4 12.3 20.8 13.7 15.2 16.7 21.1 20.2 16.8 -17.2 -16.8
Inyo . . . . . . . . . . . .
Kern 5.2 4.7 6.1 4.9 4.2 4.7 4.0 3.2 4.6 3.3 -36.5 -28.3
Kings . 4.0 3.3 . . 4.0 3.3 4.0 . 3.3 . .
Lake . . . . . . . . . . . .
Lassen . . . . . . . . . . . .
Long Beach 8.4 8.4 10.1 9.5 9.1 6.2 7.2 8.0 6.3 8.2 -2.4 30.2
Los Angeles 9.6 8.9 8.6 7.6 7.3 7.3 6.7 7.0 6.2 6.3 -34.4 1.6
Madera . . 13.4 5.3 . 7.9 6.6 3.9 5.2 . . .
Marin 2.4 6.4 2.4 5.6 4.4 4.7 5.9 5.0 3.5 3.4 41.7 -2.9
Mariposa . . . . . . . . . . . .
Mendocino . . . . . . . . . . . .
Merced 3.7 2.0 2.0 4.3 2.3 2.3 7.2 4.5 2.2 7.0 89.2 218.2
Modoc . . . . . . . . . . . .
Mono . . . . . . . . . . . .
Monterey 7.1 5.4 5.8 3.9 5.1 6.0 4.3 4.0 4.2 3.7 -47.9 -11.9
Napa 5.3 5.3 . 5.9 4.4 4.4 . . . . . .
Nevada . . . . . . . . . . . .
Orange 7.6 7.3 7.0 6.6 7.4 6.8 6.2 6.0 6.0 5.1 -32.9 -15.0
Pasadena 5.1 3.7 4.4 . 3.6 3.6 7.8 3.5 . . . .
Placer 1.9 4.2 . 2.0 . 1.7 1.7 1.6 . . . .
Plumas . . . . . . . . . . . .
Riverside 3.7 3.8 3.7 3.2 3.3 3.1 2.5 2.4 2.8 2.2 -40.5 -21.4
Sacramento 7.1 7.9 7.9 6.9 4.6 5.2 4.4 5.8 4.8 4.9 -31.0 2.1
San Benito . . . . . . . . . . . .
San Bernardino 2.9 2.9 3.7 3.8 2.9 2.6 2.8 2.8 2.4 3.2 10.3 33.3
San Diego 10.6 9.3 8.7 7.2 7.2 8.4 7.4 6.4 6.8 7.1 -33.0 4.4
San Francisco 15.3 18.1 14.8 14.3 12.1 13.2 13.9 12.7 13.1 11.1 -27.5 -15.3
San Joaquin 11.8 7.6 9.8 11.2 6.7 6.3 6.3 6.1 7.5 8.0 -32.2 6.7
San Luis Obispo . . . . . 2.2 . . . . . .
San Mateo 11.2 12.6 9.0 9.2 8.2 8.1 7.3 7.8 9.8 7.5 -33.0 -23.5
Santa Barbara 3.6 3.4 8.1 5.2 7.1 4.9 5.6 6.0 6.6 4.3 19.4 -34.8
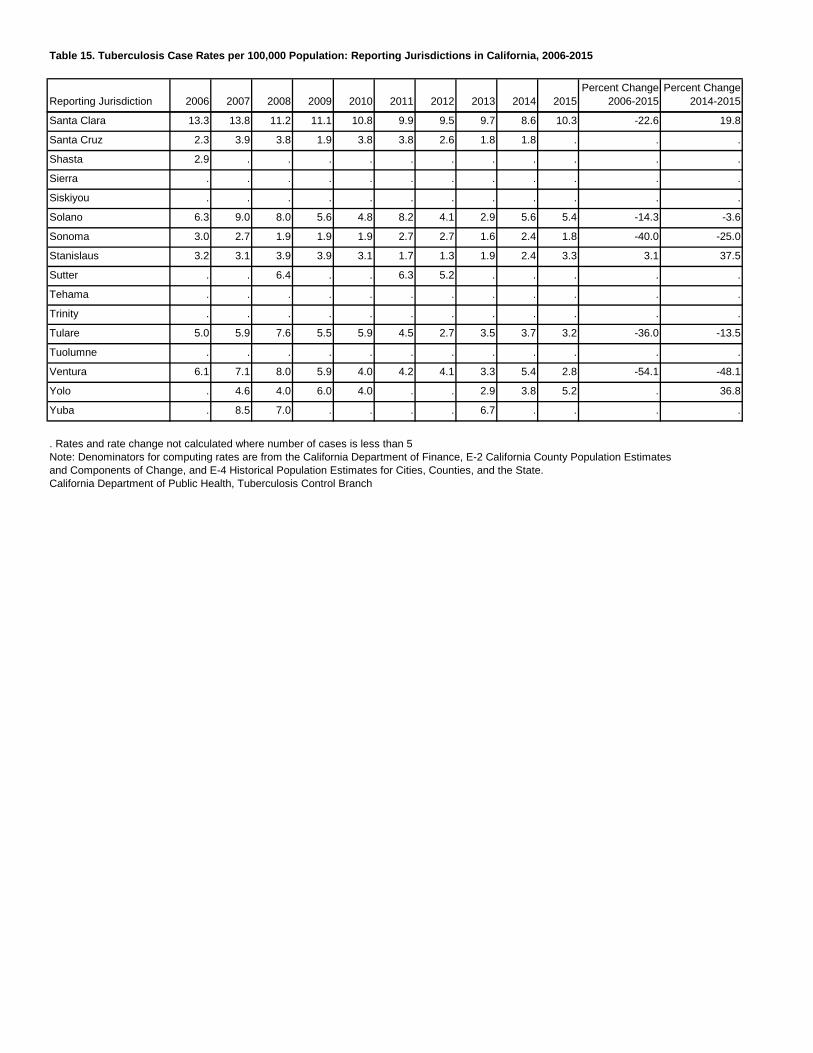
Table 15. Tuberculosis Case Rates per 100,000 Population: Reporting Jurisdictions in California, 2006-2015
Reporting Jurisdiction 2006 2007 2008 2009 2010 2011 2012 2013 2014 2015Percent Change
2006-2015Percent Change
2014-2015
Santa Clara 13.3 13.8 11.2 11.1 10.8 9.9 9.5 9.7 8.6 10.3 -22.6 19.8
Santa Cruz 2.3 3.9 3.8 1.9 3.8 3.8 2.6 1.8 1.8 . . .
Shasta 2.9 . . . . . . . . . . .
Sierra . . . . . . . . . . . .
Siskiyou . . . . . . . . . . . .
Solano 6.3 9.0 8.0 5.6 4.8 8.2 4.1 2.9 5.6 5.4 -14.3 -3.6
Sonoma 3.0 2.7 1.9 1.9 1.9 2.7 2.7 1.6 2.4 1.8 -40.0 -25.0
Stanislaus 3.2 3.1 3.9 3.9 3.1 1.7 1.3 1.9 2.4 3.3 3.1 37.5
Sutter . . 6.4 . . 6.3 5.2 . . . . .
Tehama . . . . . . . . . . . .
Trinity . . . . . . . . . . . .
Tulare 5.0 5.9 7.6 5.5 5.9 4.5 2.7 3.5 3.7 3.2 -36.0 -13.5
Tuolumne . . . . . . . . . . . .
Ventura 6.1 7.1 8.0 5.9 4.0 4.2 4.1 3.3 5.4 2.8 -54.1 -48.1
Yolo . 4.6 4.0 6.0 4.0 . . 2.9 3.8 5.2 . 36.8
Yuba . 8.5 7.0 . . . . 6.7 . . . .
. Rates and rate change not calculated where number of cases is less than 5Note: Denominators for computing rates are from the California Department of Finance, E-2 California County Population Estimatesand Components of Change, and E-4 Historical Population Estimates for Cities, Counties, and the State.California Department of Public Health, Tuberculosis Control Branch
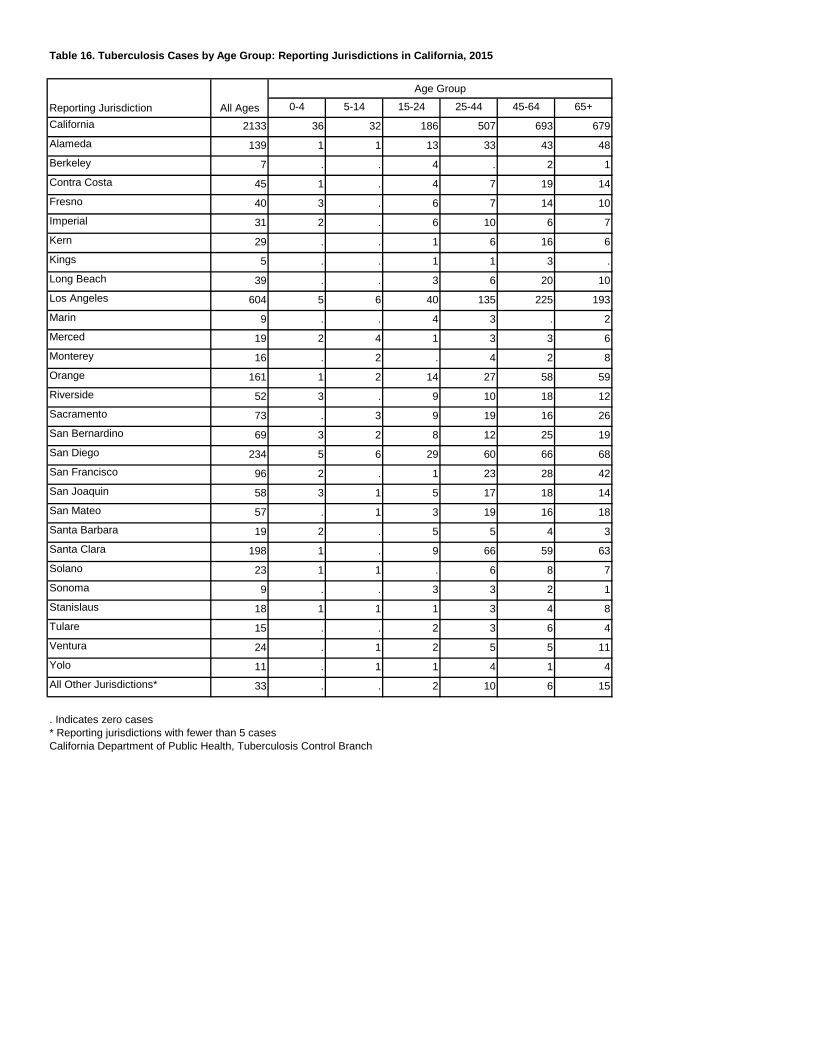
Table 16. Tuberculosis Cases by Age Group: Reporting Jurisdictions in California, 2015
0-4 5-14 15-24 25-44 45-64 65+California 2133 36 32 186 507 693 679Alameda 139 1 1 13 33 43 48Berkeley 7 . . 4 . 2 1Contra Costa 45 1 . 4 7 19 14Fresno 40 3 . 6 7 14 10Imperial 31 2 . 6 10 6 7Kern 29 . . 1 6 16 6Kings 5 . . 1 1 3 .Long Beach 39 . . 3 6 20 10Los Angeles 604 5 6 40 135 225 193Marin 9 . . 4 3 . 2Merced 19 2 4 1 3 3 6Monterey 16 . 2 . 4 2 8Orange 161 1 2 14 27 58 59Riverside 52 3 . 9 10 18 12Sacramento 73 . 3 9 19 16 26San Bernardino 69 3 2 8 12 25 19San Diego 234 5 6 29 60 66 68San Francisco 96 2 . 1 23 28 42San Joaquin 58 3 1 5 17 18 14San Mateo 57 . 1 3 19 16 18Santa Barbara 19 2 . 5 5 4 3Santa Clara 198 1 . 9 66 59 63Solano 23 1 1 . 6 8 7Sonoma 9 . . 3 3 2 1Stanislaus 18 1 1 1 3 4 8Tulare 15 . . 2 3 6 4Ventura 24 . 1 2 5 5 11Yolo 11 . 1 1 4 1 4All Other Jurisdictions* 33 . . 2 10 6 15
. Indicates zero cases* Reporting jurisdictions with fewer than 5 casesCalifornia Department of Public Health, Tuberculosis Control Branch
Reporting Jurisdiction All Ages
Age Group
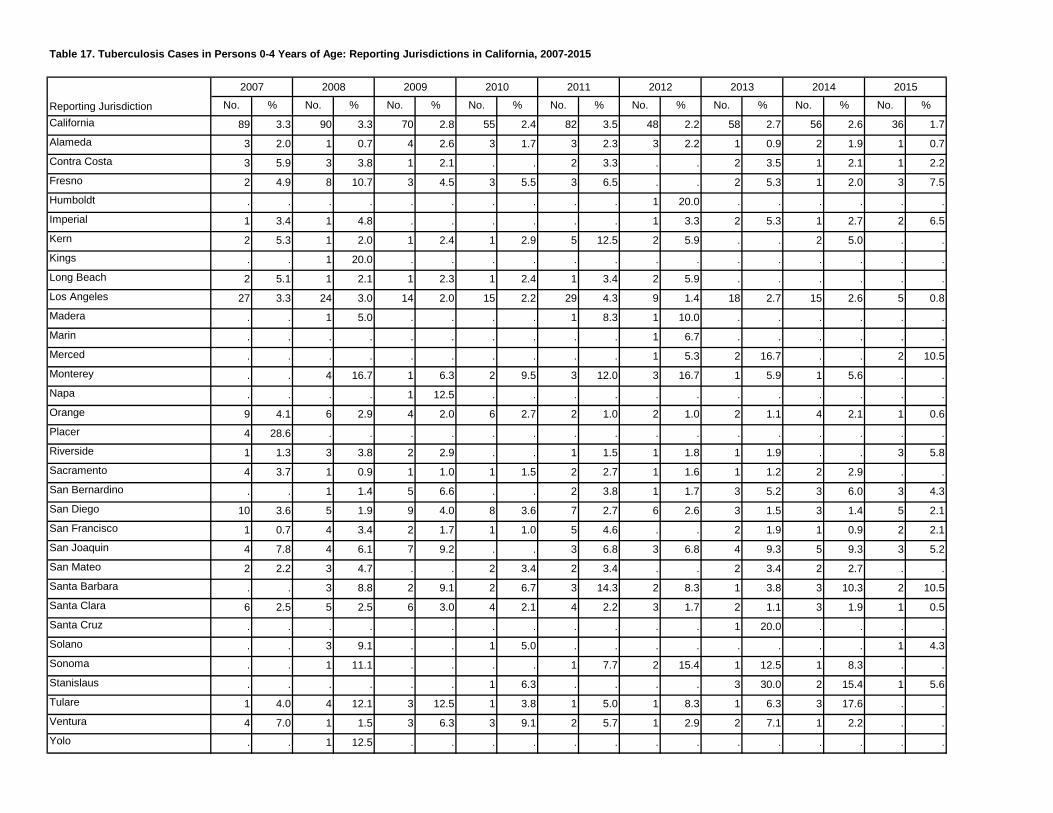
Table 17. Tuberculosis Cases in Persons 0-4 Years of Age: Reporting Jurisdictions in California, 2007-2015
No. % No. % No. % No. % No. % No. % No. % No. % No. %California 89 3.3 90 3.3 70 2.8 55 2.4 82 3.5 48 2.2 58 2.7 56 2.6 36 1.7Alameda 3 2.0 1 0.7 4 2.6 3 1.7 3 2.3 3 2.2 1 0.9 2 1.9 1 0.7Contra Costa 3 5.9 3 3.8 1 2.1 . . 2 3.3 . . 2 3.5 1 2.1 1 2.2Fresno 2 4.9 8 10.7 3 4.5 3 5.5 3 6.5 . . 2 5.3 1 2.0 3 7.5Humboldt . . . . . . . . . . 1 20.0 . . . . . .Imperial 1 3.4 1 4.8 . . . . . . 1 3.3 2 5.3 1 2.7 2 6.5Kern 2 5.3 1 2.0 1 2.4 1 2.9 5 12.5 2 5.9 . . 2 5.0 . .Kings . . 1 20.0 . . . . . . . . . . . . . .Long Beach 2 5.1 1 2.1 1 2.3 1 2.4 1 3.4 2 5.9 . . . . . .Los Angeles 27 3.3 24 3.0 14 2.0 15 2.2 29 4.3 9 1.4 18 2.7 15 2.6 5 0.8Madera . . 1 5.0 . . . . 1 8.3 1 10.0 . . . . . .Marin . . . . . . . . . . 1 6.7 . . . . . .Merced . . . . . . . . . . 1 5.3 2 16.7 . . 2 10.5Monterey . . 4 16.7 1 6.3 2 9.5 3 12.0 3 16.7 1 5.9 1 5.6 . .Napa . . . . 1 12.5 . . . . . . . . . . . .Orange 9 4.1 6 2.9 4 2.0 6 2.7 2 1.0 2 1.0 2 1.1 4 2.1 1 0.6Placer 4 28.6 . . . . . . . . . . . . . . . .Riverside 1 1.3 3 3.8 2 2.9 . . 1 1.5 1 1.8 1 1.9 . . 3 5.8Sacramento 4 3.7 1 0.9 1 1.0 1 1.5 2 2.7 1 1.6 1 1.2 2 2.9 . .San Bernardino . . 1 1.4 5 6.6 . . 2 3.8 1 1.7 3 5.2 3 6.0 3 4.3San Diego 10 3.6 5 1.9 9 4.0 8 3.6 7 2.7 6 2.6 3 1.5 3 1.4 5 2.1San Francisco 1 0.7 4 3.4 2 1.7 1 1.0 5 4.6 . . 2 1.9 1 0.9 2 2.1San Joaquin 4 7.8 4 6.1 7 9.2 . . 3 6.8 3 6.8 4 9.3 5 9.3 3 5.2San Mateo 2 2.2 3 4.7 . . 2 3.4 2 3.4 . . 2 3.4 2 2.7 . .Santa Barbara . . 3 8.8 2 9.1 2 6.7 3 14.3 2 8.3 1 3.8 3 10.3 2 10.5Santa Clara 6 2.5 5 2.5 6 3.0 4 2.1 4 2.2 3 1.7 2 1.1 3 1.9 1 0.5Santa Cruz . . . . . . . . . . . . 1 20.0 . . . .Solano . . 3 9.1 . . 1 5.0 . . . . . . . . 1 4.3Sonoma . . 1 11.1 . . . . 1 7.7 2 15.4 1 12.5 1 8.3 . .Stanislaus . . . . . . 1 6.3 . . . . 3 30.0 2 15.4 1 5.6Tulare 1 4.0 4 12.1 3 12.5 1 3.8 1 5.0 1 8.3 1 6.3 3 17.6 . .Ventura 4 7.0 1 1.5 3 6.3 3 9.1 2 5.7 1 2.9 2 7.1 1 2.2 . .Yolo . . 1 12.5 . . . . . . . . . . . . . .
2012 2013 2014 2015
Reporting Jurisdiction
2007 2008 2009 2010 2011
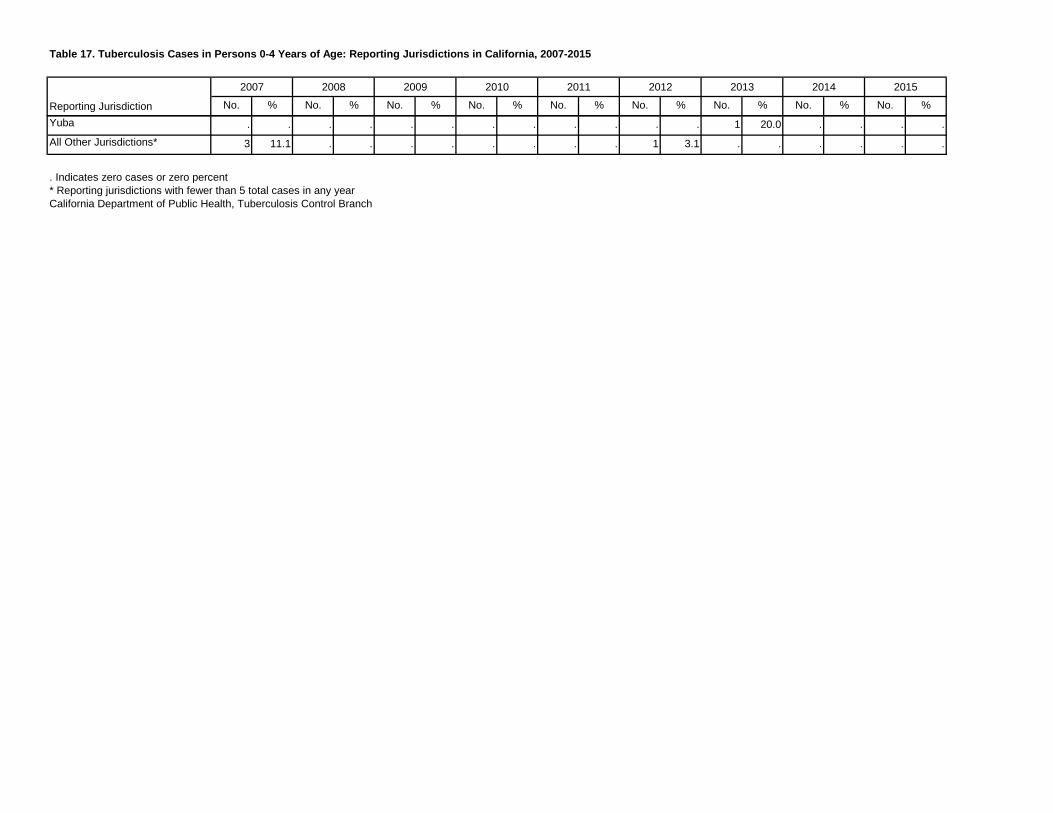
Table 17. Tuberculosis Cases in Persons 0-4 Years of Age: Reporting Jurisdictions in California, 2007-2015
No. % No. % No. % No. % No. % No. % No. % No. % No. %
2012 2013 2014 2015
Reporting Jurisdiction
2007 2008 2009 2010 2011
Yuba . . . . . . . . . . . . 1 20.0 . . . .All Other Jurisdictions* 3 11.1 . . . . . . . . 1 3.1 . . . . . .
. Indicates zero cases or zero percent* Reporting jurisdictions with fewer than 5 total cases in any yearCalifornia Department of Public Health, Tuberculosis Control Branch
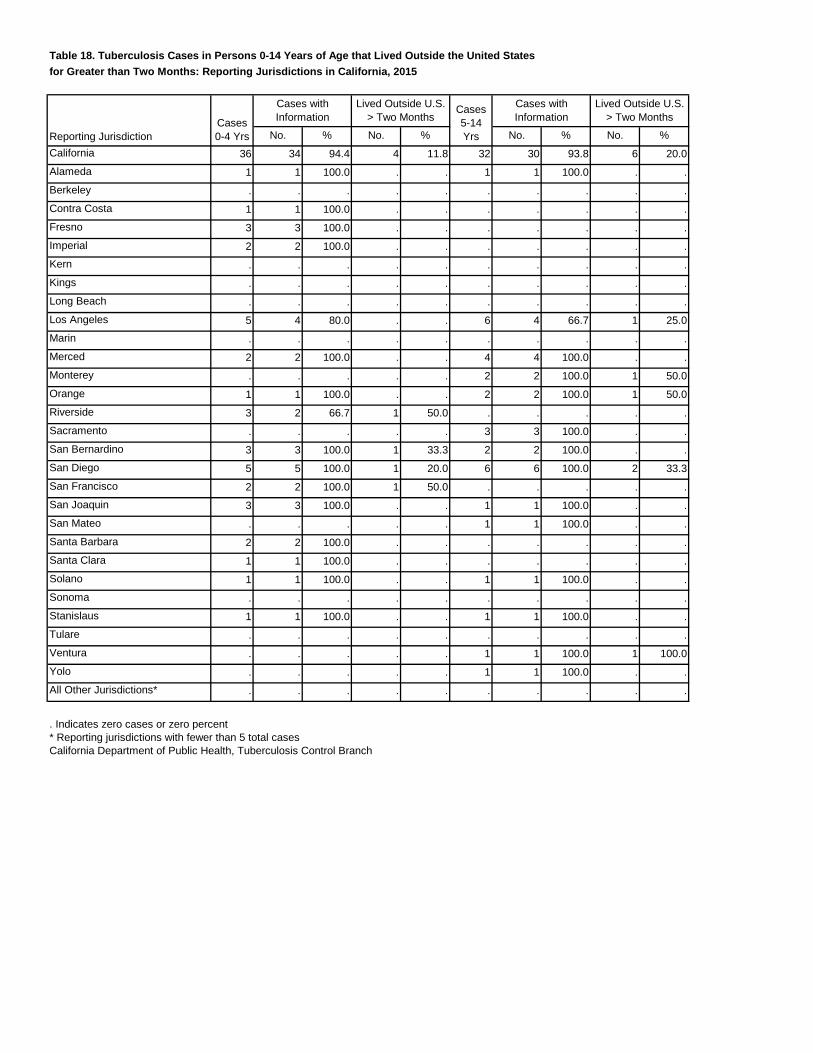
Table 18. Tuberculosis Cases in Persons 0-14 Years of Age that Lived Outside the United Statesfor Greater than Two Months: Reporting Jurisdictions in California, 2015
No. % No. % No. % No. %California 36 34 94.4 4 11.8 32 30 93.8 6 20.0Alameda 1 1 100.0 . . 1 1 100.0 . .Berkeley . . . . . . . . . .Contra Costa 1 1 100.0 . . . . . . .Fresno 3 3 100.0 . . . . . . .Imperial 2 2 100.0 . . . . . . .Kern . . . . . . . . . .Kings . . . . . . . . . .Long Beach . . . . . . . . . .Los Angeles 5 4 80.0 . . 6 4 66.7 1 25.0Marin . . . . . . . . . .Merced 2 2 100.0 . . 4 4 100.0 . .Monterey . . . . . 2 2 100.0 1 50.0Orange 1 1 100.0 . . 2 2 100.0 1 50.0Riverside 3 2 66.7 1 50.0 . . . . .Sacramento . . . . . 3 3 100.0 . .San Bernardino 3 3 100.0 1 33.3 2 2 100.0 . .San Diego 5 5 100.0 1 20.0 6 6 100.0 2 33.3San Francisco 2 2 100.0 1 50.0 . . . . .San Joaquin 3 3 100.0 . . 1 1 100.0 . .San Mateo . . . . . 1 1 100.0 . .Santa Barbara 2 2 100.0 . . . . . . .Santa Clara 1 1 100.0 . . . . . . .Solano 1 1 100.0 . . 1 1 100.0 . .Sonoma . . . . . . . . . .Stanislaus 1 1 100.0 . . 1 1 100.0 . .Tulare . . . . . . . . . .Ventura . . . . . 1 1 100.0 1 100.0Yolo . . . . . 1 1 100.0 . .All Other Jurisdictions* . . . . . . . . . .
. Indicates zero cases or zero percent* Reporting jurisdictions with fewer than 5 total casesCalifornia Department of Public Health, Tuberculosis Control Branch
Lived Outside U.S. > Two Months
Reporting JurisdictionCases 0-4 Yrs
Cases with Information
Lived Outside U.S. > Two Months
Cases 5-14 Yrs
Cases with Information
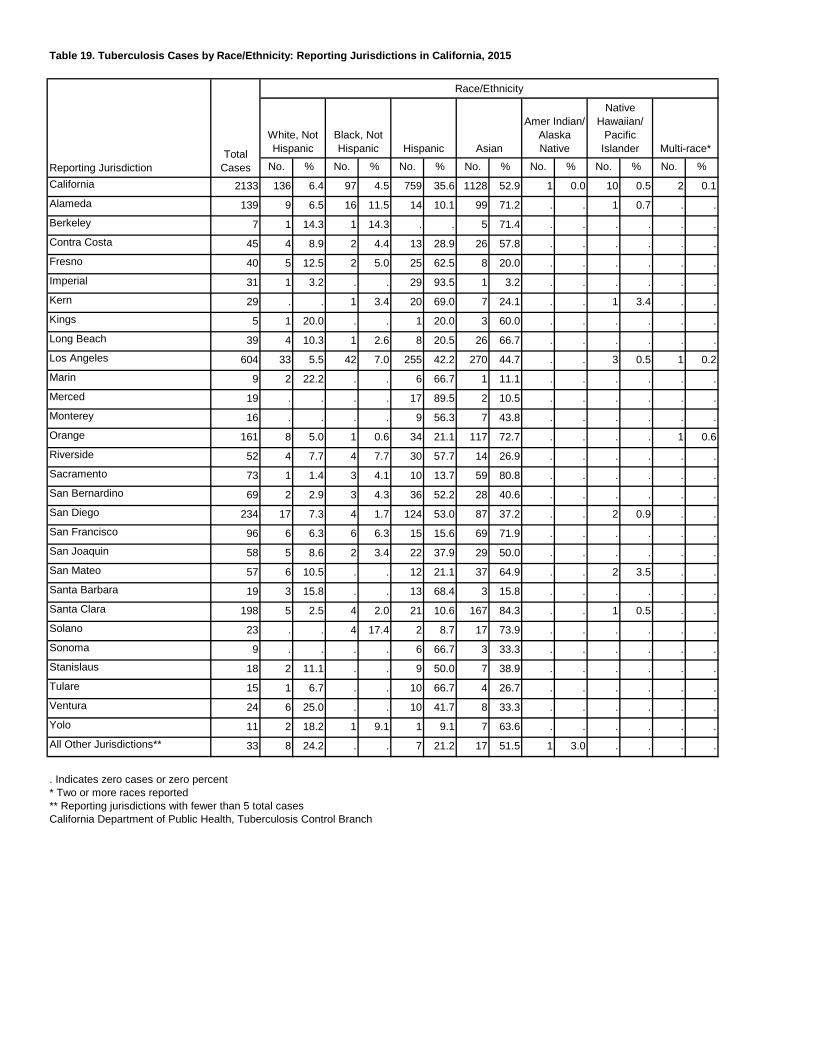
Table 19. Tuberculosis Cases by Race/Ethnicity: Reporting Jurisdictions in California, 2015
No. % No. % No. % No. % No. % No. % No. %California 2133 136 6.4 97 4.5 759 35.6 1128 52.9 1 0.0 10 0.5 2 0.1Alameda 139 9 6.5 16 11.5 14 10.1 99 71.2 . . 1 0.7 . .Berkeley 7 1 14.3 1 14.3 . . 5 71.4 . . . . . .Contra Costa 45 4 8.9 2 4.4 13 28.9 26 57.8 . . . . . .Fresno 40 5 12.5 2 5.0 25 62.5 8 20.0 . . . . . .Imperial 31 1 3.2 . . 29 93.5 1 3.2 . . . . . .Kern 29 . . 1 3.4 20 69.0 7 24.1 . . 1 3.4 . .Kings 5 1 20.0 . . 1 20.0 3 60.0 . . . . . .Long Beach 39 4 10.3 1 2.6 8 20.5 26 66.7 . . . . . .Los Angeles 604 33 5.5 42 7.0 255 42.2 270 44.7 . . 3 0.5 1 0.2Marin 9 2 22.2 . . 6 66.7 1 11.1 . . . . . .Merced 19 . . . . 17 89.5 2 10.5 . . . . . .Monterey 16 . . . . 9 56.3 7 43.8 . . . . . .Orange 161 8 5.0 1 0.6 34 21.1 117 72.7 . . . . 1 0.6Riverside 52 4 7.7 4 7.7 30 57.7 14 26.9 . . . . . .Sacramento 73 1 1.4 3 4.1 10 13.7 59 80.8 . . . . . .San Bernardino 69 2 2.9 3 4.3 36 52.2 28 40.6 . . . . . .San Diego 234 17 7.3 4 1.7 124 53.0 87 37.2 . . 2 0.9 . .San Francisco 96 6 6.3 6 6.3 15 15.6 69 71.9 . . . . . .San Joaquin 58 5 8.6 2 3.4 22 37.9 29 50.0 . . . . . .San Mateo 57 6 10.5 . . 12 21.1 37 64.9 . . 2 3.5 . .Santa Barbara 19 3 15.8 . . 13 68.4 3 15.8 . . . . . .Santa Clara 198 5 2.5 4 2.0 21 10.6 167 84.3 . . 1 0.5 . .Solano 23 . . 4 17.4 2 8.7 17 73.9 . . . . . .Sonoma 9 . . . . 6 66.7 3 33.3 . . . . . .Stanislaus 18 2 11.1 . . 9 50.0 7 38.9 . . . . . .Tulare 15 1 6.7 . . 10 66.7 4 26.7 . . . . . .Ventura 24 6 25.0 . . 10 41.7 8 33.3 . . . . . .Yolo 11 2 18.2 1 9.1 1 9.1 7 63.6 . . . . . .All Other Jurisdictions** 33 8 24.2 . . 7 21.2 17 51.5 1 3.0 . . . .
. Indicates zero cases or zero percent* Two or more races reported** Reporting jurisdictions with fewer than 5 total casesCalifornia Department of Public Health, Tuberculosis Control Branch
Reporting JurisdictionTotal
Cases
Race/Ethnicity
White, Not Hispanic
Black, Not Hispanic Hispanic Asian
Amer Indian/ Alaska Native
Native Hawaiian/
Pacific Islander Multi-race*
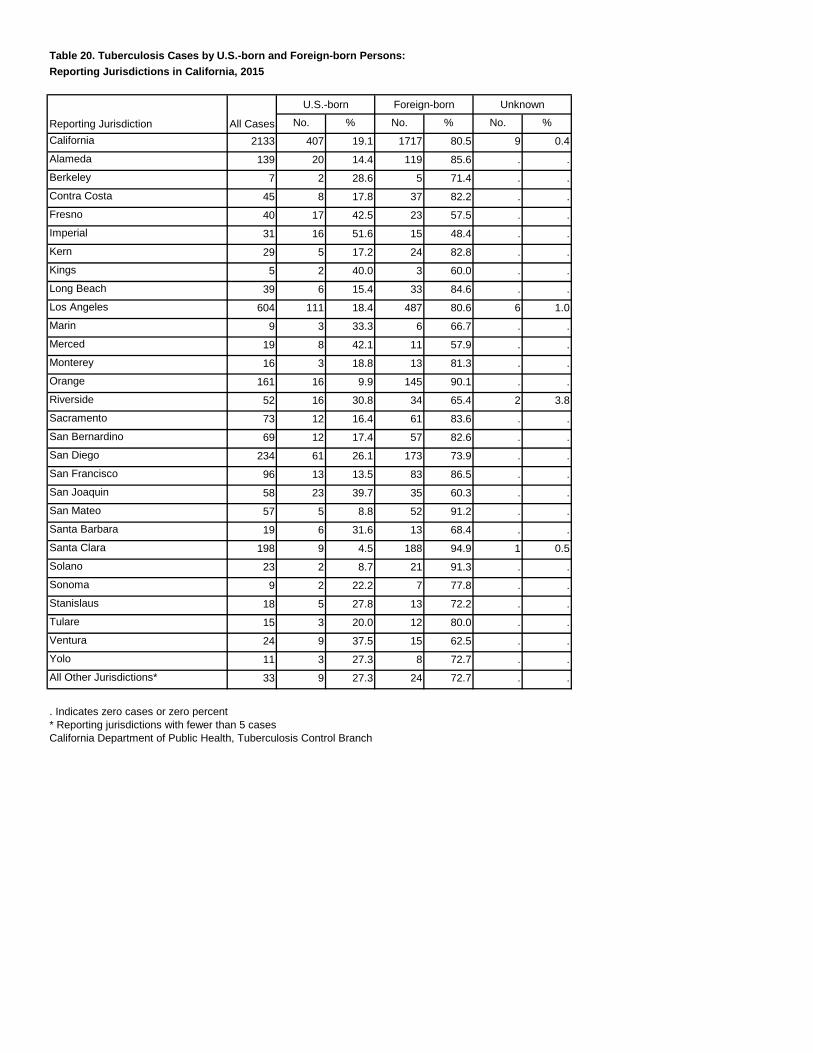
Table 20. Tuberculosis Cases by U.S.-born and Foreign-born Persons:Reporting Jurisdictions in California, 2015
No. % No. % No. %California 2133 407 19.1 1717 80.5 9 0.4Alameda 139 20 14.4 119 85.6 . .Berkeley 7 2 28.6 5 71.4 . .Contra Costa 45 8 17.8 37 82.2 . .Fresno 40 17 42.5 23 57.5 . .Imperial 31 16 51.6 15 48.4 . .Kern 29 5 17.2 24 82.8 . .Kings 5 2 40.0 3 60.0 . .Long Beach 39 6 15.4 33 84.6 . .Los Angeles 604 111 18.4 487 80.6 6 1.0Marin 9 3 33.3 6 66.7 . .Merced 19 8 42.1 11 57.9 . .Monterey 16 3 18.8 13 81.3 . .Orange 161 16 9.9 145 90.1 . .Riverside 52 16 30.8 34 65.4 2 3.8Sacramento 73 12 16.4 61 83.6 . .San Bernardino 69 12 17.4 57 82.6 . .San Diego 234 61 26.1 173 73.9 . .San Francisco 96 13 13.5 83 86.5 . .San Joaquin 58 23 39.7 35 60.3 . .San Mateo 57 5 8.8 52 91.2 . .Santa Barbara 19 6 31.6 13 68.4 . .Santa Clara 198 9 4.5 188 94.9 1 0.5Solano 23 2 8.7 21 91.3 . .Sonoma 9 2 22.2 7 77.8 . .Stanislaus 18 5 27.8 13 72.2 . .Tulare 15 3 20.0 12 80.0 . .Ventura 24 9 37.5 15 62.5 . .Yolo 11 3 27.3 8 72.7 . .All Other Jurisdictions* 33 9 27.3 24 72.7 . .
. Indicates zero cases or zero percent* Reporting jurisdictions with fewer than 5 casesCalifornia Department of Public Health, Tuberculosis Control Branch
Reporting Jurisdiction All Cases
U.S.-born Foreign-born Unknown
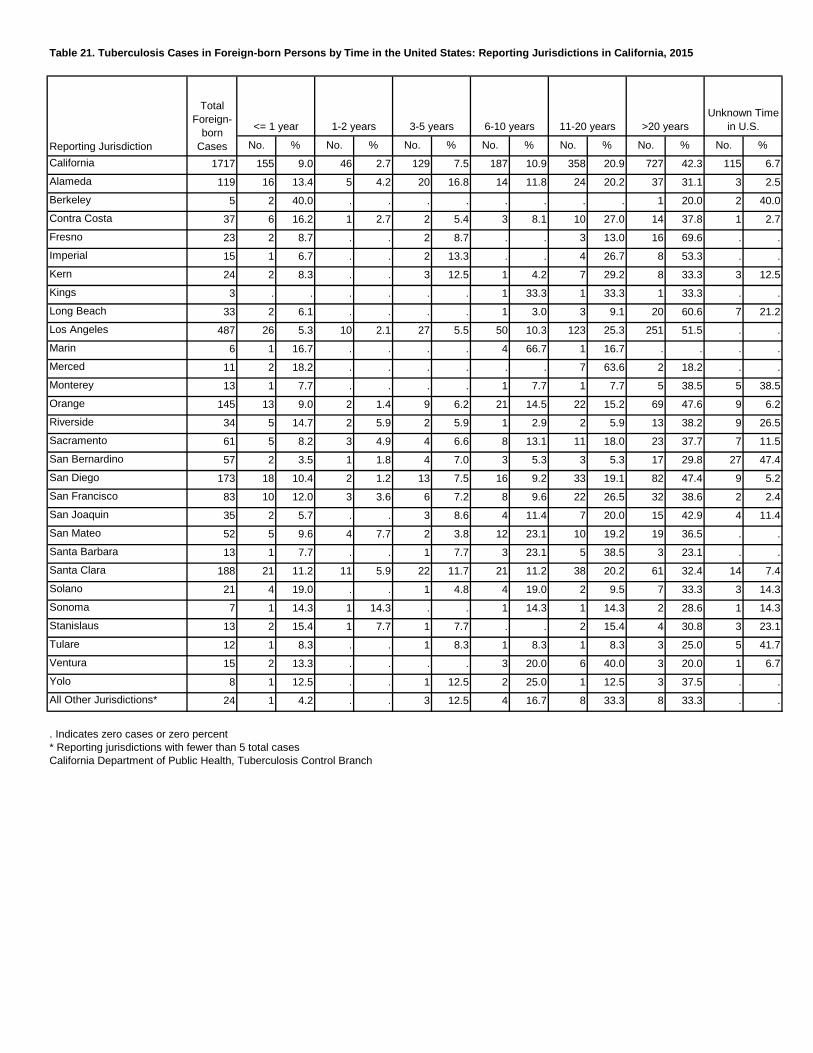
Table 21. Tuberculosis Cases in Foreign-born Persons by Time in the United States: Reporting Jurisdictions in California, 2015
No. % No. % No. % No. % No. % No. % No. %California 1717 155 9.0 46 2.7 129 7.5 187 10.9 358 20.9 727 42.3 115 6.7Alameda 119 16 13.4 5 4.2 20 16.8 14 11.8 24 20.2 37 31.1 3 2.5Berkeley 5 2 40.0 . . . . . . . . 1 20.0 2 40.0Contra Costa 37 6 16.2 1 2.7 2 5.4 3 8.1 10 27.0 14 37.8 1 2.7Fresno 23 2 8.7 . . 2 8.7 . . 3 13.0 16 69.6 . .Imperial 15 1 6.7 . . 2 13.3 . . 4 26.7 8 53.3 . .Kern 24 2 8.3 . . 3 12.5 1 4.2 7 29.2 8 33.3 3 12.5Kings 3 . . . . . . 1 33.3 1 33.3 1 33.3 . .Long Beach 33 2 6.1 . . . . 1 3.0 3 9.1 20 60.6 7 21.2Los Angeles 487 26 5.3 10 2.1 27 5.5 50 10.3 123 25.3 251 51.5 . .Marin 6 1 16.7 . . . . 4 66.7 1 16.7 . . . .Merced 11 2 18.2 . . . . . . 7 63.6 2 18.2 . .Monterey 13 1 7.7 . . . . 1 7.7 1 7.7 5 38.5 5 38.5Orange 145 13 9.0 2 1.4 9 6.2 21 14.5 22 15.2 69 47.6 9 6.2Riverside 34 5 14.7 2 5.9 2 5.9 1 2.9 2 5.9 13 38.2 9 26.5Sacramento 61 5 8.2 3 4.9 4 6.6 8 13.1 11 18.0 23 37.7 7 11.5San Bernardino 57 2 3.5 1 1.8 4 7.0 3 5.3 3 5.3 17 29.8 27 47.4San Diego 173 18 10.4 2 1.2 13 7.5 16 9.2 33 19.1 82 47.4 9 5.2San Francisco 83 10 12.0 3 3.6 6 7.2 8 9.6 22 26.5 32 38.6 2 2.4San Joaquin 35 2 5.7 . . 3 8.6 4 11.4 7 20.0 15 42.9 4 11.4San Mateo 52 5 9.6 4 7.7 2 3.8 12 23.1 10 19.2 19 36.5 . .Santa Barbara 13 1 7.7 . . 1 7.7 3 23.1 5 38.5 3 23.1 . .Santa Clara 188 21 11.2 11 5.9 22 11.7 21 11.2 38 20.2 61 32.4 14 7.4Solano 21 4 19.0 . . 1 4.8 4 19.0 2 9.5 7 33.3 3 14.3Sonoma 7 1 14.3 1 14.3 . . 1 14.3 1 14.3 2 28.6 1 14.3Stanislaus 13 2 15.4 1 7.7 1 7.7 . . 2 15.4 4 30.8 3 23.1Tulare 12 1 8.3 . . 1 8.3 1 8.3 1 8.3 3 25.0 5 41.7Ventura 15 2 13.3 . . . . 3 20.0 6 40.0 3 20.0 1 6.7Yolo 8 1 12.5 . . 1 12.5 2 25.0 1 12.5 3 37.5 . .All Other Jurisdictions* 24 1 4.2 . . 3 12.5 4 16.7 8 33.3 8 33.3 . .
. Indicates zero cases or zero percent* Reporting jurisdictions with fewer than 5 total casesCalifornia Department of Public Health, Tuberculosis Control Branch
11-20 years >20 yearsUnknown Time
in U.S.
Reporting Jurisdiction
Total Foreign-
born Cases
<= 1 year 1-2 years 3-5 years 6-10 years
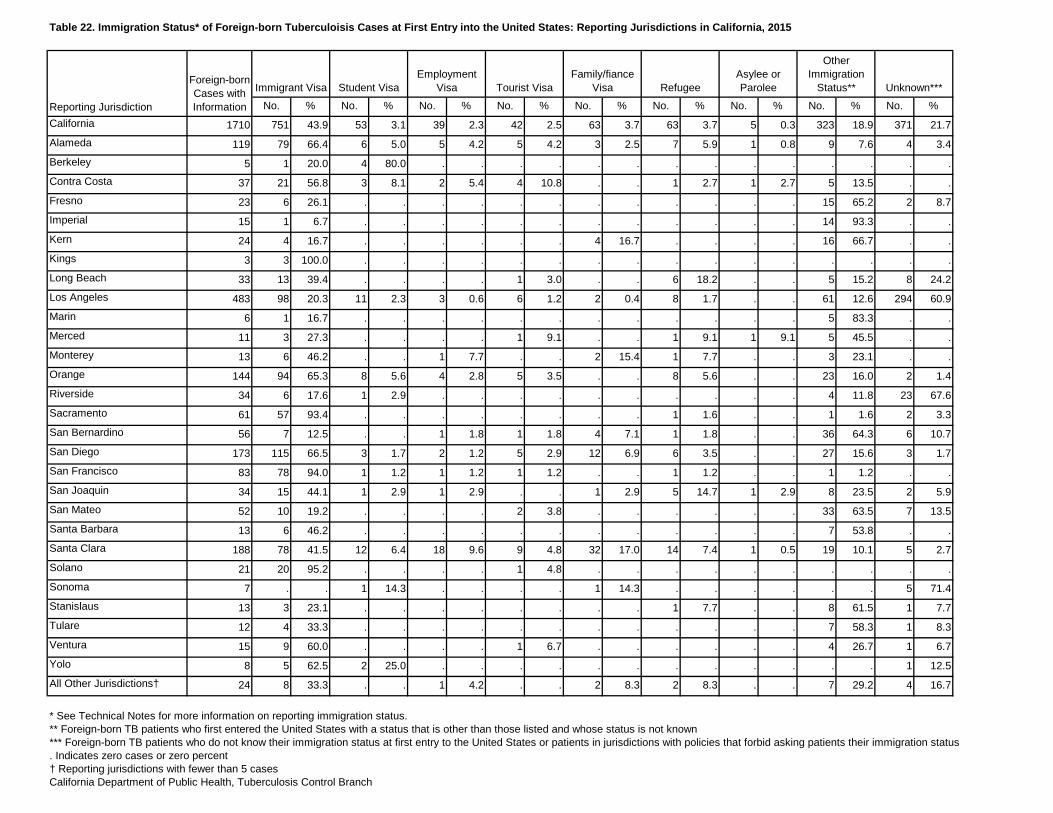
Table 22. Immigration Status* of Foreign-born Tuberculoisis Cases at First Entry into the United States: Reporting Jurisdictions in California, 2015
No. % No. % No. % No. % No. % No. % No. % No. % No. %California 1710 751 43.9 53 3.1 39 2.3 42 2.5 63 3.7 63 3.7 5 0.3 323 18.9 371 21.7Alameda 119 79 66.4 6 5.0 5 4.2 5 4.2 3 2.5 7 5.9 1 0.8 9 7.6 4 3.4Berkeley 5 1 20.0 4 80.0 . . . . . . . . . . . . . .Contra Costa 37 21 56.8 3 8.1 2 5.4 4 10.8 . . 1 2.7 1 2.7 5 13.5 . .Fresno 23 6 26.1 . . . . . . . . . . . . 15 65.2 2 8.7Imperial 15 1 6.7 . . . . . . . . . . . . 14 93.3 . .Kern 24 4 16.7 . . . . . . 4 16.7 . . . . 16 66.7 . .Kings 3 3 100.0 . . . . . . . . . . . . . . . .Long Beach 33 13 39.4 . . . . 1 3.0 . . 6 18.2 . . 5 15.2 8 24.2Los Angeles 483 98 20.3 11 2.3 3 0.6 6 1.2 2 0.4 8 1.7 . . 61 12.6 294 60.9Marin 6 1 16.7 . . . . . . . . . . . . 5 83.3 . .Merced 11 3 27.3 . . . . 1 9.1 . . 1 9.1 1 9.1 5 45.5 . .Monterey 13 6 46.2 . . 1 7.7 . . 2 15.4 1 7.7 . . 3 23.1 . .Orange 144 94 65.3 8 5.6 4 2.8 5 3.5 . . 8 5.6 . . 23 16.0 2 1.4Riverside 34 6 17.6 1 2.9 . . . . . . . . . . 4 11.8 23 67.6Sacramento 61 57 93.4 . . . . . . . . 1 1.6 . . 1 1.6 2 3.3San Bernardino 56 7 12.5 . . 1 1.8 1 1.8 4 7.1 1 1.8 . . 36 64.3 6 10.7San Diego 173 115 66.5 3 1.7 2 1.2 5 2.9 12 6.9 6 3.5 . . 27 15.6 3 1.7San Francisco 83 78 94.0 1 1.2 1 1.2 1 1.2 . . 1 1.2 . . 1 1.2 . .San Joaquin 34 15 44.1 1 2.9 1 2.9 . . 1 2.9 5 14.7 1 2.9 8 23.5 2 5.9San Mateo 52 10 19.2 . . . . 2 3.8 . . . . . . 33 63.5 7 13.5Santa Barbara 13 6 46.2 . . . . . . . . . . . . 7 53.8 . .Santa Clara 188 78 41.5 12 6.4 18 9.6 9 4.8 32 17.0 14 7.4 1 0.5 19 10.1 5 2.7Solano 21 20 95.2 . . . . 1 4.8 . . . . . . . . . .Sonoma 7 . . 1 14.3 . . . . 1 14.3 . . . . . . 5 71.4Stanislaus 13 3 23.1 . . . . . . . . 1 7.7 . . 8 61.5 1 7.7Tulare 12 4 33.3 . . . . . . . . . . . . 7 58.3 1 8.3Ventura 15 9 60.0 . . . . 1 6.7 . . . . . . 4 26.7 1 6.7Yolo 8 5 62.5 2 25.0 . . . . . . . . . . . . 1 12.5All Other Jurisdictions† 24 8 33.3 . . 1 4.2 . . 2 8.3 2 8.3 . . 7 29.2 4 16.7
* See Technical Notes for more information on reporting immigration status.** Foreign-born TB patients who first entered the United States with a status that is other than those listed and whose status is not known*** Foreign-born TB patients who do not know their immigration status at first entry to the United States or patients in jurisdictions with policies that forbid asking patients their immigration status. Indicates zero cases or zero percent† Reporting jurisdictions with fewer than 5 casesCalifornia Department of Public Health, Tuberculosis Control Branch
Family/fiance Visa Refugee
Asylee or Parolee
Other Immigration
Status** Unknown***Tourist Visa
Reporting Jurisdiction
Foreign-born Cases with Information
Immigrant Visa Student VisaEmployment
Visa
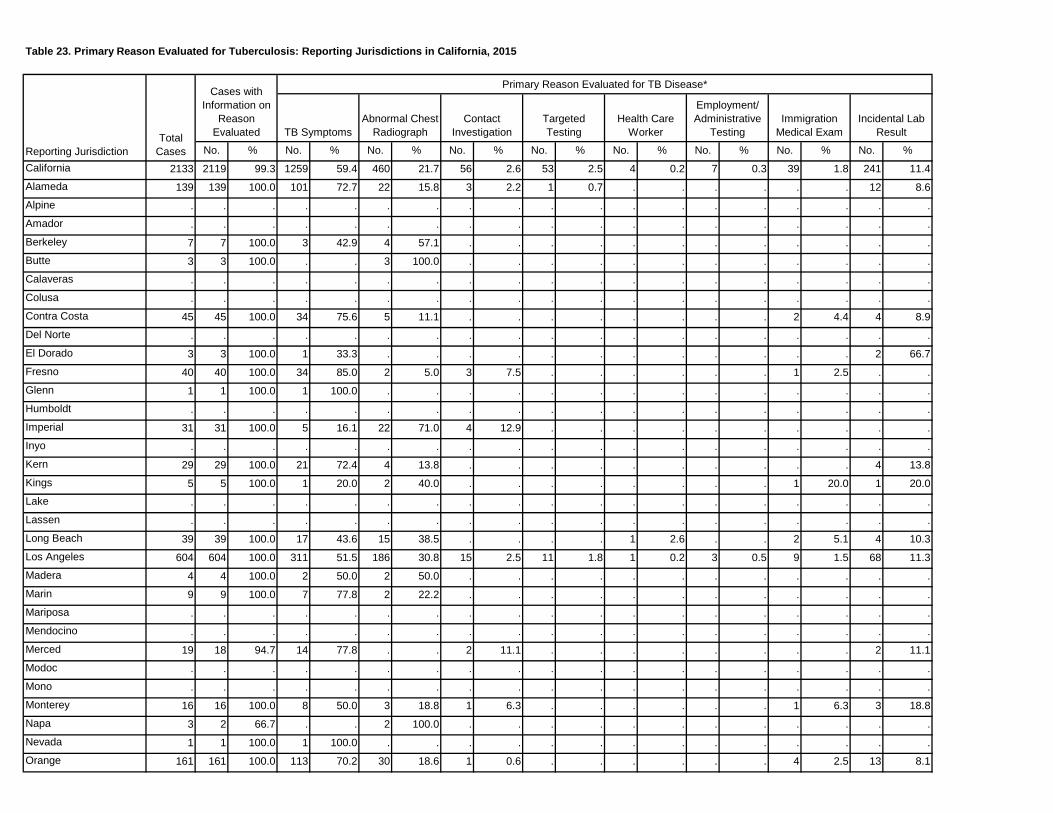
Table 23. Primary Reason Evaluated for Tuberculosis: Reporting Jurisdictions in California, 2015
No. % No. % No. % No. % No. % No. % No. % No. % No. %California 2133 2119 99.3 1259 59.4 460 21.7 56 2.6 53 2.5 4 0.2 7 0.3 39 1.8 241 11.4Alameda 139 139 100.0 101 72.7 22 15.8 3 2.2 1 0.7 . . . . . . 12 8.6Alpine . . . . . . . . . . . . . . . . . . .Amador . . . . . . . . . . . . . . . . . . .Berkeley 7 7 100.0 3 42.9 4 57.1 . . . . . . . . . . . .Butte 3 3 100.0 . . 3 100.0 . . . . . . . . . . . .Calaveras . . . . . . . . . . . . . . . . . . .Colusa . . . . . . . . . . . . . . . . . . .Contra Costa 45 45 100.0 34 75.6 5 11.1 . . . . . . . . 2 4.4 4 8.9Del Norte . . . . . . . . . . . . . . . . . . .El Dorado 3 3 100.0 1 33.3 . . . . . . . . . . . . 2 66.7Fresno 40 40 100.0 34 85.0 2 5.0 3 7.5 . . . . . . 1 2.5 . .Glenn 1 1 100.0 1 100.0 . . . . . . . . . . . . . .Humboldt . . . . . . . . . . . . . . . . . . .Imperial 31 31 100.0 5 16.1 22 71.0 4 12.9 . . . . . . . . . .Inyo . . . . . . . . . . . . . . . . . . .Kern 29 29 100.0 21 72.4 4 13.8 . . . . . . . . . . 4 13.8Kings 5 5 100.0 1 20.0 2 40.0 . . . . . . . . 1 20.0 1 20.0Lake . . . . . . . . . . . . . . . . . . .Lassen . . . . . . . . . . . . . . . . . . .Long Beach 39 39 100.0 17 43.6 15 38.5 . . . . 1 2.6 . . 2 5.1 4 10.3Los Angeles 604 604 100.0 311 51.5 186 30.8 15 2.5 11 1.8 1 0.2 3 0.5 9 1.5 68 11.3Madera 4 4 100.0 2 50.0 2 50.0 . . . . . . . . . . . .Marin 9 9 100.0 7 77.8 2 22.2 . . . . . . . . . . . .Mariposa . . . . . . . . . . . . . . . . . . .Mendocino . . . . . . . . . . . . . . . . . . .Merced 19 18 94.7 14 77.8 . . 2 11.1 . . . . . . . . 2 11.1Modoc . . . . . . . . . . . . . . . . . . .Mono . . . . . . . . . . . . . . . . . . .Monterey 16 16 100.0 8 50.0 3 18.8 1 6.3 . . . . . . 1 6.3 3 18.8Napa 3 2 66.7 . . 2 100.0 . . . . . . . . . . . .Nevada 1 1 100.0 1 100.0 . . . . . . . . . . . . . .Orange 161 161 100.0 113 70.2 30 18.6 1 0.6 . . . . . . 4 2.5 13 8.1
Employment/ Administrative
TestingImmigration
Medical ExamIncidental Lab
Result
Reporting JurisdictionTotal
Cases
Cases with Information on
Reason Evaluated
Primary Reason Evaluated for TB Disease*
TB SymptomsAbnormal Chest
RadiographContact
InvestigationTargeted Testing
Health Care Worker
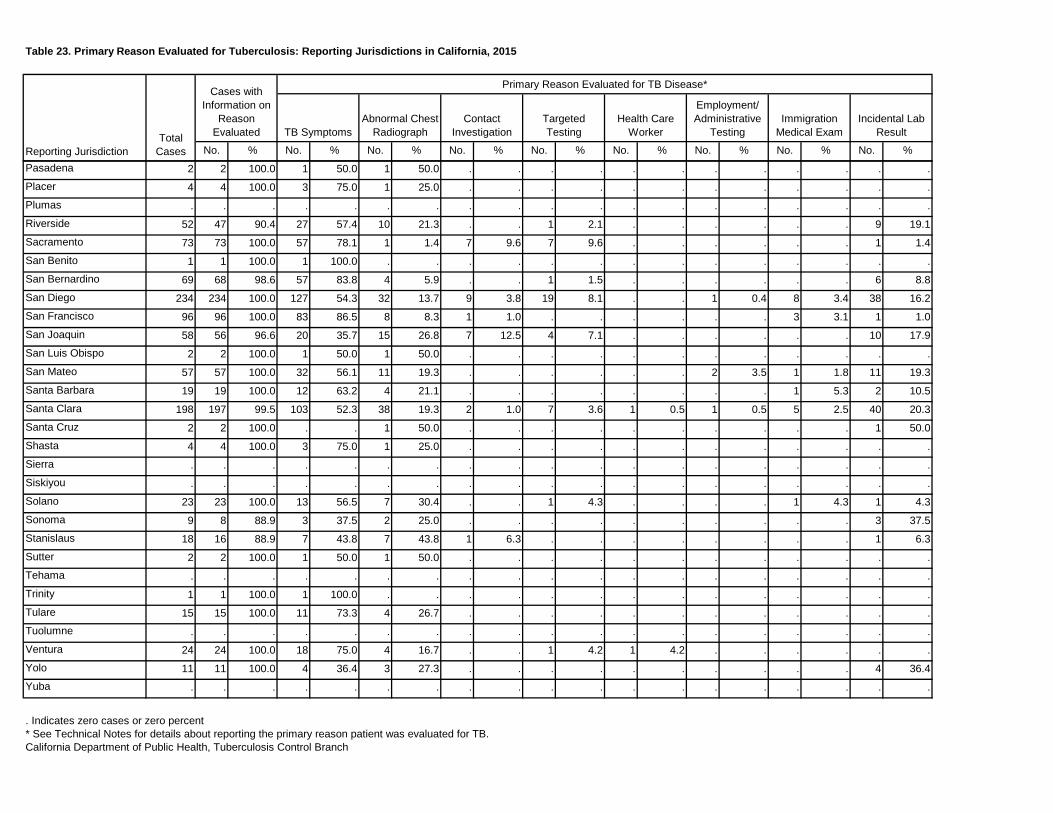
Table 23. Primary Reason Evaluated for Tuberculosis: Reporting Jurisdictions in California, 2015
No. % No. % No. % No. % No. % No. % No. % No. % No. %
Employment/ Administrative
TestingImmigration
Medical ExamIncidental Lab
Result
Reporting JurisdictionTotal
Cases
Cases with Information on
Reason Evaluated
Primary Reason Evaluated for TB Disease*
TB SymptomsAbnormal Chest
RadiographContact
InvestigationTargeted Testing
Health Care Worker
Pasadena 2 2 100.0 1 50.0 1 50.0 . . . . . . . . . . . .Placer 4 4 100.0 3 75.0 1 25.0 . . . . . . . . . . . .Plumas . . . . . . . . . . . . . . . . . . .Riverside 52 47 90.4 27 57.4 10 21.3 . . 1 2.1 . . . . . . 9 19.1Sacramento 73 73 100.0 57 78.1 1 1.4 7 9.6 7 9.6 . . . . . . 1 1.4San Benito 1 1 100.0 1 100.0 . . . . . . . . . . . . . .San Bernardino 69 68 98.6 57 83.8 4 5.9 . . 1 1.5 . . . . . . 6 8.8San Diego 234 234 100.0 127 54.3 32 13.7 9 3.8 19 8.1 . . 1 0.4 8 3.4 38 16.2San Francisco 96 96 100.0 83 86.5 8 8.3 1 1.0 . . . . . . 3 3.1 1 1.0San Joaquin 58 56 96.6 20 35.7 15 26.8 7 12.5 4 7.1 . . . . . . 10 17.9San Luis Obispo 2 2 100.0 1 50.0 1 50.0 . . . . . . . . . . . .San Mateo 57 57 100.0 32 56.1 11 19.3 . . . . . . 2 3.5 1 1.8 11 19.3Santa Barbara 19 19 100.0 12 63.2 4 21.1 . . . . . . . . 1 5.3 2 10.5Santa Clara 198 197 99.5 103 52.3 38 19.3 2 1.0 7 3.6 1 0.5 1 0.5 5 2.5 40 20.3Santa Cruz 2 2 100.0 . . 1 50.0 . . . . . . . . . . 1 50.0Shasta 4 4 100.0 3 75.0 1 25.0 . . . . . . . . . . . .Sierra . . . . . . . . . . . . . . . . . . .Siskiyou . . . . . . . . . . . . . . . . . . .Solano 23 23 100.0 13 56.5 7 30.4 . . 1 4.3 . . . . 1 4.3 1 4.3Sonoma 9 8 88.9 3 37.5 2 25.0 . . . . . . . . . . 3 37.5Stanislaus 18 16 88.9 7 43.8 7 43.8 1 6.3 . . . . . . . . 1 6.3Sutter 2 2 100.0 1 50.0 1 50.0 . . . . . . . . . . . .Tehama . . . . . . . . . . . . . . . . . . .Trinity 1 1 100.0 1 100.0 . . . . . . . . . . . . . .Tulare 15 15 100.0 11 73.3 4 26.7 . . . . . . . . . . . .Tuolumne . . . . . . . . . . . . . . . . . . .Ventura 24 24 100.0 18 75.0 4 16.7 . . 1 4.2 1 4.2 . . . . . .Yolo 11 11 100.0 4 36.4 3 27.3 . . . . . . . . . . 4 36.4Yuba . . . . . . . . . . . . . . . . . . .
. Indicates zero cases or zero percent* See Technical Notes for details about reporting the primary reason patient was evaluated for TB.California Department of Public Health, Tuberculosis Control Branch
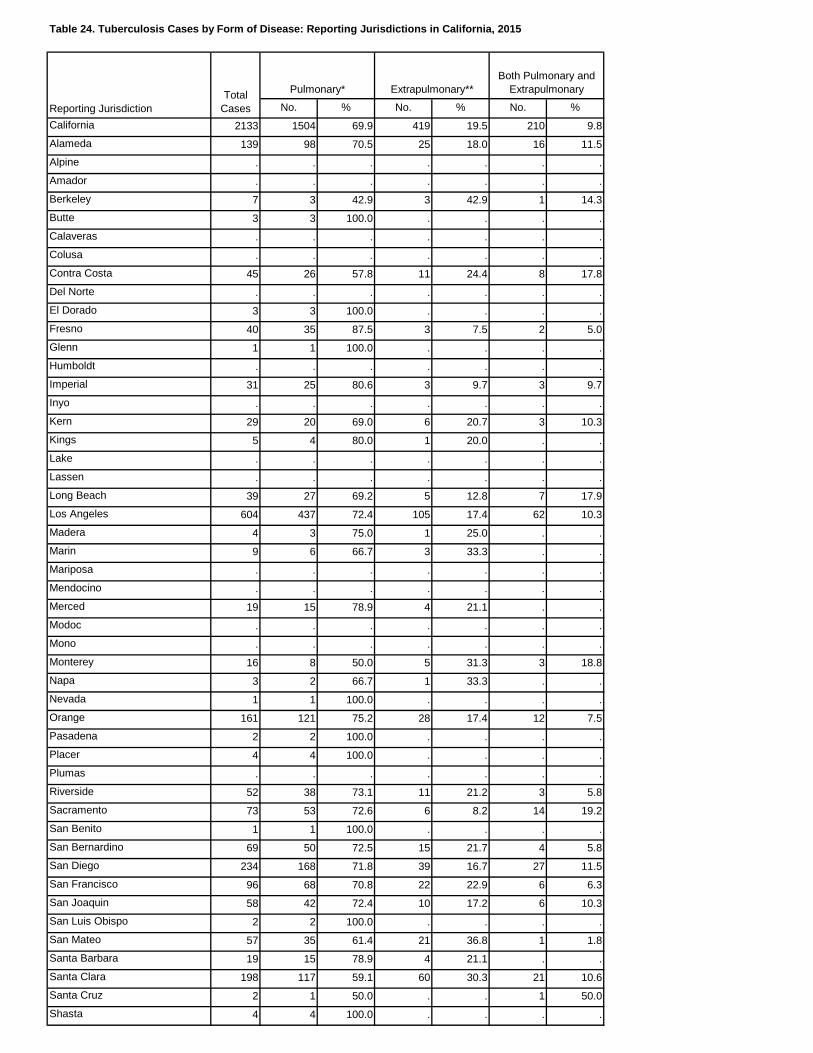
Table 24. Tuberculosis Cases by Form of Disease: Reporting Jurisdictions in California, 2015
No. % No. % No. %California 2133 1504 69.9 419 19.5 210 9.8Alameda 139 98 70.5 25 18.0 16 11.5Alpine . . . . . . .Amador . . . . . . .Berkeley 7 3 42.9 3 42.9 1 14.3Butte 3 3 100.0 . . . .Calaveras . . . . . . .Colusa . . . . . . .Contra Costa 45 26 57.8 11 24.4 8 17.8Del Norte . . . . . . .El Dorado 3 3 100.0 . . . .Fresno 40 35 87.5 3 7.5 2 5.0Glenn 1 1 100.0 . . . .Humboldt . . . . . . .Imperial 31 25 80.6 3 9.7 3 9.7Inyo . . . . . . .Kern 29 20 69.0 6 20.7 3 10.3Kings 5 4 80.0 1 20.0 . .Lake . . . . . . .Lassen . . . . . . .Long Beach 39 27 69.2 5 12.8 7 17.9Los Angeles 604 437 72.4 105 17.4 62 10.3Madera 4 3 75.0 1 25.0 . .Marin 9 6 66.7 3 33.3 . .Mariposa . . . . . . .Mendocino . . . . . . .Merced 19 15 78.9 4 21.1 . .Modoc . . . . . . .Mono . . . . . . .Monterey 16 8 50.0 5 31.3 3 18.8Napa 3 2 66.7 1 33.3 . .Nevada 1 1 100.0 . . . .Orange 161 121 75.2 28 17.4 12 7.5Pasadena 2 2 100.0 . . . .Placer 4 4 100.0 . . . .Plumas . . . . . . .Riverside 52 38 73.1 11 21.2 3 5.8Sacramento 73 53 72.6 6 8.2 14 19.2San Benito 1 1 100.0 . . . .San Bernardino 69 50 72.5 15 21.7 4 5.8San Diego 234 168 71.8 39 16.7 27 11.5San Francisco 96 68 70.8 22 22.9 6 6.3San Joaquin 58 42 72.4 10 17.2 6 10.3San Luis Obispo 2 2 100.0 . . . .San Mateo 57 35 61.4 21 36.8 1 1.8Santa Barbara 19 15 78.9 4 21.1 . .Santa Clara 198 117 59.1 60 30.3 21 10.6Santa Cruz 2 1 50.0 . . 1 50.0Shasta 4 4 100.0 . . . .
Reporting JurisdictionTotal
Cases
Pulmonary* Extrapulmonary**Both Pulmonary and
Extrapulmonary
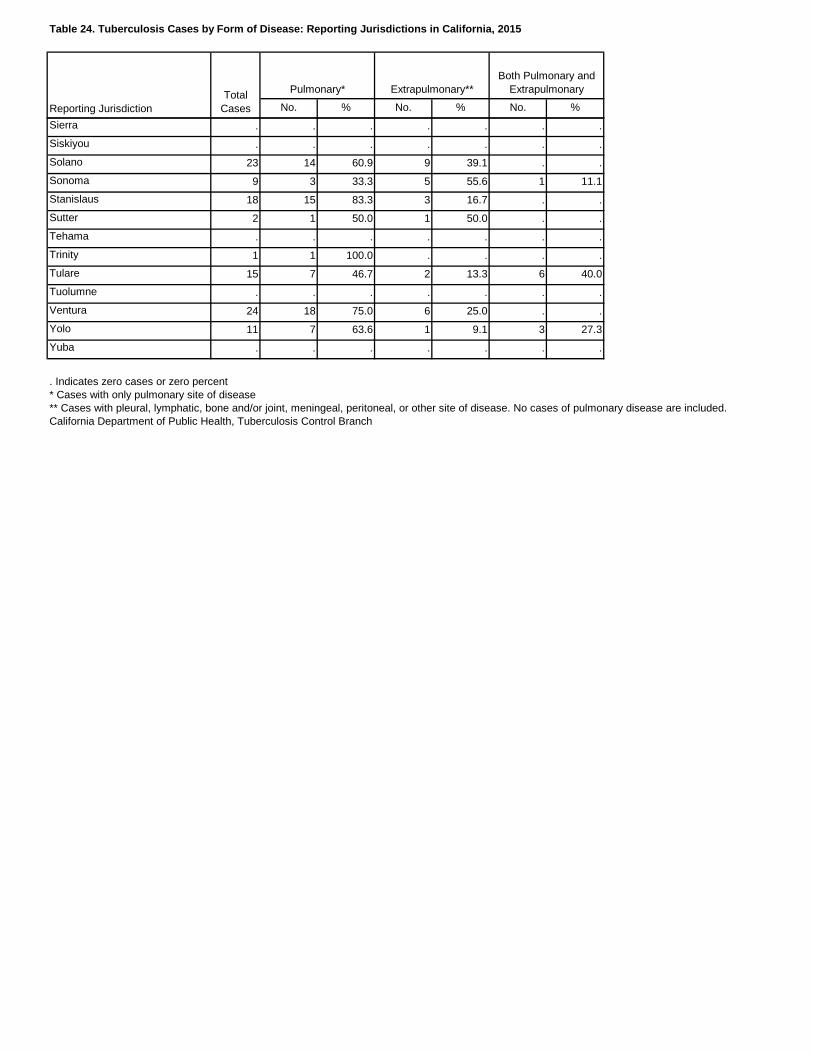
Table 24. Tuberculosis Cases by Form of Disease: Reporting Jurisdictions in California, 2015
No. % No. % No. %Reporting JurisdictionTotal
Cases
Pulmonary* Extrapulmonary**Both Pulmonary and
Extrapulmonary
Sierra . . . . . . .Siskiyou . . . . . . .Solano 23 14 60.9 9 39.1 . .Sonoma 9 3 33.3 5 55.6 1 11.1Stanislaus 18 15 83.3 3 16.7 . .Sutter 2 1 50.0 1 50.0 . .Tehama . . . . . . .Trinity 1 1 100.0 . . . .Tulare 15 7 46.7 2 13.3 6 40.0Tuolumne . . . . . . .Ventura 24 18 75.0 6 25.0 . .Yolo 11 7 63.6 1 9.1 3 27.3Yuba . . . . . . .
. Indicates zero cases or zero percent* Cases with only pulmonary site of disease** Cases with pleural, lymphatic, bone and/or joint, meningeal, peritoneal, or other site of disease. No cases of pulmonary disease are included.California Department of Public Health, Tuberculosis Control Branch
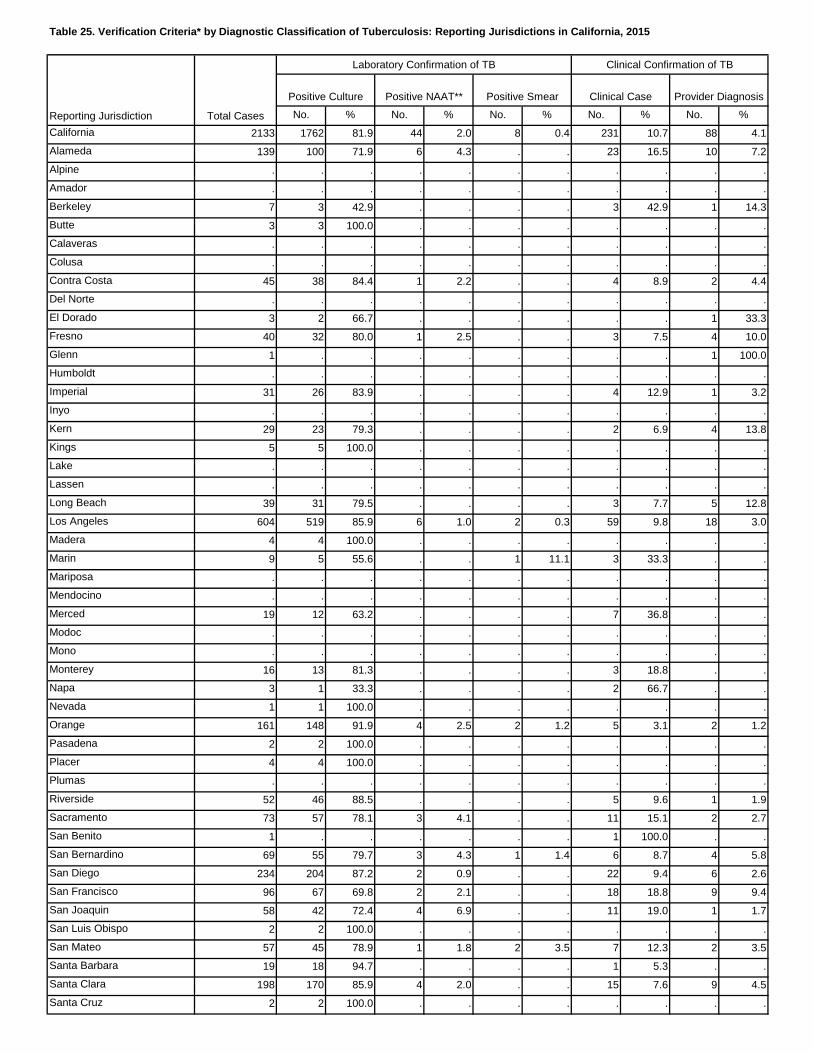
Table 25. Verification Criteria* by Diagnostic Classification of Tuberculosis: Reporting Jurisdictions in California, 2015
No. % No. % No. % No. % No. %California 2133 1762 81.9 44 2.0 8 0.4 231 10.7 88 4.1Alameda 139 100 71.9 6 4.3 . . 23 16.5 10 7.2Alpine . . . . . . . . . . .Amador . . . . . . . . . . .Berkeley 7 3 42.9 . . . . 3 42.9 1 14.3Butte 3 3 100.0 . . . . . . . .Calaveras . . . . . . . . . . .Colusa . . . . . . . . . . .Contra Costa 45 38 84.4 1 2.2 . . 4 8.9 2 4.4Del Norte . . . . . . . . . . .El Dorado 3 2 66.7 . . . . . . 1 33.3Fresno 40 32 80.0 1 2.5 . . 3 7.5 4 10.0Glenn 1 . . . . . . . . 1 100.0Humboldt . . . . . . . . . . .Imperial 31 26 83.9 . . . . 4 12.9 1 3.2Inyo . . . . . . . . . . .Kern 29 23 79.3 . . . . 2 6.9 4 13.8Kings 5 5 100.0 . . . . . . . .Lake . . . . . . . . . . .Lassen . . . . . . . . . . .Long Beach 39 31 79.5 . . . . 3 7.7 5 12.8Los Angeles 604 519 85.9 6 1.0 2 0.3 59 9.8 18 3.0Madera 4 4 100.0 . . . . . . . .Marin 9 5 55.6 . . 1 11.1 3 33.3 . .Mariposa . . . . . . . . . . .Mendocino . . . . . . . . . . .Merced 19 12 63.2 . . . . 7 36.8 . .Modoc . . . . . . . . . . .Mono . . . . . . . . . . .Monterey 16 13 81.3 . . . . 3 18.8 . .Napa 3 1 33.3 . . . . 2 66.7 . .Nevada 1 1 100.0 . . . . . . . .Orange 161 148 91.9 4 2.5 2 1.2 5 3.1 2 1.2Pasadena 2 2 100.0 . . . . . . . .Placer 4 4 100.0 . . . . . . . .Plumas . . . . . . . . . . .Riverside 52 46 88.5 . . . . 5 9.6 1 1.9Sacramento 73 57 78.1 3 4.1 . . 11 15.1 2 2.7San Benito 1 . . . . . . 1 100.0 . .San Bernardino 69 55 79.7 3 4.3 1 1.4 6 8.7 4 5.8San Diego 234 204 87.2 2 0.9 . . 22 9.4 6 2.6San Francisco 96 67 69.8 2 2.1 . . 18 18.8 9 9.4San Joaquin 58 42 72.4 4 6.9 . . 11 19.0 1 1.7San Luis Obispo 2 2 100.0 . . . . . . . .San Mateo 57 45 78.9 1 1.8 2 3.5 7 12.3 2 3.5Santa Barbara 19 18 94.7 . . . . 1 5.3 . .Santa Clara 198 170 85.9 4 2.0 . . 15 7.6 9 4.5Santa Cruz 2 2 100.0 . . . . . . . .
Provider Diagnosis
Reporting Jurisdiction Total Cases
Laboratory Confirmation of TB Clinical Confirmation of TB
Positive Culture Positive NAAT** Positive Smear Clinical Case
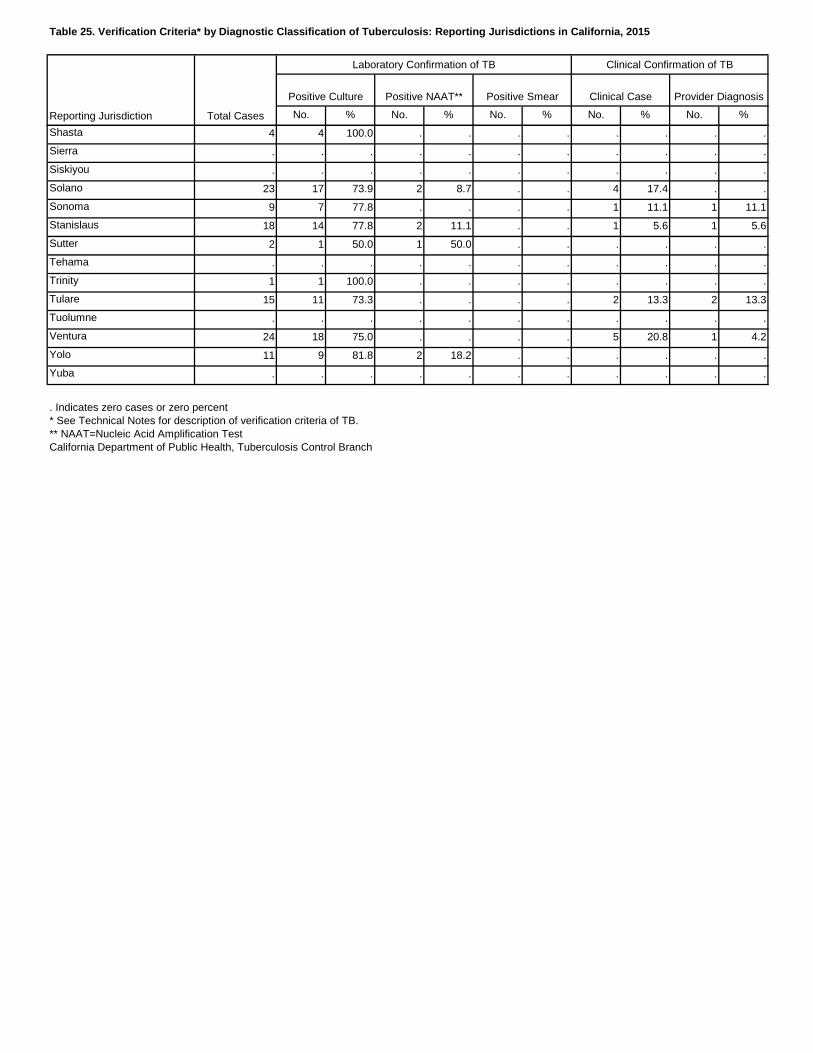
Table 25. Verification Criteria* by Diagnostic Classification of Tuberculosis: Reporting Jurisdictions in California, 2015
No. % No. % No. % No. % No. %
Provider Diagnosis
Reporting Jurisdiction Total Cases
Laboratory Confirmation of TB Clinical Confirmation of TB
Positive Culture Positive NAAT** Positive Smear Clinical Case
Shasta 4 4 100.0 . . . . . . . .Sierra . . . . . . . . . . .Siskiyou . . . . . . . . . . .Solano 23 17 73.9 2 8.7 . . 4 17.4 . .Sonoma 9 7 77.8 . . . . 1 11.1 1 11.1Stanislaus 18 14 77.8 2 11.1 . . 1 5.6 1 5.6Sutter 2 1 50.0 1 50.0 . . . . . .Tehama . . . . . . . . . . .Trinity 1 1 100.0 . . . . . . . .Tulare 15 11 73.3 . . . . 2 13.3 2 13.3Tuolumne . . . . . . . . . . .Ventura 24 18 75.0 . . . . 5 20.8 1 4.2Yolo 11 9 81.8 2 18.2 . . . . . .Yuba . . . . . . . . . . .
. Indicates zero cases or zero percent* See Technical Notes for description of verification criteria of TB.** NAAT=Nucleic Acid Amplification TestCalifornia Department of Public Health, Tuberculosis Control Branch
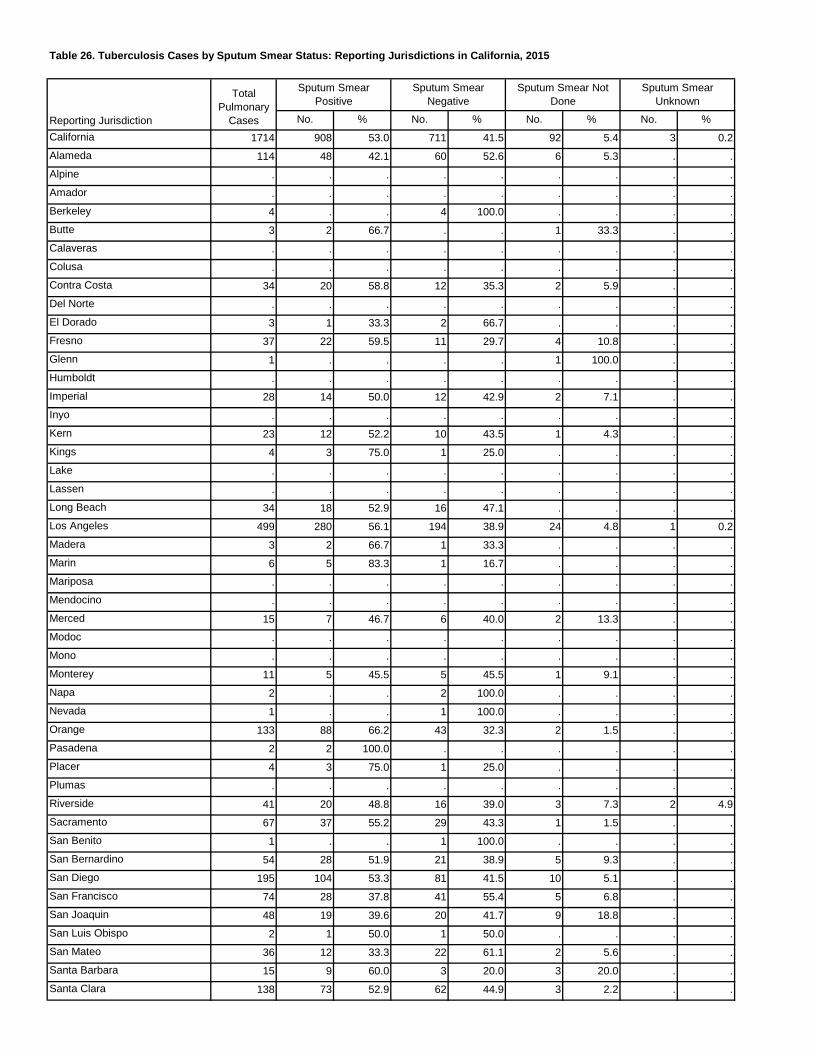
Table 26. Tuberculosis Cases by Sputum Smear Status: Reporting Jurisdictions in California, 2015
No. % No. % No. % No. %California 1714 908 53.0 711 41.5 92 5.4 3 0.2Alameda 114 48 42.1 60 52.6 6 5.3 . .Alpine . . . . . . . . .Amador . . . . . . . . .Berkeley 4 . . 4 100.0 . . . .Butte 3 2 66.7 . . 1 33.3 . .Calaveras . . . . . . . . .Colusa . . . . . . . . .Contra Costa 34 20 58.8 12 35.3 2 5.9 . .Del Norte . . . . . . . . .El Dorado 3 1 33.3 2 66.7 . . . .Fresno 37 22 59.5 11 29.7 4 10.8 . .Glenn 1 . . . . 1 100.0 . .Humboldt . . . . . . . . .Imperial 28 14 50.0 12 42.9 2 7.1 . .Inyo . . . . . . . . .Kern 23 12 52.2 10 43.5 1 4.3 . .Kings 4 3 75.0 1 25.0 . . . .Lake . . . . . . . . .Lassen . . . . . . . . .Long Beach 34 18 52.9 16 47.1 . . . .Los Angeles 499 280 56.1 194 38.9 24 4.8 1 0.2Madera 3 2 66.7 1 33.3 . . . .Marin 6 5 83.3 1 16.7 . . . .Mariposa . . . . . . . . .Mendocino . . . . . . . . .Merced 15 7 46.7 6 40.0 2 13.3 . .Modoc . . . . . . . . .Mono . . . . . . . . .Monterey 11 5 45.5 5 45.5 1 9.1 . .Napa 2 . . 2 100.0 . . . .Nevada 1 . . 1 100.0 . . . .Orange 133 88 66.2 43 32.3 2 1.5 . .Pasadena 2 2 100.0 . . . . . .Placer 4 3 75.0 1 25.0 . . . .Plumas . . . . . . . . .Riverside 41 20 48.8 16 39.0 3 7.3 2 4.9Sacramento 67 37 55.2 29 43.3 1 1.5 . .San Benito 1 . . 1 100.0 . . . .San Bernardino 54 28 51.9 21 38.9 5 9.3 . .San Diego 195 104 53.3 81 41.5 10 5.1 . .San Francisco 74 28 37.8 41 55.4 5 6.8 . .San Joaquin 48 19 39.6 20 41.7 9 18.8 . .San Luis Obispo 2 1 50.0 1 50.0 . . . .San Mateo 36 12 33.3 22 61.1 2 5.6 . .Santa Barbara 15 9 60.0 3 20.0 3 20.0 . .Santa Clara 138 73 52.9 62 44.9 3 2.2 . .
Sputum Smear Unknown
Reporting Jurisdiction
Total Pulmonary
Cases
Sputum Smear Positive
Sputum Smear Negative
Sputum Smear Not Done
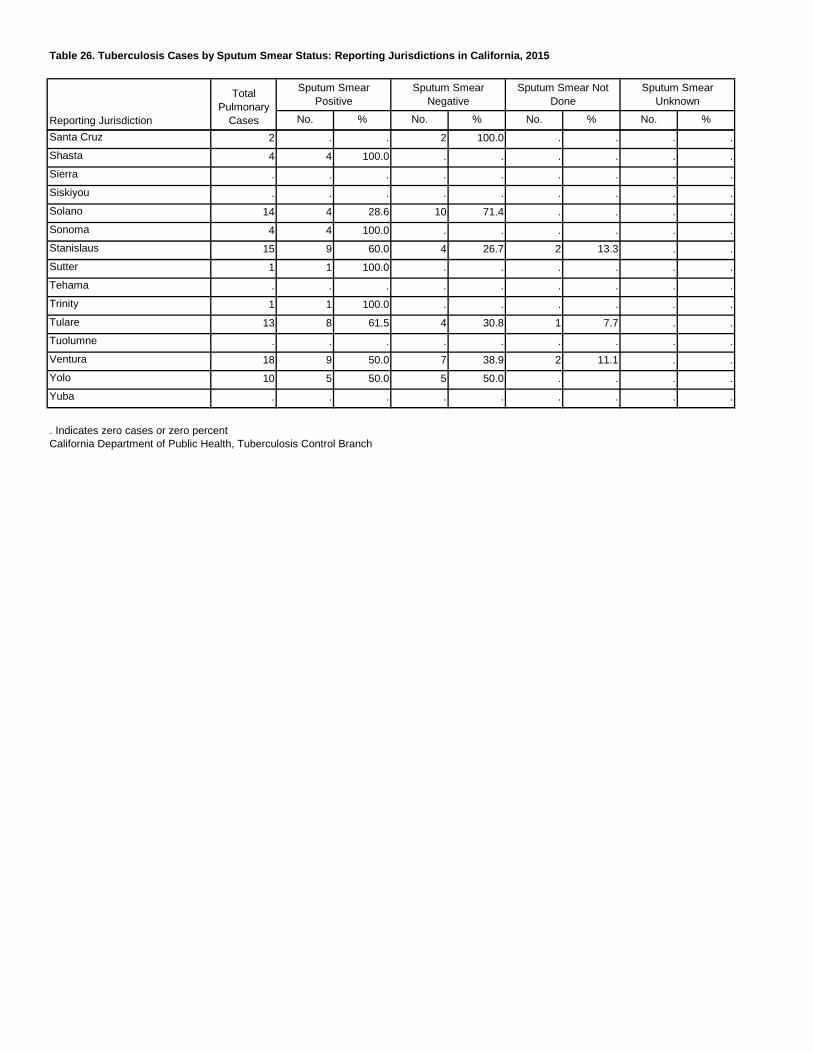
Table 26. Tuberculosis Cases by Sputum Smear Status: Reporting Jurisdictions in California, 2015
No. % No. % No. % No. %
Sputum Smear Unknown
Reporting Jurisdiction
Total Pulmonary
Cases
Sputum Smear Positive
Sputum Smear Negative
Sputum Smear Not Done
Santa Cruz 2 . . 2 100.0 . . . .Shasta 4 4 100.0 . . . . . .Sierra . . . . . . . . .Siskiyou . . . . . . . . .Solano 14 4 28.6 10 71.4 . . . .Sonoma 4 4 100.0 . . . . . .Stanislaus 15 9 60.0 4 26.7 2 13.3 . .Sutter 1 1 100.0 . . . . . .Tehama . . . . . . . . .Trinity 1 1 100.0 . . . . . .Tulare 13 8 61.5 4 30.8 1 7.7 . .Tuolumne . . . . . . . . .Ventura 18 9 50.0 7 38.9 2 11.1 . .Yolo 10 5 50.0 5 50.0 . . . .Yuba . . . . . . . . .
. Indicates zero cases or zero percentCalifornia Department of Public Health, Tuberculosis Control Branch
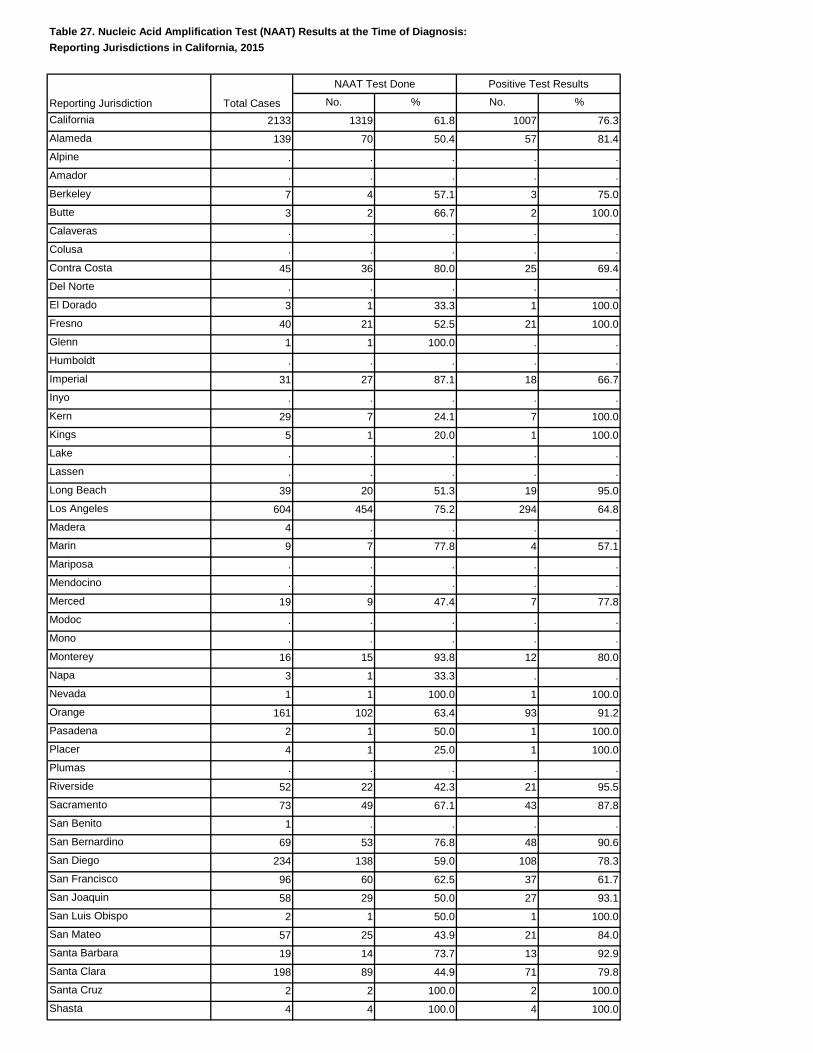
Table 27. Nucleic Acid Amplification Test (NAAT) Results at the Time of Diagnosis:Reporting Jurisdictions in California, 2015
No. % No. %California 2133 1319 61.8 1007 76.3Alameda 139 70 50.4 57 81.4Alpine . . . . .Amador . . . . .Berkeley 7 4 57.1 3 75.0Butte 3 2 66.7 2 100.0Calaveras . . . . .Colusa . . . . .Contra Costa 45 36 80.0 25 69.4Del Norte . . . . .El Dorado 3 1 33.3 1 100.0Fresno 40 21 52.5 21 100.0Glenn 1 1 100.0 . .Humboldt . . . . .Imperial 31 27 87.1 18 66.7Inyo . . . . .Kern 29 7 24.1 7 100.0Kings 5 1 20.0 1 100.0Lake . . . . .Lassen . . . . .Long Beach 39 20 51.3 19 95.0Los Angeles 604 454 75.2 294 64.8Madera 4 . . . .Marin 9 7 77.8 4 57.1Mariposa . . . . .Mendocino . . . . .Merced 19 9 47.4 7 77.8Modoc . . . . .Mono . . . . .Monterey 16 15 93.8 12 80.0Napa 3 1 33.3 . .Nevada 1 1 100.0 1 100.0Orange 161 102 63.4 93 91.2Pasadena 2 1 50.0 1 100.0Placer 4 1 25.0 1 100.0Plumas . . . . .Riverside 52 22 42.3 21 95.5Sacramento 73 49 67.1 43 87.8San Benito 1 . . . .San Bernardino 69 53 76.8 48 90.6San Diego 234 138 59.0 108 78.3San Francisco 96 60 62.5 37 61.7San Joaquin 58 29 50.0 27 93.1San Luis Obispo 2 1 50.0 1 100.0San Mateo 57 25 43.9 21 84.0Santa Barbara 19 14 73.7 13 92.9Santa Clara 198 89 44.9 71 79.8Santa Cruz 2 2 100.0 2 100.0Shasta 4 4 100.0 4 100.0
Reporting Jurisdiction Total Cases
NAAT Test Done Positive Test Results
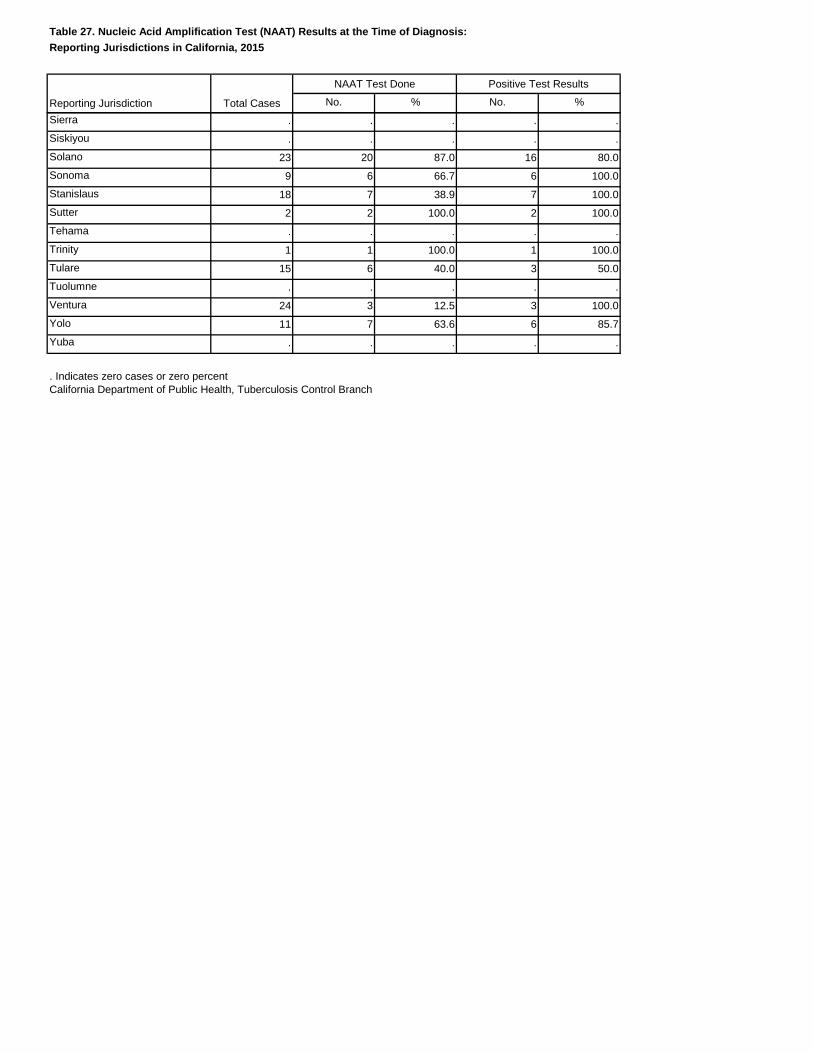
Table 27. Nucleic Acid Amplification Test (NAAT) Results at the Time of Diagnosis:Reporting Jurisdictions in California, 2015
No. % No. %Reporting Jurisdiction Total Cases
NAAT Test Done Positive Test Results
Sierra . . . . .Siskiyou . . . . .Solano 23 20 87.0 16 80.0Sonoma 9 6 66.7 6 100.0Stanislaus 18 7 38.9 7 100.0Sutter 2 2 100.0 2 100.0Tehama . . . . .Trinity 1 1 100.0 1 100.0Tulare 15 6 40.0 3 50.0Tuolumne . . . . .Ventura 24 3 12.5 3 100.0Yolo 11 7 63.6 6 85.7Yuba . . . . .
. Indicates zero cases or zero percentCalifornia Department of Public Health, Tuberculosis Control Branch
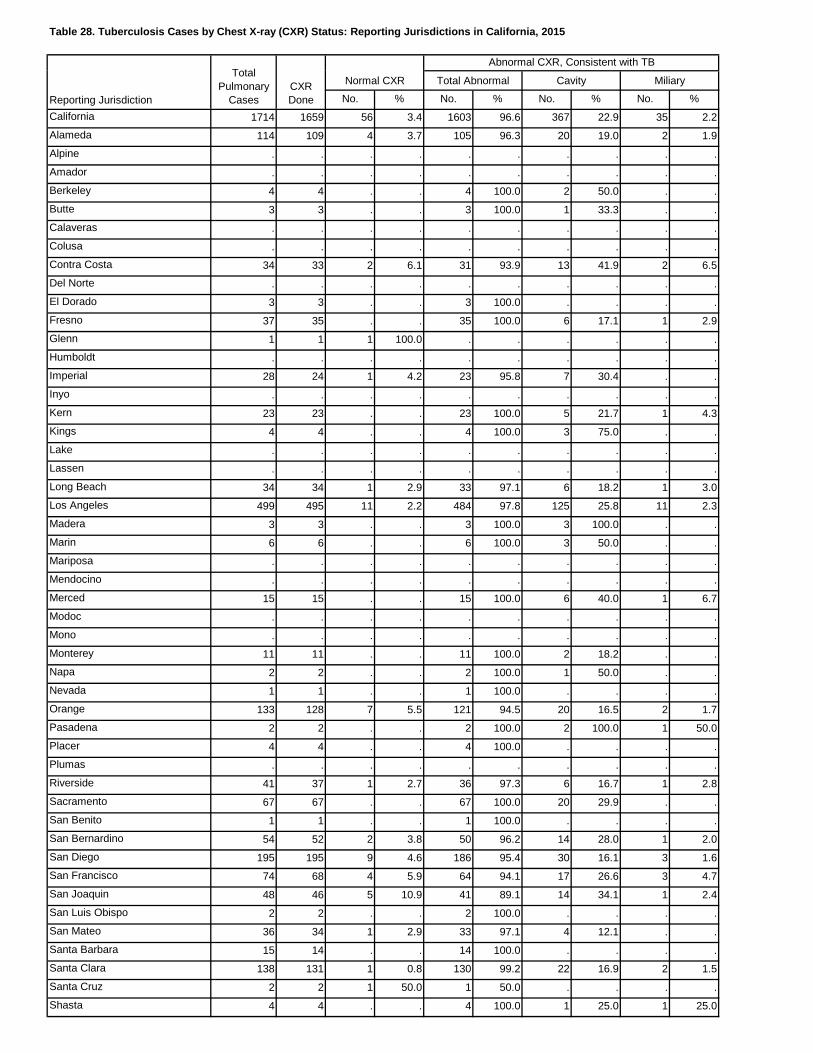
Table 28. Tuberculosis Cases by Chest X-ray (CXR) Status: Reporting Jurisdictions in California, 2015
No. % No. % No. % No. %California 1714 1659 56 3.4 1603 96.6 367 22.9 35 2.2Alameda 114 109 4 3.7 105 96.3 20 19.0 2 1.9Alpine . . . . . . . . . .Amador . . . . . . . . . .Berkeley 4 4 . . 4 100.0 2 50.0 . .Butte 3 3 . . 3 100.0 1 33.3 . .Calaveras . . . . . . . . . .Colusa . . . . . . . . . .Contra Costa 34 33 2 6.1 31 93.9 13 41.9 2 6.5Del Norte . . . . . . . . . .El Dorado 3 3 . . 3 100.0 . . . .Fresno 37 35 . . 35 100.0 6 17.1 1 2.9Glenn 1 1 1 100.0 . . . . . .Humboldt . . . . . . . . . .Imperial 28 24 1 4.2 23 95.8 7 30.4 . .Inyo . . . . . . . . . .Kern 23 23 . . 23 100.0 5 21.7 1 4.3Kings 4 4 . . 4 100.0 3 75.0 . .Lake . . . . . . . . . .Lassen . . . . . . . . . .Long Beach 34 34 1 2.9 33 97.1 6 18.2 1 3.0Los Angeles 499 495 11 2.2 484 97.8 125 25.8 11 2.3Madera 3 3 . . 3 100.0 3 100.0 . .Marin 6 6 . . 6 100.0 3 50.0 . .Mariposa . . . . . . . . . .Mendocino . . . . . . . . . .Merced 15 15 . . 15 100.0 6 40.0 1 6.7Modoc . . . . . . . . . .Mono . . . . . . . . . .Monterey 11 11 . . 11 100.0 2 18.2 . .Napa 2 2 . . 2 100.0 1 50.0 . .Nevada 1 1 . . 1 100.0 . . . .Orange 133 128 7 5.5 121 94.5 20 16.5 2 1.7Pasadena 2 2 . . 2 100.0 2 100.0 1 50.0Placer 4 4 . . 4 100.0 . . . .Plumas . . . . . . . . . .Riverside 41 37 1 2.7 36 97.3 6 16.7 1 2.8Sacramento 67 67 . . 67 100.0 20 29.9 . .San Benito 1 1 . . 1 100.0 . . . .San Bernardino 54 52 2 3.8 50 96.2 14 28.0 1 2.0San Diego 195 195 9 4.6 186 95.4 30 16.1 3 1.6San Francisco 74 68 4 5.9 64 94.1 17 26.6 3 4.7San Joaquin 48 46 5 10.9 41 89.1 14 34.1 1 2.4San Luis Obispo 2 2 . . 2 100.0 . . . .San Mateo 36 34 1 2.9 33 97.1 4 12.1 . .Santa Barbara 15 14 . . 14 100.0 . . . .Santa Clara 138 131 1 0.8 130 99.2 22 16.9 2 1.5Santa Cruz 2 2 1 50.0 1 50.0 . . . .Shasta 4 4 . . 4 100.0 1 25.0 1 25.0
Miliary
Abnormal CXR, Consistent with TB
CXR Done
Total Pulmonary
CasesReporting Jurisdiction
Normal CXR Total Abnormal Cavity
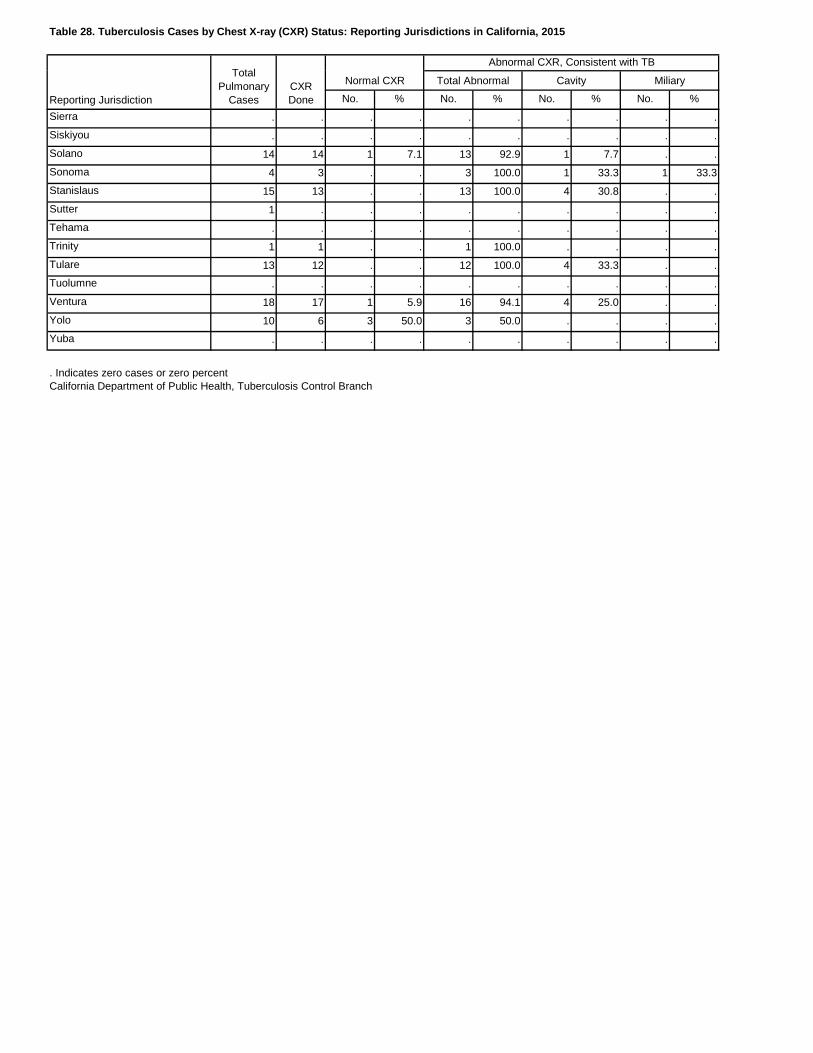
Table 28. Tuberculosis Cases by Chest X-ray (CXR) Status: Reporting Jurisdictions in California, 2015
No. % No. % No. % No. %
Miliary
Abnormal CXR, Consistent with TB
CXR Done
Total Pulmonary
CasesReporting Jurisdiction
Normal CXR Total Abnormal Cavity
Sierra . . . . . . . . . .Siskiyou . . . . . . . . . .Solano 14 14 1 7.1 13 92.9 1 7.7 . .Sonoma 4 3 . . 3 100.0 1 33.3 1 33.3Stanislaus 15 13 . . 13 100.0 4 30.8 . .Sutter 1 . . . . . . . . .Tehama . . . . . . . . . .Trinity 1 1 . . 1 100.0 . . . .Tulare 13 12 . . 12 100.0 4 33.3 . .Tuolumne . . . . . . . . . .Ventura 18 17 1 5.9 16 94.1 4 25.0 . .Yolo 10 6 3 50.0 3 50.0 . . . .Yuba . . . . . . . . . .
. Indicates zero cases or zero percentCalifornia Department of Public Health, Tuberculosis Control Branch
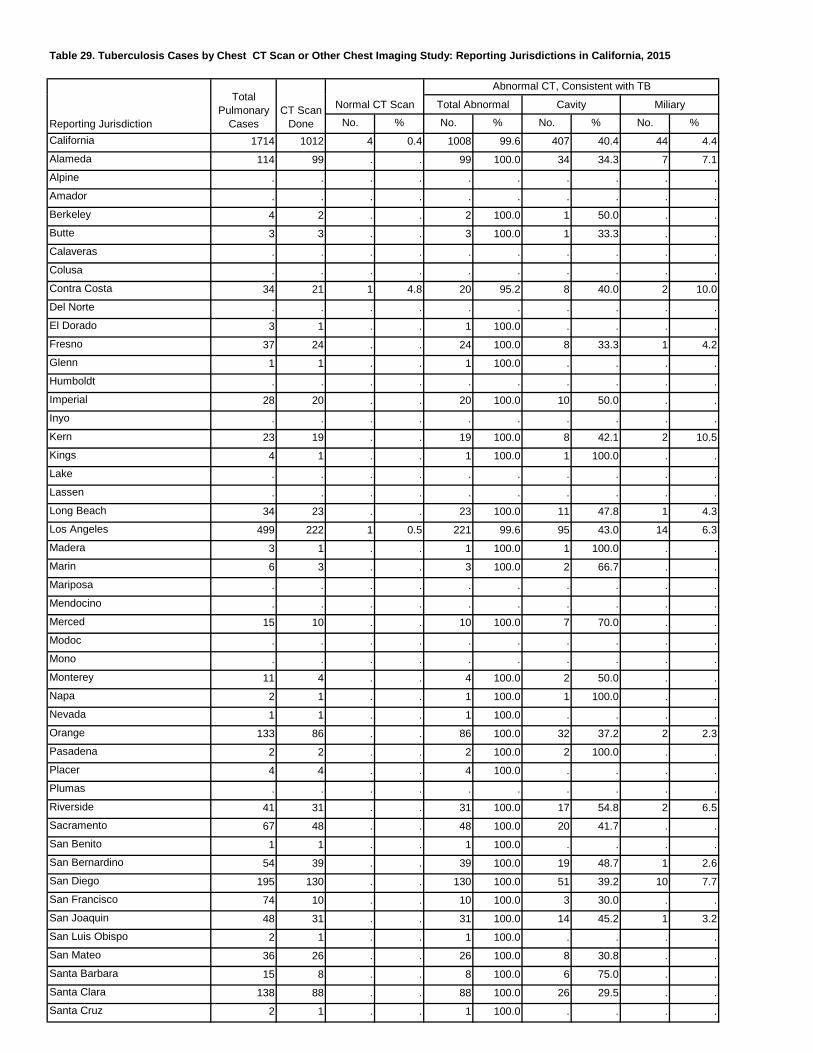
Table 29. Tuberculosis Cases by Chest CT Scan or Other Chest Imaging Study: Reporting Jurisdictions in California, 2015
No. % No. % No. % No. %California 1714 1012 4 0.4 1008 99.6 407 40.4 44 4.4Alameda 114 99 . . 99 100.0 34 34.3 7 7.1Alpine . . . . . . . . . .Amador . . . . . . . . . .Berkeley 4 2 . . 2 100.0 1 50.0 . .Butte 3 3 . . 3 100.0 1 33.3 . .Calaveras . . . . . . . . . .Colusa . . . . . . . . . .Contra Costa 34 21 1 4.8 20 95.2 8 40.0 2 10.0Del Norte . . . . . . . . . .El Dorado 3 1 . . 1 100.0 . . . .Fresno 37 24 . . 24 100.0 8 33.3 1 4.2Glenn 1 1 . . 1 100.0 . . . .Humboldt . . . . . . . . . .Imperial 28 20 . . 20 100.0 10 50.0 . .Inyo . . . . . . . . . .Kern 23 19 . . 19 100.0 8 42.1 2 10.5Kings 4 1 . . 1 100.0 1 100.0 . .Lake . . . . . . . . . .Lassen . . . . . . . . . .Long Beach 34 23 . . 23 100.0 11 47.8 1 4.3Los Angeles 499 222 1 0.5 221 99.6 95 43.0 14 6.3Madera 3 1 . . 1 100.0 1 100.0 . .Marin 6 3 . . 3 100.0 2 66.7 . .Mariposa . . . . . . . . . .Mendocino . . . . . . . . . .Merced 15 10 . . 10 100.0 7 70.0 . .Modoc . . . . . . . . . .Mono . . . . . . . . . .Monterey 11 4 . . 4 100.0 2 50.0 . .Napa 2 1 . . 1 100.0 1 100.0 . .Nevada 1 1 . . 1 100.0 . . . .Orange 133 86 . . 86 100.0 32 37.2 2 2.3Pasadena 2 2 . . 2 100.0 2 100.0 . .Placer 4 4 . . 4 100.0 . . . .Plumas . . . . . . . . . .Riverside 41 31 . . 31 100.0 17 54.8 2 6.5Sacramento 67 48 . . 48 100.0 20 41.7 . .San Benito 1 1 . . 1 100.0 . . . .San Bernardino 54 39 . . 39 100.0 19 48.7 1 2.6San Diego 195 130 . . 130 100.0 51 39.2 10 7.7San Francisco 74 10 . . 10 100.0 3 30.0 . .San Joaquin 48 31 . . 31 100.0 14 45.2 1 3.2San Luis Obispo 2 1 . . 1 100.0 . . . .San Mateo 36 26 . . 26 100.0 8 30.8 . .Santa Barbara 15 8 . . 8 100.0 6 75.0 . .Santa Clara 138 88 . . 88 100.0 26 29.5 . .Santa Cruz 2 1 . . 1 100.0 . . . .
Miliary
Abnormal CT, Consistent with TB
CT Scan Done
Total Pulmonary
CasesReporting Jurisdiction
Normal CT Scan Total Abnormal Cavity
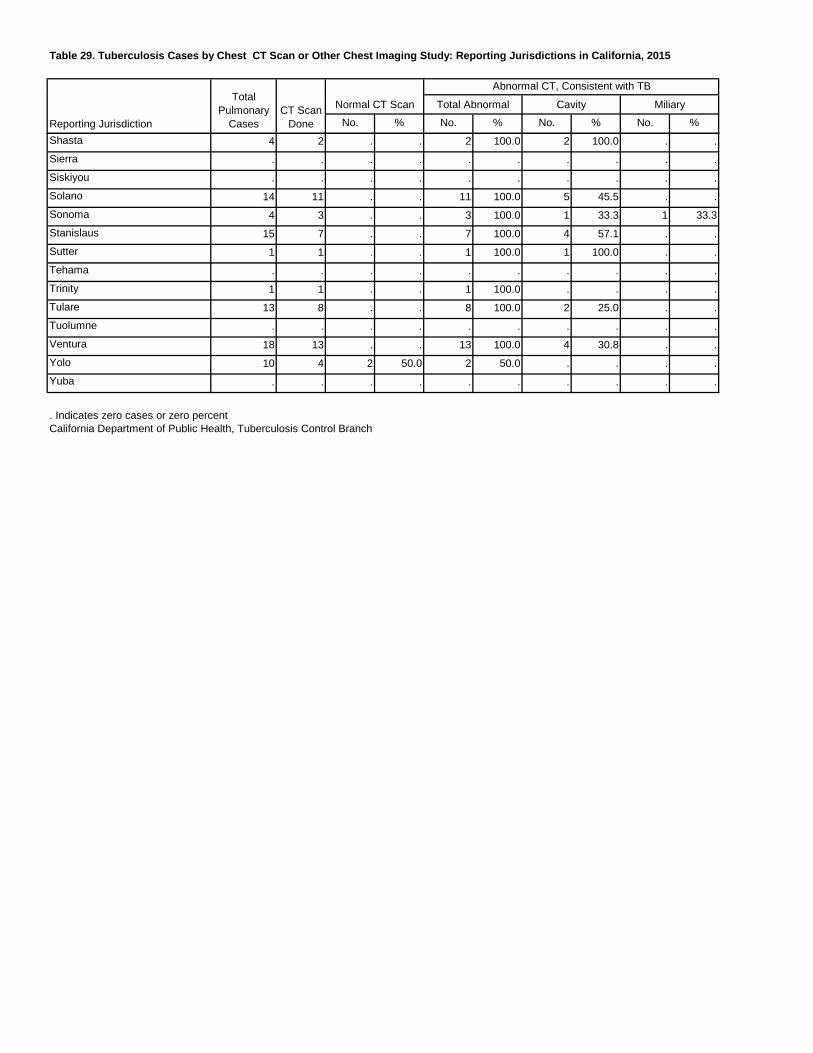
Table 29. Tuberculosis Cases by Chest CT Scan or Other Chest Imaging Study: Reporting Jurisdictions in California, 2015
No. % No. % No. % No. %
Miliary
Abnormal CT, Consistent with TB
CT Scan Done
Total Pulmonary
CasesReporting Jurisdiction
Normal CT Scan Total Abnormal Cavity
Shasta 4 2 . . 2 100.0 2 100.0 . .Sierra . . . . . . . . . .Siskiyou . . . . . . . . . .Solano 14 11 . . 11 100.0 5 45.5 . .Sonoma 4 3 . . 3 100.0 1 33.3 1 33.3Stanislaus 15 7 . . 7 100.0 4 57.1 . .Sutter 1 1 . . 1 100.0 1 100.0 . .Tehama . . . . . . . . . .Trinity 1 1 . . 1 100.0 . . . .Tulare 13 8 . . 8 100.0 2 25.0 . .Tuolumne . . . . . . . . . .Ventura 18 13 . . 13 100.0 4 30.8 . .Yolo 10 4 2 50.0 2 50.0 . . . .Yuba . . . . . . . . . .
. Indicates zero cases or zero percentCalifornia Department of Public Health, Tuberculosis Control Branch
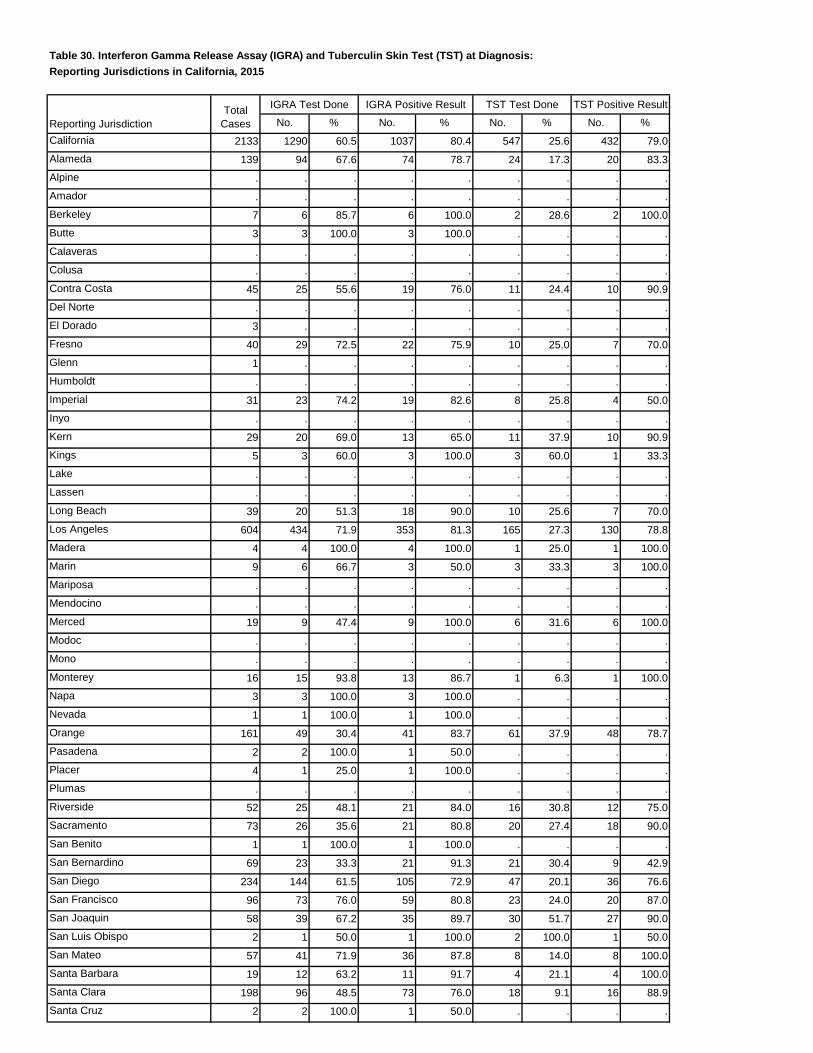
Table 30. Interferon Gamma Release Assay (IGRA) and Tuberculin Skin Test (TST) at Diagnosis:Reporting Jurisdictions in California, 2015
No. % No. % No. % No. %California 2133 1290 60.5 1037 80.4 547 25.6 432 79.0Alameda 139 94 67.6 74 78.7 24 17.3 20 83.3Alpine . . . . . . . . .Amador . . . . . . . . .Berkeley 7 6 85.7 6 100.0 2 28.6 2 100.0Butte 3 3 100.0 3 100.0 . . . .Calaveras . . . . . . . . .Colusa . . . . . . . . .Contra Costa 45 25 55.6 19 76.0 11 24.4 10 90.9Del Norte . . . . . . . . .El Dorado 3 . . . . . . . .Fresno 40 29 72.5 22 75.9 10 25.0 7 70.0Glenn 1 . . . . . . . .Humboldt . . . . . . . . .Imperial 31 23 74.2 19 82.6 8 25.8 4 50.0Inyo . . . . . . . . .Kern 29 20 69.0 13 65.0 11 37.9 10 90.9Kings 5 3 60.0 3 100.0 3 60.0 1 33.3Lake . . . . . . . . .Lassen . . . . . . . . .Long Beach 39 20 51.3 18 90.0 10 25.6 7 70.0Los Angeles 604 434 71.9 353 81.3 165 27.3 130 78.8Madera 4 4 100.0 4 100.0 1 25.0 1 100.0Marin 9 6 66.7 3 50.0 3 33.3 3 100.0Mariposa . . . . . . . . .Mendocino . . . . . . . . .Merced 19 9 47.4 9 100.0 6 31.6 6 100.0Modoc . . . . . . . . .Mono . . . . . . . . .Monterey 16 15 93.8 13 86.7 1 6.3 1 100.0Napa 3 3 100.0 3 100.0 . . . .Nevada 1 1 100.0 1 100.0 . . . .Orange 161 49 30.4 41 83.7 61 37.9 48 78.7Pasadena 2 2 100.0 1 50.0 . . . .Placer 4 1 25.0 1 100.0 . . . .Plumas . . . . . . . . .Riverside 52 25 48.1 21 84.0 16 30.8 12 75.0Sacramento 73 26 35.6 21 80.8 20 27.4 18 90.0San Benito 1 1 100.0 1 100.0 . . . .San Bernardino 69 23 33.3 21 91.3 21 30.4 9 42.9San Diego 234 144 61.5 105 72.9 47 20.1 36 76.6San Francisco 96 73 76.0 59 80.8 23 24.0 20 87.0San Joaquin 58 39 67.2 35 89.7 30 51.7 27 90.0San Luis Obispo 2 1 50.0 1 100.0 2 100.0 1 50.0San Mateo 57 41 71.9 36 87.8 8 14.0 8 100.0Santa Barbara 19 12 63.2 11 91.7 4 21.1 4 100.0Santa Clara 198 96 48.5 73 76.0 18 9.1 16 88.9Santa Cruz 2 2 100.0 1 50.0 . . . .
TST Positive Result
Reporting JurisdictionTotal
Cases
IGRA Test Done IGRA Positive Result TST Test Done
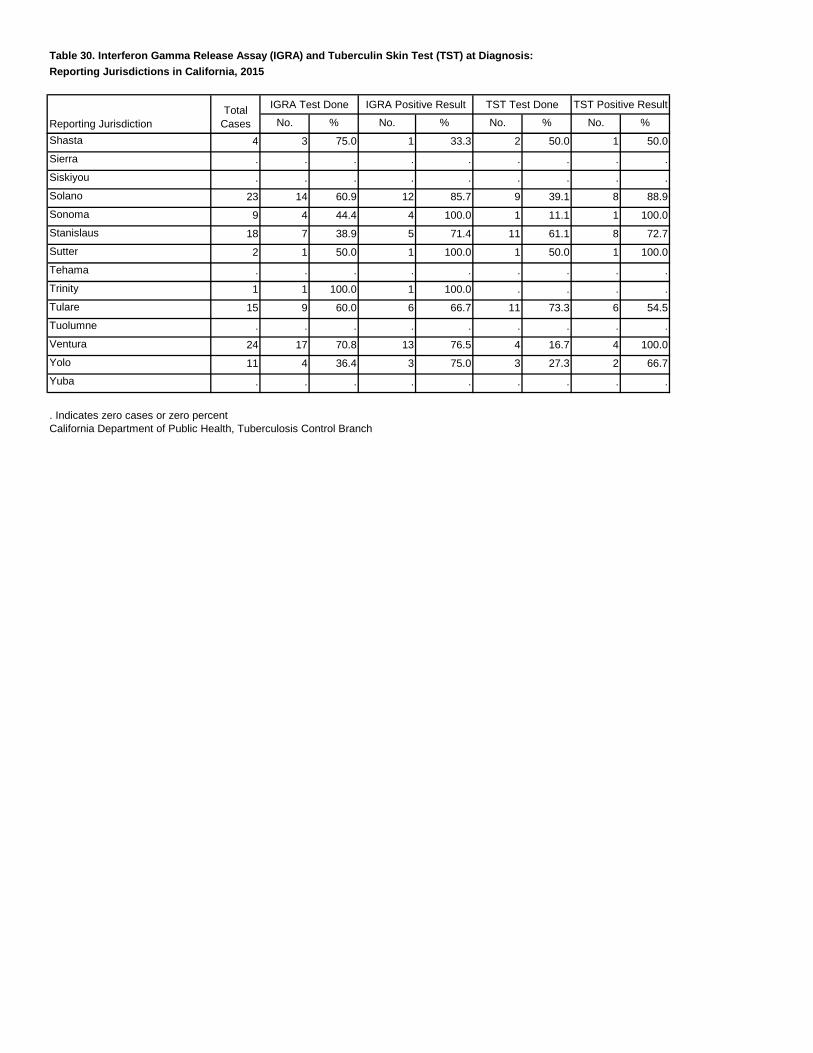
Table 30. Interferon Gamma Release Assay (IGRA) and Tuberculin Skin Test (TST) at Diagnosis:Reporting Jurisdictions in California, 2015
No. % No. % No. % No. %
TST Positive Result
Reporting JurisdictionTotal
Cases
IGRA Test Done IGRA Positive Result TST Test Done
Shasta 4 3 75.0 1 33.3 2 50.0 1 50.0Sierra . . . . . . . . .Siskiyou . . . . . . . . .Solano 23 14 60.9 12 85.7 9 39.1 8 88.9Sonoma 9 4 44.4 4 100.0 1 11.1 1 100.0Stanislaus 18 7 38.9 5 71.4 11 61.1 8 72.7Sutter 2 1 50.0 1 100.0 1 50.0 1 100.0Tehama . . . . . . . . .Trinity 1 1 100.0 1 100.0 . . . .Tulare 15 9 60.0 6 66.7 11 73.3 6 54.5Tuolumne . . . . . . . . .Ventura 24 17 70.8 13 76.5 4 16.7 4 100.0Yolo 11 4 36.4 3 75.0 3 27.3 2 66.7Yuba . . . . . . . . .
. Indicates zero cases or zero percentCalifornia Department of Public Health, Tuberculosis Control Branch
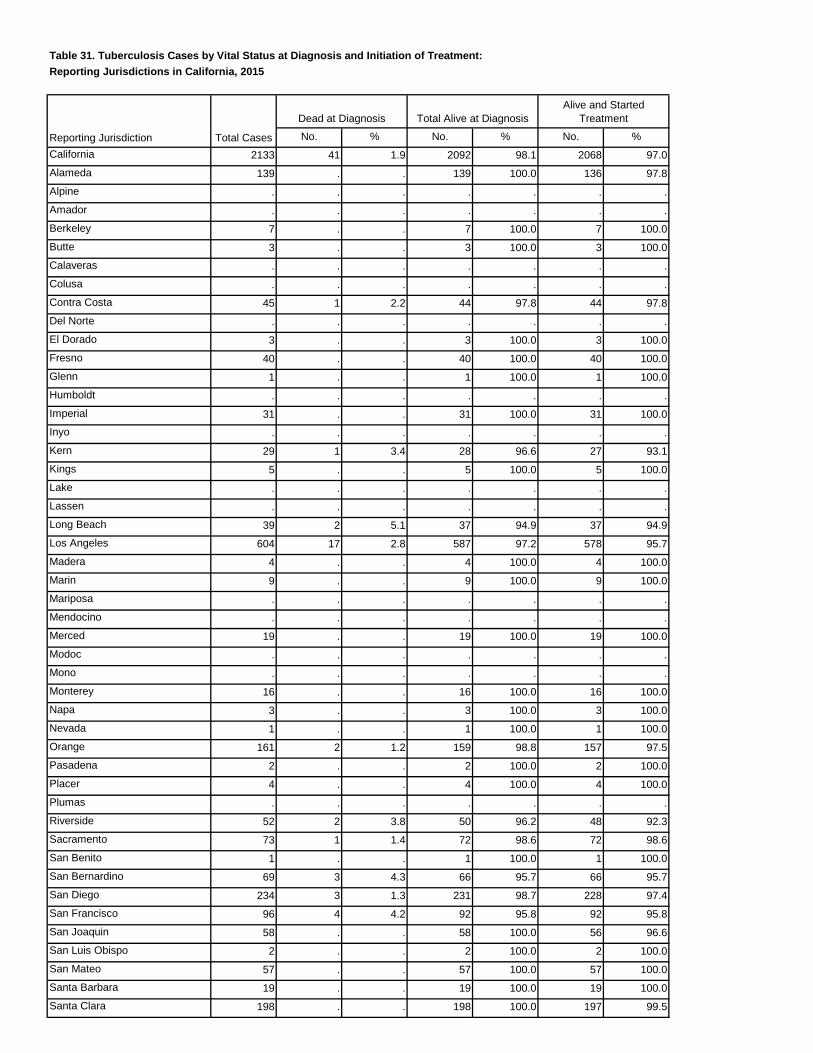
Table 31. Tuberculosis Cases by Vital Status at Diagnosis and Initiation of Treatment:Reporting Jurisdictions in California, 2015
No. % No. % No. %California 2133 41 1.9 2092 98.1 2068 97.0Alameda 139 . . 139 100.0 136 97.8Alpine . . . . . . .Amador . . . . . . .Berkeley 7 . . 7 100.0 7 100.0Butte 3 . . 3 100.0 3 100.0Calaveras . . . . . . .Colusa . . . . . . .Contra Costa 45 1 2.2 44 97.8 44 97.8Del Norte . . . . . . .El Dorado 3 . . 3 100.0 3 100.0Fresno 40 . . 40 100.0 40 100.0Glenn 1 . . 1 100.0 1 100.0Humboldt . . . . . . .Imperial 31 . . 31 100.0 31 100.0Inyo . . . . . . .Kern 29 1 3.4 28 96.6 27 93.1Kings 5 . . 5 100.0 5 100.0Lake . . . . . . .Lassen . . . . . . .Long Beach 39 2 5.1 37 94.9 37 94.9Los Angeles 604 17 2.8 587 97.2 578 95.7Madera 4 . . 4 100.0 4 100.0Marin 9 . . 9 100.0 9 100.0Mariposa . . . . . . .Mendocino . . . . . . .Merced 19 . . 19 100.0 19 100.0Modoc . . . . . . .Mono . . . . . . .Monterey 16 . . 16 100.0 16 100.0Napa 3 . . 3 100.0 3 100.0Nevada 1 . . 1 100.0 1 100.0Orange 161 2 1.2 159 98.8 157 97.5Pasadena 2 . . 2 100.0 2 100.0Placer 4 . . 4 100.0 4 100.0Plumas . . . . . . .Riverside 52 2 3.8 50 96.2 48 92.3Sacramento 73 1 1.4 72 98.6 72 98.6San Benito 1 . . 1 100.0 1 100.0San Bernardino 69 3 4.3 66 95.7 66 95.7San Diego 234 3 1.3 231 98.7 228 97.4San Francisco 96 4 4.2 92 95.8 92 95.8San Joaquin 58 . . 58 100.0 56 96.6San Luis Obispo 2 . . 2 100.0 2 100.0San Mateo 57 . . 57 100.0 57 100.0Santa Barbara 19 . . 19 100.0 19 100.0Santa Clara 198 . . 198 100.0 197 99.5
Reporting Jurisdiction Total Cases
Dead at Diagnosis Total Alive at DiagnosisAlive and Started
Treatment
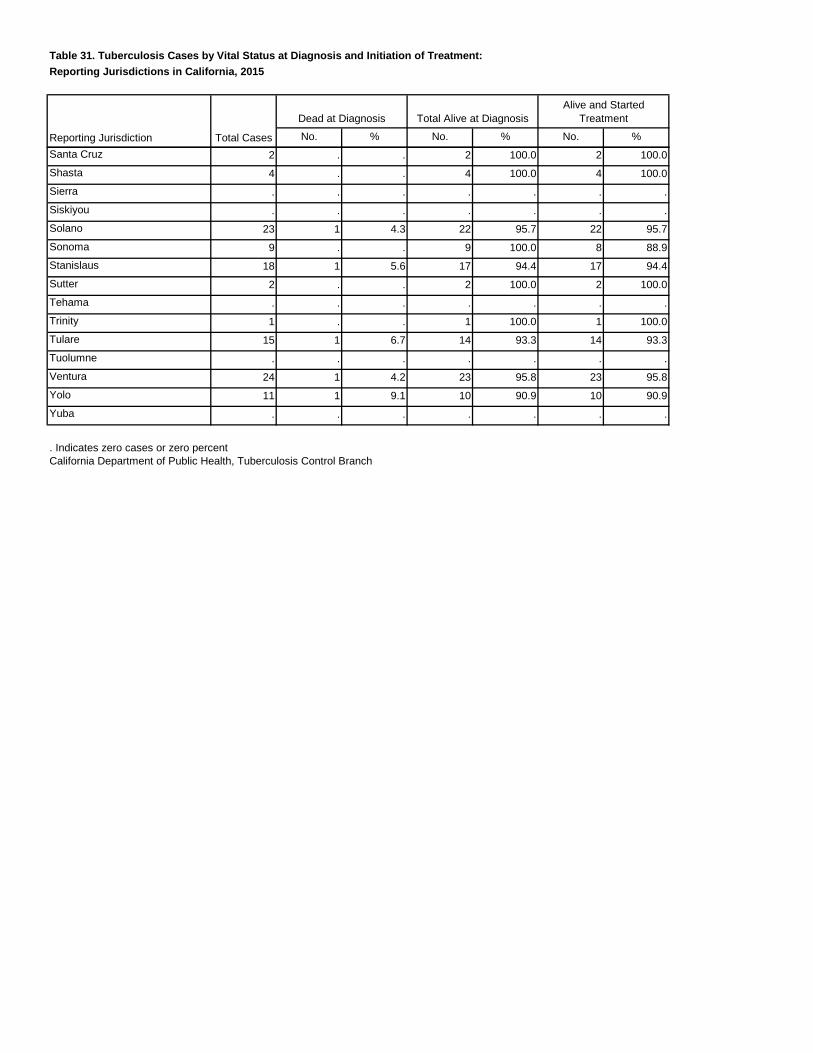
Table 31. Tuberculosis Cases by Vital Status at Diagnosis and Initiation of Treatment:Reporting Jurisdictions in California, 2015
No. % No. % No. %Reporting Jurisdiction Total Cases
Dead at Diagnosis Total Alive at DiagnosisAlive and Started
Treatment
Santa Cruz 2 . . 2 100.0 2 100.0Shasta 4 . . 4 100.0 4 100.0Sierra . . . . . . .Siskiyou . . . . . . .Solano 23 1 4.3 22 95.7 22 95.7Sonoma 9 . . 9 100.0 8 88.9Stanislaus 18 1 5.6 17 94.4 17 94.4Sutter 2 . . 2 100.0 2 100.0Tehama . . . . . . .Trinity 1 . . 1 100.0 1 100.0Tulare 15 1 6.7 14 93.3 14 93.3Tuolumne . . . . . . .Ventura 24 1 4.2 23 95.8 23 95.8Yolo 11 1 9.1 10 90.9 10 90.9Yuba . . . . . . .
. Indicates zero cases or zero percentCalifornia Department of Public Health, Tuberculosis Control Branch
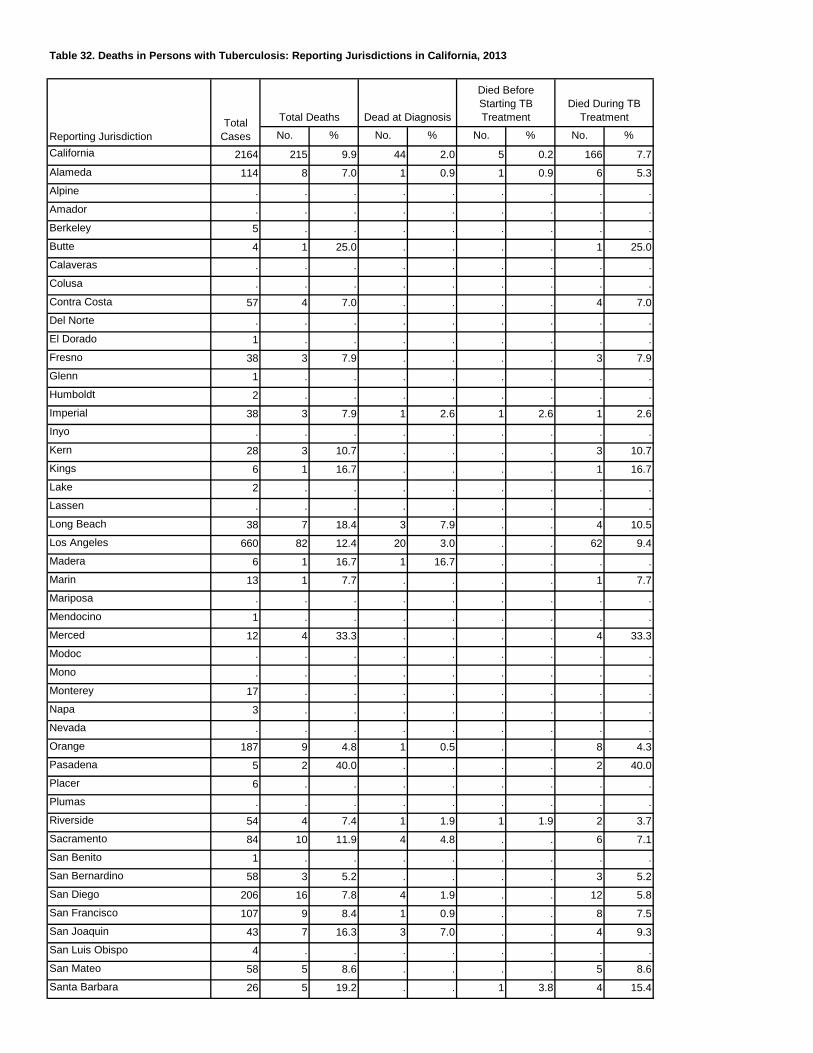
Table 32. Deaths in Persons with Tuberculosis: Reporting Jurisdictions in California, 2013
No. % No. % No. % No. %California 2164 215 9.9 44 2.0 5 0.2 166 7.7Alameda 114 8 7.0 1 0.9 1 0.9 6 5.3Alpine . . . . . . . . .Amador . . . . . . . . .Berkeley 5 . . . . . . . .Butte 4 1 25.0 . . . . 1 25.0Calaveras . . . . . . . . .Colusa . . . . . . . . .Contra Costa 57 4 7.0 . . . . 4 7.0Del Norte . . . . . . . . .El Dorado 1 . . . . . . . .Fresno 38 3 7.9 . . . . 3 7.9Glenn 1 . . . . . . . .Humboldt 2 . . . . . . . .Imperial 38 3 7.9 1 2.6 1 2.6 1 2.6Inyo . . . . . . . . .Kern 28 3 10.7 . . . . 3 10.7Kings 6 1 16.7 . . . . 1 16.7Lake 2 . . . . . . . .Lassen . . . . . . . . .Long Beach 38 7 18.4 3 7.9 . . 4 10.5Los Angeles 660 82 12.4 20 3.0 . . 62 9.4Madera 6 1 16.7 1 16.7 . . . .Marin 13 1 7.7 . . . . 1 7.7Mariposa . . . . . . . . .Mendocino 1 . . . . . . . .Merced 12 4 33.3 . . . . 4 33.3Modoc . . . . . . . . .Mono . . . . . . . . .Monterey 17 . . . . . . . .Napa 3 . . . . . . . .Nevada . . . . . . . . .Orange 187 9 4.8 1 0.5 . . 8 4.3Pasadena 5 2 40.0 . . . . 2 40.0Placer 6 . . . . . . . .Plumas . . . . . . . . .Riverside 54 4 7.4 1 1.9 1 1.9 2 3.7Sacramento 84 10 11.9 4 4.8 . . 6 7.1San Benito 1 . . . . . . . .San Bernardino 58 3 5.2 . . . . 3 5.2San Diego 206 16 7.8 4 1.9 . . 12 5.8San Francisco 107 9 8.4 1 0.9 . . 8 7.5San Joaquin 43 7 16.3 3 7.0 . . 4 9.3San Luis Obispo 4 . . . . . . . .San Mateo 58 5 8.6 . . . . 5 8.6Santa Barbara 26 5 19.2 . . 1 3.8 4 15.4
Died During TB Treatment
Reporting JurisdictionTotal
Cases
Total Deaths Dead at Diagnosis
Died Before Starting TB Treatment
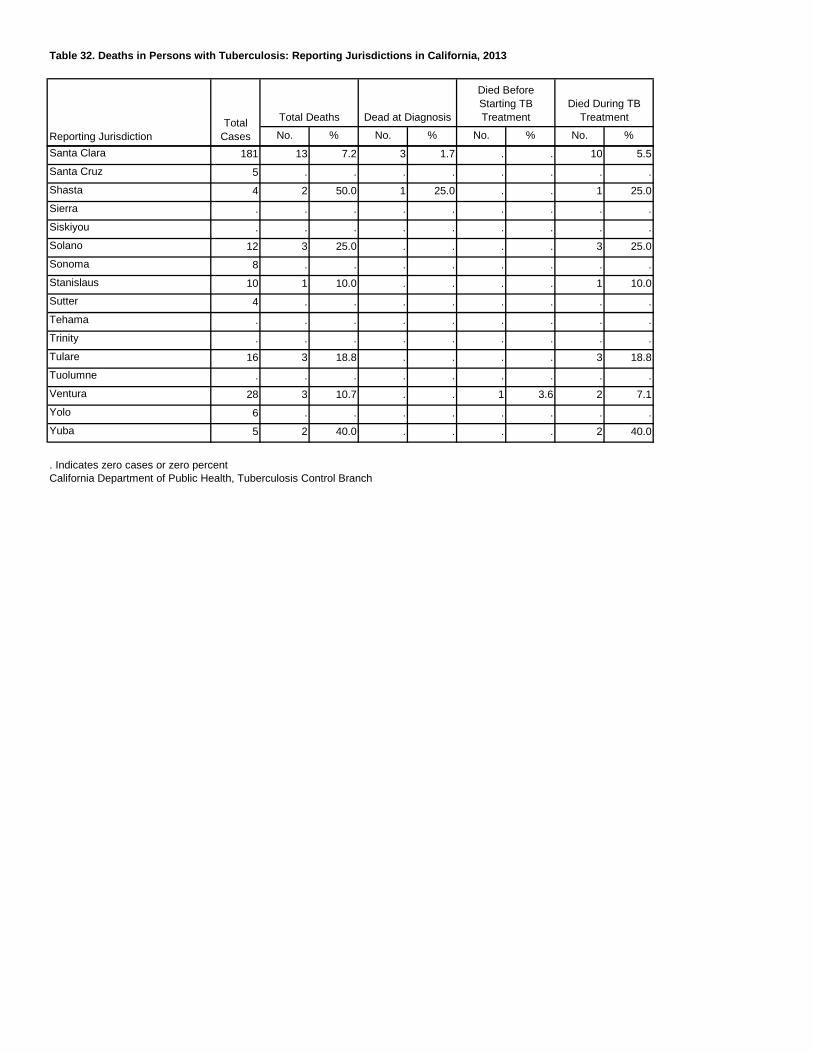
Table 32. Deaths in Persons with Tuberculosis: Reporting Jurisdictions in California, 2013
No. % No. % No. % No. %
Died During TB Treatment
Reporting JurisdictionTotal
Cases
Total Deaths Dead at Diagnosis
Died Before Starting TB Treatment
Santa Clara 181 13 7.2 3 1.7 . . 10 5.5Santa Cruz 5 . . . . . . . .Shasta 4 2 50.0 1 25.0 . . 1 25.0Sierra . . . . . . . . .Siskiyou . . . . . . . . .Solano 12 3 25.0 . . . . 3 25.0Sonoma 8 . . . . . . . .Stanislaus 10 1 10.0 . . . . 1 10.0Sutter 4 . . . . . . . .Tehama . . . . . . . . .Trinity . . . . . . . . .Tulare 16 3 18.8 . . . . 3 18.8Tuolumne . . . . . . . . .Ventura 28 3 10.7 . . 1 3.6 2 7.1Yolo 6 . . . . . . . .Yuba 5 2 40.0 . . . . 2 40.0
. Indicates zero cases or zero percentCalifornia Department of Public Health, Tuberculosis Control Branch
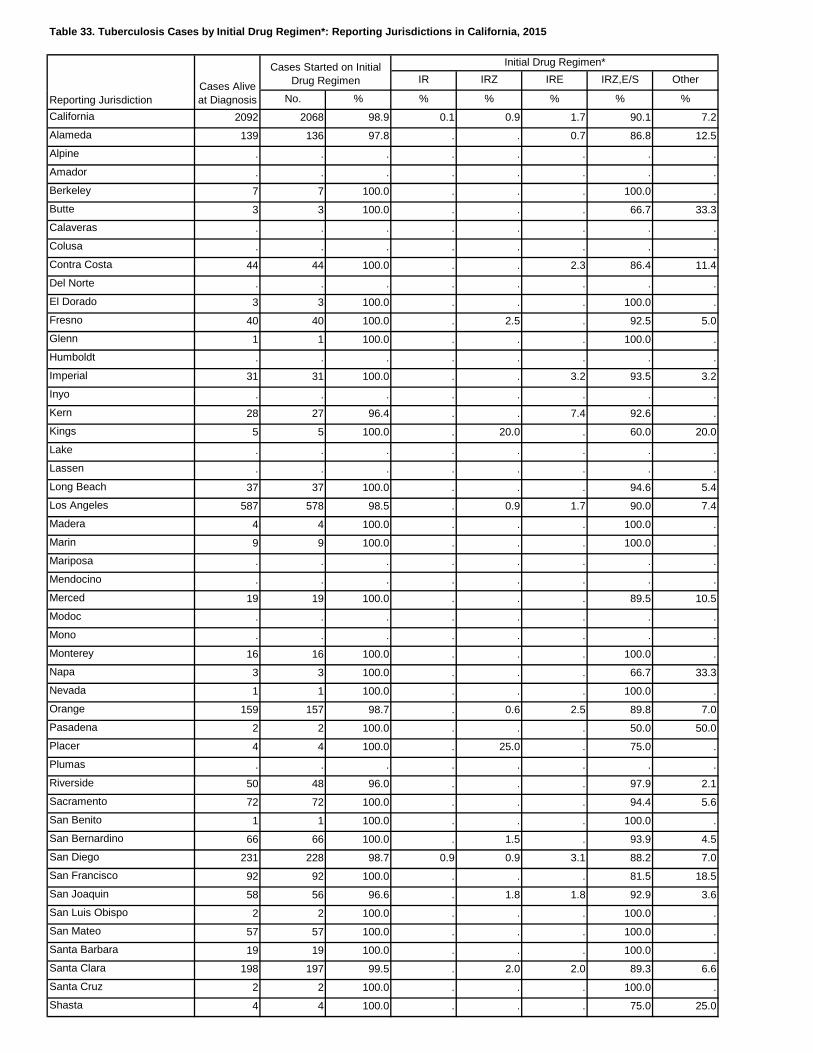
Table 33. Tuberculosis Cases by Initial Drug Regimen*: Reporting Jurisdictions in California, 2015
IR IRZ IRE IRZ,E/S Other
No. % % % % % %California 2092 2068 98.9 0.1 0.9 1.7 90.1 7.2Alameda 139 136 97.8 . . 0.7 86.8 12.5Alpine . . . . . . . .Amador . . . . . . . .Berkeley 7 7 100.0 . . . 100.0 .Butte 3 3 100.0 . . . 66.7 33.3Calaveras . . . . . . . .Colusa . . . . . . . .Contra Costa 44 44 100.0 . . 2.3 86.4 11.4Del Norte . . . . . . . .El Dorado 3 3 100.0 . . . 100.0 .Fresno 40 40 100.0 . 2.5 . 92.5 5.0Glenn 1 1 100.0 . . . 100.0 .Humboldt . . . . . . . .Imperial 31 31 100.0 . . 3.2 93.5 3.2Inyo . . . . . . . .Kern 28 27 96.4 . . 7.4 92.6 .Kings 5 5 100.0 . 20.0 . 60.0 20.0Lake . . . . . . . .Lassen . . . . . . . .Long Beach 37 37 100.0 . . . 94.6 5.4Los Angeles 587 578 98.5 . 0.9 1.7 90.0 7.4Madera 4 4 100.0 . . . 100.0 .Marin 9 9 100.0 . . . 100.0 .Mariposa . . . . . . . .Mendocino . . . . . . . .Merced 19 19 100.0 . . . 89.5 10.5Modoc . . . . . . . .Mono . . . . . . . .Monterey 16 16 100.0 . . . 100.0 .Napa 3 3 100.0 . . . 66.7 33.3Nevada 1 1 100.0 . . . 100.0 .Orange 159 157 98.7 . 0.6 2.5 89.8 7.0Pasadena 2 2 100.0 . . . 50.0 50.0Placer 4 4 100.0 . 25.0 . 75.0 .Plumas . . . . . . . .Riverside 50 48 96.0 . . . 97.9 2.1Sacramento 72 72 100.0 . . . 94.4 5.6San Benito 1 1 100.0 . . . 100.0 .San Bernardino 66 66 100.0 . 1.5 . 93.9 4.5San Diego 231 228 98.7 0.9 0.9 3.1 88.2 7.0San Francisco 92 92 100.0 . . . 81.5 18.5San Joaquin 58 56 96.6 . 1.8 1.8 92.9 3.6San Luis Obispo 2 2 100.0 . . . 100.0 .San Mateo 57 57 100.0 . . . 100.0 .Santa Barbara 19 19 100.0 . . . 100.0 .Santa Clara 198 197 99.5 . 2.0 2.0 89.3 6.6Santa Cruz 2 2 100.0 . . . 100.0 .Shasta 4 4 100.0 . . . 75.0 25.0
Reporting JurisdictionCases Alive at Diagnosis
Initial Drug Regimen*Cases Started on Initial Drug Regimen

Table 33. Tuberculosis Cases by Initial Drug Regimen*: Reporting Jurisdictions in California, 2015
IR IRZ IRE IRZ,E/S Other
No. % % % % % %Reporting JurisdictionCases Alive at Diagnosis
Initial Drug Regimen*Cases Started on Initial Drug Regimen
Sierra . . . . . . . .Siskiyou . . . . . . . .Solano 22 22 100.0 . 4.5 . 95.5 .Sonoma 9 8 88.9 . . . 87.5 12.5Stanislaus 17 17 100.0 . . . 100.0 .Sutter 2 2 100.0 . . . 100.0 .Tehama . . . . . . . .Trinity 1 1 100.0 . . . 100.0 .Tulare 14 14 100.0 . . . 100.0 .Tuolumne . . . . . . . .Ventura 23 23 100.0 . . 13.0 82.6 4.3Yolo 10 10 100.0 . . 10.0 60.0 30.0Yuba . . . . . . . .
. Indicates zero cases or zero percent* I=isoniazid; R=rifampin; Z=pyrazinamide; E=ethambutol; E/S=ethambutol and/or streptomycin; Other=all other combinationsCalifornia Department of Public Health, Tuberculosis Control Branch
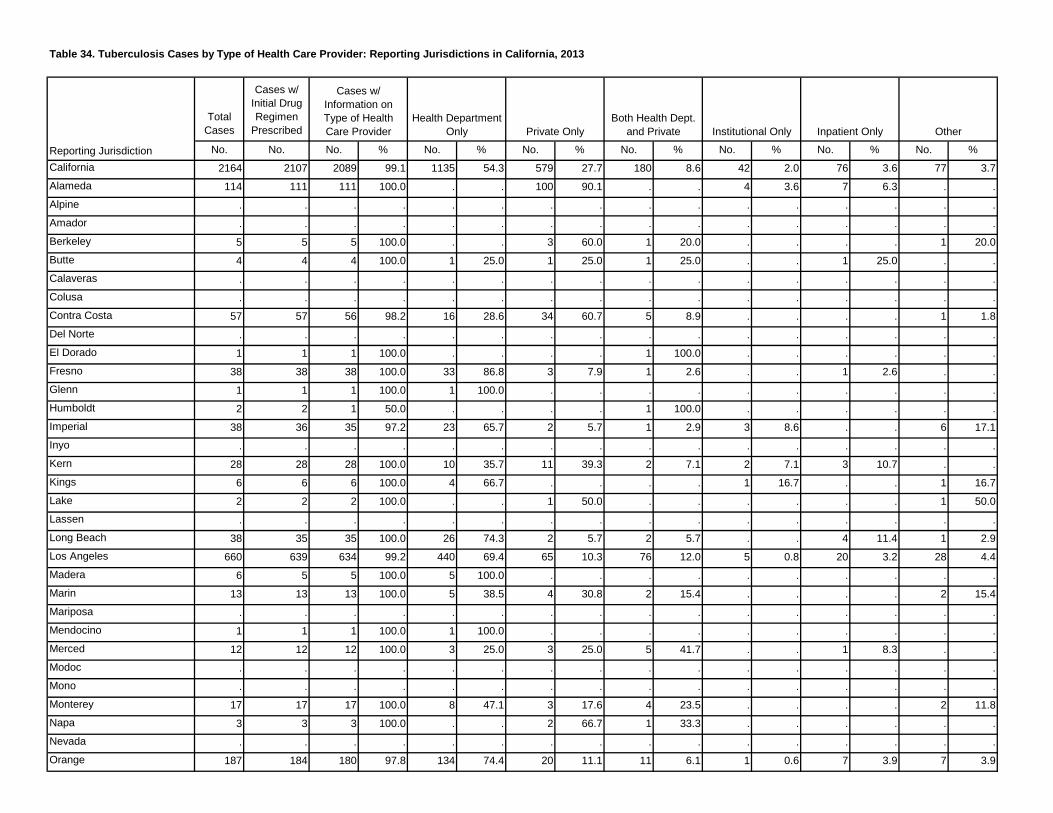
Table 34. Tuberculosis Cases by Type of Health Care Provider: Reporting Jurisdictions in California, 2013
Total Cases
Cases w/ Initial Drug Regimen
Prescribed
No. No. No. % No. % No. % No. % No. % No. % No. %California 2164 2107 2089 99.1 1135 54.3 579 27.7 180 8.6 42 2.0 76 3.6 77 3.7Alameda 114 111 111 100.0 . . 100 90.1 . . 4 3.6 7 6.3 . .Alpine . . . . . . . . . . . . . . . .Amador . . . . . . . . . . . . . . . .Berkeley 5 5 5 100.0 . . 3 60.0 1 20.0 . . . . 1 20.0Butte 4 4 4 100.0 1 25.0 1 25.0 1 25.0 . . 1 25.0 . .Calaveras . . . . . . . . . . . . . . . .Colusa . . . . . . . . . . . . . . . .Contra Costa 57 57 56 98.2 16 28.6 34 60.7 5 8.9 . . . . 1 1.8Del Norte . . . . . . . . . . . . . . . .El Dorado 1 1 1 100.0 . . . . 1 100.0 . . . . . .Fresno 38 38 38 100.0 33 86.8 3 7.9 1 2.6 . . 1 2.6 . .Glenn 1 1 1 100.0 1 100.0 . . . . . . . . . .Humboldt 2 2 1 50.0 . . . . 1 100.0 . . . . . .Imperial 38 36 35 97.2 23 65.7 2 5.7 1 2.9 3 8.6 . . 6 17.1Inyo . . . . . . . . . . . . . . . .Kern 28 28 28 100.0 10 35.7 11 39.3 2 7.1 2 7.1 3 10.7 . .Kings 6 6 6 100.0 4 66.7 . . . . 1 16.7 . . 1 16.7Lake 2 2 2 100.0 . . 1 50.0 . . . . . . 1 50.0Lassen . . . . . . . . . . . . . . . .Long Beach 38 35 35 100.0 26 74.3 2 5.7 2 5.7 . . 4 11.4 1 2.9Los Angeles 660 639 634 99.2 440 69.4 65 10.3 76 12.0 5 0.8 20 3.2 28 4.4Madera 6 5 5 100.0 5 100.0 . . . . . . . . . .Marin 13 13 13 100.0 5 38.5 4 30.8 2 15.4 . . . . 2 15.4Mariposa . . . . . . . . . . . . . . . .Mendocino 1 1 1 100.0 1 100.0 . . . . . . . . . .Merced 12 12 12 100.0 3 25.0 3 25.0 5 41.7 . . 1 8.3 . .Modoc . . . . . . . . . . . . . . . .Mono . . . . . . . . . . . . . . . .Monterey 17 17 17 100.0 8 47.1 3 17.6 4 23.5 . . . . 2 11.8Napa 3 3 3 100.0 . . 2 66.7 1 33.3 . . . . . .Nevada . . . . . . . . . . . . . . . .Orange 187 184 180 97.8 134 74.4 20 11.1 11 6.1 1 0.6 7 3.9 7 3.9
Inpatient Only Other
Reporting Jurisdiction
Cases w/ Information on Type of Health Care Provider
Health Department Only Private Only
Both Health Dept. and Private Institutional Only
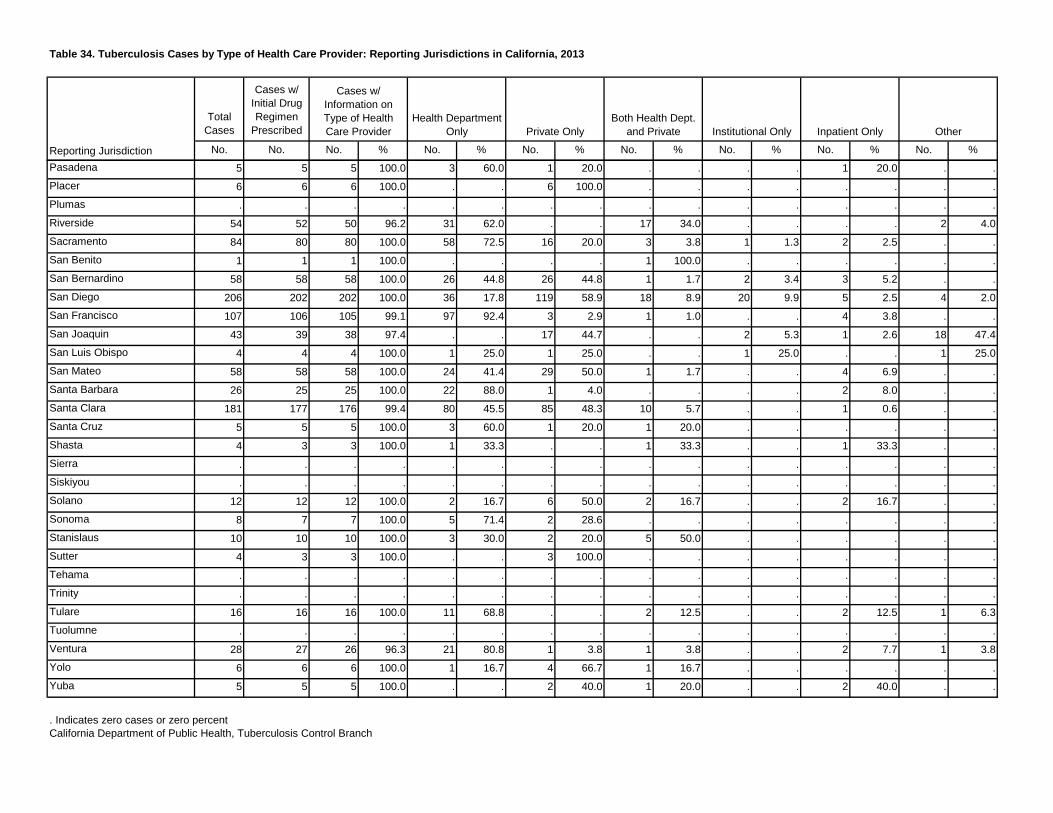
Table 34. Tuberculosis Cases by Type of Health Care Provider: Reporting Jurisdictions in California, 2013
Total Cases
Cases w/ Initial Drug Regimen
Prescribed
No. No. No. % No. % No. % No. % No. % No. % No. %
Inpatient Only Other
Reporting Jurisdiction
Cases w/ Information on Type of Health Care Provider
Health Department Only Private Only
Both Health Dept. and Private Institutional Only
Pasadena 5 5 5 100.0 3 60.0 1 20.0 . . . . 1 20.0 . .Placer 6 6 6 100.0 . . 6 100.0 . . . . . . . .Plumas . . . . . . . . . . . . . . . .Riverside 54 52 50 96.2 31 62.0 . . 17 34.0 . . . . 2 4.0Sacramento 84 80 80 100.0 58 72.5 16 20.0 3 3.8 1 1.3 2 2.5 . .San Benito 1 1 1 100.0 . . . . 1 100.0 . . . . . .San Bernardino 58 58 58 100.0 26 44.8 26 44.8 1 1.7 2 3.4 3 5.2 . .San Diego 206 202 202 100.0 36 17.8 119 58.9 18 8.9 20 9.9 5 2.5 4 2.0San Francisco 107 106 105 99.1 97 92.4 3 2.9 1 1.0 . . 4 3.8 . .San Joaquin 43 39 38 97.4 . . 17 44.7 . . 2 5.3 1 2.6 18 47.4San Luis Obispo 4 4 4 100.0 1 25.0 1 25.0 . . 1 25.0 . . 1 25.0San Mateo 58 58 58 100.0 24 41.4 29 50.0 1 1.7 . . 4 6.9 . .Santa Barbara 26 25 25 100.0 22 88.0 1 4.0 . . . . 2 8.0 . .Santa Clara 181 177 176 99.4 80 45.5 85 48.3 10 5.7 . . 1 0.6 . .Santa Cruz 5 5 5 100.0 3 60.0 1 20.0 1 20.0 . . . . . .Shasta 4 3 3 100.0 1 33.3 . . 1 33.3 . . 1 33.3 . .Sierra . . . . . . . . . . . . . . . .Siskiyou . . . . . . . . . . . . . . . .Solano 12 12 12 100.0 2 16.7 6 50.0 2 16.7 . . 2 16.7 . .Sonoma 8 7 7 100.0 5 71.4 2 28.6 . . . . . . . .Stanislaus 10 10 10 100.0 3 30.0 2 20.0 5 50.0 . . . . . .Sutter 4 3 3 100.0 . . 3 100.0 . . . . . . . .Tehama . . . . . . . . . . . . . . . .Trinity . . . . . . . . . . . . . . . .Tulare 16 16 16 100.0 11 68.8 . . 2 12.5 . . 2 12.5 1 6.3Tuolumne . . . . . . . . . . . . . . . .Ventura 28 27 26 96.3 21 80.8 1 3.8 1 3.8 . . 2 7.7 1 3.8Yolo 6 6 6 100.0 1 16.7 4 66.7 1 16.7 . . . . . .Yuba 5 5 5 100.0 . . 2 40.0 1 20.0 . . 2 40.0 . .
. Indicates zero cases or zero percentCalifornia Department of Public Health, Tuberculosis Control Branch
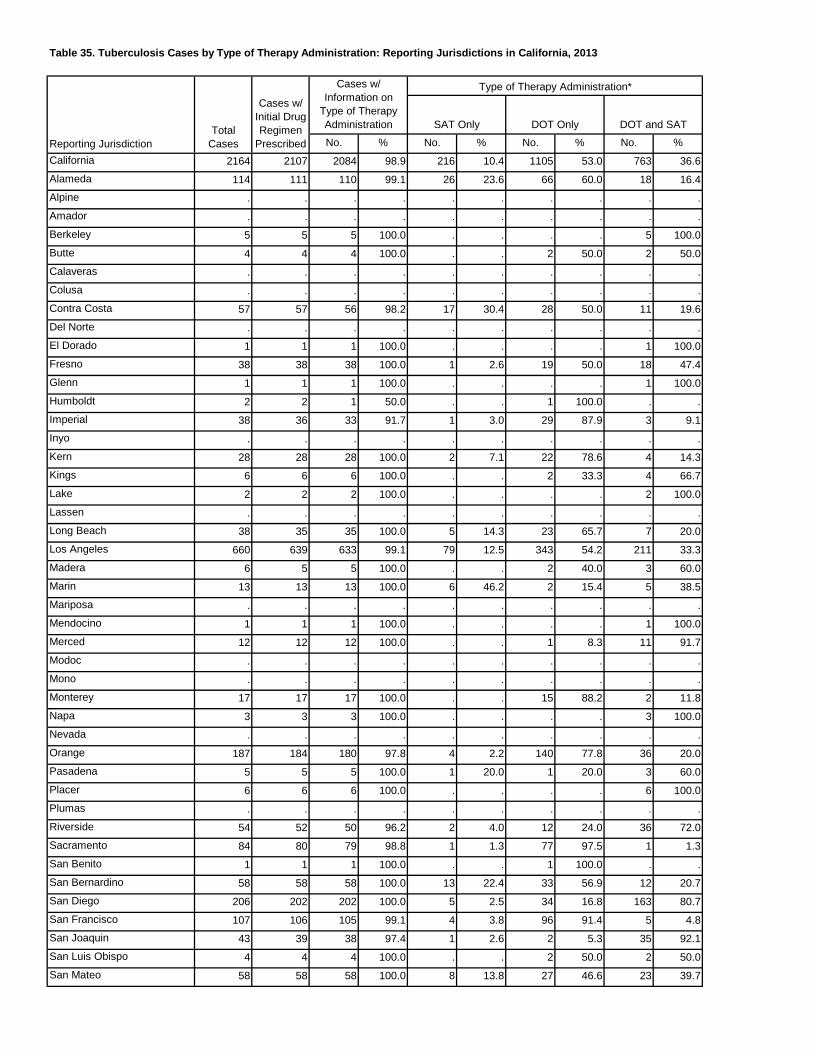
Table 35. Tuberculosis Cases by Type of Therapy Administration: Reporting Jurisdictions in California, 2013
No. % No. % No. % No. %California 2164 2107 2084 98.9 216 10.4 1105 53.0 763 36.6Alameda 114 111 110 99.1 26 23.6 66 60.0 18 16.4Alpine . . . . . . . . . .Amador . . . . . . . . . .Berkeley 5 5 5 100.0 . . . . 5 100.0Butte 4 4 4 100.0 . . 2 50.0 2 50.0Calaveras . . . . . . . . . .Colusa . . . . . . . . . .Contra Costa 57 57 56 98.2 17 30.4 28 50.0 11 19.6Del Norte . . . . . . . . . .El Dorado 1 1 1 100.0 . . . . 1 100.0Fresno 38 38 38 100.0 1 2.6 19 50.0 18 47.4Glenn 1 1 1 100.0 . . . . 1 100.0Humboldt 2 2 1 50.0 . . 1 100.0 . .Imperial 38 36 33 91.7 1 3.0 29 87.9 3 9.1Inyo . . . . . . . . . .Kern 28 28 28 100.0 2 7.1 22 78.6 4 14.3Kings 6 6 6 100.0 . . 2 33.3 4 66.7Lake 2 2 2 100.0 . . . . 2 100.0Lassen . . . . . . . . . .Long Beach 38 35 35 100.0 5 14.3 23 65.7 7 20.0Los Angeles 660 639 633 99.1 79 12.5 343 54.2 211 33.3Madera 6 5 5 100.0 . . 2 40.0 3 60.0Marin 13 13 13 100.0 6 46.2 2 15.4 5 38.5Mariposa . . . . . . . . . .Mendocino 1 1 1 100.0 . . . . 1 100.0Merced 12 12 12 100.0 . . 1 8.3 11 91.7Modoc . . . . . . . . . .Mono . . . . . . . . . .Monterey 17 17 17 100.0 . . 15 88.2 2 11.8Napa 3 3 3 100.0 . . . . 3 100.0Nevada . . . . . . . . . .Orange 187 184 180 97.8 4 2.2 140 77.8 36 20.0Pasadena 5 5 5 100.0 1 20.0 1 20.0 3 60.0Placer 6 6 6 100.0 . . . . 6 100.0Plumas . . . . . . . . . .Riverside 54 52 50 96.2 2 4.0 12 24.0 36 72.0Sacramento 84 80 79 98.8 1 1.3 77 97.5 1 1.3San Benito 1 1 1 100.0 . . 1 100.0 . .San Bernardino 58 58 58 100.0 13 22.4 33 56.9 12 20.7San Diego 206 202 202 100.0 5 2.5 34 16.8 163 80.7San Francisco 107 106 105 99.1 4 3.8 96 91.4 5 4.8San Joaquin 43 39 38 97.4 1 2.6 2 5.3 35 92.1San Luis Obispo 4 4 4 100.0 . . 2 50.0 2 50.0San Mateo 58 58 58 100.0 8 13.8 27 46.6 23 39.7
Reporting Jurisdiction
SAT Only DOT Only DOT and SAT
Type of Therapy Administration*
Total Cases
Cases w/ Initial Drug Regimen
Prescribed
Cases w/ Information on
Type of Therapy Administration
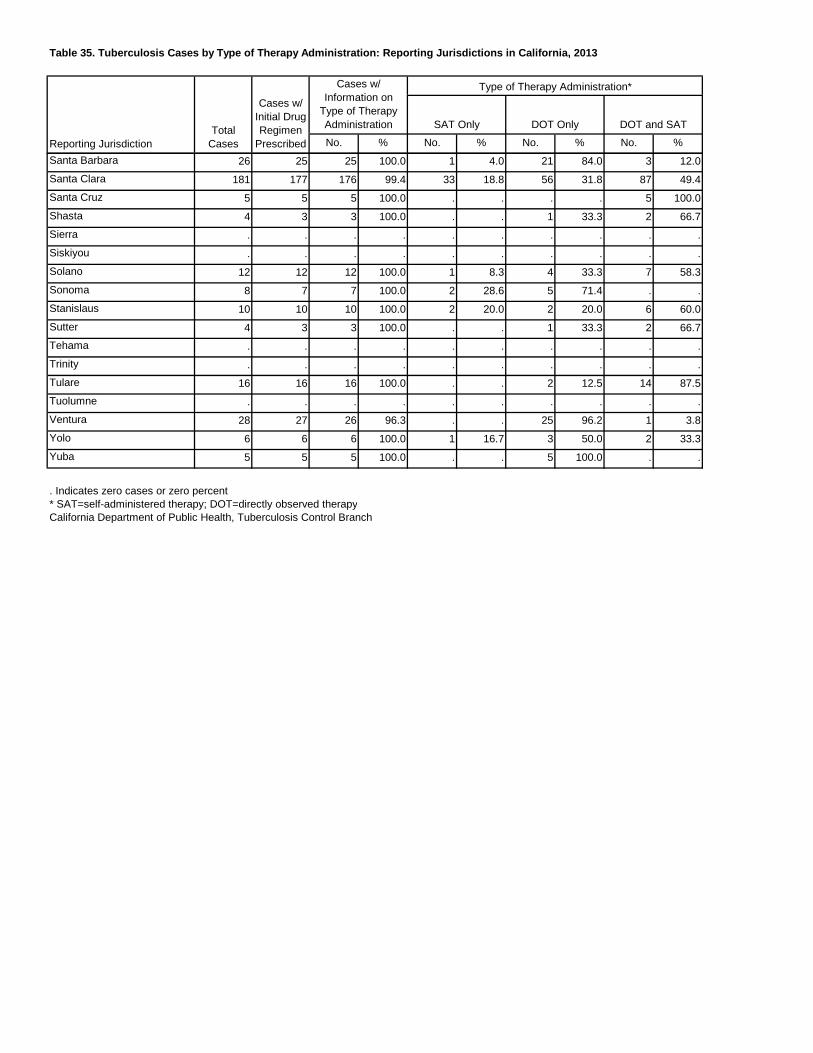
Table 35. Tuberculosis Cases by Type of Therapy Administration: Reporting Jurisdictions in California, 2013
No. % No. % No. % No. %Reporting Jurisdiction
SAT Only DOT Only DOT and SAT
Type of Therapy Administration*
Total Cases
Cases w/ Initial Drug Regimen
Prescribed
Cases w/ Information on
Type of Therapy Administration
Santa Barbara 26 25 25 100.0 1 4.0 21 84.0 3 12.0Santa Clara 181 177 176 99.4 33 18.8 56 31.8 87 49.4Santa Cruz 5 5 5 100.0 . . . . 5 100.0Shasta 4 3 3 100.0 . . 1 33.3 2 66.7Sierra . . . . . . . . . .Siskiyou . . . . . . . . . .Solano 12 12 12 100.0 1 8.3 4 33.3 7 58.3Sonoma 8 7 7 100.0 2 28.6 5 71.4 . .Stanislaus 10 10 10 100.0 2 20.0 2 20.0 6 60.0Sutter 4 3 3 100.0 . . 1 33.3 2 66.7Tehama . . . . . . . . . .Trinity . . . . . . . . . .Tulare 16 16 16 100.0 . . 2 12.5 14 87.5Tuolumne . . . . . . . . . .Ventura 28 27 26 96.3 . . 25 96.2 1 3.8Yolo 6 6 6 100.0 1 16.7 3 50.0 2 33.3Yuba 5 5 5 100.0 . . 5 100.0 . .
. Indicates zero cases or zero percent* SAT=self-administered therapy; DOT=directly observed therapyCalifornia Department of Public Health, Tuberculosis Control Branch
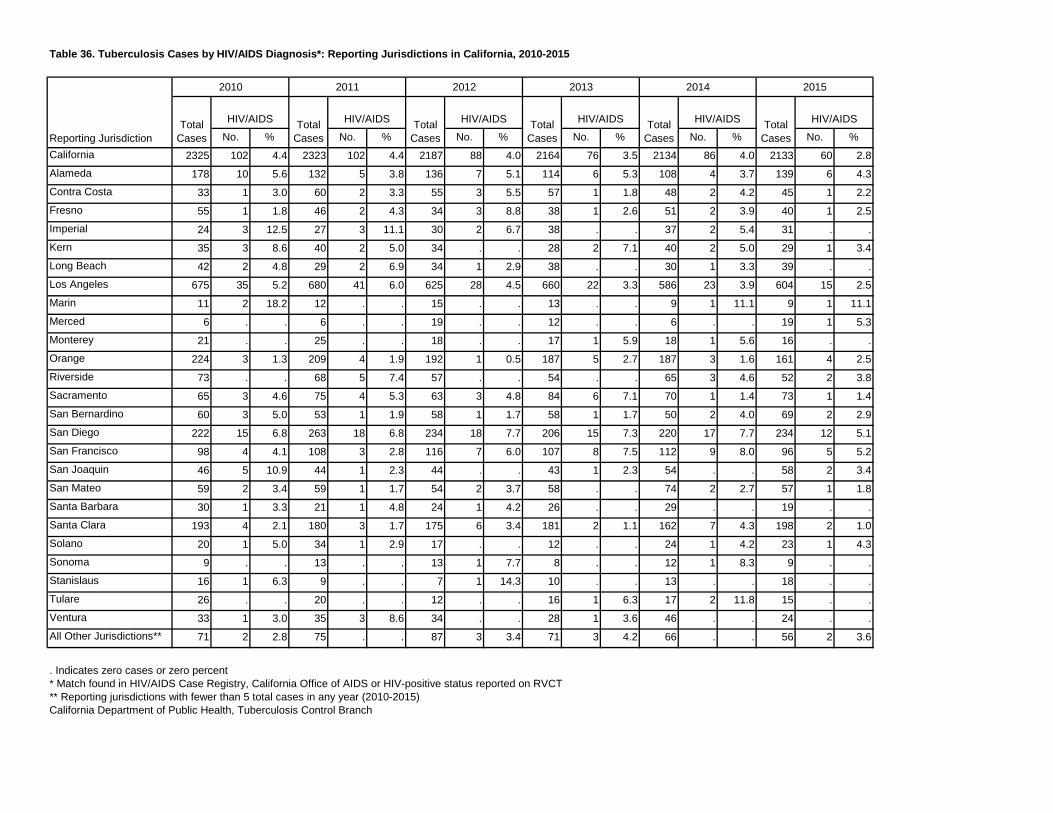
Table 36. Tuberculosis Cases by HIV/AIDS Diagnosis*: Reporting Jurisdictions in California, 2010-2015
No. % No. % No. % No. % No. % No. %California 2325 102 4.4 2323 102 4.4 2187 88 4.0 2164 76 3.5 2134 86 4.0 2133 60 2.8Alameda 178 10 5.6 132 5 3.8 136 7 5.1 114 6 5.3 108 4 3.7 139 6 4.3Contra Costa 33 1 3.0 60 2 3.3 55 3 5.5 57 1 1.8 48 2 4.2 45 1 2.2Fresno 55 1 1.8 46 2 4.3 34 3 8.8 38 1 2.6 51 2 3.9 40 1 2.5Imperial 24 3 12.5 27 3 11.1 30 2 6.7 38 . . 37 2 5.4 31 . .Kern 35 3 8.6 40 2 5.0 34 . . 28 2 7.1 40 2 5.0 29 1 3.4Long Beach 42 2 4.8 29 2 6.9 34 1 2.9 38 . . 30 1 3.3 39 . .Los Angeles 675 35 5.2 680 41 6.0 625 28 4.5 660 22 3.3 586 23 3.9 604 15 2.5Marin 11 2 18.2 12 . . 15 . . 13 . . 9 1 11.1 9 1 11.1Merced 6 . . 6 . . 19 . . 12 . . 6 . . 19 1 5.3Monterey 21 . . 25 . . 18 . . 17 1 5.9 18 1 5.6 16 . .Orange 224 3 1.3 209 4 1.9 192 1 0.5 187 5 2.7 187 3 1.6 161 4 2.5Riverside 73 . . 68 5 7.4 57 . . 54 . . 65 3 4.6 52 2 3.8Sacramento 65 3 4.6 75 4 5.3 63 3 4.8 84 6 7.1 70 1 1.4 73 1 1.4San Bernardino 60 3 5.0 53 1 1.9 58 1 1.7 58 1 1.7 50 2 4.0 69 2 2.9San Diego 222 15 6.8 263 18 6.8 234 18 7.7 206 15 7.3 220 17 7.7 234 12 5.1San Francisco 98 4 4.1 108 3 2.8 116 7 6.0 107 8 7.5 112 9 8.0 96 5 5.2San Joaquin 46 5 10.9 44 1 2.3 44 . . 43 1 2.3 54 . . 58 2 3.4San Mateo 59 2 3.4 59 1 1.7 54 2 3.7 58 . . 74 2 2.7 57 1 1.8Santa Barbara 30 1 3.3 21 1 4.8 24 1 4.2 26 . . 29 . . 19 . .Santa Clara 193 4 2.1 180 3 1.7 175 6 3.4 181 2 1.1 162 7 4.3 198 2 1.0Solano 20 1 5.0 34 1 2.9 17 . . 12 . . 24 1 4.2 23 1 4.3Sonoma 9 . . 13 . . 13 1 7.7 8 . . 12 1 8.3 9 . .Stanislaus 16 1 6.3 9 . . 7 1 14.3 10 . . 13 . . 18 . .Tulare 26 . . 20 . . 12 . . 16 1 6.3 17 2 11.8 15 . .Ventura 33 1 3.0 35 3 8.6 34 . . 28 1 3.6 46 . . 24 . .All Other Jurisdictions** 71 2 2.8 75 . . 87 3 3.4 71 3 4.2 66 . . 56 2 3.6
. Indicates zero cases or zero percent* Match found in HIV/AIDS Case Registry, California Office of AIDS or HIV-positive status reported on RVCT** Reporting jurisdictions with fewer than 5 total cases in any year (2010-2015)California Department of Public Health, Tuberculosis Control Branch
Total Cases
HIV/AIDS
2015
Total Cases
HIV/AIDS Total Cases
HIV/AIDS Total Cases
HIV/AIDS Total Cases
HIV/AIDS Total Cases
2014
HIV/AIDS
Reporting Jurisdiction
2010 2011 2012 2013
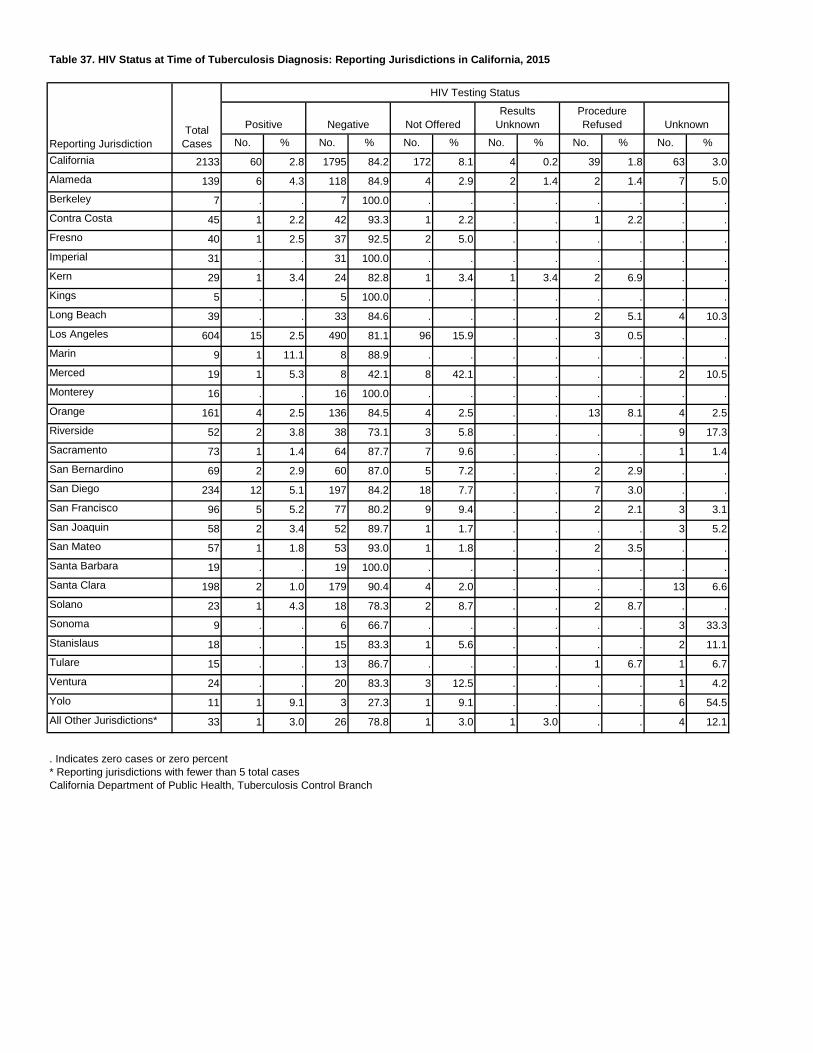
Table 37. HIV Status at Time of Tuberculosis Diagnosis: Reporting Jurisdictions in California, 2015
No. % No. % No. % No. % No. % No. %California 2133 60 2.8 1795 84.2 172 8.1 4 0.2 39 1.8 63 3.0Alameda 139 6 4.3 118 84.9 4 2.9 2 1.4 2 1.4 7 5.0Berkeley 7 . . 7 100.0 . . . . . . . .Contra Costa 45 1 2.2 42 93.3 1 2.2 . . 1 2.2 . .Fresno 40 1 2.5 37 92.5 2 5.0 . . . . . .Imperial 31 . . 31 100.0 . . . . . . . .Kern 29 1 3.4 24 82.8 1 3.4 1 3.4 2 6.9 . .Kings 5 . . 5 100.0 . . . . . . . .Long Beach 39 . . 33 84.6 . . . . 2 5.1 4 10.3Los Angeles 604 15 2.5 490 81.1 96 15.9 . . 3 0.5 . .Marin 9 1 11.1 8 88.9 . . . . . . . .Merced 19 1 5.3 8 42.1 8 42.1 . . . . 2 10.5Monterey 16 . . 16 100.0 . . . . . . . .Orange 161 4 2.5 136 84.5 4 2.5 . . 13 8.1 4 2.5Riverside 52 2 3.8 38 73.1 3 5.8 . . . . 9 17.3Sacramento 73 1 1.4 64 87.7 7 9.6 . . . . 1 1.4San Bernardino 69 2 2.9 60 87.0 5 7.2 . . 2 2.9 . .San Diego 234 12 5.1 197 84.2 18 7.7 . . 7 3.0 . .San Francisco 96 5 5.2 77 80.2 9 9.4 . . 2 2.1 3 3.1San Joaquin 58 2 3.4 52 89.7 1 1.7 . . . . 3 5.2San Mateo 57 1 1.8 53 93.0 1 1.8 . . 2 3.5 . .Santa Barbara 19 . . 19 100.0 . . . . . . . .Santa Clara 198 2 1.0 179 90.4 4 2.0 . . . . 13 6.6Solano 23 1 4.3 18 78.3 2 8.7 . . 2 8.7 . .Sonoma 9 . . 6 66.7 . . . . . . 3 33.3Stanislaus 18 . . 15 83.3 1 5.6 . . . . 2 11.1Tulare 15 . . 13 86.7 . . . . 1 6.7 1 6.7Ventura 24 . . 20 83.3 3 12.5 . . . . 1 4.2Yolo 11 1 9.1 3 27.3 1 9.1 . . . . 6 54.5All Other Jurisdictions* 33 1 3.0 26 78.8 1 3.0 1 3.0 . . 4 12.1
. Indicates zero cases or zero percent* Reporting jurisdictions with fewer than 5 total casesCalifornia Department of Public Health, Tuberculosis Control Branch
Reporting JurisdictionTotal
Cases
HIV Testing Status
Positive Negative Not Offered
, Results
UnknownProcedure Refused Unknown
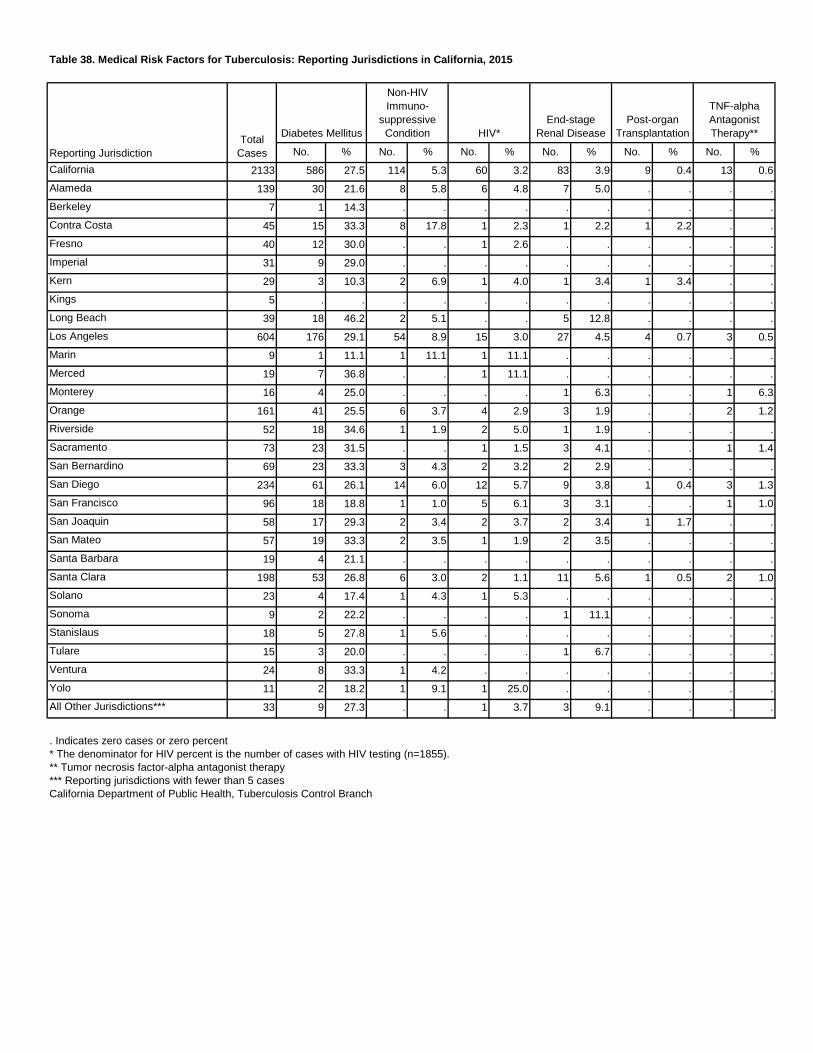
Table 38. Medical Risk Factors for Tuberculosis: Reporting Jurisdictions in California, 2015
No. % No. % No. % No. % No. % No. %California 2133 586 27.5 114 5.3 60 3.2 83 3.9 9 0.4 13 0.6Alameda 139 30 21.6 8 5.8 6 4.8 7 5.0 . . . .Berkeley 7 1 14.3 . . . . . . . . . .Contra Costa 45 15 33.3 8 17.8 1 2.3 1 2.2 1 2.2 . .Fresno 40 12 30.0 . . 1 2.6 . . . . . .Imperial 31 9 29.0 . . . . . . . . . .Kern 29 3 10.3 2 6.9 1 4.0 1 3.4 1 3.4 . .Kings 5 . . . . . . . . . . . .Long Beach 39 18 46.2 2 5.1 . . 5 12.8 . . . .Los Angeles 604 176 29.1 54 8.9 15 3.0 27 4.5 4 0.7 3 0.5Marin 9 1 11.1 1 11.1 1 11.1 . . . . . .Merced 19 7 36.8 . . 1 11.1 . . . . . .Monterey 16 4 25.0 . . . . 1 6.3 . . 1 6.3Orange 161 41 25.5 6 3.7 4 2.9 3 1.9 . . 2 1.2Riverside 52 18 34.6 1 1.9 2 5.0 1 1.9 . . . .Sacramento 73 23 31.5 . . 1 1.5 3 4.1 . . 1 1.4San Bernardino 69 23 33.3 3 4.3 2 3.2 2 2.9 . . . .San Diego 234 61 26.1 14 6.0 12 5.7 9 3.8 1 0.4 3 1.3San Francisco 96 18 18.8 1 1.0 5 6.1 3 3.1 . . 1 1.0San Joaquin 58 17 29.3 2 3.4 2 3.7 2 3.4 1 1.7 . .San Mateo 57 19 33.3 2 3.5 1 1.9 2 3.5 . . . .Santa Barbara 19 4 21.1 . . . . . . . . . .Santa Clara 198 53 26.8 6 3.0 2 1.1 11 5.6 1 0.5 2 1.0Solano 23 4 17.4 1 4.3 1 5.3 . . . . . .Sonoma 9 2 22.2 . . . . 1 11.1 . . . .Stanislaus 18 5 27.8 1 5.6 . . . . . . . .Tulare 15 3 20.0 . . . . 1 6.7 . . . .Ventura 24 8 33.3 1 4.2 . . . . . . . .Yolo 11 2 18.2 1 9.1 1 25.0 . . . . . .All Other Jurisdictions*** 33 9 27.3 . . 1 3.7 3 9.1 . . . .
. Indicates zero cases or zero percent* The denominator for HIV percent is the number of cases with HIV testing (n=1855).** Tumor necrosis factor-alpha antagonist therapy*** Reporting jurisdictions with fewer than 5 casesCalifornia Department of Public Health, Tuberculosis Control Branch
Post-organ Transplantation
TNF-alpha Antagonist Therapy**
Reporting JurisdictionTotal
Cases
Diabetes Mellitus
Non-HIV Immuno-
suppressive Condition HIV*
End-stage Renal Disease
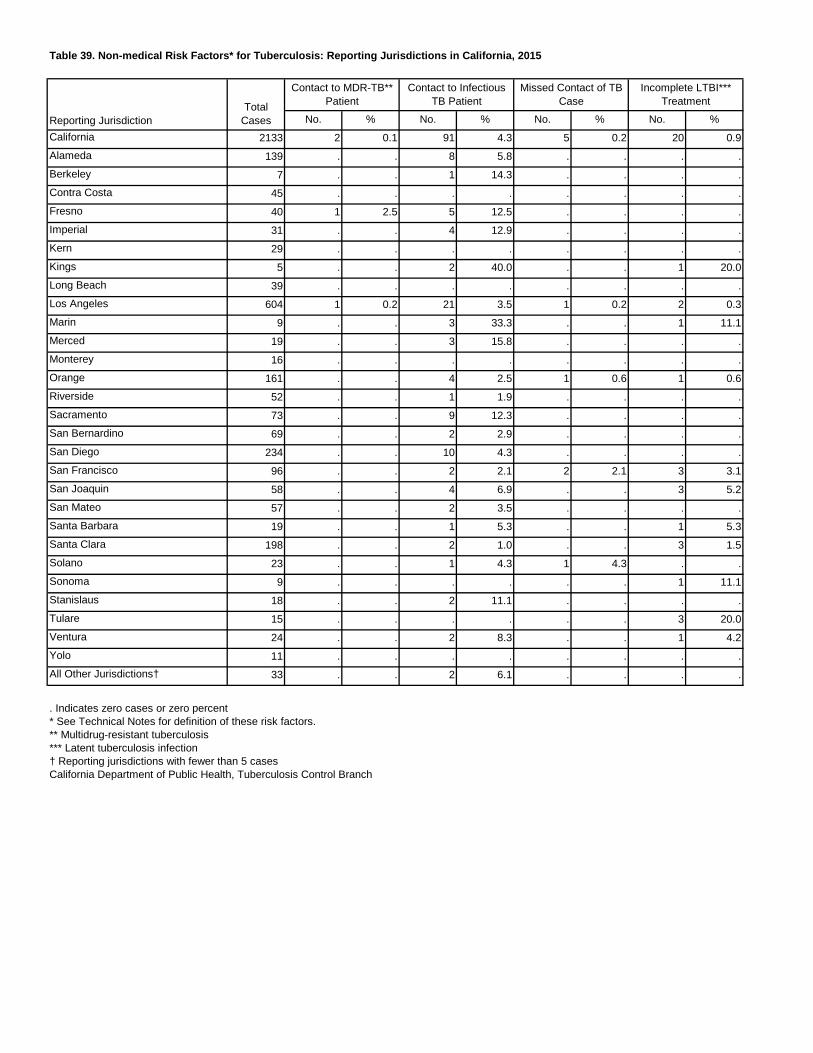
Table 39. Non-medical Risk Factors* for Tuberculosis: Reporting Jurisdictions in California, 2015
No. % No. % No. % No. %California 2133 2 0.1 91 4.3 5 0.2 20 0.9Alameda 139 . . 8 5.8 . . . .Berkeley 7 . . 1 14.3 . . . .Contra Costa 45 . . . . . . . .Fresno 40 1 2.5 5 12.5 . . . .Imperial 31 . . 4 12.9 . . . .Kern 29 . . . . . . . .Kings 5 . . 2 40.0 . . 1 20.0Long Beach 39 . . . . . . . .Los Angeles 604 1 0.2 21 3.5 1 0.2 2 0.3Marin 9 . . 3 33.3 . . 1 11.1Merced 19 . . 3 15.8 . . . .Monterey 16 . . . . . . . .Orange 161 . . 4 2.5 1 0.6 1 0.6Riverside 52 . . 1 1.9 . . . .Sacramento 73 . . 9 12.3 . . . .San Bernardino 69 . . 2 2.9 . . . .San Diego 234 . . 10 4.3 . . . .San Francisco 96 . . 2 2.1 2 2.1 3 3.1San Joaquin 58 . . 4 6.9 . . 3 5.2San Mateo 57 . . 2 3.5 . . . .Santa Barbara 19 . . 1 5.3 . . 1 5.3Santa Clara 198 . . 2 1.0 . . 3 1.5Solano 23 . . 1 4.3 1 4.3 . .Sonoma 9 . . . . . . 1 11.1Stanislaus 18 . . 2 11.1 . . . .Tulare 15 . . . . . . 3 20.0Ventura 24 . . 2 8.3 . . 1 4.2Yolo 11 . . . . . . . .All Other Jurisdictions† 33 . . 2 6.1 . . . .
. Indicates zero cases or zero percent* See Technical Notes for definition of these risk factors.** Multidrug-resistant tuberculosis*** Latent tuberculosis infection† Reporting jurisdictions with fewer than 5 casesCalifornia Department of Public Health, Tuberculosis Control Branch
Incomplete LTBI*** Treatment
Reporting JurisdictionTotal
Cases
Contact to MDR-TB** Patient
Contact to Infectious TB Patient
Missed Contact of TB Case
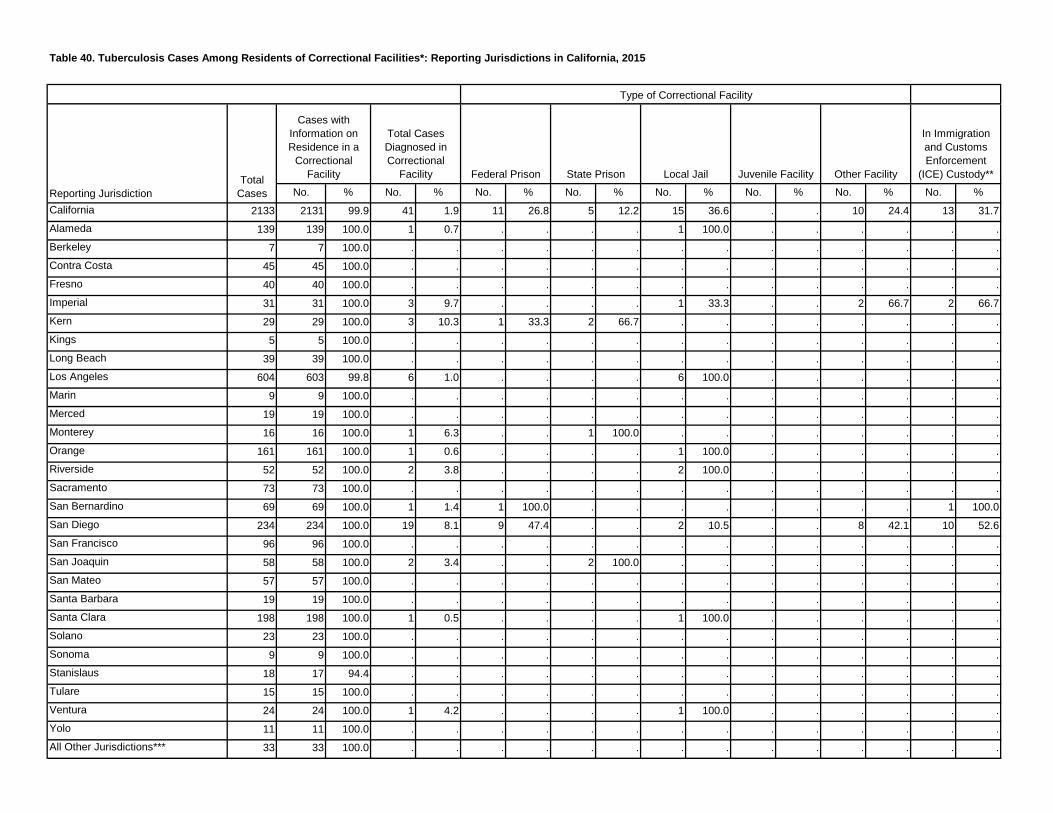
Table 40. Tuberculosis Cases Among Residents of Correctional Facilities*: Reporting Jurisdictions in California, 2015
No. % No. % No. % No. % No. % No. % No. % No. %California 2133 2131 99.9 41 1.9 11 26.8 5 12.2 15 36.6 . . 10 24.4 13 31.7Alameda 139 139 100.0 1 0.7 . . . . 1 100.0 . . . . . .Berkeley 7 7 100.0 . . . . . . . . . . . . . .Contra Costa 45 45 100.0 . . . . . . . . . . . . . .Fresno 40 40 100.0 . . . . . . . . . . . . . .Imperial 31 31 100.0 3 9.7 . . . . 1 33.3 . . 2 66.7 2 66.7Kern 29 29 100.0 3 10.3 1 33.3 2 66.7 . . . . . . . .Kings 5 5 100.0 . . . . . . . . . . . . . .Long Beach 39 39 100.0 . . . . . . . . . . . . . .Los Angeles 604 603 99.8 6 1.0 . . . . 6 100.0 . . . . . .Marin 9 9 100.0 . . . . . . . . . . . . . .Merced 19 19 100.0 . . . . . . . . . . . . . .Monterey 16 16 100.0 1 6.3 . . 1 100.0 . . . . . . . .Orange 161 161 100.0 1 0.6 . . . . 1 100.0 . . . . . .Riverside 52 52 100.0 2 3.8 . . . . 2 100.0 . . . . . .Sacramento 73 73 100.0 . . . . . . . . . . . . . .San Bernardino 69 69 100.0 1 1.4 1 100.0 . . . . . . . . 1 100.0San Diego 234 234 100.0 19 8.1 9 47.4 . . 2 10.5 . . 8 42.1 10 52.6San Francisco 96 96 100.0 . . . . . . . . . . . . . .San Joaquin 58 58 100.0 2 3.4 . . 2 100.0 . . . . . . . .San Mateo 57 57 100.0 . . . . . . . . . . . . . .Santa Barbara 19 19 100.0 . . . . . . . . . . . . . .Santa Clara 198 198 100.0 1 0.5 . . . . 1 100.0 . . . . . .Solano 23 23 100.0 . . . . . . . . . . . . . .Sonoma 9 9 100.0 . . . . . . . . . . . . . .Stanislaus 18 17 94.4 . . . . . . . . . . . . . .Tulare 15 15 100.0 . . . . . . . . . . . . . .Ventura 24 24 100.0 1 4.2 . . . . 1 100.0 . . . . . .Yolo 11 11 100.0 . . . . . . . . . . . . . .All Other Jurisdictions*** 33 33 100.0 . . . . . . . . . . . . . .
Local Jail Juvenile Facility Other Facility
In Immigration and Customs Enforcement
(ICE) Custody**
Type of Correctional Facility
State Prison
Reporting JurisdictionTotal
Cases
Cases with Information on Residence in a
Correctional Facility
Total Cases Diagnosed in Correctional
Facility Federal Prison
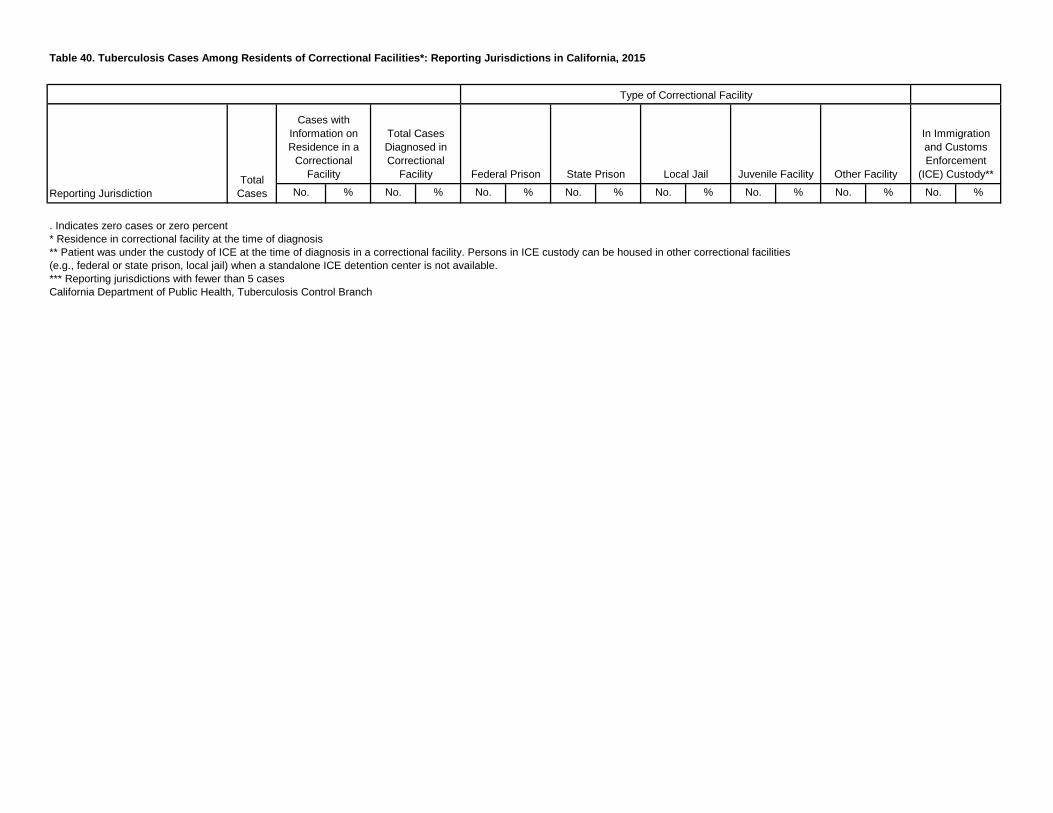
Table 40. Tuberculosis Cases Among Residents of Correctional Facilities*: Reporting Jurisdictions in California, 2015
No. % No. % No. % No. % No. % No. % No. % No. %
Local Jail Juvenile Facility Other Facility
In Immigration and Customs Enforcement
(ICE) Custody**
Type of Correctional Facility
State Prison
Reporting JurisdictionTotal
Cases
Cases with Information on Residence in a
Correctional Facility
Total Cases Diagnosed in Correctional
Facility Federal Prison
. Indicates zero cases or zero percent* Residence in correctional facility at the time of diagnosis** Patient was under the custody of ICE at the time of diagnosis in a correctional facility. Persons in ICE custody can be housed in other correctional facilities(e.g., federal or state prison, local jail) when a standalone ICE detention center is not available.*** Reporting jurisdictions with fewer than 5 casesCalifornia Department of Public Health, Tuberculosis Control Branch

Table 41. Tuberculosis Cases By Homeless Status*: Reporting Jurisdictions in California, 2015
No. % No. %California 2133 2124 99.6 114 5.4Alameda 139 139 100.0 2 1.4Berkeley 7 7 100.0 . .Contra Costa 45 45 100.0 3 6.7Fresno 40 40 100.0 5 12.5Imperial 31 31 100.0 5 16.1Kern 29 27 93.1 2 7.4Kings 5 5 100.0 1 20.0Long Beach 39 39 100.0 3 7.7Los Angeles 604 598 99.0 44 7.4Marin 9 9 100.0 . .Merced 19 19 100.0 1 5.3Monterey 16 16 100.0 . .Orange 161 161 100.0 2 1.2Riverside 52 52 100.0 1 1.9Sacramento 73 73 100.0 . .San Bernardino 69 69 100.0 4 5.8San Diego 234 234 100.0 18 7.7San Francisco 96 96 100.0 8 8.3San Joaquin 58 58 100.0 4 6.9San Mateo 57 57 100.0 . .Santa Barbara 19 19 100.0 1 5.3Santa Clara 198 197 99.5 2 1.0Solano 23 23 100.0 1 4.3Sonoma 9 9 100.0 1 11.1Stanislaus 18 18 100.0 . .Tulare 15 15 100.0 . .Ventura 24 24 100.0 1 4.2Yolo 11 11 100.0 . .All Other Jurisdictions** 33 33 100.0 5 15.2
. Indicates zero cases or zero percent* Homeless at any time during the 12 months prior to the initiation of TB diagnostic evaluation** Reporting jurisdictions with fewer than 5 casesCalifornia Department of Public Health, Tuberculosis Control Branch
Reporting Jurisdiction Total Cases
Cases with Information on Homeless Status Cases with Homeless Status
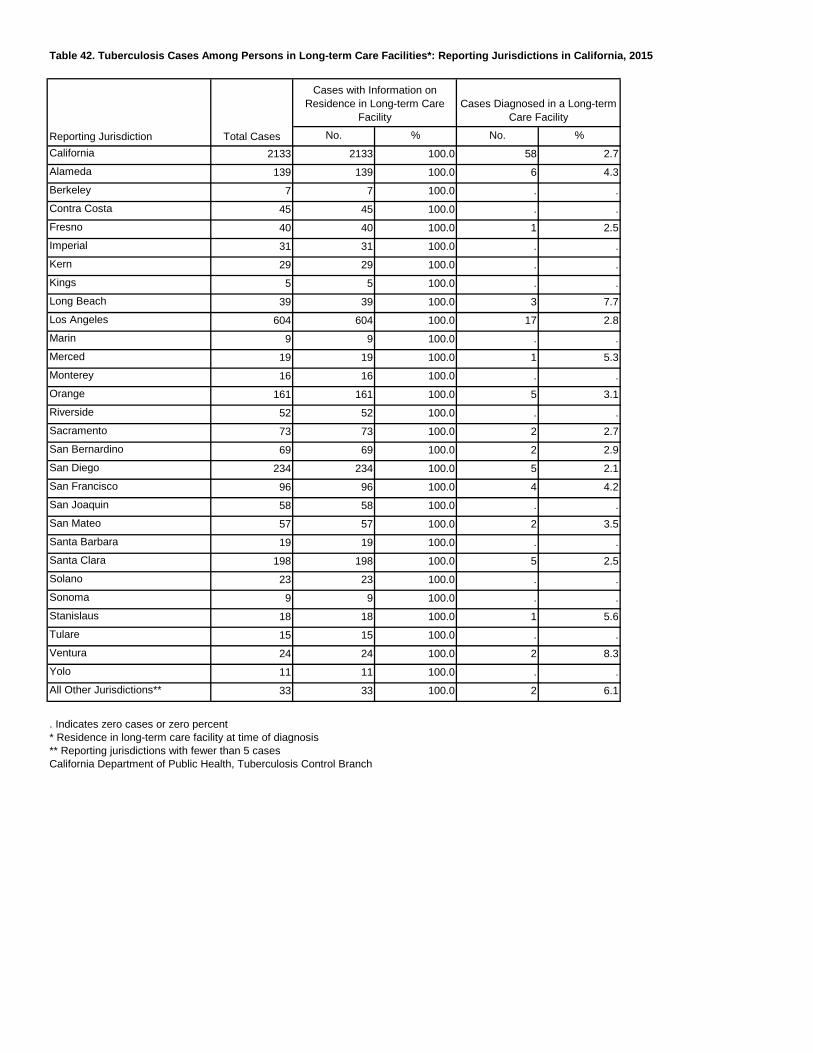
Table 42. Tuberculosis Cases Among Persons in Long-term Care Facilities*: Reporting Jurisdictions in California, 2015
No. % No. %California 2133 2133 100.0 58 2.7Alameda 139 139 100.0 6 4.3Berkeley 7 7 100.0 . .Contra Costa 45 45 100.0 . .Fresno 40 40 100.0 1 2.5Imperial 31 31 100.0 . .Kern 29 29 100.0 . .Kings 5 5 100.0 . .Long Beach 39 39 100.0 3 7.7Los Angeles 604 604 100.0 17 2.8Marin 9 9 100.0 . .Merced 19 19 100.0 1 5.3Monterey 16 16 100.0 . .Orange 161 161 100.0 5 3.1Riverside 52 52 100.0 . .Sacramento 73 73 100.0 2 2.7San Bernardino 69 69 100.0 2 2.9San Diego 234 234 100.0 5 2.1San Francisco 96 96 100.0 4 4.2San Joaquin 58 58 100.0 . .San Mateo 57 57 100.0 2 3.5Santa Barbara 19 19 100.0 . .Santa Clara 198 198 100.0 5 2.5Solano 23 23 100.0 . .Sonoma 9 9 100.0 . .Stanislaus 18 18 100.0 1 5.6Tulare 15 15 100.0 . .Ventura 24 24 100.0 2 8.3Yolo 11 11 100.0 . .All Other Jurisdictions** 33 33 100.0 2 6.1
. Indicates zero cases or zero percent* Residence in long-term care facility at time of diagnosis** Reporting jurisdictions with fewer than 5 casesCalifornia Department of Public Health, Tuberculosis Control Branch
Reporting Jurisdiction Total Cases
Cases with Information on Residence in Long-term Care
FacilityCases Diagnosed in a Long-term
Care Facility
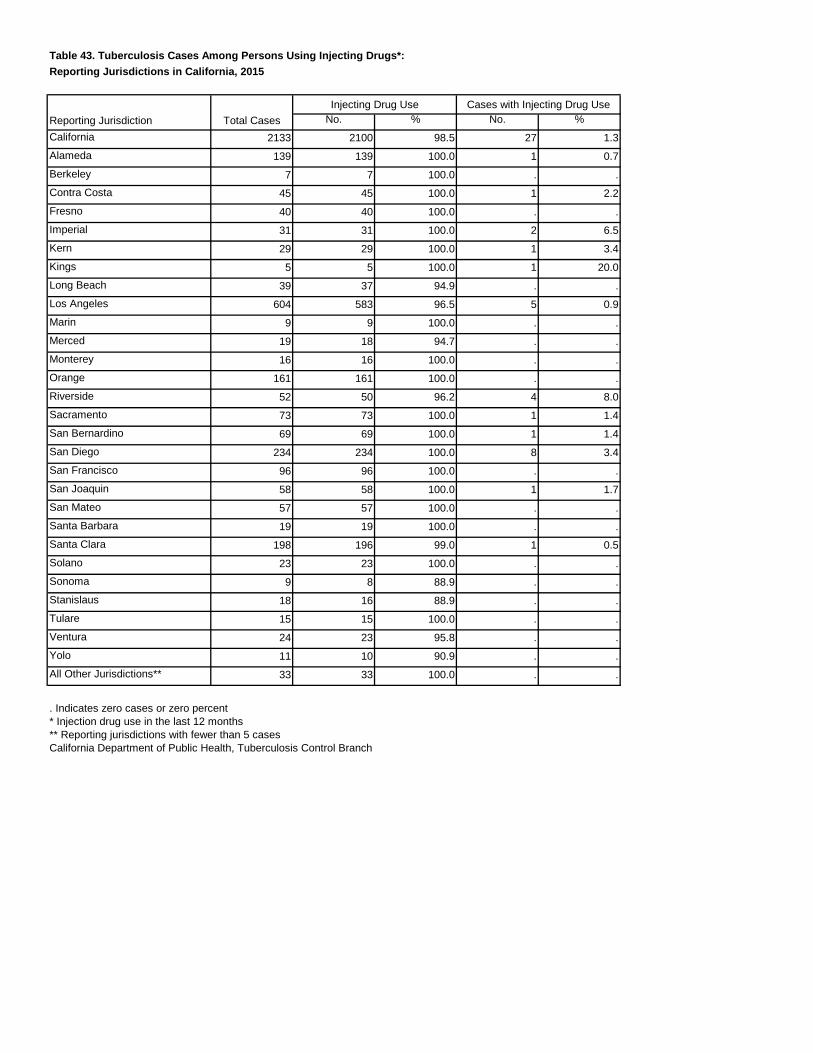
Table 43. Tuberculosis Cases Among Persons Using Injecting Drugs*:Reporting Jurisdictions in California, 2015
No. % No. %California 2133 2100 98.5 27 1.3Alameda 139 139 100.0 1 0.7Berkeley 7 7 100.0 . .Contra Costa 45 45 100.0 1 2.2Fresno 40 40 100.0 . .Imperial 31 31 100.0 2 6.5Kern 29 29 100.0 1 3.4Kings 5 5 100.0 1 20.0Long Beach 39 37 94.9 . .Los Angeles 604 583 96.5 5 0.9Marin 9 9 100.0 . .Merced 19 18 94.7 . .Monterey 16 16 100.0 . .Orange 161 161 100.0 . .Riverside 52 50 96.2 4 8.0Sacramento 73 73 100.0 1 1.4San Bernardino 69 69 100.0 1 1.4San Diego 234 234 100.0 8 3.4San Francisco 96 96 100.0 . .San Joaquin 58 58 100.0 1 1.7San Mateo 57 57 100.0 . .Santa Barbara 19 19 100.0 . .Santa Clara 198 196 99.0 1 0.5Solano 23 23 100.0 . .Sonoma 9 8 88.9 . .Stanislaus 18 16 88.9 . .Tulare 15 15 100.0 . .Ventura 24 23 95.8 . .Yolo 11 10 90.9 . .All Other Jurisdictions** 33 33 100.0 . .
. Indicates zero cases or zero percent* Injection drug use in the last 12 months** Reporting jurisdictions with fewer than 5 casesCalifornia Department of Public Health, Tuberculosis Control Branch
Reporting Jurisdiction Total Cases
Injecting Drug Use Cases with Injecting Drug Use
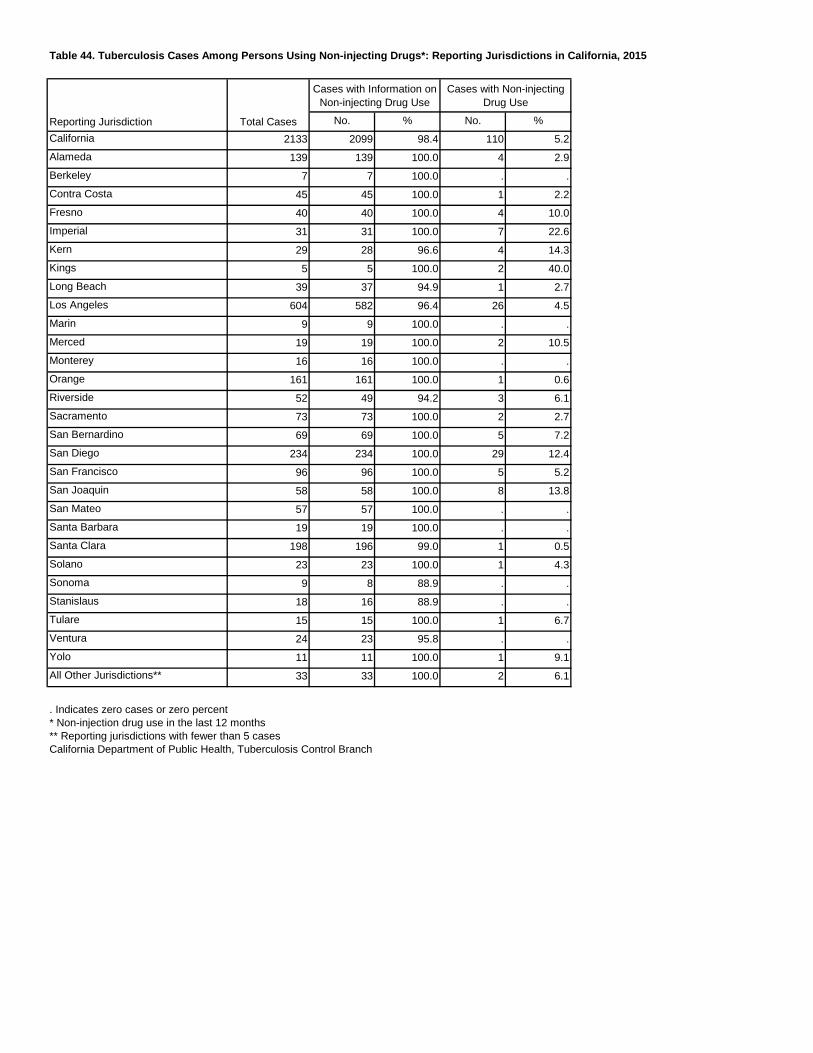
Table 44. Tuberculosis Cases Among Persons Using Non-injecting Drugs*: Reporting Jurisdictions in California, 2015
No. % No. %California 2133 2099 98.4 110 5.2Alameda 139 139 100.0 4 2.9Berkeley 7 7 100.0 . .Contra Costa 45 45 100.0 1 2.2Fresno 40 40 100.0 4 10.0Imperial 31 31 100.0 7 22.6Kern 29 28 96.6 4 14.3Kings 5 5 100.0 2 40.0Long Beach 39 37 94.9 1 2.7Los Angeles 604 582 96.4 26 4.5Marin 9 9 100.0 . .Merced 19 19 100.0 2 10.5Monterey 16 16 100.0 . .Orange 161 161 100.0 1 0.6Riverside 52 49 94.2 3 6.1Sacramento 73 73 100.0 2 2.7San Bernardino 69 69 100.0 5 7.2San Diego 234 234 100.0 29 12.4San Francisco 96 96 100.0 5 5.2San Joaquin 58 58 100.0 8 13.8San Mateo 57 57 100.0 . .Santa Barbara 19 19 100.0 . .Santa Clara 198 196 99.0 1 0.5Solano 23 23 100.0 1 4.3Sonoma 9 8 88.9 . .Stanislaus 18 16 88.9 . .Tulare 15 15 100.0 1 6.7Ventura 24 23 95.8 . .Yolo 11 11 100.0 1 9.1All Other Jurisdictions** 33 33 100.0 2 6.1
. Indicates zero cases or zero percent* Non-injection drug use in the last 12 months** Reporting jurisdictions with fewer than 5 casesCalifornia Department of Public Health, Tuberculosis Control Branch
Reporting Jurisdiction Total Cases
Cases with Information on Non-injecting Drug Use
Cases with Non-injecting Drug Use
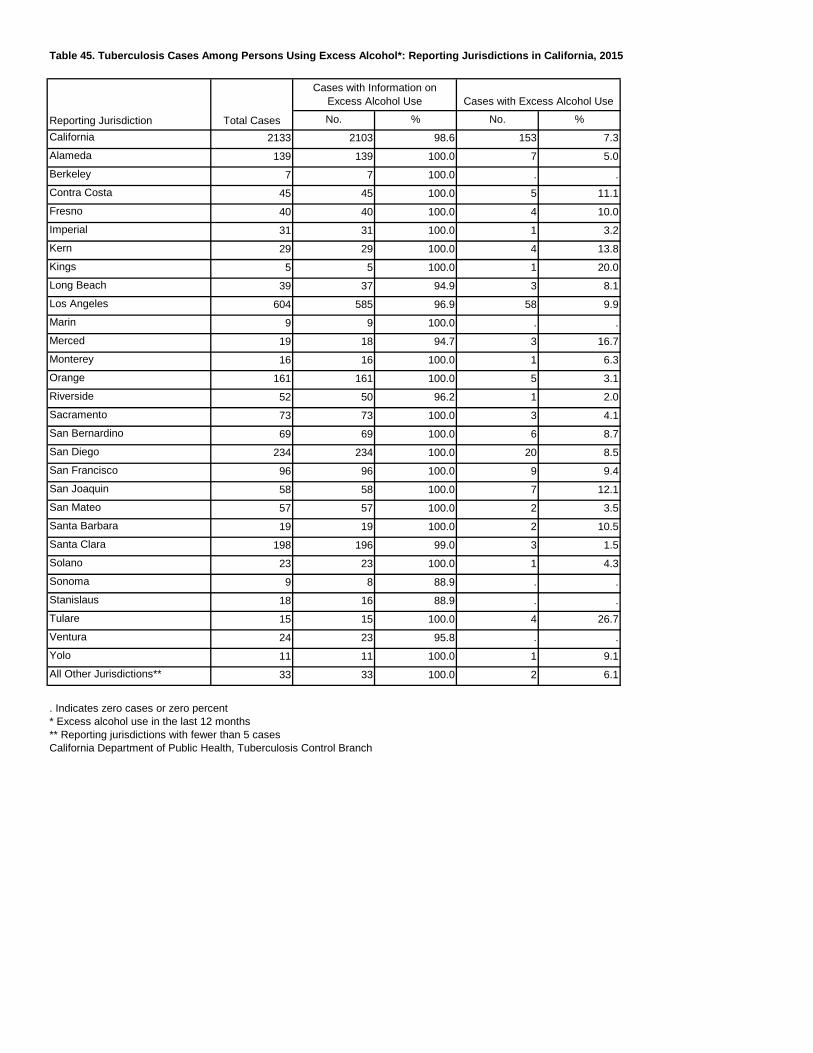
Table 45. Tuberculosis Cases Among Persons Using Excess Alcohol*: Reporting Jurisdictions in California, 2015
No. % No. %California 2133 2103 98.6 153 7.3Alameda 139 139 100.0 7 5.0Berkeley 7 7 100.0 . .Contra Costa 45 45 100.0 5 11.1Fresno 40 40 100.0 4 10.0Imperial 31 31 100.0 1 3.2Kern 29 29 100.0 4 13.8Kings 5 5 100.0 1 20.0Long Beach 39 37 94.9 3 8.1Los Angeles 604 585 96.9 58 9.9Marin 9 9 100.0 . .Merced 19 18 94.7 3 16.7Monterey 16 16 100.0 1 6.3Orange 161 161 100.0 5 3.1Riverside 52 50 96.2 1 2.0Sacramento 73 73 100.0 3 4.1San Bernardino 69 69 100.0 6 8.7San Diego 234 234 100.0 20 8.5San Francisco 96 96 100.0 9 9.4San Joaquin 58 58 100.0 7 12.1San Mateo 57 57 100.0 2 3.5Santa Barbara 19 19 100.0 2 10.5Santa Clara 198 196 99.0 3 1.5Solano 23 23 100.0 1 4.3Sonoma 9 8 88.9 . .Stanislaus 18 16 88.9 . .Tulare 15 15 100.0 4 26.7Ventura 24 23 95.8 . .Yolo 11 11 100.0 1 9.1All Other Jurisdictions** 33 33 100.0 2 6.1
. Indicates zero cases or zero percent* Excess alcohol use in the last 12 months** Reporting jurisdictions with fewer than 5 casesCalifornia Department of Public Health, Tuberculosis Control Branch
Reporting Jurisdiction Total Cases
Cases with Information on Excess Alcohol Use Cases with Excess Alcohol Use
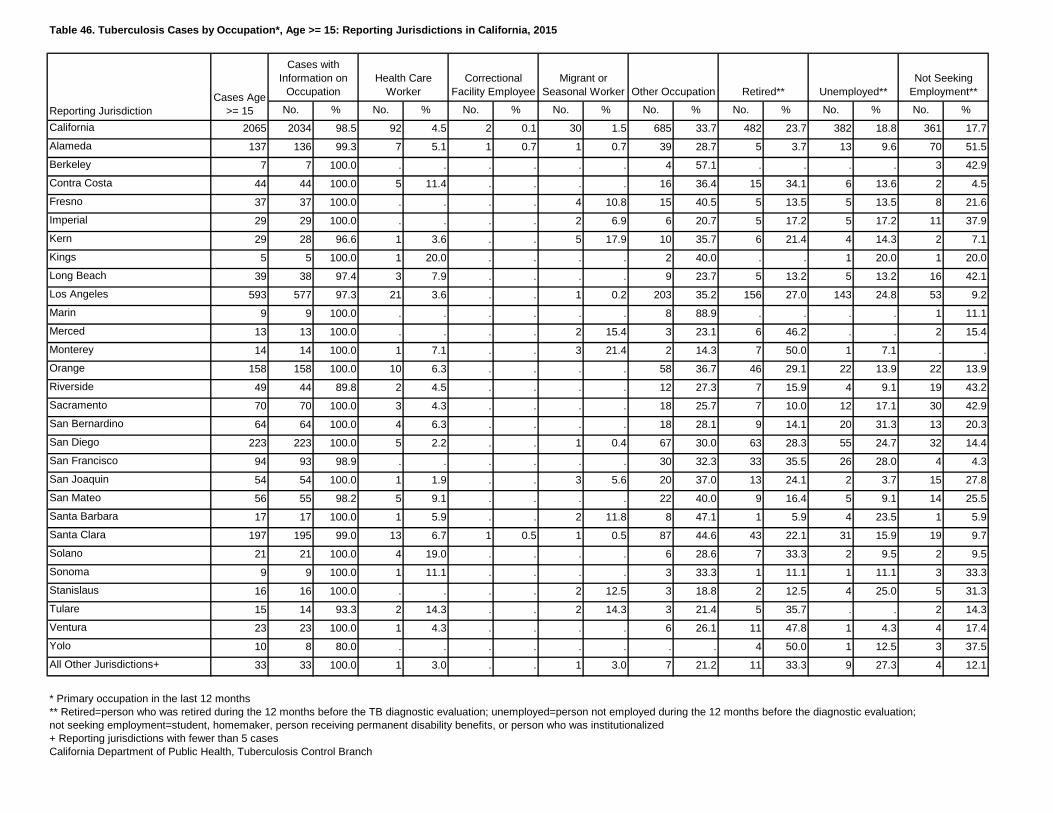
Table 46. Tuberculosis Cases by Occupation*, Age >= 15: Reporting Jurisdictions in California, 2015
No. % No. % No. % No. % No. % No. % No. % No. %California 2065 2034 98.5 92 4.5 2 0.1 30 1.5 685 33.7 482 23.7 382 18.8 361 17.7Alameda 137 136 99.3 7 5.1 1 0.7 1 0.7 39 28.7 5 3.7 13 9.6 70 51.5Berkeley 7 7 100.0 . . . . . . 4 57.1 . . . . 3 42.9Contra Costa 44 44 100.0 5 11.4 . . . . 16 36.4 15 34.1 6 13.6 2 4.5Fresno 37 37 100.0 . . . . 4 10.8 15 40.5 5 13.5 5 13.5 8 21.6Imperial 29 29 100.0 . . . . 2 6.9 6 20.7 5 17.2 5 17.2 11 37.9Kern 29 28 96.6 1 3.6 . . 5 17.9 10 35.7 6 21.4 4 14.3 2 7.1Kings 5 5 100.0 1 20.0 . . . . 2 40.0 . . 1 20.0 1 20.0Long Beach 39 38 97.4 3 7.9 . . . . 9 23.7 5 13.2 5 13.2 16 42.1Los Angeles 593 577 97.3 21 3.6 . . 1 0.2 203 35.2 156 27.0 143 24.8 53 9.2Marin 9 9 100.0 . . . . . . 8 88.9 . . . . 1 11.1Merced 13 13 100.0 . . . . 2 15.4 3 23.1 6 46.2 . . 2 15.4Monterey 14 14 100.0 1 7.1 . . 3 21.4 2 14.3 7 50.0 1 7.1 . .Orange 158 158 100.0 10 6.3 . . . . 58 36.7 46 29.1 22 13.9 22 13.9Riverside 49 44 89.8 2 4.5 . . . . 12 27.3 7 15.9 4 9.1 19 43.2Sacramento 70 70 100.0 3 4.3 . . . . 18 25.7 7 10.0 12 17.1 30 42.9San Bernardino 64 64 100.0 4 6.3 . . . . 18 28.1 9 14.1 20 31.3 13 20.3San Diego 223 223 100.0 5 2.2 . . 1 0.4 67 30.0 63 28.3 55 24.7 32 14.4San Francisco 94 93 98.9 . . . . . . 30 32.3 33 35.5 26 28.0 4 4.3San Joaquin 54 54 100.0 1 1.9 . . 3 5.6 20 37.0 13 24.1 2 3.7 15 27.8San Mateo 56 55 98.2 5 9.1 . . . . 22 40.0 9 16.4 5 9.1 14 25.5Santa Barbara 17 17 100.0 1 5.9 . . 2 11.8 8 47.1 1 5.9 4 23.5 1 5.9Santa Clara 197 195 99.0 13 6.7 1 0.5 1 0.5 87 44.6 43 22.1 31 15.9 19 9.7Solano 21 21 100.0 4 19.0 . . . . 6 28.6 7 33.3 2 9.5 2 9.5Sonoma 9 9 100.0 1 11.1 . . . . 3 33.3 1 11.1 1 11.1 3 33.3Stanislaus 16 16 100.0 . . . . 2 12.5 3 18.8 2 12.5 4 25.0 5 31.3Tulare 15 14 93.3 2 14.3 . . 2 14.3 3 21.4 5 35.7 . . 2 14.3Ventura 23 23 100.0 1 4.3 . . . . 6 26.1 11 47.8 1 4.3 4 17.4Yolo 10 8 80.0 . . . . . . . . 4 50.0 1 12.5 3 37.5All Other Jurisdictions+ 33 33 100.0 1 3.0 . . 1 3.0 7 21.2 11 33.3 9 27.3 4 12.1
* Primary occupation in the last 12 months** Retired=person who was retired during the 12 months before the TB diagnostic evaluation; unemployed=person not employed during the 12 months before the diagnostic evaluation;not seeking employment=student, homemaker, person receiving permanent disability benefits, or person who was institutionalized+ Reporting jurisdictions with fewer than 5 casesCalifornia Department of Public Health, Tuberculosis Control Branch
Other Occupation Retired** Unemployed**Not Seeking
Employment**
Reporting JurisdictionCases Age
>= 15
Cases with Information on
OccupationHealth Care
WorkerCorrectional
Facility EmployeeMigrant or
Seasonal Worker
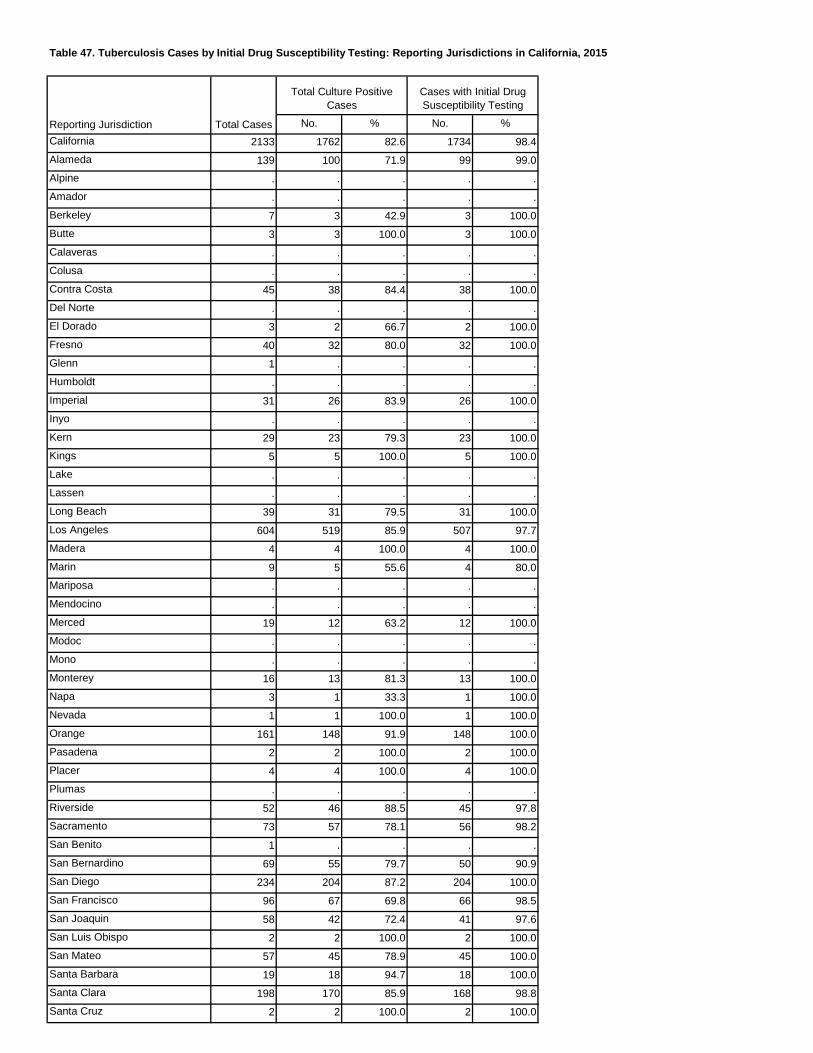
Table 47. Tuberculosis Cases by Initial Drug Susceptibility Testing: Reporting Jurisdictions in California, 2015
No. % No. %California 2133 1762 82.6 1734 98.4Alameda 139 100 71.9 99 99.0Alpine . . . . .Amador . . . . .Berkeley 7 3 42.9 3 100.0Butte 3 3 100.0 3 100.0Calaveras . . . . .Colusa . . . . .Contra Costa 45 38 84.4 38 100.0Del Norte . . . . .El Dorado 3 2 66.7 2 100.0Fresno 40 32 80.0 32 100.0Glenn 1 . . . .Humboldt . . . . .Imperial 31 26 83.9 26 100.0Inyo . . . . .Kern 29 23 79.3 23 100.0Kings 5 5 100.0 5 100.0Lake . . . . .Lassen . . . . .Long Beach 39 31 79.5 31 100.0Los Angeles 604 519 85.9 507 97.7Madera 4 4 100.0 4 100.0Marin 9 5 55.6 4 80.0Mariposa . . . . .Mendocino . . . . .Merced 19 12 63.2 12 100.0Modoc . . . . .Mono . . . . .Monterey 16 13 81.3 13 100.0Napa 3 1 33.3 1 100.0Nevada 1 1 100.0 1 100.0Orange 161 148 91.9 148 100.0Pasadena 2 2 100.0 2 100.0Placer 4 4 100.0 4 100.0Plumas . . . . .Riverside 52 46 88.5 45 97.8Sacramento 73 57 78.1 56 98.2San Benito 1 . . . .San Bernardino 69 55 79.7 50 90.9San Diego 234 204 87.2 204 100.0San Francisco 96 67 69.8 66 98.5San Joaquin 58 42 72.4 41 97.6San Luis Obispo 2 2 100.0 2 100.0San Mateo 57 45 78.9 45 100.0Santa Barbara 19 18 94.7 18 100.0Santa Clara 198 170 85.9 168 98.8Santa Cruz 2 2 100.0 2 100.0
Reporting Jurisdiction Total Cases
Total Culture Positive Cases
Cases with Initial Drug Susceptibility Testing
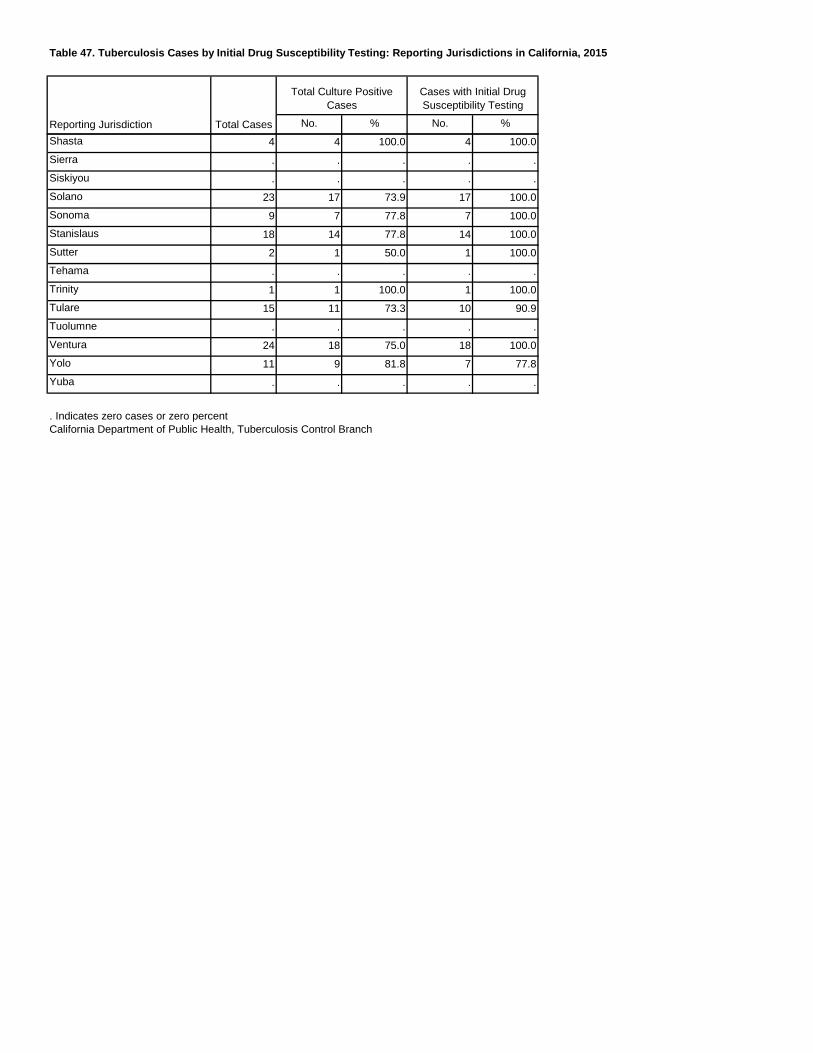
Table 47. Tuberculosis Cases by Initial Drug Susceptibility Testing: Reporting Jurisdictions in California, 2015
No. % No. %Reporting Jurisdiction Total Cases
Total Culture Positive Cases
Cases with Initial Drug Susceptibility Testing
Shasta 4 4 100.0 4 100.0Sierra . . . . .Siskiyou . . . . .Solano 23 17 73.9 17 100.0Sonoma 9 7 77.8 7 100.0Stanislaus 18 14 77.8 14 100.0Sutter 2 1 50.0 1 100.0Tehama . . . . .Trinity 1 1 100.0 1 100.0Tulare 15 11 73.3 10 90.9Tuolumne . . . . .Ventura 24 18 75.0 18 100.0Yolo 11 9 81.8 7 77.8Yuba . . . . .
. Indicates zero cases or zero percentCalifornia Department of Public Health, Tuberculosis Control Branch
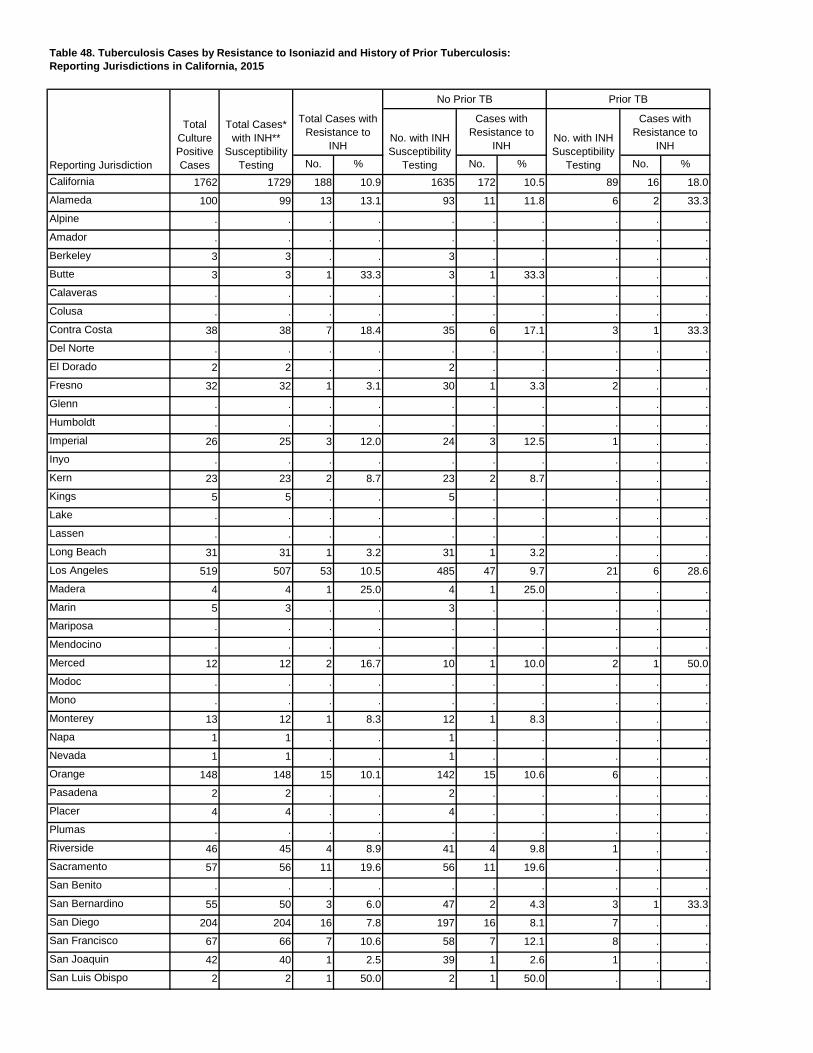
Table 48. Tuberculosis Cases by Resistance to Isoniazid and History of Prior Tuberculosis:Reporting Jurisdictions in California, 2015
No. % No. % No. %California 1762 1729 188 10.9 1635 172 10.5 89 16 18.0Alameda 100 99 13 13.1 93 11 11.8 6 2 33.3Alpine . . . . . . . . . .Amador . . . . . . . . . .Berkeley 3 3 . . 3 . . . . .Butte 3 3 1 33.3 3 1 33.3 . . .Calaveras . . . . . . . . . .Colusa . . . . . . . . . .Contra Costa 38 38 7 18.4 35 6 17.1 3 1 33.3Del Norte . . . . . . . . . .El Dorado 2 2 . . 2 . . . . .Fresno 32 32 1 3.1 30 1 3.3 2 . .Glenn . . . . . . . . . .Humboldt . . . . . . . . . .Imperial 26 25 3 12.0 24 3 12.5 1 . .Inyo . . . . . . . . . .Kern 23 23 2 8.7 23 2 8.7 . . .Kings 5 5 . . 5 . . . . .Lake . . . . . . . . . .Lassen . . . . . . . . . .Long Beach 31 31 1 3.2 31 1 3.2 . . .Los Angeles 519 507 53 10.5 485 47 9.7 21 6 28.6Madera 4 4 1 25.0 4 1 25.0 . . .Marin 5 3 . . 3 . . . . .Mariposa . . . . . . . . . .Mendocino . . . . . . . . . .Merced 12 12 2 16.7 10 1 10.0 2 1 50.0Modoc . . . . . . . . . .Mono . . . . . . . . . .Monterey 13 12 1 8.3 12 1 8.3 . . .Napa 1 1 . . 1 . . . . .Nevada 1 1 . . 1 . . . . .Orange 148 148 15 10.1 142 15 10.6 6 . .Pasadena 2 2 . . 2 . . . . .Placer 4 4 . . 4 . . . . .Plumas . . . . . . . . . .Riverside 46 45 4 8.9 41 4 9.8 1 . .Sacramento 57 56 11 19.6 56 11 19.6 . . .San Benito . . . . . . . . . .San Bernardino 55 50 3 6.0 47 2 4.3 3 1 33.3San Diego 204 204 16 7.8 197 16 8.1 7 . .San Francisco 67 66 7 10.6 58 7 12.1 8 . .San Joaquin 42 40 1 2.5 39 1 2.6 1 . .San Luis Obispo 2 2 1 50.0 2 1 50.0 . . .
Prior TB
No. with INH Susceptibility
Testing
Cases with Resistance to
INHNo. with INH Susceptibility
Testing
Cases with Resistance to
INH
Reporting Jurisdiction
Total Culture Positive Cases
Total Cases* with INH**
Susceptibility Testing
Total Cases with Resistance to
INH
No Prior TB

Table 48. Tuberculosis Cases by Resistance to Isoniazid and History of Prior Tuberculosis:Reporting Jurisdictions in California, 2015
No. % No. % No. %
Prior TB
No. with INH Susceptibility
Testing
Cases with Resistance to
INHNo. with INH Susceptibility
Testing
Cases with Resistance to
INH
Reporting Jurisdiction
Total Culture Positive Cases
Total Cases* with INH**
Susceptibility Testing
Total Cases with Resistance to
INH
No Prior TB
San Mateo 45 45 9 20.0 38 7 18.4 7 2 28.6Santa Barbara 18 18 4 22.2 18 4 22.2 . . .Santa Clara 170 167 25 15.0 151 23 15.2 15 2 13.3Santa Cruz 2 2 . . 2 . . . . .Shasta 4 4 . . 4 . . . . .Sierra . . . . . . . . . .Siskiyou . . . . . . . . . .Solano 17 17 2 11.8 14 1 7.1 3 1 33.3Sonoma 7 7 2 28.6 6 2 33.3 1 . .Stanislaus 14 14 1 7.1 14 1 7.1 . . .Sutter 1 1 . . 1 . . . . .Tehama . . . . . . . . . .Trinity 1 1 . . 1 . . . . .Tulare 11 10 1 10.0 10 1 10.0 . . .Tuolumne . . . . . . . . . .Ventura 18 18 . . 17 . . 1 . .Yolo 9 7 1 14.3 6 1 16.7 1 . .Yuba . . . . . . . . . .
. Indicates zero cases or zero percent* Sum of cases with prior TB and without prior TB may not equal all cases due to inclusion of those with unknown history of TB.** INH=isoniazidCalifornia Department of Public Health, Tuberculosis Control Branch
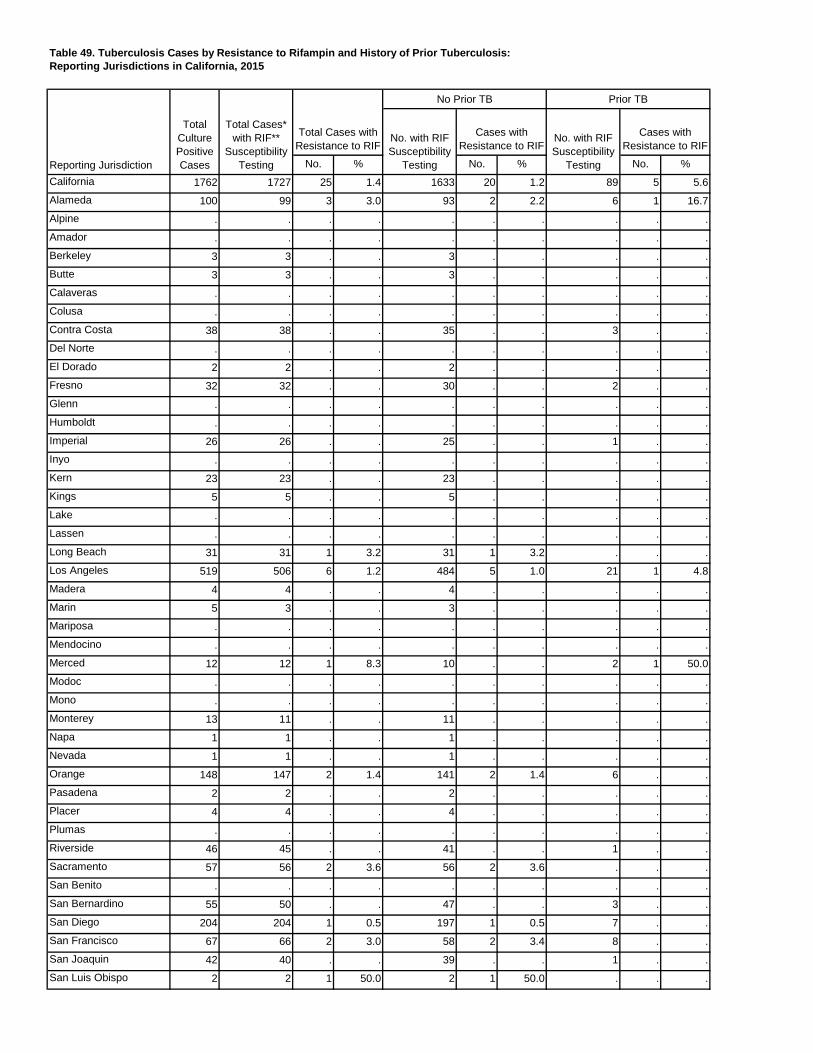
Table 49. Tuberculosis Cases by Resistance to Rifampin and History of Prior Tuberculosis:Reporting Jurisdictions in California, 2015
No. % No. % No. %California 1762 1727 25 1.4 1633 20 1.2 89 5 5.6Alameda 100 99 3 3.0 93 2 2.2 6 1 16.7Alpine . . . . . . . . . .Amador . . . . . . . . . .Berkeley 3 3 . . 3 . . . . .Butte 3 3 . . 3 . . . . .Calaveras . . . . . . . . . .Colusa . . . . . . . . . .Contra Costa 38 38 . . 35 . . 3 . .Del Norte . . . . . . . . . .El Dorado 2 2 . . 2 . . . . .Fresno 32 32 . . 30 . . 2 . .Glenn . . . . . . . . . .Humboldt . . . . . . . . . .Imperial 26 26 . . 25 . . 1 . .Inyo . . . . . . . . . .Kern 23 23 . . 23 . . . . .Kings 5 5 . . 5 . . . . .Lake . . . . . . . . . .Lassen . . . . . . . . . .Long Beach 31 31 1 3.2 31 1 3.2 . . .Los Angeles 519 506 6 1.2 484 5 1.0 21 1 4.8Madera 4 4 . . 4 . . . . .Marin 5 3 . . 3 . . . . .Mariposa . . . . . . . . . .Mendocino . . . . . . . . . .Merced 12 12 1 8.3 10 . . 2 1 50.0Modoc . . . . . . . . . .Mono . . . . . . . . . .Monterey 13 11 . . 11 . . . . .Napa 1 1 . . 1 . . . . .Nevada 1 1 . . 1 . . . . .Orange 148 147 2 1.4 141 2 1.4 6 . .Pasadena 2 2 . . 2 . . . . .Placer 4 4 . . 4 . . . . .Plumas . . . . . . . . . .Riverside 46 45 . . 41 . . 1 . .Sacramento 57 56 2 3.6 56 2 3.6 . . .San Benito . . . . . . . . . .San Bernardino 55 50 . . 47 . . 3 . .San Diego 204 204 1 0.5 197 1 0.5 7 . .San Francisco 67 66 2 3.0 58 2 3.4 8 . .San Joaquin 42 40 . . 39 . . 1 . .San Luis Obispo 2 2 1 50.0 2 1 50.0 . . .
Prior TB
No. with RIF Susceptibility
Testing
Cases with Resistance to RIF
No. with RIF Susceptibility
Testing
Cases with Resistance to RIF
Reporting Jurisdiction
Total Culture Positive Cases
Total Cases* with RIF**
Susceptibility Testing
Total Cases with Resistance to RIF
No Prior TB
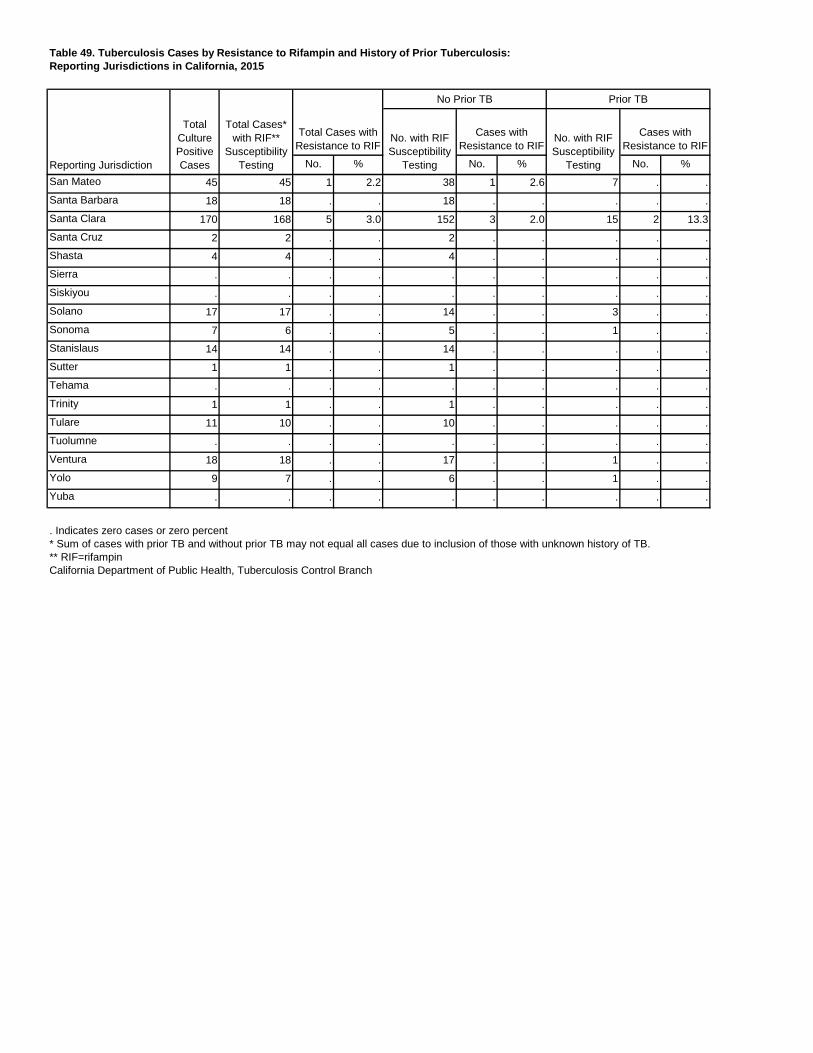
Table 49. Tuberculosis Cases by Resistance to Rifampin and History of Prior Tuberculosis:Reporting Jurisdictions in California, 2015
No. % No. % No. %
Prior TB
No. with RIF Susceptibility
Testing
Cases with Resistance to RIF
No. with RIF Susceptibility
Testing
Cases with Resistance to RIF
Reporting Jurisdiction
Total Culture Positive Cases
Total Cases* with RIF**
Susceptibility Testing
Total Cases with Resistance to RIF
No Prior TB
San Mateo 45 45 1 2.2 38 1 2.6 7 . .Santa Barbara 18 18 . . 18 . . . . .Santa Clara 170 168 5 3.0 152 3 2.0 15 2 13.3Santa Cruz 2 2 . . 2 . . . . .Shasta 4 4 . . 4 . . . . .Sierra . . . . . . . . . .Siskiyou . . . . . . . . . .Solano 17 17 . . 14 . . 3 . .Sonoma 7 6 . . 5 . . 1 . .Stanislaus 14 14 . . 14 . . . . .Sutter 1 1 . . 1 . . . . .Tehama . . . . . . . . . .Trinity 1 1 . . 1 . . . . .Tulare 11 10 . . 10 . . . . .Tuolumne . . . . . . . . . .Ventura 18 18 . . 17 . . 1 . .Yolo 9 7 . . 6 . . 1 . .Yuba . . . . . . . . . .
. Indicates zero cases or zero percent* Sum of cases with prior TB and without prior TB may not equal all cases due to inclusion of those with unknown history of TB.** RIF=rifampinCalifornia Department of Public Health, Tuberculosis Control Branch
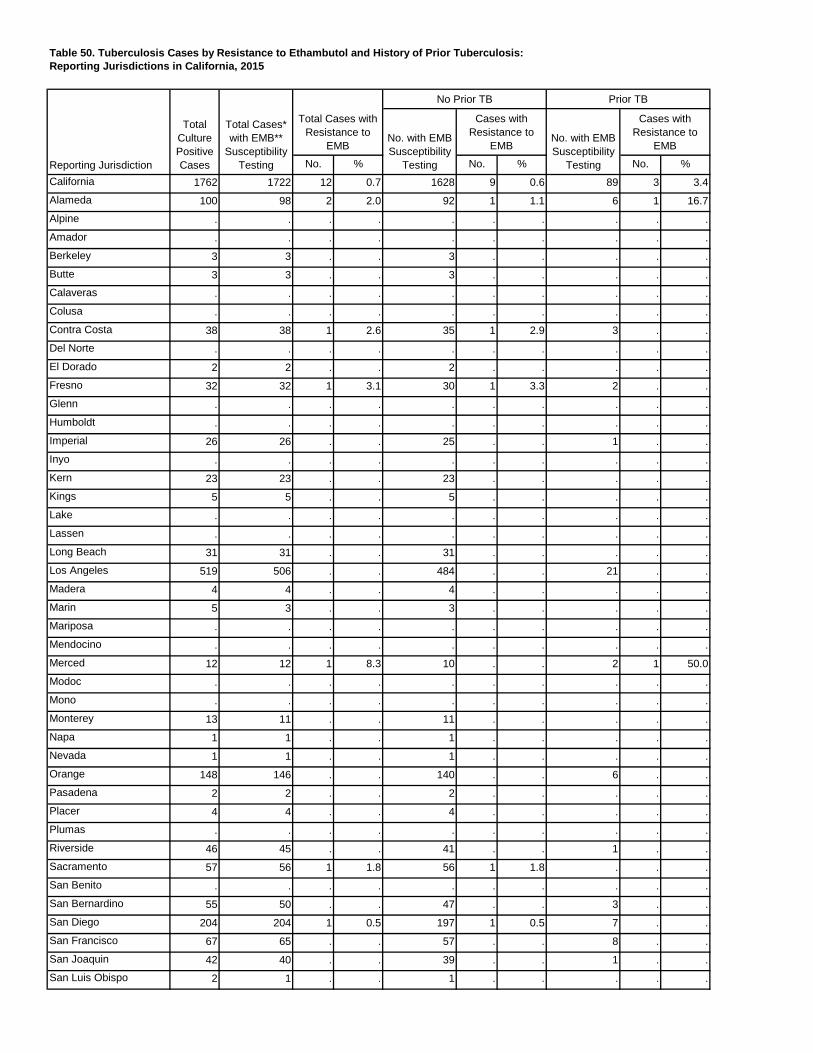
Table 50. Tuberculosis Cases by Resistance to Ethambutol and History of Prior Tuberculosis:Reporting Jurisdictions in California, 2015
No. % No. % No. %California 1762 1722 12 0.7 1628 9 0.6 89 3 3.4Alameda 100 98 2 2.0 92 1 1.1 6 1 16.7Alpine . . . . . . . . . .Amador . . . . . . . . . .Berkeley 3 3 . . 3 . . . . .Butte 3 3 . . 3 . . . . .Calaveras . . . . . . . . . .Colusa . . . . . . . . . .Contra Costa 38 38 1 2.6 35 1 2.9 3 . .Del Norte . . . . . . . . . .El Dorado 2 2 . . 2 . . . . .Fresno 32 32 1 3.1 30 1 3.3 2 . .Glenn . . . . . . . . . .Humboldt . . . . . . . . . .Imperial 26 26 . . 25 . . 1 . .Inyo . . . . . . . . . .Kern 23 23 . . 23 . . . . .Kings 5 5 . . 5 . . . . .Lake . . . . . . . . . .Lassen . . . . . . . . . .Long Beach 31 31 . . 31 . . . . .Los Angeles 519 506 . . 484 . . 21 . .Madera 4 4 . . 4 . . . . .Marin 5 3 . . 3 . . . . .Mariposa . . . . . . . . . .Mendocino . . . . . . . . . .Merced 12 12 1 8.3 10 . . 2 1 50.0Modoc . . . . . . . . . .Mono . . . . . . . . . .Monterey 13 11 . . 11 . . . . .Napa 1 1 . . 1 . . . . .Nevada 1 1 . . 1 . . . . .Orange 148 146 . . 140 . . 6 . .Pasadena 2 2 . . 2 . . . . .Placer 4 4 . . 4 . . . . .Plumas . . . . . . . . . .Riverside 46 45 . . 41 . . 1 . .Sacramento 57 56 1 1.8 56 1 1.8 . . .San Benito . . . . . . . . . .San Bernardino 55 50 . . 47 . . 3 . .San Diego 204 204 1 0.5 197 1 0.5 7 . .San Francisco 67 65 . . 57 . . 8 . .San Joaquin 42 40 . . 39 . . 1 . .San Luis Obispo 2 1 . . 1 . . . . .
Prior TB
No. with EMB Susceptibility
Testing
Cases with Resistance to
EMBNo. with EMB Susceptibility
Testing
Cases with Resistance to
EMB
Reporting Jurisdiction
Total Culture Positive Cases
Total Cases* with EMB**
Susceptibility Testing
Total Cases with Resistance to
EMB
No Prior TB
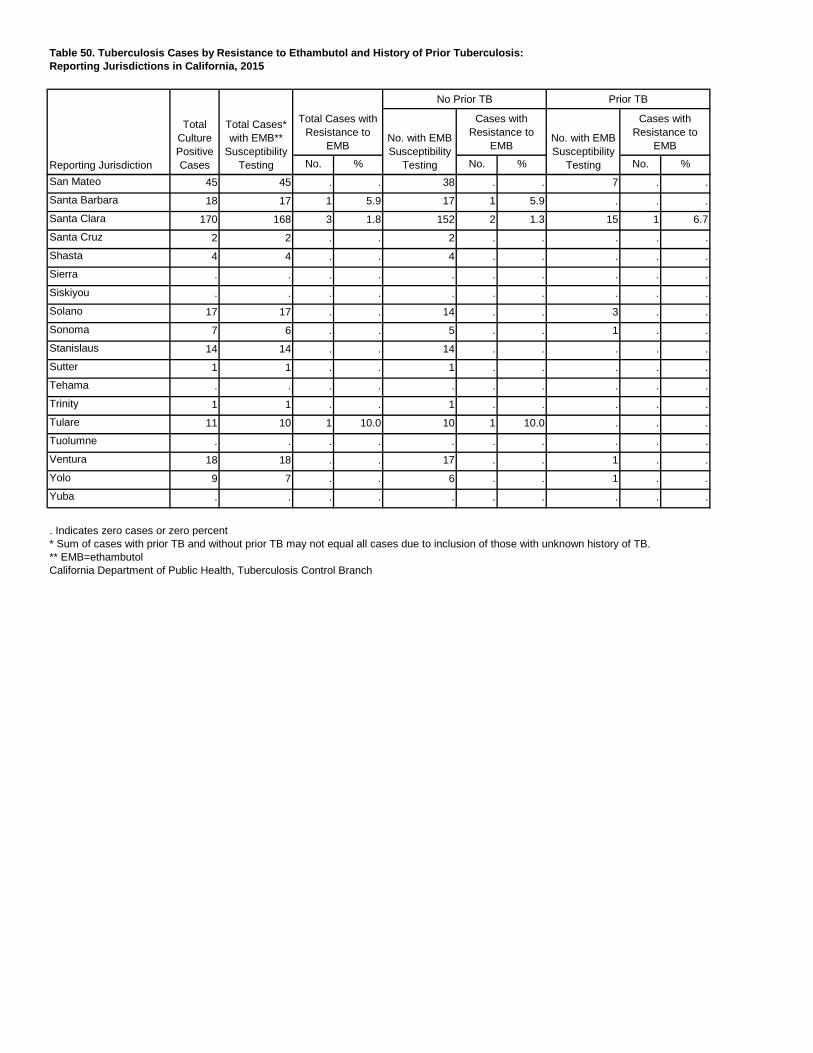
Table 50. Tuberculosis Cases by Resistance to Ethambutol and History of Prior Tuberculosis:Reporting Jurisdictions in California, 2015
No. % No. % No. %
Prior TB
No. with EMB Susceptibility
Testing
Cases with Resistance to
EMBNo. with EMB Susceptibility
Testing
Cases with Resistance to
EMB
Reporting Jurisdiction
Total Culture Positive Cases
Total Cases* with EMB**
Susceptibility Testing
Total Cases with Resistance to
EMB
No Prior TB
San Mateo 45 45 . . 38 . . 7 . .Santa Barbara 18 17 1 5.9 17 1 5.9 . . .Santa Clara 170 168 3 1.8 152 2 1.3 15 1 6.7Santa Cruz 2 2 . . 2 . . . . .Shasta 4 4 . . 4 . . . . .Sierra . . . . . . . . . .Siskiyou . . . . . . . . . .Solano 17 17 . . 14 . . 3 . .Sonoma 7 6 . . 5 . . 1 . .Stanislaus 14 14 . . 14 . . . . .Sutter 1 1 . . 1 . . . . .Tehama . . . . . . . . . .Trinity 1 1 . . 1 . . . . .Tulare 11 10 1 10.0 10 1 10.0 . . .Tuolumne . . . . . . . . . .Ventura 18 18 . . 17 . . 1 . .Yolo 9 7 . . 6 . . 1 . .Yuba . . . . . . . . . .
. Indicates zero cases or zero percent* Sum of cases with prior TB and without prior TB may not equal all cases due to inclusion of those with unknown history of TB.** EMB=ethambutolCalifornia Department of Public Health, Tuberculosis Control Branch
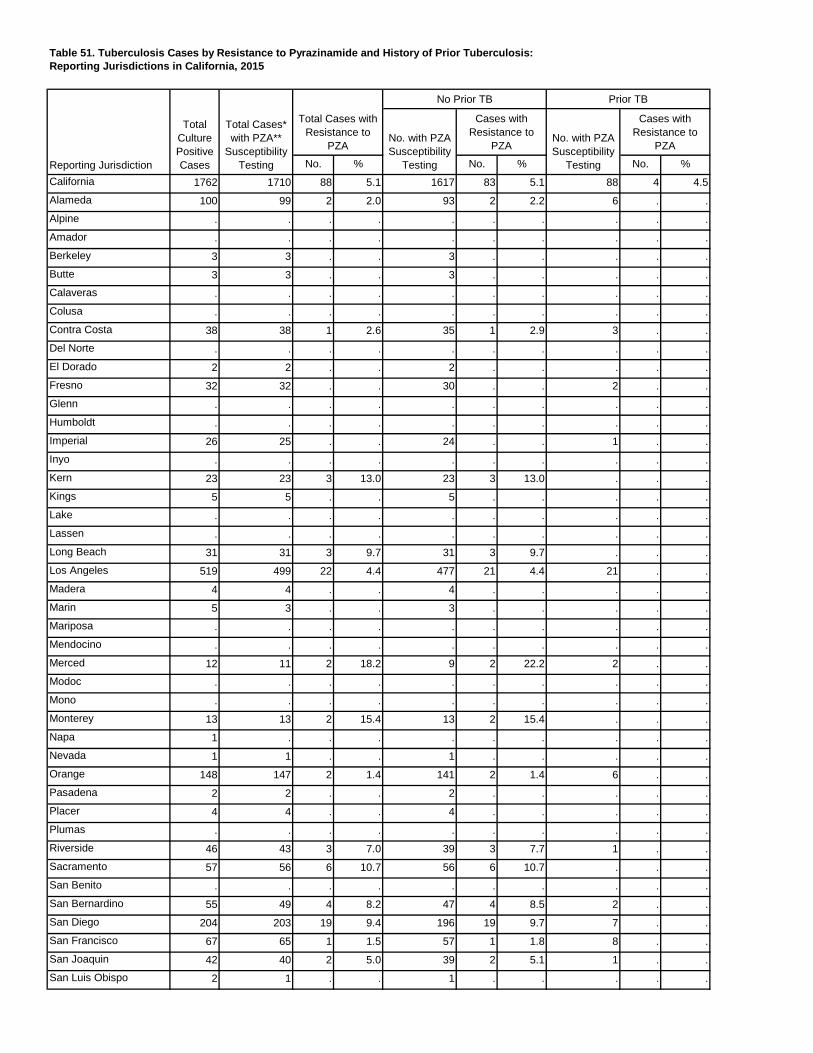
Table 51. Tuberculosis Cases by Resistance to Pyrazinamide and History of Prior Tuberculosis:Reporting Jurisdictions in California, 2015
No. % No. % No. %California 1762 1710 88 5.1 1617 83 5.1 88 4 4.5Alameda 100 99 2 2.0 93 2 2.2 6 . .Alpine . . . . . . . . . .Amador . . . . . . . . . .Berkeley 3 3 . . 3 . . . . .Butte 3 3 . . 3 . . . . .Calaveras . . . . . . . . . .Colusa . . . . . . . . . .Contra Costa 38 38 1 2.6 35 1 2.9 3 . .Del Norte . . . . . . . . . .El Dorado 2 2 . . 2 . . . . .Fresno 32 32 . . 30 . . 2 . .Glenn . . . . . . . . . .Humboldt . . . . . . . . . .Imperial 26 25 . . 24 . . 1 . .Inyo . . . . . . . . . .Kern 23 23 3 13.0 23 3 13.0 . . .Kings 5 5 . . 5 . . . . .Lake . . . . . . . . . .Lassen . . . . . . . . . .Long Beach 31 31 3 9.7 31 3 9.7 . . .Los Angeles 519 499 22 4.4 477 21 4.4 21 . .Madera 4 4 . . 4 . . . . .Marin 5 3 . . 3 . . . . .Mariposa . . . . . . . . . .Mendocino . . . . . . . . . .Merced 12 11 2 18.2 9 2 22.2 2 . .Modoc . . . . . . . . . .Mono . . . . . . . . . .Monterey 13 13 2 15.4 13 2 15.4 . . .Napa 1 . . . . . . . . .Nevada 1 1 . . 1 . . . . .Orange 148 147 2 1.4 141 2 1.4 6 . .Pasadena 2 2 . . 2 . . . . .Placer 4 4 . . 4 . . . . .Plumas . . . . . . . . . .Riverside 46 43 3 7.0 39 3 7.7 1 . .Sacramento 57 56 6 10.7 56 6 10.7 . . .San Benito . . . . . . . . . .San Bernardino 55 49 4 8.2 47 4 8.5 2 . .San Diego 204 203 19 9.4 196 19 9.7 7 . .San Francisco 67 65 1 1.5 57 1 1.8 8 . .San Joaquin 42 40 2 5.0 39 2 5.1 1 . .San Luis Obispo 2 1 . . 1 . . . . .
Prior TB
No. with PZA Susceptibility
Testing
Cases with Resistance to
PZANo. with PZA Susceptibility
Testing
Cases with Resistance to
PZA
Reporting Jurisdiction
Total Culture Positive Cases
Total Cases* with PZA**
Susceptibility Testing
Total Cases with Resistance to
PZA
No Prior TB
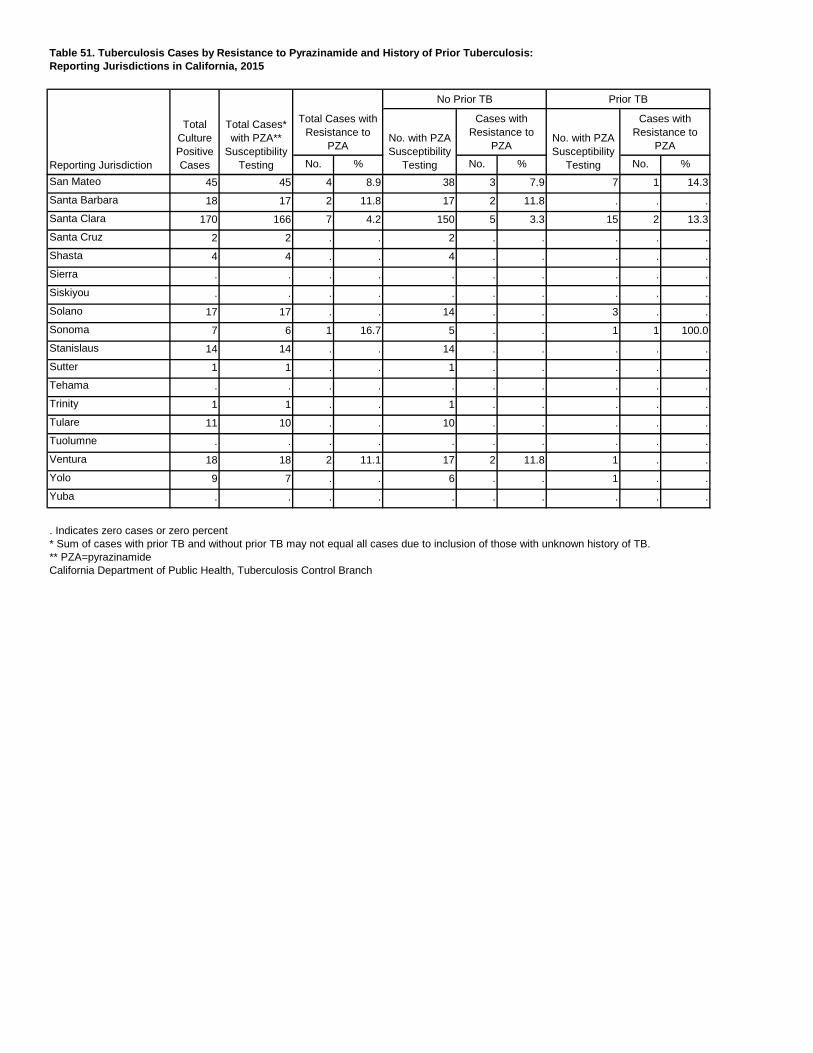
Table 51. Tuberculosis Cases by Resistance to Pyrazinamide and History of Prior Tuberculosis:Reporting Jurisdictions in California, 2015
No. % No. % No. %
Prior TB
No. with PZA Susceptibility
Testing
Cases with Resistance to
PZANo. with PZA Susceptibility
Testing
Cases with Resistance to
PZA
Reporting Jurisdiction
Total Culture Positive Cases
Total Cases* with PZA**
Susceptibility Testing
Total Cases with Resistance to
PZA
No Prior TB
San Mateo 45 45 4 8.9 38 3 7.9 7 1 14.3Santa Barbara 18 17 2 11.8 17 2 11.8 . . .Santa Clara 170 166 7 4.2 150 5 3.3 15 2 13.3Santa Cruz 2 2 . . 2 . . . . .Shasta 4 4 . . 4 . . . . .Sierra . . . . . . . . . .Siskiyou . . . . . . . . . .Solano 17 17 . . 14 . . 3 . .Sonoma 7 6 1 16.7 5 . . 1 1 100.0Stanislaus 14 14 . . 14 . . . . .Sutter 1 1 . . 1 . . . . .Tehama . . . . . . . . . .Trinity 1 1 . . 1 . . . . .Tulare 11 10 . . 10 . . . . .Tuolumne . . . . . . . . . .Ventura 18 18 2 11.1 17 2 11.8 1 . .Yolo 9 7 . . 6 . . 1 . .Yuba . . . . . . . . . .
. Indicates zero cases or zero percent* Sum of cases with prior TB and without prior TB may not equal all cases due to inclusion of those with unknown history of TB.** PZA=pyrazinamideCalifornia Department of Public Health, Tuberculosis Control Branch
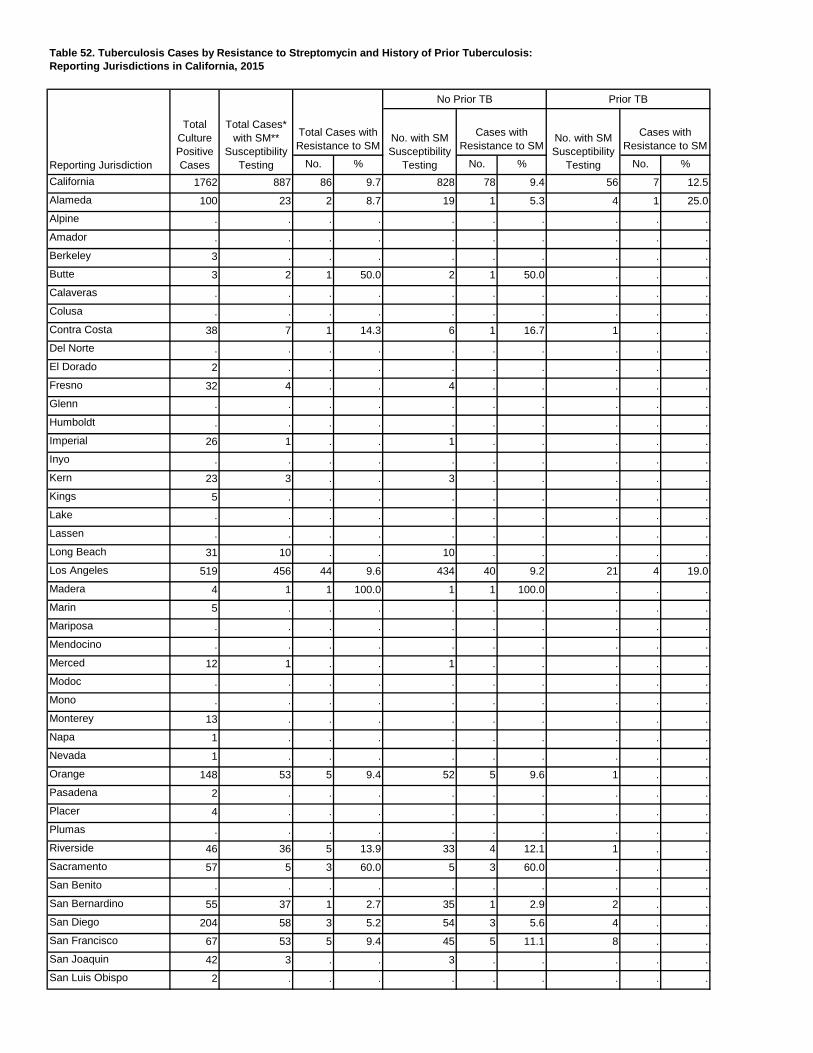
Table 52. Tuberculosis Cases by Resistance to Streptomycin and History of Prior Tuberculosis:Reporting Jurisdictions in California, 2015
No. % No. % No. %California 1762 887 86 9.7 828 78 9.4 56 7 12.5Alameda 100 23 2 8.7 19 1 5.3 4 1 25.0Alpine . . . . . . . . . .Amador . . . . . . . . . .Berkeley 3 . . . . . . . . .Butte 3 2 1 50.0 2 1 50.0 . . .Calaveras . . . . . . . . . .Colusa . . . . . . . . . .Contra Costa 38 7 1 14.3 6 1 16.7 1 . .Del Norte . . . . . . . . . .El Dorado 2 . . . . . . . . .Fresno 32 4 . . 4 . . . . .Glenn . . . . . . . . . .Humboldt . . . . . . . . . .Imperial 26 1 . . 1 . . . . .Inyo . . . . . . . . . .Kern 23 3 . . 3 . . . . .Kings 5 . . . . . . . . .Lake . . . . . . . . . .Lassen . . . . . . . . . .Long Beach 31 10 . . 10 . . . . .Los Angeles 519 456 44 9.6 434 40 9.2 21 4 19.0Madera 4 1 1 100.0 1 1 100.0 . . .Marin 5 . . . . . . . . .Mariposa . . . . . . . . . .Mendocino . . . . . . . . . .Merced 12 1 . . 1 . . . . .Modoc . . . . . . . . . .Mono . . . . . . . . . .Monterey 13 . . . . . . . . .Napa 1 . . . . . . . . .Nevada 1 . . . . . . . . .Orange 148 53 5 9.4 52 5 9.6 1 . .Pasadena 2 . . . . . . . . .Placer 4 . . . . . . . . .Plumas . . . . . . . . . .Riverside 46 36 5 13.9 33 4 12.1 1 . .Sacramento 57 5 3 60.0 5 3 60.0 . . .San Benito . . . . . . . . . .San Bernardino 55 37 1 2.7 35 1 2.9 2 . .San Diego 204 58 3 5.2 54 3 5.6 4 . .San Francisco 67 53 5 9.4 45 5 11.1 8 . .San Joaquin 42 3 . . 3 . . . . .San Luis Obispo 2 . . . . . . . . .
Prior TB
No. with SM Susceptibility
Testing
Cases with Resistance to SM
No. with SM Susceptibility
Testing
Cases with Resistance to SM
Reporting Jurisdiction
Total Culture Positive Cases
Total Cases* with SM**
Susceptibility Testing
Total Cases with Resistance to SM
No Prior TB

Table 52. Tuberculosis Cases by Resistance to Streptomycin and History of Prior Tuberculosis:Reporting Jurisdictions in California, 2015
No. % No. % No. %
Prior TB
No. with SM Susceptibility
Testing
Cases with Resistance to SM
No. with SM Susceptibility
Testing
Cases with Resistance to SM
Reporting Jurisdiction
Total Culture Positive Cases
Total Cases* with SM**
Susceptibility Testing
Total Cases with Resistance to SM
No Prior TB
San Mateo 45 6 1 16.7 6 1 16.7 . . .Santa Barbara 18 17 1 5.9 17 1 5.9 . . .Santa Clara 170 90 12 13.3 78 10 12.8 12 2 16.7Santa Cruz 2 . . . . . . . . .Shasta 4 . . . . . . . . .Sierra . . . . . . . . . .Siskiyou . . . . . . . . . .Solano 17 1 . . 1 . . . . .Sonoma 7 1 . . . . . 1 . .Stanislaus 14 1 . . 1 . . . . .Sutter 1 . . . . . . . . .Tehama . . . . . . . . . .Trinity 1 . . . . . . . . .Tulare 11 6 1 16.7 6 1 16.7 . . .Tuolumne . . . . . . . . . .Ventura 18 12 . . 11 . . 1 . .Yolo 9 . . . . . . . . .Yuba . . . . . . . . . .
. Indicates zero cases or zero percent* Sum of cases with prior TB and without prior TB may not equal all cases due to inclusion of those with unknown history of TB.** SM=streptomycinCalifornia Department of Public Health, Tuberculosis Control Branch
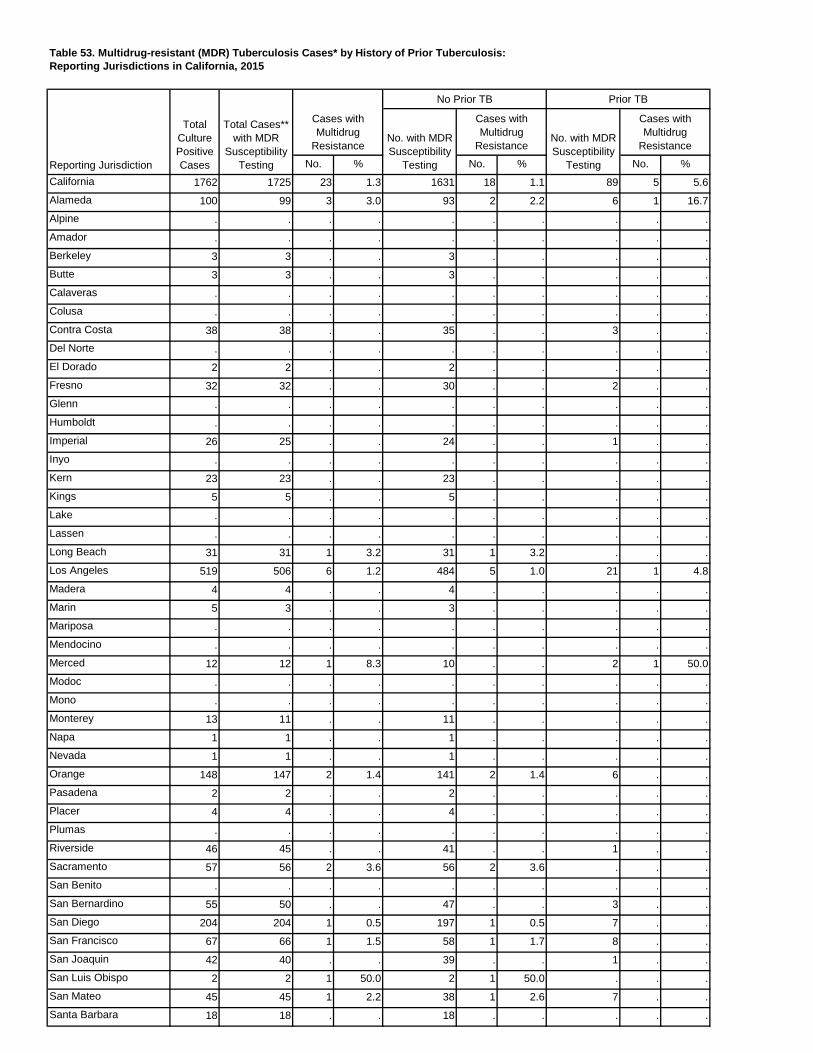
Table 53. Multidrug-resistant (MDR) Tuberculosis Cases* by History of Prior Tuberculosis:Reporting Jurisdictions in California, 2015
No. % No. % No. %California 1762 1725 23 1.3 1631 18 1.1 89 5 5.6Alameda 100 99 3 3.0 93 2 2.2 6 1 16.7Alpine . . . . . . . . . .Amador . . . . . . . . . .Berkeley 3 3 . . 3 . . . . .Butte 3 3 . . 3 . . . . .Calaveras . . . . . . . . . .Colusa . . . . . . . . . .Contra Costa 38 38 . . 35 . . 3 . .Del Norte . . . . . . . . . .El Dorado 2 2 . . 2 . . . . .Fresno 32 32 . . 30 . . 2 . .Glenn . . . . . . . . . .Humboldt . . . . . . . . . .Imperial 26 25 . . 24 . . 1 . .Inyo . . . . . . . . . .Kern 23 23 . . 23 . . . . .Kings 5 5 . . 5 . . . . .Lake . . . . . . . . . .Lassen . . . . . . . . . .Long Beach 31 31 1 3.2 31 1 3.2 . . .Los Angeles 519 506 6 1.2 484 5 1.0 21 1 4.8Madera 4 4 . . 4 . . . . .Marin 5 3 . . 3 . . . . .Mariposa . . . . . . . . . .Mendocino . . . . . . . . . .Merced 12 12 1 8.3 10 . . 2 1 50.0Modoc . . . . . . . . . .Mono . . . . . . . . . .Monterey 13 11 . . 11 . . . . .Napa 1 1 . . 1 . . . . .Nevada 1 1 . . 1 . . . . .Orange 148 147 2 1.4 141 2 1.4 6 . .Pasadena 2 2 . . 2 . . . . .Placer 4 4 . . 4 . . . . .Plumas . . . . . . . . . .Riverside 46 45 . . 41 . . 1 . .Sacramento 57 56 2 3.6 56 2 3.6 . . .San Benito . . . . . . . . . .San Bernardino 55 50 . . 47 . . 3 . .San Diego 204 204 1 0.5 197 1 0.5 7 . .San Francisco 67 66 1 1.5 58 1 1.7 8 . .San Joaquin 42 40 . . 39 . . 1 . .San Luis Obispo 2 2 1 50.0 2 1 50.0 . . .San Mateo 45 45 1 2.2 38 1 2.6 7 . .Santa Barbara 18 18 . . 18 . . . . .
Prior TB
No. with MDR Susceptibility
Testing
Cases with Multidrug
ResistanceNo. with MDR Susceptibility
Testing
Cases with Multidrug
Resistance
Reporting Jurisdiction
Total Culture Positive Cases
Total Cases** with MDR
Susceptibility Testing
Cases with Multidrug
Resistance
No Prior TB
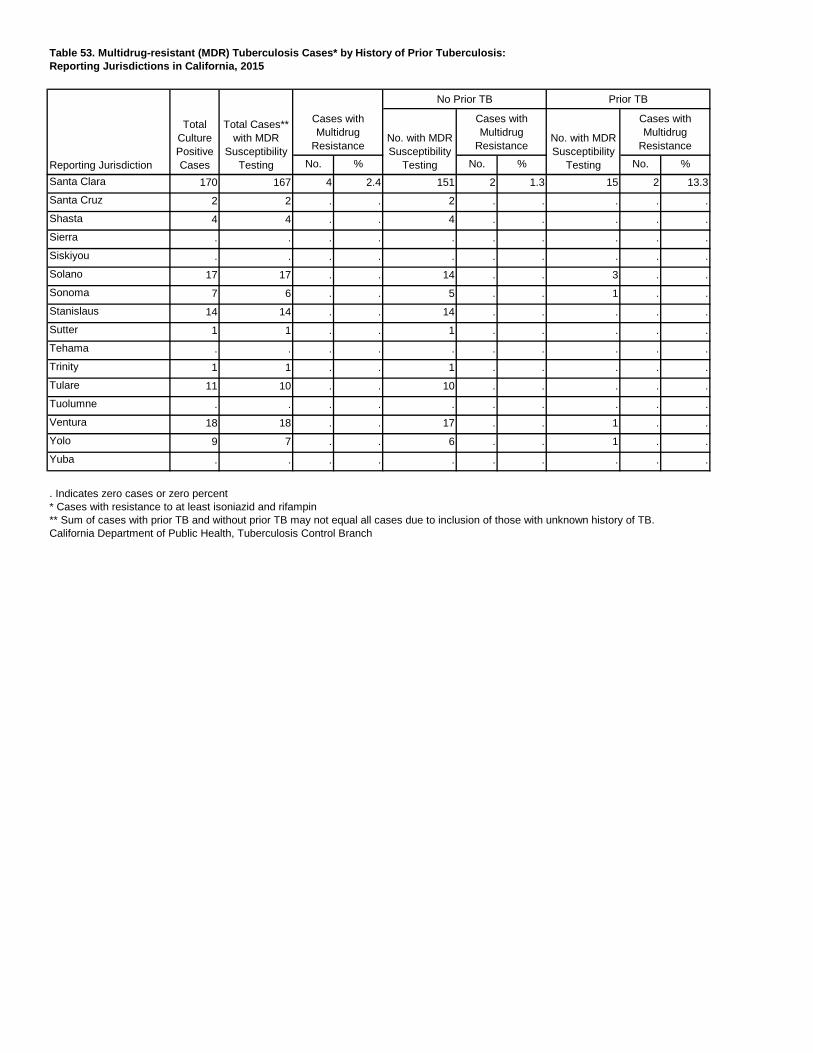
Table 53. Multidrug-resistant (MDR) Tuberculosis Cases* by History of Prior Tuberculosis:Reporting Jurisdictions in California, 2015
No. % No. % No. %
Prior TB
No. with MDR Susceptibility
Testing
Cases with Multidrug
ResistanceNo. with MDR Susceptibility
Testing
Cases with Multidrug
Resistance
Reporting Jurisdiction
Total Culture Positive Cases
Total Cases** with MDR
Susceptibility Testing
Cases with Multidrug
Resistance
No Prior TB
Santa Clara 170 167 4 2.4 151 2 1.3 15 2 13.3Santa Cruz 2 2 . . 2 . . . . .Shasta 4 4 . . 4 . . . . .Sierra . . . . . . . . . .Siskiyou . . . . . . . . . .Solano 17 17 . . 14 . . 3 . .Sonoma 7 6 . . 5 . . 1 . .Stanislaus 14 14 . . 14 . . . . .Sutter 1 1 . . 1 . . . . .Tehama . . . . . . . . . .Trinity 1 1 . . 1 . . . . .Tulare 11 10 . . 10 . . . . .Tuolumne . . . . . . . . . .Ventura 18 18 . . 17 . . 1 . .Yolo 9 7 . . 6 . . 1 . .Yuba . . . . . . . . . .
. Indicates zero cases or zero percent* Cases with resistance to at least isoniazid and rifampin** Sum of cases with prior TB and without prior TB may not equal all cases due to inclusion of those with unknown history of TB.California Department of Public Health, Tuberculosis Control Branch
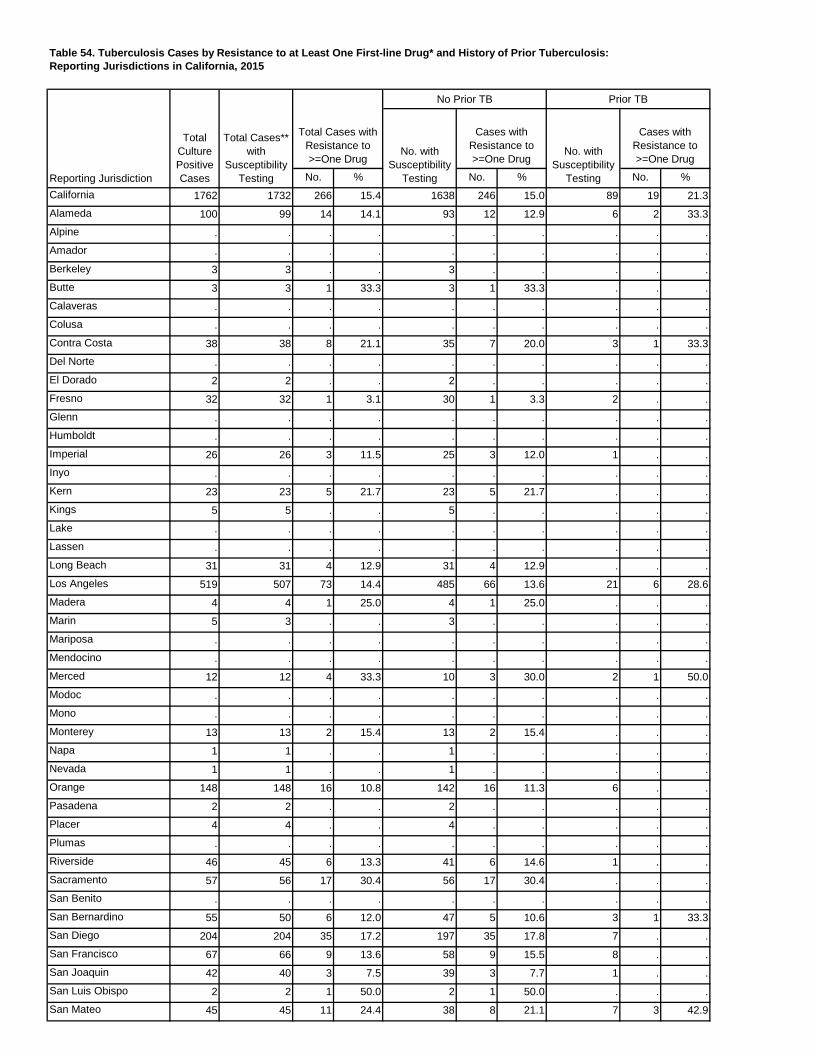
Table 54. Tuberculosis Cases by Resistance to at Least One First-line Drug* and History of Prior Tuberculosis:Reporting Jurisdictions in California, 2015
No. % No. % No. %California 1762 1732 266 15.4 1638 246 15.0 89 19 21.3Alameda 100 99 14 14.1 93 12 12.9 6 2 33.3Alpine . . . . . . . . . .Amador . . . . . . . . . .Berkeley 3 3 . . 3 . . . . .Butte 3 3 1 33.3 3 1 33.3 . . .Calaveras . . . . . . . . . .Colusa . . . . . . . . . .Contra Costa 38 38 8 21.1 35 7 20.0 3 1 33.3Del Norte . . . . . . . . . .El Dorado 2 2 . . 2 . . . . .Fresno 32 32 1 3.1 30 1 3.3 2 . .Glenn . . . . . . . . . .Humboldt . . . . . . . . . .Imperial 26 26 3 11.5 25 3 12.0 1 . .Inyo . . . . . . . . . .Kern 23 23 5 21.7 23 5 21.7 . . .Kings 5 5 . . 5 . . . . .Lake . . . . . . . . . .Lassen . . . . . . . . . .Long Beach 31 31 4 12.9 31 4 12.9 . . .Los Angeles 519 507 73 14.4 485 66 13.6 21 6 28.6Madera 4 4 1 25.0 4 1 25.0 . . .Marin 5 3 . . 3 . . . . .Mariposa . . . . . . . . . .Mendocino . . . . . . . . . .Merced 12 12 4 33.3 10 3 30.0 2 1 50.0Modoc . . . . . . . . . .Mono . . . . . . . . . .Monterey 13 13 2 15.4 13 2 15.4 . . .Napa 1 1 . . 1 . . . . .Nevada 1 1 . . 1 . . . . .Orange 148 148 16 10.8 142 16 11.3 6 . .Pasadena 2 2 . . 2 . . . . .Placer 4 4 . . 4 . . . . .Plumas . . . . . . . . . .Riverside 46 45 6 13.3 41 6 14.6 1 . .Sacramento 57 56 17 30.4 56 17 30.4 . . .San Benito . . . . . . . . . .San Bernardino 55 50 6 12.0 47 5 10.6 3 1 33.3San Diego 204 204 35 17.2 197 35 17.8 7 . .San Francisco 67 66 9 13.6 58 9 15.5 8 . .San Joaquin 42 40 3 7.5 39 3 7.7 1 . .San Luis Obispo 2 2 1 50.0 2 1 50.0 . . .San Mateo 45 45 11 24.4 38 8 21.1 7 3 42.9
Prior TB
No. with Susceptibility
Testing
Cases with Resistance to >=One Drug
No. with Susceptibility
Testing
Cases with Resistance to >=One Drug
Reporting Jurisdiction
Total Culture Positive Cases
Total Cases** with
Susceptibility Testing
Total Cases with Resistance to >=One Drug
No Prior TB
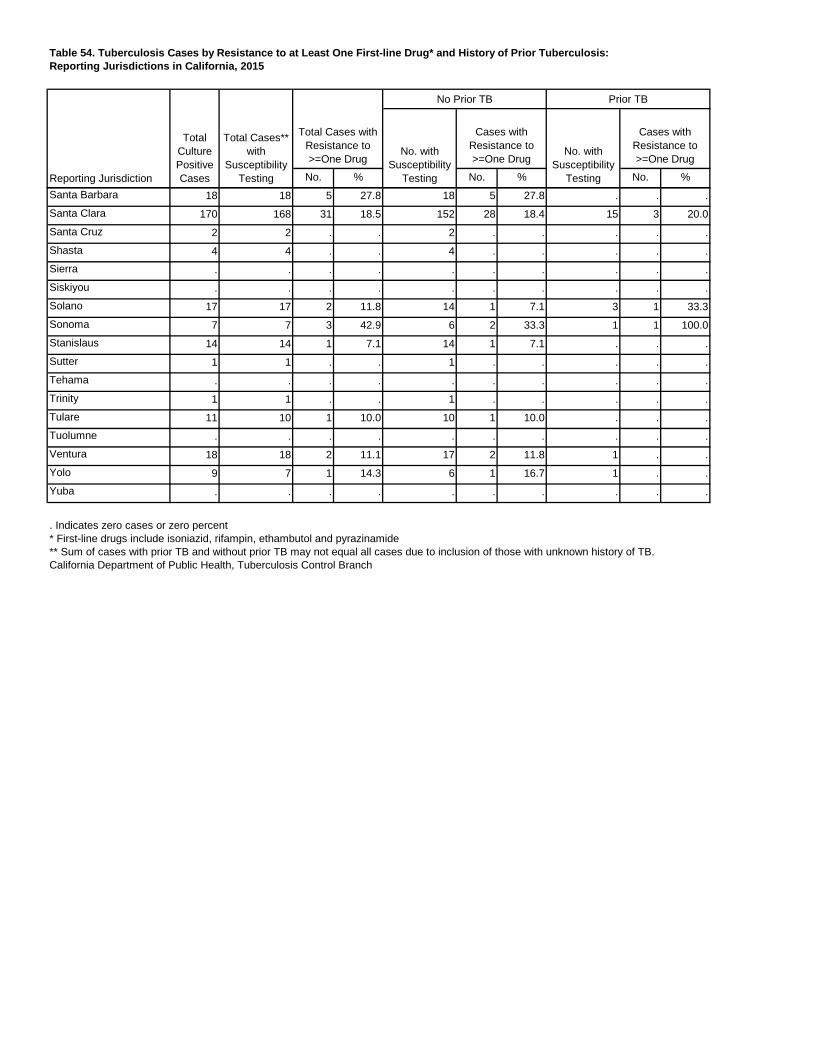
Table 54. Tuberculosis Cases by Resistance to at Least One First-line Drug* and History of Prior Tuberculosis:Reporting Jurisdictions in California, 2015
No. % No. % No. %
Prior TB
No. with Susceptibility
Testing
Cases with Resistance to >=One Drug
No. with Susceptibility
Testing
Cases with Resistance to >=One Drug
Reporting Jurisdiction
Total Culture Positive Cases
Total Cases** with
Susceptibility Testing
Total Cases with Resistance to >=One Drug
No Prior TB
Santa Barbara 18 18 5 27.8 18 5 27.8 . . .Santa Clara 170 168 31 18.5 152 28 18.4 15 3 20.0Santa Cruz 2 2 . . 2 . . . . .Shasta 4 4 . . 4 . . . . .Sierra . . . . . . . . . .Siskiyou . . . . . . . . . .Solano 17 17 2 11.8 14 1 7.1 3 1 33.3Sonoma 7 7 3 42.9 6 2 33.3 1 1 100.0Stanislaus 14 14 1 7.1 14 1 7.1 . . .Sutter 1 1 . . 1 . . . . .Tehama . . . . . . . . . .Trinity 1 1 . . 1 . . . . .Tulare 11 10 1 10.0 10 1 10.0 . . .Tuolumne . . . . . . . . . .Ventura 18 18 2 11.1 17 2 11.8 1 . .Yolo 9 7 1 14.3 6 1 16.7 1 . .Yuba . . . . . . . . . .
. Indicates zero cases or zero percent* First-line drugs include isoniazid, rifampin, ethambutol and pyrazinamide** Sum of cases with prior TB and without prior TB may not equal all cases due to inclusion of those with unknown history of TB.California Department of Public Health, Tuberculosis Control Branch
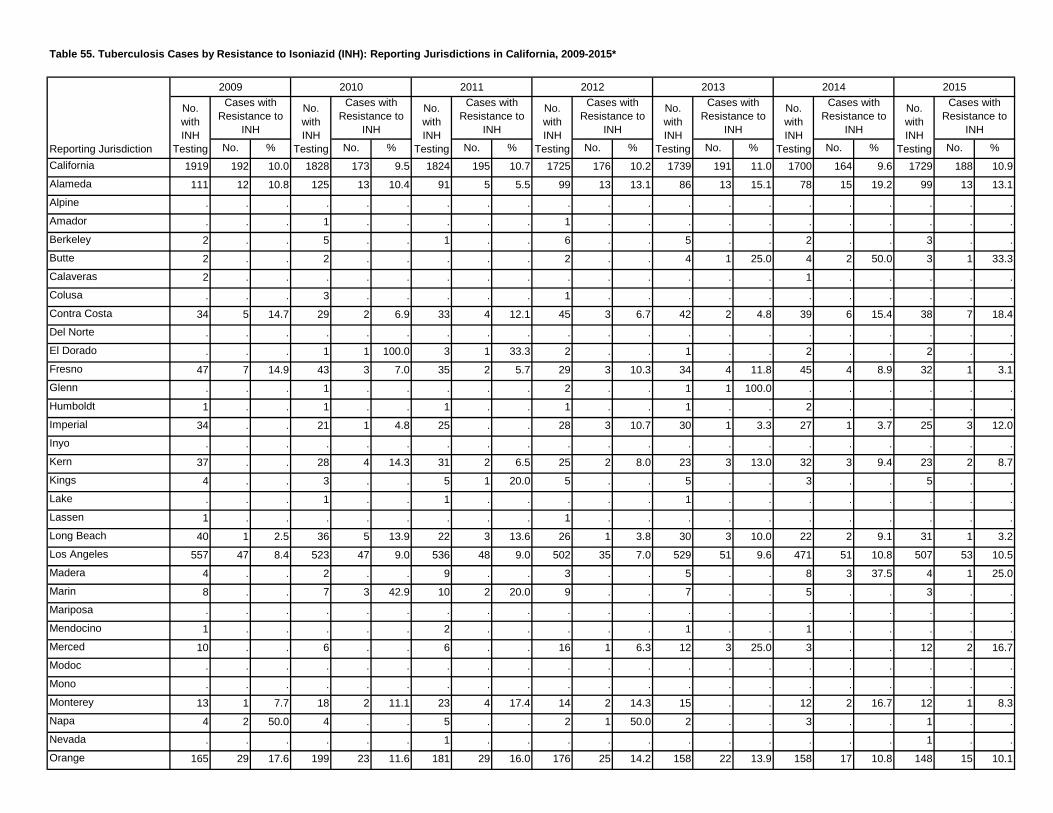
Table 55. Tuberculosis Cases by Resistance to Isoniazid (INH): Reporting Jurisdictions in California, 2009-2015*
No. % No. % No. % No. % No. % No. % No. %California 1919 192 10.0 1828 173 9.5 1824 195 10.7 1725 176 10.2 1739 191 11.0 1700 164 9.6 1729 188 10.9Alameda 111 12 10.8 125 13 10.4 91 5 5.5 99 13 13.1 86 13 15.1 78 15 19.2 99 13 13.1Alpine . . . . . . . . . . . . . . . . . . . . .Amador . . . 1 . . . . . 1 . . . . . . . . . . .Berkeley 2 . . 5 . . 1 . . 6 . . 5 . . 2 . . 3 . .Butte 2 . . 2 . . . . . 2 . . 4 1 25.0 4 2 50.0 3 1 33.3Calaveras 2 . . . . . . . . . . . . . . 1 . . . . .Colusa . . . 3 . . . . . 1 . . . . . . . . . . .Contra Costa 34 5 14.7 29 2 6.9 33 4 12.1 45 3 6.7 42 2 4.8 39 6 15.4 38 7 18.4Del Norte . . . . . . . . . . . . . . . . . . . . .El Dorado . . . 1 1 100.0 3 1 33.3 2 . . 1 . . 2 . . 2 . .Fresno 47 7 14.9 43 3 7.0 35 2 5.7 29 3 10.3 34 4 11.8 45 4 8.9 32 1 3.1Glenn . . . 1 . . . . . 2 . . 1 1 100.0 . . . . . .Humboldt 1 . . 1 . . 1 . . 1 . . 1 . . 2 . . . . .Imperial 34 . . 21 1 4.8 25 . . 28 3 10.7 30 1 3.3 27 1 3.7 25 3 12.0Inyo . . . . . . . . . . . . . . . . . . . . .Kern 37 . . 28 4 14.3 31 2 6.5 25 2 8.0 23 3 13.0 32 3 9.4 23 2 8.7Kings 4 . . 3 . . 5 1 20.0 5 . . 5 . . 3 . . 5 . .Lake . . . 1 . . 1 . . . . . 1 . . . . . . . .Lassen 1 . . . . . . . . 1 . . . . . . . . . . .Long Beach 40 1 2.5 36 5 13.9 22 3 13.6 26 1 3.8 30 3 10.0 22 2 9.1 31 1 3.2Los Angeles 557 47 8.4 523 47 9.0 536 48 9.0 502 35 7.0 529 51 9.6 471 51 10.8 507 53 10.5Madera 4 . . 2 . . 9 . . 3 . . 5 . . 8 3 37.5 4 1 25.0Marin 8 . . 7 3 42.9 10 2 20.0 9 . . 7 . . 5 . . 3 . .Mariposa . . . . . . . . . . . . . . . . . . . . .Mendocino 1 . . . . . 2 . . . . . 1 . . 1 . . . . .Merced 10 . . 6 . . 6 . . 16 1 6.3 12 3 25.0 3 . . 12 2 16.7Modoc . . . . . . . . . . . . . . . . . . . . .Mono . . . . . . . . . . . . . . . . . . . . .Monterey 13 1 7.7 18 2 11.1 23 4 17.4 14 2 14.3 15 . . 12 2 16.7 12 1 8.3Napa 4 2 50.0 4 . . 5 . . 2 1 50.0 2 . . 3 . . 1 . .Nevada . . . . . . 1 . . . . . . . . . . . 1 . .Orange 165 29 17.6 199 23 11.6 181 29 16.0 176 25 14.2 158 22 13.9 158 17 10.8 148 15 10.1
Cases with Resistance to
INH
2013 2014 2015
No. with INH
Testing
Cases with Resistance to
INH
No. with INH
Testing
Cases with Resistance to
INH
No. with INH
Testing
No. with INH
Testing
Cases with Resistance to
INH
No. with INH
Testing
Cases with Resistance to
INH
No. with INH
TestingReporting Jurisdiction
2009 2010 2011 2012Cases with
Resistance to INH
No. with INH
Testing
Cases with Resistance to
INH
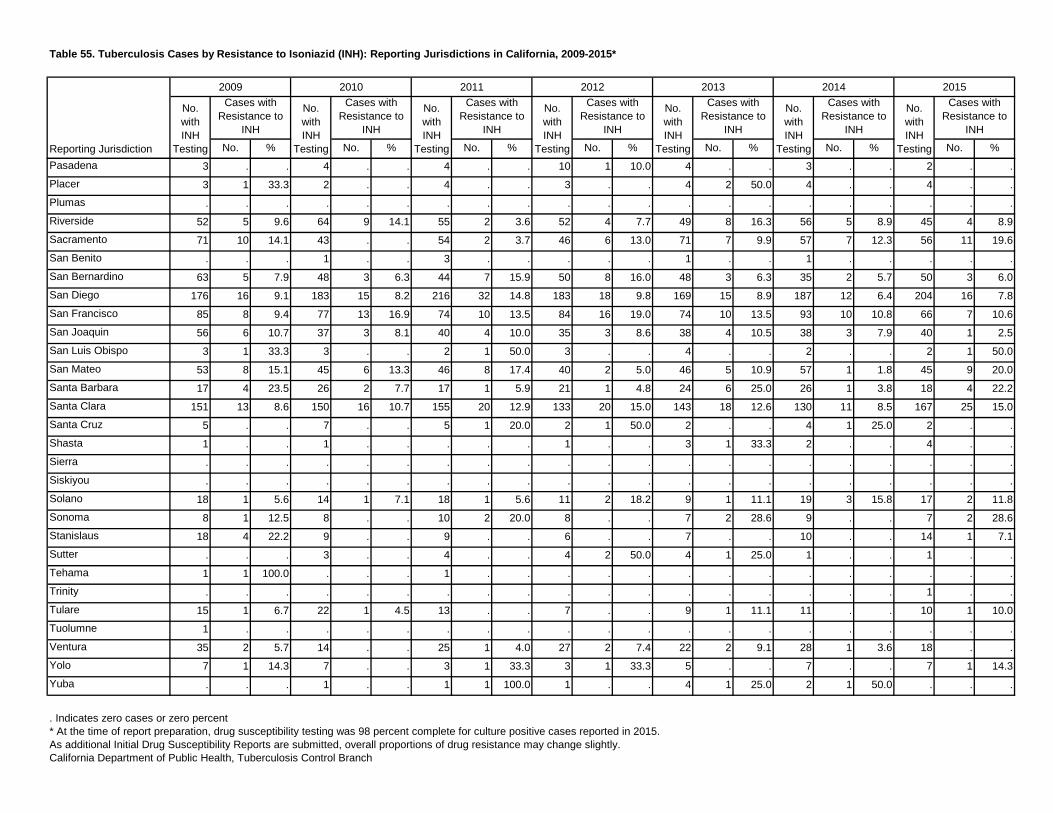
Table 55. Tuberculosis Cases by Resistance to Isoniazid (INH): Reporting Jurisdictions in California, 2009-2015*
No. % No. % No. % No. % No. % No. % No. %
Cases with Resistance to
INH
2013 2014 2015
No. with INH
Testing
Cases with Resistance to
INH
No. with INH
Testing
Cases with Resistance to
INH
No. with INH
Testing
No. with INH
Testing
Cases with Resistance to
INH
No. with INH
Testing
Cases with Resistance to
INH
No. with INH
TestingReporting Jurisdiction
2009 2010 2011 2012Cases with
Resistance to INH
No. with INH
Testing
Cases with Resistance to
INH
Pasadena 3 . . 4 . . 4 . . 10 1 10.0 4 . . 3 . . 2 . .Placer 3 1 33.3 2 . . 4 . . 3 . . 4 2 50.0 4 . . 4 . .Plumas . . . . . . . . . . . . . . . . . . . . .Riverside 52 5 9.6 64 9 14.1 55 2 3.6 52 4 7.7 49 8 16.3 56 5 8.9 45 4 8.9Sacramento 71 10 14.1 43 . . 54 2 3.7 46 6 13.0 71 7 9.9 57 7 12.3 56 11 19.6San Benito . . . 1 . . 3 . . . . . 1 . . 1 . . . . .San Bernardino 63 5 7.9 48 3 6.3 44 7 15.9 50 8 16.0 48 3 6.3 35 2 5.7 50 3 6.0San Diego 176 16 9.1 183 15 8.2 216 32 14.8 183 18 9.8 169 15 8.9 187 12 6.4 204 16 7.8San Francisco 85 8 9.4 77 13 16.9 74 10 13.5 84 16 19.0 74 10 13.5 93 10 10.8 66 7 10.6San Joaquin 56 6 10.7 37 3 8.1 40 4 10.0 35 3 8.6 38 4 10.5 38 3 7.9 40 1 2.5San Luis Obispo 3 1 33.3 3 . . 2 1 50.0 3 . . 4 . . 2 . . 2 1 50.0San Mateo 53 8 15.1 45 6 13.3 46 8 17.4 40 2 5.0 46 5 10.9 57 1 1.8 45 9 20.0Santa Barbara 17 4 23.5 26 2 7.7 17 1 5.9 21 1 4.8 24 6 25.0 26 1 3.8 18 4 22.2Santa Clara 151 13 8.6 150 16 10.7 155 20 12.9 133 20 15.0 143 18 12.6 130 11 8.5 167 25 15.0Santa Cruz 5 . . 7 . . 5 1 20.0 2 1 50.0 2 . . 4 1 25.0 2 . .Shasta 1 . . 1 . . . . . 1 . . 3 1 33.3 2 . . 4 . .Sierra . . . . . . . . . . . . . . . . . . . . .Siskiyou . . . . . . . . . . . . . . . . . . . . .Solano 18 1 5.6 14 1 7.1 18 1 5.6 11 2 18.2 9 1 11.1 19 3 15.8 17 2 11.8Sonoma 8 1 12.5 8 . . 10 2 20.0 8 . . 7 2 28.6 9 . . 7 2 28.6Stanislaus 18 4 22.2 9 . . 9 . . 6 . . 7 . . 10 . . 14 1 7.1Sutter . . . 3 . . 4 . . 4 2 50.0 4 1 25.0 1 . . 1 . .Tehama 1 1 100.0 . . . 1 . . . . . . . . . . . . . .Trinity . . . . . . . . . . . . . . . . . . 1 . .Tulare 15 1 6.7 22 1 4.5 13 . . 7 . . 9 1 11.1 11 . . 10 1 10.0Tuolumne 1 . . . . . . . . . . . . . . . . . . . .Ventura 35 2 5.7 14 . . 25 1 4.0 27 2 7.4 22 2 9.1 28 1 3.6 18 . .Yolo 7 1 14.3 7 . . 3 1 33.3 3 1 33.3 5 . . 7 . . 7 1 14.3Yuba . . . 1 . . 1 1 100.0 1 . . 4 1 25.0 2 1 50.0 . . .
. Indicates zero cases or zero percent* At the time of report preparation, drug susceptibility testing was 98 percent complete for culture positive cases reported in 2015.As additional Initial Drug Susceptibility Reports are submitted, overall proportions of drug resistance may change slightly.California Department of Public Health, Tuberculosis Control Branch
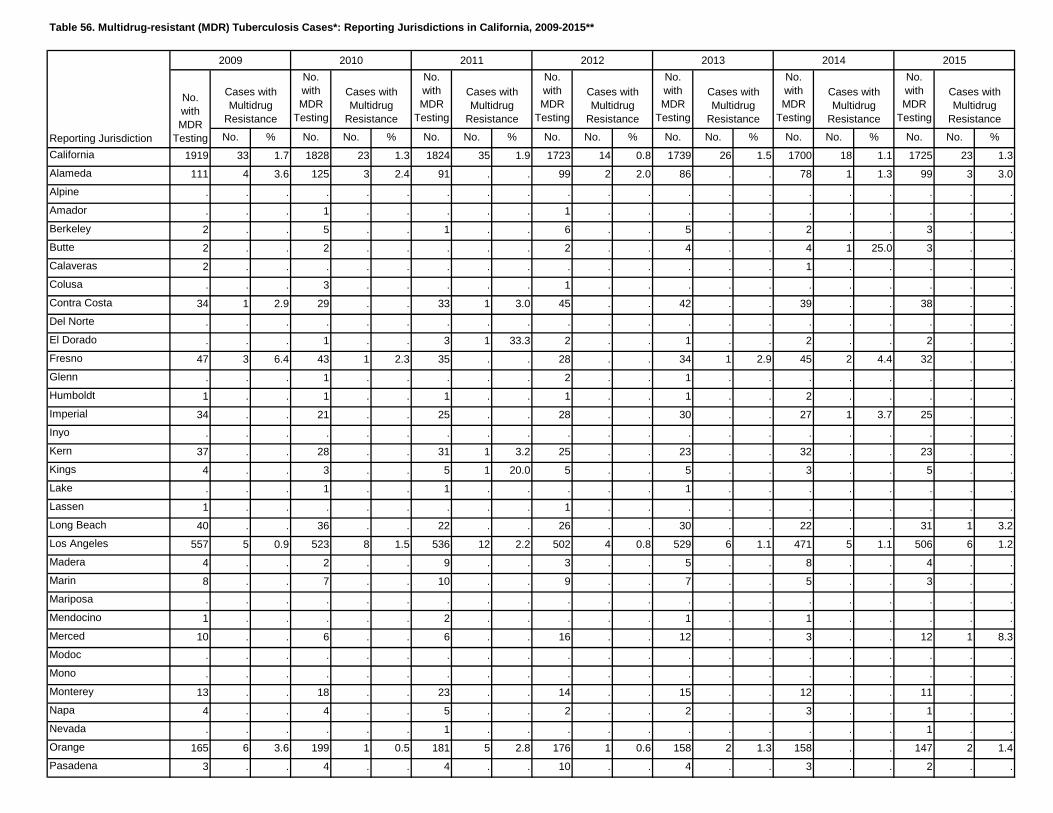
Table 56. Multidrug-resistant (MDR) Tuberculosis Cases*: Reporting Jurisdictions in California, 2009-2015**
No. with MDR
Testing
No. with MDR
Testing
No. with MDR
Testing
No. with MDR
Testing
No. with MDR
Testing
No. with MDR
Testing
No. % No. No. % No. No. % No. No. % No. No. % No. No. % No. No. %California 1919 33 1.7 1828 23 1.3 1824 35 1.9 1723 14 0.8 1739 26 1.5 1700 18 1.1 1725 23 1.3Alameda 111 4 3.6 125 3 2.4 91 . . 99 2 2.0 86 . . 78 1 1.3 99 3 3.0Alpine . . . . . . . . . . . . . . . . . . . . .Amador . . . 1 . . . . . 1 . . . . . . . . . . .Berkeley 2 . . 5 . . 1 . . 6 . . 5 . . 2 . . 3 . .Butte 2 . . 2 . . . . . 2 . . 4 . . 4 1 25.0 3 . .Calaveras 2 . . . . . . . . . . . . . . 1 . . . . .Colusa . . . 3 . . . . . 1 . . . . . . . . . . .Contra Costa 34 1 2.9 29 . . 33 1 3.0 45 . . 42 . . 39 . . 38 . .Del Norte . . . . . . . . . . . . . . . . . . . . .El Dorado . . . 1 . . 3 1 33.3 2 . . 1 . . 2 . . 2 . .Fresno 47 3 6.4 43 1 2.3 35 . . 28 . . 34 1 2.9 45 2 4.4 32 . .Glenn . . . 1 . . . . . 2 . . 1 . . . . . . . .Humboldt 1 . . 1 . . 1 . . 1 . . 1 . . 2 . . . . .Imperial 34 . . 21 . . 25 . . 28 . . 30 . . 27 1 3.7 25 . .Inyo . . . . . . . . . . . . . . . . . . . . .Kern 37 . . 28 . . 31 1 3.2 25 . . 23 . . 32 . . 23 . .Kings 4 . . 3 . . 5 1 20.0 5 . . 5 . . 3 . . 5 . .Lake . . . 1 . . 1 . . . . . 1 . . . . . . . .Lassen 1 . . . . . . . . 1 . . . . . . . . . . .Long Beach 40 . . 36 . . 22 . . 26 . . 30 . . 22 . . 31 1 3.2Los Angeles 557 5 0.9 523 8 1.5 536 12 2.2 502 4 0.8 529 6 1.1 471 5 1.1 506 6 1.2Madera 4 . . 2 . . 9 . . 3 . . 5 . . 8 . . 4 . .Marin 8 . . 7 . . 10 . . 9 . . 7 . . 5 . . 3 . .Mariposa . . . . . . . . . . . . . . . . . . . . .Mendocino 1 . . . . . 2 . . . . . 1 . . 1 . . . . .Merced 10 . . 6 . . 6 . . 16 . . 12 . . 3 . . 12 1 8.3Modoc . . . . . . . . . . . . . . . . . . . . .Mono . . . . . . . . . . . . . . . . . . . . .Monterey 13 . . 18 . . 23 . . 14 . . 15 . . 12 . . 11 . .Napa 4 . . 4 . . 5 . . 2 . . 2 . . 3 . . 1 . .Nevada . . . . . . 1 . . . . . . . . . . . 1 . .Orange 165 6 3.6 199 1 0.5 181 5 2.8 176 1 0.6 158 2 1.3 158 . . 147 2 1.4Pasadena 3 . . 4 . . 4 . . 10 . . 4 . . 3 . . 2 . .
Cases with Multidrug
Resistance
No. with MDR
Testing
2013 2014 2015
Cases with Multidrug
Resistance
Cases with Multidrug
Resistance
Cases with Multidrug
Resistance
Cases with Multidrug
Resistance
Cases with Multidrug
Resistance
Cases with Multidrug
Resistance
Reporting Jurisdiction
2009 2010 2011 2012
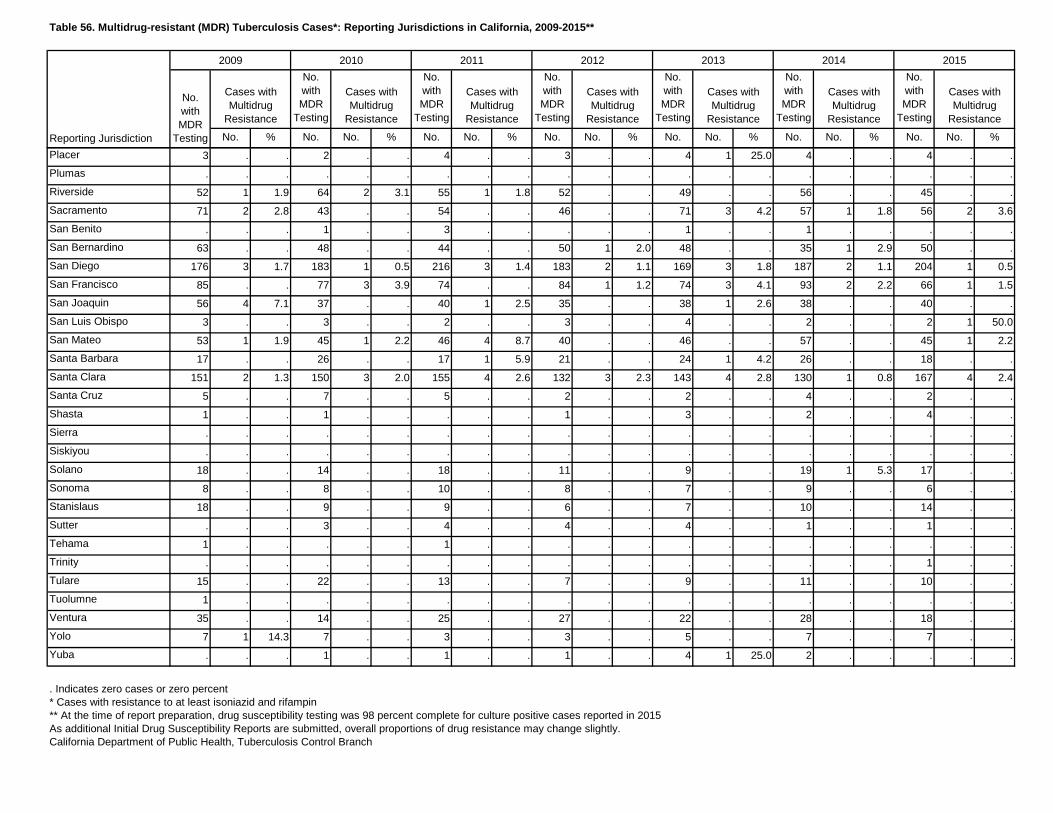
Table 56. Multidrug-resistant (MDR) Tuberculosis Cases*: Reporting Jurisdictions in California, 2009-2015**
No. with MDR
Testing
No. with MDR
Testing
No. with MDR
Testing
No. with MDR
Testing
No. with MDR
Testing
No. with MDR
Testing
No. % No. No. % No. No. % No. No. % No. No. % No. No. % No. No. %
Cases with Multidrug
Resistance
No. with MDR
Testing
2013 2014 2015
Cases with Multidrug
Resistance
Cases with Multidrug
Resistance
Cases with Multidrug
Resistance
Cases with Multidrug
Resistance
Cases with Multidrug
Resistance
Cases with Multidrug
Resistance
Reporting Jurisdiction
2009 2010 2011 2012
Placer 3 . . 2 . . 4 . . 3 . . 4 1 25.0 4 . . 4 . .Plumas . . . . . . . . . . . . . . . . . . . . .Riverside 52 1 1.9 64 2 3.1 55 1 1.8 52 . . 49 . . 56 . . 45 . .Sacramento 71 2 2.8 43 . . 54 . . 46 . . 71 3 4.2 57 1 1.8 56 2 3.6San Benito . . . 1 . . 3 . . . . . 1 . . 1 . . . . .San Bernardino 63 . . 48 . . 44 . . 50 1 2.0 48 . . 35 1 2.9 50 . .San Diego 176 3 1.7 183 1 0.5 216 3 1.4 183 2 1.1 169 3 1.8 187 2 1.1 204 1 0.5San Francisco 85 . . 77 3 3.9 74 . . 84 1 1.2 74 3 4.1 93 2 2.2 66 1 1.5San Joaquin 56 4 7.1 37 . . 40 1 2.5 35 . . 38 1 2.6 38 . . 40 . .San Luis Obispo 3 . . 3 . . 2 . . 3 . . 4 . . 2 . . 2 1 50.0San Mateo 53 1 1.9 45 1 2.2 46 4 8.7 40 . . 46 . . 57 . . 45 1 2.2Santa Barbara 17 . . 26 . . 17 1 5.9 21 . . 24 1 4.2 26 . . 18 . .Santa Clara 151 2 1.3 150 3 2.0 155 4 2.6 132 3 2.3 143 4 2.8 130 1 0.8 167 4 2.4Santa Cruz 5 . . 7 . . 5 . . 2 . . 2 . . 4 . . 2 . .Shasta 1 . . 1 . . . . . 1 . . 3 . . 2 . . 4 . .Sierra . . . . . . . . . . . . . . . . . . . . .Siskiyou . . . . . . . . . . . . . . . . . . . . .Solano 18 . . 14 . . 18 . . 11 . . 9 . . 19 1 5.3 17 . .Sonoma 8 . . 8 . . 10 . . 8 . . 7 . . 9 . . 6 . .Stanislaus 18 . . 9 . . 9 . . 6 . . 7 . . 10 . . 14 . .Sutter . . . 3 . . 4 . . 4 . . 4 . . 1 . . 1 . .Tehama 1 . . . . . 1 . . . . . . . . . . . . . .Trinity . . . . . . . . . . . . . . . . . . 1 . .Tulare 15 . . 22 . . 13 . . 7 . . 9 . . 11 . . 10 . .Tuolumne 1 . . . . . . . . . . . . . . . . . . . .Ventura 35 . . 14 . . 25 . . 27 . . 22 . . 28 . . 18 . .Yolo 7 1 14.3 7 . . 3 . . 3 . . 5 . . 7 . . 7 . .Yuba . . . 1 . . 1 . . 1 . . 4 1 25.0 2 . . . . .
. Indicates zero cases or zero percent* Cases with resistance to at least isoniazid and rifampin** At the time of report preparation, drug susceptibility testing was 98 percent complete for culture positive cases reported in 2015As additional Initial Drug Susceptibility Reports are submitted, overall proportions of drug resistance may change slightly.California Department of Public Health, Tuberculosis Control Branch
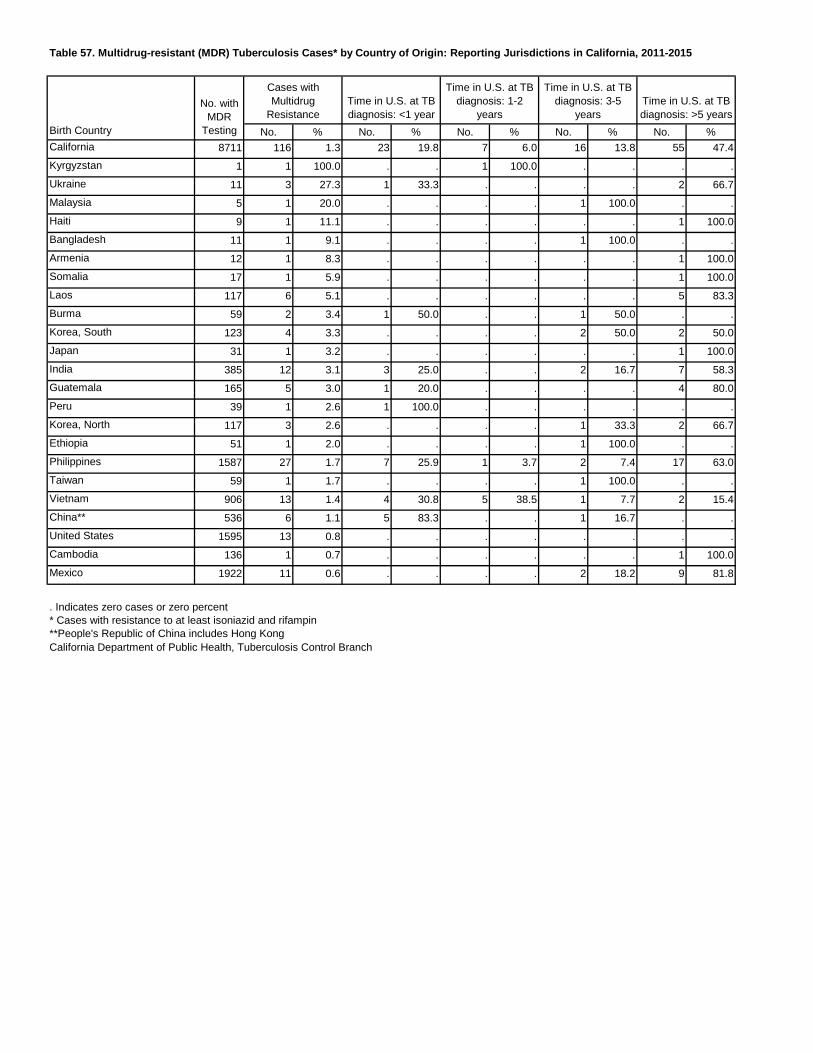
Table 57. Multidrug-resistant (MDR) Tuberculosis Cases* by Country of Origin: Reporting Jurisdictions in California, 2011-2015
No. % No. % No. % No. % No. %California 8711 116 1.3 23 19.8 7 6.0 16 13.8 55 47.4Kyrgyzstan 1 1 100.0 . . 1 100.0 . . . .Ukraine 11 3 27.3 1 33.3 . . . . 2 66.7Malaysia 5 1 20.0 . . . . 1 100.0 . .Haiti 9 1 11.1 . . . . . . 1 100.0Bangladesh 11 1 9.1 . . . . 1 100.0 . .Armenia 12 1 8.3 . . . . . . 1 100.0Somalia 17 1 5.9 . . . . . . 1 100.0Laos 117 6 5.1 . . . . . . 5 83.3Burma 59 2 3.4 1 50.0 . . 1 50.0 . .Korea, South 123 4 3.3 . . . . 2 50.0 2 50.0Japan 31 1 3.2 . . . . . . 1 100.0India 385 12 3.1 3 25.0 . . 2 16.7 7 58.3Guatemala 165 5 3.0 1 20.0 . . . . 4 80.0Peru 39 1 2.6 1 100.0 . . . . . .Korea, North 117 3 2.6 . . . . 1 33.3 2 66.7Ethiopia 51 1 2.0 . . . . 1 100.0 . .Philippines 1587 27 1.7 7 25.9 1 3.7 2 7.4 17 63.0Taiwan 59 1 1.7 . . . . 1 100.0 . .Vietnam 906 13 1.4 4 30.8 5 38.5 1 7.7 2 15.4China** 536 6 1.1 5 83.3 . . 1 16.7 . .United States 1595 13 0.8 . . . . . . . .Cambodia 136 1 0.7 . . . . . . 1 100.0Mexico 1922 11 0.6 . . . . 2 18.2 9 81.8
. Indicates zero cases or zero percent* Cases with resistance to at least isoniazid and rifampin**People's Republic of China includes Hong KongCalifornia Department of Public Health, Tuberculosis Control Branch
Time in U.S. at TB diagnosis: >5 years
Birth Country
No. with MDR
Testing
Cases with Multidrug
ResistanceTime in U.S. at TB diagnosis: <1 year
Time in U.S. at TB diagnosis: 1-2
years
Time in U.S. at TB diagnosis: 3-5
years
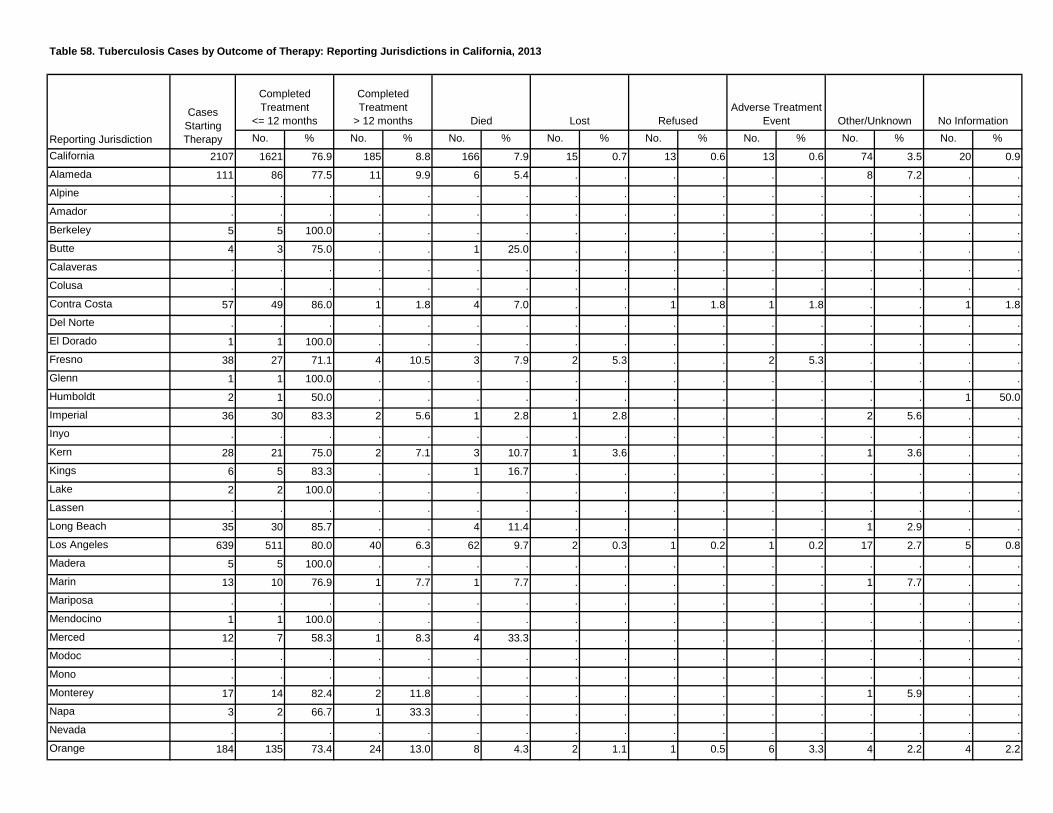
Table 58. Tuberculosis Cases by Outcome of Therapy: Reporting Jurisdictions in California, 2013
No. % No. % No. % No. % No. % No. % No. % No. %California 2107 1621 76.9 185 8.8 166 7.9 15 0.7 13 0.6 13 0.6 74 3.5 20 0.9Alameda 111 86 77.5 11 9.9 6 5.4 . . . . . . 8 7.2 . .Alpine . . . . . . . . . . . . . . . . .Amador . . . . . . . . . . . . . . . . .Berkeley 5 5 100.0 . . . . . . . . . . . . . .Butte 4 3 75.0 . . 1 25.0 . . . . . . . . . .Calaveras . . . . . . . . . . . . . . . . .Colusa . . . . . . . . . . . . . . . . .Contra Costa 57 49 86.0 1 1.8 4 7.0 . . 1 1.8 1 1.8 . . 1 1.8Del Norte . . . . . . . . . . . . . . . . .El Dorado 1 1 100.0 . . . . . . . . . . . . . .Fresno 38 27 71.1 4 10.5 3 7.9 2 5.3 . . 2 5.3 . . . .Glenn 1 1 100.0 . . . . . . . . . . . . . .Humboldt 2 1 50.0 . . . . . . . . . . . . 1 50.0Imperial 36 30 83.3 2 5.6 1 2.8 1 2.8 . . . . 2 5.6 . .Inyo . . . . . . . . . . . . . . . . .Kern 28 21 75.0 2 7.1 3 10.7 1 3.6 . . . . 1 3.6 . .Kings 6 5 83.3 . . 1 16.7 . . . . . . . . . .Lake 2 2 100.0 . . . . . . . . . . . . . .Lassen . . . . . . . . . . . . . . . . .Long Beach 35 30 85.7 . . 4 11.4 . . . . . . 1 2.9 . .Los Angeles 639 511 80.0 40 6.3 62 9.7 2 0.3 1 0.2 1 0.2 17 2.7 5 0.8Madera 5 5 100.0 . . . . . . . . . . . . . .Marin 13 10 76.9 1 7.7 1 7.7 . . . . . . 1 7.7 . .Mariposa . . . . . . . . . . . . . . . . .Mendocino 1 1 100.0 . . . . . . . . . . . . . .Merced 12 7 58.3 1 8.3 4 33.3 . . . . . . . . . .Modoc . . . . . . . . . . . . . . . . .Mono . . . . . . . . . . . . . . . . .Monterey 17 14 82.4 2 11.8 . . . . . . . . 1 5.9 . .Napa 3 2 66.7 1 33.3 . . . . . . . . . . . .Nevada . . . . . . . . . . . . . . . . .Orange 184 135 73.4 24 13.0 8 4.3 2 1.1 1 0.5 6 3.3 4 2.2 4 2.2
RefusedAdverse Treatment
Event Other/Unknown No Information
Reporting Jurisdiction
Cases Starting Therapy
Completed Treatment
<= 12 months
Completed Treatment
> 12 months Died Lost
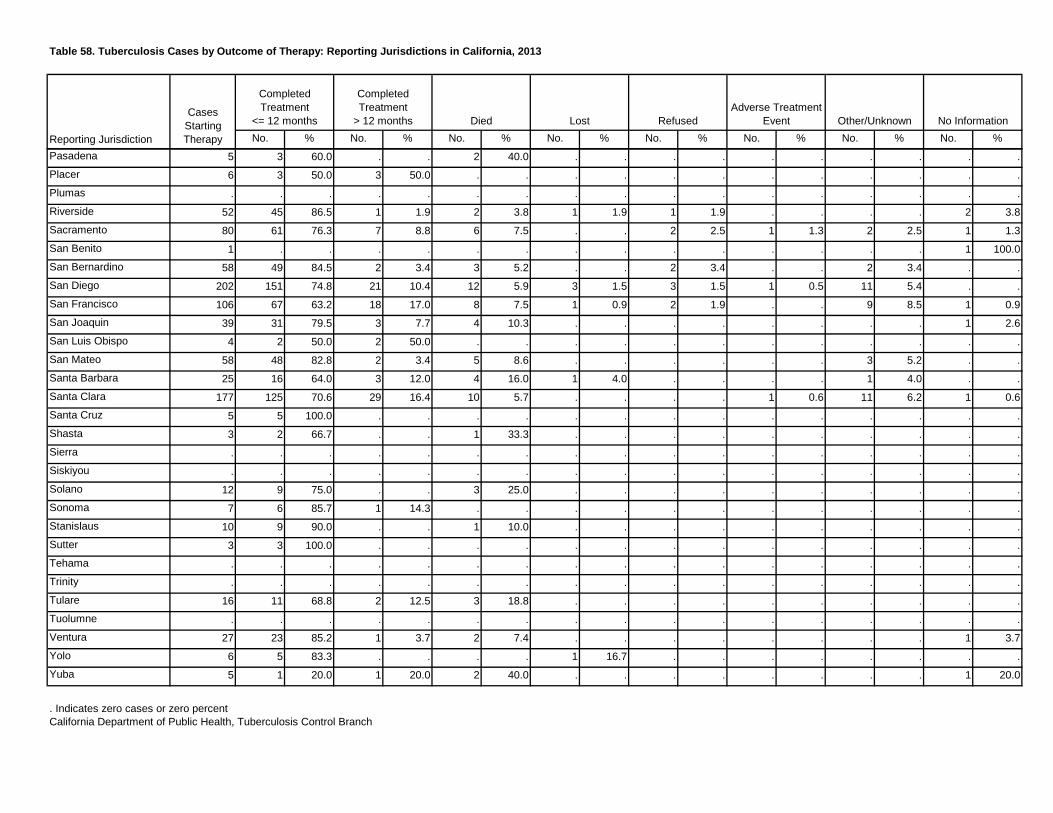
Table 58. Tuberculosis Cases by Outcome of Therapy: Reporting Jurisdictions in California, 2013
No. % No. % No. % No. % No. % No. % No. % No. %Refused
Adverse Treatment Event Other/Unknown No Information
Reporting Jurisdiction
Cases Starting Therapy
Completed Treatment
<= 12 months
Completed Treatment
> 12 months Died Lost
Pasadena 5 3 60.0 . . 2 40.0 . . . . . . . . . .Placer 6 3 50.0 3 50.0 . . . . . . . . . . . .Plumas . . . . . . . . . . . . . . . . .Riverside 52 45 86.5 1 1.9 2 3.8 1 1.9 1 1.9 . . . . 2 3.8Sacramento 80 61 76.3 7 8.8 6 7.5 . . 2 2.5 1 1.3 2 2.5 1 1.3San Benito 1 . . . . . . . . . . . . . . 1 100.0San Bernardino 58 49 84.5 2 3.4 3 5.2 . . 2 3.4 . . 2 3.4 . .San Diego 202 151 74.8 21 10.4 12 5.9 3 1.5 3 1.5 1 0.5 11 5.4 . .San Francisco 106 67 63.2 18 17.0 8 7.5 1 0.9 2 1.9 . . 9 8.5 1 0.9San Joaquin 39 31 79.5 3 7.7 4 10.3 . . . . . . . . 1 2.6San Luis Obispo 4 2 50.0 2 50.0 . . . . . . . . . . . .San Mateo 58 48 82.8 2 3.4 5 8.6 . . . . . . 3 5.2 . .Santa Barbara 25 16 64.0 3 12.0 4 16.0 1 4.0 . . . . 1 4.0 . .Santa Clara 177 125 70.6 29 16.4 10 5.7 . . . . 1 0.6 11 6.2 1 0.6Santa Cruz 5 5 100.0 . . . . . . . . . . . . . .Shasta 3 2 66.7 . . 1 33.3 . . . . . . . . . .Sierra . . . . . . . . . . . . . . . . .Siskiyou . . . . . . . . . . . . . . . . .Solano 12 9 75.0 . . 3 25.0 . . . . . . . . . .Sonoma 7 6 85.7 1 14.3 . . . . . . . . . . . .Stanislaus 10 9 90.0 . . 1 10.0 . . . . . . . . . .Sutter 3 3 100.0 . . . . . . . . . . . . . .Tehama . . . . . . . . . . . . . . . . .Trinity . . . . . . . . . . . . . . . . .Tulare 16 11 68.8 2 12.5 3 18.8 . . . . . . . . . .Tuolumne . . . . . . . . . . . . . . . . .Ventura 27 23 85.2 1 3.7 2 7.4 . . . . . . . . 1 3.7Yolo 6 5 83.3 . . . . 1 16.7 . . . . . . . .Yuba 5 1 20.0 1 20.0 2 40.0 . . . . . . . . 1 20.0
. Indicates zero cases or zero percentCalifornia Department of Public Health, Tuberculosis Control Branch
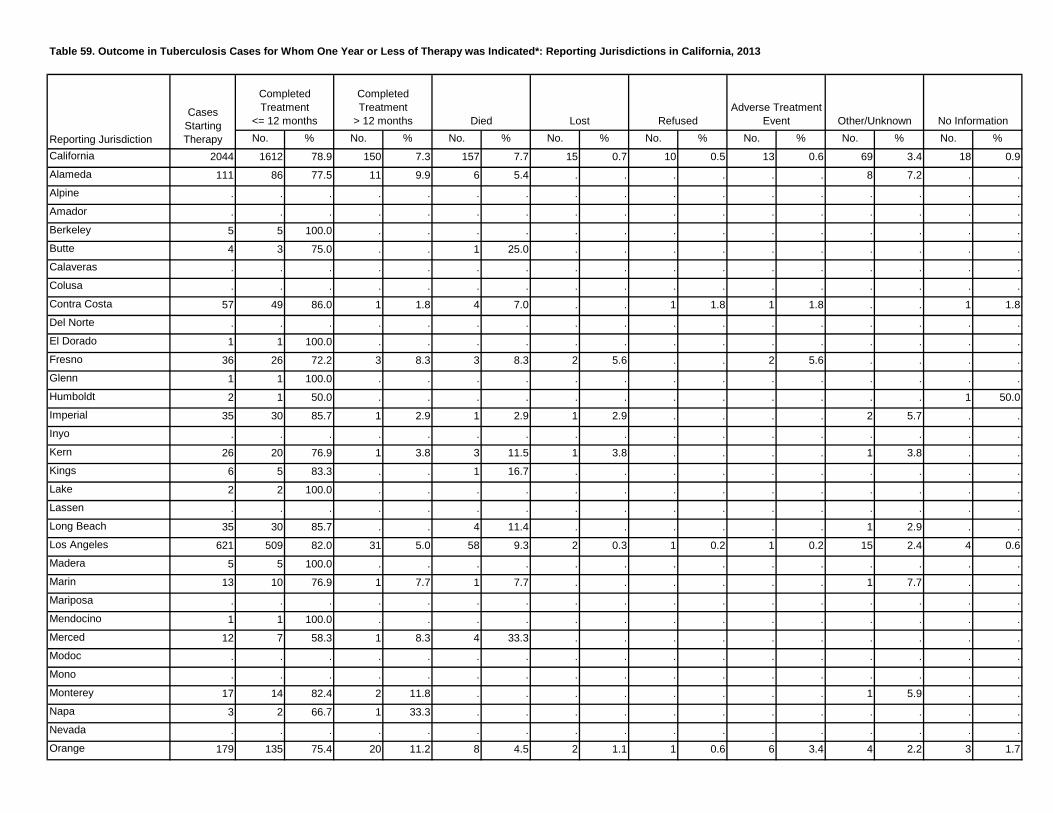
Table 59. Outcome in Tuberculosis Cases for Whom One Year or Less of Therapy was Indicated*: Reporting Jurisdictions in California, 2013
No. % No. % No. % No. % No. % No. % No. % No. %California 2044 1612 78.9 150 7.3 157 7.7 15 0.7 10 0.5 13 0.6 69 3.4 18 0.9Alameda 111 86 77.5 11 9.9 6 5.4 . . . . . . 8 7.2 . .Alpine . . . . . . . . . . . . . . . . .Amador . . . . . . . . . . . . . . . . .Berkeley 5 5 100.0 . . . . . . . . . . . . . .Butte 4 3 75.0 . . 1 25.0 . . . . . . . . . .Calaveras . . . . . . . . . . . . . . . . .Colusa . . . . . . . . . . . . . . . . .Contra Costa 57 49 86.0 1 1.8 4 7.0 . . 1 1.8 1 1.8 . . 1 1.8Del Norte . . . . . . . . . . . . . . . . .El Dorado 1 1 100.0 . . . . . . . . . . . . . .Fresno 36 26 72.2 3 8.3 3 8.3 2 5.6 . . 2 5.6 . . . .Glenn 1 1 100.0 . . . . . . . . . . . . . .Humboldt 2 1 50.0 . . . . . . . . . . . . 1 50.0Imperial 35 30 85.7 1 2.9 1 2.9 1 2.9 . . . . 2 5.7 . .Inyo . . . . . . . . . . . . . . . . .Kern 26 20 76.9 1 3.8 3 11.5 1 3.8 . . . . 1 3.8 . .Kings 6 5 83.3 . . 1 16.7 . . . . . . . . . .Lake 2 2 100.0 . . . . . . . . . . . . . .Lassen . . . . . . . . . . . . . . . . .Long Beach 35 30 85.7 . . 4 11.4 . . . . . . 1 2.9 . .Los Angeles 621 509 82.0 31 5.0 58 9.3 2 0.3 1 0.2 1 0.2 15 2.4 4 0.6Madera 5 5 100.0 . . . . . . . . . . . . . .Marin 13 10 76.9 1 7.7 1 7.7 . . . . . . 1 7.7 . .Mariposa . . . . . . . . . . . . . . . . .Mendocino 1 1 100.0 . . . . . . . . . . . . . .Merced 12 7 58.3 1 8.3 4 33.3 . . . . . . . . . .Modoc . . . . . . . . . . . . . . . . .Mono . . . . . . . . . . . . . . . . .Monterey 17 14 82.4 2 11.8 . . . . . . . . 1 5.9 . .Napa 3 2 66.7 1 33.3 . . . . . . . . . . . .Nevada . . . . . . . . . . . . . . . . .Orange 179 135 75.4 20 11.2 8 4.5 2 1.1 1 0.6 6 3.4 4 2.2 3 1.7
RefusedAdverse Treatment
Event Other/Unknown No Information
Reporting Jurisdiction
Cases Starting Therapy
Completed Treatment
<= 12 months
Completed Treatment
> 12 months Died Lost
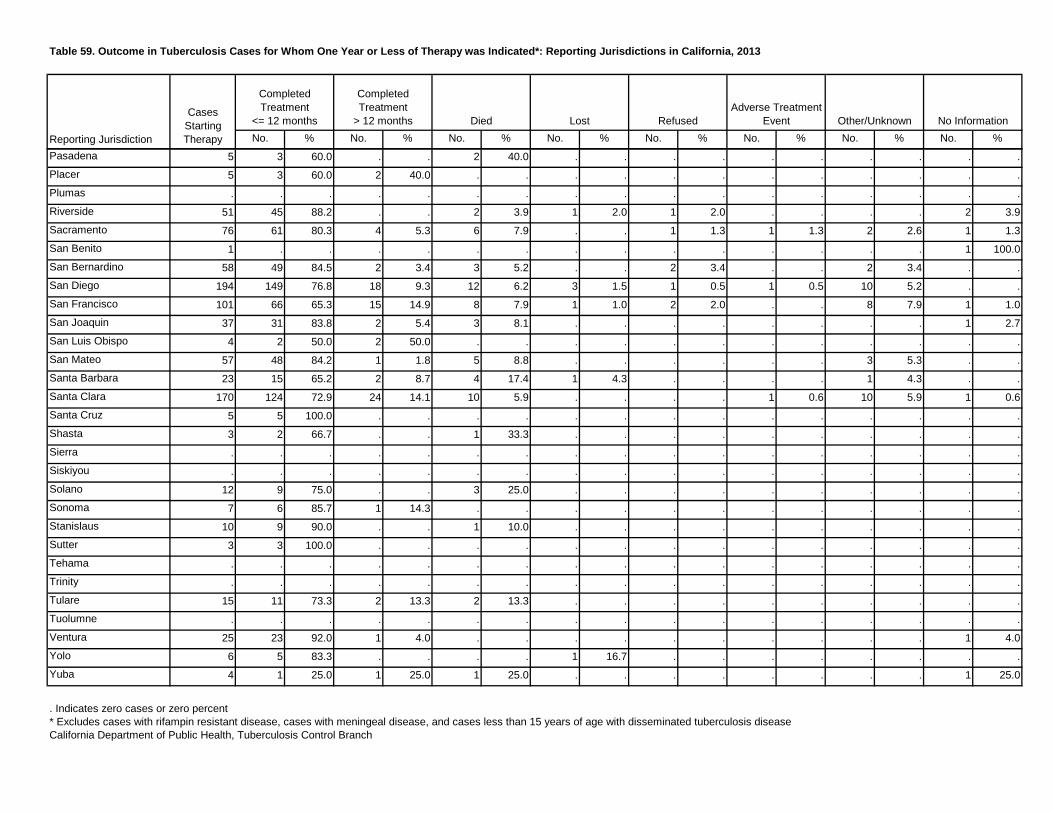
Table 59. Outcome in Tuberculosis Cases for Whom One Year or Less of Therapy was Indicated*: Reporting Jurisdictions in California, 2013
No. % No. % No. % No. % No. % No. % No. % No. %Refused
Adverse Treatment Event Other/Unknown No Information
Reporting Jurisdiction
Cases Starting Therapy
Completed Treatment
<= 12 months
Completed Treatment
> 12 months Died Lost
Pasadena 5 3 60.0 . . 2 40.0 . . . . . . . . . .Placer 5 3 60.0 2 40.0 . . . . . . . . . . . .Plumas . . . . . . . . . . . . . . . . .Riverside 51 45 88.2 . . 2 3.9 1 2.0 1 2.0 . . . . 2 3.9Sacramento 76 61 80.3 4 5.3 6 7.9 . . 1 1.3 1 1.3 2 2.6 1 1.3San Benito 1 . . . . . . . . . . . . . . 1 100.0San Bernardino 58 49 84.5 2 3.4 3 5.2 . . 2 3.4 . . 2 3.4 . .San Diego 194 149 76.8 18 9.3 12 6.2 3 1.5 1 0.5 1 0.5 10 5.2 . .San Francisco 101 66 65.3 15 14.9 8 7.9 1 1.0 2 2.0 . . 8 7.9 1 1.0San Joaquin 37 31 83.8 2 5.4 3 8.1 . . . . . . . . 1 2.7San Luis Obispo 4 2 50.0 2 50.0 . . . . . . . . . . . .San Mateo 57 48 84.2 1 1.8 5 8.8 . . . . . . 3 5.3 . .Santa Barbara 23 15 65.2 2 8.7 4 17.4 1 4.3 . . . . 1 4.3 . .Santa Clara 170 124 72.9 24 14.1 10 5.9 . . . . 1 0.6 10 5.9 1 0.6Santa Cruz 5 5 100.0 . . . . . . . . . . . . . .Shasta 3 2 66.7 . . 1 33.3 . . . . . . . . . .Sierra . . . . . . . . . . . . . . . . .Siskiyou . . . . . . . . . . . . . . . . .Solano 12 9 75.0 . . 3 25.0 . . . . . . . . . .Sonoma 7 6 85.7 1 14.3 . . . . . . . . . . . .Stanislaus 10 9 90.0 . . 1 10.0 . . . . . . . . . .Sutter 3 3 100.0 . . . . . . . . . . . . . .Tehama . . . . . . . . . . . . . . . . .Trinity . . . . . . . . . . . . . . . . .Tulare 15 11 73.3 2 13.3 2 13.3 . . . . . . . . . .Tuolumne . . . . . . . . . . . . . . . . .Ventura 25 23 92.0 1 4.0 . . . . . . . . . . 1 4.0Yolo 6 5 83.3 . . . . 1 16.7 . . . . . . . .Yuba 4 1 25.0 1 25.0 1 25.0 . . . . . . . . 1 25.0
. Indicates zero cases or zero percent* Excludes cases with rifampin resistant disease, cases with meningeal disease, and cases less than 15 years of age with disseminated tuberculosis diseaseCalifornia Department of Public Health, Tuberculosis Control Branch
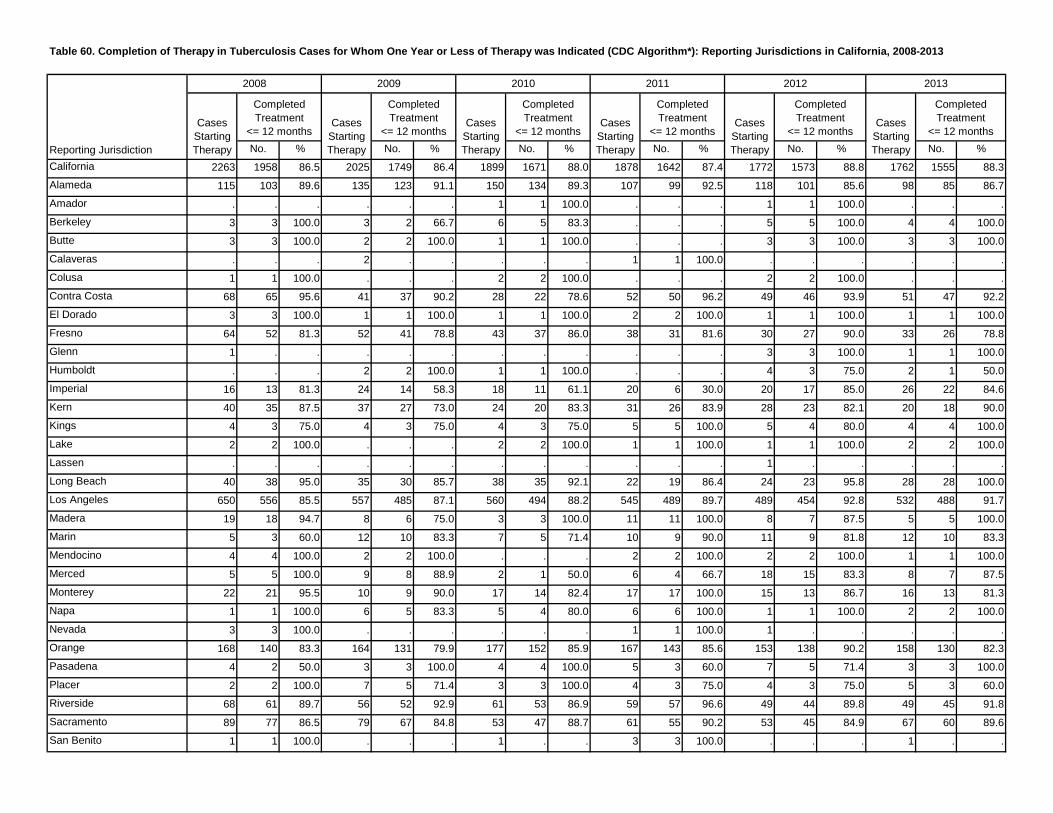
Table 60. Completion of Therapy in Tuberculosis Cases for Whom One Year or Less of Therapy was Indicated (CDC Algorithm*): Reporting Jurisdictions in California, 2008-2013
No. % No. % No. % No. % No. % No. %California 2263 1958 86.5 2025 1749 86.4 1899 1671 88.0 1878 1642 87.4 1772 1573 88.8 1762 1555 88.3Alameda 115 103 89.6 135 123 91.1 150 134 89.3 107 99 92.5 118 101 85.6 98 85 86.7Amador . . . . . . 1 1 100.0 . . . 1 1 100.0 . . .Berkeley 3 3 100.0 3 2 66.7 6 5 83.3 . . . 5 5 100.0 4 4 100.0Butte 3 3 100.0 2 2 100.0 1 1 100.0 . . . 3 3 100.0 3 3 100.0Calaveras . . . 2 . . . . . 1 1 100.0 . . . . . .Colusa 1 1 100.0 . . . 2 2 100.0 . . . 2 2 100.0 . . .Contra Costa 68 65 95.6 41 37 90.2 28 22 78.6 52 50 96.2 49 46 93.9 51 47 92.2El Dorado 3 3 100.0 1 1 100.0 1 1 100.0 2 2 100.0 1 1 100.0 1 1 100.0Fresno 64 52 81.3 52 41 78.8 43 37 86.0 38 31 81.6 30 27 90.0 33 26 78.8Glenn 1 . . . . . . . . . . . 3 3 100.0 1 1 100.0Humboldt . . . 2 2 100.0 1 1 100.0 . . . 4 3 75.0 2 1 50.0Imperial 16 13 81.3 24 14 58.3 18 11 61.1 20 6 30.0 20 17 85.0 26 22 84.6Kern 40 35 87.5 37 27 73.0 24 20 83.3 31 26 83.9 28 23 82.1 20 18 90.0Kings 4 3 75.0 4 3 75.0 4 3 75.0 5 5 100.0 5 4 80.0 4 4 100.0Lake 2 2 100.0 . . . 2 2 100.0 1 1 100.0 1 1 100.0 2 2 100.0Lassen . . . . . . . . . . . . 1 . . . . .Long Beach 40 38 95.0 35 30 85.7 38 35 92.1 22 19 86.4 24 23 95.8 28 28 100.0Los Angeles 650 556 85.5 557 485 87.1 560 494 88.2 545 489 89.7 489 454 92.8 532 488 91.7Madera 19 18 94.7 8 6 75.0 3 3 100.0 11 11 100.0 8 7 87.5 5 5 100.0Marin 5 3 60.0 12 10 83.3 7 5 71.4 10 9 90.0 11 9 81.8 12 10 83.3Mendocino 4 4 100.0 2 2 100.0 . . . 2 2 100.0 2 2 100.0 1 1 100.0Merced 5 5 100.0 9 8 88.9 2 1 50.0 6 4 66.7 18 15 83.3 8 7 87.5Monterey 22 21 95.5 10 9 90.0 17 14 82.4 17 17 100.0 15 13 86.7 16 13 81.3Napa 1 1 100.0 6 5 83.3 5 4 80.0 6 6 100.0 1 1 100.0 2 2 100.0Nevada 3 3 100.0 . . . . . . 1 1 100.0 1 . . . . .Orange 168 140 83.3 164 131 79.9 177 152 85.9 167 143 85.6 153 138 90.2 158 130 82.3Pasadena 4 2 50.0 3 3 100.0 4 4 100.0 5 3 60.0 7 5 71.4 3 3 100.0Placer 2 2 100.0 7 5 71.4 3 3 100.0 4 3 75.0 4 3 75.0 5 3 60.0Riverside 68 61 89.7 56 52 92.9 61 53 86.9 59 57 96.6 49 44 89.8 49 45 91.8Sacramento 89 77 86.5 79 67 84.8 53 47 88.7 61 55 90.2 53 45 84.9 67 60 89.6San Benito 1 1 100.0 . . . 1 . . 3 3 100.0 . . . 1 . .
Cases Starting Therapy
Completed Treatment
<= 12 months
2013
Cases Starting Therapy
Completed Treatment
<= 12 monthsCases
Starting Therapy
Completed Treatment
<= 12 monthsCases
Starting Therapy
Completed Treatment
<= 12 monthsCases
Starting Therapy
Completed Treatment
<= 12 monthsCases
Starting Therapy
2012
Completed Treatment
<= 12 months
Reporting Jurisdiction
2008 2009 2010 2011
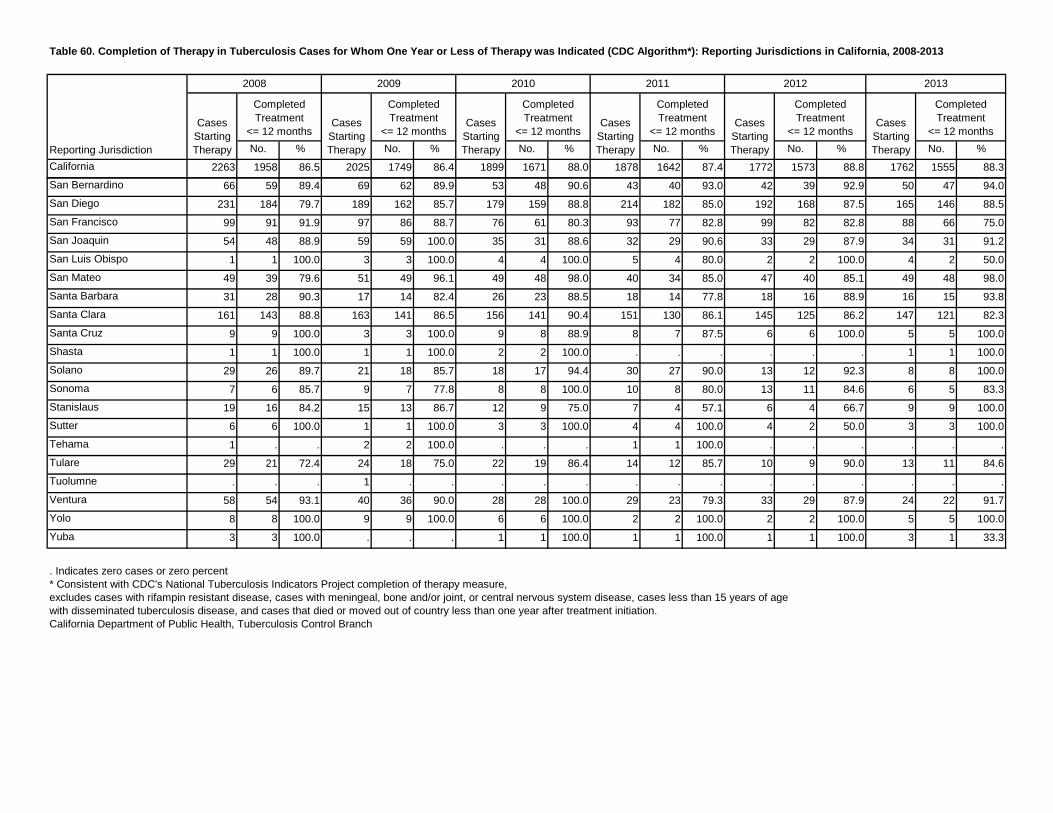
Table 60. Completion of Therapy in Tuberculosis Cases for Whom One Year or Less of Therapy was Indicated (CDC Algorithm*): Reporting Jurisdictions in California, 2008-2013
No. % No. % No. % No. % No. % No. %California 2263 1958 86.5 2025 1749 86.4 1899 1671 88.0 1878 1642 87.4 1772 1573 88.8 1762 1555 88.3
Cases Starting Therapy
Completed Treatment
<= 12 months
2013
Cases Starting Therapy
Completed Treatment
<= 12 monthsCases
Starting Therapy
Completed Treatment
<= 12 monthsCases
Starting Therapy
Completed Treatment
<= 12 monthsCases
Starting Therapy
Completed Treatment
<= 12 monthsCases
Starting Therapy
2012
Completed Treatment
<= 12 months
Reporting Jurisdiction
2008 2009 2010 2011
San Bernardino 66 59 89.4 69 62 89.9 53 48 90.6 43 40 93.0 42 39 92.9 50 47 94.0San Diego 231 184 79.7 189 162 85.7 179 159 88.8 214 182 85.0 192 168 87.5 165 146 88.5San Francisco 99 91 91.9 97 86 88.7 76 61 80.3 93 77 82.8 99 82 82.8 88 66 75.0San Joaquin 54 48 88.9 59 59 100.0 35 31 88.6 32 29 90.6 33 29 87.9 34 31 91.2San Luis Obispo 1 1 100.0 3 3 100.0 4 4 100.0 5 4 80.0 2 2 100.0 4 2 50.0San Mateo 49 39 79.6 51 49 96.1 49 48 98.0 40 34 85.0 47 40 85.1 49 48 98.0Santa Barbara 31 28 90.3 17 14 82.4 26 23 88.5 18 14 77.8 18 16 88.9 16 15 93.8Santa Clara 161 143 88.8 163 141 86.5 156 141 90.4 151 130 86.1 145 125 86.2 147 121 82.3Santa Cruz 9 9 100.0 3 3 100.0 9 8 88.9 8 7 87.5 6 6 100.0 5 5 100.0Shasta 1 1 100.0 1 1 100.0 2 2 100.0 . . . . . . 1 1 100.0Solano 29 26 89.7 21 18 85.7 18 17 94.4 30 27 90.0 13 12 92.3 8 8 100.0Sonoma 7 6 85.7 9 7 77.8 8 8 100.0 10 8 80.0 13 11 84.6 6 5 83.3Stanislaus 19 16 84.2 15 13 86.7 12 9 75.0 7 4 57.1 6 4 66.7 9 9 100.0Sutter 6 6 100.0 1 1 100.0 3 3 100.0 4 4 100.0 4 2 50.0 3 3 100.0Tehama 1 . . 2 2 100.0 . . . 1 1 100.0 . . . . . .Tulare 29 21 72.4 24 18 75.0 22 19 86.4 14 12 85.7 10 9 90.0 13 11 84.6Tuolumne . . . 1 . . . . . . . . . . . . . .Ventura 58 54 93.1 40 36 90.0 28 28 100.0 29 23 79.3 33 29 87.9 24 22 91.7Yolo 8 8 100.0 9 9 100.0 6 6 100.0 2 2 100.0 2 2 100.0 5 5 100.0Yuba 3 3 100.0 . . . 1 1 100.0 1 1 100.0 1 1 100.0 3 1 33.3
. Indicates zero cases or zero percent* Consistent with CDC's National Tuberculosis Indicators Project completion of therapy measure,excludes cases with rifampin resistant disease, cases with meningeal, bone and/or joint, or central nervous system disease, cases less than 15 years of agewith disseminated tuberculosis disease, and cases that died or moved out of country less than one year after treatment initiation.California Department of Public Health, Tuberculosis Control Branch
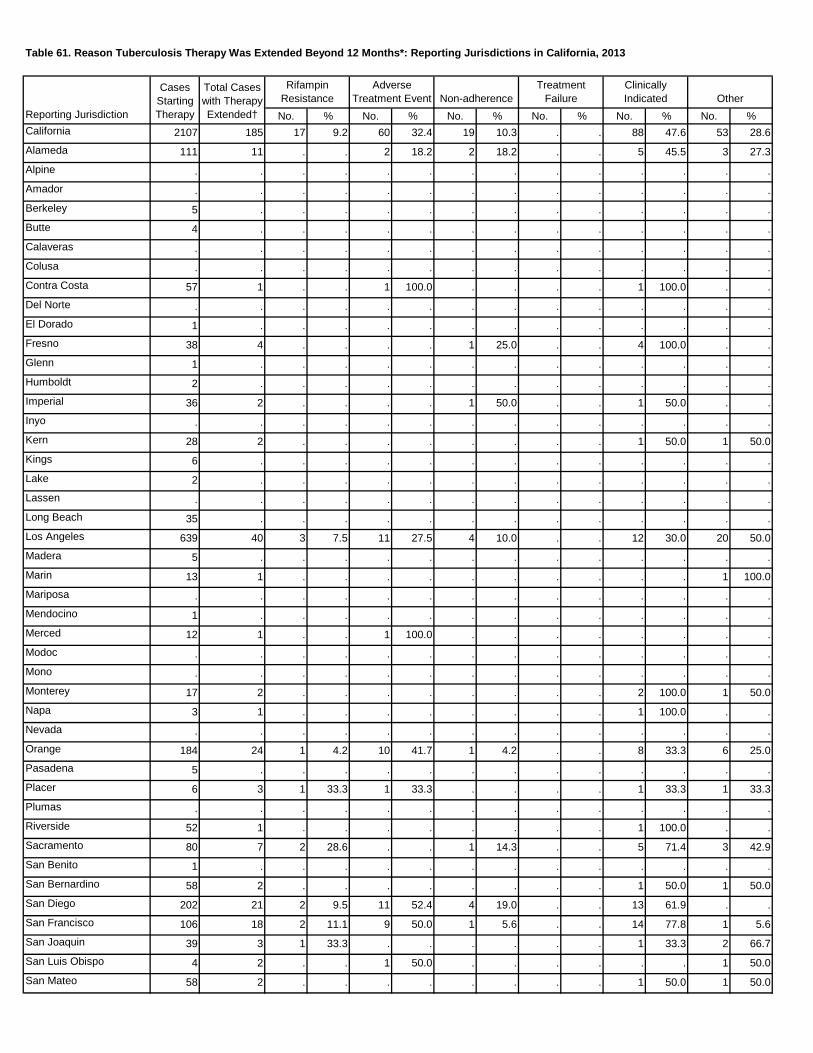
Table 61. Reason Tuberculosis Therapy Was Extended Beyond 12 Months*: Reporting Jurisdictions in California, 2013
No. % No. % No. % No. % No. % No. %California 2107 185 17 9.2 60 32.4 19 10.3 . . 88 47.6 53 28.6Alameda 111 11 . . 2 18.2 2 18.2 . . 5 45.5 3 27.3Alpine . . . . . . . . . . . . . .Amador . . . . . . . . . . . . . .Berkeley 5 . . . . . . . . . . . . .Butte 4 . . . . . . . . . . . . .Calaveras . . . . . . . . . . . . . .Colusa . . . . . . . . . . . . . .Contra Costa 57 1 . . 1 100.0 . . . . 1 100.0 . .Del Norte . . . . . . . . . . . . . .El Dorado 1 . . . . . . . . . . . . .Fresno 38 4 . . . . 1 25.0 . . 4 100.0 . .Glenn 1 . . . . . . . . . . . . .Humboldt 2 . . . . . . . . . . . . .Imperial 36 2 . . . . 1 50.0 . . 1 50.0 . .Inyo . . . . . . . . . . . . . .Kern 28 2 . . . . . . . . 1 50.0 1 50.0Kings 6 . . . . . . . . . . . . .Lake 2 . . . . . . . . . . . . .Lassen . . . . . . . . . . . . . .Long Beach 35 . . . . . . . . . . . . .Los Angeles 639 40 3 7.5 11 27.5 4 10.0 . . 12 30.0 20 50.0Madera 5 . . . . . . . . . . . . .Marin 13 1 . . . . . . . . . . 1 100.0Mariposa . . . . . . . . . . . . . .Mendocino 1 . . . . . . . . . . . . .Merced 12 1 . . 1 100.0 . . . . . . . .Modoc . . . . . . . . . . . . . .Mono . . . . . . . . . . . . . .Monterey 17 2 . . . . . . . . 2 100.0 1 50.0Napa 3 1 . . . . . . . . 1 100.0 . .Nevada . . . . . . . . . . . . . .Orange 184 24 1 4.2 10 41.7 1 4.2 . . 8 33.3 6 25.0Pasadena 5 . . . . . . . . . . . . .Placer 6 3 1 33.3 1 33.3 . . . . 1 33.3 1 33.3Plumas . . . . . . . . . . . . . .Riverside 52 1 . . . . . . . . 1 100.0 . .Sacramento 80 7 2 28.6 . . 1 14.3 . . 5 71.4 3 42.9San Benito 1 . . . . . . . . . . . . .San Bernardino 58 2 . . . . . . . . 1 50.0 1 50.0San Diego 202 21 2 9.5 11 52.4 4 19.0 . . 13 61.9 . .San Francisco 106 18 2 11.1 9 50.0 1 5.6 . . 14 77.8 1 5.6San Joaquin 39 3 1 33.3 . . . . . . 1 33.3 2 66.7San Luis Obispo 4 2 . . 1 50.0 . . . . . . 1 50.0San Mateo 58 2 . . . . . . . . 1 50.0 1 50.0
Treatment Failure
Clinically Indicated Other
Reporting Jurisdiction
Cases Starting Therapy
Total Cases with Therapy Extended†
Rifampin Resistance
Adverse Treatment Event Non-adherence
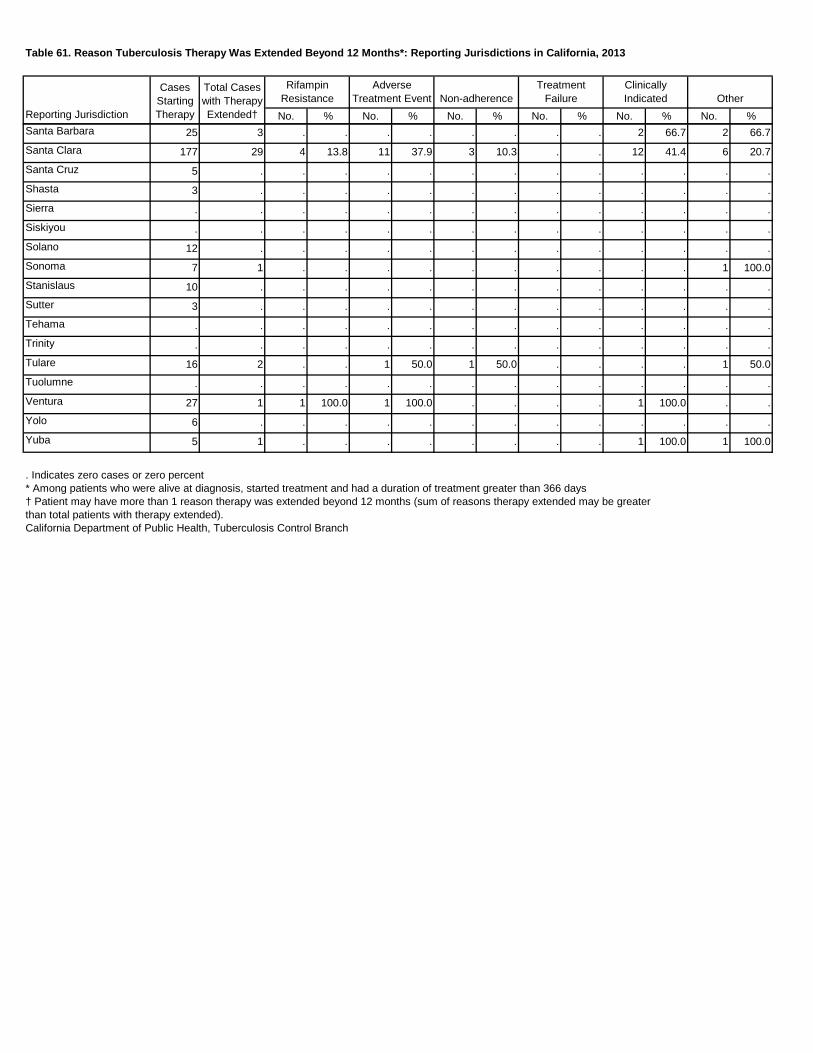
Table 61. Reason Tuberculosis Therapy Was Extended Beyond 12 Months*: Reporting Jurisdictions in California, 2013
No. % No. % No. % No. % No. % No. %
Treatment Failure
Clinically Indicated Other
Reporting Jurisdiction
Cases Starting Therapy
Total Cases with Therapy Extended†
Rifampin Resistance
Adverse Treatment Event Non-adherence
Santa Barbara 25 3 . . . . . . . . 2 66.7 2 66.7Santa Clara 177 29 4 13.8 11 37.9 3 10.3 . . 12 41.4 6 20.7Santa Cruz 5 . . . . . . . . . . . . .Shasta 3 . . . . . . . . . . . . .Sierra . . . . . . . . . . . . . .Siskiyou . . . . . . . . . . . . . .Solano 12 . . . . . . . . . . . . .Sonoma 7 1 . . . . . . . . . . 1 100.0Stanislaus 10 . . . . . . . . . . . . .Sutter 3 . . . . . . . . . . . . .Tehama . . . . . . . . . . . . . .Trinity . . . . . . . . . . . . . .Tulare 16 2 . . 1 50.0 1 50.0 . . . . 1 50.0Tuolumne . . . . . . . . . . . . . .Ventura 27 1 1 100.0 1 100.0 . . . . 1 100.0 . .Yolo 6 . . . . . . . . . . . . .Yuba 5 1 . . . . . . . . 1 100.0 1 100.0
. Indicates zero cases or zero percent* Among patients who were alive at diagnosis, started treatment and had a duration of treatment greater than 366 days† Patient may have more than 1 reason therapy was extended beyond 12 months (sum of reasons therapy extended may be greaterthan total patients with therapy extended).California Department of Public Health, Tuberculosis Control Branch
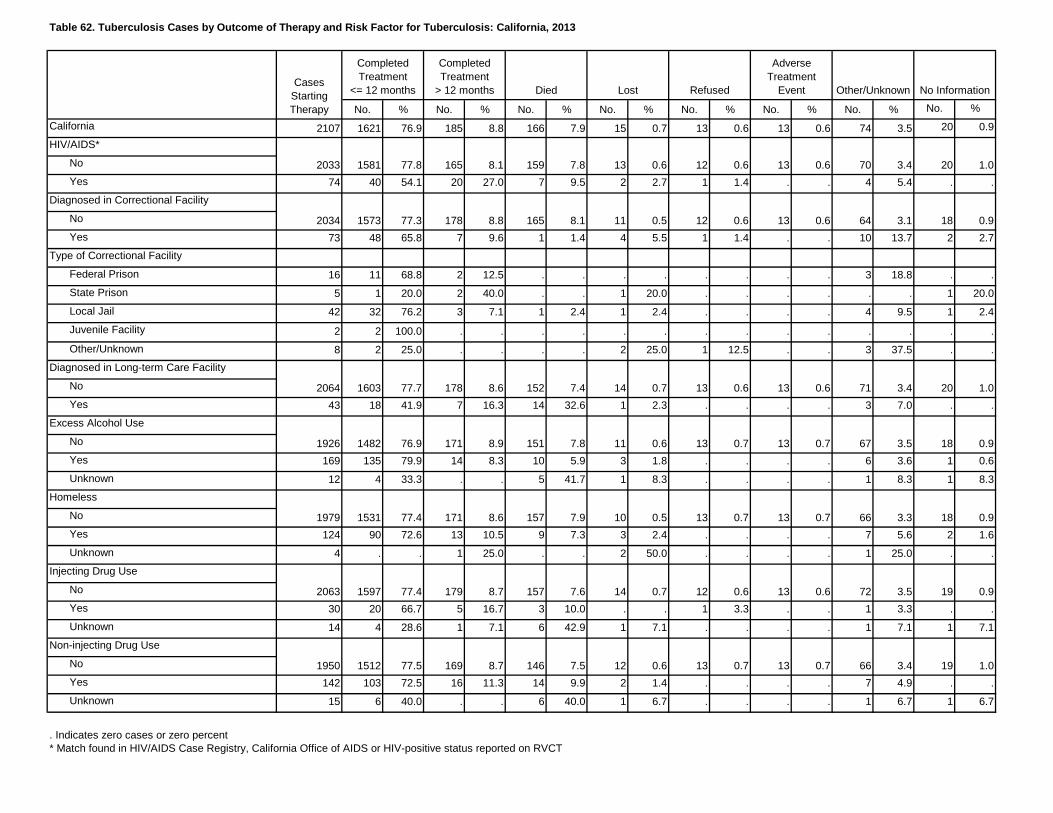
Table 62. Tuberculosis Cases by Outcome of Therapy and Risk Factor for Tuberculosis: California, 2013
No. % No. % No. % No. % No. % No. % No. % No. %California 2107 1621 76.9 185 8.8 166 7.9 15 0.7 13 0.6 13 0.6 74 3.5 20 0.9HIV/AIDS*
No
Yes 74 40 54.1 20 27.0 7 9.5 2 2.7 1 1.4 . . 4 5.4 . .Diagnosed in Correctional Facility
No
Yes 73 48 65.8 7 9.6 1 1.4 4 5.5 1 1.4 . . 10 13.7 2 2.7Type of Correctional Facility
Federal Prison 16 11 68.8 2 12.5 . . . . . . . . 3 18.8 . .State Prison 5 1 20.0 2 40.0 . . 1 20.0 . . . . . . 1 20.0Local Jail 42 32 76.2 3 7.1 1 2.4 1 2.4 . . . . 4 9.5 1 2.4Juvenile Facility 2 2 100.0 . . . . . . . . . . . . . .Other/Unknown 8 2 25.0 . . . . 2 25.0 1 12.5 . . 3 37.5 . .
Diagnosed in Long-term Care Facility
No
Yes 43 18 41.9 7 16.3 14 32.6 1 2.3 . . . . 3 7.0 . .Excess Alcohol Use
No
Yes 169 135 79.9 14 8.3 10 5.9 3 1.8 . . . . 6 3.6 1 0.6Unknown 12 4 33.3 . . 5 41.7 1 8.3 . . . . 1 8.3 1 8.3
Homeless
No
Yes 124 90 72.6 13 10.5 9 7.3 3 2.4 . . . . 7 5.6 2 1.6Unknown 4 . . 1 25.0 . . 2 50.0 . . . . 1 25.0 . .
Injecting Drug Use
No
Yes 30 20 66.7 5 16.7 3 10.0 . . 1 3.3 . . 1 3.3 . .Unknown 14 4 28.6 1 7.1 6 42.9 1 7.1 . . . . 1 7.1 1 7.1
Non-injecting Drug Use
No
Yes 142 103 72.5 16 11.3 14 9.9 2 1.4 . . . . 7 4.9 . .Unknown 15 6 40.0 . . 6 40.0 1 6.7 . . . . 1 6.7 1 6.7
. Indicates zero cases or zero percent* Match found in HIV/AIDS Case Registry, California Office of AIDS or HIV-positive status reported on RVCT
66 3.4 19 1.0146 7.5 12 0.6 13 0.7
0.6 72 3.5 19 0.9
1950 1512 77.5 169 8.7
7.6 14 0.7 12 0.6 132063 1597 77.4 179 8.7 157
13 0.7
13 0.7 66 3.3 18 0.9157 7.9 10 0.5 13 0.71979 1531 77.4 171 8.6
7.8 11 0.6 131926 1482 76.9 171 8.9 151
20 1.0152 7.4 14 0.7 13 0.6
0.7 67 3.5 18 0.90.7 13
64 3.12034 1573 77.3 178 8.8
13 0.6 71 3.4
0.6 13
2064 1603 77.7 178 8.6
13 0.6
No Information
2033 1581 77.8 165 8.1 159
18 0.9165 8.1 11 0.5 12 0.6
0.6 70 3.4 20 1.07.8 13 0.6 12
Cases Starting Therapy
Completed Treatment
<= 12 months
Completed Treatment
> 12 months Died Lost Refused
Adverse Treatment
Event Other/Unknown
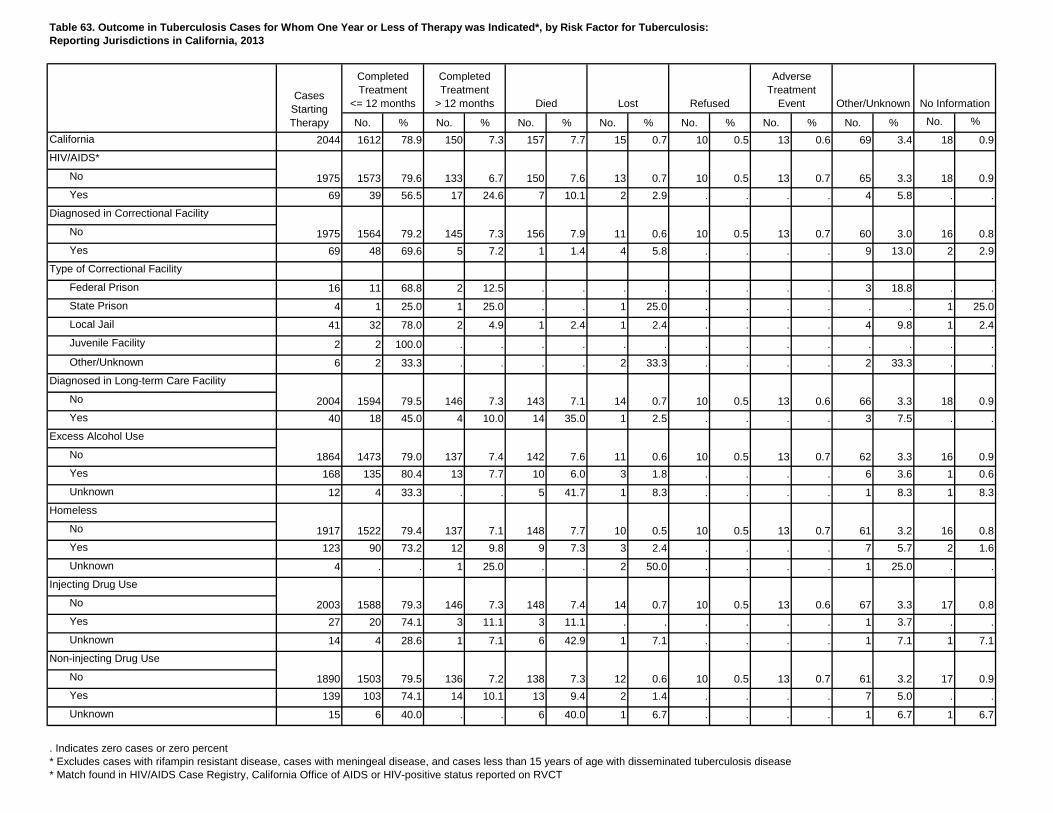
Table 63. Outcome in Tuberculosis Cases for Whom One Year or Less of Therapy was Indicated*, by Risk Factor for Tuberculosis:Reporting Jurisdictions in California, 2013
No. % No. % No. % No. % No. % No. % No. % No. %California 2044 1612 78.9 150 7.3 157 7.7 15 0.7 10 0.5 13 0.6 69 3.4 18 0.9HIV/AIDS*
No
Yes 69 39 56.5 17 24.6 7 10.1 2 2.9 . . . . 4 5.8 . .Diagnosed in Correctional Facility
No
Yes 69 48 69.6 5 7.2 1 1.4 4 5.8 . . . . 9 13.0 2 2.9Type of Correctional Facility
Federal Prison 16 11 68.8 2 12.5 . . . . . . . . 3 18.8 . .State Prison 4 1 25.0 1 25.0 . . 1 25.0 . . . . . . 1 25.0Local Jail 41 32 78.0 2 4.9 1 2.4 1 2.4 . . . . 4 9.8 1 2.4Juvenile Facility 2 2 100.0 . . . . . . . . . . . . . .Other/Unknown 6 2 33.3 . . . . 2 33.3 . . . . 2 33.3 . .
Diagnosed in Long-term Care Facility
No
Yes 40 18 45.0 4 10.0 14 35.0 1 2.5 . . . . 3 7.5 . .Excess Alcohol Use
No
Yes 168 135 80.4 13 7.7 10 6.0 3 1.8 . . . . 6 3.6 1 0.6Unknown 12 4 33.3 . . 5 41.7 1 8.3 . . . . 1 8.3 1 8.3
Homeless
No
Yes 123 90 73.2 12 9.8 9 7.3 3 2.4 . . . . 7 5.7 2 1.6Unknown 4 . . 1 25.0 . . 2 50.0 . . . . 1 25.0 . .
Injecting Drug Use
No
Yes 27 20 74.1 3 11.1 3 11.1 . . . . . . 1 3.7 . .Unknown 14 4 28.6 1 7.1 6 42.9 1 7.1 . . . . 1 7.1 1 7.1
Non-injecting Drug Use
No
Yes 139 103 74.1 14 10.1 13 9.4 2 1.4 . . . . 7 5.0 . .Unknown 15 6 40.0 . . 6 40.0 1 6.7 . . . . 1 6.7 1 6.7
. Indicates zero cases or zero percent* Excludes cases with rifampin resistant disease, cases with meningeal disease, and cases less than 15 years of age with disseminated tuberculosis disease* Match found in HIV/AIDS Case Registry, California Office of AIDS or HIV-positive status reported on RVCT
61 3.2 17 0.9138 7.3 12 0.6 10 0.5
0.6 67 3.3 17 0.8
1890 1503 79.5 136 7.2
7.4 14 0.7 10 0.5 132003 1588 79.3 146 7.3 148
13 0.7
13 0.7 61 3.2 16 0.8148 7.7 10 0.5 10 0.51917 1522 79.4 137 7.1
7.6 11 0.6 101864 1473 79.0 137 7.4 142
18 0.9143 7.1 14 0.7 10 0.5
0.7 62 3.3 16 0.90.5 13
60 3.01975 1564 79.2 145 7.3
13 0.6 66 3.3
0.5 13
2004 1594 79.5 146 7.3
13 0.7
No Information
1975 1573 79.6 133 6.7 150
16 0.8156 7.9 11 0.6 10 0.5
0.7 65 3.3 18 0.97.6 13 0.7 10
Cases Starting Therapy
Completed Treatment
<= 12 months
Completed Treatment
> 12 months Died Lost Refused
Adverse Treatment
Event Other/Unknown
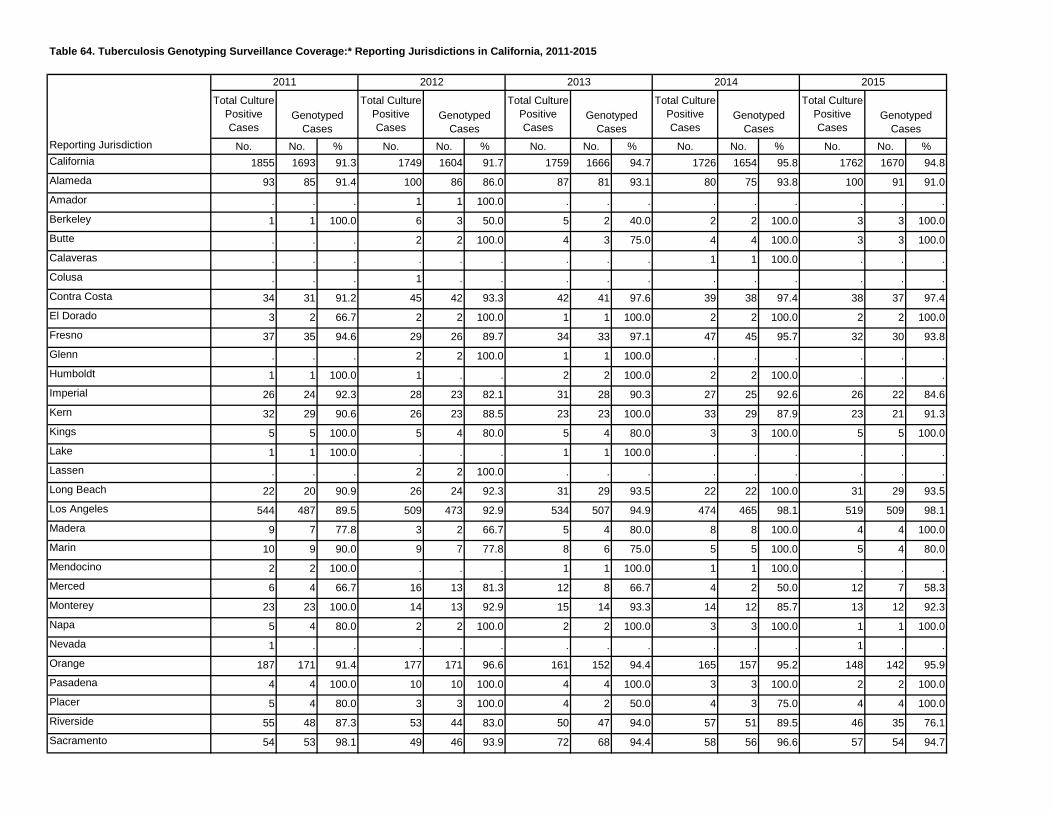
Table 64. Tuberculosis Genotyping Surveillance Coverage:* Reporting Jurisdictions in California, 2011-2015
Total Culture Positive Cases
Total Culture Positive Cases
Total Culture Positive Cases
Total Culture Positive Cases
Total Culture Positive Cases
No. No. % No. No. % No. No. % No. No. % No. No. %California 1855 1693 91.3 1749 1604 91.7 1759 1666 94.7 1726 1654 95.8 1762 1670 94.8Alameda 93 85 91.4 100 86 86.0 87 81 93.1 80 75 93.8 100 91 91.0Amador . . . 1 1 100.0 . . . . . . . . .Berkeley 1 1 100.0 6 3 50.0 5 2 40.0 2 2 100.0 3 3 100.0Butte . . . 2 2 100.0 4 3 75.0 4 4 100.0 3 3 100.0Calaveras . . . . . . . . . 1 1 100.0 . . .Colusa . . . 1 . . . . . . . . . . .Contra Costa 34 31 91.2 45 42 93.3 42 41 97.6 39 38 97.4 38 37 97.4El Dorado 3 2 66.7 2 2 100.0 1 1 100.0 2 2 100.0 2 2 100.0Fresno 37 35 94.6 29 26 89.7 34 33 97.1 47 45 95.7 32 30 93.8Glenn . . . 2 2 100.0 1 1 100.0 . . . . . .Humboldt 1 1 100.0 1 . . 2 2 100.0 2 2 100.0 . . .Imperial 26 24 92.3 28 23 82.1 31 28 90.3 27 25 92.6 26 22 84.6Kern 32 29 90.6 26 23 88.5 23 23 100.0 33 29 87.9 23 21 91.3Kings 5 5 100.0 5 4 80.0 5 4 80.0 3 3 100.0 5 5 100.0Lake 1 1 100.0 . . . 1 1 100.0 . . . . . .Lassen . . . 2 2 100.0 . . . . . . . . .Long Beach 22 20 90.9 26 24 92.3 31 29 93.5 22 22 100.0 31 29 93.5Los Angeles 544 487 89.5 509 473 92.9 534 507 94.9 474 465 98.1 519 509 98.1Madera 9 7 77.8 3 2 66.7 5 4 80.0 8 8 100.0 4 4 100.0Marin 10 9 90.0 9 7 77.8 8 6 75.0 5 5 100.0 5 4 80.0Mendocino 2 2 100.0 . . . 1 1 100.0 1 1 100.0 . . .Merced 6 4 66.7 16 13 81.3 12 8 66.7 4 2 50.0 12 7 58.3Monterey 23 23 100.0 14 13 92.9 15 14 93.3 14 12 85.7 13 12 92.3Napa 5 4 80.0 2 2 100.0 2 2 100.0 3 3 100.0 1 1 100.0Nevada 1 . . . . . . . . . . . 1 . .Orange 187 171 91.4 177 171 96.6 161 152 94.4 165 157 95.2 148 142 95.9Pasadena 4 4 100.0 10 10 100.0 4 4 100.0 3 3 100.0 2 2 100.0Placer 5 4 80.0 3 3 100.0 4 2 50.0 4 3 75.0 4 4 100.0Riverside 55 48 87.3 53 44 83.0 50 47 94.0 57 51 89.5 46 35 76.1Sacramento 54 53 98.1 49 46 93.9 72 68 94.4 58 56 96.6 57 54 94.7
Genotyped Cases
Reporting Jurisdiction
2011 2012 2013 2014 2015
Genotyped Cases
Genotyped Cases
Genotyped Cases
Genotyped Cases
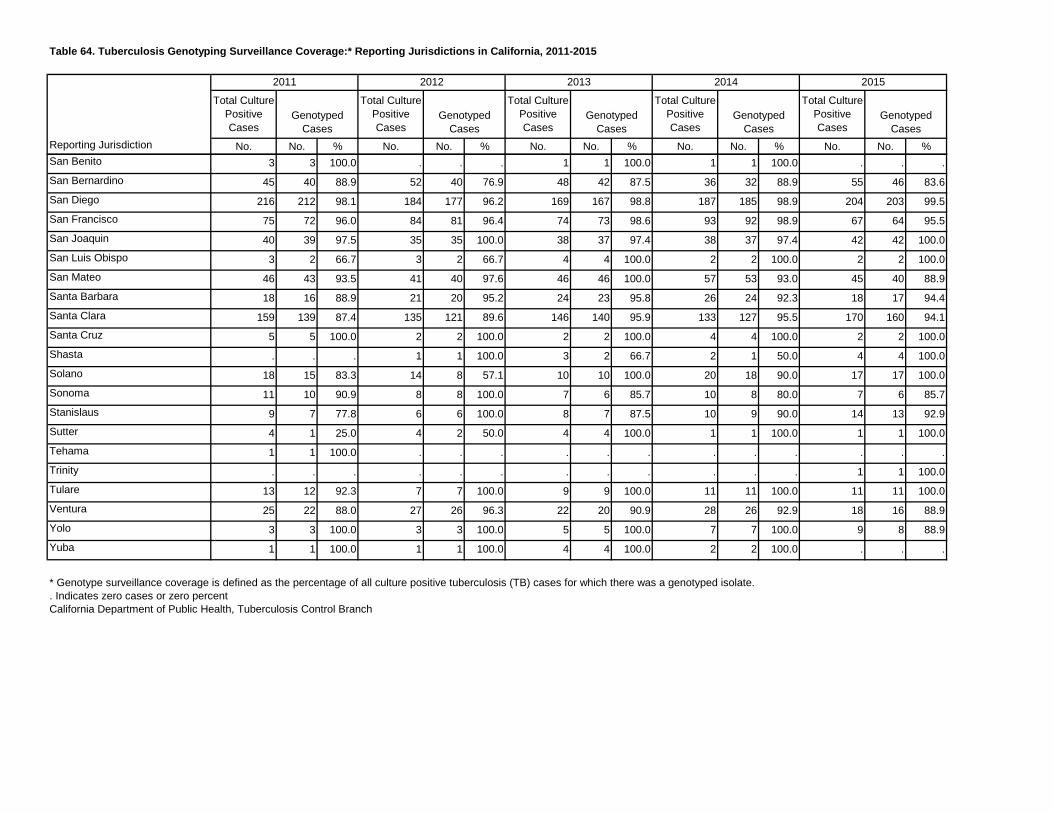
Table 64. Tuberculosis Genotyping Surveillance Coverage:* Reporting Jurisdictions in California, 2011-2015
Total Culture Positive Cases
Total Culture Positive Cases
Total Culture Positive Cases
Total Culture Positive Cases
Total Culture Positive Cases
No. No. % No. No. % No. No. % No. No. % No. No. %
Genotyped Cases
Reporting Jurisdiction
2011 2012 2013 2014 2015
Genotyped Cases
Genotyped Cases
Genotyped Cases
Genotyped Cases
San Benito 3 3 100.0 . . . 1 1 100.0 1 1 100.0 . . .San Bernardino 45 40 88.9 52 40 76.9 48 42 87.5 36 32 88.9 55 46 83.6San Diego 216 212 98.1 184 177 96.2 169 167 98.8 187 185 98.9 204 203 99.5San Francisco 75 72 96.0 84 81 96.4 74 73 98.6 93 92 98.9 67 64 95.5San Joaquin 40 39 97.5 35 35 100.0 38 37 97.4 38 37 97.4 42 42 100.0San Luis Obispo 3 2 66.7 3 2 66.7 4 4 100.0 2 2 100.0 2 2 100.0San Mateo 46 43 93.5 41 40 97.6 46 46 100.0 57 53 93.0 45 40 88.9Santa Barbara 18 16 88.9 21 20 95.2 24 23 95.8 26 24 92.3 18 17 94.4Santa Clara 159 139 87.4 135 121 89.6 146 140 95.9 133 127 95.5 170 160 94.1Santa Cruz 5 5 100.0 2 2 100.0 2 2 100.0 4 4 100.0 2 2 100.0Shasta . . . 1 1 100.0 3 2 66.7 2 1 50.0 4 4 100.0Solano 18 15 83.3 14 8 57.1 10 10 100.0 20 18 90.0 17 17 100.0Sonoma 11 10 90.9 8 8 100.0 7 6 85.7 10 8 80.0 7 6 85.7Stanislaus 9 7 77.8 6 6 100.0 8 7 87.5 10 9 90.0 14 13 92.9Sutter 4 1 25.0 4 2 50.0 4 4 100.0 1 1 100.0 1 1 100.0Tehama 1 1 100.0 . . . . . . . . . . . .Trinity . . . . . . . . . . . . 1 1 100.0Tulare 13 12 92.3 7 7 100.0 9 9 100.0 11 11 100.0 11 11 100.0Ventura 25 22 88.0 27 26 96.3 22 20 90.9 28 26 92.9 18 16 88.9Yolo 3 3 100.0 3 3 100.0 5 5 100.0 7 7 100.0 9 8 88.9Yuba 1 1 100.0 1 1 100.0 4 4 100.0 2 2 100.0 . . .
* Genotype surveillance coverage is defined as the percentage of all culture positive tuberculosis (TB) cases for which there was a genotyped isolate.. Indicates zero cases or zero percentCalifornia Department of Public Health, Tuberculosis Control Branch
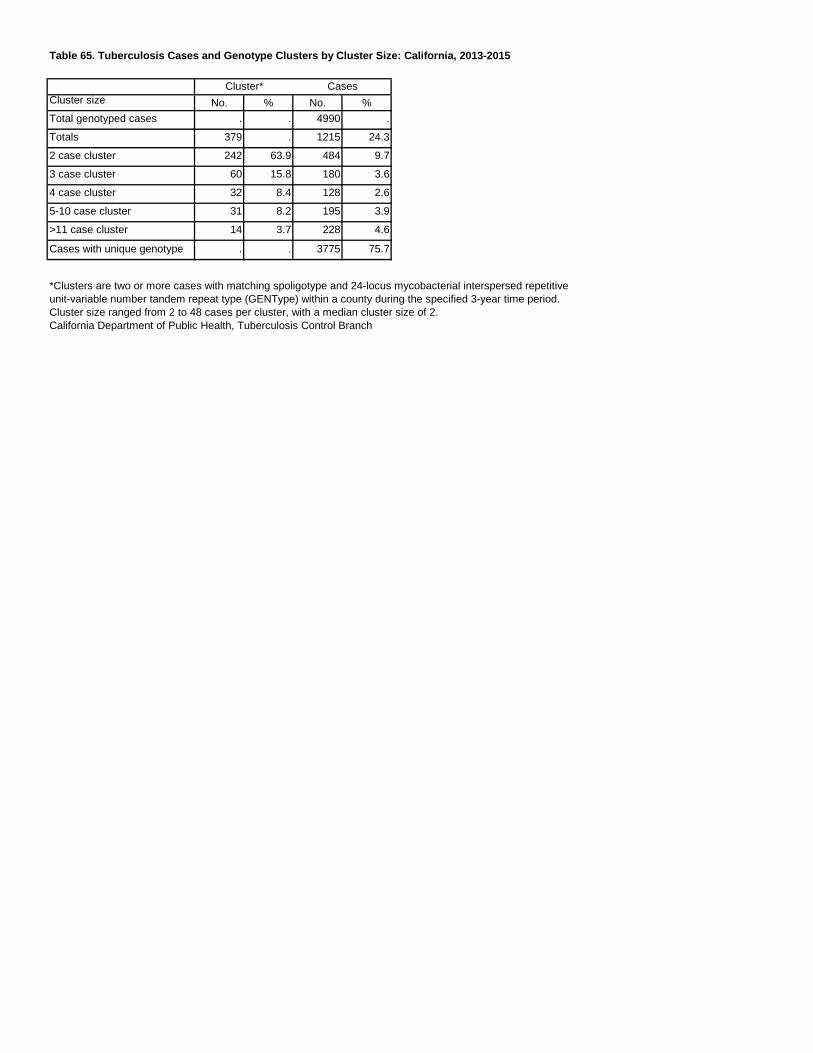
Table 65. Tuberculosis Cases and Genotype Clusters by Cluster Size: California, 2013-2015
Cluster size No. % No. %Total genotyped cases . . 4990 .
Totals 379 . 1215 24.3
2 case cluster 242 63.9 484 9.7
3 case cluster 60 15.8 180 3.6
4 case cluster 32 8.4 128 2.6
5-10 case cluster 31 8.2 195 3.9
>11 case cluster 14 3.7 228 4.6
Cases with unique genotype . . 3775 75.7
*Clusters are two or more cases with matching spoligotype and 24-locus mycobacterial interspersed repetitiveunit-variable number tandem repeat type (GENType) within a county during the specified 3-year time period.Cluster size ranged from 2 to 48 cases per cluster, with a median cluster size of 2.California Department of Public Health, Tuberculosis Control Branch
Cluster* Cases
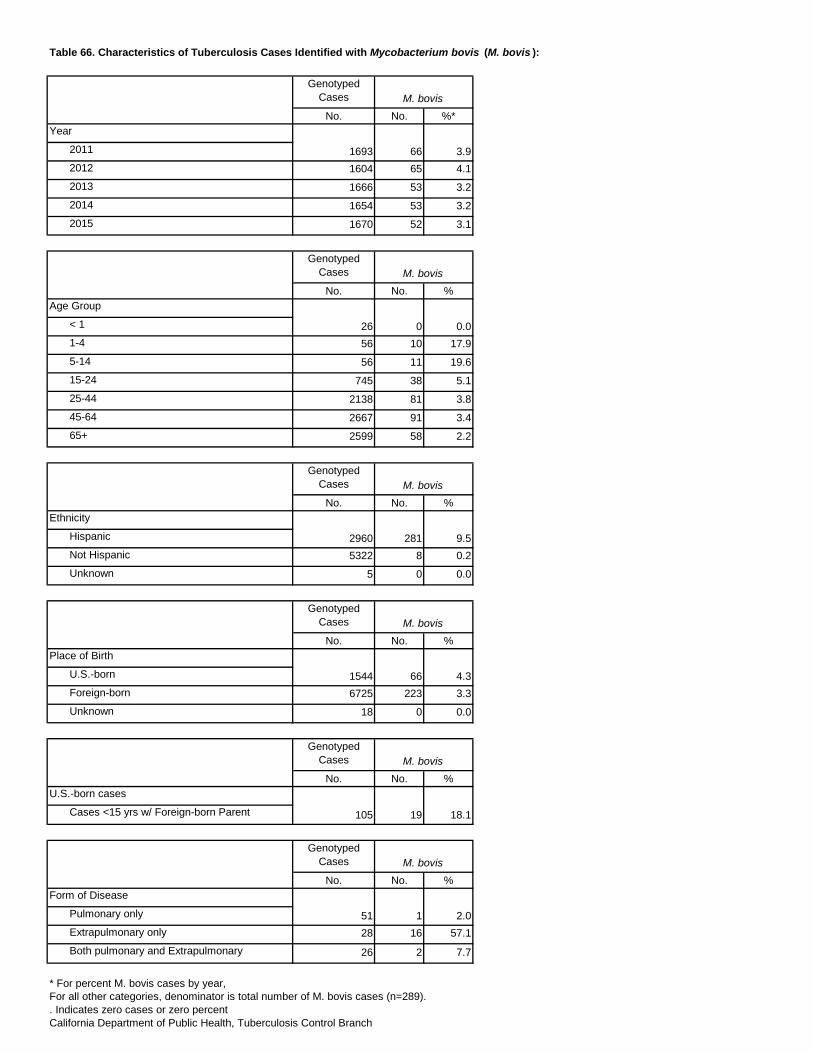
Table 66. Characteristics of Tuberculosis Cases Identified with Mycobacterium bovis (M. bovis ):
Genotyped Cases
No. No. %*Year
2011
2012 1604 65 4.12013 1666 53 3.22014 1654 53 3.22015 1670 52 3.1
Genotyped Cases
No. No. %Age Group
< 1
1-4 56 10 17.95-14 56 11 19.615-24 745 38 5.125-44 2138 81 3.845-64 2667 91 3.465+ 2599 58 2.2
Genotyped Cases
No. No. %Ethnicity
Hispanic
Not Hispanic 5322 8 0.2Unknown 5 0 0.0
Genotyped Cases
No. No. %Place of Birth
U.S.-born
Foreign-born 6725 223 3.3Unknown 18 0 0.0
Genotyped Cases
No. No. %U.S.-born cases
Cases <15 yrs w/ Foreign-born Parent
Genotyped Cases
No. No. %Form of Disease
Pulmonary only
Extrapulmonary only 28 16 57.1Both pulmonary and Extrapulmonary 26 2 7.7
* For percent M. bovis cases by year, For all other categories, denominator is total number of M. bovis cases (n=289).. Indicates zero cases or zero percentCalifornia Department of Public Health, Tuberculosis Control Branch
51 1 2.0
M. bovis
1544 66 4.3
M. bovis
105 19 18.1
M. bovis
2960 281 9.5
M. bovis
1693 66 3.9
M. bovis
26 0 0.0
M. bovis
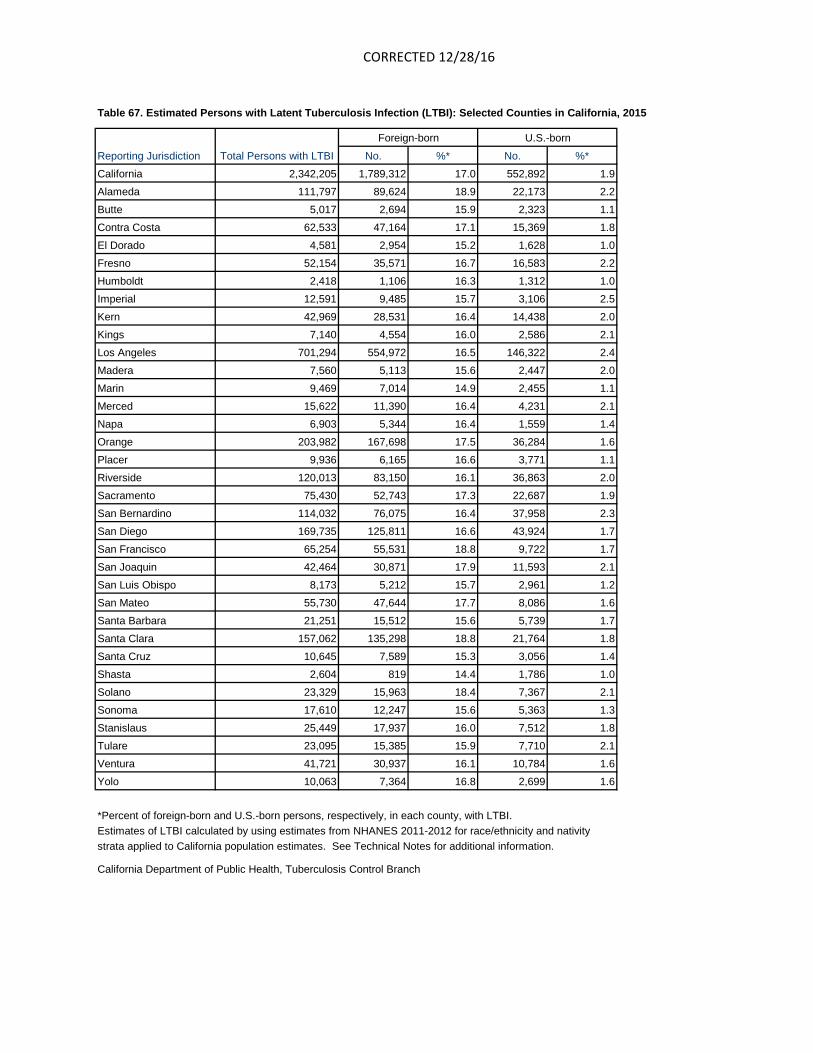
CORRECTED 12/28/16
Reporting Jurisdiction Total Persons with LTBI No. %* No. %*
California 2,342,205 1,789,312 17.0 552,892 1.9
Alameda 111,797 89,624 18.9 22,173 2.2
Butte 5,017 2,694 15.9 2,323 1.1
Contra Costa 62,533 47,164 17.1 15,369 1.8
El Dorado 4,581 2,954 15.2 1,628 1.0
Fresno 52,154 35,571 16.7 16,583 2.2
Humboldt 2,418 1,106 16.3 1,312 1.0
Imperial 12,591 9,485 15.7 3,106 2.5
Kern 42,969 28,531 16.4 14,438 2.0
Kings 7,140 4,554 16.0 2,586 2.1
Los Angeles 701,294 554,972 16.5 146,322 2.4
Madera 7,560 5,113 15.6 2,447 2.0
Marin 9,469 7,014 14.9 2,455 1.1
Merced 15,622 11,390 16.4 4,231 2.1
Napa 6,903 5,344 16.4 1,559 1.4
Orange 203,982 167,698 17.5 36,284 1.6
Placer 9,936 6,165 16.6 3,771 1.1
Riverside 120,013 83,150 16.1 36,863 2.0
Sacramento 75,430 52,743 17.3 22,687 1.9
San Bernardino 114,032 76,075 16.4 37,958 2.3
San Diego 169,735 125,811 16.6 43,924 1.7
San Francisco 65,254 55,531 18.8 9,722 1.7
San Joaquin 42,464 30,871 17.9 11,593 2.1
San Luis Obispo 8,173 5,212 15.7 2,961 1.2
San Mateo 55,730 47,644 17.7 8,086 1.6
Santa Barbara 21,251 15,512 15.6 5,739 1.7
Santa Clara 157,062 135,298 18.8 21,764 1.8
Santa Cruz 10,645 7,589 15.3 3,056 1.4
Shasta 2,604 819 14.4 1,786 1.0
Solano 23,329 15,963 18.4 7,367 2.1
Sonoma 17,610 12,247 15.6 5,363 1.3
Stanislaus 25,449 17,937 16.0 7,512 1.8
Tulare 23,095 15,385 15.9 7,710 2.1
Ventura 41,721 30,937 16.1 10,784 1.6
Yolo 10,063 7,364 16.8 2,699 1.6
*Percent of foreign-born and U.S.-born persons, respectively, in each county, with LTBI.Estimates of LTBI calculated by using estimates from NHANES 2011-2012 for race/ethnicity and nativitystrata applied to California population estimates. See Technical Notes for additional information.
California Department of Public Health, Tuberculosis Control Branch
Table 67. Estimated Persons with Latent Tuberculosis Infection (LTBI): Selected Counties in California, 2015
Foreign-born U.S.-born
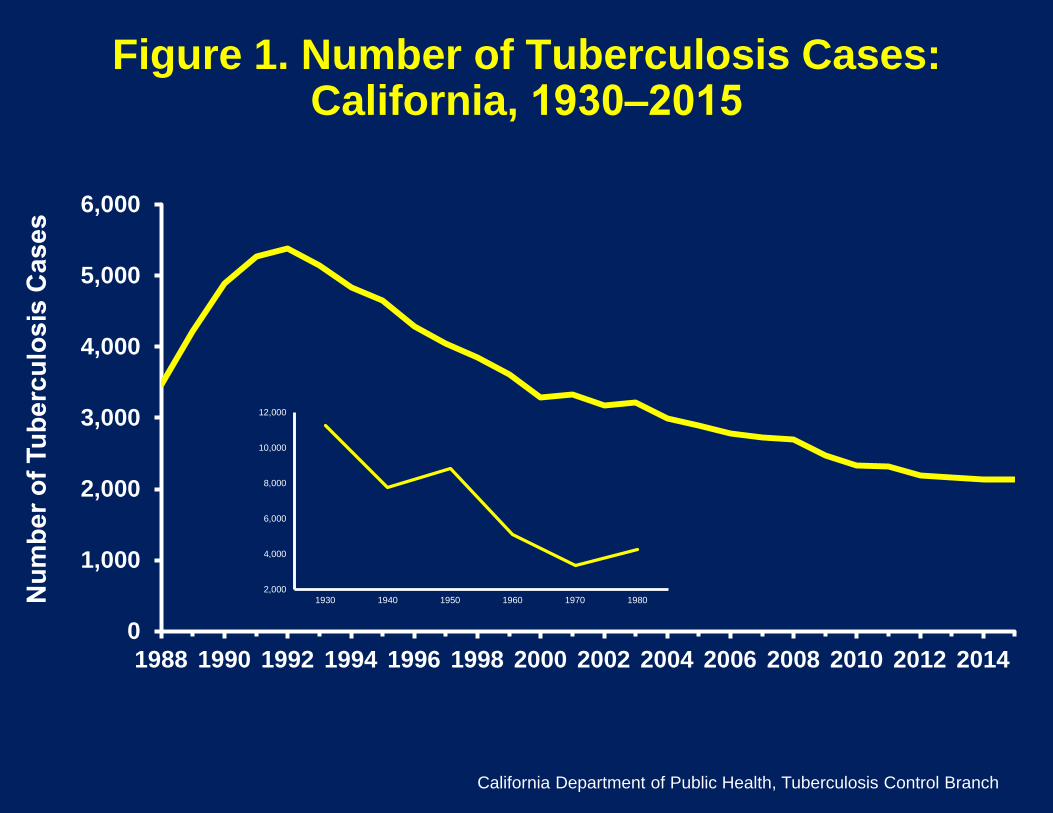
Figure 1. Number of Tuberculosis Cases: California, 1930‒2015
0
1,000
2,000
3,000
4,000
5,000
6,000
1988 1990 1992 1994 1996 1998 2000 2002 2004 2006 2008 2010 2012 2014
California Department of Public Health, Tuberculosis Control Branch
2,000
4,000
6,000
8,000
10,000
12,000
1930 1940 1950 1960 1970 1980
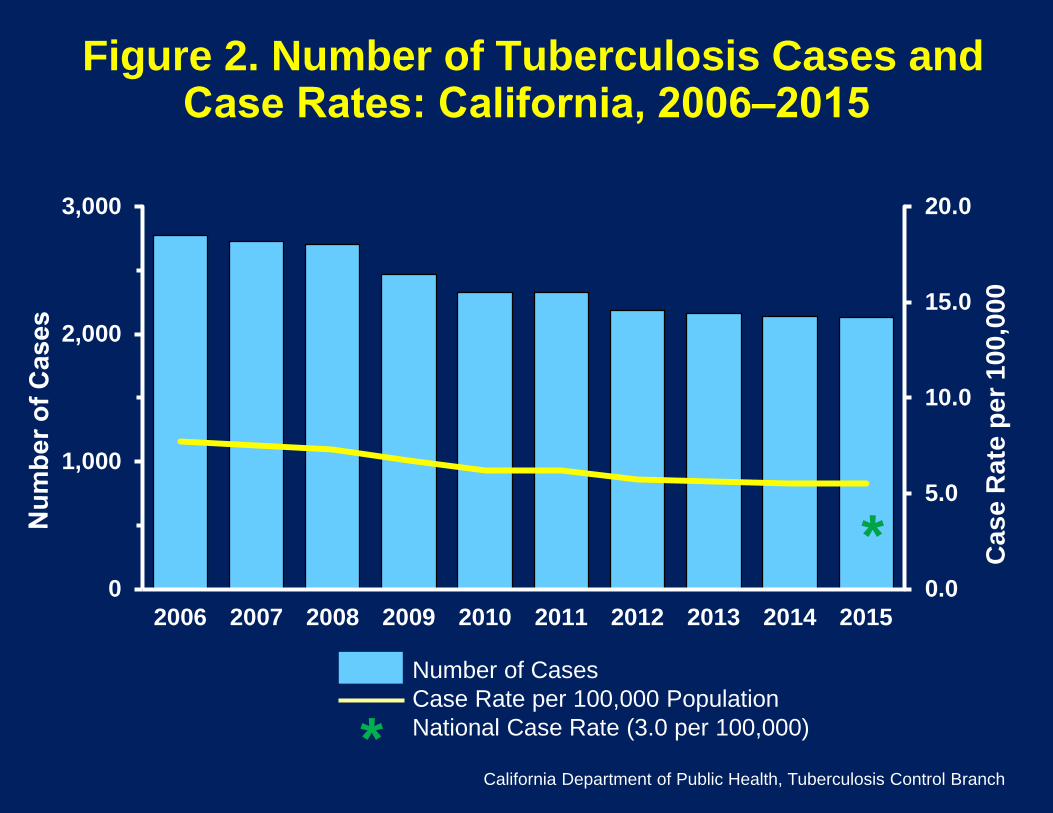
Figure 2. Number of Tuberculosis Cases and Case Rates: California, 2006‒2015
Cas
e R
ate
per 1
00,0
00
California Department of Public Health, Tuberculosis Control Branch *
Number of Cases Case Rate per 100,000 Population National Case Rate (3.0 per 100,000)
* 0.0
5.0
10.0
15.0
20.0
0
1,000
2,000
3,000
2006 2007 2008 2009 2010 2011 2012 2013 2014 2015
*
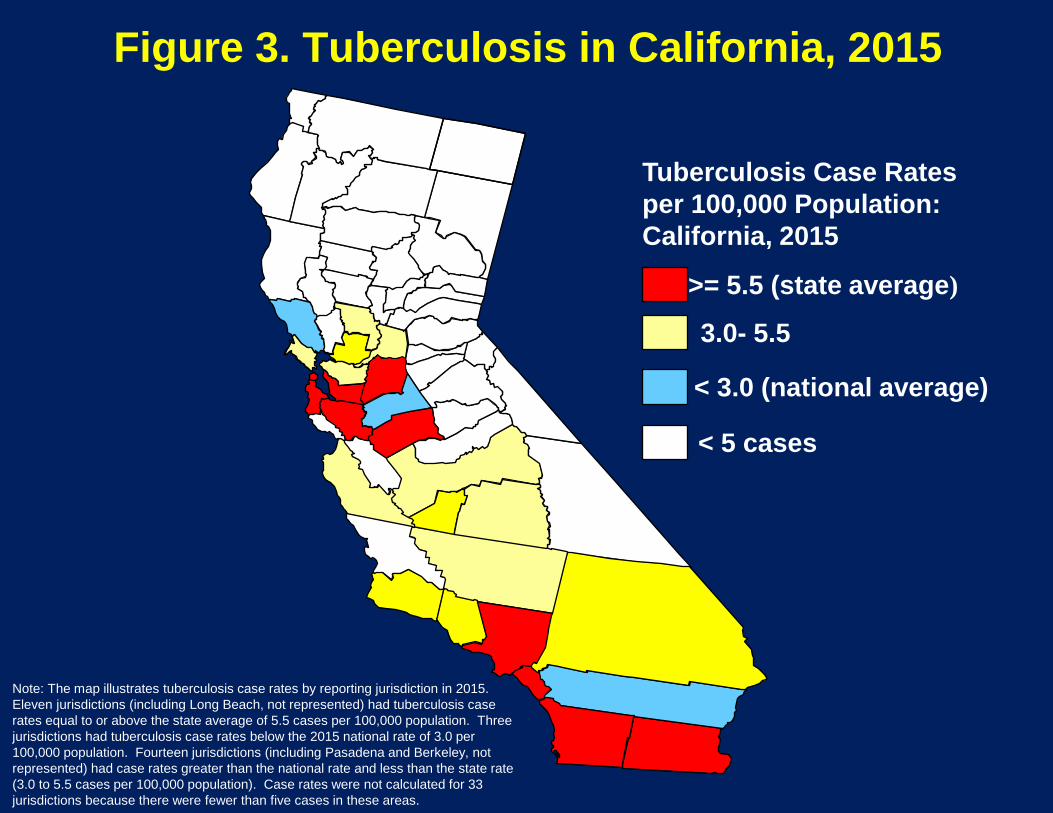
Figure 3. Tuberculosis in California, 2015
< 3.0 (national average)
>= 5.5 (state average)
3.0- 5.5
< 5 cases
Tuberculosis Case Rates per 100,000 Population: California, 2015
Note: The map illustrates tuberculosis case rates by reporting jurisdiction in 2015. Eleven jurisdictions (including Long Beach, not represented) had tuberculosis case rates equal to or above the state average of 5.5 cases per 100,000 population. Three jurisdictions had tuberculosis case rates below the 2015 national rate of 3.0 per 100,000 population. Fourteen jurisdictions (including Pasadena and Berkeley, not represented) had case rates greater than the national rate and less than the state rate (3.0 to 5.5 cases per 100,000 population). Case rates were not calculated for 33 jurisdictions because there were fewer than five cases in these areas.
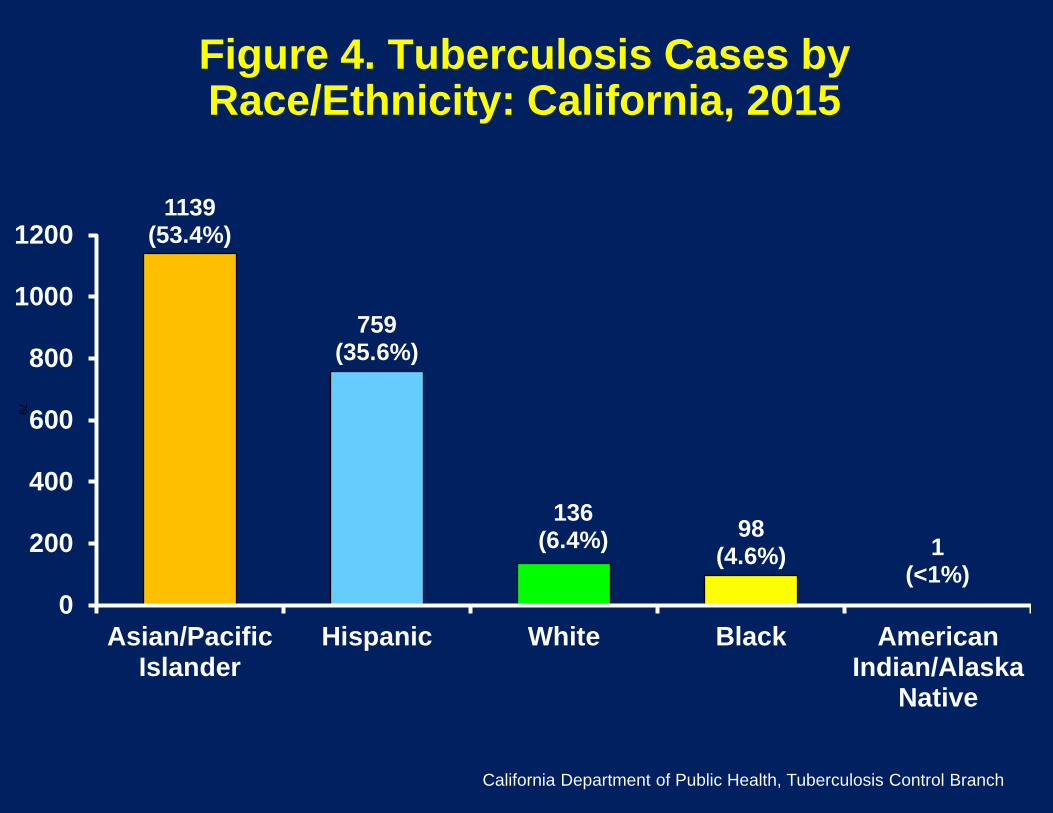
Figure 4. Tuberculosis Cases by Race/Ethnicity: California, 2015
1139 (53.4%)
759 (35.6%)
136 (6.4%) 98
(4.6%) 1 (<1%)
Asian/PacificIslander
Hispanic White Black AmericanIndian/Alaska
Native
0
200
400
600
800
1000
1200
California Department of Public Health, Tuberculosis Control Branch
79
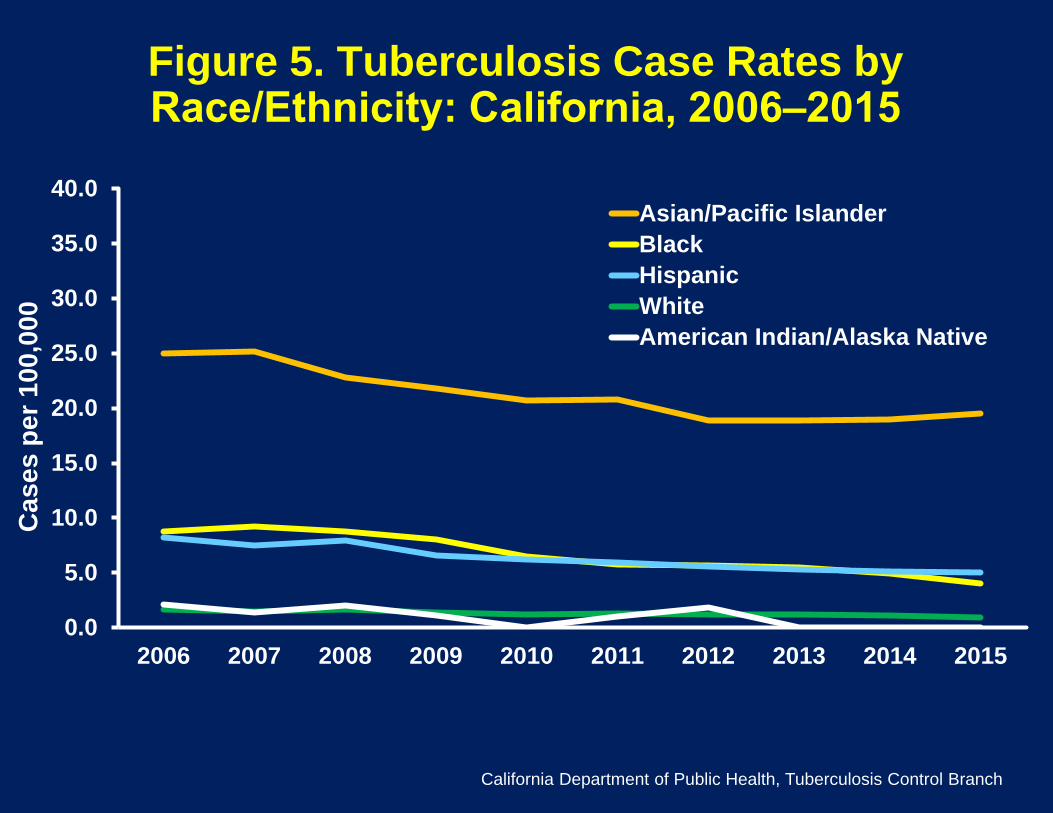
Figure 5. Tuberculosis Case Rates by Race/Ethnicity: California, 2006‒2015
0.0
5.0
10.0
15.0
20.0
25.0
30.0
35.0
40.0
2006 2007 2008 2009 2010 2011 2012 2013 2014 2015
Asian/Pacific IslanderBlackHispanicWhiteAmerican Indian/Alaska Native
Cas
es p
er 1
00,0
00
California Department of Public Health, Tuberculosis Control Branch
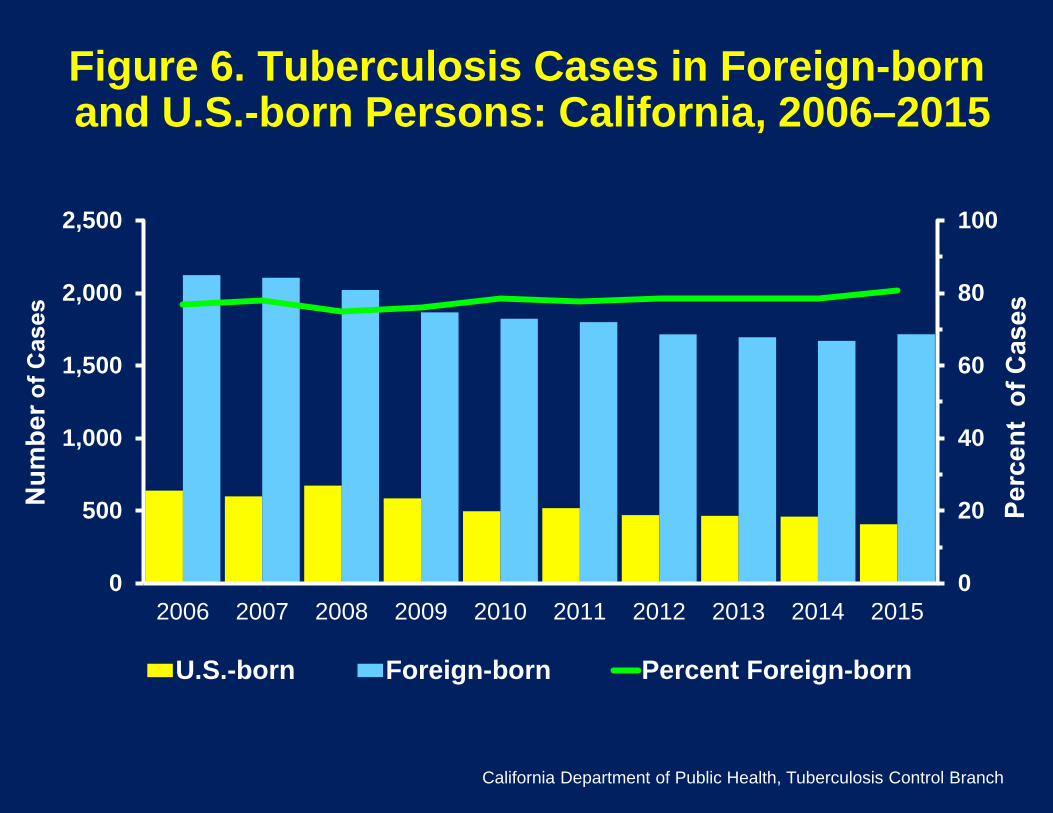
Figure 6. Tuberculosis Cases in Foreign-born and U.S.-born Persons: California, 2006–2015
0
20
40
60
80
100
0
500
1,000
1,500
2,000
2,500
2006 2007 2008 2009 2010 2011 2012 2013 2014 2015
U.S.-born Foreign-born Percent Foreign-born
California Department of Public Health, Tuberculosis Control Branch
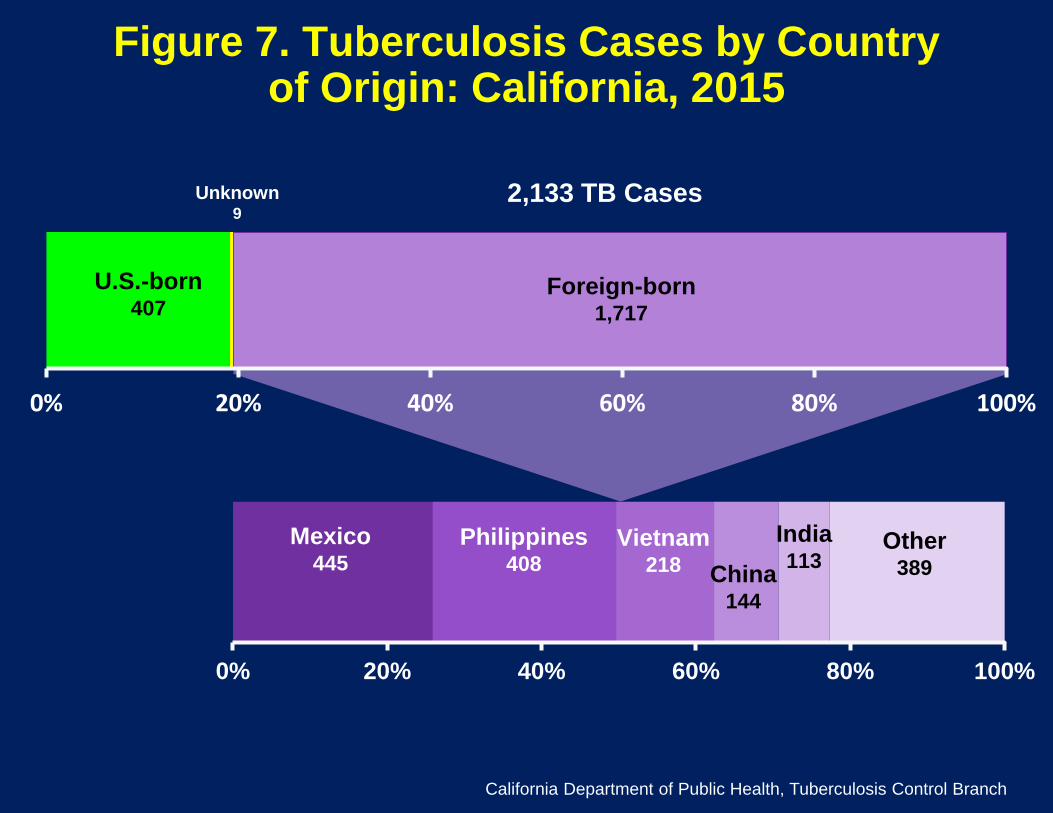
Figure 7. Tuberculosis Cases by Country of Origin: California, 2015
0% 20% 40% 60% 80% 100%
Foreign-born 1,717
U.S.-born 407
Unknown 9
0% 20% 40% 60% 80% 100%
Mexico 445
India 113 China
144
Vietnam 218
Philippines 408
Other 389
California Department of Public Health, Tuberculosis Control Branch
2,133 TB Cases
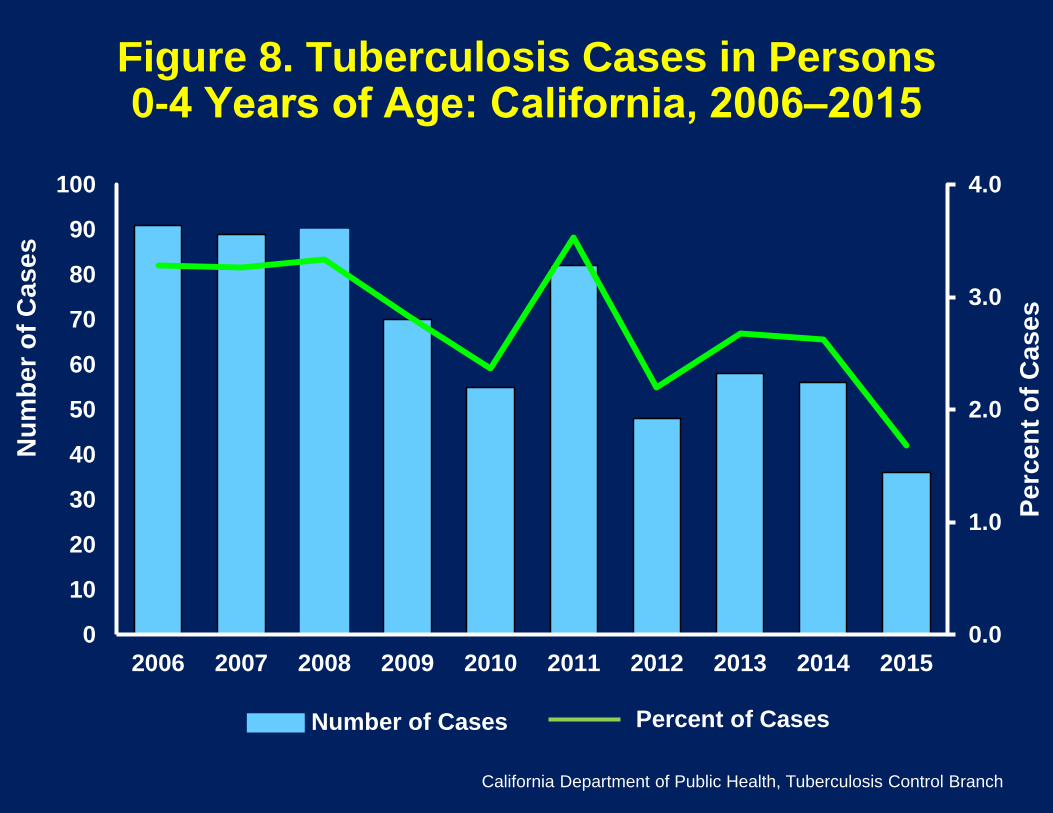
Figure 8. Tuberculosis Cases in Persons 0-4 Years of Age: California, 2006‒2015
0.0
1.0
2.0
3.0
4.0
0
10
20
30
40
50
60
70
80
90
100
2006 2007 2008 2009 2010 2011 2012 2013 2014 2015
Num
ber o
f Cas
es
Perc
ent o
f Cas
es
Number of Cases Percent of Cases
California Department of Public Health, Tuberculosis Control Branch
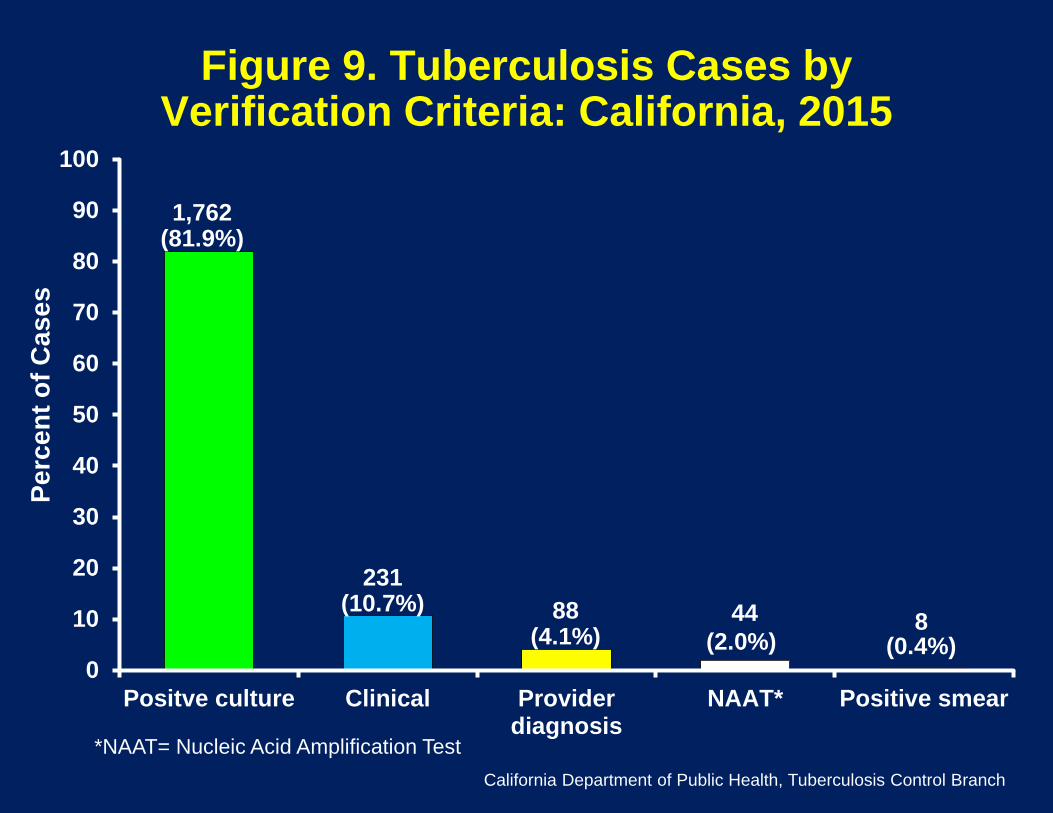
Figure 9. Tuberculosis Cases by Verification Criteria: California, 2015
Positve culture Clinical Providerdiagnosis
NAAT* Positive smear0
10
20
30
40
50
60
70
80
90
100
88 (4.1%)
1,762 (81.9%)
231 (10.7%)
8 (0.4%)
California Department of Public Health, Tuberculosis Control Branch
44 (2.0%)
*NAAT= Nucleic Acid Amplification Test
Perc
ent o
f Cas
es
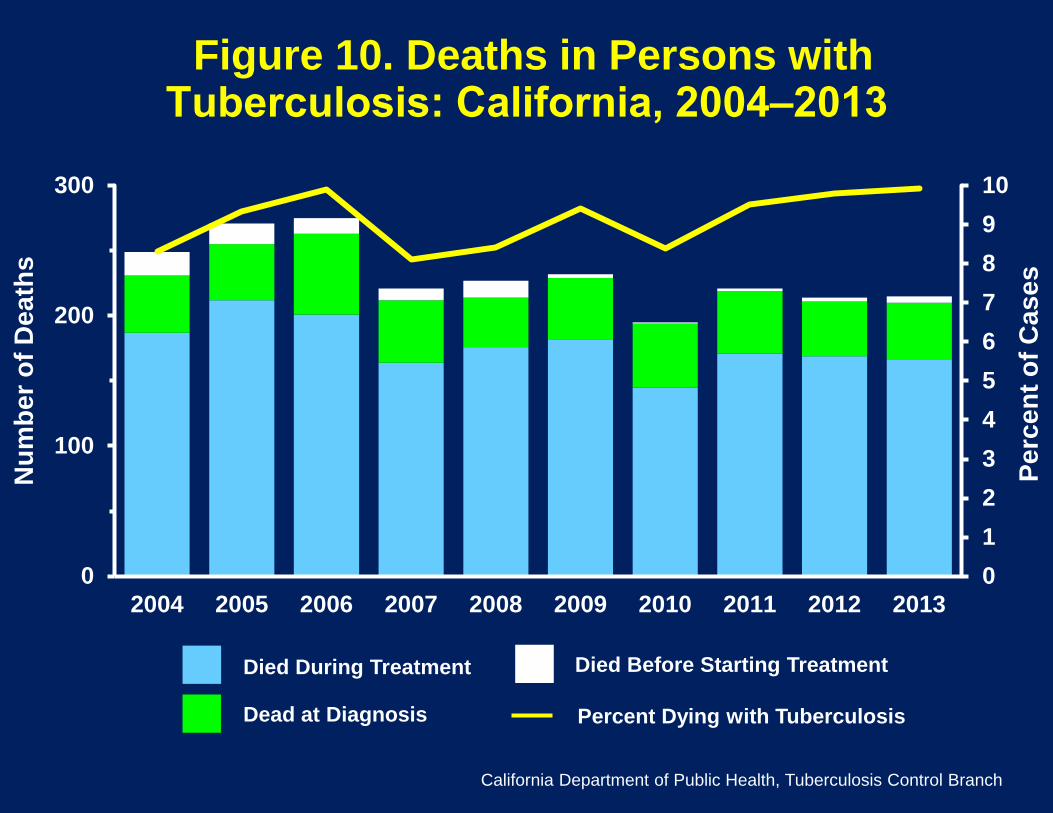
012345678910
0
100
200
300
2004 2005 2006 2007 2008 2009 2010 2011 2012 2013
Figure 10. Deaths in Persons with Tuberculosis: California, 2004‒2013
Perc
ent o
f Cas
es
Num
ber o
f Dea
ths
California Department of Public Health, Tuberculosis Control Branch
Dead at Diagnosis
Died During Treatment Died Before Starting Treatment
Percent Dying with Tuberculosis
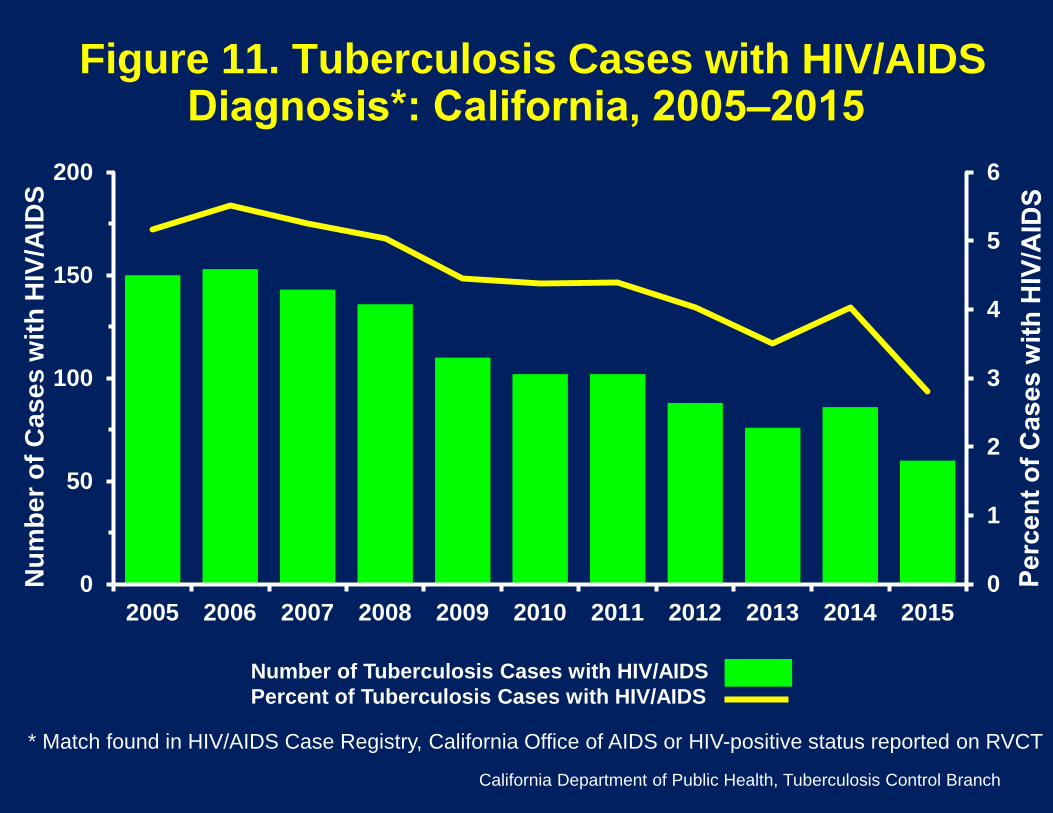
0
1
2
3
4
5
6
0
50
100
150
200
2005 2006 2007 2008 2009 2010 2011 2012 2013 2014 2015
Number of Tuberculosis Cases with HIV/AIDS Percent of Tuberculosis Cases with HIV/AIDS
Figure 11. Tuberculosis Cases with HIV/AIDS Diagnosis*: California, 2005‒2015
Num
ber o
f Cas
es w
ith H
IV/A
IDS
* Match found in HIV/AIDS Case Registry, California Office of AIDS or HIV-positive status reported on RVCT
California Department of Public Health, Tuberculosis Control Branch
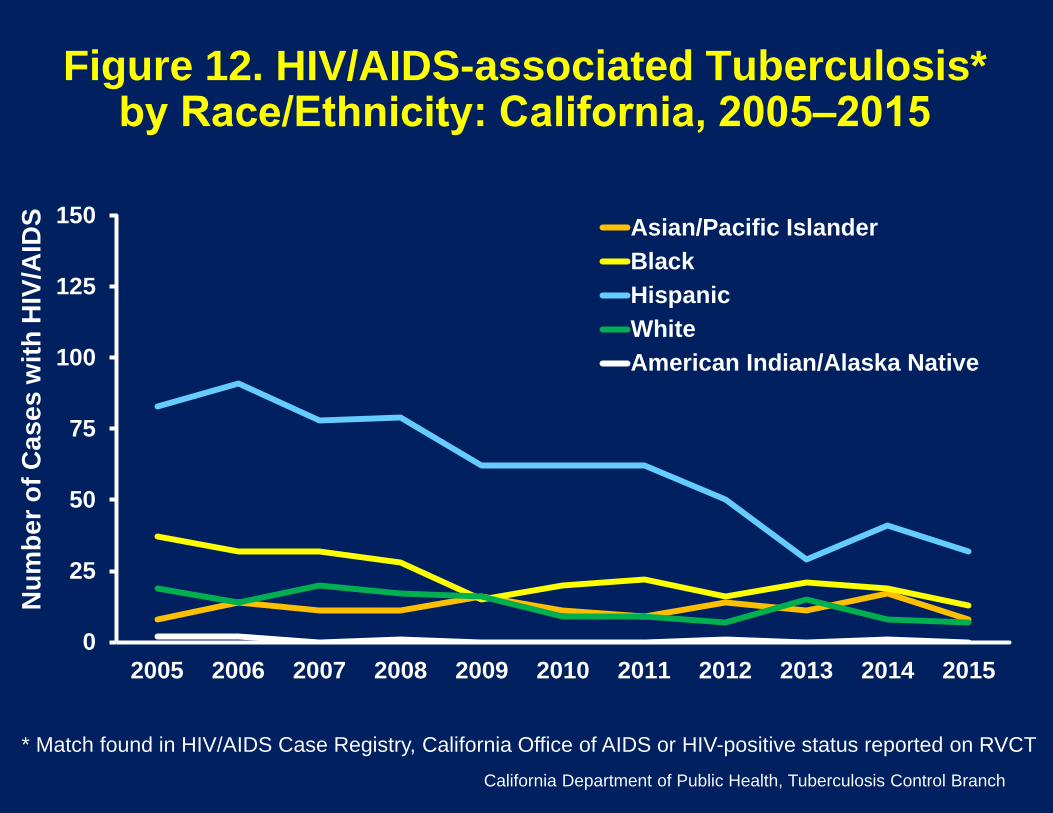
Figure 12. HIV/AIDS-associated Tuberculosis* by Race/Ethnicity: California, 2005‒2015
0
25
50
75
100
125
150
2005 2006 2007 2008 2009 2010 2011 2012 2013 2014 2015
Asian/Pacific IslanderBlackHispanicWhiteAmerican Indian/Alaska Native
Num
ber o
f Cas
es w
ith H
IV/A
IDS
* Match found in HIV/AIDS Case Registry, California Office of AIDS or HIV-positive status reported on RVCT California Department of Public Health, Tuberculosis Control Branch
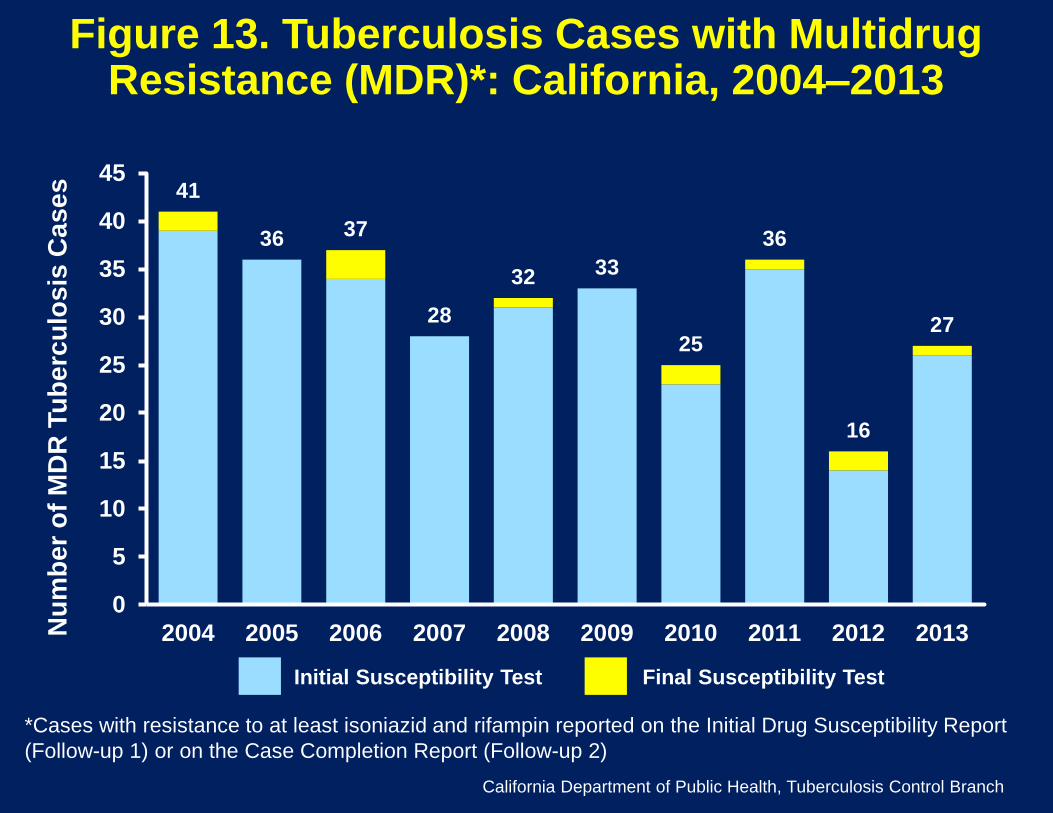
41
36 37
28
32 33
25
36
16
27
0
5
10
15
20
25
30
35
40
45
2004 2005 2006 2007 2008 2009 2010 2011 2012 2013
Figure 13. Tuberculosis Cases with Multidrug Resistance (MDR)*: California, 2004‒2013
Num
ber o
f MD
R T
uber
culo
sis
Cas
es
*Cases with resistance to at least isoniazid and rifampin reported on the Initial Drug Susceptibility Report (Follow-up 1) or on the Case Completion Report (Follow-up 2)
California Department of Public Health, Tuberculosis Control Branch
Initial Susceptibility Test Final Susceptibility Test
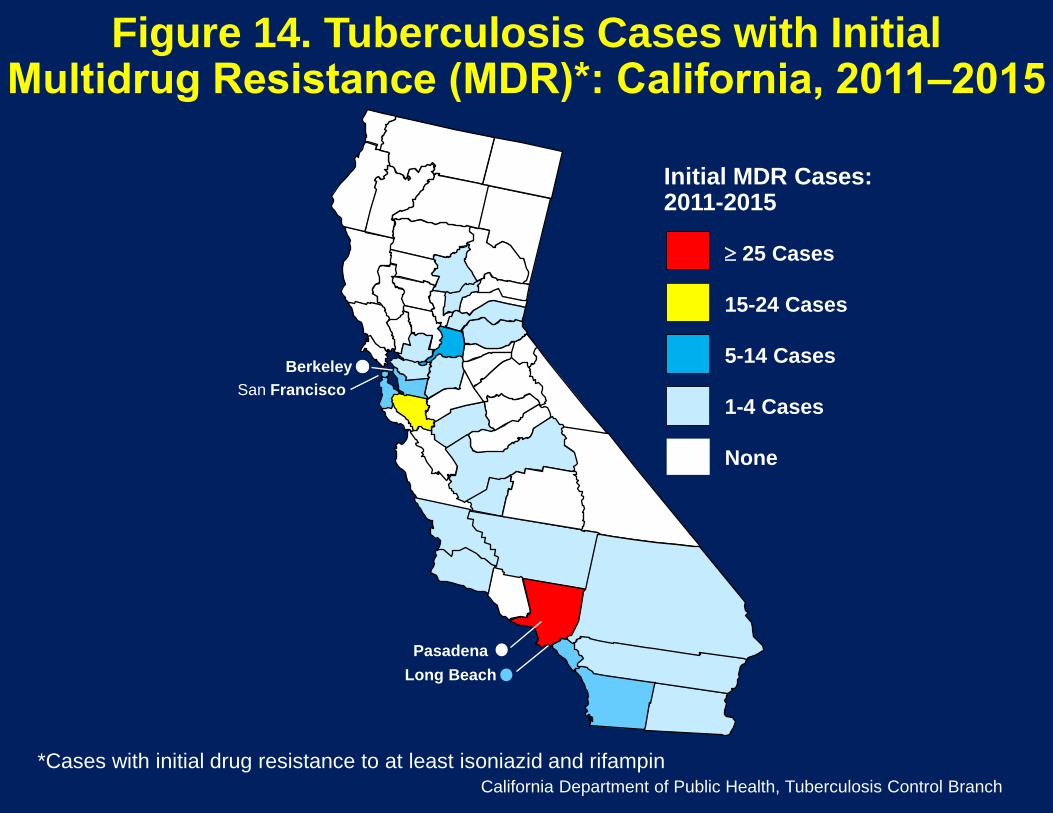
Figure 14. Tuberculosis Cases with Initial Multidrug Resistance (MDR)*: California, 2011‒2015
*Cases with initial drug resistance to at least isoniazid and rifampin California Department of Public Health, Tuberculosis Control Branch
Long Beach Pasadena
Berkeley San Francisco
≥ 25 Cases
15-24 Cases
5-14 Cases
1-4 Cases
None
Initial MDR Cases: 2011-2015
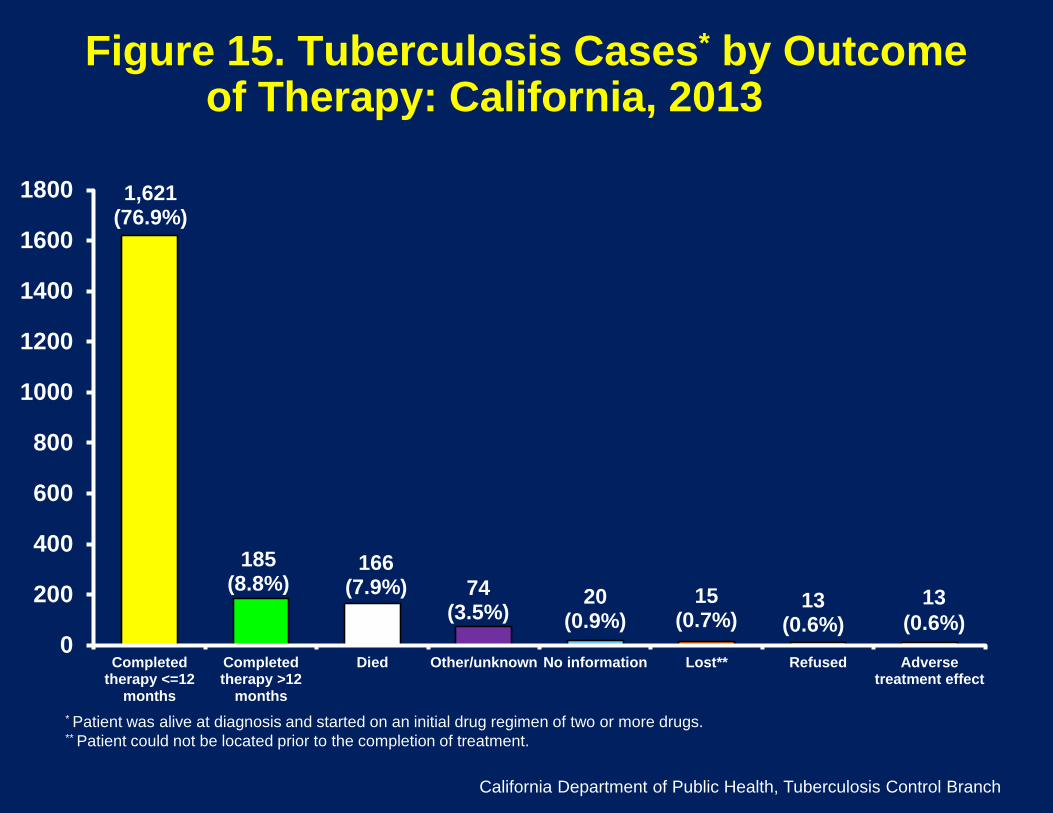
Completedtherapy <=12
months
Completedtherapy >12
months
Died Other/unknown No information Lost** Refused Adversetreatment effect
0
200
400
600
800
1000
1200
1400
1600
1800
13 (0.6%)
Figure 15. Tuberculosis Cases* by Outcome of Therapy: California, 2013
1,621 (76.9%)
185 (8.8%)
166 (7.9%) 15
(0.7%) 13
(0.6%) 74
(3.5%)
* Patient was alive at diagnosis and started on an initial drug regimen of two or more drugs. ** Patient could not be located prior to the completion of treatment.
20 (0.9%)
California Department of Public Health, Tuberculosis Control Branch
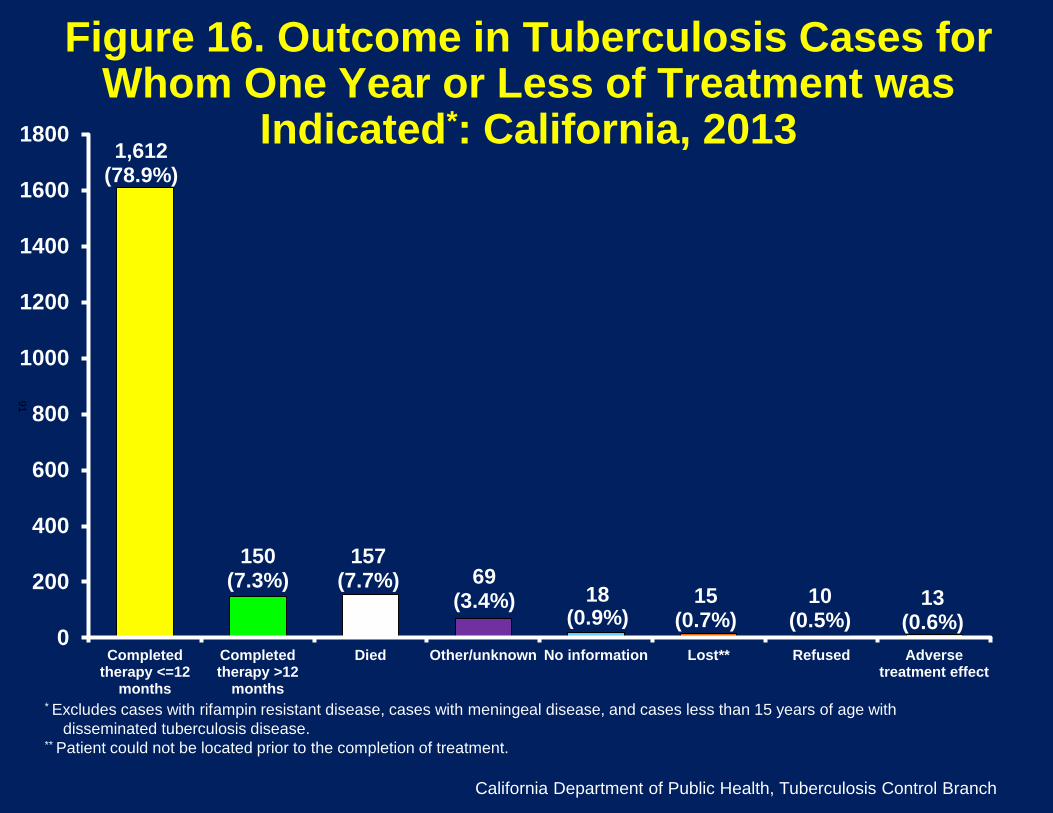
Figure 16. Outcome in Tuberculosis Cases for Whom One Year or Less of Treatment was
Indicated*: California, 2013
Completedtherapy <=12
months
Completedtherapy >12
months
Died Other/unknown No information Lost** Refused Adversetreatment effect
0
200
400
600
800
1000
1200
1400
1600
18001,612
(78.9%)
150 (7.3%)
157 (7.7%)
15 (0.7%)
10 (0.5%)
69 (3.4%) 18
(0.9%)
* Excludes cases with rifampin resistant disease, cases with meningeal disease, and cases less than 15 years of age with disseminated tuberculosis disease.
** Patient could not be located prior to the completion of treatment.
91
California Department of Public Health, Tuberculosis Control Branch
13 (0.6%)
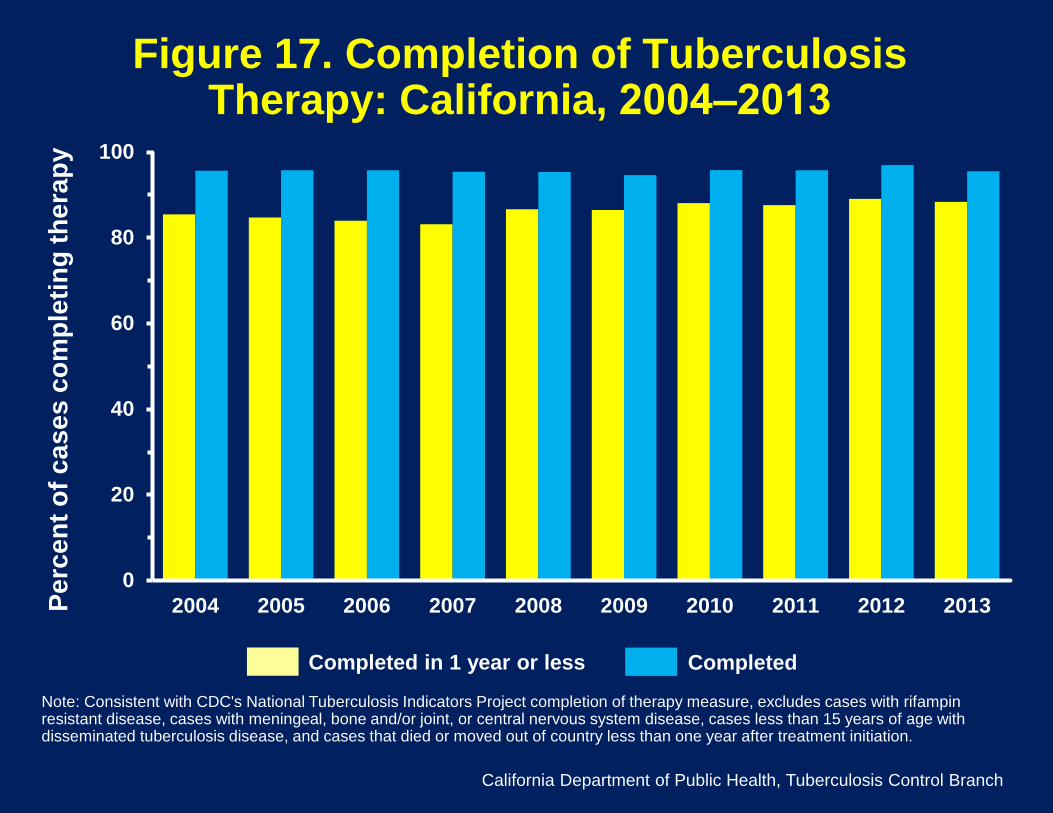
Figure 17. Completion of Tuberculosis Therapy: California, 2004‒2013
0
20
40
60
80
100
2004 2005 2006 2007 2008 2009 2010 2011 2012 2013
Completed Completed in 1 year or less
Note: Consistent with CDC's National Tuberculosis Indicators Project completion of therapy measure, excludes cases with rifampin resistant disease, cases with meningeal, bone and/or joint, or central nervous system disease, cases less than 15 years of age with disseminated tuberculosis disease, and cases that died or moved out of country less than one year after treatment initiation.
California Department of Public Health, Tuberculosis Control Branch
Perc
ent o
f cas
es c
ompl
etin
g th
erap
y
Technical Notes
Reporting Jurisdictions
California has 61 jurisdictions that report TB morbidity. There are 58 counties and the cities of Berkeley, Long Beach, and Pasadena. Reports from Alameda County exclude TB cases from the city of Berkeley, and reports from Los Angeles County exclude cases from the cities of Long Beach and Pasadena. Since 1993, local health jurisdictions have used the Report of Verified Case of Tuberculosis (RVCT) form to report TB cases; an expanded and updated version of this form was implemented in California in 2010. California cleans, compiles and analyzes these data for state and local use, and also reports these data to the Centers for Disease Control and Prevention (CDC).
TB Cases
A TB case submitted to the TBCB Registry by January 15, 2016 was included as a 2015 case in this report if the case was confirmed as active TB between January 1 and December 31, 2015. After reporting the case, a jurisdiction may subsequently decide that a reported case did not have TB. Also, a few cases may be reported after the submission deadline. These changes will be reflected in future reports. Therefore, the total number of TB cases counted in a given year may change, usually by a small number of cases. This small change in case numbers may also be reflected in the two sets of TB numbers released each year, a provisional case count used in early reports and materials generated in March for World TB Day, and a final case count which is used in this report.
Population Data
Population data were derived primarily from the following sources at the State of California, Department of Finance. State and local health jurisdiction totals are from the following sources:
• E-2 California County Population Estimates and Components of Change by Year, July 1, 2010-2015, December 2015
• E-4 Historical Population Estimates for Cities, Counties, and the State 2011-2015 with 2010 Census Benchmark.
Proportions of population subgroups (sex, age, race and ethnicity) for California are from the following sources:
• Race/Ethnic Population with Age and Sex Detail, 1970-1989, December 1998 • Race/Ethnic Population with Age and Sex Detail, 1990-1999, Revised May 2009 • Race/Hispanics Population with Age and Gender Detail: 2000-2010, Revised March
2013 • P-3 State and County Population Projections by Race/Ethnicity, Sex, and Age, 2010-
2060, December 2014 State and county population totals are from the estimate series. Populations for the cities of Berkeley, Long Beach and Pasadena were estimated by obtaining the ratio of city to county population totals from the E-4 report, and applying the ratio to the E-2 county population totals. Population totals for the jurisdiction of Alameda were then calculated by subtracting Berkeley calculated population from Alameda County total; population total for the jurisdiction of Los Angeles was calculated by subtracting Long Beach and Pasadena calculated populations from Los Angeles County total.
Demographic populations were estimated by applying the population proportion of each demographic subgroup to the state total (estimate series). For calculation of rates by racial/ethnic group, the multi-race category in the 2006−2015 population data was reallocated to a single racial/ethnic group according to the allocation table in this source: State of California, Department of Finance, Suggested Allocations of the Multi-race Category for Use with Projections by Race/Ethnicity for California and Its Counties, 2000-2050, Sacramento, California, June 2004. Populations of foreign-born and U.S.-born persons were calculated by applying the proportion of each group from the United States Census Bureau’s American Community Survey available at http://factfinder2.census.gov, to the California total population for 2015 from California Department of Finance, E-2 California County Population Estimates and Components of Change by Year, July 1, 2010-2015. At the time of preparation of this report, U.S. Census data for the current year were not available, therefore the proportion of foreign-born and U.S.-born persons from 2014 were also used for 2015. These rates will be updated in future reports. Small Case Numbers
We have chosen not to report rates when the total number of TB cases is less than five. Rates of zero, based on no TB cases, are also not reported. Where the rate is not reported, changes in rate over time are also not reported.
In tables that report demographics of, and risk factors for, TB cases by reporting jurisdictions (Tables 16−22, 36−46), data from jurisdictions with less than five cases of TB are aggregated to reduce the likelihood that individual TB cases in a given jurisdiction can be identified.
The following 14 jurisdictions had between one and four cases of TB in 2015: Butte, El Dorado, Glenn, Madera, Napa, Nevada, Pasadena, Placer, San Benito, San Luis Obispo, Santa Cruz, Shasta, Sutter and Trinity. The following 19 jurisdictions had no TB cases in 2015: Alpine, Amador, Calaveras, Colusa, Del Norte, Humboldt, Inyo, Lake, Lassen, Mariposa, Mendocino, Modoc, Mono, Plumas, Sierra, Siskiyou, Tehama, Tuolumne and Yuba.
Ranking of Jurisdictions
For Table 13, jurisdictions are ranked in order of decreasing 2015 case rates with the highest rank first. Those jurisdictions with one to four cases are not given a rate and are given the same rank; they are listed according to decreasing number of cases. Jurisdictions with no cases of TB are given the same rank and are listed in alphabetical order.
TB Case Definition and Verification Criteria
For surveillance purposes, a case of TB is defined by laboratory and clinical evidence of disease caused by Mycobacterium tuberculosis (Mtb) complex. TB cases with culture or nucleic acid amplification evidence of Mtb, or acid fast bacilli in a smear from a clinical specimen (when a culture cannot be obtained, or positive results are negative or contaminated) are classified as laboratory-confirmed. In the absence of laboratory confirmation, persons with a positive tuberculin skin test (TST) or positive interferon gamma release assay (IGRA) for Mtb, abnormal chest imaging (in those with pulmonary disease), and treatment with two or more anti-TB medications will be classified as clinically-confirmed TB. Reported cases not meeting one or more of the clinical criteria for TB are classified as provider-diagnosed cases because the health
care provider has determined there is sufficient evidence of active TB disease to report the case.
The following hierarchy is applied in determining the verification criteria for TB disease (Table 25):
1. Positive culture for Mtb
2. Positive nucleic acid amplification test
3. Positive acid-fast bacilli test
4. Clinical case confirmation
5. Provider diagnosis
Race and Ethnicity
The RVCT has one variable for race and one for ethnicity. If a case is classified as “Hispanic” on the RVCT, then the case is reported as “Hispanic” in this report, regardless of race.
Beginning in 2003, the federal Office of Management and Budget (OMB) mandated separate reporting of Asian and Pacific Islander/Native Hawaiian races, as well as the opportunity for persons to identify themselves by one or more racial groups. Individuals reporting more than one race are presented in Table 19. In all other tables presenting race/ethnicity, cases were reassigned to a single racial/ethnic group based on the “Smallest Group” method, in which responses that include white and any another group were assigned to the other group, and responses with two or more racial groups other than white were assigned to the group with the fewest number of individuals identifying that group as a single race. In 2015, there were two non-Hispanic persons reported with more than one race. In tables where data on race/ethnicity are presented (except Table 19) one person reported as Asian and white was included in the Asian and Pacific Islander group, and one person reported as black and white are reported in the black, non-Hispanic group. In addition to the 1 multi-race Asian person, 1128 persons were reported as only Asian, and 10 were reported as only Native Hawaiian or Pacific Islander. HIV/AIDS Status
In 2011, California implemented reporting of HIV status of TB cases on the RVCT (Tables 36, 37). Since 1993, TB cases co-infected with HIV, and reported with HIV or AIDS are also identified by matching TBCB Registry data with the HIV/AIDS case registry in the California Department of Public Health Office of AIDS. A positive result from either source was considered to be indicative of co-infection with HIV/AIDS in Tables 12, 36, 62, 63, Figures 11, 12. Table 37 (HIV Status at the Time of TB Diagnosis) and Table 38 (Medical Risk Factors for Tuberculosis) report only the HIV testing status variable from the RVCT.
Primary Reason for TB Evaluation
The primary reason for a patient’s initial evaluation for TB was added to the TB case report form in 2010. Because multiple factors may be present at the time of a person’s initial TB evaluation (e.g., a person with TB symptoms evaluated during the course of a contact investigation of a
family member), and only the primary reason may be reported, the following definitions and hierarchies are applied.
TB symptoms: the person sought evaluation because of signs or symptoms of TB disease (e.g., persistent cough, fever, lymphadenopathy, night sweats, weight loss or symptoms of extra-pulmonary disease).
Abnormal chest image: the initial chest radiograph was consistent with TB disease, and was performed for a reason other than suspicion of TB disease. If the radiograph was performed following a positive TST or IGRA result obtained during targeted testing, “Targeted Testing” is considered to be the primary reason the patient was evaluated for TB.
Contact investigation: the person’s TB was identified during the course of a contact investigation or source case finding, regardless of whether the person was symptomatic at the time.
Targeted testing: a positive TST or IGRA result was obtained during a screening performed specifically because the person was considered to be at high risk for TB. However, health care worker or employment/administrative testing, contact investigation, and immigration medical exam supersede targeted testing as the primary reason a patient was evaluated, when one of those situations is applicable.
Health care worker: a positive TST or IGRA result was obtained during the course of routine screening of health care workers. Health care worker supersedes targeted testing and employment/administrative testing. However, evaluation of health care workers for other reasons (e.g., TB symptoms or contact investigation) supersedes health care worker.
Employment/administrative testing: persons whose TB testing was performed before or periodically during employment to meet administrative requirements. If employment was health-care, “health care worker” is considered the primary reason the patient was evaluated.
Immigration medical exam: TB disease was found during a medical examination that was part of the immigration requirement process that is mandatory for certain categories of U.S. entrants (e.g., immigrant, refugee, asylee).
Incidental lab result: the clinical evaluation was for something other than TB. Specimens were collected and submitted for evaluation of TB and other diseases for diagnostic completeness, but TB was not expected.
Risk Factors for TB
In 2010, reporting of certain additional medical and epidemiologic risk factors began. Persons with medical co-morbidities such as diabetes mellitus, end-stage renal disease, organ transplantation, tumor necrosis factor (TNF) alpha antagonist therapy, or other immunosuppressive medications that suppress a patient’s immune response have a higher risk of TB; these new data will provide a better understanding of these high-risk groups (Table 38).
Non-medical epidemiologic risks for TB (Table 39) include contact to an MDR TB case, or to an infectious TB patient. If the patient was a contact to an MDR case, he/she should be reported as “contact of MDR case,” rather than “contact of infectious case.” The association with the MDR case must be within the last two years. A case should be reported as a missed contact if the current case was identified as a contact of a known TB patient (within 2 years of current diagnosis), but was not identified or evaluated at that time. Incomplete LTBI treatment includes
patients who started treatment for a previous diagnosis of LTBI, but did not complete the regimen.
Immigration Status at First Entry to the United States
Information on the immigration status of cases born outside the United States was added to the TB case report form in 2010. TB patients are asked to provide their immigration status at the time they first entered the US. Persons entering the United States with no official immigration status (e.g., “undocumented” persons) are included in the “other” immigration status category, as are persons with visa types other than those specified in Table 22, and persons not required to obtain visas (such as short-term visitors from countries such as Canada that are part of the U.S. visa waiver program). In addition, some local health jurisdictions have policies in place that prohibit them from inquiring about the immigration status of patients; these cases are included in the “unknown” category.
For more detailed information on the reporting of the variables “Primary reason evaluated for TB,” “Additional risk factors for TB” and “Immigration status at first entry to the United States” see http://www.cdc.gov/tb/programs/rvct/InstructionManual.pdf.
Drug Susceptibility Reports
Tables 47−54 present the results of initial drug susceptibility testing for the most recent year (2015). Because the Initial Drug Susceptibility Report (Follow-up 1) may be submitted several months after the initial case report, all results may not have been available at the time this report was prepared. At the time of report preparation, drug susceptibility testing was approximately 94 percent complete for culture-positive TB cases. As additional Follow-up 1 reports are submitted, overall proportions of drug resistance may change slightly. These updated results will be available in future reports, in tables presenting trends in drug resistance (Tables 55, 56, Figure 13).
Figure 13 presents MDR TB cases (defined as cases with an isolate resistant to at least isoniazid and rifampin reported on the Initial Drug Susceptibility Report [Follow-up 1] or the Case Completion Report [Follow-up 2]).
Case Completion Reports
Because the Case Completion Report (Follow-up 2) is not submitted until many months after a TB case is initially reported, data reported on cases counted in 2013 are the most recent available and are presented in this report. These data include health care provider type (Table 34), directly observed therapy (Table 35) and treatment outcomes (Tables 58−64, Figures 13, 15−17). Data in these tables are from the final Follow-up 2 submitted and, therefore represent the overall treatment completion rate for cases beginning therapy for TB disease in California. Treatment completion may have occurred in the jurisdiction reporting the case, in another California jurisdiction, or another state. In addition, for the first time, we are including treatment outcomes (completion of therapy, or death during treatment) for patients who were referred to Mexico or Central America through CureTB, as results become available.
Treatment Outcomes
Categories for completion of therapy (Tables 58−60, 62−63, Figures 15−17) are: completed therapy in 12 months or less (includes patients whose treatment was completed in 366 days or less); and completed therapy in more than 12 months (treatment completed in more than 366 days, or treatment completed in an undetermined amount of time). If the day of the month is
missing from the treatment start or stop date (but the month and year are available), the missing day is set to the first of the month. Because the day of the month is much more likely to be missing from the stop date than the start date, the bias in calculating the duration of therapy is toward shorter duration of therapy.
Cases known to have started treatment, but for whom no Follow-up 2 is available are included in the “No Information” category. All other outcome categories reflect the “Reason Therapy Stopped” variable of the Follow-up 2.
Tables 59 and 63, and Figure 16 present outcomes of TB treatment for cases expected to complete TB therapy in one year or less. Thus, cases with rifampin-resistant disease (including MDR TB), those with meningeal disease, and children less than 15 years of age with disseminated TB disease are excluded. Table 60 and Figure 17 present completion of TB therapy using methodology used by CDC. Patients with rifampin-resistant disease, patients with meningeal, bone or joint disease, patients under 15 years of age with disseminated disease, and patients who died or moved out of the country less than one year after initiation of treatment are excluded. The percentage of patients who completed therapy in one year or less is presented, as well as the percentage of patients who completed therapy, regardless of duration.
TB Genotypes
TB genotyping is a laboratory-based approach used to analyze the genetic material (e.g., DNA) of Mtb. TB genotyping results, combined with epidemiologic data, can help identify persons with TB disease involved in the same chain of recent transmission, and is a valuable tool in contact investigations. It can also be used to help to distinguish recent infection from activation of an old infection. Genotyping is recommended for isolates from sputum and other clinical specimens that are positive for Mtb.
Table 64 presents the percentage of cases with isolates positive for Mycobacterium tuberculosis (Mtb) whose specimens were submitted for genotyping for 2011-2015. Table 65 presents the number of cases with genotyped isolates that were clustered (matched) with a genotyped isolate from one or more other case in the same jurisdiction within a three year time period, and the number of clusters by cluster size. A cluster is defined as two or more cases with matching spoligotype and 24-locus mycobacterial interspersed repetitive unit-variable number tandem repeat type (GENType) within a county during the specified 3-year time period. Characteristics of the cases with genotyped isolates identified as the Mycobacterium bovis strain of Mtb are shown in Table 66.
Latent TB Infection (LTBI)
Estimates of LTBI prevalence is an important tool to understanding the potential pool of persons who may one day progress to active TB in the future, and for whom testing and treatment of the infection can decrease TB morbidity in the future. To estimate populations by nativity, the proportions of foreign-born and U.S.-born persons for California and selected LHDs from the U.S. Census Bureau’s American Community Survey (ACS) were applied to population totals from the California Department of Finance estimates series (see Population Data above). The prevalence of latent TB infection (LTBI) presented in Table 67 was then estimated by applying the proportions of U.S.-born persons with a positive TST and proportions of foreign-born persons with a positive IGRA from the National Health and Nutrition Examination Survey (http://www.cdc.gov/nchs/nhanes/index.htm), and reported in Miramontes (http://www.ncbi.nlm.nih.gov/pmc/articles/PMC4633161) to the U.S.- and foreign-born

populations. Due to ACS sampling methods, estimates of LTBI are not available for all LHDs in California.