report on the study of performance-based … · output goals: customer ... for establishing...
TRANSCRIPT

REPORT ON THE STUDY OF
PERFORMANCE-BASED REGULATION
Sally A. Talberg, Chairman Norman J. Saari, Commissioner
Rachael A. Eubanks, Commissioner
MICHIGAN PUBLIC SERVICE COMMISSION Department of Licensing and Regulatory Affairs
In compliance with Act 341 of 2016
April 20, 2018

Table of Contents
Executive Summary ......................................................................................................................... 3
Study Criteria ................................................................................................................................... 5
Comparison of Traditional Cost-of-Service Regulation and PBR ................................................. 5 Economic Regulation of Public Utilities in Michigan ........................................................................ 5 Drivers of Change .......................................................................................................................... 8 PBR vs. Traditional Cost-of-Service Regulation .............................................................................. 8
The UK’s RIIO (Revenues-Incentives-Inputs-Outputs) Mechanism ............................................ 10
Key Incentive/PBR Mechanisms and Implementation in the U.S. ............................................... 11
Cost-of-Service Regulation with Added Targeted Incentives ..................................................... 12
PIM Options .................................................................................................................................... 13 Demand Response PIM ............................................................................................................... 13 Shared-Saving PIM for DR ........................................................................................................... 14 Positive and Negative PIMs for Optimizing CAPEX and OPEX .................................................... 15 Output Goals: Customer Satisfaction ............................................................................................ 16 Output Goals: Safety .................................................................................................................... 16 Output Goals: Reliability ............................................................................................................... 16 Output Goals: Environmental Impact ............................................................................................ 17 Output Goals: Social Obligations .................................................................................................. 18 Multi-Year Rate Plans ................................................................................................................... 18 Public Reporting Mechanisms ...................................................................................................... 19
Green Pricing: ........................................................................................................................... 20 On-Bill Financing: ...................................................................................................................... 20
Potential Applicability of Broad-Based PBR in Michigan ............................................................ 20 RIIO as Applied in the UK Would Not be Appropriate for Michigan under Existing Market Structure.............................................................................................................................. 20
Pros and Cons of Different Approaches and Conditions for Successful Implementation ............... 22
Summary and Recommendations ................................................................................................. 23
3
Executive Summary
This report by the Michigan Public Service Commission (PSC or Commission), on
performance-based regulation (PBR) and its potential applicability in Michigan, was
developed to comply with Section 6u of Public Act 341 of 2016 (PA 341). That statute
implemented a comprehensive reform of energy policies in the state and directed the
Commission to perform a study of PBR in other states and countries, including a well-
established PBR approach used in the United Kingdom. The Commission was directed to
engage stakeholders on this topic and evaluate four specific factors: (1) methods for
estimating revenue needed, (2) methods to increase the time between rate cases, (3) options
for establishing incentives and penalties, and (4) profit-sharing provisions that can spread
efficiency gains among consumers and utility stockholders and can reduce the degree of
downside risk associated with innovation.
The rates of investor-owned electric and natural gas utilities in Michigan are regulated by the
Commission under cost-of-service regulation.1 Under this traditional regulatory approach,
utilities have been incentivized to build infrastructure to meet a multi-decade period of
increasing energy demand. In more recent years, however, stagnant growth in energy
demand has challenged the assumption that utility investment can be funded by anticipated
future growth, causing rate cases to be filed more frequently. During a time of increased
technology innovation, digitalization, and customer engagement affecting the energy
industry, it is also difficult to encourage innovation and operating efficiency within the
traditional regulatory model. PBR has been used in other jurisdictions to help adapt to these
drivers of change, meet policy goals, extend time between rate cases, and remove
disincentives inherent in traditional regulation for non-capital solutions such as energy waste
reduction or customer-owned generation. As discussed in this report, PBR is complex and
has both advantages and disadvantages. Accordingly, the direction from the Michigan
Legislature and Governor for the Commission to undertake a comprehensive examination of
PBR as a first step is timely.
The Commission examined PBR mechanisms in two jurisdictions: (1) the United Kingdom
(revenues, incentives, inputs, and outputs for 8 years), and (2) New York (distribution rate
freeze for 2 years). The Commission also created an inventory of four other PBR
applications in (1) Alberta, Canada (distribution price cap for 5 years); (2) Australia
(transmission revenue cap for 5 years); (3) Norway (transmission revenue cap for 5 years);
and (4) Ontario, Canada (distribution price cap for 5 years). In addition to considering PBR
mechanisms in other jurisdictions, the Commission also analyzed potential PBR approaches
related to PA 341, including: (a) cost-of-service with targeted incentives, (b) performance
incentive mechanisms for demand response, (c) shared-saving approaches, and (d)
1 Cost-of-service regulation is also referred to as cost-plus-return regulation. In regulatory jargon, the term “cost-of-service” also refers to setting rates for
individual classes of customer (e.g., residential, industrial) based on the utility’s cost to serve those groups of customers.

4
approaches to optimize overall capital expenditures and operating costs. The Commission
analyzed these approaches in light of five specific objectives in PA 341: (1) customer
satisfaction, (2) safety, (3) reliability, (4) environmental impact, and (5) social obligations. The
MPSC relied on numerous secondary sources for its study of PBR.2
The Commission’s review of PBR mechanisms in other jurisdictions indicates that similar
approaches can be used to augment the existing regulatory model, provided they are tailored
to specific requirements in Michigan. Sec. 6u did not create any new or revised authority
addressing the Commission’s ability to approve PBR but Sec. 6u (5) states that Sec. 6u does
not limit the Commission’s existing authority to authorize PBR. Notwithstanding, it is clear
that how rates are set—whether through traditional regulatory methods or PBR—provides
strong incentives that affect utility investments and behaviors. Integrating forms of PBR into
the existing cost-of-service regulatory model could help utilities and regulators adapt to
potentially profound changes affecting the energy industry in the coming years as discussed
above. Consequently, the Commission intends to: (a) proceed through the use of pilot
programs to evaluate the feasibility of different approaches, (b) integrate PBR with other
energy planning and infrastructure programs, and (c) continue to keep stakeholders involved.
More specifically, the Commission has a well-established program to accelerate the
replacement of aging natural gas main pipelines that could be expanded to address other
infrastructure challenges in conjunction with additional performance metrics. In addition, the
Commission has a new electric distribution planning initiative to increase transparency and
stakeholder engagement on grid modernization goals, metrics, and investment strategies that
could provide a foundation for PBR. The Commission intends to evaluate the inclusion of
PBR metrics in these programs and also review other programs that may prove fruitful for the
use of PBR.
2 One comprehensive source on PBR—a September 2017 report by the Regulatory Assistance Project (RAP) and the National Renewable Energy Laboratory
is particularly timely and relevant given their research on the latest U.S. and global experience with respect to PBR and analysis of new regulatory trends
involving the use of performance incentive mechanisms, or PIMs, to augment existing regulatory structures to achieve a diverse array of targeted policy
outcomes. Due to its relevance, the RAP/NREL report on Next-Generation Performance-Based Regulation is referenced as Appendix F, the RAP report on
Performance Based Regulation Options is referenced as Appendix G, and the report on Incentive Regulation of Distribution Utilities is referenced in Appendix H
to this MPSC report.

5
Study Criteria
Act 341 of 2016, which amended Act 3 of 1939, charges the Commission to undertake a
study of PBR, and to report on its findings with written recommendations (Sec. 6u). In
conducting this study, the Commission was tasked with collaborating with representatives of
each customer class, regulated utilities, and other interested parties.
Sec. 6u (1) defines PBR, in part, as a regulatory system in which a utility’s authorized rate of
return would depend on the utility achieving targeted policy outcomes. Such outcomes could
relate to cost control, customer service, reliability, safety, innovation, environmental
performance, or other considerations. Regulatory mechanisms with targeted objectives are
commonly referred to as performance incentive mechanisms, or PIMs.
Sec. 6u (2) directs the MPSC to examine PBR applications in other states and countries
including, but not limited, the United Kingdom’s RIIO (revenue = incentive, + innovation +
outputs) model. RIIO is a broad-based PBR alternative to traditional cost-of-service
regulation. Other jurisdictions have used PBR mechanisms such as PIMs to augment
existing cost-of-service regulation.
Sec. 6u (3) directs the MPSC to evaluate four specific factors associated with PBR:
1. Methods for estimating revenue needed during a multi-year pricing period that uses
forecasts of efficient total expenditures (i.e., TOTEX as used in the RIIO model);
2. Methods to increase the time between rate cases to provide the utility with opportunity
to retain cost savings and to encourage investments that have extended payback
periods;
3. Options (i.e., mechanisms) for establishing incentives and penalties that pertain to
customer satisfaction, safety, reliability, environmental impact, and social obligations;
and,
4. Profit sharing provisions that can spread efficiency gains among consumers and utility
stockholders and reduce the degree of downside risk associated with innovation.
Comparison of Traditional Cost-of-Service Regulation and PBR Economic Regulation of Public Utilities in Michigan
The origins of the MPSC as a regulatory body, and its jurisdiction over public utilities, stem
from Act 3 of 1939 (Act 3). It is the Commission’s core enabling legislation and outlines the
scope of its legal authority to regulate public utilities.
Both Act 419 of 1919, and Act 9 of 1929, preceded Act 3. Act 419 created the Michigan

6
Public Utilities Commission, having jurisdiction over electric, manufactured gas and power.
Act 9 expanded the MPUC’s jurisdiction to include rate authority over amended natural gas
purchase contracts, and the transmission and distribution of natural gas within Michigan.
Act 3 replaced the Public Utilities Commission with the Public Service Commission, and
consolidated the Commission’s regulatory authority over public utilities. The Act granted the
Commission broad ratemaking authority over investor-owned natural gas, steam, and electric
utilities.3
There have been several major and minor amendments to Act 3 over the years to modify the
structure of utility regulation in Michigan to respond to changes in the regulatory environment,
and to modify the procedures and processes used to evaluate applications for rate increases.
Table 1: Economic Regulation of Public Utility
YEAR PA # TITLE
1919 419 Michigan Public Utilities Commission
1929 9 Natural Gas
1939 3 Michigan Public Service Commission
1982 304 Amended Act 3 of 1939
2000 141 Customer Choice and Electricity Reliability Act
2008 286 Amended Act 3 of 1939
2008 295 Clean and Renewable and Efficient Energy Act
2016 341 Amended Act 3 of 1939
2016 342 Amended Act 295 of 2008
The utility regulatory structure was developed over nearly a century with refinements over
time to the core approach, known as “cost-plus-return” or cost-of-service regulation. Under
this form of economic regulation, utility rates are set to allow the utility the opportunity to
recover capital investments over time (including a return, or profit, on those investments) plus
operations and maintenance expenses such as tree trimming, labor expenses, insurance,
and taxes.
Under cost-of-service regulation, the following formula is used:
Revenue Requirement = Rate Base * r + D + O + T
Where:
Rate Base = Unrecovered Capital Investment
r = Cost of Capital; return “ON” capital
D = Depreciation; return “OF” capital
O = Operating and Maintenance Expenses
T = Taxes
3 Changes to Michigan law in 2008 authorized cooperatives to become regulated, for purposes of setting rates, by their elected board of directors. All but one
cooperative (Presque Isle Gas Cooperative) are now member regulated.

7
With the utility’s profit tied to the level of capital investment, this approach provides a strong
incentive for utilities to make capital investments in energy infrastructure. It has enabled
utilities to build infrastructure to respond to a multi-decade expansion of energy demand and
broad changes in the economy.
For decades, Michigan applied this rate-setting formula with historical data on the utility’s
revenue, sales, and costs, known as a historical test-year.4 Act 286 of 2008 permitted
regulated utilities to file rate case applications using projected costs and revenues for a future
consecutive 12-month period (i.e., a fully projected test year, as opposed to the limited
adjustments to actual costs and revenues made in a historical test year calculation).5 While
there are arguments made against the use of projected test years,6 Michigan’s experience
with them does provide a foundation for PBR in that it better informs the Commission with
respect to short-term utility capital planning and related goals (e.g., reliability improvement) to
be met from the planned investments and such review can occur prior to the expenditure
being made.
Under traditional regulation, prudence reviews often occur after the fact (although with
projected test years, utilities may wait to make certain investments or incur expenses until
they are approved by the Commission in a rate case given the potential uncertainty of cost
recovery). Quality service is to be provided according to the performance requirements
implicit in traditional utility regulation combined with prescriptive technical and customer
service standards promulgated by the MPSC.
Traditional cost-of-service regulation incentivizes certain behaviors: regulated utilities
recognize they can maximize revenue and profits by building more generation, distribution,
and other infrastructure and by selling more electricity between rate cases.7 This can work
well for a system featuring large, centralized power plants that required large investments of
capital resources with growing energy demand.
4 A historical test year is a pro forma calculation of revenue requirements using the requesting utility’s books and records as a cost foundation (pro forma
means based on historical costs, as adjusted for non-recurring events). Typically, historical costs were adjusted for “known and measurable” changes. A
historical test-year did allow for the use of projected sales levels to ensure that the final rates for the various rate schedules fairly recovered a utility's approved
revenue requirement. 5 All rate case applications since the passage of Act 286 have used projected test years. In various rate case orders since 2008, the Commission has clarified
its standards for utilities using projected test years, and in some instances relies on historical information for certain cost items. 6 Use of projected costs in determining a utility’s revenue deficiency can blunt the “regulatory lag” associated with the strict use of actual (historical) costs and
revenues to set rates. Regulatory lag is the lapse of time between a petition for a rate increase and action by the regulatory body. Some entities and academics
argue that such regulatory lag is a critical and positive feature of traditional cost-of service regulation, creating economic incentives for utilities to pursue cost
efficiencies. 7 In a rate case, to somewhat simplify, the rate is set by dividing the revenue requirement by expected sales to yield an allowed rate that utilities charge to
customers on a volumetric basis of cents per kilowatt-hour. If the volume increases above the expected sales figure used in the rate case, that excess revenue
is above the revenue requirement, and is traditionally retained by the utility. Decoupling and other revenue adjustment mechanisms can alter this outcome by
adjusting rates if sales increase.

8
Drivers of Change
Several factors are leading to a re-examination of the traditional utility business model and
regulatory approaches. These factors include, but are not limited to, technological change
(e.g., electric vehicles, energy storage, renewable energy, Internet of Things, digitalization),
stagnant growth in energy demand due largely to end-use efficiency improvements, and
evolving customer preferences and engagement relating to energy sources and use. As
utilities undertake significant capital investments to replace aging infrastructure, there is also
an opportunity to integrate technological innovations and rethink approaches to energy
production and delivery.
New capital investment to upgrade aging infrastructure such as gas pipelines, substations,
poles, and generation equipment is the primary driver of rate cases in Michigan. The level of
investment—on the order of $3 billion per year—is leading to regular rate cases before the
Commission. The Commission had an unprecedented 11 rate cases in some stage of the
process during 2017, and multiple cases are slated for decisions or to be filed in 2018.8 The
frequency of these cases (and the time and cost involved for the Commission, utilities, and
stakeholders) has also led to questions about the traditional regulatory approach, and
whether PBR could play a role in potential reforms.
As discussed further below, PBR is viewed as an option to help adapt to these drivers of
change by specifying expectations of utility performance and outcomes for consumers, while
staying agnostic to the exact means of delivery. PBR can also be designed to provide
incentives and penalties to meet certain policy goals (e.g., service quality, reliability, power
plant performance, innovation), extend time between rate cases, and remove disincentives
inherent in traditional regulation for non-capital solutions such as energy waste reduction or
customer-owned generation.
PBR vs. Traditional Cost-of-Service Regulation
In its most basic form, a transition to PBR entails capping utility rates or revenues (often with
some provision for inflationary adjustments) and shifting to a series of pre-defined goals or
metrics to ensure specific performance outputs and outcomes are met. Regulators began
adopting various forms of PBR in the 1980’s and 1990’s.9 Early forms of PBR focused almost
exclusively on cost-control, and PBR has been used in the telecommunication and railroad
industries as well. More recently, PBR has expanded beyond cost-control, and is now being
utilized as a means to focus regulated utilities on jurisdictional goals ranging from energy
efficiency and renewable integration, to grid modernization goals. Under traditional
8 An increasing portion of utility rate increases are directly related to capital investment programs, reflecting a combination of low inflation (reducing the rate of
increase in operating expenses or even reducing overall operating expenses) and major new infrastructure investment. 9 Elenchaus Research Associates, Inc. (2015). Performance Based Regulation: A Review of Design Options as Background for the Review of PBR for Hydro
Québec Distribution and Transmission Divisions. Retrieved from: http://publicsde.regie-energie.qc.ca/projets/272/DocPrj/R-3897-2014-A-0003-Dec-Dec-
2015_03_04.pdf

9
regulation, the levels of sales and capital expenditures primarily drive utility financial
earnings, whereas PBR can be designed to optimize total utility expenditures regardless of
whether they are operational or capital in nature.
In general, the goal of PBR is to embed explicit incentives and/or disincentives into the
regulatory regime to directly encourage a utility to make investment and operating decisions
that achieve certain policy or regulatory outcomes. More specifically, PBR has the ability to
connect goals, targets, and measures to utility performance, executive compensation, and
investor returns. PBR mechanisms determine utility revenue based on specific performance
metrics and other non-investment factors. PBR can include multi-year rate plans (MRPs),
performance incentive mechanisms (PIMs), alternative rate mechanisms, and rate or
revenue caps, which are discussed in this report and in Appendix A. PIMs are metrics and
formulas that determine the levels of financial rewards or penalties (i.e., adjustments to
allowed revenues) for achievement of specified outputs and outcomes. A rate cap literally
limits the rate a utility can charge its customers. A utility is allowed to keep some or all
efficiency gains so long as rates do not increase. A revenue cap limits how much revenue a
utility can recover so utility revenue cannot exceed a certain level.10 In designing PBR
metrics, regulators and policy makers can clearly articulate expectations for utility operations
on particular targets and outcomes—such as reliability improvements, cost-effective energy
efficiency or grid modernization—in advance of any utility decisions or expenditures.
On the other hand, successful PBR requires the targets and incentives to be carefully
designed so the incentives, whether negative or positive, do not unnecessarily burden
ratepayers or generate unfair profits for the utility. Depending on the expenditure, it may be
difficult for the regulator to foresee at the outset all possible unintended outcomes of the PBR
metric. A conceptual review of a shift to a more performance based regulatory regime is
shown below in Table 2. While the figure describes traditional cost-of-service regulation as
“reactive,” it is worth mentioning that projected test years can provide some visibility into
near-term plans prior to certain expenditures being made. But even with projected test
years, the model is still best characterized as reactive.
10 Migden-Ostrander, J., Littell, D., Shipley, J., Kadoch, C., and Sliger, J. (2018) Recommendations for Ohio’s Power Forward Inquiry. Montpelier, VT: The
Regulatory Assistance Project. Retrieved from: http://www.raponline.org/wp-content/uploads/2018/02/rap-recommendations-ohio-power-forward-inquiry-2018-
february-final2.pdf

10
Table 2: Conceptual Contrast of Cost-of-Service Regulation with Performance-Based
Regulation.11
Cost-of-Service Regulation Comprehensive Performance-Based
Regulation
Regulatory Involvement
After-the-Fact Before-the-Fact
Reactive Proactive
Large regulatory input with imprudence Large regulatory input up-front
Specificity of Regulatory Guidance
Little regulatory guidance Specific targets set
Less Innovation Flexibility in methods to achieve
outcomes
Well-designed PBR provides incentives and disincentives based on utility performance, and
has the potential to benefit consumers and utilities alike. PBR provides goals and metrics that
enable utilities to forecast efficient total expenditures. Some forms of PBR, such as multi-year
rate plans, increase the time between rate cases, which provides utilities with more
opportunity to retain cost savings without the threat of imminent rate adjustments. However,
multi-year rate plans require detailed policy objectives at the outset. PBR encourages utilities
to make investments that have extended payback periods, which can shift the focus from
traditional capital plant investments to a longer horizon focused on designated performance
outcomes. PBR can also be designed to provide incentives and disincentives that help the
utility focus on and improve customer satisfaction, safety, reliability, and environmental
performance.
PBR should not be viewed as a mechanism to avoid increases in utility rates, since the
expected level of new capital investment, even with the deployment of new technologies, will
be significant over the coming years. PBR is best defined as a unique regulatory tool that
uses incentives to guide innovation and cost efficiencies, which may provide utility
management flexibility to choose among operational options that can lead to improved
performance and customer benefits.
The UK’s RIIO (Revenues-Incentives-Inputs-Outputs) Mechanism
Pursuant to Sec. 6u of Act 341, the MPSC has evaluated the United Kingdom’s (UK’s) RIIO performance-based regulation model and its suitability for Michigan, in whole, or in part. The
11 Hopkins, A. (2017). Utility Performance Regulation: Presentation to NASEO Western Regional Meeting. Cambridge, MA: Synapse Energy Economics.
Retrieved from: http://www.naseo.org/Data/Sites/1/events/regional/west/2017/Hopkins--Utility-Performance-Regulation.pdf
NOTE: After-the-fact and reactive review is the case for historic test years, while projected test years include some before-the-fact and proactive review.

11
main goal of RIIO is the ‘timely delivery of a sustainable energy sector at a lower cost to consumers than would be the case under the existing regimes.’12 RIIO is a framework which retains strong cost control incentives while attempting to focus on long-term performance, outputs, and outcomes, with less focus on ex-post review of investment costs.13 RIIO was intended to begin a transition away from the traditional approach of simply rewarding investment in networks under the prior regime to an outcome-based approach—a shift from inputs to outputs through revenue-based regulation overlaid with a system of financial rewards for achievement of specified goals (performance).14 U.K. regulators changed their price and revenue control mechanism to remove any bias that may normally exist between capital expenditures and operational expenses that would tend to lead utilities to prefer capital expenditures. This approach, which has been referred to as TOTEX (i.e., total expenditures),15 means there is an incentive to deliver outputs rather than simply build new infrastructure.16 As discussed later in this report, the differences between the electricity industry structure in the UK and Michigan could make some of the UK approaches difficult to replicate. However, the Commission also examined this model to assess learnings for potential application in Michigan if elements of RIIO were used to augment the current cost-of-service based regulation structure. This review is attached as Appendix B of the Commission’s study.
Key Incentive/PBR Mechanisms and Implementation in the U.S. Michigan continues to employ traditional cost-of-service methods for regulating utilities, but
has utilized incentive mechanisms, alternative methods, or performance metrics on a limited
basis over the past 30 years. Although Michigan’s utility regulatory past has not featured a
formal PBR structure, Michigan has used variations of performance mechanisms designed to
achieve improved energy efficiency, reliability, and quality and service. An ongoing issue for
policy makers addressing PBR/incentive/penalty systems has been determining whether
incentives should be applied to all phases of rates in a case or on a goal-specific basis.
Regulators must then decide how to value those incentives and penalties associated with the
chosen design based on specific goals and metrics. This report examines Michigan’s past
incentive mechanisms as well as implementation of PBR mechanisms in the United States
and other countries.
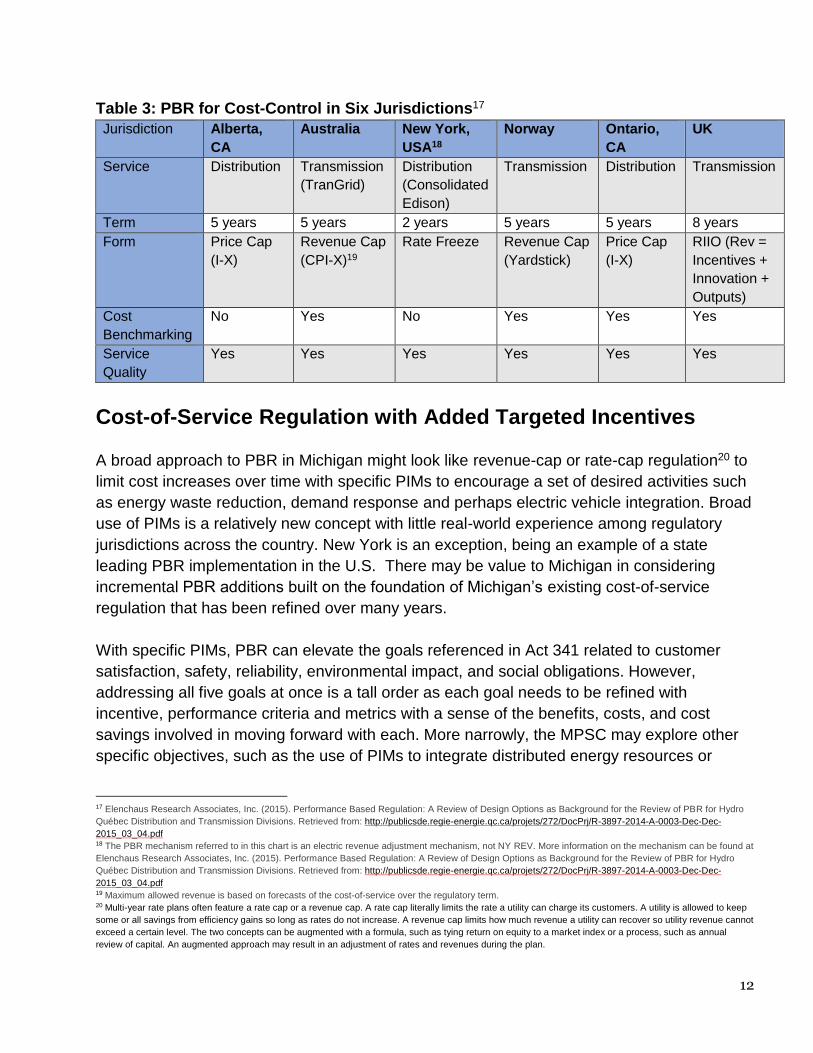
Table 3 shows PBR for cost control in six jurisdictions. This review of incentive mechanisms can be found in Appendix C. 12 Ofgem (2010): RIIO: A new way to regulate energy networks. Factsheet. Retrieved from: https://www.ofgem.gov.uk/ofgem-publications/64031/re-
wiringbritainfs.pdf 13 Littell, D., Kadoch, C., Baker, P., Bharvirkar, R., Dupuy, M., Hausauer, B., Linvill, C., Migden-Ostrander, J., Rosenow, J., Wang, X., Zinaman, O., and Logan,
J. (2017). Next-Generation Performance-Based Regulation. Golden, Colorado: National Renewable Energy Laboratory. Retrieved from:
https://www.nrel.gov/docs/fy17osti/68512.pdf. 14 Id. By “revenue-based,” we mean a method by which “target” or “allowed” revenue levels are determined by regulators and collected by means of
adjustments to prices as sales vary (as they inevitably do) from expected levels. (This is what is known as decoupling in the United States.) The allowed
revenues themselves may be periodically adjusted to deal with non-sales-related cost drivers, such as inflation, productivity improvements, and approved
changes in investment. Such changes are often formulaic in nature and embedded in multi-year regulatory plans. 15 The move to a total expenditure, or TOTEX, regime was first suggested by Ofgem in March 2008, when the energy regulator launched its RPI-X@20 review.
From this comprehensive review of the previous regulatory regime, which had endured since privatization in 1989, emerged the RIIO model. 16 Littell, D., Kadoch, C., Baker, P., Bharvirkar, R., Dupuy, M., Hausauer, B., Linvill, C., Migden-Ostrander, J., Rosenow, J., Wang, X., Zinaman, O., and Logan,
J. (2017). Next-Generation Performance-Based Regulation. Golden, Colorado: National Renewable Energy Laboratory. Retrieved from:
https://www.nrel.gov/docs/fy17osti/68512.pdf.
12
Table 3: PBR for Cost-Control in Six Jurisdictions17
Jurisdiction Alberta,
CA
Australia New York,
USA18
Norway Ontario,
CA
UK
Service Distribution Transmission
(TranGrid)
Distribution
(Consolidated
Edison)
Transmission Distribution Transmission
Term 5 years 5 years 2 years 5 years 5 years 8 years
Form Price Cap
(I-X)
Revenue Cap
(CPI-X)19
Rate Freeze Revenue Cap
(Yardstick)
Price Cap
(I-X)
RIIO (Rev =
Incentives +
Innovation +
Outputs)
Cost
Benchmarking
No Yes No Yes Yes Yes
Service
Quality
Yes Yes Yes Yes Yes Yes
Cost-of-Service Regulation with Added Targeted Incentives A broad approach to PBR in Michigan might look like revenue-cap or rate-cap regulation20 to
limit cost increases over time with specific PIMs to encourage a set of desired activities such
as energy waste reduction, demand response and perhaps electric vehicle integration. Broad
use of PIMs is a relatively new concept with little real-world experience among regulatory
jurisdictions across the country. New York is an exception, being an example of a state
leading PBR implementation in the U.S. There may be value to Michigan in considering
incremental PBR additions built on the foundation of Michigan’s existing cost-of-service
regulation that has been refined over many years.
With specific PIMs, PBR can elevate the goals referenced in Act 341 related to customer
satisfaction, safety, reliability, environmental impact, and social obligations. However,
addressing all five goals at once is a tall order as each goal needs to be refined with
incentive, performance criteria and metrics with a sense of the benefits, costs, and cost
savings involved in moving forward with each. More narrowly, the MPSC may explore other
specific objectives, such as the use of PIMs to integrate distributed energy resources or
17 Elenchaus Research Associates, Inc. (2015). Performance Based Regulation: A Review of Design Options as Background for the Review of PBR for Hydro
Québec Distribution and Transmission Divisions. Retrieved from: http://publicsde.regie-energie.qc.ca/projets/272/DocPrj/R-3897-2014-A-0003-Dec-Dec-
2015_03_04.pdf 18 The PBR mechanism referred to in this chart is an electric revenue adjustment mechanism, not NY REV. More information on the mechanism can be found at
Elenchaus Research Associates, Inc. (2015). Performance Based Regulation: A Review of Design Options as Background for the Review of PBR for Hydro
Québec Distribution and Transmission Divisions. Retrieved from: http://publicsde.regie-energie.qc.ca/projets/272/DocPrj/R-3897-2014-A-0003-Dec-Dec-
2015_03_04.pdf 19 Maximum allowed revenue is based on forecasts of the cost-of-service over the regulatory term. 20 Multi-year rate plans often feature a rate cap or a revenue cap. A rate cap literally limits the rate a utility can charge its customers. A utility is allowed to keep
some or all savings from efficiency gains so long as rates do not increase. A revenue cap limits how much revenue a utility can recover so utility revenue cannot
exceed a certain level. The two concepts can be augmented with a formula, such as tying return on equity to a market index or a process, such as annual
review of capital. An augmented approach may result in an adjustment of rates and revenues during the plan.

13
electrical vehicles in a cost-effective manner. Each effort would require stakeholder and
public input and vetting so ratepayers understand what they are being asked to pay for and
why it is valuable.
Targeted pilots could demonstrate results that could be achieved on a larger scale. In this
manner, the MPSC could determine whether or not the PIM approach is able to meaningfully
achieve the multi-faceted policy outcomes delineated in Sec. 6u of PA 341. Should pilots be
undertaken, the MPSC recommends a regulatory process with a strong stakeholder focus, as
is case with the UK’s RIIO incentive regulation system.
With these general caveats, the Commission observes that the changing power sector --
including penetration of new disruptive technologies such as decentralized supply, growth of
demand side resources, increasing intelligence and digitalization of networks -- will change
what regulation looks like in the 21st century. PBR both to control costs and integrate these
new technologies into Michigan’s grid may prove a valuable concept in the future path for
Michigan’s utility regulation. Performance Incentive Mechanisms that may work for Michigan
are further discussed below and in Appendix D.
PIM Options
Demand Response PIM
Michigan’s 2016 energy laws require the Commission to promote voluntary load
management programs such as demand response programs, time-of-use and peak pricing,
and air conditioner remote shut off. Additionally, certain utility companies are required to offer
Commission-approved demand response programs. A PIM could be used as an
implementation mechanism for some or most of these requirements and provide guidance to
utilities on achieving successful demand response program participation to meet PSC-set
performance criteria.
Regulators can use generic or utility‐specific economic and engineering studies to set
targets. Energy efficiency and demand response potential studies that were undertaken
pursuant to the energy laws can identify the level of cost-effective investments for utilities.
These studies can help regulators identify and define specific resource investment targets
and costs.21
Metrics associated with demand response depend in part on the specific goals to be
achieved. Demand response can be used for multiple purposes such as peak load reduction,
load reduction to avoid targeted infrastructure investment, displacing energy purchases
during high price periods, customer engagement, operational load management including
21 Whited, M., Woolf, T., and Napoleon, A. (2015). Utility Performance Mechanisms: A Handbook for Regulators. Synapse Energy Economics. Retrieved from: http://www.synapse-
energy.com/sites/default/files/Utility%20Performance%20Incentive%20Mechanisms%2014-098_0.pdf, p.37
14
emergency load reductions, and ancillary services to accommodate variations in net load.
Metrics should reflect whether or not the underlying policy goal is being met; e.g., if peak
demand has decreased over the prior year.22
Shared-Saving PIM for DR
By January 1, 2021, PA 341 requires the MPSC to authorize a shared savings mechanism
for an electric utility to the extent the utility has not otherwise capitalized the costs of the
EWR, conservation, demand reduction, and other waste reduction measures as follows:
a) A savings of 1 percent to 1.25 percent of the utility's total annual weather-adjusted
retail sales in megawatt hours in the previous calendar year equals a shared savings
incentive of 15 percent of the net benefits validated as a result of the programs
implemented by the electric utility related to EWR, conservation, demand reduction,
and other waste reduction, but not to exceed 20 percent of the utility's expenditures
associated with implementing EWR programs for the calendar year in which the
shared savings mechanism was authorized. The bill details how the MPSC is to
determine the net benefits.
b) At least 1.25 percent to 1.5 percent savings equals a shared savings incentive of 17.5
percent of the net benefits, with a cap of at 22.5 percent of expenditures.
c) Greater than 1.5 percent savings equals a shared savings incentive of 20 percent of
the net benefits, with a cap of 25 percent of expenditures.23
A similar shared net benefits scheme could be developed for demand response programs
that save the utility and customers’ expenditures on peak energy supply costs including the
costs of fuel, peaking capacity, and avoided transmission and distribution plant costs. The
potential for savings from demand response programs administered by the utilities is
particularly strong if specific power plant, distribution and transmission investments can be
avoided through demand-response. A shared savings mechanism ideally would provide
sufficient benefit to the utility that the utility prefers demand response solutions where
feasible to traditional capital investments in infrastructure. Shared savings from avoided
system investments can create a “profit” for the utility and a savings for customers. That said,
the savings shared with customers must be fair so there is some form of joint savings from
innovative cost-effective implementation.
With a shared net-benefit incentive structure, the utility shares with ratepayers in the benefits
associated with, and identified from, its performance and the metric achieved. This can mean
sharing in financial benefits between the utility and ratepayers. A shared net benefits
approach needs to be carefully designed and implemented to clearly identify the shared
22 Whited, M., Woolf, T., and Napoleon, A. (2015). Utility Performance Mechanisms: A Handbook for Regulators. Synapse Energy Economics. Retrieved from: http://www.synapse-
energy.com/sites/default/files/Utility%20Performance%20Incentive%20Mechanisms%2014-098_0.pdf
23 Michigan Public Service Commission. (2017). Energy Law Updates. Retrieved from: http://www.michigan.gov/mpsc/0,4639,7-159-80741---,00.html
15
benefits, ensure the utility appropriately controls costs, and that the mechanism cannot be
gamed. Implementation of shared savings schemes can be difficult because the focus on
evaluation, measurement and verification (EM&V), the concept of shared net-benefit’s
inherent imprecision, and translation to dollars can negatively impact a utility-regulatory-
ratepayer relationship. This approach relies upon accurate benefit calculations through
evaluation and measurement, and a clear EM&V plan based on objective metrics.
Positive and Negative PIMs for Optimizing CAPEX and OPEX
If a good estimate of overall capital expenditures (CAPEX) and operational expenditures
(OPEX) costs and timeframe can be set in advance through a formal proceeding, such as a
general rate case, it is possible to use a carefully designed PIM mechanism to provide
incentives and penalties for utility optimization of capital investment and operational
expenses. Such a CAPEX/OPEX mechanism would provide incentives for cost savings and
penalties for cost overruns.
While such a CAPEX/OPEX PIM could stand alone, a PIM for capital expenditures could also
be built into a cost-cap regime. Either way, the “new” capital expenditures would need to be
added into the revenue requirement cap and translated to a rate cap adder for additional
capital expenditures beyond those involved in business-as-usual operations. A focal point of
such a system is to ensure that business-as-usual capital expenditures are counted only
once in either the revenue requirement or the capital expenditure adder to avoid double
recovery of these costs. Beyond that, the critical element that would require substantial effort
up front is to establish a reasonable CAPEX budget and timeframe on which to calculate the
capital expenditure adder (or rider) that savings would be measured from using OPEX
judiciously. This would involve a substantial initial effort by the regulators and utility to
determine a reasonable capital expenditure plan over some time frame such as three, five or
eight years based on a proposed and adjudicated capital investment plan.
From a capital expenditure plan and timeframe, a series of incentives could be designed to
reward the utility for implementation under budget or ahead of schedule, and penalize the
utility with disallowances of some percentage of costs for delays or over-budget projects. As
an example, if a utility completes a set of distribution upgrades on time with savings of 10
percent from the project budget, the utility could be allowed to keep half of those savings and
half could be “returned” to ratepayers. While the symmetry of such a proposal may appear
elegant, the current system results in utilities often keeping 100 percent of any saving from a
future test year, so the utilities may not be motivated to share these saving with ratepayers.
If capital projects are managed to miss timeframes or run over budget, a penalty of
disallowing some utility recovery of expense or profit might be imposed. So, if a set of
distribution upgrades is completed 10 percent over budget, the utility may only be allowed to
recover half from ratepayers, and utility shareholders would be expected to absorb half of the
cost overruns. Again, while the symmetry of this may appear elegant, it is worth noting that

16
the risk of cost overruns is typically placed on ratepayers under traditional regulation (unless
a prudence review finds utility imprudence). For this reason, utilities likely would oppose any
disallowances for cost overruns.
The benefits to the utility of sharing in savings from optimizing capital and operation costs is
that they may be able to achieve long-term capital investment certainty over a specified time
frame such as three, five, or eight years. They also could share in benefits if the utility can
use OPEX to operate more efficiently. With that certainty, utility management can focus on
project management and implementation and assessing the least costly options to address
known system deficiencies.
Output Goals: Customer Satisfaction
PBR can focus on improving customer satisfaction and can also promote customer
empowerment. Customer empowerment is defined here as the ability of customers to provide
feedback on utility service, adopt demand-side energy options, and the ability to see publicly
reported performance data on their utility.
Case studies from around the world indicate that paying attention to customer satisfaction is
an important indicator of utility performance. And done well, these metrics can help transform
the utility business model by focusing utility attention on meeting customer needs and
preferences. Focus on customer satisfaction can range from public reporting of customer
satisfaction rankings, to metrics focused on utility customer empowerment, to public reporting
scorecards.
Output Goals: Safety
PIMs for safety generally focus on employee and public safety goals. These are usually to
require a high and improving level of both employee and public safety. Metrics in this area
are intended to provide indicators of incidents, injuries, and fatalities associated with the
contact with the electric and gas system, and adequacy of response to emergency
situations.24 Metrics associated with natural gas operations safety compliance or reducing
gas system losses could also be explored.
Output Goals: Reliability
Setting reliability goals, performance criteria, or metrics is universally recognized as desirable
since it effectuates one of the central public utility service goals: safe and reliable service. For
electric utilities, there are well established reliability metrics and benchmarking data
addressing the frequency and duration of power outages such as:
24 id.

17
SAIDI – System Average Interruption Duration Index – The average number of service
interruptions a customer served by the utility would expect to endure in a given year.
SAIFI – System Average Interruption Frequency Index – The average duration
(minutes) of service interruptions a customer served by the utility would expect to
endure in a given year.
CAIDI – Customer Average Interruption Duration Index – The average time it takes the
utility to restore service (minutes) after an outage has occurred on the system.
Governor Snyder has established goals for these reliability metrics to improve electric
distribution reliability in the state.
Even with these and other established industry metrics, defining the precise incentive or
penalties, and performance criteria can be difficult. It is important to ensure that customers
receive reasonable value and return on reliability investments. There is a point of diminishing
returns with respect to reliability investments. Low cost reliability improvements are certainly
worth pursuing, whereas expensive reliability improvements should be weighed to consider
whether consumers really desire to pay those costs to obtain the reliability benefits gained.
Output Goals: Environmental Impact
Michigan’s 2016 energy laws provided a framework to transition to cleaner sources of
electricity. Michigan is also known as a technological and industrial innovator. The breadth of
advanced energy technologies being developed and deployed makes tracking any one set of
technologies a significant challenge. But this does not mean that regulators cannot set up
accommodating utility structures to integrate advanced technologies into Michigan’s grid and
resource planning and investments. Such alternatives could present new least-cost solutions
that benefit not only individual customers, but all utility customers.
The challenge is to set up a flexible performance-based structure that encourages utilities,
third-party providers, and customers to move toward environmentally beneficial and least-
cost solutions whether those are traditional investments or more distributed options owned by

18
the utility, third party, and/or the customer. With advanced technologies entering the market
and quickly evolving in terms of cost and capabilities, it is almost impossible to determine
cost-effectiveness in advance. But regulatory structures can create “facilitated competition”
space where utilities are rewarded for acquiring competitively bid services that reduce overall
system costs. Most advanced customer-site resources (excepting distributed fossil
generators) will have an environmentally beneficial effect so it is possible to focus on
achieving the least-cost set of distributed solutions and comparing those to a set of energy
infrastructure upgrade costs.
Output Goals: Social Obligations
It is important for the regulator to be able to assess impact on low-income and vulnerable
customers, and to correspondingly assess utility response to low-to-moderate income
impacts. PBR and specific PIMs focused on these areas can help the regulator, the utility,
and other stakeholders address and empower this segment of the population. The primary
question with PBR schemes that is often raised by low-income and other consumer
advocates, is how to craft incentives that force meaningful utility action in exchange for
reasonable, but not excessive, revenues.25 There are two components to metrics in this area:
1. Protection of low-income customers and attention to payment method options,
disconnection rates, prepayment meters, etc.
2. Customer empowerment that enables vulnerable customers to pro-actively manage
their consumption and make energy bills more affordable.
Multi-Year Rate Plans
The MPSC was also charged by law to evaluate methods to increase the time between rate
cases with a view to encourage utility investments having extended payback periods and that
promote cost efficiency. Multi-year rate plans, a first effort at PBR, were first used in in the
1980s for railroads, telecommunications, and other industries facing competition and
changing demand, and were introduced for U.S. electric utilities in the 1990s. The purpose of
these plans was to motivate efficient operations and thus low-cost service while maintaining
reliability and customer service. Traditional cost-of-service regulation essentially assumes
that sales growth is a predictor of cost growth. To address this, PBR is often explicit in
allowing utilities to earn higher profits if they become more efficient by cutting cost and
continuing to provide quality service.26 The PBR construct to control costs is to set utility
revenue over a number of years and then allow the utility to retain all or some portion of cost
savings resulting from efficiency gains. The utility has a potential gain to increase earnings
and also takes on the risk that it can operate more efficiently. Multi-year rate cases are nearly
always negotiated in settlements with utilities, so any inherent risks in a negotiated
25 Thompson, A. (2016). Protecting Low-Income Ratepayers as the Electricity System Evolves. Energy Bar Association. Retrieved from: http://eba-net.org/sites/default/files/18-265-305-
Thompson%20-%20FINAL_0.pdf
26 Regulatory Assistance Project. (2000). Performance-Based Regulation for Distribution Utilities. Montpelier, VT: The Regulatory Assistance Project. Retrieved from:
http://www.raponline.org/wp-content/uploads/2016/05/rap-performancebasedregulationfordistributionutilities-2000-12.pdf, p. 35.

19
settlement are ones that the utility believes are reasonable in comparison to the potential
gain. The Commission has examined multi-year rate plans in other states as required.
Please refer to Appendix E.
PBR over multiple years should be based on projections of costs, revenues, inflation and
productivity in the future. PBR focused on cost control often takes the form of a multi-year
rate plan, with various mechanisms: productivity indexes, attrition relief mechanisms, earning
sharing mechanisms and PIMs. Without those mechanisms being in place, and without
earnings sharing mechanisms, multi-year rate plans could fail to achieve cost-control
incentives and fail to encourage increased utility productivity.27
The MPSC could test whether PIMs can be used to extend the period between general rate
cases. In doing so, it would be necessary to utilize a diverse set of target performance
mechanisms allowing for both positive incentives (rewards for good performance) and
negative incentives (for unacceptable performance). At a minimum, such PIMs would
address known potential issues arising out of multi-year rate setting periods, such as reduced
customer service and service quality that are well established as issues in many other
jurisdictions using multi-year rate plans.
Prudent PBR design in the U.K. and other U.S. States has recognized the need for a
symmetric mix of incentives, both positive and negative, to ensure utilities continuously
perform in a manner warranting annual rate increases absent the direct regulatory review
that occurs in single year rate cases prior to a rate increases being granted. The mixture of
incentives that can enhance well-established and time tested traditional regulation is different
for the priorities of each jurisdiction.
Public Reporting Mechanisms
Public reporting obligations, such as tracking specific performance criteria and metrics that
are important for Michigan’s regulatory goals, are a way to build experience with performance
metrics prior to attaching rewards or penalties. The benefit of a public report-only metric is
that regulators and utilities can implement performance metrics without attaching financial
awards to gain experience and training as the performance metrics are fine-tuned. The
establishment of a reporting obligation communicates the importance of that performance
criteria and metric to the utility, stakeholders, and the public.
The requirement that utilities track, analyze, and report specific information can encourage
different utility behavior, assist in establishing incentives attached to some or all of the
metrics, and provide transparency which may allow other stakeholders to interact in more
predictable ways with the utility that are important for supporting third-party energy service
27 Lowry, M., Woolf, T., and Schwartz, L. (2016). Performance-Based Regulation in a High Distributed Energy Resources Future. Berkley, CA: Lawrence
Berkley National Lab. Retrieved from: https://emp.lbl.gov/sites/all/files/lbnl-1004130.pdf

20
businesses and customer investments in on-site generation, demand response, or energy
waste reduction. Some of the above-mentioned PIMs could first be instituted as public
reporting only measures. Additional options Michigan might consider for a public tracking
metric include progress on green pricing programs and on-bill financing.
Green Pricing:
Under Public Act 342, electric utilities must offer customers the option to participate in a
voluntary green pricing program. Under this law, customers can specify the amount of
electricity provided to the customer that will be generated from renewable energy. Utilities
submitted proposed green pricing programs, which are under Commission review based on
criteria such as:
1. Whether different customer preferences or objectives are met;
2. How program costs are calculated;
3. How much of fees go to marketing and administration; and
4. Whether the program is based on cost-of-service principles.
A public tracking metric or metrics, based on survey results of customers enrolled in the
green pricing programs, could help the Commission and utilities identify whether customer
objectives and preferences are being met, and make clarifications or improvements.
On-Bill Financing:
Under the new energy law, rate-regulated utilities may offer residential customers the option
to finance home energy improvement projects, and the ability to pay off the costs of those
projects on their utility bill. The Commission is working with utilities and other interested
parties to create a framework for such “on-bill financing” programs. A public tracking metric
could be developed as part of this framework to enable the Commission and utilities to track
the number of improvement projects that use on-bill financing, customer savings, and
feedback from customers on various the utility offerings and implementation of this option.
Potential Applicability of Broad-Based PBR in Michigan
RIIO as Applied in the UK Would Not be Appropriate for Michigan
under Existing Market Structure
The RIIO incentive structure now in place in the UK is an evolution from the regulatory
framework that was in place before it, called RPI-X. RPI-X was itself an incentive-based
regulatory scheme, focused primarily on price and revenue caps. RIIO is a regulatory
evolution building on experience and lessons learned from many years of utilizing incentive
regulation in the UK’s utility sector. UK regulators made improvements over the course of
many years to result in the broad-based incentive PBR model now in place. The multi-year
regulatory review prior to finalization of RIIO as well as its incremental implementation were

21
critical to building stakeholder support for the reforms.28 The prior projections of efficient
future costs were an essential element of RIIO and would require a modeling and economic
projection ability beyond that currently in use in setting rates in any U.S. jurisdiction.
If Michigan were to move toward a similarly ambitious performance incentive regime it would
likely require a similar regulatory review and stakeholder engagement over a multi-year
timeframe.
Though the comprehensive RIIO process in full form is likely unrealistic for Michigan to
pursue, there are some lessons learned from RIIO that could be applicable here. First, the
UK regulators’ initial focus on cost control resulted in regulated firms cutting back on
customer service, reliability, and service quality to achieve maximum cost savings.
Regulators corrected this by implementing incentive mechanisms that focused on customer
service and service quality. Second, UK regulators learned that cost cap regulation was not
producing the kinds of consumer savings they desired and implemented shared-savings
mechanisms to balance utility and customer benefit. These types of incentive design features
are ones that Michigan could consider in a PBR scheme, even if not as broad-based a
regulator apparatus as RIIO.
In undertaking RIIO, UK regulators recognized the need for substantial new capital
investment in the utility system to replace aging infrastructure and maintain reliability and grid
services. They also recognized that the investment in the existing grid could not consist
simply of a one-for-one replacement of retiring assets if decarbonization goals were going to
be met. Thus, the regulators set innovation as one of the primary goals for incentives in RIIO.
Several innovation rewards were created including competitive awards for innovative
proposals to improve environmental performance of distribution networks and an annual
competition to fund up to 90% of costs for large-scale projects that demonstrate
environmental benefits. There are a variety of approaches that Michigan could take from
RIIO in this area, including PIMs (incremental increase in return on base revenue) or
monetary rewards for innovative projects or for replacing aging infrastructure with new,
decentralized technologies. Michigan’s traditional leadership in the automobile industry may
also lend itself to innovation in integration platforms for utility- or aggregator- models for EV
charging linked to modern distribution system investments.
As discussed earlier, the differences between the electricity industry structure in the UK and
Michigan could make some of the UK approaches difficult to replicate. The “unbundled”
nature of the electric industry in the UK with generation separate from transmission and
distribution contributes to the difficulty regulators there face in achieving environmental goals.
This structure means that UK regulators oversee network distribution companies but have
little authority over the sources of electricity supply, or how end-use consumers behave. As a
result, much of RIIO’s environmental incentives are focused on encouraging network
28
Guarini Center’s (NYU/Law) January 2015 report to the New York Public Service Commission.

22
companies to take measures that reduce environmental impacts, but does not hold network
companies accountable for a low-carbon transition. This is one potential shortcoming that
need not exist in vertically integrated states like Michigan where utilities have more direct
control over the generation fleet and therefore the environmental attributes associated with
electricity supply.
Pros and Cons of Different Approaches and Conditions for
Successful Implementation
Stand-alone PIMs are not prohibited under Michigan’s current regulatory framework. They
are available ratemaking tools as long as rates remain just and reasonable. Some PIMs,
such as cost trackers, are already a part of the regulatory framework. Trackers, an
accounting of specific costs for recovery in the next rate case or on top of approved rates,
have been used in a limited manner in Michigan in recent years. Trackers can be used to
track and reconcile specific types of expenses or investments. Trackers can reduce
regulatory lag and provide certainty on an approved investment strategy that could increase
cost efficiencies through material procurement and better workforce planning. The use of
trackers, such as uncollectible expense equalization mechanisms, have been tested at the
Court of Appeals and validated as an appropriate ratemaking tool under Michigan’s
regulatory framework. In re Application of Consumers Energy Co., 279 Mich. App. 180
(2008). Trackers are currently in place for utilities’ natural gas main pipeline replacement
programs to accelerate the replacement of at risk pipe made of vintage materials.
Another example of a PIM available under the current statutory scheme is a revenue
decoupling mechanism (RDM). RDMs are available for gas utilities; for electric utilities the
statute limits RDMs for companies with fewer than one million customers. Power supply cost
recovery (PSCR) and gas cost recovery (GCR) mechanisms (where fuel and purchased
power costs which are estimated in a plan and trued-up through a separate reconciliation
under the law) are similar to a PIM and permissible under the current regulatory framework.

23
Summary and Recommendations
This report examines PBR systems that have been implemented across the United States
and in other countries. The majority of states have maintained, at least in large part, the
traditional cost-of-service ratemaking structure. This structure, which dates from the late
1800s, has evolved over time to meet emerging issues, such as changing economic
conditions, the growth of wholesale energy markets, aging infrastructure, and evolving
consumer needs. This evolution continues today, with the introduction of advanced
technologies in the utility industry, the potential for expanding renewable and distributed
generating resources, and enhanced focus on reliability and grid resilience. States that have
implemented some form of PBR have also retained cost-of-service regulation as a
foundation.
The Commission’s review of PBR mechanisms indicates that they can be used to augment
the existing cost-of-service approach provided that they are tailored to the specific
requirements associated with utility regulation in Michigan. The Commission is mindful that
Michigan courts have repeatedly held that the “PSC’s power to fix and regulate rates does
not carry with it, explicitly or implicitly, the power to make managerial decisions.” Detroit
Edison v Michigan Public Service Commission 221 Mich App 370, 386 (1997). Consequently,
any PBR program must distinguish between the Commission’s regulatory authority to set
rates and the utility’s managerial decision-making powers. Notwithstanding, it is clear that
how rates are set – whether through traditional regulatory methods or PBR – provides strong
incentives that affect utility investments and behavior. Integrating forms of PBR into the
existing cost-of-service regulatory model could help utilities and regulators adapt to
potentially profound changes affecting the energy industry. A variety of approaches are
available.
Multi-year rate plans, for example, build on the foundation of cost-of-service regulation by
providing incentives for cost-control to the utility. PBR also has the potential to enhance
customer satisfaction through public reporting metrics on various measures of customer
satisfaction. PIM’s for demand response, shared-saving approaches, and approaches to
optimize overall capital expenditures and operating costs could complement Michigan’s
existing regulatory model if carefully designed and implemented to ensure ratepayers receive
the benefits of enhanced utility performance. PBR can also be used to encourage “non-wires”
alternatives, which may in certain applications be more cost-effective than traditional utility
capital investments in transmission or distribution upgrades such as a new substation. In any
event, well-designed PBR should include both positive incentives (rewards for good
performance) and negative incentives (for unacceptable performance such as reduced
customer service and service quality) in order to improve utility performance.
The Commission will continue to explore whether diverse PBR approaches facilitate the

24
evolution of regulated utilities in Michigan toward a more reliable, resilient grid, while
increasing value to customers. This will likely require shifting the traditional focus of
infrastructure maintenance from a like-for-like replacement of grid assets toward the
development of lower life-cycle cost, advanced technologies and practices. Regulated
utilities, under this approach, would have (in addition to their traditional role as retail energy
supplier) a stronger role of providing network services to a diverse group of users. Such an
approach will be explored in the context of current initiatives in long-term distribution
planning, energy waste reduction programs, distributed generation tariffs, interconnection
standards and processes, PURPA proceedings, and the integrated resource planning
approach recently put in place under Act 341. Such transformative changes would not be
made to the entire regulatory paradigm overnight; the Commission is more inclined to test the
efficacy of PBR through specific natural gas and electric utility pilot programs or other
targeted opportunities. This study has demonstrated that incorporation of a public process
with stakeholders and utilities is important to the success of new and innovative programs.
This is particularly the case as advanced technologies offer grid and customer values
simultaneously, and the Commission intends to keep all stakeholders engaged as it moves
forward.