report on the progress for the - paul scherrer institute · web viewreport on the progress for the...
TRANSCRIPT

R-99-05.1
Report on the Progress for the +e++ Experiment at PSI
Collaboration for the +e++ Experiment at PSINov. 2001
AbstractThis report describes the progress made in the preparation for the +e++experiment.
1. E5 Beam line studiesIn order to achieve the design goals of the detectors involved in the experiment [Ref. 1], it is also necessary to have a well understood beam transport system delivering a high intensity surface muon beam, capable of stopping in a thin target with a minimum of contaminant particles entering the detectors.Since the E5 beamline is the most intense source of surface muons, the choice was clear. However, there are two separate branches of the beamline, a "U"-branch feeding the E52-area and a "Z"-branch feeding the E51-area c.f. Fig. 1. Previous measurements on the "Z"-branch [Ref. 2], showed that a suitable number of muons could be transported to a final focus with the help of a large solenoidal magnet (PMC-magnet), after having passed a degrader, to separate the muons from the contaminant beam positrons.
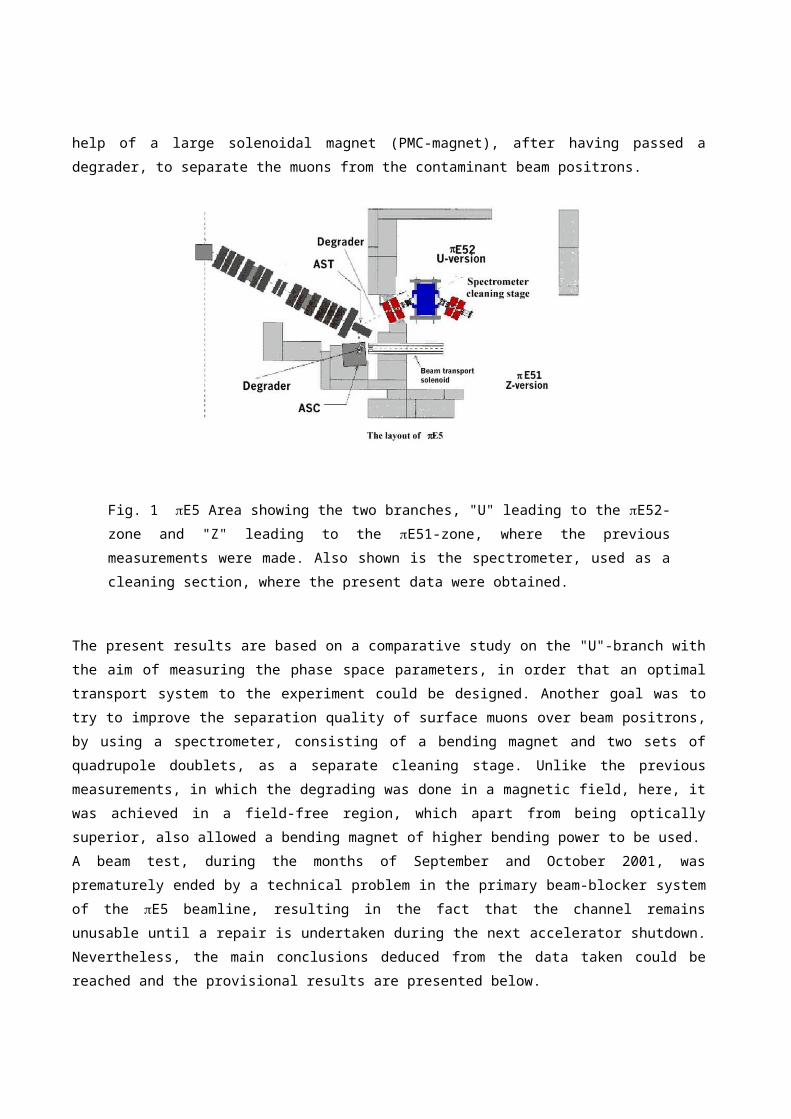
Fig. 1 E5 Area showing the two branches, "U" leading to the E52-zone and "Z" leading to the
E51-zone, where the previous measurements were made. Also shown is the spectrometer, used as a
cleaning section, where the present data were obtained.
The present results are based on a comparative study on the "U"-branch with the aim of measuring the phase space parameters, in order that an optimal transport system to the experiment could be designed. Another goal was to try to improve the separation quality of surface muons over beam positrons, by using a spectrometer, consisting of a bending magnet and two sets of quadrupole doublets, as a separate cleaning stage. Unlike the previous measurements, in which the degrading was done in a magnetic field, here, it was achieved in a field-free region, which apart from being optically superior, also allowed a bending magnet of higher bending power to be used.A beam test, during the months of September and October 2001, was prematurely ended by a technical problem in the primary beam-blocker system of the E5 beamline, resulting in the fact that the channel remains unusable until a repair is undertaken during the next accelerator shutdown. Nevertheless, the main conclusions deduced from the data taken could be reached and the provisional results are presented below.
1.1. Test beam layout
The test beam layout is shown schematically in Fig. 2. Optically the degrader system should be located at a "waist" or focus, where the beam divergences are large enough to allow the contribution from multiple scattering from the degrader foil to be appropriately small. This dictates that the location has to be in the secondary beam-blocker of "U"-

branch, just upstream of the quadrupole QSE41.
Fig. 2 Area layout, schematic and photograph, showing the spectrometer, consisting of the
quadrupole doublets QSE41/42 and QSE43/44 as well as the dipole magnet ASL52, which was
mounted on a moveable assembly running on rails. The degrader system is located upstream of
QSE41 and is not shown in the figure. A 4-micron thick differential pressure window, made of
Mylar was placed just after QSE42 in order to suppress rest-gas activation in the spectrometer. Also
shown are the detector systems used, a small "pill" scintillation counter, mounted on an X-Y
scanner. A scintillation counter telescope S1, S2, together with a large NaI(Tl)-counter. A set of fast
multi-wire proportional chambers (MWPC1/2), used for tracking, and a profile MWPC.
Since the degrader had to be inserted into a movable safety element, which had to be rotated in and out of the beam, special precautions had to be taken, necessitating the construction of a cylindrical assembly which then had to be inserted into the beam-blocker by means of a two and a half metre long rod system from the outside and locked into position. To gain access to this location and to enable the changing of the foil/collimator the ASL52 bending magnet had to be removed each time, which was achieved by mounting the magnet on an assembly which ran on rails. This operation could only be performed when the accelerator was turned off.Measurements were taken at two locations in the area, namely, at the entrance, immediately downstream of the QSE42 quadrupole magnet and at the exit window of the

spectrometer, some 50 cm after QSE44. In total, thirty-one measurements were taken under different conditions (counter type, beamline tune, momentum byte, collimator size and degrader in/out). For the degrader measurements, a foil of 450 microns of Mylar was used to separate the initial 28 MeV/c surface muons from beam positrons of the same momentum. While the positrons were virtually unaffected by the degrader, the muons reached a central momentum of close to 23 MeV/c, with still sufficient residual range to exit the final vacuum window without stopping, see Fig. 3. For all measurements a 2 mm thick, CH2-collimator with either a 50 mm or 80 mm diameter hole was located at the same point as the degrader foil. This was used to force a higher vertical divergence of the muons at the degrader during beam tuning. Unfortunately, planned measurements without this collimator could not be carried out in the end due to the technical problems with the beamline.
Fig. 3 Digital oscilloscope output from a 1mm diameter "pill" scintillator, wrapped with only 25
microns of Aluminium and positioned after the spectrometer, showing a positron line (lower red
distribution) and a muon line (upper red distribution). The intensity is proportional to the colour, red
being the highest intensity.
1.2. Measurement Techniques
Three counter systems were employed to measure the muon and electron beam intensities and profiles, as well as to determine the beam divergences. All counter signals, both time and pulse-height, were read-out event-by-event in addition to the radio-frequency (R.F.) signal of the accelerator, thus allowing both pulse-height and timing cuts to distinguish between muons and Michel and beam positrons.

Firstly, various sized "pill" scintillators, mounted on a Hammatsu metal-channel, miniature, photomultiplier(PMT) and wrapped with only 25 microns of aluminium foil, were used. These could be mounted on a remotely controllable X-Y scanner table. An example of the direct output signal from a 2 mm thick, 1 mm diameter pill scintillator is shown in Fig. 3. This demonstrates clearly that pulse-height discrimination can be used to distinguish between positrons and muons. To distinguish between Michel positrons and beam positrons the timing information from the counter, together with the R.F.-timing signal from the accelerator must be employed. Michel positrons, originating from the decay of the muon, +e+, are not beam correlated and thus have a flat time spectrum with respect to the accelerator R.F., while the beam positrons that are generated in the production target are correlated and produce a peak in the time spectrum. Secondly, a 1mm thick CH2-plate was used as a stopping target for the muons, which then decay and produced Michel positrons. These were selected by the trigger telescope counters S1,S2 and their tracks reconstructed back to the target by the chambers MWPC1/2 while their energy was measured in a large, single-crystal NaI(Tl) counter, see Fig. 4.Finally, a profile MWPC system was used to also measure the positron beam profile and divergences.
Fig. 4 Pulse-height spectrum obtained from the NaI(Tl) counter, after correction for dead-time and

track reconstruction in the MWPCs, superimposed is the Michel spectrum smeared by a 6% energy
resolution at 52 MeV.
1.3. Results - Intensities and Phase Space
All quoted provisional results1, unless otherwise stated, are normalized to 1800 A of beam current on a 6 cm long Target E and a momentum byte of 6.5 % FWHM. Measurements showed that without the degrader and a 50 mm diameter CH2-collimator, a total muon rate of:
N+ 3.5 · 108 + s-1
could be transported up to the spectrometer, whereas at the same location the beam had a total positron rate of:
Ne+ 1.6 ·109 e+ s-1
The loss factor in the spectrometer itself was found to be consistent for all measurements and amounted to a factor 2.10.1, equivalent to a transmission factor of 48 %. This loss was attributed to the inability to transmit high divergences through the spectrometer. Typical beam spot sizes after the spectrometer were 15 mm horizontally, 55 mm vertically, both FWHM, with divergences of the order of 300 mrad. horizontally and 80 mrad. vertically.With a 450 micron thick Mylar degrader, as well as an 80 mm diameter CH2-collimator, a total muon rate of only:
N+ 6.0 ·107 + s-1
could be transmitted up to the spectrometer, whereas a maximum of:
N+ 3.2 ·107 + s-1
were measured at the final focus, behind the spectrometer. A typical beam spot size at this location was 23 mm horizontally and 68 mm vertically, both FWHM. This shows that there is a total loss factor of about 11.5 between muons entering the area without a
1 The quoted values were obtained using the “pill-counter” method.

degrader and muons reaching the final focus with a degrader. However, the measurements show that already a factor of 5.5 is lost between the degrader and the entrance to the area, whereas, as mentioned above, a factor 2.1 is lost in the spectrometer. This dramatic loss of muons in the beamline between the degrader and the entrance to the area could not be improved upon, even when using a smaller diameter collimator and re-tuning. This loss, although not totally understood, is attributed to the increased vertical divergence after the degrader, due to multiple scattering. Horizontally, the divergences are large at the degrader, set by the horizontal focusing properties of the sector magnet AST41, whereas vertically it is only constrained by the inserted CH2-collimator. A muon momentum scan of the kinematic edge of pion decay (29.79 MeV/c), gave the central beam momentum as 1.3% higher than the assumed value.
1.4. Results - Separation Quality
From the analysis of data taken while scanning the muon beam spot after the spectrometer, using a small pill-counter mounted on a remotely controlled X-Y table. The different beam constituents could be determined by applying pulse-height and timing cuts to the offline data. The results are shown in Fig. 5. As expected, the suppression of beam positrons is very good, at the peak of the muon distribution the suppression factor is 16.5, with a gently increasing contribution as one goes to higher momenta i.e. lower x-values. Below x = 190 mm the distributions drop again, this is artificial and due to an acceptance cut-off in the spectrometer. The total suppression factor for beam positrons is approximately 90, however, with suitable collimation a factor of more than 300 could be envisaged.

Fig. 5 Offline results from a scan of the muon beam profile, post spectrometer, using a pill-counter.
Shown horizontally is the scanner position in millimetres. Vertically the normalized counts are
shown. The muon beam profile is shown relative to the contaminant positron distributions from
beam positrons (red) and decay positrons i.e. Michel positrons (green). The positron distributions
below x = 190 mm are cut-off due to the spectrometer acceptance. High beam momenta correspond
to low x-value.
Unfortunately, as is apparent from Fig. 5 there is a large decay positron background present, the origin of this requires further investigation. A part of these Michel positrons come from muon stops in the material close to the scintillator (e.g. holder and PMT) these events should follow the same shape as the muon peak. Since the decay positrons also show the same cut-off behaviour as the beam positrons, it is assumed that the majority come from upstream of the spectrometer. Their source is probably correlated in part to the factor 5.5 loss after the degrader and in part to the factor 2.1 loss in the spectrometer. A contribution from the CH2-collimator, at the degrader location, is also expected. However, this latter effect could not be tested due to the technical problem with the beamline.
1.5. U/Z-Branch Comparison
shows comparative values measured in the "Z"-branch [Ref. 2] and the "U"-branch (present evaluation). The numbers from [Ref. 2] have been scaled to 1800 A and already constitute the maximum momentum byte and a 6 cm Target E.
Condition "Z"-branch "U"-branchNo Degrader, Transmitted to Zone 3.6 ·108 +s-1
6.0 ·108 e+s-1
3.5 ·108 +s-1
1.6 · 109 e+s-1
Degrader, at Final Focus 2.0 ·108 +s-1 3.2 ·107 +s-1
/e ratio at Muon Peak 9 16.5
Table 1 Comparison of "U"- and "Z"-branches for various conditions
The numbers indicate that without a degrader the muon intensities are the same, whereas in the "U"-branch the beam positron contamination seems to be more than 2.5

times higher than in the "Z"-branch. The beam positron suppression factor is clearly better in the "U"-branch, using a spectrometer. The absolute difference in muon intensities at the final focus is more than a factor of 6, in favour of the "Z"-branch.
1.6. Preliminary Conclusions
The transmitted surface muon intensities in both of the E5 branches are equivalent without a degrader, however, the beam positron contamination seems to be more than a factor of 2.5 times higher in the "U"-branch. The use of a spectrometer in this branch causes a loss of about a factor 2.1 in muon intensity, irrespective of condition. This could, in principle, be reduced, by reducing the overall length of the spectrometer such that the higher divergences, which seem to be the ones associated with the loss, would have a better chance of being transmitted.The situation with a degrader shows a dramatic loss in muon intensity of a factor 5.5, already in front of the spectrometer. This loss, although not totally understood at present, is most likely due to the increased vertical divergence introduced by the multiple scattering of the degrader foil. This is unlikely to be solved in the future. The absolute rate at the final focus compared with the "Z"-branch is more than a factor of 6 lower. The separation quality of beam positrons however, is superior on using a spectrometer.Owing to the large loss of muons with the degrader in, an extra background of decay positrons was present and significant. Measurements suggest that a substantial part of these Michel positrons have their origin upstream of the spectrometer. This requires further investigation.
Before a final beam transport solution can be decided on further simulations and a further test run are needed in order to assess the potential of using an electrostatic separator in the "U"-branch, instead of a degrader, and the use of a short solenoid in the "Z"-branch.
2. Superconducting solenoidal magnetThe design of the COBRA magnet is currently being finalized, while all the superconducting cable was delivered and the winding has already started. The COBRA magnet now implements compensation coils as shown in Fig. 6 to reduce the residual field around the liquid xenon calorimeter for a proper operation of the photomultipliers (PMT) [Ref. 4]. Two large loop-coils with a diameter of 240cm are adopted as the compensation coils. The magnetic field around the calorimeter can be canceled effectively by the compensation coils because the shape of the flux line distribution

produced by the compensation coils is very similar to that produced by the main magnet in the calorimeter region.
Fig. 6 Schematic view of the COBRA magnet with the compensation coils. Other detector
components are also shown.
Fig. 7 Contour plot of the magnetic field produced by the COBRA magnet with the compensation

coils. A box in the calorimeter region shows the surface of the liquid xenon where the PMTs are
arranged. Note that the intervals of the contour are not linear.
Fig. 7 shows the contour plot of the magnet field where we can see that the magnetic field is below 50 Gauss, which is the maximum permissible level for the PMTs, almost over the entire calorimeter region, while giving a negligible effect inside the main solenoid where the positron trajectories are measured. It was also confirmed that the essential features such as the constant bending radius and fast sweeping out of the low energy positrons is preserved in this design.
The layout of the magnet in the current design is shown in Fig. 8. The main magnet consists of five solenoidal coils with three different diameters and is technically easier to construct than the sand-glass shaped magnet considered in the proposal [Ref. 1]. The adoption of this new step structure does not however influence the performance of the positron spectrometer at all.
Fig. 8 The layout of the COBRA magnet. The dimensions are measured in cm.
All the superconducting cable needed for the coil of the COBRA magnet was fabricated and delivered. The performance of the fabricated cable was measured at around 4 K. Fig. 9 shows the measured critical current as a function of the applied magnetic field. The operating current and peak value of the magnetic field of the COBRA magnet will be 360 A and 1.7 T, respectively. The operating point is also shown in the same figure. Since the

operating temperature of the coil is estimated to be about 5 K, this figure indicates that the cable has a safety margin of around 30% compared to the operating condition of the COBRA magnet.
Fig. 9 Critical current as a function of the applied magnetic field. The operating point for the
COBRA magnet is also shown.
We have started the mechanical analysis of the magnet by the finite element method to finalize the engineering design prior to its construction . Fig. 10 shows the stress distribution in the coils in the central region. In this calculation each coil is supported by a thin aluminum cylinder. The maximum stress is 250 MPa, which is below the maximum allowed stress. The electromagnetic force acting on the coil is also within the acceptable range (Fig. 11).

Fig. 10 Stress distribution in the coil.
Fig. 11 Electromagnetic force acting on the coil. The values indicate the strength of the force per
unit length integrated along the circumferential direction.
The magnetic field calculations taking into account the realistic condition in the experimental area at PSI were also made. The analysis shows that additional magnetic field produced by the muon transport magnet around the calorimeter is much smaller than the residual field by the COBRA magnet and the electromagnetic force between the COBRA magnet and the transport magnet is small enough to manage with an ordinary support structure.
The winding of the coils has already started and construction of the cryostat will start soon. Following the assembly of the coils and the cryostat, the construction of the magnet is expected to be finished by the end of the year 2002.
3. Liquid xenon photon detectorR&D works of the liquid xenon photon detector is in progress using the large prototype. After successful construction of the vessel as reported in the previous progress report [Ref. 4], various kinds of tests have been performed to establish the fundamental techniques for stable detector operation and to investigate the detector performance. In parallel, preparation of a dedicated experiment to measure the absorption length is under way [Ref. 3]. A Monte Carlo study of the final detector is also in progress together with the

design work of the final detector vessel.
3.1. Large prototype
The photomultipliers (PMTs) were assembled in a rectangular frame as shown in Fig. 12 (left). The active volume of the detector is 69 liter, which is viewed by 224 PMTs. LEDs and alpha sources (241Am) are located on the frame for PMT calibration.
Fig. 12 PMTs assembled in a rectangular shape (left). The PMTs are installed in the cooling vessel
(right).
After installing the PMTs in the cooling vessel as shown in Fig. 12 (right), we have been examining:1) Performance of the pulse-tube refrigerator and other detector components;2) Absorption length of the scintillation light in liquid xenon by means of cosmic rays; 3) Energy, position, and timing resolutions of the detector using a high energy gamma
beam, each of which is described in turn in the following sections.
3.1.1. Performance of the refrigerator and other detector components
Initially, the cryogenic performance with the PMT heat load was evaluated after filling the vessel. The intrinsic cooling power of the refrigerator had been measured to be 70W2 at around 165K. By measuring the power consumption of the heater equipped to compensate the extra cooling power of the refrigerator, the total heat load was evaluated to be 52W including thermal inflow via radiation and conduction, and a heat load from PMT bleeder circuits. Considering the heat load from PMTs (18W) and the heat conduction
2 The cooling power of the refrigerator is currently limited by the power of the compressor.

through signal and HV cables (10W), we can conclude that the static heat load of the vessel alone is 24W, which is small and as designed. The result of these measurements will be of importance when we design the final detector vessel. Using a simple estimate, the above result implies that the heat load in the final detector will be 161W, which can be handled by a single pulse-tube refrigerator with upgraded cooling power. We are planning to employ two pulse-tube refrigerators with 250W cooling power for xenon recondensation during a stable detector operation, and possibly for pre-cooling of the vessel and xenon liquefaction at the startup of the detector. During the studies using the large prototype, pre-cooling of the vessel and PMTs, and liquefaction of xenon was achieved by using liquid nitrogen since the cooling power of the present refrigerator was not sufficient to both cool and liquefy efficiently. However, in the final detector this process can be managed without using liquid nitrogen if we operate both of the refrigerators, which will make the handling of the detector system much simpler and also more reliable. R&D to upgrade the cooling power of the pulse tube refrigerator is in progress, where the shape of the pulse-tube is modified from a co-axial to a Ushape, which is expected to increase the cooling power to above 250 W.The operation of the pulse-tube refrigerator has proved to be very successful and has not posed any serious problem during more than 50 days of the large prototype studies. To assure a long term stable operation under real experimental conditions, a further study to optimize the operating condition (pressure and temperature) is also under way.
Most of the new detector components we introduced in the large prototype, such as feedthrough connectors for signal and HV cables, sensors to monitor the temperature, pressure, and surface level of liquid xenon, PMT support structure made of low-Z material worked reasonably well, thus proved to be directly applicable to the final detector. However just a few posed some problems: e.g. silicon rubber filler for the PMTs.
For the PMTs aligned at the entrance wall, a gap between the PMT glass stem and the bleeder circuit board has to be filled with certain material to prevent liquid xenon from leaking in and causing unwanted photon conversions there. For this purpose silicon RTV rubber had been used. However, after a few cooling tests, some PMTs with the filler seemed to receive tiny cracks at the glass stem due to the difference of the thermal expansion rates between the glass stem and the filler, and became inoperative during the detector tests. In order to solve this problem, a new filler material, epoxy (STYCAST 1266/A) mixed with glass beads (0.5 mm diameter), which has a similar thermal index to glass, is now being tested.

3.1.2. Studies with cosmic rays
Cosmic rays have been measured with the large prototype detector. The aim of the measurement was twofold: (1) to examine the detector response and its stability under the real conditions of detector operation, and (2) to evaluate the absorption length of the scintillation light inside liquid xenon, which influences the energy resolution of the detector (See Section 3.2.1). Three pairs of trigger counters with 10 cm 10 cm plastic scinitillators were located above and below the cooling vessel to trigger cosmic ray events. The total yield of scintillation light observed by all PMTs will change depending on the absorption length and on the incident position of the cosmic rays. Comparing the data to a Monte Carlo prediction, taking into account light absorption, it is possibly extract information about the absorption length. Fig. 13 shows a typical distribution of the total light yield for cosmic rays passing through the middle of the detector. Analysis of the cosmic ray data is still in progress.
In parallel, as reported before, a preparation of a dedicated experiment to measure the absorption length is under way at Novosibirsk. Construction of the setup has been completed and a liquefaction test will be started soon.
Fig. 13 A typical distribution of total light yield for cosmic rays passing the middle of the detector.
Superimposed is the best fit with a Landau distribution function .
3.1.3. Studies with a photon beamThe first of a series of the measurements using a photon beam from inverse Compton scattering at the TERAS electron storage ring [Ref. 4] was carried out in May, 2001, to have first experiences in measuring high energy (up to 40MeV) gamma rays for later

examinations of the detector performance. The first photon beam test, unfortunately, suffered two major problems, which made the evaluation of the obtained data rather difficult. The first problem was the one with the PMT filler described in 3.1.1. It caused some of the PMTs on the front wall to become inoperative. This had a fatal consequence for the measurements, as the front PMTs receive most of the scintillation light and are indispensable for photon measurements. This problem is being resolved by replacing the filler material, as already described. The other problem was a hardware one (noisy amplifiers in the ADCs) in the DAQ system that, with all possible efforts made, could not be fixed during the scheduled beam time. This problem, which was identified and solved after the beam test, made many of the ADC channels too noisy. In spite of these major problems , we tried to make a very crude evaluation of the detector performance, which is described below. This practice of evaluating the detector performance is important in understanding and surmounting obstacles so that final, ultimate resolutions can be obtained in future measurements. The values quoted below therefore should not be taken as final -- they will be improved in a series of future measurements. Unfortunately, the second beam test that had been scheduled for September -- October, 2001, had to be postponed due to a serious problem in the electron gun of the accelerator, and is now foreseen to take place at the beginning of 2002.
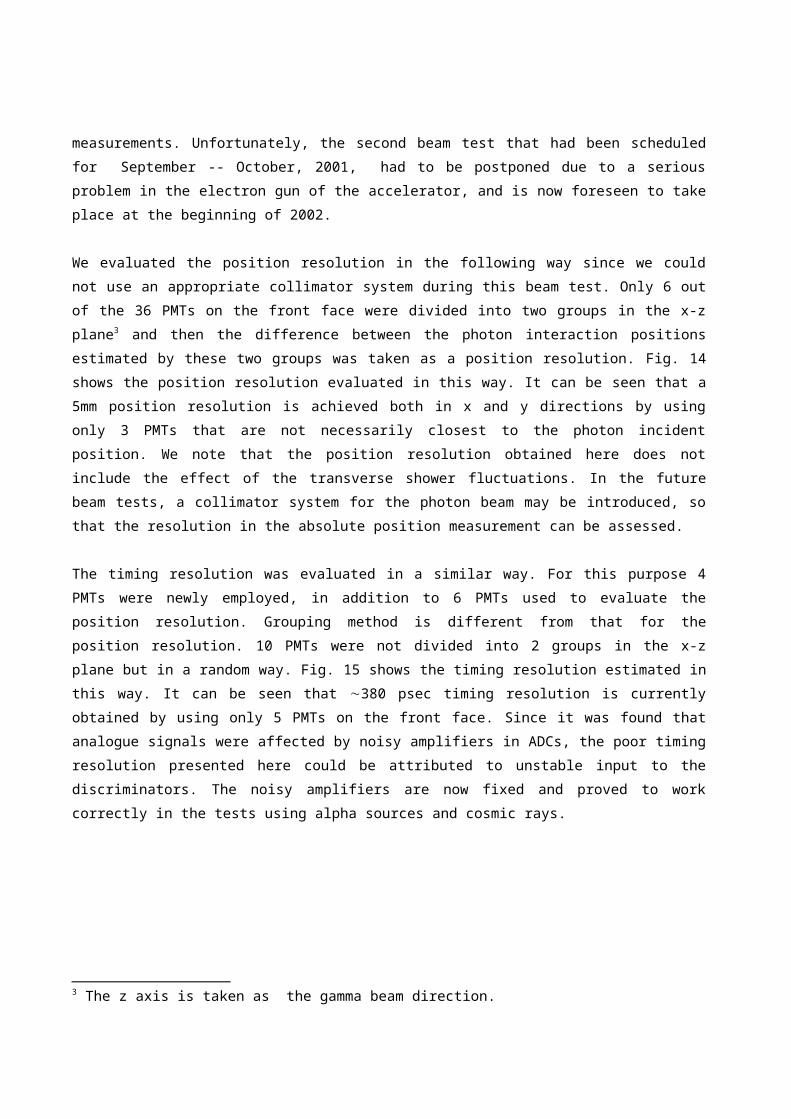
We evaluated the position resolution in the following way since we could not use an appropriate collimator system during this beam test. Only 6 out of the 36 PMTs on the front face were divided into two groups in the x-z plane3 and then the difference between the photon interaction positions estimated by these two groups was taken as a position resolution. Fig. 14 shows the position resolution evaluated in this way. It can be seen that a 5mm position resolution is achieved both in x and y directions by using only 3 PMTs that are not necessarily closest to the photon incident position. We note that the position resolution obtained here does not include the effect of the transverse shower fluctuations. In the future beam tests, a collimator system for the photon beam may be introduced, so that the resolution in the absolute position measurement can be assessed.
The timing resolution was evaluated in a similar way. For this purpose 4 PMTs were newly employed, in addition to 6 PMTs used to evaluate the position resolution. Grouping method is different from that for the position resolution. 10 PMTs were not divided into 2 groups in the x-z plane but in a random way. Fig. 15 shows the timing resolution estimated in this way. It can be seen that 380 psec timing resolution is currently
3 The z axis is taken as the gamma beam direction.

obtained by using only 5 PMTs on the front face. Since it was found that analogue signals were affected by noisy amplifiers in ADCs, the poor timing resolution presented here could be attributed to unstable input to the discriminators. The noisy amplifiers are now fixed and proved to work correctly in the tests using alpha sources and cosmic rays.
Fig. 14 The position resolution obtained in the photon beam test. The x-y plane is perpendicular to
the beam direction. The evaluated resolution is very preliminary.
Fig. 15 The timing resolution obtained in the photon beam test. The resolution was evaluated using
10 PMTs after ADC slewing corrections.
3.2. Final Detector Design
3.2.1. Monte Carlo simulation

A framework for a Monte Carlo simulation of the whole experiment has been set up, based on GEANT3, for various studies of the experimental performances. Especially for the liquid xenon photon detector, two independent simulation codes have been prepared to simulate scintillation photons from the gamma ray interactions and their propagation, scattering and absorption inside xenon. The results of these two simulations are currently being analyzed and closely compared by applying and tuning various reconstruction programs. An effort to implement the results of the large prototype measurements, by comparing the scintillation simulations with the actual measurements, is also being made.
It is generally reconfirmed that the position measurements are much less dependent on the absorption of the scintillation light inside xenon, while the energy measurement is more sensitive and a clever reconstruction algorithm would be required if the absorption length is shorter. Thus a good knowledge of the absorption length is indispensable to assess the final detector performance. These simulation studies are still in progress and the results of these studies will be summarized in a separate report when they become available.
3.2.2. CalibrationDuring cosmic ray tests with the large prototype, the PMT gains have been adjusted with an accuracy of 3% using LEDs immersed in xenon. The relative quantum efficiency and gains are monitored using alpha sources located at fixed positions on the PMT frame as in the small prototype [Ref. 1]. In the final photon detector, the following methods are considered to be additionally implemented for the PMT calibration:1) A 2D movable alpha source: A metal piece on which an alpha source is mounted, is
supported by two wires crossing at right angles. The piece has two holes through which the two wires are placed, allowing it to slid on them. The wire positions are controlled by moving, small, coupling electromagnets, located outside the vessel, thus enabling the control of the alpha source position in front of the PMT windows on the inner surface. Design work of the prototype of this scheme is in progress. The system has to be tested at low temperature to confirm that the source position is controlled precisely enough for the PMT calibration.
2) Line-type radioactive source: This kind of radioactive source is commonly used in medical applications. The sources will be stretched along the center of adjacent PMT windows of the arrays. Thus each PMT can view same amount of light, which makes it possible to calibrate the relative gain and quantum efficiencies. The radioactive
material and intensity of the source have to be carefully studied.
For absolute energy calibration and for evaluating the detector resolutions it is planned to detect gamma rays from 0 s produced through a charge exchange process, -+p n+0. For this purpose another photon detector is required on the opposite side of the liquid xenon detector. The energy and position resolutions can be evaluated using the gamma-ray energy spectrum and constraint that 0s should decay on the target. The timing resolution will be improved and evaluated as well as that of the positron timing counter using radiative muon decays.
3.2.3. Design work of the final detector vessel
We have started design work of the vessel for the final photon detector based on the experiences obtained with the large prototype. A simple estimation shows that the heat load in the final detector will be 161W, which can be covered by an upgraded pulse-tube refrigerator. R&D work on the inner front window has also been started. We are investigating the performance of a thin carbon -fiber window to be used in the inner front surface of the photon detector instead of the aluminum honeycomb window described in the proposal.
4. Timing counterWe built and tested several timing counter prototypes made of 1 meter long BC404 scintillatior bars (cross section 5 cm 1 cm), wrapped with 50 m of aluminized Mylar and coupled to PMTs through light guides at the two opposite ends. We used Philips XP2020 UR (2'', 470 ps transit time spread) and Hamamatsu R5946 fine mesh (1.5'', same t.t.s. as the Philips ones) PMTs and tested several shapes of light guides.
We studied the timing properties of these counters by means of cosmic ray muons. Since the rate of these muons is relatively low and it is necessary to correct for position dependent effects, we set up a telescope of eight Microstrip Gas Chambers (the same devices tested at PSI for the CMS experiment), four of which have strips at a small angle (5.7) with respect to the other four, thus providing the 3D position of four hits along the muon track (see Fig. 16). The dimensions of each chamber are 10 cm 10 cm. The impact point of one muon along the counter prototype was reconstructed with a resolution better than 1 mm.

Fig. 16 Layout of the MSGC tracking system for Timing Counter studies.
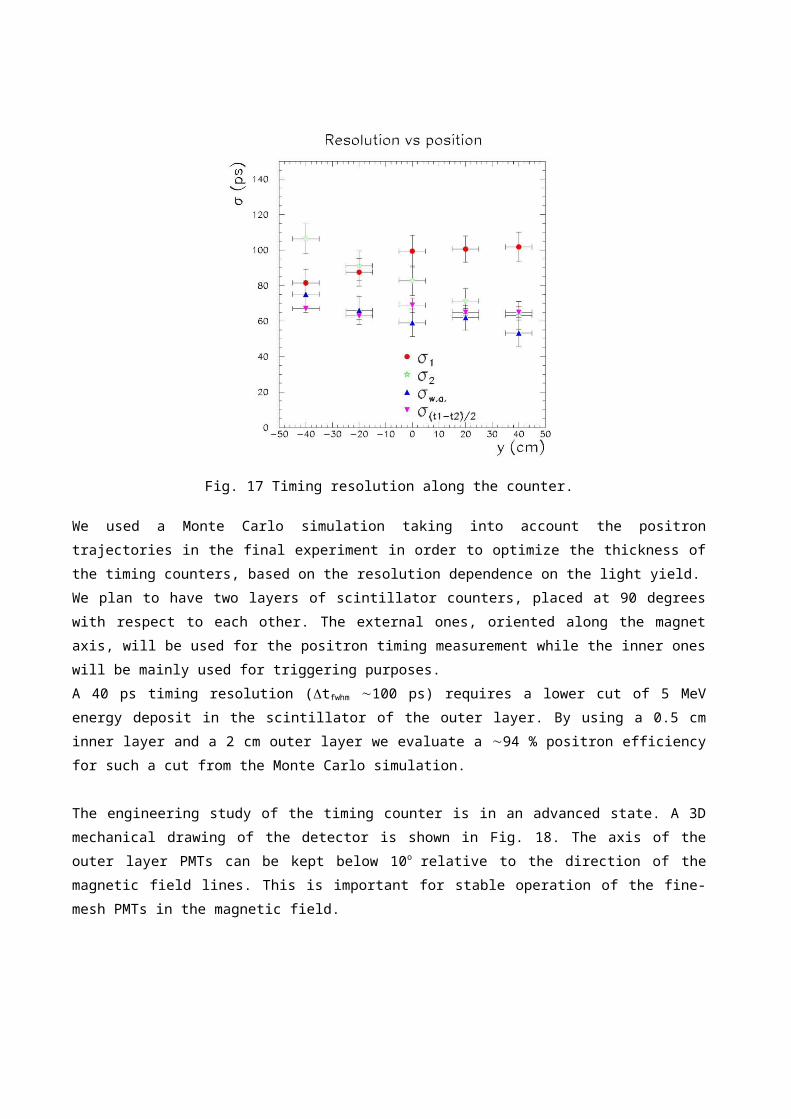
The muon timing (relative to a reference counter) is independently measured by each of the two PMTs of the counter, after correcting for ‘’time walk’’ effects. As shown in Fig. 17, the weighted average of the two measurements turns out to be 60 ps, independently of the position along the counter. We checked that the timing resolution depends on the square root of the total number of photoelectrons produced by the muon passage in the counter (1 cm of scintillator traversed) by tilting the counter, thus increasing the muon path in the scintillator.

Fig. 17 Timing resolution along the counter.
We used a Monte Carlo simulation taking into account the positron trajectories in the final experiment in order to optimize the thickness of the timing counters, based on the resolution dependence on the light yield.We plan to have two layers of scintillator counters, placed at 90 degrees with respect to each other. The external ones, oriented along the magnet axis, will be used for the positron timing measurement while the inner ones will be mainly used for triggering purposes.A 40 ps timing resolution (tfwhm 100 ps) requires a lower cut of 5 MeV energy deposit in the scintillator of the outer layer. By using a 0.5 cm inner layer and a 2 cm outer layer we evaluate a 94 % positron efficiency for such a cut from the Monte Carlo simulation.
The engineering study of the timing counter is in an advanced state. A 3D mechanical drawing of the detector is shown in Fig. 18. The axis of the outer layer PMTs can be kept below 10o relative to the direction of the magnetic field lines. This is important for stable operation of the fine-mesh PMTs in the magnetic field.
Fig. 18 3D mechanical drawing of the Timing Counter.
5. Drift chamber prototypeThe first test chamber built at PSI has shown that the main mechanical problem (open frame on the target side) can be solved. A second set of test chamber modules is under

construction and will be used to study and optimize the chamber features listed below:1) Cathode readout: replacement of the common, unused middle cathode by two
separated cathodes using the same readout scheme as the outer cathodes2) Charge division: study of the wave impedance of the anode wires, in order, to better
match the readout prints and pre-amps.3) Gas amplification: adaptation of the chamber geometry to, the dipole magnet used
to study the gas amplification in the magnetic field and to, a set-up which allows one to measure the trajectory of cosmic muons in the laboratory.
6. Trigger electronics 6.1. The rate
In the previous progress report [Ref. 4] we described the simple selection criteria for the e event, studied by means of a Monte Carlo simulation, that can reduce the data acquisition rate due to the accidental background, to the acceptable rate of 20Hz. This rate gives us some margin in case of other possible backgrounds that are not taken into account in the simulation. Different algorithms to keep other possible sources of background under control are currently under study.
The physical quantities used by the trigger are the photon energy, conversion point and timing, the positron direction and timing.
6.2. The system
Today's high density Field Programmable Gate Arrays (FPGAs) coupled with fast Flash Analog to Digital Converters (FADCs) clocked at 100MHz, are able to implement the algorithms required to evaluate the physical quantities indicated above at the trigger level.
The hardware digital approach, coupled with the FPGAs programmability, allows a simple system design and is at the same time extremely powerful and flexible. We are currently designing a trigger system based on two different electronics boards only. A first board (Type1) receives and digitizes the PMT signals, preprocesses the digitized waveforms and transmits information through LVDS connections to a second board (Type2), which completes the triggering algorithms. The Board Type2 communicates with other boards through LVDS connections too.
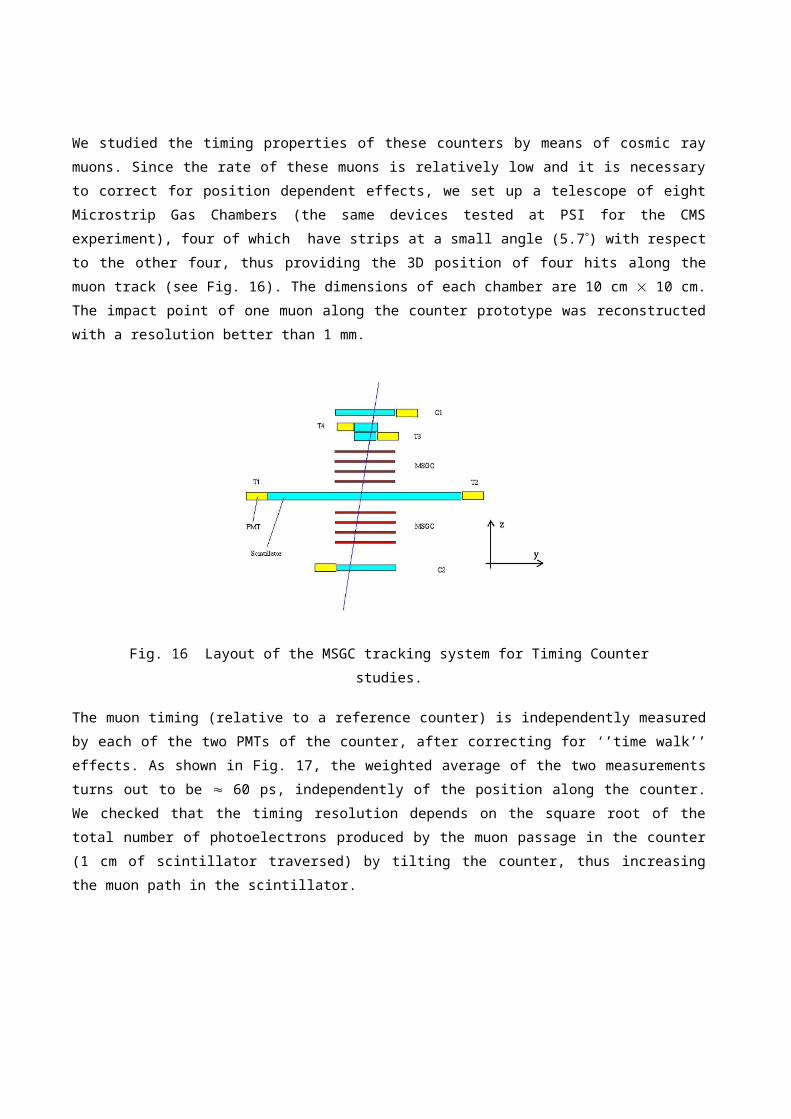
Fig. 19 The trigger system structure: the 2 board types are used for the photon calorimeter and for
the positron tracker. The boards are arranged in a tree structure.
These two types of boards are arranged in a tree structure, as shown in Fig. 19. The Type1 board is a VME 6U circuit which accommodates 16 FADCs, while board Type2 is a VME 9U circuit with only digital inputs and outputs.
As indicated by the simulations the inner photon detector face needs, for a good trigger performance, one FADC per PMT while for the lateral and outer faces a 4-PMT-to-one-FADC fan-in should be tolerable. In this scheme the entire system can be arranged into 3 VME crates (two standard 6U and one 9U), for a total of 42 Type1 and 6 Type2 boards. The trigger system needs to be operated synchronously. For this reason the 100MHz clock is distributed by means of Delay Locked Loop components. The total trigger latency is 350ns; this delay can easily be accommodated in the memory depth of the main waveform digitizer of the experiment.
6.3. Short description of the boards functions
The core of the system is the new generation of high density FPGAs: the selected ones are the Virtex-E Xilinx devices with an Extended Memory feature.
Board Type1 contains 16 FADCs, one FPGA, a control section, and 2 LVDS output connections, for a total throughput rate of 2 5 Gbits/s. The Type1 boards have three distinct configurations accordingly to the sub-detector to which they are connected (see Fig. 19). The FPGA for the inner photon detector face implements the following functions:
4) buffering of 16 PMT channels signals;
5) equalization of the PMT gains and, if needed, correction for PMT non linearity by means of Look Up Tables;
6) evaluation of each PMT baseline, and its subtraction from the corresponding signal; 7) search for the PMT corresponding to the maximum signal amplitude;8) sum of the total collected charge;9) definition of the signal timing with a precision of one fifth of the clock period; 10) control and debug capability of the data flow;
The boards configuration for the other photon detector faces is similar to this but functions 4) and 6) are not required. The boards for the timing counter have a hit cluster finding algorithm that replaces functions 4), 5) and 6).
Board Type2 contains 2 FPGAs, a control section, 10 input, and 2 output LVDS connections, each one with a throughput rate of 5 Gbits/s. The 6 Type2 boards have 4 different FPGA configurations reflecting their different use in the trigger system. The algorithms that these FPGAs should implement are mainly a subset of those enumerated for the board Type1. The chosen board size (VME 9U) is large enough to easily solve the signals routing on the printed circuit, without compromising the signals timing.
6.4. Present status
The FPGA configurations for Type1 boards are designed and simulated, and all the requirements for the photon detector board are met. Selection of the components for the first two prototype boards has finished . The printed circuit design of the board Type1 is in progress. The components for one Type1 and Type2 boards were already purchased.
7. HV and slow control systemExperiments with the complexity of muegamma need a reliable and integrated control of variables such as temperature, pressure, and high voltage, commonly referred to as "slow control". A constant monitoring of these values, integrated into the main data acquisition system, is crucial to ensure long-term stability of the experiment during data taking in the upcoming years.
To achieve these requirements, a new slow control system is currently under development at PSI [Ref. 5]. This system uses a RS485 network with dedicated slow control nodes containing microcontrollers with both analog-to-digital and digital-to-analog converters,

thus allowing a distributed acquisition and control of slow control parameters. A prototype of this system has been implemented and successfully tested at a PSI drift chamber test facility. The final system design is now fixed and under production. The next step will be the control of the muegamma liquid xenon photon detector and the superconducting solenoidal magnet using this system.
Based on the slow control system a high voltage power supply for PMTs is under development. This system is not only cheaper by a factor of four compared to commercial units, but also the high voltage stability and accuracy of 0.3V over the full temperature range is significantly better than in other systems, which is crucial in a high resolution calorimeter. A first prototype with 12 channels was successfully tested, the full system with 1200 channels is now in production.
ReferencesRef. 1 PSI Proposal R-99.05.1, "Search for e down to 10-14 branching ratio", May 1999.
Ref. 2 Update & Supplement to LOI R-98-05.0/1, BV29, July 1999.
Ref. 3 e+ progress report, June 2000
Ref. 4 e+ progress report, Jan 2001
Ref. 5 http://midas.psi.ch/mscb