report on the physical nature of the victorian fire ...on... · physical nature of the victorian...
TRANSCRIPT

Report on the Physical Nature of the Victorian Fires
occurring on 7th February 2009
A report prepared by: Dr Kevin Tolhurst Senior Lecturer, Fire Ecology and Management Department of Forest and Ecosystem Science University of Melbourne, Water Street, Creswick, Victoria. Dated: 15th May 2009
This report has been written in response to the request by the Counsel Assisting the Royal Commission (letter dated 1 May 2009).

Tolhurst (2009) “Describing The Black Saturday Fires”
Report on the Physical Nature of the Victorian Fires occurring on 7th February 2009 Dr Kevin Tolhurst, 15th May 2009 This report has been written in response to the request by the Counsel Assisting the Royal Commission (letter dated 1 May 2009). Specifically, the request was to provide a written report, “which describes in general terms the major aspects of the behaviour of the fires including:
(i) the intensity of the fires (energy consumed); (ii) rate of spread; (iii) radiant heat and spotting; (iv) a comparison with the behaviour of other major fires (for example the Ash
Wednesday fires) to the extent that you are able to make comparisons with the available data, with the time allowed for the delivery of your report; and
(v) Identification of the challenges that the scale and intensity fires of 7 February 2009 presented for fire management at the incident control level.”
Preface At the time of preparing this report, a comprehensive analysis of the weather conditions across the State (by the Bureau of Meteorology) and the behaviour of the fires (by the Bushfire CRC on behalf of the Country Fire Authority and the Department of Sustainability and Environment, Victoria) have not been completed. These analyses and other eyewitness accounts will provide more detail than can be achieved at this point in time by the author. This report is based on personal knowledge of the fires during and after the event, intelligence gathered during the fire whilst performing the duty of a Fire Behaviour Specialist, and • Video footage recorded by Simon Langdon, Managing Director, EYEfi Pty. Ltd.
from a camera located at Mt Poley, 12 km south of Marysville and 23 km east of Healesville.
• Video footage recorded by Daryl Hull in Marysville. • Still photographs taken by Jacqueline Brooks, from Harvest Close, Romsey, 20 km
west-south-west of Kilmore. • Various records of fire reports collated by the Country Fire Authority and
presented in Google Earth format (4D_STAR_2009_05_12.kmz)
Report on the Physical Nature of the Victorian Fire occurring on 7th February 2009.doc Page 2 of 18

Tolhurst (2009) “Describing The Black Saturday Fires”
The Nature of Fire Behaviour Fire behaviour is determined by the interaction of four primary factors: fuel, weather, topography and the fire itself. Diagrammatically, this is shown in Fig. 1.
FuelFuel
Wea
ther
Wea
ther
FireFire
Topography
Topography
Fire Behaviour TriangleFire Behaviour Triangle Figure 1. Factors important in determining bushfire behaviour. Each element is
affected by and in turn affects each other element.
Weather Elements of the weather critical to fire behaviour include predisposing seasonal conditions such as drought, shorter-term episodic events like heat waves and storms, dynamic situations such as periods of extreme temperature combined with low air moistures and strong winds, and atmospheric patterns such as the passage of low pressure troughs and cold fronts across the landscape. In the case of the fires in 2009, parts of Victoria have had significantly below the average rainfall for 13 years, a very severe drought. Most of Victoria had the driest period on record or in the lowest one percentile of records (Fig. 2). Prolonged drought leads to plant death and the thinning out of many plant communities adding to the dead material in forests, parks and gardens, particularly woody material. “Black Saturday”, 7 February 2009, had been preceded by a record breaking heat wave across the State in the last week of January. Maximum daily temperatures for Melbourne were near or exceeding 30oC for the 11 days prior to “Black Saturday”. This heat wave was unusual in that it scorched many green plants and destroyed many horticultural crops. This period of desiccation was important in pre-drying many live plants making them more combustible. Temperatures on 7 February 2009 were the highest on record across most of the State (Fig. 3). In Melbourne, the maximum temperature reached 47oC. Such high temperatures lead to rapid and extreme fuel drying and bring the fuels closer to the kindling temperature and therefore aid ignition from whatever source, including burning embers.
Report on the Physical Nature of the Victorian Fire occurring on 7th February 2009.doc Page 3 of 18

Tolhurst (2009) “Describing The Black Saturday Fires”
The amount of moisture in the air was also extremely low. The relative humidity was less than 10% for several hours. This very dry air forces drying of dead fuels and stresses live fuels, dropping their moisture content as well. Combined with high air temperatures, fuels are primed for ignition which manifests itself in more explosive fire behaviour.
Figure 2. Australian rainfall deciles for the three years up until 30 March 2009. Note
the extent of extremely low rainfall in southern Australia.
Figure 3. Daily maximum temperature extremes. Red areas indicate the highest on
record.
Report on the Physical Nature of the Victorian Fire occurring on 7th February 2009.doc Page 4 of 18

Tolhurst (2009) “Describing The Black Saturday Fires”
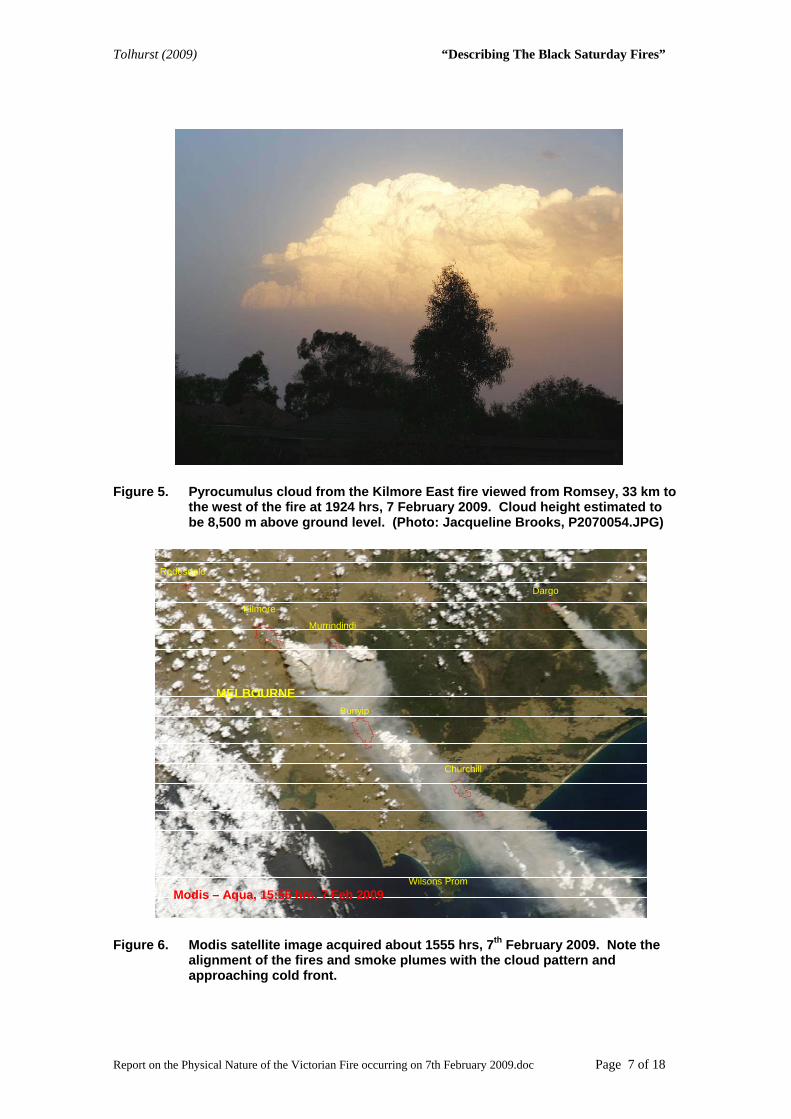
Once a fire has started, the heat and many of the combustion products rise in the smoke plume. They rise because they are hotter and therefore less dense than the surrounding air. Eventually they mix with the surrounding air and cool until they reach an equilibrium with their surroundings. This may be several thousand metres above the ground. These smoke plumes, created by the bushfire, help coalesce the burning area including the thousands of spotfires. This is because air is drawn into the base of the smoke plume to replace the rising air. Two particular factors are important in the nature of the plume – the amount of heat being released from the fuel burning in the fire and the instability of the atmosphere. Atmospheric instability is a measure of how easy it is for a parcel of warm air to rise in the atmosphere. In an unstable atmosphere, it is easy for a parcel of air to rise. Thunderstorms develop in unstable atmospheres because warm moist air rises readily forming the thunder clouds. On 7th February 2009, a low pressure trough passed over the fire area ahead of a cold front (Fig. 4). Low pressure troughs are lines of unstable air and enhance the development of smoke plumes leading to the formation of pyrocumulus clouds, which can and did develop into a fire induced thunderstorm on the evening of “Black Saturday”. At around 1924 hours, the pyrocumulus cloud was estimated by scaling a photograph (Fig. 5) to be 8,500 m high with the smoke rising to around 5,200 m.
Figure 4. A mean sea-level pressure analysis made at 1700 hrs on 7th February 2009
showing a low pressure trough over the fire area (red dashed line) ahead of the cold front (black barbed line) in the Great Australian Bight.
Pyrocumulus cloud is formed when water vapour in the smoke plume rises to a level where it cools below the condensation point. When the water vapour condenses to water droplets or ice crystals, to form the cloud, heat is released. This heat is called the “latent heat of vaporization” and it amounts to 2.44 kJ/g of water. Water in the smoke plume is a combination of free water evaporated in the pre-heating process and water produced during the combustion reaction. On average, about 40% of the smoke plume is water vapour. The formation of the pyrocumulus cloud effectively adds further heat to the smoke column, reinforcing the updraught of the plume over the fire area. The condensation of water vapour from one tonne of burnt fuel would add about 2.44 GJ of energy to the convection column. An experiment in Western Australia showed that the
Report on the Physical Nature of the Victorian Fire occurring on 7th February 2009.doc Page 5 of 18

Tolhurst (2009) “Describing The Black Saturday Fires”
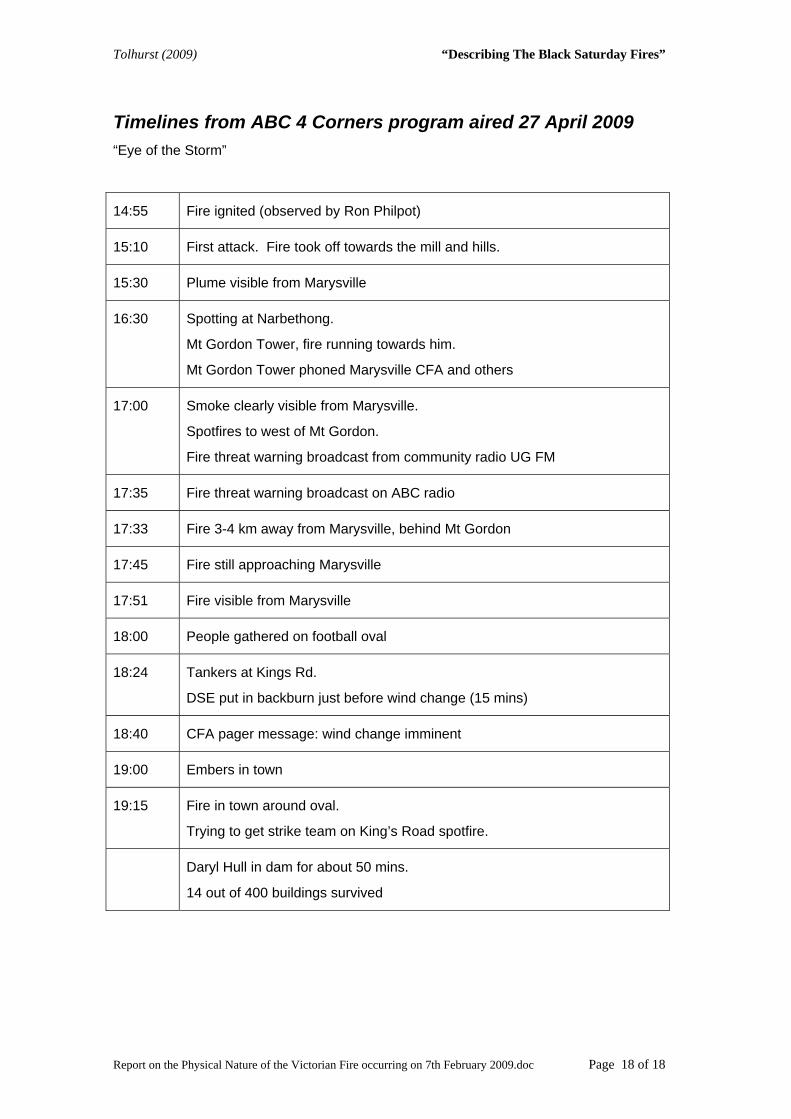
heat released in this process approximately doubled the amount of heat produced by the burning fuel alone. The Modis satellite image captured at about 1555 hours on “Black Saturday”, shows the relative location of the fires in central Victoria (Fig. 6). It is worth noting that of the 100 odd fires starting on this day, the ones doing the most damage and developing to the greatest extent were those aligned with the prefrontal trough during the mid-afternoon. A low pressure trough was also a significant factor in the 2003 fires that burnt into Canberra on the 18th January and into Wulgulmerang in the Gelantipy valley on the 30th January and the Berringa fire in west-central Victoria in 25th February1995. Another weather element critical to the nature of the fire behaviour on 7th February, and common to many (most) other bushfire disasters in Victoria, is the passage of a cold front across the fire area. Recent research has identified a number of cold fronts types, but a common element to all of them is how they turn the flank of a long and narrow (cigar shaped) fire driven by strong northerly winds into a fire front several kilometres wide. Typically, about 80% of the total area burnt occurs after this wind change. As a consequence of both the extent of the fire front and the sudden change in direction of the wind, this is also when a high proportion of the fire damage occurs. The passage of a cold front was an important part of the Ash Wednesday fires in 1983 and the numerous fires in 1977 to name a few. Finally, the wind profile on a day when a cold front is passing across the State, often shows a significant difference in the surface and the upper winds. On the 7th February, the upper winds were already more westerly than the surface winds at 1000 hrs in the morning (Fig. 7). The significance of this was that burning firebrands carried aloft in the smoke plume (convection column) were being acted upon by winds from a different direction to that driving the surface fire. This resulted in two phenomena; firstly, there was a predominance of spotfires being started to the northeast (left) of the main fire path when it was being driven by the northerly winds. This is evident in the video footage from Mt Poley where a spotfire was observed burning on the ridge to the west of Mt Poley at 1643 hours, more than an hour before the main fire front burnt through this area. This was also evident in the reports of spotfires in mid- to late-afternoon in the Kinglake area while the fire was still burning towards the south of the area, whereas the main fire front travelled through Kinglake in the late afternoon and early evening (CFA 4D Star presentation). Similarly, spotfires were occurring on the outskirts of Marysville around 1824 hrs, but the main fire did not move through the town until about 1900 hrs (ABC 4 Corners report, 27 April 2009). The second effect was for the convection column to be blown more to the east and hence “drag” the head of the fire more to the east as if it were being acted upon by a more westerly wind. On “Black Saturday”, this effectively made the fire track about 10 degrees further to the east.
Report on the Physical Nature of the Victorian Fire occurring on 7th February 2009.doc Page 6 of 18
Tolhurst (2009) “Describing The Black Saturday Fires”
Figure 5. Pyrocumulus cloud from the Kilmore East fire viewed from Romsey, 33 km to
the west of the fire at 1924 hrs, 7 February 2009. Cloud height estimated to be 8,500 m above ground level. (Photo: Jacqueline Brooks, P2070054.JPG)
MELBOURNE
Wilsons Prom
Kilmore
Murrindindi
Bunyip
Churchill
Dargo
Redesdale
Modis – Aqua, 15:55 hrs, 7 Feb 2009
MELBOURNE
Wilsons Prom
Kilmore
Murrindindi
Bunyip
Churchill
Dargo
Redesdale
Modis – Aqua, 15:55 hrs, 7 Feb 2009
Figure 6. Modis satellite image acquired about 1555 hrs, 7th February 2009. Note the
alignment of the fires and smoke plumes with the cloud pattern and approaching cold front.
Report on the Physical Nature of the Victorian Fire occurring on 7th February 2009.doc Page 7 of 18

Tolhurst (2009) “Describing The Black Saturday Fires”
Figure 7. Temperature, dew point and wind observations with height above ground
level taken at 1000 hours on Saturday 7 February 2009, at the Melbourne Airport. Note the increasing westerly wind direction with elevation.
Report on the Physical Nature of the Victorian Fire occurring on 7th February 2009.doc Page 8 of 18

Tolhurst (2009) “Describing The Black Saturday Fires”
Report on the Physical Nature of the Victorian Fire occurring on 7th February 2009.doc Page 9 of 18
Figure 8. Temperature, dew point and wind observations with height above ground
level taken at 2200 hrs on Saturday 7 February 2009, at the Melbourne Airport.

Tolhurst (2009) “Describing The Black Saturday Fires”
Fuels Fuels across the areas burnt varied from grassland to softwood and hardwood plantations, dry forest, mountain forests, rainforests and subalpine woodlands. Due to the drought conditions, many of the normally moist forests were dry and carried fire easily. In the Mountain Ash forests in Melbourne’s water catchments, fires were backing down hills in relatively uniform flame fronts with a height of about one metre. Normally these forests would be too moist to burn. Fine fuels, defined as those fuels burning in the flaming zone of the fire, varied from about 1.5 t/ha in eaten-out grass paddocks, to about 45 t/ha in mountain forests, averaging about 25 t/ha across most of the burnt area. It is these fuels that carry the fire front and largely determine the flame height of the fire. Green vegetation will normally only burn if it has sufficient dry fuel around it. In the case of grass this proportion of live to dead fuel is called the degree of curing. As a result of the heatwave in late January, there had already been a degree of desiccation in the green vegetation and an increase in the degree of curing in grasslands. This added to the total amount of fuel available to burn. A similar situation occurred in 1982/3 before the Ash Wednesday fires, but via a different process. Unusually severe frosts and heavy snowfalls before the summer in 1982 resulted in a significantly greater amount of normally green vegetation being desiccated before the fires. In both cases this additional dry fuel resulted in more energy being available to drive the fire instead of being used to dry the fuel and heat it to the kindling temperature. Woody fuels such as twigs, branches, fallen trees and dead standing trees also caught fire and added considerably to the amount of heat coming off the burnt area. The heat generated from these woody fuels can add considerably to the heat in the main convection column and hence help drive the fire. These woody fuels may vary from about 50 t/ha in dry foothill forests and woodlands to over 200 t/ha in the wet mountain forests. Video footage of the fires burning at Mt Poley, Marysville and Kinglake all show this wood fuel burning freely and with very long burn out times, in excess of five hours in the case of Mt Poley (see timelines in Appendix of this report).
Topography The “Black Saturday” fires burnt from grassy plains to alpine meadows. There was over 1,000 m of elevation range in the areas burnt. With this elevation range there were the effects of fires running up hills and backing down others and all variations in between. These elevation differences were associated with differences in vegetation types and therefore fuels in terms of quantity, structure, composition and moisture content. The range of topography involved in the 2009 fires was similar to that burnt in 1939, 1982, 2003, and 2007. An important aspect of the topography was the way the winds changed with elevation, both in terms of speed and direction. For example, when the Kilmore East fire burnt up the side of Mt Disappointment, the winds became stronger and more westerly than those lower down in the valleys. This resulted in the fire being directed more towards
Report on the Physical Nature of the Victorian Fire occurring on 7th February 2009.doc Page 10 of 18

Tolhurst (2009) “Describing The Black Saturday Fires”
Strathewen and Kinglake West rather than towards Whittlesea, but it also meant that firebrands were blown further as well, reaching the area north of Healesville. This is a distance of about 35 km, with the previous longest spotting distance recorded being 30 km from a fire in Gippsland. Similarly, the Churchill fire in south Gippsland threw firebrands 23 km from the top of the Strezlecki Range down to the Yarram area. The predicted spotting distance was only about 15 km, but because the winds were stronger at the top of the range, embers were carried further. The topography was also a factor in creating a fire induced wind strong enough to snap off trees in a gully in the Bunyip Ridge fire (Fig. 9). Winds would need to be in excess of 120 km/h to cause this type of damage.
Figure 9. Gully of trees snapped of by high fire induced winds. Jack Road, Bunyip
Ridge Fire. (Photo: Derek Chong, Uni. Melb.)
Fire Itself The fire helps enhance itself as previously mentioned, by creating it own local winds with indraughts into the convection column. It also enhances itself by producing and projecting firebrands to create spotfires ahead of itself. The degree to which the fire provides a positive feedback on its behaviour is influenced in part by the weather, the fuel and the topography, but it also depends on the size of the fire. As a fire becomes larger, it tends to “see” the fuels and topography differently. Fire effectively integrates or averages out the fuels and topography within its “footprint”. The mechanism for doing this integration is the convection column.
Report on the Physical Nature of the Victorian Fire occurring on 7th February 2009.doc Page 11 of 18

Tolhurst (2009) “Describing The Black Saturday Fires”
An extreme example of how the fire feeds back on itself, was the way in which the pyrocumulus clouds developed into a thunderstorm. These thunderstorms produced lightning which initiated a new set of fires. Many of these new fires were in Melbourne’s water catchments. Fortunately, most of the new lightning fires were suppressed while still relatively small. In 2003, lightning induced by a pyrocumulus cloud started fires in the Snow River National Park, 25 km ahead of the fire front. These fires did develop into a significant area. Other examples exist of this phenomenon.
General Fire Behaviour A unique aspect of these fires was the extent of the “fire-active area”. This was a function of the dryness of the fuels brought about by the severe drought conditions and the heat wave in late-January. Three types of fire-active areas can be recognised in the fires of “Black Saturday”. • Firstly, the area impacted by the run of the initial fire under the northerly wind.
This includes the initial buildup phase through to the time of the wind change. • The second type of fire-active area is the eastern or left-hand flank of the fire where
spotfires start and develop for one to two hours before being burnt over after the wind change.
• The third type of fire-active area is the area burnt after the wind change when the flank fire turns into the main fire front. This area is characterised by a massive number of spotfires with no single coherent front.
Each type of fire-active area has its own characteristics and implications for those being affected by them. Each type of area will be discussed in turn. The first type of fire-active area ahead of the fire being driven by the northerly wind is directly under the smoke plume and is subjected to spotting. This is normally the fastest and most intense phase of the fire. It is here that the greatest potential impact can occur. The impact on Strathewen is a good example of this phase. The only consolation about the area burnt in this first phase is that the fire burns out relatively quickly, but could still last for an hour. The second type of fire-active area is to left or east of the left-hand flank of the fire. This area will be affected for the longest period of time because it may be subjected to fires starting from high-lofted and long-distance firebrands. This area will be the area first affected on the wind change so it will be affected by fires coming from multiple directions. The duration of exposure to running fires could be two hours or more, but it will be a more gradual process, but may be very confusing and disorientating. The third type of fire-active area is the area burnt after the wind change. On and after the wind change, there is a massive release of embers and prolific spotting occurs. Areas previously in relatively clear air will be filled with smoke and embers with only limited warning. Because of the extensive area of spotting (20 km or more long and 5 km or more ahead of the fire front), fire suppression will be limited to local asset protection only, but the dangers of getting caught, surrounded by fire, is very high. This is the time when there is a huge potential for loss of life and property due to the dispersed, but still intense nature of the fire.
Report on the Physical Nature of the Victorian Fire occurring on 7th February 2009.doc Page 12 of 18

Tolhurst (2009) “Describing The Black Saturday Fires”
Some Characteristics of the “Black Saturday” Fires Table 1 lists some of the major fire events in Australia. The fires in Victoria on “Black Saturday” represented the worst bushfire disaster in Australia in terms of the number of fatalities. An area of approximately 300,000 ha was burnt on the 7th February with the majority of that being burnt in the Kilmore East, Murrundindi, Bunyip Ridge and Churchill fires. The extremely dry conditions brought about by the combination of over a decade of drought, a record breaking heatwave in late-January, and the highest temperatures ever recorded across the State combined with extremely strong dry winds to drive fires uncontrollably across the landscape. In terms of the combination of weather conditions, they were the most extreme conditions ever experienced in Australia with the exception of the Wangary fires in South Australia in 2005 (Table 1). Fire weather conditions were two to three times worse than those experienced in the legendary “Black Friday” fires of 1939 and significantly more severe than the conditions of the more recent “Ash Wednesday” fires in 1983. The rates of spread of the fires in forest equalled the maximum previously recorded on “Ash Wednesday”, averaging 12 km/h for an hour in the case of the Kilmore East fire. There was an exceptional run of fire in the Canberra fires of 2003 which spread at a rate of about 26 km/h for an hour due to the “pull” of a major convection column on either side of it. However, it was the extent and prolific spotfires that made the behaviour of these fires unique. The very hot and dry conditions were conducive to keeping the firebrands alight for longer than normal, and upper winds of around 100 km/h carried firebrands and started spotfires up to 35 km ahead of the fire front. The previous authenticated spotting distance was 30 km (Luke and McArthur, 1978). The rate of spread of the fire for shorter periods of time would have been much faster than the hourly average. Prolific short-distance spotting was occurring about 10 minutes before the arrival of the main fire, i.e. about one kilometre ahead of the main front. Black smoke indicated that the burning efficiency of the fire was very poor due to the air-fuel mixture being too rich to burn. This resulted in fire flares and what have been described as “fireballs” where parcels of flammable gases released from the forest fuels have been blown ahead or above the fire and when they have mixed with sufficient air (oxygen), they ignite. This phenomenon could occur several hundred metres ahead of the fire front. Modelling of these fires, using PHOENIX RapidFire, indicated that fires could have spread as fast as 60 km/h in grassland and 40 km/h in forest for one hundredth of an hour – about half a minute. The fire then effectively moves in pulses where several hundreds of meters of forest can be set alight and then it take a few minutes for the fuel to be fully incorporated into the fire and then it pulses again. The rate at which these pulses move could be as fast as the prevailing winds, which in the case of “Black Saturday” was 50 to 60 km/h. Flames were observed to leap 100 m or more into the air. Radiation from the flame would make survival within a distance of three to four times this flame height difficult except for very short exposures. Flame temperatures would have been 900 to 1200oC, depending on the amount of moisture in the fuels and the depth of the flames. Some aluminium road signs melted in the flames indicating that they were exposed to
Report on the Physical Nature of the Victorian Fire occurring on 7th February 2009.doc Page 13 of 18

Tolhurst (2009) “Describing The Black Saturday Fires”
temperatures in excess of 700oC. However, the heat from the bushfire should not be confused with the much greater heat generated by burning buildings and vehicles ignited by the bushfire. The total amount of heat released from the fires on “Black Saturday” would have been sufficient to provide the total energy needs for all Victorian domestic and industrial use for a year. This energy was released in just a few hours. The energy of the fires was equivalent to more than 1500 atomic bombs the size of the one used at Hiroshima, which devastated an area equivalent to 2,000 ha, but bushfires release their energy in a “storm” not a “blast”. This gives an indication of the destructive power of these fires. Table 1. Summary of weather and impact of some significant Australian fires. The
Fire Danger Indices (FDI), calculated using McArthur’s method, for grass and forest for the peak weather is used for comparison.
Disaster Losses Max
Temp (oC)
Min RH (%)
Wind Spd
(km/h)
Forest FDI
Grass FDI
Wangary Fire, 10 Jan 2005, SA
9 fatalities 93 homes lost
42 3 65 192 336
“Black Saturday”, 7 Feb 2009, Victoria
173 fatalities 2029 homes lost
46 4 51 (69) 172 241
“Ash Wednesday”, 16 Feb 1983, Victoria / SA
76 fatalities 2080 homes lost
41 14 60 (90) 120 196
“Black Friday”, 13 Jan 1939, Victoria
71 fatalities 1,380,000 ha burnt 1000 homes lost
46 8 35 (65) 100 87
“Canberra Fires”, 18 Feb 2003
4 fatalities 500 homes lost
37 10 50 (80) 99 133
8 Jan 1969, Victoria 20 fatalities 240 homes lost
40 10 45 (90) 97 114
“Hobart Fires”, 7 Feb 1967 62 fatalities 1400 homes lost
39 18 55 90 138
Beerburrum Fires, 6 Nov 1994, Qld
> $10 million loss of plantation wood
37 13 50 89 120
14 Jan 1944, Victoria 51 fatalities 700 homes lost
40 10 35 (55) 77 69
“Black Sunday”, 2 Jan 1955, SA
43 15 35 72 64
14 Feb 1926, Victoria 31 fatalities 38 15 40 (75) 70 72
25 Oct 1918, Blackall, Qld 39 17 40 66 70
Alpine Fires, Jan/Feb 2003, Victoria / NSW (ACT)
7 fatalities 2.7 Mha burnt in Vic/NSW/ACT127 homes lost in Vic / NSW
35 10 35 63 57
Dwellingup Fires, 19 Jan 1961, WA
Many homes lost 145,000 ha burnt
40 26 20 31 18
Pickering Brook fire, 15 Jan 2005, WA
No significant losses 30 20 21 28 17
“Black Thursday”, 6 Feb 1851, Victoria
One quarter of State affected by fire 10 fatalities
14-16 Jan 1962, Dandenongs, Victoria
14 fatalities 454 homes lost
Report on the Physical Nature of the Victorian Fire occurring on 7th February 2009.doc Page 14 of 18

Tolhurst (2009) “Describing The Black Saturday Fires”
Table 2. Summary of fire behaviour statistics for four of the main fires burning on
Black Saturday, 7 February 2009, in Victoria. Kilmore Murrundindi Churchill Bunyip
Maximum fireline intensity (kW/m) 150,000 150,000 71,000 77,000
Average fireline intensity, N’ly wind (kW/m) 100,000 100,000 45,000 38,700
Average fireline intensity, S’ly wind (kW/m) 64,000 71,000 64,500 25,800
Total heat output (TJ) 53,000 36,000 11,000 10,000
Maximum spread rate in one hour (km/h) 12 12 5.5 6
Average spread rate in one hour N’ly wind (km/h) 8 8 3.5 3
Average spread rate in one hour S’ly wind (km/h) 5 5.5 5 2
Area burnt on 7th Feb. (ha) 114,929 77,400 23,800 21,000
Maximum spotting distance (km) 35 23 24 16
Average spotting distance (km) 10-15 7 8 11
Predictability using Current Models Once the spread of the fires have been accurately documented, it will be possible to undertake a comprehensive review of how well the available fire behaviour models predicted the rate of spread and spotting of these fires. However, early indications are that the PHOENIX RapidFire model developed as part of the Bushfire CRC gives a good representation of the fire spread rates and extent (Fig.10). Further evaluation will be needed.
Figure 10. A screen grab of the modelled extent of the Kilmore East fire using the
Kilmore Gap weather observations. Note how the model did not predict the spotting in the area north and west of Healesville. The fire indicated around Broadford did not occur due to suppression activity.
Report on the Physical Nature of the Victorian Fire occurring on 7th February 2009.doc Page 15 of 18

Tolhurst (2009) “Describing The Black Saturday Fires”
Conclusions The fires on “Black Saturday” were exceptional in their severity and the manner in which they spread. The spread pattern they showed was typical of many previous fire events, but there were some key spread characteristics which were magnified. The pulsating nature of the fire spread, with the accompanying propagation by spotting and wind-blown volatile gases, needs better description and research. These are important characteristics that need to be communicated to the public and taken into account in building design and land-use planning.
Report on the Physical Nature of the Victorian Fire occurring on 7th February 2009.doc Page 16 of 18

Tolhurst (2009) “Describing The Black Saturday Fires”
Appendix
Timelines from video taken at Poley Tower The black bar in the time column indicates the period of direct fire activity at the tower. The red bar in the time column indicates the period of flaming and running fire at the tower. Fire was affecting the area around the tower for in excess of six hours. 16:43 Spotfire to West of Mt Poley (looking to St Filians). Carried by upper winds
17:10 Spotfire to East. Spotfire running to ridge (Poley ridge). Carried by upper winds.
17:46 Second spot fire to East. Carried by upper winds.
17:50 Covered in smoke
17:55 Shift in wind to West
18:00 Embers (18:02:50)
18:15 Lots of embers
18:17 Spotfires close to West
18:25 Lots of spotfires.
18:33 Darkness
18:35 Wind South-westerly
18:44 Fierce fire around tower
18:50 Red glow.
18:52:00 Fireball.
18:50 Burning out, spread finished
18:56 Fireball in background.
19:07 Some clear air
19:05 Ember attack over.
23:00 Woody fuel still burning out.
Report on the Physical Nature of the Victorian Fire occurring on 7th February 2009.doc Page 17 of 18
Tolhurst (2009) “Describing The Black Saturday Fires”
Timelines from ABC 4 Corners program aired 27 April 2009 “Eye of the Storm”
14:55 Fire ignited (observed by Ron Philpot)
15:10 First attack. Fire took off towards the mill and hills.
15:30 Plume visible from Marysville
16:30 Spotting at Narbethong.
Mt Gordon Tower, fire running towards him.
Mt Gordon Tower phoned Marysville CFA and others
17:00 Smoke clearly visible from Marysville.
Spotfires to west of Mt Gordon.
Fire threat warning broadcast from community radio UG FM
17:35 Fire threat warning broadcast on ABC radio
17:33 Fire 3-4 km away from Marysville, behind Mt Gordon
17:45 Fire still approaching Marysville
17:51 Fire visible from Marysville
18:00 People gathered on football oval
18:24 Tankers at Kings Rd.
DSE put in backburn just before wind change (15 mins)
18:40 CFA pager message: wind change imminent
19:00 Embers in town
19:15 Fire in town around oval.
Trying to get strike team on King’s Road spotfire.
Daryl Hull in dam for about 50 mins.
14 out of 400 buildings survived
Report on the Physical Nature of the Victorian Fire occurring on 7th February 2009.doc Page 18 of 18