report on the environmental benefits of recycling€¦ · page 1 report on environmental benefits...
TRANSCRIPT
Report on the Environmental Benefits of RecyclingBureau of International Recycling (BIR)

Report on the Environmental Benefits of RecyclingPrepared by: Professor Sue Grimes, Professor John Donaldson, Dr Gabriel Cebrian GomezCentre for Sustainable Production & Resource Efficiency (CSPRE)
Imperial College LondonCommissioned by the Bureau of International RecyclingUnder the project leadership of Roger Brewster, Metal Interests Ltd.
October 2008

Report on Environmental Benefits of RecyclingPage 1
Foreword 2Preface 3Executive Summary 4Understanding the Brief 5Methodology 6Primary and Secondary Metal Production 7 Primary and Secondary Aluminium Production 7 Primary Production 7 Secondary Production 7 Energy Requirement and Carbon Footprint Data for Aluminium 8 Summary 10 Primary and Secondary Copper Production 11 Primary Production 11 Secondary Production 11 Energy Requirement and Carbon Footprint Data for Copper 12 Summary 13 Primary and Secondary Ferrous Production 14 Primary Production 14 Secondary Production 15 Energy Requirement and Carbon Footprint Data for Steel Production 15 Summary 17 Primary and Secondary Lead Production 18 Primary Production 18 Secondary Production 18 Energy Requirement and Carbon Footprint Data for Lead 18 Summary 20 Primary and Secondary Nickel Production 21 Primary Production 21 Secondary Production 21 Energy Requirement and Carbon Footprint Data for Nickel 22 Summary 23 Primary and Secondary Tin Production 24 Primary Production 24 Secondary Production 24 Energy Requirement and Carbon Footprint Data for Tin 24 Summary 25 Primary and Secondary Zinc Production 26 Primary Production 26 Secondary Production 26 Energy Requirement and Carbon Footprint Data for Zinc 27 Summary 29Primary and Secondary Paper Production 30 Primary and Secondary Production of Paper 30 Primary Production 30 Secondary Production 31 Energy Requirements and Carbon Footprint Data for Paper Production 31 Summary 34Sensitivity Analyses 35 Variation in Secondary Energy Requirement Compared with Primary 35 Variation in Primary Energy Data from Benchmark Values 35 Variation in Carbon Footprint for Secondary Production Compared with Primary Production 37 Variation in Carbon Footprint Data for Primary Production from the Benchmark Data 37 Variation in Energy by Country 37Conclusion 42Bibliography 44
Table of Contents

Report on Environmental Benefits of RecyclingPage 2
The benchmark values were based on the literature data and are intended to reflect what was achievable by both the primary and secondary metal industries. Given time, the Imperial group would have preferred to have used verifiable industry data provided for specific plants from different countries but, since this was not possible, sensitivity analyses on the benchmark data have been carried out. The sensitivity analysis data enable any individuals or groups to input any industry-specific data values that they might have for comparison with the benchmarks. We believe that the benchmark information is completely defensible and very conservative. Undoubtedly, sections of industry may claim greater savings based on their own databases, but there is a danger in over-stressing industry data which have not been independently verified and which in any case will differ from country to country depending upon the sophistication of both the energy supply and the metal production plant. The purpose of this report was to produce information on carbon dioxide savings that is defensible, and to provide a balanced comparison between primary and secondary production from delivery of ore or secondary material to a metal-producing plant. It is hoped that this report will be used by industry to assess their own situation in terms of secondary metal production and perhaps to provide information that can be independently verified to permit further more accurate calculations of carbon dioxide savings in specific cases.
Roger BrewsterMetals Interests Limited
Foreword
The Imperial College remit was to use published literature data to estimate the carbon dioxide savings that could be made through the recycling of metals and paper. The key to the document produced was the need to avoid bias, and for this reason the concept of benchmark values was developed.
Report on Environmental Benefits of RecyclingPage 2
Table of Contents

Report on Environmental Benefits of RecyclingPage 3
Imperial College was established in 1907 through the merger of the Royal College of Science, the City and Guilds College and the Royal School of Mines. In 2007, Imperial College celebrated its centenary and, coincident with this date, it withdrew its long-standing association with the University of London to become a university in its own right. Imperial College owns one of the largest estates in the UK university sector and resides in the heart of London with its main campus at South Kensington. The College has over 2,900 academic and research staff in total and more than 12,200 students, of whom approximately one third are postgraduates. The College has strong international links with students from over 110 countries.
Imperial is ranked fifth in the world and has world-renowned academic expertise across its four faculties of Natural Sciences, Engineering, Medicine and the Imperial College Business School. The College has a number of cross-faculty initiatives that bring together College-wide expertise to focus on grand challenge research themes; these include the Grantham Institute for Climate Change, the Energy Futures Laboratories and the Porter Institute for plant-based biofuels. The College’s academics have strong research groups delivering innovative solutions in all aspects of science, engineering, technology and business, and have taken a lead in guiding policy at national and international levels.
In 2005, the SITA Trust (the Trust body of SITA UK) and the Royal Academy of Engineering established a Chair in Waste Management at Imperial College. The holder of the post, Professor Sue Grimes (the first lady in the UK to be supported by the Royal Academy of Engineering to a professorship), is championing the creation of a centre for excellence in Sustainable Production and Resource Efficiency that brings together disparate Imperial research groups to provide a focus for collaborative research, in particular on key sustainability issues. The Centre draws on the College-wide expertise in material recovery, mineral wastes, materials science and material reprocessing, biological treatment of waste, waste electrical and electronic equipment, biofuels, incineration, energy from waste, carbon capture and sequestration, waste management decision-making tools, landfill science, agricultural waste, radioactive waste, and epidemiology.
Preface
In March 2008, Roger Brewster of Metal Interests Limited, UK, on behalf of the Bureau of International Recycling (BIR) in Brussels, commissioned Professor Sue Grimes of Imperial College and her team to carry out research and deliver a report on the Environmental Benefits of Recycling.
Report on Environmental Benefits of RecyclingPage 3
Table of Contents

Report on Environmental Benefits of RecyclingPage 4
To avoid complications associated with the early stages of whole life cycles of these materials, benchmark energy requirements and carbon footprints are extracted from: ore or raw material delivered at the production plant for primary materials; and delivered at the secondary plant for secondary material. Benchmark data are reported per 100,000 tonnes of material produced to provide a means of direct comparison between primary and secondary production. These data are tabulated below for each material separately – as energy requirements and savings per 100,000 tonnes of production of material, and as carbon footprints and savings per 100,000 tonnes of production.
Energy Requirement and Savings in Terajoules (TJ/100,000t)
Material Primary Secondary Saving/100,000 TonnesAluminium 4700 240 4460Copper 1690 630 1060Ferrous 1400 1170 230Lead 1000 13 987Nickel 2064 186 1878Tin 1820 20 1800Zinc 2400 1800 600Paper 3520 1880 1640
Carbon Footprint and Savings Expressed in Kilotonnes of CO2 (ktCO2)/100,000 Tonnes
Material Primary Secondary Saving/100,000 Tonnes(% savings CO2 in paretheses)
Aluminium 383 29 354 (92%)Copper 125 44 81 (65%)Ferrous 167 70 97 (58%)Lead 163 2 161 (99%)Nickel 212 22 190 (90%)Tin 218 3 215 (99%)Zinc 236 56 180 (76%)Paper 0.17 0.14 0.03 (18%)
The total estimated reduction in CO2 emissions obtained from these data is approximately 500Mt CO2 per annum.
The benchmark figures extracted from the primary literature in this work represent (i) data for situations that are said to be achievable and (ii) values that are the most acceptable and justifiable.
To deal with variations in the processes involved, sensitivity analyses are provided to show how the data can be handled to provide comparisons in any situation.
Energy requirement and carbon footprint values for the production of primary and secondary metals and paper have been obtained from a survey of the primary literature. The metals included in the survey are aluminium, copper, ferrous, lead, nickel, tin and zinc.
Executive Summary *
Report on Environmental Benefits of RecyclingPage 4
* Please note that:• thereportisbasedonresearchliteratureavailableatthetimeofthecommission,notonfielddata.• onlytheprocessofproducingtheproductmaterialisforcomparison,andnotextraction,beneficiationandotherancillaryprocesses.• comparisonismadeonthegroundsoftechnologicalexcellence(benchmarks)andnotoncurrentaveragesofenergyconsumption
or conversion.
Therefore,theresultsofthisreportdonotrepresentabsolutevaluesbutmustbereadinthecontextoftheconsiderationsandassumptionsoutlined in the methodology.
Table of Contents

Report on Environmental Benefits of RecyclingPage 5
The brief given by Metal Interests Limited on behalf of BIR is to prepare a report on the environmental benefits of recycling, identifying the savings that can be made by using recyclables as opposed to primaries, and thereby the carbon credentials of the recycling industries. In the first instance, the materials to be considered in the study are seven metals – aluminium, copper, ferrous metals, lead, nickel, tin and zinc – and paper.
The overall aim of the project is to provide verifiable data on the influence of recycling on carbon emissions. Ideally, the project should be carried out under two key phases.
The first phase (Phase I) would involve two steps:
(i) to provide information to the Global Emissions Study of CO2 for recyclables with preliminary information from available sources. This should provide a preliminary comparison between the use of primary and recycled materials for paper and metals;
(ii) to extend the study to provide additional information from primary scientific sources to verify the preliminary data, and provide new data where appropriate and to produce a report containing verifiable quantitative data.
Since the timescale did not permit detailed optimisation of the data, it is recommended that in the second phase (Phase II) consideration be given to further quantification and verification of the data using individual secondary material recovery operations throughout the world. This is considered necessary to ensure that the collective data presented by trade associations and other bodies can be defended, and to allow the secondary materials industries to be certain of carbon savings achieved prior to second use of their materials by manufacturing industries.
Phase I, the subject of this report, will be the results of a detailed survey of the primary literature on energy consumption in primary and secondary material recovery.
The environmental benefits of recycling can be expressed in many ways, including savings in energy and in use of virgin materials. There appears however to have been very little attempt to express these benefits in terms of carbon footprint and particularly in savings in carbon dioxide equivalent emissions which would have implications in terms of both the environment and carbon emission.
Understanding the Brief
Table of Contents

Report on Environmental Benefits of RecyclingPage 6
The most common greenhouse gas emitted is carbon dioxide and a carbon footprint is a quantitative measure of the carbon dioxide released as a result of an activity expressed as a factor of the greenhouse gas effect of carbon dioxide itself. Many environmental impacts, including the production of any electricity used in the materials recovery industry, can be converted into carbon dioxide-equivalent (CO2-e) emissions.
The methodology used involved:
(i) A detailed survey of the primary literature to extract the data available on energy consumption and associated carbon emissions.
(ii) The use of energy data and associated carbon emissions, extracted to highlight differences between primary and secondary production of seven metals - aluminium, copper, ferrous metals, lead, nickel, tin and zinc - and of paper. The assumptions made in all information provided are identified and the units used in the calculations are expressed as MegaJoules per kilogram of product for energy and tonnes of CO2 per tonne of product for carbon emissions.
(iii) For each material for both primary and secondary production, best estimates of benchmark energy consumptions and carbon footprints are used in the comparisons as examples of what can be achieved.
(iv) A summary table comparing the energy consumption and carbon footprint of primary and secondary production of aluminium, copper, ferrous metals, lead, nickel, tin and zinc, and of paper, is compiled per 100,000 tonnes of production. For all materials, the life cycle boundaries are set to compare the production of (a) primary material from raw material delivered to the primary production plant to final product, and (b) secondary materials delivered to the recycling plant to final product.
(v) Sensitivity analyses are carried out on the data obtained using the benchmark values in the summary table to show how these data can be handled to deal with variations in input such as the details of the energy sources used, the energy/fuel mix for different countries, and the energy efficiency of specific recovery plants.
This report sets out in the section ‘Primary and Secondary Metals Production’ (p.7) the data gathered for each metal. The energy data obtained are expressed in flow diagrams and all references to the primary literature are given. For the purposes of comparing primary and secondary production, however, the results for energy consumption and carbon footprint are those for the following processes: (i) conversion of ore concentrate to metal in primary production, and (ii) from scrap and other secondary materials delivered to a recycling process and converted to metal. This choice of life cycle boundaries avoids the complications associated with differences in mining and beneficiation of ores and in the collection and transport of scrap to a recycling process.
The data for primary and recycled paper are compared in the section ‘Primary and Secondary Paper Production’ (p.30).
Sensitivity analyses are provided on page 35 to show how data can be handled to provide comparisons and deal with any variations in processes. Conclusions (p42) drawn from Phase I of the study are presented.
This report contains the results of a detailed survey to obtain information on energy consumption in primary and secondary material recovery and the carbon emissions associated with these processes. The information obtained is used in calculations to assess the environmental benefits of recycled materials expressed in both energy terms and as a carbon footprint.
Methodology
Table of Contents

Report on Environmental Benefits of RecyclingPage 7
Primary and Secondary Aluminium Production
In 2006, the tonnages of primary and secondary aluminium produced were approximately 34 and 16Mt respectively, so that about one third of aluminium demand is satisfied from secondary production.
The difference between primary and secondary production is illustrated in the following figure.
Primary and Secondary Production of Aluminium
Primary ProductionIn the Bayer process, the bauxite ore is treated by alkaline digestion to beneficiate the ore. Although the red mud produced in this process is a waste which has major environmental impacts because about 3.2 tonnes of mud are produced per tonne of aluminium produced, the comparison between primary and secondary aluminium production made in this report starts at the point of delivery of the alumina concentrate to the processing plant.
Primary production of aluminium from the ore concentrate is achieved by an electrolytic process in molten solution. The Hall Héroult process consists of electrolysis in molten alumina containing molten cryolite (Na3AlF6) to lower the melting point of the mixture from 2050ºC for the ore concentrate to about 960ºC.
The electrolysis cell consists of a carbon-lined reactor which acts as a cathode, with carbon anodes submerged in the molten electrolyte. In the electrolysis process, the aluminium produced is denser than the molten electrolyte and is deposited at the bottom of the cell, from where it is cast into ingots. At the anodes, the anodic reaction is the conversion of oxygen in the cell to carbon dioxide by reaction with the carbon of the anodes. The process results in the production of between 2 and 4% dross.
Secondary Production All secondary aluminium arisings are treated by refiners or remelters. Remelters accept only new scrap metal or efficiently sorted old scrap whose composition is relatively known. Refiners, on the other hand, can work with all types of scrap as their process includes refinement of the metal to remove unwanted impurities. In both processes, the molten aluminium undergoes oxidation at the surface which has to be skimmed off as a dross. In Europe, about 2.5% of the feedstock aluminium in the refining process is converted to dross.
Primary Production
Old and New ScrapDross
Bauxite Mining Scrap
Refiners Remelters
Casting Casting
Alumina Production/Bayer Process
Hall Heroult-Electrolysis
Casting
Secondary Production
New Scrap
The metals are discussed in the order: aluminium, copper, ferrous metals, lead, nickel, tin and zinc.
Primary and Secondary Metals Production
Table of Contents

Report on Environmental Benefits of RecyclingPage 8
Energy Requirement and Carbon Footprint Tables for AluminiumThe gross energy requirement for primary aluminium production has been estimated at 120MJ/kg Al based on using hydroelectricity with 89% energy efficiency. As alternatives to hydroelectricity, use of black coal for electricity generation with an efficiency of 35% or natural gas with an efficiency of 54% would give gross energy estimates of approximately 211 and 150MJ/kg Al respectively. The data in the following table are the gross energy requirements that have been quoted in various publications for production of primary aluminium by the Bayer-Hall Héroult route, along with the assumptions that the authors made on the fuel used.
Energy Requirements of Production of Primary Aluminium
Energy Requirements Bayer Hall Héroult Route Source MJ/kg Al NotesNorgate 211 Coal (c.e. 35%)Norgate 150 Gas (c.e. 54%)Norgate 120 Hydro (c.e. 89%)Cambridge 260 Coal (c.e. 35%)Aus Alu Council 182-212 Coal (c.e. 35%)Grant 207 Coal (c.e. 35%)Choate and Green 133 US average
(c.e. – refers to conversion efficiency)
The electricity consumption in the Hall Héroult process is the most energy-demanding aspect of primary production of aluminium. The energy requirements reported in the literature for the Hall Héroult process alone (i.e. for conversion of treated ore to metal) are in the following table along with the assumptions made on the fuel used.
Energy Requirements of the Hall Héroult Process
Energy Requirements Hall Héroult Process OnlySource MJ/kg Al NotesSchwarz 47 Electricity benchmarkIAI 54 Electricity averageNorgate 66 Electricity maxNorgate 46 Electricity benchmarkIAI 69 Electricity maxCambridge 55 Hydro efficiency 95%Cambridge 160 Coal efficiency 35%Cambridge 50 100% efficientChoate and Green 56 US average
For the purpose of comparison of the energy requirements and associated carbon emissions for primary aluminium production with data for secondary aluminium production, we have assumed that the benchmark process would involve an electricity benchmark figure of about 47MJ/kg.
Table of Contents

Report on Environmental Benefits of RecyclingPage 9
The literature data on the carbon footprint for primary production of aluminium following the Bayer-Hall Héroult route and for the Hall Héroult process alone are in the following tables, respectively, along with the assumptions made by the authors on the fuel used.
Carbon Footprint for Primary Production of Aluminium
Carbon Footprint Bayer-Hall Héroult Route Source Carbon Footprint
(tCO2/t Al)Energy Source
Norgate 22.4 Coal Grant 18.2 Coal Kvande 24 Coal IAI 20 Coal IAI 9.8 Hydro 57%, Coal 28%, Natural Gas 9%, Nuclear 5%, Oil 1%Choate and Green 9.11 US AverageChoate and Green 5.48 Inert Anode, Wetted Cathode, ACD 2cmChoate and Green 8.56 Carbothermic ReactionChoate and Green 6.71 Wetted Cathode and ACD of 2cmChoate and Green 8.95 Chloride Reduction of Kaolinite Clays
Carbon Footprint for the Hall Héroult Process
Carbon Footprint Hall Héroult Process OnlySource Carbon Footprint
(tCO2/t Al)Notes
Norgate 7.2 Drain Cathode, Inert Anode, Low Temp Electrolyte, Natural Gas 54%Norgate 4.6 Drain Cathode, Inert Anode, Low Temp Electrolyte,
Hydroelectricity 89%
IAI 7.7 Average IAIChoate and Green 3.83 US Average (Typical)
It has been reported that the production of one tonne of aluminium from scrap requires only 12% of the energy required for primary production. Energy savings of between 90 and 95% have also been reported for secondary aluminium production compared with primary production, starting with mining the ore and not with as-received concentrate.
The energy requirement to recycle aluminium has been calculated at between 6 and 10MJ/kg assuming efficiencies of 60-80% in the recycling process. The energy requirement data for secondary aluminium production are reported in the following table as mean values for melting and casting and benchmark values for melting and casting. The carbon footprint data included in the table on the following page have been calculated on the basis of these energy requirement data, using the carbon emission factor for the UK.
Table of Contents

Report on Environmental Benefits of RecyclingPage 10
Energy Requirement of Secondary Processes for the Production of Aluminium from Scrap
Process Mean in MJ/kg Benchmark in MJ/kgRemelting 4.5 2.1Casting 0.5 0.3
Carbon Footprint for the Secondary Processes for the Production of Aluminium from Scrap
Process CO2 Emissions (tCO2/t)
Benchmark (tCO2/tAl)
Remelting 0.54 0.25Casting 0.06 0.04
SummaryUsing the benchmark data for primary and secondary aluminium production from delivered ore concentrate and scrap respectively, the energy requirements for the production of 100,000 tonnes of aluminium are:
Energy requirement for primary production: 4700TJEnergy requirement for secondary production: 240TJ
Using the energy data, the carbon footprints for primary and secondary production of aluminium on the same basis are:
Carbon footprint for primary production: 383kt CO2
Carbon footprint for secondary production: 29kt CO2
Sensitivity analyses on these data are given on page 35 of this report to illustrate the effects of deviations from benchmark conditions.
Table of Contents

Report on Environmental Benefits of RecyclingPage 11
Primary and Secondary Copper Production
According to the US Geological Survey, world copper production in 2007 was 15.6Mt. The percentage of copper recovered from scrap as a percentage of total copper produced has been reported to vary with geographical location within the range 19-45%.
Primary ProductionThe major route in primary copper production is the pyrometallurgical route from copper sulfide ores that have been concentrated usually by flotation to give the concentrate used in the pyrometallurgical process. A very small percentage of primary copper is recovered from copper ores hydrometallurgically.
In the pyrometallurgical process, the concentrates are roasted to produce a copper matte which contains between 30-50% copper. The matte is reduced to copper metal in a converter process, and the final product is generally purified by dissolving the copper metal obtained in sulfuric acid and recovering high-purity copper from this solution by electrowinning.
The hydrometallurgical route involves leaching of the copper oxide ore with sulfuric acid to produce a solution from which copper metal can be recovered on the cathodes of an electrowinning process.
Schematic of Copper Production
Secondary ProductionSecondary copper can be produced from scrap and other copper containing materials by pyrometallurgical and hydrometallurgical processes that are similar to those used in primary metal production. The following figure for example is a flow chart of secondary pyrometallurgical copper production.
Pyrometallurgical
Benefication
RoastingSmelting
Fire RefiningElectrorefining
Solvent Extraction (SX)Acid LeachingElectrowinning
Copper Ore Waste Streams for Copper Related Processes, CuO Ore
Scrap
Cu Concentrate
Copper Matte
Cu Cathode
Hydrometallurgical
Table of Contents

Report on Environmental Benefits of RecyclingPage 12
Secondary Copper Production By Pyrometallurgy
Energy Requirement and Carbon Footprint Tables for CopperThere are literature reports suggesting that the energy requirement for secondary copper production is between 35 and 85% that for primary production – the higher value is that reported by the Institute of Scrap Recycling Industries, and this would lead to an estimated 7.3MJ/kg energy saving.
The data for energy required for primary copper production via pyrometallurgical and hydrometallurgical routes are given in The following figure, and the figure also shows the point in the energy requirement diagram at which scrap copper would enter the pyrometallurgical process. These are the data on which comparisons between primary and secondary production have to be based. The data quoted on the extreme left of the figure are for energy calculations based on different ore grades and by different authors.
Energy Requirements for Copper Production
The carbon footprint data for copper production from these data are presented in the following figure.
Pyrometallurgical
MiningBenefication
33MJ/kg(ore 3% Cu)
19.1MJ/kg(Europe)
41.8MJ/kg
-15MJ/kg10.6
57.3MJ/kg(0.5% Cu ore)
47.0MJ/kg(Boliden
0.5% Cu)
RoastingSmelting
Fire Refining 2.8MJ/kgElectrorefining 3.5MJ/kg
Solvent Extraction (SX)Acid LeachingElectrowinning
Copper Ore Waste Streams for Copper Related Processes, CuO Ore
Scrap
Cu Concentrate
Copper Matte
Cu Cathode
Hydrometallurgical
64MJ/kg(from CuS ore
2% Cu)
16.9MJ/kg 24MJ/kg+1.5 MJ/kg
acid plant
SLAG Blister Copper
Low Grade Scrap Convertor
Anode Furnace Refining
Smelting
Black Copper
High Grade Scrap
Table of Contents

Report on Environmental Benefits of RecyclingPage 13
Carbon Footprint for Copper Production
The benchmark energy requirements for the production of cathode copper metal from primary copper ore concentrate by pyrometallurgy, by hydrometallurgy from soluble copper ores, and for secondary cathode copper metal from scrap and secondary sources are in the following table.
Benchmark Energy Requirements for Copper Production
Copper Recovery Method Energy Requirement (MJ/kg Cu)
Carbon Footprint (tCO2/t Cu)
Pyrometallurgy from Ore Concentrate 16.9 1.25Hydrometallurgy from Oxide Ores 25.5 1.57Secondary Production from Scrap 6.3 0.44
Summary
Using the benchmark data for primary and secondary copper production from delivered ore concentrate and scrap respectively, the energy requirements for the production of 100,000 tonnes of copper are:
Energy requirement for pyrometallurgical primary production: 1690TJ Energy requirement for hydrometallurgical primary production: 2550TJ Energy requirement for secondary production: 630TJ
Using the energy data, the carbon footprints for primary and secondary production of copper on the same basis are:
Carbon footprint for pyrometallurgical primary production: 125kt CO2
Carbon footprint for hydrometallurgical primary production: 157kt CO2
Carbon footprint for secondary production: 44kt CO2
Sensitivity analyses on these data are given on page 35 of this report to illustrate the effects of deviations from benchmark conditions.
Pyrometallurgical
MiningBenefication
RoastingSmelting
Fire RefiningElectrorefining
Solvent Extraction (SX)Acid LeachingElectrowinning
Mining
Copper Ore Waste Streams fromCopper Related Processes CuS Ore
Cu Concentrate
Copper Matte
Cu Cathode
Hydrometallurgical
3.2tCO2/t(ore 3% Cu)
0.81tCO2/t
0.21tCO2/t0.23tCO2/t
1.48tCO2/t+ 0.09tCO2/t
acid plant
1.25tCO2/tScrap
Table of Contents

Report on Environmental Benefits of RecyclingPage 14
Primary and Secondary Ferrous Production
Primary ProductionIn 2006, world production of steel was 1,245Mt in which scrap consumption amounted to approximately 440Mt.
A schematic representation of iron recovery and steel manufacture is in the following figure. There are four main routes used for the production of steel, namely: blast furnace/basic oxygen furnace (BF-BOF); electric arc furnace (EAF); direct reduction (DR) and smelting reduction (SR).
Iron Recovery and Steel Manufacture
The BF-BOF route is the most complex and involves the reduction of iron oxide ore with carbon in the furnace.
Liquid iron produced in the blast furnace is referred to as pig iron, and contains about 4% carbon. The amount of carbon has to be reduced to less than 1% for use in steelmaking, and this reduction is achieved in a basic oxygen furnace (BOF) in which carbon reacts with oxygen to give carbon dioxide. The oxidation reaction is exothermic and produces enough energy to produce a melt. Scrap or ore is introduced at this stage to cool the mix and maintain the temperature at approximately 1600-1650°C. Blast furnaces consume about 60% of the overall energy demand of a steelworks, followed by rolling mills (25%), sinter plants (about 9%) and coke ovens (about 7%).
Direct reduction involves the production of primary iron from iron ores to deliver a direct reduced iron (DRI) product from the reaction between ores and a reducing gas in the reactor. The DRI product is mainly used as a feedstock in an electric arc furnace (EAF). The main advantage of this process is that the use of coke as a reductant is not required, thus avoiding the heavy burden on emissions resulting from coke production and use.
The electric arc furnace (EAF) process involves the melting of DRI using the temperature generated by an electric arc formed between the electrode and the scrap metal, producing an energy of about 35MJ/s which is sufficient to raise the temperature to 1600ºC. Depending on the quality of product required, the output of the EAF might need further treatment by secondary metallurgical and casting processes.
Smelting reduction (SR) is a current development that involves a combination of ore reduction and smelting in one reactor, without the use of coke. The product is liquid pig iron which can be treated and refined in the same way as pig iron from the blast furnace.
MiningPelletisation
Sintering
LimestoneCoke Fuel
Ironmaking
BF-Blast Furnace DRI-Direct Reduced Iron
Pig Iron Pig Iron
Basic Oxygen Furnace Steel
Electric Arc Furnace(EAF)
Primary Production Secondary Production
Scrap Collectionand Preparation
Mining
BF-BOF Route DRI-EAF Route EAF Route
Table of Contents

Report on Environmental Benefits of RecyclingPage 15
Secondary ProductionElectric arc furnaces (EAF) are used to produce steel from scrap using the same process as that described for the use of DRI as feedstock. Production of steel from scrap has been reported to consume considerably less energy compared to production of steel from iron ores.
Energy Requirements and Carbon Footprint Tables for Steel ProductionThe literature values for the energy requirements and carbon footprints for the production of steel by different routes are in the following eight tables.
The energy requirements reported for the whole life cycle of steel production from ore to metal via the BF/BOF route and for the conversion of ore concentrate to steel by this route, are presented in the following two tables.
Energy Requirements for Steel Production from Ore via the BF/BOF Route
BF-BOF RouteSource Energy Requirement
(MJ/kg Steel)
Das and Kandpal 29.2Hu et al 25.5Sakamoto 25Norgate 22Price et al (Open Hearth) 20.1Price et al 16.5Phylipsen et al 15.17Mean (SD) 21.9 (5.1)
Energy Requirements for Steel Production from Ore Concentrate via the BF/BOF Route
BF-BOF OnlyEnergy Requirement (MJ/kg Steel)
Ertem and Gurgen 16.58Price et al 15.6Phylipsen et al 15.47Sakamoto 13.4Mean (SD) 15.3 (1.3)
Carbon Footprint for Steel Production via the BF/BOF Route
BF-BOF RouteSource Carbon Footprint
(tCO2/t Steel)
Norgate 2.3Orth et al 2.23Sakamoto 2.15Orth et al 2.14
Table continues on page 16
Table of Contents

Report on Environmental Benefits of RecyclingPage 16
Carbon Footprint for Steel Production via the BF/BOF Route (Continued from Page 15)
BF-BOF RouteSource Carbon Footprint (tCO2/t Steel)Das and Kandpal 2.12Gielen and Moriguchi 2Hu et al 1.97Orth et al 1.82Orth et al 1.69Wang et al 1.32Mean (SD) 1.97 (0.30)
The reported energy requirements for the DRI step of the steel production process, and for the DRI + EAF steps combined, along with assumptions made on the energy source used, are represented in the following two tables. The data for the carbon footprints associated with the energy source used are presented separately in the table below.
Energy Requirements for Steel Production for the DRI Step Only
DRI Only Energy Requirement (MJ/kg Steel)Gielen and Moriguchi 10Phylipsen et al 10.93
Energy Requirements for Steel Production for the DRI + EAF Steps
DRI + EAF Energy Requirement
(MJ/kg Steel)Note
Das and Kandpal 36.9 Coal (India)Das and Kandpal 24 Gas (India)Price et al 19.2 80% DRI + 20% scrap
Carbon Footprint for Steel Production for the DRI + EAF Steps
DRI + EAF Carbon Footprint
(tCO2/t Steel)Note
Das and Kandpal 3.31 Coal (India)Orth et al 1.74 Coal + CircoferDas and Kandpal 1.57 GasOrth et al 1.46 Gas + CircoferGielen and Moriguchi 0.7 Gas Mean (SD) 1.76 (0.96)
The energy requirements and carbon footprints for the electric arc furnace route for production of steel from secondary sources are in the following two tables.
Table of Contents

Report on Environmental Benefits of RecyclingPage 17
Energy Requirements for Steel Production from Scrap in an Electric Arc Furnace
EAF RouteSource Energy Requirement (MJ/kg Steel)Das and Kandpal 14.4Hu et al 11.8Hu et al 11.2Sakamoto et al 9.4Mean (SD) 11.7 (2.1)
Carbon Footprint for Steel Production in an Electric Arc Furnace
EAF RouteSource Carbon Footprint (tCO2/t Steel)Das and Kandpal 1.18Wang et al 0.64Hu et al 0.59Sakamoto et al 0.56Hu et al 0.54Mean (SD) 0.70 (0.27)
The benchmark energy requirements for the production of steel from primary ore concentrate by the BF-BOF route, by the DRI + EAF route and from scrap and secondary sources via the EAF route are in in the following table.
Benchmark Energy Requirements for Steel Production
Steel Recovery Method Energy Requirement (MJ/kg Steel)
Carbon Footprint(tCO2/t Steel)
BF/BOF Route (Mean-SD) 14 1.67DRI + EAF Route (Benchmark) 19.2 0.7EAF Route (Mean) 11.7 0.7
SummaryUsing the benchmark data for primary and secondary steel production from delivered ore concentrate and scrap respectively, the energy requirements for the production of 100,000 tonnes of steel are:
Energy requirement for primary production BF-BOF route: 1400TJEnergy requirement for primary production DRI + EAF route: 1920TJEnergy requirement for secondary production EAF route: 1170TJ
Using the energy data, the carbon footprints for primary and secondary production of steel on the same basis are:
Carbon footprint for primary production BF-BOF route: 167kt CO2
Carbon footprint for primary production DRI + EAF route: 70kt CO2
Carbon footprint for secondary production EAF route: 70kt CO2
Sensitivity analyses on these data are given on page 35 of this report to illustrate the effects of deviations from benchmark conditions.
Table of Contents

Report on Environmental Benefits of RecyclingPage 18
Primary and Secondary Lead Production
The annual production of lead is about 6.2M tonnes with approximately half of that originating from ore. The schematic diagram of the production of primary lead and lead from scrap is in the following figure.
Schematic of Primary Lead Production
Primary ProductionLead sulfide ores usually contain less than 10% of the metal by weight and are concentrated to around 70% before processing. The main method of lead recovery from ores is a blast furnace process that involves three main steps: sintering, smelting and refining. Lead is also recovered in the Imperial smelting furnace process that is designed to recover both lead and zinc from ores. The energy demand for the Imperial smelting process is higher than that for the blast furnace process for lead but is used because it has a significantly lower energy demand for zinc production than alternative processes.
Secondary ProductionLead is easily recycled via pyrometallurgical routes and can be recycled many times without any deterioration or degradation of its properties. A very high proportion of scrap lead comes from spent vehicle batteries. Secondary lead from this source is usually smelted at 1260°C in a rotary reverberatory furnace to produce a slag with a high lead content, along with lead metal for refining. The slag can then be heated in a blast furnace at 1000°C with coke to produce lead (purity 75-85%) and a slag with a low lead content.
Energy Requirement and Carbon Footprint Tables for LeadThe energy requirements for the production of lead from primary sources by the blast furnace and Imperial smelting furnace routes are in the following figure.
Concentration
PbS Ore
Pb
Scrap Pb from Batteries(60% Pb, 15% PbO2, 12% PbSO4)
75-85% Pb
Slag Treatment
Zn/Pb Ore
Blast Furnace Imperial Smelting Furnace Recycling
Sintering
Smelting
Refining
Concentration
Sintering
Smelting
Refining
Smelting
Refining
Table of Contents

Report on Environmental Benefits of RecyclingPage 19
Energy Requirements for the Production of Lead from Primary Sources
Primary ProductionIn 2002, it was reported that 20MJ/kg of energy are required to produce 1kg of lead in the blast furnace process while the Imperial smelting furnace process requires 32MJ/kg for the whole life cycle including mining and concentration, assuming 98.3% and 95% recoveries in the blast furnace and Imperial smelting furnace respectively. The energy requirements excluding the mining and mineral processes obtained from several different sources are reported to be 2.4MJ/kg Pb for the blast furnace route and 2.71MJ/kg Pb for the Imperial smelting furnace route.
Secondary ProductionThe literature contains reports that claim secondary production of lead results in a 60-65% energy saving compared to primary production. Using these data, Norgate estimates a general energy demand of 9.1MJ/kg for secondary lead production.
Life cycle analysis of the secondary process has been conducted, including the processes of disaggregation and remanufacturing that would be carried out at a reprocessing facility. From the data, energy consumption at a reprocessing plant was estimated at a total of 0.40MJ/kg Pb.
The energy chosen as a benchmark for secondary production is that of calculated theoretical melting energies with 50% furnace efficiency.
Carbon Footprint for Lead Production
Concentration
PbS Ore
Pb
Zn/Pb Ore
Blast Furnace Imperial Smelting Furnace
Sintering
Smelting
Refining
20MJ/kg(Coal 35%,
Ore 5.5% Pb,Concentrated
57.9% Pb)
~2.2MJ/kg
~6.0MJ/kg
~1.5MJ/kg
~10MJ/kg(Coal 35%,Ore 5.5% Pb,Concentrated57.9% Pb)
32MJ/kg(Coal 35%,Ore 5.5% Pb,Concentrated57.9% Pb)
Concentration
Sintering
Smelting
Refining
Concentration
PbS Ore
Pb
Zn/Pb Ore
Blast Furnace Imperial Smelting Furnace
Sintering
Smelting
Refining
2.1tCO2/t(Coal 35%,
Ore 5.5% Pb,Concentrated
57.9% Pb)
1.63tCO2/t 2.50tCO2/t 3.2tCO2/t(Coal 35%,Ore 5.5% Pb,Concentrated57.9% Pb)
Concentration
Sintering
Smelting
Refining
Table of Contents

Report on Environmental Benefits of RecyclingPage 20
Carbon footprint data for production of lead calculated by Norgate are given in the previous figure. In 2001, Robertson produced a life cycle analysis of primary lead production based on data from two plants in Australia, one of which is the third largest producer of lead in the world. His calculations for emissions yielded a total value of 4.202tCO2e/t Pb; this value is greater than that obtained by Norgate but it is not absolutely clear how Robertson’s data were derived and what assumptions were made.
The benchmark energy requirements for the production of lead metal from primary ore concentrate and for secondary lead from scrap are in in the following table.
Benchmark Energy Requirements for Lead Production
Lead Recovery Method Energy Requirement (MJ/kg Pb)
Carbon Footprint(tCO2/t Pb)
Primary 10 1.63Secondary Assuming 50% Furnace Efficiency 0.129* 0.015**
*Theoretical minimum energy requirement to melt lead assuming furnace efficiency of 50%**Based on electricity consumption (UK average emission factor)
SummaryUsing the benchmark data for primary and secondary lead production from delivered ore concentrate and scrap respectively, the energy requirements for the production of 100,000 tonnes of lead are:
Energy requirement for primary production of lead: 1000TJEnergy requirement for secondary production of lead: 12.9TJ
Using the energy data, the carbon footprints for primary and secondary production of lead on the same basis are:
Carbon footprint for primary production of lead: 163kt CO2 Carbon footprint for secondary production of lead: 1.5kt CO2
Sensitivity analyses on these data are given on page 35 of this report to illustrate the effects of deviations from benchmark conditions.
Table of Contents

Report on Environmental Benefits of RecyclingPage 21
Primary and Secondary Nickel Production
The International Nickel Study Group quotes a global primary production figure of 1.44Mt for nickel in 2007, and it has been estimated that 0.35M tonnes of nickel is recycled from about 4.5Mt of scrap every year.
Primary ProductionThere are two types of nickel ore that are treated in different ways. The common ores are nickel sulfides (containing about 2% Ni) and these are processed pyrometallurgically. Laterite oxide ores (containing approximately 1% Ni) are treated hydrometallurgically to produce nickel metal, or pyrometallurgically to produce ferronickel. The following figure is a schematic showing the primary production routes.
Schematic for Primary Production of Nickel
The pyrometallurigical process involves concentration of the sulfide ore followed by smelting to produce a matte which is converted to nickel metal and refined by routes such as the Sherritt-Gordon process. Final nickel refining is often carried out by an electrowinning process.
Laterite ores with nickel concentrations greater than 1.7% (saprolite ores) are processed pyrometallurgically in a rotary kiln and an electric furnace to obtain ferronickel. Laterite ores with less than 1.5% nickel (limonite ores) are processed via a hydrometallurgical leaching route with the metal generally being recovered electrolytically.
Secondary ProductionNickel is recycled in different ways depending on its original application. Nickel alloys are often recycled as the same alloys, for example the nickel in stainless steel, where about 40% of the nickel used in the production of stainless steel originates from post-consumer stainless steel scrap. Other secondary nickel arisings tend to be recycled by primary nickel smelters.
Sulfide OreLaterite Ores
Nickel
Limonite Ore
Concentration Concentration Ore Preparation
Saprolite Ore
Ferronickel
Concentration
Smelting Reduction Roast Pressure Acid Leaching Rotary Kiln
Ammonia Leach Neutralisation SmeltingConverting
Solvent Extraction Solvent ExtractionElectrowinning
ConvertingRefining
Reduction
Sintering
Table of Contents

Report on Environmental Benefits of RecyclingPage 22
Energy Requirement and Carbon Footprint Tables for NickelThe energy requirement and carbon footprint data reported in the literature are in the following two figures. The data in the figures are based on publications by Norgate, Kellogg, Chapman and Roberts for the whole life cycle of nickel production from mining to metal, and are expressed as gross energy requirement (GER) in MJ/kg and carbon footprint in kg CO2eq/kg Ni.
Energy Requirement for Production of Nickel
The Norgate data for the whole life cycle – from mining a sulfide ore containing nickel to the recovery of nickel by flash furnace smelting with Sherritt-Gordon refining to recover 78% of the nickel and assuming a 35% energy efficiency – give a GER equal to 114MJ/kg and a carbon footprint of 11.4kgCO2eq/kg Ni. The smelting and refining processes alone are reported to require 2900kWh/t of electricity, producing a carbon footprint of 8.5kgCO2eq/kg Ni.
Carbon Footprint for Production of Nickel
Laterite Ores
Nickel
Limonite Ore Saprolite Ore
Ferronickel
Concentration
Rotary Kiln
Smelting
Solvent ExtractionElectrowinning
ConvertingRefining
Sintering
Ore Preparation
Pressure Acid Leaching
Neutralisation
Concentration
Reduction Roast
Ammonia Leach
Solvent Extraction
Reduction
Sulfide Ore
Concentration
Smelting
Converting
114M
J/kg
(coa
l at 3
5% e
ffic
ienc
y fr
om 2
.3%
Ni o
re)
152M
J/kg
(32.
5% p
ower
pla
nt e
ffic
ienc
y)
100-
200M
J/kg
20.6
4MJ/
kg
340-
800M
J/kg
(all
late
rite
ore
proc
esse
s ge
nera
lly)
194M
J/kg
(coa
l at 3
5% e
ffic
ienc
y from
1.0
% N
i ore
)
Laterite Ores
Nickel
Limonite Ore Saprolite Ore
Ferronickel
Concentration
Rotary Kiln
Smelting
Solvent ExtractionElectrowinning
ConvertingRefining
Sintering
Ore Preparation
Pressure Acid Leaching
Neutralisation
Concentration
Reduction Roast
Ammonia Leach
Solvent Extraction
Reduction
Sulfide Ore
Concentration
Smelting
Converting
11
.4kg
CO
2eq
/kg
8.5
kgC
O2eq
/kg
15
kgC
O2eq
/kg
16
.1kg
CO
2eq
/kg
Table of Contents
Report on Environmental Benefits of RecyclingPage 23
Norgate’s data for the whole life cycle of a 1% laterite ore – with nickel recovery by pressure acid leaching followed by solvent extraction and electrowinning to recover 92% of the nickel assuming a 35% energy efficiency – give a GER value of 194MJ/kg and a carbon footprint of 16.1kgCO2eq/kg Ni. The pressure leach and solvent extraction/electrowinning stages of the hydrometallurgical process are reported to require 7651kWh/t of electricity, giving a carbon footprint of 15kgCO2eq/kg Ni.
A study of the effects of ore concentration on GER and carbon footprint suggested that lowering the ore grade from 2.4% to 0.3% Ni resulted in an increase in GER from 130MJ/kg to 370MJ/kg and in carbon footprint from about 18kgCO2eq/kg Ni to 85kgCO2eq/kg Ni.
Chapman and Roberts report GER values for the whole life cycle of 100-200MJ/kg for processing sulfide ores and 340-800 MJ/kg for processing laterite ores. Kellogg’s energy requirement value is 152MJ/kg to recover nickel from processing to mining nickel ingot, assuming 32.5% energy efficiency.
On the basis of an assumption of 90% energy savings for secondary nickel production and based on the European average for hydrometallurgical and pyrometallurgical use, Norgate estimates a 15.4-15.8MJ/kg energy requirement for secondary nickel recovery.
Taylor has reported that recycling of nickel-based superalloys into a superalloy ingot requires only 14% of the primary “material fuel equivalent”, including transportation, sorting and processing.
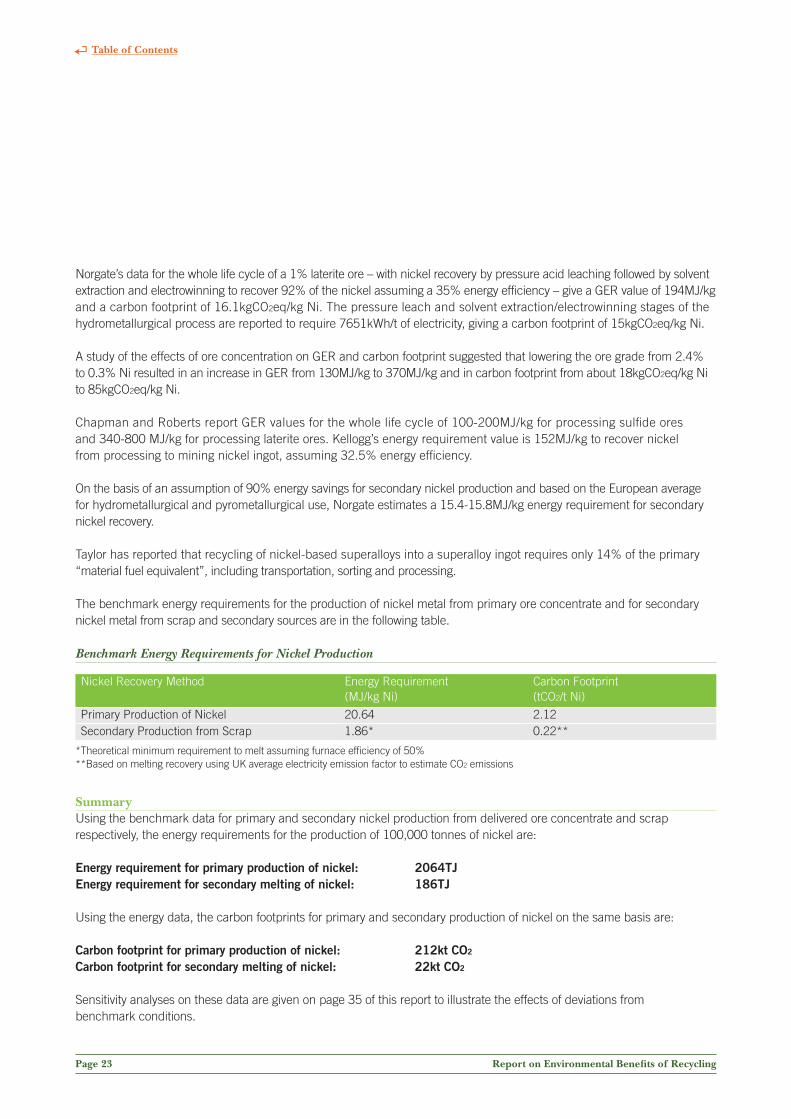
The benchmark energy requirements for the production of nickel metal from primary ore concentrate and for secondary nickel metal from scrap and secondary sources are in the following table.
Benchmark Energy Requirements for Nickel Production
Nickel Recovery Method Energy Requirement (MJ/kg Ni)
Carbon Footprint(tCO2/t Ni)
Primary Production of Nickel 20.64 2.12Secondary Production from Scrap 1.86* 0.22**
*Theoretical minimum requirement to melt assuming furnace efficiency of 50%**Based on melting recovery using UK average electricity emission factor to estimate CO2 emissions
SummaryUsing the benchmark data for primary and secondary nickel production from delivered ore concentrate and scrap respectively, the energy requirements for the production of 100,000 tonnes of nickel are:
Energy requirement for primary production of nickel: 2064TJEnergy requirement for secondary melting of nickel: 186TJ
Using the energy data, the carbon footprints for primary and secondary production of nickel on the same basis are:
Carbon footprint for primary production of nickel: 212kt CO2
Carbon footprint for secondary melting of nickel: 22kt CO2
Sensitivity analyses on these data are given on page 35 of this report to illustrate the effects of deviations from benchmark conditions.
Table of Contents

Report on Environmental Benefits of RecyclingPage 24
Primary and Secondary Tin Production
In 2007, approximately 300,000 tonnes of tin was recovered from ore worldwide, and an additional amount of approximately 50,000 tonnes was produced from scrap and other secondary sources.
Primary ProductionThe main ore of tin is cassiterite. The ores need to be concentrated prior to smelting in the presence of carbon to obtain the metal that can be subsequently refined by pyrorefining or electrolytic refining to produce metal of high purity. The following figure is a schematic of the processes involved in the recovery of tin from cassiterite ores.
A Schematic of the Processes Involved in Primary Production of Tin
Secondary ProductionTin can be recovered from secondary sources via pyrometallurgical treatment by melting the scrap and purifying the metal obtained by similar refining processes to that used in primary production. Tin can also be recovered from secondary sources by hydrometallurgical routes in which either alkali or acid leach solutions can be used, with final recovery usually involving electrowinning of the tin from leach solutions.
Energy Requirement and Carbon Footprint Tables for TinThe energy requirement for the whole life cycle production of tin from mining the ore to refined metal from a low-grade ore has been reported as 200MJ/kg. The energy requirements for the smelting and refining stages only have been recorded as 19.6MJ/kg from alluvial ores and 127MJ/kg from hard rock ores, and a value of 20MJ/kg has been calculated for these stages based on a 32.5% energy efficiency.
The energy requirements reported for the production of primary tin are given in the following figure.
Primary Ore
Concentration (Complex)
Roasting
Reduction
Refining
Tin
Table of Contents

Report on Environmental Benefits of RecyclingPage 25
Energy Requirements for Primary Tin Production
The benchmark energy requirements for the production of tin metal from primary tin ore concentrate and for secondary tin metal from scrap and secondary sources are in the following table.
Benchmark Energy Requirements for Tin Production
Tin Recovery Method Energy Requirement (MJ/kg Sn)
Carbon Footprint(tCO2/t Sn)
Primary production of tin 18.2* 2.18***Secondary production of tin from scrap 0.2** 0.024****
*Based on data shown but recalculated at 35% plant efficiency **Theoretical minimum requirement to melt assuming furnace efficiency of 50%*** Based on emissions of 0.12kgCO2/MJ, as found in processes with similar chemistry ****Based on melting recovery using UK average electricity emission factor to estimate CO2 emissions
SummaryUsing the benchmark data for primary and secondary tin production from delivered ore concentrate and scrap respectively, the energy requirements for the production of 100,000 tonnes of tin are:
Energy requirement for primary production of tin: 1820TJEnergy requirement for secondary production of tin: 20TJ
Using the energy data, the carbon footprints for primary and secondary production of tin on the same basis are:
Carbon footprint for primary production of tin: 218kt CO2
Carbon footprint for secondary production of tin: 2.4kt CO2
Sensitivity analyses on these data are given on page 35 of this report to illustrate the effects of deviations from benchmark conditions.
Primary Ore
Concentration (Complex)
Roasting
Reduction
Refining
Tin
19.6MJ/kg or 127.0MJ/kgDepending on type of ore
20MJ/kg (32.5% powerplant efficiency)
200MJ/kg (32.5% powerplant efficiency)
Table of Contents

Report on Environmental Benefits of RecyclingPage 26
Primary and Secondary Zinc Production
The estimated worldwide production of zinc metal in 2007 was 11.4Mt. Of the total production of smelter zinc (10.6Mt), 4.97Mt are categorised as either primary or secondary, and the remaining 5.63Mt (53%) are not differentiated. Production from secondary is estimated at 7.5% of the differentiated 4.97Mt.
Primary ProductionZinc is produced from zinc sulfide ores containing between 2 and 30% zinc, which are concentrated by froth flotation. Primary zinc metal can be recovered from ore concentrates by both pyrometallurgical and hydrometallurgical processes as shown in the schematic diagram in the following figure.
Schematic for Zinc Production
In the hydrometallurgical process, ore concentrate is roasted to convert the sulfide to zinc oxide which is then leached out in sulfuric acid to give a leach solution that can be purified before recovering zinc by electrowinning.
The pyrometallurgical process makes use of a sulfide ore concentrate that is high in lead and zinc, and recovers both metals simultaneously. This process has three main steps: (i) sintering in which the sulfide ore is converted to zinc oxide, (ii) smelting in the presence of carbon to reduce the oxide to zinc metal, and (iii) distillation in which the zinc is evaporated off as zinc vapour and cooled to obtain the zinc metal.
Secondary ProductionThe routes for secondary processing of zinc depend upon the types of zinc-containing secondary material being recycled, and in some cases the primary feed may include some secondary material as shown in the life cycle diagram in the following figure.
Concentration
ZnS Ore
Zn Ingot
Zn/Pb Ore
Hydrometallurgy Pyrometallurgy (Imperial Smelting Furnace)
Roasting
Leaching
Electrolysis
Concentration
Sintering
Smelting
Refining
Casting Casting
Table of Contents

Report on Environmental Benefits of RecyclingPage 27
Life Cycle Diagram Illustrating Zinc Flows
Clean and mixed scrap can be treated by sweating whereby the scrap is heated at 360-420°C to melt zinc for recovery, leaving other impurities such as copper, aluminium and iron in a solid slag. Zinc alloy scrap can also be recovered by a similar process to recover the metal as the alloy and zinc oxide residues can be converted to zinc by dissolving them in sulfuric acid and recovering the metal by electrowinning.
Energy Requirement and Carbon Footprint Tables for ZincThe literature values for the energy requirements and carbon footprints for the production of primary zinc by different routes are given in the following two figures respectively.
Two values have been reported for the energy savings made when secondary production is used instead of primary viz. 75% by Norgate (apparently based on a position paper on recycling by EuroMetaux) and 60% by Gaballah (based on US Institute of Scrap Recycling Industries data from 1993). From these assumptions, Norgate estimated the total energy consumption to recover secondary zinc as 13.7MJ/kg Zn. In 1982, Kellogg stated that secondary processing requires about 5-40% of the energy required for primary processing. None of these data, however, seem to be based on fundamental energy data measurements.
Energy Requirements for the Primary Production of Zinc
Secondary Zinc
Zinc Smelter
Total Scrap
Zinc OreOld Scrap
Zinc Products
Process Scrap
Concentration
ZnS Ore
Zn Ingot
Zn/Pb Ore
Hydrometallurgy Pyrometallurgy (Imperial Smelting Furnace)
Roasting
Leaching
Electrolysis
Concentration
Sintering
Smelting
Refining
Casting Refining
48MJ/kg(8.6% Zn ore)
50MJ/kg(High grade)
35MJ/kg(Conventional)
36MJ/kg(8.6% Zn ore)
38MJ/kg(Low grade)
45MJ/kg(High grade)
1.33MJ/kg(High grade)
3.57MJ/kg(High grade)
40MJ/kg(High grade)
1.49MJ/kg(High grade)
2.51MJ/kg(High grade including
fuel and coke)
40MJ/kg(High grade including
fuel and coke)
7.28MJ/kg(High grade
including fuel)24MJ/kg 29MJ/kg
Table of Contents

Report on Environmental Benefits of RecyclingPage 28
Carbon Footprint for the Primary Production of Zinc
The energy data and carbon footprint data that have been reported for zinc recovery from flue dust are in the following two tables.
Energy Requirements for Processes Associated with the Recovery of Zinc from Scrap
Secondary Processing of Zinc Flue DustProcess Energy Requirement
(MJ/kg Zn)% Electricity Additional
Dezincing 54 Waelz-Kiln Process 18 93 1.2tcoke/t ZnEZINEX 35 82 DC-furnace 27 96 0.27tcoke/t Zn
Carbon Footprint Data for Processes Associated with the Recovery of Zinc from Scrap
Secondary Processing of Zinc Flue DustProcess Carbon Footprint
(tCO2/t Zn)
Dezincing 4.6Waelz-Kiln Process
0.7-1.4EZINEXDC-furnace
The benchmark energy requirements for the production of zinc metal from primary zinc ore concentrate and for secondary zinc metal from scrap and secondary sources are in the following table. Although an energy value of 16.4MJ/kg has been reported in Europe for the primary production of zinc via a combination of hydrometallurgical and pyrometallurgical routes, in this work we have used the value of 24MJ/kg as this is more defendable.
Concentration
ZnS Ore
Zn Ingot
Zn/Pb Ore
Hydrometallurgy Pyrometallurgy (Imperial Smelting Furnace)
Roasting
Leaching
Electrolysis
Concentration
Sintering
Smelting
Refining
Casting Refining
4.6tCO2/t(8.6% Zn ore)
3.3tCO2/t(8.6% Zn ore)
3.5tCO2/t(8.6% Zn ore)0.096tCO2/t
0.111tCO2/t
2.01tCO2/t
0.153tCO2/t
2.36tCO2/t
2.5tCO2/t(8.6% Zn ore)
Table of Contents

Report on Environmental Benefits of RecyclingPage 29
Benchmark Energy Requirements for Zinc Production
Zinc Recovery Method Energy Requirement (MJ/kg Zn)
Carbon Footprint(tCO2/t Zn)
Primary production of zinc 24 2.36Secondary production from scrap 18 1.4Secondary zinc vaporisation 4.7* 0.56**
*Theoretical minimum with 50% furnace efficiency**UK average electricity emission factor to estimate CO2 emissions
SummaryUsing the benchmark data for primary and secondary zinc production from delivered ore concentrate and scrap respectively, the energy requirements for the production of 100,000 tonnes of zinc are:
Energy requirement for primary production of zinc: 2400TJEnergy requirement for secondary production of zinc: 1800TJEnergy requirement for secondary vaporisation of zinc: 470TJ
Using the energy data, the carbon footprints for primary and secondary production of zinc on the same basis are:
Carbon footprint for primary production of zinc: 236kt CO2
Carbon footprint for secondary production of zinc: 140kt CO2
Carbon footprint for secondary vaporisation of zinc: 56kt CO2
Sensitivity analyses on these data are given on page 35 of this report to illustrate the effects of deviations from benchmark conditions.
Table of Contents

Report on Environmental Benefits of RecyclingPage 30
Comparison of the primary and secondary papermaking industry is complicated for the following reasons:• Recycledpulpandvirginpulpareoftencombinedbeforemanufacture• Papercanberecycledonly3-6timesbeforeitdegrades• Thepaperproductfromrecyclingwillbeofalowerqualitythanfromprimarysources• Sometypesofpapercanbemadeonlyfrom100%virginpulp• Recycledpulpcannotbeusedalone;someprimarypulpisalwaysrequired• Paperisproducedfromarenewableresource• Asawaste,papercontainsenergythatcanberecoveredbyincineration• PrimaryproductionremovestreesandthereforereducesCO2 uptake by the trees • Mostliteraturecomparesdisposaloptionsratherthanproductionoptions
Primary and Secondary Production of Paper
The primary and secondary production of paper is illustrated schematically in the figure below.
Primary ProductionIn the primary manufacture of paper, trees must be harvested, debarked, chipped at the sawmill and pulped with water. Pulping can be conducted by adding chemicals or by mechanical beating which will break down the lignin in wood and allow the pulp to form. Chemical pulping is expensive because the paper yield from wood is very low, but the paper produced is strong. Mechanical pulping is much cheaper despite the considerable use of electrical energy because it leads to a high yield of paper product from the wood, although this paper is much weaker. More water is added to the pulp before chemicals and dyes are added prior to the refining, screening and cleaning of the pulp which is then used in paper manufacture.
Schematic for the Primary and Secondary Production of Paper
Primary and Secondary Paper Production
Approximately 365 million tonnes of paper and paperboard are produced globally per annum, with about 46% from secondary sources.
Harvest
Trees Scrap Paper
Paper
Debarking
Chipping
Mechanical Pulping Chemical Pulping
Hydropulping
Blend Chest
Refining
Screening and Cleaning
Papermill
Sorting
Shredding
Hydropulper
Deinking
Blend Chest
Refining
Screening and Cleaning
Papermill
Table of Contents

Report on Environmental Benefits of RecyclingPage 31
Secondary ProductionWaste paper from various sources is sorted, shredded, pulped with water and cleaned to remove impurities such as wire, plastic, paperclips and staples that may be in the mix. A de-inking cell cleans the pulp, removing ink and sticky substances. The pulp is fed into a blend chest where chemicals and dyes are added that will influence the character and appearance of the final product. The pulp is refined using a mechanical abrasive and bruising action before being screened, cleaned to remove any dirt or grit, and used in the manufacture of paper.
Energy Requirements and Carbon Footprint for Paper Production The global average energy requirements for the production of 1 tonne of paper has been reported as 10.8GJ of thermal energy and 4.5GJ of electrical energy, and it has been claimed that primary production requires 40% more energy than secondary production, but more fossil fuels are required to make secondary paper. It has also been reported that to produce paper from wood and then recycle it back into paper requires 22-53MJ/kg, excluding transportation.
Reported Energy Requirements in Primary and Secondary Paper Manufacture
A review in 2007 of high-quality Life Cycle Analyses that compared disposal options for paper concluded that recycling is a better option than landfill or incineration in terms of energy demand.
Schenk has compared energy requirements for chemically and mechanically processed paper manufacturing methods, using varying amounts of recyclate in the feedstock. For the use of 100% virgin pulp, the energy requirement is 12MJ/kg for chemical processing and 28MJ/kg for mechanical processing. If recycled pulp is added to the process, the energy consumption will be increased in the chemical process but decreased in the mechanical process.
Harvest
Trees Scrap Paper
Paper
Debarking
Chipping
MechanicalPulping
ChemicalPulping
Hydropulping
Blend Chest
Refining
Screening and Cleaning
Papermill
Sorting
Shredding
Hydropulper
Deinking
Blend Chest
Refining
Screening and Cleaning
Papermill
Thermal: 10.8MJ/kgElectrical: 4.5MJ/kg
Primary manufacturefollowed by recycle:22-53MJ/kg
36MJ/kg scrap
Chemical: 12MJ/kgMechanical: 28MJ/kg
28-41MJ/kg 8.25MJ/kg
Thermal: 0.4MJ/kgElectrical: 1.4MJ/kg
16-21MJ/kg
Table of Contents

Report on Environmental Benefits of RecyclingPage 32
An updated report by The Paper Task Force in 2002 gave information on primary and secondary paper production. The types of paper considered were newsprint, corrugated, office paper and paperboard. The scope of the assessment was broad, including all activities involved in the three scenarios from tree felling and waste paper collection to landfill consequences and incinerator ash disposal. For ease of comparison and simplification of analysis, it was considered that in the recycling scheme the pulp was 100% waste paper. In order to prepare paper of good quality, however, it would not be possible to use 100% pulp from recycled sources. Data obtained from the literature on energy use and direct CO2 emissions are in the following table.
Energy Use and CO2 Emissions for Paper Production
UNITS Newsprint Corrugated Containers
Office Paper CUK Paperboard
SBS Paperboard
Virgin Manufacture Total Energy MJ/kg paper managed 39 28 40 28 41Purchased Energy MJ/kg paper managed 36 15 19 14 19Fossil Fuel Energy MJ/kg paper managed 26 13 14 12 14Recycled ManufactureTotal Energy MJ/kg paper managed 21 19 21 17 16Purchased Energy MJ/kg paper managed 21 19 21 17 16Fossil Fuel Energy MJ/kg paper managed 16 16 16 13 13GHG Emissions – Whole System Minus Waste Management and Material RecoveryVirgin CO2eqt/t paper 0.0023 0.0014 0.0014 0.0009 0.0027Recycle CO2eqt/t paper 0.0013 0.0013 0.0017 0.0013 0.0014
The data in the table above, which are for paper manufacturing steps only (i.e. excluding tree harvesting and transport, and waste paper collection and sorting), show that the total energy requirement for the recycling process is always less than the total energy for paper produced from virgin sources.
Values have been calculated by the Ecobilan Group for the energy requirement and CO2 emissions for recycling paper but are reported per tonne of waste paper treated rather than per tonne of paper produced.
The carbon footprints (in the following figure) for the whole life cycle of primary and secondary paper manufacture and the numerical values obtained from the literature on energy use and carbon footprint are given in the following table.
Table of Contents

Report on Environmental Benefits of RecyclingPage 33
Carbon Footprint Measurements
Energy Use and Carbon Footprint Data for Primary and Secondary Paper Production
Measure Units ValueThermal + Electrical Energy MJ/kg 10.8 + 4.5Primary Paper Production + Recycle Primary Paper Production + IncinerationClosed Recycle Scheme with Nearby Papermill
MJ/kgMJ/kgMJ/kg
22-5311-408.25
100% Primary Pulp – Chemical Process 100% Primary Pulp – Mechanical Process100% Paper Recycling Rate (Energy per Ton of Total Paper Production)
Chemical Primary Processing Chemical Secondary Processing Mechanical Primary Processing Mechanical Secondary Processing
MJ/kg
MJ/kg MJ/kgMJ/kgMJ/kg
1228
413517
Primary Manufacture (Total Energy) Recycled Manufacture (Total Energy)
MJ/kg 28-4116-21
Specific Energy Consumption – Primary MJ/kg 8.7-16.9Primary Energy Used in Secondary Production (In Terms of Waste Paper Treated)
MJ/kg 36.2
Primary Energy to Produce a Clean Fibre Pulp from Wastepaper MJ/kg 3.9Overall Energy to Produce 1 Tonne Recycled Paper MJ/kg 16.3
Harvest
Trees Scrap Paper
Paper
Debarking
Chipping
MechanicalPulping
ChemicalPulping
Hydropulping
Blend Chest
Refining
Screening and Cleaning
Papermill
Sorting
Shredding
Hydropulper
Deinking
Blend Chest
Refining
Screening and Cleaning
Papermill
0.0009-0.0027kgCO2eq/kg
0.0013-0.0017kgCO2eq/kg
Table continues on page 34
Table of Contents

Report on Environmental Benefits of RecyclingPage 34
Energy Use and Carbon Footprint Data for Primary and Secondary Paper Production (Continued from Page 33)
Measure Units ValueGHG Emissions Primary Production Secondary Production
tCO2eq/t tCO2eq/t
0.0009-0.00270.0013-0.0017
CO2 Emissions (In Terms of Waste Paper Treated) Secondary Production
tCO2/t 1.4
GHG’s over 20 years (In Terms of Waste Paper Treated) Secondary Production
tCO2eq/t 1.4
Text written in italics signifies the secondary process.
The benchmark figures for the energy requirement and carbon footprint for the manufacture of newsprint by primary and secondary sources are given in the following table.
Benchmark Energy Requirements for Paper Production
Paper Recovery Method Energy Requirement (MJ/kg Paper)
Carbon Footprint(tCO2/t Paper)
Primary 35.2 0.0017Secondary 18.8 0.0014
SummaryUsing the benchmark data for primary and secondary paper production from virgin pulp and scrap respectively, the energy requirements for the production of 100,000 tonnes of paper are:
Energy requirement for primary production: 3520TJEnergy requirement for secondary production: 1880TJ
Using the energy data, the carbon footprints for primary and secondary production of paper on the same basis are:
Carbon footprint for primary production: 0.17ktCO2
Carbon footprint for secondary production: 0.14ktCO2
Sensitivity analyses on these data are given on page 35 of this report to illustrate the effects of deviations from benchmark conditions.
Table of Contents

Report on Environmental Benefits of RecyclingPage 35
Sensitivity analysis can be carried out on any input parameter but the following are given as examples of variation in:(i) secondary production energy requirement data compared with the primary benchmark;(ii) primary production energy requirement data from the benchmark;(iii) carbon footprint data for secondary recovery compared with the primary benchmark;(iv) carbon footprint data for primary production from the primary benchmark;(v) energy and carbon footprint data expressed for different countries or regions depending on their fuel/energy balance.
Variation in Secondary Energy Requirement compared with Primary
The data in in the following table show how variations would arise in energy requirement data if a given process deviated from the benchmark data process. Variations are calculated for deviations of -10, -5, +5, +10, +15, +20, +30, +40, +50, +90 and +100%. The data presented in the three tables after the following table, are calculated for deviations of -10, -5, +5, +10, +15, +20, +30, +40, +50 and +100%.
For aluminium, copper, lead, nickel and tin, even if a given process deviates by 100% from the benchmark, an energy saving would still be predicted (figure on the following page). However, for ferrous, zinc and paper, deviations of less than 100% would result in the prediction of an energy balance in favour of primary production.
Variation in Primary Energy Data from Benchmark Values
The sensitivity analyses on the primary energy data are expressed in the same way and show the variation in energy requirement with deviations from the primary benchmark data (table on p.37) that would have to be compared with the energy requirement for secondary production in given situations.
Sensitivity Analysis for Secondary Energy Requirement Data vs. Primary Benchmark Data (Expressed in TJ/kg)
Material Primary Secondary Sensitivity Analysis of Secondary Recovery Data -10% -5% 0% 5% 10% 15% 20% 30% 40% 50% 90% 100%Aluminium 4700 240 216 228 240 252 264 276 288 312 336 360 456 480Copper 1690 630 567 599 630 662 693 725 756 819 882 945 1197 1260Ferrous 1400 1170 1053 1112 1170 1229 1287 1346 1404 1521 1638 1755 2223 2340Lead 1000 13 12 12 13 14 14 15 16 17 18 20 25 26Nickel 2064 186 167 177 186 195 205 214 223 242 260 279 353 372Tin 1820 20 18 19 20 21 22 23 24 26 28 30 38 40Zinc 2400 1800 1620 1710 1800 1890 1980 2070 2160 2340 2520 2700 3420 3600Paper 3520 1880 1692 1786 1880 1974 2068 2162 2256 2444 2632 2820 3572 3760
The benchmark figures extracted from the primary literature in this work represent data for situations that are said to be achievable. To account for any variations arising from differences in processes, however, sensitivity analyses can be carried out on any of the input data in order to show how differences in process parameters would be reflected in the overall energy saving and carbon footprint results.
Sensitivity Analyses
Table of Contents

Report on Environmental Benefits of RecyclingPage 36
Diagrammatic Representation of Changes in Secondary Energy Requirements vs Primary Benchmark Data
0
-10% 0% 10%
20%
40%
100%
Aluminium 240 Primary Benchmark 4700
5,000
4,000
3,000
2,000
1,000
0
-10% 0% 10
%
20%
40%
100%
Ferrous 1170 Primary Benchmark 1400
2,500
2,000
1,500
1,000
500
0
-10% 0% 10%
20%
40%
100%
Copper 630 Primary Benchmark 1690
0
-10% 0% 10
%
20%
40%
100%
Lead 13 Primary Benchmark 1000
1,000
800
600
400
200
2,000
1,600
1,200
800
400
0
-10% 0% 10%
20%
40%
100%
Nickel 186 Primary Benchmark 2046
2,500
2,000
1,500
1,000
500
-10% 0% 10%
20%
40%
100%
Zinc 1800 Primary Benchmark 2400
0
-10% 0% 10%
20%
40%
100%
Tin 20 Primary Benchmark 1820
2,000
1,600
1,200
800
400
0
4,000
3,000
2,000
1,000
3,500
2,500
1,500
500
-10% 0% 10%
20%
40%
100%
Paper 1880 Primary Benchmark 3520
0
4,000
3,000
2,000
1,000
3,500
2,500
1,500
500
Table of Contents

Report on Environmental Benefits of RecyclingPage 37
Sensitivity Analysis for Primary Energy Requirement Data vs. Primary Benchmark Data (Expressed in TJ/kg)
Material Primary Sensitivity Analysis of Primary Data -10% -5% 0% 5% 10% 15% 20% 30% 40% 50% 100%Aluminium 4700 4,230 4,465 4,700 4,935 5,170 5,405 5,640 6,110 6,580 7,050 9,400Copper 1690 1,521 1,606 1,690 1,775 1,859 1,944 2,028 2,197 2,366 2,535 3,380Ferrous 1400 1,260 1,330 1,400 1,470 1,540 1,610 1,680 1,820 1,960 2,100 2,800Lead 1000 900 950 1,000 1,050 1,100 1,150 1,200 1,300 1,400 1,500 2,000Nickel 2064 1,858 1,961 2,064 2,167 2,270 2,374 2,477 2,683 2,890 3,096 4,128Tin 1820 1,638 1,729 1,820 1,911 2,002 2,093 2,184 2,366 2,548 2,730 3,640Zinc 2400 2,160 2,280 2400 2,520 2,640 2,760 2,880 3,120 3,360 3,600 4,800Paper 3520 3,168 3,344 3,520 3,696 3,872 4,048 4,224 4,576 4,928 5,280 7,040
Variation in Carbon Footprint for Secondary Production Compared with Primary Production
The data in the second table on page 38 show how variations would arise in carbon footprint data if a given process deviated from the benchmark data process. The sensitivity analysis is calculated across the same range; for all of the metals studied, deviations by plus 100% from the benchmark still lead to the prediction of carbon dioxide savings from the secondary process, but for paper production deviations of greater than 30% would lead to a prediction of a carbon footprint in favour of primary production.
Variation in Carbon Footprint Data for Primary Production from the Benchmark Data
The sensitivity analyses on primary carbon footprint data are expressed in the same way and show the variation in CO2 emissions with deviations from the primary benchmark data (third table on p.38) that would have to be compared with the carbon footprint for secondary production in given situations.
Variation in Energy by Country
One obvious potential variation in energy use between countries or regions depends upon the nature of the energy source, ranging from efficient hydroelectric production of electricity to the use of low-grade coals. The following table shows the emission factors for different fuels averaged for the following 14 European countries (Europe-14): Austria, Belgium, Denmark, Finland, France, Germany, Greece, Ireland, Italy, Netherlands, Portugal, Spain, Sweden and the UK.
0
-10% 0% 10%
20%
40%
100%
Aluminium 240 Primary Benchmark 4700
5,000
4,000
3,000
2,000
1,000
0
-10% 0% 10%
20%
40%
100%
Ferrous 1170 Primary Benchmark 1400
2,500
2,000
1,500
1,000
500
0
-10% 0% 10%
20%
40%
100%
Copper 630 Primary Benchmark 1690
0
-10% 0% 10%
20%
40%
100%
Lead 13 Primary Benchmark 1000
1,000
800
600
400
200
2,000
1,600
1,200
800
400
0
-10% 0% 10%
20%
40%
100%
Nickel 186 Primary Benchmark 2046
2,500
2,000
1,500
1,000
500
-10% 0% 10%
20%
40%
100%
Zinc 1800 Primary Benchmark 2400
0
-10% 0% 10%
20%
40%
100%
Tin 20 Primary Benchmark 1820
2,000
1,600
1,200
800
400
0
4,000
3,000
2,000
1,000
3,500
2,500
1,500
500
-10% 0% 10%
20%
40%
100%
Paper 1880 Primary Benchmark 3520
0
4,000
3,000
2,000
1,000
3,500
2,500
1,500
500
Table of Contents

Report on Environmental Benefits of RecyclingPage 38
CO2 Emission Factors in kg/GJ, Average for Europe-14
State Type of Fuel CO2 Emissions Factor in (kg/GJ)
Gas Natural Gas 56.3Liquid Natural Gas Liquids 63.8Liquid Crude Oil 73.6Liquid Orimulsion* 80.7Solid Anthracite 98.7Solid Bituminous Coal 94.8Solid Sub-bituminous Coal 96.7Solid Lignite 105.5Solid Peat 106.8
* Orimulsion is a bitumen based fuel from Venezuela.
The data in the table above are averaged over the 14 European countries but they also vary with the source of extraction. For example, although the average factor for bituminous coal in Europe-14 is 94.8, the UK average is 83.3 and for Canada the factor is 80.3kgCO2/GJ.
Sensitivity Analysis for Secondary Carbon Footprint Data vs Primary Benchmark Data (Expressed in kTCO2/t)
Material Primary Secondary Sensitivity Analysis of Secondary CO2 Data -10% -5% 0% 5% 10% 15% 20% 30% 40% 50% 100%Aluminium 383 29 26 28 29 30 32 33 35 38 41 44 58Copper 125 44 40 42 44 46 48 51 53 57 62 66 88Ferrous 167 70 63 67 70 74 77 81 84 91 98 105 140Lead 163 2 2 2 2 2 2 2 2 3 3 3 4Nickel 212 22 20 21 22 23 24 25 26 29 31 33 44Tin 218 3 3 3 3 3 3 3 4 4 4 5 6Zinc 236 56 50 53 56 59 62 64 67 73 78 84 112Paper 0.17 0.14 0.13 0.13 0.14 0.15 0.15 0.16 0.17 0.18 0.20 0.21 0.28
Sensitivity Analysis for Primary Carbon Footprint Data vs. Primary Benchmark Data (Expressed in kTCO2/t)
Material Primary Sensitivity Analysis of Primary CO2 Data -10% -5% 0% 5% 10% 15% 20% 30% 40% 50% 100%Aluminium 383 345 364 383 402 421 440 460 498 536 575 766Copper 125 113 119 125 131 138 144 150 163 175 188 250Ferrous 167 150 159 167 175 184 192 200 217 234 251 334Lead 163 147 155 163 171 179 187 196 212 228 245 326Nickel 212 191 201 212 223 233 244 254 276 297 318 424Tin 218 196 207 218 229 240 251 262 283 305 327 436Zinc 236 212 224 236 248 260 271 283 307 330 354 472Paper 0.17 0.15 0.16 0.17 0.18 0.19 0.20 0.20 0.22 0.24 0.26 0.34
Table of Contents

Report on Environmental Benefits of RecyclingPage 39
Many primary and secondary production processes for metals rely on electricity as a source of energy, and the data in the following table show the benchmark CO2 emissions in the generation of electricity from different energy sources. A US Department of Energy report provides information on the electricity emission factors worldwide between 1999 and 2002, averaged by region, and these are recorded in the table at the bottom of this page.
Benchmark CO2 Emissions in Generation of Electricity from Different Energy Sources
Minimum Emissions for Production of Electricity from Different Sources (kgCO2/GJ)
Coal 238.9Oil 190.6Natural Gas 127.8Biomass 8.6Solar PV 8.3Hydro 4.4Wind 4.2Nuclear 2.5
Electricity Emission Factor by Region
Region Electricity Emission Factor (kgCO2/GJ)
Non-OECD Asia 224.8Middle East 206.3Africa 189.7U.S. 187.8Mexico 164.8Non-OECD Europe and Eurasia 142.5OECD Asia 142.0OECD Europe 107.4Canada 62.0Central and South America 56.7
The data provided in this section show that there are large variations in carbon footprints arising from the differences in the sources of energy available between regions. For the purposes of this report, copper has been used as an example.
The estimated primary production of copper in 2007 was 15.6M tonnes. The following table shows the mine production of copper in the largest producing countries.
Table of Contents

Report on Environmental Benefits of RecyclingPage 40
Largest Copper Mine Producers and Production in 2007
Country Copper Mine Production (Mt)Chile 5.70Peru 1.20U.S. 1.19China 0.92Australia 0.86Indonesia 0.78Russia 0.73Canada 0.58Zambia 0.53Poland 0.47Kazakhstan 0.46Mexico 0.40Total 13.82
The production of 100,000 tonnes of primary copper following the pyrometallurgical route can be compared for different countries on the basis of electricity emission factors. To do this, it is assumed that all countries initially have the same specific energy requirement (the benchmark data taken from table on page 13 and presented in the table below). Assuming that the energy requirement can be based on electricity emission factors, the emissions of CO2 per 100,000 tonnes of primary copper production compared with the benchmark value of 125 for different countries are given in the table below.
Benchmark Energy Requirements for Primary and Secondary Copper Production
Copper Recovery Method Energy Requirement (MJ/kg Cu)Pyrometallurgy from Ore Concentrate 16.9Secondary Production from Scrap 6.3
CO2 Emissions per 100,000 Tonnes of Copper Production in Selected Countries
Country Electricity Emission Factor (kgCO2/GJ)
Emissions in ktCO2 (100,000 tonnes Cu)
Kazakhstan 359.2 607Australia 256.8 434China 233.1 394Poland 202.7 343Indonesia 200.5 339U.S. 187.8 317Mexico 164.8 279Russia 97.5 165Chile 92.4 156Benchmark 125Canada 62.0 105Peru 41.1 70Zambia 1.9 3
Table of Contents

Report on Environmental Benefits of RecyclingPage 41
The data for production of 100,000 tonnes of secondary copper are given along with the benchmark figure in the following table.
CO2 Emissions per 100,000 Tonnes of Secondary Copper Production in Selected Countries
Country Electricity Emission Factor (kgCO2/GJ)
Emissions in ktCO2 (100,000 tonnes 2ary Cu)
India 277.4 175Australia 256.8 162South Africa 253.0 159China 233.1 147Poland 202.7 128Indonesia 200.5 126U.S. 187.8 118Islamic Republic of Iran 166.2 105Mexico 164.8 104Germany 149.7 94United Kingdom 132.0 83Japan 116.0 73Russia 97.5 61Venezuela 69.7 44Benchmark 44Canada 62.0 39Brazil 25.8 16
Using the benchmark data from this work, the total savings in CO2 from production of secondary material rather than primary are estimated as approximately 500Mt CO2 (see table below).
Estimated Savings in CO2 Emissions
Material Secondary Production (Mt)
Emission by Primary Production (Mt CO2)
Emission by Secondary Production (Mt CO2)
Savings (Mt CO2)
Aluminium 16 61.3 4.6 56.6Copper 6 7.5 2.6 4.9Ferrous 440 734.8 308.0 426.8Lead 3 4.9 0.1 4.8Nickel 0.35 0.7 0.1 0.6Tin 0.05 0.1 <0.1 0.1Zinc 1 2.4 0.6 1.8Paper 168 28.6 23.5 5.1Total 628 840 340 501
Table of Contents

Report on Environmental Benefits of RecyclingPage 42
To avoid complications associated with the early stages of the whole life cycles of these materials, benchmark energy requirements and carbon footprints for primary materials are extracted from ore or raw material delivered at the production plant, and for secondary material delivered at the secondary plant. Benchmark data are reported per 100,000 tonnes of material produced to provide a means of direct comparison between primary and secondary production. These data are tabulated in the following two tables for each material separately, as energy requirements and savings per 100,000 tonnes of production of material, and as carbon footprints and savings per 100,000 tonnes of production of material.
Energy Requirement and Savings in Terajoules (TJ/100,000t)
Material Primary Secondary Saving/100,000 TonnesAluminium 4700 240 4460Copper 1690 630 1360Ferrous 1400 1170 230Lead 1000 13 987Nickel 2064 186 1878Tin 1820 20 1800Zinc 2400 1800 600Paper 3520 1880 1640
Carbon Footprint and Savings Expressed in Kilotonnes of CO2 (ktCO2)/100,000 Tonnes
Material Primary Secondary Saving/100,000 TonnesAluminium 383 29 354Copper 125 44 81Ferrous 167 70 97Lead 163 2 161Nickel 212 22 190Tin 218 3 215Zinc 236 56 180Paper 0.17 0.14 0.03
Using these data, the total saving in annual carbon dioxide emissions for the production of the secondary materials that are the subject of this report is calculated to be approximately 500Mt. The savings for the individual materials are listed in the following table.
Conclusion
Values of the energy requirements and carbon footprints have been obtained from a survey of the primary literature, for the production of primary and secondary metals and paper. The metals included in the survey are aluminium, copper, ferrous, lead, nickel, tin and zinc.Values of the energy requirements and carbon footprints have been obtained from a survey of the primary literature for the production of primary and secondary metals and paper. The metals included in the survey are aluminium, copper, ferrous, lead, nickel, tin and zinc.
Report on Environmental Benefits of RecyclingPage 42
Table of Contents

Report on Environmental Benefits of RecyclingPage 43
Estimated Annual Savings in CO2 Emissions
Material Secondary Production (Mt)
Emission by Primary Production (Mt CO2)
Emission by Secondary Production (Mt CO2)
Savings/100 000tonnes(% savings CO2 in parentheses)
Aluminium 16 61.3 4.6 56.6 (92%)Copper 6 7.5 2.6 4.9 (65%)Ferrous 440 734.8 308.0 426.8 (58%)Lead 3 4.9 0.1 4.8 (99%)Nickel 0.35 0.7 0.1 0.6 (90%)Tin 0.05 0.1 <0.1 0.1 (99%)Zinc 1 2.4 0.6 1.8 (76%)Paper 168 0.286 0.235 0.05 (18%)Total 634 812 316 496
The benchmark figures extracted from the primary literature in this work represent (i) data for situations that are said to be achievable and (ii) values that are the most acceptable and justifiable. To account for any variations arising from differences in processes, however, sensitivity analyses can be carried out on any of the input data in order to show how differences in process parameters would be reflected in the overall energy saving and carbon footprint results.
Sensitivity analysis can be carried out on any input parameter but the following are given as examples:
(i) the variation in secondary production energy requirement data compared with the primary benchmark;(ii) the variation in primary production energy requirement data from the benchmark;(iii) the variation in the carbon footprint data for secondary recovery compared with the primary benchmark;(iv) the variation in the carbon footprint data for primary production from the primary benchmark;(v) the variation in energy and carbon footprint data expressed for different countries or regions depending
on their fuel/energy balance.
Except for variations by country and region, variations have been calculated for deviations of -10, -5, +5, +10, +15, +20, +30, +40, +50, +90 and +100%, or -10, -5, +5, +10, +15, +20, +30, +40, +50 and +100%. This provides a rapid method of comparing data from real production processes with the benchmark values used in this work.
The concept of benchmarking is a novel approach to calculating environmental parameters such as carbon footprints and carbon dioxide savings, and combined with the provision of sensitivity analyses provides a means of obtaining the best available calculated data for individual situations.
Report on Environmental Benefits of RecyclingPage 43
Table of Contents

Report on Environmental Benefits of RecyclingPage 44
Bibliography
Primary and Secondary Aluminium Production1. Blomberg, J. and Hellmer, S. Short-run demand and supply elasticities in the West European market for secondary aluminium.
Resources Policy 26 (2000) 39-502. Xiao, Y., Reuter, M. A. Recycling of distributed aluminium turning scrap. Minerals Engineering, 15/11 (2002) 963-9703. Developments in Mineral Processing, 16 (2005) 391-4514. Energy efficiency and greenhouse gas reduction potentials in the aluminium industry. A workshop in the framework of the G8 Dialogue
on climate change, clean energy and sustainable development. International Aluminium Institute. 20075. Aluminium story. International Aluminium Institute. Online access 05 April 08. http://www.world-aluminium.org/About+Aluminium/Story+of6. Samuel, M. A new technique for recycling aluminium scrap. Journal of Materials Processing Technology 135/1 (2003) 117-1247. Schwarz, H. G. Technology diffusion in metal industries: driving forces and barriers in the German aluminium smelting sector.
Journal of Cleaner Production, 16/1 (2008) 37-498. Coal to remain top energy source for China. Shenzhen Daily/Agencies. Updated: 2005-03-30 [Cited 04/04/08]. http://www.chinadaily.com.cn/
english/doc/2005-03/30/content_429544.htm 9. Life Cycle Inventory data for aluminium production and transformation processes in Europe. Environmental Profile Report for the European
Aluminium Industry. European Aluminium Association. [cited 15/04/08]. Available online www.eaa.net/upl/4/en/doc/EAA_Environmental_profile_report_May08.pdf
10. Norgate, T. E., Rankin, W. J. Greenhouse gas emissions from aluminium production – a life cycle approach. CSIRO Minerals. [cited 14/04/08] Available online: www.minerals.csiro.au/sd/CSIRO_Paper_LCA_Al.htm
11. Aluminium production: an example calculation of the energy saved by recycling. Department of Materials Science and Metallurgy, University of Cambridge. Online accessed: 23 Feb 2008. www.doitpoms.ac.uk/tlplib/recycling-metals/aluminium_production.php
12. Norgate, T. E. Metal recycling: An assessment using Life Cycle Energy Consumption as a sustainability indicator (Report), CSIRO Minerals, 2004.13. Life Cycle Assessment of aluminium: inventory data for the primary aluminium industry. Year 2005 update. International Aluminium Institute.
September 2007.14. Norgate, T. E., Jahanshahi, S., and Rankin, W. J. Assessing the environmental impact of metal production processes.
Journal of Cleaner Production 15/8-9 (2007) 838-84815. Logozar, K., Radonjic, G. and Bastic, M. Incorporation of reverse logistics model into in-plant recycling process: A case of aluminium industry.
Resources, Conservation and Recycling 49/1 (2006) 49-6716. Choate, W. T. and Green, J. A. U.S. Energy requirements for aluminium production: Historical perspective, theoretical limits
and new opportunities. U.S. Department of Energy, Energy efficiency and renewable energy. February 2003.
Primary and Secondary Copper Production1. Ayres, R. U., Ayres, L.W., et al. The life cycle of copper, its co-products and by-products. Mining minerals and sustainable development.
International Institute for Environment and Development and the World Business Council for Sustainable Development. 2002.2. Reprinted from Outokumpu News February 1998. [cited 16/04/08] Online: http:// www.copper.org/innovations/1998/06/outokumpu.html3. Laboy, C. and González, E. Map and table of world copper smelters. US Geological Survey Open File-Report 03-75. U.S. Geological Survey, 2003. 4. Bordia, S. General activity of LCA in developing countries and in Papua New Guinea. Department of Mining Engineering. Papua New Guinea
University of Technology. Paper presented at the Gateway to Life Cycle Impact Assessment for APEC Member Economies. Group report. 2002. Accessed online: http://unit.aist.go.jp/lca-center/asianetwork/symposium/report/2002/81.pdf
5. Jolly, J. L. The US copper-base scrap industry and its by-products. An overview 2006. Technical report. Seventh edition. February 2007. Copper Development Association Inc.
6. Xueyi, G., Yu, S. Substance flow analysis of copper in China. Resources, Conservation and Recycling (2008) 52(6), 874-8827. Spatari, S., Bertram, M., Fuse, K., Graedel, T. E., Rechberger, H. The contemporary European copper cycle: 1 year stocks and flows.
Ecological Economics 42 (2002) 27-428. U.S. Geological Survey, Mineral Commodity Summaries, January 2008. Accessed online: http://minerals.usgs.gov/minerals/pubs/commodity/
copper/ [cited 14/04/08]9. Norgate, T. E., Jahanshahi, S., Rankin, W. J. Assessing the environmental impact of metal production processes.
Journal of Cleaner Production 15 (2007) 838-84810. Gaballah, I. and Kanari, N. Recycling policy in the European Union. Journal of Metals 53/11 (2001) 24-2711. Norgate, T. E, and Rankin, W. J. The role of metals in sustainable development. Green Processing 2002, (the AusIMM), Caims, 49-5512. The copper recycling media tour, Waalwijk (Netherlands), June 2003. Copper Benelux & European Copper Institute. [cited 16/04/08]
Available online: http://www.eurocopper.org/doc/uploaded/File/Recyclage2_ EN.pdf 13. Kellogg, H. H. Sizing up the energy requirements for producing primary metals. Engineering and Minerals Journal, 178/4 (1977) 61-65
Table of Contents

Report on Environmental Benefits of RecyclingPage 45
14. Lipowsky, H. and Arpaci, E. Copper in the Automotive Industry. Wiley-VCH Verlag GmBH & Co, KgaA. Weinheim ISBN:978-3-527-31769-115. Bruch, H., Gohike, D., Kruger, C., Reuter, M., Roepenack, I. V., Rombach, E., Rombach, G., Winkler, P. LCI of copper production
and processing. Metall 49/4 (1995) 252-25716. Landner, L., and Lindstrom, L. Copper in society and the environment. Swedish Environmental Research Group. 1999.17. Norgate, T. E. and Rankin, W. J. Life Cycle assessment of copper and nickel production. Proceedings, Minprex 2000,
International Conference on Minerals Processing and Extractive Metallurgy. September 2000, 133-13818. Kuckshinrichs, W., Zapp, P., and Poganietz, W-R. CO2 emissions of global metal industries: the case of copper. Applied Energy 84 (2007) 842-852.
Primary and Secondary Ferrous Production1. Integrated Pollution Prevention and Control (IPPC). Best Available Techniques Reference Document on the Production of Iron and Steel.
EUROPEAN COMMISSION. December 2001. [cited 28/04/08] Available online: http://www.elaw.org/system/files/eu.isp_bref_1201.pdf2. BlueScope Steel Corporate: Steelmaking. [cited 14/04/08] Available online: http://www.bluescopesteel.com/go/about-bluescope-steel/student-
information/steelmaking3. Price, L., Sinton, J., Worrell, E., Phylipsen, D., Xiulian, H., Ji, L. Energy use and carbon dioxide emissions from steel production in China.
Energy 27 (2002) 429-446 4. Iron and Steel Statistics Bureau. Accessed online on 9 April 2008: http://www.issb.co.uk/5. Steelmaking raw materials. The International Iron Steel Institute. [cited 14/04/08] http://www.worldsteel.org/pictures/programfiles/Fact%20
sheet_Raw%20materials.pdf 6. Report World Steel in Figures 2007. The International Iron Steel Institute. [cited 14/04/08] Online:http://www.worldsteel.org/index.
php?action=newsdetail&id=198 7. Norgate, T. E. Metal recycling: An assessment using life cycle energy consumption as a sustainability indicator. CSIRO Minerals 20048. Wei, Y. M., Liao, H., Fan, Y. An empirical analysis of energy efficiency in China’s iron and steel sector. Energy 32 (2007) 2262-22709. Gielen, D., Moriguchi, Y. CO2 in the iron and steel industry: an analysis of Japanese emission reduction potentials. Energy policy 30 (2002) 849-86310. Hidalgo, I., Szabo, L., Ciscar, J. C., Soria, A. Technological prospects and CO2 emission trading analyses in the iron and steel industry:
A global model. Energy 30/5 (2005) 583-610 11. Hu, C., Chen, L., Zhang, C., Qi, Y., Yin, R. Emission mitigation of CO2 in steel industry: current status and future scenarios.
Journal of Iron and Steel Research, International 13/6 (2006) 38-4212. Kim, Y., Worrell, E. International comparison of CO2 emission trend in the iron and steel industry. Energy policy 30 (2002) 827-838 13. Ozawa, L., Sheinbaum, C., Martin, N., Worrell, E., Price, L. Energy use and CO2 emissions in Mexico’s iron and steel industry.
Energy 27 (2002) 225-23914. Bhaktavatsalam, A. K., Choudhury, R. Specific energy consumption in the steel industry. Energy 20 (1995) 1247-125015. Choudhury, R., Bhaktavatsalam, A. K. Energy inefficiency of Indian steel industry – scope for energy conservation.
Energy Conservation and Management 38/2 (1997) 167-17116. Worrell, E., Price, L., Martin, N., Farla, J., Schaeffer, R. Energy intensity in the iron and steel industry: a comparison of physical
and economic indicators. Energy policy 25/7-9 (1997) 727-74417. Quoted by Choudhury et al (1997) from Energy data for steel plants – 1993-94. Energy conservation group, research and development centre
for iron and steel, Ranchi 199118. Andersen, J. P., Hyman, B. Energy and material flow models for the U.S. steel industry. Energy 26 (2001) 137-15919. Wei, Y. M., Liao, H., Fan, Y. An empirical analysis of energy efficiency in China’s iron and steel sector. Energy 32 (2007) 2262-227020. Wang, K., Wang, C., Lu, X., Chen, J. Scenario analysis on CO2 emissions reduction potential in China’s iron and steel industry.
Energy policy 35 (2007) 2320-233521. Sakamoto, Y., Tonooka, Y., Yanagisawa, Y. Estimation of energy consumption for each process in the Japanese steel industry:
a process analysis. Energy Conservation and Management 40 (1999) 1129-114022. Ertem, M., Gürgen, S. Energy balance analysis for Erdemir blast furnace number one. Applied Thermal Engineering 26 (2006) 1139-114823. Norgate, T. E., Jahanshahi, S., Rankin, W. J. Assessing the environmental impact of metal production processes. Journal of Cleaner
Production 15 (2007) 838-84824. Norgate, T. E. Metal recycling: An assessment using life cycle energy consumption as a sustainability indicator. CSIRO Minerals 200425. Norgate, T. E., Rankin, W. J. The role of metals in sustainable development. Green Processing 2002, (The AusIMM), Caims, 49-5526. Gaballah, I., Kanari, N. Recycling policy in the European Union. Journal of Metals, (2001) 24-27 27. Grant, T., James, K., Lundie, S. Sonneveld, K. Stage 2 report for life cycle assessment for paper and packaging waste management
scenarios in Victoria. 2001. Ecorecycle Victoria28. Johnson, J., Reck, B. K., Wang, T. Graedel, T. E. The energy benefits of stainless steel recycling. Energy policy 36 (2008) 181-192
Table of Contents

Report on Environmental Benefits of RecyclingPage 46
29. Das, A., Kandpal, T. C. Iron and Steel manufacturing technologies in India: estimation of CO2 emission. International Journal of Energy Research 21 (1997) 1187
30. Das, A., Kandpal, T. C. Energy demand and associated CO2 emissions for the Indian steel industry. Energy 23/12 (1998) 1043-105031. Phylipsen, D., Blok, K., Worrell, E., Beer, J. Benchmarking the energy efficiency of Dutch industry: an assessment of the expected effect
on energy consumption and CO2 emissions. Energy policy 30 (2002) 663-67932. Sakamoto, Y. and Tonooka, Y. Estimation of CO2 emission for each process in the Japanese steel industry: a process analysis. International
Journal of Energy Research 24 (2000) 625-63233. Das, A., Kandpal, T. C. Energy demand and associated CO2 emissions for the Indian steel industry. Energy 23/12 (1998) 1043-105034. Das, A., Kandpal, T. C. Iron and Steel manufacturing technologies in India: estimation of CO2 emission. International Journal of Energy 21
(1997) 1187-120135. Orth, A., Anastasijevic, N., Eichberger, H. Low CO2 emission technologies for iron and steelmaking as well as titania slag production.
Minerals Engineering 20 (2007) 854-86136. Ho, J. C., Chandratilleke, T. T. Thermodynamic analysis of an electric arc furnace. Energy Conversion and Management 31/2 (1991) 179-18637. Rynikiewicz, C. The climate change challenge and transitions for radical changes in the European steel industry. Journal of Cleaner
Production 16/7 (2008) 781-789
Primary and Secondary Lead Production1. Chapter 5: Recycling of Lead. p. 71-80 [Cited 14/04/08] http://www.ila-lead.org/factbook/chapter5.pdf2. Mao, J. Industrial flow of lead in China. Zhong Guo You Se Jin Shu Xue Hui Hui Kan (Ying Wen Ban), 2007. 17(2): p. 400-4113. Norgate, T. E. and Rankin W. J. An Environmental Assessment of lead and zinc production processes. Green Processing, 2002. 2002(May):
p. 177-1844. Campbell, M. C. Non-Ferrous Metals Recycling: A Complement to Primary Metals Production. 1996, International Council on Metals
and the Environment: Ottawa.5. Norgate, T. E. Assessing the environmental impact of metal production processes. Journal of Cleaner Production, 2007. 15(8-9): p. 838-8486. Siegmund, A. The International Symposium on Zinc and Lead Processing. JOM, 1999. May: p. 33-347. Kreusch, M. Technological improvements in automotive battery recycling. Resources, Conservation, and Recycling, 2007. 52: p. 368-3808. Wernick, I. K. and Themelis, N. J. Recycling Metals for the Environment. Annu. Rev. Energy Environ., 1998. 23: p. 465-979. Kang, H.-Y. and Schoenung, J. M. Used Consumer Electronics: A Comparative Analysis of Materials Recycling Technologies. 2004: p. 226-23010. Schupp, N. D. Operations at the Doe Run company’s Herculaneum primary lead smelter. Zinc-Lead 2000, 2000: p. 117-12511. Siegmund, A. Primary lead production - A survey of existing smelters and refineries. Lead-Zinc 2000, 2000: p. 55-6612. Moriya, K. Achievement of lead smelting during a quarter century at Mitsubishi-Cominco’s Naoshima smelter. Primary and Secondary
Lead Processing, 1989. 15: p. 71-86.13. Norgate, T. E. Metal Recycling: An Assessment Using Life Cycle Energy Consumption as a Sustainability Indicator, C. Minerals, Editor. 2004.14. Profile of the Nonferrous Metals Industry, in EPA Office of Compliance Sector Notebook Project. 1995, Office of Compliance,
Office of Enforcement and Compliance Assurance U.S. Environmental Protection Agency, Washington, DC.15. Daniel, S. Applying life cycle inventory to reverse supply chains: a case study of lead recovery from batteries. Resources, Conservation,
and Recycling, 2003. 37(4): p. 251-28116. Gaballah, I. and Kanari, N. Recycling Policy in the European Union, in JOM, R.a. Regulation, Editor. 2001: Vandoeuvre.17. Norgate, T. E. and W. J. Rankin. The role of metals in sustainable development. CSIRO Minerals 2002. [cited 1404/08] Available from:
www.minerals.csiro.au/sd/CSIRO_Paper_LCA_Sust.pdf18. Robertson, J. MIM primary lead production: a life-cycle approach to identification and management of the environmental effects.
Transactions. Section C, Mineral Processing & Extractive Metallurgy, 2001. 110: p. C33-C42.
Primary and Secondary Nickel Production1. U.S. Geological Survey, Mineral Commodity Summaries, January 2008: Nickel. [cited 28/04/08] Available from: http://minerals.usgs.gov/
minerals/pubs/commodity/nickel/mcs-2008-nickel.pdf 2. Nickel Production Statistics. International Nickel Study Group. [cited 28/04/08] Available from: http://www.insg.org/stats.aspx 3. Recycling of Nickel Containing Products. International Nickel Study Group. [cited 28/04/08] Available from: http://www.insg.org/recycling.aspx4. Campbell, M. C. Non-Ferrous Metals Recycling: A Complement to Primary Metals Production. 1996, International Council on Metals and the
Environment: Ottawa.5. Norgate, T. E., Assessing the environmental impact of metal production processes. Journal of Cleaner Production, 2007. 15(8-9): p. 838-848.6. Handbook of Extractive Metallurgy, in Volume 2, Primary Metals; Secondary Metals; Light Metals, F. Habashi, Editor. 1997, Weinham: Cambridge.
Table of Contents

Report on Environmental Benefits of RecyclingPage 47
7. Norgate, T. E. and Rankin, W. J. Life Cycle Assessment of Copper and Nickel Production in MINPREX 2000, International Congress on Mineral Processing and Extractive Metallurgy. 2000. Melbourne, Australia: RMIT University.
8. Kellogg, H. H. Sizing up the Energy Requirements for Producing Primary Materials. Engineering and Mining Journal, 1977. 178(4): p. 61-65.9. Chapman, P. F. and Roberts, F. Metal Resources and Energy. Butterworths Monographs in Materials. 1983, Thetford: Butterworth and Co.10. Norgate, T. E. Metal Recycling: An Assessment Using Life Cycle Energy Consumption as a Sustainability Indicator, C. Minerals, Editor. 2004.11. Norgate, T. E. and Rankin, W. J. The role of metals in sustainable development. CSIRO Minerals 2002. [cited 14/04/08] Available from:
www.minerals.csiro.au/sd/CSIRO_Paper_LCA_Sust.pdf12. Johnson, J., et al. The energy benefit of stainless steel recycling. Energy Policy, 2008. 36(1): p. 181-192.13. Taylor, J. C. The Recycling of Non-Ferrous Metals. Extractive Metallurgy of Copper, Nickel and Cobalt, 1993. 1: p. 1199-1209
Primary and Secondary Tin Production1. U.S. Geological Survey, Mineral Commodity Summaries, January 2008: Tin. [cited 7/04/08] Available from: http://minerals.usgs.gov/minerals/
pubs/commodity/tin/mcs-2008-tin.pdf2. Tin Use Survey 2007. International Tin Research Institute. [cited 7/04/08] Available from: http://www.itri.co.uk/pooled/articles/BF_TECHART/
view.asp?Q=BF_TECHART_297350. Accessed April 2008.3. Indonesia’s Koba Tin smelter shut. 2008. [cited 14/04/08] Available from: http://uk.reuters.com/article/rbssIndustryMaterialsUtilitiesNews/
idUKJAK31603200801294. Chapman, P. F. and Roberts, F. Metal Resources and Energy. Butterworths Monographs in Materials. 1983, Thetford: Butterworth and Co.5. Handbook of Extractive Metallurgy, in Volume 2, Primary Metals; Secondary Metals; Light Metals, F. Habashi, Editor. 1997, Weinham:
Cambridge.6. Kekesi, T., Torok, T. I., Kabelik, G. Extraction of tin from scrap by chemical and electrochemical methods in alkaline media. Hydrometallurgy,
2000. 55: p. 213-2227. Kellogg, H. H. Sizing up the Energy Requirements for Producing Primary Materials. Engineering and Mining Journal, 1977. 178(4): p. 61-658. Morris, J. Comparative LCAs for Curbside Recycling Versus Either Landfilling or Incineration with Energy Recovery. Int J LCA 2005. 10(4):
p. 273-284
Primary and Secondary Zinc Production1. Profile of the Nonferrous Metals Industry, in EPA Office of Compliance Sector Notebook Project. 1995, Office of Compliance,
Office of Enforcement and Compliance Assurance, U.S. Environmental Protection Agency, Washington, DC2. Norgate, T. E. and Rankin, W. J. The role of metals in sustainable development. CSIRO Minerals 2002. Available from: www.minerals.csiro.au/
sd/CSIRO_Paper_LCA_Sust.pdf. Accessed April 2008.3. Norgate, T. E. and Rankin, W. J. An Environmental Assessment of lead and zinc production processes. Green Processing, 2002(May): p. 177-1844. Viklund-White, C. C. The use of LCA for the environmental evaluation of the recycling of galvanised steel. ISIJ International, 2000. 40(3): p. 2925. Siegmund, A. The International Symposium on Zinc and Lead Processing. JOM, 1999. May: p. 33-346. Hassall, C. and Roberts, H. Market Fundamentals and The Evolution of lead and zinc supplies. Lead-Zinc 2000, 2000: p. 3-167. Zinc Recycling. American Galvanisers Association. [cited 2008 15/04]; Available from: http://www.galvanizeit.org/aga/galvanized-steel-in-use/
sustainable-development/zinc-recycling/8. Guidelines on Best Available Techniques (BAT) and provisional Guidance on Best Environmental Practices (BEP) relevant to Article 5
and Annex C of the Stockholm Convention on Persistent Organic Pollutants. United Nations Environmental programme. December 2004. [cited 28/04/08] Available online: http://www.dioksyny.pl/files/Draft-BAT-BEP-Dec-2004.pdf
9. Campbell, M. C. Non-Ferrous Metals Recycling: A Complement to Primary Metals Production. 1996, International Council on Metals and the Environment: Ottawa.
10. Zinc: Industry Usage. London Metal Exchange [cited 14/04/08]; Available from: http://www.lme.co.uk/zinc_industryusage.asp11. Gaballah, I. and Kanari, N. Recycling Policy in the European Union, in JOM, R.a. Regulation, Editor. 2001: Vandoeuvre12. Wernick, I. K. and Themelis, N. J. Recycling Metals For The Environment. Annu. Rev. Energy Environ., 1998. 23: p. 465-9713. International Lead and Zinc Study Group. Statistics. Table 5: ILZSG Lead and Zinc Statistics. [cited 14/04/08] Available from www.ilzsg.org14. Tolcin, A. C. Zinc. 2006 Minerals Yearbook. U.S. Geological Survey. February 2008. [cited 28/04/08] Available from: http://minerals.usgs.gov/
minerals/pubs/commodity/zinc/myb1-2006-zinc.pdf15. Martin, M., Wildt, R. Closing the loop: An introduction to recycling zinc-coated steel. International Zinc Association 2001. 16. Higgins, S. Galvanised for action. World Zinc Report. International Mining. January (2007) pp14-17. U.S. Geological Survey 2005. Zinc End-Use Statistics in Kelly, T. D. and Matos, G. R. compilations, Historical statistics for mineral and material
commodities in the United States. U.S. Geological Survey Data Series 140, available online: http://pubs.usgs.gov/ds/2005/140/ April 2008
Table of Contents

Report on Environmental Benefits of RecyclingPage 48
18. Uses of Zinc. International Zinc Association. [cited 21/04/08] Available at: www.iza.com/uses.html19. Moriya, K. Achievement of lead smelting during a quarter century at Mitsubishi-Cominco’s Naoshima smelter. Primary and Secondary
Lead Processing, 1989. 15: p. 71-8620. Kellogg, H. H., State Of Nonferrous Extractive Metallurgy. Journal of Metals, 1982. V 34(N 10): p. 35-4221. Dove, W. and Boustead, I. The Effect of sulphur on primary zinc ecoprofile calculations. Third international conference on ecobalance. 1998. Japan22. Reuter, M. A. The simulation of industrial ecosystems. Minerals Engineering, 1998. 11(10): p. 891-91823. Gediga, J., Florin, H. and Eyerer, P. Life Cycle Assessment: A case study in zinc production. Heavy Metals, 1997: p. 87-9224. Xiao, X. X., et al. LCA Case Study of Zinc Hydro- and Pyro-Metallurgical Process in China. The International Journal of Life Cycle Assessment,
2003. 8(3): p. 15125. Kellogg, H. H. and Krumb, H. Energy Use in Zinc Extraction. Journal of Metals, 1979(10): p. 2126. Martchek, K. J. Importance of recycling to the environmental profile of metal products. 2000. 1927. Norgate, T. E. Metal Recycling: An Assessment Using Life Cycle Energy Consumption as a Sustainability Indicator, C. Minerals, Editor. 2004.
Primary and Secondary Paper Production1. Paper Industry Statistics. [cited: 18/04/08] Available from: http://www.conservatree.org/learn/EnviroIssues/paperindstats.shtml2. Paper Recycling Association of South Africa. [cited: 18/04/08] Available from: http://www.prasa.co.za/statistics.html#fibre3. Blanco, A. A. et al. The challenges of sustainable papermaking. Environmental Science & Technology, 2004. 38(21): p. 414A-420A4. Confederation of European Paper Industries [cited 18/04/08] Available from: www.cepi.org5. Monte, M. C., Fuente, E., Blanco, A., and Negro, C. Waste management from pulp and paper production in the European Union.
Waste Management, 2009, 29(1) 293-3086. UK Wood Production and Trade. 2007 [cited 2008 18/04/08].7. Leach, M. A., Bauen, A. and Lucas, N. J. D. A Systems Approach to Materials Flow in Sustainable Cities: A Case Study of Paper.
Journal of Environmental Planning and Management, 1997. 40(6): p. 705-7248. Bloemhof-Ruwaard, J. M., et al. An environmental life cycle optimization model for the European pulp and paper industry. Omega, 1996.
24(6): p. 615-6299. Recycling Paper & Glass. 2006 [cited 2008 18/04/08]; Available from: http://www.eia.doe.gov/kids/energyfacts/saving/recycling/solidwaste/
paperandglass.html#SavingEnergy10. Hart, A. A., et al. Use of life cycle assessment to develop industrial ecologies - A case study graphics paper. Process Safety and Environmental
Protection, 2005. 83(4 B): p. 359-36311. Villanueva, A. and Wenzel, H. Paper waste - Recycling, incineration or landfilling? A review of existing life cycle assessments.
Waste Management, 2007. 27(8): p. S29-S4612. Schenk, N. J., Henri, C. M. and Potting, J. The nonlinear relationship between paper recycling and primary pulp requirements.
Journal of Industrial Ecology, 2004. 8(3): p. 141-16113. Lifecycle Environmental Comparison: Virgin Paper and Recycled Paper-based Systems, prepared by The Paper Task Force: White Papers,
T.E.D. Fund, Editor. 1995, 2002, Environmental Defense New York. Accessed: http://www.edf.org/documents/1618_WP3.pdf14. An Independent Assessment of the Environmental Benefits of Recycling at Aylesford Newsprint Compared with Incineration, prepared by the
Ecobilan Group, commissioned by Aylesford Newsprint 2003. Accessed: http://www.aylesford-newsprint.co.uk/ReportFiles/lcs.pdf15. Beer, J. D., Worrell, E. and Blok, K. Long-term energy efficiency improvements in the paper and board industry. Energy, 1998. 23(1): p. 21-4216. Farla, J., Blok, K. and L. Schipper, L. Energy Efficiency Developments in the Pulp and Paper Industry. Energy Policy, 1997. 25(7-9): p. 745-75817. The Environmental Consequences of Pulp and Paper Manufacture. Available from: http://www.foe.co.uk/resource/briefings/consequence_
pulp_paper.html [cited 18/04/04]
Sensitivity Analyses 1. Herold, A. Comparison of CO2 emission factors for fuels used in GHG inventories and consequences for monitoring and reporting
under the EC emission trading scheme. European Topic Centre on Air and Climate Change Technical Paper 2003/10. July 20032. National Inventory report, 1990-2004: Greenhouse Gas Sources and Sinks in Canada. Annex 4. Environment Canada. [cited 21/04/08]
Available online: www.ec.gc.ca/pdb/ghg/inventory_report/2004_report/ta4_2_e.cfm3. Energy value and greenhouse emission factor of selected fuels. The Australian Institute of Energy. [cited 23/04/08] Available online:
http://aie.org.au/Content/NavigationMenu/Resources/EnergyData/Energy_Value_Greenh.htm 4. Appendix F: Foreign Electricity Emission Factors 1999-2002. Form EIA-1605 (2007). Energy Information Administration.
U.S. Department of Energy 2007. [cited 08/03/08] Online: http://www.eia.doe.gov/oiaf/1605/pdf/Appendix%20F_r071023.pdf5. US Geological Survey, Mineral Commodity Summaries, January 2008. [cited 14/04/08] Accessed online: http://minerals.usgs.gov/minerals/
pubs/commodity/copper/
Table of Contents

Bureau of International Recycling (aisbl)
Avenue Franklin Roosevelt 241050 BrusselsBelgium
T. +32 2 627 57 70F. +32 2 627 57 73
[email protected]://www.bir.org