report on the elimination of toll roadsftp.dot.state.tx.us/pub/txdot-info/sla/090116-hb-2612.pdf ·...
TRANSCRIPT

Report on the Elimination of Toll Roads HB 2612, 84th Texas Legislature Provided to: Legislative Budget Board House Committee on Transportation Senate Committee on Transportation September 1, 2016

f
Contents
Section Page
Executive Summary 1
Section 1 – Debt Service on Bonds Issued for Toll Projects 6
Section 2 – Bonds Appropriate for Accelerated or Lump-Sum Payment of Debt Service
12
Section 3 – Plan to Eliminate Toll Roads 16
Appendices
Appendix A – Index of Toll Road Bonds A
Appendix B – Assumptions Regarding Toll Road Debt Service Analysis B
Appendix C – Toll Road Project Actual vs. Projected Traffic C
Appendix D – House Bill 2612 D

f
1
Executive Summary
House Bill 2612, 84th Legislature, Regular Session, 2015, requires the Texas Department of Transportation (TxDOT) to prepare a report on the feasibility of eliminating toll roads in the State of Texas. This report is divided into three sections, which correspond to the requirements of the legislation: Section 1. “lists the amount of debt service on bonds issued for each toll project in this
state;” Section 2. “identifies, based on criteria provided by the Texas Transportation Commission,
bonds that would be appropriate for accelerated or complete lump-sum payment of debt service;”
Section 3. “proposes a plan to eliminate all toll roads in this state, except for tolls on roads
constructed, operated, or maintained only with proceeds from the issuance of bonds by a toll project entity other than the department, by methods including: – “the accelerated or complete lump-sum payment of debt service on bonds identified
under Subdivision (1); or – “requiring, as a condition on receipt of state financial assistance, a commitment by a toll
project entity to eliminate toll collection on a project for which the financial assistance is provided.”
The report includes a review of the 53 toll roads and 28 financial tolling systems in the state, excluding international bridges. A summary of the outstanding debt for public toll roads in the state, which excludes the five Comprehensive Development agreements (CDAs), as of January 1, 2016 is provided in Section 1 and detailed annual debt service for each of the public toll road entities in the state is provided in Appendix A. As of January 1, 2016, the total public toll road debt principal amount outstanding from these entities was $21.6 billion. TxDOT would like to express its appreciation to all of the tolling entities in the state for their cooperation in providing this data. Table 1a: Texas Toll Road Center-Line Miles
Center-Line Miles
Non-State Publicly-Operated Toll Roads 441
State Toll Roads 230
Total Toll Road Center-Line Miles 671
State Roads (Non-Tolled) * 80,241 *As shown TxDOT Roadway Inventory Annual Reports, 2014.

f
2
Table 1b: Texas Toll Project Debt, Debt Service, and Upfront Payment Total Outstanding
Principal in millions
Total Debt Service Payments until Final
Maturity
Total Upfront Payment Cost
in millions
Non-TxDOT Publicly-Operated Toll Roads $15,301.1 $27,920.2 $17,115.1
TxDOT Publicly-Operated Toll Roads 6,285.9 11,965.6 7,120.8
Sub-Total $21,587.0 $39,935.8 $24,235.9*
CDA Toll Road Projects N/A N/A 12,500.0**
Total N/A N/A $36,735.9
*Upfront payment cost is as of January 1, 2016. **Comprehensive Development Agreement (CDA) termination payment amount is as January 1, 2018 and is a preliminary estimate. CDAs are described in detail in Section 3.
Section 2 of this report describes the criteria developed to determine toll road debt suitable for accelerated or lump sum payment. Eliminating toll road debt is necessary to remove tolls on certain roads in the state. Many of the state’s toll roads, both stand-alone projects and toll systems, generate ongoing revenues to pay for long-term maintenance on the facilities and provide the financial capacity to expand and extend these projects. In addition, revenues from toll road projects that are not used for operations, maintenance, and debt service may provide money to fund new transportation projects in their regions. Certain toll road projects have been developed as part of larger regional transportation plans to provide mobility and manage traffic. The role toll roads play in both transportation funding and regional mobility were considerations in the establishment of criteria used to identify those toll road bonds that could be considered for lump-sum or accelerated payment. Based upon the criteria outlined in Section 2, TxDOT identified two state-owned toll projects with outstanding debt that would be candidates for lump-sum or accelerated payment. As of the date of this report, outstanding bond issues for state-owned toll projects include:
$3.2 billion in outstanding debt of the Central Texas Turnpike System (Figure A)
$3.1 billion in outstanding debt of the Grand Parkway Transportation Corporation (Figure B)

f
3
Figure A

f
4
Figure B

f
5
Section 3 identifies the upfront cost to remove the obligations on the Central Texas Turnpike System, the Grand Parkway Transportation Corporation, and the five state toll projects developed and funded through Comprehensive Development Agreements (CDA) with private entities. The cost to remove tolls on each of these facilities immediately requires a lump-sum payment of (i) outstanding toll road debt in the case of the Central Texas Turnpike System and the Grand Parkway Transportation Corporation, and (ii) an upfront payment to the private entities operating toll facilities under a CDA. Below are the estimated lump-sum upfront costs for each of these facilities assuming a September 1, 2017 repayment date for the toll bonds and a January 1, 2018 payment to terminate the CDAs, totalling $19.3 billion:
$3.2 billion: Central Texas Turnpike System
$3.6 billion: Grand Parkway Transportation Corporation
$12.5 billion: Five CDA Projects Section 3 also sets forth a plan that includes alternatives to accelerate or fully pre-pay debt on state-owned toll projects. The alternatives discussed in Section 3 include:
the lump-sum payment of outstanding toll project debt assuming funds become available as of September 1, 2017; September 1, 2019; September 1, 2021; and September 1, 2023; and
accelerated repayment alternatives that use the toll projects’ projected excess revenue to prepay annually a portion of outstanding bond principal.
The analyses in Section 3 also includes a scenario whereby funding for operations, maintenance, major maintenance, and planned expansions and extensions would be provided by the state to replace toll road revenues originally projected to provide for these expenditures. This would generate more projected excess revenue that could be used to prepay more debt. Considering pay-off dates at different points in the future could lower the lump-sum debt repayment cost for the state as debt service will continue to be funded from toll revenue until the lump-sum payment is made. Reducing the period between the lump-sum repayment date and the maturities should also generally reduce the repayment cost. For the Central Texas Turnpike System and the Grand Parkway Transportation Corporation, the reduction in lump-sum debt repayment costs moving from a lump-sum debt repayment date of September 1, 2017 to September 1, 2023 are estimated as follows:
$722 million decrease in the lump-sum debt repayment cost for the Central Texas Turnpike System
$173 million decrease in the lump-sum debt repayment cost for the Grand Parkway Transportation Corporation
In addition, the House Committee on Transportation requested for each standalone toll project or toll system element:
the original projected volume of traffic;
the actual volume of traffic;
length (in miles); and
the amount of tolls levied (in a comparable format). This additional information is provided in Appendix C.

f
6
Section 1: Debt Service on Bonds Issued for Toll Projects
In accordance with HB 2612, TxDOT has compiled and presents information that “lists the amount of debt service on bonds issued for each toll project in this state.” Toll road projects in Texas are owned and managed by TxDOT, regional and county toll authorities, regional mobility authorities, transportation corporations, transit authorities, counties, road improvement districts, and other entities. To facilitate accuracy of the data presented, TxDOT requested that each toll entity provide information on its toll projects and toll-related debt. The debt and debt service information presented in this section are derived from the data TxDOT received from each public toll road entity. In addition to debt service on debt, the information provided in this section includes:
The name of each bond issuing entity
Identification of each toll project or system – Toll road bonds can be payable from the revenues of either a stand-alone toll project or the collective revenues of a toll system, which includes multiple individual project elements.
The individual toll road elements that comprise a toll system
Outstanding principal for each toll project or system as of January 1, 2016
Cost to repay the outstanding principal for each toll project or system based upon a repayment date of January 1, 2016
All data and calculations assume debt outstanding as of January 1, 2016. Table 2 on the following page summarizes the outstanding toll road debt for all public toll road projects in the state.

f
7
Total $21,571,054,540 $18,364,711,844
$39,935,766,384
1 Represents debt issued for public toll roads and does not include debt service for any toll roads currently under a CDA. 2 $924.2 million of Grand Parkway Transportation Corporation debt maturing in 2016 is expected to be refinanced, largely through a federal loan through the Transportation Infrastructure Finance and Innovation Act program that will spread this principal over time.
Table 2: Debt Service on All Toll Revenue Bonds Issued for Texas Public Toll Projects1 (As of January 1, 2016)
Calendar Year Principal Due Interest Due Total Debt Service
2016 $1,054,216,0432 $723,329,323 $1,777,545,366
2017 169,255,427 792,784,712 962,040,119
2018 174,211,198 822,098,051 996,309,250
2019 242,585,316 818,155,033 1,060,740,349
2020 285,972,401 814,441,260 1,100,413,661
2021 349,218,480 804,038,794 1,153,257,274
2022 374,716,250 801,560,555 1,176,276,805
2023 403,761,825 786,990,100 1,190,751,925
2024 449,564,783 809,919,757 1,259,484,540
2025 473,009,309 801,053,290 1,274,062,599
2026 538,359,431 777,532,429 1,315,891,859
2027 574,215,416 750,611,329 1,324,826,744
2028 651,211,069 727,884,378 1,379,095,446
2029 676,724,631 705,471,504 1,382,196,135
2030 794,576,535 679,814,615 1,474,391,150
2031 793,482,943 650,480,790 1,443,963,733
2032 796,492,000 616,656,383 1,413,148,383
2033 798,450,254 586,332,727 1,384,782,981
2034 805,999,658 556,799,915 1,362,799,572
2035 873,921,032 527,298,533 1,401,219,565
2036 868,884,927 494,584,979 1,363,469,906
2037 895,857,418 466,821,530 1,362,678,949
2038 962,428,896 438,953,924 1,401,382,820
2039 787,800,768 400,455,578 1,188,256,346
2040 822,346,015 359,107,565 1,181,453,580
2041 855,615,879 304,839,043 1,160,454,922
2042 860,947,771 258,783,483 1,119,731,254
2043 598,711,272 216,767,689 815,478,961
2044 478,921,947 189,346,806 668,268,753
2045 517,664,231 158,946,214 676,610,444
2046 486,297,829 131,824,156 618,121,985
2047 436,166,737 107,228,841 543,395,578
2048 258,572,253 86,146,453 344,718,706
2049 302,324,596 70,373,607 372,698,203
2050 332,020,000 58,225,399 390,245,399
2051 399,920,000 42,116,413 442,036,413
2052 212,525,000 21,526,225 234,051,225
2053 214,105,000 5,410,463 219,515,463

f
8
Table 3 below identifies each toll road project and system, as well as the toll elements that comprise each regional and local government toll agency. Appendix A provides a summary of annual toll road debt service for each public toll road project and system. The data provided in Appendix A does not include financial obligations associated with the state’s concession CDA projects. As part of the process of identifying costs associated with eliminating toll roads in the state, TxDOT has calculated the upfront cost to repay the debt obligations for each local and regional toll road entity project or system having toll debt outstanding. Table 3 presents the projected cost to repay the debt for each regional and local government toll agency project or system as of January 1, 2016. The assumptions used in the calculation of the lump-sum cost to repay debt are provided in Appendix B.

f
9
Table 3: List of Regional and Local Government Toll Agency Projects3
System or Project Name System Elements
Outstanding Principal on Jan. 1, 2016
in millions
Upfront Payment
Cost as of Jan. 1, 2016
in millions
Debt Service Report Page
Cameron County Regional Mobility Authority SH 550 $49.5 $56.8 A.3
Camino Real Regional Mobility Authority Cesar Chavez Express Toll Lanes4 4.3 4.6
Camino Real Regional Mobility Authority Loop 375 Border West Expressway4 none none
Central Texas Regional Mobility Authority System
US 183A Toll Lanes
1,495.4 1,811.2 A.4 US 183 South
US 290 East
Central Texas Regional Mobility Authority MoPac Managed Lanes
MoPac Managed Lanes4 none none
Central Texas Regional Mobility Authority SH 71 Express
SH 71 Express4 65.0 65.0 A.5
Ft. Bend Co. Grand Parkway Toll Road Authority
SH 99 Grand Pkwy Segment D - Fort Bend County 155.1 183.6 A.6
Fort Bend County Toll Road Authority Fort Bend County Toll Road 191.7 223.7 A.7
Westpark Tollway
Galveston County Road District #1 San Louis – Vacek Pass Bridge none none
Harris County Toll Road Authority Hardy Toll Road
2,127.3 2,393.1 A.8
Katy (I-10) Managed Lanes
Sam Houston Tollway
Fort Bend Parkway Extension
Tomball Tollway
Westpark Tollway
Metro Transit Authority of Harris County US 290 Northwest Freeway HOT Lanes
none none
US 59 North HOT Lanes
US 59 Southwest Freeway HOT Lanes
I-45 North Gulf Freeway HOT Lanes
I-45 South Gulf Freeway HOT Lanes
North East Texas Regional Mobility Authority Loop 49 Toll System4 59.1 59.1 A.9
North Texas Tollway Authority System Addison Airport Toll Tunnel
8,913.9 9,923.0 A.10
Sam Rayburn Tollway (SH 121)
Dallas North Tollway
Lewisville Lake Bridge
Mountain Creek Lake Toll Bridge
President George Bush Turnpike (SH 161)
North Texas Tollway Authority Special Projects System
President George Bush Turnpike Western Ext.(SH 161) 2,240.5 2,395.0 A.11 Chisholm Trail Parkway
North Texas Tollway Authority SH 360 SH 3604 none none
Totals $15,301.1 $17,115.1
3 Information does not include international toll bridges. 4 Certain TxDOT financial agreements do not have set principal and interest repayment schedules and are not included in tables representing annual debt service. These agreements are described under ‘TxDOT Financial Assistance’ on the next page.

f
10
TxDOT Financial Assistance Many toll projects in Texas have relied on traditional debt issuances to finance construction of projects. As noted in Table 3 above, not all projects have such debt. Below is a discussion of certain toll facilities for which TxDOT provided financial assistance to local tolling entities. Cesar Chavez Express Toll Lanes – Camino Real Regional Mobility Authority TxDOT has provided a loan in the amount of $9.4 million for the operations and maintenance of the Cesar Chavez Express Toll Lanes Project in annual draws until 2025. As of January 1, 2016, the drawn amount, including two pre-development loans, is $4.3 million. The payoff amount as of January 1, 2016, if interest is assessed at 4.25%, is $4.6 million. Repayment begins when project revenues cover the operations and maintenance expenses, and the annual repayment amount required is to be at least 10% of net revenues.
Loop 375 Border Highway West - Camino Real Regional Mobility Authority In August, 2014, the Camino Real Regional Mobility Authority (CRRMA) entered into a Texas Mobility Fund5 grant agreement with TxDOT for $500 million to fund a portion of this project. TxDOT is also contributing $139 million in capital costs. Upon completion of the project, CRRMA and TxDOT will share the project’s net revenues.
SH 71 - Central Texas Regional Mobility Authority TxDOT and the Central Texas Regional Mobility Authority (CTRMA) entered into a project agreement for SH 71. TxDOT is responsible for funding the development, design, and construction of the project. Upon completion of SH 71, CTRMA will be responsible for operations and maintenance of the project. Toll revenues are expected to cover the costs of operations and maintenance for the project, and one-half of the excess revenues must be used to reimburse TxDOT for up to $65 million plus interest at a rate of 3.62%. MoPac Managed Lanes – Central Texas Regional Mobility Authority In June, 2012, the Capital Area Metropolitan Planning Organization (CAMPO) and CTRMA entered into an inter-local agreement in which CAMPO allocated $130 million of their portion of an additional $1.9 billion in funds programed into the 2012 Unified Transportation Program by the Texas Transportation Commission (Commission) to fund a portion of the MoPac Improvement Project in Austin. The $130 million allocation was in addition to $67.6 million that had previously been allocated to the project by CAMPO. In exchange for the $130 million allocation, CTRMA agreed to set up a regional infrastructure fund (RIF) where a portion of the project’s net toll revenues would be deposited. CAMPO would select additional projects to make use of the RIF. The Commission approved the total $197.6 million grant in July 2012.
SH 360 - North Texas Tollway Authority SH 360 is a joint project between TxDOT and the North Texas Tollway Authority (NTTA). Pursuant to the SH 360 Project Agreement, TxDOT is funding and developing the initial SH 360 project, while NTTA will own, operate, and maintain the project once complete. The SH 360 Project
5 Texas Mobility Fund debt is paid from certain state revenues dedicated to the fund by the Texas Legislature for the purpose of
paying debt service on outstanding bonds. It is not payable from toll revenues.

f
11
Agreement provides, upon substantial completion (estimated to be late 2017), that project revenues will be used to repay TxDOT for a loan representing up to $294 million for eligible costs incurred for the development, design, and construction of the project plus interest at a rate of 4.25%.
Loop 49 - North East Texas Regional Mobility Authority North East Texas Regional Mobility Authority (NETRMA) entered into loan agreements with TxDOT to fund the costs of developing certain segments of the Loop 49 Toll System. As of January 1, 2016, two of these loans were still outstanding – a State Infrastructure Bank (SIB) loan and a loan related to a Financial Assistance Agreement (FAA). The annual debt service shown in Appendix A represents the projected annual repayments of the SIB loan. The FAA with TxDOT, which did not have a set repayment schedule, is not included in NETRMA’s annual debt service in Appendix A. In April 2016, NETRMA repaid the outstanding balances on both the SIB and FAA through an interim commercial bank loan facility.

f
12
Section 2: Bonds Appropriate for Accelerated or Lump-Sum Payment of Debt Service
HB 2612 requires that TxDOT identify ‘based on criteria provided by the Texas Transportation Commission, bonds that would be appropriate for accelerated or complete lump-sum payment of debt service.’ On June 30, 2016 the Texas Transportation Commission directed TxDOT’s executive director to examine each toll facility for which debt issued by the Commission or a transportation corporation created by the Commission under Texas Transportation Code Chapter 431 is currently outstanding and evaluate the circumstances under which it may be appropriate for the payment of debt service to be accelerated. The analysis is focused on state-owned toll roads. The following criteria were adopted.
Criteria The executive director shall:
Evaluate the accelerated payment/defeasance cost of outstanding bonds using different assumptions about the timing of when the debt may be paid.
Additionally, consider the potential effects removing tolls could have on: – mobility, reliability, and safety in the region in which the toll facility is located; – the capacity to continue funding long-term costs for maintenance and rehabilitation of
the facility; – the capacity to fund improvements including the extension and expansion of the facility
as well as direct connections with other facilities; and – the capacity to continue planned improvements to other transportation projects in the
region that could have been or were expected to be funded or financed in part with the foregone toll revenue.
Note if removing tolls may impair compliance with existing intergovernmental or other agreements.
And, note what actions may be required by a metropolitan planning organization (MPO) to remove tolls from a facility located within its boundaries, pursuant to state and federal laws and regulations, including potential steps required by the MPO policy committee to make changes to an MPO’s transportation improvement plan, air quality conformity determination, long-range transportation plan and associated regional travel demand or air quality emissions models.
Table 4 provides a summary of the state-owned toll road projects and systems, including the toll road elements that comprise state toll road systems. Table 4 also includes the principal outstanding for each state toll road project as of January 1, 2016.

f
13
Table 4: List of State-Owned Toll Projects6 (As of January 1, 2016)
System or Project Name System Elements Outstanding
Principal in millions
Debt Service Report Page In millions
Camino Colombia Toll Road SH 255 Camino Colombia none
Central Texas Turnpike System SH 130 Segments 1-4
$3,172.8 A.12 SH 45 North
Loop 1
SH 45 Southeast
DFW Connector DFW Connector Managed Lanes none
Grand Parkway Transportation Corporation Grand Pkwy Segment D - Harris Co. Portion
3,113.1 A.13
(From IH 10 west of Houston traveling clockwise to US 59/IH 69) Grand Pkwy Segment E
Grand Pkwy Segment F1
Grand Pkwy Segment F2
Grand Pkwy Segment G
SH 99 Grand Parkway Segment I-2A SH 99 Grand Parkway Segment I-2A none
IH 30 Managed Lanes (Tom Landry) IH 30 Managed Lanes (Tom Landry) none
IH 35E Managed Lanes Project IH 35E Managed Lanes none
SH 183 Midtown Express Managed Lanes SH 183 Midtown Express Managed Lanes none
Table 5 below identifies the individual bonds for each of the state-owned toll projects’ outstanding debt that would need to be paid off as part of the process to remove tolls from the project. The bonds, by system, are listed in order of the most to least efficient to pay off based upon a ratio of the pay-off amount to the debt amount. Please note the outstanding principal amounts in Table 4 above include deferred interest securities shown at their final maturity value. The corresponding outstanding principal amounts in Table 5 are shown at their accreted value as of January 1, 2016.
Table 5: State Toll Road Bonds Identified for Lump-Sum Payment (As of January 1, 2016)
System or Project Name Series Maturity Debt Amount (as of
Jan 1, 2016) in millions
Pay-Off Amount (as of Jan 1, 2016)
in millions Central Texas Turnpike System (CTTS)
2002A 8/15/2016 $1.693 $1.740
2002A 8/15/2017 7.272 7.775
2002A 8/15/2018 12.446 13.798
2012A 8/15/2038 123.235 140.529
2002A 8/15/2019 16.873 19.369
2002A 8/15/2020 20.921 24.843
2015C 8/15/2022 2.200 2.655
2012A 8/15/2039 159.415 192.369
2012A 8/15/2040 167.385 201.987
2012A 8/15/2041 135.295 163.263
2015B 8/15/2036 49.304 60.374
2015B 8/15/2037 47.023 57.679
2015C 8/15/2023 5.375 6.594
2002A 8/15/2021 26.904 33.076
6 Debt information is as of January 1, 2016 and does not include actual or planned debt refinancing or new issuance after such date.

f
14
Table 5: State Toll Road Bonds Identified for Lump-Sum Payment (As of January 1, 2016)
System or Project Name Series Maturity Debt Amount (as of
Jan 1, 2016) in millions
Pay-Off Amount (as of Jan 1, 2016)
in millions
CTTS (continued) 2015B 8/15/2032 40.000 49.855
2015B 8/15/2036 24.505 30.542
2015B 8/15/2037 20.000 24.927
2015C 8/15/2024 8.655 10.787
2015C 8/15/2025 12.245 15.262
2015C 8/15/2026 9.825 12.246
2015C 8/15/2027 14.050 17.511
2015C 8/15/2028 13.395 16.695
2015C 8/15/2029 14.620 18.222
2015C 8/15/2030 16.290 20.303
2015C 8/15/2031 125.215 156.064
2015C 8/15/2032 97.730 121.808
2015C 8/15/2033 151.045 188.258
2015C 8/15/2034 150.165 187.161
2015C 8/15/2035 65.900 82.136
2015C 8/15/2036 50.935 63.484
2015C 8/15/2037 66.370 82.722
2015C 8/15/2038 88.315 110.073
2015C 8/15/2039 61.480 76.627
2015C 8/15/2040 64.555 80.459
2015C 8/15/2041 67.780 84.479
2015C 8/15/2042 71.175 88.710
2015B 8/15/2035 113.520 141.488
2002A 8/15/2022 29.971 38.103
2002A 8/15/2023 32.005 42.242
2002A 8/15/2024 33.792 46.200
2002A 8/15/2025 35.176 49.855
2015A 8/15/2041 40.460 57.504
2015A 8/15/2042 184.540 262.985
2002A 8/15/2026 42.410 62.258
2002A 8/15/2027 43.747 66.439
2002A 8/15/2028 44.953 70.684
2002A 8/15/2029 44.831 72.980
2002A 8/15/2030 44.536 75.034
Total $2,699.531 $3,450.155
Grand Parkway Transportation Corporation (GPTC)
2014B 12/15/2016 83.550 83.550
2014C 12/15/2016 107.180 107.180
2014A 12/15/2016 733.465 751.347
2013A 10/1/2031 0.330 0.407
2013A 10/1/2032 0.740 0.912
2013A 10/1/2033 1.180 1.454
2013A 10/1/2034 1.660 2.045
2013A 10/1/2035 2.175 2.680
2013A 10/1/2036 2.735 3.370
2013A 10/1/2037 3.340 4.115
2013A 10/1/2038 3.990 4.916
2013A 10/1/2039 4.690 5.779
2013A 10/1/2040 5.445 6.709

f
15
Table 5: State Toll Road Bonds Identified for Lump-Sum Payment (As of January 1, 2016)
System or Project Name Series Maturity Debt Amount (as of
Jan 1, 2016) in millions
Pay-Off Amount (as of Jan 1, 2016)
in millions
GPTC (continued) 2013A 10/1/2041 6.255 7.707
2013A 10/1/2042 7.125 8.779
2013A 10/1/2043 8.065 9.937
2013A 10/1/2044 9.065 11.423
2013A 10/1/2045 10.175 12.822
2013A 10/1/2046 11.365 14.321
2013A 10/1/2047 12.645 15.934
2013A 10/1/2048 14.015 17.661
2013A 10/1/2050 17.065 21.504
2013A 10/1/2051 18.755 23.634
2013A 10/1/2052 20.560 25.908
2013A 4/1/2053 23.135 29.153
2013A 10/1/2049 15.490 19.520
2013B 10/1/2051 181.000 236.178
2013B 10/1/2052 190.965 249.180
2013B 4/1/2053 190.970 249.187
2013B 10/1/2048 43.205 57.608
2013B 10/1/2049 68.675 91.569
2013B 10/1/2050 263.955 351.949
2013B 10/1/2051 199.165 265.560
2013E 10/1/2036 15.195 20.596
2013E 10/1/2037 50.865 69.201
2013E 10/1/2038 56.805 77.518
2013E 10/1/2039 62.000 84.814
2013E 10/1/2040 66.505 91.143
2013E 10/1/2041 70.035 96.102
2013E 10/1/2042 40.405 55.484
2013B 10/1/2029 1.431 2.000
2013B 10/1/2030 4.807 6.799
2013B 10/1/2031 8.095 11.649
2013B 10/1/2032 11.714 17.052
2013B 10/1/2033 15.517 22.849
2013B 10/1/2034 19.733 29.225
2013B 10/1/2035 24.263 36.140
2013B 10/1/2036 19.078 28.417
2013B 10/1/2044 48.811 74.815
2013B 10/1/2046 48.627 74.960
2013B 10/1/2045 48.897 75.376
2013B 10/1/2047 47.591 73.782
2013B 10/1/2048 18.517 28.708
Total $2,941.020 $3,670.626

f
16
Section 3: Plan to Eliminate Certain State Toll Roads
This section of the report discusses the considerations and circumstances under which tolls could be removed from certain state-owned facilities. In addition to the analysis of the cost and timing of accelerated or lump-sum payment of toll road debt service, the criteria cited in Section 2 include other factors to be considered in the decision to remove tolls. Toll Debt Repayment Unlike a mortgage or car loan, which can typically be paid off at any time, long-term fixed-rate toll revenue bonds generally include terms that ensure the bond holder will receive interest payments for a minimum period of time. For bonds that mature 11 years or longer, this minimum period of time is generally 10 years from the date the bonds are issued. These bonds can still be paid off at any time, but the issuer must pay the original principal amount of the bond as well as the interest that is due to the bond holder during this minimum guaranteed period of time. The lump-sum or accelerated cost of paying down long-term debt in advance, therefore, includes the cost of repaying principal plus the cost of funding interest through the minimum guaranteed time. Additionally, depending upon the rate of construction cost inflation, it may be cheaper to fund new projects with cash today versus using that same cash to pay off debt today and develop those new projects in the future. System Financing TxDOT and other tolling entities are able to finance and operate two or more toll projects in a region as one operational and financial enterprise. The toll road entity may also elect to include future toll projects as additions to or expansions of an existing system. Generally, system financing spreads the traffic and revenue risk across two or more projects, which normally results in a higher credit rating and a lower borrowing cost for the system enabling, in some cases, for a project to be funded that otherwise could not be completely funded if done independently. Furthermore, a new toll facility added to an existing system may reduce the need for the amount of other alternative funding required to complete the project. Bonds that are issued to finance toll systems are payable from all revenues of all elements of the system. Removing tolls from one element of the system typically requires all bonds for the entire system to be paid off. Managed Lanes TxDOT has constructed managed lanes on certain existing highways to improve reliability and mobility, particularly in urban areas where space for roadway expansion is limited. Typically on managed lanes, drivers choose to pay a toll to avoid congestion on the adjacent non-tolled lanes. To ensure the managed toll lane provides a specified minimum speed, the toll rate is typically adjusted to either encourage or discourage additional traffic.

f
17
TxDOT currently operates one managed lane project, the DFW Connector. In addition, TxDOT is developing the IH 30 Managed Lanes (Tom Landry) project in Dallas County, the IH 35E Managed Lanes project in Denton and Dallas Counties, and the SH 183 Midtown Express Managed Lanes project in Tarrant and Dallas Counties. DFW Connector. The DFW Connector project provided for the reconstruction and expansion of SH 114 and SH 121. At its widest point on SH 114, the project has 14 main lanes, 4 tolled managed lanes, and 6 frontage road lanes. The 14.4 mile-project opened to traffic in April 2014. IH 35E Managed Lanes. The IH 35E Managed Lanes project is a three-phase project along IH 35E from IH 635 to US 380. The initial Phase 1 improvements include one additional general purpose lane in each direction, two reversible managed lanes, and additional general purpose lanes and frontage roads across Lake Lewisville. Please note that while no debt is currently outstanding, the department plans to draw down a federal Transportation Infrastructure Finance and Innovation Act (TIFIA) loan by the end of this year. Approximately $120 million of the TIFIA loan proceeds will be used to reimburse the Regional Toll Revenue (RTR) fund controlled by the North Central Texas Council of Governments.7 IH 30 Managed Lanes (Tom Landry). This project will provide two reversible, barrier-separated HOV/managed lanes on the IH 30 Tom Landry Freeway between the Dallas/Tarrant County Line in the City of Grand Prairie and Sylvan Avenue in the City of Dallas, a distance of approximately 13 miles. SH 183 Midtown Express Managed Lanes. The project provides for improvements to SH 183 from SH 121 to IH 35E, as well as portions of Loop 12 and SH 114. It involves reconstructing portions of frontage roads, reconstructing portions of main-lanes, and constructing one managed toll lane in each direction in certain locations. The purpose of tolled managed lanes is to offer drivers of these facilities reliable travel times along congested corridors. The removal of tolls on these facilities would therefore eliminate their very purpose. In addition, TxDOT’s managed-lane projects are built within the boundaries and with the concurrence of metropolitan planning organizations. For these reasons, this report does not contemplate in detail the removal of tolls on such facilities. Surplus Toll Revenue For most toll roads, toll revenues are sufficient to pay the annual operations, maintenance, and debt service associated with the project. As they mature, toll projects and systems can also be expected to generate surplus revenues that can be used for expansion and construction of additional transportation projects in the area or to pay off debt early. If the TxDOT toll project is within the bounds of a Metropolitan Planning Organization, the MPO selects the transportation projects to make use of the surplus revenues. The removal of tolls would therefore remove a possible source of funding for construction of new transportation facilities. If funds are 7 The RTR fund is a subaccount held in the State Highway Fund which may only be used on projects in the Dallas-Fort Worth region. The source of funding for the account is payments from the North Texas Tollway Authority for the right to develop certain toll projects in the region.

f
18
available for the retirement of toll debt, they could alternatively be used to fund other needed transportation projects. Maintenance Costs Maintaining roadways is expensive and the aggregate long-term cost of maintenance, rehabilitation, and reconstruction of roadways eventually surpasses the initial cost of construction. As TxDOT continues to add capacity to the State Highway System and as the existing system continues to age, the pressures on the department’s maintenance budget increase commensurately each year. The more money that is spent on maintenance, the less there is available to improve mobility. One benefit of toll projects is that toll revenue is used to pay for the maintenance of the facility. While more toll road traffic accelerates the deterioration of the highway, it also typically generates toll revenues sufficient to meet those increased maintenance costs. Through tolling, the state is relieved of the burden of funding maintenance costs for this portion of the state’s transportation system. Table 6 presents projected revenues, debt service, operations, and total maintenance expenses for TxDOT-operated toll projects. It should be noted that these are current projections of revenues and expenses. Actual revenues and expenses could be more or less than what is projected today. Additionally, toll revenue bonds typically include requirements that projected revenues exceed expected debt service, operations and maintenance each year by a certain measure in order to achieve a lower borrowing cost from investors. Table 6: List of State-Operated Toll Projects8 (As of January 1, 2016)
Projected Operating Data (2016 – 2035)
System or Project Name Gross Revenues in millions
Total Debt Service In millions
Total Operations, Maintenance, and Major
Maintenance Costs In millions
Camino Colombia Toll Road Yrs 1 - 5 $10.2 $0.0 $1.0
Yrs 1 - 10 21.7 0.0 2.1
Yrs 1 - 20 48.1 0.0 4.4
Central Texas Turnpike System Yrs 1 - 5 1,013.1 606.2 313.1
Yrs 1 - 10 2,344.4 1,412.3 696.5
Yrs 1 - 20 6,330.9 3,641.3 1,793.2
DFW Connector Yrs 1 - 5 13.6 0.0 3.8
Yrs 1 - 10 32.9 0.0 8.6
Yrs 1 - 20 90.9 0.0 20.8
Grand Parkway Transportation Corporation Yrs 1 - 5 490.5 375.3 146.6
Yrs 1 - 10 1,438.0 1,035.5 390.9
Yrs 1 - 20 4,673.7 2,897.7 1,210.8
8 The figures shown in Table 6 represent projected cash flows. With respect to the Grand Parkway Transportation Corporation, IH 35E Managed Lanes Project, and SH 183 Midtown Express Managed Lanes, the projected debt service includes currently programmed new money debt issuances and refinancings expected to occur after the date of this report.

f
19
Projected Operating Data (2016 – 2035)
System or Project Name Gross Revenues in millions
Total Debt Service In millions
Total Operations, Maintenance, and Major
Maintenance Costs In millions
SH 99 Grand Parkway Segment I-2A Yrs 1 - 5 12.0 0.0 3.7
Yrs 1 - 10 35.5 0.0 9.9
Yrs 1 - 20 118.2 0.0 29.3
I-30 Managed Lanes (Tom Landry) Yrs 1 - 5 61.8 0.0 9.3
Yrs 1 - 10 177.7 0.0 24.2
Yrs 1 - 20 528.7 0.0 66.1
IH 35E Managed Lanes Project Yrs 1 - 5 37.8 0.0 9.5
Yrs 1 - 10 150.5 40.2 41.3
Yrs 1 - 20 538.4 211.9 139.7
SH 183 Midtown Express Managed Lanes Yrs 1 - 5 31.5 0.0 27.6
Yrs 1 - 10 112.2 28.1 81.7
Yrs 1 - 20 415.4 187.4 193.2
Camino Colombia The Camino Colombia is an all-electronic toll road stretching 22 miles from the Colombia-Solidarity International Bridge to IH 35 north of Laredo. This $90 million project was a private toll road built, operated, and financed by a private company in 2000. The Texas Transportation Commission approved the road’s connection with the State Highway System but had no role in initiating development of the facility. In early 2004 the project’s creditors foreclosed on the project after the owners could not meet their debt service obligations. The creditors auctioned the road and TxDOT later acquired it for $20 million. TxDOT converted the road to all-electronic tolling. Toll revenue is currently projected to exceed the costs of operations and maintenance by about ten to one as shown in the table above. Because there is no debt on the facility, tolls can be removed with no defeasance costs and there would be no adverse impact on congestion, reliability, or safety in the region. A portion of the road is within the boundaries of the Laredo Metropolitan Planning Organization. TxDOT would need to coordinate with and solicit the approval of the MPO to remove tolls. Pursuant to state and federal laws and regulations, the MPO policy committee would need to make changes to its transportation improvement plan, long-range transportation plan and associated regional travel demand or air quality emissions models. The State Highway Fund would be responsible for maintenance of the road and the initial purchase price would not be fully recovered. Central Texas Turnpike System The Central Texas Turnpike System (CTTS) consists of four elements that provide expanded mobility options in the Central Texas region.

f
20
Elements SH 130 Element. Segments 1 through 4 of SH 130, from IH 35 to US 183. This element is 49.0 miles long extending from IH 35 near SH 195, north of Georgetown, Texas, southward to US 183, southeast of Austin, and provides an eastern alternative to IH 35. SH 45N Element is 12.8 miles long extending from US 183 on the west to SH 130 on the east and provides an east-west roadway for the Austin metropolitan area. Loop 1 Element. The north extension of Loop 1. This element is 4.0 miles long extending northward from the non-tolled portion of Loop 1 at Parmer Lane to the SH 45N Element and is a major north-south route of the CTTS. SH 45SE Element. This element links IH 35 at FM 1327, north of the City of Buda, to the junction of SH 130 and US 183 near Mustang Ridge. The 7.0 mile long facility is a four-lane roadway with controlled access and a wide center median. Funding of the Project TxDOT used a combination of state funding, local funding, toll revenue bonds, and a federal loan to finance the construction of the $2.7 billion CTTS. At the time of the original financing, the state agreed to fund from the State Highway Fund operations and maintenance costs in the event revenues were insufficient to cover those costs plus debt service. However, since 2013 CTTS revenues have been sufficient to pay debt service, operations, and maintenance expenses without contributions from the State Highway Fund and are projected to continue doing so. Bonds CTTS bonds, originally issued in 2002, are payable from the revenues of the system. Refinancings for savings, including a refinancing of the federal loan, were completed in 2012 and 2015. Outstanding principal is $3.2 billion9. Removing Tolls To remove tolls from one or more elements of the CTTS, all of the outstanding bonds must be paid off. Table 7 shows how much cash is needed to pay off debt when certain dates are targeted for the repayment on: September 1 of 2017, 2019, 2021, or 2023. The table also shows when these bonds may be paid off if excess revenue (revenue in excess of operations, maintenance or debt service) is also applied to retire debt early. Lastly, Table 7 shows when the debt may be paid if the repayments are accelerated using excess revenue assuming maintenance expenses are paid from other sources. Final maturity for CTTS bonds would be in the year 2042 if no accelerated payment of debt occurs.
9 The principal includes deferred interest securities and is shown at their final maturity value.

f
21
Table 7: Central Texas Turnpike System Lump-Sum Debt Repayment Costs Lump-Sum Cost (in millions)
September 1, 2017 Payoff $3,195.3
September 1, 2019 Payoff 3,005.8
September 1, 2021 Payoff 2,759.4
September 1, 2023 Payoff 2,473.3
Early Retirement of Debt Over Time Using Excess Revenues – Final Debt Payment Date
Excess Revenues Fiscal Year 2035
Excess Revenues including $1.17 billion of revenue currently expected to fund operations and maintenance expenses
Fiscal Year 2030
Other Considerations Effects on Mobility and Safety. If tolls are removed from CTTS, it is reasonable to expect that congestion on the system will increase. Drivers using the northern portions of SH 130 currently experience congestion during the peak afternoon hours. Congestion would likely occur for a longer period of time if the facility were non-tolled. However, removing tolls from SH 130 could also draw vehicles off of IH 35 in Austin, which could improve overall safety in the region. Significant analysis would be required to more specifically determine projected traffic and safety implications from removing tolls from the Central Texas Turnpike System. Costs of Long-term Maintenance. Over the next 20 years, the cost of performing non-toll related operations and maintenance on CTTS is projected to be $444 million. Toll revenues are currently expected to fund these costs. Without tolls these costs would need to be funded from other sources. Other Planned Improvements. As noted above, drivers experience congestion in the northern portions of SH 130 during peak hours. Excess system revenue could be used to expand the capacity of the system and further improve mobility. Additionally, it has been suggested that some of the excess revenue of the system could possibly be used to support the delivery of new, tolled lanes on IH 35 in Central Texas. If tolls are removed, such improvements would need to be funded from other sources, which have not been identified. Local Coordination. The CTTS is located within the boundaries of the Capital Area Metropolitan Planning Organization. TxDOT would need to coordinate with and solicit the approval of the MPO. Pursuant to state and federal laws and regulations, the MPO policy committee would need to make changes to its transportation improvement plan, long-range transportation plan and associated regional travel demand or air quality emissions models. The Grand Parkway Transportation Corporation The Grand Parkway Transportation Corporation (GPTC) is a public, non-profit Texas corporation created by the Texas Transportation Commission in March 2012. GPTC is authorized to act on behalf of the Texas Transportation Commission for the public purpose of developing, financing, refinancing, designing, constructing, reconstructing, expanding, operating or maintaining some or all of the segments of the Grand Parkway Project. The Grand Parkway Project is a proposed 184-mile long highway traversing seven counties (Harris, Fort Bend, Brazoria, Galveston, Montgomery, Liberty, and Chambers Counties) and encircling the greater Houston area. The Grand Parkway Project is divided into eleven segments designated A, B, C, D, E, F-1, F-2, G, H, I-

f
22
1 and I-2. GPTC currently consists of the portion of Segment D located within Harris County, Segment E, Segment F-1 and Segment G (collectively the “Grand Parkway System”). As of March 2016, all of the segments that comprise the GPTC’s Grand Parkway System were open to traffic. Elements Segment D (Harris County Portion) extends 2.6 miles from the Fort Bend/Harris County line to 0.30 miles north of Colonial Parkway. Segment E is a 14.4-mile, controlled access toll road with intermittent frontage roads from just north of Colonial Parkway to US Highway 290 through northwest Harris County. Segment F-1 extends 12.1 miles from US Highway 290 to State Highway 249 through northwest Harris County. Segment F-2 is 12.2 miles extending from State Highway 249 to Interstate Highway 45 North through northwest Harris County. Segment G is 13.5 miles extending from Interstate Highway 45 North to Interstate Highway 69 North through northwest Harris County and southeast Montgomery County. Funding of the Project Bonds In August 2013, GPTC financed the capital costs of delivering Segments D-G of the Grand Parkway Project, using toll revenue bonds, some with a Toll Equity Loan Agreement (TELA) component. As of January 1, 2016, a total of approximately $3.1 billion10 in bonds were outstanding. TELA is an agreement in which TxDOT would make a loan from the State Highway Fund to the GPTC to cover eligible costs of construction, right-of-way, and operations and maintenance in the event annual toll revenues are insufficient to pay certain operation and maintenance costs plus debt service, up to a maximum annual amount. Any amount drawn must be repaid, with interest. The TELA was utilized to improve the credit rating on some of the bonds, thereby lowering borrowing costs, enabling more of the project to be delivered. Before any such loan is made, available toll revenues along with substantial cash reserves must be used. There is no projected use of the TELA in the next biennium. Without the TELA, the 2013 financing would have required an estimated $980 million of additional up-front public subsidy. Transportation Infrastructure Finance and Innovation Act (TIFIA) An $840.6 million TIFIA loan from USDOT for Segments D-G closed in February 2014. Disbursement of the loan proceeds is expected in late 2016 and is not anticipated to increase the total amount of GPTC debt. In October of 2015, a TIFIA Letter of Interest, the first step of the loan process, was submitted to USDOT for Segments H&I. The plan for development of Segments H&I is discussed in more detail in the “Other Planned Improvements” section below. 10 The principal includes deferred interest securities and is shown at their final maturity value.

f
23
Removing Tolls In order to remove tolls from any element of the GPTC’s Grand Parkway System, all of the outstanding GPTC bonds must be paid. Table 8 below shows the timing and required pay-off amounts under different scenarios under which the debt repayment may be accelerated. The table shows how much cash is needed to pay off debt when certain dates are targeted for the repayment on: September 1 of 2017, 2019, 2021, or 2023. Additionally, Table 8 below shows when the bonds may be paid off if excess revenue (revenue not needed for operations, maintenance or debt service) is used to retire debt early. Lastly, the table shows when the debt may be paid if the repayments are accelerated using excess revenue and revenue that would otherwise have been used for maintenance expenses. This scenario assumes that maintenance would be performed using some other eligible source of funding. Final maturity for GPTC bonds would be in the year 2053 if no accelerated payment of debt occurs. Table 8: Grand Parkway Transportation Corporation Lump-Sum Repayment Costs
Upfront Cash Cost (in millions)
September 1, 2017 Payoff $3,554.3
September 1, 2019 Payoff 3,563.9
September 1, 2021 Payoff 3,504.0
September 1, 2023 Payoff 3,381.0
Early Retirement of Debt Over Time Using Excess Revenues – Final Debt Extinguishment Date
Excess Revenues Only Fiscal Year 2042
Excess Revenues including $1.4 billion of revenue currently expected to fund operations and maintenance expenses
Fiscal Year 2036
Effects on Mobility and Safety If tolls are removed from the segments of the Grand Parkway operated by the Grand Parkway Transportation Corporation, it is reasonable to expect more traffic on the facility. The Grand Parkway, which was originally conceived in 1960, is designed to serve the now rapidly growing areas around Houston. The Grand Parkway will be the outer-most loop serving the Houston Metropolitan area. The next available loop inward toward Houston is the Sam Houston Toll Road, approximately 14 miles from the Grand Parkway along IH 10. Traffic could be diverted from the Sam Houston Toll Road if drivers whose destinations are north or south of Houston find the Grand Parkway more convenient. The inner-most loop, IH 610, is not tolled. However it is 20 miles from the Grand Parkway along IH 10. The traffic study conducted for the GPTC’s Grand Parkway System financings estimated the travel time savings in 2035 for segments D through G during peak and non-peak periods. The traffic study estimates during peak hours travel time savings increases in a range of 10-11 minutes on Segment F-1 to 47-48 minutes on Segment G. A detailed traffic study conducted over several months would have to be performed to predict the precise effects of removing tolls from the GPTC’s segments of the Grand Parkway. However,

f
24
the previous traffic study shows significant estimated time savings, particularly during peak hours. Such time savings would be expected to decrease if the Grand Parkway System was operated as a non-tolled road. Costs of Long-term Maintenance Over the next 20 years, the costs of performing non-toll related operations and maintenance on the segments of the Grand Parkway operated by the Grand Parkway Transportation Corporation is projected to be $495 million. Toll revenues are expected to pay these costs. If tolls are removed, the maintenance costs would need to be paid from other sources of revenue available to TxDOT. Other Planned Improvements TxDOT is currently procuring a contractor to build Segments H, I-1 and I-2B (Segments H&I). If Segments H&I were to be financed as a stand-alone project, rather than being incorporated into the GPTC’s Grand Parkway System, it is estimated that TxDOT would need an additional $340 million up front along with the proceeds of revenue bonds and a TIFIA loan to fund the project. If tolls are removed before completion of this procurement, the cost of Segments H&I, which will likely far exceed $1 billion, would need to be funded from other sources which are not currently identified. If the state determines it has funds available to pay off toll bond debt, it could be substantially more efficient to continue building the Grand Parkway with those funds rather than issuing new debt and paying interest to continue the project. Segment I-2A (FM 1405 to SH 146) opened to traffic in 2008 and currently has no debt outstanding. It is expected to be added to the Grand Parkway System upon completion of Segments H & I. If tolls are removed and Segments H & I are not procured, then Segment I-2A will remain a standalone section of the Grand Parkway Project. Local Coordination Four counties (Harris, Montgomery, Liberty and Chambers) have ceded to the Commission and TxDOT their primacy rights to develop the Grand Parkway segments in their counties. TxDOT is a party to the 2009 Market Valuation Waiver Agreement (MVWA) with seven counties (Galveston, Brazoria, Fort Bend, Harris, Montgomery, Liberty and Chambers). The MVWA establishes certain policies and principles for the development of the 184-mile toll project. The MVWA describes the minimum scope and ultimate scope of the Grand Parkway Project and phased construction of a number of direct connectors. In addition, the MVWA sets out principles of governance for all segments of the Grand Parkway Project, including: (1) baseline toll rates and annual toll escalation policy that are based on average per mile toll rates of the Harris County Toll Road Authority in effect in 2009; (2) a prohibition on the use of toll revenues outside the Grand Parkway Project until the ultimate scope has been constructed and placed in service; and (3) limits on competing roads that impact tolled traffic on the corridor Project. TxDOT would work with the other parties to the agreement and amend it as necessary in order to remove tolls from the segments operated by the GPTC. The GPTC’s Grand Parkway System is located within the boundaries of the Houston-Galveston Area Council, the metropolitan planning organization for that region. TxDOT would need to coordinate with and solicit the approval of the council. Pursuant to state and federal laws and

f
25
regulations, the MPO policy committee would need to make changes to its transportation improvement plan, air quality conformity determination, long-range transportation plan and associated regional travel demand or air quality emissions models. Comprehensive Development Agreement Concession Summary A form of Comprehensive Development Agreement (CDA), concessions are a method of alternative financing that enables the state to access private investment and transfer the risks and responsibilities associated with the design, construction, financing and maintenance of transportation projects. TxDOT uses different types of CDAs, including design-build contracts and concession agreements. Design-build contracts provide a mechanism for property acquisition, design, and construction to occur simultaneously under a single contract, but do not include private-sector financial participation. Concession agreements require that a private-sector developer be responsible for performing the development, financing, construction, operation, and maintenance of a facility for a specific time period up to 52 years. In exchange, the developer receives a share of revenue from tolls collected. TxDOT has entered into concession CDAs with private-sector developers for five projects in Texas, as shown in Table 9 below.
Table 9: List of Comprehensive Development Agreement Toll Projects in the State of Texas Project District Phase Limits Developer Contract Execution Total Capital
Costs11
SH 130 Segments 5 and 612 Austin / San Antonio
Operations & Maintenance
Segment 5 stretches from north of Mustang Ridge to FM 1185 north of Lockhart; Segment 6 runs from FM 1185 to IH 10 northeast of Seguin.
SH 130 Concession
Company LLC March 22, 2007 $1.38 billion
North Tarrant Express Segments 1 & 2W Fort Worth Operations &
Maintenance
Segment 1 of IH 820 from IH 35W to the Northeast IH 820/SH 121 Interchange Segment 2 from Northeast IH 820/SH 121 Interchange to east of SH 183/SH 121
NTE Mobility Partners LLC June 23, 2009 2.12 billion
IH-635 LBJ Managed Lanes Dallas Operations & Maintenance
From Greenville Avenue to Luna Rd on IH 635 and from Northwest Highway to Valwood Parkway on IH 35 north of Dallas
LBJ Infrastructure
Group, LLC
September 4, 2009 2.74 billion
North Tarrant Express Segments 3A13 Fort Worth Design -
Construction
Extends along IH 35W from IH 30 to Fossil Creek Boulevard north of Fort Worth
NTE Mobility Partners
Segments 3, LLC
March 1, 2013 1.5 billion
SH 288 Toll Lanes in Harris County Project Houston Design -
Construction
From US 59 to the Harris/Brazoria County line south of Houston
Blueridge Transportation
Group, LLC March 4, 2016 816 million
11 Total Capital Costs include current Contract Value with Change Order, ROW, Utilities, Tolling/ITS/Contingencies and other financial fees. 12 Includes final developer expenditures, including the concession payment to TxDOT. 13 Upon substantial completion, operation of North Tarrant Express Segment 3B will be governed by the North Tarrant Express 3A/3B Facility Agreement.

f
26
These toll projects were structured as long-term concession agreements and each of these concessions would require an upfront payment from TxDOT to the developer to terminate the concession agreement and remove tolls. The cost of the up-front payment is substantial and the calculation is more complex compared to TxDOT-operated toll projects. To remove the debt and other obligations for all of these toll road facilities, TxDOT has calculated the estimated payments to be approximately $12.5 billion. This is a preliminary, estimated amount of upfront payment to be paid to developers if TxDOT were to exercise its right to terminate each CDA. A more rigorous process, including the use of an independent appraiser, pursuant to state law and the contractual agreements would be required in order to determine the actual payments.

f
A-1
Appendix A: Index of Texas Toll Road Bonds
Table A.1: Debt Service on Regional and Local Government Toll Agency Toll Revenue Bonds14 (As of January 1, 2016)
Calendar
Principal Due Interest Due Total Debt Service
2016 $128,276,043 $599,794,519 $728,070,561
2017 161,370,427 613,755,758 775,126,185
2018 159,986,198 627,135,158 787,121,357
2019 222,220,316 623,192,140 845,412,456
2020 259,257,401 619,478,367 878,735,768
2021 312,738,480 609,075,901 921,814,381
2022 329,366,250 606,597,662 935,963,912
2023 349,446,825 592,137,207 941,584,032
2024 386,184,783 587,578,061 973,762,844
2025 400,354,309 579,144,345 979,498,653
2026 451,329,431 556,235,733 1,007,565,164
2027 475,810,416 529,805,884 1,005,616,299
2028 545,986,069 507,781,432 1,053,767,501
2029 562,974,631 486,038,308 1,049,012,939
2030 669,186,535 461,215,875 1,130,402,409
2031 655,887,943 433,053,837 1,088,941,780
2032 640,452,000 406,133,692 1,046,585,692
2033 622,775,254 383,665,672 1,006,440,926
2034 624,239,658 363,011,884 987,251,542
2035 655,381,032 342,735,285 998,116,317
2036 626,464,927 321,136,174 947,601,102
2037 635,282,418 299,670,354 934,952,772
2038 690,083,896 278,929,264 969,013,160
2039 500,215,768 252,925,326 753,141,095
2040 518,456,015 226,076,506 744,532,521
2041 535,790,879 187,131,660 722,922,539
2042 557,702,771 157,204,033 714,906,804
2043 590,646,272 130,433,741 721,080,012
2044 394,116,947 103,426,188 497,543,136
2045 431,329,231 77,879,222 509,208,452
2046 399,192,829 55,734,068 454,926,897
2047 349,116,737 36,156,748 385,273,485
2048 172,402,253 20,122,528 192,524,781
2049 218,159,596 9,082,344 227,241,940
2050 51,000,000 1,391,524 52,391,524
2051 1,000,000 78,750 1,078,750
2052 1,000,000 26,250 1,026,250
Total $15,285,184,540 $12,684,971,402 $27,970,155,939
14 Figures do not include certain loan agreements between TxDOT and local and regional toll entities that do not have a set annual principal and interest payment schedule. Such loans are described under ‘TxDOT Financial Assistance’

f
A-2
Table A.2: Debt Service on All Toll Revenue Bonds Issued for State-Owned Toll Projects15 (As of January 1, 2016)
Calendar Year Principal Due Interest Due Total Debt Service
2016 $925,940,000 $123,534,805 $1,049,474,805
2017 7,885,000 179,028,954 186,913,934
2018 14,225,000 194,962,893 209,187,893
2019 20,365,000 194,962,893 215,327,893
2020 26,715,000 194,962,893 221,677,893
2021 36,480,000 194,962,893 231,442,893
2022 45,350,000 194,962,893 240,312,893
2023 54,315,000 194,852,893 249,167,893
2024 63,380,000 222,341,695 285,721,695
2025 72,655,000 221,908,945 294,563,945
2026 87,030,000 221,296,695 308,326,695
2027 98,405,000 220,805,445 319,210,445
2028 105,225,000 220,102,945 325,327,945
2029 113,750,000 219,433,195 333,183,195
2030 125,390,000 218,598,740 343,988,740
2031 137,595,000 217,426,953 355,021,953
2032 156,040,000 210,522,690 366,562,690
2033 175,675,000 202,667,055 378,342,055
2034 181,760,000 193,788,030 375,548,030
2035 218,540,000 184,563,248 403,103,248
2036 242,420,000 173,448,804 415,868,804
2037 260,575,000 167,151,177 427,726,177
2038 272,345,000 160,024,660 432,369,660
2039 287,585,000 147,530,251 435,115,251
2040 303,890,000 133,031,059 436,921,059
2041 319,825,000 117,707,383 437,532,383
2042 303,245,000 101,579,450 404,824,450
2043 8,065,000 86,333,949 94,398,949
2044 84,805,000 85,920,618 170,725,618
2045 86,335,000 81,066,993 167,401,993
2046 87,105,000 76,090,088 163,195,088
2047 87,050,000 71,072,093 158,122,093
2048 86,170,000 66,023,925 152,193,925
2049 84,165,000 61,291,263 145,456,263
2050 281,020,000 56,833,875 337,853,875
2051 398,920,000 42,037,663 440,957,663
2052 211,525,000 21,499,975 233,024,975
2053 214,105,000 5,410,463 219,515,463
Total $6,285,870,000 $5,679,740,442 $11,965,610,442
15 The Grand Parkway Transportation Corporation principal maturing in 2016 in the amount of $924.2 million is expected to be refinanced, largely through a federal loan through the Transportation Infrastructure Finance and Innovation Act program.

f
A-3
Cameron County Regional Mobility Authority Table A.3: Cameron County Regional Mobility Authority Toll System Debt Service (As of January 1, 2016)
Calendar Year Principal Due Interest Due Total Debt Service 2016 $-- $2,262,813 $2,262,813
2017 840,000 2,250,213 3,090,213
2018 910,000 2,226,900 3,136,900
2019 1,030,000 2,205,338 3,235,338
2020 1,240,000 2,176,550 3,416,550
2021 1,335,000 2,127,050 3,462,050
2022 1,400,000 2,064,550 3,464,550
2023 1,475,000 2,000,569 3,475,569
2024 1,540,000 1,933,575 3,473,575
2025 1,610,000 1,863,894 3,473,894
2026 1,685,000 1,789,388 3,474,388
2027 1,765,000 1,709,963 3,474,963
2028 1,850,000 1,626,313 3,476,313
2029 1,940,000 1,538,178 3,478,178
2030 2,025,000 1,445,744 3,470,744
2031 2,125,000 1,348,794 3,473,794
2032 2,230,000 1,246,044 3,476,044
2033 2,335,000 1,137,331 3,472,331
2034 2,455,000 1,023,078 3,478,078
2035 2,130,000 912,906 3,042,906
2036 2,240,000 807,000 3,047,000
2037 2,350,000 695,563 3,045,563
2038 2,465,000 578,625 3,043,625
2039 2,595,000 455,719 3,050,719
2040 2,720,000 326,594 3,046,594
2041 2,540,000 197,000 2,737,000
2042 2,670,000 66,750 2,736,750
Total $49,500,000 $38,016,438 $87,516,438
Standalone Toll Road / System Elements SH550

f
A-4
Central Texas Regional Mobility Authority Table A.4: Central Texas Regional Mobility Authority Toll System Debt Service (As of January 1, 2016)
Calendar Year Principal Due Interest Due Total Debt Service
2016 $5,175,000 $50,011,700 $55,186,700
2017 6,315,000 56,763,563 63,078,563
2018 8,275,000 56,379,706 64,654,706
2019 11,025,000 55,864,263 66,889,263
2020 12,800,000 56,596,342 69,396,342
2021 15,570,000 57,202,722 72,772,722
2022 16,895,449 56,740,542 73,635,991
2023 19,873,357 57,257,584 77,130,941
2024 23,486,476 63,323,843 86,810,319
2025 20,959,439 73,788,953 94,748,392
2026 24,475,784 71,887,956 96,363,740
2027 29,286,750 69,409,329 98,696,079
2028 30,654,208 68,763,733 99,417,941
2029 42,294,069 67,554,228 109,848,298
2030 49,262,943 65,875,857 115,138,800
2031 52,166,778 62,961,028 115,127,806
2032 54,150,143 60,884,019 115,034,162
2033 56,291,675 58,649,463 114,941,137
2034 58,679,928 56,275,809 114,955,737
2035 61,135,851 53,759,711 114,895,562
2036 65,018,067 49,706,395 114,724,462
2037 67,888,985 46,843,403 114,732,387
2038 70,786,947 43,818,015 114,604,962
2039 74,087,277 40,619,960 114,707,237
2040 77,351,015 37,239,547 114,590,562
2041 92,015,879 23,117,134 115,133,012
2042 72,602,904 19,032,983 91,635,887
2043 70,391,272 15,619,859 86,011,131
2044 73,841,947 12,171,721 86,013,669
2045 104,764,120 7,861,255 112,625,375
2046 54,544,660 3,962,753 58,507,412
2047 23,673,693 2,227,994 25,901,687
2048 24,442,253 1,456,234 25,898,487
2049 25,239,596 660,091 25,899,687
Total $1,495,421,465 $1,524,287,698 $3,019,709,163
Standalone Toll Road / System Elements US 183A US 290 East US 183 South

f
A-5
Central Texas Regional Mobility Authority Table A.5: Central Texas Regional Mobility Authority SH 71 Express Debt Service16 (As of January 1, 2016)
Calendar Year Principal Due Interest Due Total Debt Service
2016 $0 $- 2017 1,335,180 1,335,180 2018 2,385,371 2,385,371 2019 2,744,584 2,744,584 2020 2,954,875 2,954,875 2021 2,788,319 2,788,319 2022 3,391,772 3,391,772 2023 3,617,789 3,617,789 2024 3,848,366 3,848,366 2025 4,083,574 4,083,574 2026 2,315,623 2,315,623 2027 4,524,862 4,524,862 2028 4,734,093 4,734,093 2029 4,943,392 4,943,392 2030 5,155,097 5,155,097 2031 2,094,395 2,094,395 2032 5,579,605 5,579,605 2033 5,791,262 5,791,262 2034 2,711,835 2,711,835 Total $65,000,000 $65,000,000
Standalone Toll Road / System Elements SH 71 Express
16 Debt service is projected based upon net revenues and will change based upon actual revenues and operations and maintenance. Total repayments as of January 1, 2016 were still not fully finalized as to total size of the loan and interest repayments and therefore only the estimated principal payments were contemplated as of that date.

f
A-6
Fort Bend County Grand Parkway Toll Road Authority Table A.6: Fort Bend County Grand Parkway Toll Road Authority Toll System Debt Service (As of January 1, 2016)
Calendar Year Principal Due Interest Due Total Debt Service 2016 $0 $7,180,200 $7,180,200 2017 7,180,200 7,180,200 2018 7,180,200 7,180,200 2019 7,180,200 7,180,200 2020 7,180,200 7,180,200 2021 1,230,000 7,149,450 8,379,450 2022 2,460,000 7,057,200 9,517,200 2023 3,575,000 6,906,325 10,481,325 2024 3,750,000 6,723,200 10,473,200 2025 3,930,000 6,531,200 10,461,200 2026 4,125,000 6,329,825 10,454,825 2027 4,325,000 6,118,575 10,443,575 2028 4,535,000 5,897,075 10,432,075 2029 4,710,000 5,713,050 10,423,050 2030 4,890,000 5,520,150 10,410,150 2031 5,080,000 5,321,700 10,401,700 2032 5,275,000 5,113,625 10,388,625 2033 5,535,000 4,843,375 10,378,375 2034 5,805,000 4,559,875 10,364,875 2035 6,090,000 4,262,500 10,352,500 2036 6,390,000 3,950,500 10,340,500 2037 6,705,000 3,623,125 10,328,125 2038 7,040,000 3,279,500 10,319,500 2039 7,385,000 2,918,875 10,303,875 2040 7,750,000 2,540,500 10,290,500 2041 8,135,000 2,143,375 10,278,375 2042 8,540,000 1,726,500 10,266,500 2043 8,920,000 1,334,600 10,254,600 2044 9,265,000 970,900 10,235,900 2045 9,630,000 593,000 10,223,000 2046 10,010,000 200,200 10,210,200 Total $155,085,000 $147,229,200 $302,314,200
Standalone Toll Road / System Elements SH 99 Grand Pkwy Segment D - Fort Bend County

f
A-7
Fort Bend County Toll Road Authority Table A.7: Fort Bend County Grand Parkway Toll Road Authority Toll System Debt Service (As of January 1, 2016)
Calendar Year Principal Due Interest Due Total Debt Service 2016 $4,645,000 $8,680,025 $13,325,025 2017 5,390,000 8,508,175 13,898,175 2018 6,260,000 8,276,288 14,536,288 2019 6,820,000 8,011,188 14,831,188 2020 7,345,000 7,714,575 15,059,575 2021 7,780,000 7,363,875 15,143,875 2022 8,230,000 6,987,975 15,217,975 2023 8,630,000 6,587,075 15,217,075 2024 9,085,000 6,164,922 15,249,922 2025 9,510,000 5,720,019 15,230,019 2026 9,980,000 5,251,913 15,231,913 2027 10,470,000 4,758,894 15,228,894 2028 10,975,000 4,240,806 15,215,806 2029 11,510,000 3,694,156 15,204,156 2030 12,105,000 3,125,119 15,230,119 2031 12,660,000 2,527,831 15,187,831 2032 13,280,000 1,893,231 15,173,231 2033 3,370,000 1,491,406 4,861,406 2034 3,520,000 1,334,131 4,854,131 2035 3,680,000 1,169,656 4,849,656 2036 3,845,000 997,631 4,842,631 2037 4,015,000 829,406 4,844,406 2038 4,170,000 664,600 4,834,600 2039 4,340,000 492,144 4,832,144 2040 4,515,000 312,697 4,827,697 2041 2,710,000 167,000 2,877,000 2042 2,820,000 56,400 2,876,400 Total $191,660,000 $107,021,138 $298,681,138
Standalone Toll Road / System Elements Fort Bend Co. Pkwy Toll Road Fort Bend Co. Westpark Tollway

f
A-8
Harris County Toll Road Authority Table A.8: Harris County Toll Road Authority Toll System Debt Service (As of January 1, 2016)
Calendar Year Principal Due Interest Due Total Debt Service 2016 $93,585,000 $98,732,614 $192,317,614 2017 97,210,000 98,105,350 195,315,350 2018 99,180,000 94,100,520 193,280,520 2019 103,780,000 90,271,570 194,051,570 2020 106,865,000 85,323,187 192,188,187 2021 102,540,000 80,106,825 182,646,825 2022 79,200,000 75,154,962 154,354,962 2023 81,990,000 71,248,194 153,238,194 2024 84,870,000 67,206,475 152,076,475 2025 76,520,000 63,025,631 139,545,631 2026 74,880,000 59,174,181 134,054,181 2027 73,340,000 55,408,619 128,748,619 2028 76,955,000 51,723,894 128,678,894 2029 80,765,000 47,890,706 128,655,706 2030 92,720,000 43,882,956 136,602,956 2031 97,095,000 39,294,044 136,389,044 2032 100,815,000 34,449,844 135,264,844 2033 106,075,000 29,425,069 135,500,069 2034 102,815,000 24,390,656 127,205,656 2035 107,755,000 19,807,739 127,562,739 2036 41,335,000 14,738,488 56,073,488 2037 31,905,000 12,671,738 44,576,738 2038 33,545,000 11,076,488 44,621,488 2039 20,145,000 9,399,238 29,544,238 2040 20,810,000 8,391,988 29,201,988 2041 14,030,000 7,318,213 21,348,213 2042 17,885,000 6,581,638 24,466,638 2043 18,680,000 5,650,425 24,330,425 2044 19,520,000 4,677,475 24,197,475 2045 20,505,000 3,660,425 24,165,425 2046 21,340,000 2,591,913 23,931,913 2047 22,325,000 1,479,313 23,804,313 2048 3,100,000 315,000 3,415,000 2049 3,200,000 160,000 3,360,000 Total $2,127,280,000 $1,317,435,372 $3,444,715,372
Standalone Toll Road / System Elements Hardy Toll Road Tomball Tollway Katy (I-10) Managed Lanes Fort Bend Parkway Extension Sam Houston Tollway Westpark Tollway

f
A-9
North East Texas Regional Mobility Authority17 Table A.9: North East Texas Regional Mobility Authority Toll System Debt Service (As of January 1, 2016)
Calendar Year Principal Due Interest Due Total Debt Service 2016 $0 $1,936,752 $1,936,752
2017 1,956,782 1,956,782
2018 1,956,782 1,956,782
2019 2,893,041 2,893,041
2020 41,757 3,827,593 3,869,350
2021 3,825,885 3,825,885
2022 570,811 3,802,539 4,373,350
2023 709,955 3,750,155 4,460,110
2024 846,448 3,687,725 4,534,174
2025 938,916 3,615,931 4,554,847
2026 1,079,753 3,533,367 4,613,120
2027 1,241,716 3,438,419 4,680,135
2028 1,427,973 3,329,229 4,757,202
2029 1,642,169 3,203,660 4,845,830
2030 1,888,495 3,059,256 4,947,751
2031 2,171,769 2,893,191 5,064,960
2032 2,497,534 2,702,217 5,199,751
2033 2,872,164 2,482,596 5,354,761
2034 3,302,989 2,230,032 5,533,021
2035 3,798,438 1,939,584 5,738,021
2036 4,368,203 1,605,568 5,973,772
2037 5,023,434 1,221,450 6,244,884
2038 5,776,949 779,715 6,556,663
2039 6,643,491 271,719 6,915,210
Total $46,842,965 $63,943,190 $110,786,155
Standalone Toll Road / System Elements Loop 49
17 Debt service does not include a toll equity loan outstanding in the amount of approximately $12 million on January 1, 2016. The toll equity loan was repayable from available excess revenues, and thus did not have a set annual principal and interest repayment schedule. The toll equity loan and existing debt shown above were repaid in full with a bank loan in April 2016.

f
A-10
North Texas Tollway Authority Table A.10: North Texas Tollway Authority System Debt Service (As of January 1, 2016)
Calendar Year Principal Due Interest Due Total Debt Service 2016 $9,841,043 $374,072,986 $383,914,029 2017 37,445,247 381,771,430 419,216,677 2018 42,915,827 379,831,596 422,747,423 2019 94,855,732 379,585,776 474,441,507 2020 102,475,769 379,545,121 482,020,889 2021 151,675,161 375,223,393 526,898,554 2022 184,738,218 367,459,589 552,197,807 2023 195,045,723 358,297,052 553,342,774 2024 214,763,493 348,028,783 562,792,276 2025 236,882,380 336,284,060 573,166,440 2026 277,853,270 322,356,022 600,209,291 2027 301,202,087 305,924,790 607,126,877 2028 334,949,795 291,762,544 626,712,339 2029 329,575,000 280,023,698 609,598,698 2030 408,645,000 266,172,623 674,817,623 2031 377,860,000 251,192,930 629,052,930 2032 383,375,000 237,557,212 620,932,212 2033 397,035,000 225,007,812 622,042,812 2034 408,345,000 212,614,783 620,959,783 2035 421,890,000 200,344,769 622,234,769 2036 432,885,000 188,837,241 621,722,241 2037 444,965,000 175,940,874 620,905,874 2038 493,270,000 161,532,626 654,802,626 2039 302,095,000 145,624,727 447,719,727 2040 318,610,000 128,723,180 447,333,180 2041 334,470,000 110,455,569 444,925,569 2042 352,050,000 90,550,442 442,600,442 2043 371,185,000 68,684,637 439,869,637 2044 149,500,000 52,731,004 202,231,004 2045 156,310,000 43,568,491 199,878,491 2046 126,775,000 35,009,606 161,784,606 2047 132,880,000 26,946,689 159,826,689 2048 144,860,000 18,351,294 163,211,294 2049 189,720,000 8,262,253 197,982,253 2050 51,000,000 1,391,524 52,391,524 2051 1,000,000 78,750 1,078,750 2052 1,000,000 26,250 1,026,250 Total $8,913,943,744 $7,529,772,126 $16,443,715,867
Standalone Toll Road / System Elements Addison Airport Toll Road President George Bush Turnpike Dallas North Tollway Mountain Creek Lake Toll Bridge Lewisville Lake Bridge Sam Rayburn Tollway

f
A-11
North Texas Tollway Authority Table A.11: North Texas Tollway Authority Special Project System Debt Service (As of January 1, 2016)
Calendar Year Principal Due Interest Due Total Debt Service 2016 $15,030,000 $56,917,429 $71,947,429
2017 12,835,000 57,220,046 70,055,046
2018 60,000 77,183,166 77,243,166
2019 1,965,000 77,180,766 79,145,766
2020 25,535,000 77,114,799 102,649,799
2021 29,820,000 76,076,701 105,896,701
2022 32,480,000 87,330,305 119,810,305
2023 34,530,000 86,090,254 120,620,254
2024 43,995,000 90,509,538 134,504,538
2025 45,920,000 88,314,657 134,234,657
2026 54,935,000 85,913,082 140,848,082
2027 49,655,000 83,037,295 132,692,295
2028 79,905,000 80,437,838 160,342,838
2029 85,595,000 76,420,632 162,015,632
2030 92,495,000 72,134,169 164,629,169
2031 104,635,000 67,514,320 172,149,320
2032 73,249,717 62,287,501 135,537,217
2033 43,470,153 60,628,620 104,098,772
2034 36,604,906 60,583,519 97,188,425
2035 48,901,743 60,538,420 109,440,163
2036 70,383,657 60,493,351 130,877,008
2037 72,430,000 57,844,795 130,274,795
2038 73,030,000 57,199,694 130,229,694
2039 82,925,000 53,142,945 136,067,945
2040 86,700,000 48,542,001 135,242,001
2041 81,890,000 43,733,370 125,623,370
2042 101,134,867 39,189,319 140,324,186
2043 121,470,000 39,144,219 160,614,219
2044 141,990,000 32,875,088 174,865,088
2045 140,120,111 22,196,050 162,316,161
2046 186,523,169 13,969,597 200,492,766
2047 170,238,044 5,502,753 175,740,796
Total $2,240,451,366 $1,957,266,236 $4,197,717,601
Standalone Toll Road / System Elements President George Bush Turnpike – Western Extension Chisholm Trail Parkway

f
A-12
Central Texas Turnpike System Table A.12: Central Texas Turnpike System Debt Service (As of January 1, 2016)
Calendar Year Principal Due Interest Due Total Debt Service 2016 $1,745,000 $107,051,400 $108,796,400
2017 7,885,000 107,051,400 114,936,400
2018 14,225,000 107,051,400 121,276,400
2019 20,365,000 107,051,400 127,416,400
2020 26,715,000 107,051,400 133,766,400
2021 36,480,000 107,051,400 143,531,400
2022 45,350,000 107,051,400 152,401,400
2023 54,315,000 106,941,400 161,256,400
2024 63,380,000 106,672,650 170,052,650
2025 72,655,000 106,239,900 178,894,900
2026 87,030,000 105,627,650 192,657,650
2027 98,405,000 105,136,400 203,541,400
2028 105,225,000 104,433,900 209,658,900
2029 111,660,000 103,764,150 215,424,150
2030 118,315,000 103,033,150 221,348,150
2031 125,215,000 102,218,650 227,433,650
2032 137,730,000 95,957,900 233,687,900
2033 151,045,000 89,071,400 240,116,400
2034 150,165,000 81,519,150 231,684,150
2035 179,420,000 74,010,900 253,430,900
2036 195,440,000 65,039,900 260,479,900
2037 206,370,000 61,267,900 267,637,900
2038 211,550,000 56,949,400 268,499,400
2039 220,895,000 47,604,250 268,499,250
2040 231,940,000 36,559,500 268,499,500
2041 243,535,000 24,962,500 268,497,500
2042 255,715,000 12,785,750 268,500,750
Total $3,172,770,000 $2,339,156,200 $5,511,926,200
Standalone Toll Road / System Elements SH 130 Segments 1-4 SH 45 North Loop 1 SH 45 Southeast

f
A-13
Grand Parkway Transportation Corporation Table A.13: Grand Parkway Transportation Corporation System Debt Service18 (As of January 1, 2016)
Calendar Year Principal Due Interest Due Total Debt Service 2016 $924,195,000 $16,483,405 $940,678,405 2017 71,977,554 71,977,534 2018 87,911,493 87,911,493 2019 87,911,493 87,911,493 2020 87,911,493 87,911,493 2021 87,911,493 87,911,493 2022 87,911,493 87,911,493 2023 87,911,493 87,911,493 2024 115,669,045 115,669,045 2025 115,669,045 115,669,045 2026 115,669,045 115,669,045 2027 115,669,045 115,669,045 2028 115,669,045 115,669,045 2029 2,090,000 115,669,045 117,759,045 2030 7,075,000 115,565,590 122,640,590 2031 12,380,000 115,208,303 127,588,303 2032 18,310,000 114,564,790 132,874,790 2033 24,630,000 113,595,655 138,225,655 2034 31,595,000 112,268,880 143,863,880 2035 39,120,000 110,552,348 149,672,348 2036 46,980,000 108,408,904 155,388,904 2037 54,205,000 105,883,277 160,088,277 2038 60,795,000 103,075,260 163,870,260 2039 66,690,000 99,926,001 166,616,001 2040 71,950,000 96,471,559 168,421,559 2041 76,290,000 92,744,883 169,034,883 2042 47,530,000 88,793,700 136,323,700 2043 8,065,000 86,333,949 94,398,949 2044 84,805,000 85,920,618 170,725,618 2045 86,335,000 81,066,993 167,401,993 2046 87,105,000 76,090,088 163,195,088 2047 87,050,000 71,072,093 158,122,093 2048 86,170,000 66,023,925 152,193,925 2049 84,165,000 61,291,263 145,456,263 2050 281,020,000 56,833,875 337,853,875 2051 398,920,000 42,037,663 440,957,663 2052 211,525,000 21,499,975 233,024,975 2053 214,105,000 5,410,463 219,515,463 Total $3,113,100,000 $3,340,584,242 $6,453,684,242
Standalone Toll Road / System Elements SH 99 Grand Pkwy Segment D - Harris County SH 99 Grand Pkwy Segment E SH 99 Grand Pkwy Segment F1 SH 99 Grand Pkwy Segment F2 SH 99 Grand Pkwy Segment G
18 All of the principal maturing in 2016 is expected to be refinanced, largely through a federal loan through the Transportation Infrastructure Finance and Innovation Act program that will spread this principal over time.

f
B-1
Appendix B: Assumptions Regarding Toll Road Debt Service Analysis
Assumption Principal amount Capital appreciation bond and convertible capital appreciation
bond principal is shown at the maturity value Assumption Defeasance date January 1, 2016 Outstanding debt Debt outstanding as of January 1, 2016 Escrow investment securities SLGS Escrow investment rates Rates as of January 1, 2016 Section 3 Analyses - General Assumption Defeasance dates Final defeasance calculated as of September 1, 2017, 2019,
2021, 2023, and final debt run-off date Final debt run-off scenarios Two scenarios – with and without expenses; “expenses”
includes toll-related O&M, non-toll related O&M, and major maintenance expenses
External cash contribution Single cash contribution made on date of final debt defeasance for defeasance calculated as of September 1, 2017, 2019, 2021, and 2023
Escrow investment securities SLGS Escrow investment rates Rates as of July 7, 2016 Excess annual cash flow Starting with the fiscal year ending August 31, 2017, used to
repay all outstanding debt Reserve funds Remain at their current level for the duration of the analysis (no
increases or decreases) Released upon final debt defeasance and used to pay portion of final debt defeasance cost
Central Texas Turnpike System Analyses
Assumption
Revenue projections As shown in the Series 2015 A, B, C official statement O&M projections As shown in the Series 2015 A, B, C official statement Major maintenance projections As shown in the Series 2015 A, B, C official statement Debt service reserve fund balance
$125 million senior DSRF, $53.1 million junior debt service reserve fund balance as of April 1, 2016
Rate stabilization fund balance $67.8 million balance as of May 31, 2016 Series 2015 A Put Bonds Bonds refunded at mandatory tender date of Apr 1, 2020 with
5.00% fixed rate and bonds callable at any time Grand Parkway Transportation Corporation Analyses
Assumption
Revenue projections Series 2014 A official statement O&M projections Series 2014 A official statement Major maintenance projections Series 2014 A official statement First tier reserve fund balance $18.1 million as of May 31, 2016 Rate stabilization fund balance $100.5 million as of May 31, 2016
Due to insufficient project cash flow, a portion of O&M and major maintenance expenses during fiscal years 2018-2021 are paid from the rate stabilization fund
Enhancement fund balance $6.7 million as of May 31, 2016

f
B-2
TIFIA loan debt service $840.6 million single TIFIA loan draw on Dec 15, 2016. Loan interest and principal repayment per Grand Parkway TIFIA Loan Agreement Appendix Two to Exhibit A.
Series 2014-B bond debt service
Bonds refunded on Dec 15, 2016 with 5.00% fixed rate bonds callable at any time
Assumption Local and regional toll entity debt service
Annual principal and interest was provided by each individual local and regional toll entity

f
C-1
Appendix C: Toll Road Project Actual Traffic Versus Projected Traffic
Disclaimer: Projected and actual traffic volume data, length of toll facility, and toll rate per mile information was provided to TxDOT by each local and regional toll agency for their
respective toll road projects and system elements. The source of projected traffic volume has been identified for each toll road project and system element where projection data was
provided.

f
C-2
Table C.1: Cameron County Regional Mobility Authority Toll Project: SH 550
Toll Project Length: Lane Miles: 26.4 Center-Line Miles: 6.7 Opening of Project to Traffic: May 2011 Average Toll Per Mile (as of 3/30/16): Passenger Electronic Toll Rate: $0.15 Passenger Non-Electronic Toll Rate: $0.20 Year Ending
9/30 Original Projected
Traffic Transactions Actual Traffic Transactions Over / (Under) Actual Traffic vs. Projected
2011
2012
2013 n/a 323,126
2014 n/a 492,644
2015 n/a 997,293
2016 1,533,000 n/a n/a
2017 1,822,080 n/a n/a
2018 2,131,965 n/a n/a
2019 2,217,244 n/a n/a
2020 2,305,933 n/a n/a
2021 2,398,171 n/a n/a
2022 2,494,098 n/a n/a
2023 2,593,861 n/a n/a
2024 2,697,616 n/a n/a
2025 2,805,520 n/a n/a
2026 2,917,741 n/a n/a
2027 3,034,451 n/a n/a
2028 3,155,829 n/a n/a
2029 3,282,062 n/a n/a
2030 3,413,345 n/a n/a
2031 3,549,878 n/a n/a
2032 3,691,874 n/a n/a
2033 3,839,549 n/a n/a
2034 3,993,130 n/a n/a
2035 4,152,856 n/a n/a Projection source: Cameron County Regional Mobility Authority’s engineering consultant

f
C-3
Table C.2: Camino Real Regional Mobility Authority Toll Project: Cesar Chavez Express Toll Lanes
Toll Project Length: Lane Miles: 8.9 Center-Line Miles: 8.9 Opening of Project to Traffic: January 2014 Average Toll Per Mile (as of 3/30/16): Passenger Electronic Toll Rate: $0.10 Passenger Non-Electronic Toll Rate: $0.21 Year Ending
12/31 Original Projected
Traffic Transactions Actual Traffic Transactions Over / (Under) Actual Traffic vs. Projected
2011
2012
2013
2014 438,000 380,571 -13%
2015 610,000 521,140 -15%
2016 740,000 n/a n/a
2017 809,000 n/a n/a
2018 883,000 n/a n/a
2019 966,000 n/a n/a
2020 1,055,000 n/a n/a
2021 1,180,000 n/a n/a
2022 1,319,000 n/a n/a
2023 1,475,000 n/a n/a
2024 1,649,000 n/a n/a
2025 1,846,000 n/a n/a
2026 2,063,000 n/a n/a
2027 2,305,000 n/a n/a
2028 2,577,000 n/a n/a
2029 2,883,000 n/a n/a
2030 3,225,000 n/a n/a
2031 3,484,000 n/a n/a
2032 3,766,000 n/a n/a
2033 4,069,000 n/a n/a
2034 4,400,000 n/a n/a
2035 4,757,000 n/a n/a Projection source: 2010 Traffic and Revenue study

f
C-4
Table C.3: Camino Real Regional Mobility Authority Toll Project: Loop 375 Border West Expressway
Toll Project Length: Lane Miles: 28 Center-Line Miles: 7 Opening of Project to Traffic: February 2018 (estimated) Average Toll Per Mile (estimated): Passenger Electronic Toll Rate: $0.07 Passenger Non-Electronic Toll Rate: $0.18 Year Ending
12/31 Original Projected
Traffic Transactions Actual Traffic Transactions Over / (Under) Actual Traffic vs. Projected
2011
2012
2013
2014
2015
2016 n/a n/a
2017 n/a n/a
2018 3,637,000 n/a n/a
2019 4,672,000 n/a n/a
2020 5,438,000 n/a n/a
2021 5,766,000 n/a n/a
2022 6,095,000 n/a n/a
2023 6,424,000 n/a n/a
2024 6,433,000 n/a n/a
2025 6,442,000 n/a n/a
2026 6,450,000 n/a n/a
2027 6,459,000 n/a n/a
2028 6,468,000 n/a n/a
2029 6,476,000 n/a n/a
2030 6,485,000 n/a n/a
2031 6,672,000 n/a n/a
2032 6,860,000 n/a n/a
2033 7,048,000 n/a n/a
2034 7,235,000 n/a n/a
2035 7,423,000 n/a n/a Projection source: 2016 Traffic and Revenue update

f
C-5
Table C.4: Central Texas Regional Mobility Authority System Toll Element: US 183A Toll Lanes
Toll Element Length: Lane Miles: 106.0 Center-Line Miles: 11.6 Opening of Element to Traffic: March 2007 Average Toll Per Mile (as of 3/30/16): Passenger Electronic Toll Rate: $0.33 Passenger Non-Electronic Toll Rate: $0.44 Year Ending
6/30 Original Projected
Traffic Transactions Actual Traffic Transactions Over / (Under) Actual Traffic vs. Projected
2011 23,393,825 22,704,780 -3%
2012 33,569,575 29,238,220 -13%
2013 37,975,925 35,069,657 -8%
2014 41,454,400 40,498,180 -2%
2015 44,545,150 45,850,495 3%
2016 46,606,300 n/a n/a
2017 48,766,250 n/a n/a
2018 50,248,250 n/a n/a
2019 51,775,100 n/a n/a
2020 53,348,425 n/a n/a
2021 54,969,525 n/a n/a
2022 56,639,700 n/a n/a
2023 58,360,900 n/a n/a
2024 59,996,300 n/a n/a
2025 61,678,825 n/a n/a
2026 63,410,425 n/a n/a
2027 65,192,075 n/a n/a
2028 67,025,725 n/a n/a
2029 68,912,675 n/a n/a
2030 70,854,875 n/a n/a
2031 72,202,650 n/a n/a
2032 73,579,025 n/a n/a
2033 74,984,975 n/a n/a
2034 76,421,150 n/a n/a
2035 77,888,200 n/a n/a Projection source: Official Statement dated June 10, 2011 .

f
C-6
Table C.5: Central Texas Regional Mobility Authority System Toll Element: US 183 South Toll Lanes
Toll Element Length: Lane Miles: 67.4 Center-Line Miles: 8.0 Opening of Element to Traffic: Under Construction Average Toll Per Mile (as of 3/30/16): Passenger Electronic Toll Rate: Not Available Passenger Non-Electronic Toll Rate: Not Available Year Ending
6/30 Original Projected
Traffic Transactions Actual Traffic Transactions Over / (Under) Actual Traffic vs. Projected
2011
2012
2013
2014
2015
2016 n/a n/a
2017 n/a n/a
2018 n/a n/a
2019 1,794,773 n/a n/a
2020 17,030,484 n/a n/a
2021 38,542,477 n/a n/a
2022 45,850,474 n/a n/a
2023 49,977,786 n/a n/a
2024 51,298,822 n/a n/a
2025 52,654,777 n/a n/a
2026 54,046,572 n/a n/a
2027 55,475,157 n/a n/a
2028 56,941,502 n/a n/a
2029 58,446,607 n/a n/a
2030 59,991,495 n/a n/a
2031 61,310,596 n/a n/a
2032 62,658,703 n/a n/a
2033 64,036,451 n/a n/a
2034 65,444,494 n/a n/a
2035 66,883,497 n/a n/a Projection source: Official Statement dated June 10, 2011

f
C-7
Table C.6: Central Texas Regional Mobility Authority System Toll Element: US 290 East
Toll Element Length: Lane Miles: 81.4 Center-Line Miles: 6.2 Opening of Element to Traffic: 2012 Average Toll Per Mile (as of 3/30/16): Passenger Electronic Toll Rate: $0.27 Passenger Non-Electronic Toll Rate: $0.35 Year Ending
6/30 Original Projected
Traffic Transactions Actual Traffic Transactions Over / (Under) Actual Traffic vs. Projected
2011
2012
2013 2,944,500 6,898,562 134%
2014 3,539,250 13,554,399 283%
2015 13,357,500 20,880,591 56%
2016 15,785,250 n/a n/a
2017 16,965,000 n/a n/a
2018 18,232,500 n/a n/a
2019 19,090,500 n/a n/a
2020 21,365,500 n/a n/a
2021 22,737,000 n/a n/a
2022 24,196,250 n/a n/a
2023 25,753,000 n/a n/a
2024 27,407,250 n/a n/a
2025 29,172,000 n/a n/a
2026 30,043,000 n/a n/a
2027 30,940,000 n/a n/a
2028 31,863,000 n/a n/a
2029 32,818,500 n/a n/a
2030 33,800,000 n/a n/a
2031 34,944,000 n/a n/a
2032 36,127,000 n/a n/a
2033 37,349,000 n/a n/a
2034 38,613,250 n/a n/a
2035 39,923,000 n/a n/a Projection source: Official Statement dated June 10, 2011.

f
C-8
Table C.7: Central Texas Regional Mobility Authority Toll Project: MoPac Managed Lanes
Toll Project Length: Lane Miles: 134.4 Center-Line Miles: 11.0 Opening of Project to Traffic: Under Construction Average Toll Per Mile (estimated): Passenger Electronic Toll Rate: Not Available Passenger Non-Electronic Toll Rate: Not Available Year Ending
6/30 Original Projected
Traffic Transactions Actual Traffic Transactions Over / (Under) Actual Traffic vs. Projected
2011
2012
2013
2014
2015
2016 9,141,000 n/a n/a
2017 9,795,500 n/a n/a
2018 10,472,000 n/a n/a
2019 11,173,250 n/a n/a
2020 11,899,250 n/a n/a
2021 11,998,250 n/a n/a
2022 12,113,750 n/a n/a
2023 12,240,250 n/a n/a
2024 12,380,500 n/a n/a
2025 12,534,500 n/a n/a
2026 12,600,500 n/a n/a
2027 12,680,250 n/a n/a
2028 12,776,500 n/a n/a
2029 12,886,500 n/a n/a
2030 13,120,250 n/a n/a
2031 13,153,250 n/a n/a
2032 13,202,750 n/a n/a
2033 13,274,250 n/a n/a
2034 13,359,500 n/a n/a
2035 13,461,250 n/a n/a Projection source: Intermediate Level-2 Traffic and Toll Revenue Study MoPac (Loop 1) Express Lanes dated August 2011

f
C-9
Table C.8: Central Texas Regional Mobility Authority Toll Project: SH 71 Express
Toll Project Length: Lane Miles: 38.5 Center-Line Miles: 5.0 Opening of Project to Traffic: Under Construction Average Toll Per Mile (estimated): Passenger Electronic Toll Rate: Not Available Passenger Non-Electronic Toll Rate: Not Available Year Ending
6/30 Original Projected
Traffic Transactions Actual Traffic Transactions Over / (Under) Actual Traffic vs. Projected
2011
2012
2013
2014
2015
2016 n/a n/a
2017 5,815,680 n/a n/a
2018 6,319,360 n/a n/a
2019 6,936,960 n/a n/a
2020 7,222,080 n/a n/a
2021 7,507,200 n/a n/a
2022 7,792,640 n/a n/a
2023 8,077,760 n/a n/a
2024 8,362,880 n/a n/a
2025 8,648,000 n/a n/a
2026 8,840,320 n/a n/a
2027 8,986,240 n/a n/a
2028 9,132,160 n/a n/a
2029 9,278,400 n/a n/a
2030 9,424,320 n/a n/a
2031 9,570,240 n/a n/a
2032 9,716,160 n/a n/a
2033 9,862,080 n/a n/a
2034 10,008,000 n/a n/a
2035 10,153,920 n/a n/a Projection source: SH 71 Express Toll Lanes Traffic and Revenue Forecasts dated April 30, 2013

f
C-10
Table C.9: Fort Bend County Grand Parkway Toll Road Authority Toll Project: SH 99 Grand Pkwy Segment D - Fort Bend County
Toll Project Length: Lane Miles: 32 Center-Line Miles: 8 Opening of Project to Traffic: April 2014 Average Toll Per Mile (as of 3/30/16): Passenger Electronic Toll Rate: $0.31 Passenger Non-Electronic Toll Rate: $0.44 Year Ending
9/30 Original Projected
Traffic Transactions Actual Traffic Transactions Over / (Under) Actual Traffic vs. Projected
2011
2012
2013
2014 14,604,500 17,849,680 22%
2015 35,833,000 44,900,022 25%
2016 43,314,000 n/a n/a
2017 50,675,000 n/a n/a
2018 58,208,000 n/a n/a
2019 68,317,000 n/a n/a
2020 78,617,000 n/a n/a
2021 84,688,000 n/a n/a
2022 90,798,000 n/a n/a
2023 97,192,000 n/a n/a
2024 104,030,000 n/a n/a
2025 110,512,000 n/a n/a
2026 114,170,000 n/a n/a
2027 117,953,000 n/a n/a
2028 121,865,000 n/a n/a
2029 125,910,000 n/a n/a
2030 130,094,000 n/a n/a
2031 134,420,000 n/a n/a
2032 142,751,000 n/a n/a
2033 146,617,000 n/a n/a
2034 154,729,000 n/a n/a
2035 160,247,000 n/a n/a Projection source: Grand Parkway Segment D Comprehensive Traffic and Revenue Study 2011 (June 2011)

f
C-11
Table C.10: Fort Bend County Toll Road Authority Toll Element: Fort Bend Parkway Toll Road
Toll Element Length: Lane Miles: 24.8 Center-Line Miles: 6.2 Opening of Element to Traffic: August 2004 Average Toll Per Mile (as of 3/30/16): Passenger Electronic Toll Rate: $0.23 Passenger Non-Electronic Toll Rate: $0.30 Year Ending
9/30 Original Projected
Traffic Transactions Actual Traffic Transactions Over / (Under) Actual Traffic vs. Projected
2011 13,334,200 7,049,289 -47%
2012 13,780,800 7,346,366 -47%
2013 14,227,400 7,896,828 -44%
2014 14,674,000 8,859,986 -40%
2015 15,120,600 14,927,001 -1%
2016 15,847,920 n/a n/a
2017 16,575,240 n/a n/a
2018 17,302,560 n/a n/a
2019 18,029,880 n/a n/a
2020 18,757,200 n/a n/a
2021 19,507,488 n/a n/a
2022 20,287,788 n/a n/a
2023 21,099,300 n/a n/a
2024 21,943,272 n/a n/a
2025 22,821,003 n/a n/a
2026 23,733,843 n/a n/a
2027 24,683,197 n/a n/a
2028 25,670,525 n/a n/a
2029 26,697,346 n/a n/a
2030 27,765,240 n/a n/a
2031 28,875,850 n/a n/a
2032 30,030,884 n/a n/a
2033 31,232,119 n/a n/a
2034 32,481,404 n/a n/a
2035 33,780,660 n/a n/a Projection source: Fort Bend Parkway Traffic & Revenue Study (Feb 2003) through 2020; 2021 through 2035 represents a 4% increase each year based on the increase projected for 2020 from the previous year.

f
C-12
Table C.11: Fort Bend County Toll Road Authority Toll Element: Fort Bend Westpark Tollway
Toll Element Length: Lane Miles: 24 Center-Line Miles: 6 Opening of Element to Traffic: August 2005 Average Toll Per Mile (as of 3/30/16): Passenger Electronic Toll Rate: $0.22 Passenger Non-Electronic Toll Rate: $0.27 Year Ending
9/30 Original Projected
Traffic Transactions Actual Traffic Transactions Over / (Under) Actual Traffic vs. Projected
2011 16,932,000 15,224,942 -10%
2012 18,287,000 16,741,990 -8%
2013 19,740,000 18,586,669 -6%
2014 21,309,000 20,121,013 -6%
2015 23,372,000 21,391,903 -8%
2016 24,728,000 n/a n/a
2017 25,768,000 n/a n/a
2018 26,716,000 n/a n/a
2019 27,637,000 n/a n/a
2020 28,634,000 n/a n/a
2021 29,104,000 n/a n/a
2022 29,581,000 n/a n/a
2023 30,066,000 n/a n/a
2024 30,559,000 n/a n/a
2025 31,060,000 n/a n/a
2026 31,914,000 n/a n/a
2027 32,791,000 n/a n/a
2028 33,692,000 n/a n/a
2029 34,618,000 n/a n/a
2030 35,569,000 n/a n/a
2031 36,547,000 n/a n/a
2032 37,551,000 n/a n/a
2033 38,583,000 n/a n/a
2034 39,643,000 n/a n/a
2035 40,733,000 n/a n/a Projection source: Fort Bend County Toll Road Authority Traffic & Revenue Study (January 2014). Original projections were included in table for the system.

f
C-13
Table C.12: Fort Bend County Toll Road Authority Toll Element: Fort Bend Parkway Toll Road
Toll Element Length: Lane Miles: 4.8 Center-Line Miles: 1.2 Opening of Element to Traffic: May 2014 Average Toll Per Mile (as of 3/30/16): Passenger Electronic Toll Rate: $0.33 Passenger Non-Electronic Toll Rate: $0.46 Year Ending
9/30 Original Projected
Traffic Transactions Actual Traffic Transactions Over / (Under) Actual Traffic vs. Projected
2011
2012
2013
2014 2,449,000 552,555 -77%
2015 3,626,000 762,257 -79%
2016 4,307,000 n/a n/a
2017 4,818,000 n/a n/a
2018 5,120,000 n/a n/a
2019 5,441,000 n/a n/a
2020 6,471,000 n/a n/a
2021 7,178,000 n/a n/a
2022 7,769,000 n/a n/a
2023 8,339,000 n/a n/a
2024 8,878,000 n/a n/a
2025 9,451,000 n/a n/a
2026 9,939,000 n/a n/a
2027 10,452,000 n/a n/a
2028 10,991,000 n/a n/a
2029 11,559,000 n/a n/a
2030 12,155,000 n/a n/a
2031 12,783,000 n/a n/a
2032 13,442,000 n/a n/a
2033 14,136,000 n/a n/a
2034 14,866,000 n/a n/a
2035 15,633,000 n/a n/a Projection source: Fort Bend County Toll Road Authority Traffic & Revenue Study (January 2014)

f
C-14
Table C.13: Galveston County Road District #1 Toll Project: San Luis Pass (Vacek) Toll Bridge
Toll Project Length: Lane Miles: 2.6 Center-Line Miles: 1.3 Opening of Project to Traffic: 1969 Average Toll Per Mile (as of 3/30/16): Passenger Electronic Toll Rate: $1.54 Passenger Non-Electronic Toll Rate: $1.54 Year Ending
6/30 Original Projected
Traffic Transactions Actual Traffic Transactions Over / (Under) Actual Traffic vs. Projected
2011 255,000 258,092 1%
2012 250,000 276,825 11%
2013 250,000 256,239 2%
2014 250,000 253,502 1%
2015 237,500 270,103 14%
2016 240,000 136,993 * -43%
2017 n/a n/a
2018 n/a n/a
2019 n/a n/a
2020 n/a n/a
2021 n/a n/a
2022 n/a n/a
2023 n/a n/a
2024 n/a n/a
2025 n/a n/a
2026 n/a n/a
2027 n/a n/a
2028 n/a n/a
2029 n/a n/a
2030 n/a n/a
2031 n/a n/a
2032 n/a n/a
2033 n/a n/a
2034 n/a n/a
2035 n/a n/a * Actual transaction data through 05/09/2016. Projection source: The final toll-revenue budgets for the respective fiscal years, extracted from budget-to-actual reports generated via the county's financial accounting software and divided by 2 (i.e., the toll per vehicle). Galveston County does not make multi-year projections.

f
C-15
Table C.14: Harris County Toll Road Authority Toll Element: Hardy Toll Road
Toll Element Length: Lane Miles: 130 Center-Line Miles: 24 Opening of Element to Traffic: September 1987 Average Toll Per Mile (as of 3/30/16): Passenger Electronic Toll Rate: $0.13 Passenger Non-Electronic Toll Rate: $0.15 Year Ending
2/28 Original Projected
Traffic Transactions Actual Traffic Transactions Over / (Under) Actual Traffic vs. Projected
2012 39,346,000 37,999,977 -3%
2013 39,958,000 39,671,025 -1%
2014 40,946,000 42,327,879 3%
2015 44,308,000 48,307,553 9%
2016 46,380,000 50,730,619 9%
2017 45,786,000 n/a n/a
2018 48,049,000 n/a n/a
2019 50,311,000 n/a n/a
2020 52,574,000 n/a n/a
2021 54,837,000 n/a n/a
2022 56,398,000 n/a n/a
2023 57,959,000 n/a n/a
2024 59,520,000 n/a n/a
2025 61,081,000 n/a n/a
2026 62,642,000 n/a n/a
2027 64,020,000 n/a n/a
2028 65,399,000 n/a n/a
2029 66,778,000 n/a n/a
2030 68,157,000 n/a n/a
2031 69,536,000 n/a n/a
2032 70,128,000 n/a n/a
2033 70,721,000 n/a n/a
2034 71,313,000 n/a n/a
2035 71,905,000 n/a n/a
2036 72,497,000 n/a n/a Projection source: The Wilbur Smith 2009 Traffic and Revenue Forecast was used for fiscal years 2012-2014. The CDM Smith 2014 Traffic and Revenue Forecast was used for fiscal years 2015 and beyond.

f
C-16
Table C.15: Harris County Toll Road Authority Toll Element: Sam Houston Tollway
Toll Element Length: Lane Miles: 476 Center-Line Miles: 70 Opening of Element to Traffic: June 1988 Average Toll Per Mile (as of 3/30/16): Passenger Electronic Toll Rate: $0.17 Passenger Non-Electronic Toll Rate: $0.19 Year Ending
2/28 Original Projected
Traffic Transactions Actual Traffic Transactions Over / (Under) Actual Traffic vs. Projected
2012 305,089,000 309,818,817 2%
2013 309,777,000 322,202,455 4%
2014 320,957,000 328,853,180 2%
2015 340,179,000 355,964,268 5%
2016 351,501,000 374,665,959 7%
2017 361,134,000 n/a n/a
2018 372,649,000 n/a n/a
2019 381,654,000 n/a n/a
2020 391,158,000 n/a n/a
2021 399,664,000 n/a n/a
2022 405,868,000 n/a n/a
2023 412,072,000 n/a n/a
2024 419,182,000 n/a n/a
2025 424,932,000 n/a n/a
2026 407,936,000 n/a n/a
2027 418,616,000 n/a n/a
2028 430,851,000 n/a n/a
2029 442,671,000 n/a n/a
2030 452,751,000 n/a n/a
2031 461,338,000 n/a n/a
2032 466,799,000 n/a n/a
2033 472,260,000 n/a n/a
2034 477,721,000 n/a n/a
2035 483,182,000 n/a n/a
2036 488,643,000 n/a n/a Projection source: The Wilbur Smith 2009 Traffic and Revenue Forecast was used for fiscal years 2012-2014. The CDM Smith 2014 Traffic and Revenue Forecast was used for fiscal years 2015 and beyond.

f
C-17
Table C.16: Harris County Toll Road Authority Toll Element: Westpark Tollway
Toll Element Length: Lane Miles: 50 Center-Line Miles: 13 Opening of Element to Traffic: May 2004 Average Toll Per Mile (as of 3/30/16): Passenger Electronic Toll Rate: $0.23 Passenger Non-Electronic Toll Rate: Not Available Year Ending
2/28 Original Projected
Traffic Transactions Actual Traffic Transactions Over / (Under) Actual Traffic vs. Projected
2012 41,884,000 41,234,056 -2%
2013 43,746,000 43,575,876 0%
2014 45,691,000 45,957,937 1%
2015 47,832,000 48,915,625 2%
2016 49,703,000 51,855,139 4%
2017 51,185,000 n/a n/a
2018 52,667,000 n/a n/a
2019 54,149,000 n/a n/a
2020 55,631,000 n/a n/a
2021 57,113,000 n/a n/a
2022 58,237,000 n/a n/a
2023 59,361,000 n/a n/a
2024 60,485,000 n/a n/a
2025 61,609,000 n/a n/a
2026 62,733,000 n/a n/a
2027 63,698,000 n/a n/a
2028 64,664,000 n/a n/a
2029 65,629,000 n/a n/a
2030 66,595,000 n/a n/a
2031 67,560,000 n/a n/a
2032 68,242,000 n/a n/a
2033 68,923,000 n/a n/a
2034 69,604,000 n/a n/a
2035 70,286,000 n/a n/a
2036 70,967,000 n/a n/a Projection source: The Wilbur Smith 2009 Traffic and Revenue Forecast was used for fiscal years 2012-2014. The CDM Smith 2014 Traffic and Revenue Forecast was used for fiscal years 2015 and beyond.

f
C-18
Table C.17: Harris County Toll Road Authority Toll Element: Fort Bend Parkway Extension
Toll Element Length: Lane Miles: 10 Center-Line Miles: 2 Opening of Element to Traffic: March 2005 Average Toll Per Mile (as of 3/30/16): Passenger Electronic Toll Rate: $0.75 Passenger Non-Electronic Toll Rate: $0.88 Year Ending
2/28 Original Projected
Traffic Transactions Actual Traffic Transactions Over / (Under) Actual Traffic vs. Projected
2012 3,622,000 3,182,925 -12%
2013 3,844,000 3,456,988 -10%
2014 4,015,000 3,728,952 -7%
2015 3,934,000 4,013,391 2%
2016 4,138,000 4,338,216 5%
2017 4,318,000 n/a n/a
2018 4,498,000 n/a n/a
2019 4,678,000 n/a n/a
2020 4,857,000 n/a n/a
2021 5,037,000 n/a n/a
2022 5,181,000 n/a n/a
2023 5,324,000 n/a n/a
2024 5,467,000 n/a n/a
2025 5,611,000 n/a n/a
2026 5,754,000 n/a n/a
2027 5,837,000 n/a n/a
2028 5,921,000 n/a n/a
2029 6,004,000 n/a n/a
2030 6,087,000 n/a n/a
2031 6,171,000 n/a n/a
2032 6,221,000 n/a n/a
2033 6,272,000 n/a n/a
2034 6,322,000 n/a n/a
2035 6,373,000 n/a n/a
2036 6,424,000 n/a n/a Projection source: The Wilbur Smith 2009 Traffic and Revenue Forecast was used for fiscal years 2012-2014. The CDM Smith 2014 Traffic and Revenue Forecast was used for fiscal years 2015 and beyond.

f
C-19
Table C.18: Harris County Toll Road Authority Toll Element: Tomball Tollway
Toll Element Length: Lane Miles: 37 Center-Line Miles: 6 Opening of Element to Traffic: April 2015 Average Toll Per Mile (as of 3/30/16): Passenger Electronic Toll Rate: $0.25 Passenger Non-Electronic Toll Rate: Not Available Year Ending
2/28 Original Projected
Traffic Transactions Actual Traffic Transactions Over / (Under) Actual Traffic vs. Projected
2012
2013
2014
2015
2016 4,931,000 10,744,952 118%
2017 9,814,000 n/a n/a
2018 11,752,000 n/a n/a
2019 13,253,000 n/a n/a
2020 14,200,000 n/a n/a
2021 15,214,000 n/a n/a
2022 16,067,000 n/a n/a
2023 16,969,000 n/a n/a
2024 17,920,000 n/a n/a
2025 18,926,000 n/a n/a
2026 19,988,000 n/a n/a
2027 20,578,000 n/a n/a
2028 21,186,000 n/a n/a
2029 21,811,000 n/a n/a
2030 22,455,000 n/a n/a
2031 23,119,000 n/a n/a
2032 23,802,000 n/a n/a
2033 24,505,000 n/a n/a
2034 25,228,000 n/a n/a
2035 25,973,000 n/a n/a
2036 26,740,000 n/a n/a Projection source: The CDM Smith 2014 Traffic and Revenue Forecast was used for fiscal years 2016 and beyond.

f
C-20
Table C.19: Harris County Toll Road Authority Toll Element: Katy (I-10) Managed Lanes
Toll Element Length: Lane Miles: 44 Center-Line Miles: 12 Opening of Element to Traffic: April 2009 Average Toll Per Mile (as of 3/30/16): Passenger Electronic Toll Rate: $0.08 Passenger Non-Electronic Toll Rate: $0.58 Year Ending
2/28 Original Projected
Traffic Transactions Actual Traffic Transactions Over / (Under) Actual Traffic vs. Projected
2012 n/a 16,071,614
2013 n/a 19,320,467
2014 n/a 22,388,942
2015 n/a 28,243,333
2016 n/a 31,615,049
2017 n/a
2018 n/a
2019 n/a
2020 n/a
2021 n/a
2022 n/a
2023 n/a
2024 n/a
2025 n/a
2026 n/a
2027 n/a
2028 n/a
2029 n/a
2030 n/a
2031 n/a
2032 n/a
2033 n/a
2034 n/a
2035 n/a
2036 n/a Projection source: Not applicable

f
C-21
Table C.20: Metro Transit Authority of Harris County Toll Element: I-45 South Gulf Freeway HOT Lanes
Toll Element Length: Lane Miles: 15.5 Center-Line Miles: 15.5 Opening of Element to Traffic: March 2012 Average Toll Per Mile (as of 4/30/16): Passenger Minimum Toll Rate: $0.06 Passenger Maximum Toll Rate: $0.29 Passenger Average Toll Rate: $0.18 Year Ending
9/30 Original Projected
Traffic Transactions Actual Traffic Transactions Over / (Under) Actual Traffic vs. Projected
2011
2012 58,200 99,205 70%
2013 263,725 314,794 19%
2014 340,935 408,275 20%
2015 340,935 490,676 44%
2016 340,935 329,423 * -3%
2017 340,935 n/a n/a
2018 340,935 n/a n/a
2019 340,935 n/a n/a
2020 340,935 n/a n/a
2021 340,935 n/a n/a
2022 340,935 n/a n/a
2023 340,935 n/a n/a
2024 340,935 n/a n/a
2025 340,935 n/a n/a
2026 340,935 n/a n/a
2027 340,935 n/a n/a
2028 340,935 n/a n/a
2029 340,935 n/a n/a
2030 340,935 n/a n/a
2031 340,935 n/a n/a
2032 340,935 n/a n/a
2033 340,935 n/a n/a
2034 340,935 n/a n/a
2035 340,935 n/a n/a * Actual transaction data through April 30, 2016. Projection source: Metro Transit Authority of Harris County internal projections. No growth was forecast after the ramp up period due to the capacity constraints in the single lane and conformance to FTA performance criteria.

f
C-22
Table C.21: Metro Transit Authority of Harris County Toll Element: I-45 North Gulf Freeway HOT Lanes
Toll Element Length: Lane Miles: 19.9 Center-Line Miles: 19.9 Opening of Element to Traffic: December 2012 Average Toll Per Mile (as of 4/30/16): Passenger Minimum Toll Rate: $0.05 Passenger Maximum Toll Rate: $0.35 Passenger Average Toll Rate: $0.14 Year Ending
9/30 Original Projected
Traffic Transactions Actual Traffic Transactions Over / (Under) Actual Traffic vs. Projected
2011
2012
2013 107,310 333,309 211%
2014 307,674 471,892 53%
2015 357,059 502,102 41%
2016 218,046 * 317,590 * 46%
2017 357,059 n/a n/a
2018 357,059 n/a n/a
2019 357,059 n/a n/a
2020 357,059 n/a n/a
2021 357,059 n/a n/a
2022 357,059 n/a n/a
2023 357,059 n/a n/a
2024 357,059 n/a n/a
2025 357,059 n/a n/a
2026 357,059 n/a n/a
2027 357,059 n/a n/a
2028 357,059 n/a n/a
2029 357,059 n/a n/a
2030 357,059 n/a n/a
2031 357,059 n/a n/a
2032 357,059 n/a n/a
2033 357,059 n/a n/a
2034 357,059 n/a n/a
2035 357,059 n/a n/a * Actual transaction data through April 30, 2016. Traffic projections are adjusted through April 30, 2016. Projection source: Metro Transit Authority of Harris County internal projections. No growth was forecast after the ramp up period due to the capacity constraints in the single lane and conformance to FTA performance criteria.

f
C-23
Table C.22: Metro Transit Authority of Harris County Toll Element: US 59 Southwest Freeway HOT Lanes
Toll Element Length: Lane Miles: 14.3 Center-Line Miles: 14.3 Opening of Element to Traffic: July 2012 Average Toll Per Mile (as of 4/30/16): Passenger Minimum Toll Rate: $0.07 Passenger Maximum Toll Rate: $0.31 Passenger Average Toll Rate: $0.20 Year Ending
9/30 Original Projected
Traffic Transactions Actual Traffic Transactions Over / (Under) Actual Traffic vs. Projected
2011
2012 14,796 37,073 151%
2013 273,026 332,447 22%
2014 510,869 436,605 -15%
2015 529,802 489,943 -8%
2016 323,942 * 313,126 * -3%
2017 529,802 n/a n/a
2018 529,802 n/a n/a
2019 529,802 n/a n/a
2020 529,802 n/a n/a
2021 529,802 n/a n/a
2022 529,802 n/a n/a
2023 529,802 n/a n/a
2024 529,802 n/a n/a
2025 529,802 n/a n/a
2026 529,802 n/a n/a
2027 529,802 n/a n/a
2028 529,802 n/a n/a
2029 529,802 n/a n/a
2030 529,802 n/a n/a
2031 529,802 n/a n/a
2032 529,802 n/a n/a
2033 529,802 n/a n/a
2034 529,802 n/a n/a
2035 529,802 n/a n/a * Actual transaction data through April 30, 2016. Traffic projections are adjusted through April 30, 2016. Projection source: Metro Transit Authority of Harris County internal projections. No growth was forecast after the ramp up period due to the capacity constraints in the single lane and conformance to FTA performance criteria.

f
C-24
Table C.23: Metro Transit Authority of Harris County Toll Element: US 59 North HOT Lanes
Toll Element Length: Lane Miles: 20.2 Center-Line Miles: 20.2 Opening of Element to Traffic: July 2013 Average Toll Per Mile (as of 4/30/16): Passenger Minimum Toll Rate: $0.05 Passenger Maximum Toll Rate: $0.22 Passenger Average Toll Rate: $0.14 Year Ending
9/30 Original Projected
Traffic Transactions Actual Traffic Transactions Over / (Under) Actual Traffic vs. Projected
2011
2012
2013 4,796 36,728 666%
2014 63,910 276,936 333%
2015 112,466 362,425 222%
2016 70,928 * 261,359 * 268%
2017 116,002 n/a n/a
2018 116,002 n/a n/a
2019 116,002 n/a n/a
2020 116,002 n/a n/a
2021 116,002 n/a n/a
2022 116,002 n/a n/a
2023 116,002 n/a n/a
2024 116,002 n/a n/a
2025 116,002 n/a n/a
2026 116,002 n/a n/a
2027 116,002 n/a n/a
2028 116,002 n/a n/a
2029 116,002 n/a n/a
2030 116,002 n/a n/a
2031 116,002 n/a n/a
2032 116,002 n/a n/a
2033 116,002 n/a n/a
2034 116,002 n/a n/a
2035 116,002 n/a n/a * Actual transaction data through April 30, 2016. Traffic projections are adjusted through April 30, 2016. Projection source: Metro Transit Authority of Harris County internal projections. No growth was forecast after the ramp up period due to the capacity constraints in the single lane and conformance to FTA performance criteria.

f
C-25
Table C.24: Metro Transit Authority of Harris County Toll Element: US 290 HOT Lanes
Toll Element Length: Lane Miles: 13.5 Center-Line Miles: 13.5 Opening of Element to Traffic: May 2013 Average Toll Per Mile (as of 4/30/16): Passenger Minimum Toll Rate: $0.07 Passenger Maximum Toll Rate: $0.52 Passenger Average Toll Rate: $0.21 Year Ending
9/30 Original Projected
Traffic Transactions Actual Traffic Transactions Over / (Under) Actual Traffic vs. Projected
2011
2012
2013 32,352 121,140 274%
2014 221,036 529,051 139%
2015 341,456 677,165 98%
2016 210,475 * 382,626 * 82%
2017 344,228 n/a n/a
2018 344,228 n/a n/a
2019 344,228 n/a n/a
2020 344,228 n/a n/a
2021 344,228 n/a n/a
2022 344,228 n/a n/a
2023 344,228 n/a n/a
2024 344,228 n/a n/a
2025 344,228 n/a n/a
2026 344,228 n/a n/a
2027 344,228 n/a n/a
2028 344,228 n/a n/a
2029 344,228 n/a n/a
2030 344,228 n/a n/a
2031 344,228 n/a n/a
2032 344,228 n/a n/a
2033 344,228 n/a n/a
2034 344,228 n/a n/a
2035 344,228 n/a n/a * Actual transaction data through April 30, 2016. Traffic projections are adjusted through April 30, 2016. Projection source: Metro Transit Authority of Harris County internal projections. No growth was forecast after the ramp up period due to the capacity constraints in the single lane and conformance to FTA performance criteria.

f
C-26
Table C.25: North East Texas Regional Mobility Authority Toll Project: Loop 49 Toll System
Toll Project Length: Lane Miles: 54.0 Center-Line Miles: 25.6 Opening of Project to Traffic: August 2006 Average Toll Per Mile (as of 3/30/16): Passenger Electronic Toll Rate: $0.171 Passenger Non-Electronic Toll Rate: $0.227 Year Ending
9/30 Original Projected
Traffic Transactions Actual Traffic Transactions Over / (Under) Actual Traffic vs. Projected
2011 1,782,900 1,846,300 4%
2012 2,086,600 2,011,800 -4%
2013 4,570,800 6,504,400 42%
2014 7,650,200 10,033,700 31%
2015 10,326,000 11,688,300 13%
2016 11,389,300 n/a n/a
2017 11,899,500 n/a n/a
2018 13,050,600 n/a n/a
2019 15,689,100 n/a n/a
2020 16,887,200 n/a n/a
2021 17,506,300 n/a n/a
2022 17,904,000 n/a n/a
2023 18,299,000 n/a n/a
2024 18,691,400 n/a n/a
2025 19,154,900 n/a n/a
2026 19,625,700 n/a n/a
2027 20,087,000 n/a n/a
2028 20,545,100 n/a n/a
2029 21,000,100 n/a n/a
2030 21,221,500 n/a n/a
2031 21,564,500 n/a n/a
2032 21,984,300 n/a n/a
2033 22,404,100 n/a n/a
2034 22,823,900 n/a n/a
2035 24,574,600 n/a n/a Projection source: 2011-2013 estimates are from CDM Smith Comprehensive Traffic and Toll Revenue Study December 2010; 2014 estimates are from CDM Smith 2014 Bring Down Study Report; 2015 estimates are from CDM Smith Comprehensive Traffic and Toll Revenue Study May 2016.

f
C-27
Table C.26: North Texas Tollway Authority System Toll Element: Addison Airport Tunnel
Toll Element Length: Lane Miles: 1.4 Center-Line Miles: 0.7 Opening of Element to Traffic: February 1999 Average Toll Per Mile (as of 3/30/16): Passenger Electronic Toll Rate: $0.59 Passenger Non-Electronic Toll Rate: $0.89 Year Ending
12/31 Original Projected
Traffic Transactions Actual Traffic Transactions Over / (Under) Actual Traffic vs. Projected
2011 1,804,800 1,942,937 8%
2012 1,819,100 2,012,376 11%
2013 1,828,400 2,101,001 15%
2014 1,840,400 2,290,426 24%
2015 1,852,400 2,438,046 32%
2016 1,857,500 n/a n/a
2017 1,863,100 n/a n/a
2018 1,869,100 n/a n/a
2019 1,875,500 n/a n/a
2020 1,886,700 n/a n/a
2021 1,897,900 n/a n/a
2022 1,909,200 n/a n/a
2023 1,920,600 n/a n/a
2024 1,932,000 n/a n/a
2025 1,943,600 n/a n/a
2026 1,953,100 n/a n/a
2027 1,962,700 n/a n/a
2028 1,972,400 n/a n/a
2029 1,982,100 n/a n/a
2030 1,992,000 n/a n/a
2031 2,001,800 n/a n/a
2032 2,011,600 n/a n/a
2033 2,021,500 n/a n/a
2034 2,031,500 n/a n/a
2035 2,041,600 n/a n/a Projection source: North Texas Tollway Authority System T&R Letter Update - October 2010 - WSA/CDM Smith

f
C-28
Table C.27: North Texas Tollway Authority System Toll Element: Dallas North Tollway
Toll Element Length: Lane Miles: 179.3 Center-Line Miles: 30.7 Opening of Element to Traffic: June 1968 Average Toll Per Mile (as of 3/30/16): Passenger Electronic Toll Rate: $0.17 Passenger Non-Electronic Toll Rate: $0.26 Year Ending
12/31 Original Projected
Traffic Transactions Actual Traffic Transactions Over / (Under) Actual Traffic vs. Projected
2011 218,617,400 215,636,493 -1%
2012 230,103,700 230,301,519 0%
2013 238,239,300 233,151,429 -2%
2014 245,550,400 243,969,234 -1%
2015 250,187,900 256,410,901 2%
2016 265,645,100 n/a n/a
2017 273,724,300 n/a n/a
2018 282,305,200 n/a n/a
2019 291,434,000 n/a n/a
2020 297,216,600 n/a n/a
2021 302,931,200 n/a n/a
2022 308,951,800 n/a n/a
2023 315,296,600 n/a n/a
2024 321,985,800 n/a n/a
2025 328,379,100 n/a n/a
2026 331,427,100 n/a n/a
2027 334,600,400 n/a n/a
2028 337,906,100 n/a n/a
2029 341,352,400 n/a n/a
2030 344,949,000 n/a n/a
2031 348,556,000 n/a n/a
2032 352,277,800 n/a n/a
2033 356,124,900 n/a n/a
2034 360,054,700 n/a n/a
2035 364,112,200 n/a n/a Projection source: North Texas Tollway Authority System T&R Letter Update - October 2010 - WSA/CDM Smith

f
C-29
Table C.28: North Texas Tollway Authority System Toll Element: Lewisville Lake Toll Bridge
Toll Element Length: Lane Miles: 8.2 Center-Line Miles: 2.0 Opening of Element to Traffic: August 2009 Average Toll Per Mile (as of 3/30/16): Passenger Electronic Toll Rate: $1.18 Passenger Non-Electronic Toll Rate: $1.77 Year Ending
12/31 Original Projected
Traffic Transactions Actual Traffic Transactions Over / (Under) Actual Traffic vs. Projected
2011 3,642,800 3,561,534 -2%
2012 4,304,800 3,923,244 -9%
2013 5,036,700 4,058,915 -19%
2014 5,803,500 4,385,259 -24%
2015 6,605,100 4,651,534 -30%
2016 7,406,600 n/a n/a
2017 8,173,400 n/a n/a
2018 8,940,100 n/a n/a
2019 9,647,300 n/a n/a
2020 10,344,400 n/a n/a
2021 11,041,500 n/a n/a
2022 11,738,500 n/a n/a
2023 12,435,600 n/a n/a
2024 13,062,900 n/a n/a
2025 13,585,700 n/a n/a
2026 13,934,300 n/a n/a
2027 14,186,500 n/a n/a
2028 14,444,100 n/a n/a
2029 14,707,000 n/a n/a
2030 14,975,300 n/a n/a
2031 15,247,100 n/a n/a
2032 15,523,900 n/a n/a
2033 15,805,800 n/a n/a
2034 16,092,700 n/a n/a
2035 16,384,800 n/a n/a Projection source: North Texas Tollway Authority System T&R Letter Update - October 2010 - WSA/CDM Smith

f
C-30
Table C.29: North Texas Tollway Authority System Toll Element: Mountain Creek Lake Toll Bridge
Toll Element Length: Lane Miles: 3.9 Center-Line Miles: 2.0 Opening of Element to Traffic: April 1979 Average Toll Per Mile (as of 3/30/16): Passenger Electronic Toll Rate: $0.59 Passenger Non-Electronic Toll Rate: $0.89 Year Ending
12/31 Original Projected
Traffic Transactions Actual Traffic Transactions Over / (Under) Actual Traffic vs. Projected
2011 2,905,500 2,458,693 -15%
2012 3,136,200 2,521,470 -20%
2013 3,303,500 2,361,453 -29%
2014 3,404,200 2,399,750 -30%
2015 3,504,900 2,540,770 -28%
2016 3,559,400 n/a n/a
2017 3,615,300 n/a n/a
2018 3,672,600 n/a n/a
2019 3,731,300 n/a n/a
2020 3,771,900 n/a n/a
2021 3,814,300 n/a n/a
2022 3,858,700 n/a n/a
2023 3,905,000 n/a n/a
2024 3,953,400 n/a n/a
2025 4,003,900 n/a n/a
2026 4,027,500 n/a n/a
2027 4,051,300 n/a n/a
2028 4,075,200 n/a n/a
2029 4,099,200 n/a n/a
2030 4,123,400 n/a n/a
2031 4,147,800 n/a n/a
2032 4,172,300 n/a n/a
2033 4,196,900 n/a n/a
2034 4,221,700 n/a n/a
2035 4,246,500 n/a n/a Projection source: North Texas Tollway Authority System T&R Letter Update - October 2010 - WSA/CDM Smith

f
C-31
Table C.30: North Texas Tollway Authority System Toll Element: President George Bush Turnpike
Toll Element Length: Lane Miles: 243.7 Center-Line Miles: 41.2 Opening of Element to Traffic: December 1998 Average Toll Per Mile (as of 3/30/16): Passenger Electronic Toll Rate: $0.17 Passenger Non-Electronic Toll Rate: $0.26 Year Ending
12/31 Original Projected
Traffic Transactions Actual Traffic Transactions Over / (Under) Actual Traffic vs. Projected
2011 193,963,500 192,376,645 -1%
2012 219,847,300 237,407,472 8%
2013 230,731,000 250,820,068 9%
2014 240,891,500 262,547,335 9%
2015 248,438,300 271,287,317 9%
2016 254,668,000 n/a n/a
2017 261,167,400 n/a n/a
2018 268,021,200 n/a n/a
2019 282,413,200 n/a n/a
2020 287,268,700 n/a n/a
2021 292,196,900 n/a n/a
2022 297,289,800 n/a n/a
2023 302,554,600 n/a n/a
2024 307,998,900 n/a n/a
2025 315,989,800 n/a n/a
2026 320,705,800 n/a n/a
2027 325,542,600 n/a n/a
2028 330,505,200 n/a n/a
2029 335,599,300 n/a n/a
2030 340,830,600 n/a n/a
2031 346,167,900 n/a n/a
2032 351,639,900 n/a n/a
2033 357,251,900 n/a n/a
2034 363,010,000 n/a n/a
2035 368,920,300 n/a n/a Projection source: North Texas Tollway Authority System T&R Letter Update - October 2010 - WSA/CDM Smith

f
C-32
Table C.31: North Texas Tollway Authority System Toll Element: Sam Rayburn Tollway
Toll Element Length: Lane Miles: 307.9 Center-Line Miles: 28.5 Opening of Element to Traffic: 2008 Average Toll Per Mile (as of 3/30/16): Passenger Electronic Toll Rate: $0.17 Passenger Non-Electronic Toll Rate: $0.26 Year Ending
12/31 Original Projected
Traffic Transactions Actual Traffic Transactions Over / (Under) Actual Traffic vs. Projected
2011 101,058,000 99,387,292 -2%
2012 112,204,600 111,585,595 -1%
2013 119,655,700 119,951,721 0%
2014 126,029,000 131,626,873 4%
2015 132,402,200 141,791,807 7%
2016 139,475,200 n/a n/a
2017 147,079,700 n/a n/a
2018 155,274,600 n/a n/a
2019 168,773,800 n/a n/a
2020 174,771,100 n/a n/a
2021 181,035,200 n/a n/a
2022 187,579,300 n/a n/a
2023 194,417,100 n/a n/a
2024 201,563,100 n/a n/a
2025 209,033,100 n/a n/a
2026 212,891,600 n/a n/a
2027 216,840,200 n/a n/a
2028 220,881,200 n/a n/a
2029 225,016,700 n/a n/a
2030 229,248,900 n/a n/a
2031 233,580,100 n/a n/a
2032 238,012,700 n/a n/a
2033 242,549,200 n/a n/a
2034 247,192,000 n/a n/a
2035 251,943,700 n/a n/a Projection source: North Texas Tollway Authority System T&R Letter Update - October 2010 - WSA/CDM Smith.

f
C-33
Table C.32: North Texas Tollway Authority Special Project System Toll Element: President George Bush Turnpike – Western Extension
Toll Element Length: Lane Miles: 106.1 Center-Line Miles: 11.5 Opening of Element to Traffic: 2012 Average Toll Per Mile (as of 3/30/16): Passenger Electronic Toll Rate: $0.17 Passenger Non-Electronic Toll Rate: $0.26 Year Ending
8/31 Original Projected
Traffic Transactions Actual Traffic Transactions Over / (Under) Actual Traffic vs. Projected
2011
2012 23,390,200 12,642,870 -46%
2013 52,451,900 34,433,016 -34%
2014 62,477,500 45,194,673 -28%
2015 68,052,500 51,925,106 -24%
2016 70,781,900 n/a n/a
2017 73,641,600 n/a n/a
2018 76,637,100 n/a n/a
2019 80,081,500 n/a n/a
2020 85,759,900 n/a n/a
2021 87,783,600 n/a n/a
2022 89,858,700 n/a n/a
2023 91,986,900 n/a n/a
2024 94,169,200 n/a n/a
2025 89,847,900 n/a n/a
2026 92,091,300 n/a n/a
2027 94,400,900 n/a n/a
2028 96,779,700 n/a n/a
2029 99,229,000 n/a n/a
2030 101,751,700 n/a n/a
2031 112,213,300 n/a n/a
2032 115,075,500 n/a n/a
2033 118,022,900 n/a n/a
2034 121,058,600 n/a n/a
2035 124,185,600 n/a n/a Projection source: North Texas Tollway Authority System President George Bush Turnpike – Western Extension Investment Grade Study - Wilbur Smith – December 2010

f
C-34
Table C.33: North Texas Tollway Authority Special Project System Toll Element: Chisholm Trail Parkway
Toll Element Length: Lane Miles: 100.0 Center-Line Miles: 27.5 Opening of Element to Traffic: May 2014 Average Toll Per Mile (as of 3/30/16): Passenger Electronic Toll Rate: $0.22 Passenger Non-Electronic Toll Rate: $0.33 Year Ending
8/31 Original Projected
Traffic Transactions Actual Traffic Transactions Over / (Under) Actual Traffic vs. Projected
2011
2012
2013
2014 6,940,600 3,737,236 -46%
2015 24,562,100 21,188,303 -14%
2016 31,197,200 n/a n/a
2017 37,991,700 n/a n/a
2018 45,616,700 n/a n/a
2019 53,007,900 n/a n/a
2020 57,162,000 n/a n/a
2021 59,355,700 n/a n/a
2022 60,951,400 n/a n/a
2023 62,514,700 n/a n/a
2024 64,082,500 n/a n/a
2025 65,579,800 n/a n/a
2026 67,372,100 n/a n/a
2027 69,101,400 n/a n/a
2028 71,030,300 n/a n/a
2029 72,668,400 n/a n/a
2030 74,537,700 n/a n/a
2031 76,340,700 n/a n/a
2032 78,263,500 n/a n/a
2033 79,988,900 n/a n/a
2034 81,970,600 n/a n/a
2035 83,854,400 n/a n/a Projection source: North Texas Tollway Authority System Chisholm Trail Parkway Investment Grade Study - Wilbur Smith – September 2011

f
C-35
Table C.34: North Texas Tollway Authority Toll Project: SH 360
Toll Project Length: Lane Miles: 38.8 Center-Line Miles: 9.7 Opening of Project to Traffic: Under Construction Average Toll Per Mile (Projected): Passenger Electronic Toll Rate: $0.17 Passenger Non-Electronic Toll Rate: $0.26 Year Ending
12/31 Original Projected
Traffic Transactions Actual Traffic Transactions Over / (Under) Actual Traffic vs. Projected
2011
2012
2013
2014
2015
2016
2017 475,100 n/a n/a
2018 11,255,000 n/a n/a
2019 14,096,200 n/a n/a
2020 17,296,700 n/a n/a
2021 20,895,200 n/a n/a
2022 24,158,300 n/a n/a
2023 25,138,600 n/a n/a
2024 26,311,100 n/a n/a
2025 27,491,300 n/a n/a
2026 28,559,600 n/a n/a
2027 29,669,900 n/a n/a
2028 30,823,100 n/a n/a
2029 31,921,700 n/a n/a
2030 33,059,200 n/a n/a
2031 35,832,300 n/a n/a
2032 36,536,100 n/a n/a
2033 37,255,100 n/a n/a
2034 37,988,600 n/a n/a
2035 38,737,600 n/a n/a Projection source: CDM Smith - SH 360 Scenario 3b - November 2012, shifted transactions down a year to reflect 2017 opening vs. original 2016 projection.

f
C-36
Table C.35: Camino Colombia Toll Road Toll Project: SH 255
Toll Project Length: Lane Miles: 49.5 Center-Line Miles: 22.0 Opening of Project to Traffic: October 2000 Average Toll Per Mile (as of 3/30/16): Passenger Electronic Toll Rate: $0.14 Passenger Non-Electronic Toll Rate: Not Available Year Ending
12/31 Original Projected
Traffic Transactions Actual Traffic Transactions Over / (Under) Actual Traffic vs. Projected
2011 329,625
2012 300,079
2013 471,516
2014 443,872
2015 504,719
2016 n/a n/a
2017 n/a n/a
2018 n/a n/a
2019 n/a n/a
2020 n/a n/a
2021 n/a n/a
2022 n/a n/a
2023 n/a n/a
2024 n/a n/a
2025 n/a n/a
2026 n/a n/a
2027 n/a n/a
2028 n/a n/a
2029 n/a n/a
2030 n/a n/a
2031 n/a n/a
2032 n/a n/a
2033 n/a n/a
2034 n/a n/a
2035 n/a n/a

f
C-37
Table C.36: Central Texas Turnpike System Toll Element: SH 130 Segments 1-4
Toll Element Length: Lane Miles: 214.1 Center-Line Miles: 49.0 Opening of Element to Traffic: November 2006 Average Toll Per Mile (as of 3/30/16): Passenger Electronic Toll Rate: $0.14 Passenger Non-Electronic Toll Rate: $0.19 Year Ending
8/31 Original Projected
Traffic Transactions Actual Traffic Transactions Over / (Under) Actual Traffic vs. Projected
2011 27,074,240 30,585,675 13%
2012 30,657,280 34,352,100 12%
2013 33,782,080 41,365,500 22%
2014 35,958,720 46,210,700 29%
2015 38,135,360 54,785,716 44%
2016 32,279,360 n/a n/a
2017 34,864,960 n/a n/a
2018 37,450,240 n/a n/a
2019 40,035,840 n/a n/a
2020 42,621,440 n/a n/a
2021 47,562,880 n/a n/a
2022 51,421,440 n/a n/a
2023 55,280,320 n/a n/a
2024 59,138,880 n/a n/a
2025 62,997,440 n/a n/a
2026 54,562,240 n/a n/a
2027 57,291,200 n/a n/a
2028 60,017,600 n/a n/a
2029 62,727,360 n/a n/a
2030 65,406,400 n/a n/a
2031 68,040,320 n/a n/a
2032 70,614,400 n/a n/a
2033 73,112,960 n/a n/a
2034 75,521,280 n/a n/a
2035 77,824,000 n/a n/a Projection source: Central Texas Turnpike System 2002 Traffic and Revenue Forecast

f
C-38
Table C.37: Central Texas Turnpike System Toll Element: SH 45 North
Toll Element Length: Lane Miles: 98.5 Center-Line Miles: 12.8 Opening of Element to Traffic: November 2006 Average Toll Per Mile (as of 3/30/16): Passenger Electronic Toll Rate: $0.17 Passenger Non-Electronic Toll Rate: $0.22 Year Ending
8/31 Original Projected
Traffic Transactions Actual Traffic Transactions Over / (Under) Actual Traffic vs. Projected
2011 25,760,700 33,541,799 30%
2012 28,734,600 35,790,100 25%
2013 30,352,500 37,126,440 22%
2014 31,970,400 38,255,800 20%
2015 33,588,600 42,686,069 27%
2016 32,033,100 n/a n/a
2017 33,188,400 n/a n/a
2018 34,344,000 n/a n/a
2019 35,499,600 n/a n/a
2020 36,655,200 n/a n/a
2021 38,841,600 n/a n/a
2022 41,371,500 n/a n/a
2023 43,901,400 n/a n/a
2024 46,431,000 n/a n/a
2025 48,960,900 n/a n/a
2026 47,980,800 n/a n/a
2027 49,611,000 n/a n/a
2028 51,241,200 n/a n/a
2029 52,871,100 n/a n/a
2030 54,501,300 n/a n/a
2031 56,131,500 n/a n/a
2032 57,761,700 n/a n/a
2033 59,391,900 n/a n/a
2034 61,022,100 n/a n/a
2035 62,652,300 n/a n/a Projection source: Central Texas Turnpike System 2002 Traffic and Revenue Forecast

f
C-39
Table C.38: Central Texas Turnpike System Toll Element: Loop 1
Toll Element Length: Lane Miles: 31.9 Center-Line Miles: 4.0 Opening of Element to Traffic: November 2006 Average Toll Per Mile (as of 3/30/16): Passenger Electronic Toll Rate: $0.27 Passenger Non-Electronic Toll Rate: $0.35 Year Ending
8/31 Original Projected
Traffic Transactions Actual Traffic Transactions Over / (Under) Actual Traffic vs. Projected
2011 22,127,700 18,882,398 -15%
2012 23,632,500 19,889,700 -16%
2013 23,972,400 19,715,300 -18%
2014 24,312,300 19,839,100 -18%
2015 24,652,500 21,468,026 -13%
2016 23,891,400 n/a n/a
2017 24,375,000 n/a n/a
2018 24,858,600 n/a n/a
2019 25,342,200 n/a n/a
2020 25,825,800 n/a n/a
2021 26,496,000 n/a n/a
2022 27,228,300 n/a n/a
2023 27,960,600 n/a n/a
2024 28,693,200 n/a n/a
2025 29,425,500 n/a n/a
2026 29,032,200 n/a n/a
2027 29,639,700 n/a n/a
2028 30,246,900 n/a n/a
2029 30,854,100 n/a n/a
2030 31,461,300 n/a n/a
2031 32,068,800 n/a n/a
2032 32,676,000 n/a n/a
2033 33,283,200 n/a n/a
2034 33,890,400 n/a n/a
2035 34,497,900 n/a n/a Projection source: Central Texas Turnpike System 2002 Traffic and Revenue Forecast

f
C-40
Table C.39: Central Texas Turnpike System Toll Element: SH 45 Southeast
Toll Element Length: Lane Miles: 30.4 Center-Line Miles: 7.0 Opening of Element to Traffic: May 2009 Average Toll Per Mile (as of 3/30/16): Passenger Electronic Toll Rate: $0.15 Passenger Non-Electronic Toll Rate: $0.20 Year Ending
8/31 Original Projected
Traffic Transactions Actual Traffic Transactions Over / (Under) Actual Traffic vs. Projected
2011 3,178,000
2012 2,715,200 3,842,000 41%
2013 2,987,520 4,300,000 44%
2014 3,279,040 4,743,000 45%
2015 3,596,480 5,565,864 55%
2016 3,772,160 n/a n/a
2017 3,901,120 n/a n/a
2018 4,034,560 n/a n/a
2019 4,172,800 n/a n/a
2020 4,315,520 n/a n/a
2021 4,463,360 n/a n/a
2022 4,616,000 n/a n/a
2023 4,773,760 n/a n/a
2024 4,937,280 n/a n/a
2025 5,106,240 n/a n/a
2026 5,280,960 n/a n/a
2027 5,461,760 n/a n/a
2028 5,648,640 n/a n/a
2029 5,841,920 n/a n/a
2030 6,041,600 n/a n/a
2031 6,248,640 n/a n/a
2032 6,462,400 n/a n/a
2033 6,683,520 n/a n/a
2034 6,912,000 n/a n/a
2035 7,148,800 n/a n/a Projection source: Central Texas Turnpike System 2012 Traffic and Revenue Forecast
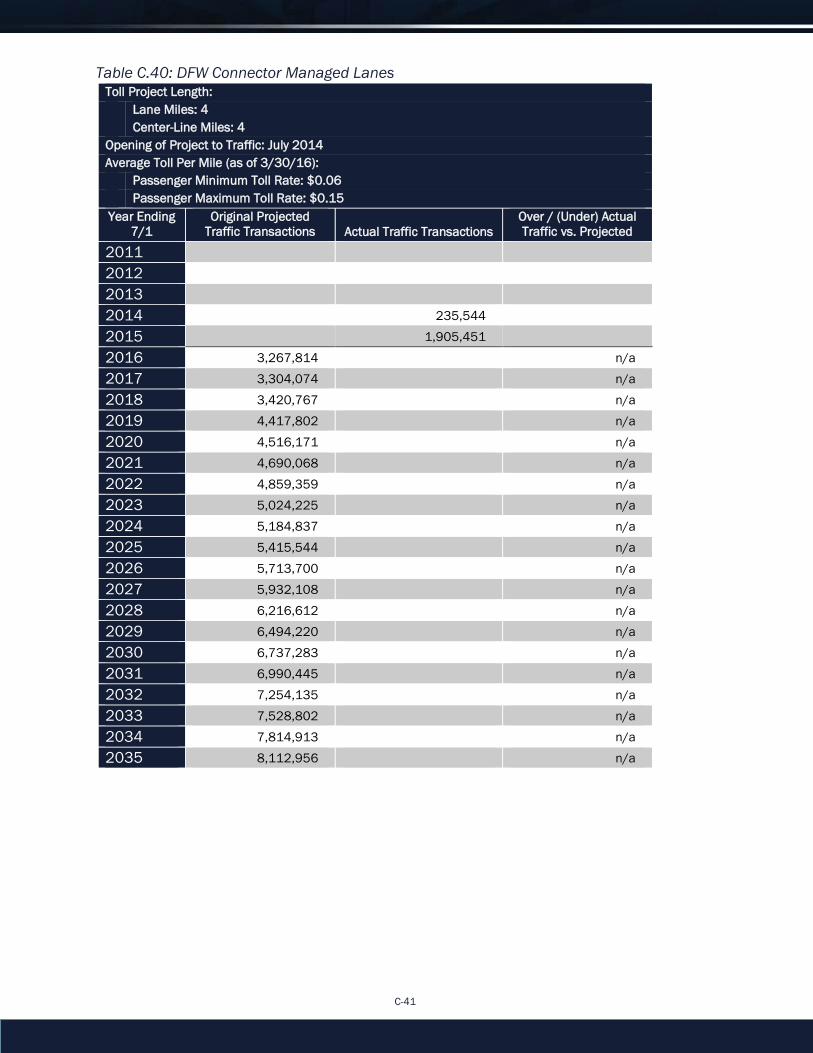
f
C-41
Table C.40: DFW Connector Managed Lanes Toll Project Length: Lane Miles: 4 Center-Line Miles: 4 Opening of Project to Traffic: July 2014 Average Toll Per Mile (as of 3/30/16): Passenger Minimum Toll Rate: $0.06 Passenger Maximum Toll Rate: $0.15 Year Ending
7/1 Original Projected
Traffic Transactions Actual Traffic Transactions Over / (Under) Actual Traffic vs. Projected
2011
2012
2013
2014 235,544
2015 1,905,451
2016 3,267,814 n/a
2017 3,304,074 n/a
2018 3,420,767 n/a
2019 4,417,802 n/a
2020 4,516,171 n/a
2021 4,690,068 n/a
2022 4,859,359 n/a
2023 5,024,225 n/a
2024 5,184,837 n/a
2025 5,415,544 n/a
2026 5,713,700 n/a
2027 5,932,108 n/a
2028 6,216,612 n/a
2029 6,494,220 n/a
2030 6,737,283 n/a
2031 6,990,445 n/a
2032 7,254,135 n/a
2033 7,528,802 n/a
2034 7,814,913 n/a
2035 8,112,956 n/a

f
C-42
Table C.41: Grand Parkway Transportation Corporation Toll Element: Grand Parkway Segment D – Harris County
Toll Element Length: Lane Miles: 10.4 Center-Line Miles: 2.6 Opening of Element to Traffic: February 2014 Average Toll Per Mile (as of 3/30/16): Passenger Electronic Toll Rate: $0.17 Passenger Non-Electronic Toll Rate: Not Available Year Ending
8/31 Original Projected
Traffic Transactions Actual Traffic Transactions Over / (Under) Actual Traffic vs. Projected
2011
2012
2013
2014 465,000 621,584 34%
2015 1,110,000 1,181,283 6%
2016 1,381,000 n/a n/a
2017 1,587,000 n/a n/a
2018 1,685,000 n/a n/a
2019 1,796,000 n/a n/a
2020 1,909,000 n/a n/a
2021 2,008,000 n/a n/a
2022 2,072,000 n/a n/a
2023 2,144,000 n/a n/a
2024 2,200,000 n/a n/a
2025 2,251,000 n/a n/a
2026 2,312,000 n/a n/a
2027 2,359,000 n/a n/a
2028 2,418,000 n/a n/a
2029 2,461,000 n/a n/a
2030 2,512,000 n/a n/a
2031 2,562,000 n/a n/a
2032 2,615,000 n/a n/a
2033 2,668,000 n/a n/a
2034 2,727,000 n/a n/a
2035 2,782,000 n/a n/a Projection source: Grand Parkway Comprehensive Traffic and Revenue Study dated June 26, 2013

f
C-43
Table C.42: Grand Parkway Transportation Corporation Toll Element: Grand Parkway Segment E
Toll Element Length: Lane Miles: 57.6 Center-Line Miles: 14.4 Opening of Element to Traffic: February 2014 Average Toll Per Mile (as of 3/30/16): Passenger Electronic Toll Rate: $0.21 Passenger Non-Electronic Toll Rate: Not Available Year Ending
8/31 Original Projected
Traffic Transactions Actual Traffic Transactions Over / (Under) Actual Traffic vs. Projected
2011
2012
2013
2014 5,877,000 8,874,381 51%
2015 14,446,000 20,521,681 42%
2016 19,596,000 n/a n/a
2017 22,950,000 n/a n/a
2018 25,346,000 n/a n/a
2019 27,694,000 n/a n/a
2020 30,049,000 n/a n/a
2021 32,225,000 n/a n/a
2022 34,926,000 n/a n/a
2023 37,869,000 n/a n/a
2024 40,940,000 n/a n/a
2025 43,939,000 n/a n/a
2026 46,268,000 n/a n/a
2027 47,828,000 n/a n/a
2028 50,269,000 n/a n/a
2029 53,822,000 n/a n/a
2030 55,728,000 n/a n/a
2031 57,853,000 n/a n/a
2032 60,044,000 n/a n/a
2033 62,172,000 n/a n/a
2034 64,560,000 n/a n/a
2035 66,592,000 n/a n/a Projection source: Grand Parkway Comprehensive Traffic and Revenue Study dated June 26, 2013

f
C-44
Table C.43: Grand Parkway Transportation Corporation Toll Element: Grand Parkway Segment F1
Toll Element Length: Lane Miles: 48.4 Center-Line Miles: 12.1 Opening of Element to Traffic: February 2016 Average Toll Per Mile (as of 3/30/16): Passenger Electronic Toll Rate: $0.19 Passenger Non-Electronic Toll Rate: Not Available Year Ending
8/31 Original Projected
Traffic Transactions Actual Traffic Transactions Over / (Under) Actual Traffic vs. Projected
2011
2012
2013
2014
2015
2016 4,532,000 n/a n/a
2017 10,982,000 n/a n/a
2018 14,610,000 n/a n/a
2019 16,854,000 n/a n/a
2020 18,757,000 n/a n/a
2021 20,907,000 n/a n/a
2022 22,481,000 n/a n/a
2023 24,226,000 n/a n/a
2024 26,035,000 n/a n/a
2025 28,054,000 n/a n/a
2026 30,237,000 n/a n/a
2027 31,165,000 n/a n/a
2028 31,885,000 n/a n/a
2029 32,011,000 n/a n/a
2030 33,147,000 n/a n/a
2031 34,278,000 n/a n/a
2032 35,632,000 n/a n/a
2033 36,973,000 n/a n/a
2034 38,475,000 n/a n/a
2035 39,961,000 n/a n/a Projection source: Grand Parkway Comprehensive Traffic and Revenue Study dated June 26, 2013

f
C-45
Table C.44: Grand Parkway Transportation Corporation Toll Element: Grand Parkway Segment F2
Toll Element Length: Lane Miles: 48.8 Center-Line Miles: 12.2 Opening of Element to Traffic: February 2016 Average Toll Per Mile (as of 3/30/16): Passenger Electronic Toll Rate: $0.19 Passenger Non-Electronic Toll Rate: Not Available Year Ending
8/31 Original Projected
Traffic Transactions Actual Traffic Transactions Over / (Under) Actual Traffic vs. Projected
2011
2012
2013
2014
2015
2016 7,155,000 n/a n/a
2017 17,007,000 n/a n/a
2018 22,023,000 n/a n/a
2019 26,107,000 n/a n/a
2020 28,917,000 n/a n/a
2021 31,447,000 n/a n/a
2022 33,390,000 n/a n/a
2023 35,616,000 n/a n/a
2024 37,734,000 n/a n/a
2025 39,959,000 n/a n/a
2026 41,872,000 n/a n/a
2027 42,634,000 n/a n/a
2028 43,545,000 n/a n/a
2029 44,363,000 n/a n/a
2030 45,311,000 n/a n/a
2031 46,286,000 n/a n/a
2032 47,411,000 n/a n/a
2033 48,463,000 n/a n/a
2034 49,681,000 n/a n/a
2035 50,697,000 n/a n/a Projection source: Grand Parkway Comprehensive Traffic and Revenue Study dated June 26, 2013

f
C-46
Table C.45: Grand Parkway Transportation Corporation Toll Element: Grand Parkway Segment G
Toll Element Length: Lane Miles: 54.0 Center-Line Miles: 13.5 Opening of Element to Traffic: March 2016 Average Toll Per Mile (as of 3/30/16): Passenger Electronic Toll Rate: $0.21 Passenger Non-Electronic Toll Rate: Not Available Year Ending
8/31 Original Projected
Traffic Transactions Actual Traffic Transactions Over / (Under) Actual Traffic vs. Projected
2011
2012
2013
2014
2015
2016 10,955,000 n/a n/a
2017 26,281,000 n/a n/a
2018 34,203,000 n/a n/a
2019 40,052,000 n/a n/a
2020 43,851,000 n/a n/a
2021 47,019,000 n/a n/a
2022 50,352,000 n/a n/a
2023 54,053,000 n/a n/a
2024 57,736,000 n/a n/a
2025 61,172,000 n/a n/a
2026 63,469,000 n/a n/a
2027 65,065,000 n/a n/a
2028 67,187,000 n/a n/a
2029 69,737,000 n/a n/a
2030 71,575,000 n/a n/a
2031 73,528,000 n/a n/a
2032 75,669,000 n/a n/a
2033 77,708,000 n/a n/a
2034 80,029,000 n/a n/a
2035 84,109,000 n/a n/a Projection source: Grand Parkway Comprehensive Traffic and Revenue Study dated June 26, 2013

f
C-47
Table C.46: SH 99 Grand Parkway Segment I-2A Toll Project Length: Lane Miles: Center-Line Miles: 7.4 Opening of Project to Traffic: November 2011 Average Toll Per Mile (as of 3/30/16): Passenger Electronic Toll Rate: $0.17 Passenger Non-Electronic Toll Rate: Not Available Year Ending
8/31 Original Projected
Traffic Transactions Actual Traffic Transactions Over / (Under) Actual Traffic vs. Projected
2011
2012 713,210
2013 863,101
2014 978,699
2015 1,394,915
2016 1,588,000 n/a n/a
2017 1,674,000 n/a n/a
2018 1,765,000 n/a n/a
2019 1,864,000 n/a n/a
2020 1,965,000 n/a n/a
2021 2,661,000 n/a n/a
2022 3,088,000 n/a n/a
2023 3,364,000 n/a n/a
2024 3,639,000 n/a n/a
2025 3,896,000 n/a n/a
2026 4,154,000 n/a n/a
2027 4,420,000 n/a n/a
2028 4,701,000 n/a n/a
2029 4,999,000 n/a n/a
2030 5,308,000 n/a n/a
2031 5,637,000 n/a n/a
2032 5,987,000 n/a n/a
2033 6,359,000 n/a n/a
2034 6,755,000 n/a n/a
2035 7,174,000 n/a n/a

f
D-1
Appendix D: House Bill 2612
AN ACT relating to a report to the legislature regarding the elimination of toll roads. BE IT ENACTED BY THE LEGISLATURE OF THE STATE OF TEXAS: SECTION 1. Not later than September 1, 2016, the Texas Department of Transportation shall submit to each standing committee of the senate and house of representatives that has primary jurisdiction over transportation matters a report that: (1) lists the amount of debt service on bonds issued for each toll project in this state; (2) identifies, based on criteria provided by the Texas Transportation Commission, bonds that would be appropriate for accelerated or complete lump-sum payment of debt service; and (3) proposes a plan to eliminate all toll roads in this state, except for tolls on roads constructed, operated, or maintained only with proceeds from the issuance of bonds by a toll project entity other than the department, by methods including: (A) the accelerated or complete lump-sum payment of debt service on bonds identified under Subdivision (1); or (B) requiring, as a condition on receipt of state financial assistance, a commitment by a toll project entity to eliminate toll collection on a project for which the financial assistance is provided. SECTION 2. This Act takes effect September 1, 2015.
Texas Department of Transportation - Rider 46. Report on the Elimination of Toll Roads. Out of funds appropriated above, it is the intent of the Legislature that the Texas Department of Transportation conduct a study on the feasibility of eliminating toll roads and the payment of debt to accomplish this purpose. It is the intent of the Legislature that the report: i. list the amount of debt service on bonds issued for each toll project in this state; ii. identify, based on criteria provided by the Texas Transportation Commission, bonds that would be
appropriate for accelerated or complete lump-sum payment of debt service; and iii. propose a plan to eliminate all toll roads in this state, except for tolls on roads constructed, operated,
or maintained only with proceeds from the issuance of bonds by a toll project entity other than the department, by methods including: (A) the accelerated or complete lump-sum payment of debt service on bonds identified under
Subdivision (1); or (B) requiring, as a condition on receipt of state financial assistance, a commitment by a toll project
entity to eliminate toll collection on a project for which the financial assistance is provided. It is the intent of the Legislature that the report is completed by September 1, 2016, and a copy be provided to the Legislative Budget Board and the standing committees of each house of the Legislature with primary jurisdiction over transportation matters.