report on the electronic communications sector 2007quarter iv.pdf · report on the electronic...
TRANSCRIPT

COMMUNICATIONS REGULATORY AUTHORITY OF THE REPUBLIC OF LITHUANIA
REPORT ON THE ELECTRONIC COMMUNICATIONS SECTOR
according to information provided by electronic communications operators and service
providers on the electronic communications activities carried out
(Quarter IV, 2007)
Vilnius 2007 March

Report on the electronic communications sector Quarter IV, 2007
© 2008 Communications Regulatory Authority (RRT) 2
Content
1. Preface 3
2. Main Indicators of the Electronic Communications Market 4
3. Fixed Telephony 7
4. Mobile Telephony 23
5. Leased Lines 37
6. Internet Access Services 39
7. Data Transmission Services 53
8. Cable Television and Microwave Multi-channel Distribution System (MMDS) Networks 54
9. Wire Radio Activities 56
10. Radio and Television Programs Transmission Services 56

Report on the electronic communications sector Quarter IV, 2007
© 2008 Communications Regulatory Authority (RRT) 3
1. Preface
The report on the electronic communications sector has been prepared on the basis of
information provided by electronic communications operators and (or) providers of services about the electronic communications activities that were carried out in the fourth quarter of 2007, as well as on other information available to the Communications Regulatory Authority (RRT).
At the end of the fourth quarter of 2007 the following had the right to engage in the electronic communications activities (submitted notifications about the beginning of their activities): 65 undertakings � to engage in the provision of fixed public telephone network and (or) services (during the fourth quarter was submitted 1 new notification, 5 undertakings cancelled activities), 20 undertakings � to engage in the activities of providing mobile public telephone network and (or) services (during the fourth quarter were not submitted new notifications, 2 undertakings cancelled activities), and 24 undertakings � to engage in the activities of providing leased lines services (during the fourth quarter were not submitted new notifications).
During the year were submitted 12 notifications about the beginning of activities in regard to public fixed telephone network and/or service provision, in regard to public mobile telephone network and/or service provision activities were submitted 6 notifications during the year, in regard to leased lines services provision activities � 3 notifications during the year.
The number of undertakings, actually executing public fixed telephone activities decreased by 7,7% during the year, number of undertakings, actually executing public mobile telephone activities increased by 8,3% and number of undertakings, actually executing leased lines services activities unchanged.
Fig. 1. Notifications about the beginning of electronic communications activities
52 47 48
12 13 13 15 15 15
9 22 17
5 9 7 9 11 9
2426242022
17
6561
69
0
10
20
30
40
50
60
70
80
2006 12 312007 09 30
2007 12 312006 12 31
2007 09 302007 12 31
200612 312007 09 30
2007 12 31
fixed telephone activities mobile telephone activities leased lines services
active in the market non active in the market number of notifications

Report on the electronic communications sector Quarter IV, 2007
© 2008 Communications Regulatory Authority (RRT) 4
2. Main Indicators of the Electronic Communications Market
1 table. Summarised indicators of the fixed public telephone activity
Name of indicator Quarter IV of 2007
Quarter III of 2007
Change in comparison
IIIQ, % 2006 2007
Change in comparison 2007 with 2006, %
1. Number of fixed telephone lines1, total, in units
799.436 800.185 -0,09 792.357 799.436 0,89
2. Number of lines per 100 population2,
23,7 23,7 0 23,4 23,7 0,3
3. Number of mobile telephone subscribers, in units
4.921.077 4.889.512 0,65 4.718.215 4.921.077 4,30
4. Number of mobile telephone subscribers per 100 population
146,2 145,0 1,1 139,4 146,2 6,6
5. Number of Internet access subscribers, in units
581.860 524.514 10,93 417.526 581.860 39,36
including: who make use of broadband communication technologies
507.572 463.122 9,60 368.715 507.572 37,66
6. Number of Internet access subscribers per 100 population
17,3 15,6 1,7 12,3 17,3 4,9
broadband subscribers per 100 population
15,1 13,7 1,4 10,9 15,1 4,2
7. Revenue, in Litas 760.105 770.529 -1,35 2.695.279 2.974.469 10,36
including: fixed telephone 103.513 101.774 1,71 424.632 412.738 -2,80 mobile telephone 344.709 361.792 -4,72 1.237.870 1.387.251 12,07 leased lines 7.222 6.877 5,02 25.384 26.651 4,99 internet access services 87.385 80.689 8,30 264.884 312.965 18,15
data transmission services 14.814 14.175 4,51 46.818 55.609 18,78
provision of physical optical fibre
2.472 1.423 73,70 6.937
cable TV and MMDS 18.404 18.066 1,87 65.934 71.699 8,74
radio and television programs transmission services
7.355 6.264 17,42 20.644 25.294 22,53
wire radio 375 380 -1,42 1629 1.568 -3,74 networks interconnection 173.857* 179.089 -2,92 607.485 673.756 10,91 8. Investments, in Litas 171.118 128.699 32,96 525.670 546.614 3,98
including the investments into the electronic communication network infrastructure
138.712 106.680 30,03 350.191 460.983 31,64
1 - fixed telephone lines, including ISDN channels 2 - population 3366,2 thousand according to the data of the Statistic Department (data for 2008.01.01)

Report on the electronic communications sector Quarter IV, 2007
© 2008 Communications Regulatory Authority (RRT) 5
Fig 2. Distribution of revenue by markets for the fourth quarter of 2007, in % (total revenue LTL 760,10 mill. )
In the fourth quarter of 2007 electronic communication market according to revenue from the provision of fixed telephone networks and services, mobile telephone networks and services, leased lines services, internet access, data transmission, physical optical fibre, cable TV, MMDS, wire radio, radio and television programs transmission services and revenue from the networks interconnection in comparison with the third quarter of 2007 decreased by 1,4% and constituted LTL 760,10 million. In comparison with the year 2006 in the year 2007 market increased by 10,4%.
Estimating according to the revenues, received from the provision of all the aforementioned
electronic communications services, in 2007 only four companies occupied a market share larger than 2%, the market share of all the other operators and providers of electronic communications services (156 companies) amounted to approximately 11%.
Fig. 3. Distribution of the electronic communications market against operators (estimating according to the revenues, received in 2007), % (total revenue LTL 2974,5 mill.)
Network interconnection
22,87%
Wire radio0,05%
Radio and television programs transmission
0,97%Physical optical fibre
0,33%
Cable TV and MMDS2,42%
Data transmission (excl. internet)1,95%
Internet access11,50%
Mobile telephony45,35%
Fixed telephony13,62%
Leased lines0,95%
UAB �Bitė Lietuva� 20.4%
UAB �Tele2� 15.7%
Other 11.1% UAB �Omnitel�
29.0%
TEO LT, AB 23.9%

Report on the electronic communications sector Quarter IV, 2007
© 2008 Communications Regulatory Authority (RRT) 6
Fig 4. Distribution of revenue from network interconnection by operators for the fourth quarter of 2007, in % (total revenue LTL 173,9 mill.)
In the fourth quarter of 2007 the investments into the electronic communications network infrastructure increased by 30,0%, comparing with the third quarter of 2007 and amounted to LTL 138,7 million. As compared with the year 2006, the investments into the electronic communications network infrastructure in the year 2007 increased by 31,6%.
Other2,92%
UAB "Omnitel"27,91%
TEO LT, AB19,76%
UAB "Bitė Lietuva"27,50%
UAB "Tele2"21,91%

Report on the electronic communications sector Quarter IV, 2007
© 2008 Communications Regulatory Authority (RRT) 7
3. Fixed Telephony 48 companies engaged in the activities of the fixed public telephone communication in the
fourth quarter of 2007. Totally 32 companies specified that their fixed telephone services are provided by using IP (14 of them employed cable television networks).
Undertakings that engaged in the activities of the fixed public telephone communication in the fourth quarter of 2007: UAB �Alderada�, UAB �Alytaus kabelinė televizija�, UAB �Arcus Novus�, UAB �Balticum TV�, UAB �Baltnetos komunikacijos�, UAB �CSC Telecom�, UAB �Cubio�, UAB �Eurocom�, UAB �Eurofonas�, UAB �Gigatelis�, UAB �Gisnetas�, VĮ �Infostruktūra�, UAB �Init�, UAB �Interneto pasaulis�, A. Judicko individuali įmonė, AB �Lietuvos gele�inkeliai�, AB �Lietuvos radijo ir televizijos centras, UAB �Linkotelus�, UAB �Linktelis�, UAB �Marsatas�, UAB �Microlink Lietuva�, UAB �Mikrovisatos TV�, UAB �Nacionalinis telekomunikacijų tinklas�, UAB �Naujasis telefonas�, UAB �NORBY Telecom�, UAB �NTT Cable Lietuva�, AB �Ogmios centras�, UAB �Penkių kontinentų komunikacijų centras�, UAB �Radijo elektroninės sistemos�, UAB �Remo televizija�, UAB �Resvera�, UAB �Roventa�, UAB �Solocomas�, UAB �Tele2 fiksuotas ry�ys�, UAB �Telekomunikaciju grupa�, UAB �Televartai�, UAB �Telerena�, UAB �Teletinklas�, TEO LT, AB, UAB �ViaCall�, UAB �Viginta�, UAB �Zirzilė� and UAB �Bitė Lietuva�, UAB �Bručas ir Ko�, UAB �Fast traffic�, UAB �Mediafon�, UAB �Teleinformacijos paslaugos�, UAB �Trys penketai�.
Most undertakings provided retail fixed telephony services (42 undertaking from the beginning of the list provided international call services, 28 of them (UAB �Alderada�, UAB �Alytaus kabelinė televizija�, UAB �Balticum TV�, UAB �Eurocom�, UAB �Gisnetas�, VĮ �Infostruktūra�, UAB �Init�, UAB �Interneto pasaulis�, A. Judicko individuali įmonė, AB �Lietuvos gele�inkeliai�, AB �Lietuvos radijo ir televizijos centras�, UAB �Linktelis�, UAB �Marsatas�, UAB �Microlink Lietuva�, UAB �Mikrovisatos TV�, UAB �Nacionalinis telekomunikacijų tinklas�, UAB �NORBY Telecom�, AB �Ogmios centras�, UAB �Penkių kontinentų komunikacijų centras�, UAB �Radijo elektroninės sistemos�, UAB �Remo televizija�, UAB �Roventa�, UAB �Tele2 fiksuotas ry�ys�, UAB �Telerena�, UAB �Teletinklas�, TEO LT, AB, UAB �Viginta�, UAB �Zirzilė�) also provided services of national calls, other 5 provided only transit services.
Table 2. Summarised indicators of the fixed public telephone activity
Name of indicator Quarter IV of 2007
Quarter III of 2007
Change in comparison
IIIQ, % 2006 2007
Change in comparison 2007 with 2006, %
1. Total number of fixed telephone subscribers3, total, units,
840.272 842.169 -0,23 835.446 840.272 0,58
including: - consumers 630.705 634.390 -0,58 630.394 630.705 0,05 - business subscribers 209.567 207.779 0,86 205.052 209.567 2,20
2. Total number of telephone lines, used for provision of public fixed telephone service (excl. ISDN), units,
751.684 753.427 -0,23 747.081 751.684 0,62
including: - consumers 610.592 612.650 -0,34 607.857 610.592 0,45 - business subscribers 141.092 140.777 0,22 139.224 141.092 1,34
including: - the number of metallic twisted pair lines
710.048 708.403 0,23 706.079 710.048 0,56
including the lines, used or provision of high speed rate digital subscriber
231.960 218.638 6,09 178.302 231.960 30,09
3 - the number of the fixed telephone subscribers is equated to the number of telephone lines, used for provision of fixed telephone services and adding the subscribers, to whom fixed telephone services were provided by using the access, provided by other operators

Report on the electronic communications sector Quarter IV, 2007
© 2008 Communications Regulatory Authority (RRT) 8
Name of indicator Quarter IV of 2007
Quarter III of 2007
Change in comparison
IIIQ, % 2006 2007
Change in comparison 2007 with 2006, %
lines (hereinafter referred to as xDSL) service - the number of wireless communication lines
34.653 35.214 -1,59 36.360 34.653 -4,69
- the number of lines of cable television networks
315 491 -35,85 524 315 -39,89
- the number of lines of data communication networks
6.668 9.319 -28,45 4.118 6.668 61,92
3. Number of ISDN, total, in units
17.226 16.939 1,69 16.170 17.226 6,53
including: - consumers 524 566 -7,42 714 524 -26,61 - business subscribers 16.702 16.373 2,01 15.456 16.702 8,06
including: - ISDN BRA (128 kbps main speed rate line, equivalent to two 64 kbps speed rate channels)
16.751 16.479 1,65 15.708 16.751 6,64
- ISDN PRA (2 Mbps primary speed rate line, equivalent to thirty 64 kbps sped rate channels
475 460 3,26 462 475 2,81
4. Number of telephone lines connected to digital automatic exchanges, units4:
699.761 696.779 0,43 694.386 699.761 0,77
including: - consumers 567.514 568.886 -0,24 564.363 567.514 0,56 - business subscribers 132.247 127.893 3,40 130.023 132.247 1,71
5. The number of subscribers, to whom public fixed telephone services are provided by using the access, provided by other electronic communications operators, units:
40.836 41.984 -2,73 43.089 40.836 -5,23
including: - consumers 19.065 20.608 -7,49 21.109 19.065 -9,68 - business subscribers 21.771 21.376 1,85 21.980 21.771 -0,95
6. The number of pre-payment cards sold, units
51.567 84.844 -39,22 51.567
7. Number of pay phones, total, units:
2.440 3.065 -20,39 3.575 2.440 -31,75
including - in cities 2.066 2.602 -20,60 3.005 2.066 -31,25 - in small towns and rural areas
374 463 -19,22 570 374 -34,39
8. Total number of disconnected telephones, units:
15.109 14.081 7,30 66.265 55.586 -16,12
including: - due to the debts for services
1.475 1.431 3,07 6.877 5.673 -17,51
- wished by the customer 13.634 12.650 7,78 59.268 49.913 -15,78 9. Volumes of calls where calls are initiated in one�s own network, total, min:
422.793.495 383.406.922 10,27 1.729.085.914 1.667.248.256 -3,58
- consumers 292.355.022 259.526.070 12,65 1.136.418.443 1.131.530.932 -0,43 - business subscribers 130.438.472 123.880.852 5,29 592.667.470 535.717.323 -9,61 including: - services over short telephone numbers
7.694.186 7.499.338 2,60 26.998.188 30.158.018 11,70
4 - excl. ISDN lines

Report on the electronic communications sector Quarter IV, 2007
© 2008 Communications Regulatory Authority (RRT) 9
Name of indicator Quarter IV of 2007
Quarter III of 2007
Change in comparison
IIIQ, % 2006 2007
Change in comparison 2007 with 2006, %
(excluding 10XX and the dial-up Internet connections), when calls are terminated in own network - local calls (volume of calls when calls are terminated in own network within a geographical numbering area)
303.014.816 270.181.951 12,15 1.254.055.830 1.195.057.480 -4,70
- long-distance calls (volume of calls when calls are terminated in own network in other areas of geographical numbering)
72.540.912 66.324.112 9,37 292.845.186 282.475.149 -3,54
- international calls (calls terminated in the networks of foreign operators)
12.813.803 12.659.820 1,22 52.557.764 51.462.181 -2,08
- to other public fixed telephone networks of the Republic of Lithuania
6.915.786 6.421.485 7,70 18.897.426 26.565.478 40,58
- to public mobile telephone networks of the Republic of Lithuania
19.813.992 20.320.216 -2,49 83.731.520 81.529.951 -2,63
10. Duration of calls to internet in case of dial-up connection, min.:
13.998.301 14.856.049 -5,77 157.156.215 69.003.051 -56,09
including: - consumers 11.142.124 11.908.449 -6,44 125.137.312 54.158.100 -56,72 - business subscribers 2.856.177 2.947.600 -3,10 32.018.903 14.844.951 -53,64
11. Volumes of calls where calls are terminated in one�s own network, total, min (except the calls, initiated in the own network):
75.366.365 72.187.174 4,40 281.024.087 291.530.896 3,74
including: - calls initiated in other public fixed telephone networks of the Republic of Lithuania
12.316.796 10.665.019 15,49 60.210.231 46.168.634 -23,32
- calls initiated in public mobile telephone networks of the Republic of Lithuania
29.558.485 29.212.672 1,18 107.475.610 115.662.912 7,62
- calls initiated in the networks of operators of foreign countries
33.491.083 32.309.483 3,66 113.338.246 129.699.351 14,44
12. Volume of transit forwarded calls, min.:
123.093.566 117.099.937 5,12 347.482.429 439.478.114 26,47
- to other public telephone networks of the Republic of Lithuania
61.526.936 56.438.624 9,02 190.296.291 215.506.093 13,25
- to telephone networks of foreign countries
61.566.630 60.661.312 1,49 157.186.137 223.972.021 42,49
13. The number of users of services who make use of the public telephone service operator (carrier) (hereinafter referred to as the provider) selection
18.926 19.637 -3,62 21.884 18.926 -13,52

Report on the electronic communications sector Quarter IV, 2007
© 2008 Communications Regulatory Authority (RRT) 10
Name of indicator Quarter IV of 2007
Quarter III of 2007
Change in comparison
IIIQ, % 2006 2007
Change in comparison 2007 with 2006, %
service, total, units, (who made use of these services at least once within the reporting period): - of which by means of pre-selection, units
5.165 5.252 -1,66 4.639 5.165 11,34
14. The total volume of calls, initiated by the service users, who make use of provider selection service, min.:
5.377.291 5.531.322 -2,78 30.461.478 23.526.034 -22,77
- including by those who use the pre-selection service
2.864.045 2.926.184 -2,12 13.998.728 12.498.409 -10,72
15. The number of providers whose services can be chosen by means of pre-selection or call-by-call selection, total, units
15 15 0 15 15 0
- of which by means of pre-selection, units
6 6 0 6 6 0
16. Revenues from the retail provision of the public fixed telephone network and/or services, in thou. Litas (excluding VAT).
101.698 99.836 1,87 417.972 405.754 -2,92
- consumers 54.243 53.712 0,99 215.517 216.379 0,40 - business subscribers 47.456 46.123 2,89 202.455 189.375 -6,46 including: - for local calls 17.922 16.541 8,35 79.951 71.412 -10,68 - for domestic long-distance calls
8.326 8.068 3,20 40.698 34.032 -16,38
- for international calls 8.702 8.864 -1,83 40.998 36.142 -11,84 - for the calls to other public fixed telephone networks
1.538 1.335 15,15 721 5.557 670,42
- for the calls to public mobile telephone networks
10.663 10.913 -2,30 46.669 43.950 -5,83
- other revenues 54.548 54.114 0,80 208.935 214.660 2,74 17. Revenues from wholesale public fixed telephone network and/or services, thou. LTL (excluding VAT). (the item does not include the revenues, received from network interconnection activities)
1.814 1.939 -6,41 6.660 6.984 4,87
18. The revenues from network interconnection activities, thou. Litas (excluding VAT)
43.068 44.567 -3,37 143.754 165.210 14,93
including: - the revenues for termination of calls, initiated in other public telephone networks of the Republic of Lithuania in the own network
4.926 5.172 -4,75 19.322 15.719 -18,65

Report on the electronic communications sector Quarter IV, 2007
© 2008 Communications Regulatory Authority (RRT) 11
Name of indicator Quarter IV of 2007
Quarter III of 2007
Change in comparison
IIIQ, % 2006 2007
Change in comparison 2007 with 2006, %
- the revenues for termination of calls, initiated in foreign countries� networks in the own network
3.215 3.141 2,37 13.401 12.698 -5,25
- the revenues for forwarding (transit) of calls
34.660 35.753 -3,06 108.657 131.366 20,90
Total revenue from the provisions of fixed public telephone networks and services constituted
LTL 103,51 million during the fourth quarter of 2007, revenue of alternative providers of fixed telephone communication totalled LTL 4,85 million, or 4,68%. As compared with the last quarter, total revenue of the providers of fixed telephone communication increased by 1,7%, as well as revenue of the alternative providers increased by 0,9%. As compared with the year 2006 total revenue of the providers of fixed telephone communication in the year 2007 decreased by 2,8%, revenue of the alternative providers increased by 6,5%.
TEO LT, AB revenues from provision of local calls during the fourth quarter of 2007 accounted 99,1% of market share, of domestic long-distance calls � 90,6% (UAB �Eurocom� � 5,9%), of international calls � 77,9% (UAB �Telekomunikaciju grupa� � 4,1%, UAB �Cubio� � 3,6%, UAB �Solocomas� � 2,2%, other less than 2%), of calls to public mobile telephone networks � 94,5% (UAB �Eurocom� � 2,6%).
The number of subscribers of alternative providers of fixed public telephone services at the end of the fourth quarter of 2007 totalled 52,0 thousand (6,2% of the total number of the subscribers � 840,3 thousand) and during the quarter their number decreased by 7,3%. From the end of the fourth quarter of 2006 number of the subscribers of alternative providers of fixed public telephone services decreased by 1,8%. Fig. 5. Change of market share of alternative providers of fixed public telephone services according to the number of subscribers and revenues, %
The number 799,44 thousand comprises 788,32 thousand lines of TEO LT, AB and 11,12
thousand main lines of the alternative operators. During the fourth quarter of 2007 the total number of telephone lines decreased by 0,7
thousand (0,1%). During the year the number of telephone lines increased by 7,1 thousand (0,9%).
6,19 6,38 6,54 6,58
1,37
5,05
6,016,08 6,34 6,65
6,18
4,15 3,98 3,97 4,11 4,454,72 4,68
2,92
4,78
6,12
4,27
0
2
4
6
8
2003 2004 2005 2006 IQ 2006 IIQ 2006 IIIQ 2006 IVQ 2007 IQ 2007 IIQ 2007 IIIQ 2007 IVQ
%
Altern. share according to the number of subscribers Altern. share according to revenues

Report on the electronic communications sector Quarter IV, 2007
© 2008 Communications Regulatory Authority (RRT) 12
During the fourth quarter of 2007 the number of telephone lines per 100 population unchanged and in the 31 December 2007 constituted 23,7 lines per 100 population � 45,2 lines per 100 households5. During the year penetration increased by 0,3 per cent. Fig. 6. Number of telephone lines
According to the information, published on the Internet websites of national regulators, the fixed communication penetration at the end of the fourth quarter of 2007:
- in Spain reached 40.8% (40,8 lines per 100 population) and in comparison with the end of the year 2006, it increased by 0,5 per cent;
- in Hungary reached 32,3% and in comparison with the end of the year 2006, it decreased by 0,9 per cent.
Twisted metallic pair loops were mostly used for access to the subscribers, also there were used wireless communication lines, cable television and data transmission network lines. Fig. 7. Distribution of the number of the telephone lines according to technologies, thou. (total number � 799,44 thou.)
5 - household - 2,4 person according to the data of the Statistic Department (data for 2007)
799,44800,19799,04798,08792,357801,11820,04
824,2
935,9
1151,723,723,723,7
33,1
27,023,9 23,9 23,5 23,4 23,6
0
200
400
600
800
1000
1200
1400
2001 12 31 2002 12 31 2003 12 31 2004 12 31 2005 12 31 2006 12 31 2007 03 31 2007 06 30 2007 09 30 2007 12 310
5
10
15
20
25
30
35
Number of telephone lines, in thou. Number of telephone lines per 100 population
twisted metallic pair loops (PSTN)
88,8%
cable television network lines
0,04%
wireless communication lines
4,3%
data transmission network lines
0,8%
ISDN channels6,0%
twisted metallic pair loops (PSTN) wireless communication linescable television network lines data transmission network linesISDN channels

Report on the electronic communications sector Quarter IV, 2007
© 2008 Communications Regulatory Authority (RRT) 13
The alternative service providers provided fixed telephone services to approximately 21,4% (11,1 thousand) subscribers by using their lines, the remaining subscribers (40,8 thousand) were provided the services by using the access, provided by other electronic communications operators.
As of 31 December of 2007 two agreements on provision of unbundled access to the local loop service were signed and TEO LT, AB was providing fully unbundled access6 to 443 local loops.
Cable television networks and data communication networks were used for provision of the Internet telephony services (6983 lines). Totally at the end of fourth quarter of 2007 approximately 27,6 thousand subscribers used the Internet telephony services7, during the quarter their number decreased by 10%, during the year increased by 25,2%. By using the IP protocol, mostly international calls services were provided. The revenues from these services during the fourth quarter of 2007 amounted to LTL 1,17 million, i. e. they grew by 0,7% comparing with the third quarter of 2007; the revenues from these services in the year 2007 totalled LTL 4,5 million, comparing with the year 2006 they increased by 15,2% In the fourth quarter of 2007 the international call (IP) streams increased by 1,8% comparing with last quarter and amounted 2,36 million min. (about 18,4% of all the international calls).
The share of TEO LT, AB telephone lines connected to digital telephone stations (ATS) increased from 93,9% at the end of the fourth quarter of 2006 until 94,0% at the end of the fourth quarter of 2007.
During the fourth quarter of 2007 the number of main lines whereby the high-speed service of subscriber lines (hereinafter referred to as xDSL) increased by 6,1% and on 31 December 2007 totalled 232,0 thousand. From the end of the fourth quarter of 2006 it increased by 30,1%.
The total duration of the calls initiated in public fixed telephone networks in the fourth quarter of 2007 increased by 10,3% comparing with the previous quarter, and constituted 422,80 million minutes, including 408,50 million minutes (96,6%), which were initiated in the network of TEO LT, AB. As compared with the year 2006 the total duration of the calls in the year 2007 decreased by 3,6%. Share of duration of the calls initiated by alternative service providers during the year increased by 0,1 per cent.
During the fourth quarter of 2007 alternative operators initiated: - 31,5% of international calls (including: 4,8% - UAB �Telekomunikaciju grupa�, 4,5% - UAB
�Cubio�, 4,0% - UAB �CSC Telecom�, 2,5% - UAB �Linkotelus�, 2,3% - UAB �Tele2 fiksuotas ry�ys�, 2,3% - UAB �Solocomas�, 2,0% - UAB �Eurocom�, other � less 2%),
- 7,9%8 of long-distance calls (including: 4,0% - UAB �Eurocom�), - 0,7% of local calls, - 8,9% to mobile telephone networks (including: 3,5% - AB �Lietuvos gele�inkeliai�, 2,4% -
UAB �Eurocom�, other � less 2%), - 1,1% calls over service and short numbers.
6 - Full unbundled access to the local loop means the provision to a beneficiary of access to the local loop or local sub-loop of the operator bound by the procedure and conditions set out in the Electronic Communications Law, authorising the use of the full frequency spectrum of the physical circuit. 7 - according to the data of public fixed telephone communications that indicated provision of the IP telephony services 8 - including long-distance calls and calls to other public fixed telephone networks of the Republic of Lithuania
Report on the electronic communications sector Quarter IV, 2007
© 2008 Communications Regulatory Authority (RRT) 14
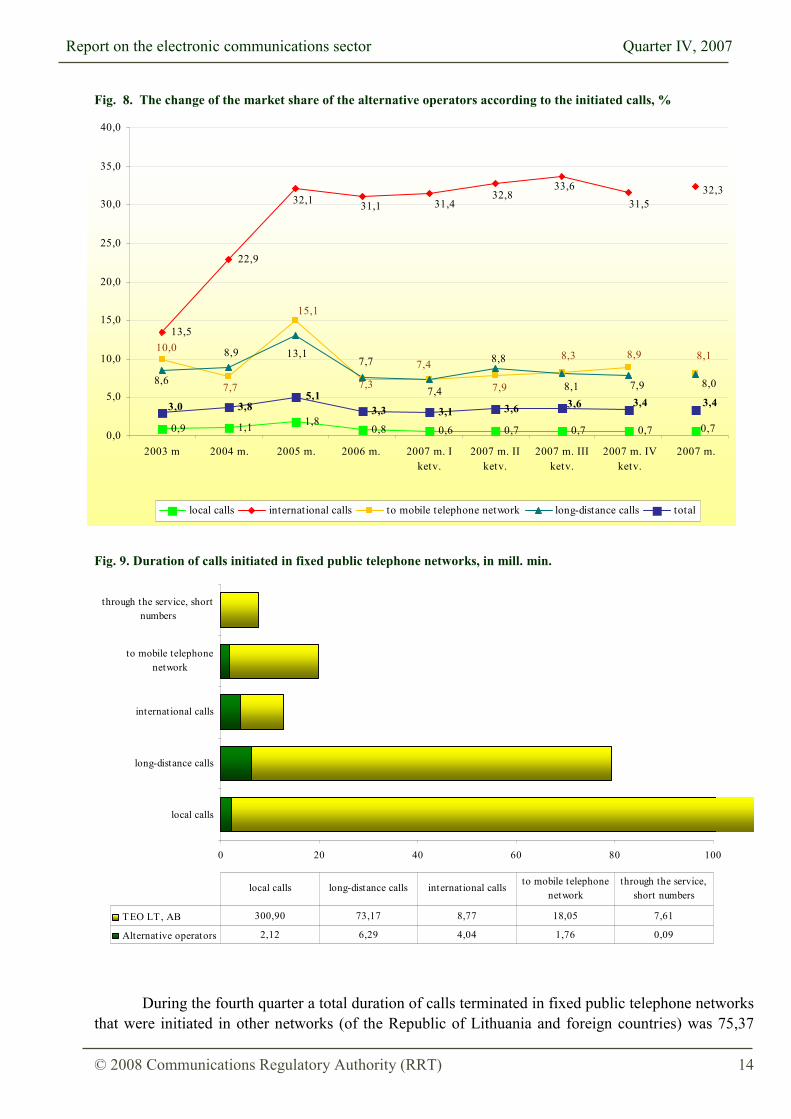
Fig. 8. The change of the market share of the alternative operators according to the initiated calls, %
Fig. 9. Duration of calls initiated in fixed public telephone networks, in mill. min. During the fourth quarter a total duration of calls terminated in fixed public telephone networks
that were initiated in other networks (of the Republic of Lithuania and foreign countries) was 75,37
0,9 1,1 1,80,8 0,6 0,7 0,7 0,7
13,5
22,9
3,8 3,3 3,1 3,6
0,7
32,331,5
33,632,8
31,431,132,1
8,310,0
8,18,9
7,9
7,4
7,3
15,1
7,7 8,07,98,1
8,8
7,4
7,713,18,9
8,65,1 3,43,43,63,0
0,0
5,0
10,0
15,0
20,0
25,0
30,0
35,0
40,0
2003 m 2004 m. 2005 m. 2006 m. 2007 m. Iketv.
2007 m. IIketv.
2007 m. IIIketv.
2007 m. IVketv.
2007 m.
local calls international calls to mobile telephone network long-distance calls total
0 20 40 60 80 100
local calls
long-distance calls
international calls
to mobile telephonenetwork
through the service, shortnumbers
TEO LT, AB 300,90 73,17 8,77 18,05 7,61
Alternative operators 2,12 6,29 4,04 1,76 0,09
local calls long-distance calls international calls to mobile telephone network
through the service, short numbers
Report on the electronic communications sector Quarter IV, 2007
© 2008 Communications Regulatory Authority (RRT) 15
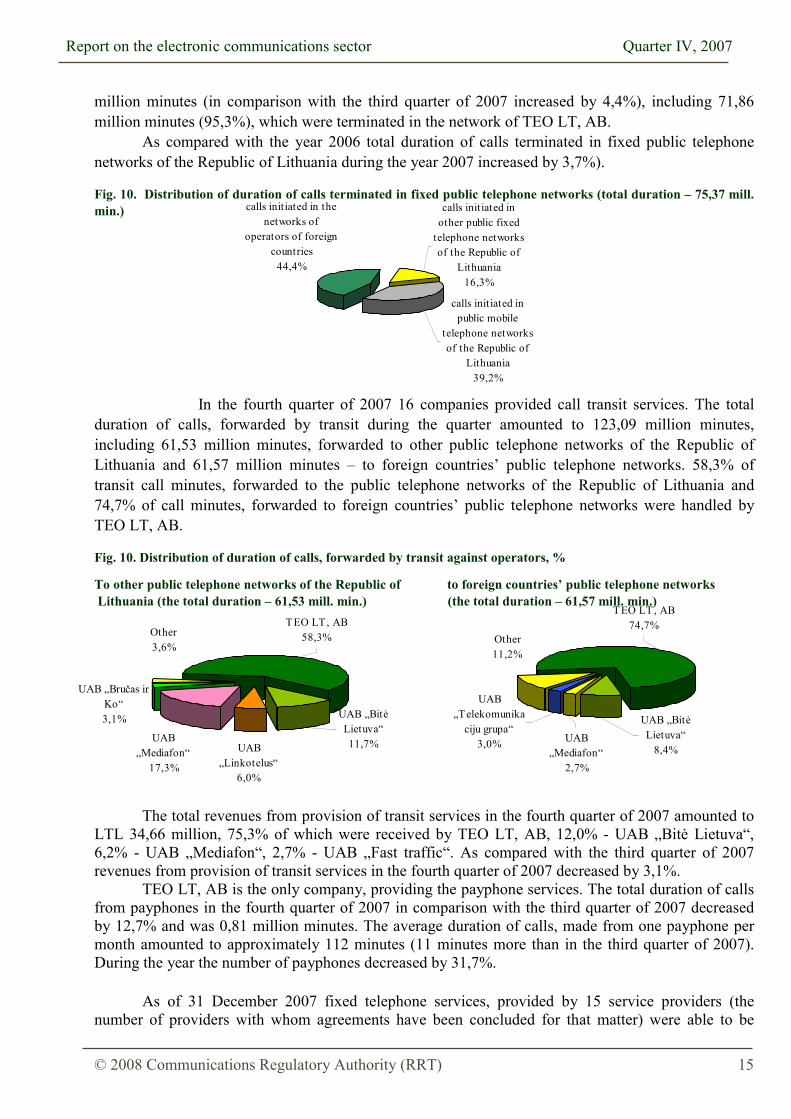
million minutes (in comparison with the third quarter of 2007 increased by 4,4%), including 71,86 million minutes (95,3%), which were terminated in the network of TEO LT, AB.
As compared with the year 2006 total duration of calls terminated in fixed public telephone networks of the Republic of Lithuania during the year 2007 increased by 3,7%). Fig. 10. Distribution of duration of calls terminated in fixed public telephone networks (total duration � 75,37 mill. min.)
In the fourth quarter of 2007 16 companies provided call transit services. The total
duration of calls, forwarded by transit during the quarter amounted to 123,09 million minutes, including 61,53 million minutes, forwarded to other public telephone networks of the Republic of Lithuania and 61,57 million minutes � to foreign countries� public telephone networks. 58,3% of transit call minutes, forwarded to the public telephone networks of the Republic of Lithuania and 74,7% of call minutes, forwarded to foreign countries� public telephone networks were handled by TEO LT, AB.
Fig. 10. Distribution of duration of calls, forwarded by transit against operators, %
To other public telephone networks of the Republic of to foreign countries� public telephone networks Lithuania (the total duration � 61,53 mill. min.) (the total duration � 61,57 mill. min.)
The total revenues from provision of transit services in the fourth quarter of 2007 amounted to
LTL 34,66 million, 75,3% of which were received by TEO LT, AB, 12,0% - UAB �Bitė Lietuva�, 6,2% - UAB �Mediafon�, 2,7% - UAB �Fast traffic�. As compared with the third quarter of 2007 revenues from provision of transit services in the fourth quarter of 2007 decreased by 3,1%.
TEO LT, AB is the only company, providing the payphone services. The total duration of calls from payphones in the fourth quarter of 2007 in comparison with the third quarter of 2007 decreased by 12,7% and was 0,81 million minutes. The average duration of calls, made from one payphone per month amounted to approximately 112 minutes (11 minutes more than in the third quarter of 2007). During the year the number of payphones decreased by 31,7%.
As of 31 December 2007 fixed telephone services, provided by 15 service providers (the
number of providers with whom agreements have been concluded for that matter) were able to be
calls initiated in other public fixed
telephone networks of the Republic of
Lithuania 16,3%
calls initiated in the networks of
operators of foreign countries
44,4%
calls initiated in public mobile
telephone networks of the Republic of
Lithuania39,2%
TEO LT, AB58,3%
UAB �Mediafon�
17,3%
UAB �Bručas ir Ko�3,1%
Other3,6%
UAB �Linkotelus�
6,0%
UAB �Bitė Lietuva� 11,7%
TEO LT, AB74,7%
UAB �Telekomunika
ciju grupa�3,0%
Other11,2%
UAB �Mediafon�
2,7%
UAB �Bitė Lietuva�
8,4%

Report on the electronic communications sector Quarter IV, 2007
© 2008 Communications Regulatory Authority (RRT) 16
0,44
0,86
0,53
1,37
0,00
0,30
0,60
0,90
1,20
1,50
Price of 3 min call, peak Price of 3 min call, off-peak
“Calls to other fixed telephone communication networks” payment plan Standart tariff calls to other fixed networks
Subscription fee for 1 phone number
23,0025,36
“Calls to other fixedtelephone
communicationnetworks” payment
plan
Standart tariff callsto other fixed
networks
selected in the network of TEO LT, AB by individual selection (by dialling the operator code 10XX), from them 6 � and by carrier pre-selection (the possibility to use the provider�s services automatically, i. e. without dialling the operator code and without executing any other carrier selection procedure when calling). In reality 10 service providers provided public fixed telephone services by using the individual selection, including UAB �Eurocom�, UAB �Cubio�, UAB �Linkotelus� � and carrier pre-selection.
During the fourth quarter of 2007 about 18,99 thousand users made use of this service (3,6% less than during the previous quarter), 5,2 thousand of them � by means of pre-selection. The total duration of calls, initiated in the fourth quarter of 2007 decreased by 2,8%, compared with third quarter of 2007, and amounted to 5,38 million minutes, including 2,86 million minutes by pre-selection initiated calls.
Until the end of the fourth quarter of 2007 were assigned 24 operator selection codes 10XX to 22 providers of services (during the fourth quarter was assigned 1 operator selection code).
Until 31 December 2007 9013 subscribers had their numbers transferred to other networks by using the fixed telephone number portability service, during the quarter this number increased by 9,0%. During the fourth quarter were transferred 744 telephone numbers: to UAB �Mediafon� � 370 numbers (from UAB �Mediafon� - 6), accordingly to UAB �Nacionalinis telekomunikacijų tinklas� � 224 (1), UAB �CSC Telecom� � 75 (3), UAB �Eurocom� � 25 (20), AB Lietuvos radijos ir televizijos centras � 19 (4), TEO LT, AB � 16 (709), UAB �Telekomunikaciju grupa� � 10 (0), UAB �Tele2� � 3 (0), UAB �Interneto pasaulis� � 2 (1). Prices of fixed telephone calls
In the fourth quarter of 2007 TEO LT, AB, the company, holding significant power on the market of public local and/or national telephone communications services, provided to consumers and service recipients, except users, at a fixed location and the market of public international telephone communication services, provided to consumers and service recipients, except users at a fixed location offered 18 (in the 3rd Quarter of 2007 � 17) retail payment plans for private and business consumers. 12 November 2007 the tariffs and conditions for provision of the �Pokalbiai į kitus fiksuoto telefono ry�io tinklus�(�Calls to other fixed telephone communication networks�) payment plan were approved.
Figure 12. Prices of calls to other fixed telephone networks from TEO LT, AB fixed telephone network, as for December 31st, 2007, LTL w. the VAT
Note: Peak � 8 am. � 8 pm. on workdays, Off-peak � 8 pm. � 8 am. on workdays, 24 h. on weekends and holidays.
Till the end of the fourth quarter of 2007 TEO LT, AB concluded 11 networks� interconnection agreements with providers of public fixed telephone networks, thus the subscribers of those networks
9 - according to the data provided by TEO LT, AB

Report on the electronic communications sector Quarter IV, 2007
© 2008 Communications Regulatory Authority (RRT) 17
were given the possibility to make calls to the network of TEO LT, AB and the subscribers of TEO LT, AB were given the possibility to make calls to the networks of the said providers.
Other providers of public fixed telephone services (according to the data, provided to the RRT) did not execute any changes in the prices of the calls inside their networks and to other networks in the fourth quarter of 2007. The average prices of fixed telephone calls
The information on the average prices of installation of a telephone line and public fixed telephone services, applicable to service recipients is presented below. In all the figures, presented in the present chapter (Figures 13 - 19) the lowest and highest prices, offered on the market in the fourth quarter of 2007, as well as the average prices, calculated on the basis of all the data for the aforementioned period, presented to the Communications Regulatory Authority are presented.
Figure 13 presents the comparison of the charges for installation of a new telephone line, change of subscription to a line and monthly charges for a telephone line.
According to the data, submitted by providers of public fixed telephone services, in the fourth Quarter of 2007 the average price of installation of a new fixed telephone line reduced by 4,57% comparing with the third quarter of 2007, although the highest and lowest prices applicable did not change. Comparing the average prices of installation of a new telephone line, applicable in the fourth quarter of 2007 with the corresponding period of 2006, the prices increased by 24,4%; which is also related with the fact that certain new service providers set a larger price for the service upon their accession to the fixed telephone communication market.
The average price for changing of subscription to a line reduced insignificantly � by LTL 1,11 (4,4%) during the quarter, the average price of the monthly charge for the used telephone line, comparing with the third quarter of 2007 reduced by 16,3% and amounted to LTL 34,13.
Figure 13. Comparison of the fees for installation of a new line, changing of the subscription to a line and monthly
subscription fees for a telephone line, charged by public fixed telephone service providers, LTL w. the VAT
In the fourth quarter of 2007 18 providers presented information on the fixed telephone line installation service, 9 providers � on the service of changing of subscription to a line, 17 providers � on the monthly charge for a telephone line service.
35,0725,22
34,26 40,77
24,1134,13
105,57
25,22
104,08
115,38110,10
26,7112,00 12,00
10,0012,00 5,001,181,18
10,00 10,001,18 1,18
10,00
309,40309,40 309,40309,40
39,00
373,18373,18
39,00 39,00
373,18
39,00
373,18
0,00
74,00
148,00
222,00
296,00
370,00
2007 I 2007 II 2007 III 2007IV
2007 I 2007 II 2007 III 2007IV
2007 I 2007 II 2007 III 2007IV
New line installation fee Change of subscription to an existingline
Line subscription fee
Average price, LTL w . the VAT Bottom price, LTL w . the VAT Top price, LTL w . the VAT

Report on the electronic communications sector Quarter IV, 2007
© 2008 Communications Regulatory Authority (RRT) 18
Figure 14 presents the comparisons of the prices of local and national long-distance calls (during the peak and off-peak hours), without the call setup charge.
During the fourth quarter of 2007 the average price of a fixed telephone communication local call during the peak hours increased from LTL 0,15 to LTL 0,17, however, comparing with the first quarter of 2007, the average price of a fixed telephone local call reduced by approximately 15% (LTL 0,03 per minute). As the lowest price of a minute of a local call, offered on the market did not change, the change of the highest price, calculating from the beginning of the calendar year is rather significant (the price reduced by LTL 0,39 per minute).
During the fourth quarter of 2007 the average price of the peak and off-peak hour national long-distance calls, as well as the highest and the lowest price, offered on the market did not change (see Figure 14). Figure 14. Comparison of prices of local and national long-distance calls, provided by public fixed telephone service providers (peak* and off-peak** time), LTL w. the VAT Peak* - a period when the highest applicable price applied by the provider. Off-peak** - a period when the lowest applicable price applied by the provider.
Price for 1 call minute, peak
0,120,20
0,15 0,15 0,17 0,20 0,19
0,88
0,49 0,49 0,49 0,49 0,49 0,49 0,49
0,06 0,06 0,06 0,060,120,12 0,12
0,190,18
0,00
0,30
0,60
0,90
2007 I 2007 II 2007 III 2007 IV 2007 I 2007 II 2007 III 2007 IV
Local call National call
Bottom price, LTL w . the VAT Average price, LTL w . the VAT Top price, LTL w . the VAT
Price for 1 call minute, off-peak
0,02 0,02 0,020,07
0,100,13 0,13 0,14
0,17 0,15 0,15
0,26
0,49 0,49 0,49 0,49 0,49 0,49 0,49
0,070,070,070,02
0,15
0,00
0,10
0,20
0,30
0,40
0,50
0,60
2007 I 2007 II 2007 III 2007 IV 2007 I 2007 II 2007 III 2007 IV
Local call National call
Bottom price, LTL w . the VAT Average price, LTL w . the VAT Top price, LTL w . the VAT

Report on the electronic communications sector Quarter IV, 2007
© 2008 Communications Regulatory Authority (RRT) 19
If viewing the dynamics of the prices of local and national long-distance calls, offered to fixed telephone service recipients (see Figure 15), it can be noticed that the prices of the services were consistently reducing. Starting from the end of 2005 the average price of a local call made during peak hours reduced by 51,4%, the price of an off-peak hour call � by 63%. During the same time period the average price of a national long-distance call reduced correspondingly by 50% and 59,4%.
The information on the prices of fixed telephone local and national long-distance calls, offered at the end of the fourth quarter of 2007 was provided by 13 service providers. Figure 15. Comparison of prices of local and national long-distance calls, provided by public fixed telephone service providers (peak* and off-peak** time), year 2005 � 2007, LTL w. the VAT
Price for 1 call minute, peak
1,18
0,88
0,49
1,18
0,570,49
0,060,060,060,14 0,12 0,12
0,380,35
0,230,17
0,230,19
0,00
0,20
0,40
0,60
0,80
1,00
1,20
1,40
2005 IV 2006 IV 2007 IV 2005 IV 2006 IV 2007 IV
Local call National call
Bottom price, LTL w . the VATTop price, LTL w . the VATAverage price, LTL w . the VAT
Price for 1 call minute, off-peak
0,02
1,18
0,570,49
1,18
0,570,49
0,070,070,070,020,02
0,38 0,37
0,150,190,140,13
0,00
0,20
0,40
0,60
0,80
1,00
1,20
1,40
2005 IV 2006 IV 2007 IV 2005 IV 2006 IV 2007 IV
Local call National call
Bottom price, LTL w . the VAT Top price, LTL w . the VATAverage price, LTL w . the VAT
Peak* - a period when the highest applicable price applied by the provider. Off-peak** - a period when the lowest applicable price applied by the provider.

Report on the electronic communications sector Quarter IV, 2007
© 2008 Communications Regulatory Authority (RRT) 20
During the fourth quarter of 2007 the average charges for setup of local and national long-distance calls, offered by public fixed telephone service providers did not change.
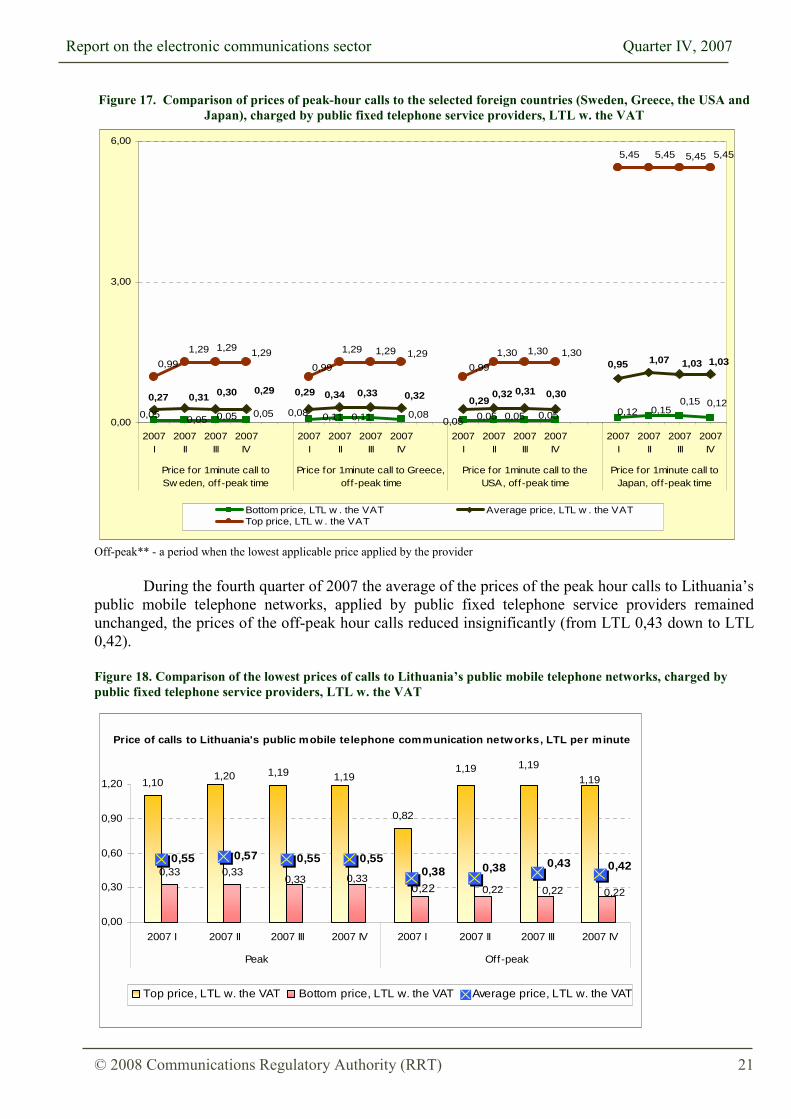
Figures 16 - 17 present the comparison of the prices of international calls to the selected foreign countries (Sweden, Greece, the USA and Japan), offered by public fixed telephone service providers.
During the fourth quarter of 2007 the average prices per minute of the calls to all the selected foreign countries during the peak and off-peak hours changed insignificantly, within the limits of 5% (from 0% for calls to the USA to 5% for calls to the EU Member States). Such fluctuation of the average market price resulted from the changes of the prices, applicable by individual service providers.
At the end of the fourth quarter the average price of peak hour fixed telephone communication calls to a close European Union Member State � Sweden amounted to LTL 0,32, to Greece, the USA and Japan � correspondingly LTL 0,34, LTL 0,33 and LTL 1,11, the average price of off-peak hour calls was insignificantly lower (LTL 0,29 for calls to Sweden, LTL 0,32 � to Greece, LTL 0,30 � to the USA and LTL 1,03 � to Japan).
The information on the prices of international calls, valid at the end of the fourth quarter of 2007 was presented to the Communications Regulatory Authority by 32 fixed telephone operators and service providers.
Figure 16. Comparison of prices of peak-hour international calls to the selected foreign countries (Sweden, Greece, the USA and Japan), charged by public fixed telephone service providers (excluding the call setup fee), LTL w. the
VAT
0,11 0,110,05 0,050,050,100,100,05 0,05 0,150,050,050,15 0,15 0,15
0,05
0,310,33 0,320,30 0,330,330,33 0,32 0,36 0,340,36 0,34
1,021,15 1,13 1,111,39 1,39 1,391,391,391,391,39 1,39
7,79
1,39 1,39 1,39
7,79 7,79 7,79
1,39
0,00
3,70
7,40
2007I
2007II
2007III
2007IV
2007I
2007II
2007III
2007IV
2007I
2007II
2007III
2007IV
2007I
2007II
2007III
2007IV
Price for 1minute call to Sw eden,peak time
Price for 1 minute call to Greece,peak time
Price for 1 minute call to USA,peak time
Price for 1 minute call toJapan, peak time
Bottom price, LTL w . the VAT Average price, LTL w . the VATTop price, LTL w . the VAT
Peak* - a period when the highest applicable price applied by the provider.
Report on the electronic communications sector Quarter IV, 2007
© 2008 Communications Regulatory Authority (RRT) 21
Figure 17. Comparison of prices of peak-hour calls to the selected foreign countries (Sweden, Greece, the USA and Japan), charged by public fixed telephone service providers, LTL w. the VAT
Off-peak** - a period when the lowest applicable price applied by the provider
During the fourth quarter of 2007 the average of the prices of the peak hour calls to Lithuania�s public mobile telephone networks, applied by public fixed telephone service providers remained unchanged, the prices of the off-peak hour calls reduced insignificantly (from LTL 0,43 down to LTL 0,42). Figure 18. Comparison of the lowest prices of calls to Lithuania�s public mobile telephone networks, charged by public fixed telephone service providers, LTL w. the VAT
0,05 0,120,050,080,050,05 0,080,05 0,050,110,11
0,150,15 0,12
0,05 0,05
0,95 1,07 1,03 1,03
0,29 0,320,330,340,27 0,310,290,30
0,290,32 0,31 0,30
5,45 5,45 5,45 5,45
0,991,29 1,29 1,29
0,99
1,29 1,29 1,290,99
1,30 1,30 1,30
0,00
3,00
6,00
2007I
2007II
2007III
2007IV
2007I
2007II
2007III
2007IV
2007I
2007II
2007III
2007IV
2007I
2007II
2007III
2007IV
Price for 1minute call toSw eden, off -peak time
Price for 1minute call to Greece,off-peak time
Price for 1minute call to theUSA, off-peak time
Price for 1minute call toJapan, off-peak time
Bottom price, LTL w . the VAT Average price, LTL w . the VATTop price, LTL w . the VAT
1,101,19
0,82
0,33 0,33
1,191,20 1,191,191,19
0,330,330,22 0,22 0,22 0,22
0,55 0,57 0,55 0,550,38 0,38 0,43 0,42
0,00
0,30
0,60
0,90
1,20
2007 I 2007 II 2007 III 2007 IV 2007 I 2007 II 2007 III 2007 IV
Peak Off-peak
Price of calls to Lithuania's public mobile telephone communication networks, LTL per minute
Top price, LTL w. the VAT Bottom price, LTL w. the VAT Average price, LTL w. the VAT

Report on the electronic communications sector Quarter IV, 2007
© 2008 Communications Regulatory Authority (RRT) 22
As shown by Figure 19, the average price of the call, made from a public fixed telephone network to Lithuania�s public mobile telephone networks during peak hours, comparing with the data as of the corresponding period of 2006 remained unchanged, however comparing with the fourth quarter of 2005 � reduced by 7%. The dynamics of the price of the service as of the off-peak hours was inconsistent � from the end of 2005 till the end of 2006 the price reduced by 17,4%, however upon accession of new service providers to the market, the average price of calls slightly increased. Figure 19. Comparison of the lowest prices of calls to Lithuania�s public mobile telephone networks, charged by public fixed telephone service providers, year 2005-2007, LTL w. the VAT.
0,30 0,33 0,33
1,181,10
1,19
0,550,550,59
0,00
0,20
0,40
0,60
0,80
1,00
1,20
1,40
2005 IV 2006 IV 2007 IV
Price of calls to Lithuania’s public mobiletelephone communications networks, LTL per
minute, peak
Bottom price, LTL w. the VATTop price, LTL w. the VATAverage price, LTL w. the VAT
0,24
1,18
0,82
1,19
0,220,22 0,380,42
0,46
0,00
0,20
0,40
0,60
0,80
1,00
1,20
1,40
2005 IV 2006 IV 2007 IV
Price of calls to Lithuania’s public mobiletelephone communications networks, LTL per
minute, off- peak
Bottom price, LTL w. the VATTop price, LTL w. the VATAverage price, LTL w. the VAT

Report on the electronic communications sector Quarter IV, 2007
© 2008 Communications Regulatory Authority (RRT) 23
4. Mobile Telephony 8 undertakings carried out the activities of mobile public telephony in the fourth quarter of
2007: 3 operators (UAB �Omnitel�, UAB �Bitė Lietuva�, UAB �Tele2�) and 5 providers of services that did not own network (hereinafter referred to as the Service providers) (UAB �Eurocom�, UAB �Laracijos telekomunikacijos�, UAB �Teledema�, UAB �Norfos ma�mena� and UAB �CSC Telecom�) that provided services though the network of UAB �Bitė Lietuva�.
5 undertakings (UAB �Auto�vilgsnis�, UAB �Mobilus partneris�, UAB �Metameda� ir ko, UAB �Transteleservis�, UAB �AKN�) carried out the activities as resellers.
Table 3. Summarised indicators of the mobile public telephone activity
Name of indicator Quarter IV of 2007
Quarter III of 2007
Change in comparison
IIIQ, % 2006 2007
Change in comparison 2007 with 2006, %
1. Number of active mobile telephone communication subscribers
4.921.077 4.889.512 0,65 4.718.215 4.921.077 4,30
including: - consumers, who pay for the services against the bills
1.056.634 1.042.332 1,37 1.004.507 1.056.634 5,19
- business subscribers, who pay for the services against the bills
604.154 597.324 1,14 553.590 604.154 9,13
- subscribers who make use of the prepaid service
3.260.289 3.249.856 0,32 3.160.118 3.260.289 3,17
2. The number of short messages (SMS) forwarded, in units
2.394.182.987 2.164.856.797 10,59 9.033.571.709 9.373.312.686 3,76
3. The number of multimedia messages (MMS) forwarded, in units
1.585.456 1.582.761 0,17 4.019.612 5.765.333 43,43
4. The number of subscribers, who make use of the data transmission services (GPRS and/or EDGE and/or UMTS), provided by public mobile telephone network, units
1.532.114 1.385.529 10,58 1.153.479 1.532.114 32,83
5. The number of subscribers who make use of the data transmission services (CSD and/or HSCSD) provided by the public mobile telephone networks, units
14.012 17.845 -21,48 44.731 14.012 -68,67
6. Volume of data forwarded and received by using the packet data services (GPRS and EDGE and/or UMTS), provided by mobile telephone network, megabytes:
141.096.569 89.341.994 57,93 171.607.541 356.594.407 107,80
- including the volume of received data
116.503.335 74.716.041 55,93 139.640.613 293.852.092 110,43
7. The total duration of calls, initiated in the own network, min.:
1.249.926.479 1.236.805.602 1,06 3.776.706.952 4.606.471.770 21,97
including: - the calls, terminated in the own network
925.715.520 908.873.523 1,85 2.741.554.087 3.372.534.597 23,02
- the calls to other public mobile telephone networks of the Republic of Lithuania
276.838.708 280.332.022 -1,25 870.351.770 1.050.959.572 20,75
- the calls to public fixed telephone networks of the Republic of Lithuania
28.300.329 27.999.846 1,07 104.490.152 110.676.880 5,92
- international calls 19.071.922 19.597.512 -2,68 60.310.943 72.298.023 19,888. The duration of calls, terminated in the own network, total, min:
331.381.373 336.893.910 -1,64 1.107.591.106 1.284.202.308 15,95

Report on the electronic communications sector Quarter IV, 2007
© 2008 Communications Regulatory Authority (RRT) 24
Name of indicator Quarter IV of 2007
Quarter III of 2007
Change in comparison
IIIQ, % 2006 2007
Change in comparison 2007 with 2006, %
including: - from public fixed telephone networks of the Republic of Lithuania
18.134.939 19.090.929 -5,01 78.614.528 75.744.563 -3,65
- from other public mobile telephone networks of the Republic of Lithuania
268.597.080 270.734.099 -0,79 858.683.083 1.030.120.504 19,97
- from the networks of foreign countries
44.649.354 47.068.882 -5,14 170.293.495 178.337.241 4,72
9. Duration of calls of the subscribers who make use of roaming services, min.:
12.277.572 12.403.305 -1,01 36.533.316 44.595.675 22,07
including: - duration of calls when calls are initiated by the subscribers who have left for foreign countries
5.770.474 6.137.319 -5,98 18.895.950 22.117.739 17,05
- duration of calls when calls are received by the subscribers who have left for foreign countries
6.507.098 6.265.986 3,85 17.637.366 22.477.936 27,44
10. Duration of calls of the subscribers of providers of foreign public mobile telephone services, who have arrived in the Republic of Lithuania and who make use of roaming services, min.:
7.967.312 10.559.154 -24,55 26.682.394 33.465.031 25,42
including: - duration of calls when calls are initiated by the subscribers of foreign public mobile telephone services, who have arrived in the Republic of Lithuania
3.990.642 4.790.937 -16,70 13.020.021 15.595.534 19,78
- duration of calls when calls are received by the subscribers of providers of foreign public mobile telephone services who have arrived in the Republic of Lithuania
3.976.670 5.768.217 -31,06 13.662.373 17.869.497 30,79
11 The revenues from provision of retail public mobile telephone network and/or services, thou. Litas (excluding the VAT):
310.203 321.219 -3,43 1.110.721 1.236.900 11,36
from: - consumers, who pay for the services against the bills
118.214 121.759 -2,91 - 472.598 -
- business subscribers, who pay for the services against the bills
120.213 118.011 1,87 - 456.964 -
- subscribers who make use of the prepaid service
71.776 81.449 -11,88 - 307.338 -
including: -the revenues, received for voice calls, including video calls
235.634 247.571 -4,82 - 952.407 -
- the revenues received for the forwarded SMS
35.125 35.621 -1,39 - 143.070 -
- the revenues, received for the forwarded MMS
385 390 -1,33 - 1.336 -
- the revenues received for the data transmission services, (using GPRS and/or EDGE and/or UMTS)
9.034 8.883 1,70 - 35.021 -
- other revenues 30.025 28.755 4,42 - 105.067 - 12. The revenues, received from calls, made by subscribers using roaming services, thou. Litas (excluding VAT):
27.160 32.996 -17,69 105.349 119.098 13,05

Report on the electronic communications sector Quarter IV, 2007
© 2008 Communications Regulatory Authority (RRT) 25
Name of indicator Quarter IV of 2007
Quarter III of 2007
Change in comparison
IIIQ, % 2006 2007
Change in comparison 2007 with 2006, %
from: - consumers, who pay for the services against the bills
6.389 9.029 -29,23 25.278 29.315 15,97
- business subscribers, who pay for the services against the bills
20.498 23.523 -12,86 80.071 88.668 10,74
- subscribers who make use of the prepaid service
273 444 -38,58 0 1.115
13. The revenues, received from foreign countries� public mobile telephone service providers for the calls, made by their subscribers who visit the Republic of Lithuania and use roaming services, thou. Litas (excluding the VAT)
12.475 18.456 -32,41 70.704 61.594 -12,88
14. The revenues from wholesale public mobile telephone network and/or service provision, thou. Litas (excluding VAT) (the item does not cover the revenues from networks interconnection activities)
7.345 7.577 -3,06 21.800 31.253 43,36
15. Revenues from the networks interconnection activity, in thou. Litas (excluding VAT)
117.778 116.065 1,48 393.028 446.415 13,58
including: - the revenues for termination of calls, initiated in public telephone networks of the Republic of Lithuania in the own network
95.525 96.901 -1,42 321.189 368.829 14,83
- the revenues for termination of calls, initiated in foreign networks in the own network
15.652 16.683 -6,18 60.770 63.153 3,92
In the fourth quarter of 2007 total revenue from the provision of public mobile telephone networks and services constituted LTL 344,71 million, revenue of Service providers were LTL 11,65 million. Out of the total revenues 77,07% were those received from provision of voice services, 10,19% were the revenues, received for the forwarded SMS, 0,11% � the revenues, received for the forwarded MMS, 2,62% - the revenues received for usage of data transmission services (GPRS, EDGE, UMTS), 7,88% � the revenues, received for calls from the subscribers, using the roaming services, 2,13% � the revenues from provision of wholesale public mobile telephone network and services.
In comparison with third quarter of 2007 total revenue decreased by 4,7%, revenue of Service providers decreased by 2,4%. In comparison with the year 2006 mobile telephone market in the year 2007 increased by 12,1%.
Fig. 20. Market shares of mobile fixed public telephone operators and providers of services by revenue, in % (total revenue � LTL 344,71 mill.)
Other Service providers1,18%
UAB "Eurocom"2,20%
UAB "Bitė Lietuva"28,75%
UAB "Omnitel"44,30%
UAB "Tele2"23,57%
Report on the electronic communications sector Quarter IV, 2007
© 2008 Communications Regulatory Authority (RRT) 26
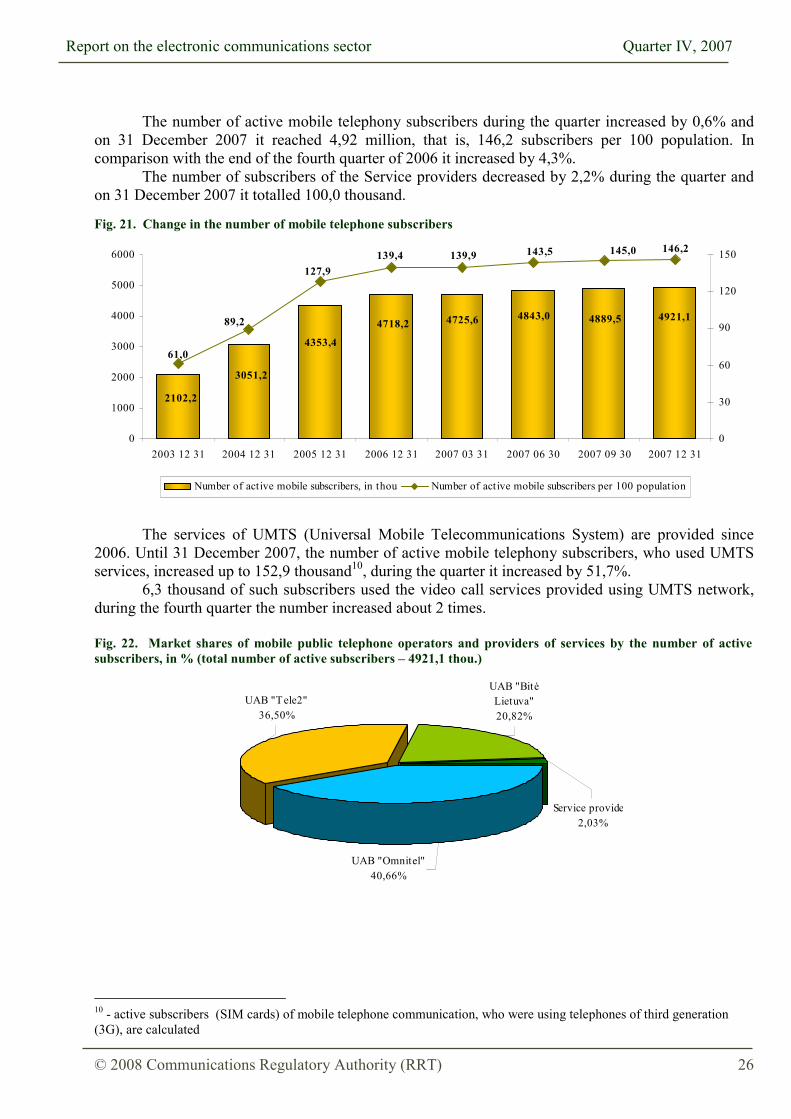
The number of active mobile telephony subscribers during the quarter increased by 0,6% and
on 31 December 2007 it reached 4,92 million, that is, 146,2 subscribers per 100 population. In comparison with the end of the fourth quarter of 2006 it increased by 4,3%.
The number of subscribers of the Service providers decreased by 2,2% during the quarter and on 31 December 2007 it totalled 100,0 thousand.
Fig. 21. Change in the number of mobile telephone subscribers
The services of UMTS (Universal Mobile Telecommunications System) are provided since
2006. Until 31 December 2007, the number of active mobile telephony subscribers, who used UMTS services, increased up to 152,9 thousand10, during the quarter it increased by 51,7%.
6,3 thousand of such subscribers used the video call services provided using UMTS network, during the fourth quarter the number increased about 2 times.
Fig. 22. Market shares of mobile public telephone operators and providers of services by the number of active subscribers, in % (total number of active subscribers � 4921,1 thou.)
10 - active subscribers (SIM cards) of mobile telephone communication, who were using telephones of third generation (3G), are calculated
4921,14889,54843,04718,2
4353,4
3051,2
2102,2
4725,6
146,2145,0143,5139,9139,4127,9
89,2
61,0
0
1000
2000
3000
4000
5000
6000
2003 12 31 2004 12 31 2005 12 31 2006 12 31 2007 03 31 2007 06 30 2007 09 30 2007 12 310
30
60
90
120
150
Number of active mobile subscribers, in thou Number of active mobile subscribers per 100 population
UAB "Tele2"36,50%
Service provide2,03%
UAB "Bitė Lietuva"20,82%
UAB "Omnitel"40,66%
Report on the electronic communications sector Quarter IV, 2007
© 2008 Communications Regulatory Authority (RRT) 27
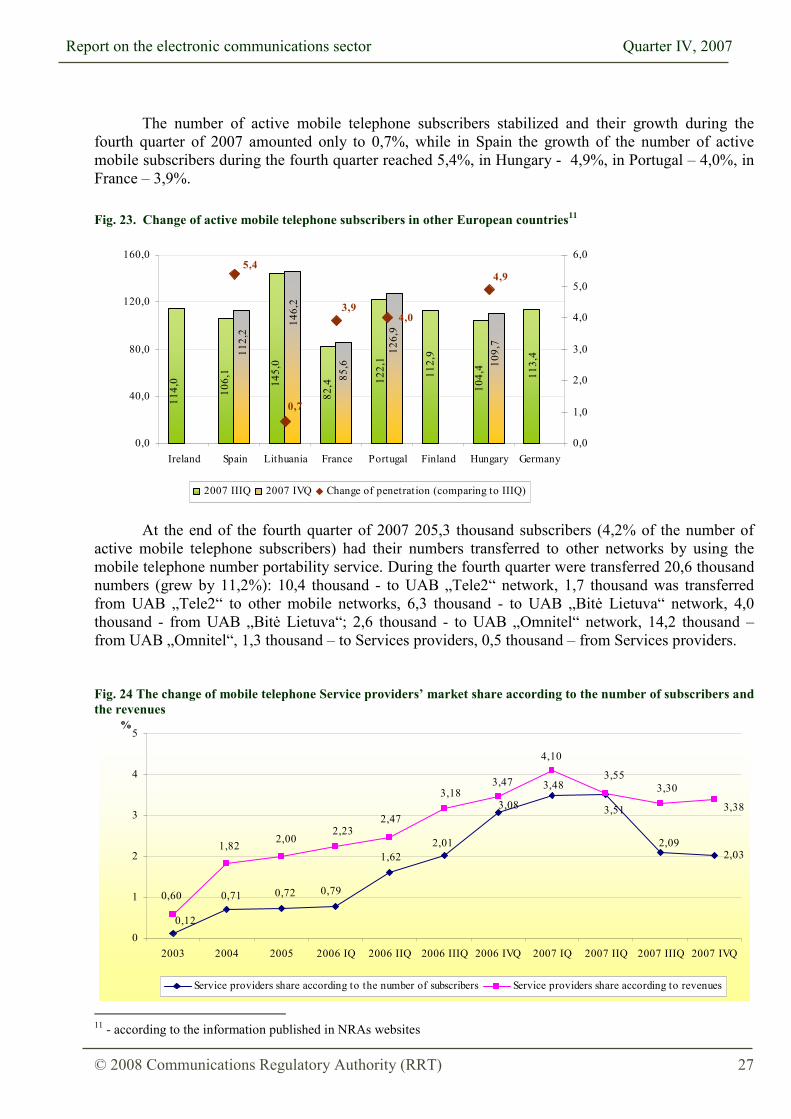
The number of active mobile telephone subscribers stabilized and their growth during the
fourth quarter of 2007 amounted only to 0,7%, while in Spain the growth of the number of active mobile subscribers during the fourth quarter reached 5,4%, in Hungary - 4,9%, in Portugal � 4,0%, in France � 3,9%.
Fig. 23. Change of active mobile telephone subscribers in other European countries11 At the end of the fourth quarter of 2007 205,3 thousand subscribers (4,2% of the number of
active mobile telephone subscribers) had their numbers transferred to other networks by using the mobile telephone number portability service. During the fourth quarter were transferred 20,6 thousand numbers (grew by 11,2%): 10,4 thousand - to UAB �Tele2� network, 1,7 thousand was transferred from UAB �Tele2� to other mobile networks, 6,3 thousand - to UAB �Bitė Lietuva� network, 4,0 thousand - from UAB �Bitė Lietuva�; 2,6 thousand - to UAB �Omnitel� network, 14,2 thousand � from UAB �Omnitel�, 1,3 thousand � to Services providers, 0,5 thousand � from Services providers.
Fig. 24 The change of mobile telephone Service providers� market share according to the number of subscribers and the revenues
11 - according to the information published in NRAs websites
113,
4
104,
4112,
9
122,
1
82,414
5,0
106,
1
114,
0
126,
9
109,
7
85,6
146,
2
112,
2
4,0
4,9
3,9
0,7
5,4
0,0
40,0
80,0
120,0
160,0
Ireland Spain Lithuania France Portugal Finland Hungary Germany0,0
1,0
2,0
3,0
4,0
5,0
6,0
2007 IIIQ 2007 IVQ Change of penetration (comparing to IIIQ)
2,031,622,01
3,48
3,51
0,71 0,72 0,79
3,08
2,09
0,12
1,82 2,002,23
2,47
3,183,47
4,10
3,553,30
0,60
3,38
0
1
2
3
4
5
2003 2004 2005 2006 IQ 2006 IIQ 2006 IIIQ 2006 IVQ 2007 IQ 2007 IIQ 2007 IIIQ 2007 IVQ
%
Service providers share according to the number of subscribers Service providers share according to revenues

Report on the electronic communications sector Quarter IV, 2007
© 2008 Communications Regulatory Authority (RRT) 28
Fig. 25. Market shares of mobile public telephone operators and providers of services by the number of active subscribers in different categories by consumers (paying against the bills): by business subscribers (paying against the bills): (total � 1056,6 thou.) (total number � 604,2 thou.) by pre-paid subscribers: (total number � 3260,3 thou.)
At the end of the fourth quarter of 2007 all subscribers of mobile telephone communication by categories were distributed as follows: 33,8% of subscribers who paid for the services against the bills, included 21,5% of consumers and 12,3% business subscribers, 66,2% of pre-paid subscribers. The common distribution of subscribers according to their categories has been almost changeless for several years, only the distribution according to the categories of each specific operator has been changing: share of the number of UAB �Omnitel� subscribers who paid for the services against the bills (from all active UAB �Omnitel� subscribers) at the end of the fourth quarter was 36,3% (during the year it decreased by 7,5 per cent), accordingly UAB �Bitė Lietuva� � 42,5% (during the year it increased by 9,6 per cent), UAB �Tele2� � 24,3% (during the year it increased by 1,4 per cent).
For the sake of comparison, according to the information, announced by national regulators, the number of subscribers, who have chosen the pre-paid services in Portugal as of the end of the fourth quarter of 2007 amounted to 76,7% of the total number of mobile telephone subscribers, accordingly in Hungary � 62,4%, in Spain � 41,4%, in France � 34,4%. Fig 26. Share of the number of mobile telephone pre- paid subscribers from the total mobile subscribers� number, %
UAB "Omnitel"42,4%
UAB "Tele2"34,2%
UAB "Bitė Lietuva"19,2%
Service providers
4,2%
UAB "Omnitel"46,2%
Service providers2,9%
UAB "Bitė Lietuva"38,4%
UAB "Tele2"12,4%
UAB "Omnitel"39,1%
UAB "Tele2"41,7%
UAB "Bitė Lietuva"18,1%
Service providers1,18%
76,766,0 62,4
41,434,4
0,0
20,0
40,0
60,0
80,0
100,0
Portugal Lithuania Hungary Spain France

Report on the electronic communications sector Quarter IV, 2007
© 2008 Communications Regulatory Authority (RRT) 29
Fig.27. Change in the number of subscribers in different categories (in thou.)
The number of the active subscribers, which use the pre-paid services in the fourth quarter of
2007 increased by 0,3% (during the year it increased by 3,2%), the number of subscribers, paying for the services against the bills: the number of consumers increased by 1,4% (during the year it increased by 5,2%), the number of business subscribers increased by 1,1% (during the year it increased 9,1%).
Fig 28. Change in the number of subscribers of mobile public telephone operators and Service providers in different categories (in thou.)
105710421015647 763 854 889 972 985 1005 1013
604597585553 482 462 467 494 522 554 568
326032503243
9021331
1737
2169
2888 29033160 3144
0
500
1000
1500
2000
2500
3000
3500
2003 1231
2004 0630
2004 1231
2005 0630
2005 1231
2006 0630
2006 1231
2007 0331
2007 0630
2007 0930
2007 1231
Consumers Business subscribers Pre-paid
362
448
304
389
450474
514 499 490 473458 457
203
134109 121 136
162 175 183 188 192 200207260
273 269 280 289 304 317 326 344
442 5 9 10 16 22 27 35 39 42
0
100
200
300
400
500
600
2003 1231
2004 0630
2004 1231
2005 0630
2005 1231
2006 0630
2006 1231
2007 0331
2007 0630
2007 0930
2007 1231
Con
sum
ers
75
18
279283279
389
299
257 238 243 252 267 270
232226219
149 153 167 176 188 198 208 215
7271
14 18 25 39 48 55 64 68
1716
113 13 14 14 16 15 16
0
100
200
300
400
500
2003 1231
2004 0630
2004 1231
2005 0630
2005 1231
2006 0630
2006 1231
2007 0331
2007 0630
2007 0930
2007 1231
Busin
ess s
ubsc
ribe
rs

Report on the electronic communications sector Quarter IV, 2007
© 2008 Communications Regulatory Authority (RRT) 30
Although the majority of subscribers are those using the pre-payment option the revenue
received from the subscribers of the said category in the fourth quarter of 2007 amounted about 21,4% (LTL 72,05 million, in comparison with previous quarter it decreased by 12,0%). The rest revenues received from subscribers, paying for the services against the bills, including: 36,9% (LTL 124,60 million, in comparison with previous quarter it decreased by 4,7%) revenue received from consumers, 41,7% (LTL 140,71 million, in comparison with previous quarter it decreased by 0,6%) - from business subscribers.
The duration of calls initiated in mobile public telephone networks in the fourth quarter of 2007 in comparison with the previous quarter increased by 1,1% and totalled 1249,93 million minutes: 40,1% in the network of UAB �Omnitel�, 26,5% in the network of UAB �Bitė Lietuva�, 30,5% in the network of UAB �Tele2� and 2,9% by Service providers.
Total duration of calls initiated in mobile public telephone networks in the year 2007 in comparison with the year 2006 increased by 22,0%.
Off the total duration of the calls, originated in public mobile telephone networks in the fourth quarter of 2007 74,1% were the calls inside the own network, 22,1% - the calls to other public mobile telephone networks of the Republic of Lithuania, 2,3% - the calls to public fixed telephone networks of the Republic of Lithuania, 1,5% - international calls. During the fourth quarter of 2007, in comparison with the third quarter of 2007, the duration of the calls inside the own network grew by 1,9%, the calls to public fixed telephone networks of the Republic of Lithuania - by 1,1%,duration of the calls to other public mobile telephone networks of the Republic of Lithuania decreased by 1,2%, international calls - by 2,7%.
127412581133975973
886885
683557
429353
589611681
748797817858
578
420387216
1359133713141308128711661144
897759
515
332
3943115113103
341111000
200
400
600
800
1000
1200
1400
1600
2003 1231
2004 0630
2004 1231
2005 0630
2005 1231
2006 0630
2006 1231
2007 0331
2007 0630
2007 0930
2007 1231
Pre-
paid
Omnitel Bitė Lietuva Tele2 Service providers

Report on the electronic communications sector Quarter IV, 2007
© 2008 Communications Regulatory Authority (RRT) 31
Fig. 29. Distribution of calls initiated in mobile public Fig. 30. Distribution of calls initiated in mobile public telephone networks, which are terminated on-net telephone networks, which are terminated in other (total duration is 925,72 mill. min. ) mobile telephone networks of the Republic of Lithuania
(total duration is 276,84 mill. min.) Fig. 31 Distribution of calls initiated in mobile public Fig. 32. Distribution of calls initiated in mobile public telephone networks, which are terminated in fixed telephone networks, which are terminated in the public telephone networks of the Republic of Lithuania networks of foreign countries
total duration is 28,30 mill. min.) (total duration is 19,07 mill. min.)
The duration of calls, initiated by Lithuania�s mobile telephone subscribers, using roaming
services, in the fourth quarter of 2007 in comparison with the third quarter of 2007 decreased by 6,0% and totalled 5,77 million minutes. Subscribers of public mobile telephone service providers of foreign countries that came to the Republic of Lithuania and used roaming services in the fourth quarter of 2007 initiated 3,99 million minutes of calls, comparing with the third quarter of 2007 the duration of such calls decreased by 16,7%.
The using of roaming services grows in average about 20% annually: in the year 2007 in comparison with the year 2006, the duration of calls, initiated by Lithuania�s mobile telephone subscribers, using roaming services, increased by 17,1%; the duration of calls initiated by subscribers of public mobile telephone service providers of foreign countries increased by 19,8%.
The duration of calls terminated in mobile telephone networks, which were initiated in other
networks, in the fourth quarter of 2007 in comparison with the last quarter decreased by 1,6% and totalled 331,38 million minutes, including 37,5% in the network of UAB �Omnitel�, 30,6% in the network of UAB �Bitė Lietuva�, 31,9% in the network of UAB �Tele2�.
Total duration of calls terminated in mobile telephone networks, which were initiated in other networks in the year 2007 in comparison with the year 2006 increased by 15,9%.
UAB "Tele2"31,9%
UAB "Bitė Lietuva"25,4%
UAB "Omnitel"40,8%
Service providers1,9%
UAB "Tele2"25,3%
UAB "Bitė Lietuva"30,5%
Service providers6,2%
UAB "Omnitel"38,0%
UAB "Tele2"33,0%
UAB "Bitė Lietuva"24,6%
Service providers2,9%
UAB "Omnitel"39,4%
UAB "Tele2"34,9%UAB "Bitė
Lietuva"23,7%
Service providers4,1%
UAB "Omnitel"37,3%
Report on the electronic communications sector Quarter IV, 2007
© 2008 Communications Regulatory Authority (RRT) 32
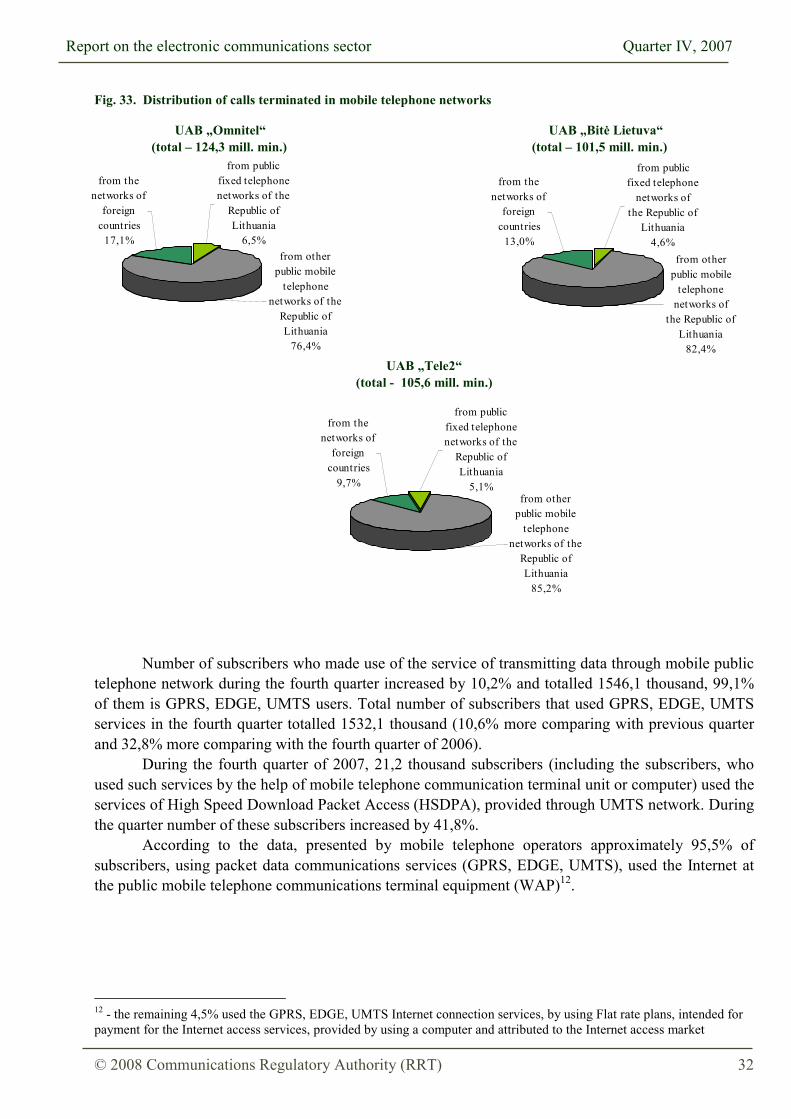
Fig. 33. Distribution of calls terminated in mobile telephone networks
UAB �Omnitel� UAB �Bitė Lietuva� (total � 124,3 mill. min.) (total � 101,5 mill. min.)
UAB �Tele2� (total - 105,6 mill. min.)
Number of subscribers who made use of the service of transmitting data through mobile public
telephone network during the fourth quarter increased by 10,2% and totalled 1546,1 thousand, 99,1% of them is GPRS, EDGE, UMTS users. Total number of subscribers that used GPRS, EDGE, UMTS services in the fourth quarter totalled 1532,1 thousand (10,6% more comparing with previous quarter and 32,8% more comparing with the fourth quarter of 2006).
During the fourth quarter of 2007, 21,2 thousand subscribers (including the subscribers, who used such services by the help of mobile telephone communication terminal unit or computer) used the services of High Speed Download Packet Access (HSDPA), provided through UMTS network. During the quarter number of these subscribers increased by 41,8%.
According to the data, presented by mobile telephone operators approximately 95,5% of subscribers, using packet data communications services (GPRS, EDGE, UMTS), used the Internet at the public mobile telephone communications terminal equipment (WAP)12.
12 - the remaining 4,5% used the GPRS, EDGE, UMTS Internet connection services, by using Flat rate plans, intended for payment for the Internet access services, provided by using a computer and attributed to the Internet access market
from public fixed telephone networks of the
Republic of Lithuania
6,5%
from the networks of
foreign countries
17,1%from other
public mobile telephone
networks of the Republic of Lithuania
76,4%
from other public mobile
telephone networks of
the Republic of Lithuania
82,4%
from the networks of
foreign countries
13,0%
from public fixed telephone
networks of the Republic of
Lithuania4,6%
from public fixed telephone networks of the
Republic of Lithuania
5,1%
from the networks of
foreign countries
9,7%from other
public mobile telephone
networks of the Republic of Lithuania
85,2%

Report on the electronic communications sector Quarter IV, 2007
© 2008 Communications Regulatory Authority (RRT) 33
Fig. 34. Distribution of the number of mobile telephone subscribers, who made use of GPRS during the fourth quarter of 2007, % (total number � 1532,1 thou.)
In the fourth quarter of 2007 in comparison with the third quarter the amount of data, sent and
received by using the GPRS, EDGE, UMTS technologies increased by 57,9% and amounted to approximately 141,10 million megabytes (MB), including 116,50 million MB of received data. In average one subscriber sent and received 30,7 MB per month (9,2 MB more than in the third quarter of 2007), including 25,3 MB of received data.
The amount of data, sent and received by UAB �Omnitel� subscribers was 81,8 million MB (in average one subscriber sent and received 36,3 MB), accordingly UAB �Bitė Lietuva� � 57,1 million MB (39,5 MB), UAB �Tele2� � 6,0 million MB (7,0 MB).
In the fourth quarter of 2007 mobile telephone subscribers sent 2394,18 million short messages
(SMS) and 1,59 million illustrated short messages (MMS). 89,6% of the recipients of the SMS, sent in the fourth quarter were subscribers of the own
network, 9,1% were subscribers of other public mobile telephone networks of the Republic of Lithuania, 1,2% - subscribers of foreign countries� networks. 88,1% of the recipients of the MMS, sent in the fourth quarter were subscribers of the own network, 9,6% were subscribers of other public mobile telephone network of the Republic of Lithuania, 2,2% - subscribers of foreign countries� networks.
During the said quarter 10,6% more SMS and 0,2% more MMS messages were sent than during the third quarter of 2007. During the year 2007 3,8% more SMS and 43,4% more MMS were sent than during the year 2006.
Fig. 35. Distribution of the number of short messages (SMS) sent by mobile telephone subscribers during the fourth quarter of 2007, in % (total number � 2394,18 mill.)
UAB "Tele2"18,9%
UAB "Omnitel"48,6%
UAB "Bitė Lietuva"31,4%
Service providers1,1%
Service providers0,2%
UAB "Bitė Lietuva"23,9%
UAB "Omnitel"35,0%
UAB "Tele2"40,9%

Report on the electronic communications sector Quarter IV, 2007
© 2008 Communications Regulatory Authority (RRT) 34
Fig. 36. Distribution of the number of illustrated short messages (MMS) sent by mobile telephone subscribers during the fourth quarter of 2007, in % (total number � 1,59 mill.)
One subscriber sent on average 162 SMS messages and 0,1 MMS messages per month. One
UAB �Bitė Lietuva� subscriber on average sent 186 SMS messages, accordingly UAB �Tele2� � 182, UAB �Omnitel� � 140.
According to the information as of the fourth quarter of 2007, announced on the Internet
websites of national regulators, in Portugal one subscriber sent in average 129 SMS messages per month, whereas in France the service is less popular and one subscriber sent in average 37 SMS messages per month.
Fig. 37. The number of SMS sent by one mobile telephony subscriber in some countries during the fourth quarter of 2007
UAB "Bitė Lietuva"15,3%
UAB "Omnitel"71,2%
Service providers
0,4%
UAB "Tele2"13,1%
148132
4431
129
162
37
0
30
60
90
120
150
180
Lithuania Portugal Finland France
2007 IIIQ 2007 m. IV ketv.

Report on the electronic communications sector Quarter IV, 2007
© 2008 Communications Regulatory Authority (RRT) 35
Fig. 38. Duration of calls initiated in fixed public telephone and mobile telephone networks per subscriber per month (duration of all calls initiated by a relevant provider divided by the total number of active subscribers of that provider at the end of the quarter and the number of months) in minutes13
The average call duration per one fixed telephone subscriber per month of the fourth quarter
increased by 10,5% and was 168 minutes. The average call duration per one subscriber per month of TEO LT, AB increased by 16 minutes and was 173 minutes. During the fourth quarter the average call duration per one mobile telephone subscriber per month increased by 1,2% and was 85 minutes. The average call duration per one UAB �Bitė Lietuva� mobile subscriber per month unchanged, UAB �Tele2� increased by 3 minutes, UAB �Omnitel� decreased by 1 minute.
Fig. 39. Average revenue derived from one subscriber per month in providing fixed public and mobile public telephone services, including revenue earned from MMS, SMS, GPRS (all revenue received by a relevant provider per quarter divided by the total number of active subscribers of a relevant provider at the end of the quarter and the number of months) in Litas
13 - the number of the fixed telephone subscribers is equated to the number of telephone lines, used for provision of fixed telephone services and adding the subscribers, to whom fixed telephone services were provided by using the access, provided by other operators
7462
219210
39
81
216
177
61 65 64
184
77
217222
46
155
705752
84
177
101
182
84
112
68
10885
152
82
157
85
122
71
108
84
168
92
173
0
50
100
150
200
250
TEO LT , AB Alternativeproviders (fixed)
All fixedtelephonyproviders
UAB "Omnitel" UAB "BitėLietuva"
UAB "Tele2" Service providers All mobiletelephonyproviders
2004 Q4 2005 Q4 2006 Q4 2007 Q3 2007 Q4
66
83
54
31
17
41
54
32
5044
33
2320
5152
1323
15
2530
42
26
43
27 24
39
17
3127
40
27
40
23
39
15
3025
40
29
41
0
10
20
30
4050
60
70
80
90
TEO LT, AB Alternativeproviders
(fixed)
All fixedtelephonyproviders
UAB "Omnitel" UAB "BitėLietuva"
UAB "Tele2" Serviceproviders
All mobiletelephonyproviders
2004 Q4 2005 Q4 2006 Q4 2007 Q3 2007 Q4

Report on the electronic communications sector Quarter IV, 2007
© 2008 Communications Regulatory Authority (RRT) 36
According to the submitted data the average duration of a mobile telephone call in fourth quarter of 2007 in comparison with third quarter decreased by 0,1 minutes (1,8 min.), the average duration of a fixed telephone call in fourth quarter increased by 0,1 minutes (2,9 min.). The average duration of a mobile telephone call amounts to 74,7% of the total duration of calls, initiated in public telephone networks (the part decreased by 1,6 per cent comparing with the previous quarter).
During the fourth quarter of 2007 mobile telephone operators received the permissions to use
47 GSM/DCS base stations and registered 76 UMTS base station. Included new stations, until 31 December, 2007 was issued permissions to use 2334 GSM/DCS base stations and registered 522 UMTS base stations. During the year 2007 the number of the GSM/DCS base stations increased by 9,5%, the number of UMTS base stations - more than 7 times.

Report on the electronic communications sector Quarter IV, 2007
© 2008 Communications Regulatory Authority (RRT) 37
5. Leased Lines
In the fourth quarter of 2007 the activities of providing leased lines were carried out by 15 undertakings: TEO LT, AB, AB Lietuvos radijo ir televizijos centras, AB �Lietuvos energija�, UAB �Bitė Lietuva�, AB �Lietuvos gele�inkeliai�, VĮ �Infostruktūra�, UAB �Cubio�, Lattelekom SIA filialas, AB �Rytų skirstomieji tinklai�, UAB �Neltė�, UAB �Dicto Citius�, UAB �Linx telecommunications�, UAB �Arcus Novus�, UAB �Balticum TV�, UAB �Ektra�.
Table 4. Summarised indicators of the activity of the provision of leased lines services
Name of indicator Quarter
IV of 2007
Quarter III of 2007
Change in comparison
IIIQ, % 2006 2007
Change in comparison 2007 with 2006, %
1. Number of leased lines provided to others, total, in units:
4.196 4.228 -0,76 3.970 4.196 5,69
- local leased lines 3.831 3.858 -0,70 3.670 3.831 4,39 - long-distance leased lines 202 215 -6,05 184 202 9,78
- international leased lines 163 155 5,16 116 163 40,52 - number of primary14 leased lines 4.063 4.096 -0,81 3.861 4.063 5,23 - local leased lines 3.748 3.776 -0,74 3.585 3.748 4,55 - long-distance leased lines 192 205 -6,34 173 192 10,98
- international leased lines 123 115 6,96 103 123 19,42 - number of secondary15 leased lines
133 132 0,76 109 133 22,02
- local leased lines 83 82 1,22 85 83 -2,35 - long-distance leased lines 10 10 0,00 11 10 -9,09
- international leased lines 40 40 0,00 13 40 207,69 2. Number of analogous leased lines provided to others, in units:
3.147 3.159 -0,38 3.071 3.147 2,47
- local leased lines 3.126 3.136 -0,32 3.046 3.126 2,63 - long-distance leased lines 18 20 -10,00 22 18 -18,18
- international leased lines 3 3 0,00 3 3 0,00 3. Number of digital leased lines provided to others, in units:
1.049 1.069 -1,87 900 1.049 16,56
- local leased lines 705 722 -2,35 624 705 12,98 - long-distance leased lines 184 195 -5,64 163 184 12,88
- international leased lines 160 152 5,26 113 160 41,59 including: � up to 2 Mb/s (inclusive) 945 1.001 -5,59 840 945 12,50 - local leased lines 651 707 -7,92 610 651 6,72 - long-distance leased lines 160 168 -4,76 140 160 14,29
- international leased lines 134 126 6,35 90 134 48,89 - more than 2 Mb/s 104 68 52,94 60 104 73,33 - local leased lines 54 15 260,00 14 54 285,71 - long-distance leased lines 24 27 -11,11 23 24 4,35
- international leased lines 26 26 0,00 23 26 13,04 5. The revenues from provision of retail leased lines services, thou. Litas (excl. VAT)
4.550 4.237 7,39 18.735 17.410 -7,07
6. The revenues from provision of wholesale leased lines services, Litas (excluding PVM) (the item does not cover the revenues, received from networks interconnection activities)
2.672 2.640 1,22 6.649 9.241 38,99
14 - the primary leased line is understood as a leased line, which is provided using one�s own resources or the leased line provided by a foreign provider of the leased line service without national mediators: the border of the Republic of Lithuania is the dividing line; 15 - the secondary leased line is understood as a leased line, which an undertaking of the Republic of Lithuania provides to any user by making use of the resources of other undertaking of the Republic of Lithuania.

Report on the electronic communications sector Quarter IV, 2007
© 2008 Communications Regulatory Authority (RRT) 38
As of 31 December 2007 the total number of leased lines, provided to other operators was 4196 (0,8% less than as of 30 September 2007). Out of the total number 96,8% were primary leased lines, the remaining ones � secondary.
75,0% (3147) of the provided leased lines were analogue, the greater part of them (99,3%) were local lines.
The total revenue received from the leased lines provision activities during fourth quarter of 2007 comparing with the third quarter of 2007 increased by 5,0% and amounted to LTL 7,22 million. In comparison with the year 2006 leased lines provision market in the year 2007 increased by 5,0%.
The largest market share of the provided leased lines by the earned revenue is occupied by TEO LT, AB: the undertaking�s revenue from the provision of leased lines accounted for 54,9% of the whole leased lines market in the fourth quarter of 2007.
Fig. 40. Distribution of revenue from the provision of leased lines services by operators, in % (total revenue � LTL 7,22 mill.)
The providers whose revenue from the provision of leased lines services in the fourth quarter of 2007 accounted for less 2% of the market share are assigned to the part of �other� providers (together they occupy 3,6% of the market).
Provision of the physical optical fibre (‘Dark Fibre’) In the fourth quarter of 2007 5 companies (TEO LT, AB, UAB �Skaidula�, AB Lietuvos radijo
ir televizijos centras, UAB �Balticum TV�, UAB �Socius�) were engaged in the activities of provision of physical optical fibre. The number of physical optical lines fibers, provided to others was 891. The revenues from these activities in the fourth quarter of 2007 constituted 2,47 million Litas, comparing with the third quarter of 2007 revenues increased by 73,7%.
AB"Lietuvos gele�inkeliai"
7,1% TEO LT, AB54,9%UAB "Bitė Lietuva"
2,5%
UAB �Arcus Novus�3,5%
UAB �Linx telecommunications�
5,2%
AB"Lietuvos energija" 23,1% Other
3,6%

Report on the electronic communications sector Quarter IV, 2007
© 2008 Communications Regulatory Authority (RRT) 39
6. Internet Access Services
In the fourth quarter of 2007 115 providers provided the Internet access services.
Table 5. Summarised indicators of the activity of the provision of the Internet access service
Name of indicator Quarter
IV of 2007
Quarter III of 2007
Change in comparison
IIIQ, % 2006 2007
Change in comparison 2007 with 2006, %
1. Total number of subscribers of the Internet access services, units
581.860 524.514 10,93 417.526 581.860 39,36
- consumers 488.702 441.295 10,74 348.874 488.702 40,08 - business subscribers 93.158 83.219 11,94 68.652 93.158 35,70
including: - the number of subscribers who connected to the Internet via switched public fixed telephone lines at least once in the last month of the quarter
5.833 6.778 -13,94 11.418 5.833 -48,91
- consumers 3.610 4.169 -13,41 7.643 3.610 -52,77 - business subscribers 2.223 2.609 -14,79 3.775 2.223 -41,11
- the number of subscribers, who connected to the Internet through the mobile public telephone network by using fixed rate plans, intended for payment for the Internet access services, provided by using a computer
68.455 54.614 25,34 37.393 68.455 83,07
- consumers 25.755 18.156 41,85 12.283 25.755 109,68 - business subscribers 42.700 36.458 17,12 25.110 42.700 70,05
- the number of subscribers, who connected to the Internet via xDSL lines
231.361 218.101 6,08 178.615 231.361 29,53
- consumers 202.736 190.040 6,68 152.977 202.736 32,53 - business subscribers 28.625 28.061 2,01 25.638 28.625 11,65
- the number of subscribers, connecting to the Internet via wireless communication lines, apart of the public mobile telephone network
51.464 38.762 32,77 26.166 51.464 96,68
- consumers 41.919 31.949 31,21 20.441 41.919 105,07 - business subscribers 9.545 6.813 40,10 5.725 9.545 66,72
- the number of subscribers, connected to the Internet via the cable television networks
64.995 63.241 2,77 65.758 64.995 -1,16
- consumers 63.820 62.096 2,78 64.480 63.820 -1,02 - business subscribers 1.175 1.145 2,62 1.278 1.175 -8,06
- the number of subscribers, connected to the Internet via optical communication (FTTH, FTTB) lines
94.700 83.565 13,32 52.664 94.700 79,82
- consumers 90.810 80.193 13,24 49.769 90.810 82,46 - business subscribers 3.890 3.372 15,36 2.895 3.890 34,37
- the number of subscribers, connected to the Internet via local area networks (LAN)
63.098 57.609 9,53 43.959 63.098 43,54
- consumers 60.044 54.684 9,80 41.272 60.044 45,48 - business subscribers 3.054 2.925 4,41 2.687 3.054 13,66
- the number of subscribers, connected to the Internet via a leased line
1.744 1.674 4,18 1.553 1.744 12,30
- consumers 8 8 0 9 8 -11,11 - business subscribers 1.736 1.666 4,20 1.544 1.736 12,44
- the number of subscribers connected to the Internet via satellite
210 170 23,53 0 210 -
- consumers 0 0 0 0 -

Report on the electronic communications sector Quarter IV, 2007
© 2008 Communications Regulatory Authority (RRT) 40
Name of indicator Quarter
IV of 2007
Quarter III of 2007
Change in comparison
IIIQ, % 2006 2007
Change in comparison 2007 with 2006, %
- business subscribers 210 170 23,53 0 210 - 2. The revenues from the provision of retail Internet access services, thou. Litas (excluding VAT)
82.994 76.333 8,73 247.618 294.525 18,94
- from consumers 49.736 45.406 9,54 134.569 173.350 28,82 - from business subscribers 33.258 30.927 7,53 113.049 121.175 7,19
including: - from the subscribers, connected to the Internet via switched fixed telephone lines
380 445 -14,68 5.734 1.988 -65,33
- from the subscribers, connected to the Internet through the mobile public telephone network using a computer and paying for the Internet access services according to fixed rate plans
12.408 10.406 19,24 37.649 38.773 2,99
- from the subscribers, connected to the Internet via xDSL lines
33.583 31.034 8,21 98.491 120.161 22,00
- from the subscribers, connected to the Internet via wireless lines, except the mobile telephone networks
6.596 6.082 8,45 18.505 23.411 26,51
- from the subscribers, connected to the Internet via cable television networks
7.720 7.666 0,71 28.557 30.394 6,43
- from the subscribers, connected to the Internet via optical communication (FTTH) lines
10.060 9.039 11,29 15.932 35.412 122,27
- from the subscribers, connected to the Internet via local area networks (LAN)
6.733 6.393 5,33 23.335 23.957 2,67
- from the subscribers, connected to the Internet via the leased line
5.108 4.975 2,67 19.391 19.330 -0,31
- from the subscribers, connected to the Internet via satellite
406 293 38,64 25 1.099 4.243,54
3. Revenues from wholesale Internet access service provision, thou. Litas (excluding VAT)
4.391 4.356 0,80 17.266 18.440 6,80
4. Total number of public wireless Internet zones (hotspots), where the wireless computer network technology is implemented, units
3.457 3.013 14,74 993 3.457 248,14
- including free of charge 169 168 0,60 972 169 -82,61 5. The speed rate of clear (not via other Internet access services providers of Lithuania) international Internet communication channel, Mbps
15.716 14.801 6,18 9.214 15.716 70,57
The total number of the Internet subscribers at the end of the period was 581,9 thousand (that is
17,3 connections per 100 population). The said figure does not include 1463,7 thousand subscribers, who were using the service of Internet access at the public mobile telephone communications end equipment (WAP).
87,2% of subscribers used broadband communication technologies for the Internet access, 1,0% - connected to the dial-up Internet, 11,8% - connected to the Internet through the mobile public telephone network by using fixed rate plans, intended for payment for the Internet access services, provided by using a computer.

Report on the electronic communications sector Quarter IV, 2007
© 2008 Communications Regulatory Authority (RRT) 41
The consumers amounted to 84,0% of the total number of subscribers, that is, 34,8 household had permanent connection to the Internet. The revenues, generated by the consumers amounted to 59,9% off the total revenue, received from provision of the retail Internet services.
In the fourth quarter of 2007 the number of the wireless Internet zones (hotspots) increased. As of the end of the fourth quarter there were 3457 wireless Internet hotspots, including 3182 implemented by TEO LT, AB. Comparing with the end of the third quarter of 2007 the number of wireless communication hotspots grew by 14,7%, during the year � 3,5 times.
Fig. 41. Distribution of the number of the Internet access subscribers by the manner of connection (total number of subscribers 581,9 thou.) Fig. 42. Distribution of the number of the Internet access subscribers by providers, in % (total number of subscribers 581,9 thou.)
The providers whose number of subscribers in the end of fourth quarter of 2007 accounted for
less 2% of the market share are assigned to the part of �other� providers (together they occupy 18,6% of the market).
Leased lines0,30%
Fiber16,28%
Satellite0,04%
Through the mobile public telephone network
11,76%
Dial-up1,00%
Wireless8,84%
xDSL39,76%
LAN10,84%
Cable modems11,17%
UAB �Mikrovisatos TV�2,2%
UAB "Dokeda"4,8%
UAB "Bitė Lietuva"2,2%
UAB "Telerena"3,0%
AB Lietuvos radijo ir televizijos centras
3,5%
UAB"Vinita"2,0%
UAB �Balticum TV�2,9%
UAB �Penkių kont. komun. centas"
3,8%
UAB �Omnitel� 9,8%
UAB �Viginta�2,3%
Other18,6%
TEO LT, AB44,9%

Report on the electronic communications sector Quarter IV, 2007
© 2008 Communications Regulatory Authority (RRT) 42
Leased lines6,15%
Fiber12,12%
Satellite0,49%
Through the mobile public telephone network
14,95%Dial-up0,46%Wireless
7,95%
xDSL40,46%
LAN8,11%
Cable modems9,30%
The total revenue, received from the provision of the Internet access services grew by 8,3% comparing with the third quarter of 2007 and in the fourth quarter of 2007 amounted to LTL 87,39 million including LTL 82,99 million of the revenue from provision of retail Internet access services. Approximately 84,6% of the revenue from the provision of retail Internet access services were the revenue from the provision of the Internet services via the broadband access.
Total revenue from provision of Internet access services in the year 2007 in comparison with the year 2006 increased by 18,2%.
Fig. 43. Distribution of the revenue for provision of retail Internet access services according to the manner of connection (total revenue - LTL 82,99 mill.)
The largest part of the Internet access market in terms of revenue is comprised by the revenue,
received from subscribers who are connected to the Internet by xDSL lines (40,5%), then � through the mobile telephone network (15,0%), fiber � 12,1%.
Fig. 44. Distribution of revenue from the Internet access service by providers, in % (total revenue is LTL 87,39 mill.)
The providers whose revenue from the Internet access services in the fourth quarter of 2007
accounted for less 2% of the market share are assigned to the part of �other� providers (together they occupy 22,1% of the market).
UAB "Dokeda"3,5% UAB "Bitė Lietuva"
5,7%
UAB �Baltnetos komunikacijos�
2,3%
AB Lietuvos radijo ir televizijos centras
3,9%
UAB �Balticum TV�3,6%
UAB �Penkių kont. komun. centas"
2,8%
UAB �Omnitel� 13,0%
Other22,1%
TEO LT, AB43,0%

Report on the electronic communications sector Quarter IV, 2007
© 2008 Communications Regulatory Authority (RRT) 43
The average monthly revenues from one subscriber for the Internet access services (including all the ways of connection) in the fourth quarter of 2007 amounted to LTL 48 (comparing to LTL 49 in the third quarter of 2007). The largest average amount of revenue from one subscriber per month was received from subscribers, who are connected to the Internet by leased lines - LTL 976 (LTL 991), the corresponding amount, received from the subscribers connected by wireless communication lines was LTL 43 (LTL 52), through mobile telephone networks (by using computer) � LTL 60 (LTL 64), by xDSL line users was LTL 48 (LTL 47), by optical cable - LTL 35 (LTL 36), local area network (LAN) - LTL 36 (LTL 37), cable television networks - LTL 40 (LTL 40), dial-up - LTL 22 (LTL 22).
In the fourth quarter of 2007 fourteen undertakings had direct international Internet
communication channels (not via other Internet access providers of Lithuania). The total speed rate of direct international Internet communication channels (Mb/s) by the end of the fourth quarter of 2007 amounted to 15716 Mb/s, i. e. increased by 6,2% comparing with the third quarter of 2007, and grew by 70,6% during the year. By the end of the fourth quarter the largest speed rate of international channels was held by TEO LT, AB (9600 Mb/s), UAB Bitė Lietuva (1866 Mb/s) and KTU Institute of Information Technology Development (1024 Mb/s).
Fig. 45. Distribution of subscribers who connected to the Internet indefinitely (where the payment for services provided does not depend on the duration of the use of the Internet or the amount of downloaded information) by speed, in % (total number � 343,7 thou.) Fig. 46. Distribution of subscribers who connected to the Internet with a certain limitation (according to the amount of information conveyed, the duration of the use of the Internet) by speed, in % (total number � 238,1 thou.)
from 512 Kb/s to 2Mb/s 43,6%
from 256 to 512 Kb/s7,8%
from 144 to 256 Kb/s3,0%
until 64 Kb/s0,6%
from 64 to 128 Kb/s2,24%
from 128 to 144 Kb/s6,31%
more than 2 Mbit/s36,4%
more than 2 Mbit/s11,4%from 128 to 144 Kb/s
28,8%
from 64 to 128 Kb/s0,05%
until 64 Kb/s2,5%
from 144 to 256 Kb/s0,2%
from 256 to 512 Kb/s50,2%
from 512 Kb/s to 2Mb/s 6,8%

Report on the electronic communications sector Quarter IV, 2007
© 2008 Communications Regulatory Authority (RRT) 44
Narrowband
In this review the Internet via narrowband access covers the following technologies: Internet via switched telecommunications lines (dial-up) and Internet via mobile telephone network by using fixed payment plans, intended for paying for Internet access services by using a computer.
The number of subscribers, connected to the dial-up Internet reduced by 13,9% comparing with the third quarter of 2007, during the year it decreased about two times and at the end of the fourth quarter of 2007 amounted to 5,8 thousand. According to the data of fourth quarter of 2007 a subscriber uses those services in average 13,3 hours per month. The number of subscribers, connecting to the Internet by dial-up is reducing since more subscribers start using the Internet via broadband access services.
The total number of the subscribers, who connected to the Internet via the mobile telephone by using a computer and paid for the Internet services according to payment plans, intended for usage of the Internet via a computer (Omni Connect, Vodafone Mobile Connect) as of 31 December amounted to 68,5 thousand, during the fourth quarter it increased by 25,3%. In the fourth quarter of 2007 these services were provided through UAB �Omnitel� and UAB �Bitė Lietuva� networks (81,5% subscribers used UAB �Omnitel� services, 17,8% � UAB �Bitė Lietuva�, 0,7% � Service providers that provided services though the network of UAB �Bitė Lietuva�).
Broadband
The number of subscribers who make use of broadband communication technologies totalled
507,6 thousand as of 31 December 2007 (at the beginning of the period this figure stood at 463,1 thousand), during the quarter it increased by 9,6%, during the year it increased by 37,7%.
At the end of the fourth quarter of 2007 broadband penetration (subscribers per 100 population) was 15,1%, during the quarter it increased by 1,4 per cent and from the end of the fourth quarter of 2006 by 4,2 per cent.
Fig. 47. Change in the number of Internet subscribers who make use of broadband technologies
507,6
463,1431,3409,0
368,7
234,1
129,166,8
15,1
1,9
3,8
6,9
10,912,1
12,813,7
0,0
100,0
200,0
300,0
400,0
500,0
600,0
2003 12 31 2004 12 31 2005 12 31 2006 12 31 2007 03 31 2007 06 30 2007 09 30 2007 12 310,0
2,0
4,0
6,0
8,0
10,0
12,0
14,0
16,0
Broadband subscribers, thou. Penetration, %

Report on the electronic communications sector Quarter IV, 2007
© 2008 Communications Regulatory Authority (RRT) 45
Fig. 48. The number of connected new subscribers who make use of broadband technologies within the quarter
At the end of the year the providers of Internet access services usually execute various campaigns for connection of new subscribers and apply different discounts therefore in the fourth quarter the number of newly connected lines is the largest comparing with other quarters. Fig. 49. Broadband per 100 population in European countries16
The data prepared by Point Topic�s World on the broadband connection and published as the
III quarterly report of 2007 shows that the penetration of broadband connection shifts from 7,0 to 36,0 connections per 100 inhabitants. The greatest broadband penetration in the European countries is observed in the Denmark, Netherlands, Norway and the lowest penetration rates are observed in Slovakia, Poland, Romania.
According to the data, provided by Point Topic�s World company, during the time period of one year from 30 September 2006 till 30 September 2007 the penetration of broadband communication mostly increased in Germany (by 7,1%), Ireland (by 6,3%) as well as in the countries, which have the largest penetration of broadband communication: in the Netherlands (by 6,3%), Norway (by 6,2%); the penetration grew least in Sweden (by 0,9%), Malta (by 1,9%). 16 - according Point Topic's �World Broadband Statistics� for September of 2007, September of 2006
26,6 25,429,3
53,4
40,3
22,3
31,8
44,5
0,0
10,0
20,0
30,0
40,0
50,0
60,0
2006 IQ 2006 IIQ 2006 IIIQ 2006 IVQ 2007 IQ 2007 IIQ 2007 IIIQ 2007 IVQ
14,713,7
7,08,2 8,4 8,5
12,2 12,513,6
36,035,2
30,830,530,027,8
25,424,424,322,522,4
19,918,017,817,717,415,915,1
0
5
10
15
20
25
30
35
40
Slovakia
PolandRomania
Greece
CzechHungary
LatviaLithuania
MaltaPortugal
Ireland
Slovenia
ItalySpain
Austria
Estonia
Germany
Belgium
FranceUK Sweden
Finland
Switzerland
Norway
Netherlands
Denmark
2006 09 30 2007 09 30 2007 12 31

Report on the electronic communications sector Quarter IV, 2007
© 2008 Communications Regulatory Authority (RRT) 46
Fig. 50. Change of Internet subscribers who make use of broadband technologies in European countries17 (2006-09-30 to 2007-09-30)
Fig. 51. Distribution of the number of the Internet access subscribers, who make use of broadband communications technologies, according to the manner of connection (total number - 507,6 thou.), %
17 - according Point Topic's �World Broadband Statistics� for September of 2007, September of 2006
7,16,3
6,26,1
5,55,4
5,14,9
4,74,6
4,54,4
4,24,0
3,83,8
3,63,5
3,13,1
2,52,4
2,32,2
1,20,9
0,0 1,0 2,0 3,0 4,0 5,0 6,0 7,0 8,0
GermanyIreland
NetherlandsNorway
LatviaDenmark
GreeceFrance
HungaryRomaniaSlovenia
LithuaniaUK
AustriaCzech
FinlandSwitzerland
SlovakiaBelgium
SpainItaly
PolandPortugalEstonia
MaltaSweden
xDSL45,58%
Leased lines0,34%
Fiber18,66%
Cable modems12,81%
Wireless10,14%
LAN12,43%
Satellite0,04%

Report on the electronic communications sector Quarter IV, 2007
© 2008 Communications Regulatory Authority (RRT) 47
Fig. 52. Distribution of the number of the Internet access subscribers, who make use of broadband communications technologies, by providers (total number - 507,6 thou.), %
Fig. 53. Distribution of the number of the Internet access subscribers, who make use of broadband communications technologies, by providers (total number - LTL 70,21 mill.), %
On 31 December 2007 the number of telephone line, whereby the high-speed service of
subscriber lines (hereinafter referred to as xDSL) is provided, totalled 232,0 thousand (32,7% of the total number of metallic twisted pair lines). During the fourth quarter it increased by 6,1%, during the year � by 30,1%. By using 99,0% of the lines TEO LT, AB provided the Internet access services to its customers and 2363 xDSL access units were whole-sold to other Internet access service providers. According to information available to the Regulatory Communications Authority, apart from TEO LT, AB, 9 more providers provide xDSL services.
UAB �Vinita�2,3%
UAB �Telerena�3,4%
UAB �Dokeda�5,5%
UAB �Penkių kontinentų komunikacijų centras�
4,3%
UAB "Viginta"2,6%
UAB �Mikrovisatos TV�2,5%
Other21,4%
UAB �Balticum TV�3,4%
TEO LT, AB50,5%
AB �Lietuvos radijo ir televizijos centras�
4,0%
UAB �Penkių kontinentų
komunikacijų centras�3,5%
UAB �Telerena�2,2%
UAB "Omnitel"2,3%
TEO LT, AB48,7%
UAB "Bitė Lietuva"3,4%
Other21,3%
UAB �Dokeda�4,1%
UAB "Microlink Lietuva"
2,3%
UAB �Balticum TV�4,4%
AB �Lietuvos radijo ir televizijos centras�
4,9%
UAB "Baltnetos komunikacijos"
2,9%
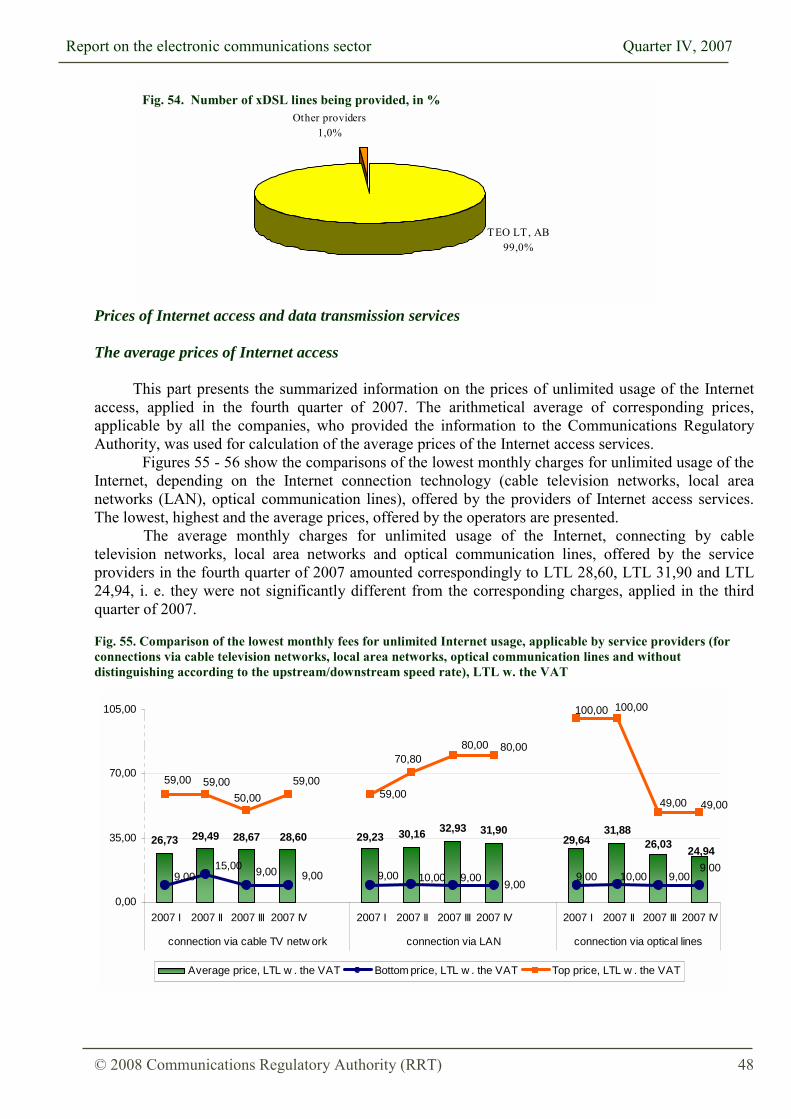
Report on the electronic communications sector Quarter IV, 2007
© 2008 Communications Regulatory Authority (RRT) 48
Other providers1,0%
TEO LT, AB99,0%
Fig. 54. Number of xDSL lines being provided, in %
Prices of Internet access and data transmission services The average prices of Internet access
This part presents the summarized information on the prices of unlimited usage of the Internet access, applied in the fourth quarter of 2007. The arithmetical average of corresponding prices, applicable by all the companies, who provided the information to the Communications Regulatory Authority, was used for calculation of the average prices of the Internet access services.
Figures 55 - 56 show the comparisons of the lowest monthly charges for unlimited usage of the Internet, depending on the Internet connection technology (cable television networks, local area networks (LAN), optical communication lines), offered by the providers of Internet access services. The lowest, highest and the average prices, offered by the operators are presented. The average monthly charges for unlimited usage of the Internet, connecting by cable television networks, local area networks and optical communication lines, offered by the service providers in the fourth quarter of 2007 amounted correspondingly to LTL 28,60, LTL 31,90 and LTL 24,94, i. e. they were not significantly different from the corresponding charges, applied in the third quarter of 2007. Fig. 55. Comparison of the lowest monthly fees for unlimited Internet usage, applicable by service providers (for connections via cable television networks, local area networks, optical communication lines and without distinguishing according to the upstream/downstream speed rate), LTL w. the VAT
26,73 30,16 32,93 31,90 31,88
24,9426,0329,6428,60 29,2329,49 28,67
9,00
59,00
9,00 10,00 9,009,00
10,00 9,009,00 9,00 9,009,0015,00
100,00100,00
49,0049,00
59,00 59,0050,00
70,8080,00 80,00
59,00
0,00
35,00
70,00
105,00
2007 I 2007 II 2007 III 2007 IV 2007 I 2007 II 2007 III 2007 IV 2007 I 2007 II 2007 III 2007 IV
connection via cable TV netw ork connection via LAN connection via optical lines
Average price, LTL w . the VAT Bottom price, LTL w . the VAT Top price, LTL w . the VAT

Report on the electronic communications sector Quarter IV, 2007
© 2008 Communications Regulatory Authority (RRT) 49
The dynamics of the change of the monthly charges, applied by the providers of the Internet access services for unlimited usage of the Internet, including all the technologies of provision of the Internet access services, except the wireless telecommunication lines is presented in Figure 56. A general trend of increase of prices can be noted, with the exception of the lowest (64 Kbps, 128 Kbps) and highest (>2048 Kbps) speed rate Internet access services. During the reporting period the average price for the 64 Kbps speed rate reduced from LTL 44,38 down to LTL 33,17 (by almost 25%), for the 128 Kbps speed rate � from LTL 46,32 down to LTL 42,92, for the 512 Kbps speed rate � reduced by 9%, for the 256 Kbps speed rate remained virtually unchanged; the prices of the Internet access of the speed rate of 1024 Kbps and 2048 Kbps during the quarter increased by correspondingly 2,38% and 11,48%. The average of the monthly charge for the Internet access of the speed rate, higher than 2048 Kbps, comparing with the third quarter of 2007 reduced by 15% - from LTL 117,33 down to LTL 99,45 (the highest charge for the Internet access of the said speed rate did not change during the time period).
The information on the monthly charges for unlimited Internet usage, applicable as of the end of the fourth quarter of 2007 was presented to RRT by 76 operators. Figure 56. Comparison of the monthly fees for unlimited Internet usage, applicable by the Internet access service providers (independently of the service provision technology, but not including the services, provided via wireless technologies) LTL w. the VAT
10,00 10,00 10,00 10,00
100,00 100,00 99,00
80,00
33,1741,00 44,3844,69
2007 I 2007 II 2007 III 2007 IV
64 Kb/s
Bottom price,LTL w . theVATTop price,LTL w . theVATAverageprice, LTL w .the VAT
162,00 153,40 153,40 153,40
19,9919,9919,99 19,9942,92
46,3245,73 46,08
2007 I 2007 II 2007 III 2007 IV
128 Kb/s
Bottom price,LTL w . the VATTop price, LTLw . the VAT
Average price,LTL w . the VAT
220,00
259,60 259,60 259,60
19,00 19,0019,0024,00
52,8445,60
53,4748,01
2007 I 2007 II 2007 III 2007 IV
256 Kb/s
Bottom price,LTL w . the VAT
Top price, LTLw . the VAT
Average price,LTL w . the VAT

Report on the electronic communications sector Quarter IV, 2007
© 2008 Communications Regulatory Authority (RRT) 50
330,00
590,00 590,00 590,00
10,00 10,0010,0010,0067,32 78,7486,5479,90
2007 I 2007 II 2007 III 2007 IV
512 Kb/s
Bottom price,LTL w . theVATTop price, LTLw . the VAT
Average price,LTL w . theVAT
274,00200,00
500,00 500,00
25,0025,00 25,00 29,0059,9060,76 82,42 84,38
2007 I 2007 II 2007 III 2007 IV
1024 Kb/s
Bottom price,LTL w . theVATTop price, LTLw . the VAT
Averageprice, LTL w .the VAT
590,00
400,00448,90
519,20
29,0029,00 29,00 29,0087,6295,48 101,40
113,04
2007 I 2007 II 2007 III 2007 IV
2048 Kb/s
Bottom price,LTL w . theVATTop price,LTL w . theVATAverageprice, LTL w .the VAT
500,00 500,00
640,70 640,70
29,00 29,00 29,00 29,0099,45
117,3392,09100,76
2007 I 2007 II 2007 III 2007 IV
> 2048 Kb/s
Bottom price,LTL w . theVATTop price,LTL w . theVATAverageprice, LTL w .the VAT

Report on the electronic communications sector Quarter IV, 2007
© 2008 Communications Regulatory Authority (RRT) 51
Figure 57 shows the monthly charges for digital subscriber line (hereinafter referred to as xDSL) Internet access service of the corresponding speed rate (the lowest charge for the Internet access of the corresponding speed rate, applicable by each provider is used for comparison), and Figure 58 shows the charges for installation of the xDSL service of the corresponding speed rate.
According to the data, supplied by the providers of electronic communications services, during the fourth quarter of 2007 the average of the monthly charge for xDSL Internet access of the 256 Kb/s speed rate reduced by 6,8%, and the average of the 512 Kb/s speed rate � increased by 1,8%. The average size of the xDSL Internet access service installation charge has not changed since the beginning of the year, only in the fourth quarter of 2007, due to the prices, applied by several xDSL service providers it reduced by 10,6% for the speed rate of 512 Kb/s (see Figure 58). Figure 57. Comparison of the monthly fees for the Internet usage via the xDSL Internet access, applicable by the Internet access service providers, LTL w. the VAT
49,00 49,00 49,00
259,60
590,00 590,00 590,00
26,0035,0035,0035,0026,00
200,00259,60259,60
250,00 225,10221,18251,00
160,75136,72146,70155,77
124,00
0,00
200,00
400,00
600,00
2007 I 2007 II 2007 III 2007 IV 2007 I 2007 II 2007 III 2007 IV
256 Kb/s 512 Kb/s
Bottom price, LTL w . the VAT Top price, LTL w . the VATAverage price, LTL w . the VAT
Figure 58. Comparison of the minimum xDSL installation fees, applicable by the Internet access service providers, LTL w. the VAT
200,00 200,00200,00
150,00150,00
200,00 200,00
50,00
200,00
50,00
200,00 200,00
300,00
200,00
300,00
200,00
162,67182,07200,00
181,44
200,00198,58200,00200,00
0,00
150,00
300,00
2007 I 2007 II 2007 III 2007 IV 2007 I 2007 II 2007 III 2007 IV
256 Kb/s 512 Kb/s
Bottom price, LTL w . the VAT Top price, LTL w . the VATAverage price, LTL w . the VAT
Figure 59 shows the information on the monthly charges, applied by service providers for the Internet access service, when connecting via a leased line, Figure 60 � the charges for installation of the service. The average monthly charge, applied by the providers of the Internet access services during the reporting period for the usage of the Internet connecting via a leased line (due to the increased tariffs, applied by certain providers of the service) increased by approximately 19% for the 256 Kb/s speed rate, 17% for the 512 Kb/s speed rate and 10% for the 1024 Kb/s speed rate (see Figure 59).

Report on the electronic communications sector Quarter IV, 2007
© 2008 Communications Regulatory Authority (RRT) 52
Contrariwise, the average installation charge for connection to the Internet via a leased line, applied by the providers of the Internet access services during the fourth quarter reduced by approximately 24% for the 256 Kb/s speed rate, 19% for the 512 Kb/s speed rate and 32% for the 1024 Kb/s speed rate (see Figure 60).
Figure 59. Comparison of the monthly fees for the Internet usage by connecting via a leased line, applicable by the Internet access service providers, LTL w. the VAT.
32,00
330,00 330,00
32,0032,4532,4525,00 32,4525,0025,00 32,00 20,0032,0025,00
300,00
177,00280,00
630,00 630,00
300,00
177,00177,00
280,00
177,00
85,35102,7856,23
168,86153,43
101,09107,5061,8052,0651,77
113,2492,06
0,00
350,00
700,00
2007I
2007II
2007III
2007IV
2007I
2007II
2007III
2007IV
2007I
2007II
2007III
2007Iv
256 Kb/s 512 Kb/s 1024 Kb/s
Bottom price, LTL w . the VAT Top price, LTL w . the VATAverage price, LTL w . the VAT
Figure 60. Comparison of the minimum installation fees for connection to the Internet via a leased line, applicable by the Internet access service providers, LTL w. the VAT.
29,00 20,00 20,00 39,00 20,00 20,00 49,00 20,00 20,00 20,00
400,00 400,00 400,00 400,00 400,00
600,00 600,00
400,00
590,00 600,00 600,00
400,00
20,00 20,00
140,71199,18156,40 196,11208,90
160,50178,00 145,63
214,50
155,50 184,50 170,44
0,00
200,00
400,00
600,00
800,00
2007 I 2007 II 2007 III 2007 IV 2007 I 2007 II 2007 III 2007 IV 2007 I 2007 II 2007 III 2007 IV
256 Kb/s 512 Kb/s 1024 Kb/s
Bottom price, LTL w . the VAT Top price, LTL w . the VAT Average price, LTL w . the VAT

Report on the electronic communications sector Quarter IV, 2007
© 2008 Communications Regulatory Authority (RRT) 53
7. Data Transmission Services
Other data transmission services in the fourth quarter of 2007 were provided by 15
undertakings. The total revenue, received from provision of data transmission services increased by 4,5% comparing with the third quarter of 2007 and amounted to LTL 14,8 million. Total revenues received from provision of data transmission services during the year 2007 in comparison with the year 2006 increased by 18,8%.
The main services provided were the following: virtual private network (VPN), IP, Frame Relay, Ethernet, Ethernet VLAN, etc.
The total number of customers of the said services as of 31 December of 2007 amounted to 12,5 thousand, during the quarter it increased by 33,9%.
Fig. 61. Data transmission service providers� market shares according to the revenue from provision of data transmission services (the total revenue � LTL 14,8 mill.), %
Other1,3%
AB "Lietuvos energija"4,5%
UAB "Microlink Lietuva"
5,0%
TEO LT, AB51,7%
VĮ " Infostruktūra" 9,8%
UAB "Omnitel"14,8%
UAB "Bitė Lietuva"12,9%
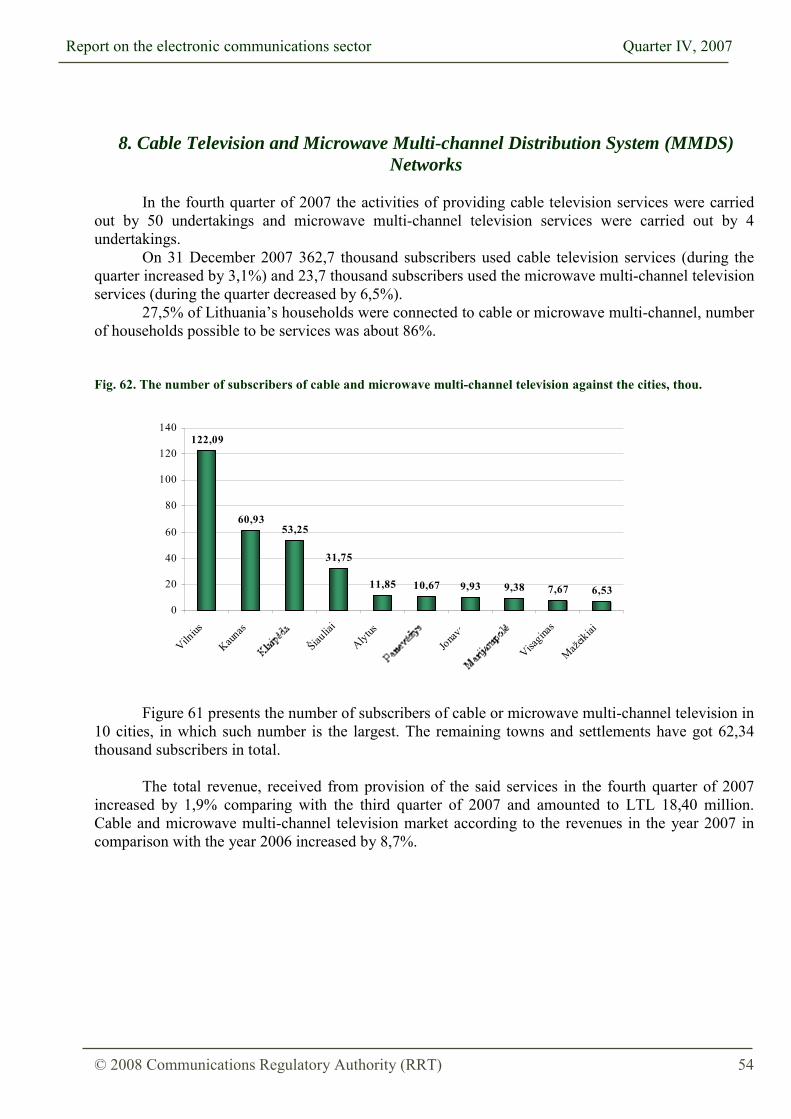
Report on the electronic communications sector Quarter IV, 2007
© 2008 Communications Regulatory Authority (RRT) 54
8. Cable Television and Microwave Multi-channel Distribution System (MMDS) Networks
In the fourth quarter of 2007 the activities of providing cable television services were carried
out by 50 undertakings and microwave multi-channel television services were carried out by 4 undertakings.
On 31 December 2007 362,7 thousand subscribers used cable television services (during the quarter increased by 3,1%) and 23,7 thousand subscribers used the microwave multi-channel television services (during the quarter decreased by 6,5%).
27,5% of Lithuania�s households were connected to cable or microwave multi-channel, number of households possible to be services was about 86%.
Fig. 62. The number of subscribers of cable and microwave multi-channel television against the cities, thou. Figure 61 presents the number of subscribers of cable or microwave multi-channel television in
10 cities, in which such number is the largest. The remaining towns and settlements have got 62,34 thousand subscribers in total.
The total revenue, received from provision of the said services in the fourth quarter of 2007
increased by 1,9% comparing with the third quarter of 2007 and amounted to LTL 18,40 million. Cable and microwave multi-channel television market according to the revenues in the year 2007 in comparison with the year 2006 increased by 8,7%.
122,09
60,9353,25
31,75
11,85 10,67 9,93 9,38 7,67 6,53
0
20
40
60
80
100
120
140
Vilnius
Kaunas
�iaulia
i
Alytus
Jonava
Visagina
s
Ma�eikiai

Report on the electronic communications sector Quarter IV, 2007
© 2008 Communications Regulatory Authority (RRT) 55
Fig. 63. Distribution of revenue from cable and microwave multi-channel television by providers, in % (total revenue is LTL 18,40 mill.), %
Fig. 64. Distribution of the number of the cable and microwave multi-channel television subscribers by providers, in % (total number of subscribers � 386,4 thou.), %
38 undertakings, providing cable television and/or microwave multi-channel television
services, also provide the Internet access services. 11 companies (UAB �Alytaus kabelinė televizija�, UAB �Balticum TV�, UAB �Init�, UAB �Marsatas�, UAB �Radijo elektroninės sistemos�, UAB �Remo televizija�, UAB �Roventa�, UAB �Telerena�, UAB �Viginta�, UAB �Zirzilė� and UAB �Mikrovisatos TV�) provide the entire package of services to their customers (3 services): fixed telephone, Internet access and cable television services. All the said companies (excepting �Mikrovisatos TV�) provided the fixed telephone services of UAB �Nacionalinis telekomunikacijų tinklas�.
Other23,7%
UAB �Viginta�4,3%
UAB �Balticum TV�14,9% UAB �Telerena�
5,1%
UAB �AVVA�2,5%
UAB �Init�7,1%
UAB �Kabeliniai ry�ių t inklai�
3,3%
UAB �Trigeris�3,6%
UAB �Sugardas�2,7%
UAB �Parabolė�2,1%
UAB �Mikrovisatos TV�9,4%
UAB �Lignita�3,3%
UAB �Rygveda�4,1%
UAB �Vinita�13,9%
UAB �Alytaus kabelinė televizija�
3,1%
UAB �Vinita�15,6%
UAB �Rygveda�4,2%
UAB �Lignita�3,9%
UAB �Mikrovisatos TV�9,4%
UAB �Sugardas�2,0%
UAB �Trigeris�3,7%
UAB �Kabeliniai ry�ių t inklai�
3,0%
UAB �Init�6,3%
UAB �AVVA�2,6%
UAB �Telerena�5,4%
UAB �Balticum TV�16,1%
UAB �Viginta�3,7%
Other21,2%

Report on the electronic communications sector Quarter IV, 2007
© 2008 Communications Regulatory Authority (RRT) 56
Digital television At the end of the fourth quarter of 2007 12,08 thousand used digital TV services, provided
through cable TV and MMDS networks. During the quarter the number increased by 34,8%. Also in the fourth quarter of 2007 were provided digital TV services by using IP technologies,
these services were provided by Teo LT, AB ir UAB �Penkių kontinentų komunikacijų centras�. At the end of the fourth quarter were 17,57 thousand IPTV subscribers, during the quarter this number increased by 27,2%.
9. Wire Radio Activities
One undertaking i.e. Public Enterprise Teleradijo Kompanija �Hansa� was engaged in wire radio activities in the fourth quarter of 2007. The total number of wire radio sets as of December 31 amounted to 53,3 thousand, including 44,9 thousand for consumers, during the quarter decreased by 1,7%.
The total revenue from wire radio activities in the fourth quarter of 2007 decreased by 1,4% comparing with the third quarter of 2007 and amounted approximately to LTL 0,37 million. Total revenues from wire radio activities during the year 2007 in comparison with the year 2006 decreased by 3,7%.
10. Radio and Television Programs Transmission Services According to the submitted data 2 undertakings (AB Lietuvos radijo ir televizijos centras and
TEO LT, AB) were engaged in the provision of radio and television programs� transmission services to other operators in the fourth quarter of 2007.
Revenues, received from the provision of radio programs transmission services amounted approximately to LTL 1,18 million, (decreased by 0,4% comparing with the previous quarter).
Revenues, received from provision of television programs� transmission services amounted to LTL 6,18 million (increased by 21,6% comparing with the previous quarter).
Total revenues received from the provision of radio and television transmission services during the year 2007 in comparison with the year 2006 increased by 22,5%.

Report on the electronic communications sector Quarter IV, 2007
© 2008 Communications Regulatory Authority (RRT) 57
List of electronic communications operators and providers of services on the basis of
whose data the present review has been prepared:
TEO LT, AB, UAB �Omnitel�, UAB �Bitė Lietuva�, UAB �Tele2�, UAB �Tele2 fiksuotas ry�ys�, AB �Lietuvos gele�inkeliai�, AB �Lietuvos radijo ir televizijos centras�, UAB �Alderada�, UAB �Alytaus kabelinė televizija�, UAB �Arcus Novus�, UAB �Balticum TV�, UAB �Baltnetos komunikacijos�, UAB �Bručas ir Ko�, UAB �CSC Telecom�, UAB �Cubio�, UAB �Eurocom�, UAB �Eurofonas�, UAB �Fast traffic�, UAB �Gigatelis�, UAB �Gisnetas�, VĮ �Infostruktūra�, UAB �Init�, UAB �Interneto pasaulis�, A. Judicko individuali įmonė, UAB �Linkotelus�, UAB �Linktelis�, UAB �Linx telecommunications�, UAB �Marsatas�, UAB �Mediafon�, UAB �Microlink Lietuva�, UAB �Mikrovisatos TV�, UAB �Nacionalinis telekomunikacijų tinklas�, UAB �Naujasis telefonas�, UAB �Neltė�, UAB �NORBY Telecom�, UAB �NTT Cable Lietuva�, AB �Ogmios centras�, UAB �Penkių kontinentų komunikacijų centras�, UAB �Radijo elektroninės sistemos�, UAB �Remo televizija�,UAB �Resvera�, UAB �Roventa�, UAB �Solocomas�, UAB �Teleinformacijos paslaugos�, UAB �Telekomunikaciju grupa�, UAB �Telerena�, UAB �Teletinklas�, UAB �Televartai�, UAB �Trys penketai�, UAB �ViaCall�, UAB �Viginta�, UAB �Voicecom�, UAB "Zirzilė", UAB �Laracijos telekomunikacijos�, UAB �Teledema�, UAB �Norfos ma�mena�, UAB �AKN�, UAB �Auto�vilgsnis�, UAB �Metameda� ir ko, UAB �Mobilus partneris�, AB �Lietuvos energija�, AB �Rytų skirstomieji tinklai�, LATTELEKOM SIA filialas, UAB �Alpha Komunikacijos�, UAB �Dicto Citius�, UAB �Ektra�,UAB �Skaidula�, UAB "Acta iuventus�, UAB �AirNet�, UAB �Alantos kompiuterių servisas�, Astos Dvaranauskienės IĮ (Alneta), UAB �Andernetas�, UAB �Auridija�, UAB �AVVA�, UAB �Baitida�, L. Pikučio firma �Bipt�, UAB �Biuro sprendimų tinklas�, UAB �Biznio kontaktai�, UAB �Consilium Optimum�, UAB �Dagmina�, UAB �Davgita�, UAB �DKD�, UAB �Dokeda�, UAB �Duomenų ekspresas�, UAB �Elekta�, L. Bulovo firma �Elektromedija�, UAB �Elektroninė komunikacija�, UAB �Elneta�, UAB �Eteris�, UAB �Garg�dų telekomunikacijų tinklai�, UAB �Greitneta�, Vie�oji įstaiga Teleradijo kompanija �Hansa�, UAB �Ignalinos televizija�, UAB �Ilora�, UAB �Informacijos labirintas�, UAB �Informacijos tiltas�, UAB �Infoseka�, M. E�erskio įm. �Interneto namai�, UAB �Interplus�, UAB �Kabeliniai ry�ių tinklai�, UAB �Kabelinis internetas�, UAB �Katalita�, UAB �Kateka�, UAB �Kauno interneto sistemos�, UAB �Kednetas�, V. Gustienės firma �Kelmės kabelinė televizija�, L. Pru�insko IĮ �Kompiuterinis langas�, UAB �Krėna�, KTU Informacinių technologijų plėtros institutas, Individuali įmonė �Laineta�, UAB �LANS�, UAB �Lantraneta�, UAB �Lema�, UAB �Lignita�, UAB �Marijampolės kabelinė televizija�, UAB �Miesto tinklas�, Kęstučio Mykolaičio individuali įmonė, UAB �Neltės tinklas�, UAB �NNT�, UAB �Orglita�, UAB �Oslo ptoducts�, UAB �Ozo tinklas�, UAB �Palsatas�, UAB �Parabolė�, G. Pečiulio įmonė, Petriko kabelinės televizijos studija, UAB �Rakaras�, UAB �Rietavo televizija�, UAB �Rygveda�, UAB �Salmija�, UAB �Satela�, UAB �SauleNet�, UAB �Silnet�, Aido Deveikio firma �Sinchronizacija�, UAB �Socius�, UAB �Sugardas�, UAB �Telelanas�, UAB �Telesat�, UAB �Televizijos komunikacijos�, UAB �Transteleservis�, UAB �Trigeris�, UAB �Verslo tiltas�, UAB �Viltuva�, UAB �Vinita�, Ivančiko IĮ ��aibas�, UAB ��aliasis namas�, UAB �Druskininkų televizija�, UAB �Funaris�, J. Jasiulionio IĮ, A. Kiek�os individuali įmonė, UAB �Levitel�, UAB �Mano kamanė�, Palionio firma �Miestelėnai�, UAB �Molėtų radijas ir televizija�, UAB �Pajūrio televizija�, UAB �Patrimpas�, UAB �Teletronika�, UAB �Ukmergės televizija�, J. Varno Vilniaus radijo studija.
Electronic communications department
Accounting and statistics division Vilma Grigaliūnienė, e-mail: [email protected] Julija Ivanova, e-mail: [email protected]