report on tests with close to reality conditions - europa on tests with close to reality ... fast...
TRANSCRIPT

© PROSOFC PROJECT
Report on tests with close to reality conditions
D3.3
www.prosofc-project.eu
Confidentiality PU Deliverable Type R
Project PROSOFC Project Number 325278
Contact Person Martin Hauth Organization AVL List GmbH
Phone +43 316 787 2770 E-mail [email protected]
The research leading to these results has received funding from the European Union’s Seventh Framework Programme
(FP7/2007-2013) for the Fuel Cells and Hydrogen Joint Technology Initiative under grant agreement n° 325278

Report on tests with close to reality conditions
12/22/2016 Page 1 of 25
Table of Contents
1 Publishable summary ............................................................................................................................ 3
3 Introduction .......................................................................................................................................... 5
4 Objectives.............................................................................................................................................. 5
5 Design of the close-to-reality test equipment ...................................................................................... 5
6 Test rig layout for close-to-reality tests .............................................................................................. 13
7 Test results and CFD validation ........................................................................................................... 15
7.1 Validation of thermal temperature field..................................................................................... 15
7.2 Validation of catalytic steam reforming behavior ...................................................................... 20
7.3 Validation of electrochemical behavior ...................................................................................... 22
8 Conclusion ........................................................................................................................................... 24
List of Figures
FIGURE 1: DESIGN OF CLOSE-TO-REALITY SEGMENTED SINGLE CELL TEST EQUIPMENT ....................................................................... 6
FIGURE 2: TEMPERATURE DISTRIBUTION INSIDE SINGLE CELL HOUSING AND ALONG CELL SURFACE WITH TWO HEATING ELEMENTS TURNED
ON .......................................................................................................................................................................... 7
FIGURE 3: EXPECTED TEMPERATURE GRADIENT ALONG THE SEGMENTED CELL BASED ON PRELIMINARY CFD CALCULATIONS ..................... 7
FIGURE 4: CLOSE-TO-REALITY TEST EQUIPMENT FOR SEGMENTED CELLS ......................................................................................... 8
FIGURE 5: THERMOCOUPLE POSITIONS IN ANODE FLOW FIELD ..................................................................................................... 9
FIGURE 6: SEGMENTED CELL TEST EQUIPMENT FOR CLOSE-TO-REALITY TESTS ................................................................................ 10
FIGURE 7: DIMENSION OF SEGMENTED CELL IN MM ................................................................................................................. 11
FIGURE 8: SEGMENTED CELL TEST EQUIPMENT SHOWING THE 4 SEGMENTED CATHODES OF THE CELL................................................. 11
FIGURE 9: CATHODE CONTACTING VIA GOLD GRIDS (LEFT: BOTTOM VIEW OF FLOW FIELD INTEGRATED IN CERAMIC STAMP, RIGHT: TOP VIEW
OF WIRE FEEDTHROUGHS) .......................................................................................................................................... 12
FIGURE 10: POSITION OF THE GAS MEASURING CHANNEL DEPENDING ON THE SEGMENTED CELL’S EMPLACEMENT ............................... 13
FIGURE 11: PROCESS FLOW DIAGRAM OF TEST RIG FOR CLOSE-TO-REALITY TESTS WITH SEGMENTED SINGEL CELL TEST EQUIPMENT ......... 14
FIGURE 12: 3D TEMPERATURE DISTRIBUTION OF THE CELL TEST EQUIPMENT ................................................................................ 15
FIGURE 13: TEMPERATURE PROFILE ALONG THE ANODE FLOW FIELD DURING OCV CONDITIONS (ALL 4 ELECTRIC HEATERS ARE TURNED ON,
N2=50.1 NL/H, H2=39.2 NL/H AND AIRCA=108.2 NL/H). TOP: MEASURED TEMPERATURE FIELD, MIDDLE: SIMULATED
TEMPERATURE FIELD BY CFD, BOTTOM: DIFFERENCE BETWEEN MEASUREMENT AND SIMULATION ............................................ 16
FIGURE 14: TEMPERATURE PROFILE ALONG THE ANODE FLOW FIELD DRAWING 3 A PER CATHODE (ALL 4 ELECTRIC HEATERS ARE TURNED
OFF, CH4=14.5 NL/H, N2=32 NL/H, AIRANODE=82 NL/H, H2=35 NL/H AND AIRCA=150 NL/H). TOP: MEASURED
TEMPERATURE FIELD, MIDDLE: SIMULATED TEMPERATURE FIELD BY CFD, BOTTOM: DIFFERENCE BETWEEN MEASUREMENT AND
SIMULATION ............................................................................................................................................................ 17

Report on tests with close to reality conditions
12/22/2016 Page 2 of 25
FIGURE 15: MEASURED TEMPERATURE FIELD ALONG ANODE FLOW FIELD FOR CH4 STEAM REFORMING CONDITIONS AT 800 °C (ALL 4
ELECTRIC HEATERS ARE TURNED OFF, I=5 A, CH4=15.5 NL/H, N2=32 NL/H, AIRANODE=82 NL/H, H2=35 NL/H AND AIRCA=150
NL/H) .................................................................................................................................................................... 18
FIGURE 16: COMPARISON OF STACK CFD SIMULATION AND CFD SIMULATION OF SEGMENTED SINGLE CELL (TOP HALF: SEGMENTED SINGLE
CELL, BOTTOM HALF: STACK SIMULATION) ..................................................................................................................... 19
FIGURE 17: FAST HEAT-UP TEST TO SHOW MAXIMUM TEMPERATURE GRADIENTS THAT CAN BE SIMULATED IN THE SEGMENTED SINGLE CELL
TEST RIG ................................................................................................................................................................. 19
FIGURE 18: H2 CONSUMPTION (DRY COMPOSITION) ALONG THE ANODE FLOW CHANNEL AT 800 °C (N2=32 NL/H, H2=50 NL/H AND
AIRCA=150 NL/H) .................................................................................................................................................. 20
FIGURE 19: H2 AND CH4 CONSUMPTION (DRY COMPOSITION) ALONG THE ANODE FLOW CHANNEL AT 800 °C (CH4=15.5 NL/H, N2=32
NL/H, AIRANODE=82 NL/H, H2=35 NL/H AND AIRCA=150 NL/H) ................................................................................. 21
FIGURE 20: LEFT PICTURE, UPPER HALF: SIMULATED H2 CONCENTRATION ALONG THE ANODE FLOW CHANNELS. LEFT PICTURE, BOTTOM
HALF: COMPARISON OF SIMULATED AND MEASURED H2 CONCENTRATION FOR THE 5 MEASUREMENT CHANNELS. RIGHT PICTURE,
UPPER HALF: SIMULATED CH4 CONCENTRATION ALONG THE ANODE FLOW CHANNELS. RIGHT PICTURE, BOTTOM HALF: COMPARISON
OF SIMULATED AND MEASURED CH4 CONCENTRATION FOR THE 5 MEASUREMENT CHANNELS. OPERATING PARAMETERS: T=800 °C,
I=0 A, CH4=15.5 NL/H, N2=32 NL/H, AIRANODE=82 NL/H, H2=35 NL/H AND AIRCA=150 NL/H. .................................... 22
FIGURE 21: CV CURVE OF SEGMENT 1 AND 2 FOR H2 OPERATION AT 800 °C (N2=32 NL/H, H2=50 NL/H AND AIRCA=150 NL/H) ...... 23
FIGURE 22: CV CURVE OF SEGMENT 3 AND 4 FOR H2 OPERATION AT 800 °C (N2=32 NL/H, H2=50 NL/H AND AIRCA=150 NL/H) ...... 23
FIGURE 23: CV CURVES OF ALL 4 SEGMENTS AT CH4 STEAM REFORMING CONDITIONS (LEFT DIAGRAM: MEASURED CV CURVES, RIGHT
DIAGRAM: SIMULATED CV CURVES). OPERATING PARAMETERS: T=800 °C, I=0-9 A, CH4=15.5 NL/H, N2=32 NL/H,
AIRANODE=82 NL/H, H2=35 NL/H AND AIRCA=150 NL/H............................................................................................ 24
Authors
Name, Partner E-mail
Martin Hauth, AVL List GmbH [email protected]

Report on tests with close to reality conditions
12/22/2016 Page 3 of 25
1 Publishable summary The purpose of the close-to-reality tests is to experimentally simulate temperature fields for single cells
similar to how they occur in a real stack. The results will then be used for the calibration of the stack
model’s catalytic reactions (steam reforming, water gas shift reaction), electrochemistry and heat
management calculations. Following requirements for the development of the new single cell test
equipment have been elaborated in the beginning of the project.
Temperature gradient between inlet and outlet of 100 – 150 K
Measurement and control of temperature field close to real stack conditions
Gas extraction channels to measure gas composition along the anode flow channel
Segmented cathode areas to measure local cell voltages
Capability to operate on H2 and CH4 steam reforming
Ideal electrical contacting and uniform gas distribution
Deliverable 3.3 reports the development, design and test results of the segmented single cell test
equipiment used for the close-to-reality tests. The test results are then taken for the calibration of the
AVL CFD simulation model which is used in WP4, task 4.3. The test equipment allows the experimental
simulation of stack like temperature fields along a single cell at H2 and CH4 steam reforming conditions.
Tests at OCV and polarization were perfomred. The measurement of the temperature distribution, the
gas conversion and the cell voltages along the cell provides detailed information for the CFD simulation
which can usually not be received from typical stack tests.
The close-to-reality segmented cell test equipment is a powerful tool to calibrate the CFD simulation
model. With this approach it was possible to finetune the thermal, electrochemical and catalytic models
in the CFD simulations to achive a very good accordance with the real measurements. This way the
measurement can be directly compared with results from the CFD simulation. On the other hand the CFD
can now be used for the design of experiment since it is able to reproduce the real operating conditions.
The calibration of the CFD model directly improves the accuracy of the full scale stack modeling in WP4,
task 4.3 where also the electrochemical and catalytic behavior of the stack needs to be implemented and
calibrated.
Since the temperature in the test equipment is measured only within the solid of the anode flow field the
CFD simulation provides additional information about the complete temperature field of all components
(cell, flow fields, glass sealing). Therefore, the temperature field can furthermore be used for additional
thermo-mechanical stress simulation using FE software. Since the measurement of mechanical
parameters (e.g. expansion of components, mechanical stresses) at high temperatures is rather
complicated within the cell test equipment the combination of CFD and FE simulation will be an useful

Report on tests with close to reality conditions
12/22/2016 Page 4 of 25
tool for further structural investigation such as delamination and cracking of cells and breakage of
sealings.
The results enabled in depth validation and further improvement of AVLs CFD simulation software. It is
planned to use this equipment further for future CFD simulation development.

Report on tests with close to reality conditions
12/22/2016 Page 5 of 25
3 Introduction Deliverable 3.3 reports the development, design and test results of the segmented single cell test
equipiment used for the close-to-reality tests. The test results are then taken for the calibration of the
AVL CFD simulation model which is used in WP4, task 4.3. The test equipment allows the experimental
simulation of stack like temperature fields along a single cell at H2 and CH4 steam reforming conditions.
Tests at OCV and polarization were perfomred. The measurement of the temperature distribution, the
gas conversion and the cell voltages along the cell provides detailed information for the CFD simulation
which can usually not be received from typical stack tests.
The test equipment turned out to be a very powerful instrument to sharpen the CFD simulation
algorithms and to further align simulation with real operation.
4 Objectives The purpose of the close-to-reality tests is to experimentally simulate temperature fields for single cells
similar to how they occur in a real stack. The results will then be used for the calibration of the stack
model’s catalytic reactions (steam reforming, water gas shift reaction), electrochemistry and heat
management calculations. Following requirements for the development of the new single cell test
equipment have been elaborated in the beginning of the project.
Temperature gradient between inlet and outlet of 100 – 150 K
Measurement and control of temperature field close to real stack conditions
Gas extraction channels to measure gas composition along the anode flow channel
Segmented cathode areas to measure local cell voltages
Capability to operate on H2 and CH4 steam reforming
Ideal electrical contacting and uniform gas distribution
Eventually the segmented single cell test equipment can be used to simulate or reproduce critical
temperature distributions and gradients based on particular issues coming from real stack operation.
Dedicated tests to investigate for example cell delamination, cell cracks or breakage of glass sealings can
be used to support FE simulations addressing thermo-mechanical stresses.
5 Design of the close-to-reality test equipment The design was developed by AVL and discussed in a workshop in Karlsruhe together with KIT and TOFC.
The aim was to improve a standard single cell housing concept by adding electrical heating elements
below the anode flow field (see Figure 1, top left picture). The segmented single cell housing is then be
placed in an electric oven to maintain the temperature up to 850 °C (see Figure 6). In addition to the

Report on tests with close to reality conditions
12/22/2016 Page 6 of 25
electric heating of the oven 4 electric heating elements will be used to control and adjust the temperature
field towards stack like temperature distributions.
Figure 1: Design of close-to-reality segmented single cell test equipment
In order to estimate the required electric power of the heating elements and to investigate the
temperature field a CFD supported design of the segmented single cell test equipment has been carried
out in the beginning (see Figure 2).
For a fast design approach in the beginning the cell housing was simulated without modelling the
electrochemistry. The heat produced by the electrochemical reactions was considered as local heat
sources within the preliminary CFD model. The electrochemistry as well as the reforming kinetics were
implemented at a later stage. The main aim of this CFD simulation was to confirm whether the 4 additional
electrical heaters provide enough power to generate the required temperature gradients and whether
the heat transfer within the segmented single cell test equipment allow temperature fields similar to real
stack operation.
Crofer base plate
Crofer anode flow field Segmented cell (cathode)
4 ceramic segmentedstamps
Crofer frame
Ceramicframe
Electrical contactweight (red)
Sealingweight(purple)
Electric heating elements

Report on tests with close to reality conditions
12/22/2016 Page 7 of 25
Figure 2: Temperature distribution inside single cell housing and along cell surface with two heating elements turned on
Figure 3 shows the expected temperature gradients based on the preliminary CFD calculation. It was
tested how the temperature field changes depending on the number of heating elements turned on. The
base case (simulation number 5) is considering an oven temperature of 600 °C and no additional heating
elements to be turned on. The temperature increase ΔTheating shown for the cases 1 – 4 are mainly due to
the additional heating elements. Only a small amount comes from the electrochemical reaction as can be
seen in case 5. ΔTedge considers the min./max. temperature difference for the whole cell area including
the non-active area (such as electrolyte area for sealing) while ΔTactive considers only the active area of the
cell.
Figure 3: Expected temperature gradient along the segmented cell based on preliminary CFD calculations
Legend
ΔTedge = Tcell,max – Tcell,min
ΔTactive = Tcell,active,max – Tcell,active,min
ΔTheating = Tcell,max – 600 °C
Simulation Number
1: HE (heating element) turned on all
2: HE 2 + 3
3: HE 3 + 4
4: HE 3
5: HE none

Report on tests with close to reality conditions
12/22/2016 Page 8 of 25
It was found that 4 heating elements with ~700 W each are sufficient to generate the required
temperature gradients and temperature fields.
The segmented single cell housing was built from Crofer and ceramic material (compare Figure 1 and
Figure 4). At regions where the temperature gradients were expected to be too high for ceramic material
Crofer was used to avoid cracking (e.g. anode flow field).
Figure 4: Close-to-reality test equipment for segmented cells
The temperatures in operation are measured in the solid part of the anode flow field. The position is a
few mm below the gas channel. It was decided to not directly measure the gas temperature in the anode
channel to avoid gas leakages and flow disturbances by thermocouples. Figure 5 shows the plane in which
the temperatures are measured as well as the exact positions.
For the following results it must be considered that the measured temperatures are not those directly
along the anode surface. However, by using the CFD it is possible to calculate back from the measured
temperatures to the actual temperatures in the anode channel and of the anode layer.

Report on tests with close to reality conditions
12/22/2016 Page 9 of 25
Figure 5: Thermocouple positions in anode flow field
As shown in Figure 6 the test equipment was mounted inside an electrical oven and connected to the
media supply (anode: H2, N2, CH4, H2O, air. cathode: air)

Report on tests with close to reality conditions
12/22/2016 Page 10 of 25
Figure 6: Segmented cell test equipment for close-to-reality tests
The cell exists of one continuous anode layer that is electrically contacted to the external load via the
surface of the anode flow field. The cathode is segmented into 4 areas which are individually contacted
to the external load. For each cathode segment the current can be controlled individually and the
responding cell voltage is recorded. Figure 7 shows the dimension of the segmented cell. Each cathode
area is about 40.5 x 44 mm2. The electrolyte and the anode layer have an area of 120 x 120 mm2.

Report on tests with close to reality conditions
12/22/2016 Page 11 of 25
Figure 7: Dimension of segmented cell in mm
Figure 8 shows the 4 segments of the cathode in assembly situation which are on top of the electrolyte
and anode layer. A commercial cell supplier was used as no samples from the stack partner within the
consortium were available by the time the tests have been performed. However, the development of the
test equipment and the whole methodology for the CFD calibration could be carried out according the
original project planning.
Figure 8: Segmented cell test equipment showing the 4 segmented cathodes of the cell

Report on tests with close to reality conditions
12/22/2016 Page 12 of 25
For electrical contacting one electrically separeted gold grid (see Figure 9) for each cathode segment was
used on the cathode side and one nickel grid for the complete anode side. The anode flow field is used as
a common earth in the electric configuration. This way the cell voltage could be measured individually for
each segment.
Figure 9: Cathode contacting via gold grids (left: bottom view of flow field integrated in ceramic stamp, right: top view of wire feedthroughs)
For sealing a commercial sealing glass was used. The sealing seperates the anode compartment
completely from the cathode and the environment. The cathode side is open towards the oven
environment. Cathode off gas is directly released to the oven while the anode off gas is circled back to a
dedicated exhaust gas system.
The gas conversion was monitored by measuring the gas composition along the anode flow direction as
shown in Figure 10.

Report on tests with close to reality conditions
12/22/2016 Page 13 of 25
Figure 10: Position of the gas measuring channel depending on the segmented cell’s emplacement
Channel 1 is the inlet of the first segment, channel 2 is the center of the first segment, channel 3 is the
outlet of the first segment and the inlet of the second segment respectively, channel 4 is the center of
the second segment in flow direction and channel 5 is the outlet of the second segment.
6 Test rig layout for close-to-reality tests The process flow diagram of the test rig for the segmented single cell test equipment is shown in Error!
Reference source not found.. The anode side is connected to H2, N2, Air, CH4 and H2O while the cathode
side is connected to Air.

Report on tests with close to reality conditions
12/22/2016 Page 14 of 25
Figure 11: Process flow diagram of test rig for close-to-reality tests with segmented singel cell test equipment

Report on tests with close to reality conditions
12/22/2016 Page 15 of 25
7 Test results and CFD validation
7.1 Validation of thermal temperature field Figure 12 shows exemplarily the 3D temperature distribution within the cell test equipment for a test
case at OCV conditions with H2/N2 operation. The CFD model was calibrated by the measured
temperature field to considere the correct heat transfer within the cell housing (e.g. from the heaters to
the anode flow field) as well as the heat transfer between the oven environment and the cell housing
(e.g. conductivitiy and convection from housing to environment).
Figure 12: 3D temperature distribution of the cell test equipment
The segmented single cell test equipment was heated up to ~600 °C by the electric oven. Additionally
the 4 electric heaters were turned on to generate a specific temperature field. A temperature
distribution in this particular case of 700-770 °C was achieved. The comparison of the measured and
simulated temperature field is shown in Figure 13. Similar tests have been performed for a different
number of active electric heaters and different heater powers.

Report on tests with close to reality conditions
12/22/2016 Page 16 of 25
Figure 13: Temperature profile along the anode flow field during OCV conditions (all 4 electric heaters are turned on, N2=50.1 Nl/h, H2=39.2 Nl/h and AirCa=108.2 Nl/h). Top: measured temperature field, middle: simulated temperature field by CFD, bottom: difference between measurement and simulation
Figure 14 shows the temperature field during CH4 steam reforming at 3 A per segment for the case that
no electrical heaters are used. The oven temperature was set to 800 °C in this case.

Report on tests with close to reality conditions
12/22/2016 Page 17 of 25
Figure 14: Temperature profile along the anode flow field drawing 3 A per cathode (all 4 electric heaters are turned off, CH4=14.5 Nl/h, N2=32 Nl/h, AirAnode=82 Nl/h, H2=35 Nl/h and AirCa=150 Nl/h). Top: measured temperature field, middle: simulated temperature field by CFD, bottom: difference between measurement and simulation

Report on tests with close to reality conditions
12/22/2016 Page 18 of 25
It can be shown that the simulated CFD temperature profile matches the measured temperature profile
within 5 K which is seen to be a very successful validation of the CFD model.
Figure 15 shows the temperature field for CH4 steam reforming conditions at 800 °C and 5 A. It
correlates very well with CH4 conversion behavior shown in Figure 19. Most CH4 is converted in the first
half of the cell which leads to a temperature decrease of about 7 K. This test shows that the
temperature profile can be measured in a sufficient quality to allow the usage for the calibration of the
CFD simulation.
Figure 15: Measured temperature field along anode flow field for CH4 steam reforming conditions at 800 °C (all 4 electric heaters are turned off, I=5 A, CH4=15.5 Nl/h, N2=32 Nl/h, AirAnode=82 Nl/h, H2=35 Nl/h and AirCa=150 Nl/h)
In Figure 16 the temperature field along the cell is compared between the simulation of the segemented
singe cell (upper half of picture) and the CFD simulation results from EPFL based on the SOLIDpower
stack (bottom half of picture). As can be seen the temperature gradients are similar to stack conditions
and therefore can be reproduced in the segmented single cell test equipment. The outlet temperature
of the segmented cell is cooler because the cell test equipment is not thermally insulated to the oven
environment. However, along the active area the temperature field matches the stack condition very
well. Unfortunately, no real stack temperature mesurements were available in the project (neither by
TOFC nor by SOLIDpower) to compare the simulation with.
Report on tests with close to reality conditions
12/22/2016 Page 19 of 25
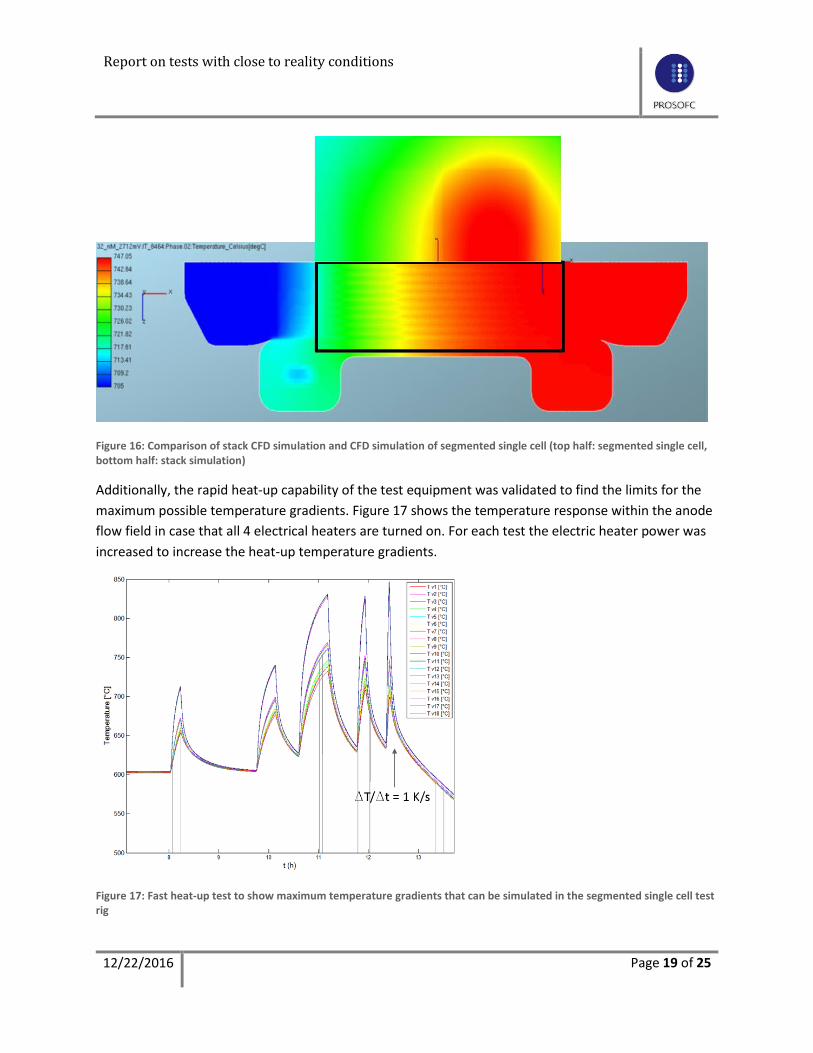
Figure 16: Comparison of stack CFD simulation and CFD simulation of segmented single cell (top half: segmented single cell, bottom half: stack simulation)
Additionally, the rapid heat-up capability of the test equipment was validated to find the limits for the
maximum possible temperature gradients. Figure 17 shows the temperature response within the anode
flow field in case that all 4 electrical heaters are turned on. For each test the electric heater power was
increased to increase the heat-up temperature gradients.
Figure 17: Fast heat-up test to show maximum temperature gradients that can be simulated in the segmented single cell test rig

Report on tests with close to reality conditions
12/22/2016 Page 20 of 25
It could be shown that very high temperature gradients of about 1 K/s can be realized with this test
equipment. This information is taken for potential future thermo-mechanical investiagtions. In the
current project this feature is not further used as the focus is more on the calibration of the CFD
simulation for stack operating conditions.
7.2 Validation of catalytic steam reforming behavior In order to allow a validation of the electrochemical performance of the CFD model the catalytic steam
reforming and shift reactions were investigated along the cell. Therefore, the cell was operated at
constant temperatures of 700, 750 and 800 °C under H2 and CH4 steam reforming conditions. CV curves
up to 12 A per segment (=673 mA/cm2) were generated. For specific current steps of the CV curve the
gas composition along the anode flow channel was measured using the 5 channels described above in
Figure 10. Figure 18 shows the result exemplarily for H2 operation at 800 °C.
Figure 18: H2 consumption (dry composition) along the anode flow channel at 800 °C (N2=32 Nl/h, H2=50 Nl/h and AirCa=150 Nl/h)
Similar tests were carried out in CH4 operation to test the steam reforming rate along the anode flow
channel (see Figure 19). Along the anode supply line of the test rig, steam was produced by catalytic
combustion of H2 with O2 from air (see Figure 11). O2 is completely converterd to H2O and a minor H2
excess stream was maintained to make sure that no O2 is entering the anode. The produced mixture of
steam, N2 and excess H2 was then mixed with CH4 and provided to the anode inlet.

Report on tests with close to reality conditions
12/22/2016 Page 21 of 25
Figure 19: H2 and CH4 consumption (dry composition) along the anode flow channel at 800 °C (CH4=15.5 Nl/h, N2=32 Nl/h, AirAnode=82 Nl/h, H2=35 Nl/h and AirCa=150 Nl/h)
The results in Figure 19 show the conversion of CH4 along the anode surface. In the same way the H2
content increases as more H2 is available from steam reforming (compare with curve at 0 A at OCV
condition). At increased currents the H2 content becomes lower due to electrochemical conversion to
H2O. Is interesting to mention that the CH4 does not reform completely already at the inlet but requires
approximately ¾ of the anode surface to be converterd almost completely. It was also observed that a
substantial amount of CH4 was reformerd already in the supply and return tubes of the test rig assembly
since stainless steel tubes have been used. Furthermore, steam reforming will also take place at the
Crofer anode flow field and the nickel mesh on the anode.
Figure 20 compares the measured H2 and CH4 concentration for CH4 steam reforming conditions at 800 °C
in OCV mode. The reforming behavior of CH4 in the CFD simulation was calibrated using an Arrhenius-
curve-fit of the measured data. This was possible, since the change in concentration of CH4 along the cell
was determined at three different temperatures at 700, 750 and 800 °C. The respective approaches for
the reforming-rate constant were taken from literature.

Report on tests with close to reality conditions
12/22/2016 Page 22 of 25
Figure 20: Left picture, upper half: simulated H2 concentration along the anode flow channels. Left picture, bottom half: Comparison of simulated and measured H2 concentration for the 5 measurement channels. Right picture, upper half: simulated CH4 concentration along the anode flow channels. Right picture, bottom half: comparison of simulated and measured CH4 concentration for the 5 measurement channels. Operating parameters: t=800 °C, I=0 A, CH4=15.5 Nl/h, N2=32 Nl/h, AirAnode=82 Nl/h, H2=35 Nl/h and AirCa=150 Nl/h.
The simulation meets the measurement very well. Based on this results of the simulation of the catalytic
steam reforming reactions the CV curve according to chapter 7.3 is carried out.
7.3 Validation of electrochemical behavior For H2 operation the CV curves for constant operating temperatures at 700, 750 and 800 °C were
measured. Figure 21 and Figure 22 show the measured (solid curves) and simulated (dotted curves) CV
curves for all 4 segments at 800 °C.

Report on tests with close to reality conditions
12/22/2016 Page 23 of 25
Figure 21: CV curve of segment 1 and 2 for H2 operation at 800 °C (N2=32 Nl/h, H2=50 Nl/h and AirCa=150 Nl/h)
Figure 22: CV curve of segment 3 and 4 for H2 operation at 800 °C (N2=32 Nl/h, H2=50 Nl/h and AirCa=150 Nl/h)
Figure 23 shows the measured (left) and fitted CV curves from the simulation. The CV curves were fitted
by adjusting the parameters of the Butler-Volmer Equation. Thereby the exchange-current-densities for
the anode- and the cathode-side as well as the cathodic and anodic transfer-coefficients are varied until
the resulting VI-curve of the CFD-calculation showed good agreement with measurements.

Report on tests with close to reality conditions
12/22/2016 Page 24 of 25
Figure 23: CV curves of all 4 segments at CH4 steam reforming conditions (left diagram: measured CV curves, right diagram: simulated CV curves). Operating parameters: t=800 °C, I=0-9 A, CH4=15.5 Nl/h, N2=32 Nl/h, AirAnode=82 Nl/h, H2=35 Nl/h and AirCa=150 Nl/h.
8 Conclusion The close-to-reality segmented cell test equipment is a powerful tool to calibrate the CFD simulation
model. With this approach it was possible to finetune the thermal, electrochemical and catalytic models
in the CFD simulations to achive a very good accordance with the real measurements. This way the
measurement can be directly compared with results from the CFD simulation. On the other hand the
CFD can now be used for the design of experiment since it is able to reproduce the real operating
conditions.
The calibration of the CFD model directly improves the accuracy of the full scale stack modeling in WP4,
task 4.3 where also the electrochemical and catalytic behavior of the stack needs to be implemented
and calibrated.
Since the temperature in the test equipment is measured only within the solid of the anode flow field
the CFD simulation provides additional information about the complete temperature field of all
components (cell, flow fields, glass sealing). Therefore, the temperature field can furthermore be used
for additional thermo-mechanical stress simulation using FE software. Since the measurement of
mechanical parameters (e.g. expansion of components, mechanical stresses) at high temperatures is
rather complicated within the cell test equipment the combination of CFD and FE simulation will be an
useful tool for further structural investigation such as delamination and cracking of cells and breakage of
sealings.

Report on tests with close to reality conditions
12/22/2016 Page 25 of 25
The results enabled in depth validation and further improvement of AVLs CFD simulation software. It is
planned to use this equipment further for future CFD simulation development.