report on statewide financial management and compliance ... · report on statewide financial...
TRANSCRIPT

REPORT ON STATEWIDE FINANCIAL MANAGEMENT
AND COMPLIANCE
FOR THE QUARTER ENDED SEPTEMBER 30, 2003
OFFICE OF THE COMPTROLLER
DEPARTMENT OF ACCOUNTS

This report is prepared using Spiral Binding at a cost of 10 cents per copy, a savings of $1.26 per copy from the CoverBind process.
Prepared and Published byDepartment of Accounts
Commonwealth of VirginiaP. O. Box 1971
Richmond, VA 23218-1971
For additional copies, contact:Electronic Publishing Manager
Administrative Services DivisionDepartment of Accounts� (804) 225-3051
This report is available online at: www.doa.virginia.gov
Text and graphics were produced using Microsoft Word for Windows in Arial and Times New Roman fonts. Printed November 2003 at the Department of Accounts on a Xerox 4890 highlight color printer.
TABLE OF CONTENTS
REPORT ON STATEWIDE FINANCIAL MANAGEMENT AND COMPLIANCE
Quarter Ended September 30, 2003 Page
STATEMENT OF PURPOSE .............................................................................................1
COMPLIANCE....................................................................................................................................................................
.............................................................
.....................................................................................
2Auditor of Public Accounts Reports - Executive Branch Agencies 2
Audit Reports – Quarter Ended September 30, 2003 2Agency Findings – Quarter Ended September 30, 2003 3Annual Summary of APA Audit Findings 6
Compliance Monitoring ..........................................................................................
.....................................................................................................................................................
................................................................................................................................
..................................................................................................................................................................
..................................................................................................................................................................................................
7Exception Registers 7Disbursement Processing 7Paperwork Decentralization 8
Decentralized Agencies 9Non-Decentralized Agencies 11
Prompt Payment Compliance 13E-Commerce 15
Financial Electronic Data Interchange (EDI) 17Employee EDI 18Direct Deposit 22Payroll Earnings Notices ................................................................
...............................................................................................................................................
..............................................................................................................................
....................................................................................................................................
....................................................................................................
........................................................................................................................................................................................................
.....................................................................................................................................
.............................................................................................................................................
....................................................................................................................................
26Small Purchase Charge Card (SPCC) and Increased Limit (GOLD) Card 31
Payroll Controls 37PMIS/CIPPS Payroll Audit 37PMIS/CIPPS Exceptions 40Payroll Certification 41Healthcare Reconciliations 43
FINANCIAL MANAGEMENT ACTIVITY 44Commonwealth Accounting and Reporting System (CARS) 44
CARS Edits 45Payroll 46
Benefit Participation by CIPPS Agencies 47Accounts Receivable 48
Comptroller’s Debt Setoff (CDS) Program 51Indirect Costs 53Loans and Advances 55Fixed Asset Accounting and Control System (FAACS) 57
STATEMENT OF PURPOSE
The Code of Virginia requires that the Department of Accounts (DOA) monitor and account for all transactions involving public funds. In order to carry out this mandate, the Department uses a variety of measures, including automated controls, statistical analyses, pre-audits and post-audits, staff studies and reviews of reports issued by the Auditor of Public Accounts. When taken as a whole, these measures provide an important source of information on the degree of agency compliance with Commonwealth accounting and financial management policies, internal controls, procedures, regulations, and practices.
The Comptroller's Report on Statewide Financial Management and Compliance (the Quarterly Report) is a summary of measures used by DOA to monitor transactions involving public funds and report findings to the Governor, his Cabinet, and other senior State officials. The Quarterly Report uses exception reporting and summary statistics to highlight key findings and trends. The Department also provides additional detailed financial management statistics for agencies and institutions of higher education.
This Quarterly Report includes information for the quarter ended September 30, 2003 and comparative FY 2003 data. Some information in the report is for the quarter ended June 30, 2003, which is the most current data available.
David A. Von Moll, CPA, CGFM Comptroller
9/30/03 Quarterly Report 1 Department of Accounts
COMPLIANCE
Auditor of Public Accounts Reports - Executive Branch Agencies
Agency audit reports issued by the Auditor of Public Accounts (APA) may contain findings because of noncompliance with state laws and regulations. Agencies may also have internal control findings considered to be reportable conditions. Reportable conditions involve matters relating to significant deficiencies in the design or operation of internal control that, in the Auditor’s judgement, could adversely affect the agency’s ability to safeguard assets or record, process, summarize, and report financial data consistent with the assertions of management.
Each agency must provide a written response that includes a Corrective Action Workplan (CAW) to the Department of Planning and Budget, the Department of Accounts, and the agency’s Cabinet Secretary when its audit report contains one or more audit findings. Workplans must be submitted within 30 days of receiving the audit report. Commonwealth Accounting Policies and Procedures (CAPP) manual, Topic 10205, Agency Response to APA Audit, contains instructions and guidance on preparing the workplan.
Audit Reports – Quarter Ended September 30, 2003
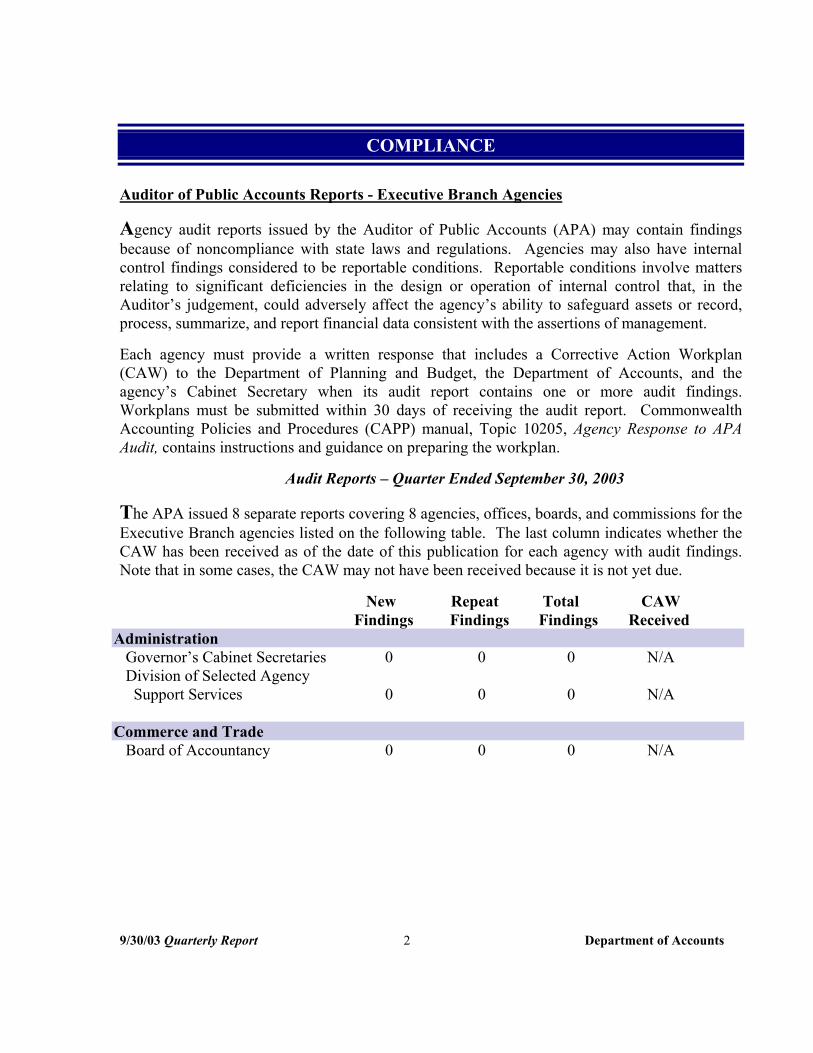
The APA issued 8 separate reports covering 8 agencies, offices, boards, and commissions for the Executive Branch agencies listed on the following table. The last column indicates whether the CAW has been received as of the date of this publication for each agency with audit findings. Note that in some cases, the CAW may not have been received because it is not yet due.
Administration
NewFindings
RepeatFindings
Total Findings
CAW Received
Governor’s Cabinet Secretaries Division of Selected Agency Support Services
0
0
0
0
0
0
N/A
N/A
Commerce and Trade Board of Accountancy 0 0 0 N/A
9/30/03 Quarterly Report 2 Department of Accounts
New Repeat Total CAW Findings Findings Findings Received
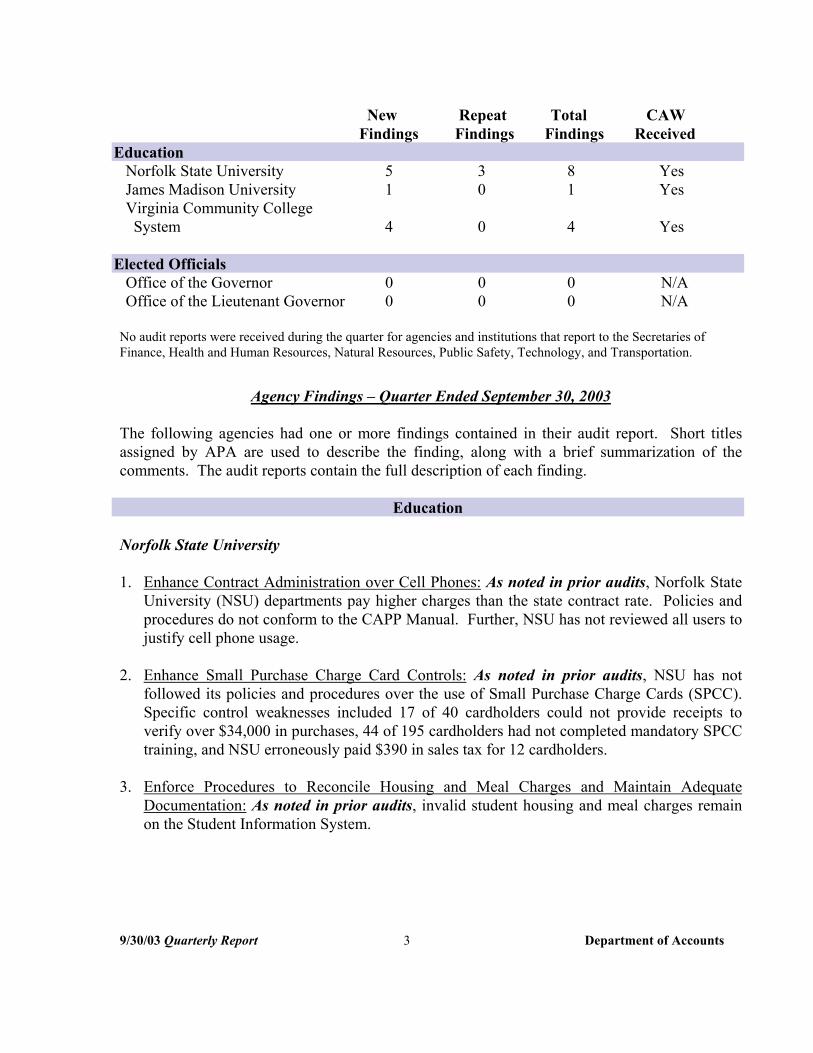
Education Norfolk State University 5 3 8 Yes James Madison University 1 0 1 Yes Virginia Community College System 4 0 4 Yes
Elected Officials Office of the Governor 0 0 0 N/A Office of the Lieutenant Governor 0 0 0 N/A
No audit reports were received during the quarter for agencies and institutions that report to the Secretaries of Finance, Health and Human Resources, Natural Resources, Public Safety, Technology, and Transportation.
Agency Findings – Quarter Ended September 30, 2003
The following agencies had one or more findings contained in their audit report. Short titles assigned by APA are used to describe the finding, along with a brief summarization of the comments. The audit reports contain the full description of each finding.
Education
Norfolk State University
1. Enhance Contract Administration over Cell Phones: As noted in prior audits, Norfolk State University (NSU) departments pay higher charges than the state contract rate. Policies and procedures do not conform to the CAPP Manual. Further, NSU has not reviewed all users to justify cell phone usage.
2. Enhance Small Purchase Charge Card Controls: As noted in prior audits, NSU has not followed its policies and procedures over the use of Small Purchase Charge Cards (SPCC). Specific control weaknesses included 17 of 40 cardholders could not provide receipts to verify over $34,000 in purchases, 44 of 195 cardholders had not completed mandatory SPCC training, and NSU erroneously paid $390 in sales tax for 12 cardholders.
3. Enforce Procedures to Reconcile Housing and Meal Charges and Maintain Adequate Documentation: As noted in prior audits, invalid student housing and meal charges remain on the Student Information System.
9/30/03 Quarterly Report 3 Department of Accounts
Norfolk State University - continued
4. Update Information Technology Security and Contingency Plan: NSU has not updated certain components of its information technology security program to reflect its current operating environment. Neither has it updated its contingency plan. NSU has experienced several changes in its computer environment in recent years.
5. Develop and Implement Information Security Policies and Procedures over Network Environment: NSU has not developed formal information technology policies and procedures to provide security controls for its network environment in accordance with the Commonwealth’s ITRM Standard SEC2001-01.1.
6. Develop Policies and Procedures for Maintaining Security Controls on AIX UNIX: NSU does not have written policies and procedures for maintaining security controls on its server. The UNIX server had certain services turned on that could allow for unauthorized access. Also, no user accountability exists for changes made to the UNIX system.
7. Adhere to Contract Administrator Responsibilities: The audit included a review of seven contracts for compliance with the contract’s terms and conditions. Three contracts had instances of noncompliance, of which two involved over-billings and overpayments.
8. Obtain Proper Approval for Information Technology Contracts: NSU did not secure the required approval from the Department of Information Technology for technology procurements exceeding $100,000.
James Madison University
1. Strengthen Controls over the Small Purchase Charge Card Program: The audit disclosed several internal control weaknesses. JMU did not perform required annual analyses of cardholder usage. Two cardholders split purchases to circumvent transaction limits, three cardholders paid sales taxes on purchases, one cardholder shared the card with another employee, and one cardholder did not have receipts for amounts charged.
Virginia Community College System
1. Update Information Security Plan: Since 1998, the System Office has not updated the Office’s comprehensive information security plan to reflect its current operating environment.
9/30/03 Quarterly Report 4 Department of Accounts
Virginia Community College System - continued
2. Enhance Fixed Asset Procedures: Individual colleges do not always properly record fixed asset changes in the Fixed Asset Inventory System and do not follow adequate fixed asset accounting and control procedures.
3. Properly Administer Return of Title IV Funds: Two colleges did not always record and post Title IV refunds in a timely manner. The two also failed to promptly return federal funds to the federal Department of Education. Additionally, one other college failed to properly calculate Title IV refunds.
4. Provide Campus Security Report to All Current and Prospective Students and Employees: One college did not completely prepare and directly provide to students and employees their annual campus security report. Two other colleges did not directly provide students and employees their annual security reports. The federal Department of Education in 34 CFR 668.41(e) requires that currently enrolled students and employees receive the institution’s annual campus security report in its entirety.
� � � � �
9/30/03 Quarterly Report 5 Department of Accounts

Annual Summary of APA Audit Findings
As of September 30, 2003, the Auditor of Public Accounts has issued audit reports for 73 executive branch agencies for FY 2002. Thirty-three of these reports reflected no internal control weaknesses or compliance findings. The remaining 40 agencies’ audit reports contained 100 audit findings citing internal control weaknesses and noncompliance. For FY 2001, 34 reports contained findings and 118 total findings were reported. About 41 percent of the FY 2002 audit findings were reported in the Financial Accounting Systems and reporting area compared to 37 percent for the previous year.
Statewide Findings by Category FY 2001 – FY 2002 Comparison
Financial Resources
Cash Receipts & Revenue
Expenditures & Procurement
Payroll & Leave Accounting
Federal Grants Accounting
Financial Aid
Financial Accounting Systems & Reporting
Miscellaneous
0
2002 2001
5 10 15 20 25 30 35 40 45 50 Number of Findings
New Repeat Total Category Findings Findings FindingsFinancial Accounting Systems & Reporting 30 11 41 Financial Resources 15 6 21 Expenditures & Procurement 10 3 13 Miscellaneous 7 3 10 Federal Grant Accounting 6 2 8 Cash Receipts & Revenue 1 2 3 Payroll & Leave Accounting 1 2 3 Financial Aid 0 1 1 Total 70 30 100
9/30/03 Quarterly Report 6 Department of Accounts
Compliance Monitoring
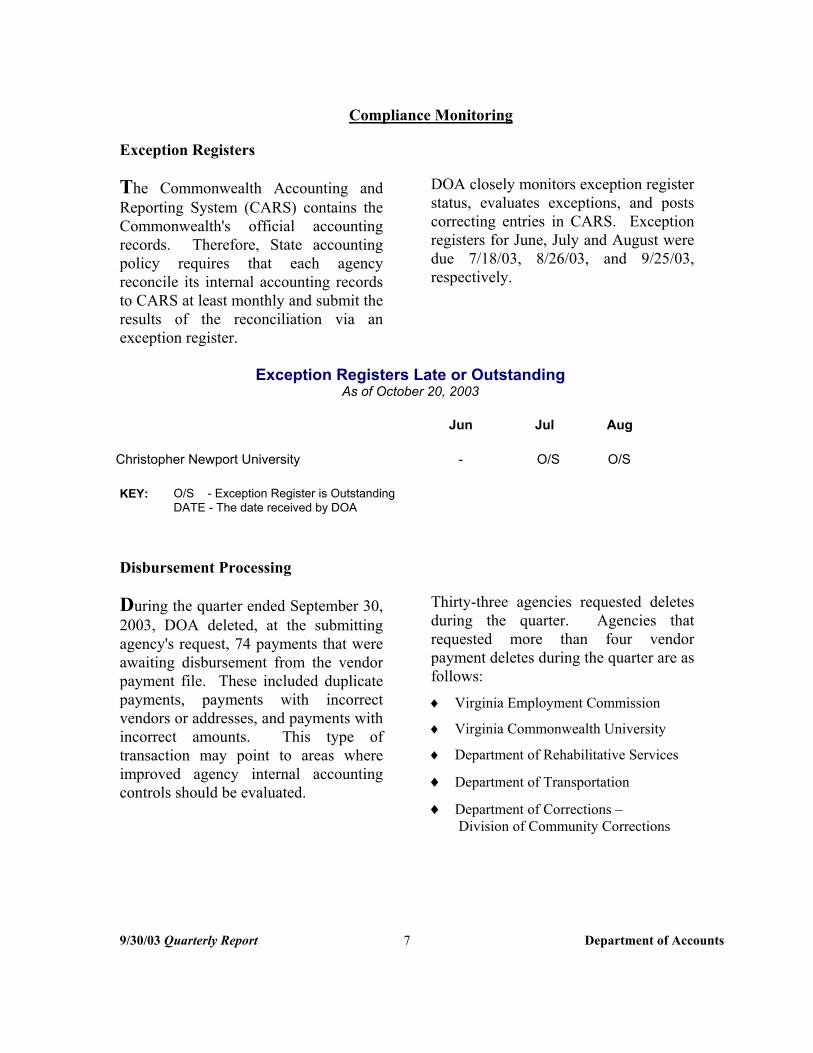
Exception Registers
The Commonwealth Accounting and Reporting System (CARS) contains the Commonwealth's official accounting records. Therefore, State accounting policy requires that each agency reconcile its internal accounting records to CARS at least monthly and submit the results of the reconciliation via an exception register.
DOA closely monitors exception register status, evaluates exceptions, and posts correcting entries in CARS. Exception registers for June, July and August were due 7/18/03, 8/26/03, and 9/25/03, respectively.
Exception Registers Late or OutstandingAs of October 20, 2003
Jun Jul Aug
Christopher Newport University - O/S O/S
KEY: O/S - Exception Register is Outstanding DATE - The date received by DOA
Disbursement Processing
During the quarter ended September 30, 2003, DOA deleted, at the submitting agency's request, 74 payments that were awaiting disbursement from the vendor payment file. These included duplicate payments, payments with incorrect vendors or addresses, and payments with incorrect amounts. This type of transaction may point to areas where improved agency internal accounting controls should be evaluated.
Thirty-three agencies requested deletes during the quarter. Agencies that requested more than four vendor payment deletes during the quarter are as follows:
♦ Virginia Employment Commission
♦ Virginia Commonwealth University
♦ Department of Rehabilitative Services
♦ Department of Transportation
♦ Department of Corrections – Division of Community Corrections
9/30/03 Quarterly Report 7 Department of Accounts

Paperwork Decentralization
The Commonwealth has decentralized the pre-auditing of most disbursements to individual agencies under a grant of delegated authority from the State Comptroller. Prior to the implementation of the program, over two million document sets (batches) were sent to the central repository each year. This program reduces the flow of documents from these agencies to the central repository in Richmond.
The overall quality of the State pre-audit program is monitored through the use of quality control reviews conducted by DOA staff. Results of these reviews are provided to the agency with corrective action recommendations. The great majority of problems encountered involve documentation inconsistencies, which should be easily corrected. Travel vouchers continue to be the primary source of all problems found.
Vouchers Processed Quarter Ended September 30, 2003
��������������������������������������������������������������������������������������������������������������������������������������������������������
Non-Decentralized
Agencies 15%
����������������������������������������������������������������������������
����������������������������������������������������������������������������
Decentralized Agencies
85%
Note: Totals include vouchers processed by decentralized higher education institutions.
9/30/03 Quarterly Report 8 Department of Accounts
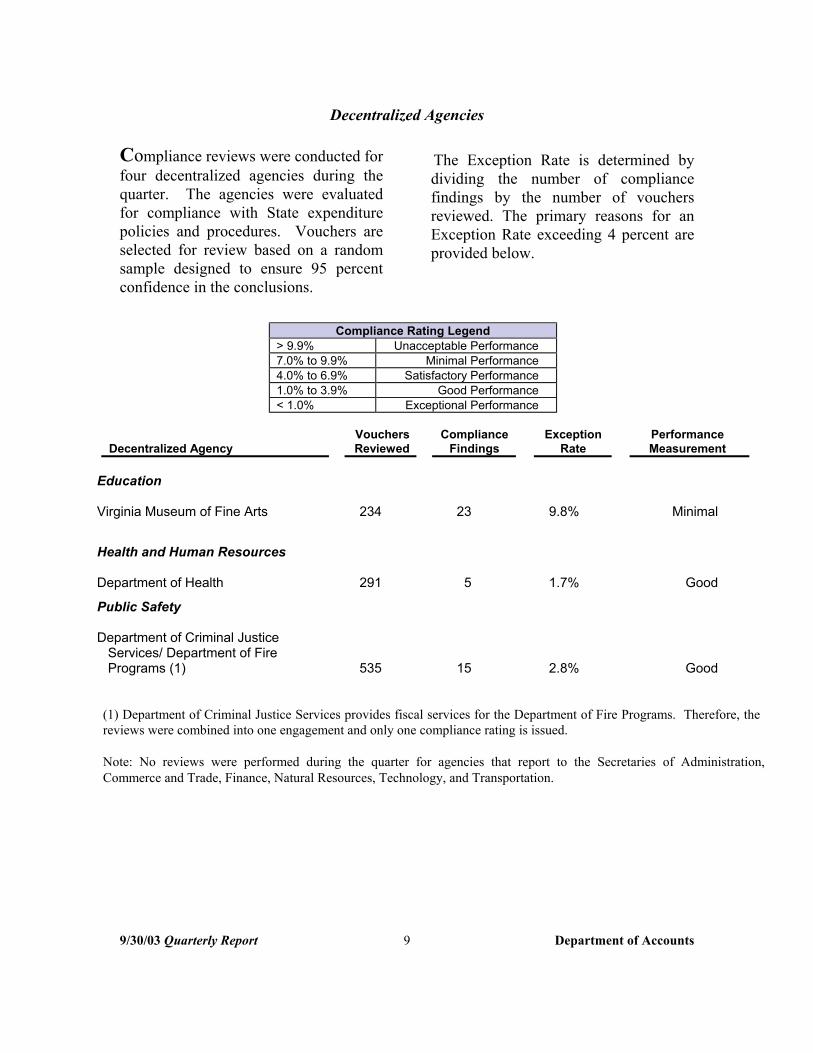
Decentralized Agencies
Compliance reviews were conducted for four decentralized agencies during the quarter. The agencies were evaluated for compliance with State expenditure policies and procedures. Vouchers are selected for review based on a random sample designed to ensure 95 percent confidence in the conclusions.
The Exception Rate is determined by dividing the number of compliance findings by the number of vouchers reviewed. The primary reasons for an Exception Rate exceeding 4 percent are provided below.
Compliance Rating Legend > 9.9% Unacceptable Performance 7.0% to 9.9% Minimal Performance 4.0% to 6.9% Satisfactory Performance 1.0% to 3.9% Good Performance < 1.0% Exceptional Performance
Decentralized Agency
Education
Vouchers Reviewed
Compliance Findings
Exception Rate
PerformanceMeasurement
Virginia Museum of Fine Arts 234 23 9.8% Minimal
Health and Human Resources
Department of Health 291 5 1.7% Good
Public Safety
Department of Criminal Justice Services/ Department of Fire Programs (1) 535 15 2.8% Good
(1) Department of Criminal Justice Services provides fiscal services for the Department of Fire Programs. Therefore, the reviews were combined into one engagement and only one compliance rating is issued.
Note: No reviews were performed during the quarter for agencies that report to the Secretaries of Administration, Commerce and Trade, Finance, Natural Resources, Technology, and Transportation.
9/30/03 Quarterly Report 9 Department of Accounts
Agencies With Performance Ratings Lower Than “Good”
Virginia Museum of Fine Arts – Minimal Performance – The performance level is attributable to compliance findings for travel vouchers. Inadequate documentation accounted for the majority of the 22 travel voucher findings. Some of the more prevalent findings include the following:
Travel Vouchers
♦ Inadequate documentation and lack of original receipts (11)♦ Meal costs exceed the guidelines (6)♦ No overnight travel estimate sheet (4)
� � � � �
9/30/03 Quarterly Report 10 Department of Accounts
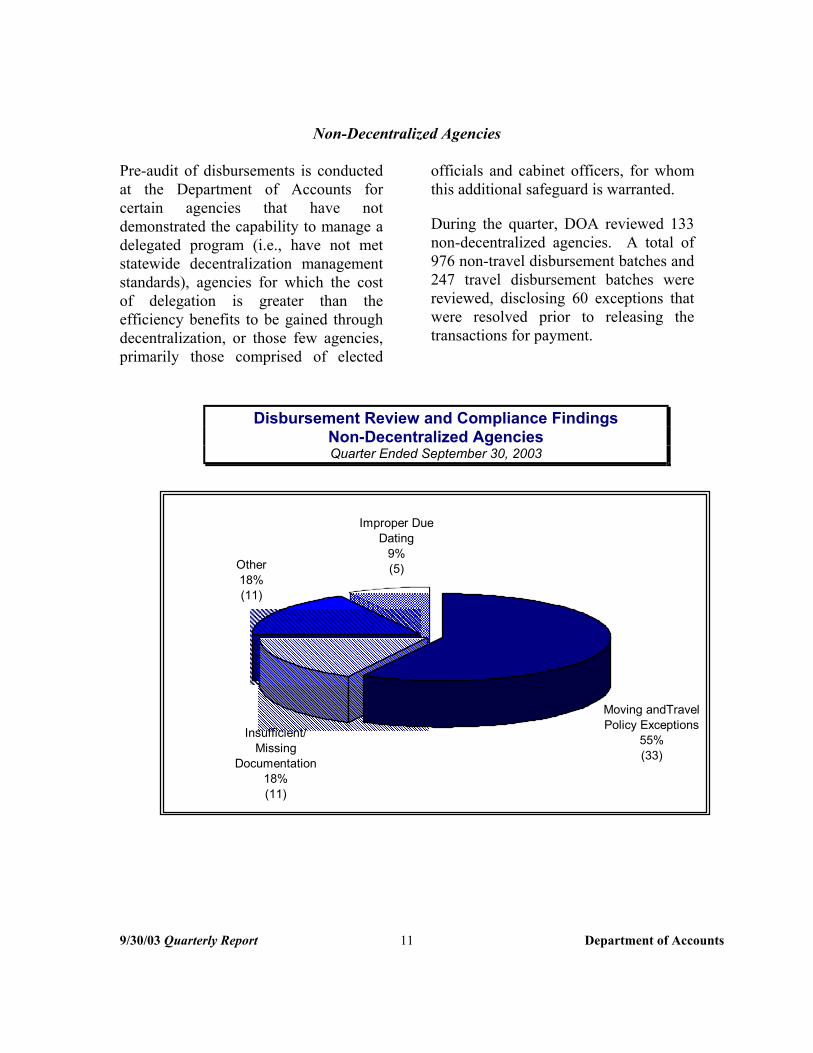
Non-Decentralized Agencies
Pre-audit of disbursements is conducted at the Department of Accounts for certain agencies that have not demonstrated the capability to manage a delegated program (i.e., have not met statewide decentralization management standards), agencies for which the cost of delegation is greater than the efficiency benefits to be gained through decentralization, or those few agencies, primarily those comprised of elected
officials and cabinet officers, for whom this additional safeguard is warranted.
During the quarter, DOA reviewed 133 non-decentralized agencies. A total of 976 non-travel disbursement batches and 247 travel disbursement batches were reviewed, disclosing 60 exceptions that were resolved prior to releasing the transactions for payment.
Disbursement Review and Compliance FindingsNon-Decentralized AgenciesQuarter Ended September 30, 2003
9/30/03 Quarterly Report 11 Department of Accounts
��������������������������������������������������������������
�������������������������������������������������������������������
�������������������������������������������������������������������
�����������������������������������������������������������������������������������������������������������������������������������������������������������������������������������������������������
��������������������������������������������������������������
����������
������������������������������������������������������������������������������������������������������������
������������������������������������������������������������������������������������������������
Improper DueDating
9%Other (5)18%
Moving andTravelPolicy Exceptions
55%(33)
�������������������������������
�������������������������������
������������������������������� ������������������������������� �������������������������������
�������������������������������������������������������������� �������������������������������������������������������������� �������������������������������������������������������������������
��������������������������������������������������������������������������������������������������������������������������������������
������������������������������������������������������������������������������������������������������������
������������������������������������������������������������������������������������������������
�������������������������������������������������������������������
��������������������������������������������������������������������������������������������������������������������������������������
Insufficient/ Missing
Documentation 18% (11)
(11)
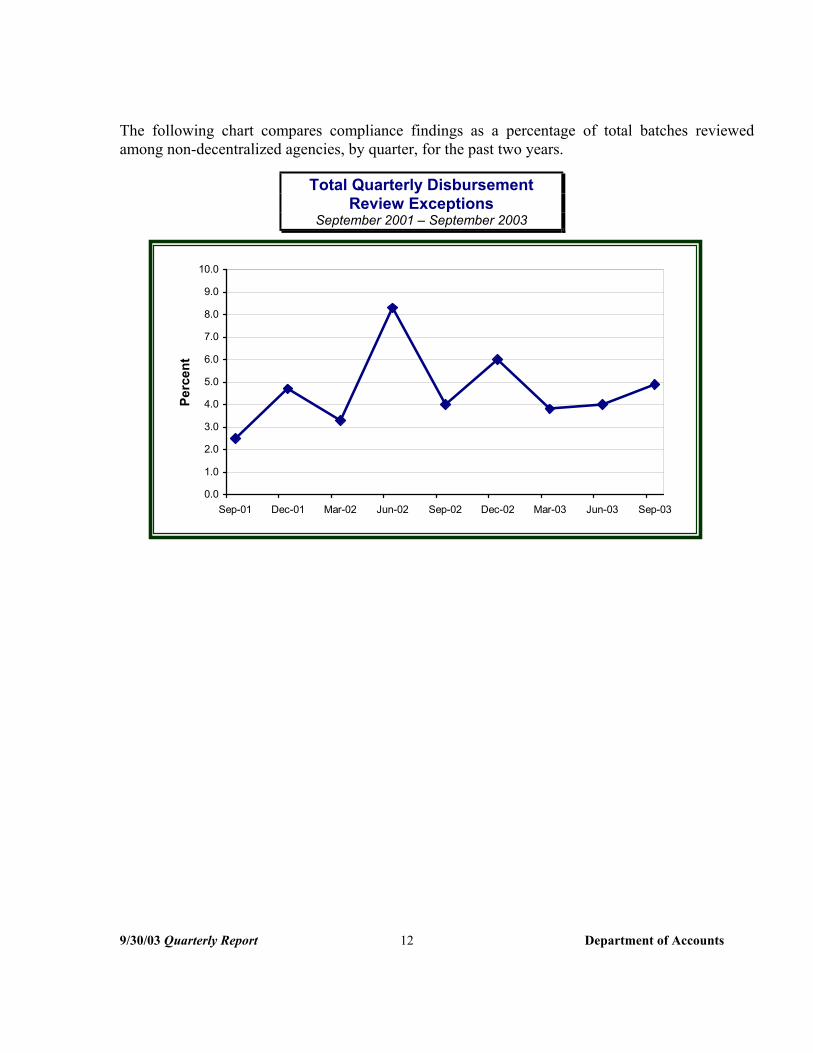
The following chart compares compliance findings as a percentage of total batches reviewed among non-decentralized agencies, by quarter, for the past two years.
Total Quarterly DisbursementReview Exceptions
September 2001 – September 2003
Perc
ent
0.0
1.0
2.0
3.0
4.0
5.0
6.0
7.0
8.0
9.0
10.0
Sep-01 Mar-03 Jun-03 Sep-03 Dec-01 Mar-02 Jun-02 Sep-02 Dec-02
9/30/03 Quarterly Report 12 Department of Accounts

Prompt Payment Compliance
The Prompt Payment Act requires that State agencies and institutions pay for goods and services by the required payment due date. The reporting required by the Code of Virginia Section 2.2-4356 is being met by the information presented here. This section details the number and dollar amounts of late payments by secretarial area, institutions
and agencies, and the total amount of interest paid. Agencies and institutions that process 50 or more vendor payments during a quarter are reported as not meeting Prompt Pay requirements if fewer than 95 percent of their payments are processed by the required due date.
Statewide Prompt Payment Performance Statistics
Quarter Ended September 30, 2003
Comparative Quarter Ended
September 30, 2002 Late Total Late
Number of Payments 7,228 621,194 9,306 6
Dollars (in thousands) $20,458 $1,262,320 $68,013 $1,2
Interest Paid on Late Payments $1,401
Percentage of Payments in Compliance 98.8%
Total
28,833
16,954
$5,052
98.5%
� � � � �
9/30/03 Quarterly Report 13 Department of Accounts
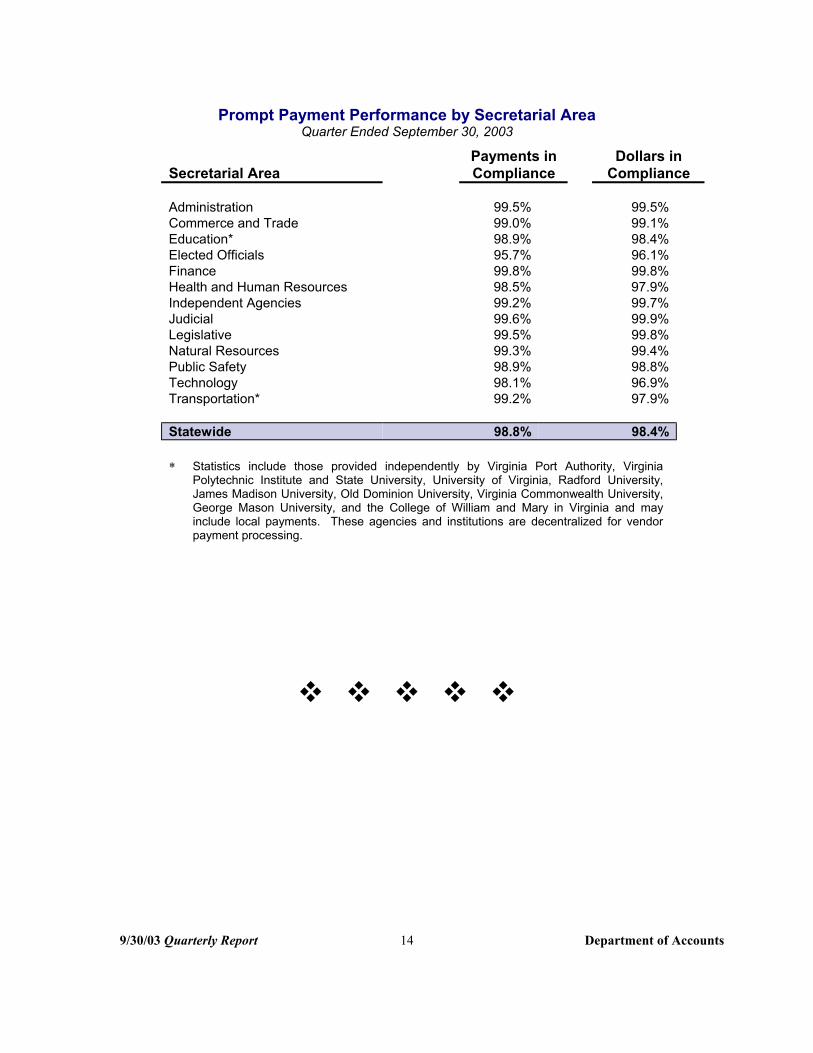
Prompt Payment Performance by Secretarial AreaQuarter Ended September 30, 2003
Payments in Secretarial Area Compliance
Administration 99.5% Commerce and Trade 99.0% Education* 98.9% Elected Officials 95.7% Finance 99.8% Health and Human Resources 98.5% Independent Agencies 99.2% Judicial 99.6% Legislative 99.5% Natural Resources 99.3% Public Safety 98.9% Technology 98.1% Transportation* 99.2%
Statewide 98.8%
Dollars in Compliance
99.5% 99.1% 98.4% 96.1% 99.8% 97.9% 99.7% 99.9% 99.8% 99.4% 98.8% 96.9% 97.9%
98.4%
* Statistics include those provided independently by Virginia Port Authority, Virginia Polytechnic Institute and State University, University of Virginia, Radford University, James Madison University, Old Dominion University, Virginia Commonwealth University, George Mason University, and the College of William and Mary in Virginia and may include local payments. These agencies and institutions are decentralized for vendor payment processing.
� � � � �
9/30/03 Quarterly Report 14 Department of Accounts

For the quarter ended September 30, 2003, the following agencies and institutions that processed more than 50 vendor payments during the quarter were below the 95 percent prompt payment performance standard.
Prompt Payment Compliance RateAgencies Below 95%
Quarter Ended September 30, 2003
Late Total Payments
in Agency Payments Payments Compliance
Education Gunston Hall Plantation 6 105 94.3% The Science Museum of Virginia 54 877 93.8%
Elected Officials Attorney General and Department of Law 37 460 92.0%
Health and Human Resources Southeastern Virginia Training Center 427 1,040 58.9%
Public SafetyCentral Region Correctional Field Units 98 838 88.3%
Prompt Payment Explanations
Explanations for low prompt payment compliance rates for the first quarter of FY 2004 were provided by the following agencies. Not all agencies elected to provide written explanations.
Gunston Hall Plantation has one employee to handle administration, accounting, human resources and purchasing functions. They continue to strive to meet prompt payment standards.
� � � � �
9/30/03 Quarterly Report 15 Department of Accounts

E-Commerce
The primary goal of the Department of Accounts’ electronic commerce initiative is to reduce the number of state issued checks by using more efficient electronic payment processes. Tools such as Financial Electronic Data Interchange (EDI), Payroll Direct Deposit, and the Small Purchase Charge Card (SPCC) are more reliable and cost effective than traditional paper checks. Electronic payments are also more secure because of the use of encryption devices and other security measures. In addition to these tools, the use of electronic earnings notices through the Payline Opt Out program further reduces paper processing and related costs.
EDI, Direct Deposit, SPCC and Payline Opt Out are best practices that demonstrate effective financial management, particularly during difficult economic times. They increase efficiency in processing and eliminate wasteful use of time, paper, printing, and postage for both large and small vendor payments, payroll, and employee travel reimbursement. Agencies and institutions are expected to embrace these practices to the fullest extent possible. On the following pages, agencies and institutions are identified if e-commerce statistics indicate that they are not fully utilizing these tools.
Statewide E-Commerce Performance Statistics
Quarter Ended Comparative
Quarter Ended September 30, 2003 September 30, 2002
Percent E-Commerce Total Percent
Number of Payments
Payment Amounts
562,281 1,002,975
$4,509,455,826 $5,381,872,945
56.1%
83.8%
54.4%
81.3%
9/30/03 Quarterly Report 16 Department of Accounts

Financial Electronic Data Interchange (EDI)
The dollar volume of Financial EDI payments for the first quarter of FY 2004 increased by $24.1 million from the same quarter last year. The number of trading partner accounts increased by
162 percent from September 2002. The largest portion of this increase is due to efforts to convert state employee travel reimbursements from checks to electronic payments.
Financial EDI Activity
Financial EDI Activity
Number of Payments
Quarter EndedSeptember 30, 2003
Comparative Quarter Ended
September 30, 2002
19,901 28,916 Amount of Payments $3,859,490,391 $3,835,424,792
Number of Invoices Paid 146,729 122,326 Estimated Number of Checks Avoided 55,872 43,326
Number of Trading Partner Accounts as of 9-30-03 13,220 5,039
EDI Payment ComparisonFY 2003 – FY 2004
$0
$200 $400
$600
$800 $1,000
$1,200 $1,400
$1,600 $1,800
$2,000
Mill
ions
JUL AUG SEP OCT NOV DEC JAN FEB MAR APR MAY JUN
2003 2004
9/30/03 Quarterly Report 17 Department of Accounts

Employee EDI
Expansion of the Employee EDI program is an integral part of the statewide effort to reduce the administrative costs associated with paying for goods and services for the Commonwealth. The Appropriation Act requires employees who travel more than twice a year to be reimbursed using EDI.
Although participation among certain agencies has increased, many agencies
have failed to enroll employees in EDI as required by law. In accordance with Section 4-5.06g of the Appropriation Act, the Comptroller will charge agencies $1 for each travel reimbursement check issued in lieu of Employee EDI beginning with the second quarter of FY 2004. Agencies are expected to take action to enroll applicable employees in the EDI program and thus avoid the fees altogether.
Employee EDI Growth October 2002 – September 2003
9/30/03 Quarterly Report 18 Department of Accounts
# of Employees Enrolled % EDI Travel Reimbursement
14,000 60% 55%
# of
Em
ploy
ee E
DI A
ccou
nts 12,000 50%
45%10,000 40%
8,000 35% 30%
6,000 25% 20%
4,000 15% 10%2,000 5%
0 0% OCT NOV DEC JAN FEB MAR APR MAY JUN JUL AUG SEP
% o
f Tra
vel R
eim
burs
emen
ts M
ade
Via
EDI

The following table lists by secretarial area the percentage of travel reimbursements that were made via EDI versus the number of checks that were written for travel reimbursements during the quarter. The statistics include all travel reimbursements, whether for state or non-state employees.
Travel Reimbursement Employee EDI Performance
by Secretarial AreaQuarter Ended September 30, 2003
Secretarial Area Percent Reimbursement Checks Issued
Administration Commerce and Trade Education* Elected Officials Finance Health and Human Resources Independent Agencies Judicial Legislative Natural Resources Public Safety Technology Transportation*
Statewide
Statewide
38.2% 72.5% 28.8% 18.8% 87.0% 60.9% 70.5% 6.3%
45.7% 43.0%20.3% 5.7%
54.5%
42.4%
Comparative Quarter Ended September 30, 2002
12.1%
162 805
2,786 181 85
2,905 390
3,002 406
965 4,430
66 213
16,396
27,624
* Statistics do not include agencies and institutions decentralized for vendor payment processing and the Department of Transportation, which currently processes travel reimbursements through petty cash.
� � � � �
9/30/03 Quarterly Report 19 Department of Accounts
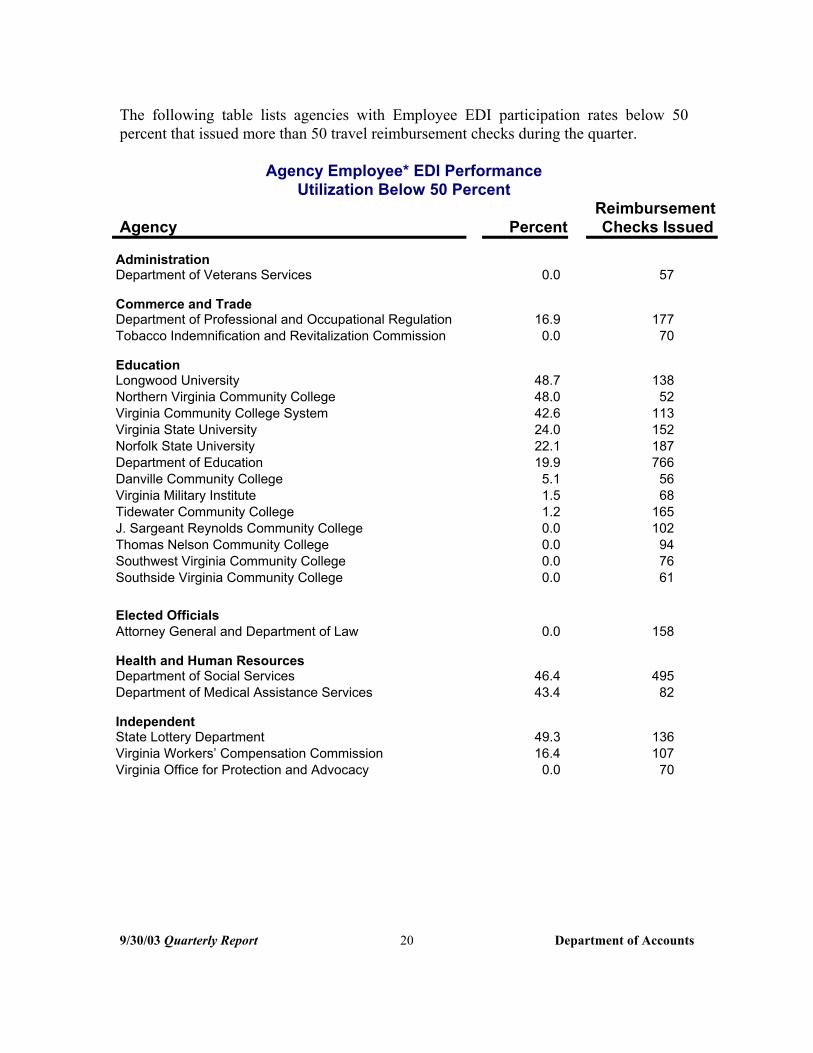
The following table lists agencies with Employee EDI participation rates below 50 percent that issued more than 50 travel reimbursement checks during the quarter.
Agency Employee* EDI Performance Utilization Below 50 Percent
ReimbursementAgency
Administration
Percent Checks Issued
Department of Veterans Services 0.0 57
Commerce and Trade Department of Professional and Occupational Regulation 16.9 177 Tobacco Indemnification and Revitalization Commission 0.0 70
Education Longwood University 48.7 138 Northern Virginia Community College 48.0 52 Virginia Community College System 42.6 113 Virginia State University 24.0 152 Norfolk State University 22.1 187 Department of Education 19.9 766 Danville Community College 5.1 56 Virginia Military Institute 1.5 68 Tidewater Community College 1.2 165 J. Sargeant Reynolds Community College 0.0 102 Thomas Nelson Community College 0.0 94 Southwest Virginia Community College 0.0 76 Southside Virginia Community College 0.0 61
Elected Officials Attorney General and Department of Law 0.0 158
Health and Human Resources Department of Social Services 46.4 495 Department of Medical Assistance Services 43.4 82
IndependentState Lottery Department 49.3 136 Virginia Workers’ Compensation Commission 16.4 107 Virginia Office for Protection and Advocacy 0.0 70
9/30/03 Quarterly Report 20 Department of Accounts

ReimbursementAgency Percent Checks Issued
Judicial Virginia State Bar 19.9 177 Circuit Courts 0.0 824 Supreme Court 0.0 727 General District Courts 0.0 314 Juvenile and Domestic Relations District Courts 0.0 302 Combined District Courts 0.0 286 Magistrate System 0.0 258
LegislativeSenate 42.9 52 House of Delegates 12.7 124
Natural Resources Department of Game and Inland Fisheries 0.0 801
Public Safety Department of Criminal Justice Services 34.2 331 Department of Corrections – Central Administration 28.3 99 Department of Corrections - Division of Community Corrections 15.9 506
Virginia Correctional Enterprises 13.0 121 Department of Corrections – Division of Institutions 7.9 105 Department of Fire Programs 0.8 120 Department of State Police 0.0 1,411 Department of Juvenile Justice 0.0 851 Department of Military Affairs 0.0 92
TechnologyVirginia Information Technologies Agency 0.0 56
TransportationDepartment of Motor Vehicles 47.8 179
* Current statistics include all travel reimbursements, whether for state or non-state employees. Several of the agencies listed process reimbursements to non-state employees.
� � � � �
9/30/03 Quarterly Report 21 Department of Accounts
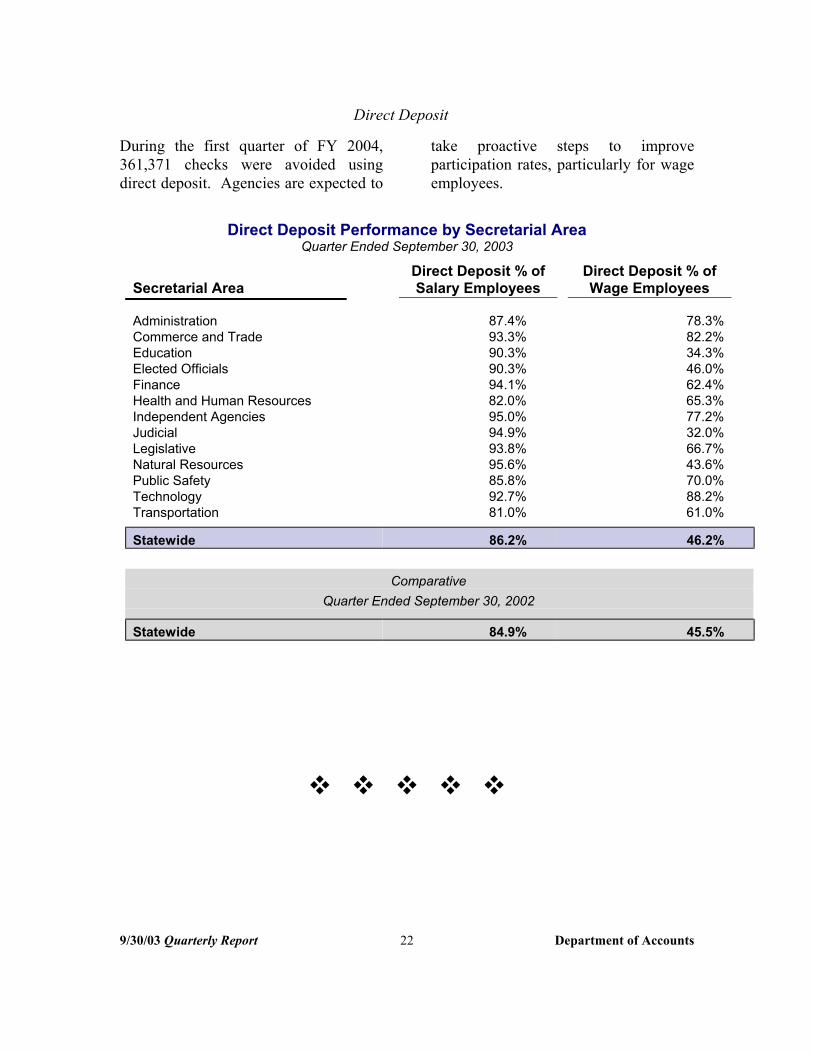
Direct Deposit
During the first quarter of FY 2004, take proactive steps to improve 361,371 checks were avoided using participation rates, particularly for wage direct deposit. Agencies are expected to employees.
Direct Deposit Performance by Secretarial AreaQuarter Ended September 30, 2003
Secretarial Area Direct Deposit % of Salary Employees
87.4% 93.3% 90.3% 90.3% 94.1% 82.0% 95.0% 94.9% 93.8% 95.6% 85.8% 92.7% 81.0%
Direct Deposit % of Wage Employees
Administration Commerce and Trade Education Elected Officials Finance Health and Human Resources Independent Agencies Judicial Legislative Natural Resources Public Safety Technology Transportation
78.3% 82.2% 34.3% 46.0% 62.4% 65.3% 77.2% 32.0% 66.7% 43.6% 70.0% 88.2% 61.0%
Statewide 86.2% 46.2%
QComparative
uarter Ended September 30, 2002
Statewide 84.9% 45.5%
� � � � �
9/30/03 Quarterly Report 22 Department of Accounts
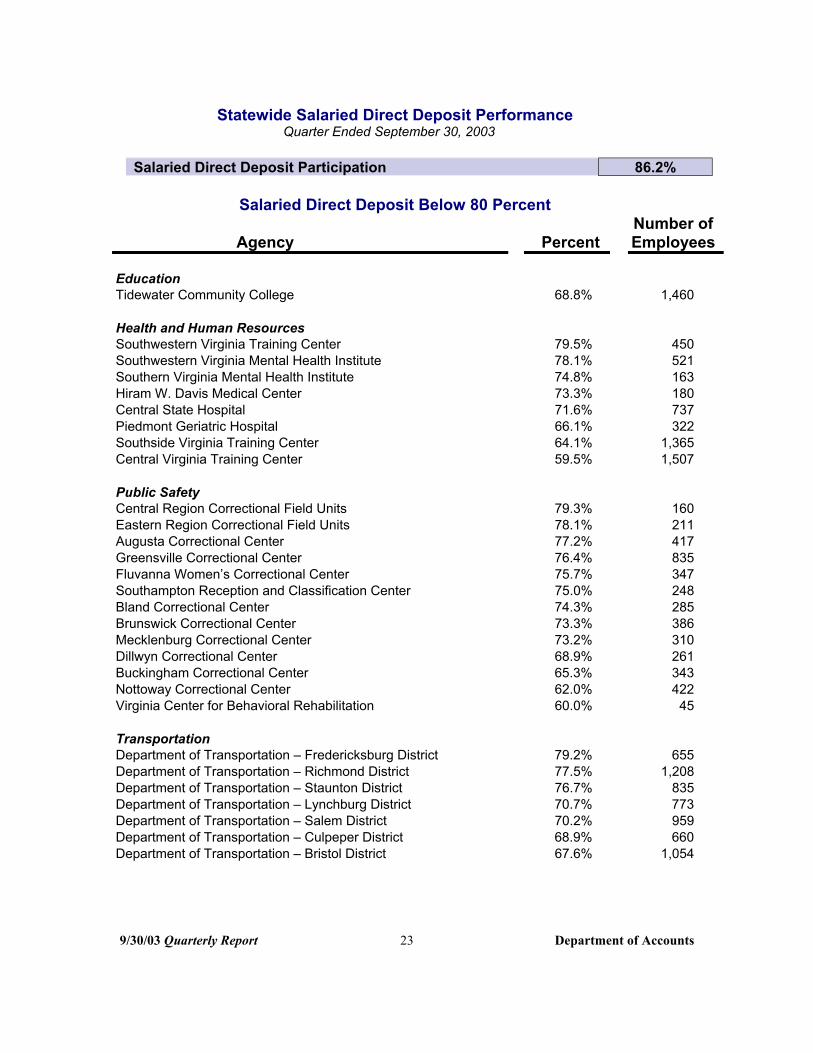
Statewide Salaried Direct Deposit PerformanceQuarter Ended September 30, 2003
Salaried Direct Deposit Participation 86.2%
Salaried Direct Deposit Below 80 Percent Number of
Agency Percent Employees
Education Tidewater Community College 68.8% 1,460
Health and Human Resources Southwestern Virginia Training Center 79.5% 450 Southwestern Virginia Mental Health Institute 78.1% 521 Southern Virginia Mental Health Institute 74.8% 163 Hiram W. Davis Medical Center 73.3% 180 Central State Hospital 71.6% 737 Piedmont Geriatric Hospital 66.1% 322 Southside Virginia Training Center 64.1% 1,365 Central Virginia Training Center 59.5% 1,507
Public Safety Central Region Correctional Field Units 79.3% 160 Eastern Region Correctional Field Units 78.1% 211 Augusta Correctional Center 77.2% 417 Greensville Correctional Center 76.4% 835 Fluvanna Women’s Correctional Center 75.7% 347 Southampton Reception and Classification Center 75.0% 248 Bland Correctional Center 74.3% 285 Brunswick Correctional Center 73.3% 386 Mecklenburg Correctional Center 73.2% 310 Dillwyn Correctional Center 68.9% 261 Buckingham Correctional Center 65.3% 343 Nottoway Correctional Center 62.0% 422 Virginia Center for Behavioral Rehabilitation 60.0% 45
Transportation Department of Transportation – Fredericksburg District 79.2% 655 Department of Transportation – Richmond District 77.5% 1,208 Department of Transportation – Staunton District 76.7% 835 Department of Transportation – Lynchburg District 70.7% 773 Department of Transportation – Salem District 70.2% 959 Department of Transportation – Culpeper District 68.9% 660 Department of Transportation – Bristol District 67.6% 1,054
9/30/03 Quarterly Report 23 Department of Accounts
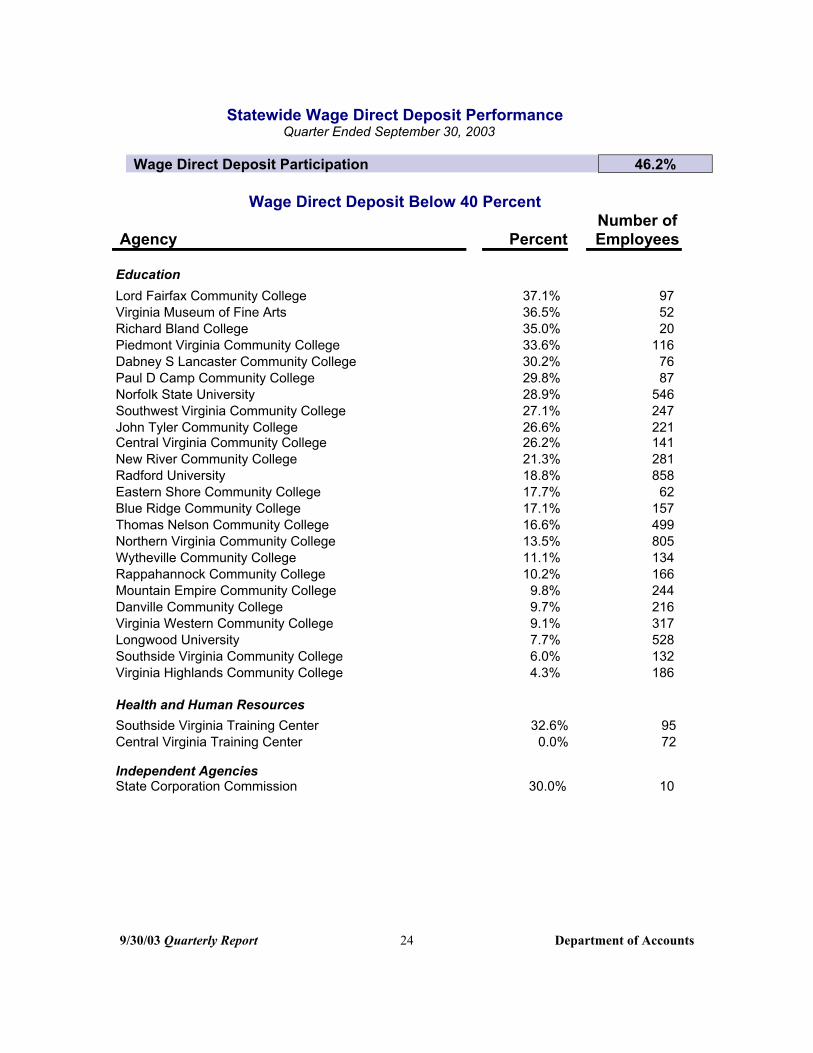
Statewide Wage Direct Deposit PerformanceQuarter Ended September 30, 2003
Wage Direct Deposit Participation 46.2%
Wage Direct Deposit Below 40 Percent Number of
Agency Percent Employees
Education Lord Fairfax Community College 37.1% 97 Virginia Museum of Fine Arts 36.5% 52 Richard Bland College 35.0% 20 Piedmont Virginia Community College 33.6% 116 Dabney S Lancaster Community College 30.2% 76 Paul D Camp Community College 29.8% 87 Norfolk State University 28.9% 546 Southwest Virginia Community College 27.1% 247 John Tyler Community College 26.6% 221 Central Virginia Community College 26.2% 141 New River Community College 21.3% 281 Radford University 18.8% 858 Eastern Shore Community College 17.7% 62 Blue Ridge Community College 17.1% 157 Thomas Nelson Community College 16.6% 499 Northern Virginia Community College 13.5% 805 Wytheville Community College 11.1% 134 Rappahannock Community College 10.2% 166 Mountain Empire Community College 9.8% 244 Danville Community College 9.7% 216 Virginia Western Community College 9.1% 317 Longwood University 7.7% 528 Southside Virginia Community College 6.0% 132 Virginia Highlands Community College 4.3% 186
Health and Human Resources Southside Virginia Training Center 32.6% 95 Central Virginia Training Center 0.0% 72
Independent AgenciesState Corporation Commission 30.0% 10
9/30/03 Quarterly Report 24 Department of Accounts

Number of Agency Percent Employees
Judicial Combined District Courts 29.0% 31 General District Courts 24.4% 245
Natural Resources Department of Conservation and Recreation 38.6% 764
Public Safety Department of Fire Programs 31.5% 38 Virginia Correctional Enterprises 13.3% 15
9/30/03 Quarterly Report 25 Department of Accounts
� � � � �

�������������� ��������������
�������������� ��������������
������������Payline Participants Earnings Notices Eliminated
16,000 14,000 12,000 10,000 8,000 6,000 4,000 2,000
0
�������������� �������������� �������������� �������������� �������������� ��������������
������������������������������������������������������������������������������������
�������������� �������������� �������������� �������������� ��������������
����������������������������
�������������� �������������� ��������������
����������������������������
��������������������������������������������������������
QE 12/31/02 QE 3/31/03 QE 6/30/03 QE 9/30/03
20%
15%
10%
5%
0%
Payroll Earnings Notices
Elimination of earnings notices associated with direct deposit is an additional method for increasing the benefits of electronic payments. Employees are currently able to obtain enhanced information online using the web-based Payline system.
In addition to increasing direct deposit participation, agencies and institutions are expected to encourage employees to enroll in Payline and discontinue receipt of centrally printed earnings notices. Since inception in November 2002, the Commonwealth has eliminated the printing of approximately 87,000 earnings notices. However, statewide participation rates remain low.
Quarterly Payline and Earnings Notice Opt Out Participation December 2002 – September 2003
9/30/03 Quarterly Report 26 Department of Accounts

The following table lists participation among all statewide employees in Payline and the Opt-Out initiative by secretarial area.
Payline and Earnings Notice Opt-Out Participation by Secretarial Area
Quarter Ended September 30, 2003
Secretarial Area
Administration Commerce and Trade Education Elected Officials Finance Health and Human Resources Independent Agencies Judicial Legislative Natural Resources Public Safety Technology Transportation
Statewide
Percent Payline
Participation
41.3% 38.0% 10.8% 25.1% 62.3% 19.0% 36.0%
3.5% 29.0% 35.5% 11.8% 36.6% 13.6%
16.9%
Percent Earnings Notices
Eliminated*
26.2% 20.6%
6.3% 18.8% 34.4% 8.2%
18.5% 1.0%
25.3% 24.5%
4.5% 27.3%
4.3%
8.2%
* Employees must participate in Direct Deposit and Payline in order to opt out of receiving centrally printed earnings notices.
Statistics do not include employees of eight institutions of higher education that are decentralized for payroll processing.
9/30/03 Quarterly Report 27 Department of Accounts
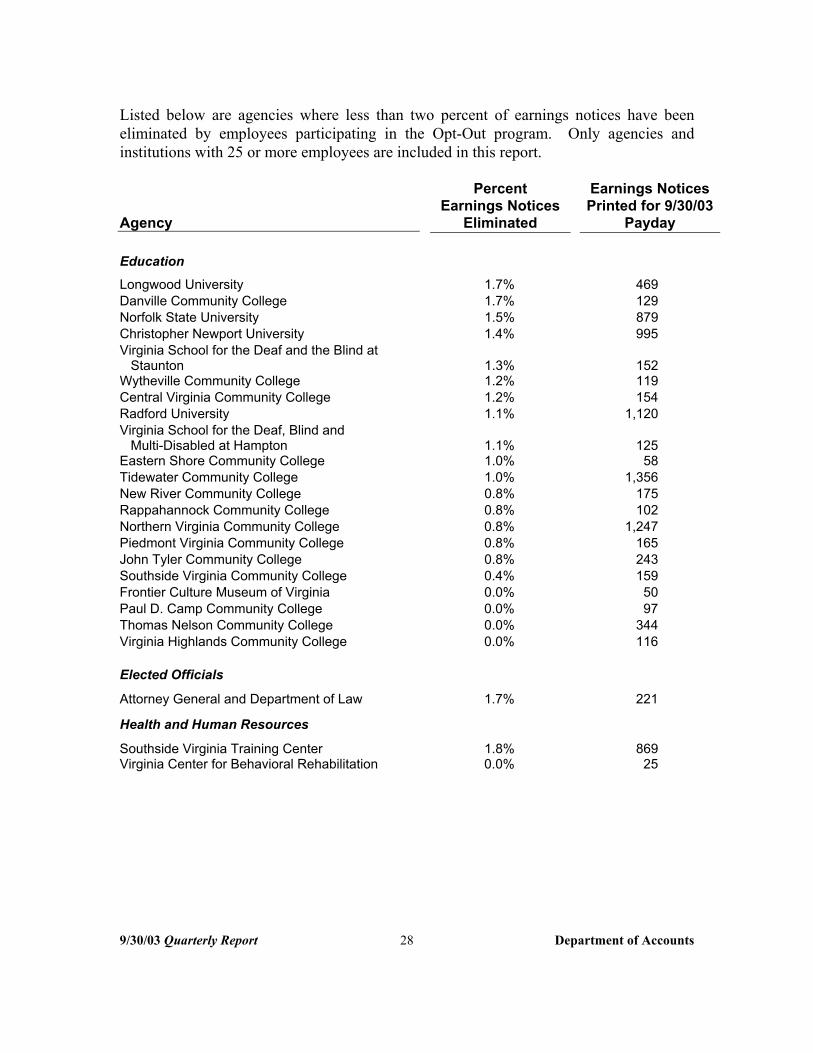
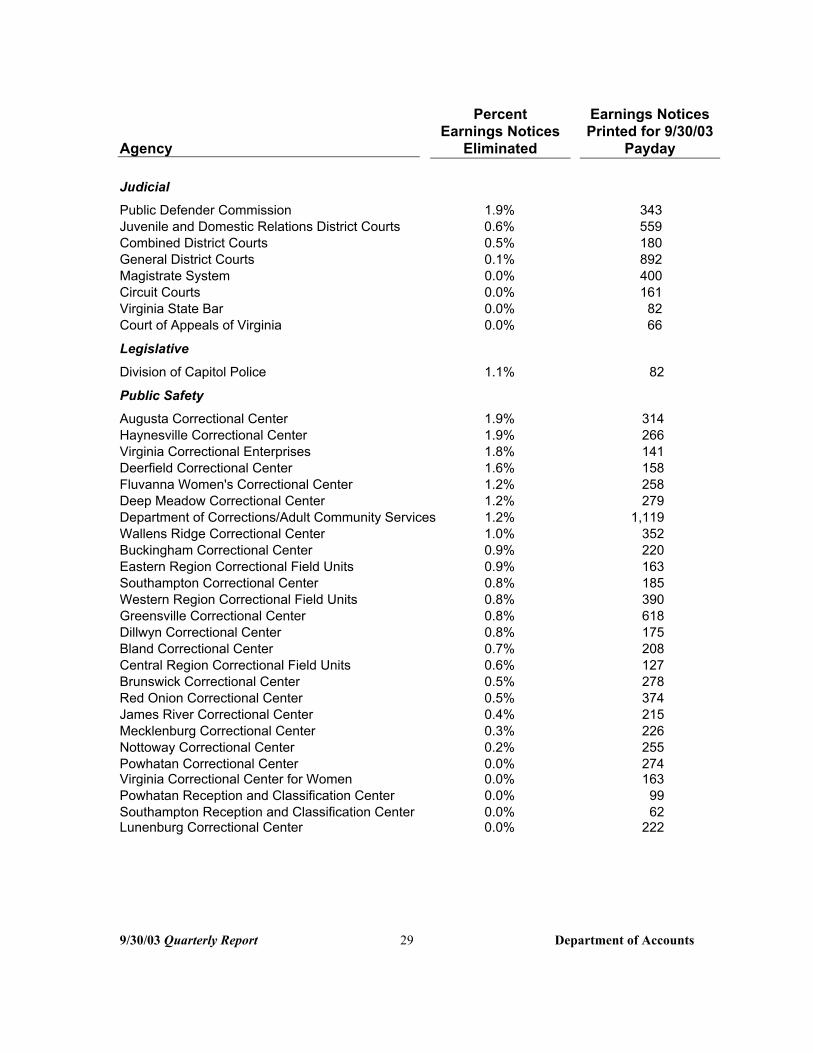
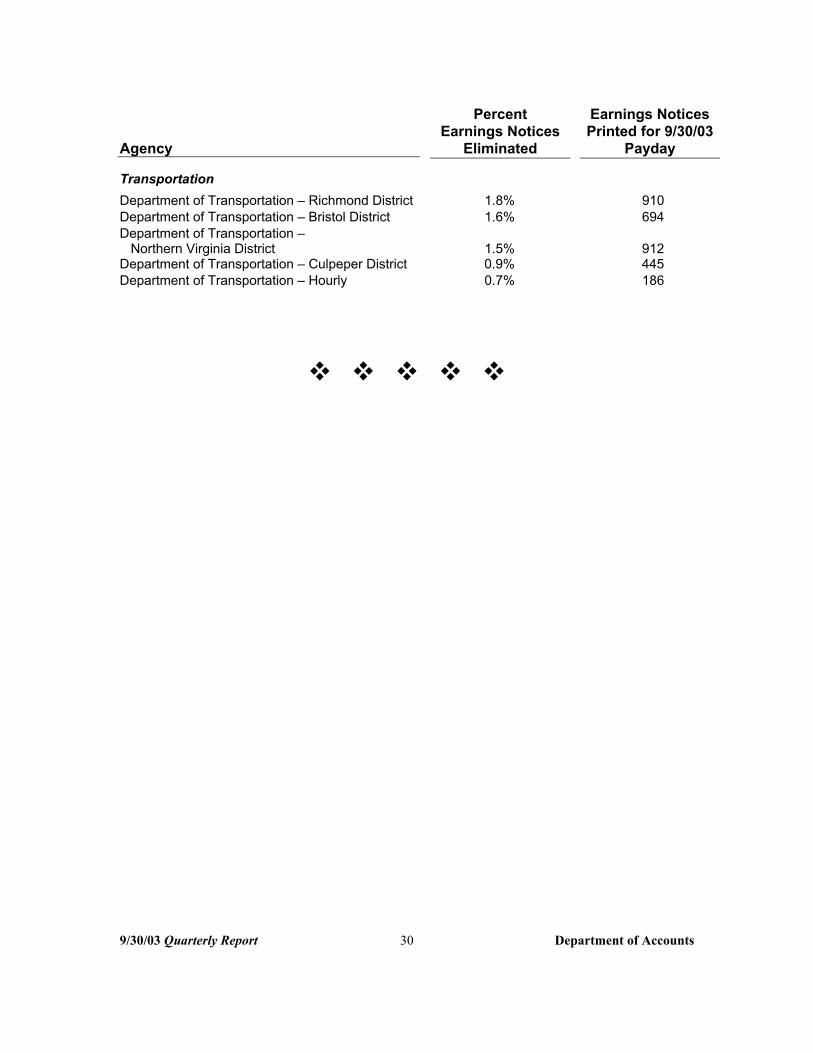
Listed below are agencies where less than two percent of earnings notices have been eliminated by employees participating in the Opt-Out program. Only agencies and institutions with 25 or more employees are included in this report.
Agency
Percent Earnings Notices
Eliminated
Earnings Notices Printed for 9/30/03
Payday
Education Longwood University 1.7% 469 Danville Community College 1.7% 129 Norfolk State University 1.5% 879 Christopher Newport University 1.4% 995 Virginia School for the Deaf and the Blind at Staunton 1.3% 152
Wytheville Community College 1.2% 119 Central Virginia Community College 1.2% 154 Radford University 1.1% 1,120 Virginia School for the Deaf, Blind and Multi-Disabled at Hampton
Eastern Shore Community College 1.1% 1.0%
125 58
Tidewater Community College 1.0% 1,356 New River Community College 0.8% 175 Rappahannock Community College 0.8% 102 Northern Virginia Community College 0.8% 1,247 Piedmont Virginia Community College 0.8% 165 John Tyler Community College 0.8% 243 Southside Virginia Community College 0.4% 159 Frontier Culture Museum of Virginia 0.0% 50 Paul D. Camp Community College 0.0% 97 Thomas Nelson Community College 0.0% 344 Virginia Highlands Community College 0.0% 116
Elected Officials
Attorney General and Department of Law 1.7% 221
Health and Human Resources
Southside Virginia Training Center Virginia Center for Behavioral Rehabilitation
1.8% 0.0%
869 25
9/30/03 Quarterly Report 28 Department of Accounts
Agency
Percent Earnings Notices
Eliminated
Earnings Notices Printed for 9/30/03
Payday
Judicial Public Defender Commission 1.9% 343 Juvenile and Domestic Relations District Courts 0.6% 559 Combined District Courts 0.5% 180 General District Courts 0.1% 892 Magistrate System Circuit Courts
0.0% 0.0%
400 161
Virginia State Bar Court of Appeals of Virginia
0.0% 0.0%
82 66
Legislative Division of Capitol Police 1.1% 82
Public Safety Augusta Correctional Center Haynesville Correctional Center Virginia Correctional Enterprises Deerfield Correctional Center
1.9% 1.9% 1.8% 1.6%
314 266 141 158
Fluvanna Women's Correctional Center 1.2% 258 Deep Meadow Correctional Center Department of Corrections/Adult Community Services Wallens Ridge Correctional Center Buckingham Correctional Center Eastern Region Correctional Field Units Southampton Correctional Center Western Region Correctional Field Units Greensville Correctional Center
1.2% 1.2% 1.0% 0.9% 0.9% 0.8% 0.8% 0.8%
279 1,119
352 220 163 185 390 618
Dillwyn Correctional Center Bland Correctional Center
0.8% 0.7%
175 208
Central Region Correctional Field Units Brunswick Correctional Center
0.6% 0.5%
127 278
Red Onion Correctional Center 0.5% 374 James River Correctional Center 0.4% 215 Mecklenburg Correctional Center Nottoway Correctional Center Powhatan Correctional Center
0.3% 0.2% 0.0%
226 255 274
Virginia Correctional Center for Women Powhatan Reception and Classification Center Southampton Reception and Classification Center Lunenburg Correctional Center
0.0% 0.0% 0.0% 0.0%
163 99 62
222
9/30/03 Quarterly Report 29 Department of Accounts
Percent Earnings Notices
Agency Earnings Notices
Eliminated Printed for 9/30/03
Payday
Transportation Department of Transportation – Richmond District 1.8% 910 Department of Transportation – Bristol District 1.6% 694 Department of Transportation – Northern Virginia District 1.5% 912
Department of Transportation – Culpeper District 0.9% 445 Department of Transportation – Hourly 0.7% 186
9/30/03 Quarterly Report 30 Department of Accounts
� � � � �

Small Purchase Charge Card (SPCC) and Increased Limit (Gold) Card
Two purchasing charge card programs offer State agencies and institutions alternative payment methods that improve administrative efficiency by consolidating invoice and payment processing for purchases of less than $50,000. Use of the purchasing charge cards decreases the number of checks issued and the associated administrative costs of processing invoices. Suppliers benefit from expedited receipt of payments and reduced billing costs.
The Small Purchase Charge Card continues to be used for purchases under $5,000. Agencies are stronglyencouraged to obtain a Gold Card for use by a procurement professional for purchases in the $5,000 to $50,000 range.
The total amount charged on SPCC and Gold cards during the first quarter of FY 2004 increased by $4.7 million or 14.1 percent from the same quarter last year.
Small Purchase Charge Card Program
Quarter Ended Comparative
Quarter Ended Charge Card Activity
Amount of Charges
September 30, 2003
$37,950,329
September 30, 2003
$33,246,613 Estimated Number of Checks Avoided 107,518 99,983 Total Number of Participating Agencies 191 192 Total Number of Cards Outstanding 10,661 10,561
The following chart compares charge activity for FY 2004 to activity for FY 2003.
Charge Amount ComparisonFY 2003 - FY 2004
9/30/03 Quarterly Report 31 Department of Accounts
$14.0
$16.0 2003 2004
$12.0
$10.0
$8.0
Mill
ions
$6.0
$4.0
$2.0
$0.0 JUL AUG SEP OCT NOV DEC JAN FEB MAR APR MAY JUN
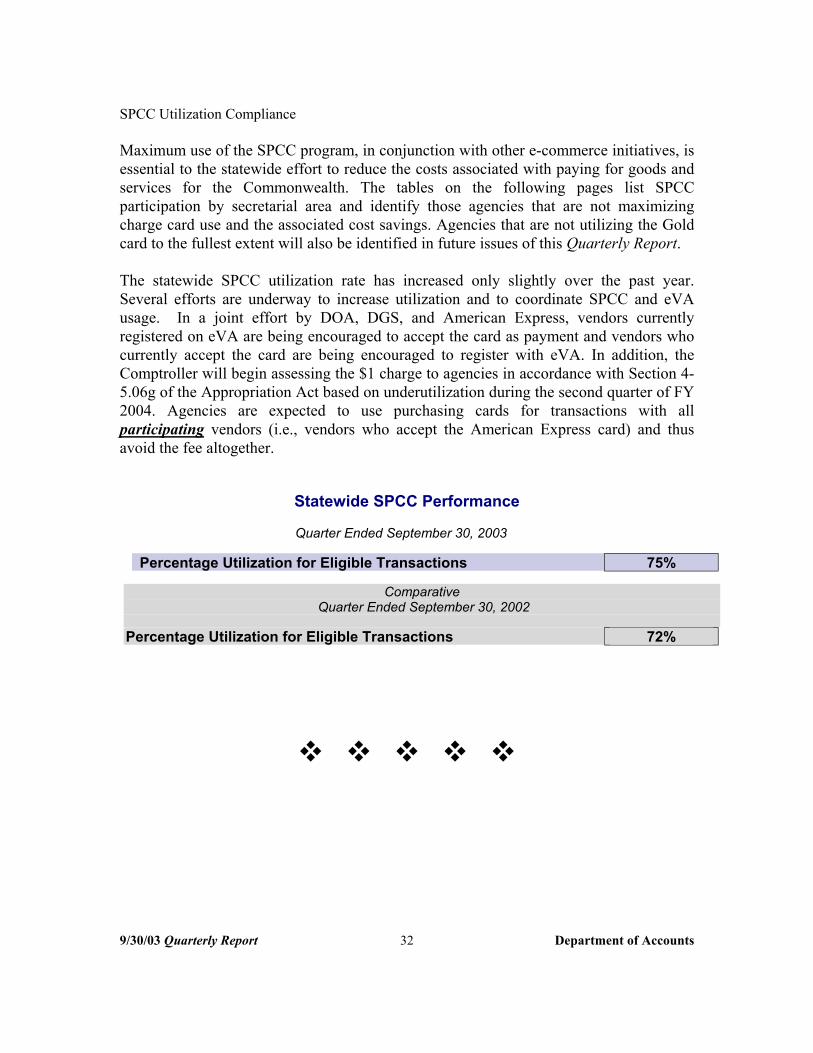
SPCC Utilization Compliance
Maximum use of the SPCC program, in conjunction with other e-commerce initiatives, is essential to the statewide effort to reduce the costs associated with paying for goods and services for the Commonwealth. The tables on the following pages list SPCC participation by secretarial area and identify those agencies that are not maximizing charge card use and the associated cost savings. Agencies that are not utilizing the Gold card to the fullest extent will also be identified in future issues of this Quarterly Report.
The statewide SPCC utilization rate has increased only slightly over the past year. Several efforts are underway to increase utilization and to coordinate SPCC and eVA usage. In a joint effort by DOA, DGS, and American Express, vendors currently registered on eVA are being encouraged to accept the card as payment and vendors who currently accept the card are being encouraged to register with eVA. In addition, the Comptroller will begin assessing the $1 charge to agencies in accordance with Section 4-5.06g of the Appropriation Act based on underutilization during the second quarter of FY 2004. Agencies are expected to use purchasing cards for transactions with all participating vendors (i.e., vendors who accept the American Express card) and thus avoid the fee altogether.
Statewide SPCC Performance
Quarter Ended September 30, 2003
Percentage Utilization for Eligible Transactions 75%
Comparative Quarter Ended September 30, 2002
Percentage Utilization for Eligible Transactions 72%
� � � � �
9/30/03 Quarterly Report 32 Department of Accounts
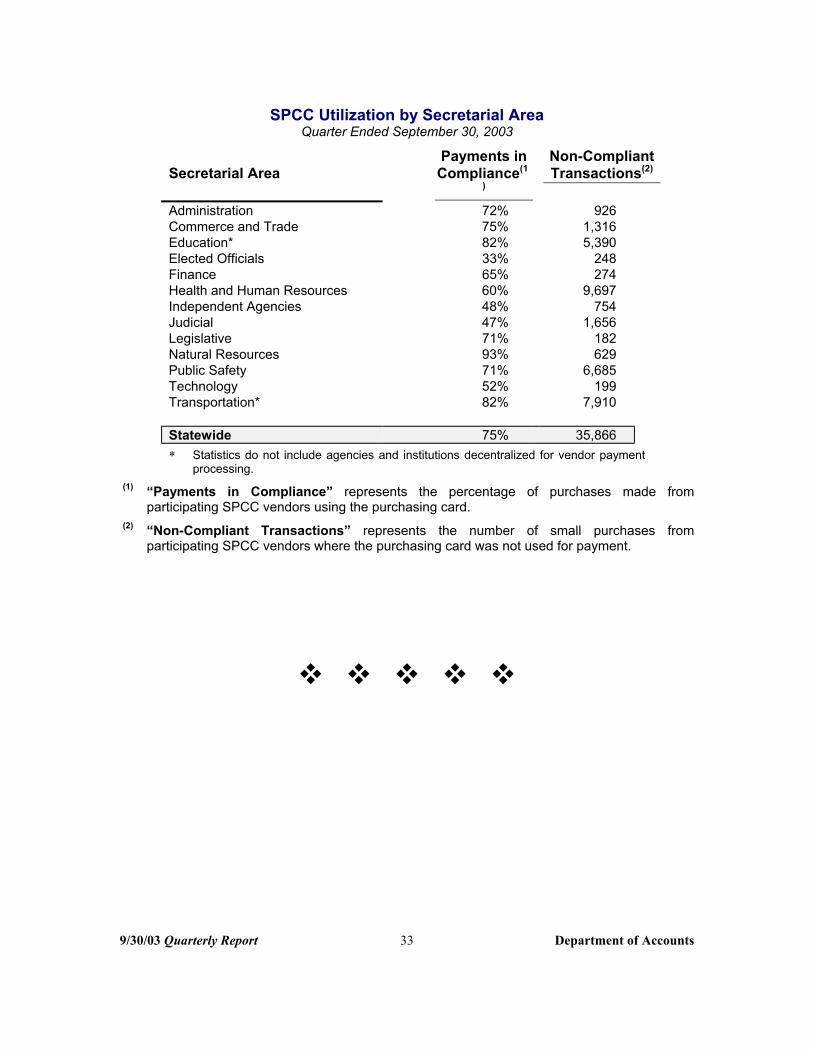
SPCC Utilization by Secretarial AreaQuarter Ended September 30, 2003
Secretarial Area
Administration
Payments in Compliance(1
)
72%
Non-Compliant Transactions(2)
926 Commerce and Trade 75% 1,316 Education* 82% 5,390 Elected Officials 33% 248 Finance 65% 274 Health and Human Resources 60% 9,697 Independent Agencies 48% 754 Judicial 47% 1,656 Legislative 71% 182 Natural Resources 93% 629 Public Safety 71% 6,685 Technology 52% 199 Transportation*
Statewide
82%
75%
7,910
35,866
(1)
(2)
* Statistics do not include agencies and institutions decentralized for vendor payment processing.
“Payments in Compliance” represents the percentage of purchases made participating SPCC vendors using the purchasing card.
“Non-Compliant Transactions” represents the number of small purchases participating SPCC vendors where the purchasing card was not used for payment.
from
from
� � � � �
9/30/03 Quarterly Report 33 Department of Accounts
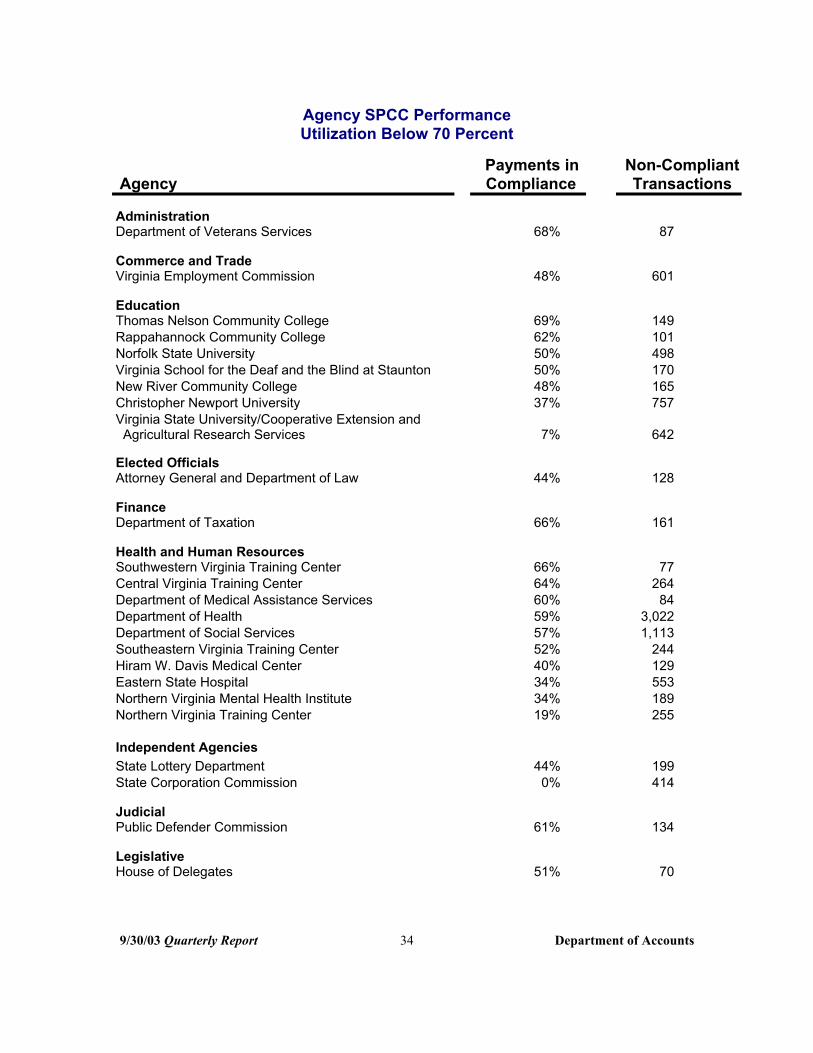
Agency SPCC PerformanceUtilization Below 70 Percent
Agency Payments in Compliance
Non-Compliant Transactions
Administration Department of Veterans Services 68% 87
Commerce and Trade Virginia Employment Commission 48% 601
Education Thomas Nelson Community College 69% 149 Rappahannock Community College 62% 101 Norfolk State University 50% 498 Virginia School for the Deaf and the Blind at Staunton 50% 170 New River Community College 48% 165 Christopher Newport University 37% 757 Virginia State University/Cooperative Extension and Agricultural Research Services 7% 642
Elected Officials Attorney General and Department of Law 44% 128
Finance Department of Taxation 66% 161
Health and Human Resources Southwestern Virginia Training Center 66% 77 Central Virginia Training Center 64% 264 Department of Medical Assistance Services 60% 84 Department of Health 59% 3,022 Department of Social Services 57% 1,113 Southeastern Virginia Training Center 52% 244 Hiram W. Davis Medical Center 40% 129 Eastern State Hospital 34% 553 Northern Virginia Mental Health Institute 34% 189 Northern Virginia Training Center 19% 255
Independent Agencies State Lottery Department 44% 199 State Corporation Commission 0% 414
Judicial Public Defender Commission 61% 134
LegislativeHouse of Delegates 51% 70
9/30/03 Quarterly Report 34 Department of Accounts

Agency Payments in Compliance
Non-Compliant Transactions
Natural Resources Marine Resources Commission 58% 98
Public SafetyDepartment of Alcoholic Beverage Control 69% 380 Department of Fire Programs 68% 67 Dillwyn Correctional Center 68% 77 Southampton Correctional Center 67% 120 Department of Corrections – Central Administration 65% 152 Coffeewood Correctional Center 65% 87 Department of State Police 64% 411 Virginia Correctional Enterprises 59% 696 Brunswick Correctional Center 58% 185 Wallens Ridge Correctional Center 57% 128 Powhatan Correctional Center 57% 134 Deep Meadow Correctional Center 54% 102 Nottoway Correctional Center 51% 80 Department of Military Affairs 48% 695 Sussex I Correctional Center 46% 75 Red Onion Correctional Center 41% 122 Virginia Correctional Center for Women 31% 131 Keen Mountain Correctional Center 19% 128 Department of Corrections – Division of Institutions 0% 292 Marion Correctional Treatment Center 0% 115
TechnologyVirginia Information Technologies Agency 53% 191
TransportationDepartment of Motor Vehicles 67% 871
9/30/03 Quarterly Report 35 Department of Accounts

SPCC Payment Compliance
Agencies and institutions participating in the SPCC program are required to submit payments via EDI to the SPCC vendor by the 14th of each month. Failure to pay the correct amount when due jeopardizes the Commonwealth’s
contractual relationship with the purchasing card vendor and may result in suspension of an agency’s charge card program. The following chart lists agencies more than three days late in submitting their payments.
Agency Name Jul Aug Sep
Administration Department of Human Resource Management Department of Veterans Services
X XX
Education Dabney S Lancaster Community College J Sargeant Reynolds Community College X
X X
Elected Officials Attorney General and Department of Law X X
Health and Human Resources Piedmont Geriatric Hospital Southeastern Virginia Training Center
XX
Public SafetyDepartment of Corrections Virginia Correctional Center for Women
X X X
X
TechnologyVirginia Information Technologies Agency X
TransportationDepartment of Rail and Public Transportation X X
� � � � �
9/30/03 Quarterly Report 36 Department of Accounts

Payroll Controls
PMIS/CIPPS Payroll Audit
During the quarter, DOA’s automated comparison of payroll and personnel (PMIS) records examined 421,416 salaried pay transactions and 233,148 wage pay transactions. The comparison is performed following each payday and is designed to identify discrepancies between authorized salary/wage amounts in PMIS and amounts paid in CIPPS. There were 2,390 new exceptions noted statewide during the quarter, with an overall exception rate of 0.39 percent.
The statewide salaried payroll exception rate was 0.56 percent and the wage payroll exception rate was 0.09 percent. During this quarter, 36 employee paychecks were reduced to recover $13,995.45 in overpayments.
The largest causes of exceptions are agency failure to complete the salary increase authorization process by updating PMIS salary amounts prior to paying the increased salary amount in CIPPS and retroactive payments that exceed normal pay period salaries. The PMIS authorization is an important internal control over payroll processing. Such exceptions can largely be avoided through timely PMIS data entry by agency Human Resource staff. Although segregation of these Human Resource and Payroll functions is an effective internal control, coordination and communication between agency Human Resource and Payroll staffs is essential.
Payroll Audit Exception ReportQuarter Ended September 30, 2003
9/30/03 Quarterly Report 37 Department of Accounts
���������������������������������������
����������������������������������������������������������������������������������������������������
�����������������������������������������������������������������������������������������������������������������������������������������������������������
��������������������������������������������������� ������
��
������������������
������������������
��������������������������������������������������
����������������������������������������������������������������������������������������������������������������������������
������������������������������
Wage Payment with No Hours Other
6% 15% (50) (130) Class Code Missing
in CIPPS 7%
��
������������������
������������������ ������������������
������������������� ������������������� �������������������
��������������������������������������������������
����������������������������������������������������������������������������������������������������
����������������������������������������������������������������������������
���������������������������������������������������
������������
��������������������������������������������������������������������������������
����������������������������������������
���������������������������������������������������
��������������������������������������������������������������������������
������������������������������
������������������������������������������������������������������������������������������������������
���������������������������������������������������
(61)
Gross Pay HigherThan PMIS Authorized
Pay45%(391)
Position Expired 9%
No PMIS Record (73) Found 18% (159)

Exception percentages are calculated by dividing the number of exceptions by the number of salaried or wage employees. Effective with the quarter ending June 30, 2003, the number of reported salaried exceptions increased due to refinements in audit procedures. The increase was not due to significant changes in agency performance. The refinements are designed to improve accuracy in payroll and benefit calculations by increasing agency awareness of the importance of timely personnel system updates and proper payroll payment classification. Agencies are reported below if the percentage of payroll exceptions to salaried or wage payments exceeds twice the statewide average for the quarter.
Payroll Exception AuditAgency Payroll Exceptions as a Percent of Salaried Payments
Quarter Ended September 30, 2003 Exceptions as a
% of Salaried Agency
Southside Virginia Community College
Total Salaried Payroll Exceptions for the Quarter
Payments
2.82%
0.56%
The following chart compares payroll exceptions as a percentage of salaried payments by quarter for the past two years.
Total Quarterly Salaried ExceptionsSeptember 2001 – September 2003
9/30/03 Quarterly Report 38 Department of Accounts
0.00
0.10
0.20
0.30
0.40
0.50
0.60
0.70
Perc
ent
Sep-01 Dec-01 Mar-02 Jun-02 Sep-02 Dec-02 Mar-03 Jun-03 Sep-03
Note: Increases since the last quarter of FY 2003 were caused by refinements in audit procedures. See narrative explanation, above.

Payroll Exception Audit Agency Payroll Exceptions as a Percent of Wage Payments
Quarter Ended September 30, 2003
Agency
Richard Bland College Department of Veterans Services
Wage Payroll Exceptions for the Quarter
Exceptions as a % of WagePayments
0.91%16.25%
0.09%
The following chart compares payroll exceptions as a percentage of wage payments by quarter for the past two years.
Total Quarterly Wage ExceptionsSeptember 2001 – September 2003
0.00
0.10
0.20
0.30
0.40
0.50
0.60
0.70
Sep-01 Dec-01 Mar-02 Jun-02 Sep-02 Dec-02 Mar-03 Jun-03 Sep-03
Perc
ent
� � � � �
9/30/03 Quarterly Report 39 Department of Accounts

PMIS/CIPPS Exceptions
Agencies are required to submit explanations and/or reconciliations for the differences identified on the CIPPS/PMIS Unresolved Exceptions Report, within 6 weeks of notification. The following table lists those agencies having exceptions that remain unresolved six weeks after receipt of the report.
Agency Unresolved Exceptions
Education Christopher Newport University Norfolk State University
322
Finance Department of Taxation 5
Natural Resources Virginia Museum of Natural History 1
TransportationDepartment of Transportation – Northern Virginia District 1
� � � � �
9/30/03 Quarterly Report 40 Department of Accounts
Payroll Certification
Agencies are required to calculate, verify, and authorize the amount to be disbursed for each payroll. This responsibility can be met through the timely preparation of agency payrolls, request and review of automated edit reports, and correction of errors prior to requesting actual payroll runs which result in payroll disbursements. This process is referred to as “payroll certification." Payroll certification serves as a critical internal control to ensure payroll disbursements are accurate and authorized. Agency payroll certifications are monitored centrally to ensure that agencies conduct this important function.
Differences between the amount calculated by the payroll system based on agency input and the amount certified by the agency to be disbursed based on edit reports are identified in automated reports provided to agencies. Agencies are required to submit explanations and/or reconciliations of the differences identified on this report by the end of the day following receipt of the report. Differences result from agency payroll errors, miscalculations, online certification data entry errors, and inappropriately high volumes of changes following certification. Although differences do not result in undetected
incorrect payments, such errors are avoidable and are not consistent with sound internal control over payroll.
Since timely certification is also essential, authorized and trained staff, as well as telecommunications access and computer terminals, must be available at all times. Reliable back-up plans are necessary should any of these resources be unavailable on a critical payroll processing date due to emergency or other circumstances.
Agencies are required to enter applicable payroll certification requests into the payroll system by 3:30 p.m. daily to ensure sufficient time is available for central review by DOA staff to validate certification entries, a critical compensating control. Late entries, either initial or correcting, make certification review more difficult or impossible. When a data entry error is detected during the review process, DOA must make corrections to avoid inaccurate payroll disbursements and/or voluminous and costly corrective action.
The table on the following page lists agencies and institutions that have failed to comply with one or more of the requirements for accurate and timely payroll certification.
9/30/03 Quarterly Report 41 Department of Accounts
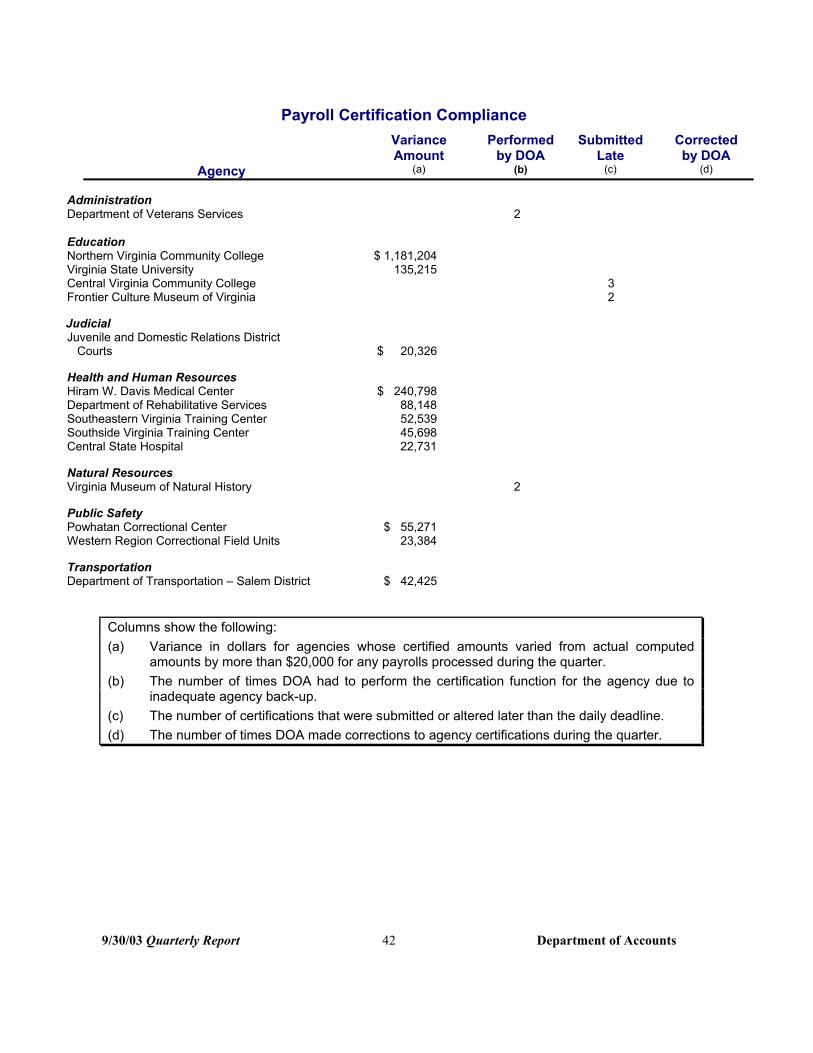
Payroll Certification Compliance Variance Performed Submitted Corrected
Agency Amount
(a) by DOA
(b) Late
(c) by DOA
(d)
Administration Department of Veterans Services 2
Education Northern Virginia Community College $ 1,181,204 Virginia State University 135,215 Central Virginia Community College 3 Frontier Culture Museum of Virginia 2
Judicial Juvenile and Domestic Relations District
Courts $ 20,326
Health and Human Resources Hiram W. Davis Medical Center $ 240,798 Department of Rehabilitative Services 88,148 Southeastern Virginia Training Center 52,539 Southside Virginia Training Center 45,698 Central State Hospital 22,731
Natural Resources Virginia Museum of Natural History 2
Public SafetyPowhatan Correctional Center $ 55,271 Western Region Correctional Field Units 23,384
TransportationDepartment of Transportation – Salem District $ 42,425
Columns show the following: (a) Variance in dollars for agencies whose certified amounts varied from actual computed
amounts by more than $20,000 for any payrolls processed during the quarter. (b) The number of times DOA had to perform the certification function for the agency due to
inadequate agency back-up. (c) The number of certifications that were submitted or altered later than the daily deadline. (d) The number of times DOA made corrections to agency certifications during the quarter.
9/30/03 Quarterly Report 42 Department of Accounts

Healthcare Reconciliations
Employee healthcare fringe benefits costs are covered by a combination of agency paid and employee-paid premiums.Agencies are required to return aCertification of Automated Health Care Reconciliations form to DOA by the close of the month following the month of coverage. This reconciliationannotates differences between healthcare eligibility records (BES) and healthcare premium payments collected throughpayroll deduction. The following table
lists those agencies that were late in submitting their certification or had problems requiring additionaladjustments. Such problems may include incomplete or incorrect documents or required IAT's not submitted to DOA. Healthcare reconciliations for the months of June, July and August were due 7/31/03, 8/29/03, and 9/30/03, respectively.
Schedule of Late Health Care Reconciliations
Jun Jul Aug
Education George Mason University* X X XPiedmont Virginia Community College X XSouthside Virginia Community College XThe Science Museum of Virginia XTidewater Community College X XVirginia State University X
Elected Officials Attorney General and Department of Law X XAttorney General/Division of Debt Collection X X
Public SafetyDepartment of Corrections – Division of Institutions X
Department of Juvenile Justice XFluvanna Women’s Correctional Center XLunenburg Correctional Center XRed Onion Correctional Center X
TransportationDepartment of Transportation X X X
* George Mason University is decentralized but is required to submit healthcare reconciliations to the Department of Human Resource Management by the end of the month following each quarter.
� � � � �
9/30/03 Quarterly Report 43 Department of Accounts

FINANCIAL MANAGEMENT ACTIVITY
DOA monitors several types of financial accounts receivable, indirect cost activity. Various measures are used to recoveries, treasury loans, and Fixed Asset track activities for CARS, payroll, Accounting and Control System (FAACS).
Commonwealth Accounting and Reporting System (CARS)
CARS activity trends provide important number of CARS transactions may information about Statewide accounting. indicate that an agency has changed the Currently, measures are used to track way it accounts for an activity. Such CARS transactions and error counts. A change may require DOA review. marked increase or decrease in the
CARS Transactions Fiscal Years 2002 - 2004
9/30/03 Quarterly Report 44 Department of Accounts
2002 2003 2004
Thou
sand
s
1,200
1,000
800
600
400
200
0 JUL AUG SEP OCT NOV DEC JAN FEB MAR APR MAY JUN

CARS Edits
One of the most important management tools used by DOA is the monitoring of CARS errors generated by standard system edits. Batches remain on the error file until problems are resolved, which, for disbursement transactions, can lead to noncompliance with prompt payment standards and poor vendor relations. During the first quarter of FY 2004, the most frequent reasons cited for batches being sent to the error file were:
♦ Available Cash Negative ♦ Expenditures Exceed Allotments ♦ Certified Amount Not Balanced
The marked increase during the month of August was attributable to cash flow problems in several agencies and institutions. Agencies may avoid such errors by more closely monitoring cash and allotment balances. Sound agency cash management practices should be developed to ensure transactions are not submitted to CARS when funding is not available.
CARS Monthly ErrorsAverage Number of Daily Errors
Fiscal Years 2002 - 2004
9/30/03 Quarterly Report 45 Department of Accounts
2002 2003 2004
2,500
2,000
1,500
1,000
500
0 JUL AUG SEP OCT NOV DEC JAN FEB MAR APR MAY JUN
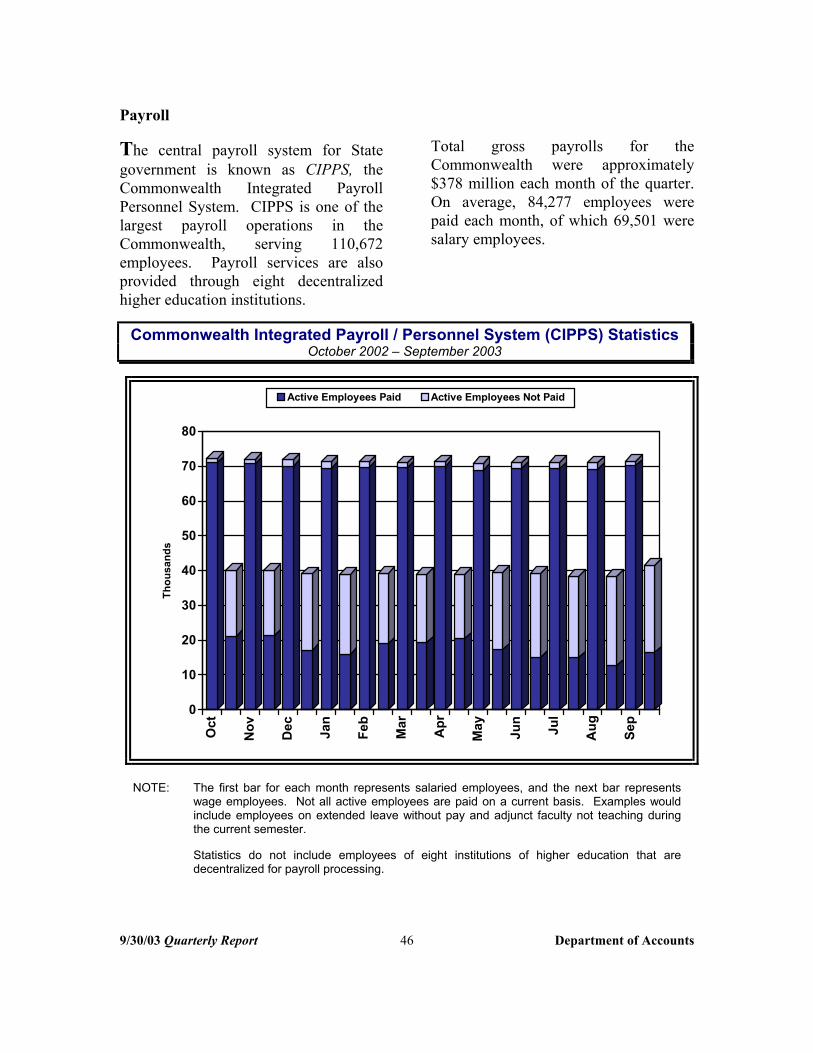
Payroll
The central payroll system for State government is known as CIPPS, the Commonwealth Integrated Payroll Personnel System. CIPPS is one of the largest payroll operations in the Commonwealth, serving 110,672 employees. Payroll services are also provided through eight decentralized higher education institutions.
Total gross payrolls for the Commonwealth were approximately $378 million each month of the quarter. On average, 84,277 employees were paid each month, of which 69,501 were salary employees.
Commonwealth Integrated Payroll / Personnel System (CIPPS) StatisticsOctober 2002 – September 2003
9/30/03 Quarterly Report 46 Department of Accounts
Active Employees Paid Active Employees Not Paid
Thou
sand
s
80
70
60
50
40
30
20
10
0
Oct
Nov
Dec
Jan
Feb
Mar
Apr
May
Jun
Jul
Aug
Sep
NOTE: The first bar for each month represents salaried employees, and the next bar represents wage employees. Not all active employees are paid on a current basis. Examples would include employees on extended leave without pay and adjunct faculty not teaching during the current semester.
Statistics do not include employees of eight institutions of higher education that are decentralized for payroll processing.

Benefit Participation by CIPPS Agencies
The Commonwealth offers a variety of benefits to State employees, including health care, optional retirement plans, deferred compensation, and flexible reimbursement programs. During the quarter, state employees purchased 15,935 savings bonds with a face value of over $2.0 million.
Benefit ParticipationNumber of Participating Employees
As of Comparative
As of As of
Health Care 9/30/03 9/30/02 9/30/01
COVA Care 79,494 N/A N/A Key Advantage N/A 63,430 66,778 Cost Alliance N/A 16,696 12,226 Aetna – PS N/A 173 40 Aetna – HMO N/A 1,204 215 Optimum Choice – Std N/A N/A 33 Optimum Choice - High N/A N/A 129 Kaiser 1,845 1,794 1,771 Cigna N/A N/A 2,716 Piedmont N/A 134 116
Optional Retirement Plans *Fidelity Investments 261 284 286 Great West Life 14 16 18 TIAA/CREF 1,293 1,285 1,227 T. Rowe Price 61 65 65 VALIC 242 234 251 Political Appointee - ORP 82 77 95
Deferred Compensation *Great West Life 26,605 25,538 23,371
Flexible Reimbursement * Dependent Care 637 634 601 Medical Care 3,487 3,130 2,710
* Statistics do not include employees of eight institutions of higher education that are decentralized for payroll processing.
9/30/03 Quarterly Report 47 Department of Accounts

Accounts Receivable
Chapter 48 of the Code of Virginia requires the Department of Accounts, along with the Office of the Attorney General, to oversee, report on, and monitor the Commonwealth's accounts receivable program. In order to carry out this responsibility, DOA has issued policies and procedures on accounting, collecting, reporting, and writing off accounts receivable. In addition, DOA provides technical assistance to agencies and institutions and uses statistical analyses and audit reports to monitor the ongoing effectiveness of agencies in managing their accounts receivable. Commonwealth agencies and institutions reported total gross receivables of $2.4 billion at June 30, 2003, with $974
million considered collectible. Receivables over 90 days past due as of June 30, 2003 totaled $1.4 billion. Of that amount, $686 million (49%) was placed with collection agencies or attorneys for additional collection efforts.
It is important to note that state receivables largely consist of taxes, fines, penalties, tuition and fees, and billings for several indigent care programs, which present numerous special problems in collection. “Trade receivables” typical of the private sector, which are generated by billings for the provision of goods and/or services, make up only a small portion of state receivables.
Gross, Past Due, and Collectible Receivables June 2002 – June 2003
����������� ����������� ������������ ����������� �����������
������������
�Mill
ions
GROSS > 90 DAYS PAST DUE COLLECTIBLE
$3,000
$2,500
$2,000
$1,500
$1,000
$500
$0
�������������������������������������������
����������� ����������� ����������� �����������
������������������������������������������������
��������������������������������������������
��������������������������������������������
Jun-02 Sep-02 Dec-02 Mar-03 Jun-03
� � � � �
9/30/03 Quarterly Report 48 Department of Accounts

As of June 30, 2003, agencies expected to collect $974 million (41%) of all receivables. About 24 percent of these receivables are due to the General Fund,
primarily for tax assessments. The balance ($744 million) consists of amounts due to various nongeneral funds’ activities.
Collectible Receivables by FundAs of June 30, 2003
9/30/03 Quarterly Report 49 Department of Accounts
Fund Source Amount Percent
General Fund Medicaid $ 27,835,376 (24%) Individual Taxes 106,669,765
Business Taxes 65,378,243 Courts of Justice 21,384,715 Other 7,009,749
Subtotal 228,277,848
Interagency Receivables 712,716
Total General Fund Collectible $228,990,564
Nongeneral Funds Medicaid 4,062,001 (76%) Unemployment Taxes 62,623,794
Transportation 136,605,698 Child Support Enforcement 13,385,416 Federal Government 54,658,714 MHMR Patient Services 35,762,076 Hospital 138,277,994 Enterprise 51,075,934 Higher Education 96,300,011 Courts of Justice 23,428,183 Other 30,809,495
Subtotal 646,989,316
Interagency Receivables 97,504,567
Total Nongeneral Fund Collectible $744,493,883
All Funds Grand Total $ 973,484,447
1247 28 9 3
99
1
100
18
18 2 7 5
19 7
13 3 4
87
13
100
100
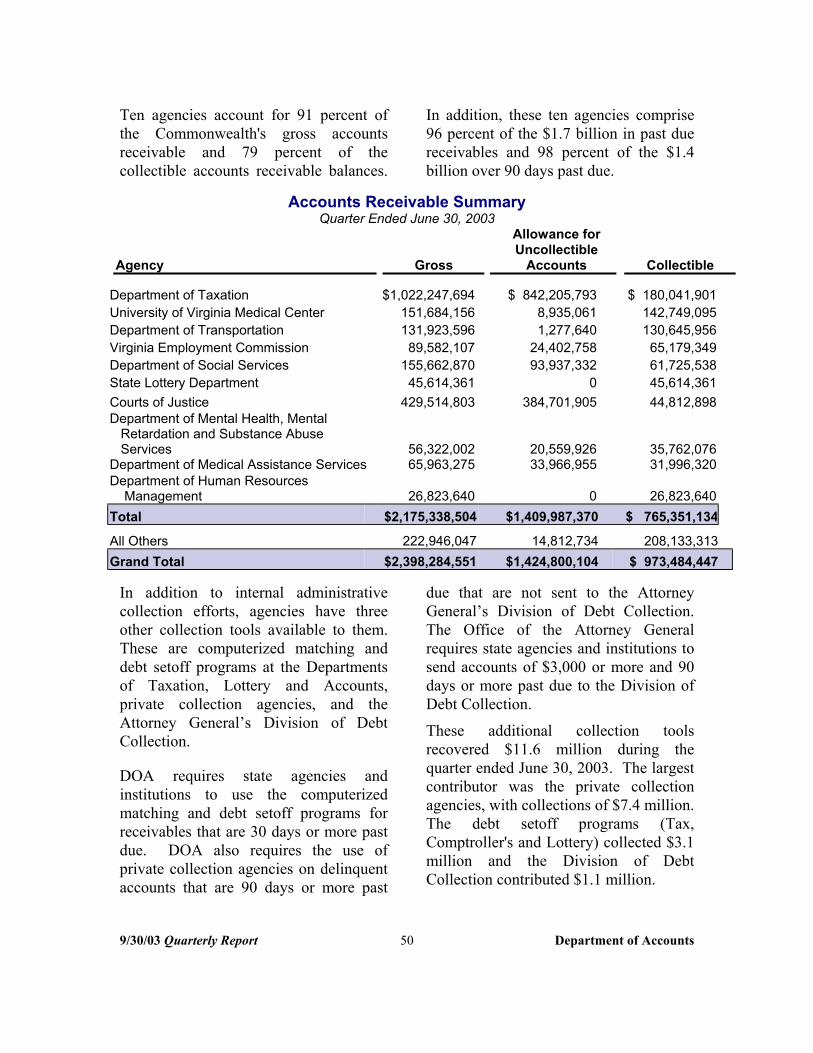
Ten agencies account for 91 percent of the Commonwealth's gross accounts receivable and 79 percent of the collectible accounts receivable balances.
In addition, these ten agencies comprise 96 percent of the $1.7 billion in past due receivables and 98 percent of the $1.4 billion over 90 days past due.
Accounts Receivable SummaryQuarter Ended June 30, 2003
Agency
Department of Taxation University of Virginia Medical Center Department of Transportation Virginia Employment Commission Department of Social Services State Lottery Department Courts of Justice Department of Mental Health, Mental Retardation and Substance Abuse Services
Department of Medical Assistance Services Department of Human Resources
Management Total
All Others Grand Total
Gross
$1,022,247,694 151,684,156 131,923,596 89,582,107
155,662,870 45,614,361
429,514,803
56,322,002 65,963,275
26,823,640 $2,175,338,504
222,946,047 $2,398,284,551
Allowance for Uncollectible
Accounts
$ 842,205,793 8,935,061 1,277,640
24,402,758 93,937,332
0 384,701,905
20,559,926 33,966,955
0 $1,409,987,370
14,812,734 $1,424,800,104
Collectible
$ 180,041,901 142,749,095 130,645,956 65,179,349 61,725,538 45,614,361 44,812,898
35,762,076 31,996,320
26,823,640 $ 765,351,134
208,133,313 $ 973,484,447
In addition to internal administrative collection efforts, agencies have three other collection tools available to them. These are computerized matching and debt setoff programs at the Departments of Taxation, Lottery and Accounts, private collection agencies, and the Attorney General’s Division of Debt Collection.
DOA requires state agencies and institutions to use the computerized matching and debt setoff programs for receivables that are 30 days or more past due. DOA also requires the use of private collection agencies on delinquent accounts that are 90 days or more past
due that are not sent to the Attorney General’s Division of Debt Collection. The Office of the Attorney General requires state agencies and institutions to send accounts of $3,000 or more and 90 days or more past due to the Division of Debt Collection.
These additional collection tools recovered $11.6 million during the quarter ended June 30, 2003. The largest contributor was the private collection agencies, with collections of $7.4 million. The debt setoff programs (Tax, Comptroller's and Lottery) collected $3.1 million and the Division of Debt Collection contributed $1.1 million.
9/30/03 Quarterly Report 50 Department of Accounts

RECEIVABLES OVER 90 DAYS PAST DUE As of June 30, 2003
With Total Over 90 Collection With Attorney Retained by
AGENCY Days Agency (1) General State Agency
Department of Taxation $ 808,759,913 $ 327,427,759 $ 0 $ 481,332,154 Courts of Justice 338,642,419 338,642,419 0 0 Department of Social Services 106,315,825 0 0 106,315,825
Department of Medical Assistance Services 37,529,028 733,328 3,398 36,792,302 Virginia Employment
Commission 24,857,121 4,505,037 1,110,145 19,241,939 University of Virginia Medical
Center 21,572,120 0 0 21,572,120 Department of Transportation 9,377,973 0 5,224,082 4,153,891 Department of Mental Health,
Mental Retardation and Substance Abuse Services 3,744,044 0 0 3,744,044
Workers’ Compensation Commission 3,641,349 155,275 1,277,943 2,208,131
Department of State Police 2,750,023 0 197,346 2,552,677
Total $1,357,189,815 $671,463,818 $ 7,812,914 $ 677,913,083
All Other Agencies 20,991,137 4,801,499 1,864,144 14,325,494
GRAND TOTAL $1,378,180,952 $676,265,317 $9,677,058 $ 692,238,577
(1) Amounts include accounts in the hands of Commonwealth’s Attorneys functioning as private collectors, as well as the courts’ debt and tax debt collection operation, which functions as a private collection agency.
Comptroller’s Debt Setoff (CDS) Program
CDS is one of the debt setoff programsused by agencies to collect past dueaccounts receivable owed the State,primarily by businesses and individualsacting in a business capacity. Under
CDS, a payment made by the State to the debtor may be withheld, in full or in part, to satisfy the debt owed the State. CDS collected $1.2 million during the first quarter of FY 2004.
9/30/03 Quarterly Report 51 Department of Accounts

One way to measure an agency’s effectiveness at managing its accounts receivable is to look at how efficient and effective collection procedures are on accounts that become delinquent. The table below looks at trend percentages of receivables over 90 days past due as a percentage of gross receivables for the ten agencies with the largest amounts of receivables over 90 days past due.
Percentage of Gross Receivables Over 90 Days Past Due
Percent at Percent at Percent at Agency Workers’ Compensation Commission
6/30/03 80%
6/30/02 79%
6/30/01 84%
Department of Taxation 79% 75% 78% Courts of Justice 79% 79% 80% Department of Social Services 68% 15% 24% Department of Medical Assistance Services 57% 46% 50% Department of State Police 47% 32% 17% Virginia Employment Commission 28% 30% 26% University of Virginia Medical Center 14% 19% 20% Department of Transportation 7% 5% 21% Department of Mental Health, Mental Retardation and Substance Abuse Services 7% 3% 6%
Total Past Due Accounts Listed With Collection Resources Quarter Ended June 30, 2003
�����������
������������������������������������������
�����������������������������������������������������
���������������������������������������������������
����
Mill
ions
FY 2001 FY 2002 ���� FY 2003
$2,500
$2,000
$1,500
$1,000
$500
$0
�������������������������������������������������������
����������������������������������������������������������������
��������������������������
��������������������������������������
��������������������������
�����������������������������������������������������������������������������������������
��������������������������
�������������������������
Collection Agencies Attorney General Debt Setoff Programs
The Department of Social Services did not provide FY 2003 year-end data on accounts listed with collection resources. This accounts for nearly all of the decrease from FY 2002 in figures for both Collection Agencies and Debt Setoff Programs.
9/30/03 Quarterly Report 52 Department of Accounts

Indirect Costs
The Department of Accounts prepares a Federal Statewide Indirect Cost Allocation Plan (SICAP) annually that identifies the central service agency General Fund support provided to all State agencies. Agencies receiving Federal grants or contracts prepare indirect cost rate proposals or cost allocation plans that include both the
agency (agency specific overhead expenditures) and Statewide (overhead expenditures incurred by the State's central service agencies for support provided to other State agencies) indirect costs associated with the administration and management of federal, State, or private grant and contract activity.
Total Indirect Cost Recoveries* For Fiscal Years Ended 1998-2004
������������������������������������������������
���������������������������������� �����������������������������������������
�����������������������������������������
�����������������������������������������
�����������������������������������������
�����������������������������������������
Mill
ions
$225
$200
$175
$150
$125
$100
$75
$50
$25
$0
�������������������������������������������������
��������������������������������������������������������������������������������������������������
��������������������������������������������������������
��������������������������������������������������������������������������������������������������
�������������������� ��������������������������������������������������������
����������������������������������������������������������������������������������������������������������������
���������������������������������������������������������������
������������������������������������������������������������������������������������������������������������������������������
�����������������������������������������������������������������������������
��������������������������������������������������������������������������������������������������������������������������������������������
������������������������������������������������������������������������������������������
��������������������������������������������������������������������������������������������������������������������������������������������
���������������������
������������������������������������������
1998 1999 2000 2001 2002 2003 2004
*FY 2004 reflects indirect cost recoveries through September 2003.
9/30/03 Quarterly Report 53 Department of Accounts
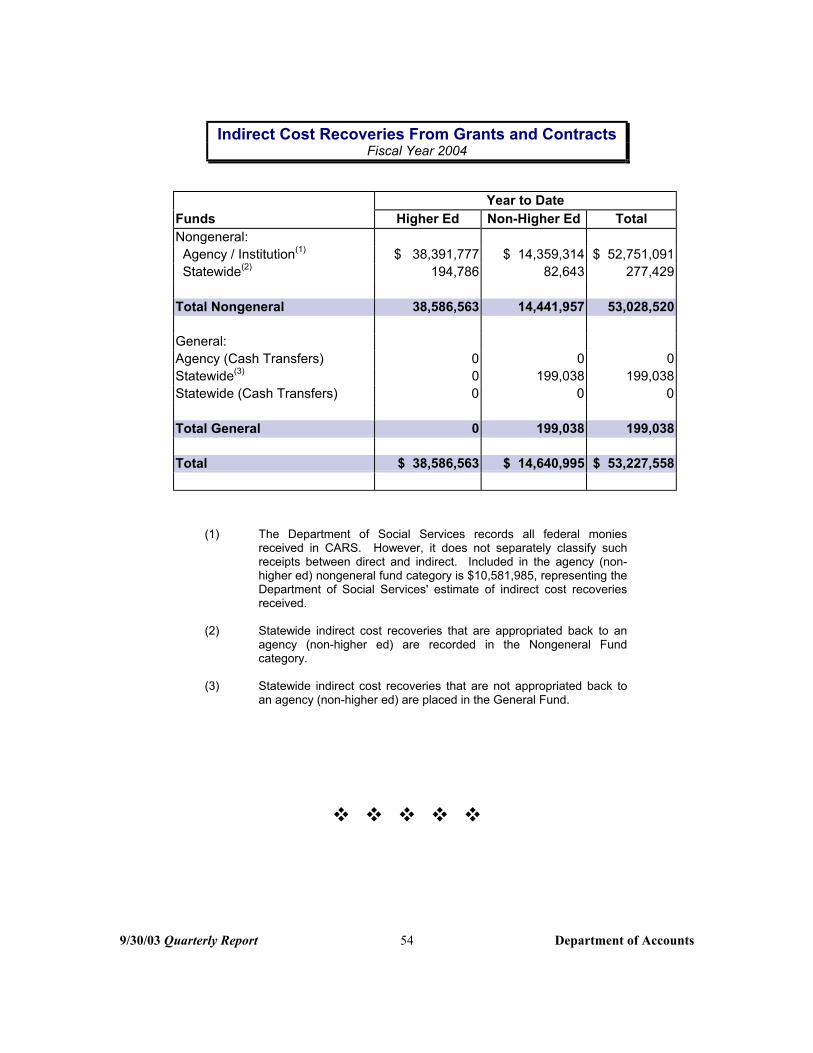
Indirect Cost Recoveries From Grants and Contracts Fiscal Year 2004
Funds Year to Date
Higher Ed Non-Higher Ed Total Nongeneral: Agency / Institution(1)
Statewide(2) $ 38,391,777
194,786$ 14,359,314
82,643$ 52,751,091
277,429
Total Nongeneral 38,586,563 14,441,957 53,028,520
General: Agency (Cash Transfers) Statewide(3)
Statewide (Cash Transfers)
000
0 199,038
0
0 199,038
0
Total General 0 199,038 199,038
Total $ 38,586,563 $ 14,640,995 $ 53,227,558
(1) The Department of Social Services records all federal monies received in CARS. However, it does not separately classify such receipts between direct and indirect. Included in the agency (non-higher ed) nongeneral fund category is $10,581,985, representing the Department of Social Services' estimate of indirect cost recoveries received.
(2) Statewide indirect cost recoveries that are appropriated back to an agency (non-higher ed) are recorded in the Nongeneral Fund category.
(3) Statewide indirect cost recoveries that are not appropriated back to an agency (non-higher ed) are placed in the General Fund.
� � � � �
9/30/03 Quarterly Report 54 Department of Accounts
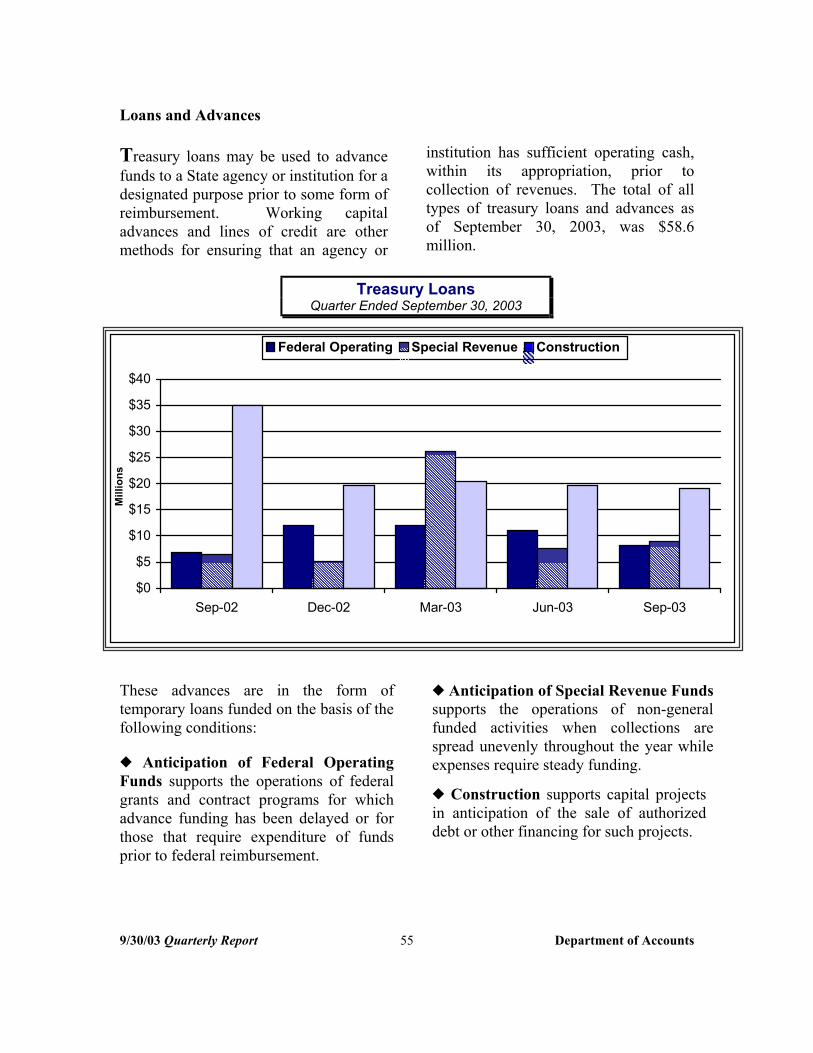
Loans and Advances
Treasury loans may be used to advance funds to a State agency or institution for a designated purpose prior to some form of reimbursement. Working capital advances and lines of credit are other methods for ensuring that an agency or
institution has sufficient operating cash, within its appropriation, prior to collection of revenues. The total of all types of treasury loans and advances as of September 30, 2003, was $58.6 million.
Treasury LoansQuarter Ended September 30, 2003
������������ �������������
�������������
��������������������������
���� ����
�
�������� �
Mill
ions
������������ ������������
�������������������������
������������������������������������������������������������������������������������������������
�������������������������
�������������
���������������������������������������
Sep-02 Dec-02 Mar-03 Jun-03 Sep-03
Federal Operating
$40
$35
$30
$25
$20
$15
$10
$5
$0
���� Special Revenue ���� Construction
These advances are in the form of temporary loans funded on the basis of the following conditions:
X Anticipation of Federal Operating Funds supports the operations of federal grants and contract programs for which advance funding has been delayed or for those that require expenditure of funds prior to federal reimbursement.
X Anticipation of Special Revenue Funds supports the operations of non-general funded activities when collections are spread unevenly throughout the year while expenses require steady funding.
X Construction supports capital projects in anticipation of the sale of authorized debt or other financing for such projects.
9/30/03 Quarterly Report 55 Department of Accounts

Other types of loans and advances that are not charted include:
X Authorized Appropriation Deficit, which provides funding, when authorized by the Governor, under emergency conditions as described in §4-3.01 and §4-3.02 of the Appropriation Act. There were no deficit loans outstanding at September 30, 2003.
X Working Capital Advances, which provide operating funds for nongeneral fund projects when revenues to be used for repayment will not be generated within the twelve months required for anticipation loans.
Significant New Loans/Drawdowns
Virginia Commonwealth University To provide cash prior to the sale of revenue bonds for payment of obligations relating to the Academic Campus Parking Deck IV project.
$3,515,733
Virginia Commonwealth University To provide cash prior to the sale of revenue bonds for payment of obligations relating to the Academic Housing III project.
$2,756,701
Department of General Services Drawdown to cover operating costs of the state’s electronic procurement system (eVA).
$2,500,000
Significant Loan Repayments
Tidewater Community College Repayment of outstanding balance due to receipt of federal reimbursements.
$1,312,829
Virginia Institute of Marine Science Repayment of outstanding balance due to receipt of federal reimbursements.
$1,000,000
Department of Motor Vehicles Two partial loan repayments due to receipt of revenues.
$1,000,000
9/30/03 Quarterly Report 56 Department of Accounts

Fixed Asset Accounting and Control System (FAACS)
FAACS is the Commonwealth’s fixedasset accounting system. State agencies are required to enter capitalized assets(cost $5,000 or greater) into FAACS.This system produces reports that helpagencies track and generally managetheir assets. It also provides financialinformation for the ComprehensiveAnnual Financial Report (CAFR) of the Commonwealth.
For the first quarter of FY 2004, theagencies and institutions of theCommonwealth that are central users of
FAACS processed 8,970 FAACS transactions. This volume of FAACS transactions represents a 49.1 percent decrease from the last quarter of FY 2003 (17,638 transactions). Fourth quarter volume is always heaviest, so the decrease from fourth quarter to first quarter is normal.
First quarter FY 2004 volume is 32.2 percent lower than that of the first quarter of FY 2003 (13,232 transactions). This decrease is likely due to continuing tight budget conditions.
Number of Fixed Asset Transactions Fiscal Years 2002 - 2004
9/30/03 Quarterly Report 57 Department of Accounts
Tran
sact
ions
2002 2003 2004
12,000
10,000
8,000
6,000
4,000
2,000
0
Jul Aug Sep Oct Nov Dec Jan Feb Mar Apr May Jun