report on louisiana healthcare delivery and financing system*
TRANSCRIPT


Report for the Louisiana Recovery Authority Support Foundation
Page 1
This Report is intended for the use and benefit of the
Louisiana Recovery Authority Support Foundation only and not intended for reliance by any other Party.
finExecutive Summary.....................................................................................................................5 Introduction............................................................................................................................. 7 Key Findings and Recommendations ................................................................................... 10
SECTION I: VISION AND MISSION OF THE LOUISIANA HEALTHCARE SYSTEM .......23 Vision for the Louisiana Healthcare System ........................................................................ 24 Mission of the Louisiana Healthcare System........................................................................ 24
SECTION II: MEASURES AND OPTIMIZING THE HEALTHCARE SYSTEM FOR THE FUTURE........................................................................................................................................26
Research................................................................................................................................ 26 Key Findings and Recommendations ................................................................................... 26 Background........................................................................................................................... 29 The Population’s Most Prevalent Illnesses and Conditions.................................................. 32 Moving Towards Optimizing the Performance of Louisiana's System ................................ 34 IOM Aim: Safe .................................................................................................................... 35 IOM Aim: Effective............................................................................................................. 36 IOM Aim: Patient-Centered................................................................................................. 37 IOM Aim: Timely ................................................................................................................ 38 IOM Aim: Efficient.............................................................................................................. 39 IOM Aim: Equitable ............................................................................................................ 41 Development of Integrated Healthcare Systems: How Louisiana's Healthcare Could Improve ................................................................................................................................. 42 Integrated Healthcare Systems Take a Holistic Approach to the Patient and the Population............................................................................................................................................... 42 Ways in Which Integrated Health Systems Improve Quality and Cost................................ 43 Health Plans and Payer Impact on the Quality of Healthcare............................................... 44 The Pre and Post-Hurricanes Healthcare System in Louisiana ............................................ 46 A Reconfigured System for Louisiana.................................................................................. 49 Bed Need Analysis Methodology ......................................................................................... 53 Region 1 (New Orleans) ....................................................................................................... 56 Region 2 (Baton Rouge) ....................................................................................................... 61 Region 3 (Houma-Thibodaux).............................................................................................. 62 Region 4 (Lafayette) ............................................................................................................. 62 Region 5 (Lake Charles) ....................................................................................................... 63 Region 6 (Alexandria)........................................................................................................... 64 Region 7 (Shreveport)........................................................................................................... 64 Region 8 (Monroe)................................................................................................................ 65 Region 9 (Covington-Slidell)................................................................................................ 65 Trauma Centers..................................................................................................................... 66 Hospital Outpatient and Emergency Departments................................................................ 67 Ambulatory Care................................................................................................................... 68 Long-Term Acute Care ......................................................................................................... 69 Mental Health Services ......................................................................................................... 70 Investing to Meet IOM Goals – Programs and Process........................................................ 72 Investing to Meet IOM Goals – Operations and Capital ...................................................... 72
Report for the Louisiana Recovery Authority Support Foundation
Page 2
This Report is intended for the use and benefit of the
Louisiana Recovery Authority Support Foundation only and not intended for reliance by any other Party.
The Current Public System and Options for Reconfiguration .............................................. 74 Appendices for Measures and Optimizing the Healthcare System for the Future................ 76
SECTION III: WORKFORCE AND MEDICAL EDUCATION .................................................95 Introduction........................................................................................................................... 95 Research................................................................................................................................ 95 Key Findings and Recommendations ................................................................................... 97
WORKFORCE ......................................................................................................................... 99 Workforce Planning .............................................................................................................. 99 Medical Workforce Issues .................................................................................................... 99 Allied Health Workforce Issues.......................................................................................... 103 Nursing................................................................................................................................ 106 Recruitment and Retention ................................................................................................. 109 Effects of Salary on Recruitment and Retention................................................................. 113 The Future State of the Workforce ..................................................................................... 114
MEDICAL EDUCATION...................................................................................................... 122 Introduction......................................................................................................................... 122 Medical School Characteristics........................................................................................... 125 Debt Load Among Graduating Louisiana Medical Students.............................................. 125 Funding of Graduate Medical Education............................................................................ 126 Faculty and Resident Levels ............................................................................................... 128 The Flow of Residents ........................................................................................................ 129 Current Models for Medical Education in Louisiana ......................................................... 130 Lessons for the Future from Benchmark Medical Programs .............................................. 131 Future of Medical Education in Louisiana Post Hurricanes ............................................... 134
Appendices for Workforce and Medical Education................................................................ 140 SECTION IV: PUBLIC AND PRIVATE TECHNOLOGY INFRASTRUCTURE...................152
Introduction......................................................................................................................... 152 Research.............................................................................................................................. 152 Key Findings and Recommendations ................................................................................. 153 Chronology of Health Information Technology ................................................................. 154 Current State of Health Information Technology in Louisiana .......................................... 156 Creating the Infrastructure for Health Information Exchange in Louisiana by 2015 ......... 161 Governance ......................................................................................................................... 162 Financing............................................................................................................................. 162 Technical Infrastructure ...................................................................................................... 162 Phases of Development....................................................................................................... 163 Appendices for Public and Private Technology Infrastructure........................................... 166
SECTION V: EMERGENCY PREPAREDNESS AND DISASTER PLANNING ...................175 Introduction......................................................................................................................... 175 Key Findings and Recommendations ................................................................................. 176 Nature of a Disaster ............................................................................................................ 177 Disaster Planning ................................................................................................................ 180 Preparing the Louisiana Health System for the Future....................................................... 192 Conclusion .......................................................................................................................... 208

Report for the Louisiana Recovery Authority Support Foundation
Page 3
This Report is intended for the use and benefit of the
Louisiana Recovery Authority Support Foundation only and not intended for reliance by any other Party.
SECTION VI: FINANCING .......................................................................................................212 Introduction......................................................................................................................... 212 Key Findings and Recommendations ................................................................................. 212 Framework to Reward Improved Outcomes and Restructure Delivery System Financing 215 Summary ............................................................................................................................. 216 Pre-Hurricanes Financing of Healthcare............................................................................. 216 Medicaid ............................................................................................................................. 218 Medicare ............................................................................................................................. 218 Uninsured............................................................................................................................ 219 Commercial......................................................................................................................... 220 Opportunity to Emphasize and Reward Improved Quality Outcomes ............................... 221 Capital Investment Requirements and Financing Options.................................................. 223 The Economic Value Proposition and Delivery System Financing Options...................... 224 Summary of Annual Investment and Estimated Value Proposition ................................... 228
Interviewees .................................................................................................................................235 Glossary .......................................................................................................................................237
Report for the Louisiana Recovery Authority Support Foundation
Page 4
This Report is intended for the use and benefit of the
Louisiana Recovery Authority Support Foundation only and not intended for reliance by any other Party.
Reviewers This report has been reviewed in draft form by individuals chosen for their diverse perspectives and technical expertise. The purpose of this review is to provide candid and critical comments that will assist in making this report as sound as possible. The review comments and draft manuscripts remain confidential to protect the integrity of the process. We wish to thank the following individuals for their review of this report: Dr. Christine Cassel, President, American Board of Internal Medicine Dr. Jordan Cohen, President, Association of American Medical Colleges Robert Dickler, Senior Vice President, Association of American Medical Colleges Jeanne Lambrew, Ph.D., Associate Professor of Health Policy Analysis, George Washington University Margaret O'Kane, President, National Committee for Quality Assurance Diane Rowland, Sc.D., Executive Vice President, Kaiser Family Foundation & Executive Director of the Kaiser Commission on Medicaid and the Uninsured Myrl Weinberg, CAE, President, National Health Council Although the reviewers listed above have provided many constructive comments and suggestions, they were not asked to endorse the conclusions or recommendations nor did they see the final draft of the report before its release. All review comments were carefully considered. Responsibility for the final content of this report rests entirely with the authors of this report.

Report for the Louisiana Recovery Authority Support Foundation
Page 5
This Report is intended for the use and benefit of the
Louisiana Recovery Authority Support Foundation only and not intended for reliance by any other Party.
Executive Summary PricewaterhouseCoopers LLP was retained by the Louisiana Recovery Authority Support Foundation (the Foundation, a foundation created to serve in support of the Louisiana Recovery Authority (LRA)). The Foundation was created to provide experts needed by Louisiana Recovery Authority committees. To date, the Foundation has provided experts in community redevelopment, regional planning, repopulation research, public relations and healthcare. No public funds were spent on the production of this report. The Foundation raised private funds to pay for PricewaterhouseCoopers’ work on this document. The LRA Support Foundation and its Board of Directors were not involved in gathering of data, interviews or production of this report. PricewaterhouseCoopers produced the findings of this report independently and without any involvement from the LRA Support Foundation or its board members. This report is owned by the Foundation, which reserves all rights associated with its production. The board members of the Foundation are as follows:
• Mr. John Laborde – Chairman, New Orleans • Ms. Brenda Birkett – Lake Charles • Mr. Ron Forman – New Orleans * • Mr. King Milling – New Orleans • Mr. Sean Reilly – Baton Rouge • Mr. David Voelker –New Orleans
* Mr. Forman took a leave of absence to run for Mayor of New Orleans
The LRA, established this past fall, was created to identify and prioritize the short and long-term needs of the post-hurricanes affected areas, and to seek out and value local input as it plans and implements the recovery efforts. The Public Health & Healthcare (PHH) Task Force, as one of thirteen LRA task forces, is focusing specifically on issues related to the short-term delivery of healthcare, the development of alternatives for rebuilding the state's healthcare infrastructure, and the planning for future emergencies that require coordination among the state’s healthcare facilities and workforce. The PHH Task Force divided its focus into four Priority Areas. These Priority Areas are as follows:
• Redesigning a Sustainable Healthcare System in Affected Areas, • Healthcare Workforce & Medical Education, • Disaster Planning & Emergency Preparedness, and • Short-Term Recovery
Focusing on three of the PHH Task Force’s Priority Areas, referred to as the Long-Term Priority Areas, the Foundation requested PricewaterhouseCoopers to assist in developing recommendations – widely viewed by local, regional and national experts – to the LRA that can significantly improve the healthcare delivery system in Louisiana. Specifically, PricewaterhouseCoopers was engaged to perform the advisory services (the Services) as delineated in the engagement letter of the agreement dated January 26, 2006, and such Services are subject to the terms and conditions included therein.

Report for the Louisiana Recovery Authority Support Foundation
Page 6
This Report is intended for the use and benefit of the
Louisiana Recovery Authority Support Foundation only and not intended for reliance by any other Party.
The objective of the engagement was to provide project management, data collection and analyses related to the development of recommendations for the recovery and rebuilding of the Louisiana healthcare system. These services were focused on the following three priority areas:
• Healthcare System – to define the vision and mission for the healthcare system of the state of Louisiana and to develop recommendations for a sustainable long-term healthcare system.
• Healthcare Professionals & Medical Education – to determine the optimal array of qualified healthcare professionals in the state to support the mission of the healthcare system, and develop a strategy for immediate recovery of displaced workers and long-term retention of an effective workforce aligned with changing demand.
• Emergency Preparedness & Disaster Planning – to develop a time-sensitive illness response system linking homeland security initiatives with healthcare operational standards and trauma care requirements, using a consistent disaster planning framework.
The Services were performed in accordance with Standards for Consulting Services established by the American Institute of Certified Public Accountants (AICPA). The procedures we performed did not constitute an examination or review in accordance with generally accepted auditing standards or attestation standards. Accordingly, we provide no opinion, attestation or other form of assurance with respect to the work or on the information upon which the work was based. We did not audit or otherwise verify the information supplied to us in connection with this engagement, from whatever source, except as may be specified in this Report or the Agreement. The work was limited to the specific procedures and analysis described herein and was based only on information made available through March 31, 2006. Accordingly, changes in circumstances after this date could affect the findings outlined in this Report. The Services did not include the provision of legal advice and PricewaterhouseCoopers makes no representations regarding questions of legal interpretation. The Foundation should consult with its attorneys with respect to any legal matters or items that require legal interpretation, under federal, state or other type of law or regulation. This Report and all PricewaterhouseCoopers deliverables are intended solely for the management and the board of directors of the Louisiana Recovery Authority Support Foundation for their internal use and benefit and are not intended to nor may they be relied upon by any other party (Third Party or Party).

Report for the Louisiana Recovery Authority Support Foundation
Page 7
This Report is intended for the use and benefit of the
Louisiana Recovery Authority Support Foundation only and not intended for reliance by any other Party.
Introduction There is agreement among U.S. healthcare services experts that if one were to design a healthcare system de novo, the last thing it would look like is the healthcare system existing today in the United States. While performing exceptionally well for many, it is considered expensive and error prone, and access to care is not equitable. The system is considered administratively and financially complex and stubbornly resistant to change. The healthcare system in the state of Louisiana is no exception. As complex or perhaps more so than that in other states, it too has been resistant to change despite enormous and growing challenges. While struggling to fulfill the public hospital mission of service to the under and uninsured, the entire healthcare system (serving both the public and private sector) suffers from high cost and lower than expected quality. For years stakeholders have invested time, energy, and resources into understanding the issues that Louisianans face; many studies have been published since the beginning of the decade, but few systemic changes have occurred. The summer of 2005 is one that will never be forgotten in the state of Louisiana. Hurricanes Katrina and Rita battered the coast in rapid sequence like no others before and caused the greatest natural disaster in U.S. history. The hurricanes and ensuing floods significantly impacted healthcare infrastructure – hospitals, clinics, long-term care facilities and doctors' offices – it could be fairly said that they did so indiscriminately, for they did the same to the infrastructure of all industries that lay in their path. What was different in healthcare, however, is that the hurricanes exposed the vulnerabilities that the system had created for so many thousands of Louisianans, particularly for those with little means. Hurricane Katrina began as a horrifying story of hundreds dying and thousands suffering, exacerbated by a lack of preparedness of healthcare facilities for an emergency of this scale. The situation escalated as the "safety-net" of care for the under and uninsured nearly disappeared with the closure of the Charity Hospital system in New Orleans, leaving thousands without medical records, doctors, clinics and hospitals. This scope of work and report is organized into six chapters – the first chapter defining a vision and mission of the healthcare system for the state, and then delivering that vision and mission with:
measures and an optimized healthcare system for the future; an appropriate supply of workforce and medical education; public and private technology infrastructure; a system for emergency preparedness and disaster planning; and a financial framework.
The healthcare system in Louisiana is distinguished by its determination to assure a safety-net of care to its most needy citizens. What has evolved is a polarized state healthcare system with two delivery systems living within it – one for the insured and one for the uninsured. This report describes in detail how this dichotomy is not good for the healthcare of all Louisianans and how that led to the private sector overcapacity and public sector under capacity. It further describes how the financing model of the public system has left the safety-net in rural regions even more financially disadvantaged. Lastly, the report describes how this "two-system" model has negatively affected the state’s graduate medical education (residency training programs).

Report for the Louisiana Recovery Authority Support Foundation
Page 8
This Report is intended for the use and benefit of the
Louisiana Recovery Authority Support Foundation only and not intended for reliance by any other Party.
Much of the data presented within this report is not new and is sourced elsewhere. Efforts were focused on finding sources of data from inside and outside of the state, validating them and choosing the most appropriate benchmarks where applicable. This study indicates that the system can evolve to one of greater access and higher quality, and one that is better prepared for the next catastrophe. Indeed, it should be evident to all that the mission of care for the under and uninsured in the state of Louisiana can only survive with systemic changes, and that the Louisiana healthcare system could become a model for the nation. The findings and recommendations are derived from multiple interviews and data sources listed in the appendices. This summary is intended as a narrative; detailed data, observations, comparisons and discussions are included and appropriately referenced (sourced) in the body of the report. This study, particularly in the designated timeframes and in a complex environment made more so by the rapidly moving events of post-hurricane Louisiana, was conducted in a manner somewhat different than is customary. The typical activities of using data to generate hypotheses were ineffective; the information was fragmented, dynamic and often difficult to analyze. Rather, hypotheses were generated by conducting interviews with most of the key healthcare stakeholders, a set of emerging and recurrent themes were refined, and data were used to assess those themes. As such, it is necessarily imperfect, and represents a snapshot in time. It is important that confusing healthcare terminology is rendered explicit in meaning, and for that reason a glossary of terms is included in the appendices. However, for the purpose of this summary, some definitions are required:
1) Healthcare Regions – The Department of Health and Hospitals has divided the state for planning purposes into nine separate regions. A regional map immediately follows this summary. The regions are usually centered on a major population center – Region 1, New Orleans; Region 2, Baton Rouge, etc. It is important to understand, however, that while the population center may dominate a particular region, the geographic reach is often beyond that center.
2) Private and Public Hospitals – In this summary and report, public hospitals refer exclusively
to the ten public hospitals under the management of Louisiana State University (LSU), eight of which fall under the umbrella of the LSU - Health Care Services Division (HCSD), and two under the LSU - Health Sciences Center (HSC) - Shreveport (commonly referred to as South and North, respectively). These hospitals are listed immediately after the regional map. They collectively refer to the Louisiana vernacular of the Charity Hospital System. The private hospital system includes all other hospitals: private for-profit, private not-for-profit and other publicly owned (such as parish) hospitals. The Veterans Administration health system was not reviewed in this report. The terms public hospitals, Charity hospitals and LSU hospitals are used interchangeably in this report but all refer to this ten-hospital system.
3) Academic medical center – an organization which consists of multiple entities focused on
three missions of teaching, research and patient care and doing so in close affiliation with or as part of a degree-granting university.
4) Sustainability – “…the economic state where the demands placed upon the environment by
people and commerce can be met without reducing capacity to provide for future generations.” Sustainability would be a system that could meet demand in the future.

Report for the Louisiana Recovery Authority Support Foundation
Page 9
This Report is intended for the use and benefit of the
Louisiana Recovery Authority Support Foundation only and not intended for reliance by any other Party.
Operating margins are a key indicator of an organization’s ability to cover its costs and its financial stability. Margins in excess of break-even are required to cover other costs and cash flow needs – principally facility and equipment replacement and technology advancement. In addition, resources are required to pay outstanding debt as well as maintain working capital. Therefore, a sustainable system would generate sufficient margins for all aspects of the delivery system, while delivering desired quality and health outcomes.
The following provides an overview of the report's Key Findings and Recommendations. Extensive research and analysis supporting these statements are included in the full report. Without considering this supporting data and analysis, conclusions drawn in this executive summary could be misconstrued by various stakeholders. Rebuilding Louisiana's healthcare system requires a full understanding of issues that are complex, cultural, and interrelated; a robust discussion of them is contained in the full report.

Report for the Louisiana Recovery Authority Support Foundation
Page 10
This Report is intended for the use and benefit of the
Louisiana Recovery Authority Support Foundation only and not intended for reliance by any other Party.
Key Findings and Recommendations 1) The best starting point for system assessment is quality.
In Louisiana, as elsewhere, disagreement exists when considering how to measure the attributes of a healthcare delivery system. The Institute of Medicine (IOM), a non-partisan, not-for-profit and nationally distinguished branch of the National Academies offers a framework for discussion. This view is described in the IOM’s publication in July 2001: Crossing the Quality Chasm - a New Health System for the 21st Century. Recommendation 1: Adopt a vision for the Louisiana healthcare system as follows:
All healthcare organizations in the state, professional groups and private and public purchasers work to continually reduce the burden of illness, injury and disability, and to improve the health and functioning of all the people of Louisiana.
Create a mission of the Louisiana healthcare system that focuses on quality and the six aims for quality as described by the Institute of Medicine:
The state of Louisiana endeavors to deliver on its vision by providing to all Louisianans a quality-based system that is safe, effective, patient-centered, timely, efficient and equitable.
This quality framework is the platform for discussion in this report. Its adoption by the state can drive a consistency of ideas for improvement, strategies for implementation, targets to manage against, and results to continually improve.
2) Louisiana’s healthcare system, in essence, consists of two systems – one for the insured and one
for the under and uninsured. The current financing of healthcare delivery to the uninsured promotes referral patterns that encourage this structure. The insured are mostly cared for by the private sector, and the uninsured are mostly cared for by the public hospital system. This two-system model appears to be detrimental to the health of all Louisianans and is likely an important reason for the lower system quality, both in the public and private sector.
i) Background
The state of Louisiana has a tradition of providing healthcare for the under and uninsured. Public hospitals were created as safety net providers, caring for those without or with little means, and often with additional missions of teaching and specialty care such as trauma and burns. With the onset of Medicare and Medicaid in the 1960s, they began to provide insured care as well. However, soon after, private hospitals started to compete vigorously for both Medicare and Medicaid patients, leaving the public hospitals with the task of providing care for the under and uninsured. Public hospitals across America confronted with similar trends were faced with two choices – close, or restructure themselves to offer care to everyone while preserving their mission as the safety net. For

Report for the Louisiana Recovery Authority Support Foundation
Page 11
This Report is intended for the use and benefit of the
Louisiana Recovery Authority Support Foundation only and not intended for reliance by any other Party.
the past two decades that is essentially what has been happening to public hospitals across America, except in Louisiana. Louisiana is the only state left in the nation where a statewide dichotomy of healthcare financing and services still exists to this degree. The split between the private and public systems creates important disparities of financing between the two giving an advantage to the private hospitals that have historically referred uncompensated care to the public hospitals. The data is clear – the rest of America’s private hospitals typically deliver nearly twice the amount of uncompensated care as those in Louisiana. As a result, private hospitals in Louisiana have a “healthier” payer mix – or a more significant stream of revenue from private insurers and Medicare. This culture of one system for one group and another system for another group is embedded in the practice patterns of healthcare professionals in the state, and accentuates the problem; private paying patients are admitted to private hospitals by the same physicians who admit non-paying patients to public hospitals. The public hospitals, which absorb the vast majority of uncompensated care (UCC), are disadvantaged, because their primary revenue source is from the state and federal government in the form of Medicaid Disproportionate Share (DSH) payments used to fund UCC, and thus vulnerable to general economic conditions. Additionally, these funds (as well as traditional Medicaid funds) are leveraged in a 30/70 split. The federal government matches every $30 of state contributory money with $70. In good economic times with a state budget surplus, this level of federal funding provides flexibility in caring for the under and uninsured. However, in bad economic times (and worse, post-hurricanes times) it becomes difficult to support this population, with rapidly declining fund availability for 40 percent of state residents – 19 percent uninsured and 21 percent Medicaid. It is thus not surprising why public facilities pre-hurricanes were in need of $1 billion in capital improvements and deficient in resources to supply services.
ii) The private versus public dichotomy reduces healthcare quality for all Louisianans
The unbalanced financing of the healthcare system in Louisiana supports the private sector's excess capacity that likely produces far more care than is needed, and the public sector's lack of capacity that is likely responsible for the long wait times and scarcity of resources that produce less care than is required. Neither of these conditions is considered healthy.
a) Too many hospital beds in the private sector – It is well established that the supply of hospital
beds in a region-to-region comparison in the U.S. is an important driver of hospital services and costs. Above the base requirement of hospital beds, more beds are correlated with more service, higher costs, and lower quality.
The hospital bed supply in Louisiana before the hurricanes is indicative of the above. In regions 1, 2, 4, 5, 6, 7 and 8, there were between 20 percent and 75 percent more available beds than the national average. For example, in Region 7 (Shreveport), with over 75 percent the national average of hospital beds, the Medicare data shows that hospital use is 50 percent greater than expected. On average, this amounts to over one day of additional hospitalization every year for every Medicare beneficiary in the region compared to the national average. Where excess capacity does not exist, usage tends more to the average. The Medicare costs per beneficiary in Louisiana as reported in the Journal of the American Medical Association are among the highest in the country with the lowest quality outcomes. Because of the "two system" model in

Report for the Louisiana Recovery Authority Support Foundation
Page 12
This Report is intended for the use and benefit of the
Louisiana Recovery Authority Support Foundation only and not intended for reliance by any other Party.
Louisiana, the majority of care for the Medicare population takes place in the private sector, and these data are thus reflective of the private sector.
The most recent hospital (FY2004) occupancy rates of 52 percent on the private side compared to 73 percent on the public side underline the inefficiency. Recent data suggests that despite the private sector’s half capacity use pre-hurricanes, it has sustained a combined profitable operating margin.
On the public side, where hospitals are operating at a much higher occupancy under relatively fixed state budget constraints, the waiting times for both outpatient and inpatient services are much longer than in the private sector. Care postponed in this way leads to small medical problems getting larger, and to more expensive and serious health conditions, i.e. care delayed is care denied.
b) The current system of financing the uninsured – Medicaid DSH funding – is distributed primarily
to public hospitals that provide care to the uninsured, but only limited funding is currently available when care is delivered at sites not affiliated with the public hospital system. In addition, physicians rendering these services can only be compensated by virtue of their employment and salaries from public hospitals. The result is a public healthcare system that is forced to restrict care to sites largely dominated by the public hospitals, and significantly reduces care options for the under- and uninsured.
c) Federal funding mechanisms of hospitals provide additional graduate medical education (GME),
funded largely by the Medicare program. Medicare DSH funding is paid to institutions that have a balance of Medicare and Medicaid patient mix closer to the balanced payer mix found in other states. Under the current system in Louisiana, where public hospitals have a very low percentage of Medicare patients, the state is potentially foregoing up to approximately $160 million of additional Medicare funding (discussed later), the majority of that for graduate medical education.
d) The experience for medical residents is skewed. Under the current systems, medical residents’
experiences are limited to those in the public system with patients who tend to be young and under or uninsured. Since there are far fewer Medicare patients in the public hospitals, medical residents have far less experience with the elderly, who will likely be the bulk of their practices in years to come.
iii) What the two tiered system doesn’t mean for quality
It is important to distinguish the difference between overall macro system issues that drive overuse or under use of assets at large and which are structural in nature, from the quality of care received by the individual patient treated at the right time by the right provider with the right treatment in the right setting. This model of evidence-based care rendered in a continuum of time, location and provider has been shown to produce the highest quality of care in accordance with the Institute of Medicine definition above. These ideas define the concept of disease management in which patients with chronic conditions are managed through this continuum. Fine examples of these innovations exist on both the public side (here driven by the necessity of having to continually produce more with fewer resources),

Report for the Louisiana Recovery Authority Support Foundation
Page 13
This Report is intended for the use and benefit of the
Louisiana Recovery Authority Support Foundation only and not intended for reliance by any other Party.
and the private side, such as the Ochsner Clinic Foundation, Tulane University Hospital and Clinic, and others where disease management programs have been implemented.
Recommendation 2: Eliminate the historically predominant "two-systems within a system" healthcare delivery model. The new model should be designed to serve the entire population of the state, including the poor and the under- and uninsured. Its aim should be to produce the highest quality of healthcare for all (defined above) – insured and uninsured alike. The implementation of this recommendation requires careful and thoughtful planning to assure that in this changing environment access to care for all, particularly for those with little means and special needs, is preserved. Recommendation 3: The Department of Health and Hospitals should immediately begin a planning process, which may include application for special waivers from the federal government and the state government that would link all Medicaid and Medicaid DSH funding to the best objectively measured healthcare services available to all beneficiaries, irrespective of where that care is rendered. This includes fairly distributing funds to the state's nine healthcare regions, based on contracting for integrated care (which should include all appropriate physician, outpatient, hospital, and ancillary services) and managing to quality targets as described by the Institute of Medicine. In other words, these Medicaid and Medicaid DSH dollars should be directed by the state for patient services, not facilities, and artificial control mechanisms such as "budget caps" on the public sector and DSH exclusions to the private sector should be eliminated. Under this proposed financing mechanism, the safety-net of care for the indigent is no longer dependent on public hospitals and facilities, but guaranteed by the availability of high quality integrated services as contracted out by the state. The future of institutions would depend on their ability to compete in regional markets. As a component of implementation planning, it is recommended that a detailed financial modeling be prepared.
3) The hurricanes biggest impact on the healthcare delivery system was in Region 1, where there
are immediate infrastructure shortages related to long-term care, mental health, trauma, and ambulatory care.
i) Region 1 (New Orleans) – Hurricane Katrina essentially right-sized the overbuilt hospital system in
Region 1. Today, there are approximately one-half the pre-Katrina available acute-care hospital beds. Pre-hurricane, those beds had an average occupancy rate of about 56 percent. Accommodating to a 75 percent occupancy rate, adjusting for population changes, and targeting to average U.S. utilization leaves ample numbers of hospital beds under the current re-population scenarios. However, this does not address some of the micro-geographic issues of bed/population distribution such as redistribution of admitting physicians, population diversity, perceived access restrictions due to cultural issues, etc.
The current “bubble” of hospital occupancy in New Orleans is not caused by a shortage of acute care beds, but rather a shortage of appropriate disposition options of inpatients to discharge. Specifically, there is a shortage of long-term care beds, housing and outpatient provider sites. The average length-of-stay has risen in the remaining Region 1 hospitals from a pre-hurricane average of 5.5 days to
Report for the Louisiana Recovery Authority Support Foundation
Page 14
This Report is intended for the use and benefit of the
Louisiana Recovery Authority Support Foundation only and not intended for reliance by any other Party.
more than seven days. A single day increase in the average stay drives occupancy up about 15 percent. The immediate solution to the full hospitals in Region 1 hospitals is finding safe places to discharge patients. Statewide, the number of nursing home beds pre-hurricanes exceeded national average beds per 1,000 by greater 50 percent. Conversely, the state was undersupplied in long-term acute care (LTAC) beds. Region 1, interestingly, was the reverse – under bedded in nursing homes and over bedded in LTACs compared to national averages. The hurricane has rendered the nursing home shortage in Region 1 even more serious.
Charity Hospital and University Medical Center in New Orleans reported more than 300,000 in annual clinic visits, which have been dramatically reduced due to the hospital closures. It is unclear what the current requirement is for these services post-hurricane due to significant population shifts and the patient and case mix of the population remaining in New Orleans. Ambulatory care in Louisiana is much more hospital centric than other parts of the country, with about 43 percent more emergency department visits and 18 percent more outpatient hospital visits than the rest of the country. This variance in emergency use is largely attributable to non-emergent care, and if delivered at appropriate ambulatory sites, could potentially save up to $200 million in system costs.
A significant change in population health is related to post traumatic stress disorder (PTSD). This will challenge a pre-hurricanes mental health sector that already had an undersupply of outpatient mental health facilities/providers. Post-hurricane there has been a tripling of adults with mental health needs, and an estimated 260,000 adults and 120,000 children who will need treatment, particularly in Region 1, and in adjacent regions where evacuees have moved. Ninety-seven of the acute care beds closed with Charity Hospital were mental health beds. PTSD is a syndrome that is expected to increase in prevalence over the coming months. The State Department of Social Services was recently awarded an $80 million one-time grant by the federal government to address the issues surrounding mental health, some of which is targeted at PTSD. These funds must be allocated by September 2006 and spent by September 2007. The Department of Health and Hospitals is now in the planning process to distribute and manage these funds. It is likely that the needs of PTSD patients will extend beyond that timeframe. Louisiana lacked sufficient trauma center coverage pre-hurricanes. The U.S. median supply of Level 1 Trauma Centers is one per 1.5 million people. Pre-hurricanes Louisiana had two trauma centers, for a population ratio of one per 2.2 million people. Currently, there is only one Level I trauma center in the state (at Shreveport), although LSU has contracted with Ochsner Clinic Foundation to lease space to replace its trauma center in New Orleans. In summary, Region 1 has urgent needs regarding long term care, mental health, and ambulatory care. There is no need for additional general acute care beds. The analysis did not address the demand for additional hospital beds related to teaching, research and specialty care.
ii) Region 2 (Baton Rouge) – Pre-hurricanes Baton Rouge was over bedded, and the population
migration post-hurricanes moved its hospital occupancy closer to the 75 percent range. There is a need for a Level 1 Trauma Center in Region 2 based on population census.

Report for the Louisiana Recovery Authority Support Foundation
Page 15
This Report is intended for the use and benefit of the
Louisiana Recovery Authority Support Foundation only and not intended for reliance by any other Party.
iii) Region 5 (Lake Charles) – While suffering significantly from Hurricane Rita, the damage did not significantly affect the hospital system.
The hurricanes left few consequences to the healthcare infrastructure/facilities in the other regions.
Recommendation 4: Immediate action should be taken to solve the patient disposition issues impacting access to Region 1 hospitals. This includes the prompt restitution of appropriate numbers of long term care beds, including nursing home beds as well as the innovative use of home and community based services. Recommendation 5: The Department of Health and Hospitals should complete as a high priority the planning process for the distribution of the recently allocated funds to the Department of Social Services for mental health. These funds should address the incidence and location of likely PTSD patients, and matching those patients with programs based on best practices, deployed well before September of this year. Recommendation 6: There is a joint planning process with the Department of Veterans Affairs (VA) and LSU to replace Charity Hospital. This new LSU hospital should be a state-of-the art facility focusing on niche specialty areas of national excellence, research and teaching in conjunction with the existing substantial medical school infrastructure. The combination of this facility with the LSU medical school in New Orleans should be regarded as a potential magnet for the City for new investments in teaching, research, and sub-specialty medical care. This new facility should also be the new permanent replacement home for the Level 1 Trauma Center. General acute care beds in Region 1 appear to be unnecessary with current population scenarios; however, should repopulation in Region 1 proceed at an accelerated pace, the ultimate use of these beds could be redressed at a later date. Overall, excessive general acute care infrastructure does not provide additive return to a healthcare economy. Recommendation 7: The combination of the need for replacing the aging public hospital and population shift to Region 2 (Baton Rouge) strongly suggests the need for a new hospital there. Planning for this facility should accommodate the need for a Level 1 Trauma Center. In addition, it should also address the requirement for a significantly greater presence of graduate medical education in Region 2 and the likely need for new infrastructure and faculty to address the nursing and allied health professional shortage (discussed later).
Report for the Louisiana Recovery Authority Support Foundation
Page 16
This Report is intended for the use and benefit of the
Louisiana Recovery Authority Support Foundation only and not intended for reliance by any other Party.
Recommendation 8: The state should formulate a plan and make recommendations for the transfer of non-urgent hospital-based care to community-oriented settings as noted above and described in detail in the report. The state should also devise and implement a plan to enhance community and neighborhood ambulatory care and to the extent possible this should include expansion of community and rural clinics, FQHCs and LSU clinics where appropriate.
4) The management of the public hospitals pre-hurricanes by Louisiana State University created
an environment of divergent interests between academic medical centers and the other public hospitals.
Due to historical budget constraints in the public hospital system in the 1990s, all nine hospitals in the public hospital system not under LSU control (LSU-Health Sciences Center Shreveport being the exception) were placed under the same LSU management umbrella, forming the LSU-Health Care Services Division (HCSD). Recently, E.A. Conway Hospital was attached to LSU-Health Sciences Center (HSC) Shreveport.
The impetus for this change may have been the belief that LSU-HSC Shreveport is often mentioned as the model for how the public hospital system could more appropriately work. However, even this reorganization of management and structure could not stem the inevitable consequences of changing market conditions that had driven so many other public hospitals across the country to move to different models. Today, aside from Louisiana, there are few public hospitals left in the U.S. that are run by the state. The rest are now either separate private entities, not-for-profit corporations, or run by local government. The financial consequences to all of the public hospitals in Louisiana except for New Orleans and Shreveport have been significant: a 2003 study showed that in every case they received disproportionately less DSH funding for their uninsured patients than the two major academic centers. These funds were needed by the academic medical centers to support activities unique to them such as teaching, to the detriment of service to the uninsured. While the academic medical centers serve the other regions by providing referral specialty care, medical residents who graduate to serve in other regions, etc., the funding and management requirements of a major academic medical center should not be mixed with the needed funding of care for the under- and uninsured. Recommendation 9: The state should separate the safety-net mission for the under- and uninsured from the educational mission of the LSU medical professional teaching system. As such, it should discontinue the management of the public hospitals by Louisiana State University, except in the case of existing or new major teaching hospitals. The future of these institutions would depend on their ability to compete in regional markets.

Report for the Louisiana Recovery Authority Support Foundation
Page 17
This Report is intended for the use and benefit of the
Louisiana Recovery Authority Support Foundation only and not intended for reliance by any other Party.
5) The two-system care model in Louisiana has impacted the adequacy of funding for LSU’s graduate medical education program (residency training or GME), and the quality of the experience for its trainees.
Prior to the hurricanes, the GME program of LSU was almost exclusively conducted in public hospitals. This means that most of the LSU medical and surgical residents had approved positions in the LSU hospital system. GME is largely funded by the federal government through the Medicare program, where there are formulae to reimburse hospitals for the direct cost of residents and their supervisors (GME payments), and for the hospitals’ indirect additional costs of residency training, such as more complicated patients, more testing, etc. (IME). The private-public dichotomy left Charity Hospital with only eight percent of patients that were Medicare recipients, and only 15 percent in Shreveport. This compares unfavorably to an average of 30 percent to 40 percent in the private sector in Louisiana, and across the nation. The net result is that LSU receives only about $15,000 in direct reimbursement per resident compared to over $60,000 for other Louisiana based hospitals. It is estimated that if the nearly 1,000 LSU resident physicians were trained in hospitals with an average payer mix, up to $100 million of additional statutory Medicare funding would be available to hospitals to cover direct and indirect residency costs, and up to another $60 million related to Medicare DSH funding. This dichotomy also skewed the residency training experience, leaving those trainees with inadequate exposure to the elderly. Pre-hurricanes private hospitals were reticent to take on LSU residents in their hospitals. Tulane resident physicians were reassigned to hospitals in Louisiana and Texas, but LSU resident physicians were deployed among area private hospitals. The experience of the private sector physicians has been extremely positive, and has generated a different point-of-view amongst them regarding a willingness to take on teaching and supervision. Today, they are generally welcome in these private hospitals. Of note is that the displaced LSU resident physicians are currently practicing for the most part in hospitals which don’t have Medicare residency slots approved. Hence they are currently incurring cost to the LSU system, with no federal reimbursement to cover their services. It is understood that the Secretary of HHS has recently issued a rule that addresses the issue. Recommendation 10: LSU's hospitals should disperse its resident physicians (both primary and specialty) to hospitals with a higher percentage of Medicare patients. LSU's hospitals should also assess all of its teaching options – without compromising the care of patients or its teaching mission – to implement a strategy of improved exposure to all segments of the population and increased Medicare funding support of GME throughout the state. This could include special waivers from the Medicare program allowing innovative new ways of funding graduate medical education, and these options should be investigated.
6) Compared to benchmark states, the healthcare workforce has a shortage of primary care
physicians and an oversupply of specialty physicians who are concentrated in New Orleans, Shreveport, and Baton Rouge while leaving the rest of the state in short supply. There are sufficient medical students in the state, but likely an impending need for more doctors due to an

Report for the Louisiana Recovery Authority Support Foundation
Page 18
This Report is intended for the use and benefit of the
Louisiana Recovery Authority Support Foundation only and not intended for reliance by any other Party.
aging population. There is a shortage of nurses, physicians’ assistants, and other allied health professionals, with an oversupply of licensed practical nurses (LPNs). Residency training positions are located disproportionately in New Orleans, with too few primary care residents.
Louisiana has three medical schools with a total of 1,722 undergraduate students, which is higher than most of the benchmark states as delineated in the report. Virtually 100 percent of all LSU medical students and 26 percent of Tulane’s medical students come from Louisiana. About one half of LSU medical students and about one-third of Tulane’s medical students stay in-state for residency training. One third of the 1,800 residency slots are for primary care physicians and, in general, these primary care slots are not filled to capacity. The state does a better than average job in retaining primary care residents to practice in Louisiana post-residency, but about one-half of all residents leave the state after completion of training. Of note is that Louisiana physicians incur a significantly higher debt load after completion of training than doctors who train in neighboring states. The residency training slots in Louisiana pre-hurricanes were heavily concentrated in Region 1 (New Orleans) and Region 7 (Shreveport) with a 2:1 ratio of specialty to primary care residents. Various interviewees reiterated that some New Orleans residency slots were at risk by national accreditation organizations because of a relative scarcity of clinical material (patients). A simple restating of residency slots to match population and primary care needs shows that Tulane and Ochsner have more than enough residents to fill all of the New Orleans requirements, and only LSU has the capacity to meet the rest of the state requirements, especially in Baton Rouge. Solving the primary care physician problem in Louisiana to guarantee long term availability to Louisianans throughout the state will require special efforts. Other states have solved these problems (others – particularly the WWAMI program in the states of Washington, Wyoming, Alaska, Montana, and Idaho are referenced in the body of this report as possible models for Louisiana). A workforce model was developed suggesting that the appropriate number of doctors, properly balanced for primary care and specialties would incrementally cost approximately $20 million per year in physician salaries. Louisiana has a shortage of nurses, yet a surplus of LPNs. There are also deficits of a variety of allied health professionals. The workforce model estimates the incremental salary cost of addressing this shortfall to be about $180 million annually. Therefore, the workforce analysis estimates the increased cost would be about $200 million in total. Recommendation 11: LSU should comprehensively review its strategy of educating and training physicians for the state of Louisiana from the recruitment of medical students, residency training, to post-training physician retention to assure the state of the right supply and balance of primary care and specialty physicians for the next generation. This study should closely consider the heavier burden of debt incurred by Louisiana medical students, the medical needs of Louisianans, the demographics and location of population, and the commitment of Tulane and Ochsner to Region 1. This strategic plan could be approved by the end of 2006 with implementation no later than 2008.

Report for the Louisiana Recovery Authority Support Foundation
Page 19
This Report is intended for the use and benefit of the
Louisiana Recovery Authority Support Foundation only and not intended for reliance by any other Party.
Recommendation 12: The state should focus on retaining existing and recruiting new physicians and allied healthcare professionals such as nurses, LPNs, physician assistants, etc. While there are several programs currently in place, the state should expand and align them under a comprehensive plan to assure the adequacy of supply for the future. An immediate opportunity is career laddering of LPNs to RNs, and incentives could be provided to encourage these activities. Programs for physician assistants and nurse practitioners should be created and/or expanded to help offset the need for primary care physicians. This will likely require more infrastructure and faculty to support these activities.
7) Information technology infrastructure in Louisiana is immature. In Louisiana, a digital
technology infrastructure or "backbone" is an important requirement for healthcare continuity in time of disaster, as well as the enabling foundation for a system of healthcare for all Louisianans that is integrated, continuous, and patient-centered.
After the hurricanes, and as a direct result of the significant loss of paper medical records, the Department of Health and Hospitals initiated a series of activities to connect patients to lost information. In collaboration with the private sector, Katrina.org was launched, which provided prescription drug information to pharmacists so that needed prescriptions could be filled for evacuees separated from their medical records. Since then, DHH has continued its efforts, having received a $4 million grant from the Office of the National Coordinator of Health Information Technology (ONCHIT). In addition, it has begun to enlist stakeholders in Louisiana to push forward preparedness for the next hurricane season and plan for the creation of a permanent digital infrastructure for the state. Recommendation 13:
The Department of Health and Hospitals should formalize its post-hurricanes activities by creating a statewide organizing body – the Louisiana Health Information Organization – for the purpose of defining, deploying, governing, and sustaining the digital backbone efforts of all of the healthcare stakeholders in the state. Urgently required is the successful deployment of the current plan for 2006, which has already been funded by ONCHIT. The required management activities over the next 3 to 5 years are expected to increase the use of electronic health records. Establishment of a health information exchange is estimated to cost an additional $35 million in infrastructure and approximately an incremental $10 million annually in operating costs. These activities are a necessary element of healthcare system improvement. This investment is what’s needed for the exchange of healthcare information. It does not include the capital that would be required to implement electronic medical records in Louisiana’s physician offices, ambulatory clinics, hospitals and long-term care facilities.
8) Louisiana has an immediate and urgent need for a statewide healthcare emergency
preparedness system.

Report for the Louisiana Recovery Authority Support Foundation
Page 20
This Report is intended for the use and benefit of the
Louisiana Recovery Authority Support Foundation only and not intended for reliance by any other Party.
While the emergency response to the hurricanes had several dimensions aside from healthcare, over 200 people died in New Orleans hospitals and nursing homes as a result of the hurricanes. Many more were killed or injured, and hundreds of thousands of people were displaced. The complexity of readiness and response activities, particularly related to coordination with multiple state and federal agencies, demands a thoughtful and comprehensive plan. Recommendation 14:
Fund the Louisiana Emergency Response Network to operationalize a time-sensitive illness response system linking homeland security initiatives with healthcare operational standards and trauma care requirements. Implementation is estimated to require approximately $9 million in annual operational costs (in today’s dollars).
Formalize the Public Health and Medical Services emergency support function (ESF-8) incident command structure in accordance with the National Response Plan and the National Incident Management System to minimize chaos and enhance decision making during a disaster.
Establish long-term funding and planning mechanisms to sustain emergency preparedness of the Louisiana health system by creating the “Bureau of Emergency Preparedness” as approved as its own entity within the Department of Health and Hospitals with a budget estimated at $1 million annually and the resources required to develop and sustain realistic disaster plans.
9) The state of Louisiana has a unique opportunity to create significant change to the current
healthcare delivery system. Its redesign, as described in this report, also presents significant challenges. However, the analysis indicates that the combination of reducing excess cost and accessing new revenue sources could enable a financially sustainable healthcare system that provides high quality care for all Louisianans, coverage for everyone and protection of the safety-net mission for those in need.
This report includes a high-level financial view of the healthcare system as it existed pre-hurricanes and how it could exist in the future. It is estimated that on a pro forma basis, the pre-hurricanes system was under funded by about $350 million. Taking into consideration the current excesses in the system, together with its needs, requirements for new infrastructure, a better balanced workforce, financing and delivery through a “one system” approach, and realizing more revenue for graduate medical education, and other mechanisms related to insuring the currently uninsured, the healthcare system could be in a financial position to support the recommendations in this report. The development of integrated care models, targeted service budgets and aligned reinvestment of savings are required to achieve a high quality and sustainable healthcare delivery system. Additional work still needs to be completed to determine how funds would flow to realize of the goals described herein. Agreement and implementation will require participation of key financial stakeholders such as employers, insurers, and government (both state and federal), as well as providers and patients. This kind of activity would not be unique to Louisiana, and has been occurring in other states which have also faced similar challenges. There is much to learn and build from in these other examples – the most important decision is to start.

Report for the Louisiana Recovery Authority Support Foundation
Page 21
This Report is intended for the use and benefit of the
Louisiana Recovery Authority Support Foundation only and not intended for reliance by any other Party.
Recommendation 15: An appropriate transition plan should be developed by the state to ensure that the recommendations of this report are implemented in a timely, transparent and equitable manner, with special attention to those with little means and special needs. Because this report calls for systemic rather than piecemeal change, strong leadership and resolve will be necessary to achieve the vision of healthcare quality for all Louisianans.

Report for the Louisiana Recovery Authority Support Foundation
Page 22
This Report is intended for the use and benefit of the
Louisiana Recovery Authority Support Foundation only and not intended for reliance by any other Party.
Department of Health and Hospitals Regional Map
Public Hospitals LSU Health Care Services Division Hospitals Medical Center of Louisiana at New Orleans (New Orleans) Lallie Kemp Regional Medical Center (Independence) Dr. Walter O. Moss Regional Medical Center (Lake Charles) Earl K. Long Medical Center (Baton Rouge) University Medical Center (Lafayette) Leonard J. Chabert Medical Center (Houma) Huey P. Long Medical Center (Pineville) Bogalusa Medical Center (Bogalusa) LSU Health Sciences Center Hospitals Earl A. Conway Medical Center (Monroe) LSUHSC – Shreveport (Shreveport)

Report for the Louisiana Recovery Authority Support Foundation
Page 23
This Report is intended for the use and benefit of the
Louisiana Recovery Authority Support Foundation only and not intended for reliance by any other Party.
SECTION I: VISION AND MISSION OF THE LOUISIANA HEALTHCARE SYSTEM It is impossible to conduct an assessment of the healthcare system in any state, or indeed in the nation as a whole, without a universally agreed upon framework for discussion. The complexity of the system with its many stakeholders and special interests demand a unifying theme. Without a road map, it is difficult to have a meaningful discussion. The healthcare system in Louisiana faces many of the same challenges as elsewhere in the United States: an explosion of medical knowledge with new technologies for diagnosis and treatment, rising costs well in excess of other industries, heightened expectations from patients and consumers and an erosion of the traditional employer based insurance coverage. Together with increasing life spans and likely scenario of living with a chronic illness, the clamor increases exponentially in the debate of stakeholders’ wants and needs. Finding one idea with which everyone can agree is imperative to productively moving forward. The organizing framework for discussion of the Louisiana healthcare system should be quality. There is no better starting point, no better destination, no better platform for discussion and no likelier construct that all can agree on than quality. In 1998, the Institute of Medicine (IOM), an independent, non-partisan, not-for-profit member organization of the National Academies appointed a Committee on the Quality of Health Care (the Committee) in America to identify strategies for improving the quality of healthcare for all Americans. The IOM was founded in 1970 by the National Academy of Sciences expressly to secure the services of eminent members of the medical professions to examine policy matters relating to healthcare in the United States. It operates under a congressional charter to be an adviser to the federal government and to choose issues at its own discretion relating to medical care delivery, research and teaching. All of its advisers are unpaid by the IOM and vetted carefully for conflicts of interest. The Committee brought together the best minds in healthcare quality in the country. With their hundreds of years of combined experience and contributions to the literature of healthcare quality, they engaged in a set of activities that culminated with the publication of two studies: To Err is Human: Building a Safer Health System, released in 1999 and Crossing the Quality Chasm: A New Health System for the 21st Century, released in 2001. To Err is Human focused on a specific issue, patient safety. That work, widely acclaimed, brought immediate attention to the American public on the inherent dangers of the healthcare delivery system and was singularly responsible for many changes that swiftly ensued among all stakeholders in the system to reduce medical errors and improve patient safety. Crossing the Quality Chasm provided strategic direction on broader issues of quality and addressed the question of how to redesign the healthcare system with quality as its central theme. With a depth and breadth never before accomplished, the Committee proposed an agenda for change, six “aims” for system improvement, a unifying overall purpose for the healthcare system, a way to track progress, a set of rules for process redesign and suggested activities to get started. While initially controversial, Crossing the Quality Chasm has become the de facto organizing framework for the quality agenda in the U.S. and is viewed as the best combined thinking the nation has to offer in this regard.
Report for the Louisiana Recovery Authority Support Foundation
Page 24
This Report is intended for the use and benefit of the
Louisiana Recovery Authority Support Foundation only and not intended for reliance by any other Party.
Taking advantage of this effort by the IOM, Louisiana should adopt its view of the overall purpose of a healthcare system designed for the 21st century as the state’s vision and take its six aims as the essential quality constructs for the state’s mission. Thus, Recommendation 1 states that a vision should be adopted and a mission created as follows:
Vision for the Louisiana Healthcare System All healthcare organizations in the state, professional groups and private and public purchasers will work to continually reduce the burden of illness, injury and disability and to improve the health and functioning of all the people of Louisiana.
Mission of the Louisiana Healthcare System The state of Louisiana should endeavor to deliver on its vision by providing to all Louisianans a quality based system that is safe, effective, patient-centered, timely, efficient and equitable. The six quality aims as described below are a set of constructs. In and of themselves they are neither measures nor targets, and many healthcare organizations around the country have attached measures to them. Organizing all of Louisiana’s system performance around these constructs will drive a consistency of ideas for improvement, strategies for implementation, targets to manage against and results to continually improve.
Safe – Avoiding injuries to patients from the care that is intended to help them. To Err is Human defined safety as the freedom from accidental injury. The concept of an error free environment in healthcare is novel and lags far behind other industries. Included here are mistakes in diagnosis and treatment, as well as getting hurt inadvertently from the process of care, like suffering an allergic reaction from a medication because a patient wasn’t properly recognized as allergic, or becoming infected in a hospital. Safety also implies seamless care – not dropping the ball when a patient moves from one site to another or from one doctor or nurse to another. It also means that the same safe environment is a twenty-four hour phenomenon, not just daytime during the week. The IOM also believes that an informed patient is the safer patient and should be included in all deliberations of risk, benefit and consequences of outcome.
Effective – Providing services based on scientific knowledge to all who could benefit and
refraining from providing services to those not likely to benefit (avoiding under use and overuse, respectively). A key concept in effectiveness is the notion that there is scientific evidence that the outcomes of the treatment are better than the alternatives, widely known as evidence-based care. The direct consequence of applying evidence-based care to patients is avoiding care that is more likely to harm than help and not restricting care that is more likely to help than harm. For example, unnecessary hospital care is ineffective, as it is far more likely to hurt than help; likewise for a wait and see treatment plan to an urgent condition requiring a surgical intervention. Integral to a delivery system focused on effectiveness is recording the outcome and monitoring results in a transparent and continuous manner.
Patient-centered – Providing care that is respectful of and responsive to individual patient
preferences, needs and values and ensuring that patient values guide all clinical decisions. The

Report for the Louisiana Recovery Authority Support Foundation Page 25
This Report is intended for the use and benefit of the
Louisiana Recovery Authority Support Foundation only and not intended for reliance by any other Party.
IOM and others have identified many dimensions of patient-centered care: respect for patients’ values, preferences and expressed needs; coordination and integration of care; information, communication and education; physical comfort such as the absence of pain; emotional support by relieving fear and anxiety; involvement of family and friends.
Timely – Reducing waits and sometimes harmful delays for both those who receive and those
who give care. Waits are endemic to the healthcare system – patients wait almost everywhere, as do nurses and doctors. From ambulances to long-term care facilities, doctor’s waiting rooms to operating rooms – everyone waits. Ultimately, care that is not given when needed is care denied. Unnecessary delays in emergency response, treatment in emergency departments and elsewhere can be fatal or lead to unnecessary and irreversible poor outcomes.
Efficient – Avoiding waste, including waste of equipment, supplies, ideas and energy. Waste is
the use of resources without taking advantage of their benefits. Therefore, reducing waste can improve processes and outcomes, and this has been shown in many areas of the healthcare system.
Equitable – Providing care that does not vary in quality because of personal characteristics such
as gender, ethnicity, geographic location and socio-economic status. At the population level, equity implies equal access for all to the same high quality care. One of the key barriers in this regard is a lack of or inadequate insurance coverage, which has been repeatedly shown to reduce access to care. The IOM believes that reduced access is a powerful barrier to quality. On an individual basis, equity implies rendering care based on need, not on irrelevant patient attributes such as race, gender, level of education, or income.

Report for the Louisiana Recovery Authority Support Foundation
Page 26
This Report is intended for the use and benefit of the
Louisiana Recovery Authority Support Foundation only and not intended for reliance by any other Party.
SECTION II: MEASURES AND OPTIMIZING THE HEALTHCARE SYSTEM FOR THE FUTURE Introduction Louisiana's healthcare system, prior to the destruction caused by Hurricanes Katrina and Rita, suffered from significant social, financial and cultural issues that caused the state to rank low in many key healthcare measurements. The combination of changes in population, destruction of existing service capacity and an underperforming healthcare system offers a challenge and an opportunity. By building a new system with a vision and mission as described earlier, Louisiana can create something that is sustainable and a model for the nation.
Research
An analysis of the pre-hurricanes healthcare system. Available metrics are benchmarked
according to the measures identified in Section I and other industry standard measures Research on other healthcare systems, including other states and countries performance indicators
and comparisons to Louisiana Analysis of the population and healthcare service demand pre and post-hurricanes Outline of an optimized healthcare system based upon achievement of the performance
improvements and rightsizing to the changed population demand post-hurricanes
Key Findings and Recommendations
Key Finding: Louisiana's healthcare system, in essence, consists of two systems – one for the insured and one for the under- and uninsured. The current financing of healthcare delivery to the uninsured promotes referral patterns that encourage this structure. The insured are mostly cared for by the private sector, and the uninsured are mostly cared for by the public hospital system. This two-system model appears to be detrimental to the health of all Louisianans and is likely an important reason for the lower system quality, both in the public and private sector. Recommendation 2: Eliminate the historically predominant "two-systems within a system" healthcare delivery model. The new model should be designed to serve the entire population of the state, including the poor and the under- and uninsured. Its aim should be to produce the highest quality of healthcare for all (defined above) – insured and uninsured alike. The implementation of this recommendation requires careful and thoughtful planning to assure that in this changing environment access to care for all, particularly for those with little means and special needs, is preserved. Recommendation 3: The Department of Health and Hospitals should immediately begin a planning process, which may include application for special waivers from the federal government and the state government that would link all Medicaid and Medicaid DSH funding to the best objectively measured healthcare services available to all beneficiaries, irrespective of where that care is rendered. This includes

Report for the Louisiana Recovery Authority Support Foundation
Page 27
This Report is intended for the use and benefit of the
Louisiana Recovery Authority Support Foundation only and not intended for reliance by any other Party.
fairly distributing funds to the state's nine healthcare regions, based on contracting for integrated care (which should include all appropriate physician, outpatient, hospital, and ancillary services) and managing to quality targets as described by the Institute of Medicine. In other words, these Medicaid and Medicaid DSH dollars should be directed by the state for patient services, not facilities, and artificial control mechanisms such as "budget caps" on the public sector and DSH exclusions to the private sector should be eliminated. Under this proposed financing mechanism, the safety-net of care for the indigent is no longer dependent on public hospitals and facilities, but guaranteed by the availability of high quality integrated services as contracted out by the state. The future of institutions would depend on their ability to compete in regional markets. As a component of implementation planning, it is recommended that a detailed financial modeling be prepared. Key Finding: The hurricanes biggest impact on the healthcare delivery system was in Region 1, where there are immediate infrastructure shortages related to long-term care, mental health, trauma and ambulatory care. Hurricane Katrina essentially right-sized the overbuilt hospital system in Region 1. Today, there are approximately one-half the pre-Katrina available acute-care hospital beds. Pre-hurricane, those beds had an average occupancy rate of about 56 percent. The current “bubble” of hospital occupancy in New Orleans is not caused by a shortage of acute care beds, but rather a shortage of appropriate disposition options of inpatients to discharge. The most significant change in population health is likely to be related to post traumatic stress disorder (PTSD). This will likely challenge a pre-hurricanes struggling mental health sector that already had an undersupply of outpatient mental health venues. While the state had more hospital beds than the national average, the supply of trauma centers was low before the hurricanes. The U.S. median supply of Level 1 trauma centers is 1 per 1.5 million people. Pre-hurricanes Louisiana had two, for a population ratio of 1 per 2.2 million people. Post-hurricanes, the only Level I trauma center still operating is in Shreveport. Recommendation 4: Immediate action be taken to solve the patient disposition issues impacting access to Region 1 hospitals. This includes the prompt restitution of appropriate numbers of long term care beds, including nursing home beds, as well as the innovative use of home and community based services. Recommendation 5: The Department of Health and Hospitals should complete as a high priority the planning process for the distribution of the recently allocated funds to the Department of Social Services for mental health. These funds should address the incidence and location of likely PTSD patients and matching those patients with programs based on best practices, deployed well before September of this year. Recommendation 6: There is a joint planning process with the Department of Veterans Affairs (VA) and LSU to replace Charity Hospital. This new LSU hospital should be a state-of-the art facility focusing on niche specialty areas of national excellence, research and teaching in conjunction with the existing substantial medical school infrastructure. The combination of this facility with the LSU medical school in New Orleans should be regarded as a potential magnet for the City for new investments in teaching, research, and sub-specialty medical care. This new facility should also be the new permanent replacement home for the Level 1 Trauma Center. General acute care beds in Region 1 appear to be unnecessary with current population scenarios; however, should repopulation in Region 1 proceed at an

Report for the Louisiana Recovery Authority Support Foundation
Page 28
This Report is intended for the use and benefit of the
Louisiana Recovery Authority Support Foundation only and not intended for reliance by any other Party.
accelerated pace, the ultimate use of these beds could be redressed at a later date. Overall, excessive general acute care infrastructure does not provide additive return to a healthcare economy. Recommendation 7: The combination of the need for replacing the aging public hospital and population shift to Region 2 (Baton Rouge) strongly suggests the need for a new hospital there. Planning for this facility should accommodate the need for a Level 1 Trauma Center. In addition, it should also address the requirement for a significantly greater presence of graduate medical education in Region 2 and the likely need for new infrastructure and faculty to address the nursing and allied health professional shortage (discussed later). Recommendation 8: The state should formulate a plan and make recommendations for the transfer of non-urgent hospital-based care to community oriented settings as noted above and described in detail in the report. The state should also devise and implement a plan to enhance community and neighborhood ambulatory care and to the extent possible this should include expansion of community and rural clinics, FQHCs and LSU clinics where appropriate. Key finding: The management of the public hospitals pre-hurricanes by Louisiana State University created an environment of divergent interests between academic medical centers and the other public hospitals. Recommendation 9: The state should separate the safety-net mission for the under- and uninsured from the educational mission of the LSU medical professional teaching system. As such, it should discontinue the management of the public hospitals by Louisiana State University, except in the case of existing or new major teaching hospitals. The future of these institutions would depend on their ability to compete in regional markets.

Report for the Louisiana Recovery Authority Support Foundation
Page 29
This Report is intended for the use and benefit of the
Louisiana Recovery Authority Support Foundation only and not intended for reliance by any other Party.
Background
Public hospitals in America were created as safety net providers, caring for those with little or no means, and often with additional missions of teaching and specialty care such as trauma and burns. With the onset of Medicare and Medicaid in the 1960s, public hospitals began to provide insured care as well. However, soon after, private hospitals began to compete successfully for Medicare and Medicaid patients, leaving the public hospitals with the task of providing care for the poor and under- and uninsured. Public hospitals across America confronted with similar trends were faced with two choices – close or restructure themselves to offer care to everyone while preserving their mission as the "safety-net." For the past two decades, public hospitals have thus adapted some more successfully than others. The lone outlier to this trend is found in Louisiana, where statewide and publicly financed safety net hospitals still exist. The state of Louisiana has a long tradition of providing healthcare to the poor and under- and uninsured. As Exhibit 1 shows, Louisiana's public hospitals serve primarily uninsured and Medicaid patients, and the private sector's hospitals serve mostly commercial and Medicare patients. The financial consequence of this imbalance is an under funding of public hospitals, giving an advantage to the private sector hospitals that have historically referred uncompensated care to public hospitals.
Section II Exhibit 1 Payer Mix for Public vs. Private Hospitals in Louisiana
Sources: LHA; Medicare Cost Reports. As a result, private hospitals in Louisiana have what could be called a "healthier" payer mix; this state-wide "two-system within a system" is the only one of its kind in the country. As a result, prior to the hurricanes, uninsured patients were generally cared for in public hospitals, even if that meant transferring them out of private hospitals as soon as they were medically stable. This created an environment where private hospitals had the opportunity to minimize the care of the uninsured, as Louisiana had a place to
8%
29%
48%
16%
39%
19%
4%
38%
0%
10%
20%
30%
40%
50%
60%
Private PublicMedicare Medicaid Uncompensated Commercial / Private

Report for the Louisiana Recovery Authority Support Foundation
Page 30
This Report is intended for the use and benefit of the
Louisiana Recovery Authority Support Foundation only and not intended for reliance by any other Party.
send them: the public hospitals. As can be seen from Exhibit 2 below, the result was that Louisiana's private sector hospitals absorbed much less - about half - the uncompensated care as did their brethren in the rest of the country. The private sector thus had an advantage in the market and could operate successfully at positive profit margins with low occupancy rates - 73 percent on the public side and only 52 percent on the private side. Section II Exhibit 2 Sources: AHA; LHA; Medicare Cost Reports; Health Care Advisory Board The public hospitals, which were full, had limited capital for improvements and expansions. For years, the replacements of Charity Hospital, a 21-story building built in the 1930s, and Earl K. Long, built in 1968 and deemed in poor physical condition, have been discussed but not acted on. In contrast, private hospitals, which were not full, had access to capital for expansion and improvements. Public hospital patients experienced wards with many beds instead of single or double rooms and often dated medical equipment. Private patients had the benefit of modern facilities and equipment in the private sector. A recent architectural study showed that there was at least $1 billion of improvements needed in the public hospital system. See Exhibit 3.
4%
6%
0%
2%
4%
6%
8%
10%
Percentage
% of Uncompensated Care in Private Sector
LA Pre-Hurricanes US Average
73%
52%
30%
40%
50%
60%
70%
80%
Percentage
Occupancy
Public Sector Private Sector
70-75% is ideal occupancy

Report for the Louisiana Recovery Authority Support Foundation
Page 31
This Report is intended for the use and benefit of the
Louisiana Recovery Authority Support Foundation only and not intended for reliance by any other Party.
Section II Exhibit 3 Physical Condition of Hospitals in Louisiana Most care for the uninsured is paid for by Medicaid DSH or disproportionate share dollars. These funds are primarily allocated to Louisiana State University's Health Care Services Division and Health Sciences Center, who manage the ten public hospitals (which include two academic medical centers), where they are subsequently distributed by management on a discretionary basis for inpatient and outpatient care. Physicians are remunerated by salary in these institutions, as by regulation, Medicaid DSH funding is not allowed to be distributed directly to doctors. Additionally, many physician services, particularly in New Orleans and Shreveport at the academic medical centers, are rendered by resident physicians in training from the LSU graduate medical education program. The public hospital system, therefore, by its nature is an institution centric model, because of the way it is financed. State monies are disbursed to public institutions to provide care for the uninsured and for the most part are the only sites of care available to those patients. As seen after Katrina in New Orleans, this poses special vulnerability to the safety net of care, for a catastrophic event that eliminates infrastructure will inevitably lead to the disappearance of services. The nature of the irony in Louisiana is straightforward: a safety net system that did not adjust with the changing times led to an exaggerated difference of financial health between the public and private sectors, a public sector in need of funds based on an institutional model, and then ultimately the hurricanes destroying some of those institutions.
Source: Comprehensive Healthcare Facilities Study – Executive Summary Prepared by: Adams and Washer Hill & Lipscomb, September 2003
* Not included in study** Option to renovate not included here*** Bogalusa facility has since moved into Bogalusa Med. Ctr.
ReplacementVery Poor1939IndependenceLallie Kemp
ImprovementsFair1959Lake CharlesW.O. Moss
Replacement / Move***Poor1960BogalusaBogalusa Medical
Center
ImprovementsFair to Poor1937PinevilleHuey P. Long
ImprovementsGood1978HoumaLeonard J. Chabert
ImprovementsFair1981LafayetteUniversity Medical Center
ImprovementsFair1986MonroeE. A. Conway
ReplacementPoor1968Baton RougeEarl K. Long
-----------1970ShreveportUniversity Hospital*
Replacement**1) Very Poor2) Fair
1936New OrleansMedical Center of LA at N.O.
Facility Recommendation (Pre-Hurricane)
PhysicalCondition
Date BuiltLocationHospital

Report for the Louisiana Recovery Authority Support Foundation
Page 32
This Report is intended for the use and benefit of the
Louisiana Recovery Authority Support Foundation only and not intended for reliance by any other Party.
This history of two-systems has also bred a culture of one system for one group and another system for another group that is deeply embedded in the practice patterns of Louisiana's healthcare professionals and patients and accentuates the problem: private paying patients are admitted to private hospitals by the same physicians who admit non-paying patients to public hospitals. From the perspective of health status, Louisiana has consistently ranked low compared to the rest of the country, as shown in the exhibit below. C Section II Exhibit 4 Health indicators
Source: United Healthcare Foundation
The Population’s Most Prevalent Illnesses and Conditions A summary of the top diagnostic conditions responsible for 80 percent of the non-drug healthcare spend is provided in the exhibit below. This further demonstrates the key conditions that are affecting the health of Louisianans. Section II Exhibit 5 Top Commercial Conditions by Non-Drug Spend
Diagnostic Categories Rank (out of 21 Major Categories)
% of Total Spend
Skeletal and Connective 1 19.1%Cardiovascular 2 13.6%Cancer 3 12.5%Gastronintestinal 4 10.6%Pulmonary 5 9.6%Reproductive Health 6 5.1%Central Nervous System 7 4.8%Renal 8 4.8%Pregnancy 9 4.0%
Source: Based upon 2004 Louisiana claims experience.
34thLimited Physical Activity
46thInfectious Disease
45thViolent Crime
46thPrevalence of Obesity
37thPrevalence of Smoking
34thLimited Physical Activity
46thInfectious Disease
45thViolent Crime
46thPrevalence of Obesity
37thPrevalence of Smoking
Specific Health Indicator State Ranking

Report for the Louisiana Recovery Authority Support Foundation
Page 33
This Report is intended for the use and benefit of the
Louisiana Recovery Authority Support Foundation only and not intended for reliance by any other Party.
Overall, skeletal and connective category has the greatest group spend. This category includes conditions such as back disorders which are common. Cardiovascular is the also a prevalent condition affecting this population. This includes items such as heart disease and hypertension. In the wake of the hurricanes, an opportunity exists to recreate the state's healthcare system, taking the best ideas from around the nation and the world. Louisiana spends more per capita on healthcare than average in the U.S, and because it depends heavily on government funding for its healthcare, it could be compared to some countries that also depend heavily on public funding. However, as Exhibit 6 shows, these comparisons are often difficult to make. Section II Exhibit 6 Like Some Countries, Louisiana Depends Heavily on Public Funding; Yet Outcomes Differ
Louisiana U.S. Australia Canada Germany Switzerland U.K.Government spending on health as % of total health spending
51% 47% 69% 70% 79% 58% 83%
Health insurance coverage 81% 84% 100% 100% 91% 100% 100%
Infant mortality (per 1,000 live births)
10 8 6 5 5 5 6
Influenza vaccine (% of adults 65+)
57% 66% 77% 63% 56% 55% 71%
Per capita spending (in U.S. dollars)
$5,316 $5,280 $1,739 $2,223 $2,637 $4,219 $2,031
General practitioners as % of total M.D.s
38% 40% 54% 48% 32% 13% 31%
Hospital beds per 1,000 population
4.0 2.8 3.7 3.2 9.0 3.9 3.7
Children under 2 immunized with 1 dose of measles (%)
89% 93% 93% 95% 92% 82% 90%
Sources: World Health Organization, World Health Report, Statistical Annex 2005; OECD, OECD Health Data, 2005. Cultural, social, demographic and political issues are different in many of these countries, and the metrics are crude at best. The best way to compare and manage is by establishing quality measures based on the six aims of the Institute of Medicine adopted in this report.
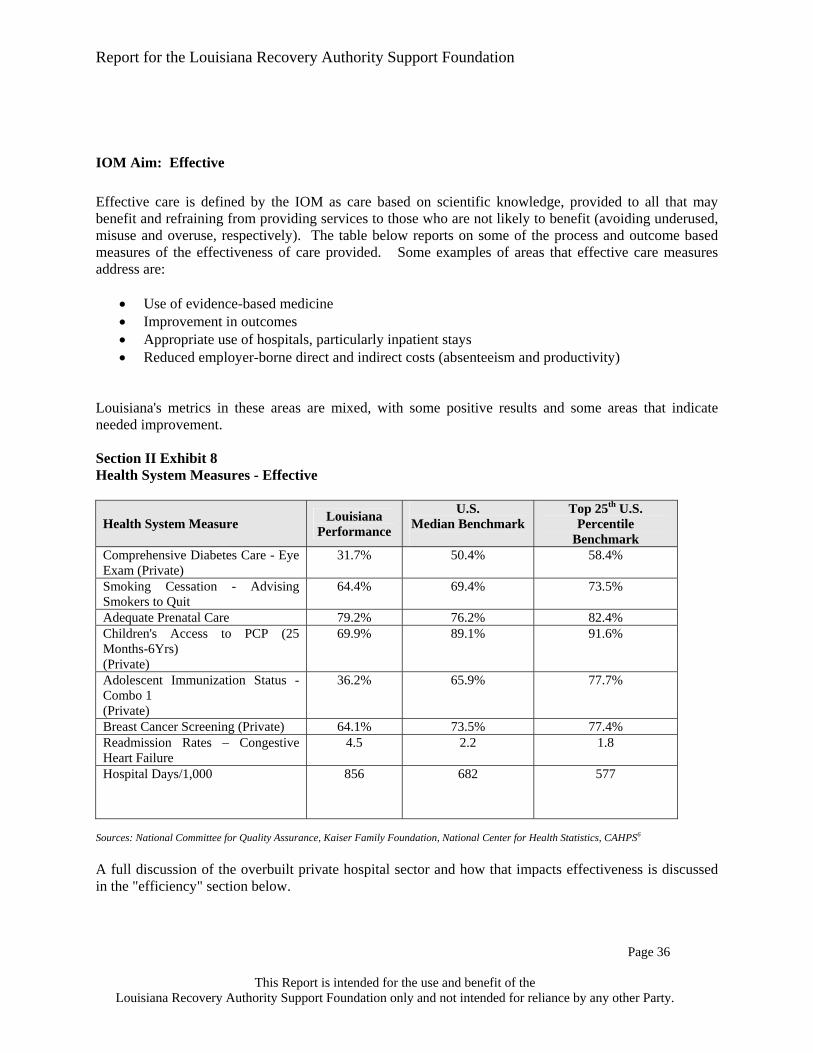
Report for the Louisiana Recovery Authority Support Foundation
Page 34
This Report is intended for the use and benefit of the
Louisiana Recovery Authority Support Foundation only and not intended for reliance by any other Party.
Moving Towards Optimizing the Performance of Louisiana's System Significant improvement in health outcomes and cost of services provided through Louisiana's future healthcare system can be achieved if redesign efforts are built on actions to improve the system in measurable ways. Measuring the structures, processes and outcomes of care provided prior to the hurricanes compared to more favorable practices benchmarked elsewhere in the country can provide the roadmap for the redesign process. Methodologies for healthcare system measurement have been evolving over the past 25 or more years. As discussed in Section I, the IOM's report Crossing the Quality Chasm provides clear aims for health system success. Consideration of Louisiana's health system performance against specific, nationally accepted measures related to each of these aims will facilitate redesign of the system’s structure and processes of care that will then result in significantly improved health outcomes. Measures that embrace the IOM's quality constructs have been developed and collected by several national organizations such as the National Committee on Quality Assurance, the Joint Commission on Accreditation of Health Care Organizations and others. These measures can describe structural elements of the system, care processes, or outcomes of care.
• Structural measures address resources such as the availability of clinical professionals, hospitals and other facilities, IT etc. An example of a structural measure that has implications in Louisiana redesign efforts is the excess hospital bed capacity in some areas and poor access to care in others. Research shows that where there is greater capacity, more care is delivered, whether or not it is warranted.1
• Process measures assess whether certain care processes are being followed in order to provide quality of care to the patient. An example is the administration of antibiotics prior to surgery to reduce the potential for infection.
• Outcome measures assess the results of the care provided. Simply put, how has the patients' health been changed by the care rendered? These measures include indicators such as treatment success or failure rates, changes in health status and others.
Structure, process and outcome results must be considered together if system improvement actions are to be identified. A focus on just one area (structure, process or outcome) will not permit the entire system to improve in the areas that require change. The interrelation between structure, process and outcome is evident when examining the continuum of care provided. For example, use of evidence based clinical pathways for prophylaxis of post surgical infections, administration of required antibiotics prior to surgery and nosocomial infection rates, surgical complications and readmission rates need to be considered when examining outcomes. Another example is the relationship of prenatal care to infant mortality rates. If the system is successful in delivering high rates of prenatal care, but continues to experience high infant mortality, more work for improvement of structure and/or process is necessary. Looking at either of these measures alone is not instructive. Measurements currently available in the industry were looked at and categorized according to each of the IOM aims. Some of the IOM aims lend themselves to more data than others. For example, efficiency measures such as inpatient length of stay and per capita spending are easy to measure. Others, such as error reporting and patient satisfaction, are just beginning to emerge. A full listing of the aggregated measures describing the six quality targets is included in the Appendix to this chapter.
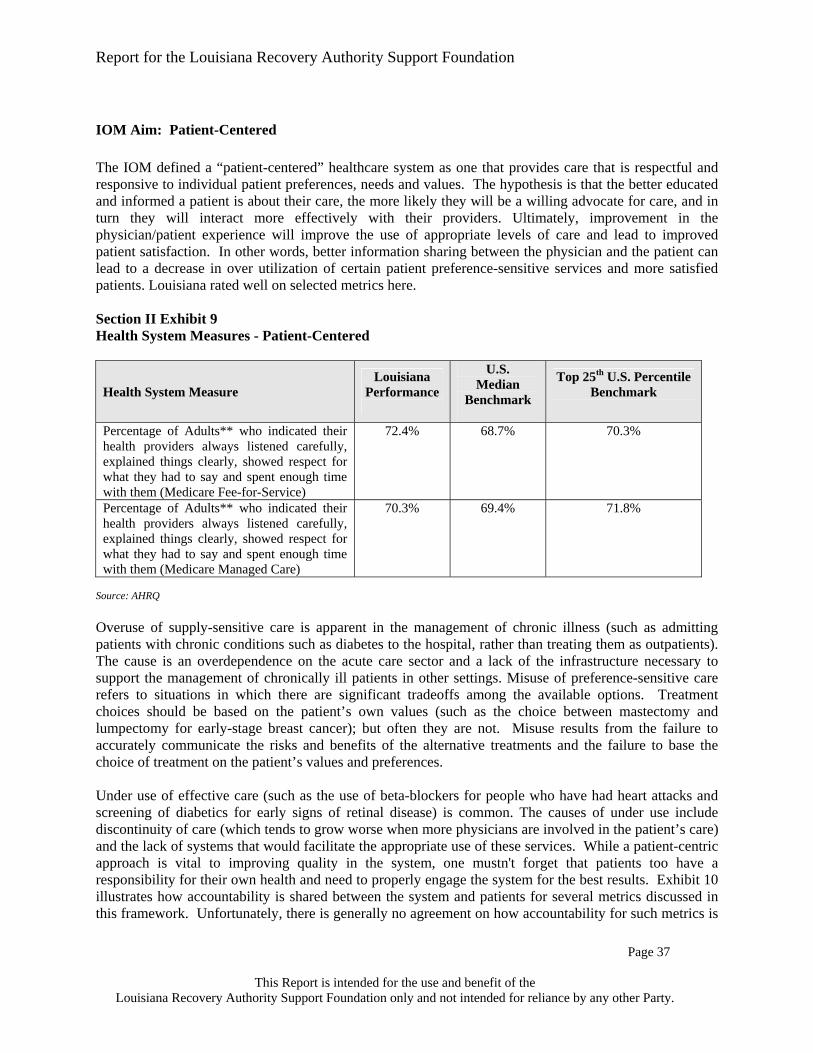
Report for the Louisiana Recovery Authority Support Foundation
Page 35
This Report is intended for the use and benefit of the
Louisiana Recovery Authority Support Foundation only and not intended for reliance by any other Party.
The following is a description of Louisiana's performance based on the six quality aims as described in the mission. Only some measures are used in the text, and a full listing of the available measures can be found in the Appendix.
IOM Aim: Safe Research indicates that nationally, adverse medical events occur in 2.9 to 3.7 percent of all hospital discharges.2 Applying this range to the nearly 600,000 short-term acute care hospital discharges in Louisiana during 2004, an estimated 13,000 to 27,000 adverse events per year could be occurring in the state. Of these adverse events, between 900 and 3,000 would have been expected to result in death. National studies suggest approximately 29 percent of adverse events result from negligence, while approximately 54 percent are preventable. For Louisiana, this could translate into 7,500 to 12,000 preventable adverse events. Further evidence supports that Louisiana has a high-intensity healthcare delivery system which correlates positively with higher mortality rates.3 Oversupply of healthcare services, which are occurring in the private system in Louisiana, could actually be a hazard because they can lead to more medical errors. To reduce the risk to patients, a system for measuring, monitoring and reporting should focus on unsafe processes and preventable outcomes that are the result of common unsafe events: nosocomial infection rates4, medication errors, over utilization of certain procedures and Intensive Care Unit staffing levels. Louisiana's performance in the area of preventing infections could be improved as indicated in the table below. While this indicator applies to hospitals, others are available as well. For example, an indicator for nursing homes is the number of deficiencies cited, a measurement collected by CMS. In Louisiana, the average number of deficiencies reported by nursing homes was ten, compared to eight nationally. There was a wide variation; some reported none, while others had as many as 50.5 An important tool to reducing medication errors in hospitals and clinics is the use of computerized physician order entry systems, and with some individual hospital exceptions, Louisiana has some of the lowest use of this technology in the country. Section II Exhibit 7 Health System Measures - Safe
Health System Measure Louisiana Performance
U.S. Median
Benchmark
Top 10% of Hospitals
Nosocomial Infections - Percent of Surgery Patients Who Received Preventative Antibiotic(s) One Hour Before Incision
65% 70% 93%
Nosocomial Infections - Percent of Surgery Patients Whose Preventative Antibiotic(s) are Stopped Within 24 hours After Surgery
58% 66% 98%
Computerized Physician Order Entry (CPOE) (All Payers) - Leapfrog Data *
0-25% St Francis Med Ctr.
100%
50% 75%
ICU Staffing Ratios (All Payers) - Leapfrog Data *
0-25% Tulane 100%
50% 75%
Source: CMS, * Leapfrog data is voluntarily reported by 18 Louisiana Hospitals. LA 2003: 112 Acute Hospitals, Total Hospitals 201.

Report for the Louisiana Recovery Authority Support Foundation
Page 36
This Report is intended for the use and benefit of the
Louisiana Recovery Authority Support Foundation only and not intended for reliance by any other Party.
IOM Aim: Effective Effective care is defined by the IOM as care based on scientific knowledge, provided to all that may benefit and refraining from providing services to those who are not likely to benefit (avoiding underused, misuse and overuse, respectively). The table below reports on some of the process and outcome based measures of the effectiveness of care provided. Some examples of areas that effective care measures address are:
• Use of evidence-based medicine • Improvement in outcomes • Appropriate use of hospitals, particularly inpatient stays • Reduced employer-borne direct and indirect costs (absenteeism and productivity)
Louisiana's metrics in these areas are mixed, with some positive results and some areas that indicate needed improvement. Section II Exhibit 8 Health System Measures - Effective
Health System Measure Louisiana Performance
U.S. Median Benchmark
Top 25th U.S. Percentile
Benchmark Comprehensive Diabetes Care - Eye Exam (Private)
31.7% 50.4% 58.4%
Smoking Cessation - Advising Smokers to Quit
64.4% 69.4% 73.5%
Adequate Prenatal Care 79.2% 76.2% 82.4% Children's Access to PCP (25 Months-6Yrs) (Private)
69.9% 89.1% 91.6%
Adolescent Immunization Status - Combo 1 (Private)
36.2% 65.9% 77.7%
Breast Cancer Screening (Private) 64.1% 73.5% 77.4% Readmission Rates – Congestive Heart Failure
4.5
2.2 1.8
Hospital Days/1,000 856 682 577
Sources: National Committee for Quality Assurance, Kaiser Family Foundation, National Center for Health Statistics, CAHPS6 A full discussion of the overbuilt private hospital sector and how that impacts effectiveness is discussed in the "efficiency" section below.

Report for the Louisiana Recovery Authority Support Foundation
Page 37
This Report is intended for the use and benefit of the
Louisiana Recovery Authority Support Foundation only and not intended for reliance by any other Party.
IOM Aim: Patient-Centered The IOM defined a “patient-centered” healthcare system as one that provides care that is respectful and responsive to individual patient preferences, needs and values. The hypothesis is that the better educated and informed a patient is about their care, the more likely they will be a willing advocate for care, and in turn they will interact more effectively with their providers. Ultimately, improvement in the physician/patient experience will improve the use of appropriate levels of care and lead to improved patient satisfaction. In other words, better information sharing between the physician and the patient can lead to a decrease in over utilization of certain patient preference-sensitive services and more satisfied patients. Louisiana rated well on selected metrics here. Section II Exhibit 9 Health System Measures - Patient-Centered
Health System Measure Louisiana
Performance
U.S. Median
Benchmark
Top 25th U.S. Percentile Benchmark
Percentage of Adults** who indicated their health providers always listened carefully, explained things clearly, showed respect for what they had to say and spent enough time with them (Medicare Fee-for-Service)
72.4%
68.7%
70.3%
Percentage of Adults** who indicated their health providers always listened carefully, explained things clearly, showed respect for what they had to say and spent enough time with them (Medicare Managed Care)
70.3%
69.4%
71.8%
Source: AHRQ Overuse of supply-sensitive care is apparent in the management of chronic illness (such as admitting patients with chronic conditions such as diabetes to the hospital, rather than treating them as outpatients). The cause is an overdependence on the acute care sector and a lack of the infrastructure necessary to support the management of chronically ill patients in other settings. Misuse of preference-sensitive care refers to situations in which there are significant tradeoffs among the available options. Treatment choices should be based on the patient’s own values (such as the choice between mastectomy and lumpectomy for early-stage breast cancer); but often they are not. Misuse results from the failure to accurately communicate the risks and benefits of the alternative treatments and the failure to base the choice of treatment on the patient’s values and preferences. Under use of effective care (such as the use of beta-blockers for people who have had heart attacks and screening of diabetics for early signs of retinal disease) is common. The causes of under use include discontinuity of care (which tends to grow worse when more physicians are involved in the patient’s care) and the lack of systems that would facilitate the appropriate use of these services. While a patient-centric approach is vital to improving quality in the system, one mustn't forget that patients too have a responsibility for their own health and need to properly engage the system for the best results. Exhibit 10 illustrates how accountability is shared between the system and patients for several metrics discussed in this framework. Unfortunately, there is generally no agreement on how accountability for such metrics is

Report for the Louisiana Recovery Authority Support Foundation
Page 38
This Report is intended for the use and benefit of the
Louisiana Recovery Authority Support Foundation only and not intended for reliance by any other Party.
shared between individuals and a health system. In general, accountability needs to be population-based; that starts with payer and health plan accountability and moves through clinical stakeholders. Section II Exhibit 10
Individual Accountability
Syst
em A
ccou
ntab
ility
Fitness and exercise
Motor vehicle accidents
SurgicalInfections
Insurance coverage
Controlling blood pressure
Prenatal visitsWaiting times
Computerized order entry to reduce medication errors
Monitoring HbA1c levels
ER utilizationReadmissionRates
Health Status Accountability
IOM Aim: Timely The IOM defined "timely" as "reducing waits and sometimes harmful delays for both those who receive and those who give care." Care delayed is care denied. The amount of time it takes to receive treatment can mean the difference between full recovery, prolonged suffering or even death. Measuring timeliness of healthcare delivered is complex, but research on other complex service processes has shown that a focus on time utilization can lead to increased efficiency and quality. Louisianans in the public sector wait longer to get care, and for some specialties the wait times to see a doctor are significant and considered unacceptable from the IOM framework. As Exhibit 11 demonstrates, the poor and under- and uninsured are more likely to wait longer for care than those in the private system. Section II Exhibit 11 Wait Times
Specialty Public Sector Wait Time (Days until Appt.)
Private Sector Time (Days until Appt.)
Difference
Cardiology 25.8 18.8 7.0 Orthopedic Surgery 202.1 16.9 185.2 OB/GYN 67.0 23.3 43.7
Source: LSU, Merritt Hawkins & Associates

Report for the Louisiana Recovery Authority Support Foundation
Page 39
This Report is intended for the use and benefit of the
Louisiana Recovery Authority Support Foundation only and not intended for reliance by any other Party.
IOM Aim: Efficient IOM defines an “efficient” healthcare system as "a healthcare system that avoids waste, including waste of equipment, supplies, ideas and energy." This goal pushes the alignment of healthcare resources (practitioner's time, provider assets and drugs) with outputs (the appropriate quantity and quality of outcomes). While it may seem like a simple matter, the complexity of the healthcare system, stakeholder interactions and the data requirements have made measuring "true" healthcare efficiency difficult. Examples of inefficiency are structural (i.e. the system has more acute care beds per 1,000 than is optimal, whereas post acute facility bed capacity is not adequate), process oriented, (i.e. hospitalization for chronic disease that could be managed in an outpatient setting), or outcome (i.e. high adjusted cost per discharge). Structural inefficiency in the delivery system leads to both overuse and under use of assets and hence a reduction in the effectiveness of the system. A well know phenomenon in healthcare, based on the work by Jack and David Wennberg, is that excess supply will drive excessive demand for services. Inappropriate hospital admissions are dangerous and by definition ineffective. As a case in point, the table below (Exhibit 12) shows that the supply of available hospital beds in Louisiana, 4.0 beds per thousand population is much higher than the 2.8 per thousand in the rest of the nation. The hospital utilization (i.e. use of these beds) for Medicare patients is far higher than the "target" comparison in all regions except Region 1. The highest utilizing region is Shreveport, with approximately 3,300 bed days per thousand Medicare beneficiaries, or 50 percent more than the "targeted best practice" use rates. Because relatively few Medicare patients are taken care of in the public system, this Medicare overuse is reflective of the private sector. For Medicaid and other, all regions have a higher days per 1,000 use rate variance compared to the "best practice target" utilization rates. Section II Exhibit 12 Pre-hurricanes Short-term Acute Care Hospitals Use Rate Comparison
Per 1,000 Population (1,2) Variance to Comparison
Region Medicare Medicaid Other Total Medicare Medicaid Other TotalRegion 1 1,946.3 711.8 456.7 728.2 4.5 (173.7) 261.8 156.7 138.2 1.7 Region 2 2,347.3 751.2 345.3 650.9 3.6 227.3 301.2 45.3 108.9 0.8 Region 3 2,274.7 591.4 309.1 635.7 2.8 154.7 141.4 9.1 53.5 (0.0) Region 4 2,764.1 708.3 332.6 766.2 4.0 644.1 258.3 32.6 156.6 1.2 Region 5 2,585.3 657.9 356.6 754.5 4.1 465.3 207.9 56.6 140.2 1.3 Region 6 2,671.6 616.2 336.4 785.5 3.3 551.6 166.2 36.4 139.6 0.5 Region 7 3,317.4 497.1 403.0 885.3 5.0 1,197.4 47.1 103.0 241.9 2.2 Region 8 3,098.7 623.2 456.4 911.3 4.7 978.7 173.2 156.4 268.3 1.9 Region 9 2,469.7 712.3 421.5 750.6 2.7 349.7 262.3 121.5 173.9 (0.1)
Total 2,543.3 662.0 388.6 754.8 4.0 423.3 212.0 88.6 155.3 1.2
Comparison (3) 2,120.0 450.0 300.0 2.8
ST Acute Beds (1)
ST Acute Beds (1)
Days/1,000Days/1,000
Notes (1) Data based on Medicare Cost Reports filed for FY2004; for facilities with no FY04 report, FY03 was used. Short term acute care hospitals only, as designated under hospital provider type. Includes subprovider data. Patient origin estimated based on actual CY2004 data by region from Louisiana Health Information Network. Does not include out of state utilization. (2) Population source: Kaiser Family Foundation, LA Dept of Health and Hospitals, Solucient, Inc., US Census. (3) Days/1,000 use rate "best practice targets" assuming national utilization levels per HEDIS reporting. Beds/1,000 is the national average.
Report for the Louisiana Recovery Authority Support Foundation
Page 40
This Report is intended for the use and benefit of the
Louisiana Recovery Authority Support Foundation only and not intended for reliance by any other Party.
The next exhibit from the Health Afffairs8 shows the net effect of overbuilt infrastructure and high utilization of healthcare services by Louisiana Medicare beneficiaries: high cost and low quality. States such as Hawaii, New Hampshire, Utah and Oregon had lower than average Medicare spending but ranked higher in overall quality. Conversely, Louisiana had the highest Medicare spending but the lowest overall quality ranking. In 2002, more recent data than below, Louisiana was the state with the second highest per-capita health spending for Medicare participants, primarily because of higher than normal hospital spending. 9 Section II Exhibit 13 Source: Baicker, Katherine and Chandra, Amitabh "Medicare Spending, The Physician Workforce, and Beneficiaries' Quality of Care." Health Affairs, Web Exclusive. April 7th 2004. Notes on Exhibit from Health Affairs:Medicare Claims data; and Jencks et al., "Change in the Quality of Care Delivered to Medicare Beneficiaries, 1998-1999 to 2000-2001,"JAMA 289, no.3 2003 The work of Jack and David Wennberg through the Dartmouth Atlas has shown that states with more specialist-oriented and inpatient-based care tend to have higher costs without increases in outcomes or patient satisfaction. 10 His work also noted that "Supply-sensitive care is generally provided in the absence of specific clinical theories of benefit governing the relative frequency of use. Medical texts provide little or no guidance on when to schedule a revisit, perform a diagnostic test, hospitalize, or admit to intensive care. However, utilization rates are strongly influenced by the supply of resources."
LA
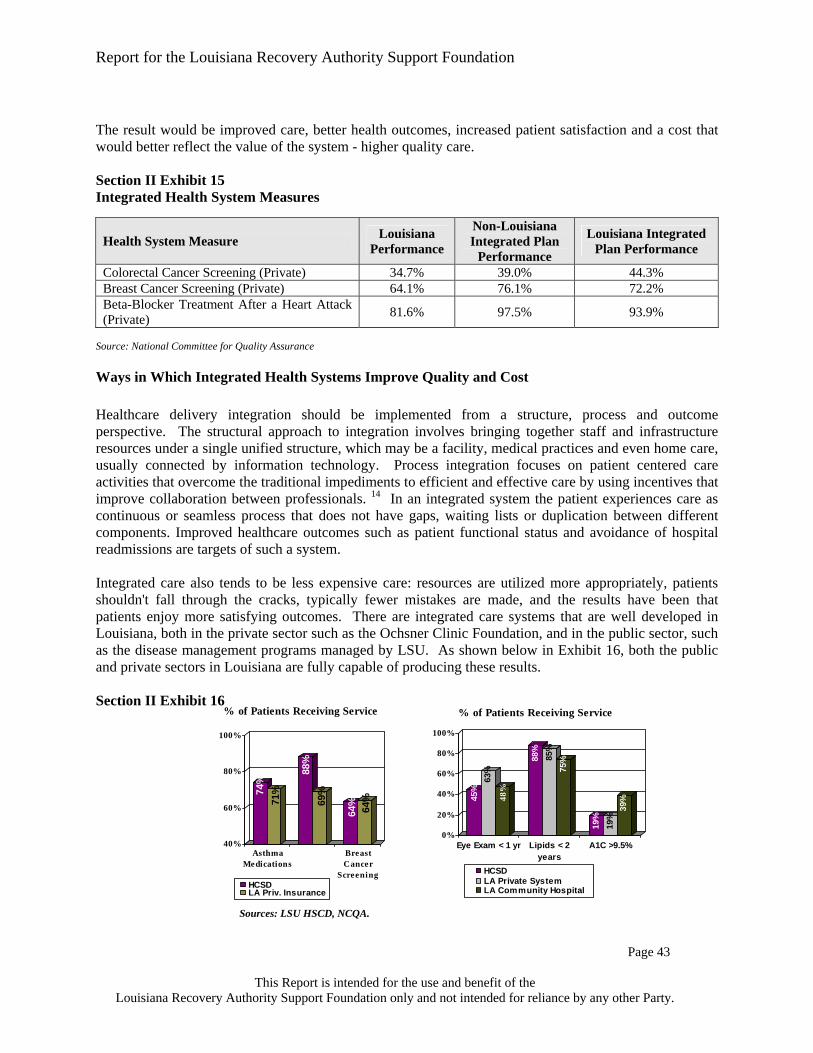
Report for the Louisiana Recovery Authority Support Foundation
Page 41
This Report is intended for the use and benefit of the
Louisiana Recovery Authority Support Foundation only and not intended for reliance by any other Party.
IOM Aim: Equitable The IOM has defined an “equitable” healthcare system as system in which quality care is provided for all persons, regardless of race, gender, ethnicity, location, or socio-economic status. The availability of care and quality of services should be based on individuals’ particular needs and not on personal characteristics unrelated to the patient’s condition or to the reason for seeking care. In particular, the quality of care should not differ because of such characteristics as gender, race, age, ethnicity, income, education, disability, sexual orientation, or location of residence. Measures of equity are structural (i.e. number of uninsured), process oriented (i.e. customer service) and outcomes-based (i.e. getting needed care). Recently the New England Journal of Medicine reported on a study of quality data that was used to identify if differences in socio-demographic standing could account for the disparity in care in the U.S. As a whole, the study found that socio-demographic status was not a significant factor suggesting that the goal of having an equitable system is within reach for the U.S. 11 Additionally, some measures of equity can be measured using health plan data directly; others require input from the patients receiving care. The National Healthcare Quality Report provides an assessment of equitable access to care in the U.S. It is based on a collection of data gathered through surveys. Section II Exhibit 14 Health System Measures - Equitable
Health System Measure Source of Data
Louisiana Performance
U.S. Median
Benchmark
Top 25th U.S. Percentile
Benchmark
Percentage of Population with Public or Private Insurance
U.S. Census 2004
82.8% 84.3% N/A
Percentage of Population on Medicaid or Uninsured
DHH 40% 28% N/A
Percentage of Mothers Beginning Prenatal Care in the First Trimester by Ethnicity – White (All Payers)
Kaiser Family
Foundation
90.30%
88.55%
90.50%
Percentage of Mothers Beginning Prenatal Care in the First Trimester by Ethnicity – African American (All Payers)
Kaiser Family
Foundation
75.50%
76.25%
80.28%
The wait times previously illustrated as Exhibit 11 under the IOM aim for "timely" also demonstrate the inequity in systems, showing that there are fewer days to wait until an appointment in the private sector.

Report for the Louisiana Recovery Authority Support Foundation
Page 42
This Report is intended for the use and benefit of the
Louisiana Recovery Authority Support Foundation only and not intended for reliance by any other Party.
Development of Integrated Healthcare Systems: How Louisiana's Healthcare Could Improve An integrated healthcare system built on a bio psycho-social model of health can reduce the prevalence of disease, the severity of illnesses and the complications of care for all Louisianans. This may be particularly true for minorities, the poor, the under- and uninsured, the young and the elderly who may be currently underserved by the healthcare system. An integrated system can also reduce overall healthcare spending by facilitating more efficient use of healthcare resources and services and by placing an emphasis on wellness and prevention. In the absence of integration, there is an increased risk of conflicting medication orders, duplication of diagnostic procedures, delays in the detection of complications, poor transferal of patients from acute level of care to sub acute or rehab and insufficient preparation of chronic patients to manage their condition post discharge.
Integrated Healthcare Systems Take a Holistic Approach to the Patient and the Population Since an integrated care model is typically built on the foundation of treating the whole person, an important tenet of the model is the potential to invest in "an ounce of prevention rather than a pound of cure"'. Within healthcare, integrated care pathways have long been advocated as a means to improve the continuity, quality and outcomes of care for patients. The patients and their care takers are no longer required to coordinate different treatments and steer themselves across different providers. 12 Complete integration has several components, including: 13 1) Integration of services through the continuum of care to ensure that patients are treated at the most
appropriate level of care and that their journey through the system is as rapid and efficient as possible. 2) Integration of clinical expertise such that all specialties, including primary care, are equal members of
a multi-specialty team and jointly control financial resources. 3) Financial integration so that all parties in the system (primary care doctors, consultants and hospitals)
are jointly responsible for a single bottom line. This ensures that available resources are spent most effectively to achieve healthcare outcomes.
4) Integration of leadership and management to ensure partnership between clinical governance and administration in achieving shared goals.
5) Integration of culture and vision within a single organizational structure dedicated to providing high quality, cost effective care.
Integrated healthcare systems are built on the idea of transparent links between providers (hospitals, labs, radiology units, pharmacies, etc.) and payers. These organizations provide complete care from the physician's office to inpatient care and all care levels in between. Examples of healthcare organizations that provide integrated care models are Kaiser Permanente, the Veterans Administration, closed model HMOs like Group Health Cooperative in Washington State and large physician and hospital group models such as the Mayo Clinic Foundation. The measures below provide a comparison of the performance of an integrated system outside of Louisiana and an integrated health system in Louisiana to the state's current system. The comparison shows that the Louisiana system could improve if integration of the system components is achieved.

Report for the Louisiana Recovery Authority Support Foundation
Page 43
This Report is intended for the use and benefit of the
Louisiana Recovery Authority Support Foundation only and not intended for reliance by any other Party.
The result would be improved care, better health outcomes, increased patient satisfaction and a cost that would better reflect the value of the system - higher quality care. Section II Exhibit 15 Integrated Health System Measures
Health System Measure Louisiana Performance
Non-Louisiana Integrated Plan
Performance
Louisiana Integrated Plan Performance
Colorectal Cancer Screening (Private) 34.7% 39.0% 44.3% Breast Cancer Screening (Private) 64.1% 76.1% 72.2% Beta-Blocker Treatment After a Heart Attack (Private) 81.6% 97.5% 93.9%
Source: National Committee for Quality Assurance
Ways in Which Integrated Health Systems Improve Quality and Cost Healthcare delivery integration should be implemented from a structure, process and outcome perspective. The structural approach to integration involves bringing together staff and infrastructure resources under a single unified structure, which may be a facility, medical practices and even home care, usually connected by information technology. Process integration focuses on patient centered care activities that overcome the traditional impediments to efficient and effective care by using incentives that improve collaboration between professionals. 14 In an integrated system the patient experiences care as continuous or seamless process that does not have gaps, waiting lists or duplication between different components. Improved healthcare outcomes such as patient functional status and avoidance of hospital readmissions are targets of such a system. Integrated care also tends to be less expensive care: resources are utilized more appropriately, patients shouldn't fall through the cracks, typically fewer mistakes are made, and the results have been that patients enjoy more satisfying outcomes. There are integrated care systems that are well developed in Louisiana, both in the private sector such as the Ochsner Clinic Foundation, and in the public sector, such as the disease management programs managed by LSU. As shown below in Exhibit 16, both the public and private sectors in Louisiana are fully capable of producing these results. Section II Exhibit 16
Sources: LSU HSCD, NCQA.
74%
71%
88%
69%
64% 64%
40%
60%
80%
100%
AsthmaMedications
BreastCancer
Screening
% of Patients Receiving Service
HCSDLA Priv. Insurance
45%
63%
48%
88%
85%
75%
19%
19%
39%
0%
20%
40%
60%
80%
100%
Eye Exam < 1 yr Lipids < 2years
A1C >9.5%
% of Patients Receiving Service
HCSDLA Private SystemLA Community Hospital

Report for the Louisiana Recovery Authority Support Foundation
Page 44
This Report is intended for the use and benefit of the
Louisiana Recovery Authority Support Foundation only and not intended for reliance by any other Party.
Health Plans and Payer Impact on the Quality of Healthcare Payers, both government and private, are a significant force in affecting the quality of care that is provided to individuals. Government payers include Medicare, Medicaid and other programs; private payers include insurance companies and employers that provide healthcare benefits to their employees. All of these groups have focused on quality at varying levels since the 1970s. Through their implementation of contracting requirements with providers, financial incentives to both providers and patients, and program designs that encourage healthy behavior and proper care management, payers have impacted the quality of care that is reported and measured. The impact on patient health and safety and the related cost of care is significant. Health Plan Quality Accreditation Health plans have been mandated, either by the market or by regulation, to participate in national quality accreditation programs. These programs, such as the National Committee for Quality Assurance (NCQA) and Utilization Review Accreditation Commission (URAC), measure the processes and outcomes of the plan's programs against national averages and best practice benchmarks. Over the years the accreditation requirements for health plans has significantly impacted quality in those plans that participate. The NCQA, in their 2005 report, indicates that the gap between health plans that are accredited and focused on quality and those that are not is significant. They report that these gaps in quality result in 39,000 - 83,000 avoidable preventable deaths each year, between $2.8 billion and $4.2 billion in avoidable medical costs and up to 83.1 million sick days per year. In Louisiana the following plans are currently accredited by either NCQA or URAC. Louisiana Health Plans Accredited under NCQA:
Humana Health Benefit Plan of Louisiana – Commercial/HMO United Healthcare of Louisiana, Inc. – Commercial HMO/POS Combined Humana Health Benefit Plan of Louisiana – Medicare HMO
Louisiana Health Plans Accredited under URAC:
Blue Cross and Blue Shield of Louisiana (Case Management, Health Utilization Management, HIPAA Privacy, Health Plan and Health Network with Credentialing Programs)
HMO Louisiana, Inc. - affiliate of BCBS of Louisiana (Case Management, Health Utilization Management, HIPAA Privacy, Health Plan and Health Network with Credentialing Programs)
Concentra Integrated Services, Inc. (Case Management Program) Coventry Health Care of Louisiana, Inc. (Health Utilization Management) Managed Health Network, Inc. (Health Utilization Management) Mental Health Network, Inc. (Health Utilization Management)
Health Plans Provide Incentives In order to improve against measured quality indicators in the accreditation process, many health plans have instituted programs that financially benefit physicians and hospitals for following practice guidelines, for prescribing generic versus brand drugs as appropriate and for using the right care setting for the right patient issues. There have been varying degrees of success, but the research is clear that

Report for the Louisiana Recovery Authority Support Foundation
Page 45
This Report is intended for the use and benefit of the
Louisiana Recovery Authority Support Foundation only and not intended for reliance by any other Party.
when the incentives are fair and the physicians agree to the evidence of improvement in clinical outcomes, the quality improves. Healthcare Payers' Influence on Quality - Accountability is Key The IOM's report discusses the important role that healthcare payers – both public and private – play in improving the quality of care provided to patients. The IOM emphasizes the critical role an integrated measurement system plays in order to meet the objectives of the six aims for a future system. The IOM also provides guidance on how payer programs focusing on quality measurement can lead to improvements in the quality of care and emphasizes the critical need for payer accountability as a component of the future system. Payers can facilitate improvement in the delivery system by using three critical influencers – public disclosure of performance data, use of payment policies that recognize quality, and institution of required performance improvement processes. As a first step, the IOM report identifies "starter" health plan performance measures that can be used to begin the process of system measurement and improvement. These measures support the six aims, and, if implemented through a common measurement effort, will support health plan efforts to realign incentives and improve quality. The chart in the appendix identifies the IOM's starter measures as compared to the measures currently evaluated through NCQA accreditation and URAC accreditation. The starter measures are intended to evolve as data and data gathering/measurement processes evolve. As depicted in the appendix's comparison table, the measures evaluated within the NCQA accreditation process most closely align with the IOM starter measures. Employer Health Benefits Programs Employers, as payers for healthcare benefits, also are influencers in healthcare quality. When large employers are self-insured, thereby both directly paying for the care and bearing the financial risk for future care, they often design programs that encourage patient behavior that is more cost efficient and that improves health and well-being. For example, for many years employers have designed plans with in-network providers and out-of network providers and encouraged participants to use the in-network providers by making their services less costly to the participant through lower coinsurance and deductibles. They have encouraged primary care physician visits through providing these services at low cost co-pays for the patient. The purpose of these programs is to affect both quality of care by encouraging use of physicians and hospitals that have been credentialed based on quality indicators and to improve cost. More recently, employers and health plans have focused efforts to improve quality and cost on changing the participants' behavior in selecting the appropriate care. The growing popularity of consumer-directed plans demonstrates this effort. By giving the individual more control and responsibility for the cost of the services, they have found that people will make different choices, for example, perhaps visiting a primary care physician instead of going to the emergency department when their child has the flu. Furthermore, these programs often incent wellness programs through reduced cost-sharing requirements, thereby improving quality of health in the future.

Report for the Louisiana Recovery Authority Support Foundation
Page 46
This Report is intended for the use and benefit of the
Louisiana Recovery Authority Support Foundation only and not intended for reliance by any other Party.
Government Payers Government payers - Medicare and Medicaid - have implemented managed care approaches since the 1990s and now are focused on additional quality influencing programs, including pay for performance for physicians. Medicaid programs in many states have instituted programs that encourage generic drug prescribing and primary care. Medicare began managed programs in the mid-1990s through Medicare+Choice HMOs. In 2005, they improved these programs, renamed them MedicareAdvantage, and improved the physician incentives and patient costs. The bottom-line in Louisiana is that a sustainable integrated healthcare system based on quality improvement must be designed to include the payers as accountable, integrated stakeholders in the system.
The Pre and Post-Hurricanes Healthcare System in Louisiana
In 2004, nearly $20 billion was spent on healthcare services in Louisiana. Twenty-seven percent (or $4.2 billion for Medicaid plus another $1.1 billion government spend on the uninsured/uncompensated care) of the care was paid for by the Medicaid program. That includes several programs for the poor and under- and uninsured, as well as the Medicaid "DSH'" funding (disproportionate share) that pays for the uninsured (uncompensated care or UCC). The totality of these Medicaid funds is based on a state-federal 'match'. For every $30 dollars of state spending, the federal government contributes another $70. Compared to other states, Louisiana is able to leverage its state spending with a high federal "match." As illustrated in Exhibit 17, 49 percent of healthcare services were paid through commercial/private insurance ($6.3 billion) and individuals’ out-of-pocket expenses ($3.4 billion), such as co-pays and deductibles. Twenty-four percent of healthcare services were paid for by Medicare. Thus, about 51 percent of healthcare services were paid for by the state or federal government either through Medicaid or Medicare. With respect to the most vulnerable, the poor, under- and uninsured, Louisiana is much different than the rest of the country. In Louisiana, 40 percent of state residents fall into these categories, as opposed to an average of 28 percent in the rest of the country. Since the money to cover these forty percent is highly leveraged by federal contributions, much of their healthcare support is dependent on the availability of state budget funds, which in bad economic times can create a threat to the safety net of support to the poor and the under- and uninsured. 15

Report for the Louisiana Recovery Authority Support Foundation
Page 47
This Report is intended for the use and benefit of the
Louisiana Recovery Authority Support Foundation only and not intended for reliance by any other Party.
Section II Exhibit 17
Estimated 2004 Pre-Hurricanes Healthcare Spend for the State of Louisiana 1
Development by Payer Class
Source of Funds ($ in Billions)Payer Class State Federal Private Self Paid Total
Medicaid (2),(3) $1.2 $3.0 $0.0 $0.0 $4.2 Uninsured (3) $0.3 $0.8 $0.0 $0.2 $1.3 Medicare (2),(4),(5) $0.0 $4.8 $0.6 $1.8 $7.2 Commercial/Private (6), (7) $0.0 $0.0 $5.7 $1.4 $7.1
Total $1.5 $8.6 $6.3 $3.4 $19.8
Adjusted Total (8),(9) $1.4 $8.8 $6.3 $2.9 $19.4
State Spend of ($1.4B)/Total Spend ($19.4B) = 7.2% Notes/Sources: (1) Healthcare spend includes medical, prescription drug and administrative expenses. Dental, vision as well as research and development costs have not been included. (2) Medicaid and Medicare payments during 2004 included $855M of DSH payments. (3) Medicaid and Uncompensated Care spend per the Louisiana Medicaid report SFY 2003-2004. Self spend based upon Health Affairs article on uninsured. (4) Medicare costs based on 2002 CMS reports (Table 15) trended to 2004 at 5% per year. (5) Self costs based upon 2004 Annual Statements (for Medicare Supplemental plans) provided by the Louisiana Department of Insurance as well as 2004 actual prescription drug spend for Louisiana retirees found in PwC's proprietary database. It was assumed that 30% of retirees had coverage provided under private retiree plans. (6) Private insurance costs based upon 2004 Annual Statements (for Private Plans) provided by the Louisiana Department of Insurance. (7) Self costs based upon PwC's proprietary actuarial pricing models. (8) 175% payments are no longer supported or made by CMS to DHH for UCC. In September 2005 LA legislature passed Healthcare Affordability Act (ACT 182) which call for a tax of certain hospitals to provide for a stable source of funds for UCC. LA intends to collect $90M annually from the hospital providers, receive matching funds from the federal government and use the resulting monies to pay for UCC on a claims basis. At this time the federal match or the impact on payment to hospital providers has not been estimated. (9) Assumes the Estimated Impact of Medicare Part D and Clawback provisions on Dually Eligibles. The following chart illustrates that since more Louisianans are poor and under- and uninsured as compared to other states, they rely on Medicaid more than the other states in the U.S. in general.

Report for the Louisiana Recovery Authority Support Foundation
Page 48
This Report is intended for the use and benefit of the
Louisiana Recovery Authority Support Foundation only and not intended for reliance by any other Party.
Section II Exhibit 18 Distribution of Population, Louisiana Compared to U.S. Source: US-Kaiser Family Foundation, statehealthfacts.org; LA-Kaiser, LA DHH, Solucient, US Census The state has become the healthcare payer of last resort for all Louisianans, as uninsured status cuts across all regions and races. While African-Americans have the highest uninsured rates, two-thirds of the uninsured are Caucasian. In addition, as it true across the Unites States, the uninsured are primarily working adults. In 2005, only half of adults had commercial/private insurance in Louisiana. 16 When considering all populations by payer type, varying patterns in service emerge. This may be explained by insurance coverage policies, demographics of the populations, health risk of the populations, discounts negotiated with the providers and possibly education/socioeconomic factors. For example, some payers pay for services that others don't cover at all. As an example, 27 percent of Louisiana's Medicaid money is spent on long-term care. That's an area in which commercial insurers and Medicare spend little of their own funding on - less than one percent. As a result, consistent with national experiences, some residents spend down their assets to qualify for Medicaid coverage of long-term care services at the end of life. This behavior may be attributing to the oversupply of nursing home care beds in certain regions, as the supply may have grown to meet the demand for these services. Long-term care bed supply will be discussed later in the document. Drug spending is an area that is changing rapidly. The Medicare outpatient drug benefit that began in 2006 shifts the onus for payment from states to the federal government. Dually eligible Medicare beneficiaries (individuals who are entitled to Medicare Part A and/or Part B and are eligible for some form of Medicaid benefit) who previously had their drugs paid for by the Louisiana Medicaid program are now covered by Medicare. As a result, states, including Louisiana, will owe Medicare a "clawback" payment. The federal government's assumption is that the states will now save money because they no longer have to pay for drugs for the dual-eligibles. This payment is intended to reflect a percentage of the expenditures a state would have made if the state was still paying for outpatient prescription drugs for the dual-eligibles through Medicaid. According to the Kaiser Family Foundation, Louisiana's "clawback" payment for 2006 is estimated at $75 million. It is not clear if other states are considering the displaced Louisiana dual-eligibles as part of their own clawback calculations, which could save Louisiana some money.
12% 12%
21%
12%
19%16%
2% 2%
46%
58%
0%
10%
20%
30%
40%
50%
60%
Medicare Medicaid Uninsured Dually Eligible Commercial/PrivatelyInsured
Louisiana U.S.

Report for the Louisiana Recovery Authority Support Foundation
Page 49
This Report is intended for the use and benefit of the
Louisiana Recovery Authority Support Foundation only and not intended for reliance by any other Party.
Section II Exhibit 19
Allocation of 2004 Louisiana Statewide Healthcare Spend by Type of Service($ is Billions)
Medicaid Uninsured Medicare Private LA State TotalType of Service Amount Percent Amount Percent Amount Percent Amount Percent Amount PercentInpatient Hospital 0.6$ 15% 0.3$ 23% 2.1$ 29% 1.4$ 20% 4.4$ 22%Long Term Care 1.1$ 27% -$ 0% 0.1$ 1% -$ 0% 1.2$ 6%Outpatient Hospital 0.6$ 13% 0.4$ 31% 1.4$ 19% 2.1$ 30% 4.5$ 22%Psych 0.1$ 1% -$ 0% 0.1$ 1% -$ 0% 0.2$ 1%Professional 0.8$ 20% 0.3$ 23% 1.2$ 17% 2.1$ 30% 4.4$ 22%Pharmaceutical 1.0$ 24% 0.3$ 23% 2.3$ 32% 1.5$ 21% 5.1$ 26%
Total 4.2$ 100% 1.3$ 100% 7.2$ 100% 7.1$ 100% 19.8$ 100% Source: (1). Allocation of Medicaid spend per the Louisiana Medicaid report SFY 2003-2004. (2) Allocation of Medicare spend per Louisiana retirees found in PwC's proprietary database consisting of 2004 incurred claims. (3) Allocation of Commercial/Private and Uninsured spend per PwC's proprietary actuarial pricing models, based upon Louisiana claims and utilization experience. Notes: Administrative costs are not broken out separately; they are included in the amounts above. Spending by payer includes out-of-pocket costs paid by the beneficiary.
A Reconfigured System for Louisiana
A rebuilt healthcare system in Louisiana should focus on patients, not buildings. The central theme should be creating more appropriate service models that lead to better performance and outcomes. A reconfigured system for Louisiana must consider repopulation estimates, system efficiency and quality benchmarks. It should deliver the right amount of care in the right settings at the right time. Louisiana has an opportunity to build for the future where care is delivered less frequently in hospitals and more in ambulatory settings and homes. It's also a future in which hospital and more intensive treatment are prevented through coordinated providers, using the best treatments in integrated care models. To determine the needs and funding for a reconfigured system, the analysis begins with the pre-hurricane system to determine the best use of current resources and how to rebuild in the wake of the hurricanes. The following chart summarizes the reconfigured system for Louisiana. Additional detail is provided in the sections below:

Report for the Louisiana Recovery Authority Support Foundation
Page 50
This Report is intended for the use and benefit of the
Louisiana Recovery Authority Support Foundation only and not intended for reliance by any other Party.
Section II Exhibit 20 Pre-hurricane and Reconfigured System Summary Pre-Hurricanes Future System
Recommendations Population Total State
Pre Post 4.5 M 4.2 M
High Med. Low estimate 4.4 M, 4.3 M, 4.2 M
Healthcare Services Short-Term Acute Hospital beds
• 17,860 available beds • Excess capacity except in Regions 3 and 9 • Post - hurricane less than average in Regions 2, 3, 9
• Region 1 - add specialty, mental health, replace trauma; no need for any new short-term acute hospital beds • Region 2 - Add trauma, possible new academic medical center (discussed in later sections)
Long-Term Care • 34,474 available nursing home beds • 2,070 available long-term acute care (LTAC) beds • Excess capacity in some areas prior to the hurricanes but mal-distributed • Post - shortage in Region 1and 9
• Redistribute long-term care beds in long-term • Rebuild capacity in Region 1 • Transition excess beds to other long-term care options
Rehabilitation beds
• 1,325 available beds • none
Ambulatory Care • 24 Federally Qualified Health Centers in Louisiana • 51 Rural Health Centers • LSU clinics
• Increase number and use of ambulatory care centers and clinics for cost effective primary care
Emergency Department Outpatient
• 43% over U.S. norms for ED visits • 18% over U.S. norms for OP services
• Decrease by 0.8% status quo based on population estimates • Redesign care process to reduce usage and focus on less expensive ambulatory sites
Population Unlike much of the South, Louisiana has not been a high-growth state in terms of population. Between 2002 and 2007, its growth rate was expected to be the 7th lowest in the nation. 17, 18 In considering the future state, one must assume repopulation by former Louisiana residents, but lower than normal population growth from other states.
Report for the Louisiana Recovery Authority Support Foundation
Page 51
This Report is intended for the use and benefit of the
Louisiana Recovery Authority Support Foundation only and not intended for reliance by any other Party.
The pre-hurricane population of Louisiana is similar to the age and gender distribution of the U.S. population. Where the population differs is in terms of the percentage of the population that is African-American and the percentage of the population that is below the Federal Poverty Level (FPL). See exhibits below. Section II Exhibit 21 Population Summary (1)
Age and Gender Distribution of Population (2)
Louisiana Unites States 2005Male Female Total Male Female Total
00-17 13.4% 12.8% 26.2% 12.7% 12.1% 24.9%18-44 19.0% 19.5% 38.5% 19.4% 18.9% 38.2%45-64 11.3% 12.2% 23.5% 11.9% 12.5% 24.3%65 + 4.8% 7.0% 11.8% 5.2% 7.3% 12.6%Total 48.5% 51.5% 100.0% 49.2% 50.8% 100.0%
Race Distribution of Population (2)
Louisiana
Asian BlackMultiraci
alNative
AmericanPacific
Islander White Other Total00-17 0.4% 10.4% 0.5% 0.2% 0.0% 14.5% 0.2% 26.2%18-44 0.6% 13.1% 0.4% 0.2% 0.0% 23.7% 0.4% 38.5%45-64 0.3% 6.5% 0.2% 0.1% 0.0% 16.2% 0.1% 23.5%65 + 0.1% 2.8% 0.1% 0.0% 0.0% 8.8% 0.0% 11.8%Total 1.4% 32.8% 1.2% 0.6% 0.0% 63.2% 0.7% 100.0%
United States 2005 Estimates
Asian BlackMultiraci
alNative
AmericanPacific
Islander White Other Total00-17 1.0% 3.7% 1.0% 0.3% 0.0% 16.6% 2.1% 24.9%18-44 1.8% 5.0% 1.0% 0.4% 0.1% 27.0% 2.9% 38.2%45-64 1.0% 2.6% 0.4% 0.2% 0.0% 19.3% 0.9% 24.3%65 + 0.4% 1.1% 0.2% 0.1% 0.0% 10.7% 0.2% 12.6%Total 4.1% 12.4% 2.7% 0.9% 0.2% 73.6% 6.1% 100.0%
LA U.S.% %22 1723 1945 3655 64
100 100 Total
Distribution of Total Population by Federal Poverty Level, states (2003-2004), U.S. (2004) (3)
Under 100% 100-199% --Low Income Subtotal 200% +
Notes/Sources: (1) Numbers may not add up to total due to rounding. (2) Percentages from Solucient, Inc Population Estimates, based on Claritas, Inc. (3) Estimate of population by FPL from Kaiser Family Foundation, statehealthfacts.org.
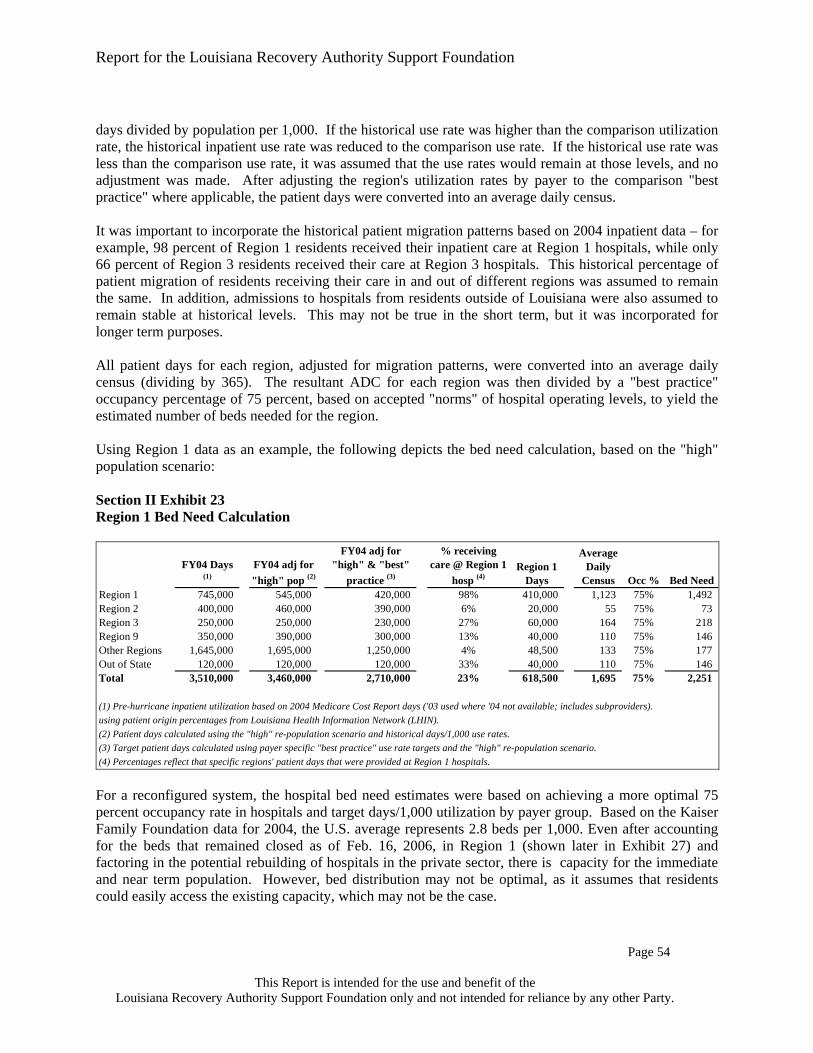
Report for the Louisiana Recovery Authority Support Foundation
Page 52
This Report is intended for the use and benefit of the
Louisiana Recovery Authority Support Foundation only and not intended for reliance by any other Party.
Currently, repopulation is under way; the state's population is expected to normalize to pre-hurricane levels. Under the high repopulation estimate, detailed on the next exhibit, the state’s population would be 98 percent of pre-hurricane levels. A lower estimate would put it at 94 percent of pre-Hurricane levels. Regions 1, 2 and 9 experience the most change in population. The following population estimates give a range of numbers, which will vary depending on factors such as economic development, public and private investment, rebuilding efforts and even future hurricanes. Section II Exhibit 22 Population Scenarios
Population Baseline Scenarios Region Pre-Hurricanes Post-Hurricanes High Middle Low
Region 1
1,016,000 578,000 750,000 650,000 600,000
Region 2
610,000 661,000 710,000 700,000 660,000
Region 3
389,000 397,000 400,000 400,000 400,000
Region 4
556,000 567,000 580,000 580,000 580,000
Region 5
284,000 281,000 280,000 280,000 280,000
Region 6
299,000 308,000 310,000 310,000 310,000
Region 7
523,000 529,000 530,000 530,000 530,000
Region 8
351,000 350,000 350,000 350,000 350,000
Region 9
469,000 481,000 520,000 520,000 520,000
Total
4,497,000 4,152,000 4,430,000 4,320,000 4,230,000 Sources: Pre-hurricane population taken from Kaiser Family Foundation, Louisiana DHH, Solucient, Inc and the U.S. Census. Post-hurricane population based on estimated shift from DHH, LRA and the Board of Education, as of February 2006. Population scenarios based on re-population conjecture. Supply of Services Population demographics are a critical driver of demand for healthcare services. To calculate current and future health service demand requires analysis of usage rates, defined as the quantity of services provided (such as admissions, discharges, procedures, etc.) per 1,000 individuals residing in a specific geographic area, regardless of where they received their care. Use rates are calculated from actual, measurable historic occurrences. With few exceptions, use rates tend to be relatively stable from one year to the next, and therefore, are a starting point for ascertaining demand for services when applying them to population

Report for the Louisiana Recovery Authority Support Foundation
Page 53
This Report is intended for the use and benefit of the
Louisiana Recovery Authority Support Foundation only and not intended for reliance by any other Party.
estimates. Demographic stratification can further refine demand estimates, as will practice patterns, anticipated technology and payer behavior. Usage rates also need to consider how technology is moving traditional care outside of the hospital setting. For example, 2005 was the first year in which the U.S. had more ambulatory surgery centers (ASC) than hospitals. 19 An ASC generally is a medical building designed with two to five operating rooms where surgeons can perform relatively quick surgical procedures. Surgery centers are facilities that allow a physician to perform surgery that does not require an overnight stay. When considering the need for hospital beds, one must factor in the evolution of care from inpatient to outpatient venues, such as ambulatory surgery centers. Outpatient services, ranging from surgery to imaging, are the fastest growing component of health spending and are expected to continue to grow. Bed need estimates in this section do not differentiate between public and private. As discussed in other parts of this report, the reconfigured system assumes moving Louisiana from separate systems to a single system of care. To consider the future system, one must start with the pre-hurricane supply of services. Prior to the hurricanes, Louisiana had the following supply of available acute and long-term care beds: 20
Short-term acute-care hospital beds – 17,860 Nursing home beds – 34,474 Long-term acute care beds – 2,070 Psychiatric beds – 2,286 Rehabilitation beds – 637
Bed Need Analysis Methodology The need for hospital inpatient beds can increase or decrease based on the utilization patterns for a patient population. The duration of a patient's stay in the hospital, measured by the length of stay the patient is in the hospital, also determines how many beds a hospital needs to adequately care for its patients. A hospital is most efficient when it can manage the patient length of stay by timely discharging the patient after appropriate care has been given, all while keeping most of its beds occupied throughout the year. Inpatient days for the year divided by 365 is equivalent to a hospital's average daily census (ADC), or the average number of patients in a hospital on a given day. Comparing the ADC to a hospital's number of beds is a hospital’s average occupancy rate, or the percentage that the hospital's beds are filled on average on a given day. In order to understand the need for short term acute hospital beds, historical inpatient utilization rates (also known as use rates – inpatient days per 1,000 population) for each region's population were compared to "best practice/target" utilization rates. These comparisons, shown at the bottom of Exhibit 12, were estimated based upon national claims experience by payer for Medicare and Medicaid and by using proprietary databases to calculate the "best practice" commercial/private use rates. To calculate and compare use rates, historical 2004 inpatient days and 2004 estimated population for each region were grouped by each of the nine regions into the following three payer categories: Medicare, Medicaid and Other (which include Private Insured, Self Insured and Uninsured). Use rates are calculated as inpatient

Report for the Louisiana Recovery Authority Support Foundation
Page 54
This Report is intended for the use and benefit of the
Louisiana Recovery Authority Support Foundation only and not intended for reliance by any other Party.
days divided by population per 1,000. If the historical use rate was higher than the comparison utilization rate, the historical inpatient use rate was reduced to the comparison use rate. If the historical use rate was less than the comparison use rate, it was assumed that the use rates would remain at those levels, and no adjustment was made. After adjusting the region's utilization rates by payer to the comparison "best practice" where applicable, the patient days were converted into an average daily census. It was important to incorporate the historical patient migration patterns based on 2004 inpatient data – for example, 98 percent of Region 1 residents received their inpatient care at Region 1 hospitals, while only 66 percent of Region 3 residents received their care at Region 3 hospitals. This historical percentage of patient migration of residents receiving their care in and out of different regions was assumed to remain the same. In addition, admissions to hospitals from residents outside of Louisiana were also assumed to remain stable at historical levels. This may not be true in the short term, but it was incorporated for longer term purposes. All patient days for each region, adjusted for migration patterns, were converted into an average daily census (dividing by 365). The resultant ADC for each region was then divided by a "best practice" occupancy percentage of 75 percent, based on accepted "norms" of hospital operating levels, to yield the estimated number of beds needed for the region. Using Region 1 data as an example, the following depicts the bed need calculation, based on the "high" population scenario: Section II Exhibit 23 Region 1 Bed Need Calculation
FY04 Days (1)
FY04 adj for "high" pop (2)
FY04 adj for "high" & "best"
practice (3)
% receiving care @ Region 1
hosp (4)Region 1
Days
Average Daily
Census Occ % Bed NeedRegion 1 745,000 545,000 420,000 98% 410,000 1,123 75% 1,492 Region 2 400,000 460,000 390,000 6% 20,000 55 75% 73 Region 3 250,000 250,000 230,000 27% 60,000 164 75% 218 Region 9 350,000 390,000 300,000 13% 40,000 110 75% 146 Other Regions 1,645,000 1,695,000 1,250,000 4% 48,500 133 75% 177 Out of State 120,000 120,000 120,000 33% 40,000 110 75% 146 Total 3,510,000 3,460,000 2,710,000 23% 618,500 1,695 75% 2,251
(1) Pre-hurricane inpatient utilization based on 2004 Medicare Cost Report days ('03 used where '04 not available; includes subproviders).using patient origin percentages from Louisiana Health Information Network (LHIN).(2) Patient days calculated using the "high" re-population scenario and historical days/1,000 use rates.(3) Target patient days calculated using payer specific "best practice" use rate targets and the "high" re-population scenario.(4) Percentages reflect that specific regions' patient days that were provided at Region 1 hospitals. For a reconfigured system, the hospital bed need estimates were based on achieving a more optimal 75 percent occupancy rate in hospitals and target days/1,000 utilization by payer group. Based on the Kaiser Family Foundation data for 2004, the U.S. average represents 2.8 beds per 1,000. Even after accounting for the beds that remained closed as of Feb. 16, 2006, in Region 1 (shown later in Exhibit 27) and factoring in the potential rebuilding of hospitals in the private sector, there is capacity for the immediate and near term population. However, bed distribution may not be optimal, as it assumes that residents could easily access the existing capacity, which may not be the case.

Report for the Louisiana Recovery Authority Support Foundation
Page 55
This Report is intended for the use and benefit of the
Louisiana Recovery Authority Support Foundation only and not intended for reliance by any other Party.
Visually, the bed need calculation below demonstrates that more efficient utilization and improved occupancy rates drive down the need for acute hospital beds regardless of the population changes. Section II Exhibit 24 Example of Bed Need Analysis
A.Pre-Hurricanes Utilization at Higher Occupancy. In Region 1, there were 4,350 beds available before the hurricanes. But these beds were only occupied 56%. Changing to 75% occupancy reduces bed need to 3,445.
B.Pre-Hurricanes Utilization at Higher Occupancy and Lower Population. Looking at a high population scenario, at a reduced population and a 75% occupancy, bed need is 2,789 at historical use rates (days per 1,000).
C.Target Utilization at Higher Occupancy and Lower Population. Applying a more efficient use of services (days per 1,000) reduces bed need further to 2,251.
Note: To achieve optimal use rates and occupancy percentages, it assumes that the hospitals are in reasonable locations and residents have adequate and timely access to those beds.
4,350
3,4452,789
2,251
-
1,000
2,000
3,000
4,000
Bed
s
Pre
Hur
rican
e
Sam
eut
iliza
tion
& 7
5%oc
cupa
ncy
Hig
hSc
enar
io:
no c
hang
ein
UR
&75
% O
ccH
igh
Scen
ario
:de
crea
sein
UR
&75
% O
cc
56%
75% 75% 75%
0%10%20%30%40%50%60%70%80%
Occ
upan
cy %
Pre
Hur
rican
e
Sam
eut
iliza
tion
& 7
5%oc
cupa
ncy
Hig
hSc
enar
io:
no c
hang
ein
UR
&75
% O
ccH
igh
Scen
ario
:de
crea
se in
UR
& 7
5%O
cc
728 728 728
571
-100200300400500600700800
Day
s/1,
000
Pre
Hur
rican
e
Hig
hSc
enar
io:
no c
hang
ein
UR
&75
% O
cc
A B C

Report for the Louisiana Recovery Authority Support Foundation
Page 56
This Report is intended for the use and benefit of the
Louisiana Recovery Authority Support Foundation only and not intended for reliance by any other Party.
The following is a region by region analysis of bed needs:
Region 1 (New Orleans)
Region 1 contains the City of New Orleans (Orleans Parish) and three surrounding parishes - Jefferson, Saint Bernard and Plaquemines. Orleans Parish made up approximately 46 percent of the region's population and has a higher rate of individuals who are either uninsured or on Medicaid. The exhibits below illustrate some of the demographic differences that existed prior to the hurricanes. Section II Exhibit 25 Orleans Parish Demographics (1) Population by Payer
Orleans Parish LouisianaPopulation % Total Population % Total
Medicaid (2) 126,000 26.9% 942,000 20.9%Medicare (3) 54,000 11.5% 549,000 12.2%Dually Eligible (4) 13,000 2.8% 96,000 2.1%Uninsured (5) 131,000 27.9% 836,000 18.6%Privately Insured (3) 145,000 30.9% 2,074,000 46.1%Total 469,000 100.0% 4,497,000 100.0% Age and Gender Distribution of Population (6)
Orleans Parish Louisiana Unites States 2005Male Female Total Male Female Total Male Female Total
00-17 13.3% 12.8% 26.1% 13.4% 12.8% 26.2% 12.7% 12.1% 24.9%18-44 18.6% 20.6% 39.1% 19.0% 19.5% 38.5% 19.4% 18.9% 38.2%45-64 10.7% 12.4% 23.1% 11.3% 12.2% 23.5% 11.9% 12.5% 24.3%65 + 4.4% 7.2% 11.6% 4.8% 7.0% 11.8% 5.2% 7.3% 12.6%Total 47.0% 53.0% 100.0% 48.5% 51.5% 100.0% 49.2% 50.8% 100.0%

Report for the Louisiana Recovery Authority Support Foundation
Page 57
This Report is intended for the use and benefit of the
Louisiana Recovery Authority Support Foundation only and not intended for reliance by any other Party.
Race Distribution of Population (6)
Orleans Parish
Asian Black MultiracialNative
AmericanPacific
Islander White Other Total00-17 0.7% 20.8% 0.5% 0.0% 0.0% 3.9% 0.2% 26.1%18-44 1.2% 25.7% 0.6% 0.1% 0.0% 11.1% 0.4% 39.1%45-64 0.5% 14.5% 0.3% 0.0% 0.0% 7.7% 0.2% 23.1%65 + 0.2% 6.1% 0.1% 0.0% 0.0% 5.2% 0.1% 11.6%Total 2.5% 67.0% 1.4% 0.2% 0.0% 27.9% 0.9% 100.0%
Louisiana
Asian Black MultiracialNative
AmericanPacific
Islander White Other Total00-17 0.4% 10.4% 0.5% 0.2% 0.0% 14.5% 0.2% 26.2%18-44 0.6% 13.1% 0.4% 0.2% 0.0% 23.7% 0.4% 38.5%45-64 0.3% 6.5% 0.2% 0.1% 0.0% 16.2% 0.1% 23.5%65 + 0.1% 2.8% 0.1% 0.0% 0.0% 8.8% 0.0% 11.8%Total 1.4% 32.8% 1.2% 0.6% 0.0% 63.2% 0.7% 100.0%
United States 2005 Estimates
Asian Black MultiracialNative
AmericanPacific
Islander White Other Total00-17 1.0% 3.7% 1.0% 0.3% 0.0% 16.6% 2.1% 24.9%18-44 1.8% 5.0% 1.0% 0.4% 0.1% 27.0% 2.9% 38.2%45-64 1.0% 2.6% 0.4% 0.2% 0.0% 19.3% 0.9% 24.3%65 + 0.4% 1.1% 0.2% 0.1% 0.0% 10.7% 0.2% 12.6%Total 4.1% 12.4% 2.7% 0.9% 0.2% 73.6% 6.1% 100.0% Notes/Sources: (1) Numbers may not add up to total due to rounding. (2) Medicaid population from Louisiana Department of Health and Hospitals – Medicaid Annual Report 2003-2004, without dually eligible. (3) Medicare & Privately Insured population from Solucient, Inc Insurance Estimates, 2004 Lives; Medicare does not include dually eligible. (4) Dually Eligible from Kaiser Family Foundation, statehealthfacts.org, based on CMS and MSIS data. Dual Eligibles are individuals entitled to Medicare who are also eligible for some level of Medicaid benefits. This number represents full-year equivalent dual eligible members, 2003. Allocation by region is estimated based on Medicaid recipients by region. (5) Uninsured population estimated and adjusted based on US Census data totals by region. (6) Percentages from Solucient, Inc Population Estimates, based on Claritas, Inc.

Report for the Louisiana Recovery Authority Support Foundation
Page 58
This Report is intended for the use and benefit of the
Louisiana Recovery Authority Support Foundation only and not intended for reliance by any other Party.
Section II Exhibit 26
12.4
19.6
18.013.1
27.913.7
0 5 10 15 20 25 30
US
Louisiana
Plaquemines
St. Bernard
Orleans
Jefferson
Percent of Region 1 Living in Poverty - 100% Federal Poverty Level
(1) Governor’s Health Care Reform Region 1 Consortium Update, March 17, 2005; GNOCDC data. In looking at the pre-hurricane data for Orleans Parish as a subsection of Region 1, several attributes are apparent. These attributes may impact future health system planning. The parish is poorer than the rest of the state and the U.S. in general. Additionally the race distribution is unique with 67 percent of the population African American compared to 33 percent across the state. The areas hardest hit by the hurricanes were also some of the poorest in the parish. The New Orleans Department of Health provided several key observations that should be further considered in planning for health system redesign in the city. Based on a repopulation study that was conducted in conjunction with the CDC, they indicate that it is possible that 50 percent of the population in the most affected areas will return. It may be logical to assume that those who return are those who own homes and potentially have employment and insurance or will have employment/insurance in the near future. If that is the case, this may change the mix of patients covered by Medicaid or private/commercial insurance or even the number of those who are uninsured. An additional observation is that if additional beds are not rebuilt, or if the number of beds added are small, then the currently open hospitals will need to consider physician admitting privileges to permit displaced physicians to admit into the facilities. Lastly, there are key affected areas of the city – New Orleans East and the 9th Ward, in which, due to cultural or social issues, patients historically refused to travel to seek care in other areas of the city or other parishes. This cultural issue will require future review in next stage planning processes. Supply of healthcare services in Region 1 is contained in sections below. In general, Katrina essentially right-sized an overbuilt hospital system in Region 1; the exhibit below shows the bed availability of Region 1 after the hurricanes. Today, there are approximately one-half the pre-Katrina capacity of 4,350 available acute care hospital beds. Those beds had an average occupancy rate of about 56 percent. Accommodating to a 75 percent occupancy rate, adjusting for population changes and targeting to average U.S. utilization leaves ample numbers of hospital beds under the re-

Report for the Louisiana Recovery Authority Support Foundation
Page 59
This Report is intended for the use and benefit of the
Louisiana Recovery Authority Support Foundation only and not intended for reliance by any other Party.
population scenarios. This assumes that no further beds are reopened in the private sector (a potentially unlikely assumption). However, this does not address some of the mal distribution of beds. Section II Exhibit 27 Region 1 Pre and Post Hurricane Beds
Pre K Beds Current BedsJefferson ParishWest Jefferson Medical Center 500 352 East Jefferson General Hospital 454 454 Meadowcrest Hospital 193 104 Tulane-Lakeside Hospital 121 121 Ochsner Foundation Hospital 451 451 Kenner Regional Medical Center 203 74
Subtotal 1,922 1,556 Orleans ParishMedical Center of Louisiana at New Orleans--Charity Hospital 522 - Touro Infirmary 252 247 Methodist Hospital 273 - Memorial Medical Center 360 - Tulane University Hospital and Clinic 342 114 Bywater Hospital 136 - Children's Hospital 201 130 Lindy Boggs Medical Center 172 -
Subtotal 2,258 491 Saint Bernard ParishChalmette Medical Center 170 -
Subtotal 170 -
Region 1 Total 4,350 2,047 Source: DHH Health Standards Section and Medicare Cost Reports filed for FY2004; for facilities with no FY04 report, FY03 was used. Includes Subproviders. Hospitals report operating about 2,047 beds, about the same number based on the population scenarios. However, news reports and anecdotal data indicate that Region 1 open hospitals are full. This discrepancy is explained by an artificial "bubble" in occupancy occurring in this Region as a result of the increasing length of stay in these hospitals. In general, due to the insufficiency of long-term care beds, housing, ambulatory care facilities and doctors' offices, the average length of stay has risen by as much as 1.5 days in many hospitals; each gain of one day in length of stay increases occupancy rates approximately 15 percent. At historic use patterns, for every additional day increase in length of stay, an additional 330 beds are therefore in use. The immediate solution to the full hospitals in Region 1 is finding appropriate settings to discharge patients.

Report for the Louisiana Recovery Authority Support Foundation
Page 60
This Report is intended for the use and benefit of the
Louisiana Recovery Authority Support Foundation only and not intended for reliance by any other Party.
Section II Exhibit 28 Sources: Historical Population: DHH, Solucient, Inc, Kaiser Family Foundation, U.S. Census. Historical Beds: Data based on Medicare Cost Reports filed for FY2004; For facilities with no FY04 report, FY03 was used. All estimates include sub-providers. Estimated Population: Based on DHH school enrollment data and as well as estimated re-population conjecture. Estimated Beds: Based on population scenarios, use rate "best practice targets" assuming national utilization levels per HEDIS reporting, and target occupancy percentages of 75% Section II Exhibit 29 Current "Bubble" of Hospital Utilization in Region 1
-
500
1,000
1,500
2,000
2,500
3,000
3,500
4,000
4,500
5,000
Pre Hurricane Post Hurricane Interim Period Future Scenario0.0%
10.0%
20.0%
30.0%
40.0%
50.0%
60.0%
70.0%
80.0%
90.0%
100.0%
Beds Avg Daily Census Days/1,000 % Occ
Source: Pre & Post information based on DHH Health Standards Section and Medicare Cost Reports. Interim period and future period used as example to illustrate "bubble" scenario. Post Katrina, New Orleans has seen a large increase in uninsured patients, both from unemployment as well as new contractors who are participating in the cleanup and rebuilding of the city. They tend to use hospitals for primary services and may also be a factor contributing to increased utilization. A recent recovery effort presentation by DHH highlighted the increase in the uninsured in the most affected regions, as depicted in the next exhibit.
Population Scenarios for Region 1
200,000
350,000
500,000
650,000
800,000
950,000
1,100,000
Pre-Hurricane
Post-Hurricane
High Medium Low0
1,000
2,000
3,000
4,000
5,000
Pre-hurricane
@ 75%Occ
Current High Medium Low
Based on Population Scenarios for Region 1

Report for the Louisiana Recovery Authority Support Foundation
Page 61
This Report is intended for the use and benefit of the
Louisiana Recovery Authority Support Foundation only and not intended for reliance by any other Party.
Section II Exhibit 30
Region 2 (Baton Rouge) Baton Rouge experienced the largest increase in population after the hurricanes, according to DHH estimates. This region is expected to remain above its pre-hurricanes population. Section II Exhibit 31 Sources: Historical Population: DHH, Solucient, Inc, Kaiser Family Foundation, U.S. Census. Historical Beds: Data based on Medicare Cost Reports filed for FY2004; For facilities with no FY04 report, FY03 was used. All estimates include subproviders. Estimated Population: Based on DHH school enrollment data and as well as estimated re-population conjecture. Estimated Beds: Based on population scenarios, use rate "best practice targets" assuming national utilization levels per HEDIS reporting, and target occupancy percentages of 75%
Source: Rebuilding health care services in Cameron, Jefferson, Orleans, Plaquemines & St. Bernard Parishes.Presented March 2, 2006 by DHH.
0.0%5.0%
10.0%15.0%20.0%25.0%30.0%35.0%40.0%45.0%50.0%
Cameron Jefferson/Orleans Plaquemines St. Bernard
Parish
Uninsured Percentage for "Hardest Hit" Areas
% Pre-H % Post-H
Population Scenarios for Region 2
200,000
350,000
500,000
650,000
800,000
Pre-Hurricane
Post-Hurricane
High Medium Low0
500
1,000
1,500
2,000
2,500
Pre-hurricane
@ 75%Occ
High Medium Low
Based on Population Scenarios for Region 2

Report for the Louisiana Recovery Authority Support Foundation
Page 62
This Report is intended for the use and benefit of the
Louisiana Recovery Authority Support Foundation only and not intended for reliance by any other Party.
Prior to the hurricane, Region 2 also had more beds than needed, assuming hospitals could experience average occupancy rates of 75 percent. With the increased population, the bed needs in the Baton Rouge region are closer to the 75 percent occupancy level needed.
Region 3 (Houma-Thibodaux)
Prior to the hurricanes, this region had more than the national average, but could do with even less based on population scenarios using the 75 percent occupancy target as a benchmark. Region 3 was in the path of Katrina, but did not suffer population loss at the level of Region 1, according to DHH estimates. Given in- and out-flows of population, this region appears comparatively stable. Section II Exhibit 32 Sources: Historical Population: DHH, Solucient, Inc, Kaiser Family Foundation, U.S. Census. Historical Beds: Data based on Medicare Cost Reports filed for FY2004; For facilities with no FY04 report, FY03 was used. All estimates include subproviders. Estimated Population: Based on DHH school enrollment data and as well as estimated re-population conjecture. Estimated Beds: Based on population scenarios, use rate "best practice targets" assuming national utilization levels per HEDIS reporting, and target occupancy percentages of 75%
Region 4 (Lafayette)
Prior to the hurricanes, this region had excess beds based on the same criteria discussed above. The same will likely apply based on population scenarios. Region 4 was in the path of Katrina and Rita but did not suffer population loss like Region 1 did, according to DHH estimates. Given in- and out-flows of population between regions, this region appears comparatively stable.
Population Scenarios for Region 3
200,000
250,000
300,000
350,000
400,000
450,000
Pre-Hurricane
Post-Hurricane
High Medium Low 0
200
400
600
800
1,000
1,200
Pre-hurricane
@ 75%Occ
High Medium Low
Based on Population Scenarios for Region 3

Report for the Louisiana Recovery Authority Support Foundation
Page 63
This Report is intended for the use and benefit of the
Louisiana Recovery Authority Support Foundation only and not intended for reliance by any other Party.
Section II Exhibit 33 Sources: Historical Population: DHH, Solucient, Inc, Kaiser Family Foundation, U.S. Census. Historical Beds: Data based on Medicare Cost Reports filed for FY2004; For facilities with no FY04 report, FY03 was used. All estimates include subproviders. Estimated Population: Based on DHH school enrollment data and as well as estimated re-population conjecture. Estimated Beds: Based on population scenarios, use rate "best practice targets" assuming national utilization levels per HEDIS reporting, and target occupancy percentages of 75%
Region 5 (Lake Charles)
This region was affected, second only to Region 1. Prior to the hurricanes, this region had excess beds based on the same criteria discussed above. The same will likely apply based on the population scenarios. Region 5 was in the path of Hurricane Rita and suffered damage. The region is comparatively small, and the most significant effects were to coastal areas. Section II Exhibit 34 Sources: Historical Population: DHH, Solucient, Inc, Kaiser Family Foundation, U.S. Census. Historical Beds: Data based on Medicare Cost Reports filed for FY2004; For facilities with no FY04 report, FY03 was used. All estimates include subproviders. Estimated Population: Based on DHH school enrollment data and as well as estimated re-population conjecture. Estimated Beds: Based on population scenarios, use rate "best practice targets" assuming national utilization levels per HEDIS reporting, and target occupancy percentages of 75%
Population Scenarios for Region 4
200,000
350,000
500,000
650,000
Pre-Hurricane
Post-Hurricane
High Medium Low 0
500
1,000
1,500
2,000
2,500
Pre-hurricane
@ 75%Occ
High Medium Low
Based on Population Scenarios for Region 4
Population Scenarios for Region 5
150,000
180,000
210,000
240,000
270,000
300,000
Pre-Hurricane
Post-Hurricane
High Medium Low0
200
400
600
800
1,000
1,200
Pre-hurricane
@ 75%Occ
High Medium Low
Based on Population Scenarios for Region 5
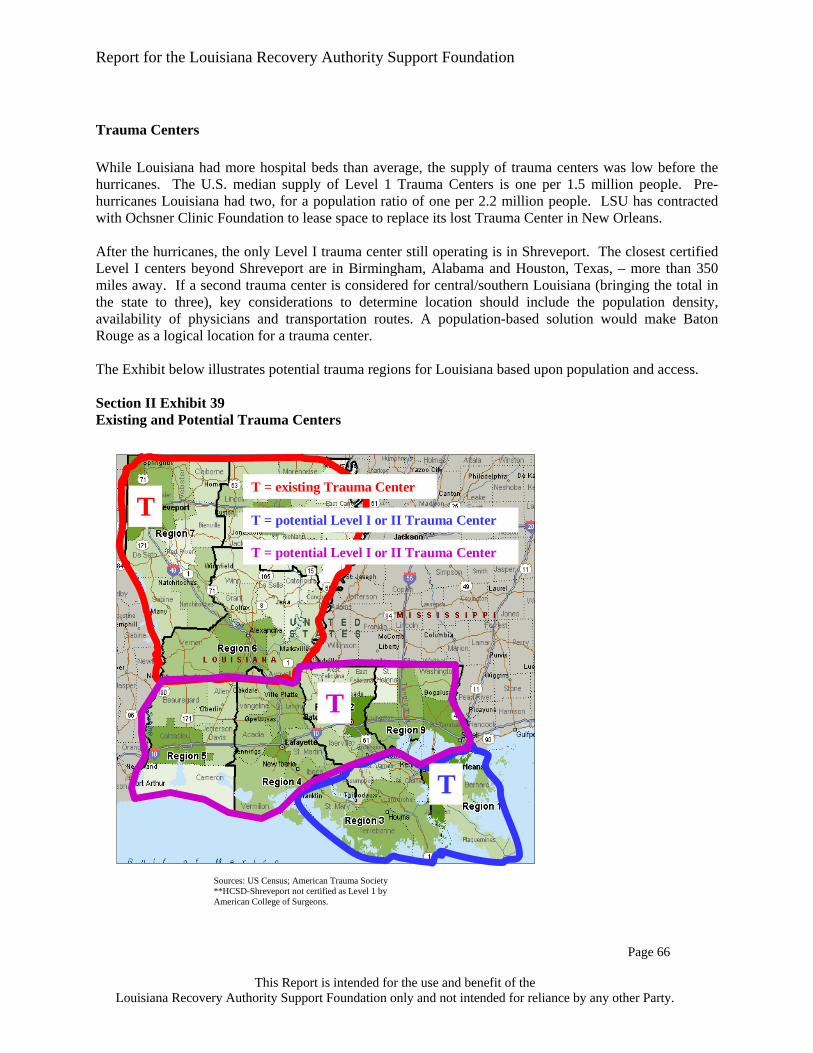
Report for the Louisiana Recovery Authority Support Foundation
Page 64
This Report is intended for the use and benefit of the
Louisiana Recovery Authority Support Foundation only and not intended for reliance by any other Party.
Region 6 (Alexandria)
Prior to the hurricanes, this region had excess beds based on the same criteria discussed above. The same will likely apply based on the population scenarios. Region 6 is inland, and effects are mostly associated with evacuees' migration, not hurricane damage. Section II Exhibit 35 Sources: Historical Population: DHH, Solucient, Inc, Kaiser Family Foundation, U.S. Census. Historical Beds: Data based on Medicare Cost Reports filed for FY2004; For facilities with no FY04 report, FY03 was used. All estimates include subproviders. Estimated Population: Based on DHH school enrollment data and as well as estimated re-population conjecture. Estimated Beds: Based on population scenarios, use rate "best practice targets" assuming national utilization levels per HEDIS reporting, and target occupancy percentages of 75%
Region 7 (Shreveport)
Prior to the hurricanes, this region had excess beds based on the same criteria discussed above. The same will likely apply based on the population scenarios. Region 7 is inland and effects are mostly associated with evacuees' migration, not hurricane damage. Section II Exhibit 36 Sources: Historical Population: DHH, Solucient, Inc, Kaiser Family Foundation, U.S. Census. Historical Beds: Data based on Medicare Cost Reports filed for FY2004; For facilities with no FY04 report, FY03 was used. All estimates include subproviders. Estimated Population: Based on DHH school enrollment data and as well as estimated re-population conjecture. Estimated Beds: Based on population scenarios, use rate "best practice targets" assuming national utilization levels per HEDIS reporting, and target occupancy percentages of 75%
Population Scenarios for Region 7
500,000
510,000
520,000
530,000
540,000
Pre-Hurricane
Post-Hurricane
High Medium Low 0
500
1,000
1,500
2,000
2,500
3,000
Pre-hurricane
@ 75%Occ
High Medium Low
Based on Population Scenarios for Region 7
Population Scenarios for Region 6
200,000
230,000
260,000
290,000
320,000
Pre-Hurricane
Post-Hurricane
High Medium Low0
200
400
600
800
1,000
Pre-hurricane
@ 75%Occ
High Medium Low
Based on Population Scenarios for Region 6

Report for the Louisiana Recovery Authority Support Foundation
Page 65
This Report is intended for the use and benefit of the
Louisiana Recovery Authority Support Foundation only and not intended for reliance by any other Party.
Region 8 (Monroe)
Prior to the hurricanes, this region had excess beds based on the same criteria discussed above. The same will likely apply based on the population scenarios. Region 8 is inland and effects are mostly associated with evacuees' migration, not damage. Section II Exhibit 37 Sources: Historical Population: DHH, Solucient, Inc, Kaiser Family Foundation, U.S. Census. Historical Beds: Data based on Medicare Cost Reports filed for FY2004; For facilities with no FY04 report, FY03 was used. All estimates include subproviders. Estimated Population: Based on DHH school enrollment data and as well as estimated re-population conjecture. Estimated Beds: Based on population scenarios, use rate "best practice targets" assuming national utilization levels per HEDIS reporting, and target occupancy percentages of 75%
Region 9 (Covington-Slidell)
Like Region 3, this region had more than the national average of beds per capita prior to the hurricane. Using the 75 percent occupancy as a benchmark, it would exceed the national average even with population growth based on the population scenarios. Region 9 was in the path of Katrina and received some damage and a number of evacuees. Pre-Hurricanes, region 9 was estimated to grow, and there is no reason to moderate that trend. Section II Exhibit 38 Sources: Historical Population: DHH, Solucient, Inc, Kaiser Family Foundation, U.S. Census. Historical Beds: Data based on Medicare Cost Reports filed for FY2004; For facilities with no FY04 report, FY03 was used. All estimates include subproviders. Estimated Population: Based on DHH school enrollment data and as well as estimated re-population conjecture. Estimated Beds: Based on population scenarios, use rate "best practice targets" assuming national utilization levels per HEDIS reporting, and target occupancy percentages of 75%
Population Scenarios for Region 8
200,000
230,000
260,000
290,000
320,000
350,000
380,000
Pre-Hurricane
Post-Hurricane
High Medium Low0
500
1,000
1,500
2,000
Pre-hurricane
@ 75%Occ
High Medium Low
Based on Population Scenarios for Region 8
Population Scenarios for Region 9
200,000
350,000
500,000
650,000
Pre-Hurricane
Post-Hurricane
High Medium Low0
200400600800
1,0001,2001,400
Pre-hurricane
@ 75%Occ
High Medium Low
Based on Population Scenarios for Region 9

Report for the Louisiana Recovery Authority Support Foundation
Page 66
This Report is intended for the use and benefit of the
Louisiana Recovery Authority Support Foundation only and not intended for reliance by any other Party.
Trauma Centers While Louisiana had more hospital beds than average, the supply of trauma centers was low before the hurricanes. The U.S. median supply of Level 1 Trauma Centers is one per 1.5 million people. Pre-hurricanes Louisiana had two, for a population ratio of one per 2.2 million people. LSU has contracted with Ochsner Clinic Foundation to lease space to replace its lost Trauma Center in New Orleans. After the hurricanes, the only Level I trauma center still operating is in Shreveport. The closest certified Level I centers beyond Shreveport are in Birmingham, Alabama and Houston, Texas, – more than 350 miles away. If a second trauma center is considered for central/southern Louisiana (bringing the total in the state to three), key considerations to determine location should include the population density, availability of physicians and transportation routes. A population-based solution would make Baton Rouge as a logical location for a trauma center. The Exhibit below illustrates potential trauma regions for Louisiana based upon population and access. Section II Exhibit 39 Existing and Potential Trauma Centers
Sources: US Census; American Trauma Society **HCSD-Shreveport not certified as Level 1 by American College of Surgeons.
T
T
T
T = existing Trauma Center
T = potential Level I or II Trauma Center
T = potential Level I or II Trauma Center

Report for the Louisiana Recovery Authority Support Foundation
Page 67
This Report is intended for the use and benefit of the
Louisiana Recovery Authority Support Foundation only and not intended for reliance by any other Party.
Hospital Outpatient and Emergency Departments Louisiana residents use emergency department (ED) and hospital outpatient (OP) services at a higher rate than the national average; 43 percent higher for ED and 18 percent higher for OP services, according to the Kaiser Family Foundation. The care is distributed differently among hospital ownership types compared to the United States; 43 percent of the emergency room visits and 37 percent of the hospital outpatient visits occurred at the state and local government hospitals in Louisiana. Conversely, only 16 percent and 17 percent of the ED and OP visits occurred at the state and local government hospitals in the U.S.. Hospital EDs are an expensive venue for care at approximately $500 per visit, yet residents have become accustomed to using them for their care. Section II Exhibit 40 Emergency Department and Hospital Outpatient Comparisons
Emergency Room Vists per 1,000 Louisiana % Total US % TotalState/Local Government 234 42.7% 62 16.2%Non-Profit 157 28.6% 272 71.0%For-Profit 157 28.7% 49 12.8%Total 548 100.0% 383 100.0%
Percent of Louisiana use rates over United States use rates 43.1%
Hospital Outpatient Visits per 1,000 Louisiana % Total US % TotalState/Local Government 859 37.3% 328 16.9%Non-Profit 992 43.1% 1,465 75.3%For-Profit 453 19.6% 153 7.8%Total 2,304 100.0% 1,946 100.0%
Percent of Louisiana use rates over United States use rates 18.4%
Source: Kaiser Family Foundation, 2004, based on AHA Survey data.
While over utilization of hospital EDs is a national problem, it appears to be more acute in Louisiana. For example, an analysis by Solucient showed that 78 percent of Louisiana's ED visits were non-emergent compared with 74 percent nationally. The following chart provides further detail by region:

Report for the Louisiana Recovery Authority Support Foundation
Page 68
This Report is intended for the use and benefit of the
Louisiana Recovery Authority Support Foundation only and not intended for reliance by any other Party.
Section II Exhibit 41 Emergency Department Comparisons
Emergent Visits Non-Emergent Visits Total Emergency Room Visits
LA Regions2004
EstimatedScenario
Estimated (1) Change Use Rate (2)2004
EstimatedScenario
Estimated (1) Change Use Rate (2)2004
EstimatedScenario
Estimated (1) Change Use Rate (2)
Region 1 90,000 50,000 -44.4% 77 410,000 280,000 -31.7% 431 490,000 330,000 -32.7% 508 Region 2 80,000 90,000 12.5% 129 160,000 190,000 18.8% 271 240,000 290,000 20.8% 414 Region 3 50,000 60,000 20.0% 150 200,000 230,000 15.0% 575 260,000 280,000 7.7% 700 Region 4 50,000 60,000 20.0% 103 260,000 270,000 3.8% 466 310,000 320,000 3.2% 552 Region 5 20,000 20,000 0.0% 71 140,000 150,000 7.1% 536 160,000 180,000 12.5% 643 Region 6 40,000 40,000 0.0% 129 130,000 140,000 7.7% 452 180,000 190,000 5.6% 613 Region 7 60,000 60,000 0.0% 113 180,000 190,000 5.6% 358 250,000 250,000 0.0% 472 Region 8 40,000 40,000 0.0% 114 160,000 160,000 0.0% 457 200,000 200,000 0.0% 571 Region 9 80,000 80,000 0.0% 154 200,000 220,000 10.0% 423 270,000 300,000 11.1% 577
Total 510,000 500,000 -2.0% 116 1,840,000 1,830,000 -0.5% 424 2,360,000 2,340,000 -0.8% 542
U.S. Average 113 321 434 Source: Solucient Market Planner Plus- Outpatient Estimates (1) Scenario estimated procedures calculated based on Medium Population Scenario (2) 2004 Use Rate held constant to estimate scenario procedures (3) Non-emergent visits do not necessarily require treatment in a hospital emergency department and can potentially be treated in a fast-track ED, an urgent care treatment center, a clinic, or a physician's private office. Emergent visits require immediate treatment in a hospital emergency department due to the severity of illness.
Ambulatory Care In 2004, $22.5 million was spent for Federally Qualified Health Centers (FQHCs) services while another $29.6 million was spent at rural health clinics. FQHCs, rural and LSU clinics deliver more cost-effective care for non-emergencies than hospitals. Typical FQHC costs per visit are approximately $135, rural health centers are approximately $105-$120 per visit and LSU clinics are approximately $130 per visit while the average Louisiana hospital outpatient cost is much greater at approximately $345 per visit. Charity Hospital and University Medical Center in New Orleans report more than 300,000 in annual clinic visits, which have now ceased. It is unclear what the current requirement is for these services post-Katrina. Below is further ambulatory care detail from the report, "Louisiana Medicaid Analysis of FQHC Services, RHC Services, and LSU Clinic Services," in December 2004 by Myers and Stauffer LC on behalf of DHH. FQHC Experience:
• 24 Federally Qualified Health Centers in Louisiana • 166,000 visits in 2004 • $22.5 Million in Total Costs • 40 percent of visits are from Medicaid
Rural Health Centers:
• 51 Rural Health Centers in Louisiana • 302,000 visits in 2004 • $29.6 Million in Total Costs • 30 percent of visits are from Medicaid

Report for the Louisiana Recovery Authority Support Foundation
Page 69
This Report is intended for the use and benefit of the
Louisiana Recovery Authority Support Foundation only and not intended for reliance by any other Party.
LSU Clinics:
• Statewide LSU Hospitals and Clinics • 972,000 visits in 2004 • 340,000 visits occur at MCLNO • 22 percent of visits are from Medicaid
In summary, Louisianans use far more Emergency Department care than is needed, and shifting care to lower cost community clinics and doctors offices would yield significant savings to the healthcare economy.
Long-Term Acute Care Prior to the hurricanes, Louisiana had a higher than average number of nursing home beds per capita. (Louisiana data was obtained from DHH and was compared to the national average of nursing home beds, which is 5.4 per 1,000 population, based on the Kaiser Family Foundation data.) However, Regions 1, 3 and 9 were under-supplied. For long-term acute care beds (LTAC), an undersupply existed statewide, although two urban Regions (1 and 7) were oversupplied. After the hurricanes hit, the supply of long-term care beds decreased significantly. For example, in Region 1, based on the Health Standards Section report from DHH, only 29 of 51 nursing homes are currently open. There is also a shortage of LTAC beds. Currently, the ratio of nursing home beds is 4.7 per 1,000 residents in Region 1, which is less than the national average of 5.4. The drop derives from the closure of more than 2,200 available nursing home beds after the hurricanes. This lack of capacity, especially within Orleans, St. Bernard and Plaquemines parishes, may be increasing the length of stay in area hospitals and affecting hospital performance. The following chart illustrates the need for long-term care beds in Region 1, where New Orleans is located. Section II Exhibit 42 Long-term Care Scenario for Region 1
Region 1 Pre Hurricanes Current High Medium LowTotal Population [a] 1,016,000 578,000 750,000 650,000 600,000 Nursing Home Providers [b] 51 29 33 28 26 Nursing Home Beds [b] 4,954 2,735 3,975 3,445 3,180 Nursing Home Beds / 1,000 [c] 4.9 4.7 5.3 5.3 5.3 LTAC Providers [d] 11 4 9 8 7 LTAC Beds [d],[e],[f] 575 97 375 325 300 LTAC Beds / 1,000 Total Population 0.6 0.2 0.5 0.5 0.5
Sources:[a] Demographic Scenarios[b] Pre-Hurricane-DHH, Current-Pre-Hurricane less closed facilities as reported by DHH; Scenarios calculated.Scenarios assumes minimum of 120 beds.[c] Pre-Hurricane/Current (DHH); benchmark based on U.S. average.[d] LHA. Licensed Beds. Scenarios assume minimum need of 40 beds[e] DHH list of closed facilities.[f] Scenarios estimated based on pre-hurricane statewide mean.
Estimated Need - Scenarios

Report for the Louisiana Recovery Authority Support Foundation
Page 70
This Report is intended for the use and benefit of the
Louisiana Recovery Authority Support Foundation only and not intended for reliance by any other Party.
Mental Health Services When hurricane Katrina hit Louisiana; it caused not only physical but emotional devastation. Prior to Hurricanes Katrina and Rita, Louisiana residents appeared less likely to be in poor mental health than some national benchmarks. According to the Centers for Disease Control and Prevention (CDC), in 2004, 24.5 percent of Louisiana adults had poor mental health compared to 33.9 percent of the U.S. adult population. 21 About 20 percent of Louisiana's residents (or 246,000 individuals), both children and adults had serious mental disorders. 22 Afterwards, there are more people likely to need treatment, especially due to the expected prevalence of post-traumatic stress disorder (PSTD). The hurricanes appear to have exacerbated Louisiana's limited mental healthcare services and funding. Many individuals lost their employer-based health insurance coverage, and the number of individuals requiring much needed services dramatically increased. An estimated 380,000 Louisianans will have developed post-traumatic stress disorder and will be in need of mental health services. 23 The state of Louisiana provided mental health services for a small fraction of those afflicted with poor mental health, as most of those covered by the state are female and white. Despite a considerable number of residents with poor mental health, Louisiana only covered approximately 46,000 individuals under the state mental health authority in 2004. This coverage represented 10.2 persons per 1,000 population compared to the average U.S. penetration rate of 19.3 persons per 1,000 population. About 54.7 percent of the residents served under Louisiana's mental health services were female. And the race distribution among those served was about equal between African-Americans / Blacks and Whites, 47.8 percent and 50.6 percent, respectively. 24 In 2001, Louisiana spent little on mental health services and focused on inpatient hospital services, leaving the outpatient arena under-funded. The state spent on average about $45 per person utilizing state mental health services in 2001 compared to the average of $84 per person in the U.S. 25 In 2004, the total state spending for mental health services was about $230 million. The majority of the state's spending — about 53 percent of total state mental health expenditures — was for state hospitals and inpatient care compared to the average U.S. spending of about 29 percent. Thirty-one percent of the state's spending was for ambulatory and community services and the rest was for other 24-hour care. 26 Many relied on one major hospital as their primary source of mental healthcare, the Medical Center of Louisiana at New Orleans (MCLNO). The MCLNO – comprised of two hospitals, Charity and University – has closed, and it was also one of the larger providers of mental health services and co-occurring substance abuse. MCNLO provided 50 percent of the total inpatient substance abuse care and 28 percent of the total inpatient psychiatry services in the New Orleans catchment area. 27 A total of 97 inpatient mental health beds were closed with the closure of Charity Hospital. This has placed a greater strain on other public hospitals and clinics still standing. The ED at Earl K. Long Medical Center in Baton Rouge reported a 57 percent increase in patients evaluated for behavioral health problems. C
23C
Louisiana was already suffering from limited ambulatory mental healthcare resources prior to the hurricanes. The state was already stretched to the limit of what it could provide its residents. According to Louisiana's Department of Health and Hospitals, the barriers to mental healthcare were:

Report for the Louisiana Recovery Authority Support Foundation
Page 71
This Report is intended for the use and benefit of the
Louisiana Recovery Authority Support Foundation only and not intended for reliance by any other Party.
Gaps in community-based system of care; Lack of appropriately trained professionals; Service system fragmentation and lack of integration; and Insufficient funding.
There is also a lack of housing, group homes and facilities. The closing of one large freestanding mental health facility, DePaul Tulane, has also affected the availability of mental health services. Because of the displacement of some residents, many Louisianans have gone for long periods of time without their medications, making their current mental health conditions worse. The Department of Social Services was recently awarded an $80 million grant by the federal government to address the issues surrounding mental health. These funds must be allocated by September 2006 and spent by September 2007. The Department of Social Services will funnel the funds to the Department of Health and Hospitals and they will be distributed by contract to local hospitals, clinics and other organizations in each of the 10 human service districts. 28 The funds may be used for training for current mental health providers. Specific funds will go to the universities to increase resources to deal with mental disorders, such as post-traumatic stress disorder. Separate courses are expected to be developed for children and adults. Overall, the grant is intended to reduce ED usage by patients with mental disorders through psychological triage and community crisis intervention. It's also expected to fund initiatives such as supportive respite housings, an Assertive Community Treatment Team, crisis intervention, 24-hour hotlines and services in the schools. A distribution of the $80 million grant is depicted in the exhibit below. Section II Exhibit 43 Mental Health Grant Distribution Grant Item Amount (millions) Crisis Response ED $ 37Child and Adolescents 18Budget Restoration 10Substance Abuse 8Developmental Disabilities 7Total $ 80
Source: DHH, F. Cerise. Efforts are also under way to establish 10,000 housing units in the New Orleans area, 5,000 of which will provide low-income housing for persons with disabilities, including permanent supportive housing for persons with mental illness. Collaboration with the VA offers opportunities to extend and enhance services. Without acute care hospital and/or freestanding mental facility investment, a shortage of beds may occur. 23 Lack of facilities, trained professionals and government funding will make mental healthcare in Louisiana worse off than prior to the hurricanes. Louisiana was in a difficult situation prior to the hurricanes and now they require resources to respond to the mental health needs of disaster victims.

Report for the Louisiana Recovery Authority Support Foundation
Page 72
This Report is intended for the use and benefit of the
Louisiana Recovery Authority Support Foundation only and not intended for reliance by any other Party.
Investing to Meet IOM Goals – Programs and Process Moving to a high performance system will require investment. In general, any shift care from a specialty care/hospital setting to a primary care/non-hospital setting will have a positive return on investment, reducing the number of expensive hospital ED visits in exchange for more efficient ambulatory settings.
Investing to Meet IOM Goals – Operations and Capital After assessing the existing infrastructure of the healthcare system, a redesign is required to align the structure to meet the IOM principles. Initial capital investments are proposed for the redesigned system to become functional. These include three major categories of investments:
• The investment in the Louisiana Emergency Response Network (LERN), • Investment in a Louisiana Health Information Organization and • Investments in new facilities.
In today’s dollars, the LERN system is estimated to cost approximately $10 million annually in operating costs and is expected to be funded through a combination of state funds and federal grants. (This cost is based upon the state's Regional Trauma-patient Care Statewide System Task Force LERN legislation and budget, adjusted to reflect nine command centers instead of the proposed five.) It is assumed that it may take three to five years to fully develop the system. As discussed in the "Emergency Preparedness and Disaster Planning" section, this estimate includes costs associated with the implementation and operation of (i) Nine Regional Commissions; (ii) One State Command and Control Center; and (iii) Nine Regional Command and Control Centers and the creation of a Bureau of Emergency Preparedness within DHH. The funding for the Louisiana Health Information Organization and essential information technology infrastructure, discussed in the "Public and Private Technology Infrastructure" section of the document, is estimated to cost $35 million in today's dollars, which includes the essential patient and provider authentication, and the privacy and security infrastructure for a browser-based tool that allows access to available lab values, medication histories, clinical encounters and claims data. In addition, it is estimated that an additionally annual investment in operational costs for the LHIO will be necessary. The estimated costs are based upon similar costs incurred and/or projected for similar regional health information exchange organizations, per estimated connected provider and emergency preparedness site. Again, it may take three to five years to develop this infrastructure. This investment in technology is expected to be funded in part by the state through grants and through key stakeholders. The funding for new facilities, estimated to cost approximately $220 million as detailed in the next exhibit, includes the creation of 10 new ambulatory care centers, the establishment of a Trauma Center in Region 2 and creation of a 200-bed trauma and mental health facility in Region 1. The rationale for the additional trauma center capacity is that before the hurricanes, Louisiana had two centers (LSU Shreveport and Medical Center of Louisiana in New Orleans), which equated to one Trauma Center for every 2.2 million people. According to the U.S. Census Bureau and the American Trauma Society, the 2002 median supply of Level I Trauma Centers was one for every 1.5 million people.

Report for the Louisiana Recovery Authority Support Foundation
Page 73
This Report is intended for the use and benefit of the
Louisiana Recovery Authority Support Foundation only and not intended for reliance by any other Party.
The recommended establishment of Trauma Centers in Regions 1 and 2 recognizes the lack of a close Trauma Center. (The closest certified Level I centers are in Birmingham and Houston approximately 350 miles away now that MCLNO is closed.) Although there are no nationally accepted rules for long-term care facility requirements per population, it appears as though Region 1 faces an immediate undersupply issue, as discussed earlier. Over the longer-term, redistribution of long-term care beds appears warranted, along with creation of additional long-term care and home health capacity in providers of a more efficient scale. According to the Kaiser Family Foundation, there were approximately 5.4 nursing home beds per 1,000 population in the United States in 2003. 29 After the hurricanes, Region 1 has approximately 4.7 beds per 1,000 and Region 9 has 5.1 beds per 1,000. Effectively distributing long-term care reduces the short-term issue of hospitals currently having high occupancy rates since they are unable to discharge patients to a more appropriate long-term care setting. (A discussion of this "bubble" was provided earlier; see Exhibit 29.)
The costs related to the investments in new facilities are detailed in the chart below. It is expected that traditional federal funding could be provided for the ambulatory care centers while the rest of the proposed infrastructure could be funded through a combination of federal or private sector financing. It is expected that nearly $100 million will be spent in the private sector to rebuild/refurbish long-term care beds. Total infrastructure investments to realize a reconfigured system are shown in the table below. Section II Exhibit 44 Total Infrastructure Investments
C
What Where NotesInitial Capital
(millions)
Annual Operating (millions)
Principal Payer
200-bed Acute Trauma/Mental Health Center Region 1 [a] 200$ 178$ MedicareAmbulatory Health Centers Statewide (10) [b] 10$ 20$ MedicaidTrauma Center in Region 2 Region 2 [c] 10$ 13$ MedicareTotal 220$ 211$
[a] Assumes $1 million per bed project cost. Assumes no land acquisition costs.[b] Assumes 5,000 square foot facility per center at $200 project cost. No land acquisition.[c] Assumes 20,000 square feet of new facilities at $500 project cost. No land acquisition.
C Notes: Project costs are based on the RS Means 2006 Construction Cost Guide. The square footage estimates were based on CON and health facility standards for the states of AK, AR, GA, MS and NJ. The capital requirements above are focused on an ability to address certain specific needs as opposed to an assessment of the current conditions of all facilities (any pent up capital improvement needs pre-hurricanes or just the normal annual capital improvement process that occurs).
Report for the Louisiana Recovery Authority Support Foundation
Page 74
This Report is intended for the use and benefit of the
Louisiana Recovery Authority Support Foundation only and not intended for reliance by any other Party.
The Current Public System and Options for Reconfiguration Louisiana operates a state public hospital system comprised of 10 hospitals located primarily in the major metropolitan areas. This structure of the system is unique to Louisiana. This hospital system today operates emergency, inpatient and outpatient services for the Medicaid, uninsured, underinsured and prisoner populations of the state. These public hospitals absorb the vast majority of uncompensated care (UCC) and are severely financially disadvantaged because their primary revenue source is from the state and federal government in the form of Medicaid DSH or UCC and thus vulnerable to general economic conditions. It is thus not surprising why public facilities pre-hurricanes were in need of $1 billion in capital improvements and deficient in resources to supply services. Due to budget constraints in the public hospital system in the 1990s, all nine hospitals in the public hospital system not under LSU control (LSU - Health Sciences Center Shreveport being the exception) were placed under the same LSU management umbrella, forming the LSU - Health Care Services Division. Recently, EA Conway Hospital was attached to LSU-HSC Shreveport. These are organized into two divisions as described earlier in the beginning of the document. The impetus for this change may have been the belief that LSU - HSC Shreveport is often mentioned as ‘model’ for how the public hospital system could more appropriately work. However, even this reorganization of management and structure could not stem the inevitable consequences of changing market conditions that had driven so many other public hospitals across the country to move to different models. Today, aside from Louisiana, there are few public hospitals left in the U.S. that are run by the state. The rest are now either separate private entities, not-for-profit corporations, or run by local government. Following is a short chart describing the total system: Section II Exhibit 45
LSU Health Sciences Center Hospitals & Clinics 2003 Fact Sheet
Hospitals in System - 10 Employees – 11,968 Annual Expenditures - $1.076 Billion Estimated Economic Impact - $2.3 Billion Medical and Clinical Education: Medical Residents and Fellows – 1,731 * Nurses and Allied Health Professionals – 4,643 Patient Population – 952,000 (Approximately)
Capacity: Licensed Beds – 2,295 Staffed Beds – 1,653 Inpatient: Admissions – 85,849 Total Inpatient Days – 474,726 Births – 8,499 Outpatient: Clinic Visits – 1,466,629 Emergency Visits – 558,240
Source: LSU Health Sciences Center - Health Care Services Division; Annual Report 2003 * Includes Tulane and LSU-HCSD joint program.

Report for the Louisiana Recovery Authority Support Foundation
Page 75
This Report is intended for the use and benefit of the
Louisiana Recovery Authority Support Foundation only and not intended for reliance by any other Party.
With DSH funding to public hospitals being the primary source of funding for the uninsured, the eight public non academic medical center hospitals received less Medicaid DSH funding than their proportionate population base requires. As can be seen from the chart below, DSH funding was retained disproportionately by New Orleans and Shreveport in support of their operating costs for tertiary care and graduate medical education roles. Section II Exhibit 46 It is clear from the above, that the interests of serving the uninsured are not necessarily convergent with the University's goals of service, teaching and research. LSU should consider separating itself from the management of public hospitals other than its academic medical centers and focus on its mission of service, teaching and research. These teaching institutions should be attractive to all patients – public and private and consequently have a "healthier" payer mix. The state should adjust its focus on care for the poor and under- and uninsured on patient services, not facilities. The care of the uninsured through Medicaid DSH funding should be contracted for by the state around integrated care management models in all regions. Simply allowing "dollars to follow the patient" is not the answer. Rather, this care should be contracted on an integrated care model to quality targets as described above. In this configuration, unless a public hospital could find a means for survival that is financially sustainable, it may likely not survive. However what would persist is a better and more sustainable safety-net for the poor and under- and uninsured, giving them all the best the state has to offer. The next section discusses the healthcare workforce and medical education. It will examine how the two-system care model in Louisiana has impacted the adequacy of funding for LSU’s graduate medical education program (residency training or GME). There it will be shown how one system for all improves the statutory federal funding of graduate medical education and offers the chance for LSU to provide the right physicians for the state for the next generation.
Source: Lewin Group Health Benefits Simulation Model (2000) and charity hospital financial statements (2003).Note: MCLNO and Shreveport are the primary State teaching hospitals and State-wide referral centers for specialty care.
Distribution of State-Wide Uninsured (2000) and DSH Payments (2003)
0%
5%
10%
15%
20%
25%
30%
35%
40%
45%
50%
MCLNO EKL UMC Shreveport EAC LK/WST HPL LJC WOM
Uninsured DSH Funding
Distribution of State-Wide Uninsured (2000) and DSH Payments (2003)
0%
5%
10%
15%
20%
25%
30%
35%
40%
45%
50%
MCLNO EKL UMC Shreveport EAC LK/WST HPL LJC WOM
Uninsured DSH Funding

Report for the Louisiana Recovery Authority Support Foundation
Page 76
This Report is intended for the use and benefit of the
Louisiana Recovery Authority Support Foundation only and not intended for reliance by any other Party.
Appendices for Measures and Optimizing the Healthcare System for the Future

Report for the Louisiana Recovery Authority Support Foundation
Page 77
This Report is intended for the use and benefit of the
Louisiana Recovery Authority Support Foundation only and not intended for reliance by any other Party.
Appendix: Health Measures The tables in this Appendix identify the measures according to both the IOM aims and the process/structure/outcome designation of the information.
IOM Aim Structural Measures Process Measures Outcome Measures
Safe • Computerized Physician order Entry System
• ICU Staffing
• System reporting of adverse events and training of appropriate personnel.
• Antibiotics one hour before skin incision
• Discontinued use of antibiotics 24 hours after surgery
• Nosocomial Infections • Complications of care:
Post-op PE/DVT • Medication
administration errors • Adverse drug reaction
events Effective • Ambulatory Care
center • Physician Offices • Labs • Board
Certifications- % of PCPs
• PCPs per Capita per 1,000 Population
• Specialists per Capita per 1,000
• Number of Nursing Homes
• Hospital Beds per 1000
• Smoking Cessation - Advising Smokers to Quit
• Cholesterol Screening < past 5 years • Childhood Immunization Status • Adolescent Immunization Status • Beta-Blocker Treatment After a
Heart Attack • Breast Cancer Screening • Cervical Cancer Screening • Colorectal Cancer Screening • Cholesterol Management - Control • Comprehensive Diabetes Care - Eye
Exams • LDL-C Screenings • New AIDS cases per 100,000
population • Influenza vaccination among high
risk adult population • Knee replacement surgery rate • Hip replacement surgery rate • Back surgery rate • CABG surgery rate • PTCA procedure rate • Prostrate surgery rate • Breast cancer: Lumpectomy rate • Breast cancer: Mastectomy rate • Inpatient hospitalization rate per
1000 • Hospitalization rate for chronic
conditions: Asthma, Diabetes, CHF, COPD, CAD
• PCP visits per 1000 • ALOS for inpatient care • Specialty visits per 1000 • CT, MRI, PET rates per 1000
• Readmission Rates COPD, CHF
• Adequate Prenatal Care • Infant Mortality per
1,000 live births • Controlling High Blood
Pressure • Antidepressant
Medication Management-Effective Acute Phase Treatment
• Comprehensive Diabetes Care - Poor HbA1c Control
• Comprehensive Diabetes Care-Rate <100 LDL-C Level

Report for the Louisiana Recovery Authority Support Foundation
Page 78
This Report is intended for the use and benefit of the
Louisiana Recovery Authority Support Foundation only and not intended for reliance by any other Party.
IOM Aim Structural Measures Process Measures Outcome Measures
Patient-Centered
• Personal Health Records
• Electronic Medical Records
• Right provider • Right setting
• CAHPS Hospital Survey • CAHPS Clinician Survey • CAHPS Health Plan Survey • CAHPS Child Survey • Geriatric assessments, etc
• % of patients who report that doctor explains things clearly
• Patient satisfaction scores
• Reduction in discomfort like pain, shortness of breath, anxiety
• Improvement in quality of life and ADLs
Timely • Access to Trauma
Centers: Level I Level II
• Ratio of Level I Trauma Centers to Million Population
• Lack of Access to Primary Care
• Wait times to see a physician
• Wait times in ER • Percent receiving
appointment when asked
• Getting Care Quickly • Examined within 15 minutes of
scheduled appointment • Surgeries completed as scheduled
• Getting Needed Care • Right patient, right
doctor, right condition at the right time
Efficient
• Percentage of Claims Electronically Submitted
• Hospital Adjusted Expense Per Capita In-Patient Day, 2003
• Total Annual Inpatient Expense • Total Annual Medicare Spend • Total Annual Medicaid Spend • Total Annual Commercial Spend • Cost impact of supply sensitive
conditions • Cost impact of preference sensitive
conditions
• Adjusted Cost per Discharge (Hospital)
• Percentage of Prescriptions for which Generic substituted
• Hospital ALOS
Equitable • Percentage of Population Insured
• Geography of facilities
Insurance coverage by race, employment status, SES
• Customer Service • Minority physicians for minority
patients • Equity for gender, race, age,
ethnicity, income, education, disability, sexual orientation, location of residence
• Getting Needed Care • Adequate Prenatal Care
by Ethnicity • Diversity of Medicaid • Children • Adults • Elderly • Blind/Disabled

Report for the Louisiana Recovery Authority Support Foundation
Page 79
This Report is intended for the use and benefit of the
Louisiana Recovery Authority Support Foundation only and not intended for reliance by any other Party.
IOM Aim: Safe
Health System Measure Source of Data LA Performance
U.S. Median
Benchmark
Top 25th U.S. Percentile
Benchmark
Nosocomial Infections - Percent of Surgery Patients Who Received Preventative Antibiotic(s) One Hour Before Incision (All Payers)
CMS 65% 70% Top 10% of Hospitals:
93%
Nosocomial Infections - Percent of Surgery Patients Whose Preventative Antibiotic(s) are Stopped Within 24 hours After Surgery (All Payers)
CMS 58% 66% Top 10% of Hospitals:
98%
Nosocomial Infections - Urinary Catheter-associated (UTI) - Surgical ICU (All Payers)
CDC - National Nosocomial Infection Surveillance
NA 3.8 per 1000 2.3 per 1000
Nosocomial Infections - central line associated - CVC - Surgical ICU (All Payers)
CDC - National Nosocomial Infection Surveillance
NA 3.4 per 1000 2.0 per 1000
Nosocomial Infections - ventilator - Surgical ICU (All Payers)
CDC - National Nosocomial Infection Surveillance
NA 8.3 per 1000 4.7 per 1000
Computerized Physician Order Entry (CPOE) (All Payers)
Leapfrog
0-25% St Francis Med
Ctr. 100%
50% 75%
ICU Staffing Ratios (All Payers)
Leapfrog 0-25% Tulane 100%
50% 75%
*Leapfrog data is voluntarily reported by 18 Louisiana Hospitals. LA 2003: 112 Acute Hospitals, Total Hospitals 201.

Report for the Louisiana Recovery Authority Support Foundation
Page 80
This Report is intended for the use and benefit of the
Louisiana Recovery Authority Support Foundation only and not intended for reliance by any other Party.
Visually, some key measures:
0%
20%
40%
60%
80%
100%
Administration of Antibiotics One Hour Before Surgery
Louisiana US Median Top 25%
0%
20%
40%
60%
80%
100%
Discontinued Use of Antibiotics 24 Hours Post-Surgery
Louisiana US Median Top 25%
0%
20%
40%
60%
80%
100%
Use of Computerized Physician Order Entry
Louisiana US Median Top 25%

Report for the Louisiana Recovery Authority Support Foundation
Page 81
This Report is intended for the use and benefit of the
Louisiana Recovery Authority Support Foundation only and not intended for reliance by any other Party.
IOM Aim: Effective
Health System Measure Source of Data LA Performance
U.S. Median
Benchmark
Top 25th U.S. Percentile
Benchmark
Infant Mortality per 1,000 live births (All Payers)
CDC 10.2 7.0 6.5
Controlling High Blood Pressure (Private)
HEDIS 63.6% 67.5% 72.3%
Controlling High Blood Pressure (Medicare)
HEDIS NA 65.0% 69.8%
Controlling High Blood Pressure (Medicaid)
HEDIS NA 61.7% 68.4%
Colorectal Cancer Screening (Private)
HEDIS 34.7% 49.0% 55.2%
Smoking Cessation - Advising Smokers to Quit (Private)
CAHPS 64.4% 69.4% 73.5%
Adequate Prenatal Care (Health Rankings 2004 Report) 19th in U.S.
National Center for Health Stats
79.2% 76.2% 82.4%
Cholesterol Screening in the past 5 years
CDC 25.8% 34.4% 36.9%
Children's Access to PCP (25 Months-6Yrs) (Private)
HEDIS 69.9% 89.1% 91.6%
Use of Appropriate Medications for People with Asthma (Combined Rate) (Private)
HEDIS 70.5% 73.9% 77.1%
Adolescent Immunization Status - Combo 1 (Private)
HEDIS 36.2% 65.9% 77.7%
Comprehensive Diabetes Care: <100 LDL-C Level Eye Exams LDL-C Screenings (Private)
HEDIS
30.8%
31.7%
69.4%
40.4%
50.4%
91.8%
56.9%
58.4%
93.7%
Breast Cancer Screening (Private)
HEDIS 64.1% 73.5% 77.4%
Breast Cancer Screening (Medicare)
HEDIS NA 73.9% 80.3%

Report for the Louisiana Recovery Authority Support Foundation
Page 82
This Report is intended for the use and benefit of the
Louisiana Recovery Authority Support Foundation only and not intended for reliance by any other Party.
Health System Measure Source of Data LA Performance
U.S. Median
Benchmark
Top 25th U.S. Percentile
Benchmark
Breast Cancer Screening (Medicaid)
HEDIS NA 54.7% 59.4%
Childhood Immunization Status - Combo 1 (Private)
HEDIS 69.4% 77.6% 82.1%
Childhood Immunization Status - Combo 1 (Medicaid)
HEDIS NA 67.8% 73.7%
Cholesterol Management - Control (LDL < 130) (Private)
HEDIS 67.8% 69.4% 73.6%
Cholesterol Management - Control (LDL < 130) (Medicare)
HEDIS NA 71.8% 78.5%
Cholesterol Management - Control (LDL < 130) (Medicaid)
HEDIS NA
42.6% 51.1%
Cervical Cancer Screening (Private)
HEDIS 70.6% 81.6% 84.3%
Antidepressant Medication Management-Effective Acute Phase Treatment (Private)
HEDIS 56.0% 60.6% 64.9%
Initiation and Engagement of Alcohol / Other Drug Dependence Treatment (Private)
HEDIS 55.7% 44.3% 51.5%
Percentage of Mothers Beginning Prenatal Care in the First Trimester by Ethnicity – White (All Payers) 30Adequate Prenatal Care by Ethnicity – White (Medicaid)
Kaiser Family Foundation CMS
90.3% 78.3%
88.5% 86.3%
90.5% 87.7%
Percentage of Mothers Beginning Prenatal Care in the First Trimester by Ethnicity – African American (All Payers) 30Adequate Prenatal Care by Ethnicity – African American (Medicaid)
Kaiser Family Foundation CMS
75.5% 66.4%
76.3% 68.7%
80.3% 69.2%
Beta-Blocker Treatment After a Heart Attack (Private)
HEDIS
81.6% 97.0% 99.0%
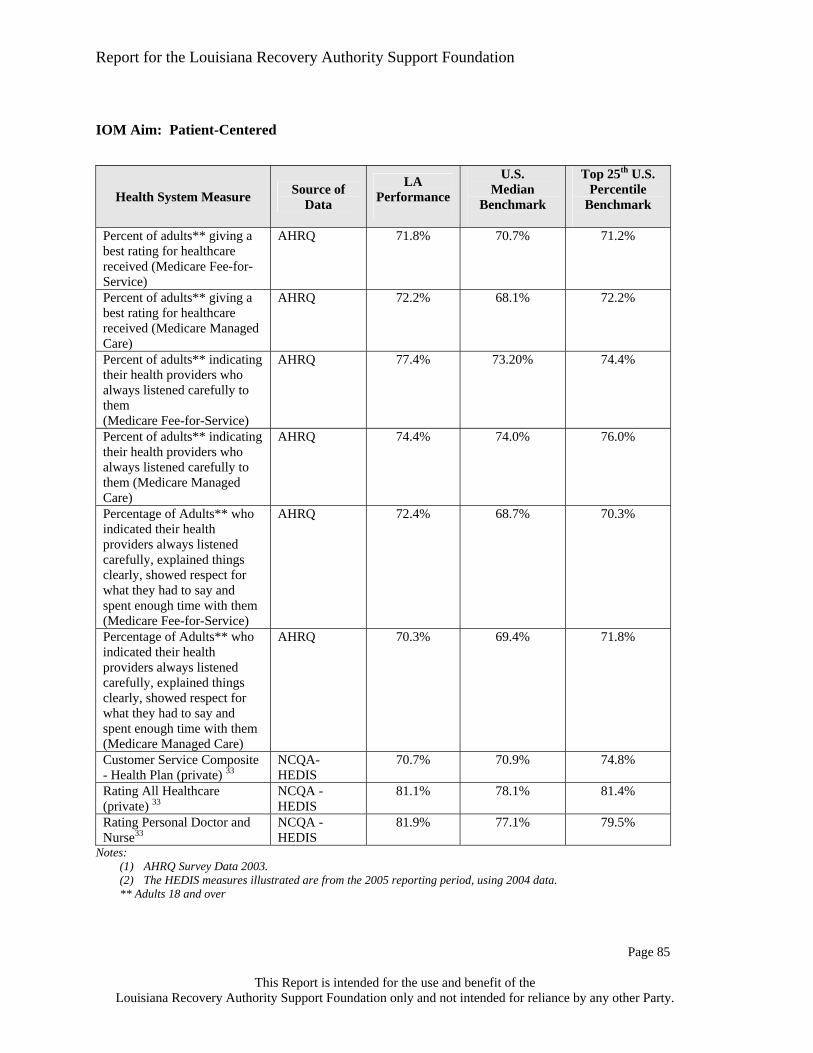
Report for the Louisiana Recovery Authority Support Foundation
Page 83
This Report is intended for the use and benefit of the
Louisiana Recovery Authority Support Foundation only and not intended for reliance by any other Party.
Health System Measure Source of Data LA Performance
U.S. Median
Benchmark
Top 25th U.S. Percentile
Benchmark
Beta-Blocker Treatment After a Heart Attack (Medicare)
HEDIS NA 96.2% 98.3%
Beta-Blocker Treatment After a Heart Attack (Medicaid)
HEDIS NA 90.6% 94.4%
PCPs per Capita per 1,000 Population (All Payers)
AMA 1.2 1.57 NA
Specialists per Capita per 1,000 Population (All Payers)
AMA 1.8 4.6 NA
Certified Nursing Facility Occupancy Rate, 200331
Kaiser Family Foundation
76.7% 87.5% 90.6%
Inpatient Utilization GH/Acute Care-Total Days/1,000 MPY (Private)
HEDIS 244.7 212.4 187.1
Hospital Days/1,00032
Kaiser Family Foundation
856 682 577
Percentage of Claims Electronically Submitted (All Payers)
CMS NA NA NA
Note: The HEDIS measures illustrated are from the 2005 reporting period, using 2004 data.
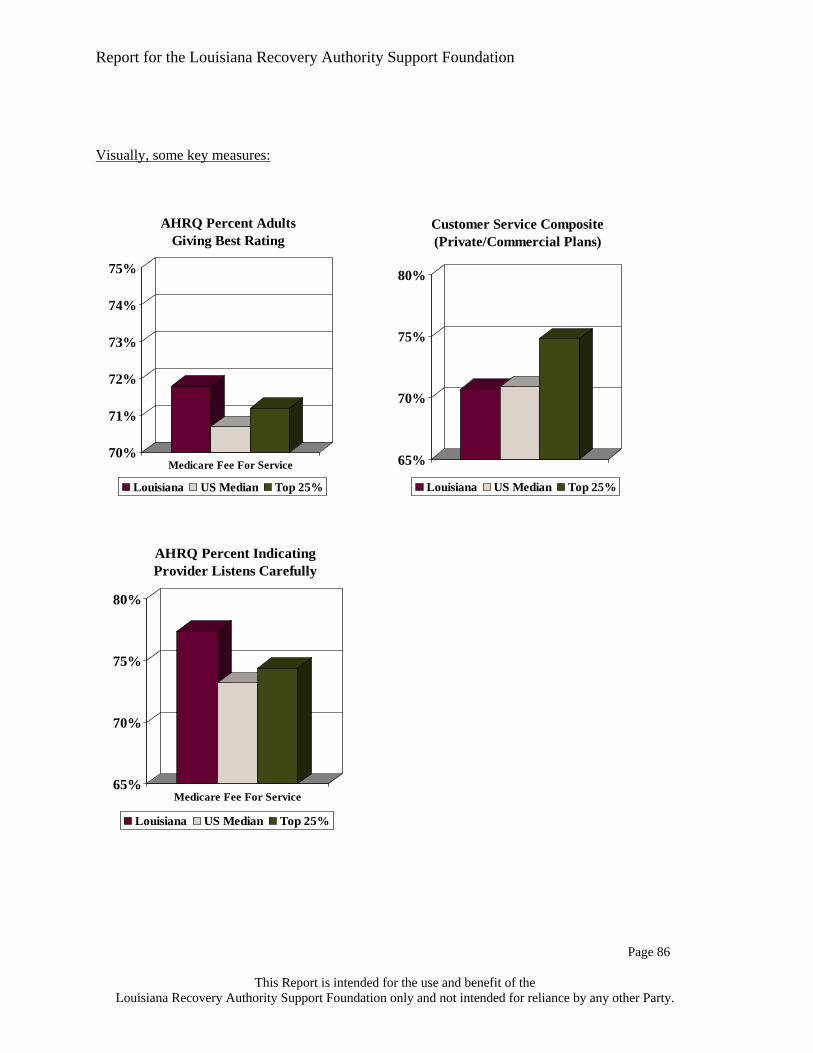
Report for the Louisiana Recovery Authority Support Foundation
Page 84
This Report is intended for the use and benefit of the
Louisiana Recovery Authority Support Foundation only and not intended for reliance by any other Party.
Visually, some key measures:
Comprehensive Diabetes Care(Medicaid) (Privately Insured)(Privately Insured)
30%
35%
40%
45%
50%
55%
60%
Privately Insured
Colorectal Cancer Screening
Louisiana US Median Top 25%
40%
45%
50%
55%
60%
65%
70%
Privately Insured
Antidepressant Medication Management
Louisiana US Median Top 25%
50%
55%
60%
65%
70%
75%
80%
Privately Insured
Advise Smokers to Quit Smoking
Louisiana US Median Top 25%
73%74%75%76%77%78%79%80%81%82%83%
Adequate Prenatal Care
Louisiana US Median Top 25%
5.0
6.0
7.0
8.0
9.0
10.0
11.0
Infant Mortality
Louisiana US Median Top 25%
60%
65%
70%
75%
80%
Privately Insured
Breast Cancer Screening
Louisiana US Median Top 25%
50%55%60%65%70%75%80%85%90%95%
100%
Privately Insured
Beta-Blocker After Heart Attack
Louisiana US Median Top 25%
60%
65%
70%
75%
80%
Privately Insured
Controlling HighBlood Pressure
Louisiana US Median Top 25%

Report for the Louisiana Recovery Authority Support Foundation
Page 85
This Report is intended for the use and benefit of the
Louisiana Recovery Authority Support Foundation only and not intended for reliance by any other Party.
IOM Aim: Patient-Centered
Health System Measure Source of Data
LA Performance
U.S. Median
Benchmark
Top 25th U.S. Percentile
Benchmark
Percent of adults** giving a best rating for healthcare received (Medicare Fee-for-Service)
AHRQ 71.8%
70.7%
71.2%
Percent of adults** giving a best rating for healthcare received (Medicare Managed Care)
AHRQ 72.2%
68.1%
72.2%
Percent of adults** indicating their health providers who always listened carefully to them (Medicare Fee-for-Service)
AHRQ 77.4%
73.20%
74.4%
Percent of adults** indicating their health providers who always listened carefully to them (Medicare Managed Care)
AHRQ 74.4%
74.0%
76.0%
Percentage of Adults** who indicated their health providers always listened carefully, explained things clearly, showed respect for what they had to say and spent enough time with them (Medicare Fee-for-Service)
AHRQ 72.4%
68.7%
70.3%
Percentage of Adults** who indicated their health providers always listened carefully, explained things clearly, showed respect for what they had to say and spent enough time with them (Medicare Managed Care)
AHRQ 70.3%
69.4%
71.8%
Customer Service Composite - Health Plan (private) 33
NCQA- HEDIS
70.7% 70.9% 74.8%
Rating All Healthcare (private) 33
NCQA - HEDIS
81.1% 78.1% 81.4%
Rating Personal Doctor and Nurse33
NCQA - HEDIS
81.9% 77.1% 79.5%
Notes: (1) AHRQ Survey Data 2003. (2) The HEDIS measures illustrated are from the 2005 reporting period, using 2004 data. ** Adults 18 and over
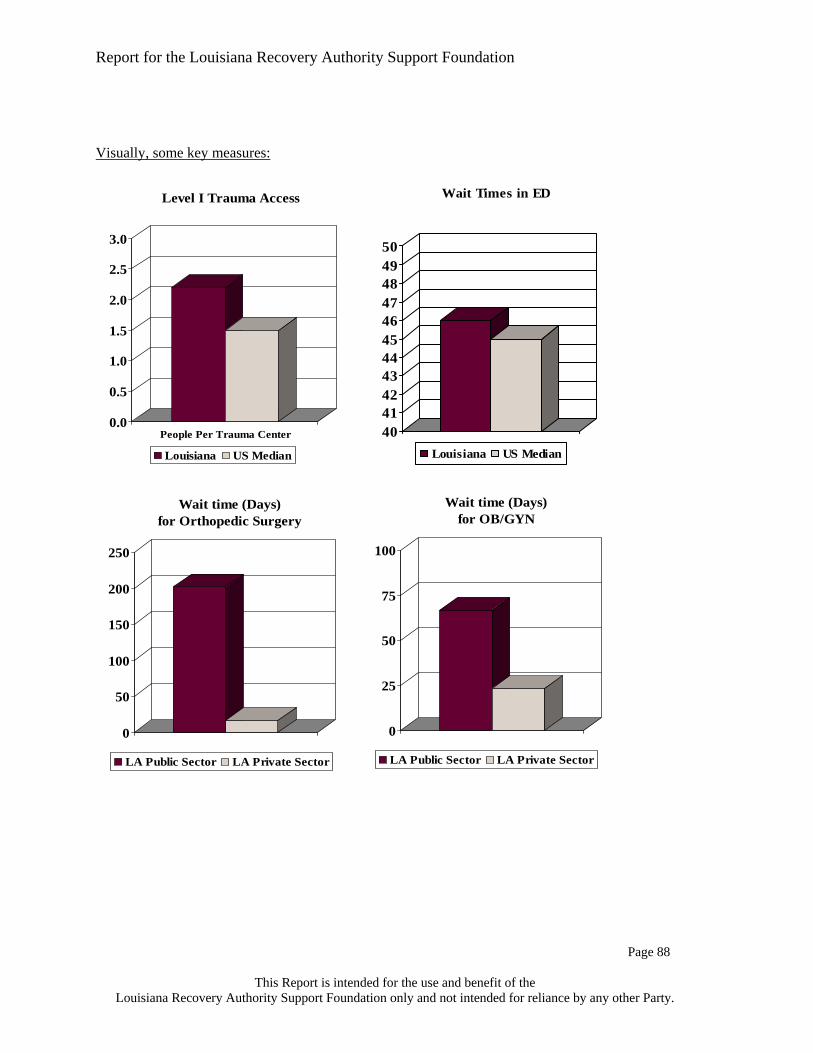
Report for the Louisiana Recovery Authority Support Foundation
Page 86
This Report is intended for the use and benefit of the
Louisiana Recovery Authority Support Foundation only and not intended for reliance by any other Party.
Visually, some key measures:
70%
71%
72%
73%
74%
75%
Medicare Fee For Service
AHRQ Percent Adults Giving Best Rating
Louisiana US Median Top 25%
65%
70%
75%
80%
Medicare Fee For Service
AHRQ Percent Indicating Provider Listens Carefully
Louisiana US Median Top 25%
65%
70%
75%
80%
Customer Service Composite(Private/Commercial Plans)
Louisiana US Median Top 25%

Report for the Louisiana Recovery Authority Support Foundation
Page 87
This Report is intended for the use and benefit of the
Louisiana Recovery Authority Support Foundation only and not intended for reliance by any other Party.
IOM Aim: Timely
Health System Measure Source of Data LA Performance
U.S. Median
Benchmark
Top 25th U.S. Percentile
Benchmark
Access to Trauma Centers: Level I Level II
ATS NA NA
70% 84%
NA NA
Ratio of Level I Trauma Centers to Million Population
ATS 1 per 2.2 1 per 1.5 NA
Lack of Access to Primary Care
DHH 18.1% 11.3% NA
Wait times in ER JCAHO 46 45 NA Note: The HEDIS measures illustrated are from the 2005 reporting period, using 2004 data. Specialty Public Sector Wait Time
(Days until Appt.) Private Sector Time (Days until Appt.)
Difference
Cardiology 25.8 18.8 7.0 Orthopedic Surgery 202.1 16.9 185.2 OB/GYN 67.0 23.3 43.7
Source: LSU, Merritt Hawkins & Associates
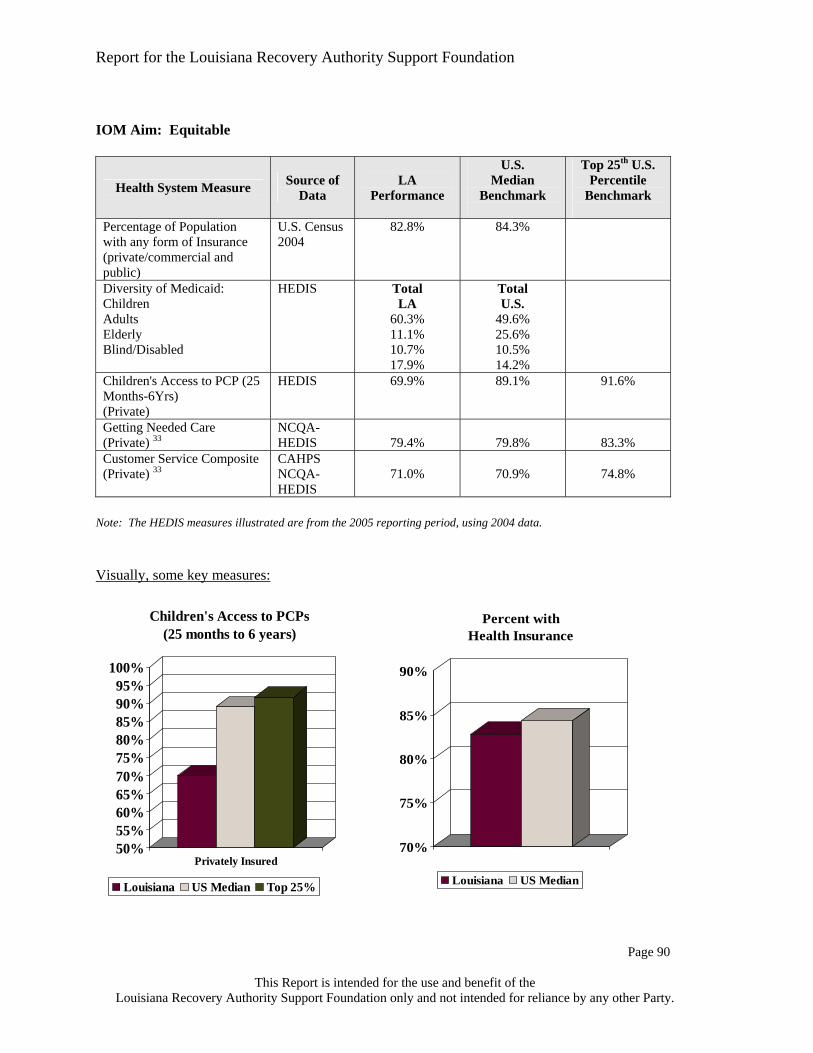
Report for the Louisiana Recovery Authority Support Foundation
Page 88
This Report is intended for the use and benefit of the
Louisiana Recovery Authority Support Foundation only and not intended for reliance by any other Party.
Visually, some key measures:
0.0
0.5
1.0
1.5
2.0
2.5
3.0
People Per Trauma Center
Level I Trauma Access
Louisiana US Median
4041424344454647484950
Wait Times in ED
Louisiana US Median
0
50
100
150
200
250
Wait time (Days) for Orthopedic Surgery
LA Public Sector LA Private Sector
0
25
50
75
100
Wait time (Days) for OB/GYN
LA Public Sector LA Private Sector
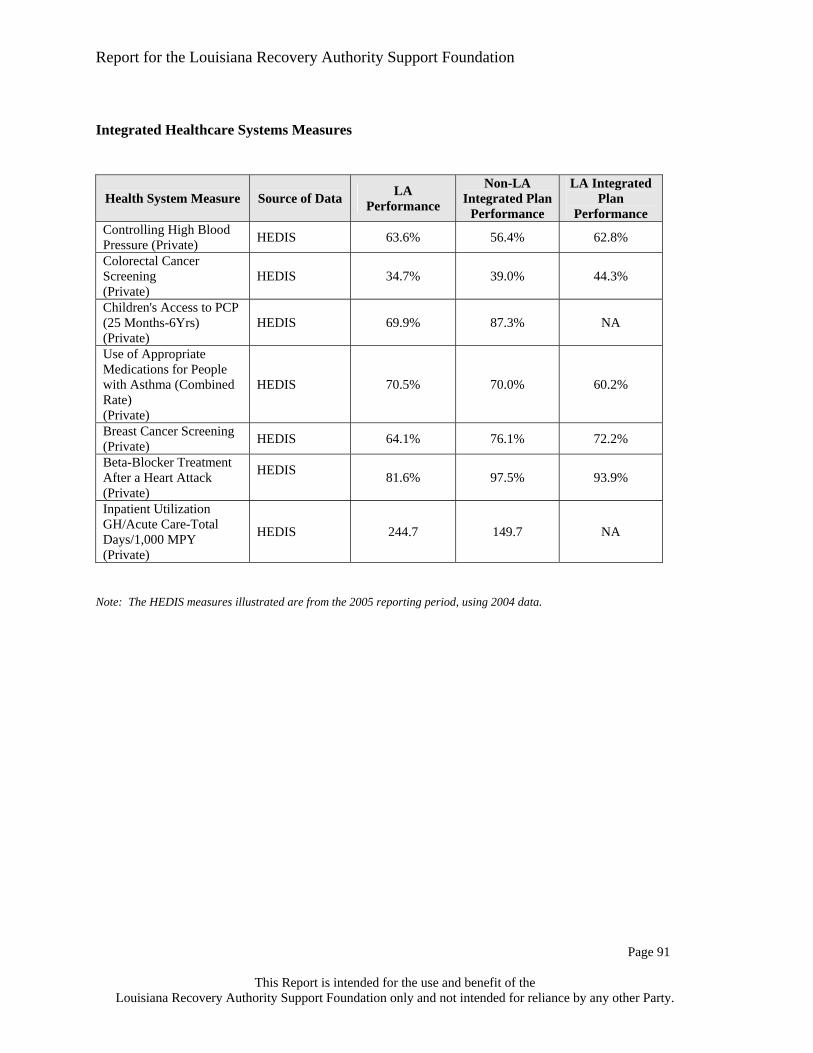
Report for the Louisiana Recovery Authority Support Foundation
Page 89
This Report is intended for the use and benefit of the
Louisiana Recovery Authority Support Foundation only and not intended for reliance by any other Party.
IOM Aim: Efficient
Health System Measure Source of Data LA Performance
U.S. Median
Benchmark
Top 25th U.S. Percentile
Benchmark
2004 Median CMI & Wage Index Adjusted Cost per Discharge (Hospital) 34
Ingenix $6,252 $5,534 (Median of all
states' medians)
$4,983
Inpatient Utilization - GH/Acute Care - Total Inpatient ALOS (Private)
HEDIS 3.83 3.64 3.41
Percentage of Prescriptions for which Generic substituted
CMS NA NA NA
Hospital Adjusted Expense Per Capita In-Patient Day, 2003
Kaiser $1,177 $1,371 $1,130
Note: The HEDIS measures illustrated are from the 2005 reporting period, using 2004 data. Visually, some key measures:
$4,000
$5,000
$6,000
$7,000
Adj. Cost per Discharge (CMI and Wage Adjusted)
Louisiana US Median Top 25%
3.2
3.3
3.4
3.5
3.6
3.7
3.8
3.9
4.0
Inpatient Acute Care - ALOS(Commercial/Private)
Louisiana US Median Top 25%
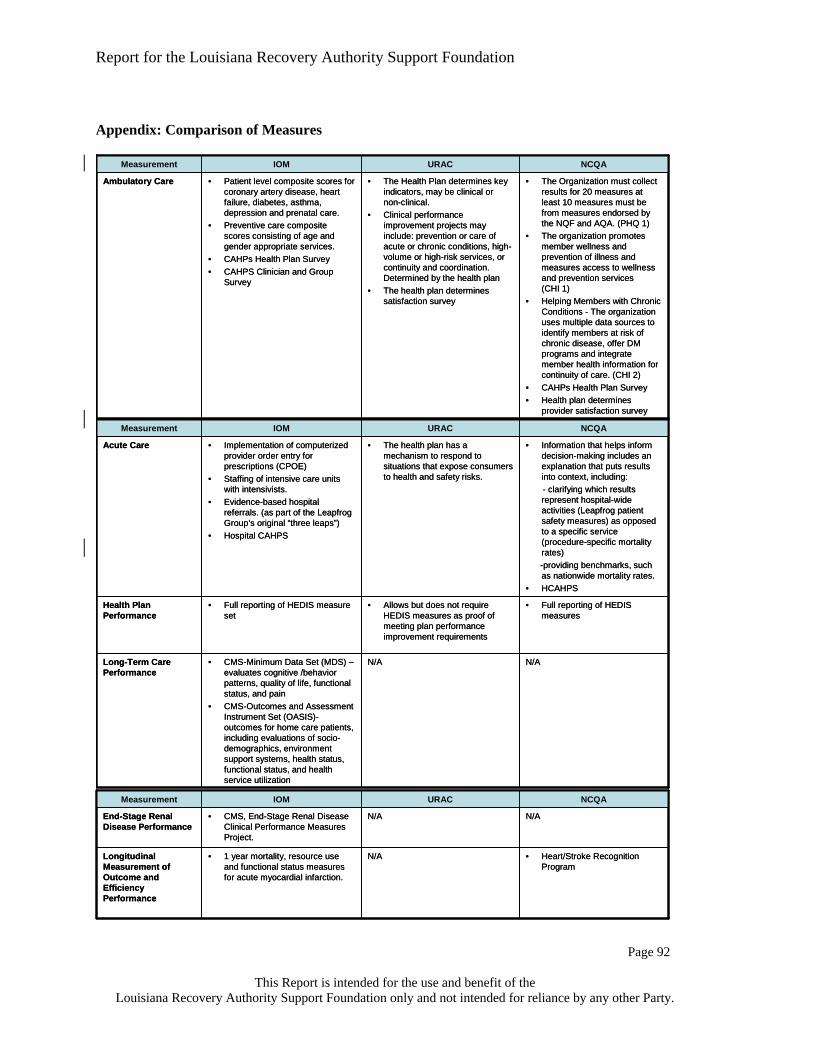
Report for the Louisiana Recovery Authority Support Foundation
Page 90
This Report is intended for the use and benefit of the
Louisiana Recovery Authority Support Foundation only and not intended for reliance by any other Party.
IOM Aim: Equitable
Health System Measure Source of Data
LA Performance
U.S. Median
Benchmark
Top 25th U.S. Percentile
Benchmark
Percentage of Population with any form of Insurance (private/commercial and public)
U.S. Census 2004
82.8% 84.3%
Diversity of Medicaid: Children Adults Elderly Blind/Disabled
HEDIS Total LA
60.3% 11.1% 10.7% 17.9%
Total U.S.
49.6% 25.6% 10.5% 14.2%
Children's Access to PCP (25 Months-6Yrs) (Private)
HEDIS 69.9% 89.1% 91.6%
Getting Needed Care (Private) 33
NCQA-HEDIS
79.4%
79.8%
83.3%
Customer Service Composite (Private) 33
CAHPS NCQA-HEDIS
71.0%
70.9%
74.8%
Note: The HEDIS measures illustrated are from the 2005 reporting period, using 2004 data. Visually, some key measures:
50%55%60%65%70%75%80%85%90%95%
100%
Privately Insured
Children's Access to PCPs (25 months to 6 years)
Louisiana US Median Top 25%
70%
75%
80%
85%
90%
Percent with Health Insurance
Louisiana US Median

Report for the Louisiana Recovery Authority Support Foundation
Page 91
This Report is intended for the use and benefit of the
Louisiana Recovery Authority Support Foundation only and not intended for reliance by any other Party.
Integrated Healthcare Systems Measures
Health System Measure Source of Data LA Performance
Non-LA Integrated Plan
Performance
LA Integrated Plan
Performance Controlling High Blood Pressure (Private) HEDIS 63.6% 56.4% 62.8%
Colorectal Cancer Screening (Private)
HEDIS 34.7% 39.0% 44.3%
Children's Access to PCP (25 Months-6Yrs) (Private)
HEDIS 69.9% 87.3% NA
Use of Appropriate Medications for People with Asthma (Combined Rate) (Private)
HEDIS 70.5% 70.0% 60.2%
Breast Cancer Screening (Private) HEDIS 64.1% 76.1% 72.2%
Beta-Blocker Treatment After a Heart Attack (Private)
HEDIS 81.6% 97.5% 93.9%
Inpatient Utilization GH/Acute Care-Total Days/1,000 MPY (Private)
HEDIS 244.7 149.7 NA
Note: The HEDIS measures illustrated are from the 2005 reporting period, using 2004 data.
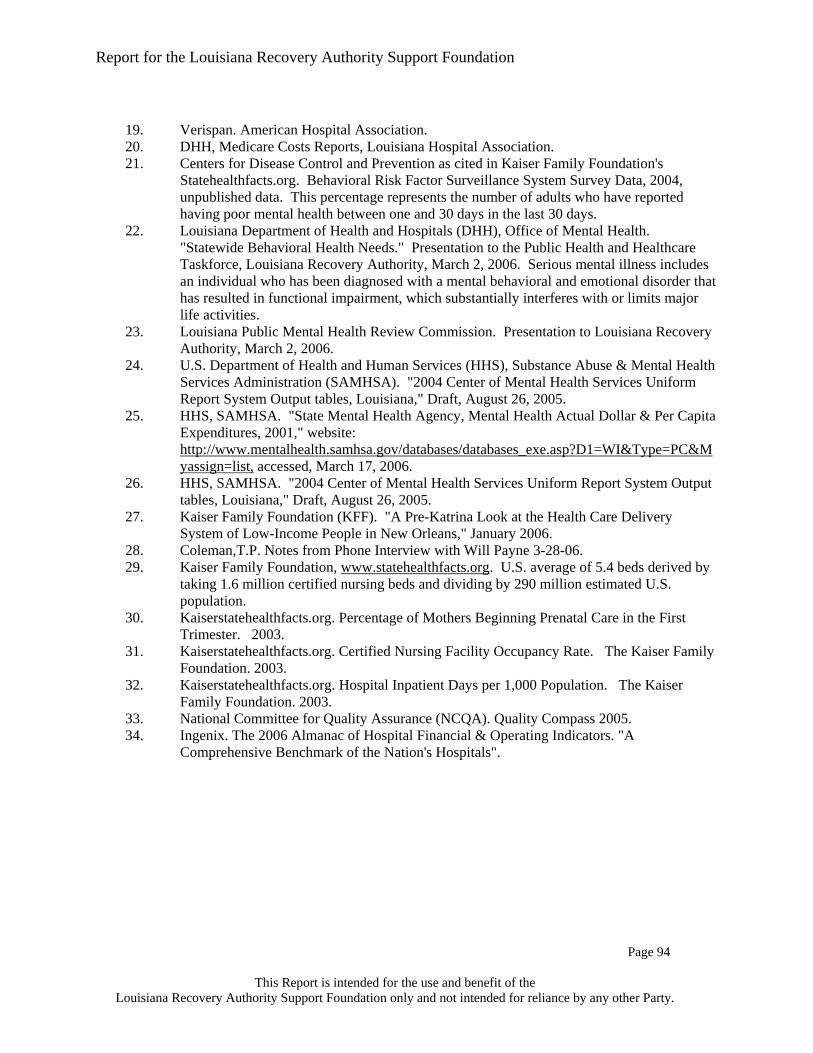
Report for the Louisiana Recovery Authority Support Foundation
Page 92
This Report is intended for the use and benefit of the
Louisiana Recovery Authority Support Foundation only and not intended for reliance by any other Party.
Appendix: Comparison of Measures
N/AN/A• CMS, End-Stage Renal Disease Clinical Performance Measures Project.
End-Stage Renal Disease Performance
• Heart/Stroke Recognition Program
N/A• 1 year mortality, resource use and functional status measures for acute myocardial infarction.
Longitudinal Measurement of Outcome and Efficiency Performance
NCQAURACIOMMeasurement
• The Organization must collect results for 20 measures at least 10 measures must be from measures endorsed by the NQF and AQA. (PHQ 1)
• The organization promotes member wellness and prevention of illness and measures access to wellness and prevention services (CHI 1)
• Helping Members with Chronic Conditions - The organization uses multiple data sources to identify members at risk of chronic disease, offer DM programs and integrate member health information for continuity of care. (CHI 2)
• CAHPs Health Plan Survey• Health plan determines
provider satisfaction survey
• The Health Plan determines key indicators, may be clinical or non-clinical.
• Clinical performance improvement projects may include: prevention or care of acute or chronic conditions, high-volume or high-risk services, or continuity and coordination. Determined by the health plan
• The health plan determines satisfaction survey
• Patient level composite scores for coronary artery disease, heart failure, diabetes, asthma, depression and prenatal care.
• Preventive care composite scores consisting of age and gender appropriate services.
• CAHPs Health Plan Survey• CAHPS Clinician and Group
Survey
Ambulatory Care
NCQAURACIOMMeasurement
• Information that helps inform decision-making includes an explanation that puts results into context, including:- clarifying which results represent hospital-wide activities (Leapfrog patient safety measures) as opposed to a specific service (procedure-specific mortality rates) -providing benchmarks, such as nationwide mortality rates.
• HCAHPS
• The health plan has a mechanism to respond to situations that expose consumers to health and safety risks.
• Implementation of computerized provider order entry for prescriptions (CPOE)
• Staffing of intensive care units with intensivists.
• Evidence-based hospital referrals. (as part of the Leapfrog Group’s original “three leaps”)
• Hospital CAHPS
Acute Care
N/AN/A• CMS-Minimum Data Set (MDS) –evaluates cognitive /behavior patterns, quality of life, functional status, and pain
• CMS-Outcomes and Assessment Instrument Set (OASIS)-outcomes for home care patients, including evaluations of socio-demographics, environment support systems, health status, functional status, and health service utilization
Long-Term Care Performance
• Full reporting of HEDIS measures
• Allows but does not require HEDIS measures as proof of meeting plan performance improvement requirements
• Full reporting of HEDIS measure set
Health Plan Performance
NCQAURACIOMMeasurement

Report for the Louisiana Recovery Authority Support Foundation
Page 93
This Report is intended for the use and benefit of the
Louisiana Recovery Authority Support Foundation only and not intended for reliance by any other Party.
Sources and Notes
1. Wennberg,J.E. Variation in Use of Medicare Services Among Regions and Select
Academic Medical Centers: Is More Better? Commonwealth Fund Publication 874, (2005). 2. Institute of Medicine (IOM). To Err Is Human: Building a Safer Health System. 2000. 3. Fisher,E.S. et al. The implications of regional variations in Medicare spending. Part 1: the
content, quality, and accessibility of care. Ann. Intern. Med. 138, 273-287 (2003). 4. Division of Healthcare Quality Promotion,National Center for Infectious Diseases,Centers
for Disease Control andPrevention. National Nosocomial Infections Surveillance (NNIS) System Report, data summary from January 1992 through June 2004, issued October 2004. Am.J.Infect.Control 32, 470-485. 2004.
5. CMS. Nursing Homes Compared, http://www.medicare.gov/NHCompared/Home.asp. 2005.
6. ** The Comprehensive Diabetes Care - HbA1c Control rates under HEDIS are reported as "poor" control. Rates illustrated above have been adjusted to reflect good (non-poor) control. The formula for "good" control = 100% - the "poor" control rate.
7. AHRQ Survey Data 2003. (1) The HEDIS measures illustrated are from the 2005 reporting period, using 2004 data. ** Adults 18 and over.
8. Baicker,K. & Chandra,A. Medicare spending, the physician workforce, and beneficiaries' quality of care. Health Aff. (Millwood. ) Suppl Web Exclusive, W184-W197 (2004).
9. Martin,A., Whittle,L., Levit,K., Won,G., & Hinman,L. Health care spending during 1991-1998: a fifty-state review. Health Aff. (Millwood. ) 21, 112-126 (2002).
10. Fisher,E.S. et al. The implications of regional variations in Medicare spending. Part 2: health outcomes and satisfaction with care. Ann. Intern. Med. 138, 288-298 (2003).
11. Asch,S.M. et al. Who is at greatest risk for receiving poor-quality health care? N. Engl. J. Med. 354, 1147-1156 (2006).
12. Middleton,S., Barnett,J., & Reeves,D. What is an integrated care pathway? Bandolier (www.ebandolier.com) . 2003.
13. Light,D. & Dixon,M. Making the NHS more like Kaiser Permanente. BMJ 328, 763-765 (2004).
14. Hiscock J & Pearson M. Looking inwards, looking outwards: dismantling the 'Berlin Wall' between health and social services? Social Policy and Administration 33, 150-163. 1999.
15. Source: Payor specific 2004 health spend by place of service relies upon the following information: 1. For Medicaid and Uninsured, the allocation of services was based upon the Louisiana Medicaid Report for SFY 2003-4. 2. For Medicare, the allocation of services was based upon the 2004 Medicare eligible Louisiana participants contained in PricewaterhouseCoopers proprietary claims database. 3. For Commercial, the allocation of services was based upon actuarial information provided a major health plan and 2004 annual statements provided by the Louisiana Department of Insurance.
16. The Public Policy Research Lab. Louisiana's Uninsured Population: A Report from the Louisiana Health Insurance Survey.
17. Solucient. 2006. 18. US Census. 2006.

Report for the Louisiana Recovery Authority Support Foundation
Page 94
This Report is intended for the use and benefit of the
Louisiana Recovery Authority Support Foundation only and not intended for reliance by any other Party.
19. Verispan. American Hospital Association. 20. DHH, Medicare Costs Reports, Louisiana Hospital Association. 21. Centers for Disease Control and Prevention as cited in Kaiser Family Foundation's
Statehealthfacts.org. Behavioral Risk Factor Surveillance System Survey Data, 2004, unpublished data. This percentage represents the number of adults who have reported having poor mental health between one and 30 days in the last 30 days.
22. Louisiana Department of Health and Hospitals (DHH), Office of Mental Health. "Statewide Behavioral Health Needs." Presentation to the Public Health and Healthcare Taskforce, Louisiana Recovery Authority, March 2, 2006. Serious mental illness includes an individual who has been diagnosed with a mental behavioral and emotional disorder that has resulted in functional impairment, which substantially interferes with or limits major life activities.
23. Louisiana Public Mental Health Review Commission. Presentation to Louisiana Recovery Authority, March 2, 2006.
24. U.S. Department of Health and Human Services (HHS), Substance Abuse & Mental Health Services Administration (SAMHSA). "2004 Center of Mental Health Services Uniform Report System Output tables, Louisiana," Draft, August 26, 2005.
25. HHS, SAMHSA. "State Mental Health Agency, Mental Health Actual Dollar & Per Capita Expenditures, 2001," website: http://www.mentalhealth.samhsa.gov/databases/databases_exe.asp?D1=WI&Type=PC&Myassign=list, accessed, March 17, 2006.
26. HHS, SAMHSA. "2004 Center of Mental Health Services Uniform Report System Output tables, Louisiana," Draft, August 26, 2005.
27. Kaiser Family Foundation (KFF). "A Pre-Katrina Look at the Health Care Delivery System of Low-Income People in New Orleans," January 2006.
28. Coleman,T.P. Notes from Phone Interview with Will Payne 3-28-06. 29. Kaiser Family Foundation, www.statehealthfacts.org. U.S. average of 5.4 beds derived by
taking 1.6 million certified nursing beds and dividing by 290 million estimated U.S. population.
30. Kaiserstatehealthfacts.org. Percentage of Mothers Beginning Prenatal Care in the First Trimester. 2003.
31. Kaiserstatehealthfacts.org. Certified Nursing Facility Occupancy Rate. The Kaiser Family Foundation. 2003.
32. Kaiserstatehealthfacts.org. Hospital Inpatient Days per 1,000 Population. The Kaiser Family Foundation. 2003.
33. National Committee for Quality Assurance (NCQA). Quality Compass 2005. 34. Ingenix. The 2006 Almanac of Hospital Financial & Operating Indicators. "A
Comprehensive Benchmark of the Nation's Hospitals".

Report for the Louisiana Recovery Authority Support Foundation
Page 95
This Report is intended for the use and benefit of the
Louisiana Recovery Authority Support Foundation only and not intended for reliance by any other Party.
SECTION III: WORKFORCE AND MEDICAL EDUCATION
Introduction Workforce is the largest single component within the healthcare cost structure. Since Louisiana faces some of the highest per capita costs and lowest overall healthcare status within the United States, it makes sense to analyze the array of healthcare professionals needed to meet the goals of the IOM, as discussed in Section II. An underlying theme for the redesign of the workforce and graduate medical education is based upon the need for community-driven healthcare. This involves a decentralization of where care has traditionally been provided in Louisiana. A redesign and realignment of undergraduate and graduate medical education in Louisiana will support this primary objective for the healthcare workforce. The urgency of this workforce redesign and medical education realignment has been exacerbated and emphasized by the two hurricanes that have hit Louisiana.
There is no question that the hurricanes have had a great impact on workforce and medical education. According to the HealthLeaders December 2005 Report on New Orleans, Katrina is responsible for dislocating 6,000 physicians and 1,300 medical residents from Tulane and LSU.1 Although the validity of this estimate cannot be commented on due to the lack of available accurate data, it does provide some insight regarding the magnitude of the situation. Due to the constant movement of the population, concrete figures regarding the medical and allied health shortages are difficult to come by. In their March 28, 2006 publication titled: “Hurricane Katrina: Status of the Health Care System in New Orleans and Difficult Decisions Related to Efforts to Rebuild It Approximately 6 Months After Hurricane Katrina” even the Government Accountability Office (GAO) admits that they were unable to obtain estimates regarding how many physicians are still in the affected areas, although they do report that there is a distinct shortage of support staff in New Orleans hospitals.2
Research The redesign of the workforce is driven by several key variables: population estimates for the state of Louisiana, physician and allied health professional levels, physician and allied health professional salary levels and disease prevalence rates. This information was benchmarked against selected best practice “benchmark states” as well as “neighboring states” to create models for staffing levels and geographic distribution of a redesigned healthcare workforce. The following six states were identified as the benchmark states:
Benchmark states were selected based on their overall 2004 healthcare rankings as defined by the United Health Foundation and the fact that each of the states selected has a state medical school. In addition to the benchmark states, several of the salary analyses were performed on what was defined as neighboring states:
Report for the Louisiana Recovery Authority Support Foundation
Page 96
This Report is intended for the use and benefit of the
Louisiana Recovery Authority Support Foundation only and not intended for reliance by any other Party.
Benchmark State
United Health Foundation
2004 Ranking
Minnesota 1Vermont 3Utah 5Connecticut 8Iowa 11Kansas 16
Source: United Health Foundation
Section 3 Exhibit 1. Benchmark State Rankings
Neighboring State
United Health Foundation
2004 Ranking
Alabama 43Arkansas 46Florida 42Georgia 45Mississippi 49Missouri 36Oklahoma 40Texas 35
Source: United Health Foundation
Section 3 Exhibit 2. Neighboring State Rankings
Neighboring states were used exclusively in salary comparisons; it is assumed that these are the states with which Louisiana is competing for healthcare professionals. Finally, national best practices for recruitment and retention of physicians, nurses and allied health professionals were accumulated to develop a focused strategy for Louisiana. In developing the recommendations for Undergraduate Medical Education (UME) and Graduate Medical Education (GME), two sets of medical schools were relied upon to develop benchmarks. The primary benchmarks were the University of Washington and University of North Dakota; the secondary benchmarks were the University of Alabama and Michigan State University. The reasons for selection of these medical schools as benchmarks are included in the next chart.

Report for the Louisiana Recovery Authority Support Foundation
Page 97
This Report is intended for the use and benefit of the
Louisiana Recovery Authority Support Foundation only and not intended for reliance by any other Party.
Medical School Background (1) University of Washington
U of W has a very strong reputation for training primary care physicians and for conducting high-quality biomedical research. It is ranked #1 in primary care and rural medicine, and was #1 in National Institutes of Health (NIH)[1] grant-funding for public schools in 2005. U of W also has a decentralized, community-based campus model that spans 5 states.
University of North Dakota UND is ranked #3 in rural health, which is the highest of all Community-Based[2] medical schools.
University of Alabama Located in a neighboring state, it has a strong reputation for primary care and research. It is ranked #32 in primary care and #23 in NIH research funding.
Michigan State University MSU has the highest primary care ranking of a Community Health medical school, with a ranking of 30. It also has a decentralized, community-based model of healthcare.
Source: US News and World Report Medical School Rankings, 2005. [1] The NIH ranking is a widely recognized measure of the quality of research performed at a medical school. [2] There are currently 18 Community-Based medical schools. These medical schools rely on community hospitals for clinical faculties and have the tendency to have a strong focus on both primary care and rural medicine.
Key Findings and Recommendations Key Finding: The two-system care model in Louisiana has impacted the adequacy of funding for LSU’s graduate medical education program (residency training or GME) and the quality of the experience for its trainees.
Recommendation 10: LSU’s hospitals should disperse its displaced resident physicians (both primary and specialty) to hospitals with a higher percentage of Medicare patients. LSU’s hospitals should also assess all of its teaching options – without compromising the care of patients or its teaching mission – to implement a strategy of improved exposure to all segments of the population and increased Medicare funding support of GME throughout the state. This could include special waivers from the Medicare program allowing innovative new ways of funding graduate medical education, and these options should be investigated. Key Finding: Compared to benchmark states, the healthcare workforce has a shortage of primary care physicians and an oversupply of specialty physicians who are concentrated in New Orleans, Shreveport and Baton Rouge while leaving the rest of the state in short supply. There are sufficient medical students in the state, but likely an impending need for more doctors due to an aging population. There is a shortage of registered nurses (RNs), physicians' assistants and other allied health professionals, with an oversupply of licensed practical nurses (LPNs). Residency training positions are located disproportionately in New Orleans, with too few primary care residents.
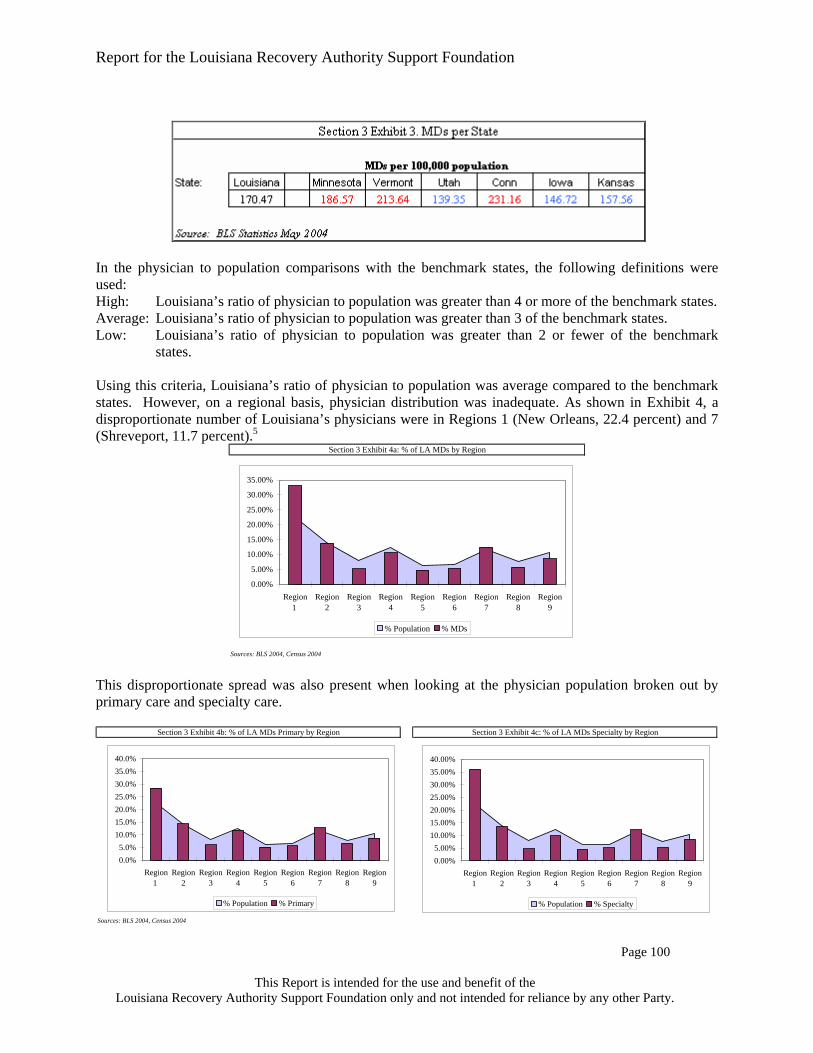
Report for the Louisiana Recovery Authority Support Foundation
Page 98
This Report is intended for the use and benefit of the
Louisiana Recovery Authority Support Foundation only and not intended for reliance by any other Party.
Recommendation 11: LSU should comprehensively review its strategy of producing physicians for the state of Louisiana from the recruitment of medical students, residency training, to post-training physician retention to assure the state of the right supply and balance of primary and specialty physicians for the next generation. This study should closely consider the heavier burden of debt incurred by Louisiana medical students, the medical needs of Louisianans, the demographics and location of the population and the commitment of Tulane and Ochsner to Region 1. This strategic plan could be approved by the end of 2006 with implementation no later than 2008. Recommendation 12: The state should focus on retaining existing and recruiting new physicians and allied healthcare professionals such as nurses, LPNs, physician assistants, etc. While there are several programs currently in place, the state should expand and align them under a comprehensive plan to assure the adequacy of supply for the future. An immediate opportunity is career laddering of LPNs to RNs, and incentives could be provided to encourage these activities. Programs for physician assistants and nurse practitioners should be created and/or expanded to help offset the need for primary care physicians. This will likely require more infrastructure and faculty to support these activities.

Report for the Louisiana Recovery Authority Support Foundation
Page 99
This Report is intended for the use and benefit of the
Louisiana Recovery Authority Support Foundation only and not intended for reliance by any other Party.
WORKFORCE
Workforce Planning Workforce planning is about having the right people in the right place at the right time, all the time. The purpose of workforce planning is not to decide what will be done in the future; it is about determining what can be done now to be best prepared for the future. Workforce planning is a continuous process that will give Louisiana officials a framework in which to shape the workforce based on the established mission, the existing financial resources and the desired workforce makeup. The steps to workforce planning are: 1. Identifying future workforce needs and capabilities
as derived from the strategic plan. 2. An analysis of current staff numbers and
capabilities. 3. An analysis of available and estimated funding
levels 4. Identifying the estimated gap between current and
future workforce needs. The Louisiana healthcare workforce has a significant impact on Louisiana’s economy. Prior to the hurricanes, 8.8 percent of the state’s employment base worked in the healthcare industry. Nationally, healthcare and social assistance only account for approximately 7.7 percent of all employment.3 While an abundance of healthcare professionals can be an economic boost, it also can increase utilization of services, which increases overall healthcare costs. The Health Works Commission data also shows that in 2003, Louisiana had 11,000 unfilled statewide healthcare openings.4 This perceived shortage of healthcare workers is cited as one of the factors leading to Louisiana’s low overall health status. To better understand Louisiana’s workforce status and its potential impact on the state’s health status, the Healthcare Taskforce looked into two components of the healthcare workforce: medical and allied health.
Medical Workforce Issues Pre-Katrina, there were 7,698 physicians practicing in the state of Louisiana,4 which amounts to 170.47 physicians per 100,000 population. When comparing this ratio to the benchmark states using 2004 data, this ratio was higher than three of the six states.

Report for the Louisiana Recovery Authority Support Foundation
Page 100
This Report is intended for the use and benefit of the
Louisiana Recovery Authority Support Foundation only and not intended for reliance by any other Party.
In the physician to population comparisons with the benchmark states, the following definitions were used: High: Louisiana’s ratio of physician to population was greater than 4 or more of the benchmark states. Average: Louisiana’s ratio of physician to population was greater than 3 of the benchmark states. Low: Louisiana’s ratio of physician to population was greater than 2 or fewer of the benchmark
states. Using this criteria, Louisiana’s ratio of physician to population was average compared to the benchmark states. However, on a regional basis, physician distribution was inadequate. As shown in Exhibit 4, a disproportionate number of Louisiana’s physicians were in Regions 1 (New Orleans, 22.4 percent) and 7 (Shreveport, 11.7 percent).5
Sources: BLS 2004, Census 2004
Section 3 Exhibit 4a: % of LA MDs by Region
0.00%
5.00%
10.00%
15.00%
20.00%
25.00%
30.00%
35.00%
Region1
Region2
Region3
Region4
Region5
Region6
Region7
Region8
Region9
% Population % MDs
This disproportionate spread was also present when looking at the physician population broken out by primary care and specialty care.
Sources: BLS 2004, Census 2004
Section 3 Exhibit 4b: % of LA MDs Primary by Region Section 3 Exhibit 4c: % of LA MDs Specialty by Region
0.0%5.0%
10.0%15.0%20.0%25.0%30.0%35.0%40.0%
Region1
Region2
Region3
Region4
Region5
Region6
Region7
Region8
Region9
% Population % Primary
0.00%5.00%
10.00%15.00%20.00%25.00%30.00%35.00%40.00%
Region1
Region2
Region3
Region4
Region5
Region6
Region7
Region8
Region9
% Population % Specialty

Report for the Louisiana Recovery Authority Support Foundation
Page 101
This Report is intended for the use and benefit of the
Louisiana Recovery Authority Support Foundation only and not intended for reliance by any other Party.
Looking at the percentage of population and physicians by regions, there are regions with high levels of physician staffing and regions with below-average levels. The second step was to analyze the physician specialty to population ratios of Louisiana in comparison to the benchmark states. Using the comparison criteria described above, the ratio to population for each physician specialty was sorted into high, average and low categories. In 2004 Louisiana only has four medical specialties in which it had a lower per capita presence when compared with the benchmark states. Of the four, one was a primary care specialty (General and Family Practice). There were 20 specialties in Louisiana that have a higher-per-capita presence when compared to the benchmark states. Of these specialties, one was a primary care specialty (Pediatrics).
To further understand these numbers, the ratio of primary care physicians and specialty physicians by each region using 2004 data was analyzed. As the following region-specific breakdown shows, Region 1 (New Orleans) had a high overall physician to population ratio; it was the only such region. All other

Report for the Louisiana Recovery Authority Support Foundation
Page 102
This Report is intended for the use and benefit of the
Louisiana Recovery Authority Support Foundation only and not intended for reliance by any other Party.
eight regions were either average or low for all physician specialties. Regions 1 (New Orleans), 2 (Baton Rouge) and 7 (Shreveport) were classified as having a high specialty physician to population ratio. No region has a high ratio of primary care physicians to population. This finding is supported by the analysis above, which shows that Region 1 (and to a lesser extent Region 7) had a high percentage of Louisiana’s Primary and Specialty MD pool (Exhibit 4A and 4B).
Based on this breakout, it appears that Louisiana had a high concentration of specialty physicians in Region 1 (New Orleans), Region 2 (Baton Rouge) and Region 7 (Shreveport). This finding is not unexpected, due to the high concentrations of medical facilities and academic medical centers in these regions. These three regions, with their high specialty physician count, are creating a distorted image of the state as a whole. The majority of the state has a shortage of specialty care physicians, as well as primary care physicians, but the shortage was being hidden due to physician over-concentration in these regions. To determine the causes of this shortage, the analysis expanded to salary levels. The annual mean salary of Louisiana’s physicians was compared to those in neighboring states. If Louisiana’s salary for that specialty was 10 percent greater than a neighboring state’s, it was indicated that Louisiana’s salary for that specialty was high versus that state. If Louisiana's salary was 10 percent lower than a neighboring state’s, it was indicated that Louisiana’s salary for that specialty was low versus that state. This information was then combined and Louisiana physician salary levels were placed into high, low and average categories: Low: If Louisiana ranked low versus four or more neighboring states, it was concluded that
Louisiana’s salary was low for that specialty. High: If Louisiana ranked high versus four or more neighboring states, it was concluded that
Louisiana’s salary was high for that specialty. Average: In all other instances, it was concluded that Louisiana’s salary was average for that specialty.
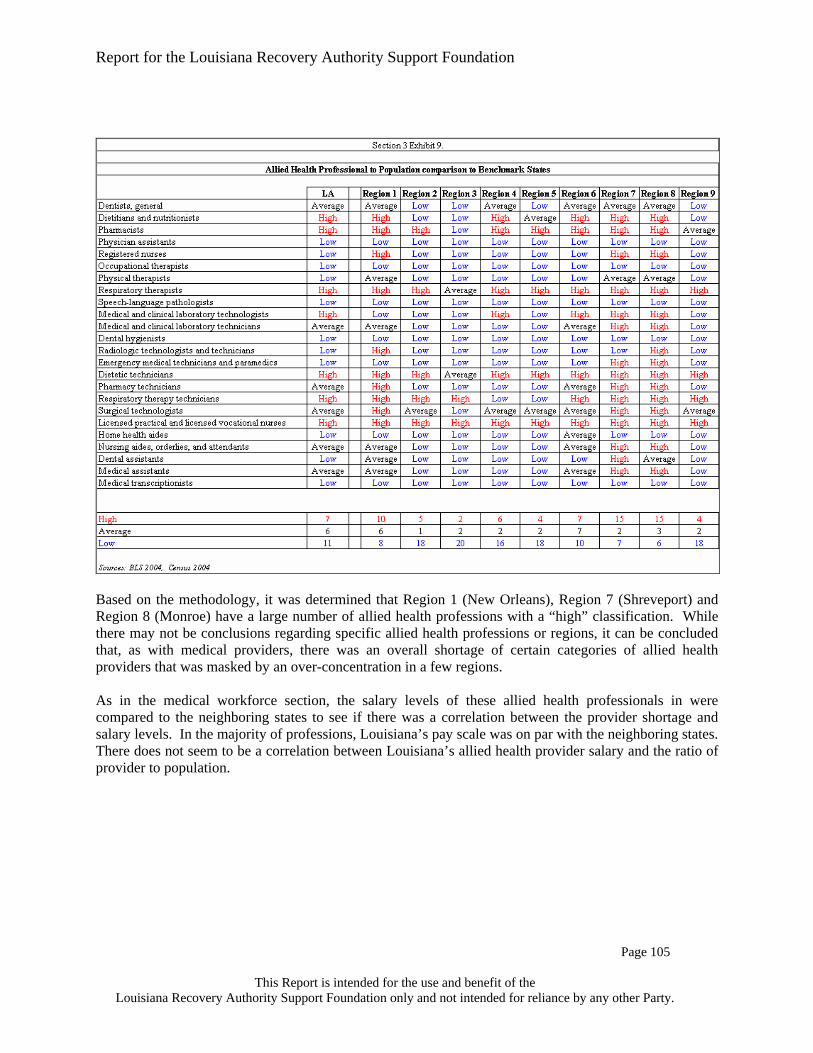
Report for the Louisiana Recovery Authority Support Foundation
Page 103
This Report is intended for the use and benefit of the
Louisiana Recovery Authority Support Foundation only and not intended for reliance by any other Party.
With the exception of anesthesiology, Louisiana’s salary levels were either on par or higher than the neighboring states. Although the statewide data indicated that there was no salary gap, there is hesitancy in making this conclusion for individual regions. The data used for this analysis was obtained from the Bureau of Labor Statistics (BLS), which does not provide information at a region-by-region level, and the salary data may be skewed higher by the high concentration of physicians affiliated with the academic and medical facilities located in Baton Rouge, New Orleans and Shreveport. The 2004 BLS data does indicate that on a state-wide level, there was no salary gap with the neighboring states. C
Allied Health Workforce Issues According to the BLS, half of the 30 fastest-growing occupations in the entire labor market are in allied health.6 The reasons vary. For example, these positions are typically hands-on jobs that are less vulnerable to international competition, more resistant to economic recession and not susceptible to outsourcing trends currently seen in manufacturing and other sectors. Studies have also shown that rural areas rely more on allied health providers for care than in urban areas.7 In using the same methodology as medical workforce on allied health, a different picture emerged. The following chart shows how Louisiana’s allied health provider to population ratio compared to the benchmark states in 2004.

Report for the Louisiana Recovery Authority Support Foundation
Page 104
This Report is intended for the use and benefit of the
Louisiana Recovery Authority Support Foundation only and not intended for reliance by any other Party.
This chart shows Louisiana was lacking in several allied health professionals that traditionally are associated with primary and preventative care (registered nurses and physician assistants.) The only allied health professional generally associated with primary care in which Louisiana has a higher ratio, when compared to its neighboring states, was Licensed Practical Nurses (LPNs). The allied health profession data used in this analysis was obtained from the BLS and does not go into Region-specific detail. In the following analysis, the supply of allied health providers was distributed across the regions based on the number of hospital beds in each region, assuming that there was a correlation between allied health density in a geographic area and the size of hospital facilities. This is an imperfect methodology, but the assumption is strong enough to provide additional insights regarding the Allied Health professional staffing levels. The population was compared to provider ratios of the Allied Health Professions to the rates of the Benchmark states and determined if Louisiana was high, average or low in comparison (using the previously discussed methodology with 2004 data).

Report for the Louisiana Recovery Authority Support Foundation
Page 105
This Report is intended for the use and benefit of the
Louisiana Recovery Authority Support Foundation only and not intended for reliance by any other Party.
Based on the methodology, it was determined that Region 1 (New Orleans), Region 7 (Shreveport) and Region 8 (Monroe) have a large number of allied health professions with a “high” classification. While there may not be conclusions regarding specific allied health professions or regions, it can be concluded that, as with medical providers, there was an overall shortage of certain categories of allied health providers that was masked by an over-concentration in a few regions. As in the medical workforce section, the salary levels of these allied health professionals in were compared to the neighboring states to see if there was a correlation between the provider shortage and salary levels. In the majority of professions, Louisiana’s pay scale was on par with the neighboring states. There does not seem to be a correlation between Louisiana’s allied health provider salary and the ratio of provider to population.

Report for the Louisiana Recovery Authority Support Foundation
Page 106
This Report is intended for the use and benefit of the
Louisiana Recovery Authority Support Foundation only and not intended for reliance by any other Party.
Nursing Because nursing is the single biggest area of the healthcare workforce, further analysis on this area was performed. According to the Louisiana Health Works Commission, registered nurses (RNs) are the occupation in highest demand. This is not unusual. Most hospitals and healthcare organizations struggle with nursing shortages. Using the BLS data and the benchmarking and region allocation methodology, it is estimated that the highest expected demand for RNs, based on 2004 actual data adjusted for the middle future population scenario, is approximately at 40,900, with the expected demand for LPNs at approximately 15,400.

Report for the Louisiana Recovery Authority Support Foundation
Page 107
This Report is intended for the use and benefit of the
Louisiana Recovery Authority Support Foundation only and not intended for reliance by any other Party.
Due to the BLS data not being region specific, the Louisiana State Board of Nursing was approached for more detailed information. Using data obtained from the Board, the ratio of RNs to population was compared to the benchmark states. (Note: This data will not match the data presented above and in the previous section, which uses BLS data and extrapolates the regional distribution based on the percentage of hospital beds in that region. This 2004 information was based on information compiled by the Louisiana State Board of Nursing; the regional breakdown is actual.)
RN levels in Louisiana generally follow the population levels. Similar to physician distribution, there are areas with a disproportionate share of RNs and areas with a distinct lack of RNs. Nursing ratios are high in Regions 6 (Alexandria), 7 (Shreveport) and 9 (Covington Slidell). Interestingly, the higher concentrations of RNs appear in areas with both high and low concentrations of physicians (i.e.: Region 1 (33 percent MDs and 22.9 percent RNs) and Region 9 (8.6 percent MDs and 10.6 percent RNs.)) This bi-modal distribution is attributed to the versatility of RNs. In areas where there are large numbers of doctors, nurses are widely sought after to assist physicians in their traditional roles. However, in areas where there are lower numbers of physicians, nurses are looked to as ‘physician extenders’ and used to supplement care.

Report for the Louisiana Recovery Authority Support Foundation
Page 108
This Report is intended for the use and benefit of the
Louisiana Recovery Authority Support Foundation only and not intended for reliance by any other Party.
Sources: Louisiana State Board of Nursing 2005, BLS 2004, Cencus 2004
Section 3 Exhibit 13: % of MDs, RNs, and Population, by Region
0.0%5.0%
10.0%15.0%20.0%25.0%30.0%35.0%40.0%
Reg
ion
1
Reg
ion
2
Reg
ion
3
Reg
ion
4
Reg
ion
5
Reg
ion
6
Reg
ion
7
Reg
ion
8
Reg
ion
9
% Population
% RNs% Primary% Specialty
Currently, there are nine associate degree nursing programs, 13 baccalaureate programs and one diploma program for nursing in Louisiana (See Appendix for details.) To meet the growing need for RNs, these institutions have increased the number of students enrolled and the number of nurses graduated over the last several years. However, at the current rate, this growth may not be enough to eliminate the existing shortage and meet future demand. In 2004, of the 41,211 in-state RNs, 22,849 (55.4 percent) were over the age of 40 and nearing the age of retirement. The replacement cohort, RNs under 30, accounts for only 6,336 (15.4 percent).
Source: Louisiana State Board of Nursing 2005
Section 3 Exhibit 14: Nursing Applicants, Admissions, and Graduates
0
500
1000
1500
2000
2500
3000
3500
4000
2001 2002 2003 2004
Qualified ApplicantsAdmissionsGraduates
Even as Louisiana nursing schools try to increase throughput, they are turning away larger and larger numbers of qualified students because of a lack of faculty, according to the Louisiana State Nursing Association. The cause for this faculty shortfall is two-fold. First, the average age of Louisiana’s nursing faculty was 52; as more and more faculty members retire, there are not enough trained nurses to replace them. Second, salaries for nurses with master’s degrees are a great deal higher in the private sector than in academia. This has resulted in fewer and fewer nurses going into teaching as a profession.8

Report for the Louisiana Recovery Authority Support Foundation
Page 109
This Report is intended for the use and benefit of the
Louisiana Recovery Authority Support Foundation only and not intended for reliance by any other Party.
Recruitment and Retention Problems with maintaining a proper workforce are not unique to Louisiana or the healthcare field. As a nation, there is increasing difficulty in meeting the needs of a growing and shifting population. The U.S. labor force is aging; at the same time, fewer young people are entering the workforce. The implications for the national workforce are more retirements, escalating compensation and benefit costs and higher recruiting expenses. To mitigate this trend, the United States has begun to rely more on immigration, off-shoring of work, extending retirement and trying to increase worker productivity. This trend exists in healthcare as well.
Sources: BLS 2004,; SSA
Section 3 Exhibit 15: US Workforce Demograpics by Age
0% 5% 10% 15% 20% 25% 30%
Under 25
25 to 34
35 to 44
45 to 54
55+
Age
Bra
cket
% of Workforce
201020001990
In addition to the aging workforce creating a labor shortage, the high costs associated with replacing workers cannot be ignored. On a national level, a 1 percent reduction in turnover increases revenues by 0.4 percent; the replacement cost (comprising of the cost of the vacancy, recruiting /new hire costs and the cost of on-boarding) is approximately $25,000 per employee. This number does not take into consideration the loss of intellectual capital and relationships. The top five reasons high performers leave are:
Dissatisfaction with pay Dissatisfaction with management Inadequate promotion opportunities Inadequate opportunities to develop skills Dissatisfaction with benefits
In planning for the redesign of Louisiana, it is important to establish policies that mitigate these issues. The state should consider the following areas:
Compensation levels are tied to skills and competencies and to evaluate pay progression. Benefits are restructured to encourage the workforce to stay employed beyond retirement age
through the provision of phased retirement, part-time eligibility for benefits and include long-term care.
Training programs, including reimbursement and mentoring to develop and grow staff. Flexible work schedules to meet the changing needs of the population and workforce. Work environment redesign to increase access to an aging workforce.

Report for the Louisiana Recovery Authority Support Foundation
Page 110
This Report is intended for the use and benefit of the
Louisiana Recovery Authority Support Foundation only and not intended for reliance by any other Party.
In analyzing the needs of Louisiana, the state should consider the workforce restructuring as two distinct tasks: The first task involves focusing specifically on coping with the effects of Katrina. During this time, the main goal is to ensure that basic healthcare services are available in the heavily affected areas for returning residents and temporary workers. The Rand Corporation Study identifies two types of workers who would be willing to work in the current, less than optimal conditions. The first are the "mercenaries" that are attracted by high financial incentives and the challenge of working in a rapidly changing environment. The second are the "idealists" who are attracted by the possibility of making a meaningful difference.9 Little time will be spent addressing the first task; the pressing need for physicians and allied health providers and the existing national shortage of qualified individuals preclude “policy designs.” It is only suggested that, in an effort to retain existing physicians who were displaced by the hurricane, an effort could be made to assist providers in finding reimbursement for the uncompensated care provided in Katrina’s aftermath. This first task affects Louisiana as a whole, not just the affected areas. There is a distinct lack of current information regarding the exact effect Katrina has had on the healthcare workforce. There is, however, an interesting trend. When Katrina initially hit, many of the hospitals and businesses kept their workforce on their payrolls, not anticipating the protracted population displacement and rebuilding effort. Areas outside of the highly affected areas saw their workload increase as the out-migration from the affected areas increased, but the provider levels remained constant as recruitment efforts were stymied due to the displaced workforce still being officially employed. Only recently, have these providers begun to look for other employment. This may be an opportunity to move providers into underserved areas. The second task is to address the workforce which will have the greatest impact on the overall health status of Louisiana. It is here that the Taskforce focused the majority of its attention. The Healthcare Taskforce has received many suggestions regarding workforce issues, including income guarantees, housing stipends and other financial incentives to draw physicians into the affected areas. The underlying theme for all of these suggestions is simple: Louisiana could get physicians to work in the affected areas, and there should be incentives to encourage this to occur. The problem with these suggestions is that they are short-term focused. Financial benefits designed to draw out-of-state physicians are extremely costly and tend not attract the type of healthcare providers that will stay long term. Prior to Katrina, the healthcare in Louisiana already experienced challenges. Hurricane Katrina did exacerbate and emphasize problems, but it did not create them. Longer-term solutions to the overall healthcare problems within Louisiana are being sought. Here, the Taskforce is presenting its findings regarding long-term workforce redevelopment. Specific to Louisiana, it is important to focus efforts toward retention of healthcare providers who live in the state. While attracting out-of-state employees is the most thought-of and immediate solution, the cost of recruitment and retention of out-of-state employees is considerably higher than that of those instate. According to the Morgan Quitno “16th Annual Most Livable State 2006” report,10 Louisiana is ranked 50th in ‘livability ranking’. This ranking takes into consideration a list of 44 socio-economic, health status and environmental factors. This perception of Louisiana increases the difficulty in recruiting out-of-state workers, requiring even higher pay levels to compensate for the distorted perception of Louisiana’s quality of life. Employees from within the state are more likely to remain in a geographical location due to pre-existing social and familial ties. These people are also the ones with the greatest first-hand knowledge of the cultural issues and specific needs of the community.9 The retention needs of Louisiana can be addressed in two phases: Short term (less than 2 years) financial incentives can be effective in

Report for the Louisiana Recovery Authority Support Foundation
Page 111
This Report is intended for the use and benefit of the
Louisiana Recovery Authority Support Foundation only and not intended for reliance by any other Party.
attracting physicians, but will become less so over time as neighboring states adopt similar strategies and Louisiana loses its competitive advantage. Long term, Louisiana could focus on changes that will make Louisiana an attractive place to work, compared to the neighboring states. Physicians: The data presented in the earlier sections of this paper indicate that Louisiana has severe
physician shortages in many of its regions. Although this shortage encompasses both primary and specialty physicians, ameliorating the shortage of primary care physicians will have the greatest impact on health status according to a recent study published in the American Journal of Public Health which found that "counties with higher availability of primary care resources experienced between two and three percent lower mortality than counties with less primary care.11" Short term, the primary tool that can be used to bring physicians into these underserved areas is loan repayment. When compared to the neighboring states, medical school graduates in Louisiana have the highest level of debt. Loan repayment programs targeting in-state medical educational institutions will focus on the population most likely to stay in Louisiana and be more willing to work in local communities. Currently, Louisiana has a tax incentive of $5,000 per year (up to three years) for physicians who work in underserved areas. This is not enough of an incentive. Physicians working for health centers or other health institutions can leverage federal programs such as the National Health Service Corps, which offers loan repayment of up to $30,000 for providers who work in Medically Underserved Areas (MUAs); this benefit is not available to private practicing physicians. These types of benefits could be increased and broadened to encourage private physicians to move into these underserved areas; a physician will be more willing to leave an employer after their loan obligations have been met, but a private physician who has spent the last three years building a private practice will be more likely to stay. The majority of existing Federally Qualified Health Centers (FQHCs) that open in rural areas tend to recruit from outside of that area and do not talk with the local physicians in the area.12 Rather than try to bring in outsiders, a better approach may be to create partnerships with the existing physicians in that area.
One strategy to bolster the effectiveness of such a financial program is to increase funding to rural recruiting activities. One example is the ongoing relationship between MedJob Louisiana and the Northern Louisiana Area Health Education Center (NLAHEC). The NLAHEC’s mission is to bring healthcare education and resources to rural and underserved communities throughout North Louisiana. MedJob uses funding from the State Office of Rural Medicine to collaboratively work with NLAHEC to recruit physicians for underserved areas. This service, normally costing between $25,000 to $50,000 per physician placed, is provided for free in Health Professional Shortage Areas (HPSAs). Over the last three years, this program has placed 75 physicians in underserved areas across Northern Louisiana, with only one physician leaving (a retention rate of almost 99 percent).12
Long term, Louisiana could focus on growing its own physician pool. Louisiana could look toward developing scholarship programs in local schools that are tied to commitments to work in underserved areas of Louisiana to entice potential medical students to train in then return to work in the state. Similar to the activities currently undertaken by the AHECs, junior-high and high-school students from the underserved regions could be educated regarding potential careers in the healthcare field in general. If

Report for the Louisiana Recovery Authority Support Foundation
Page 112
This Report is intended for the use and benefit of the
Louisiana Recovery Authority Support Foundation only and not intended for reliance by any other Party.
these individuals are identified as being interested in entering the field, the state could work with them, local colleges, local medical schools and regional hospitals to assist with loans, scholarships and a simplified application process. Louisiana should research and work on methods to modify the current framework for primary care. Nationally, primary care physicians are finding their workload growing with increasing administrative and bureaucratic demands and complex patients, while facing declining reimbursement rates. This trend needs to be changed; otherwise Louisiana and the rest of the country will face an even greater shortage of primary care physicians. Finally, Louisiana could become a place that is attractive for a physician to practice. These medical initiatives can include programs that target physician’s families. Anecdotal evidence indicates that the current trend of higher-than-average salaries for Louisiana providers can partially be attributed to quality-of-life issues. Supporting the targeting of providers’ children via educational promotions and benefits may be one effective strategy to improve retention.
Allied Health: Although allied health professions constitute an extremely broad range, there are several general recommendations. For the low-salary-level professions, retention is directly related to better salaries and other benefits. Increasing the pay scale, providing health insurance and benefits of this nature will have the greatest impact in retaining and attracting new entrants. For allied health professions with higher pay ranges, financial incentives will only be effective on the short term. Once again, the long term need is to increase the internal capacity to educate and train new work force entrants. Many of the occupations classified as allied health require more educational preparation than other occupations. Similar to the previous section, the long-term plan could start in the schools by making students aware of opportunities in healthcare. Loans and scholarships can also be offered to increase enrollment into training schools and programs. The U.S. Department of Health Resources and Services Administration awards grants to assist eligible entities in meeting the associated costs of expanding or establishing programs to increase the number of individuals trained in the allied health professions. Louisiana may qualify for many of these grants and should to actively seek them out.
Nursing: According to a report published by the U.S. General Accounting Office, factors driving
the recruitment and retention problems related to the nursing workforce can be associated with fewer people entering the field and the loss of employed individuals to job dissatisfaction. Job dissatisfaction included unfavorable work conditions, staffing issues, high work load, increased use of overtime, lack of support staff and salaries that did not keep up with inflation.13 A study by the American Organization of Nurse Executives put the annual turnover rate for registered nurses in all settings at 21 percent. In addition, a study by the American Health Care Association, a national nursing home trade association, put the annual turnover rate for nursing home nurse managers at 50 percent, registered nurses and licensed practical nurses at 48 percent and certified nurse assistants at 71 percent.14
Registered Nurses fall in the higher-paid allied health category. And while bonuses and salary increases are needed to retain RNs in the short term, Louisiana could enact more

Report for the Louisiana Recovery Authority Support Foundation
Page 113
This Report is intended for the use and benefit of the
Louisiana Recovery Authority Support Foundation only and not intended for reliance by any other Party.
career advancement initiatives. Given that the nursing shortage is a national problem and will make external recruiting difficult, Louisiana could be proactive and educate/train its own. Career ladders, where lower-level health providers can ‘train up’ to become RNs, would be extremely useful. By focusing on people currently in healthcare, less training is needed, and Louisiana would be targeting people who have a preference to working in healthcare. These types of programs can also be targeted specifically to in-state residents. Similar to physicians, scholarships can be offered, with ties to work commitments. Louisiana can also legislatively act to adopt ‘nurse-friendly’ practices, such as prohibiting mandatory overtime or eliminate staffing ratios. Providing high-quality child care or generous maternity leave packages will also have a long-term effect on retention. Finally, Louisiana must improve upon the availability and quality of the nursing education that is offered. Data from the Louisiana Board of Nursing shows that lack of faculty and higher salaries in the clinical areas, luring nurse educators out of teaching, are limiting the number of new RNs produced each year. Investment in infrastructure and faculty is necessary to meet the increasing demand.
Effects of Salary on Recruitment and Retention As the data clearly shows, there is a shortage of both primary and specialty physicians in many areas of Louisiana. At the same time, there are areas with an overabundance of physicians, which skews the state-wide ratios, understating the extreme shortages in rural areas. As a state, the salaries of the physicians are on par, or even better than the neighboring states. This information was unable to be compared across regions, but it is speculated that the salary range, similar to the physician distribution, is varied and will be skewed higher in the areas with the greatest concentration of medical schools and hospitals and lower in the underserved areas. It is recommended, although difficult to ensure, that competitive salary levels be used when in recruiting new physicians to work in underserved areas and to incentivize physicians against migrating into highly concentrated areas. The allied health professional situation is similar to that of the physicians. Although the state level numbers seem to indicate an overall shortage in key allied health positions, the attempt to break down the data by regions indicates that there are regions of overabundance and regions of extreme shortage. A recruitment and retention strategy could be developed, especially for direct patient-care providers, which will increase overall numbers and incentivise them to work in the underserved areas. To meet the growing need of RNs, Louisiana could focus on developing its training infrastructure to increase output. Career ladders to ‘train up’ existing health professionals could be developed and recruitment would take special focus on nurse educators. In addition to the general recommendations presented above it is important to note that various local organizations in Louisiana have spent considerable time and thought looking into various long-term recruitment and retention strategies. One of the plans created, entitled the "Hurricane Recovery Workforce Recruitment and Retention Plan," mentions income guarantees for providers, assistance with malpractice premium payments, student loan repayments, relocation and signing bonuses, to name a few. Further research could be done regarding the benefits of claiming all parishes as health-professional-shortage-area (HPSA) designations, as outlined in the Plan mentioned above. If populated areas are considered shortage areas, it may hinder efforts to entice physicians into more rural areas of the state.

Report for the Louisiana Recovery Authority Support Foundation
Page 114
This Report is intended for the use and benefit of the
Louisiana Recovery Authority Support Foundation only and not intended for reliance by any other Party.
The Future State of the Workforce In estimating the future needs of the healthcare work force, a methodology was used based on the population estimates described earlier in this report and the provider staffing ratios of the benchmark states. Three population scenarios were developed for this paper. In developing the future workforce scenarios, the middle population scenario was used. Using that data, the following workforce scenarios were created: Scenario 1: Healthcare provider staffing numbers modeled after Minnesota’s provider-to-population
ratios. Scenario 2: Healthcare provider staffing numbers modeled after an average of the mid 4 benchmark
states (i.e.: taking the 6 ratios of all the benchmark states, removing the minimum and maximum and taking an average of the remaining 4)
Scenario 3: Healthcare provider staffing numbers modeled after an average of all 6 benchmark states. For each of the healthcare workforce categories, all three scenarios were calculated. These values were then used to determine the minimum and maximum values in the proposed staffing range. The estimated salary load was calculated using an average salary of $C172,000C for primary care physicians and $174,000 for specialty physicians.15 Inflation was not included in this calculation. Salaries for the allied health professions were based on Louisiana’s average salary as reported by BLS. This salary-load estimate provides insight regarding the economic impact these workforce populations will have in each area. Although the benchmarks chosen to develop these projections are not specific to Louisiana’s distinct demographic makeup, socio-economic mix, or disease prevalence, these ranges provide a framework in developing a healthcare infrastructure that will meet the healthcare needs of a diverse population. The allied health workers were grouped into salary cohorts to compensate for the lack of region-specific data. C

Report for the Louisiana Recovery Authority Support Foundation
Page 115
This Report is intended for the use and benefit of the
Louisiana Recovery Authority Support Foundation only and not intended for reliance by any other Party.
$10.00 per hour and under Annual Median Salary Hourly RateNursing aides, orderlies, and attendants 15,400 8.46 Home health aides 15,970 8.77 Dietetic technicians 17,870 9.82
$10.01 to $20.00 per hourMedical assistants 21,240 11.67 Dental assistants 21,690 11.92 Pharmacy technicians 21,910 12.04 Medical transcriptionists 25,230 13.86 Emergency medical technicians and paramedics 26,890 14.77 Surgical technologists 29,110 15.99 Licensed practical and licensed vocational nurses 29,700 16.32 Medical and clinical laboratory technicians 29,930 16.45
$20.01 to $30.00 per hourRespiratory therapy technicians 36,700 20.16 Dietitians and nutritionists 38,110 20.94 Radiologic technologists and technicians 39,270 21.58 Respiratory therapists 40,060 22.01 Dental hygienists 42,450 23.32 Medical and clinical laboratory technologists 42,480 23.34 Registered nurses 48,820 26.82
$30.01 and higher per hourSpeech-language pathologists 54,690 30.05 Occupational therapists 61,510 33.80 Physician assistants 61,900 34.01 Physical therapists 70,290 38.62 Pharmacists 76,890 42.25 Dentists, general 110,660 60.80
Source: BLS 2004
Section 3 Exhibit 16: Allied Health Professional by Salary Level
4,515,770
Physicians: Estimated Salary* Min Max Min MaxPrimary $511 3,430 3,800 $590 $654Specialty $823 4,100 4,300 $714 $748
Allied Health (by hourly Salary)Less than $10.00/hour $517 37,270 41,570 $581 $651$10.00 to $19.99/hour $1,064 32,270 41,580 $838 $1,086$20.00 to $29.99/hour $2,343 49,460 51,420 $2,331 $2,427$30.00 and over $715 11,340 12,680 $821 $897
Primary: $111 Less than $10.00/hour $99Specialty: ($92) $10.00 to $19.99/hour ($102)All Physicians: $19 $20.00 to $29.99/hour $36
$30.00 and over $144All Allied Health $177
* In millionsSources: BLS 2004, Solucient 2004, US Census 2004, Calculated Population Estimates
2,9684,730
9,470
Pre-Hurricane #
Section 3 Exhibit 17a: Future Health Care Work Force
Proposed Salary Load*
Louisiana
Proposed Staffing Range
2004 Pop: Medium Population Scenario, Pro Forma Pop: 4,320,000
ESTIMATED TOTAL: $200
33,22039,59049,840
Estimated Salary Change in State:
Based on the scenarios, Louisiana could increase the number of primary care physicians and decrease the number of specialty physicians from pre-hurricane levels. (See Exhibit 18.) Based on the middle population scenario, the state could need as many as 3,800 primary care physicians and 4,300 specialty

Report for the Louisiana Recovery Authority Support Foundation
Page 116
This Report is intended for the use and benefit of the
Louisiana Recovery Authority Support Foundation only and not intended for reliance by any other Party.
physicians. The number of primary care physicians would have to increase 22 percent over pre-hurricanes levels while the number of specialty physicians would be less. There is also a need to increase the number of allied health professionals making less than $10.00 an hour and those who earn $30.00 and over. The pro forma estimated cost in the state for this increase will be an additional $19 million for physicians and $177 million for allied health; the total pro forma cost in the state will be approximately $200 million. This estimate is a starting point for this discussion; this estimate is not provided at the region specific level. The methodology used to determine the minimum and maximum ranges, which includes various assumptions and rounding calculations, invalidates the accuracy of such a calculation.
2004 Pop: 1,010,382 Medium Population Scenario, Pro Forma Pop: 4,320,000
Physicians: Pre-Hurricane # Estimated Salary* Min Max Min MaxPrimary 844 $145 520 570 $89 $98Specialty 1,709 $297 620 650 $108 $113
Allied Health (by hourly Salary)Less than $10.00/hour 8,461 $132 5,610 6,260 $87 $98$10.00 to $19.99/hour 10,083 $271 4,860 6,260 $126 $163$20.00 to $29.99/hour 12,694 $596 7,440 7,740 $351 $365$30.00 and over 2,412 $182 1,710 1,910 $124 $135
* In MillionsSources: BLS 2004, Solucient 2004, US Census 2004, Calculated Population Estimates
Section 3 Exhibit 17b: Future Health Care Work Force
Proposed Staffing Range Proposed Salary Load*
Region 1
Region 1 (New Orleans) has an excess of all healthcare providers. As alluded to earlier, a greater effort could be made to migrate some of these providers into the surrounding, underserved rural regions.
2004 Pop: 636,003 Medium Population Scenario, Pro Forma Pop: 4,320,000
Physicians: Pre-Hurricane # Estimated Salary* Min Max Min MaxPrimary 426 $73 560 620 $96 $107Specialty 641 $112 660 700 $115 $122
Allied Health (by hourly Salary)Less than $10.00/hour 4,065 $63 6,040 6,740 $94 $105$10.00 to $19.99/hour 4,844 $130 5,230 6,740 $136 $176$20.00 to $29.99/hour 6,098 $287 8,010 8,330 $178 $393$30.00 and over 1,159 $87 1,840 2,050 $133 $145
* In MillionsSources: BLS 2004, Solucient 2004, US Census 2004, Calculated Population Estimates
Section 3 Exhibit 17c: Future Health Care Work Force
Proposed Staffing Range Proposed Salary Load*
Region 2
Region 2 (Baton Rouge) requires additional primary care providers and all categories of the allied health professionals.

Report for the Louisiana Recovery Authority Support Foundation
Page 117
This Report is intended for the use and benefit of the
Louisiana Recovery Authority Support Foundation only and not intended for reliance by any other Party.
2004 Pop: 367,669 Medium Population Scenario, Pro Forma Pop: 4,320,000
Physicians: Pre-Hurricane # Estimated Salary* Min Max Min MaxPrimary 180 $031 320 350 $55 $60Specialty 223 $39 380 400 $66 $70
Allied Health (by hourly Salary)Less than $10.00/hour 1,731 $27 3,450 3,850 $54 $60$10.00 to $19.99/hour 2,062 $55 2,990 3,850 $78 $101$20.00 to $29.99/hour 2,596 $122 4,580 4,760 $216 $225$30.00 and over 493 $37 1,050 1,170 $76 $83
* In MillionsSources: BLS 2004, Solucient 2004, US Census 2004, Calculated Population Estimates
Section 3 Exhibit 17d: Future Health Care Work Force
Proposed Staffing Range Proposed Salary Load*
Region 3
Region 3 (Houma-Thibodaux) is underserved in all healthcare professionals.
2004 Pop: 559,614 Medium Population Scenario, Pro Forma Pop: 4,320,000
Physicians: Pre-Hurricane # Estimated Salary* Min Max Min MaxPrimary 352 $61 460 510 $79 $88Specialty 469 $82 550 580 $96 $101
Allied Health (by hourly Salary)Less than $10.00/hour 3,912 $61 5,000 5,580 $78 $87$10.00 to $19.99/hour 4,662 $125 4,330 5,580 $113 $146$20.00 to $29.99/hour 5,869 $276 6,640 6,900 $313 $326$30.00 and over 1,115 $84 1,520 1,700 $110 $120
* In Millions
Section 3 Exhibit 17e: Future Health Care Work Force
Proposed Staffing Range Proposed Salary Load*
Region 4
2004 Pop: 285,378 Medium Population Scenario, Pro Forma Pop: 4,320,000
Physicians: Pre-Hurricane # Estimated Salary* Min Max Min MaxPrimary 156 $27 222 246 $38 $42Specialty 212 $37 266 279 $46 $49
Allied Health (by hourly Salary)Less than $10.00/hour 1,824 $28 2,416 2,695 $87 $98$10.00 to $19.99/hour 2,174 $58 2,092 2,695 $126 $163$20.00 to $29.99/hour 2,737 $129 3,205 3,333 $351 $365$30.00 and over 520 $39 735 822 $124 $135
* In Millions
Section 3 Exhibit 17f: Future Health Care Work Force
Proposed Staffing Range Proposed Salary Load*
Region 5
2004 Pop: 299,341 Medium Population Scenario, Pro Forma Pop: 4,320,000
Physicians: Pre-Hurricane # Estimated Salary* Min Max Min MaxPrimary 170 $29 250 270 $43 $46Specialty 243 $42 290 310 $50 $54
Allied Health (by hourly Salary)Less than $10.00/hour 2,312 $36 2,670 2,980 $42 $47$10.00 to $19.99/hour 2,755 $74 2,320 2,980 $60 $78$20.00 to $29.99/hour 3,468 $163 3,550 3,690 $167 $174$30.00 and over 659 $50 810 910 $59 $64
* In MillionsSources: BLS 2004, Solucient 2004, US Census 2004, Calculated Population Estimates
Section 3 Exhibit 17g: Future Health Care Work Force
Proposed Staffing Range Proposed Salary Load*
Region 6

Report for the Louisiana Recovery Authority Support Foundation
Page 118
This Report is intended for the use and benefit of the
Louisiana Recovery Authority Support Foundation only and not intended for reliance by any other Party.
Region 4 (Lafayette), Region 5 (Lake Charles) and Region 6 (Alexandria) are all underserved in all healthcare providers, except for allied health professionals in the $10.00 to $19.99 range.
2004 Pop: 526,866 Medium Population Scenario, Pro Forma Pop: 4,320,000
Physicians: Pre-Hurricane # Estimated Salary* Min Max Min MaxPrimary 382 $66 520 570 $89 $98Specialty 581 $101 620 650 $108 $113
Allied Health (by hourly Salary)Less than $10.00/hour 5,036 $78 4,570 5,100 $71 $80$10.00 to $19.99/hour 6,002 $161 3,960 5,100 $109 $133$20.00 to $29.99/hour 7,556 $355 6,070 6,310 $286 $298$30.00 and over 1,436 $108 1,390 1,560 $101 $110
* In MillionsSources: BLS 2004, Solucient 2004, US Census 2004, Calculated Population Estimates
Section 3 Exhibit 17h: Future Health Care Work Force
Proposed Staffing Range Proposed Salary Load*
Region 7
Region 7 (Shreveport) requires additional primary and specialty physicians. It has an excess of the mid-range allied health professionals.
2004 Pop: 351,683 Medium Population Scenario, Pro Forma Pop: 4,320,000
Physicians: Pre-Hurricane # Estimated Salary* Min Max Min MaxPrimary 198 $34 280 310 $48 $53Specialty 250 $44 330 350 $57 $61
Allied Health (by hourly Salary)Less than $10.00/hour 3,171 $49 3,020 3,370 $47 $53$10.00 to $19.99/hour 3,779 $102 2,610 3,370 $68 $88$20.00 to $29.99/hour 4,757 $224 4,010 4,170 $189 $197$30.00 and over 904 $68 920 1,030 $67 $73
* In MillionsSources: BLS 2004, Solucient 2004, US Census 2004, Calculated Population Estimates
Section 3 Exhibit 17i: Future Health Care Work Force
Proposed Staffing Range Proposed Salary Load*
Region 8
Region 8 (Monroe) is understaffed in all physician levels and high-salary allied health professionals. It has an excess of mid-ranged allied health providers.
2004 Pop: 478,834 Medium Population Scenario, Pro Forma Pop: 4,320,000
Physicians: Pre-Hurricane # Estimated Salary* Min Max Min MaxPrimary 260 $45 410 460 $71 $79Specialty 402 $70 490 520 $85 $91
Allied Health (by hourly Salary)Less than $10.00/hour 2,709 $42 4,490 5,000 $70 $78$10.00 to $19.99/hour 3,228 $87 3,880 5,010 $101 $131$20.00 to $29.99/hour 4,064 $191 5,950 6,190 $281 $292$30.00 and over 772 $58 1,370 1,530 $99 $108
* In MillionsSources: BLS 2004, Solucient 2004, US Census 2004, Calculated Population Estimates
Section 3 Exhibit 17j: Future Health Care Work Force
Proposed Staffing Range Proposed Salary Load*
Region 9

Report for the Louisiana Recovery Authority Support Foundation
Page 119
This Report is intended for the use and benefit of the
Louisiana Recovery Authority Support Foundation only and not intended for reliance by any other Party.
Region 9 (Covington-Slidell) could increase its recruiting and retention efforts across all healthcare professional categories. The data presented here is not meant to provide details regarding the exact quantity of each profession that is required; these are merely guidelines. Although the level of healthcare providers in a region has a strong correlation to an area’s health status, it is impossible to tie specific staffing numbers to a specific health outcome. In addition, difficulties in recruitment and retention, changes in the population’s demographic makeup and shifts in disease prevalence will further complicate the staffing situation. Each region could take this information as a starting point and make specific changes to best meet the needs of their population. It is also important to realize that an "optimal" healthcare workforce is a moving target. “For several decades, the needs of the American public have been shifting from predominantly acute, episodic care to care for chronic conditions. Chronic conditions are now the leading cause of illness, disability and death; they affect almost half of the U.S. population and account for the majority of healthcare expenditures.”16 In meeting the changing needs of an aging population, the Institute of Medicine (IOM) recommends using chronic conditions as a starting point for the reconstruction of healthcare delivery. Under the IOM plan, a limited number of such conditions that make up the majority of patient care will be targeted as a way to achieve substantial improvements in quality for a large percentage of the population. Once these conditions have been identified, the IOM recommends all stakeholders (healthcare organizations, clinicians, purchasers and others) work together to:
• Organize evidence-based care processes consistent with best practices. • Organize major prevention programs to target key health-risk behaviors associated with the onset
or progression of these conditions. • Develop the information infrastructure needed to support the provision of care and the ongoing
measurement of care processes and patient outcomes. • Align the incentives with the goal of quality improvement.16
The state could use this guideline in developing the framework for a new healthcare workforce. According to the Louisiana State Center for Health Statistics, 64 percent of all deaths in 2002 were attributable to five causes.17 Four of the five causes (excluding accidents) have a strong correlation to chronic conditions and can be addressed in the framework set forth by the IOM.
• Diseases of the Heart 27% • Malignant Neoplasms 22% • Cerebrovascular Disease 6% • Accidents 5% • Diabetes Mellitus 4%
Cardiovascular: Cardiovascular diseases (CVD) are the diseases that attack the heart (1) and the blood
vessels (3) that lead to heart attacks, strokes and hemorrhages. Not only is CVD the leading cause of death, the majority of those who survive non-fatal events will need continued care and may be left with permanent disabilities. Most CVD risk factors are a
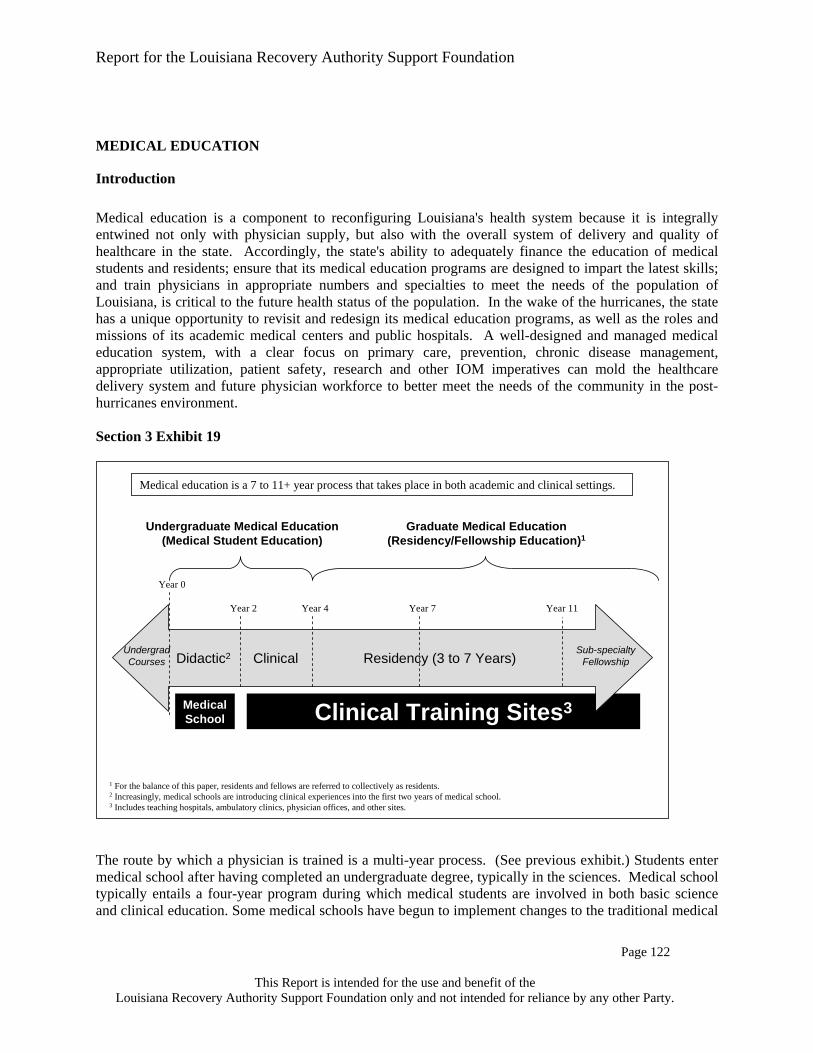
Report for the Louisiana Recovery Authority Support Foundation
Page 120
This Report is intended for the use and benefit of the
Louisiana Recovery Authority Support Foundation only and not intended for reliance by any other Party.
direct result of behavioral choices such as tobacco use, blood pressure, cholesterol, obesity, poor nutrition and diabetes.
Neoplasms: Although cancer, or malignant neoplasms, has many different forms and is associated
with differing risk factors, there are some generalities. According to the National Cancer Institute, an estimated 30 percent of all cancer deaths can be associated to tobacco use, and 35 percent can be attributed to dietary and lifestyle factors.16 Early detection and screening are key to mitigating the condition.
Diabetes: Louisiana has the highest death rate in the nation for diabetes (41.7 per 100,000
population in 2001).16 Its impact as a chronic condition is also large: it is the leading cause of blindness in adults (20-74), non-traumatic amputations and end-stage renal disease. Although preventative practices can reduce the burden of the disease, it requires active and constant management on a daily basis.
In the context of Louisiana’s workforce redesign, the problem with trying to address this list of conditions exclusively through workforce changes is that many of the causes for these health issues are tied to lifestyle and public health, in addition to lack of available healthcare providers. Simply increasing the number of providers may have some impact: primary care physicians are an extremely important line of defense through screenings and early diagnosis, as well as providing health education; specialty physicians are trained to address the symptoms through the provision of technically complicated medical care; the allied health workforce performs many of these functions as well. However, simply increasing the number of healthcare professionals in Louisiana as the only lever to decrease mortality is not the most efficient use of resources. As recommended by the IOM, the increased physician and allied health professional model described also should be assisted with state policies and programs targeting public health issues, such as behavioral and lifestyle changes. Another concern is the lack of up-to-date information regarding disease prevalence. The information from which the top 5 conditions were derived is several years old and does not take into account any of the demographic shifts and health-related changes that are the result of the hurricanes. In addition to this list, there is a distinct threat of increased mental health conditions. In its March 2, 2006 presentation to the Healthcare Taskforce, the Louisiana Public Mental Health Review Commission warned that there will be an increase in behavioral problems and addictive disorders as a direct result of Katrina and Rita. Based on all of the information provided, the following are additional recommendations. The first problem that should be addressed is the lack of current information. As each region begins to plan its workforce re-design, a closer look must be taken at the current state of the population. The demographic, racial and health status of the population should be carefully measured, and the staffing scenarios proposed above should be adjusted with the new information in mind. Additionally, the current shortage of healthcare providers will not go away any time soon. Even as Louisiana begins to develop an internal infrastructure to increase production in state, it will be many years before these efforts bear results. In the mean time, Louisiana could think beyond increasing the number of providers; Louisiana could increase the efficiency in providing healthcare. Doing so in areas where there is difficulty in attracting new physicians and alternative providers, such as Nurse Practitioners, may meet that need. Also, increased use of technology, through sharing of centralized medical patient information, telemedicine and virtual ICUs may also help to ameliorate the existing shortage.
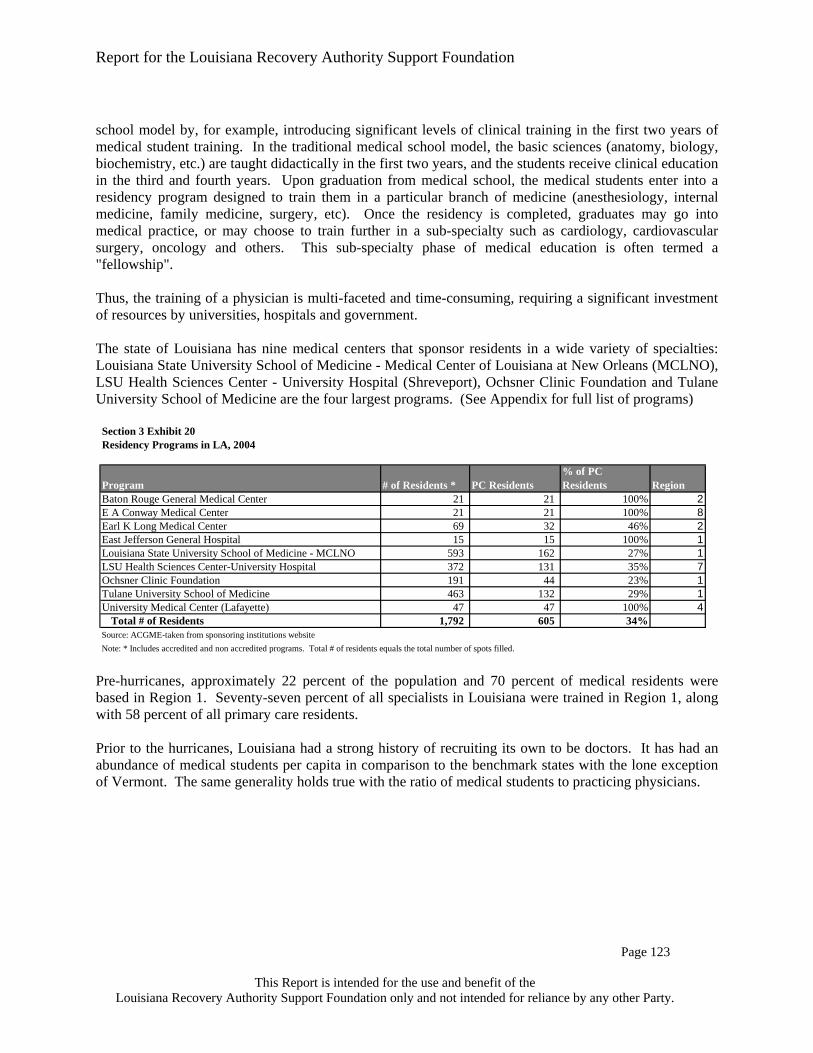
Report for the Louisiana Recovery Authority Support Foundation
Page 121
This Report is intended for the use and benefit of the
Louisiana Recovery Authority Support Foundation only and not intended for reliance by any other Party.
Finally, workforce planning will require ongoing modification and consistent validation of underlying assumptions. It is also important that proper metrics be identified and measured on an ongoing basis to gauge the success or failure of the work plan to meet the goals outlined in the strategic planning process. Workforce planning is an iterative process that constantly needs to be monitored and challenged to ensure and effective outcome. Proper data gathering will ensure that the workforce plan is on track to meet the needs of the population.

Report for the Louisiana Recovery Authority Support Foundation
Page 122
This Report is intended for the use and benefit of the
Louisiana Recovery Authority Support Foundation only and not intended for reliance by any other Party.
MEDICAL EDUCATION
Introduction Medical education is a component to reconfiguring Louisiana's health system because it is integrally entwined not only with physician supply, but also with the overall system of delivery and quality of healthcare in the state. Accordingly, the state's ability to adequately finance the education of medical students and residents; ensure that its medical education programs are designed to impart the latest skills; and train physicians in appropriate numbers and specialties to meet the needs of the population of Louisiana, is critical to the future health status of the population. In the wake of the hurricanes, the state has a unique opportunity to revisit and redesign its medical education programs, as well as the roles and missions of its academic medical centers and public hospitals. A well-designed and managed medical education system, with a clear focus on primary care, prevention, chronic disease management, appropriate utilization, patient safety, research and other IOM imperatives can mold the healthcare delivery system and future physician workforce to better meet the needs of the community in the post-hurricanes environment. Section 3 Exhibit 19 The route by which a physician is trained is a multi-year process. (See previous exhibit.) Students enter medical school after having completed an undergraduate degree, typically in the sciences. Medical school typically entails a four-year program during which medical students are involved in both basic science and clinical education. Some medical schools have begun to implement changes to the traditional medical
Year 0
Year 2 Year 4
MedicalSchool Clinical Training Sites3
Didactic2 Clinical Residency (3 to 7 Years)
Year 7 Year 11
UndergradCourses
Sub-specialtyFellowship
Undergraduate Medical Education(Medical Student Education)
Graduate Medical Education(Residency/Fellowship Education)1
Medical education is a 7 to 11+ year process that takes place in both academic and clinical settings.
1 For the balance of this paper, residents and fellows are referred to collectively as residents.2 Increasingly, medical schools are introducing clinical experiences into the first two years of medical school. 3 Includes teaching hospitals, ambulatory clinics, physician offices, and other sites.

Report for the Louisiana Recovery Authority Support Foundation
Page 123
This Report is intended for the use and benefit of the
Louisiana Recovery Authority Support Foundation only and not intended for reliance by any other Party.
school model by, for example, introducing significant levels of clinical training in the first two years of medical student training. In the traditional medical school model, the basic sciences (anatomy, biology, biochemistry, etc.) are taught didactically in the first two years, and the students receive clinical education in the third and fourth years. Upon graduation from medical school, the medical students enter into a residency program designed to train them in a particular branch of medicine (anesthesiology, internal medicine, family medicine, surgery, etc). Once the residency is completed, graduates may go into medical practice, or may choose to train further in a sub-specialty such as cardiology, cardiovascular surgery, oncology and others. This sub-specialty phase of medical education is often termed a "fellowship". Thus, the training of a physician is multi-faceted and time-consuming, requiring a significant investment of resources by universities, hospitals and government. The state of Louisiana has nine medical centers that sponsor residents in a wide variety of specialties: Louisiana State University School of Medicine - Medical Center of Louisiana at New Orleans (MCLNO), LSU Health Sciences Center - University Hospital (Shreveport), Ochsner Clinic Foundation and Tulane University School of Medicine are the four largest programs. (See Appendix for full list of programs)
Section 3 Exhibit 20Residency Programs in LA, 2004
Program # of Residents * PC Residents% of PC Residents Region
Baton Rouge General Medical Center 21 21 100% 2E A Conway Medical Center 21 21 100% 8Earl K Long Medical Center 69 32 46% 2East Jefferson General Hospital 15 15 100% 1Louisiana State University School of Medicine - MCLNO 593 162 27% 1LSU Health Sciences Center-University Hospital 372 131 35% 7Ochsner Clinic Foundation 191 44 23% 1Tulane University School of Medicine 463 132 29% 1University Medical Center (Lafayette) 47 47 100% 4
Total # of Residents 1,792 605 34%Source: ACGME-taken from sponsoring institutions websiteNote: * Includes accredited and non accredited programs. Total # of residents equals the total number of spots filled.
Pre-hurricanes, approximately 22 percent of the population and 70 percent of medical residents were based in Region 1. Seventy-seven percent of all specialists in Louisiana were trained in Region 1, along with 58 percent of all primary care residents. Prior to the hurricanes, Louisiana had a strong history of recruiting its own to be doctors. It has had an abundance of medical students per capita in comparison to the benchmark states with the lone exception of Vermont. The same generality holds true with the ratio of medical students to practicing physicians.

Report for the Louisiana Recovery Authority Support Foundation
Page 124
This Report is intended for the use and benefit of the
Louisiana Recovery Authority Support Foundation only and not intended for reliance by any other Party.
Section 3 Exhibit 21Comparison of Medical Students to Population and Active Physicians.
# of Medical Students in 2004 1 State Population 2
# of Med Students per 100,000 people
Total Number of Active MDs 3
# of Med Students per 100 Active
MDLouisiana 1722 4,515,770 38 7,698 22Minnesota 1074 5,094,710 21 9,505 11Vermont 403 612,710 66 1,309 31Utah 414 2,369,550 17 3,302 13Conn 807 3,449,070 23 7,973 10Iowa 578 2,909,030 20 4,268 14Kansas 702 2,659,930 26 4,191 17
Sources: 1 AAMC 2 www.statehealthfacts.org, LA data from 2004 US Census estimates; 3 BLS statistics May 2004 In 2005, Louisiana had approximately 1,700 medical students attending three medical schools: LSU New Orleans, LSU Shreveport and Tulane Medical School.18 Seventy-six percent of all medical students in Louisiana were located in New Orleans.
Section 3 Exhibit 22
Female Male All
LSU New Orleans 321 368 689
LSU Shreveport 176 233 409
Tulane 277 337 614Source: AAMC
Total Enrollment as of 10/31/2005
Approximately 73 percent of medical students in the state are Louisiana residents. The two public schools admit Louisianans almost exclusively while 26 percent of Tulane's students are state residents.19
Section 3 Exhibit 23Louisiana Medical Schools Pre-KatrinaStudent metric, 2004 LSU-NO LSU-SH TulaneApproximate # of 1st year med students per year1 170 100 155% of 1st year med student positions filled by state residents1* 100 100 26% MDs remaining in LA for residency training1** 53 50 32% Med students initially choosing a PC residency2 20 16 23
Sources: 1LSUHSC, TUSOM, JAMA (9/7/05); 2 AAMC master file
The above data is based on a 4 year medical school program.
Notes: *LSU-NO & LSU-SH only accept LA residents into med schools with 2 small exceptions. ** Calculation is based on graduating students. Does not necessarily equal 1st year.

Report for the Louisiana Recovery Authority Support Foundation
Page 125
This Report is intended for the use and benefit of the
Louisiana Recovery Authority Support Foundation only and not intended for reliance by any other Party.
Medical School Characteristics While Louisiana medical schools try to steer graduates into primary care, there is room for improvement based on analysis with the benchmark programs. (See next exhibit.) At LSU School of Medicine in Shreveport, approximately 16 percent of medical students initially enter into primary care residencies, while at the University of Washington approximately 33 percent of medical students initially enter into primary care residencies. The importance of primary care physicians to the healthcare system is cited in a recent study from the America College of Physicians in which they find that "an increase in primary care physicians is associated with a significant increase in quality of health services, as well as a reduction in costs."20 However it must be recognized that internal medicine students often sub-specialize upon completion of the program. As the next exhibit indicates, Tulane and LSU New Orleans appear to have fewer full time basic faculty per student than Shreveport, the University of Alabama and the University of Washington. In addition, while the two community-based medical schools (U-N North Dakota and Michigan State) appear to have an unfavorably high student to clinical faculty ratio; these programs have a large number of part-time and volunteer faculty to compensate. Consideration should be given to creating a similar network and thereby expanding on current networks and outreach efforts currently in place. Section 3 Exhibit 24Snapshot of Faculty at Select Medical Schools, 2005
Medical School
Total Number of Medical Students
Total Full-Time Basic Science Faculty
Student to Basic Science Fac Ratio
Total Full-Time Clinical Faculty
Student to Clinical Fac Ratio
% of Graduates initially entering PC
U-N Dakota Schl Med & Hlth Sci 231 93 2 46 5.0 19LSU School of Med - Shreveport 401 120 3 304 1.3 16Mich St U Coll of Human Med 428 60 7 125 3.4 21Tulane U School of Medicine 626 79 8 429 1.5 23LSU School of Med - New Orleans 678 121 6 451 1.5 20University of Alabama School of Medicine 689 232 3 925 0.7 30
Univ of Washington Schl of Med 782 337 2 1,583 0.5 33
Source; AAMC master file
Debt Load Among Graduating Louisiana Medical Students While Louisiana has developed and trained most of its own physicians, those physicians may be at a disadvantage financially because they incur a heavier debt load than others in the region. The average amount of financial debt at graduation from medical school is higher at Louisiana schools than surrounding regional schools, according to U.S. News and World Report.21

Report for the Louisiana Recovery Authority Support Foundation
Page 126
This Report is intended for the use and benefit of the
Louisiana Recovery Authority Support Foundation only and not intended for reliance by any other Party.
Section 3 Exhibit 25Debt Upon Graduation at Select Medical Schools, 04-05
School Total Debt at Graduation
Out of State Tuition
In State Tuition
Tulane University 148,145$ 36,525$ 36,525$ University of Miami 138,600$ 28,670$ 28,670$ Louisiana State University-New Orleans 106,550$ 25,611$ 11,463$ Louisiana State University-Shreveport 106,550$ 25,611$ 11,463$ University of Alabama--Birmingham 90,742$ 30,657$ 10,219$ University of South Florida 90,000$ 47,005$ 15,666$ University of Florida 88,675$ 45,092$ 15,666$
Univ. of Texas Health Science Center--Houston 83,635$ 21,650$ 8,550$ Texas A&M Univ. System Health Science Center 80,000$ 19,650$ 6,550$ U. of Texas Southwestern Medical Center--Dallas 67,000$ 21,500$ 8,400$ Baylor College of Medicine 66,195$ 6,550$ 6,550$ University of Mississippi 23,448$ 13,183$ 6,823$
Source: USNews and World Report Annual Medical School Rankings, 2005 editionNote: LSU did not participate in USNews survey, Information from their Annual Reports. Tuition data does not include room and board.
The high debt levels upon graduation from Louisiana medical schools may deter students from choosing a career in primary care and from working in rural and underserved areas, while inadvertently steering them toward specialist careers in the metropolitan areas. Programs targeting debt forgiveness to fill critical workforce needs could have an impact on addressing shortages and steer more students toward primary care medicine without creating a shortage of much needed specialist care in the more populated areas.
Funding of Graduate Medical Education Teaching hospitals receive two types of payments for medical education through Medicare: direct graduate medical education (GME) payments for direct costs, such as resident and faculty salaries; and indirect graduate medical education (IME) payments for indirect costs such as treating patients with higher severity of illness. Medicare payments for graduate medical education are largely driven by the hospital's Medicare patient percentage. Therefore, if a hospital has a greater number of Medicare inpatient days, funding for its graduate medical education programs is more significant. In the pre-Katrina environment over half of the residents receive teaching and training experience at the LSU-HCSD facilities, which historically treats a lower percentage of Medicare patients than other hospitals in the state. This is due to the historic pattern by which paying patients (including Medicare patients) are largely treated in private hospitals and the uninsured are largely treated in the state (LSU) hospital system. As a result, LSU hospitals average only 13 percent Medicare patients. The situation was even more dramatic in New Orleans, where Charity Hospital averaged only eight percent Medicare patients. This lack of available Medicare reimbursement related to the training of LSU and Tulane

Report for the Louisiana Recovery Authority Support Foundation
Page 127
This Report is intended for the use and benefit of the
Louisiana Recovery Authority Support Foundation only and not intended for reliance by any other Party.
residents at LSU facilities meant (and means) that even though the LSU hospitals are incurring the costs of medical education, they are receiving far less reimbursement to support these programs than most institutions across the nation. C This lack of Medicare days in the LSU system pre-Katrina has impacted needed funding for LSU's graduate medical education programs. The exhibit below demonstrates the pre-Katrina discrepancy of resident funding between the LSU system and other teachings hospitals in Louisiana. This discrepancy is largely attributed to a lack of Medicare days at LSU hospitals. Additionally, post Katrina the displaced LSU resident physicians are currently practicing for the most part in hospitals which don't have available approved Medicare residency slots. Hence these hospitals are currently incurring costs to the LSU system, with no available federal reimbursement to cover their services. It is understood that the Secretary of Health and Human Services has recently issued a rule that sufficiently addresses the issue. C C Section 3 Exhibit 26Medicare Funding for Residents
Total IME/GME Funds per Resident ($)
LSU HSC-HCSD 14,690 LSU HSC-Shreveport 17,721 Tulane 62,442 For Profit 69,512 Not for Profit 87,795
Source: Data based on Medicare Cost Reports filed for FY04; for facilities with no FY04 report, FY03 was used. Includes subproviders The fill-rate charts below show that Louisiana has an overall lower fill rate in primary care than the national average and the surrounding states. It appears that there is room to increase the number of primary care residents in the state without adding more accredited positions and without impacting current non primary care specialties.
Section 3 Exhibit 27Primary Care Residency Fill Rate
2005 DataOverall Fill-rate
Family Practice
Internal Medicine Pediatrics
Louisiana 86% 85% 80% 73%Mississippi 91 104 84 85Alabama 91 94 88 90Florida 88 93 88 78Texas 91 98 90 88US National 90 93 91 90
Source: ACGME Resident Programs and Fill Rate by State
Report for the Louisiana Recovery Authority Support Foundation
Page 128
This Report is intended for the use and benefit of the
Louisiana Recovery Authority Support Foundation only and not intended for reliance by any other Party.
Faculty and Resident Levels
Section 3 Exhibit 28Benchmark Comparison of Faculty and Residents 2005
Total Full-Time Clinical Faculty
Total PC Faculty
% of Faculty PC
Total Residents
Total PC Residents
% of Residents PC
Connecticut 1,491 620 42% 1,930 791 41%Iowa 694 282 41% 682 314 46%Kansas 353 163 46% 485 193 40%Louisiana 1,184 514 43% 1,677 568 34%Minnesota 3,136 1,558 50% 2,074 758 37%Utah 759 378 50% 565 245 43%Vermont 406 189 47% 243 75 31%
Faculty Residents
Source: AAMC Master File.Note: Data from AAMC GME Track system. This isreported data from the programs. The database is not inclusive of allprograms although most do report their data. Thus the numbers are not'truth' and should be viewed as approximations.
When comparing the percentage of primary care residents in Louisiana to the benchmark states, it is evident that Louisiana should increase its overall percentage of primary care residents and faculty. A focus on rural medicine and disbursing the residents throughout the state may be advantageous in order to help get primary care physicians into underserved areas. When disbursing residents, a need for additional part-time and volunteer faculty will increase drastically. Identifying the appropriate number of residents for a defined population area is challenging. The ACGME, the accrediting body for residency programs, has Residential Review Committees (RRC) that accredits each specialty program, but they do not have firm guidelines on this.
Section 3 Exhibit 29Comparison of Residents to Population in New Orleans and Birmingham
New Orleans, LA Metropolitan Service Area
Birmingham, AL Metropolitan Service Area
Population in MSA 1 1,337,726 943,431
Total Number of Filled Resident Positions 2 1,262 889
Residents per 100,000 people 94 94
Total Number of Filled PC Residents 2 353 292
PC residents per 100,000 people 26 31
Sources: (1) LA data from US census, AL data from Solucient (2) ACGME Comparing the number of residents to the population in the New Orleans Metropolitan Service Area (MSA) to that of the Birmingham Alabama MSA shows that pre-Katrina, the two southern cities had

Report for the Louisiana Recovery Authority Support Foundation
Page 129
This Report is intended for the use and benefit of the
Louisiana Recovery Authority Support Foundation only and not intended for reliance by any other Party.
comparable ratios of residents to population (see exhibit above). With the estimated population shift out of New Orleans, residency programs could disperse their residents throughout the state.
The Flow of Residents Forty percent of medical residents in Louisiana received their undergraduate medical education in Louisiana. This statistic is greater than the surrounding states and significantly higher than the national average. Louisiana appears to be doing an admirable job admitting Louisiana residents to local medical schools and keeping those students in the state of residency, as seen in the below exhibits. When compared to regional and national averages, Louisiana is successful in retaining primary care residents to practice in the state upon completion of their programs, but when including all specialties, Louisiana appears to be an exporter of graduating medical residents. Information unconfirmed with AAMC data has been provided suggesting that the public graduate medical education programs may have a higher retention rate then overall state averages as shown in the next exhibits.
Section 3 Exhibit 30Disposition of Residents
Residents originating from in-state medical school (%)
Residents originating from out-of-state medical schools (%)
Residents originating from foreign medical school (%)
Residents planning to practice in same state after residency (%)
Residents planning to practice in other state after residency (%)
Louisiana 40% 35% 23% 51% 49% Florida 20 46 29 67 33 Mississippi 40 37 14 61 39 Alabama 34 38 25 49 51 Texas 39 36 21 65 35 US National 25 45 26 53 47
Source: "State Level Data for Accredited Graduate Medical Programs in the US"AMA data file 2004
Section 3 Exhibit 31
Primary Care SpecialtiesPercent Retained in LA
National Retention Percentage
Family Medicine 74% 59%Pediatrics 66% 53%General Practice 65% 53%Internal Medicine 60% 54%
Total 49% 49%
Percent of active physicians under age 50 practicing in same state as residency program
Source: AMA Masterfile 2005. Compiled by the AAMC
Note: Retention rate=number of active physicians who are practicing in Louisiana and completed their GME in Louisiana/number of GME completers from Louisiana
While medical education is expensive, the presence of medical education programs and their related medical schools and teaching hospitals is considered an important economic driver. A 2003 report by the

Report for the Louisiana Recovery Authority Support Foundation
Page 130
This Report is intended for the use and benefit of the
Louisiana Recovery Authority Support Foundation only and not intended for reliance by any other Party.
Association of American Medical Colleges found that during 2002, the combined economic impact of AAMC members equaled approximately $326 billion. AAMC members directly or indirectly accounted for more than 2.7 million jobs, equating to one out of every 54 wage earners in the American labor force. "Furthermore, AAMC members generated nearly $14.7 billion in total state tax revenue and almost $14 billion in ‘out of state’ medical visitor related revenue."22 This report does not include any specific information specific to Louisiana. However, the Louisiana Office of Primary Care and Rural Health's study on the "Importance of the Health Care Sector on the Economy of Louisiana" concluded that the entire sector generated 374,804 jobs for the state’s economy, with a total impact of $11.6 billion.23
Current Models for Medical Education in Louisiana LSU New Orleans: Louisiana State University Health Science Center New Orleans is a traditional model medical school. During the first two years, medical students focus on the basic sciences and hold clinical clerkships during the third and fourth years. Most clerkships and rotations were completed in New Orleans at Charity Hospital and University Hospital (New Orleans).24 The residency programs at LSU New Orleans are predominantly located in New Orleans and the surrounding area. The primary teaching hospitals in New Orleans are Charity and University Hospital. Some residents also rotate to several other hospitals in New Orleans, Baton Rouge and Lafayette. The affiliated hospitals in the New Orleans area include Children's, Kenner Regional Medical Center, Memorial, Ochsner Medical Foundation, Touro Infirmary and Veterans Administration Medical Center. University Medical Center in Lafayette has freestanding programs in Family Medicine and Internal Medicine. LSU New Orleans has a 17-resident family medicine program based in Lake Charles which has a focus on community-based and rural medicine.25 (Please see Appendix for full list) LSU Shreveport: Louisiana State University Health Science Center - Shreveport is also a traditional model medical school. During the first two years, medical students focus on the basic sciences. Clinical clerkships are held during the third and fourth years. Most clerkships and rotations are completed in Shreveport and the neighboring vicinity. Third and fourth year medical students have an optional four-week rotation in community-based medicine. This rotation is an outpatient experience with a physician in medical practice in Shreveport and the surrounding communities.26 In order to help encourage students to participate in the program, North Louisiana Area Health Education Center (NLAHEC) covers the expenses that students occur on this rotation.12 The vast majority of residents at LSU Shreveport do their residency at LSU Health Sciences Center - University Hospital. Based on ACGME information, five out of 350 residents are in a rural family medicine program. LSUHC-S Family Medicine Rural Training Tract is offered through the Rural Residency Track in Vivian, LA. Residents in the rural program spend their first year at LSU Health Sciences Center in Shreveport. The second and third years are spent in Vivian, LA, with the majority of training occurring in its outpatient clinic, nursing home, hospital and emergency room. The program also includes a fellowship in rural medicine, a residency in rural family practice and rural medicine electives for residents and medical students.27

Report for the Louisiana Recovery Authority Support Foundation
Page 131
This Report is intended for the use and benefit of the
Louisiana Recovery Authority Support Foundation only and not intended for reliance by any other Party.
Tulane University School of Medicine: Tulane is a traditional model medical school where the first two years are focused on the sciences and years three and four are more clinical in nature. Predominantly, Tulane medical students and residents are located in New Orleans with MCLNO, Tulane University Hospital and Clinic (TUHC) and the Veterans Affairs Medical Center (VAMC) being the predominate sites for training. Additional sites include Huey P. Long Hospital (Pineville), the Alexandria and Biloxi VAMC, Ochsner and Touro. During the third year of medical school students are required to take a six-week clerkship in community-based family medicine. This clerkship is spread throughout the region from Natchitoches and Alexandria in the North and West, to Pensacola in the East. Students are given the opportunity to work one-on-one with an attending physician during the clerkship. Tulane also sponsors and provides scholarships to the Tulane Rural Medical Education program. The program is designed to recruit and educate medical students who intend to enter practice in a rural area or small town of Louisiana or the Gulf South, particularly in the field of Family Medicine. Students accepted to this program spend the summer of their first year and their third year doing a rural medicine clerkship and are expected to continue onto a family medicine residency after medical school.28 CTulane University School of Medicine does not have residency programs that focus exclusively on family or rural medicine. Tulane does, however, have a Department of Family and Community Medicine and an extensive internal medicine residency program which is primarily based in the city or nearby surrounding areas of New Orleans.
Lessons for the Future from Benchmark Medical Programs University of Washington – Lessons for the Future The University of Washington is ranked by U.S. News and World Report as the number one school for primary medicine in the country, number one for rural medicine and ranks first among public schools in NIH Funding. The University of Washington Hospital is ranked 9th in the nation for patient care, is a nursing Magnet hospital and has a level I trauma center. The University has a progressive model for community-based training of medical students and residents, which Louisiana should consider adopting in a modified manner. This medical school is unique in that it involves a partnership between the University of Washington School of Medicine and the states of Wyoming, Alaska, Montana and Idaho. Collectively, the partnership is named WWAMI. The WWAMI program emphasizes decentralization of medical education. A large portion of each student's education occurs within the WWAMI region, utilizing both full-time and volunteer teachers located in local communities, with a focus on primary care.29 The WWAMI program was created approximately 36 years ago by the leaders of the University of Washington through a grant from the Commonwealth Foundation. These leaders all had experience in community-based medicine and understood the need to train primary care physicians for rural areas. They opened discussions with physicians and community leaders in Alaska regarding a partnership to provide access to medical education. Over the years, other states have joined this program. Currently, WWAMI is supported through state funding. Recruitment for the WWAMI program is not isolated to college students focusing on pre-med. The WWAMI program has grants from the Robert Wood Johnson Foundation to assist in recruitment for under-represented populations, and this outreach starts in middle and high schools. Once enrolled in the

Report for the Louisiana Recovery Authority Support Foundation
Page 132
This Report is intended for the use and benefit of the
Louisiana Recovery Authority Support Foundation only and not intended for reliance by any other Party.
WWAMI program, emphasis is placed on primary and rural medicine during all four years of medical school. First-year medical students attend one of the five locations in the WWAMI region for their basic science classes. During the summer between the first and second year, students have the opportunity to take a four-week elective to work with a physician preceptor in a rural or urban underserved area. The university assists the medical students with housing during this period and provides a small stipend. Students are also given the opportunity to work on a research project over the summer between first and second year. The second year is lecture- and lab-based didactic, located at the Washington, Seattle campus. Third-and fourth-year students use the case study method for learning while doing various mandatory and elective clerkships. Third-year students can select a six-month rural medicine experience emphasizing continuity of care, integration of medical disciplines and rural setting activities. All medical students are required to do rotations through the WWAMI region. It is during the third and fourth years that UW’s wide network of part time and volunteer faculty get involved. The university works with the state medical associations to identify physicians who want a role in teaching and have the appropriate facilities to do so. In most cases, the physician is a Family Practice doctor. These physicians are usually one of a few medical providers in a small town, and their patients rely on them for a wide variety of conditions. These participating physicians are all given faculty appointments and are supervised by a Clinical Coordinator. These physicians are required to attend training and development classes, some of which are provided through the state medical associations. Although WWAMI is funded as a four-year medical school and targeted to the training of medical students, the program is also integrated into the medical residency programs. Family Medicine is the best represented residency and the University of Washington has residency sites out in the WWAMI region. Rotations are done through small communities to give the medical residents a feel for practicing in rural areas. One example provided by the Dean is a general internist in Montana: because he is the only provider in that area, he has a comprehensive private practice and is able to share that with the residents. These residencies are sought after by medical residents, due to the high quality of the training provided. As an additional benefit for the WWAMI program, it has been shown that residents who train in rural areas are more likely to practice in rural areas. The University of Washington has seen strong results from their undergraduate medical education programs. Sixty-one percent of graduating students stay within the five-state area to practice medicine. Nearly 50 percent of all graduating students pursue a career in primary care medicine with 20 percent of all graduates practicing in Health Professional Shortage Areas following completion of residency programs.29 The University of Washington has 67 residency and fellowship programs with total enrollment of approximately 1,000 students. Of those 1,000 students, more than 300 are family practice residents under the umbrella of Regional Graduate Medical Education at U of W. During the second year of residency training, medical residents are required to participate in a four- to eight-week rotation in a rural or underserved urban location in the WWAMI region.29 The University of Washington has a strong reputation for doing research and does not seem to have difficulties with the tension between performing research and having a focus on primary care. In fact, the WWAMI program assists in drawing in research funds. The regional faculty, responsible for training first-year medical students at the regional schools, is identical to any medical school faculty with scholarly expectations for research. Over the last 10 years, this research is responsible for drawing in approximately $20 million in NIH funding annually. The University of Washington also performs a great deal of research around the provision of health services, focusing in the rural setting.

Report for the Louisiana Recovery Authority Support Foundation
Page 133
This Report is intended for the use and benefit of the
Louisiana Recovery Authority Support Foundation only and not intended for reliance by any other Party.
One of the reasons WWAMI has been so successful is the broad support it receives from both the federal and state governments. Although WWAMI was started with grant funding, it is now a line item on all the participating states’ budgets, except for the Washington State WWAMI (the University of Washington gets a lump sum from the state budget and it allocates money to each of its individual programs) If Louisiana wants to create a similar program, it may want to consider a similar funding mechanism. All students are required to pay in-state tuition for the University of Washington’s medical school. Each state is responsible for paying the difference between the instate tuition ($14,000/year) and the actual cost of education ($60,000/year). The state’s level of funding determines the number of enrollees. In 2005, Congress provided an additional $500,000 to fund the Demonstration: Assistance in Rural Training (DART) program. This program provides funding to residencies in each of the WWAMI states, in support of residency training in rural areas and encourages youth to enter the healthcare field.30 University of North Dakota School Of Medicine – Lessons for the Future The University of North Dakota School of Medicine is one of 18 community-based medical schools in the country. According to the AAMC, community-based medical schools "follow a nontraditional model in their relationship to affiliated hospitals and local physicians. They rely on community hospitals for clinical facilities, and they appoint many community physicians to their faculties."31 Community-based medical schools also have the tendency to have a strong focus on both primary care and rural medicine. In order to assure that residents receive the proper case mix and in order to best serve the community, community-based medical schools typically send medical students and medical residents to do rotations in urban, underserved and rural areas. The University of North Dakota stands out as a strong community-based medical school and can be used as a model system for Louisiana. The medical school is ranked third in rural medicine, according to U.S. News and World Report, which is the highest ranking among community-based medical schools. The medical school has approximately 230 students, with a faculty base of 130 full-time employees and more than 900 clinical faculty serving on a part-time or voluntary basis in communities throughout the state, to assist with training of both medical students and medical residents. The system has four primary clinical campuses spread throughout the state. At each of the campuses, students and residents use local physicians for training in community hospitals, clinics, physicians' offices, long-term care facilities and other healthcare settings. The first two years of undergraduate medical education are taught on the primary campus in Grand Forks. The curriculum for years one and two is designed to bridge the gap between the preclinical and clinical years. Students learn the basic sciences during this time and begin interacting with patients. Second-year medical students participate in an ambulatory care experience focusing on in-depth sessions of performing patient histories and physicals. Third- and fourth-year medical students are taught predominantly in clinical settings. Students are given the option of training at one of four clinical campuses. Third-year students are also provided with an option to participate in a program entitled Rural Opportunities in Medicine (ROME). ROME is a seven-month interdisciplinary experience in a rural primary care setting. During this time, students learn about problems commonly encountered in primary care, from routine health maintenance to medical emergencies and rare and unusual diagnosis. Students are under the supervision of board certified family medicine physicians during this experience. The University of North Dakota sponsors residency programs in internal medicine, psychiatry, surgery and family medicine. The residency programs use four primary clinical campuses with an overall mission
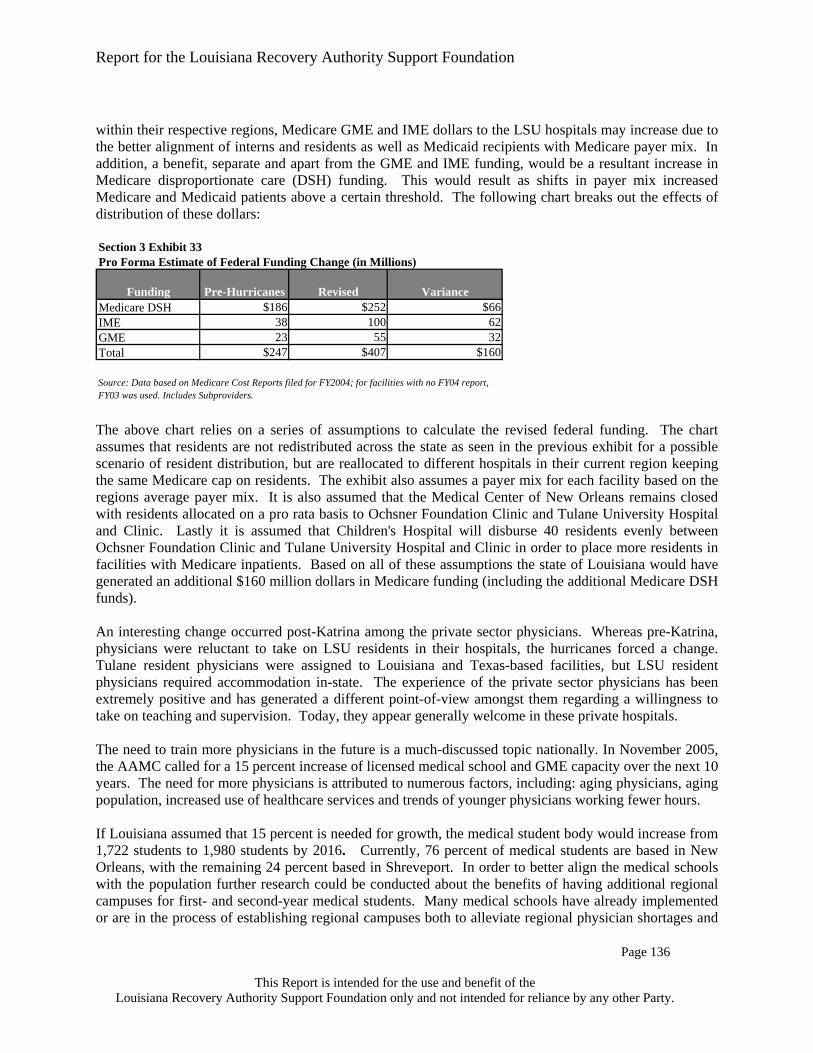
Report for the Louisiana Recovery Authority Support Foundation
Page 134
This Report is intended for the use and benefit of the
Louisiana Recovery Authority Support Foundation only and not intended for reliance by any other Party.
of providing patient-centered community care. The internal medicine and family medicine programs provide for electives in rural medicine.32 Lessons Learned from Benchmark Medical Programs The WWAMI program at the University of Washington and the University of North Dakota School of Medicine provides the following lessons which may be applicable to Louisiana: a medical school can stress the importance of research without harming primary care programs; medical students and residents who receive their training in rural settings are more likely to set up a practice in non urban areas; a medical school can leverage its primary/centralized campuses through affiliations with several satellite hospitals and clinics; and the use of part time and volunteer faculty can further enhance the learning experiences of both medical students and medical residents.
Future of Medical Education in Louisiana Post Hurricanes Pre-hurricanes, approximately 22 percent of the population and 70 percent of all medical residents were located or based in Region 1. In the middle population scenario discussed earlier in Section II, the population in Region 1 will decrease by 36 percent. In order to ensure that medical residents receive optimal training and contribute to healthcare for the lower population estimates, there is an increased need to disperse them throughout the state. The residents could be dispersed based upon areas of greatest population density, with specialists remaining in more urban areas and primary care residents training in both densely populated and rural areas. Another problem that should be addressed is the complexity of patients throughout the state. The current distribution of residents and the existing system of providing care to the uninsured in the LSU system not only financially disadvantages the LSU hospitals but is creating a suboptimal learning experience as residents in many cases are not exposed to a diverse population and complexity. For example, the lack of Medicare patients in the case mix means that, LSU residents may not have an opportunity to learn the intricacies and challenges of caring for elderly patients. The lack of Medicare patients can be correlated to LSU having only two medical residents specializing in geriatrics. The lower level of complexity means that primary care residents are less likely to focus on elder care and may not be able to provide appropriate levels of care when the need arises. Additionally, these residents are not being exposed to the types of other (insured) patients that they are likely to encounter with the highest frequency in private practice. There are benefits to both the communities and to the residents if some primary care training were moved to more rural settings and the existing two-tier system eliminated. The community benefits from having additional physicians working in underserved areas. Exposing residents and medical students to rural settings during their training may also help to steer more physicians into rural medicine as seen from the University of Washington. The residents benefit from receiving training in rural settings by gaining exposure to a wide variety of health conditions different from those in more urban settings. Disbursing residents to all regions allows for a better rural experience, better mix and better referral sources to tertiary LSU hospitals. The following exhibit suggests one possible scenario for future placement of primary care and specialty care residents. Here, residents are distributed based on population estimates. The chart assumes that the number of residents remains unchanged from present levels. An even distribution of primary care

Report for the Louisiana Recovery Authority Support Foundation
Page 135
This Report is intended for the use and benefit of the
Louisiana Recovery Authority Support Foundation only and not intended for reliance by any other Party.
residents throughout the state is one scenario of providing care to underserved areas while providing for a variety of training settings for primary care residents. Each resident could have as his or her home base one of the primary regional campuses located in New Orleans, Baton Rouge and Shreveport. Louisiana should also consider adding more primary care residents. The specialty care resident distribution was also completed using population estimates but only using regions 1, 2 and 7. This was done in order to provide specialty care residents the diverse case mix they require by placing them in more urban areas. The exhibit below proposes 91 primary care residents in Region 1. Tulane, the Ochsner Clinic and LSU combined have 338 primary care residency positions in the region. Tulane and Ochsner appear to have more than enough medical residents to cover the requirements for Region 1, while currently, LSU is the only system with the ability to establish residency programs throughout the rest of the state. Depending on future program structures or potential system changes, this could change.
Section 3 Exhibit 32
PC Resident Distribution
Specialty Resident Distribution
PC Resident Distribution
Specialty Resident Distribution
Region 1 353 909 91 410Region 2 53 37 98 442Region 3 0 0 56 0Region 4 47 0 81 0Region 5 0 0 39 0Region 6 0 0 43 0Region 7 131 241 74 335Region 8 21 0 49 0Region 9 0 0 73 0Total 605 1,187 605 1,187
Possible Scenario for Resident Re-distributionPre Katrina Future Scenario
Sources: ACGME for current distribution. Future scenario calculated based on medium population scenario.
With a realignment and re-distribution of both residents and medical students, there will be an increased demand for additional clinical faculty throughout the state. A community-based medical education model with primary care residents dispersed across the state will require part-time and volunteer community faculty as relied upon heavily by other state medical schools, such as the University of Washington and the University of North Dakota. A realignment of residents in the state may also increase federal funding for graduate medical education. Additional federal funding could result from a stronger alignment of residents and the Medicare population for those hospitals eligible to receive Direct Graduate Medical Education (GME) and Indirect Medical Education (IME) payments.. As previously discussed these dollars are distributed based on complex formulas reliant upon the ratio of Medicare patient days to total patient days. Historically LSU hospitals have received comparatively less of this funding yet incurred the full costs of training medical residents.. Due to the nature of the formula which calculates the reimbursement, some hospitals received less funding because they treated fewer Medicare patients than their counterparts while incurring the full teaching program costs. By accomplishing a shift in payer mix among the hospitals to create an "equalized" distribution of Medicare patient days and by reallocating LSU-HSC and LSU-HCD medical residents to other facilities

Report for the Louisiana Recovery Authority Support Foundation
Page 136
This Report is intended for the use and benefit of the
Louisiana Recovery Authority Support Foundation only and not intended for reliance by any other Party.
within their respective regions, Medicare GME and IME dollars to the LSU hospitals may increase due to the better alignment of interns and residents as well as Medicaid recipients with Medicare payer mix. In addition, a benefit, separate and apart from the GME and IME funding, would be a resultant increase in Medicare disproportionate care (DSH) funding. This would result as shifts in payer mix increased Medicare and Medicaid patients above a certain threshold. The following chart breaks out the effects of distribution of these dollars: Section 3 Exhibit 33Pro Forma Estimate of Federal Funding Change (in Millions)
Funding Pre-Hurricanes Revised VarianceMedicare DSH $186 $252 $66 IME 38 100 62GME 23 55 32Total $247 $407 $160
Source: Data based on Medicare Cost Reports filed for FY2004; for facilities with no FY04 report, FY03 was used. Includes Subproviders. The above chart relies on a series of assumptions to calculate the revised federal funding. The chart assumes that residents are not redistributed across the state as seen in the previous exhibit for a possible scenario of resident distribution, but are reallocated to different hospitals in their current region keeping the same Medicare cap on residents. The exhibit also assumes a payer mix for each facility based on the regions average payer mix. It is also assumed that the Medical Center of New Orleans remains closed with residents allocated on a pro rata basis to Ochsner Foundation Clinic and Tulane University Hospital and Clinic. Lastly it is assumed that Children's Hospital will disburse 40 residents evenly between Ochsner Foundation Clinic and Tulane University Hospital and Clinic in order to place more residents in facilities with Medicare inpatients. Based on all of these assumptions the state of Louisiana would have generated an additional $160 million dollars in Medicare funding (including the additional Medicare DSH funds). An interesting change occurred post-Katrina among the private sector physicians. Whereas pre-Katrina, physicians were reluctant to take on LSU residents in their hospitals, the hurricanes forced a change. Tulane resident physicians were assigned to Louisiana and Texas-based facilities, but LSU resident physicians required accommodation in-state. The experience of the private sector physicians has been extremely positive and has generated a different point-of-view amongst them regarding a willingness to take on teaching and supervision. Today, they appear generally welcome in these private hospitals. The need to train more physicians in the future is a much-discussed topic nationally. In November 2005, the AAMC called for a 15 percent increase of licensed medical school and GME capacity over the next 10 years. The need for more physicians is attributed to numerous factors, including: aging physicians, aging population, increased use of healthcare services and trends of younger physicians working fewer hours. If Louisiana assumed that 15 percent is needed for growth, the medical student body would increase from 1,722 students to 1,980 students by 2016. Currently, 76 percent of medical students are based in New Orleans, with the remaining 24 percent based in Shreveport. In order to better align the medical schools with the population further research could be conducted about the benefits of having additional regional campuses for first- and second-year medical students. Many medical schools have already implemented or are in the process of establishing regional campuses both to alleviate regional physician shortages and

Report for the Louisiana Recovery Authority Support Foundation
Page 137
This Report is intended for the use and benefit of the
Louisiana Recovery Authority Support Foundation only and not intended for reliance by any other Party.
to expand their capacities in response to the predicted coming physician shortage. Based on population estimates, Baton Rouge would be a likely candidate if additional campuses are to be created. It may also benefit the state to have additional regional campuses geographically located. Similar regional models have been explored or implemented in Washington, North Dakota, Florida, Virginia and Arizona to name a few. Additional research must also be performed to consider revising the medical school curriculum for first- and second-year students to include more clinical experiences. Schools such as University of Washington, University of North Dakota and Michigan State all place an emphasis on clinical experiences during the first two years of medical school In order to maintain parity between medical students and non-clinical faculty, there must be a redesign of the teaching program. Louisiana may want to consider a small-group learning model that requires more faculty than the traditional lecture-based model and to consider increasing the use of volunteer- and part-time faculty. Further research and study would need to be conducted to design the optimal size and make-up. When studying the faculty composition of Louisiana medical schools, further study and consideration should be given to identify strategies and best practices for increasing research and NIH grants to institutions in the state. Further investigation may be needed to determine if it is in the best interests of Louisiana to follow the 15 percent growth recommended by AAMC. Such growth may require a similar increase in faculty, although innovations in medical education, such as the use of patient simulators, distance learning and the like should be considered in decisions to expand the faculty The exhibit below estimates the size and salary cost of basic science faculty in Louisiana assuming a 15 percent and 20 percent growth in current faculty numbers. Compensation numbers are based on the 2005 Report on Medical School Faculty Salaries by the AAMC 2005 for basic science faculty in the Southern Region.33 The exhibit assumes that the calculated weighted mean salary of $118,000 remains constant during the 15 percent and 20 percent increase in total number of faculty. Section 3 Exhibit 34Pro Form Scenario of Medical School Faculty 0.15 0.2
Medical School
Total Full-Time Basic Science Faculty1
Estimated $ spent on Basic Science Faculty Total Compensation2
Total Full-Time Basic Science Faculty
Estimated $ spent on Basic Science Faculty Total Compensation
Total Full-Time Basic Science Faculty
Estimated $ spent on Basic Science Faculty Total Compensation
LSU School of Med - Shreveport 120 14,128,067 138 16,247,277 144 16,953,680Tulane U School of Medicine 79 9,300,977 91 10,696,124 95 11,161,173LSU School of Med - New Orleans 121 14,245,801 139 16,382,671 145 17,094,961
2005 15% Increase 20% Increase
Sources; (1) AAMC master file(2) Calculated Weighted Mean Salary for Basic Science Faculty.($117,733.89)"Report on Medical School Faculty Salaries 2004-2005." AAMC Data Services 2005. The same weighted mean salary is used for all three scenarios. No assumptions are made in regards to inflation, or any other form of growth. If Louisiana wants to increase its pipeline of physicians, it also should consider a 2004 AAMC survey that indicated 53 percent of all incoming medical students decided upon a medical career before or during high school. Another 21 percent decided upon a medical career during their first two years of undergraduate college. This high percentage (53 percent) indicates that the high-school years are critical in terms of getting high-school students interested in medical careers. Several medical schools have developed programs to reach out to high-school students, efforts that Louisiana may want to emulate.

Report for the Louisiana Recovery Authority Support Foundation
Page 138
This Report is intended for the use and benefit of the
Louisiana Recovery Authority Support Foundation only and not intended for reliance by any other Party.
Such efforts include:
University of Colorado Rural Health Scholars program brings minority, rural and economically disadvantaged high-school students to its Health Sciences Center.34
Boston University’s Mobile Lab program brings a biomedical classroom to 30 Boston-area high schools, including those in the inner city.35
Harvard University has created a biomedical science program that targets under-represented high-school and junior-college students.36
University of California San Francisco, through a branch campus in Fresno, sponsors a “Doctor’s Academy” program geared toward helping disadvantaged students get intensive academic and counseling preparation for college, combined with healthcare and community service experience.37
University of Nevada High School Medical Scholars program brings 20 high-school juniors to the medical school campus each summer for a 3-week program.38
North Louisiana Area Health Education Center (AHEC) offers a summer program in rural medicine. High school students spend five weeks volunteering and learning at a rural community hospital.39
It is important to note that restructuring the medical education programs can be very difficult to administer, requiring a great deal of time and energy to create an effective system. As Louisiana re-thinks medical school curriculums throughout the state, there are several recent innovations that should be considered as additions or further emphasized if already taught. One such innovation is the Chronic Care Model. "The Chronic Care Model identifies essential elements of a healthcare system that encourages high-quality chronic disease care. These elements are the community, the health system, self-management support, delivery system design, decision support and clinical information systems. Evidence-based change concepts under each element, in combination, foster productive interactions between informed patients who take an active part in their care and providers with resources and expertise. The model can be applied to a variety of chronic illnesses, healthcare settings and target populations. The bottom line is healthier patients, more satisfied providers and cost savings."40 Teaching the Chronic Care Model41 to medical students provides future physicians with an early exposure to innovative techniques to best care for patients in line with the recommendations of the Institute of Medicine.

Report for the Louisiana Recovery Authority Support Foundation
Page 139
This Report is intended for the use and benefit of the
Louisiana Recovery Authority Support Foundation only and not intended for reliance by any other Party.
Exposure to new and emerging technologies may prove beneficial to medical students. Technologies such as Physician Order Entry, Electronic Medical Records, electronic intensive care units and robotics, to name a few, will be essential in the future of medicine. Students should become familiar with how to use the technologies and to understand how the systems work so they can better analyze data to best serve patients.

Report for the Louisiana Recovery Authority Support Foundation
Page 140
This Report is intended for the use and benefit of the
Louisiana Recovery Authority Support Foundation only and not intended for reliance by any other Party.
Appendices for Workforce and Medical Education

Report for the Louisiana Recovery Authority Support Foundation
Page 141
This Report is intended for the use and benefit of the
Louisiana Recovery Authority Support Foundation only and not intended for reliance by any other Party.
Benchmark Medical SchoolsAppendix A
Medical School Background (1)University of Washington
U of W has a very strong reputation for training primary care physicians and for conducting high-quality biomedical research. It is ranked #1 in primary care and rural medicine, and was #1 in National Institutes of Health (NIH)[1] grant-funding for public schools in 2005. U of W also has a decentralized, community-based campus model that spans 5 states.
University of North Dakota UND is ranked #3 in rural health, which is the highest of all Community-Based[2] medical schools.
University of Alabama Located in a neighboring state, it has a strong reputation for primary care and research. It is ranked #32 in primary care and #23 in NIH research funding.
Michigan State University MSU has the highest primary care ranking of a Community Health medical school, with a ranking of 30. It also has a decentralized, community-based model of health care.
Source: US News and World Report Medical School Rankings, 2005.
[1] The NIH ranking is a widely recognized measure of the quality of research performed at a medical school.
[2] There are currently 18 Community-Based medical schools. These medical schools rely on community hospitals for clinical faculties and have the tendency to have a strong focus on both primary care and rural medicine.

Report for the Louisiana Recovery Authority Support Foundation
Page 142
This Report is intended for the use and benefit of the
Louisiana Recovery Authority Support Foundation only and not intended for reliance by any other Party.
Louisiana State Board of Nursing –Approved Nursing Programs Appendix B

Report for the Louisiana Recovery Authority Support Foundation
Page 143
This Report is intended for the use and benefit of the
Louisiana Recovery Authority Support Foundation only and not intended for reliance by any other Party.
Louisiana State Board of Nursing –Approved Nursing Programs Appendix B (Continued)

Report for the Louisiana Recovery Authority Support Foundation
Page 144
This Report is intended for the use and benefit of the
Louisiana Recovery Authority Support Foundation only and not intended for reliance by any other Party.
Total Residents Public Private Total Residents Public Private Allergy and Immunology 15 11 4 Nuclear Radiology 0 0 0
Anesthesiology 63 23 40 Obstetrics and Gynecology* 98 53 45Cardiovascular Disease 58 20 38 Oncology 3 0 3
Child and Adolescent Psychiatry 9 6 3 Ophthalmology 50 34 16
Child Neurology 2 2 0 Orthopaedic Sports Medicine 0 0 0Clinical Neurophysiology 3 3 0 Orthopaedic Surgery 70 34 36Colon and Rectal Surgery 5 1 4 Otolaryngology 39 25 14Critical Care Medicine 2 2 0 Pain Medicine 3 3 0
Cytopathology 3 3 0 Pathology-Anatomic and Clinical 36 24 12
Dermatology 28 15 13 Pediatric Cardiology 1 0 1
Dermatopathology 1 0 1 Pediatric Endocrinology 3 3 0
Emergency Medicine 109 109 0 Pediatric Gastroenterology 2 2 0
Endocrinology, Diabetes, and Metabolism 10 4 6 Pediatric Hematology/Oncology 4 4 0
Family medicine 158 122 36 Pediatric Infectious Diseases 4 0 4
Forensic Pathology 0 0 0 Pediatric Nephrology 1 0 1Forensic Psychiatry 4 1 3 Pediatric Orthopaedics 0 0 0Gastroenterology 24 9 15 Pediatric Pulmonology 3 0 3
Geriatric Medicine 3 2 1 Pediatric Radiology 0 0 0Geriatric Psychiatry 1 1 0 Pediatrics* 105 71 34
Hematology 1 0 1Peds/Psych/Child-Adolescent Psych (non-accredited) 4 0 4
Hematology and Oncology 21 15 6 Physical Medicine and Rehabilitation 24 24 0Infectious Disease 15 8 7 Plastic Surgery 8 4 4
Internal Medicine* 280 162 118Preventive Medicine (General, Public Health, Occ Med, Aer) 2 0 2
Internal Medicine/Dermatology (non-accredited) 1 1 0 Psychiatry 81 58 23Internal Medicine/Emergency Medicine (non-accredited) 10 10 0
Psychiatry/Neurology (non-accredited) 4 0 4
Internal Medicine/Neurology (non-accredited) 3 0 3
Pulmonary Disease and Critical Care Medicine 26 16 10
Internal Medicine/Pediatrics (non-accredited)* 62 38 24 Radiology-Diagnostic 78 40 38Internal Medicine/Preventive Medicine (non-accredited) 3 0 3 Rheumatology 8 6 2Internal Medicine/Psychiatry (non-accredited) 3 0 3 Sports Medicine 2 2 0Interventional Cardiology 2 0 2 Surgery-General 134 76 58Medical Genetics 0 0 0 Surgical Critical Care 2 2 0Neonatal-Perinatal Medicine 2 2 0 Thoracic Surgery 2 0 2Nephrology 19 12 7 Transitional Year 4 0 4Neurological Surgery 18 11 7 Urology 24 8 16
Neurology 22 15 7Vascular and Interventional Radiology 2 2 0
Neuroradiology 2 2 0 Vascular Surgery 3 1 2
Residents In Louisiana, according to ACGME Section 3 Appendix C1

Report for the Louisiana Recovery Authority Support Foundation
Page 145
This Report is intended for the use and benefit of the
Louisiana Recovery Authority Support Foundation only and not intended for reliance by any other Party.
Section 3 Appendix C2Breakdown of Residency Programs
Baton Rouge General Medical Center
E A Conway Medical Center
Earl K Long Medical Center
East Jefferson General Hospital
University Medical Center (Lafayette)
Emergency Medicine 37Family medicine 21 21 15 23Internal Medicine 32 24
source: ACGME

Report for the Louisiana Recovery Authority Support Foundation
Page 146
This Report is intended for the use and benefit of the
Louisiana Recovery Authority Support Foundation only and not intended for reliance by any other Party.
Section 3 Appendix C3Breakdown of LSU, New Orleans Residency Programs
Louisiana State University Program
Lake Charles Program
Kenner Program
Alton Ochsner Medical Foundation Program Joint
ProgramTulane University
Program Joint ProgramAllergy and Immunology 7AnesthesiologyCardiovascular Disease (IM) 10Child and Adolescent Psychiatry (P) 6Child Neurology (N) 2Clinical Neurophysiology (N) 3Colon and Rectal SurgeryCritical Care Medicine (IM)Cytopathology (PTH) 1Dermatology 15Dermatopathology (D and PTH)Emergency Medicine 58Endocrinology, Diabetes, and Metabolism (IM) 2Family medicine 17 20Forensic Pathology (PTH)Forensic Psychiatry (P) 1Gastroenterology (IM) 6Geriatric Medicine (FP) 2Geriatric Psychiatry (P) 1Hematology (PTH)Hematology and Oncology (IM) 2Infectious Disease (IM) 6Internal Medicine 51Internal Medicine/Dermatology (non-accredited) 1Internal Medicine/Emergency Medicine (non-accredited) 10Internal Medicine/Neurology (non-accredited)Internal Medicine/Pediatrics (non-accredited) 26Internal Medicine/Preventive Medicine (non-accredited)Internal Medicine/Psychiatry (non-accredited)Interventional Cardiology (IM) 0Medical GeneticsNeonatal-Perinatal Medicine (PD) 1Nephrology (IM) 6Neurological Surgery 6Neurology 7Neuroradiology (DR) 2Nuclear Radiology (DR) 0Obstetrics and Gynecology 30Oncology (IM)Ophthalmology 26Orthopaedic Sports Medicine (ORS) 0Orthopaedic Surgery 20Otolaryngology 15Pain Medicine 1Pathology-Anatomic and Clinical 12Pediatric CardiologyPediatric Endocrinology (PD) 3Pediatric Gastroenterology (PD) 2Pediatric Hematology/Oncology (PD) 4Pediatric Infectious Diseases (PD)Pediatric Nephrology (PD)Pediatric Orthopaedics (ORS) 0Pediatric Pulmonology (PD)Pediatric Radiology (DR) 0Pediatrics 48Peds/Psych/Child-Adolescent Psych (non-accredited)Physical Medicine and Rehabilitation 24Plastic Surgery 4Preventive Medicine (General, Public Health, Occ Med, Aer)Psychiatry 39Psychiatry/Neurology (non-accredited)
Pulmonary Disease and Critical Care Medicine (IM) 10Radiology-Diagnostic 28Rheumatology (IM) 2Sports Medicine (FP) 2Surgery-General 49Surgical Critical Care (GS) 2Thoracic SurgeryTransitional YearUrologyVascular and Interventional Radiology (DR) 2Vascular Surgery (GS) 1
Source: ACGME.org
Louisiana State University School of Medicine, New Orleans

Report for the Louisiana Recovery Authority Support Foundation
Page 147
This Report is intended for the use and benefit of the
Louisiana Recovery Authority Support Foundation only and not intended for reliance by any other Party.
Section 3 Appendix C4Breakdown of LSU, Shreveport Residency Programs
Shreveport Shreveport Rural ProgramRapides Regional Medical
Center ProgramAllergy and Immunology 4Anesthesiology 23Cardiovascular Disease (IM) 10Child and Adolescent Psychiatry (P)Child Neurology (N)Clinical Neurophysiology (N)Colon and Rectal Surgery 1Critical Care Medicine (IM) 2Cytopathology (PTH) 2DermatologyDermatopathology (D and PTH)Emergency Medicine 14Endocrinology, Diabetes, and Metabolism (IM) 2Family medicine 19 5 17Forensic Pathology (PTH)Forensic Psychiatry (P)Gastroenterology (IM) 3Geriatric Medicine (FP)Geriatric Psychiatry (P)Hematology (PTH)Hematology and Oncology (IM) 13Infectious Disease (IM) 2Internal Medicine 55Internal Medicine/Dermatology (non-accredited)Internal Medicine/Emergency Medicine (non-accredited)Internal Medicine/Neurology (non-accredited)Internal Medicine/Pediatrics (non-accredited) 12Internal Medicine/Preventive Medicine (non-accredited)Internal Medicine/Psychiatry (non-accredited)Interventional Cardiology (IM)Medical GeneticsNeonatal-Perinatal Medicine (PD) 1Nephrology (IM) 6Neurological Surgery 5Neurology 8Neuroradiology (DR)Nuclear Radiology (DR)Obstetrics and Gynecology 23Oncology (IM)Ophthalmology 8Orthopaedic Sports Medicine (ORS)Orthopaedic Surgery 14Otolaryngology 10Pain Medicine 2Pathology-Anatomic and Clinical 12Pediatric CardiologyPediatric Endocrinology (PD)Pediatric Gastroenterology (PD)Pediatric Hematology/Oncology (PD)Pediatric Infectious Diseases (PD)Pediatric Nephrology (PD)Pediatric Orthopaedics (ORS)Pediatric Pulmonology (PD)Pediatric Radiology (DR)Pediatrics 23Peds/Psych/Child-Adolescent Psych (non-accredited)Physical Medicine and RehabilitationPlastic SurgeryPreventive Medicine (General, Public Health, Occ Med, Aer)Psychiatry 19Psychiatry/Neurology (non-accredited)
Pulmonary Disease and Critical Care Medicine (IM) 6Radiology-Diagnostic 12Rheumatology (IM) 4Sports Medicine (FP)Surgery-General 27Surgical Critical Care (GS)Thoracic SurgeryTransitional YearUrology 8Vascular and Interventional Radiology (DR)Vascular Surgery (GS)
Source: ACGME.org
LSU Health Sciences Center-University Hospital
Report for the Louisiana Recovery Authority Support Foundation
Page 148
This Report is intended for the use and benefit of the
Louisiana Recovery Authority Support Foundation only and not intended for reliance by any other Party.
Section 3 Appendix C5Breakdown of Ochsner and Tulane Residency Programs
Ochsner Clinic Foundation Program
Ochsner Clinic Foundation/Louisiana State
University Program Tulane University Program
Tulane University School of Public Health and Tropical
Medicine ProgramAllergy and Immunology 4Anesthesiology 18 22Cardiovascular Disease (IM) 20 18Child and Adolescent Psychiatry (P) 3Child Neurology (N)Clinical Neurophysiology (N)Colon and Rectal Surgery 2 2Critical Care Medicine (IM)Cytopathology (PTH) 0Dermatology 13Dermatopathology (D and PTH) 1Emergency MedicineEndocrinology, Diabetes, and Metabolism (IM) 2 4Family medicineForensic Pathology (PTH)Forensic Psychiatry (P) 3Gastroenterology (IM) 6 9Geriatric Medicine (FP) 1Geriatric Psychiatry (P)Hematology (PTH) 1Hematology and Oncology (IM) 6Infectious Disease (IM) 2 5Internal Medicine 44 74Internal Medicine/Dermatology (non-accredited)Internal Medicine/Emergency Medicine (non-accredited)Internal Medicine/Neurology (non-accredited) 3Internal Medicine/Pediatrics (non-accredited) 24Internal Medicine/Preventive Medicine (non-accredited) 3Internal Medicine/Psychiatry (non-accredited) 3Interventional Cardiology (IM) 2Medical Genetics 0Neonatal-Perinatal Medicine (PD)Nephrology (IM) 7Neurological Surgery 7Neurology 7Neuroradiology (DR)Nuclear Radiology (DR)Obstetrics and Gynecology 16 29Oncology (IM) 3Ophthalmology 16Orthopaedic Sports Medicine (ORS) 0Orthopaedic Surgery 12 24Otolaryngology 14Pain MedicinePathology-Anatomic and Clinical 12Pediatric Cardiology 1Pediatric Endocrinology (PD)Pediatric Gastroenterology (PD)Pediatric Hematology/Oncology (PD)Pediatric Infectious Diseases (PD) 4Pediatric Nephrology (PD) 1Pediatric Orthopaedics (ORS)Pediatric Pulmonology (PD) 3Pediatric Radiology (DR)Pediatrics 34Peds/Psych/Child-Adolescent Psych (non-accredited) 4Physical Medicine and RehabilitationPlastic Surgery 4Preventive Medicine (General, Public Health, Occ Med, Aer) 2Psychiatry 23Psychiatry/Neurology (non-accredited) 4
Pulmonary Disease and Critical Care Medicine (IM) 10Radiology-Diagnostic 21 17Rheumatology (IM) 2Sports Medicine (FP)Surgery-General 29 29Surgical Critical Care (GS) 0Thoracic Surgery 2Transitional Year 4Urology 8 8Vascular and Interventional Radiology (DR)Vascular Surgery (GS) 2
Source: ACGME.org
Ochsner Clinic Foundation Tulane University School of Medicine

Report for the Louisiana Recovery Authority Support Foundation
Page 149
This Report is intended for the use and benefit of the
Louisiana Recovery Authority Support Foundation only and not intended for reliance by any other Party.
Section 3 Appendix DMission StatementsLSU New Orleans The mission of the Louisiana State University Health Sciences Center in New
Orleans (LSUHSC-NO) is to provide education, research, and public service through direct patient care and community outreach. LSUHSC-NO comprises the Schools of Allied Health Professions, Dentistry, Graduate Studies, Medicine, Nursing, and Public Health.
LSU Shreveport The primary mission of Louisiana State University Health Sciences Center - Shreveport (LSUHSC-S) is to provide education, patient care services, research, and community outreach. LSUHSC-S encompasses the School of Medicine in Shreveport, the School of Graduate Studies in Shreveport, the School of Allied Health Professions in Shreveport, the LSU Hospital and E. A. Conway Medical Center.
Tulane University Hospital and Clinic
The mission of Tulane University Hospital and Clinic and Tulane Hospital for Children is to provide individualized, quality ambulatory and inpatient health care services in partnership with the Tulane University Medical Group. Education and research programs conducted at Tulane University Hospital and Clinic play an integral part in providing high quality patient care services and reflect our relationship with the Tulane University School of Medicine and the Tulane University School of Public Health and Tropical Medicine.
Report for the Louisiana Recovery Authority Support Foundation
Page 150
This Report is intended for the use and benefit of the
Louisiana Recovery Authority Support Foundation only and not intended for reliance by any other Party.
Sources and Notes 1. Health Leaders Inter-Study. New Orleans After Hurricane Katrina. 2005. 2. GAO-06-576R Status of the Health Care System in New Orleans
http://www.gao.gov/new.items/d06576r.pdf. 3. Kaiser: Statehealthfacts.org. 4. Louisiana Health Work Commission. 2nd Report of the Louisiana Health Work
Commission: A Call to Action. 5. MDs in direct patient care were counted; residents, interns and fellows were not included in
this data. 6. Chapman,S.e.al. Allied Health Workforce: Innovations for the 21st Century. The Allied
and Auxiliary Health Care Workforce Project P3. 7. Presentation: "The State of Allied Health in North Carolina". Council for Allied Health in
North Carolina. 2005. 8. Louisiana Health Works Commission. Ensuring a Competent, Caring Workforce for
Louisiana. 24. 2003. 9. Rand Corporation. Recruitment and Retention of a High-Quality Healthcare Workforce. 7.
2006. 10. Morgan Quinto Press. 16th Annual Most Livable State 2006. 2006. 11. Primary care, social inequalities, and all-cause, heart disease, and cancer mortality in US
counties, 1990. American Journal of Public Health 95[4]. 2005. 12. Interview with Susan Moreland, Executive Director of North Louisiana Area Health
Education Center. 2006. 13. Illinois Institute for Rural Affairs. Strategies for Addressing the Nursing Shortage:
Examples from Illinois, Iowa, Kansas, Missouri, and Nebraska. 15[1], 1. 2003. 14. Results of the 2002 AHCA Survey of Nursing Staff Vacancy and Turnover in Nursing
Homes; American Organization of Nurse Executives, Acute Care Hospital Survey of RN Vacancy and Turnover Rates. 2002.
15. Calculated using 2004 BLS data. 16. National Academy of Sciences. Crossing the Quality Chasm. 2001. 17. Louisiana Department of Health and Hospitals. 2004 Louisiana Health Report Card. 2005. 18. AAMC data warehouse. 19. LSU New Orleans and LSU Shreveport exclusively accept Louisiana residents with
exceptions given to legacies, and for those applying for combined M.D. PhD programs. Those exceptions are not reflected in exhibit 5.
20. The Impending Collapse of Primary Care Medicine and Its Implications for the State of the Nation's Health Care: A Report from the American College of Physicians. 2006.
21. US News and World Report Medical School Rankings 2005 edition. 22. Tripp Umbach. The Economic Impact of Medical College and Teaching Hospital Members
of the Association of American Medical Colleges.". Healthcare Consulting,Inc. 2003. 23. Louisiana Office of Primary Care and Rural Health. The Importance of the Health Care
Sector on the Economy of Louisiana. 24. LSU New Orleans Medical School
http://www.medschool.lsuhsc.edu/medical_education/undergraduate/. 25. LSU New Orleans, GME, http://www.medschool.lsuhsc.edu/medical_education/graduate/. 26. LSU- Shreveport, http://www.sh.lsuhsc.edu/medschool/index.html. 27. LSUHC-S Family Medicine Rural Training Tract, http://lib-
sh.lsuhsc.edu/fammed/residncy/fprural.html.

Report for the Louisiana Recovery Authority Support Foundation
Page 151
This Report is intended for the use and benefit of the
Louisiana Recovery Authority Support Foundation only and not intended for reliance by any other Party.
28. Tulane University School of Medicine, http://www.fammed.tulane.edu/clerkship/about.html.
29. Phone Interview with Dean Ramsey, University of Washington. 2006. 30. University of Washington School of Medicine. WWAMI Regional Report: 2005 Wyoming
State Report. 2006. 31. American Association of Medical Colleges.
http://www.aamc.org/data/ocd/fielddefinitions.htm. 32. University of North Dakota School of Medicine and Health,
http://www.med.und.nodak.edu/. 33. AAMC. Report on Medical School Faculty Salaries 2004-2005. 21. 2005. 34. University of Colorado. University of Colorado 2004 Annual Report. 2005. 35. Mulligan,L. Mobile Lab Takes Science for a Spin" NIH News Brief. 1998. 36. The Biomedical Science Careers Program,I. Mission and Overview of Program. 2006. 37. UCSF Fresno Doctors Academy,
http://www.ucinthevalley.org/articles/2004/nov12art1.htm. 38. University of Nevada, http://www.unr.edu/med/dept/k_12/hs_medschol.htm. 39. North Louisiana Area Health Education Center (AHEC). 40. Improving Chronic Illness Care, a program of the Robert Wood Johnson Foundation. 41. National Institute of Drug Abuse,
http://www.drugabuse.gov/NIDA_notes/NNVol18N3/Discovering.html.

Report for the Louisiana Recovery Authority Support Foundation
Page 152
This Report is intended for the use and benefit of the
Louisiana Recovery Authority Support Foundation only and not intended for reliance by any other Party.
SECTION IV: PUBLIC AND PRIVATE TECHNOLOGY INFRASTRUCTURE
Introduction Prior to the 2005 hurricane season, healthcare in Louisiana and along the Gulf Coast was delivered and managed as it had been for many years. Few providers, whether hospital or ambulatory, used electronic medical records or had any means of electronically sharing patient data. Patient data was stored on paper, and every location where the patient had received treatment had a paper record for that patient. The tragic events of Katrina and Rita emphasized the need for rapidly advancing the use of health information technology in Louisiana. Health information technology (HIT) means different things to different people. For some, HIT is a computer in a doctor’s office that is used for scheduling appointments and billing. For others, it means medical equipment, such as an MRI machine or an insulin pump. And for another audience, HIT means the full range of technology that encompasses administrative tools (e.g., scheduling, billing), diagnostic and treatment tools (e.g., MRI, insulin pump, robotics), telemedicine, and comprehensive tools that allow for the storage and use of all data related to a patient’s medical care (i.e., health history, medication record, clinical notes). Regardless of how broadly one categorizes health information technology, its affect on quality and cost are increasingly valued and documented. For example, one of every seven primary care visits is affected by missing medical information, leading to duplication of, or delays in, care and testing, along with unnecessary costs to the patient.1 According to the Center for Information Technology Leadership, approximately one-fifth of medical errors are due to inadequate availability of patient information.2 Capturing and storing data electronically means that it can be saved, accessed, shared and updated with much greater ease than when it is stored on paper. Patients can quickly get information when they need it, such as immunization records. Providers can review medical histories and make more informed clinical decisions, such as not duplicating recent tests or ordering medications with known allergens. Payers will appreciate knowing that more efficiency is being achieved and that those efficiencies will lead to reduced costs and, hopefully, healthier patients. The inherent “portability” and accessibility of electronic data means that in the event of another catastrophic event, providers and patients will be able to retrieve their medical information, reducing the potential for complications and adverse events. On a day-to-day basis, as people see multiple providers, their medical history is readily available to support their care in a more ideal way. When patients are electronically connected to their health records, they can stay involved in their care, checking results, receiving reminders of appointments and suggestions for preventative care.
Research
Interviews with national and state IT leaders; National and state IT reports; and Online references included in footnotes and appendix.

Report for the Louisiana Recovery Authority Support Foundation
Page 153
This Report is intended for the use and benefit of the
Louisiana Recovery Authority Support Foundation only and not intended for reliance by any other Party.
Key Findings and Recommendations Key Finding: Information technology infrastructure in Louisiana is immature. In Louisiana, a digital technology infrastructure or "backbone" is an important requirement for healthcare continuity in time of disaster, as well as the enabling foundation for a system of healthcare for all Louisianans that is integrated, continuous and patient-centered. Similar to the situation in other states, Louisiana payers and providers have not invested heavily in information technology and are not well connected. Among hospitals, a number of initiatives are under way. However, only an estimated five percent of physicians in Louisiana are using electronic records. Cross-sector efforts and exchanges, such as the Florida Health Information Network, are worth emulating. The Florida network is designed to support community or regional exchanges of information, yet is technically supported by a statewide server.
Recommendation 13: The Department of Health and Hospitals should formalize its post-hurricanes activities by creating a statewide organizing body – the Louisiana Health Information Organization – for the purpose of defining, deploying, governing and sustaining the digital backbone efforts of all of the healthcare stakeholders in the state. Urgently required is the successful deployment of the current plan for 2006, which has already been funded by the National Coordinator of Health Information Technology (ONCHIT). The required management activities over the next 3 to 5 years are expected to increase the use of electronic health records. Establishment of a health information exchange is estimated to cost an additional $35 million in infrastructure and approximately an incremental $10 million annually in operating costs. These activities are a necessary element of healthcare system improvement. This investment is what’s needed for the exchange of healthcare information. It does not include the capital that would be required to implement electronic medical records in Louisiana’s physician offices, ambulatory clinics, hospitals and long-term care facilities. After the hurricanes and as a direct result of the significant loss of paper medical records, the Department of Health and Hospitals initiated a series of activities to connect patients to lost information. In collaboration with the private sector, Katrina.org was launched, which provided prescription drug information to pharmacists so that needed prescriptions could be filled for evacuees separated from their medical records. Since then, DHH has continued its efforts, having received a $4 million grant from the Office of the ONCHIT. In addition, it has begun to enlist stakeholders in Louisiana to push forward preparedness for the next hurricane season and plan for the creation of a permanent digital infrastructure for the state. (Note that the estimated capital costs for the exchange are based upon similar costs incurred and/or projected for similar regional health information exchange organizations, per estimated connected provider and emergency preparedness site.)

Report for the Louisiana Recovery Authority Support Foundation
Page 154
This Report is intended for the use and benefit of the
Louisiana Recovery Authority Support Foundation only and not intended for reliance by any other Party.
Chronology of Health Information Technology Over the years, the healthcare industry has inched towards automation and the use of computer systems to support care delivery and payment for that care. The pharmacy sector was among the first to embrace technology. Today, the only paper in a pharmacy is usually that of the hand-written prescription that the patient presents to the pharmacist. In 2005, over three billion prescriptions were filled3 and the vast majority of these were billed electronically. Hospitals and physician offices have built or purchased software that supports their practice management/revenue cycle needs, such as registration, scheduling and billing. Others have added functionality that replaces the patient’s paper chart, so that all documentation (history, diagnosis and allergies), orders and test results are stored electronically. Electronic medical records were used in nearly one third of emergency (31.2 percent) and outpatient hospital settings (28.6 percent) and less frequently (17.2 percent) in physician offices. Approximately 73 percent of physicians used information technology for billing patients, but only eight percent used computerized systems for ordering prescriptions electronically.4
With the growth of the healthcare industry and the changes in complexity of care, expectations of the quality and caliber of care have grown. As discussed in Section I, the Institute of Medicine has focused a great deal of effort on addressing the issue of quality, recommending a redesigned system that sets performance expectations.
Understanding the role of information sharing to improve quality, Congress passed the Medicare Prescription Drug Improvement and Modernization Act (MMA) in 2003. “The legislation anticipates that we can facilitate these overarching goals by providing incentives for system redesigns built on adoption and use of decision support tools by physicians and their patients, such as evidence based medicine guidelines, best practice guidelines and shared decision-making programs; reform of payment methodologies; measurement of outcomes; and enhanced cultural competence in the delivery of care.”5 The law suggests that the redesigned system will increase the role of patients in managing their health, through improved and expanded patient education programs to address self-care skills. It reinforces the messages from the IOM 2 report of safety, timeliness, effectiveness, efficiency, equitability and patient-centeredness. In April 2004, President Bush issued an executive order that led to the creation of the Office for the National Coordinator for Health Information Technology (ONCHIT) to lead development and nationwide implementation of an “interoperable health information technology infrastructure to improve the quality and efficiency of healthcare and the ability of consumers to manage their care and safety.”6 ONCHIT provides a central coordinating function for the myriad of health technology initiatives throughout the country. Another key function of ONCHIT is the commitment to the development and use of technical standards for the exchange of information. Some of these standards are transaction/transmission oriented, but others are vocabulary focused. The adoption of technical standards is imperative to successful interoperability. For example, every entity must be able to know that a reference to serum potassium has the exact same meaning regardless of who is sending or receiving the serum value.

Report for the Louisiana Recovery Authority Support Foundation
Page 155
This Report is intended for the use and benefit of the
Louisiana Recovery Authority Support Foundation only and not intended for reliance by any other Party.
ONCHIT established a strategic framework with four major goals that will need to be achieved in order for the work of ONCHIT to be viewed as successful. These four goals echo the information contained in MMA.
Goal 1: Inform Clinical Practice. Informing clinical practice is fundamental to improving care and making healthcare delivery more efficient. This goal centers largely on efforts to bring EHRs directly into clinical practice. This will reduce medical errors and duplicative work and enable clinicians to focus their efforts more directly on improved patient care. Goal 2: Interconnect Clinicians. Interconnecting clinicians will allow information to be portable and to move with consumers from one point of care to another. This will require an interoperable infrastructure to help clinicians get access to critical healthcare information when their clinical and/or treatment decisions are being made. Goal 3: Personalize Care. Consumer-centric information helps individuals manage their own wellness and assists with their personal healthcare decisions. The ability to personalize care is a critical component of using healthcare information in a meaningful manner. Goal 4: Improve Population Health. Population health improvement requires the collection of timely, accurate and detailed clinical information to allow for the evaluation of healthcare delivery and the reporting of critical findings to public health officials, clinical trials and other research and feedback to clinicians.7
“The value of HIT will be best realized under the conditions of a competitive technology industry, privately operated support services, choice among clinicians and provider organizations, and payers who reward clinicians based on quality.”7 The potential to connect clinicians and patients became apparent when Hurricane Katrina scattered Louisiana’s residents throughout the country. KatrinaHealthSM was started in the first month after Katrina. Designed to provide authorized providers with access to evacuees’ prescription history, KatrinaHealth was a collaborative effort among numerous public and private entities. In order to address privacy and confidentiality concerns, records relating to certain medications were not included. Having access to medication history meant that providers were better prepared to appropriately care for evacuees. The data meant fewer adverse events related to prescriptions, as allergens and duplicate therapy could be avoided. Among the challenges faced were making sure that providers and pharmacies were registered as authorized users. Concerns about privacy and security were also raised and addressed. By only allowing authorized users to access data and logging that activity, many of the concerns were resolved. Assuring the completeness and integrity of the data was also a concern, as not all evacuees’ prescription records may have been available. Depending upon which pharmacy they used, or if they had coverage for their prescriptions, data may have been incomplete. Providers were encouraged to validate the information from KatrinaHealth with their patients.

Report for the Louisiana Recovery Authority Support Foundation
Page 156
This Report is intended for the use and benefit of the
Louisiana Recovery Authority Support Foundation only and not intended for reliance by any other Party.
“Still, the fact that KatrinaHealth.org was not available immediately underscores the need for open, common standards for health interoperability in the United States and reinforces the importance of current public and private activities to achieve the ability to exchange health information electronically.”8 As a result of the tragic events of 2005, Louisiana is now in position to rebuild the healthcare system in such a way as to lead the rest of the country. A strong technology infrastructure will support the delivery of care and related processes, which may ultimately lead to a healthier Louisiana. A healthier Louisiana will include tools that support and enable clinical decision support, public health priorities, quality and patient safety standards, personal health record management, community health resource management and health policy formulation.
Current State of Health Information Technology in Louisiana A number of entities in Louisiana have implemented health information technology in a variety of ways. Hospitals and physicians are slowly moving towards greater adoption of electronic records, but there is a need for increased coordination and communication to maximize the benefits that are possible. Based on the research, it is estimated that approximately 5 percent of physicians in Louisiana are using electronic records. One of the biggest challenges is the capital needed to ensure that all stakeholders in healthcare are able to connect and share data electronically. To implement an electronic health record system in an ambulatory setting, initial costs would be estimated at $18,000 to $25,000 per provider. Annual operating costs are not insignificant, including maintenance, support, data storage and hardware upgrades. Considering most providers practice in small groups, sufficient capital is a barrier for any small business to overcome. Some discussions and initiatives are under way to provide resources to get providers “wired.” However, providers will have to commit additional capital to move into this technology. Ultimately, they will see significant benefits from the investment, both in actual savings derived from improved operating efficiencies and in their daily workflow changes. Having immediate access to better data allows for the provision of better care, stronger relationships with patients and better management of the financial resources needed to provide healthcare services. Efforts under way include: Ten critical access hospitals, which are small rural facilities, have received a grant through the Louisiana Rural Health Information Technology Partnership to increase the use of technology in their emergency departments.9 Ochsner Clinic Foundation has spent many years developing their electronic record systems, which provide on-line access for their providers. The systems provide scheduling, registration, referral management and some order processing. Ochsner uses Siemens InVision for its hospital system, which interfaces with the scheduling/registration system. Nursing staff document clinical notes, enter orders and use the medication management and pharmacy functions. Physicians continue to document on paper and order either verbally or on paper. Lab, radiology, transcription and discharge summaries are all housed in Ochsner’s repository and can be viewed electronically.

Report for the Louisiana Recovery Authority Support Foundation
Page 157
This Report is intended for the use and benefit of the
Louisiana Recovery Authority Support Foundation only and not intended for reliance by any other Party.
Our Lady of the Lake is using 24 applications offered by Cerner Millennium, and there are plans under way to roll this system to the other FMOL (Franciscan Missionaries of Our Lady) hospitals. Nurses are using Cerner and physicians have remote access to some of the Cerner components (PACS and PowerChart). Plans to increase physician adoption are being implemented. An integrated ambulatory EMR will be piloted later this spring or early this summer. This will likely be an ASP model with the goal of offering an interface to the provider’s project management system. East Jefferson General Hospital uses a combination of tools from Siemens and Cerner. It offers patients the ability to schedule appointments and receive physician referrals on-line via their website (http://www.eastjeffhospital.org/myejgh/healthfinder/index.html). West Jefferson Medical Center has been using clinical tools from Eclipsys for several years, including its wireless technology. Its focus has been on implementing tools for the WJMC staff; patient tools are not yet available. Tulane University Hospital and Clinic uses MediTech as its health information system in the hospital and IDX as the practice management system for their clinics. The MediTech system offers a complete range of EHR tools. Tulane has implemented integration software that will assist in coordinating the data stored in the two systems and will manage its Enterprise Master Patient Index throughout its hospital and clinics. Currently, Tulane does not provide on-line tools for patients. Blue Cross Blue Shield of Louisiana is moving forward with plans to develop and deploy a number of tools to assist their providers and members become more connected. Included in these plans are a pilot for a provider EMR system, a personal health record (for member use) and a claims health record built from the data in their claims system. With its market penetration and the sophistication of its information technology systems, BCBSLA has data and resources that will be valuable in building a connected healthcare system. Louisiana State University’s Medical Informatics and Telemedicine Program has developed two key information systems – SMaRDI (the Shared Medical Record Data Infrastructure) and CLIQ (Clinical Inquiry). With assistance from HRSA, PATH (Partnership for Access to Healthcare) and four Catholic Health Systems, LSU built these tools and is responsible for ongoing development and maintenance. These systems allow providers access to clinical information. See Appendix 3 for a list of providers using these tools. SMaRDI is comprised of four primary components:
Clinical Data Repository (CDR); Master Patient Index; HL7 Interface Engine with real-time HL7 data interfaces; and HIPAA compliant authentication and access control system.
The CDR contains patient demographic and visit history data, laboratory test results, pathology, cardiology, EMG and radiology reports, pharmacy prescription data, admission history and physical notes, operative notes, discharge summaries and selected outpatient clinical notes. (MaRDI processes more than 50,000 HL7 messages per day, and the CDR houses more than 28.50 million results and reports.)

Report for the Louisiana Recovery Authority Support Foundation
Page 158
This Report is intended for the use and benefit of the
Louisiana Recovery Authority Support Foundation only and not intended for reliance by any other Party.
CLIQ is a Web-based results reporting application and clinical user interface that provides efficient and easy access to information housed in the SMaRDI CDR. CLIQ organizes data in a clinically intuitive, patient-centric format, permitting access to all electronically available results and reports in a single location, independent of the legacy system from which the data originated. Clinicians can access data on CLIQ from any Web-enabled computer from office, hospital or home (with a secure Internet connection).10
The work of these entities represents primarily independent efforts; information systems that allow for electronic access within the constraints of the healthcare entity/organization. The SMaRDI and CLIQ efforts are slightly broader, but still restricted to providers affiliated with certain organizations. What is needed is to expand the sharing of data throughout the community and the state. There is some early exploration of this, including: “The Capital Area Access Partnership, administered by Access Health Inc. The partnership was created to support the exchange of health information among care providers in the Baton Rouge community. Through the HRSA’s Health Communities Access Program (HCAP) grant, the hospitals will use IT to facilitate care for the uninsured and under-insured population of greater Baton Rouge. The collaboration is planning a community-wide system to integrate diverse healthcare information systems within the capital area region of the state. The project’s objective is to bring about standards-based data sharing across multiple care sites. The HCAP is a coalition of diverse medical providers consisting of public hospitals, private not-for-profit hospitals and outpatient community health centers. Following the planning process stage, a pilot project consisting of an integrated electronic medical record in emergency rooms, electronic practice management systems and a social service referral system will be implemented and evaluated.” Community Hospital Telehealth Consortium (CHTC) Southwest Louisiana Health Care Systems (See Appendix 4 for participants) This project was designed to develop a telemedicine network to improve the quality of and access to healthcare in the Southwest Louisiana region. It will use videoconferencing technology via a hub and spoke system. Among the outcomes expected are the provision of home healthcare services, the use of telemedicine in rural school and correctional settings, specialty care and educational opportunities for providers.11 Bayou Teche Community Health Network, Inc. (ByNet) The network, established in 1997, is composed of community health centers, local and regional hospitals, a social service agency, a tribal health clinic, a regional state of Louisiana Office of Public Health site and a coalition of over seventy St. Mary Parish organizations. The network has worked to improve access to primary and preventive care for the residents of St. Mary and surrounding parishes. ByNET uses information technology to allow residents to connect to services and support public health initiatives. Residents can use ByNET to determine if they are eligible for various programs and services as well as identify certain chronic health conditions. As a result of a recent AHRQ grant, ByNET intends to expand its services to include:

Report for the Louisiana Recovery Authority Support Foundation
Page 159
This Report is intended for the use and benefit of the
Louisiana Recovery Authority Support Foundation only and not intended for reliance by any other Party.
Connection of existing information systems to allow for (1) sharing population demographic data between systems and (2) sharing of relevant data elements between medical and social service providers;
Expanded sharing of information, with demographic, financial and clinical data; Creation of a medication management system and electronic note writing capability; Expansion of a clinical software program currently in operation in New Orleans through the New
Orleans HCAP grantee; Creation of a credentialing model to allow access to clinical data for physicians in other project
partner organizations; and Creation of telecommunications, using videoconferencing for continuing education and distance
learning. 12 These are all worthwhile efforts, but ideal success in connectivity will be achieved when patients and providers throughout the state are all able to make full use of technology to improve and deliver care and health. This work has begun, notably through the submission of the ONCHIT 3 proposal, which aims to establish an electronic, core medical record for all residents. The Louisiana Department of Health and Hospitals played a key role in developing the proposal. Known as LA-CARE, the Louisiana Comprehensive Record Exchange is a bold vision to resolve many of the issues that were highlighted after the 2005 hurricane season. As an introductory step to the establishment of LA-CARE, DHH is focusing its efforts on the creation of LaHIE - the Louisiana Health Information Exchange - with the goal of having this operational by September 30, 2006. This effort will be geographically restricted to Baton Rouge and those areas included in ByNET (St. Mary Parish). According to DHH, "the goal of LaHIE is to design, develop and implement the necessary information technology infrastructure to demonstrate functional interoperability in collaboration with Louisiana healthcare providers through the standardized exchange of patient information." It is expected that this initial work of LaHIE will prove to be a successful building block in the more complicated state wide model that has been proposed. Drawing on the existing efforts outlined above and others not noted here, the following approach was outlined in the ONCHIT 3 proposal:
The information management technology used by these organizations varies from highly integrated application systems, to collections of minimally integrated applications, to paper-based systems. A set of Shared Interoperability Services will be provided that allows the secure exchange of patient data between these source technologies. These include centralized identity management, record locator and privacy management services. The demonstration also will include a Clinical Data Cache that is responsible for (1) normalizing data into a standard format, (2) enforcement of the appropriate security policy and (3) assuring data availability. In effect, the caches will augment the storage technology currently available at the participating provider organizations. The Clinical Data Cache will be implemented at the level of the individual communities in order to keep the data as close to the source systems as possible. Integration Services are closely linked to the Clinical Data Caches.

Report for the Louisiana Recovery Authority Support Foundation
Page 160
This Report is intended for the use and benefit of the
Louisiana Recovery Authority Support Foundation only and not intended for reliance by any other Party.
However, it would be a mistake to think that LaCARE is entirely a state government initiative. While LaCARE represents the vision of the state officials, the realization of this vision will require broad participation, both at other levels of government as well as the provider organizations delivery. Both industry and academia also play a critical role in the LaCARE initiative. Oracle and Scientific Technology Corporation partnered with DHH during the development of the Public Health Information Network (PHIN). Other industrial partners, such as Information Builders, have joined the development of this proposal to help make LaCARE a reality. These companies are fully committed to delivering the required products and services. Academia also will play an important role in the proposed demonstration. A team of nationally recognized experts has been assembled from the Tulane University School of Public Health and Tropical Medicine and HealthWorks Louisiana. These experts have designed the evaluation strategy for the demonstration project and will participate in the development of public health functionality supported by LaCARE. Most importantly, the healthcare partner relationships demonstrate the commitment throughout the state of Louisiana to use technology to improve healthcare delivery. The provider community is ready to move this initiative forward and put Louisiana in the fore-front of healthcare technology.13
Clearly, the outline of the LaCARE proposal is strategically appropriate and aligned with the national objectives discussed earlier. The strengths of the LaCARE proposal are in the technical details it includes. What needs more emphasis is the coordination of statewide efforts and a broader outreach among public and private stakeholders. As Louisiana focuses on rebuilding its healthcare environment following the devastating hurricane season of 2005, it has become clear that cooperation must be expanded. So many private entities have made inroads using technology in the delivery of healthcare that a better chance for success would ensure leveraging their knowledge and experience in order to improve the health of Louisiana and its residents. These groups need to band together to develop the principles and policies that will enable the use of technology as identified in the proposal. It is important to note the status of other provider groups within the state. As an example, almost all pharmacies operate with electronic records systems, used for dispensing and billing records. Many of these systems are also linked to the pharmacy’s inventory system. Nationwide, nearly 98 percent of pharmacy claims are submitted electronically, and it is assumed that Louisiana pharmacies are similar. As evidenced in the development of KatrinaHealth, the pharmacy industry was able to quickly rally and provide electronic prescription history information. Finding a way to share information regarding patients in long-term care facilities is an opportunity. As was evident in themes repeated throughout “A Failure of Initiative, Final Report of the Select Bipartisan Committee to Investigate the Preparation for and Response to Hurricane Katrina”,14 those in nursing homes suffered extensively, in part because of a lack of coordinated, consistent information that electronic medical records could have provided. More detail on the needs of emergency medical systems, such as EMS providers, is addressed in Section V - Emergency Preparedness. However, it is expected that mobile EMS providers should have the same technology as hospital emergency departments. The data that is available for the day-to-day provision of care will be crucial in planning for the next disaster. Knowing the location and status of patients, as well as the facility capacity for the immediate and near-term will be of huge benefit to the DHH Emergency

Report for the Louisiana Recovery Authority Support Foundation
Page 161
This Report is intended for the use and benefit of the
Louisiana Recovery Authority Support Foundation only and not intended for reliance by any other Party.
Operations Center. The EOC will need the ability to access census data and will play a key role in facilitating the transfer of patients and their records to other care providers.
Creating the Infrastructure for Health Information Exchange in Louisiana by 2015 The technical infrastructure of health information systems in Louisiana is a key component for allowing connectivity among all stakeholders. Providers, payers and patients will all benefit from an environment that enables the sharing of health information that is captured in the diagnosis, treatment (including medications) and payment of medical care. Such a system is referred to as a Health Information Exchange (HIE). HIEs allow for “…the electronic mobilization of health information among the parties and between disparate information systems while maintaining the meaning of the information exchanged. The goal is to facilitate access to and retrieval of clinical data to provide safer, more timely, efficient, effective, equitable, patient-centered care.”15 For a physician in the emergency room to know, within moments, a patient’s medical history including recent labs, prescriptions, allergies, diagnoses and treatments will greatly improve the emergency care that is given to that patient. These are life and death issues. This infrastructure should also allow for multiple modalities for delivering care, such as what is often referred to as telemedicine. Technologies such as telephones, email, computers, interactive video, digital imaging and healthcare monitoring devices make it possible for clinicians to monitor, diagnose and treat patients without having to physically be with them.16 Imagine going to the local hospital, having an x-ray taken and instead of waiting days for the results, getting them within hours. This is possible by storing the x-ray image electronically and sending it to a specialist hundreds of miles away who can review it as soon as it is received. Connecting the rural hospital and the specialist in the city can be done with the tools available today, namely Internet connectivity (broadband, DSL) and digital radiographic images. It will ensure timeliness and accuracy of care for the patients and efficiency for providers and payers. Telemedicine also is being used in the U.S. and countries like Norway to ease the problem of maldistribution of specialists. For example, a network of health center organizations in South Dakota is making care more convenient for rural residents who would otherwise have to drive long distances for care.17 The network allows providers to communicate with one another and connects clinics to larger facilities for consultations. The U.S. Department of Agriculture recently provided South Dakota facilities with $1.8 million in grants for telemedicine and distance learning initiatives. Since the idea of exchanging health information across multiple entities quickly becomes a complicated effort, with potential legal, regulatory and public perception concerns, the stakeholders often form a Regional Health Information Organization (RHIO). Such an organization could enable Louisiana health industry stakeholders to create the infrastructure and the policies to govern the electronic mobilization of health information among the parties and between disparate information systems while maintaining the meaning of the information exchanged. The goal would be to facilitate access to and retrieval of clinical data to provide safer, more timely, efficient, effective, equitable, patient-centered care.17 One example that may be worth emulating is the Florida Health Information Network, designed to support community or regional exchanges of information, yet is technically supported by a statewide server and patient identification data. This model clearly correlates to the different regions in Louisiana, and the work that is being done within those regions to improve the exchange of health information. The FHIN provides connectivity statewide, manages the Master Patient Index and sets overarching policy. The community RHIOs are responsible for provider authorization and authentication, as well as
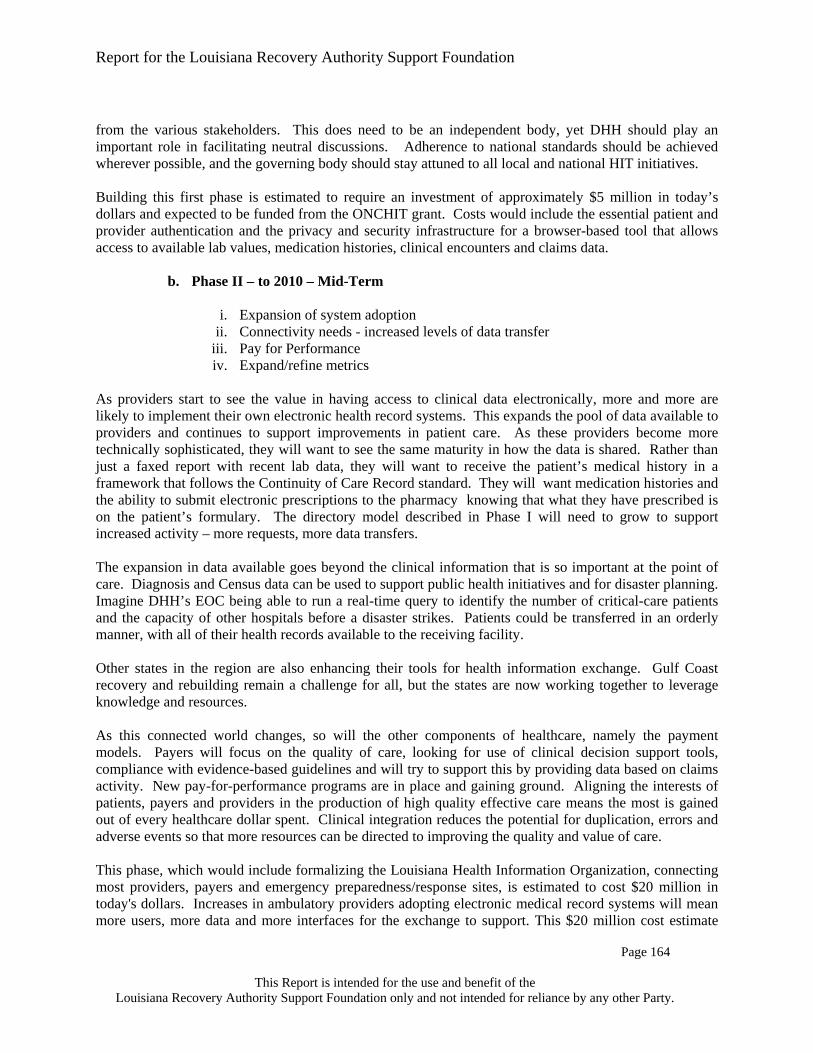
Report for the Louisiana Recovery Authority Support Foundation
Page 162
This Report is intended for the use and benefit of the
Louisiana Recovery Authority Support Foundation only and not intended for reliance by any other Party.
marketing and education efforts. Local “ownership” provides for an additional level of trust and acceptance among providers, as they feel more closely connected to the people and the effort. The FHIN operates under the assumptions that compliance with national standards will be achieved, that a minimum data set, such as the Continuity of Care Record be adopted, and that the statewide server will support the integration of data from state agencies as well as data from payers and other sources. To be a leader in health information exchange, Louisiana would have to develop a business plan that addresses three key issues: governance, financing and technical infrastructure that facilitates the exchange of health information statewide.
Governance Developing the governance of a Louisiana Health Information Organization will be a critical and challenging step in this process. The key stakeholders from throughout the state must be represented. These include physicians from practices of varying sizes and specialties, hospitals, again representing a range of sizes/services, other care systems, employers, patients, allied health professionals (including nurses, pharmacists), academic medical centers, long term care facilities, dentists, payers and quality improvement organizations. This multi-stakeholder group should develop core principles and policies that address the use of information; identify objectives and priorities; create value propositions for the multitude of use cases and document performance metrics for the entity and the efforts it will enable. A form of non-profit corporation may be the best choice as it could align the underlying mission of patient care and allows the flexibility to pursue grants for various projects. This also reinforces the collaborative nature of the work and eliminates some of the public/private tension that can develop.
Financing Another hurdle is developing the organization’s financial model. A great deal of time and effort will be required of the stakeholders to reach the point of a solid business plan and legal incorporation. Initial funding is typically comes from the stakeholders and governmental grants, but sustaining revenue is best generated from the value the system provides. Participants have costs related to the manual or semi-electronic exchange of information prior to the establishment of the electronic exchange - mail, fax, and courier - that are now significantly lower. This savings in operating expenses allows the participants to invest in other aspects of their business. After several years of operations, services might be expanded to include analytical and benchmarking services to improve understanding of how to continuously improve the system of care for Louisiana.
Technical Infrastructure The third component involves developing the technical infrastructure to address:
Privacy and Security are underlying themes in every discussion. Accessibility and authentication must be highly managed.
Usually there is not an initial central database; each entity is responsible for maintaining its data and accessing the composite record through a directory function of the Exchange.
Compliance with nationally accepted technical standards, whether vocabularies or transmission of data is essential to being able to leverage this work across the country and to ultimately be able to normalize data that might exist in a future Exchange repository.
Report for the Louisiana Recovery Authority Support Foundation
Page 163
This Report is intended for the use and benefit of the
Louisiana Recovery Authority Support Foundation only and not intended for reliance by any other Party.
The system would use technical tools that were selected to support the guiding principles and policies of the Exchange.
Two organizations would be helpful in providing expertise in developing such as exchange. The Rx2000 Institute was formed to help healthcare organizations address the issues related to Y2K, but continues to encourage a cooperative exchange on industry-wide regulatory, technology and information delivery issues.18 Another group worth learning from is the Minnesota HIPAA Collaborative, an independent, cross-sector group. The Founding Member organizations represent the providers and health plans; the Minnesota Department of Human Services, which oversees the Medicaid programs, is an invited participant. The founding members have committed to providing resources from within each of their organizations to meet the objectives set by the steering committee. Although formed originally to specifically address HIPAA implementations, the collaborative has grown and continues to serve as an advising and operating body.
Phases of Development Moving forward, future development should be looked at in several phases. First is the immediate future – through the 2006 hurricane season. Following that is what is considered to be mid-term, estimated to be through 2010. Beyond that is the long-term CC. The capital investments estimated in this section are only for the healthcare information exchange. They do not include the capital that would be required to implement electronic medical records in Louisiana’s physician offices, ambulatory clinics, hospitals and long-term care facilities.
a. Phase I – 2006 Hurricane Season – Immediate Building Blocks
i. What can be done now to advance the future state? ii. What can be leveraged of existing systems/tools?
iii. Identify metrics. As June 1 approaches and with it, the start of the 2006 hurricane season, the focus must be on creating an inventory of all existing systems and then developing a rapid implementation approach to leveraging these existing systems and tools on a broader basis. Each of the entities interviewed for this report have expressed their willingness to share what they have for the good of the community. As a first step in information exchange, a directory model is proposed. Providers would submit a request for information about a particular patient and any information found is returned to the provider, either electronically or via facsimile. The directory would access the information stored in the various systems (i.e. Ochsner, OLOL). While there are some limitations to this, it does allow providers from outside a closed system to get more timely access to clinical data. There are operational concerns that need to be addressed, such as privacy and security, as well as the increased costs that will be incurred by the various entities as their systems are accessed with greater frequency. These are issues that can be resolved rather quickly. Metrics for this first phase do not need to be complicated, but should include the number and type of users, the information requested and its availability and the number of requests. This is a model that can quickly grow to include more data sources and be available to many more providers. In order to do so, an organizing/governing body should be formed and include representatives

Report for the Louisiana Recovery Authority Support Foundation
Page 164
This Report is intended for the use and benefit of the
Louisiana Recovery Authority Support Foundation only and not intended for reliance by any other Party.
from the various stakeholders. This does need to be an independent body, yet DHH should play an important role in facilitating neutral discussions. Adherence to national standards should be achieved wherever possible, and the governing body should stay attuned to all local and national HIT initiatives. Building this first phase is estimated to require an investment of approximately $5 million in today’s dollars and expected to be funded from the ONCHIT grant. Costs would include the essential patient and provider authentication and the privacy and security infrastructure for a browser-based tool that allows access to available lab values, medication histories, clinical encounters and claims data.
b. Phase II – to 2010 – Mid-Term
i. Expansion of system adoption ii. Connectivity needs - increased levels of data transfer
iii. Pay for Performance iv. Expand/refine metrics
As providers start to see the value in having access to clinical data electronically, more and more are likely to implement their own electronic health record systems. This expands the pool of data available to providers and continues to support improvements in patient care. As these providers become more technically sophisticated, they will want to see the same maturity in how the data is shared. Rather than just a faxed report with recent lab data, they will want to receive the patient’s medical history in a framework that follows the Continuity of Care Record standard. They will want medication histories and the ability to submit electronic prescriptions to the pharmacy knowing that what they have prescribed is on the patient’s formulary. The directory model described in Phase I will need to grow to support increased activity – more requests, more data transfers. The expansion in data available goes beyond the clinical information that is so important at the point of care. Diagnosis and Census data can be used to support public health initiatives and for disaster planning. Imagine DHH’s EOC being able to run a real-time query to identify the number of critical-care patients and the capacity of other hospitals before a disaster strikes. Patients could be transferred in an orderly manner, with all of their health records available to the receiving facility. Other states in the region are also enhancing their tools for health information exchange. Gulf Coast recovery and rebuilding remain a challenge for all, but the states are now working together to leverage knowledge and resources. As this connected world changes, so will the other components of healthcare, namely the payment models. Payers will focus on the quality of care, looking for use of clinical decision support tools, compliance with evidence-based guidelines and will try to support this by providing data based on claims activity. New pay-for-performance programs are in place and gaining ground. Aligning the interests of patients, payers and providers in the production of high quality effective care means the most is gained out of every healthcare dollar spent. Clinical integration reduces the potential for duplication, errors and adverse events so that more resources can be directed to improving the quality and value of care. This phase, which would include formalizing the Louisiana Health Information Organization, connecting most providers, payers and emergency preparedness/response sites, is estimated to cost $20 million in today's dollars. Increases in ambulatory providers adopting electronic medical record systems will mean more users, more data and more interfaces for the exchange to support. This $20 million cost estimate

Report for the Louisiana Recovery Authority Support Foundation
Page 165
This Report is intended for the use and benefit of the
Louisiana Recovery Authority Support Foundation only and not intended for reliance by any other Party.
does not include the capital costs of purchasing and deploying ambulatory record systems for all of Louisiana’s physicians. It also does not include operating costs of the exchange, which are estimated at upwards of $10 million annually, in today’s dollars.
c. Phase III – Long Term – Beyond 2010
i. Uses beyond point of care clinical decision support ii. Continued evolution based on metrics
To move toward a system that optimizes technology would require a connected healthcare that includes point-of-care clinical decision support – focusing on providing the right care for the right patient at the right time. Providers are also using the data to demonstrate to their patients the changes in their health over the years. Moving to such a system could have a clear impact. For example, the state of Louisiana could track immunization rates and target certain chronic conditions before they reached epidemic proportions. By implementing and leveraging an information exchange, graduates of Louisiana’s various medical schools would be better prepared and expect to work with state of the art technology in all aspects of healthcare. The workforce would be educated in a new model of a healthcare system, not just in terms of technology, but the entire care delivery model. To achieve this state of on-going optimization, it is likely to cost an additional $15 million in today's dollars for healthcare technology infrastructure. As is the case in all the phases of this transformation, the investments identified are those that are needed for the exchange of healthcare information and the common infrastructure to support it. In Phase III, standards should be widely adopted and a normalized data repository becomes more realistic. These costs include the formation of such data repositories and the business analytic tools to assist in optimizing the quality and efficiency of care while also providing advanced connectivity for emergency preparedness and syndromic surveillance. Again, these investments do not include the capital that will be required to implement the electronic medical record systems in a provider’s office, or at a hospital or long-term care facility.
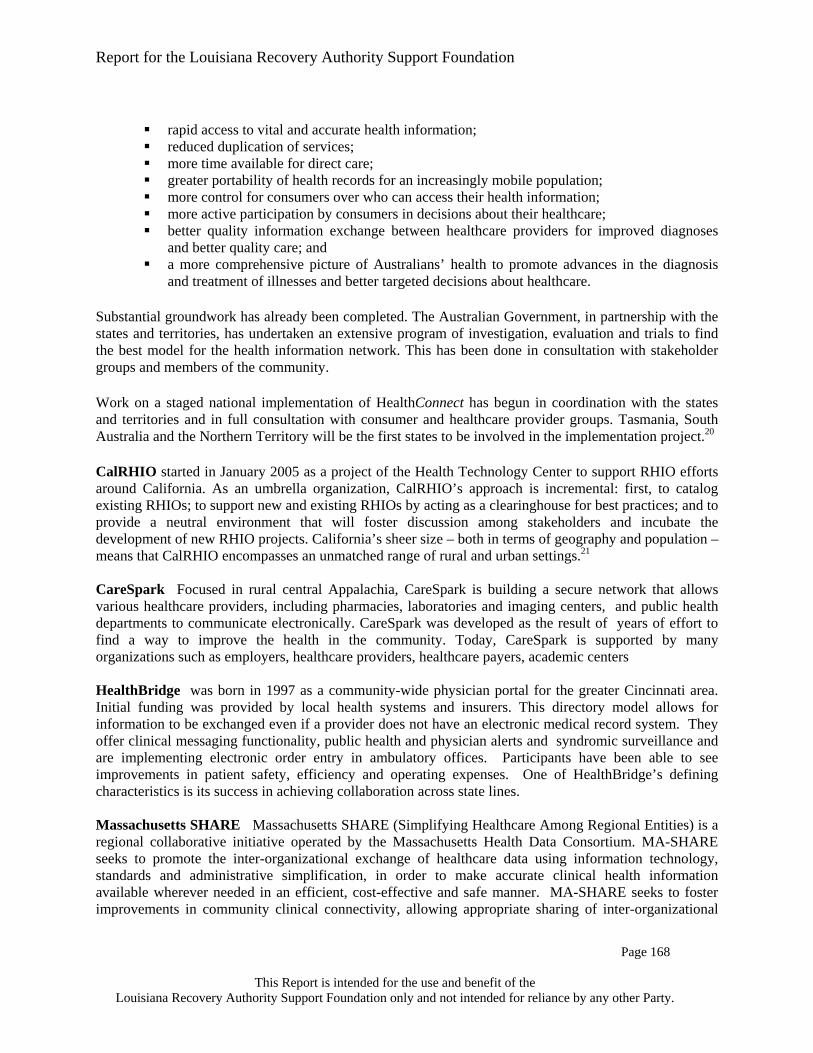
Report for the Louisiana Recovery Authority Support Foundation
Page 166
This Report is intended for the use and benefit of the
Louisiana Recovery Authority Support Foundation only and not intended for reliance by any other Party.
Appendices for Public and Private Technology Infrastructure
Report for the Louisiana Recovery Authority Support Foundation
Page 167
This Report is intended for the use and benefit of the
Louisiana Recovery Authority Support Foundation only and not intended for reliance by any other Party.
APPENDIX 1 – Current Examples of Community Health Information Exchange In researching evidence of the benefits of technology in the delivery of healthcare, there are specific examples that can and should be reviewed. These each represent a slightly different approach, aligned with best practices and vary in size and scope, providing Louisiana with suggestions on how to approach and implement a technology infrastructure that will support the redesigned healthcare system. Benchmarks/Case Studies United Kingdom - The NHS Connecting for Health Program includes the National Program for IT. This Program will bring modern computer systems into the NHS which will improve patient care and services. Over the next ten years, the National Programme for IT will connect over 30,000 GPs in England to almost 300 hospitals and give patients access to their personal health and care information, transforming the way the NHS works.
Accurate information is crucial if patients are to have choice and receive the right care at the right time. A key aim of the National Programme for IT in the NHS is to give healthcare professionals access to patient information safely, securely and easily, whenever and wherever it is needed.
The National Programme for IT is creating a multi-billion pound infrastructure, which will improve patient care by enabling clinicians and other NHS staff to increase their efficiency and effectiveness.
It is doing this by:
creating an NHS Care Records Service to improve the sharing of patients’ records across the NHS with their consent
making it easier and faster for GPs and other primary care staff to book hospital appointments for patients
providing a system for the electronic transmission of prescriptions ensuring that the IT infrastructure can meet NHS needs now and in the future.19
Australia - HealthConnect is a network of electronic health records that aims to improve the flow of information across the Australian health sector. It involves the electronic collection, storage and exchange of consumer health information via a secure network and within strict privacy safeguards.
HealthConnect gives doctors and other health professionals quick and secure access to important and potentially lifesaving medical information. HealthConnect will be implemented nationally on a state-by-state basis and is expected to improve the quality and safety of healthcare for all Australians. Participation in HealthConnect is voluntary and participants may choose to withdraw at any time.
Under HealthConnect, health-related information will be collected at the point of care, such as at a hospital or a doctor’s surgery. It will be documented in a standard electronic format and stored as part of a secure network. This information may then be retrieved online when needed or be exchanged between authorized healthcare providers - but only with the consent of the consumer.
HealthConnect is expected to realize the following benefits:

Report for the Louisiana Recovery Authority Support Foundation
Page 168
This Report is intended for the use and benefit of the
Louisiana Recovery Authority Support Foundation only and not intended for reliance by any other Party.
rapid access to vital and accurate health information; reduced duplication of services; more time available for direct care; greater portability of health records for an increasingly mobile population; more control for consumers over who can access their health information; more active participation by consumers in decisions about their healthcare; better quality information exchange between healthcare providers for improved diagnoses
and better quality care; and a more comprehensive picture of Australians’ health to promote advances in the diagnosis
and treatment of illnesses and better targeted decisions about healthcare.
Substantial groundwork has already been completed. The Australian Government, in partnership with the states and territories, has undertaken an extensive program of investigation, evaluation and trials to find the best model for the health information network. This has been done in consultation with stakeholder groups and members of the community.
Work on a staged national implementation of HealthConnect has begun in coordination with the states and territories and in full consultation with consumer and healthcare provider groups. Tasmania, South Australia and the Northern Territory will be the first states to be involved in the implementation project.20
CalRHIO started in January 2005 as a project of the Health Technology Center to support RHIO efforts around California. As an umbrella organization, CalRHIO’s approach is incremental: first, to catalog existing RHIOs; to support new and existing RHIOs by acting as a clearinghouse for best practices; and to provide a neutral environment that will foster discussion among stakeholders and incubate the development of new RHIO projects. California’s sheer size – both in terms of geography and population – means that CalRHIO encompasses an unmatched range of rural and urban settings.21 CareSpark Focused in rural central Appalachia, CareSpark is building a secure network that allows various healthcare providers, including pharmacies, laboratories and imaging centers, and public health departments to communicate electronically. CareSpark was developed as the result of years of effort to find a way to improve the health in the community. Today, CareSpark is supported by many organizations such as employers, healthcare providers, healthcare payers, academic centers HealthBridge was born in 1997 as a community-wide physician portal for the greater Cincinnati area. Initial funding was provided by local health systems and insurers. This directory model allows for information to be exchanged even if a provider does not have an electronic medical record system. They offer clinical messaging functionality, public health and physician alerts and syndromic surveillance and are implementing electronic order entry in ambulatory offices. Participants have been able to see improvements in patient safety, efficiency and operating expenses. One of HealthBridge’s defining characteristics is its success in achieving collaboration across state lines. Massachusetts SHARE Massachusetts SHARE (Simplifying Healthcare Among Regional Entities) is a regional collaborative initiative operated by the Massachusetts Health Data Consortium. MA-SHARE seeks to promote the inter-organizational exchange of healthcare data using information technology, standards and administrative simplification, in order to make accurate clinical health information available wherever needed in an efficient, cost-effective and safe manner. MA-SHARE seeks to foster improvements in community clinical connectivity, allowing appropriate sharing of inter-organizational

Report for the Louisiana Recovery Authority Support Foundation
Page 169
This Report is intended for the use and benefit of the
Louisiana Recovery Authority Support Foundation only and not intended for reliance by any other Party.
healthcare data among the various participants in the healthcare system – including patients, doctors and other practitioners, hospitals, government, insurers, HMOs and other payers. The MA-SHARE operating model is generally conceived as that of a facilitator and incubator, in which projects exploring healthcare data connectivity will be undertaken in order to develop, pilot and demonstrate new healthcare information technologies across communities and enterprises.22 PeaceHealth is an integrated delivery network in the Pacific Northwest, offers technology services and access to its comprehensive community health record (CHR) via an ASP/ISP model. Smaller, rural clinics and physicians that otherwise may not have the resources for significant IT investments can securely access the network for a modest market-based fee. Since the program began, 54 independent practices have signed on to use its EHR services, and more than a thousand authorized clinicians have full password access to PeaceHealth’s CHR to support patient care. The CHR includes approximately 1.5 million patient records.21 Taconic Health Information Network and Community (THINC) is a multi-stakeholder, community-wide data exchange among physicians, hospitals, reference laboratories, pharmacies, payers, employers and consumers in the Hudson Valley region of New York State. It provides clinical, insurance, administrative and demographic information for more than 600,000 patients via a secure Internet infrastructure incorporating standards for data exchange. Unique to THINC is the local, ongoing support provided by MedAllies, which provides training and support to community clinicians and their office staff members to drive adoption.21

Report for the Louisiana Recovery Authority Support Foundation
Page 170
This Report is intended for the use and benefit of the
Louisiana Recovery Authority Support Foundation only and not intended for reliance by any other Party.
APPENDIX 2 – CLIQ - Clinical Inquiry
CLIQ now serves physicians, nurses and their patients at:
Medical Center of Louisiana in New Orleans (Charity and University campuses) LSU Earl K. Long Medical Center (Baton Rouge) LSU Leonard J. Chabert Medical Center (Houma) LSU Bogalusa Medical Center (Bogalusa) LSU Daughters of Charity Health Centers (Carrollton, New Orleans Mission) EXCELth Inc. (New Orleans East Clinic, St. Bernard Gentilly Health Center) City of New Orleans Clinics (Healthcare for the Homeless) Office of Public Health Clinics (Jefferson, Orleans, St. Bernard, St. Charles, St. James, St.
John Parishes) LSUHSC Family Medicine Clinic (Kenner) LSUHSC Musician’s Clinic (New Orleans)
Planned Deployment Schedule - CLIQ – Fiscal Year 2004-2005:
Office of Public Health Clinics (Region 3) City of New Orleans Clinics (Booker T. Washington, Carver, Helen Levy, Ida Hymel,
Katherine Benson, Mandeville Detiege, Mary Buck) Lallie A. Kemp Medical Center (Independence) LSU University Medical Center (Lafayette) LSU Huey P. Long Medical Center (Alexandria) LSU W.O. Moss (Lake Charles)10 LSU

Report for the Louisiana Recovery Authority Support Foundation
Page 171
This Report is intended for the use and benefit of the
Louisiana Recovery Authority Support Foundation only and not intended for reliance by any other Party.
APPENDIX 3 – List of Providers Community Hospital Telehealth Consortium (CHTC) Southwest Louisiana Health Care Systems Network Partners: Lake Charles Memorial Hospital, Lake Charles, LA (11 spoke sites) Our Lady of Lourdes Regional Medical Center, Lafayette, LA (5 spoke sites) Our Lady of the Lake Regional Medical Center, Baton Rouge, LA (2 spoke sites) Slidell Memorial Hospital, Slidell, LA (1 spoke site) North Mississippi Health Services, Tupelo, MS (3 spoke sites)
Service Area: Eleven parishes in southern Louisiana, 20 HPSAs/MUAs. Four counties in northern Mississippi, eight HPSAs/MUAs

Report for the Louisiana Recovery Authority Support Foundation
Page 172
This Report is intended for the use and benefit of the
Louisiana Recovery Authority Support Foundation only and not intended for reliance by any other Party.
APPENDIX 4 – Glossary AHRQ - Agency for Healthcare Research and Quality The Agency for Healthcare Research and Quality (AHRQ) is the lead federal agency charged with improving the quality, safety, efficiency and effectiveness of healthcare for all Americans. As one of 12 agencies within the Department of Health and Human Services, AHRQ supports health services research that will improve the quality of healthcare and promote evidence-based decision making. www.ahrq.gov CCR - Continuity of Care Record The CCR, or “Continuity of Care Record”, is the standard published by ASTM International that defines the essential clinical content within a patient “snapshot” or medical record summary. While the standard allows inclusion of data elements such as patient demographic information, medication list, allergies, immunizations, problem lists, care plans and test results, a CCR record may contain a subset of that data. The CCR was developed by consensus among the largest and most influential professional medical societies in the U.S. and is expressed in a simple XML format and schema. CMS - Centers for Medicare and Medicaid Services CMS’ Mission - We assure healthcare security for beneficiaries. CMS’ Vision - In serving beneficiaries, we will open our programs to full partnership with the entire health community to improve quality and efficiency in an evolving healthcare system. www.cms.hhs.gov/MissionVisionGoals/ DHH - Louisiana Department of Health and Hospitals The mission of the Department of Health and Hospitals is to protect and promote health and to ensure access to medical, preventive and rehabilitative services for all citizens of the state of Louisiana. The Department of Health and Hospitals is dedicated to fulfilling its mission through direct provision of quality services, the development and stimulation of services of others and the utilization of available resources in the most effective manner. www.dhh.state.la.us EHR - Electronic Health Record Often defined as a complete record of information regarding an individual’s health. This may include clinical notes, test results, medication history and other information as entered by a healthcare provider. In addition, an EHR may include information entered by the individual, such as logs of diet and physical activity, over-the-counter medications and complementary medical treatments received. EMR - Electronic Medical Record This is often considered to be an individual’s health record, as maintained by a specific healthcare provider. It will include information related to the care of that individual by, or at the direction of, the specific provider or facility. EOC - Emergency Operations Center The Emergency Operations Center, or EOC, is a central command and control facility responsible for carrying out the principles of emergency preparedness and emergency management, or disaster management functions at a strategic level in an emergency situation and ensuring the continuity of operation of the company, or political subdivision. www.wikipedia.org HL7 - Health Level 7 (Standards Organization) Health Level Seven is one of several American National Standards Institute (ANSI) -accredited Standards Developing Organizations (SDOs) operating in the healthcare arena. Most SDOs produce standards

Report for the Louisiana Recovery Authority Support Foundation
Page 173
This Report is intended for the use and benefit of the
Louisiana Recovery Authority Support Foundation only and not intended for reliance by any other Party.
(sometimes called specifications or protocols) for a particular healthcare domain such as pharmacy, medical devices, imaging or insurance (claims processing) transactions. Health Level Seven’s domain is clinical and administrative data. www.hl7.org HRSA - Health Resources and Service Administration The Health Resources and Services Administration (HRSA), an agency of the U.S. Department of Health and Human Services, is the primary federal agency for improving access to healthcare services for people who are uninsured, isolated or medically vulnerable. Comprising five bureaus and 12 offices, HRSA provides leadership and financial support to healthcare providers in every state and U.S. territory. www.hrsa.gov

Report for the Louisiana Recovery Authority Support Foundation
Page 174
This Report is intended for the use and benefit of the
Louisiana Recovery Authority Support Foundation only and not intended for reliance by any other Party.
Sources and Notes 1. Smith,P.C. et al. Missing clinical information during primary care visits. JAMA 293, 565-
571 (2005). 2. PricewaterhouseCoopers. Reactive to Adaptive: Transforming Hospitals with Digital
Technology. 2005. 3. 2006 IMS HEALTH National Prescription Audit©. 2006. 4. Burt,C. & Hing,E. Use of computerized clinical support systems in medical settings:
United States, 2001–03. Hyattsville, MD, U.S. Department of Health and Human Services, CDC, National Center for Health Statistics. 2005.
5. DEPARTMENT OF HEALTH AND HUMAN SERVICES Centers for Medicare & Medicaid Services [CMS-5017-N] Medicare Program; Medicare Health Care Quality (MHCQ) Demonstration Programs.
6. http://www.hhs.gov/healthit/mission.html. 7. The Decade of Health Information Technology: Delivering Consumer-centric and
Information-rich Health Care Framework for Strategic Action, July 21, 2004. 2004. 8. http://www.katrinahealth.org/faqs.html. 9. AHRQ Grant # UC1 HS14953-01. 10. http://www.pathla.org/home/about/initiatives/view/8/. 11. HRSA Office for the Advancement of Telehealth:
http://search.hrsa.gov/search?ie=&q=ByNET&site=my_collection&output=xml_no_dtd&client=my_collection&access=p&lr=&btnG.y=0&btnG.x=24&ip=63.229.216.154&proxystylesheet=my_collection&oe=&filter=p. 2006.
12. Rural Policy Research Institute RUPRI Center for Rural Health Policy Analysis, Directory of Rural Health Networks: Profiling Network Information Technology Use. 2005.
13. LaCARE: A NHIN Demonstration by the State of Louisiana, September 26, 2005 - A Technical Proposal. 2005.
14. U.S. House of Representatives, A Failure of Initiative, 2006. 2006. 15. eHealth Initiative Foundation’s Second Annual Survey of State, Regional and
Community-Based Health Information Exchange Initiative and Organizations. 2005. 16. http://tie.telemed.org/consumer/whatis.asp. 17. Alan van Ormer. Argus Leader. Telemedicine Network Hooks Up Small-Town, Rural
Clinics. 2005. 18. http://www.rx2000.org/home/aboutus.htm#Mission. 19. http://www.connectingforhealth.nhs.uk/. 20. http://www.healthconnect.gov.au/. 21. Accelerating Transformation through Health Information Technology: Summary of
Findings from October 18, 2005 CHT Connectivity Conference. 2005. 22. http://www.mahealthdata.org/ma-share/mission.html.

Report for the Louisiana Recovery Authority Support Foundation
Page 175
This Report is intended for the use and benefit of the
Louisiana Recovery Authority Support Foundation only and not intended for reliance by any other Party.
SECTION V: EMERGENCY PREPAREDNESS AND DISASTER PLANNING
Introduction A unified incident command; a time-sensitive response system integrated with homeland security; and sustained funding and planning mechanisms are required for health system emergency preparedness. On August 29th 2005, Hurricane Katrina made landfall near Buras, Louisiana. A large and powerful hurricane as well as a catastrophic flood, Hurricane Katrina was the most destructive natural disaster in United States history.1 Nearly a month later, Hurricane Rita made landfall just east of Sabine Pass in Louisiana on September 24th 2005. Natural hazards, such as hurricanes, earthquakes, tornados and volcanic eruptions, cannot be prevented. Their impact, however, can be contained and managed. In order to call an event a disaster, people must be affected. The hurricanes and the flooding of New Orleans exposed significant flaws in federal, state and local preparedness for catastrophic events and their capacity to respond to them. A number of after action reviews have concluded that all areas of disaster response were unprepared. By any measure, Hurricanes Katrina and Rita were a catastrophe for Louisiana. The notion that disasters cannot be planned for will no longer stand up to public scrutiny especially in states where natural hazards are an annual occurrence. A number of gaps identified in the preparedness and response of the Louisiana health system can be directly attributed to a lack of funding and inadequate resources. During disasters, the health system is an integral part of a state’s response efforts. Charged with preventing and reducing disease and injury, healthcare professionals act as first responders, investigators, strategists and medical care providers.2 Implementing the recommendations in this section are estimated to cost approximately $10 million in today’s dollars annually, a fraction of the $365 million3 in public health-related recovery costs Louisiana has accrued since Hurricane Katrina. As Louisiana’s disaster management capabilities evolve, building civilian and military medical interoperability will be critical. The U.S. military has a long history of managing healthcare needs in complex disaster environments. As Louisiana’s health system recovers from the destruction of the 2005 hurricane season, it is likely to be overwhelmed over the next few years should it face hurricanes like Katrina and Rita. As a result, the Louisiana National Guard and the Office of Homeland Security and Emergency Preparedness will play an important role in providing emergency medical support. The Louisiana Emergency Response Network, in close coordination with these organizations, will provide Louisiana with a natural foundation on which to build its disaster medical response. Research
Assessed emergency preparedness systems from around the country and the world, in an effort to create a "best in class" system for Louisiana.
Recently published reports and after action reviews.

Report for the Louisiana Recovery Authority Support Foundation
Page 176
This Report is intended for the use and benefit of the
Louisiana Recovery Authority Support Foundation only and not intended for reliance by any other Party.
Leading disaster medicine and public health emergency preparedness literature. Technical journals. Best practices in other states and countries. Interviews with Louisiana emergency response and health system officials.
Key Findings and Recommendations Key Finding: Louisiana has an immediate and urgent need for a statewide healthcare emergency preparedness system. Additional observations are as follows:
Louisiana lacked the type of “preparedness culture” of nations such as Israel and United Kingdom, and states such as Florida and California, that routinely deal with disasters.
Louisiana had no shortage of disaster plans. However, the existence of those plans gave the illusion of preparedness. The planning assumptions were not valid, they lacked an inter-organizational perspective, and they were not accompanied by the needed funding and resources.
Virtually all health system emergency preparedness programs in Louisiana were created outside the operational design of the health system. As a result, constant alignment was required to keep pace with technology and changing requirements.
Pre-hurricanes, Louisiana had two trauma centers; post-hurricane, it has one. By contrast, Colorado, whose population size is similar, has 62. On a per-capita basis, Texas had 19 times more trauma capacity than pre-hurricane Louisiana.4
Despite massive planning efforts by federal, state and local governments to prepare for future disasters, the lessons learned were strikingly similar to the lessons learned from the California wildfires of 1970 – more than 30 years ago.5
Recommendation 14 is discussed in three parts: A. Fund the Louisiana Emergency Response Network to operationalize a time-sensitive illness response system linking homeland security initiatives with healthcare operational standards and trauma care requirements. Implementation is estimated to require approximately $9 million in annual operational costs (in today's dollars), based on the state's Regional Trauma-patient Care Statewide System Task Force LERN legislation and budget and adjusted to reflect nine command centers instead of the proposed five.
B. Formalize the Public Health and Medical Services emergency support function (ESF-8) incident command structure in accordance with the National Response Plan and the National Incident Management System to minimize chaos and enhance decision making during a disaster.
C. Establish long-term funding and planning mechanisms to sustain emergency preparedness of the Louisiana health system by creating the “Bureau of Emergency Preparedness” as its own entity within the Department of Health and Hospitals with an appropriate budget of $1 million annually and the resources required to develop and sustain realistic disaster plans, also based on the budget set by the Task Force mentioned above.

Report for the Louisiana Recovery Authority Support Foundation
Page 177
This Report is intended for the use and benefit of the
Louisiana Recovery Authority Support Foundation only and not intended for reliance by any other Party.
Nature of a Disaster Worldwide, a major disaster occurs almost daily. In the United States, every state and territory has communities that are at risk from one or more natural hazards. A level 3 to 5 scale hurricane strikes the continental United States every 1.5 years.6 The most frequent of all natural hazard-related disasters are those due to devastation caused by flooding which has been estimated to account for 40 percent of all disasters worldwide.6 Disasters are generally considered “low probability – high impact” events. In fact, only a few disasters in the United States have resulted in over 1,000 casualties.6 These statistics are often used to defer funding for disaster planning efforts in lieu of other projects. However, the impact of disasters in the United States is much more significant than this statistic implies. Disasters are defined by the event and the venue in which it occurs. In order to call an event a disaster, people must be affected. Complex disasters usually involve situations in which civilian populations suffer casualties and loss of property, basic services and a means of livelihood. In many cases, people are forced to flee their homes temporarily or permanently. From the standpoint of healthcare providers, a disaster should be defined on the basis of its consequences on health and health services.7 Hurricane Katrina impacted nearly 93,000 square miles across 138 parishes and counties across Louisiana, Mississippi, Alabama and Florida – roughly an area the size of Great Britain.1 Exhibit 1 charts the effects of Hurricane Katrina against other major hurricanes in recent U.S. history. Section V Exhibit 1: Hurricane Katrina Compared to Hurricanes Ivan, Andrew and Camille
Source: Federal Response to Hurricane Katrina: Lessons Learned. White House Report.

Report for the Louisiana Recovery Authority Support Foundation
Page 178
This Report is intended for the use and benefit of the
Louisiana Recovery Authority Support Foundation only and not intended for reliance by any other Party.
Natural hazards, such as hurricanes and floods, themselves are not disasters but are factors in causing a disaster. Hurricane Katrina, while being the most expensive disaster in United States history, will more likely be remembered for its human toll. In its report – The Federal Response to Hurricane Katrina: Lessons Learned, the White House describes the human toll:
An estimated 1,330 people died as a result of the Hurricane Katrina. An estimated 80 percent of the fatalities came from the New Orleans metropolitan area. As of February 2006, 2,096 people from the Gulf Coast area were still reported missing. Around 770,000 people were displaced.
A metropolis of 470,000 people before the hurricanes, the consequences for New Orleans were dire.8 Approximately 80 percent of the New Orleans, the nation’s 35th largest city, was flooded. Tens of thousands of residents who had not left prior to the hurricanes required emergency evacuations. The evacuees were taken via helicopter or boat to the Superdome, the Convention Center or any other dry spot in the city. At these locations, they were subjected to unbearable conditions: limited light, air, sewage facilities, water and food. Significant portions of the city remain uninhabitable. St. Bernard Parish, once home to nearly 70,000 people, has seen its population dip to about 7,000, with nearly all of those people living in temporary housing.8 Historically, those most impacted by natural hazards are the poor and under- and uninsured. They are probably most at risk because they are:
Least able to afford housing that withstand seismic activity, Often live along coasts or floodplains, Forced by economic circumstances to live in substandard housing, and Not educated as to the appropriate lifesaving behaviors or actions that they can take when a
disaster occurs. These circumstances fit a large percentage of the population that was impacted by the hurricanes. Analysis found that the victims of hurricanes were roughly proportionate to the pre-landfall population (based on U.S. Census data) in terms of race, sex and wealth. In terms of race, the dead in New Orleans were 62 percent black, compared to 66 percent for the total parish population. The dead in St. Bernard Parish were 92 percent white, compared to 88 percent of the total parish population.8 The percentage of the dead by sex was approximately the same as the overall population. In terms of wealth, the analysis found that the percentage of dead bodies found in poorer New Orleans and St. Bernard Parish neighborhoods — as measured by poverty rates and median household incomes — was roughly equivalent to their percentage in the overall population.8 However, seniors were disproportionately impacted. A February 2006 report from St. Gabriel morgue revealed that people over the age of 51 accounted for 84 percent of the 815 bodies identified.9 In Louisiana, approximately 71 percent of the victims were over sixty years of age, and 47 percent of those were over 65.9 At least 68 people were found in nursing homes, some of whom were allegedly abandoned by their caretakers.9 At St. Rita’s Nursing Home in St. Bernard Parish, 34 nursing home residents drowned in the floods resulting from Hurricane Katrina.9 Of the total known fatalities, almost 200 unclaimed bodies were in Carville, Louisiana.9

Report for the Louisiana Recovery Authority Support Foundation
Page 179
This Report is intended for the use and benefit of the
Louisiana Recovery Authority Support Foundation only and not intended for reliance by any other Party.
Hurricanes Katrina and Rita demonstrated why disasters should be considered a public health problem. The hurricanes and flood:
Caused an unexpected number of deaths, injuries, or illnesses in the affected communities, exceeding the therapeutic capacities of the local health services and requiring external assistance.
Destroyed local health infrastructure such as hospitals and nursing homes, which were unable to respond to the disaster.
Disrupted the provision of routine health services and preventative activities. Adversely effected the environment and the population, increasing the potential risk for
communicable diseases and environmental hazards. Affected the psychological and social behavior of the stricken community. Caused shortage of food with severe nutritional consequences. Caused a large, spontaneous population movement.
The 2005 hurricane season tested Louisiana’s planning and preparedness for a major public health threat. Despite deficiencies in coordination, communication and capacity, public health and medical support services treated a massive and overwhelming evacuee population. The following is an extract from A Failure of Initiative, a report from the U.S. House of Representatives that captured the impact on one Louisiana hospital during the Hurricane Katrina flood.
600 people in hospital 13 patients on gurneys Staff is dehydrating Temperature is 110 degrees with humidity No fuel left to operate the hospital tower No communication with National Guard to coordinate evacuation of patients Having to feed 500+ non-patient refugees – they are very close to rioting for the balance of food,
water and supplies Everything is manual due to loss of power Snakes in hospital Rashes on staff from water

Report for the Louisiana Recovery Authority Support Foundation
Page 180
This Report is intended for the use and benefit of the
Louisiana Recovery Authority Support Foundation only and not intended for reliance by any other Party.
Disaster Planning Emergency preparedness is defined as the state of readiness to respond to a disaster, crisis or any other type of incident. Nations such as Israel and United Kingdom, and states such as Florida and California, that routinely deal with disasters have developed a “preparedness culture” in which preparedness is of primary importance and becomes part of daily operations.10 The Louisiana health system has several disaster plans; however, it does not have an emergency preparedness culture. Disasters are highly complex events resulting in immediate medical problems, as well as longer-term public health disruptions. Emergency preparedness is not defined by the existence of plans or by the periodic testing of those plans. To be effective, plans must be practical, accepted by all its users, inter-organizational and based on valid resource information. The planning process, which addresses the key concepts of medical emergency preparedness, is crucial. This section focuses on the following areas of the Louisiana health system – (i) incident management; (ii) trauma care; and (iii) patient movement and care – to portray the state of preparedness leading up to the 2005 hurricane season. Incident Management The National Response Plan establishes a comprehensive all-hazards approach to enhance the ability of the United States to manage domestic incidents.11 The plan integrates incident management disciplines – designated as Emergency Support Functions (ESF) – into a unified structure and establishes protocols to help protect the nation from terrorist attacks and other natural and manmade hazards.12 ESF-8 is the Public Health and Medical Services emergency function. The function provides public health and sanitation; emergency medical, dental and hospital services; crisis counseling and mental health services to disaster victims and workers. The purpose of the function is to supplement and support disrupted or overburdened local medical personnel and facilities and relieve personal suffering and trauma.13 ESF-8 coordinates the appropriate state, local and tribal organizations to determine current medical and public health assistance requirements and is comprised of the following core functional areas: assessment of public health/medical needs; public health surveillance; medical care personnel; medical equipment and supplies; patient evacuation; safety and security of human drugs; blood supply and blood products; food and agriculture safety and security; worker health/safety; all-hazard public health and medical consultation; behavioral healthcare; vector control; potable water/wastewater and solid waste disposal; victim identification/mortuary services; and protection of animal health. In the 2005 version of the Louisiana Emergency Operations Plan, two agencies shared primary responsibility for ESF-8 – Department of Health and Hospitals (DHH) and Louisiana State University Health Sciences Center (LSUHSC) – supported by other state agencies (Exhibit 2). The DHH was responsible for public health, sanitation, medical and health assistance to Special Needs shelter operations, as well as mental health and crisis counseling. The LSUHSC was responsible for providing hospital care and shelter support for nursing home and home health patients with acute care requirements, as well as casualties of emergencies and disasters. LSUHSC had the lead role in coordinating hospital planning and actions with private hospitals and other facilities.13

Report for the Louisiana Recovery Authority Support Foundation
Page 181
This Report is intended for the use and benefit of the
Louisiana Recovery Authority Support Foundation only and not intended for reliance by any other Party.
It was the responsibility of the Secretary of DHH and the Chief Executive Officer of LSUHSC to designate ESF-8 coordinators to organize and administer the ESF. It was the responsibility of the ESF-8 coordinators to develop plans, procedures, arrangements and agreements to identify, acquire and mobilize public health and medical resources for emergencies.13
Section V Exhibit 2: Public Health and Medical Services Responsibility Chart
Trauma Care More than 15 years ago, the United States Congress passed the Trauma Systems Planning and Development Act of 1990 (the Act) to address the importance of trauma systems in responding to injury as a public health threat.14 The Act created Section XII of the Public Health Service Act, on the subject of trauma care. The importance of trauma systems in injury prevention was also emphasized in the Public Health Security and Bioterrorism Preparedness and Response Act of 2002. This Act called for trauma and burn care to be a component of state preparedness plans.14 In 2002, Health Resources and Services Administration released the National Assessment of State Trauma System Development, Emergency Medical Services Resources and Disaster Readiness for Mass Casualty Events. This national assessment revealed that those states with the most developed trauma systems were most ready to medically manage day-to-day operations as well as respond to mass casualty incidents.14 The assessment, which was designed to characterize each state’s program and infrastructure available to respond when facing an emergency medical event, found that in many state’s trauma system

Report for the Louisiana Recovery Authority Support Foundation
Page 182
This Report is intended for the use and benefit of the
Louisiana Recovery Authority Support Foundation only and not intended for reliance by any other Party.
development was influenced more by historical precedence and political bias than a rational, population-based needs assessment. The report showed that while Louisiana had a state operations center, protocols for a multi-casualty incident and a system linking health information, it also had significant shortfalls – no standardized triage protocol, no plan for professional shortages, no communications system and no surge capacity plan.15 Louisiana Emergency Response Network In January 2004, a report on regional trauma care was presented to the Governor of Louisiana. The report provided a framework for a statewide network which, when fully implemented, would enhance community health through an organized system of injury prevention, acute care and rehabilitation and would be fully integrated with the public health system in rural, suburban and urban Louisiana. The network, later named the Louisiana Emergency Response Network (LERN), was designed to address the daily demands of trauma care as well as interface with Homeland Security for demands placed on the health system during a disaster.16 During the regular session of 2004, the Louisiana legislature passed Act No. 248 establishing the LERN.17 Also referred to as the “Heather, Skylar, and Ellie Law” in memory of Heather Greer, Skylar Jarreau, Ellie Waring and other trauma victims, the Act was passed unfunded. Trauma Centers Licensure standards for hospitals in Louisiana were revised in 2003. Emergency room services were designated as an optional service for hospitals. Two trauma centers were registered with the State Department of Health Standards, the first in New Orleans and the second in Shreveport – 300 miles apart.16 According to data provided by the Trauma Information Exchange Program, Louisiana had two trauma centers that provided coverage of 0.45 (per million of population). By contrast, Florida had 17 trauma centers providing coverage of 1.06, Mississippi had 64 trauma centers providing coverage of 22.50 and Texas had 183 trauma centers providing coverage of 8.78 (Exhibit 3).4 Moreover, Colorado, whose population size is similar to that of Louisiana, has 62; Iowa, whose population is smaller at 2.9 million, has 116 trauma centers; Oklahoma, whose population is 3.5 million has 102 trauma centers.18
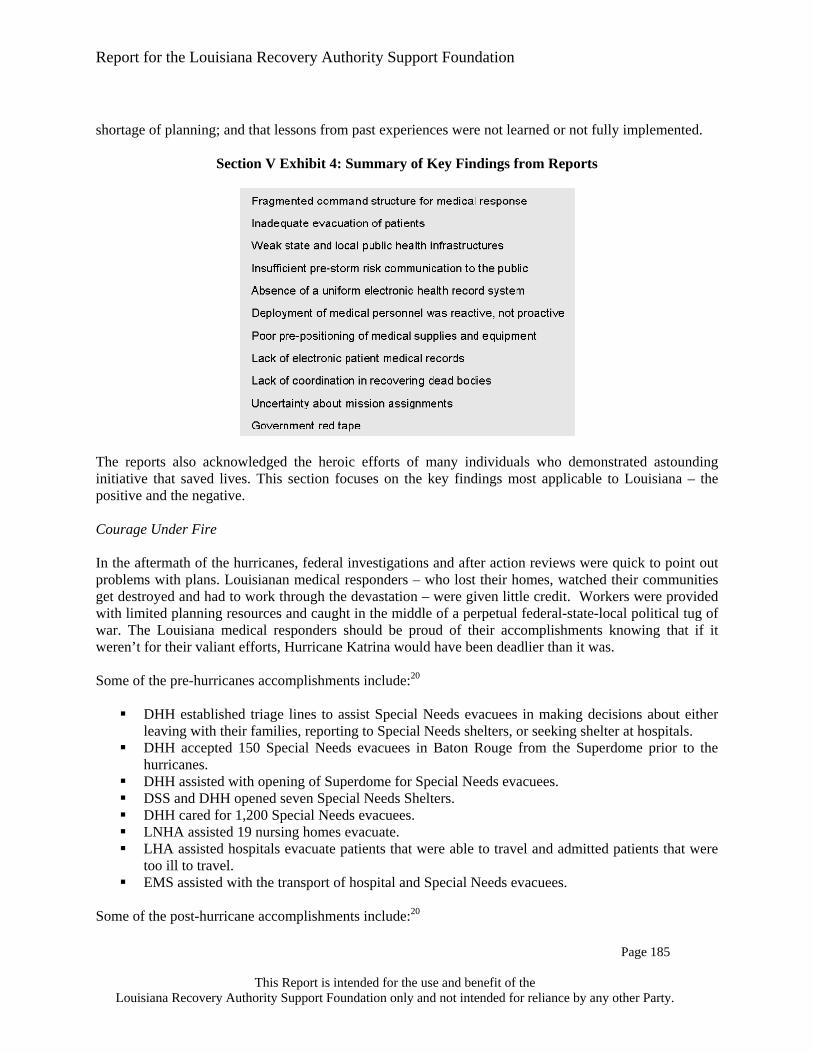
Report for the Louisiana Recovery Authority Support Foundation
Page 183
This Report is intended for the use and benefit of the
Louisiana Recovery Authority Support Foundation only and not intended for reliance by any other Party.
Section V Exhibit 3: All Levels of Trauma Centers – January 2005
Patient Movement and Care Louisiana hospitals and nursing homes were responsible for implementing their own emergency evacuation plans. The primary priority for all hospitals was to “shelter in place” rather than evacuate. The Special Needs Plan, a component of the Shelter Operations Plan in Louisiana, provided a framework within which parish and state government agencies, private industries, non-profit organizations, and volunteer groups could coordinate their actions to deal with the problems and situations associated with Special Needs people in emergencies and disasters.19 The growing vulnerable population in Louisiana resided in: (i) nursing homes; (ii) group homes; (iii) home health; (iv) assisted living; and (v) other healthcare facilities. Parish and state government authorities, according to the plan, would encourage the evacuation of vulnerable populations with their families well before calling for mandatory evacuation of the general population.19 Special Needs shelters were shelters pre-designated by state and local offices of the OHSEP to house individuals who require special assistance. Special Needs agencies were required to make every effort to secure emergency shelter for their patients. Three types of shelters would provide a triage network of shelter care for vulnerable patients: (i) General shelter, (ii) Special Needs shelter, and (iii) Hospital-based shelter.19 Special Needs shelters were primarily for medically dependent individuals who did not require care in a hospital setting and whose pre-arrangements had failed and left them with no other recourse. Regional shelters were used to support the local Special Needs shelter but only after the local parish resources had been totally exhausted.

Report for the Louisiana Recovery Authority Support Foundation
Page 184
This Report is intended for the use and benefit of the
Louisiana Recovery Authority Support Foundation only and not intended for reliance by any other Party.
Nursing homes were expected to make all arrangements to evacuate and shelter their patients in emergencies. They were required to follow the planning instructions set forth in the Louisiana Model Nursing Home or Home Health Emergency Plan. It was the responsibility of nursing homes to seek out the appropriate care from hospitals or other providers to ensure the safety of their patients during disasters. Nursing homes could not use Special Needs shelters as a planned option for patient care. They were expected to contract in advance with commercial carriers for emergency transportation for patients, staff and staff families. They were also expected to arrange for supplemental transportation.19 If prearranged transport failed, shortfalls would be reported to the parish Office of Homeland Security and Emergency Preparedness (OHSEP). The parish OHSEP would then consolidate transportation needs and report them to the state agency responsible for transportation, the Louisiana National Guard (LANG). If needs exceed assets, the LANG would arrange for supplemental transportation assistance from other agencies, the federal government, private businesses, or other organizations and volunteer groups.19 This would be done as a reactive measure to a disaster. Home Health agencies were required to evaluate the condition of each patient and categorize them as ‘Hospital Based Shelterees’ or ‘Special Needs Shelterees’.19 Home health agencies were required to report only Special Needs Shelter eligible patients who require public assistance in an emergency, to the OHSEP in each Parish. The reports were due yearly and would be used to develop transportation and sheltering requirements. Similar to Nursing homes, Home Health agencies, hospitals and other organizations or agencies that provided care to patients, were expected to arrange for supplemental transportation if they did not have enough transportation for all patients in an emergency. Only if prearrangements failed and transportation could not be arranged, would the agencies report their shortfalls to the parish OHSEP.19 LSUHSC was designated as the lead state agency in the area of regional hospital emergency operations in support of Special Needs individuals. LSUHSC was the core hospital system responsible for support to hospital-based evacuees who could not be accommodated elsewhere. As the lead agency, LSUHSC would work with DHH, the Louisiana Hospital Association, the Metropolitan Hospital Council of New Orleans and other hospital and healthcare organizations to formulate acceptance and allocation procedures during emergencies.19 Lessons Learned In the months following Hurricanes Katrina and Rita, the White House, the U.S. House of Representatives and the Government Accountability Office conducted investigations to gather the facts about the preparations for and the response to hurricanes. The goal of the reports was clear – to learn what worked and what did not work. The United States would then chart a new and better course for emergency preparation and response. A Failure of Initiative, released by the House of Representatives marked the culmination of nine public hearings, numerous interviews and briefings and the review of more than 500,000 pages of documents. The reports concluded that the response to the hurricanes was a national failure. Despite all the emergency preparedness efforts since September 2001, hurricanes Katrina and Rita were a deadly reminder that the United States could do better. Exhibit 4 presents the key findings of the reports. In essence, the overwhelming conclusion was that while there was an abundance of plans there was a
Report for the Louisiana Recovery Authority Support Foundation
Page 185
This Report is intended for the use and benefit of the
Louisiana Recovery Authority Support Foundation only and not intended for reliance by any other Party.
shortage of planning; and that lessons from past experiences were not learned or not fully implemented.
Section V Exhibit 4: Summary of Key Findings from Reports
The reports also acknowledged the heroic efforts of many individuals who demonstrated astounding initiative that saved lives. This section focuses on the key findings most applicable to Louisiana – the positive and the negative. Courage Under Fire In the aftermath of the hurricanes, federal investigations and after action reviews were quick to point out problems with plans. Louisianan medical responders – who lost their homes, watched their communities get destroyed and had to work through the devastation – were given little credit. Workers were provided with limited planning resources and caught in the middle of a perpetual federal-state-local political tug of war. The Louisiana medical responders should be proud of their accomplishments knowing that if it weren’t for their valiant efforts, Hurricane Katrina would have been deadlier than it was. Some of the pre-hurricanes accomplishments include:20
DHH established triage lines to assist Special Needs evacuees in making decisions about either leaving with their families, reporting to Special Needs shelters, or seeking shelter at hospitals.
DHH accepted 150 Special Needs evacuees in Baton Rouge from the Superdome prior to the hurricanes.
DHH assisted with opening of Superdome for Special Needs evacuees. DSS and DHH opened seven Special Needs Shelters. DHH cared for 1,200 Special Needs evacuees. LNHA assisted 19 nursing homes evacuate. LHA assisted hospitals evacuate patients that were able to travel and admitted patients that were
too ill to travel. EMS assisted with the transport of hospital and Special Needs evacuees.
Some of the post-hurricane accomplishments include:20

Report for the Louisiana Recovery Authority Support Foundation
Page 186
This Report is intended for the use and benefit of the
Louisiana Recovery Authority Support Foundation only and not intended for reliance by any other Party.
DHH Advance Team assisted the Federal DMAT sent to the Superdome. Special Needs sheltering expanded at Nicholls State University and LSU to establish TMOSAs –
Temporary Medical Operations and Staging Areas. LSU–TMOSA, Pete Maravich Assembly Center opened as a surge facility for emergency rooms
with the capacity for 800 beds. Over 40,000 evacuees were triaged at this facility. Nicholls State TMOSA, Lafourche triaged over 20,000 evacuees. Other Special Needs Shelters around the state expanded capacity to care for over 2,000 Special
Needs evacuees at one point. DHH worked with NDMS to create a Med-evac Program at the Kenner Airport to send 1,800
hospital patients out of state. DHH sent EMS Teams to Search and Rescue Base of Operations (SARBOO) at the Causeway to
help triage thousands of evacuees. LNHA helped evacuate another 34 homes. LHA helped evacuate 25 hospitals – 12,000 patients and caregivers. DHH evacuated 120 premature and newborn babies to Woman’s Hospital in Baton Rouge. Immunizations and pharmaceuticals were disseminated by DHH to evacuees in shelters with the
help of OPH, NDMS, USPHS and retail community pharmacy, including both independent and chain drugstores.
DHH assisted with medical professionals and supplies to help West Jefferson, East Jefferson and Ochsner hospitals remain open.
DHH coordinated credentialing and placement of medical volunteers. DHH worked with DMORT to handle the deceased.
Funding Following the terrorist attacks in September 2001, the United States began investing heavily in disaster planning. Faced with the likelihood of disasters – natural or manmade, New York, California and Florida stepped up their state-wide disaster planning efforts. Louisiana continued to demonstrate a general lack of commitment in terms of funding and resources. Since 2002 the Department of Health and Hospitals in Louisiana received approximately $17.5 million in Health Resources and Services Administration bioterrorism grants: $1.98 million (2002-2003); $7.7 million (2003-2004); and $7.7 million (2004-2005).21 In the past three years, Florida obtained and spent the maximum amount of federal bioterrorism dollars available, totaling more than $184 million.22 Plan Quality The lack of funding and resources shifted the focus from “quality” of plans to the “existence” of plans. Plans contained significant amounts of boilerplate information that was required to receive funds and resulted in the development of plans that were unworkable in practice. The “paper” plan syndrome, defined by Quarantelli as the tendency to believe that disaster preparedness can be accomplished merely by the completion of a written plan, created an illusion of preparedness23 because (i) the planning assumptions were not valid; (ii) plans were not created based on an inter-organizational perspective; (iii) plans were not accompanied by the provisions of resources to carry out the plans; and (iv) end users were not involved in the planning process.
Report for the Louisiana Recovery Authority Support Foundation
Page 187
This Report is intended for the use and benefit of the
Louisiana Recovery Authority Support Foundation only and not intended for reliance by any other Party.
Planning Assumptions The value of planning is in its ability to anticipate the problems that are likely to be faced in a disaster. As a result, disaster planning is only as good as the assumptions on which it is based. Some argued that disasters are just like everyday emergencies, only larger and required more resources for an appropriate response. Planning was focused on the mobilization of large numbers of resources. Unfortunately, the establishment of procedures and mechanisms to coordinate these resources was neglected. Others assumed that disasters resulting from hurricanes such as Katrina and Rita could not be planned for and therefore neglected planning. If planners consider Hurricane Katrina to be the worst case scenario, then at a minimum their plans should be developed to respond to a future disaster of the same magnitude. At the state level, planners should take into account that:
Millions of customers in the Gulf Coast will report power outages. The communications infrastructure will be devastated across the Gulf Coast, incapacitating
telephone service, police and fire dispatch centers and emergency radio systems. Customer phone lines will be knocked out, telephone switching centers will be seriously
damaged, and 1,477 cell towers will be incapacitated. Most of the radio stations and many television stations area will be knocked off the air. The 800 MHz radio system, designed to be the backbone of mutual aid communications, will
cease functioning and repairs will be delayed for several days. The Gulf Coast region’s healthcare infrastructure will sustain extraordinary damage – several
large hospitals will be destroyed, many will be rendered inoperable, and nearly all other healthcare facilities will be forced to close.
The region’s most vulnerable residents and those individuals with Special Needs will suffer terribly inadequate evacuation operations.
Hundreds of hospital patients will be stranded inside dark and flooded facilities that lack basic supplies – some patients will succumb to the horrible conditions before they can be evacuated.
Residents in some nursing homes will drown in the floods.
New Orleans emergency planners should assume that (i) some percentage (10 – 25 percent) will not evacuate; (ii) several of the levees and floodwalls will be overtopped, and some will be breached; (iii) the over toppings and breaches of the levee system will lead to the catastrophic flooding of New Orleans. Approximately 80 percent of the city will be filled with water up to 20 feet deep; (iv) many of the pumping stations will stop working due to power outages and flooded pumping equipment; (v) authoritative reporting from the field will be extremely difficult to obtain because of the widespread destruction of communications infrastructure; (vi) officials will be forced to depend on a variety of conflicting reports from a combination of media, government and private sources, many of which will continue to provide inaccurate or incomplete information; and (vii) some emergency personnel will not report to work. The 2005 hurricane season proved that disasters are not only quantitatively different, but they are also qualitatively different from everyday emergencies. Hurricanes Katrina and Rita compromised the four key elements of any system – personnel, facilities, data and technology. Most planners planned for a hurricane or flood but not both. In 2005, Louisiana was faced with a triple threat – a hurricane, a flood, followed by a second hurricane.

Report for the Louisiana Recovery Authority Support Foundation
Page 188
This Report is intended for the use and benefit of the
Louisiana Recovery Authority Support Foundation only and not intended for reliance by any other Party.
Public-Private Coordination Understanding the nature of the disaster is only one half of the planning equation – planners also require a clear understanding of available medical assets in order to determine readiness. One lesson drawn was that several problems with the response were due to the lack of inter-organizational coordination and communication. To model surge and plan accordingly, information such as the (i) number of emergency vehicles available for evacuations and patient movement; (ii) number of hospital and long-term care support personnel available and their qualifications; (iii) number and type of patients requiring movement and their medical records; (iv) hospital bed circulation and surge capacity; (v) types of medical care available at healthcare facilities; and (vi) quantity and types of medical supplies available is crucial.24 In Louisiana, planners did not have the information they needed to plan because the information resided with several stakeholders who were either not required to share information or were not included in the planning process. The Louisiana health system is a complex system with several autonomous and independent stakeholders. Some of the these stakeholders include the Louisiana Department of Health and Hospitals, Louisiana State University Health Sciences Center, Louisiana Hospital Association, Louisiana Nursing Home Association, Louisiana Primary Care Association, Acadian Ambulance Services, Rural Ambulance Alliance, Louisiana Ambulance Alliance and a number of private hospitals and nursing homes. A lesson learned from the Israeli preparedness infrastructure is the close cooperation between the military operations through the Israel Defense Forces Home Front Command and the civilian agencies and organizations through the Ministry of Health.25 Together they have developed a number of committees to draft recommendations on a variety of preparedness issues. Some of these committees include (i) Policy Committee; (ii) Hospital Preparedness; and (iii) Community Health Preparedness.25 Evacuation of Healthcare Facilities State and local governments can order evacuations of the population during emergencies but healthcare facilities may be exempt from these orders. Hospital and nursing home administrators have to consider several complex issues when deciding whether to evacuate hospitals and nursing homes.26 The decision to evacuate is complicated by (i) the risk of physically moving patients; (ii) whether timely transportation can be secured; (iii) whether a facility can be located to accepted the evacuated patients; and (iv) whether the evacuation can be timed accurately.26 Other critical factors include the cost associated with an evacuation and the transportation of patient records and medication. Without a central mechanism to track the contracting of evacuation vehicles, many healthcare facilities competed for the same local resources. Hospitals lacked sufficient guidance for patient evacuation. Development of an analysis tool that calculates the optimal time to evacuate – weighing the costs and risks associated with evacuating versus sheltering in place as a function of time and potential impact of the disaster – may prove to be beneficial decision support system to hospital and nursing home administrators. The fact that NDMS, a federal system designed to evacuate patients, is not configured to provide

Report for the Louisiana Recovery Authority Support Foundation
Page 189
This Report is intended for the use and benefit of the
Louisiana Recovery Authority Support Foundation only and not intended for reliance by any other Party.
assistance evacuating nursing homes complicates the decision to evacuate nursing homes because nursing home residents generally have no other home and cannot care for themselves. A further complication is that if a resident is evacuated, the receiving facility ought to be able to accommodate the resident for a potentially long period of time. No matter how successful evacuations are, they are ultimately measured by the number of people awaiting rescue. Triage Triage is the cornerstone of good disaster medical management yet a standardized method of triage did not exist. Triaging was further complicated by the insertion of the Louisiana National Guard, Federal Responders and Volunteers following their own variations of triage. Triaging of Special Needs patients is handled differently by each parish.8 For example, Plaquemines Parish, before the start of hurricane season, solicits people to register if they have Special Needs. Jefferson Parish conducts triage by telephone to determine which people with Special Needs require shelter within a parish hospital. Those who qualify are given a password for admittance. The implications of under-triage and over-triage should be understood and managed in future disasters to minimize morbidity and mortality. High levels of over-triage, due to unfamiliarity of triage categories, have been demonstrated to increase the mortality of critical patients.6 Surge Capacity The current tracking mechanism provides administrators with information on how hospitals spend the HRSA grants they receive. The information is not translated into emergency services procured. As a result, a true sense of surge capacity cannot be determined. During a national emergency, Israel expands its healthcare workforce by moving everyone from an 8 hour shift to a 12 hour shift – instantly creating a 50 percent increase in staff time.25 In a war, the capacity of all Israeli hospitals can be increased by 30 – 40 percent, by expanding the number of beds in the wards, using “surge capacity” treatment space and increasing the number and work hours of medical personnel.10 Without federal resources and aid, reports stated that the public health system in Louisiana and its neighboring states were not prepared to support their respective populations. State and local medical systems were either destroyed or overwhelmed and when resources were deployed, in most cases, the deployment was reactive increasing the inefficiency in the delivery of emergency medical services.8 In all, Louisiana received the following federal assistance:
Louisiana received eight Disaster Medical Assistance Teams (DMATs) and one Portable Morgue Unit (PMU), comprised of four Disaster Mortuary Operational Response Teams (DMORTs). DMATs are groups of professional and paraprofessional medical personnel that have the ability to triage and treat patients. DMORTs consist of private citizens with specialized training and experience to help in recovery, identification and processing of deceased victims. Mortuary services were established in St. Gabriel, Louisiana with 96 personnel.8
Prior to landfall, CDC personnel were on the ground in Louisiana with a Technical Advisory
Response Unit (TARU). In anticipation of the need to provide emergency medical services, 27
Report for the Louisiana Recovery Authority Support Foundation
Page 190
This Report is intended for the use and benefit of the
Louisiana Recovery Authority Support Foundation only and not intended for reliance by any other Party.
pallets of medical supplies were pre-positioned prior to landfall. A pallet includes basic first aid material, blankets and patient clothing, suture kits, sterile gloves, stethoscopes, blood pressure measuring kits and portable oxygen tanks. CDC sent over 100 personnel to help reestablish services, conduct surveillance and improve communication when New Orleans lost its public health department.8
Federal Medical Shelters (FMS), a new component of the HHS hurricane response, are rapidly
deployed, minimal care medical kits capable of housing, triaging and holding displaced patients. Each FMS is a 250-bed emergency shelter with pharmaceutical suite, designed to provide care to patients for three days before the need to re-supply and re-stock materials. One FMS arrived at Louisiana State University in Baton Rouge on August 30 and began operations staffed by Public Health Service (PHS) commissioned Corps officers. FMS was also staged at Fort Polk Army Base in central Louisiana.8
The National Air Guard supplied Expeditionary Medical Support Systems (EMEDS) to provide
front line, field hospital care with operating rooms, dental, pharmacy and lab services, intensive care units and other facilities and equipment. These mobile hospitals have a 25-bed capacity and can be set up and ready to receive patients within 24 hours. On September 1, the Air Force deployed an EMEDS to provide medical assistance at the New Orleans Airport. An additional EMEDS was set up at the Ernest N. Morial Convention Center in New Orleans to take place of Charity Hospital.8
Special Needs Disaster medical care is significantly different from the care medical providers deliver on a daily basis. The principal of emergency medical care is to do the greatest good for the greatest number of patients, while the objective of conventional medical care is to do the greatest good for the individual patient.27 Special Needs patients consume disproportionate supplies, casualty care space and caregiver attention. To ensure that scarce medical resources are put to the most beneficial use during a natural hazard with a slow onset (such as a hurricane), Special Needs patients should be evacuated with enough time to redeploy and stage the medical resources. Shelters Special Needs sheltering was a priority of planners in ESF-8 yet a standard definition of Special Needs did not exist prior to Hurricane Katrina.8 Consistent inventorying of Special Needs patients was not performed. As a result, Special Needs sheltering consumed and continues to consume a disproportionate amount of planning time. Last minute evacuees will use any and all available shelters whether they are designated or prepared to receive them. It is estimated that between 18,000 and 25,000 people broke in and entered the Convention Center. The Convention Center was never intended to serve as a shelter of any kind.8 Regulations Licensure standards for hospitals in Louisiana were revised and published in 2003. Emergency room services were designated as an optional service and hospitals were not required to declare the level of emergency service care provided.16

Report for the Louisiana Recovery Authority Support Foundation
Page 191
This Report is intended for the use and benefit of the
Louisiana Recovery Authority Support Foundation only and not intended for reliance by any other Party.
The Emergency Medical Treatment and Active Labor Act (EMTALA) of 1989 provides for medical screening examination, stabilizing treatment and appropriate transfer. Plans should include provisions for adhering to these federal regulations during patient transfers. Adherence to these requirements were challenged when the transferring and receiving hospitals did not have two-way radio communications capability and the telephone and cellular systems were damaged or rendered inoperable. Public Readiness A disaster is ultimately defined by the vulnerability of the people impacted. It is difficult to define a disaster by it physical characteristics. Natural hazards, by themselves, are not disasters. To be a disaster, a natural hazard has to affect people. The impact of a hazardous event on a community is partially determined by the mechanisms and adaptations that the population has developed to deal with the effects of potentially damaging events. Natural hazards are more likely to be disasters in Third World countries, with poor people and inadequate medical infrastructures, than in modernized countries.28 Unfortunately, rural parts of Louisiana and sections of New Orleans resembled the former rather than the latter. As of 2001, the U.S. Census Bureau reported that Louisiana was among the top five poorest states in the nation. In 2001, Louisiana ranked 4th highest in the U.S. in uninsured population. Louisiana also had a high unemployment rate (6.3 percent); a high crime index (4th highest in the U.S.; 1st in murder rate); and extremely poor health outcomes (last in the U.S. for three consecutive years). Communication The one consistent factor in disaster response is the breakdown in communications. The reasons include (i) the lack of radio channels; (ii) incredible radio traffic volume; (iii) unclear communication chains; (iv) differing radios and frequencies; and (v) loss of communication capability. Issues with communications are not confined to technology. Most hospital systems did not traditionally communicate among themselves. As they grew more competitive, they have become more reluctant to share information. As a result, during disasters no mechanism existed for the hospitals to communicate and most were left coordinating within their system. Working with the Media Although interaction with the media is often perceived as adversarial, the media have definite roles and responsibilities in disasters. Involvement of the news media before disasters can provide a valuable source of public education and support for community planning.29 The changing demographics of Louisiana reminds us to not neglect the media that reach non-English speaking audiences. Managing expectations is a critical component of incident management and should be done proactively. The media should be educated on existing plans so that expectations are realistic. The Israel Television Authority maintains 20 videos that provide authoritative information about what to do in the event of a disaster. The Ministry of Health authorizes which tape will be shown depending on circumstances. The objective of the videos are to reduce public panic and hysteria, by demonstrating that plans are in place, the situation is under control and the appropriate treatment is being made available. Medical personnel rather than politicians deliver the information in the video.25

Report for the Louisiana Recovery Authority Support Foundation
Page 192
This Report is intended for the use and benefit of the
Louisiana Recovery Authority Support Foundation only and not intended for reliance by any other Party.
Preparing the Louisiana Health System for the Future The primary goal of disaster planning is to increase the resiliency of a system allowing it to sustain a pre-determined level of operation through a disaster. The Merriam-Webster dictionary defines resiliency as the ability to recover from or adjust easily to misfortune or change. In order to be resilient, preparedness should be integrated into daily operations – funded through the budgeting process, implemented with operational standards and measured through performance evaluations. The goal is to offer Louisiana policy makers with recommendations that will result in immediate opportunities for positive change. The following three recommendations are cost effective, timely and relatively easy to implement. Moreover, they are based on proven strategies that have been employed successfully nationally and internationally. These recommendations will form the three pillars of preparedness (Exhibit 5) for the Louisiana health system and will create a consistent framework to sustain emergency preparedness in the Louisiana health system. When implemented, the recommendations will directly address all the lessons learned during the 2005 hurricane season.

Report for the Louisiana Recovery Authority Support Foundation
Page 193
This Report is intended for the use and benefit of the
Louisiana Recovery Authority Support Foundation only and not intended for reliance by any other Party.
Section V Exhibit 5: Three Pillars of Preparedness
Recommendation 14A: Fund the Louisiana Emergency Response Network to operationalize a time-sensitive illness response system linking homeland security initiatives with healthcare operational standards and trauma care requirements. Communities have five basic approaches to managing trauma-emergency networks. The first approach is to ignore it – resulting in lower level care to the patient. The second approach involves the creation of voluntary networks which depend entirely on the willingness of participants to cooperate. The third approach creates an independent agency to develop a system plan and to convince providers to participate. Under a fourth approach, the planning agency is granted regulatory powers in order to enforce implementation of the plan. The fifth approach places the entire system under a single agency.30 Based on systems in existence today, system development is best accomplished through the designation of a lead governmental agency with the authority to develop policy, including those for trauma system development, implementation, coordination, evaluation and identification of additional funding sources using a combination of the third and fourth approaches. However, to fulfil policy responsibilities, the lead agency must receive sufficient funding and human resources. For several years, Louisiana chose the first approach. Then, in 2004, the Louisiana State Legislature passed Act No. 248 – creating the Louisiana Emergency Response Network (LERN). The LERN was created to be a comprehensive, coordinated statewide system for access to regional trauma-patient care throughout the state in order to safeguard the public health, safety and welfare of the people of Louisiana
Report for the Louisiana Recovery Authority Support Foundation
Page 194
This Report is intended for the use and benefit of the
Louisiana Recovery Authority Support Foundation only and not intended for reliance by any other Party.
against unnecessary trauma and time-sensitive related deaths and incidents of morbidity due to trauma. The LERN provided the blueprint required to develop a time-sensitive illness response system in Louisiana. However, the LERN was never adequately funded. Now Louisiana operates under the second approach. By contrast, successful time-sensitive illness response systems have been implemented in a number of states including California (EMSA), Alabama (Birmingham Regional Emergency Medicine System), West Virginia (Rural/Trauma Network System), New York (New York State Trauma System) and Mississippi (Trauma Care System). Maryland runs one of the oldest and most established systems in the country. Internationally, it can be argued that Israel operates one of the most effective trauma systems in the world. The collaboration between these systems and their respective public health systems has resulted in several mutual benefits. The need for a time-sensitive response system has never been greater in Louisiana. It was estimated that almost 1,000 Louisianans died each year from trauma-related deaths.16 Hurricane Katrina destroyed one of the two ACS-verified Level I trauma centers in the state. With the 2006 hurricane season only months away, the state’s only trauma center is in Shreveport, 300 miles away from the Gulf coast. The LERN will serve in dual capacity; it will function on a daily basis in accordance with well established national guidelines and will be able to expand at the time of an incident to provide the elements of disaster medical care: triage and initial stabilization, definitive care and rehabilitation. When functional, the LERN will:
Link key stakeholders of the health system with the Office of Homeland Security, Include resources that are organized specifically for immediate life-saving response for severely
injured patients, Maintain a specialty trained workforce that is prepared to provide a range of emergency care,
including the deployment of specialty trauma teams, Include pre-hospital services, acute care in trauma centers and non-trauma acute care, Utilize a well-established communications system and patient care protocols, and Provide surge capacity for patient care by integrating other specialty teams such as DMAT,
military and other state trauma systems. Operational Structure Of primary importance is the availability of the LERN to respond to local needs to ensure that all communities of Louisiana: rural, suburban and urban; receive the best possible care. The LERN will be connected to pre-hospital, hospital, post-acute and injury programs across the state via nine regional command centers.16 Operating out of existing EMS facilities, the nine regional centers will be linked together by a tenth state-level command center. This structure will mirror the unified emergency medical system in Israel where eleven regional dispatch centers are linked via a national dispatch center.25 Consisting of an integrated network of hospitals, personnel and EMS, the LERN will match pre-hospital patient care needs with available hospital resources. The commitment of Louisiana hospitals will be required to provide time-sensitive care to patients. Using Designated Regional Coordinators (DRCs), the LERN will determine the level of trauma-patient care available at each facility and track against this level. In order to accomplish this, it is recommended that the reporting of pre-hospital and hospital emergency care data be made mandatory. Oversight of the data collection and analysis should be
Report for the Louisiana Recovery Authority Support Foundation
Page 195
This Report is intended for the use and benefit of the
Louisiana Recovery Authority Support Foundation only and not intended for reliance by any other Party.
provided by the Department of Health and Hospitals. LERN Board The LERN Board is comprised of members from the Louisiana Senate, the Louisiana House of Representatives, the Department of Health and Hospitals, the Office of Homeland Security and Emergency Preparedness, the Louisiana Hospital Association and other key stakeholders. The Board is in the process of appointing nine Regional Commissions. After the Regional Commissions have been appointed, the LERN Board will provide oversight and support funding of the LERN. Regional Commissions Members of the Regional Commissions will include representatives from the Office of Homeland Security, the Office of Public Health Regional Medical Director, local Ambulance Services, local Hospitals, the LERN Tri-Regional Coordinators and other local stakeholders. Each commission will be responsible for the planning and management of the regional response network, network improvement and ongoing funding. State Command Center The State Command Center will function as the hub of the LERN system responsible for oversight, policy development, integration with homeland security initiatives and overall system improvement. Staffing for the State Command Center will include:
A Medical Director who will be responsible for oversight of the LERN system; financial reporting; policy development; and will serve as the LERN liaison to the Louisiana Office of Homeland Security and Emergency Preparedness and the Louisiana National Guard.
An Executive Director who will serve as the chief operating officer of the system and will be responsible for system efficiency and performance; development and implementation of trauma care strategy; and implementation of LERN policies.
Three Tri-Regional Coordinators who will be responsible for collection and analysis of data for performance improvement within their respective regions; designing and executing injury prevention training programs; coordination with local Homeland Security personnel on preparedness planning for communities, families, schools and day cares; and participating in local emergency preparedness exercises.
One Staff member to provide administrative support. Regional Command Centers Integrated with the 911-EMS infrastructure, the nine Regional Command Centers will constitute the LERN operations. Each Regional Command Center will include:
A Medical Director to provide support and supervision. A Designated Regional Coordinator who will liaison with hospitals in their region. An EMT-P Supervisor to coordinate the EMT-P staff and track performance of the Regional
Command Center. Three EMT-P Staff who will facilitate the seamless movement of patients.

Report for the Louisiana Recovery Authority Support Foundation
Page 196
This Report is intended for the use and benefit of the
Louisiana Recovery Authority Support Foundation only and not intended for reliance by any other Party.
LERN IT System When accurate and timely information is available and shared, mortality and morbidity is prevented. The LERN, through its IT systems, will facilitate information sharing between key health system stakeholders.16 Implementation of a LERN IT System is recommended to will gather and track real-time information such as the (i) number of emergency vehicles available for patient movement and their geographic location; (ii) number of hospital and long-term care support personnel available and their qualifications; (iii) hospital bed availability and surge capacity; (iv) medical care available at healthcare facilities; and (vi) quantity of medical supplies available. Using this information, trauma patients will be transported to the appropriate facility in a timely manner. Such a complex information system will require the cooperation of the Louisiana Department of Health and Hospitals, Louisiana State University Health Sciences Center, Louisiana Hospital Association, Louisiana Nursing Home Association, Louisiana Primary Care Association, Acadian Ambulance Services, Rural Ambulance Alliance, Louisiana Ambulance Alliance and a number of private hospitals and nursing homes. The design and implementation of the LERN IT System may take up to three years to complete. In the meantime, it is recommended that the LERN, through its Regional Commissions, initiate:
Creation of policies, procedures and protocols pertaining to real-time information gathering, sharing, analysis and reporting,
Standardization of trauma-emergency care definitions and processes such as Special Needs and triage,
Definition of uniform data sets which at a minimum will include patient identification and gender, the pain, injury or problem, the interventions performed and the time, the pre-hospital provider identification, the EMS unit number and the triage category,
Definition of performance metrics, reporting requirements and operational standards, Data collection, validation and analysis, and Creation a state-wide trauma registry
LERN’s Role in Medical Disaster Response The LERN is a natural foundation on which to build the Louisiana disaster medical response. During disaster planning and simulation exercises, the LERN will be a valuable partner to the Office of Homeland Security and Emergency Preparedness and the Louisiana National Guard. Using its information analysis and reporting capabilities, the LERN will facilitate evidence-based planning. Information gleaned from the IT system and LERN processes will help planners gain a better understanding of any gaps that might exist between current emergency resources and public needs. Most importantly, the LERN could help resolve issues pertaining to surge capacity, evacuation routes and staging areas. Triage is arguably the most important mission of any medical response based on the assumption of a potential imbalance between health needs and available resources. The well known truism that the closest
Report for the Louisiana Recovery Authority Support Foundation
Page 197
This Report is intended for the use and benefit of the
Louisiana Recovery Authority Support Foundation only and not intended for reliance by any other Party.
healthcare facilities to the disaster site will be the ones most significantly impacted by casualties should be factored when determining triage.6 In Louisiana, the geographic effect is of clinical and statistical significance because it may result in substantial maldistribution of casualties throughout the community. The LERN will develop triage mechanisms to decrease the impact of the geographic effect. Multiple approaches to triage are currently in practice. Daily triage performed on a routine basis, vary from institution to institution. During a disaster, when local resources are unable to provide immediate care on a timely basis to all victims needing such care, LERN will shift the focus from providing the highest intensity of care to the most seriously ill patients to doing the greatest good for the greatest number of patients. Using Israel’s Magen David Adom as a best practice for field operations, the LERN will follow a clear set of standardized instructions when dealing with disasters. In Israel, the first ambulance to arrive takes a command position and is not to provide any treatment. They immediately report to the Home Front Command on the scope of the incident and the approximate number of casualties so that appropriate resources can be directed to the site. Emergency services use a “scoop and run” approach to disaster response. All victims, with the exception of dismembered bodies, are removed from the scene. Life saving procedures are generally done in the ambulance during evacuation. No treatment is provided on site. Using standardized triage criteria, uniform data sets, enhanced communications and real time asset management, during a disaster, the LERN could become a critical component of the public health and medical services emergency support function (ESF-8) – discussed in Recommendation 14B. It is recommended that the LERN IT System be enhanced to serve as a medical emergency decision support system during a disaster. The decision support system will:
Provide status updates and support decision making at the ESF-8 State EOC, Provide logistical support to the Louisiana National Guard, the Office of Homeland Security and
Local Parish EOCs, and Enable medical responders in the field to make effective decisions quickly by connecting
medical personnel, local hospitals and trauma centers to facilitate a seamless flow of patients, from the field (or a hospital) to the medical facility that possesses the resources and expertise most appropriate for the patient at that particular moment in time.
Funding Financial support is essential for ensuring system integrity to develop, maintain and improve the trauma system over time. An effective trauma care system relies heavily on maintaining trauma care services and facilities in a constant state of readiness; long-term financial and community support is required. Other states have identified various ways to fund ongoing trauma-EMS systems in addition to general fund appropriations (Exhibit 6). States can no longer rely on federal funding to develop their systems. Systems in existence today are funded through a combination of:
Motor vehicle fees, fines and penalties Court fees, fines and penalties (not motor vehicle related) 9-1-1 system surcharge Intoxication offence fees

Report for the Louisiana Recovery Authority Support Foundation
Page 198
This Report is intended for the use and benefit of the
Louisiana Recovery Authority Support Foundation only and not intended for reliance by any other Party.
Controlled substance act or weapons violation fees Taxes on sale of tobacco Tribal gaming
Section V Exhibit 6: System Funding in Other States
To develop a financial framework for the LERN, consideration was taken of the many categories of cost pertaining to administration and planning, infrastructure and equipment, communications, staffing and patient care. Funds will be required to train personnel. Salary support was included in financial planning. LERN is estimated to cost approximately $9 million annually in today’s dollars. This estimate includes costs associated with the implementation and operation of (i) Nine Regional Commissions; (ii) One State Command and Control Center; and (iii) Nine Regional Command and Control Centers. The estimate does not include the costs associated with the evaluation and implementation of the LERN IT System or the Medical Emergency Decision Support enhancement. Design and implementation of the LERN IT System will begin after the LERN Regional Commission structure is operational and the pre-system activities described above have been completed.

Report for the Louisiana Recovery Authority Support Foundation
Page 199
This Report is intended for the use and benefit of the
Louisiana Recovery Authority Support Foundation only and not intended for reliance by any other Party.
Mississippi committed to a statewide trauma system in 1991.31 In 1998, the Legislature passed HB 966, creating a Trauma Care Trust Fund, which established a permanent funding source for a statewide trauma system through a $5 assessment on all moving traffic violations.31 In 1999, the Mississippi Legislature appropriated an additional $6 million to the Trauma Care Trust Fund bringing the total amount in the trust fund to $8 million per year.31 Maryland adds a tax of $13.50 on each vehicle registration to fund its network.32 Georgia legislators are considering several strategies to fund their state’s trauma network, estimated to cost $25 million to $30 million.32 According to the Health Services and Resources Administration, 39 states already have networks in place.32 As the LERN matures, the operating costs are expected to decline, as evidenced by the California Emergency Medical Services Authority (EMSA). EMSA was established in 1980 with a general mandate to develop a statewide system of coordinated emergency medical services. With over 25 years of experience, established policies and 32 local EMS agencies, the EMSA now operates with a staff of 50 people and a budget of approximately $5 million.30 A 2002 HRSA national assessment revealed that the states with the most developed trauma systems were more medically ready to handle any type of incident because trauma systems are experienced in managing special populations, including children, residents of the inner city, groups of low income, minority groups, women, elder persons and individuals with special healthcare needs.15 Recommendation 14B: Formalize the Public Health and Medical Services emergency support function (ESF-8) incident command structure in accordance with the National Response Plan and the National Incident Management System to minimize chaos and enhance decision making during a disaster. The incident command system was created in 1970 in response to a series of wildfires in Southern California that illustrated the difficulties of having firefighters from multiple jurisdictions respond to the same event. The goal of the incident command system was to simplify communications and establish clear lines of authority and command.

Report for the Louisiana Recovery Authority Support Foundation
Page 200
This Report is intended for the use and benefit of the
Louisiana Recovery Authority Support Foundation only and not intended for reliance by any other Party.
Section V Exhibit 7: Core Concepts of the Incident Command System
The problems that California fire services faced in 1971 are strikingly similar to the lessons learned from Hurricanes Katrina and Rita.5 Among them are:
Lack of a common organization. Several federal, state and local agencies took part in the incident. There were at least a dozen different organizational structures in use, and these were frequently modified to meet contingencies. Terminologies were different. Even at the local level, departments used different terms for the same items.
Poor on-scene and inter-agency communications. Most of the radios were of single-frequency
capability; and federal, state and local forces were operating in different frequency bands. On-scene supervisors could not contact subordinate units and frequently could not talk to those in command. Field units were essentially “on their own” and had to take independent actions that were not necessarily coordinated or effective. Dispatch centers could not communicate with each other.
Inadequate joint planning. Each agency had done its own planning at is own chosen location.
Teams were assigned on a unilateral basis. Logistical support was ordered without knowledge of what other agencies already had available. There were separate and distinctly different objectives created by different jurisdictions.

Report for the Louisiana Recovery Authority Support Foundation
Page 201
This Report is intended for the use and benefit of the
Louisiana Recovery Authority Support Foundation only and not intended for reliance by any other Party.
Lack of valid and timely intelligence. None of the organizational structures included elements
charged with the specific duties of data and intelligence gathering. Information about incident character, size and intensity were provided to decision-makers on a random and haphazard basis. Much of the information upon which decisions were made was old, and forces were often dispatched to areas that needed no action. Other forces were not dispatched to critically important sectors.
Inadequate resource management. As the combined consequence of all of the preceding
weaknesses, resources were poorly managed. Personnel, equipment, supplies and other resources were lost, sometimes for days; no one knew where they were, and their potential effectiveness was lost.
Limited prediction capability. Since these fires occurred under extreme conditions and with
compounding challenges, the expertise to predict future conditions (even 1 hour in advance) was lacking. No one knew where the fires were going, how many homes might be threatened, how many people should be evacuated, or where they might go if they were ordered to leave.
Organizational Structure An ESF-8 Incident Command System could avoid the previously mentioned problems. Such a system should be structured according the format prescribed by the National Response Plan. Designed to improve effectiveness, accountability and communications, this command structure should integrate seamlessly with the National Incident Management System. The command structure must use an incident action planning process that is systematic and comprehensive; integrating multiple agencies and emergency response disciplines into a common organization using the process. The unified command concept used must provide the most effective means of coordinating and directing multiple disciplines during major Louisiana public health emergencies.

Report for the Louisiana Recovery Authority Support Foundation
Page 202
This Report is intended for the use and benefit of the
Louisiana Recovery Authority Support Foundation only and not intended for reliance by any other Party.
Section V Exhibit 8: Recommended Command Structure for ESF-8
The command structure, comprised of the following five major management activities, should be modular and designed to help organize and allocate medical personnel, services and resources in a timely manner. It is recommended that a thorough study of the Hospital Emergency Incident Command System (HEICS)33 and the Medical and Health Incident Management (MaHIM) System34 be undertaken to determine the most appropriate “mapping” of the Louisiana health system to the recommended incident command structure. Command Command responsibilities will be executive in nature and should include organizing to meet the needs of the incident, establishing incident control objectives, setting priorities for work accomplishment, assuring development of command-approved action plans, approval of resource orders and releases, approval of public information outputs and coordination with public officials and other agencies. It is recommended that an incident commander and two alternates be formally selected from within the Department of Health and Hospitals and receive training on the concepts of Incident Command, the National Response Plan and the National Incident Management System. A key point about the command function is that the executive responsibilities cannot be ignored. Even though there may be only five or six responders on an incident and the Incident Commander may be quite

Report for the Louisiana Recovery Authority Support Foundation
Page 203
This Report is intended for the use and benefit of the
Louisiana Recovery Authority Support Foundation only and not intended for reliance by any other Party.
involved in the actual “doing” work, the command function requires attention to organizing and managing. Another key point is that Command unifies the incident command structure and regardless of whether the command is represented by one person or a committee, its authority should be unambiguous. In Israel, major decisions regarding disaster response are made by the Supreme Hospital Association, a three person decision-making body. The three people are the Secretary General of the Health Ministry, the Surgeon General of the Israel Defense Forces and the CEO of the largest health maintenance organization in the country.25 The Incident Commander should be supported by a Public Information Officer, Safety Officer and a Liaison Officer, as needed. These positions report directly to Command and assist in fulfilling the duties of coordination with others and the overall safety of the organization’s members. Command should be the only ESF-8 function housed at the state EOC during a disaster. During the response to Hurricanes Katrina and Rita, several ESF-8 EOCs existed – each housing different offices and bureaus of the Department of Health and Hospitals. It is recommended that these EOCs be consolidated into one unified Department of Health and Hospitals EOC which will house all the appropriate offices and bureaus according to their incident command role. Operations Operations should be charged with carrying out Command direction and should be responsible for achieving command objectives, directing tactical operations, participating in the planning process, modifying action plans to meet contingencies providing intelligence to Planning and Command, maintaining discipline and accountability. The Operations activities – while important – should be integrated into a managed system and not a means unto themselves to the exclusion of all other chores that must be done. To this end, the LERN when implemented will play a crucial role in field operations pertaining to pre-hospital, medical and mass fatality care. Planning Planning should encompass all activities that support Command and Operations in the processing of incident information and in the development of plans for managing the incident. Within Planning, Information Processing will be responsible information collection and dissemination and maintenance of information for reporting purposes. Plan Development should support all activities through the planning process during an incident. Logistics Logistics should provide all of the personnel, equipment and supplies required to manage the incident and support the maintenance of facilities used by Operations. Critical support activities, such as receiving, managing and transporting pharmaceutical surge supplies should be addressed through Logistics.

Report for the Louisiana Recovery Authority Support Foundation
Page 204
This Report is intended for the use and benefit of the
Louisiana Recovery Authority Support Foundation only and not intended for reliance by any other Party.
Finance Finance should be responsible for financial management and accountability on the incident. Procurement authorizes expenditures in accordance with agency policies, but does not actually order or purchase anything. Procurement is also responsible for contracting services. The Logistics Section does this after receiving approval by Finance. Financial Support uses the Incident Action Planning process, the resource-status tracking and the Logistics acquisition records to accomplish its accounting tasks. Compliance is responsible for tracking licensure requirements and agency compliance issues. The command structure would provide public health and medical services with a single, comprehensive and adaptable system for incident management. Such a structure would preserve jurisdictional organizations by assigning them functions according to their traditional responsibilities and capabilities. While the concepts of incident command are easy to understand, the implementation is not as simple. Each function should conduct simulation exercises to maintain the desired level of readiness. It is recommended that DHH formalize the ESF-8 incident command structure and conduct at least one simulation exercise prior to the start of the 2006 hurricane season. The costs associated with formalizing the ESF-8 incident command structure and conducting an exercise are included in the recommendation 3 implementation costs. Recommendation 14B: Establish long-term funding and planning mechanisms to sustain emergency preparedness of the Louisiana health system by creating a Bureau of Emergency Preparedness as its own entity within the Department of Health and Hospitals with an appropriate budget and the resources required to develop and sustain realistic disaster plans. It is a widely held belief in the disaster planning community that the threats posed by future disasters are likely to get worse due to increasing population densities. Disasters of today involve economic dislocation, the collapse of political structures, violence and banditry, civil conflict and mass population displacements.7 In the aftermath of disasters, governments respond with drastic efforts – spending billions of dollars – to protect their citizens from future disasters. Commissions are created to document lessons learned and recommend action steps. Awareness is created on the risks of future threats and a conscious effort is made to mentally prepare the public for future disasters. These activities, if done in earnest, can produce resilient communities.

Report for the Louisiana Recovery Authority Support Foundation
Page 205
This Report is intended for the use and benefit of the
Louisiana Recovery Authority Support Foundation only and not intended for reliance by any other Party.
Section V Exhibit 9: Major Disaster Declarations in Louisiana since 1985
Source: FEMA Louisiana is no stranger to disasters. Over a 20-year period between 1985 and 2005, Louisiana declared 26 major disasters (Exhibit 9). So why was Louisiana not prepared for the 2005 hurricane season? One answer is that complacency had set in because over the past century, America’s natural disasters had become steadily less deadly.1 Another answer is that socio-economic circumstances prevented preparedness, and Louisiana did not have the means or resources to be resilient.7 Between 2002 and 2005, DHH did not supplement the $17.5 million in HRSA grants to support disaster planning. At present, emergency preparedness for DHH is housed in the medical director’s office. According to the DHH website, the medical director is also responsible for medical consultation on a variety of healthcare policies and serves as the department’s liaison with medical, nursing, pharmacy, allied health professionals and professional associations throughout the state. The medical director also serves as the state health officer and is responsible for ensuring that the State Sanitary Code is enforced.35 With the support of only two staff and no funding from the department for disaster planning, the medical director is expected to ensure public health preparedness throughout the state.

Report for the Louisiana Recovery Authority Support Foundation
Page 206
This Report is intended for the use and benefit of the
Louisiana Recovery Authority Support Foundation only and not intended for reliance by any other Party.
It is recommended that DHH create a Bureau of Emergency Preparedness as its own entity within the department to serve as the Secretary’s principal advisory staff on matters related to public health emergencies and to coordinate all disaster planning initiatives within the department. To maintain an unbiased position in executing its mission, it is essential that the agency be a stand alone agency within DHH reporting directly to the Secretary. Being independent will enable the agency to hold key stakeholders accountable.
Section V Exhibit 10: Functions of the Bureau of Emergency Preparedness
It is recommended that the agency be responsible for two functions – (i) Planning and (ii) Emergency Operations (Exhibit 10). To fulfill its mission, it is further recommended that the Department of Health and Hospitals appropriate the Bureau of Emergency Preparedness an annual budget of up to $1 million in today’s dollars – which only includes salary costs, costs for training and supplies and costs for disaster planning activities. This level of staffing and costs is based on research of existing international and national emergency preparedness and planning systems. The director of emergency preparedness would head the office and within six months of its creation should submit to the Secretary, a three-year Louisiana Public Health Preparedness Strategic Plan outlining its goals, objectives and strategies. The report should also include a proposed budget to accomplish its mission during the three-year period. The Planning function, with a full-time staff of five, should be responsible for the development of policies, plan assessment and implementation of analytical products that ensure readiness to respond to public health emergencies. This function should be responsible for promoting public-private disaster planning. Texas used committees to promote public-private disaster planning during its disaster response project.36

Report for the Louisiana Recovery Authority Support Foundation
Page 207
This Report is intended for the use and benefit of the
Louisiana Recovery Authority Support Foundation only and not intended for reliance by any other Party.
Within three years, the Planning function should:
Establish and chair committees on o Public-private plan integration o Hospital and nursing home evacuation planning o Special Needs o Community preparedness
Develop a Readiness Assessment Framework Create a Surge Capacity Calculator
Develop and implement an Evacuation Feasibility Tool to
o Identify overlaps in evacuation vendor contracts o Perform evacuation cost-benefit analysis o Assess the adequacy of shelter capacity
The Emergency Operations function, with a full-time staff of three, should be responsible for implementation of the ESF-8 Incident Command Structure (Recommendation 14B). In close coordination with the LERN, the Office of Homeland Security and Emergency Preparedness, Louisiana State University Health Sciences Center, Department of Social Services, Department of Transportation and Development, the Louisiana National Guard and other key ESF-8 stakeholders, this function should be responsible for maintaining a desired level preparedness. The function should also be responsible for establishing and maintaining working relationships with federal agencies and the media. Within eighteen months of its creation, the Emergency Operations function should:
Develop protocols for each function within the ESF-8 Incident Command Structure, Create a system to track all applicable federal grants, and Create a system to track all federal medical assets that would be available in a disaster
The benefits of having the Bureau of Emergency Preparedness significantly outweigh its costs. An annual budget of $1 million will help resolve several gaps identified in the current disaster planning process. More importantly, the cost represents less than one percent of the Department’s Katrina Project Worksheets3 as of January 2006 (Exhibit 11).
Section V Exhibit 11: DHH Katrina Project Worksheet (January 2006)

Report for the Louisiana Recovery Authority Support Foundation
Page 208
This Report is intended for the use and benefit of the
Louisiana Recovery Authority Support Foundation only and not intended for reliance by any other Party.
In New Zealand, the Director-General of Health is responsible to coordinate the provision of emergency health services. The Director-General should, through funding and monitoring arrangements, ensure that all key stakeholders are aware of and comply with their responsibilities in all phases of emergency management.37 As a long-term funding mechanism, the Governor of Louisiana and the Secretary of the Department of Health and Hospitals should establish “public health preparedness” as a line item in their annual budget.
Conclusion Disasters start and end at home. In the aftermath of the 2005 hurricane season, Louisiana has been presented with a unique opportunity to set the benchmark in health system disaster planning and emergency preparedness. State and local officials should take the initiative to make responsible use of state and local funding to develop an adequate healthcare disaster response system. Louisiana officials should fulfill the public trust given to them. They should lead. There can be no greater mission and no greater tribute to the victims of Hurricanes Katrina and Rita. Additional reference material used in formulating this thesis have been included:38-54

Report for the Louisiana Recovery Authority Support Foundation
Page 209
This Report is intended for the use and benefit of the
Louisiana Recovery Authority Support Foundation only and not intended for reliance by any other Party.
Sources and Notes 1. The White House. Federal Response to Hurricane Katrina: Lessons Learned. 2006. 2. Trust for America’s Health. Ready or not? protecting the public’s health from diseases,
disasters, and bioterrorism. 2005. 3. DHH Katrina Project Worksheets (FEMA-1603-DR, Louisiana). Katrina FIPS #: 000-
UHH04-00.(2006). 4. www.amtrauma.org/tiep/reports/TCPopulationPV.html. www.amtrauma.org . 2006. 5. Auf Der Heide E. Disaster response: the principles of preparation and coordination. CV
Mosby . St Louis. 1989. 6. Hogan,D. & Burstein,J. Disaster medicine. Lippencott Williams & Wilkins . Philadelphia.
2002. 7. Noji EK. The public health consequences of disasters. New York, Oxford. 1997. 8. U.S. House of Representatives. A Failure of Initiative. 2006. 9. Louisiana Department of Health and Hospitals. Vital statistics of all bodies at St. Gabriel
morgue. 2006. 10. McGlown JK. Terrorism and disaster management – preparing health care leaders for the new
reality. Chicago, Health Administration Press. 2004. 11. Federal Emergency Management Agency. National Incident Management System. 2006. 12. Louisiana Office of Homeland Security and Emergency Preparedness. Emergency operations
plan. 2005. 13. Louisiana Office of Homeland Security and Emergency Preparedness. Emergency operations
plan - Annex M: Public Health and Medical Services. 2005. 14. Health Resources and Services Administration. Model trauma system planning and
evaluation. 2006. 15. Health Resources and Services Administration. A 2002 National Assessment of State Trauma
System Development, Emergency Medical Services Resources, and Disaster Readiness of Mass Casualty Events. 2002.
16. Patient Care Statewide System Task Force. Regional trauma care - report to the governor. 2003.
17. The State of Louisiana. HB 272 – 2004 Regular Season (Act 248). 2004. 18. U.S. Census Bureau. quickfacts.census.gov. 19. Louisiana Office of Homeland Security and Emergency Preparedness. Emergency operations
plan - Annex X: Special Needs Shelter Plan. 2005. 2005. 20. DHH presentation to the HRSA Advisory Board. 2006. 21. DHH presentation. Sustainability of Emergency Preparedness. 2006. 22. Florida Department of Health,O.o.P.H.P. 5 Year Strategic Plan: Midpoint Review. 2005. 23. Quarantelli EL. Delivery of emergency medical care in disasters: assumptions and realities.
New York, Irvington Publishers. 1983. 24. Claypool,R., Hupert,N., Shannon,M., & Bogdan,G. Bioterrorism and health system
preparedness – addressing surge capacity in a mass casualty event. Agency for Health care Research and Quality . 2006.
25. Marcus LJ. Israel’s preparedness for responding to the health requirements of its civilian population in the event of deployment of a nuclear, biological or chemical weapon of mass destruction. 2002.
26. United States Government Accountability Office. Disaster preparedness: preliminary observations on the evacuation of hospitals and nursing homes due to hurricanes. 2006.

Report for the Louisiana Recovery Authority Support Foundation
Page 210
This Report is intended for the use and benefit of the
Louisiana Recovery Authority Support Foundation only and not intended for reliance by any other Party.
27. Briggs,S.M. & Brinsfield,K.H. Advanced disaster medical response. Harvard Medical International . Boston. 2003.
28. Guha Sapir,D. & Lechat,M. Reducing the impact of natural disasters: why aren’t we better prepared? Health Policy and Planning . 1986.
29. Joint Commission on Accreditation of Health care Organizations. Health care at the cross roads: Strategies for creating and sustaining community-wide emergency preparedness systems. 2003.
30. Smiley,D., Loboda,A., Starling,C., & Rubin,J. Transformation from planning to operations: emergency medical services in disaster response. 2004.
31. Mississippi Trauma Care System. Trauma Care System. 2006. 32. Moriarty,E. Trauma network proposed. Atlanta Business Chronicle
http://atlanta.bizjournals.com/atlanta/stories/2006/03/20/story6.html. 2006. 33. www.emsa.ca.gov/dms2/heics3.htm. 34. Barbera,J. & Macintyre,A.G. Medical and Health Incident Management System: A
comprehensive functional system description for mass casualty medical and health incident management. Institute for Crisis, Disaster and Risk Management. The George Washington University . 2002.
35. www.dhh.louisiana.gov/offices.asp. 36. Texas Institute for Health Policy Research. Bioterrorism preparedness planning for Texas
hospitals. Texas Department of Health. 2003. 37. New Zealand Government. National civil defence emergency management plan order 2005. 38. Anderson MB. Which costs more: prevention or recovery? World Bank . 1991. 39. Knabb,R., Rhome,J., & Brown,D. Tropical cyclone report: hurricane Katrina. National
Hurricane Center . 2006. 40. Johnson LW. Cut them into little stars. Journal of the Louisiana State Medical Society .
2006. 41. Mattox K. Katrina’s aftermath - lessons learned: an expert interview with Kenneth Mattox,
MD. Medscape. 2006. 42. Meade C. Planning the safety of health care structures. 2005. 43. Dick,A. & Mattke,S. The level of state involvement in the reconstruction of the municipal
health care system. Rand Health . 2005. 44. Levy,BS. & Sidel,V. Terrorism and public health – a balanced approach to strengthening
systems and protecting people. New York, Oxford. 2003. 45. Morgan O. Infectious disease risks from dead bodies following natural disasters. Rev Panam
Salud Publica. 2004. 46. Kreimer,A. & Munasinghe,M. Managing natural disasters and the environment. World
Bank. 1990. 47. Greater New York Hospital Association. Do you know your incident command system?
Ensuring effective emergency response and management. 2006. 48. Rosenfeld,J. et al. Crisis – Personal Perspective. Is the Australian hospital system adequately
prepared for terrorism? Medical Journal of Australia . 2005. 49. United Health Foundation. America’s health: state health rankings. 2004. 50. Public Health Foundation. PHF Calls on Congress to Invest in Improving Public Health
Performance. 2005. 51. Bazzoli,G.J., Meersman,P.J., & Chan,C. Factors that enhance continued trauma center
participation in trauma systems. 1996. 52. Cerise,F.P. How do health care systems recover, and even improve, after a catastrophe?
United Health Foundation . 2006.

Report for the Louisiana Recovery Authority Support Foundation
Page 211
This Report is intended for the use and benefit of the
Louisiana Recovery Authority Support Foundation only and not intended for reliance by any other Party.
53. Louisiana Department of Health and Hospitals. State Health Officer/Medical Director Operating Budget. 2000.
54. Prats R. The State of Louisiana department of health and hospital’s emergency preparedness policy and associated implementation costs. 2000.
Report for the Louisiana Recovery Authority Support Foundation
Page 212
This Report is intended for the use and benefit of the
Louisiana Recovery Authority Support Foundation only and not intended for reliance by any other Party.
SECTION VI: FINANCING
Introduction The objective of this section of the report is to address the financing requirements and model options for the recovery and sustenance of the healthcare system in Louisiana with the mission and recommendations delineated in the previous sections. This section responds to the following set of questions: What are the current contributions by the four primary reimbursement systems and to what degree
was there a shortfall pre-hurricanes in the funding of the healthcare delivery system (commercial, Medicare, Medicaid and Medicaid UCC/DSH)?
How can the reimbursement systems for institutions, providers and, possibly, individuals be adjusted
to emphasize and reward a continuity of care model? What capital investment in facilities and technology is required to achieve the objectives and
recommendations delineated in previous sections for a newly configured system? What are the overall options to finance the reconfigured system?
What is the economic “value proposition” of the reconfigured system and, therefore, what are the
options for ongoing financing for a sustainable system?
Key Findings and Recommendations
Previous sections of this report defined a vision for the state of Louisiana’s healthcare delivery system that fulfils a mission guided by the Institute of Medicine (IOM)’s quality of care principles. Achievement of the quality metrics delineated in Section II in support of these IOM principles is important to generating the value proposition described in this section of the report.
The following conclusions and recommendations resulted from analyses prepared for this section of the report:
C Key Finding: Louisiana’s healthcare system, in essence, consists of two systems - one for the insured and one for the under- and uninsured. The current financing of healthcare delivery to the uninsured promotes referral patterns that encourage this structure. The insured are mostly cared for by the private sector, and the uninsured are mostly cared for by the public hospital system. This two-system model appears to be detrimental to the health of all Louisianans and is likely an important reason for the lower system quality, both in the public and private sector.
Recommendation 3: The Department of Health and Hospitals should immediately begin a planning process, which may include application for special waivers from the federal government and the state government that would link all Medicaid and Medicaid DSH funding to the best objectively measured healthcare services available to all beneficiaries, irrespective of where that care is rendered. This includes fairly distributing funds to the state's nine healthcare regions, based on contracting for integrated care (which should include all appropriate physician, outpatient, hospital, and ancillary services) and

Report for the Louisiana Recovery Authority Support Foundation
Page 213
This Report is intended for the use and benefit of the
Louisiana Recovery Authority Support Foundation only and not intended for reliance by any other Party.
managing to quality targets as described by the Institute of Medicine. In other words, these Medicaid and Medicaid DSH dollars should be directed by the state for patient services, not facilities, and artificial control mechanisms such as "budget caps" on the public sector and DSH exclusions to the private sector should be eliminated. Under this proposed financing mechanism, the safety-net of care for the indigent is no longer dependent on public hospitals and facilities, but guaranteed by the availability of high quality integrated services as contracted out by the state. The future of institutions would depend on their ability to compete in regional markets. As a component of implementation planning, it is recommended that a detailed financial modeling be prepared. This would be the most significant move toward changing the current mechanisms to finance as well as reimburse for services provided to Medicaid eligibles and to the uninsured. Removing the current “budget cap” on the public system, in conjunction with payment mechanisms that emphasize and reward quality outcomes, is key to beginning the elimination of the current two-tier delivery system. Key Finding: The management of the public hospitals pre-hurricanes by Louisiana State University created an environment of divergent interests between academic medical centers and the other public hospitals. Recommendation 9: The state should separate the safety-net mission for the under- and uninsured from the educational mission of the LSU medical professional teaching system. As such, it should discontinue the management of the public hospitals by Louisiana State University, except in the case of existing or new major teaching hospitals. The future of these institutions would depend on their ability to compete in regional markets. It is important to focus on how changes can be made rather than only how the state currently distributes Medicaid DSH funds to serve the uninsured. The state clearly has other opportunities it can pursue with funding and payment mechanisms related to Medicaid recipients. The greater challenge may relate to Medicare, but the objectives outlined in previous sections are consistent with the Centers for Medicare & Medicaid Services (CMS) objectives for improved quality outcomes. The state can evaluate jointly with commercial payers (e.g., Blue Cross Blue Shield of Louisiana (BCBSLA)) the merits of Medicare managed care under the Medicare Advantage program. This could create a framework for creating similar incentives to improve quality while retaining much of the financial benefits from these improvements; important to the financial sustainability of the system. Finally, a framework would be created for all providers to revisit their commercial contracts. Collaboration with these commercial insurers, acknowledging that the state’s own BCBSLA is the insurer of the largest segment of privately insured residents of Louisiana, would create a consistency among public and private sector payers unparalleled in the United States. The creation and implementation of new payment mechanisms that will emphasize and reward the quality goals the state would like to achieve is key to not only attaining these goals, but funding the investment necessary to achieve these goals and developing a sustainable healthcare delivery system for the future. Key Finding: The two-system care model in Louisiana has impacted the adequacy of funding for LSU’s graduate medical education program (residency training or GME), and the quality of the experience for its trainees.
Recommendation 10: LSU's hospitals should disperse its resident physicians (both primary and specialty) to hospitals with a higher percentage of Medicare patients. LSU's hospitals should also assess all of its teaching options – without compromising the care of patients or its teaching mission – to implement a

Report for the Louisiana Recovery Authority Support Foundation
Page 214
This Report is intended for the use and benefit of the
Louisiana Recovery Authority Support Foundation only and not intended for reliance by any other Party.
strategy of improved exposure to all segments of the population and increased Medicare funding support of GME throughout the state. This could include special waivers from the Medicare program allowing innovative new ways of funding graduate medical education, and these options should be investigated. It is estimated that realignment of the GME program residents and interns would generate upwards of an additional $100 million (on a pro forma basis) in support of these programs from the federal government through Medicare. This would be accomplished by aligning the programs with providers that serve the Medicare constituents to a much greater degree. Typically this might be accomplished through the negotiation of affiliation agreements between LSU and the private for profit or not-for-profit providers that already have programs. However, given that it is recommended that all of LSU’s program would be dispersed and, potentially, to a new program, collaboration and approval by CMS will likely be required. In addition, if the distribution of Medicaid services provided was also realigned with the care of the elderly, it is estimated that an additional $60 million, on a pro forma basis, could also be paid by the federal government in the form of Medicare DSH payments. Several objectives related to realigning the teaching programs in the state of Louisiana exist, in addition to addressing the short term disruption caused by hospitals that have not been operational since the hurricanes, for certain GME programs in the state. Ultimately, by aligning the teaching program with the private sector institutions, a more favorable payer mix will support the cost associated with these programs. In addition, a rapidly growing segment of the population, those aged 65 and over will be better served over time.
Key Finding: The state of Louisiana has a unique opportunity to create significant change to the current healthcare delivery system. Its redesign, as described in this report, also presents significant challenges. However, the analysis indicates that the combination of reducing excess cost and accessing new revenue sources could enable a financially sustainable healthcare system that provides high quality care for all Louisianans, coverage for everyone and protection of the safety-net mission for those in need. Recommendation 15: An appropriate transition plan should be developed by the state to ensure that the recommendations of this report are implemented in a timely, transparent and equitable manner, with special attention to those with little means and special needs. Because this report calls for systematic rather than piecemeal change, strong leadership and resolve will be necessary to achieve the vision of healthcare quality for all Louisianans. It is estimated that on a pro forma basis, a gap in funding related to cost of the healthcare delivery system would exist of approximately $350 million. The nature of the data that exists does not allow a more exact manner to calculate this figure, but based on a number of factors delineated in this section, the estimated deficit was derived. A key factor was the assumption that if greater access to care existed for the uninsured through a structured insurance program, a greater level of expenditure would have occurred. An understanding of the nature of this deficit on a pro forma basis is important to the assessment of what the value proposition needs to be as a newly designed system if implemented. The value proposition should approximate this deficit plus the annual investment in the newly redesigned system in order for the new system to be financially sustainable. Sustainability is defined as "the economic state where the demands placed upon the environment by people and commerce can be met without reducing capacity to provide for future generations.”.1 Sustainability would be a system that could meet demand in the future. Operating margins are a key

Report for the Louisiana Recovery Authority Support Foundation
Page 215
This Report is intended for the use and benefit of the
Louisiana Recovery Authority Support Foundation only and not intended for reliance by any other Party.
indicator of an organization’s ability to cover its costs and its financial stability. Margins in excess of break-even are required to cover other costs and cash flow needs – principally facility and equipment replacement and technology advancement.2 In addition, resources are required to pay outstanding debt as well as maintain working capital. Therefore, a sustainable system would generate sufficient margins for all aspects of the delivery system, while delivering desired quality and health outcomes. As delineated in previous sections, incremental operating investments are estimated to approximate another $400 million on an annualized pro forma basis. Therefore, a financially sustainable system would need to generate in excess of $750 million on an annual basis to also account for the previously discussed $350 million gap in payments as compared to costs for delivering healthcare services. In addition, the annual operating investment above also includes the amortization of the capital costs associated with the additional infrastructure requirements delineated in previous sections of approximately $255 million.
Framework to Reward Improved Outcomes and Restructure Delivery System Financing A key aspect of the system’s ability to realize improvements will be changes to current payment mechanisms and the incorporation of incentive mechanisms. Previous sections have highlighted the opportunity for improvement in quality outcomes and the related expectations regarding a decline in the use of emergency room services and the decline of inpatient activity through the avoidance of unnecessary admissions. These reductions can result in significant savings. Additional savings will result from a more efficiently run delivery system, including the acknowledgement of less acute care infrastructure in the parish of Orleans. This section includes a discussion of an overview of an integrated healthcare system framework, incorporating system of care budget incentives with pay for performance quality improvement incentives to serve as a basis for achieving the desired outcomes, while maintaining the funding to support a financially sustainable delivery system. The key components of these recommendations are as follows:
Creation of regional healthcare management entities to manage regional healthcare budgets for the
provision of services to Medicaid recipients as well as a health insurance program to provide services to the uninsured;
The transition from annual budgets for the state’s public hospitals to an annual budget for the system of care for Medicaid patients and the uninsured;
Evaluate the expansion of Medicaid eligibility for low-income individuals and working parents, including optional waivers for flexibility, with continued efforts to enroll those that currently meet the Medicaid eligibility requirements, particularly children;
Evaluate increasing payments under the current Medicaid physician fee schedule to increase physician provider participation and consequently greater access to physician care for Medicaid recipients;
Partnering with commercial insurers to contract with provider organizations in a manner consistent with budgets for Medicaid recipients and the uninsured;
Evaluate opportunities for statewide CMS/Medicare programs geared at providing additional funding to achieve the quality improvements and outcomes desired for the entire population;

Report for the Louisiana Recovery Authority Support Foundation
Page 216
This Report is intended for the use and benefit of the
Louisiana Recovery Authority Support Foundation only and not intended for reliance by any other Party.
Partnering with commercial insurers to entertain implementation of a Medicare Advantage program to accomplish similar alignment for services provided to Medicare recipients;
A premium based or tax program on the uninsured based on ability to pay to generate additional state funds and, therefore, federal matching funds to augment funds available to support the expansion of the Medicaid program and a health insurance program for the uninsured; and
Partnering of the LSU GME program with the private sector hospitals as well as undertaking an effort to uncouple the non-academic public hospitals from the University.
Summary In summary, the value proposition is the establishment of a cohesive set of funding mechanisms (public and private sector financing) that supports the additional investment noted above and financial stability long term for the healthcare delivery system. This section describes a number of elements fostered by a redesign of funding and payment systems that generates upwards of $1.15 billion dollars, on a pro forma basis, to offset the estimated current system payment gap of $350 million and the proposed annual operating investments of $400 million in this report.
Pre-Hurricanes Financing of Healthcare
Louisiana supports nearly the highest combined Medicaid and uninsured population in the United States.3 Therefore, its ability to adequately finance the healthcare for these individuals and families has been challenging. Every state faces various challenges related to these populations. Ultimately healthcare providers are compensated with federal funds through the Medicaid program, and state-funded Medicaid program which is a prerequisite for federal "match" funding. The state funds are derived primarily from budgeting of tax revenue to care for Medicaid recipients. For those patients that are uninsured, providers receive only what those individuals can afford unless a state provides a mechanism to support payments for these services. The state of Louisiana directs Medicaid DSH funds to support primarily public institutions in this regard. Nationally, it is estimated that most Medicaid programs pay providers at or below cost, although the shortfall varies widely by type of provider. In general, within a range of a few percent, Medicare programs cover costs.4 Those providers that care for Medicaid and, especially, those that provide care to the uninsured, would not survive if they did not receive payments greater than their costs from the commercial insurers or the private sector. Healthcare providers generally receive higher payments from commercial insurers in order to subsidize the gap in payments compared to costs related to caring for the under- and uninsured, Medicaid and other indigent patients. It is estimated that the acute care hospital sector receives 115 to 120 percent of costs from commercial payers in order to support the gap in payments from the care they provide to Medicaid recipients and the uninsured.5 Louisiana does not appear to be any different, except that the population in question is that much more significant. As shown on the next exhibit, it is estimated that in 2004, the state of Louisiana spent approximately $19.8 billion on healthcare, across all payers (private and public). Once adjusted for the changes subsequent to FY2004 related to the availability of certain Medicaid DHS funds and the estimated impact of Medicare Part D and "clawback" provisions on dually eligibles, the pro forma total spend is estimated to be $19.4 billion. Of the $19.8 billion, the state of Louisiana spent only $1.5 billion, or 7.6 percent, of
Report for the Louisiana Recovery Authority Support Foundation
Page 217
This Report is intended for the use and benefit of the
Louisiana Recovery Authority Support Foundation only and not intended for reliance by any other Party.
the total healthcare spend (all related to Medicaid and the uninsured). These funds in combination with the federal matching supported nearly 27 percent of the "spend" (a total of $5.3 billion for Medicaid recipients and the uninsured). The federal government, including the Medicare program and matching Medicaid funds, in total funded 43.4 percent of the total, spending approximately $8.6 billion. Therefore, nearly 51.0 percent is funded by the public sector. By comparison, the national average approximates 46.5 percent.6 The remaining $9.7 billion was funded by the private sector including private insurance plans and patient out of pocket contributions. The following table summarizes the total healthcare spend. Section VI Exhibit 1 Estimated 2004 Pre-Hurricanes Healthcare Detailed Spend for the State of Louisiana (1)
Per Individual(10) Per Year (PMPY) Total ($ in Billions)Payer Class State Federal Private Self Paid Total State Federal Private Self Paid TotalMedicaid: (2)
LaCHIP (3) 211$ 853$ -$ -$ 1,065$ 0.0$ 0.1$ -$ -$ 0.1$ Medicaid (3) 1,100$ 2,777$ -$ -$ 3,876$ 0.9$ 2.3$ -$ -$ 3.2$ Dually Eligible (3)
2,555$ 6,450$ -$ -$ 9,004$ 0.3$ 0.6$ -$ -$ 0.9$ Subtotal 1,137$ 2,905$ -$ -$ 4,042$ 1.2$ 3.0$ -$ -$ 4.2$
Uninsured (3)367$ 927$ -$ 186$ 1,480$ 0.3$ 0.8$ -$ 0.2$ 1.3$
Total Medicaid 1.5$ 3.8$ -$ 0.2$ 5.5$
Medicare: (2)
Medicare (4), (5) -$ 6,929$ 1,166$ 3,212$ 11,308$ -$ 3.8$ 0.6$ 1.8$ 6.2$ Dually Eligible (4)
-$ 10,322$ -$ -$ 10,322$ -$ 1.0$ -$ -$ 1.0$ Total Medicare -$ 7,434$ -$ 2,734$ 11,161$ -$ 4.8$ 0.6$ 1.8$ 7.2$
Commercial/Private (6), (7)-$ -$ 2,729$ 687$ 3,417$ -$ -$ 5.7$ 1.4$ 7.1$
Total 1.5$ 8.6$ 6.3$ 3.4$ 19.8$
Adjusted Total (8), (9) 1.4$ 8.8$ 6.3$ 2.9$ 19.4$
Notes/Sources: (1) Healthcare spend includes medical, prescription drug and administrative services. Dental, vision as well as research and development costs have not been included. (2) Medicaid and Medicare payments during 2004 included $855M of DSH payments. (3) Medicaid and Uncompensated Care spend per the Louisiana Medicaid report SFY 2003-2004. Self spend estimate based upon Health Affairs article on uninsured. (4) Medicare costs based on 2002 CMS reports (Table 15) trended to 2004 at 5% per year adjusted for the managed care Medicare enrollees not included in the denominator used to calculate average payments. (5) Self costs based upon 2004 Annual Statements (for Medicare Supplemental plans) provided by the Louisiana Department of Insurance as well as 2004 actual prescription drug spend for Louisiana retirees found in PwC's proprietary database. (6) Private insurance costs based upon 2004 Annual Statements (for Private Plans) provided by the Louisiana Department of Insurance. (7) Self costs based upon PwC's proprietary actuarial pricing models. (8) 175% payments are no longer supported or made by CMS to DHH for UCC. In September 2005 LA legislature passed Healthcare Affordability Act (ACT 182) which call for a tax of certain hospitals to provide for a stable source of funds for UCC. LA intends to collect $90M annually from the hospital providers, receive matching funds from the federal government and use the resulting monies to pay for UCC on a claims basis. At this time we have not estimated the federal match or the impact on payment to hospital providers. (9) Assumes the Estimated Impact of Medicare Part D and Clawback provisions on Dually Eligibles. (10) Individuals are defined as enrolled in Medicaid, Medicare, and Private programs or Uninsured Individuals utilizing healthcare services. A pro forma estimate is that a gap in the financing of healthcare in Louisiana of approximately $350 million may have existed pre-hurricanes. This figure is important in understanding how the investments in the reconfigured healthcare delivery system will be financed while creating a financially sustainable

Report for the Louisiana Recovery Authority Support Foundation
Page 218
This Report is intended for the use and benefit of the
Louisiana Recovery Authority Support Foundation only and not intended for reliance by any other Party.
healthcare delivery system. This $350 million gap in payments compared to costs is summarized below by payer.
Medicaid The Medicaid program covered over a million residents with nearly 100,000 of those also Medicare eligible (referred to as dually eligible).7 While the program has become more inclusive, covering pregnant women and children up to 200 percent of the FPL, only the disabled and poor are otherwise covered. Louisiana’s Medicaid eligibility standards are more restrictive than most states.8 Still, the program covers nearly 22 percent of the state’s population. The Medicaid program is jointly funded by the state and federal government. States generally receive at least 50 to 60 percent matching funds from the federal government, while Louisiana receives substantially more to support the provision of a defined set of services to a defined population. That amount has historically been 70 percent or slightly higher, ranking Louisiana the seventh highest in the nation for federal matching rate percentage.9, 10 This does not mean that additional monies are available to Medicaid providers, only that the state’s burden in providing these services is significantly reduced. Various assessments have been completed over the years as it relates to the level of Medicaid payments to costs. Although no definitive assessment has been completed for the system, a recent study for the Department of Health & Hospitals (DHH) indicated that Medicaid payments are below costs for acute care hospitals. This is consistent with a previous study conducted by the Louisiana Hospital Association.11 Payments to physicians for Medicaid recipients may also be below cost (currently paid at approximately 70 percent of Medicare levels).12 For purposes of this analysis, it was assumed that the overall ratio of Medicaid payments to costs approximated greater than 90 percent pre-hurricanes (including Medicaid’s share of the Medicare/Medicaid dually eligible). This assumption means that a shortfall in the payments for Medicaid recipients may have approximated $325 million on a pro forma basis. In addition, Medicaid services (admissions, days in the hospital, emergency room visits) are higher than best practice guidelines by nearly 30 percent.13 Similar to Medicare (discussed below), these savings would accrue to the state and federal government under current/traditional budgeting and payment mechanisms. The objective would be to increase payments to providers as the savings are realized so that they would be available for reinvestment in the system and continue to be matched by the government at the 70 percent level.
Medicare For purposes of this study, hospital Medicare Cost Report information for fiscal year 2004 was accessed through a national database14 and assessed. In cases when 2004 data was not available, 2003 data was used. Based on cost report allocation methodologies, it appears that there exists an acute care hospital payment shortfall in relation to cost of providing care for the Medicare program recipients in the state of Louisiana. This is estimated to approximate $225 million on a pro forma basis. This figure was arrived at by compiling FY 2004 Medicare Cost Report information for short term acute hospitals in the state. Medicare cost reports use a ratio of Medicare days to total days to calculate routine costs and a charge to cost ratio for other allowable operating costs. The shortfall was determined by comparing these costs to payments from Medicare.

Report for the Louisiana Recovery Authority Support Foundation
Page 219
This Report is intended for the use and benefit of the
Louisiana Recovery Authority Support Foundation only and not intended for reliance by any other Party.
It is important to also understand that admission rates and, therefore, the amount of time Medicare recipients spend in a short term acute care hospital setting is high compared to national averages. The overall Medicare 2,500 days per 1,000 enrollees exceeds "best practice" guidelines of 2,100 days per 1,000 by nearly 20 percent. Medicare days per 1,000 were calculated using the Louisiana Health Information Network (LHIN) database in conjunction with the cost report Medicare days. Population estimates for 2004 were obtained from the Kaiser Family Foundation, DHH, Solucient, Inc. and U.S. Census. This data was presented earlier in Section II, Exhibit 12. The majority of this use rate differential is due to higher than expected admissions per 1,000.15 A major focus for the redesigned system is an improvement in quality that would lead to the avoidance of unnecessary admissions reducing the overall cost structure. The reduction in admissions will improve the overall efficacy of the system, but will not necessarily result in a net benefit to the system, since reducing admissions means less federal Medicare payments for these services as well as other payments for GME, IME or DSH. Therefore, much of these savings may not be available for reinvestment in the system. Later, opportunities to evaluate with CMS regarding pay for performance mechanisms to reward quality improvement as well as the opportunity to development Medicare Advantage plans are discussed. Both would serve to maintain a certain amount of the proposed savings in the system.
Uninsured The state of Louisiana historically has had one of the highest levels of uninsured at nearly 19 percent of the population.16 This figure breaks down to over 23 percent of adults and nearly eight percent of children in the state as uninsured. In combination with those that are eligible for Medicaid, over 40 percent comprise this mostly indigent population – one of the highest in the nation. The composition of this population primarily includes individuals and families that are working (the "working poor") but find health insurance through either their employer (if offered) or directly through a commercial insurer as unaffordable (estimated at 80 percent of the uninsured population nationally17). In addition, the uninsured includes those that could qualify for Medicaid but have not been enrolled in the system; for example, many Medicaid eligible children remain uninsured, out of nearly 100,000 children estimated to be uninsured, approximately 70,000 are eligible for Medicaid.18 The healthcare needs of the uninsured tend to be much lower than Medicaid. The primary reason is that Medicaid covers pregnant women and the disabled requiring intensive long term acute and sub-acute service. These individuals are primarily “working poor” adults without children; more than 50 percent are at the prime employment ages of between the 22 and 54.19 Therefore, the overall healthcare needs of this population appear to be significantly less on average than the Medicaid population and often lower than a traditional commercial population, given their age. In addition, based on an analysis of claims and related charges for the uninsured in an acute care setting, the Louisiana Hospital Association summarized that inpatient and outpatient services in the public and private acute care hospitals approximated nearly $600 million.20 Typically, the acute care hospital component of a global healthcare budget may range from 30 to 40 percent. For this population, because of their lack of insurance, it is generally expected to be higher given the high reliance on emergency departments and unnecessary admissions due to not accessing care in a timely or preventative manner.
Report for the Louisiana Recovery Authority Support Foundation
Page 220
This Report is intended for the use and benefit of the
Louisiana Recovery Authority Support Foundation only and not intended for reliance by any other Party.
Therefore, that would imply a total healthcare cost for the uninsured under the historical system of approximately $1.5 billion on a pro forma basis. Historical experience for a more comparably population was derived from Medicaid as well as comparative data from other regional and national sources. Therefore, for the purposes of this analysis it was assumed that pro forma costs would have approximated nearly $2.1 billion in a system that provides better access to care for the uninsured. This cost, on an individual basis, is consistent with similar populations within the existing Medicaid population as well as similar populations within a commercially insured population. Approximately $700 million, net of $400 million that no longer is accessible by the state, has been assumed to be available for allocation from the Medicaid DSH funds to support costs for the uninsured. In addition, another $200 million in self pay payments is assumed based on experiences/studies nationally.21 Therefore, there has been or is an anticipated pro forma shortfall of approximately $1.2 billion if the uninsured as a percent of total population were to remain at historical levels.
Commercial Providers typically are paid negotiated rates by commercial insurers on a contract by contract basis. Given the growing trends nationally in the uninsured population and declining proportionate public funds, the financial burden is increasingly falling on the private sector.22 Hospitals and other providers that serve the indigent population must receive payments in excess of costs from commercial/private payers in order to maintain long term financial stability. A provider’s payer mix is a key driver in its ability to accomplish this balance. For example, a hospital that provides a significant portion of its services to the indigent population would be significantly disadvantaged in achieving financial stability. The private sector hospitals in Louisiana have been advantaged by the current system in that a low percent of the services they provide is to the uninsured or Medicaid.23 At 3-4 percent, the percent of care they provide to the uninsured is nearly half the average for hospitals nationally.24 Nationally, studies have indicated that providers, and more specifically, hospital providers, generate payments from private sector insurers at 115-125 percent of their costs.25 The figures in the next table are consistent with that range, indicating that the private sector has subsidized shortfalls in the public sector financing and caring for the uninsured in excess of approximately $1 billion. Based on industry trends in medical loss ratios for health insurance companies, it appears ratios are likely even lower than portrayed in the chart in the summary section. Typical medical loss ratios would range from 75 to 90 percent of premium.26 The medical loss ratio represents payments to providers for services to members as a percent of the health premium dollars collected. Based on various surveys, payments to providers for services exceed costs by 15 percent or more. Therefore, premiums in relation to cost are likely higher than the 125 percent assumed for purposes of this analysis. The key point is to understand the magnitude to which the private sector (through commercial, primarily employer-based, insurance) subsidizes the gap in payments from the public sector for Medicare, Medicaid and the uninsured. Based on this analysis, over $1 billion of payments from the private sector serve to subsidize payment shortfalls for the public sector and caring for the uninsured in the state of Louisiana.

Report for the Louisiana Recovery Authority Support Foundation
Page 221
This Report is intended for the use and benefit of the
Louisiana Recovery Authority Support Foundation only and not intended for reliance by any other Party.
In Summary The chart below summarizes the current spend in terms of who is paying what (“spend”) and what the estimated total costs are.
Section VI Exhibit 2 Summary of Historical Spend and Estimates of Gap in Payments to Costs
Payer Class Spend (000s) (1) Population (2) Spend PMPM Cost PMPM (3)Total Cost
(000s)(Shortfall)/ Gain (000s)
Medicaid 3,300,000$ 942,000 291.93$ 321.13$ 3,625,000$ (325,000)$ Medicare 6,200,000 549,000 941.11 974.04 6,425,000 (225,000) Dually 1,850,000 96,000 1,605.90 1,605.90 1,850,000 - Uninsured 900,000 836,000 89.71 206.75 2,075,000 (1,175,000) Commercial/Private 7,100,000 2,074,000 285.28 230.00 5,725,000 1,375,000
19,350,000$ 4,497,000 358.57$ 365.06$ 19,700,000$ (350,000)$
Notes(1) Spend is based on adjusted costs and sources, as noted in previous exhibit.(2) Population: U.S. - Kaiser Family Foundation; LA - Kaiser, LA Dept of Health and Hospitals, Solucient, US Census.(3) Cost PMPM estimated based on assumed cost to payment ratios.
Opportunity to Emphasize and Reward Improved Quality Outcomes
A key aspect of the system’s ability to realize improvements will be changes to current payment mechanisms and the incorporation of incentive mechanisms. Previous sections have highlighted the opportunity for improvement in quality outcomes and the related expectations regarding a decline in the use of emergency room services and the decline in inpatient activity through the avoidance of unnecessary admissions. These reductions can result in significant savings. Additional savings will result from a more efficiently run delivery system, including the acknowledgement of less acute care infrastructure in the parish of Orleans. The key focus then becomes – who will benefit from these improvements? The development of mechanisms to emphasize and reward improved quality outcomes should serve two purposes. First, these incentives should be implemented in a manner to align the interests of all constituents – the individuals/families (improved healthcare access and health status), the professionals and institutions providing services to those individuals (fair payment for services rendered and improvements in quality) and the payers in conjunction with the employers providing the insurance to cover those individuals (reduction in the growth of healthcare costs). Without these incentives and their alignment among the various constituents, achievement of the desired quality outcomes is not likely. Second, and clearly intertwined with the first, payments under these new payment mechanisms will serve to retain a sufficient amount of the savings in the delivery system to support a financially sustainable healthcare delivery system without increasing the overall healthcare spend in the state of Louisiana.

Report for the Louisiana Recovery Authority Support Foundation
Page 222
This Report is intended for the use and benefit of the
Louisiana Recovery Authority Support Foundation only and not intended for reliance by any other Party.
From a payer/insurer perspective, a global system of care budget either is or can be created on an individual basis for the annual provision of healthcare services. This budget, often discussed in terms of per member per month (pmpm) or per member per year (pmpy), can be developed at an aggregate population level or for various segments within that population (e.g., individuals of age less than three years old, individuals age 19 to 34, etc.). These budgets are based on detailed historical trends, whether by a commercial payer like Blue Cross Blue Shield of Louisiana for a large employer based on that employer’s employee population and history, or by DHH for the Medicaid population, or by CMS for the Medicare population. Under current payment mechanisms, the reduction in ED visits and patient days would result in lower billing to these parties (likely much greater than the operational cost savings). Therefore, if no changes are made to the current system, the payers, including the state and federal government, will reap significant cost savings that may never find their way back into the delivery system in the form of payments. The foundation for change would incorporate the concept of global system of care budgets for all services provided to a population group, incorporating payments out of that budget specifically targeted at the achievement of certain quality improvement metrics and outcome measurements. One of several challenges will be the creation of as much consistency as possible across the various populations. This consistency can be fostered through DHH in collaboration with the proposed regional entities. Medicare
The Center for Medicare and Medicaid Services (CMS) is clearly looking to further link payment to performance to improve quality and health outcomes. Medicare currently pays providers a small percentage of their payments to submit quality data to CMS. Currently, CMS intends to develop a plan to ‘implement a value based purchasing program for payments under the Medicare program’ for hospitals beginning with fiscal year 2009. Current Medicare payment mechanisms and quality initiatives will not likely generate sufficient funds to offset the reduction in Medicare payments that would occur as patient stays, ED visits and other volume declines. Therefore, the state would need to negotiate a special arrangement consistent with its and CMS’ quality improvement objectives. In addition, the prevalence of Medicare managed care is low in the state. Consideration could be given to promoting a greater prevalence in collaboration with a qualifying health plan and incorporation of incentive mechanisms consistent with improving access and quality while reducing admissions to acute care facilities. Medicaid and Uncompensated Care Currently the state and federal government fund in excess of $5 billion of services to eligible Medicaid enrollees and the uninsured. For the most part, providers servicing Medicaid recipients are paid on a fee-for-service basis based on fee schedules established by DHH and the Medicaid program. The state relies heavily on federal matching funds to also serve the indigent population that do not qualify for Medicaid – more specifically, Medicaid DSH funds. The greater majority of these funds support LSU-HCSD and LSUMC-Shreveport (over 80 percent).27 It is by design that the state currently directs the greater majority of these funds to the two academic centers, another 10 percent for the other public hospitals, while private, mostly rural hospitals receive about 5 percent of these funds. Consistent with the remainder of the country, this indigent population is primarily adults with a heavy concentration of those being under 35 years of age. In addition, a significant majority of these adults have some to full time employment, but

Report for the Louisiana Recovery Authority Support Foundation
Page 223
This Report is intended for the use and benefit of the
Louisiana Recovery Authority Support Foundation only and not intended for reliance by any other Party.
incomes are low and insurance is not readily accessible through their employers and not necessarily affordable for them. Since they do not have insurance, they tend to predominantly access care through hospitals (the ED, outpatient clinics and inpatient services). It is with respect to the Medicaid and uninsured that the state may have the greatest ability to not only impact quality but implement significant changes to the way these services are funded. In previous sections, it is recommended that the state create regional healthcare management entities. These entities could form the focus for creating regional budgets and mechanisms for (1) sharing in the risk of managing the access, quality and delivery of healthcare services to the constituents and (2) monitoring pay for performance metrics to be linked to the overall objectives for improving access and quality while reducing cost through the elimination of unnecessary services. Global system of care budgets could be developed to include amounts related to pay for performance incentive payments. In other words, a medical cost budget as well as a quality performance budget would be established. The objective would be to link payments to achievement of metrics that would not only mean an improvement in health status and outcomes but clearly relate to the avoidance of unnecessary services such as non-emergent emergency room visits or hospital admissions. These budget arrangements alone could produce behaviors focused on the long term benefit of certain care management and other programs. However, since the population covered under these budget arrangements often changes, many providers remain focused on the short term. Therefore, pay for performance mechanisms linked to metrics that will signify long term improvement in outcomes and health status will be key to the overall success of the system. Commercial/Private Insurers Much of what has been proposed should apply to this population (still nearly 45 percent of the population). However, the mechanics are more difficult since individual hospitals will be in the position of negotiating these arrangements on their own behalf. Therefore, the arrangements that may transpire will not likely be consistent. These regional entities, in conjunction with DHH, could either act to facilitate a consistency across the state or even negotiate on behalf of a region’s providers on behalf of them (not unlike a large integrated delivery system negotiating with an insurer).
Capital Investment Requirements and Financing Options
After assessing the existing infrastructure of the healthcare system, a redesign is required to align the structure to meet the IOM principles. One time and initial capital investments are proposed for the redesigned system to become functional. These include two categories of investments, as discussed earlier in Section II: the investment in a Louisiana Health Information Organization and investments in new facilities. The funding for the Louisiana Health Information Organization and essential information technology infrastructure, discussed in the "Public and Private Technology Infrastructure" section of the document, is estimated to cost $35 million in today’s dollars, which includes the essential patient and provider authentication and the privacy and security infrastructure for a browser-based tool that allows access to available lab values, medication histories, clinical encounters and claims data. The investment in technology is expected to be funded in part by the state through grants and possibly through key stakeholders, such as the payers and provider organizations.

Report for the Louisiana Recovery Authority Support Foundation
Page 224
This Report is intended for the use and benefit of the
Louisiana Recovery Authority Support Foundation only and not intended for reliance by any other Party.
The funding for new facilities as discussed in "Optimizing the Healthcare System" is estimated to cost approximately $220 million on a pro forma basis and includes the creation of 10 new ambulatory care centers, the establishment of a Trauma Center in Region 2 and the creation of a 200-bed specialty/research/trauma/mental health facility in Region 1. C The costs related to the investments in new facilities are detailed in the chart below. It is expected that federal funding could be provided for the ambulatory care centers while the rest of the proposed infrastructure could be funded through the private sector. It is also expected that nearly $100 million will be spent in the private sector to rebuild/refurbish long-term care bed capacity.
Section VI Exhibit 3 Summary of Estimated Capital Investments
What Where NotesInitial Capital (millions)
200-bed Specialty/Research/Trauma/Mental Health Center Region 1 [a] $ 200 Ambulatory Care Centers Statewide (10) [b] $ 10 Trauma Center in Region 2 Region 2 [c] $ 10 Total $ 220
[a] Assumes $1 million per bed project cost. Assumes no land acquisition costs. [b] Assumes 5,000 square foot facility per center at $200 project cost. No land acquisition. [c] Assumes 20,000 square feet of new facilities at $500 project cost. No land acquisition.
It should be noted that the capital investment needs are far greater than those delineated above. The capital requirements above are focused on an ability to address certain specific needs as opposed to an assessment of the current conditions of all facilities (any pent up capital improvement needs pre-hurricanes or just the normal annual capital improvement process that occurs).
The Economic Value Proposition and Delivery System Financing Options The realization of the economic value proposition will ultimately rest on how successful the state is in changing the financing of healthcare delivery. For purposes of this study the economic value proposition is as follows: a main objective of the evaluation of the delivery and financing of the healthcare system is to achieve significant improvement in health status for the residents of the state of Louisiana in a fiscally responsible and affordable manner. As such, there are opportunities for reductions in the cost and the generation of additional funds to provide healthcare services. Given the proximity of July 1 and the creation of and adoption of this coming year’s state budget, FY2007 most likely is a transition year of evaluation and implementation effective FY2008. This section describes proposed changes to the financing of the healthcare delivery system for consideration and the resultant value proposition from these changes. It should be anticipated that the process will need to evolve to ensure that the system is able to properly care for its constituents during this transition.

Report for the Louisiana Recovery Authority Support Foundation
Page 225
This Report is intended for the use and benefit of the
Louisiana Recovery Authority Support Foundation only and not intended for reliance by any other Party.
The analysis presented below concludes that there is enough funding in the healthcare system to realize the changes described in this report. The foundation for these discussions would include evaluation of the following: Creation of regional healthcare management entities to manage regional healthcare budgets for the
provision of services to Medicaid recipients as well as a health insurance program to provide services to the uninsured;
The transition from annual budgets for the state’s public hospitals to an annual budget for the system of care for Medicaid patients and the uninsured;
Evaluate the expansion of Medicaid eligibility for low-income individuals and working parents, including optional waivers for flexibility, with continued efforts to enroll those that currently meet the Medicaid eligibility requirements, particularly children;
Evaluate increasing payments under the current Medicaid physician fee schedule to increase physician provider participation and consequently greater access to physician care for Medicaid recipients;
Partnering with commercial insurers to contract with provider organizations in a manner consistent with budgets for Medicaid recipients and the uninsured;
Evaluate opportunities for statewide CMS/Medicare programs geared at providing additional funding to achieve the quality improvements and outcomes desired for the entire population;
Partnering with commercial insurers to entertain implementation of a Medicare Advantage program to accomplish similar alignment for services provided to Medicare recipients;
A premium based program on the uninsured based on ability to pay to generate additional state funds and, therefore, federal matching funds to augment funds available to support the expansion of the Medicaid program and a health insurance program for the uninsured; and
Partnering of the LSU GME program with the private sector hospitals as well as undertaking an effort to uncouple the non-academic public hospitals from the University.
The state could establish enrollment goals for the first two years of the program, FY 2008 and 2009, with concurrent objectives for the commercial and Medicare population. The objective would be to create budgets and a sharing mechanism of the healthcare delivery cost savings that would accrue to the provider sector, concurrent with payments rewarding the achievement of quality objectives as outlined in this report. Therefore, the value proposition described below would accrue not just to the state and commercial/private insurers, but also to the healthcare delivery system to support long term sustainability as well as provide individuals with a more financially sustainable healthcare insurance program. Regional Healthcare Management Entities
The objective would be for the state to create a fair mechanism to allocate regional budgets based on Medicaid and uninsured enrollment in that geographic region (regardless of where those individuals receive their care). The regional entities would also contract within the state for the provision of trauma and specialized care. The next consideration could be the requirement that each individual enrolled select a primary care physician responsible for that individual’s care. The latter would create more focus and ability to measure quality outcomes on a delivery system by delivery system basis (assuming that all primary care physicians would be affiliated with a delivery system). If that would be the direction, then the regional budgets would not be driven by where the enrollee resides but by the location of the delivery system the enrollee chose. Regardless, the regional entity would responsible for implementing the contracts and monitoring the outcomes within the framework established by the state. The state could
Report for the Louisiana Recovery Authority Support Foundation
Page 226
This Report is intended for the use and benefit of the
Louisiana Recovery Authority Support Foundation only and not intended for reliance by any other Party.
establish regional budgets based on the composition of enrollees and provide a framework for quality based performance incentive payments within those budgets. Financing of State Public Hospitals
Currently, the state’s public hospitals operate on fixed budgets. They may be paid on a fee-for-service basis for cash flow purposes, but, ultimately, the organization must receive a supplemental budget approval if it appears the budget will be exceeded. Many feel this inhibits their ability to compete with the private sector hospitals and to provide the necessary services to its constituents, even with the ultimate protection the state budget and appropriation process provide. The public hospitals should operate under the same regional budget system described above. Expand Medicaid Eligibility
The state’s eligibility requirements for women who are not pregnant and low income adults are more restrictive than many states across the nation. Historically, even with the high federal matching funds, this has been due to state budget constraints. It is recommended that further consideration be given to expanding the eligibility, including optional waivers to maintain flexibility in benefit design, etc. for a large segment of the "working poor" within the current uninsured population. If through other means, the state is able to generate additional funds (see below), every additional dollar spent on this population would generate an additional two and a half dollars from the federal government, based on current federal matching levels. Increase Medicaid Physician Fee Schedules
Of nearly 17,000 licensed physicians, 14,000 or 82 percent are currently enrolled as Medicaid providers. However, only 8,000 or less than 50 percent of licensed physicians actively provide services to Medicaid recipients.28 Therefore, access to physician care is impaired and, likely, is a factor in the overall health status of the population. Commercial Insurers Historically, it appears that only a small portion of the commercial/private insurer population is enrolled in a HMO program where a member selects a primary care physician (PCP). Most of the membership is either in an indemnity program or a preferred provider organization (PPO ) program. Therefore, it could be difficult to implement global system of care and pay for performance arrangements similar to those outlined above. Medicare and Medicare Advantage The state would want to evaluate with CMS unique or otherwise opportunities to receive payments for the achievement of quality improvement objectives and outcomes. In addition, the state, in collaboration with the regional entities described above, should consider a partnering strategy with commercial insurers to engage in the development of Medicare Advantage products to further the above concepts within the care that is provided to the Medicare population.

Report for the Louisiana Recovery Authority Support Foundation
Page 227
This Report is intended for the use and benefit of the
Louisiana Recovery Authority Support Foundation only and not intended for reliance by any other Party.
Individual Premium The objective would be to create a source of funds that could be matched with federal funds to further support the financing of healthcare for Medicaid recipients and the uninsured. Significant premium potential in the uninsured population does exist. Based on recent studies sponsored by LA DHH, approximately 40 percent of the uninsured have household incomes in excess of 200 percent of FPL and another 25 percent have household incomes between 100 and 200 percent of FPL. In terms of income, over 30 percent of the uninsured have household incomes in excess of $35,000 and over 10 percent of the uninsured have household incomes in excess of $55,000.29 The uninsured population may not be able to afford to pay their complete healthcare premium; however, they should be able to contribute towards those costs. Premium payments, co-pays and deductibles could be based on the ability of the household to pay: a sliding scale with the expectation that at some income level they cover the full costs. The state should consider a recommendation that all individuals be required to enroll in an expanded and re-designed Medicaid or Medicaid-like system that maximizes the coordination of how services are provided to those currently uninsured and their families. A sliding scale system of "premium" could be created in conjunction with a health insurance product that also integrates coinsurance and deductibles to create incentives on the part of the individual as well as protect the nearly $200 to $250 million of funds currently estimated to be paid out-of-pocket by those uninsured. The state would likely need to consider how employers also share on some reasonably financial basis in a program of funding insurance for those currently not insured. LSU GME Program
Currently the alignment of the interns and residents at LSU-HCSD and LSU-HSC Shreveport with its hospitals means that Medicare does not support these programs to the degree they do elsewhere in the state or the country. In addition, the heavy alignment of Medicaid with the uninsured means that the care for Medicaid eligibles is not aligned with the Medicare program to the degree it is elsewhere in the country. Therefore, the state’s hospitals are also not receiving the level of Medicare DSH payments they might otherwise receive. Additional federal funding could be obtained through balancing the payer mix and resident allocation for hospitals eligible to receive Indirect Medical Education (IME), Direct Graduate Medical Education (GME) and Medicare Disproportionate Share Payments (DSH). These dollars are distributed based on fairly complex formulas; however, the Medicaid/Medicare patient day mix of a hospital impacts the payment. Historically, Louisiana hospitals have received less of this funding in proportion to the amount of costs they incur by training medical residents and treating Medicaid patients. Due to the nature of the formula which calculates the reimbursement, some hospitals received less funding because they treated less Medicare patients than their counterparts, while incurring the full teaching program costs.
An additional consideration could relate to the previously legislated acute care provider sector tax which was postponed after the hurricanes. Providers that serve the uninsured will continue to realize a shortfall in funding available to cover these costs. Some of this shortfall is appropriate and part of the charitable mission of those that are not-for-profit. However, it should be noted that every provider organization must be able to compete and generate enough income from operations and non-operating revenue to remain financially stable.

Report for the Louisiana Recovery Authority Support Foundation
Page 228
This Report is intended for the use and benefit of the
Louisiana Recovery Authority Support Foundation only and not intended for reliance by any other Party.
It is understood that providers absorb the cost or payment gap associated with providing services to Medicaid recipients and the uninsured through its commercial/private sector insurer contracts. Certain hospitals that may continue to provide a significant amount of services to the public sector may not have enough private sector business to remain financially viable. Therefore, a provider sector ‘tax or equalization assessment’ may make sense if the state wanted to create a funding mechanism that allowed acute care hospitals with a more favorable payer mix to support those hospitals with a less favorable payer mix. In addition, the cash flow associated with funding of this nature would provide additional funds for the regional budget and the incentives for providers to improve quality and the care provided to the uninsured.
Summary of Annual Investment and Estimated Value Proposition As delineated in previous sections and summarized below, the new annual operating investments are estimated to approximate another $400 million on an annualized pro forma basis. Therefore, a financially sustainable system would need to generate in excess of $750 million on an annual basis. This represents less than 4 percent of the pre-hurricanes total healthcare spend. Following is a description of how the pro forma estimates of the savings and additional funds of approximately $1.15 billion to support a sustainable system were derived.
Emergency Department. As mentioned earlier in the section of the document titled "Optimizing the Healthcare System for the Future," Louisiana residents use ED and hospital outpatient (OP) services at a higher rate than the national average; 43 percent higher for ED and 18 percent higher for OP, according to the Kaiser Family Foundation. Additionally, based on Solucient Outpatient Estimates, Louisiana ED visits were estimated to be only 22 percent emergent, meaning that approximately 78 percent of care could have been provided outside of the ED. By reducing the Louisiana State average of 538 ED visits per 1,000 population down to the U.S. average of 383 visits per 1,000 (155 less visits per 1,000), the pro forma estimates of the savings in the system would be approximately $200 million, based on the estimated cost differential of an urgent care outpatient visit ($225) versus an ED visit ($500):
155 visits per 1,000 * 4.5 million Louisiana residents = 700,000 less visits 700,000 less visits * $275 visit cost reduction approximates to $200 million in savings
Inpatient Care. Based on a targeted reduction in patient days due to effective care management, there would be a reduction in operating costs associated with inpatient care. Calculated bed need based on estimated future population, target reduction in patient day utilization and higher bed operating efficiency yields an approximate 860,000 reduction in patient days in the system. (See "Optimizing the Healthcare System for the Future" for bed need calculation methodology.) Based on FY2004 operating costs from the Hospital Medicare Cost Reports, hospital expenses were adjusted as follows:
Exclude 50 percent of the closed hospitals' inpatient expenses (approximately 40 percent of the total hospitals' costs).
Exclude 70 percent of the closed hospitals' outpatient variable expenses. Reduce 30 percent of inpatient costs considered variable for each patient day reduction due to
efficiency and utilization changes.

Report for the Louisiana Recovery Authority Support Foundation
Page 229
This Report is intended for the use and benefit of the
Louisiana Recovery Authority Support Foundation only and not intended for reliance by any other Party.
Based on these adjustments, the estimated savings for reduced over-utilization of inpatient care is approximately $560 cost per patient day, resulting in an estimated $480 million in savings:
$560 * 860,000 less patient days approximates to $480 million
Federal funding of GME/IME/DSH. By estimating a shift in payer mix between the hospitals to create an "equal" distribution of Medicare patient days and by reallocating LSU-HSC and LSU-HCD medical residents to other facilities within their respective regions, Medicare DSH, IME and GME dollars increase due to the better alignment of interns and residents as well as Medicaid recipients with Medicare payer mix. The following chart breaks out the effects of distribution of these dollars: Section VI Exhibit 4 Pro Forma Estimate of Federal Funding Change (in Millions)
Funding Pre-Hurricanes Revised (1) Variance
Medicare DSH $ 186 $ 252 $ 66 IME 38 100 62 GME 23 55 32 Total
$ 247 $ 407 $ 160 Source: Data based on Medicare Cost Reports filed for FY2004; for facilities with no FY04 report, FY03 was used. Includes Subproviders. Notes: (1) Revised Payment calculation assumption: - Payer mix at each facility based on the regions' payer mix average. - Medical Center of New Orleans CLOSED - Payments and residents allocated on a pro rata basis to Ochsner Foundation Hospital and Tulane University Hospital and Clinic. - LSU-HSCD and LSU-HSC residents reallocated to other programs in their respective regions. - Children's Hospital residents decreased by 40 and evenly allocated to Ochsner Foundation Hospital and Tulane University Hospital and Clinic. (This was to model the impact of having residents in facilities with Medicare inpatients.) - Total residents equal current cap of 1,505 per Medicare Cost Reports. Hospital Efficiency. Based on FY 2004 Hospital Medicare Cost Report data, many of the realized efficiency improvements can be obtained in the private sector (non-LSU-HSC and non-LSU-HCD), where occupancy percentages were lower than expected "standard" or "acceptable" hospital performance levels.30 Overall, short term acute care non-LSU hospitals had an occupancy percentage of 52 percent. By increasing occupancy percentages to 70 percent, there would be a reduced need for operating beds, approximately 4,000. An estimated removal of these beds, at $435,000 per bed, yields a pro forma estimated $100 million in savings. The base dollars used in the calculation is as follows:
$7 B in Private/Non-LSU ST Acute Care Exp/16,000 Beds = $435,000 per bed 25% Fixed Cost approximates $110,000 per bed 75% Variable Cost approximates $325,000 per bed

Report for the Louisiana Recovery Authority Support Foundation
Page 230
This Report is intended for the use and benefit of the
Louisiana Recovery Authority Support Foundation only and not intended for reliance by any other Party.
Assuming that only 20 percent of the variable cost is eliminated, which equates to $65,000 per bed in savings, and assuming that some hurricane damaged hospitals remain closed, the total reduction in expenses is calculated to be $100 million on a pro forma basis:
($110,000 fixed + $65,000 variable) * 4,000 beds approximates $700 million $700 million * [(4,000 beds - 1,970 already closed)/16,000 available beds] approximates to $100 Million
Individual Premium/Tax. Another method to bring in funding to the system is to assess a "tax" on all individuals who are not insured through Medicaid, Medicare or a private insurance plan that meets minimum coverage requirements. This tax would be based on a family's income compared to the Federal Poverty Level (FPL). According to the Louisiana Health Insurance Survey in 2004, uninsured adults and children between 100-150 percent of the FPL were approximately 152,000; those between 150-200 percent of the FPL were 106,000; and those greater than 200 percent of the FPL were approximately 233,000.31 If each family was assessed an annual tax based on a sliding scale to subsidize part of their healthcare coverage, a pro forma estimated $200 million or more could be collected to fund the state's Medicaid and/or an uninsured healthcare coverage program. This includes the assumption that the state could receive federal matching dollars similar to its current Medicaid program level (70 percent matching). The detail of this calculation is provided below; the estimated savings of $200 million represents an estimate of collectible funds under this methodology.

Report for the Louisiana Recovery Authority Support Foundation
Page 231
This Report is intended for the use and benefit of the
Louisiana Recovery Authority Support Foundation only and not intended for reliance by any other Party.
Section VI Exhibit 5 Premium Example (Dollars in Millions)
Uninsured Annual
'Premium' Total
'Premium'
Those at 100 to 150% FPL 150,000
$ 120 $ 20,000
Those at 150 to 200% FPL 100,000
360
35,000
Those greater than 200% FPL 135,000
480
65,000
385,000
120,000 Reduction for estimated 20 percent non-enrollment/compliance
95,000
Federal matching dollars of 70 percent
315,000 Adjustment if not able to structure program to retain existing out-of-pocket spend
(210,000)
Total available new funds $ 200,000
Source: Population based on annual Louisiana Health Insurance Survey sponsored by the Louisiana Department of Health & Hospitals, April 21, 2004.
The following chart summarizes all the components discussed above with a net resultant savings on a pro forma basis of approximately $400 million.

Report for the Louisiana Recovery Authority Support Foundation
Page 232
This Report is intended for the use and benefit of the
Louisiana Recovery Authority Support Foundation only and not intended for reliance by any other Party.
Section VI Exhibit 6 Pro Forma Estimates of Changes in Funding under the Redesigned System
Dollars in (000s)
(350,000)$
Fund and Staff LERN 10,000$ Fund and Staff Health Information Exchange 10,000Create and Staff Region 2 (Baton Rouge) Trauma Center 15,000Realign numbers and compensation of work force 200,000Fully staff existing ambulatory care centers 25,000Create and staff new ambulatory care centers 20,000Develop additional long-term/home health capacity 120,000Total 400,000$
(750,000)$
Reduce reliance on Emergency Departments 200,000 Reduce overutilization of inpatient care 490,000 Increase Federal funding for GME/IME/DSH 160,000 Improve efficiency of hospital system 100,000 Individual premium assessment 200,000
1,150,000$
E) Net savings (shortfall) (D plus C) 400,000$
A) Current System Financing Shortfall
B) Investments
C) Funds Required or Savings to be Achieved to Create Sustainable System (A - B)
D) Savings and additional funds to be support a sustainable systems with high quality outcomes
Report for the Louisiana Recovery Authority Support Foundation
Page 233
This Report is intended for the use and benefit of the
Louisiana Recovery Authority Support Foundation only and not intended for reliance by any other Party.
Sources & Notes 1. Hawken,P. The Ecology of Commerce: A Declaration of Sustainability. 2. Cleverley & Associates. State of the Hospital Industry - 2004 Edition. 2004. 3. US - Kaiser Family Foundation, statehealthfacts.org; LA - Kaiser, LA Dept of Health and
Hospitals, Solucient, US Census. 4. Medicare Payment Advisory Commission. Report to the Congress: Medicare Payment Policy.
2001. 5. Medicare Payment Advisory Commission. Report to the Congress: Medicare Payment Policy.
2001. 6. Centers for Medicare and Medicaid Services - www.cms.hhs.gov. "National Health
Expenditures by Type of Service and Source of Funds" - calculation of 2004 Federal, State and Local percentage of Personal Health Care expenditures.
7. American Diabetes Association. Economic Costs of Diabetes in the U.S. in 2002. 26[3]. 2003.
8. Louisiana Hospital Association. Louisiana Medicaid: Priorities for an Effective Program. 2003.
9. Louisiana Department of Health and Hospitals. Medicaid Annual Report SFY 2003-2004. 10. Kaiser Family Foundation, www.statehealthfacts.org. 11. Louisiana Hospital Association. The Economic Contribution of Hospitals. 2004. 12. Louisiana Hospital Association. Louisiana Medicaid: Priorities for an Effective Program.
2003. 13. The Health Plan Employer Data and Information Set (HEDIS®). Medicaid HEDIS® 2002
Audit Means. 14. Centers for Medicare and Medicaid Services. Healthcare Cost Report Information System
(HCRIS) - DATASET - HOSPITAL. 2005. 15. Admission and days per 1,000 based on Medicare Cost Reports filed for FY2004; for
facilities with no FY04 report, FY03 was used -includes short term acute care hospitals only, as designated under hospital provider type as well as sub provider data. Population source is Kaiser Family Foundation, LA Dept of Health and Hospitals, Solucient, Inc., US Census.
16. US - Kaiser Family Foundation, statehealthfacts.org; LA - Kaiser, LA Dept of Health and Hospitals, Solucient, US Census.
17. Kaiser Family Foundation, www.statehealthfacts.org. 18. Louisiana Department of Health and Hospitals. Louisiana Health Insurance Survey 2005.
2005. 19. Louisiana Department of Health and Hospitals. Louisiana Health Insurance Survey 2004.
2004. 20. Louisiana Hospital Association. LHA Board Meeting Presentation, February 21, 2006, Based
on 2003 and 2004 Uncompensated Care Survey and Post-Hurricane UCC Survey. 2006. 21. Hadley,J. & Holahan,J. How much medical care do the uninsured use, and who pays for it?
Health Aff. (Millwood. ) Suppl Web Exclusives, W3-81 (2003). 22. Medicare Payment Advisory Commission. Report to the Congress: Medicare Payment Policy.
2001. 23. Payor mix calculation based on LHA and Medicare Cost Reports. 24. American Hospital Association - US Average - 6%. 25. Medicare Payment Advisory Commission. Report to the Congress: Medicare Payment Policy.
2001. 26. Based on observed industry run rates on medical loss ratios.

Report for the Louisiana Recovery Authority Support Foundation
Page 234
This Report is intended for the use and benefit of the
Louisiana Recovery Authority Support Foundation only and not intended for reliance by any other Party.
27. Louisiana Department of Health and Hospitals. The Uninsured Moving Forward. 2005. 28. Louisiana Hospital Association. Louisiana Medicaid: Priorities for an Effective Program.
2003. 29. Louisiana Department of Health and Hospitals. Louisiana Health Insurance Survey 2004.
2004. 30. Private sector is defined as all short term hospitals excluding 10 LSU hospitals. Occupancy
rates calculated as follows: total days/365/total available beds. Data obtained from 2004 Medicare Cost Reports. In cases where 2004 data was not available, 2003 data was used.
31. Louisiana Department of Health and Hospitals. Louisiana Health Insurance Survey 2004. Note that while a 2005 survey was released, detail in the current report for population ranges of 100% to 200% of FPL was not available.

Report for the Louisiana Recovery Authority Support Foundation
Page 235
This Report is intended for the use and benefit of the
Louisiana Recovery Authority Support Foundation only and not intended for reliance by any other Party.
Interviewees
• LRA Health Care Task Force Members – Dr. Mary Ella Sanders, Chairperson – Senator Donald Hines, MD, Vice
Chairperson – Gery Barry, President/CEO, BCBS - LA – Dr. Keith DeSonier, Private Practice
Physician – Representative Cheryl A. Gray – Leslie Hirsch, CEO, Touro Infirmaries – Dr. Larry Hollier, Dean, LSUHSC School
of Medicine – Dr. Lester Wayne Johnson, Chairman, LA
Emergency Response Network – Dr. Susan Nelson, Medical Director,
Capitol House Nursing and Rehabilitation Center
– Don Smithburg, CEO, LSUHSC – HCSD – John Spain, Executive VP, Baton Rouge
Area Foundation – Dr. Kevin Stephens, Health Director, City
of New Orleans – Dr. Paul Whelton, Senior VP for Health
Sciences and Dean, Tulane University School of Medicine
• National Health Care Subject Matter Experts
– Dr. Donald Berwick, CEO,
Institute for Healthcare Improvement
– Dr. Christine Cassel, President, American Board of Internal Medicine
– Dr. Jordan Cohen, President, AAMC
– Robert Dickler, SVP, AAMC – Dr. Harvey Fineberg, President,
Institute of Medicine – Jeanne Lambrew, Ph.D.,
Associate Professor of Health Policy Analysis, George Washington University
– Margaret O'Kane, President, NCQA
– Diane Rowland, Executive VP Kaiser Family Foundation and Executive Director KCMU
– Myrl Weinberg, CAE, President, National Health Council
• Department of Health & Hospitals – Dr. Fred Cerise, Secretary – Dr. Roxane Townsend, Special
Assistant to the Secretary – Dr. Rosanne Prats, Emergency
Preparedness Director – Dr. Jimmy Guidry, Medical
Director & State Health Officer

Report for the Louisiana Recovery Authority Support Foundation
Page 236
This Report is intended for the use and benefit of the
Louisiana Recovery Authority Support Foundation only and not intended for reliance by any other Party.
– Eileen Mederos RN, HRSA Coordinator – Dr. Stephanie Mills, Chief Medical
Informatics Officer, Our Lady of the Lake – Dr. Mark Peters, CEO, East Jefferson
Hospital – Dr. Patrick Quinlan, CEO, Ochsner Clinic
Foundation – George Renaudin, Market President, Senior
Products, Humana – Paul Salles, VP of Healthcare
Reimbursement Policy, LA Hospital Association
– Joe Savoie, Commissioner, Louisiana Board of Higher Education
– P.K. Scherlee, President, PK Scherlee & Associates
– W. Ob Soonthornsima, Senior VP & CIO, BCBS - LA
– Dr. Tony Sun, Medical Director, LA Health Care Review
– William J. Sylvia, Jr., Member, LSU Board of Regents
– Dr. Dwayne Thomas, CEO, LSUHCSD – New Orleans
– Rod West, Executive VP, Entergy – Harold White, CFO, LSUHSC - Shreveport – Dr. Lynn Witherspoon, CIO, Ochsner
Clinic Foundation
• State Health Care & Industry Stakeholders
– Coletta Barrett RN, MHA, FAHA Consultant to LHA Research & Education Foundation
– Nancy Beagouis RN, BSN Program Manager EMS
– Bernie Boudreaux, Chairperson, LSU Board of Supervisors
– Dr. George Burgess, VP of Technology, FMOLHS
– Dr. Mike Butler, Chief Medical Officer, LSUHSC – New Orleans
– Kim Boyle, Partner, Phelps Dunbar LLP – Joseph Donchess, Executive Director, LA
Nursing Home Association – John Finan, CEO, FMOLHS – Marcia Fries, HRSA Coordinator – Tatsy Jeter, CPA, Vice President, Finance &
Operations, Louisiana Hospital Association – Gary Jump, Chief Information Officer, Our
Lady of the Lake – Mel Lagarde, President, HCA – Delta Division– Laura Martin, VP of Healthcare Reform,
FMOLHS – John Mattesino, President, LA Hospital
Association – Dr. John McDonald, Chancellor, LSUHSC
Shreveport
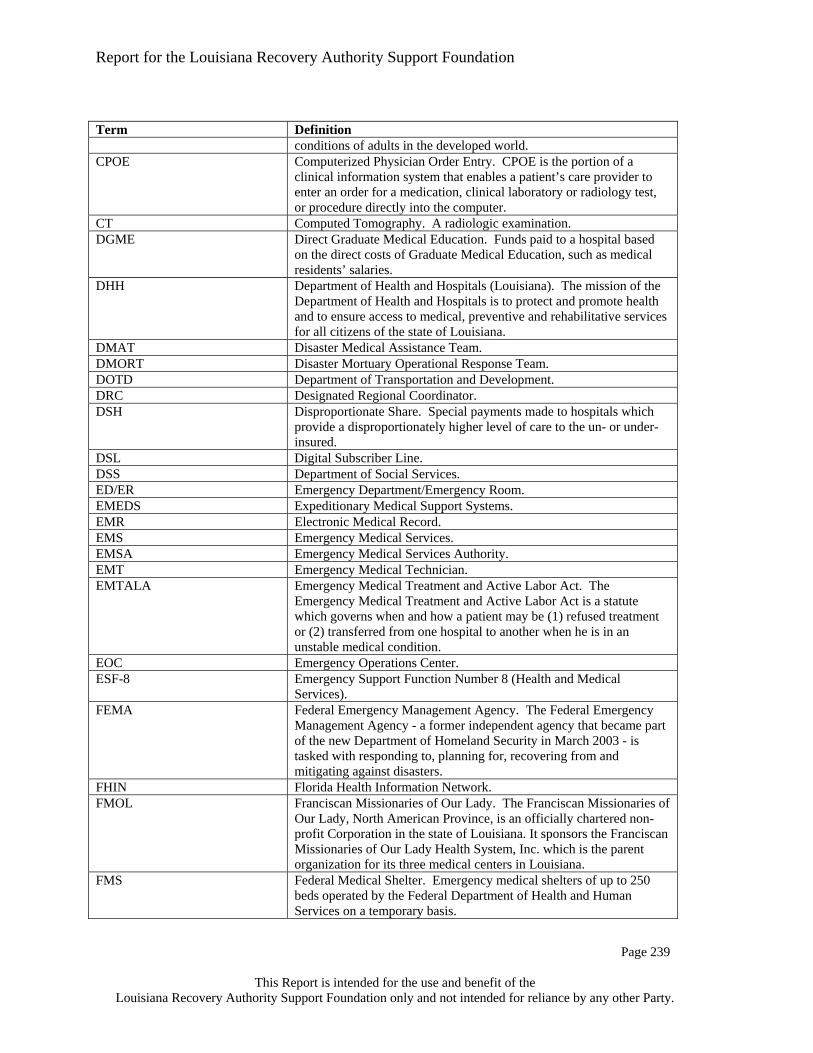
Report for the Louisiana Recovery Authority Support Foundation
Page 237
This Report is intended for the use and benefit of the
Louisiana Recovery Authority Support Foundation only and not intended for reliance by any other Party.
Glossary
Term Definition AAMC Association of American Medical Colleges. The Association of
American Medical Colleges is a nonprofit association of medical schools, teaching hospitals and academic societies. The AAMC seeks to improve the nation's health by enhancing the effectiveness of academic medicine.
ACGME Accreditation Council for Graduate Medical Education. The Accreditation Council for Graduate Medical Education is a private, non-profit council that evaluates and accredits medical residency programs in the United States.
ADC Average Daily Census. The average number of persons in a hospital as measured by total patient days divided by 365 divided by number of available beds.
ADL Activity of Daily Living. Routine activities that people tend do everyday without needing assistance. There are six basic ADLs: eating, bathing, dressing, toileting, transferring (walking) and continence. An individual's ability to perform ADLs is important for determining what type of long-term care (e.g. nursing-home care or home care) and coverage the individual needs (i.e. Medicare, Medicaid or long-term care insurance).
AHRQ Agency for Healthcare Research and Quality. The Agency for Healthcare Research and Quality (AHRQ) is the lead federal agency charged with improving the quality, safety, efficiency and effectiveness of healthcare for all Americans. As one of 12 agencies within the Department of Health and Human Services, AHRQ supports health services research that will improve the quality of healthcare and promote evidence-based decision-making.
AIDS Acquired Immune Deficiency Syndrome. A blood-borne disease caused by a virus.
ALOS Average Length of Stay. The average number of days a patient stays in a hospital, calculated by the total number of patient days divided by the total number of patients.
AMA American Medical Association. The American Medical Association helps doctors help patients by uniting physicians nationwide to work on the most important professional and public health issues.
AMC Academic Medical Center. A hospital in which the teaching of medical students (undergraduates) and medical residents (post-graduates) is a significant part of the institution’s mission. Normally the AMC is affiliated with one or more Schools of Medicine.
ASP Application Service Provider. a third-party entity that manages and distributes software-based services and solutions to customers across a wide area network from a central data center.
ATS American Trauma Society. The American Trauma Society is a member organization dedicated to the prevention of trauma and the improvement of trauma care.
BCBSLA Blue Cross/Blue Shield of Louisiana. The largest provider of private insurance services in the state of Louisiana.
BLS Bureau of Labor Statistics. The Bureau of Labor Statistics is the principal fact-finding agency for the federal government in the broad
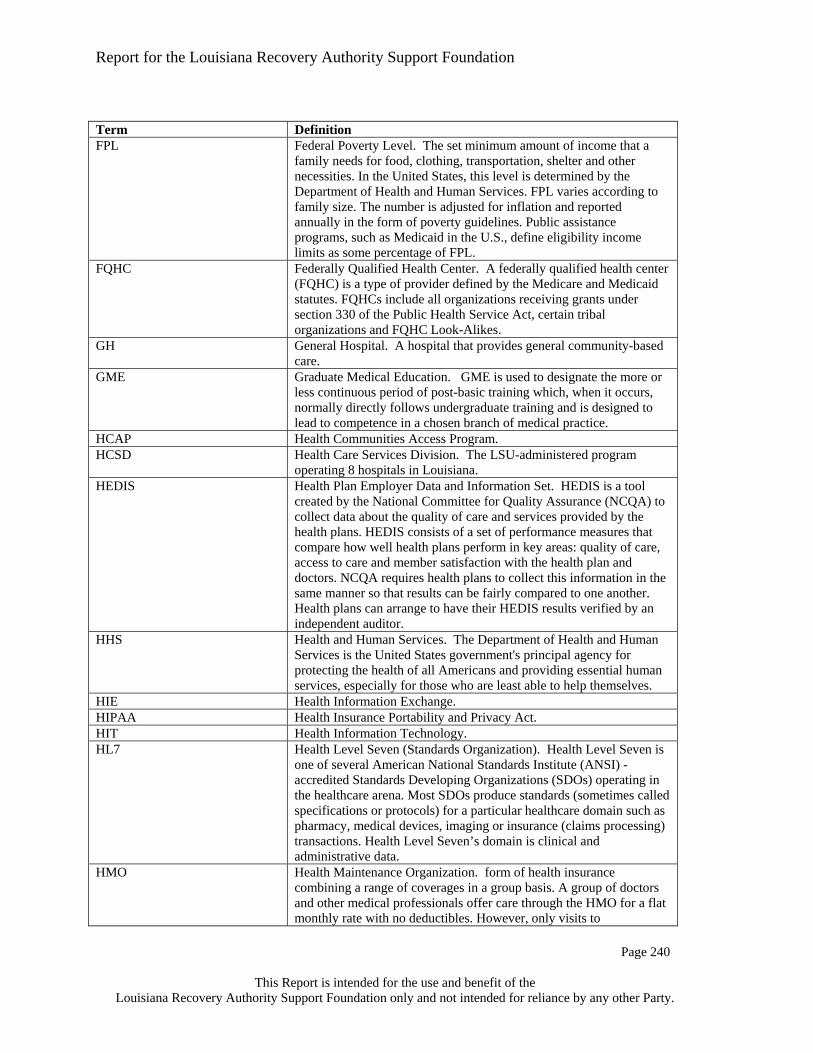
Report for the Louisiana Recovery Authority Support Foundation
Page 238
This Report is intended for the use and benefit of the
Louisiana Recovery Authority Support Foundation only and not intended for reliance by any other Party.
Term Definition field of labor economics and statistics.
ByNET Bayou Teche Community Health Network, Inc. CABG Coronary Artery Bypass Graft. Coronary artery bypass graft (CABG)
surgery is performed about 350,000 times annually in the United States, making it one of the most commonly performed major operations.
CAD Coronary Artery Disease. Coronary artery disease occurs when atherosclerotic plaque (hardening of the arteries) builds up in the wall of the arteries that supply the heart.
CAHPS Consumer Assessment of Healthcare Providers and Systems. The Consumer Assessment of Healthcare Providers and Systems (CAHPS) program is a public-private initiative to develop standardized surveys of patients’ experiences with ambulatory and facility-level care.
CalRHIO California Regional Health Information Organization. The California Regional Health Information Organization is a non-profit, collaborative, statewide initiative to improve the quality, safety and efficiency of healthcare through the use of information technology and the secure exchange of health information
CCR Continuity of Care Record. The CCR, or Continuity of Care Record, is a standard specification being developed jointly by ASTM International, the Massachusetts Medical Society (MMS), the Health Information Management and Systems Society (HIMSS), the American Academy of Family Physician s (AAFP) and the American Academy of Pediatrics. It is intended to foster and improve continuity of patient care, to reduce medical errors and to assure at least a minimum standard of health information transportability when a patient is referred or transferred to, or is otherwise seen by, another provider.
CDC Centers for Disease Control. The Centers for Disease Control and Prevention (CDC) is one of the 13 major operating components of the Department of Health and Human Services (HHS), which is the principal agency in the United States government for protecting the health and safety of all Americans and for providing essential human services, especially for those people who are least able to help themselves
CDR Clinical Data Repository. A CDR integrates patient data into a central database of individual lifetime patient records for access and clinical analysis.
CEO Chief Executive Officer. CHF Congestive Heart Failure. Congestive heart failure, or heart failure, is
a condition in which the heart is unable to adequately pump blood throughout the body and/or unable to prevent blood from "backing up" into the lungs.
CHR Community Health Record. CHTC Community Hospital Telehealth Consortium CLIQ Clinical Inquiry. CMS Center for Medicare and Medicaid Services. The federal agency
which administers the Medicare and Medicaid programs. COPD Chronic Obstructive Pulmonary Disease. Chronic Obstructive
Pulmonary Disease (COPD), which encompasses both chronic bronchitis and emphysema, is one of the commonest respiratory

Report for the Louisiana Recovery Authority Support Foundation
Page 239
This Report is intended for the use and benefit of the
Louisiana Recovery Authority Support Foundation only and not intended for reliance by any other Party.
Term Definition conditions of adults in the developed world.
CPOE Computerized Physician Order Entry. CPOE is the portion of a clinical information system that enables a patient’s care provider to enter an order for a medication, clinical laboratory or radiology test, or procedure directly into the computer.
CT Computed Tomography. A radiologic examination. DGME Direct Graduate Medical Education. Funds paid to a hospital based
on the direct costs of Graduate Medical Education, such as medical residents’ salaries.
DHH Department of Health and Hospitals (Louisiana). The mission of the Department of Health and Hospitals is to protect and promote health and to ensure access to medical, preventive and rehabilitative services for all citizens of the state of Louisiana.
DMAT Disaster Medical Assistance Team. DMORT Disaster Mortuary Operational Response Team. DOTD Department of Transportation and Development. DRC Designated Regional Coordinator. DSH Disproportionate Share. Special payments made to hospitals which
provide a disproportionately higher level of care to the un- or under-insured.
DSL Digital Subscriber Line. DSS Department of Social Services. ED/ER Emergency Department/Emergency Room. EMEDS Expeditionary Medical Support Systems. EMR Electronic Medical Record. EMS Emergency Medical Services. EMSA Emergency Medical Services Authority. EMT Emergency Medical Technician. EMTALA Emergency Medical Treatment and Active Labor Act. The
Emergency Medical Treatment and Active Labor Act is a statute which governs when and how a patient may be (1) refused treatment or (2) transferred from one hospital to another when he is in an unstable medical condition.
EOC Emergency Operations Center. ESF-8 Emergency Support Function Number 8 (Health and Medical
Services). FEMA Federal Emergency Management Agency. The Federal Emergency
Management Agency - a former independent agency that became part of the new Department of Homeland Security in March 2003 - is tasked with responding to, planning for, recovering from and mitigating against disasters.
FHIN Florida Health Information Network. FMOL Franciscan Missionaries of Our Lady. The Franciscan Missionaries of
Our Lady, North American Province, is an officially chartered non-profit Corporation in the state of Louisiana. It sponsors the Franciscan Missionaries of Our Lady Health System, Inc. which is the parent organization for its three medical centers in Louisiana.
FMS Federal Medical Shelter. Emergency medical shelters of up to 250 beds operated by the Federal Department of Health and Human Services on a temporary basis.

Report for the Louisiana Recovery Authority Support Foundation
Page 240
This Report is intended for the use and benefit of the
Louisiana Recovery Authority Support Foundation only and not intended for reliance by any other Party.
Term Definition FPL Federal Poverty Level. The set minimum amount of income that a
family needs for food, clothing, transportation, shelter and other necessities. In the United States, this level is determined by the Department of Health and Human Services. FPL varies according to family size. The number is adjusted for inflation and reported annually in the form of poverty guidelines. Public assistance programs, such as Medicaid in the U.S., define eligibility income limits as some percentage of FPL.
FQHC Federally Qualified Health Center. A federally qualified health center (FQHC) is a type of provider defined by the Medicare and Medicaid statutes. FQHCs include all organizations receiving grants under section 330 of the Public Health Service Act, certain tribal organizations and FQHC Look-Alikes.
GH General Hospital. A hospital that provides general community-based care.
GME Graduate Medical Education. GME is used to designate the more or less continuous period of post-basic training which, when it occurs, normally directly follows undergraduate training and is designed to lead to competence in a chosen branch of medical practice.
HCAP Health Communities Access Program. HCSD Health Care Services Division. The LSU-administered program
operating 8 hospitals in Louisiana. HEDIS Health Plan Employer Data and Information Set. HEDIS is a tool
created by the National Committee for Quality Assurance (NCQA) to collect data about the quality of care and services provided by the health plans. HEDIS consists of a set of performance measures that compare how well health plans perform in key areas: quality of care, access to care and member satisfaction with the health plan and doctors. NCQA requires health plans to collect this information in the same manner so that results can be fairly compared to one another. Health plans can arrange to have their HEDIS results verified by an independent auditor.
HHS Health and Human Services. The Department of Health and Human Services is the United States government's principal agency for protecting the health of all Americans and providing essential human services, especially for those who are least able to help themselves.
HIE Health Information Exchange. HIPAA Health Insurance Portability and Privacy Act. HIT Health Information Technology. HL7 Health Level Seven (Standards Organization). Health Level Seven is
one of several American National Standards Institute (ANSI) -accredited Standards Developing Organizations (SDOs) operating in the healthcare arena. Most SDOs produce standards (sometimes called specifications or protocols) for a particular healthcare domain such as pharmacy, medical devices, imaging or insurance (claims processing) transactions. Health Level Seven’s domain is clinical and administrative data.
HMO Health Maintenance Organization. form of health insurance combining a range of coverages in a group basis. A group of doctors and other medical professionals offer care through the HMO for a flat monthly rate with no deductibles. However, only visits to

Report for the Louisiana Recovery Authority Support Foundation
Page 241
This Report is intended for the use and benefit of the
Louisiana Recovery Authority Support Foundation only and not intended for reliance by any other Party.
Term Definition professionals within the HMO network are covered by the policy. All visits, prescriptions and other care must be cleared by the HMO in order to be covered. A primary physician within the HMO handles referrals.
HPSA Health Professional Shortage Area. Health Professional Shortage Areas (HPSAs) may have shortages of primary medical care, dental or mental health providers and may be urban or rural areas, population groups or medical or other public facilities. Designations are determined by the Bureau of Health Professions.
HRSA Health Resources and Services Administration ICU Intensive Care Unit. An inpatient unit where the most ill patients in a
hospital are treated. IME Indirect Medical Education. Funds paid to a hospital based on the
indirect costs of Graduate Medical Education, such as shared facility costs.
IOM Institute of Medicine. The Institute of Medicine serves as adviser to the nation to improve health. Established in 1970 under the charter of the National Academy of Sciences, the Institute of Medicine provides independent, unbiased, evidence-based advice to policymakers, health professionals, industry and the public.
IP Inpatient. A patient receiving overnight care in a hospital. ISP Internet Service Provider. A company providing access to the
internet, such as America Online. IT Information Technology. JAMA Journal of the American Medical Association. A scholarly journal. LA Louisiana. LA-CARE Louisiana Comprehensive Records Exchange. LANG Louisiana National Guard. LERN Louisiana Emergency Response Network. LHA Louisiana Hospital Association. Established in 1926, the Louisiana
Hospital Association is a not-for-profit association representing all types of hospitals and healthcare systems throughout the state. LHA carries out its mission by supporting its members through advocacy, education and services.
LHIN Louisiana Health Information Network. LNHA Louisiana Nursing Home Association. The Louisiana Nursing Home
Association is the trade association which represents more than 260 licensed proprietary and non-proprietary nursing homes in Louisiana.
LPN Licensed Practical Nurse. A nurse who has enough training to be licensed by a state to provide routine care for the sick.
LRA Louisiana Recovery Authority. The Louisiana Recovery Authority is the planning and coordinating body that was created in the aftermath of hurricanes Katrina and Rita by Governor Kathleen Babineaux Blanco to plan for the recovery and rebuilding of Louisiana. The authority is working with Governor Blanco to plan for Louisiana's future, coordinate across jurisdictions, support community recovery and resurgence and ensure integrity and effectiveness. Working in collaboration with local, state and federal agencies, the authority is also addressing short-term recovery needs while simultaneously guiding the long-term planning process.

Report for the Louisiana Recovery Authority Support Foundation
Page 242
This Report is intended for the use and benefit of the
Louisiana Recovery Authority Support Foundation only and not intended for reliance by any other Party.
Term Definition LSU Louisiana State University. LSU-HCSD Louisiana State University Health Care Services Division. Comprises
Bogalusa Medical Center, Earl K. Long Medical Center, Huey P. Long Medical Center, Lallie Kemp Regional Medical Center, LJ Chabert Medical Center, University Medical Center, Dr. W.O. Moss Regional Medical Center and Medical Center of Louisiana-New Orleans.
LSU-HSC Louisiana State University Health Sciences Center. Comprises LSU Shreveport Medical Center and E.A. Conway Medical Center.
LSU-NO Louisiana State University – New Orleans. LSU-SH Louisiana State University – Shreveport. LTAC/LTACH Long-Term Acute Care/Long-Term Acute Care Hospital. LTACs
provide specialized acute care for medically complex patients who are critically ill; have multi-system complications and/or failures and require hospitalization, averaging a length of stay of 25 days or more, in a facility offering specialized treatment programs and aggressive clinical and therapeutic intervention on a 24-hour/7-day-a-week basis.
LTC Long-Term Care. Care provided in a facility that provides rehabilitative, restorative and/or ongoing skilled nursing care to patients or residents in need of assistance with activities of daily living. Long-term care facilities include nursing homes, rehabilitation facilities, inpatient behavioral health facilities and long-term chronic care hospitals.
MaHIM Medical and Health Incident Management. MA-SHARE Massachusetts Simplifying Healthcare Among Regional Entities. The
Massachusetts Health Data Consortium has undertaken a number of initiatives to analyze, pilot and implement technologies and frameworks to improve coordination between unaffiliated organizations.
MCC Medicare Cost Report. A report hospitals participating in the Medicare program must file to the Center for Medicare and Medicaid Services on an annual basis.
MCLNO Medical Center of Louisiana New Orleans. Also referred to as “Big Charity,” the combination of Charity Hospital and University Hospital in New Orleans.
MD Medical Doctor. MMA Medicare Prescription Drug Improvement and Modernization Act.
The legislation enabling Medicare Part D, the coverage of prescription drugs, effective January 1, 2006.
MPY Members Per Year. An insurance term describing the number of persons enrolled (as “members”) in a given health plan during a given year.
MRI Magnetic Resonance Imaging. A radiologic examination. MSA Metropolitan Statistical Area. The Office of Management and Budget
(OMB) defines metropolitan statistical areas. Metropolitan statistical areas consist of one or more counties (or, in the case of Louisiana, parishes).
MUA Medically Underserved Area. Medically Underserved Areas (MUA) may be a whole county or a group of contiguous counties, a group of county or civil divisions or a group of urban census tracts in which

Report for the Louisiana Recovery Authority Support Foundation
Page 243
This Report is intended for the use and benefit of the
Louisiana Recovery Authority Support Foundation only and not intended for reliance by any other Party.
Term Definition residents have a shortage of personal health services. Designations are determined by the Bureau of Health Professions.
NCQA National Committee on Quality Assurance. NCQA is an independent, 501(c)(3) non-profit organization whose mission is to improve healthcare quality everywhere.
NDMS National Disaster Medical System. NHS National Health Service. The healthcare system of the United
Kingdom. NIH National Institutes of Health. The NIH is devoted to medical
research. Administratively under the Department of Health and Human Services (HHS), the NIH consists of 20-some separate Institutes and Centers. NIH's program activities are represented by these Institutes and Centers.
NLAHEC Northern Louisiana Area Health Education Center. OB/GYN Obstetrics/Gynecology. A physician specializing in obstetrical and
gynecological services. OHSEP Office of Homeland Security and Emergency Preparedness. OLOL Our Lady of the Lake. A private, not-for-profit hospital in Louisiana,
part of the Franciscan Missionaries of Our Lady Health System. ONCHIT Office of the National Coordinator for Health Information
Technology. OP Outpatient. A visit made to a hospital or other healthcare provider
that does not include an overnight (“inpatient”) stay. OPH Office of Public Health. A part of Louisiana’s Department of Health
and Hospitals. PACS Picture Archival and Retrieval System. A computerized system for
storing and retrieving digital images. PCP Primary Care Physician. A family doctor; general practitioner. PET Positron Emission Tomography. A radiologic examination. PHIN Public Health Information Network. PMU Portable Morgue Unit. PPO Preferred Provider Organization. Healthcare organization composed
of physicians, hospitals, or other providers which provides healthcare services at a reduced fee. A PPO is similar to an HMO, but care is paid for as it is received instead of in advance in the form of a scheduled fee.
PTCA Postluminal Coronary Angioplasty. Angioplasty performed to open a narrowed coronary artery, in which a balloon-tipped catheter is inserted into an artery in the groin or shoulder and threaded to the affected part. The balloon is inflated to flatten atherosclerotic plaque against the artery wall and reopen the artery.
PTSD Post Traumatic Stress Disorder. An anxiety disorder associated with serious traumatic events and characterized by such symptoms as survivor guilt, reliving the trauma in dreams, numbness and lack of involvement with reality, or recurrent thoughts and images.
PwC PricewaterhouseCoopers. RHC Rural Health Center. A form of Federally Qualified Health Center
(see FQHC). RHIO Regional Health Information Organization. RN Registered Nurse. A graduate nurse who has passed examinations for

Report for the Louisiana Recovery Authority Support Foundation
Page 244
This Report is intended for the use and benefit of the
Louisiana Recovery Authority Support Foundation only and not intended for reliance by any other Party.
Term Definition registration.
ROME Rural Opportunities in Medicine. RRC Residency Review Committee. Committees comprised of volunteer
physicians who review the performance of graduate medical education programs at teaching hospitals to determine their compliance with program requirements.
SARBOO Search and Rescue Base of Operations. SES Self Employed Status. SMaRDI Shared Medical Records and Data Infrastructure. SoM School of Medicine. ST Short-Term. Used to distinguish hospitals from other providers of
inpatient care, such as long-term care and rehabilitation facilities. TARU Technical Advisory Response Unit. THINC Taconic Health Information Network and Community. TMOSA Temporary Medical Operations and Staging Area. TUSOM Tulane University School of Medicine. UCC Uncompensated Care. Care provided by a hospital or health
professional for which no payment, from the patient, an insurer, or the government, is received.
UHF United Health Foundation. UnitedHealth Group established United Health Foundation in 1999 as a nonprofit, private foundation with a mission to support the health and medical decisions made by physicians, health professionals, community leaders and individuals that lead to better health outcomes and healthier communities.
UME Undergraduate Medical Education. Undergraduate education refers to pre-medical college education, which results in a Bachelor's degree and is the training most students receive before entering medical school.
USPHS/PHS United States Public Health Service/Public Health Service UTI Urinary Tract Infection. UW University of Washington. VA Veterans Administration. The federal agency charged with
administering the Veterans Healthcare Administration, which provides healthcare services to eligible persons, predominantly veterans.
WJMC West Jefferson Medical Center. A not-for-profit hospital in Louisiana.
WWAMI “Washington, Wyoming, Alaska, Montana, Idaho”. The WWAMI Rural Health Research Center (RHRC) is one of six rural research centers funded by the Federal Office of Rural Health Policy (FORHP) to perform policy-oriented research on issues related to rural healthcare.