report on field measurements petten sea … institute for coastal and marine management/rikz report...
TRANSCRIPT

The Netherlands Ministry of Transport, jklmnopq
Public Works and Water Management The Netherlands National Institute for Coastal and Marine Management /RIKZ
Report on Field Measurements
Petten Sea Defence
Storm Season 2002-2003
July 2003
CLASH-EU

2 Report on field measurements Petten Sea defense storm season 2002-2003

The Netherlands Ministry of Transport, jklmnopq
Public Works and Water Management The Netherlands National Institute for Coastal and Marine Management /RIKZ
CLASH-EU Report on Field
Measurements
Petten Sea Defence
Storm Season 2002-2003
Project: CLASH-EU Report: RIKZ/OS_2003.135X Date: July 2003 Author: D. Hordijk Cooperation: J. Hoekema J.J. Jacobse A.P. Roskam

4 Report on field measurements Petten Sea defense storm season 2002-2003

National Institute for Coastal and Marine Management/RIKZ
Report on field measurements Petten Sea defense storm season 2002-2003 1
Table of Contents
. . . . . . . . . . . . . . . . . . . . . . . . . . . . . . . . . . . . . . . . . . . . . . . . . . . . . . . . . . . . . . . . . . . . . . . . . . . . . . . .
1 Introduction 3 1.1 General 3 1.2 Background 3 1.3 Objectives 4 1.4 Organisation 4 1.5 Data Processing Method 5 1.6 Report Outline 5
2 Description of Petten Field Site 7 2.1 Location 7 2.2 Equipment 8 2.2.1 Field Site Set-up 8 2.2.2 Equipment Changes Compared with Previous Season 11 2.2.3 Operation of Equipment 11 2.2.4 Management and Maintenance 14 2.3 Data Collection 14
3 Data Availability and Reliability 15 3.1 Data Availability 15 3.1.1 Availability of Storm Season Data 15 3.1.2 Storm Data Availability 18 3.2 Data Reliability 20
4 Processing of Measuring Season 25 4.1 Wind, Wave and Current Characteristics 25 4.1.1 Wind Characteristics 25 4.1.2 Wave Characteristics 26 4.1.3 Current Velocity Measurements 28 4.2 Long Waves 29 4.2.1 General 29 4.2.2 Choice of Equipment 29 4.2.3 Definition of Low Frequency Energy 30 4.2.4 Low Frequency Energy Analysis 31 4.2.5 Conclusions 32 4.3 Morphological Measurements 33 4.3.1 Soundings 33 4.3.2 Groyne Section Measurements 34 4.4 Storm Period Selection 35 4.4.1 General 35 4.4.2 Storms Occurred 36 4.4.3 Water Levels Measured 36 4.5 Data Processing & Storage 37 4.5.1 General 37 4.5.2 Data Processing 38

National Institute for Coastal and Marine Management/RIKZ
2 Report on field measurements Petten Sea defense storm season 2002-2003
4.5.3 Software Settings 39 4.5.4 Data Storage 40
5 Report on Storm Period 25-28 October 2002 41 5.1 Storm Conditions 41 5.2 Wind Measurements 42 5.3 Water Level Measurements 43 5.4 Wave Measurements 43 5.5 Wave Run-Up Measurements 44
6 General Conclusions and Recommendations 45 References 52 Bibliography Petten 1995-2003 54 Appendices Appendix A Photographs of Instrument Set-Up and Equipment Appendix B Data Availability over Storm Season 2002-2003 Appendix C Exceedence Curves Hm0 en Tm-10 over Storm Season
2002-2003 Appendix D Long Wave Analysis Results Appendix E Water Levels and Astronomical Tide During Storm
Periods Appendix F Storm Period 25–28 October 2002

National Institute for Coastal and Marine Management/RIKZ
Report on field measurements Petten Sea defense storm season 2002-2003 3
1 Introduction . . . . . . . . . . . . . . . . . . . . . . . . . . . . . . . . . . . . . . . . . . . . . . . . . . . . . . . . . . . . . . . . . . . . . . . . . . . . . . . .
1.1 General
Wave and wave run-up measurements have been carried out at the Petten Sea Defence in the Netherlands since 1994. The Rijkswaterstaat Directorate North Holland (Information Service Water) carries out these measurements under the authority of the Rijkswaterstaat National Institute for Coastal and Marine Management (RIKZ). The Road & Hydraulic Engineering Division (DWW) is responsible for analysing the wave run-up measurements. A range of equipment is used for various measurements during this measuring programme. The vertical water level deviations, for example, are measured by means of wave buoys, pressure sensors and radar equipment, while the wave run-up against the dike is measured by means of, among other instruments, a wave run-up staff and video cameras. Although these wave and wave run-up measurements up to and including storm season 2000-2001 were filed, they were not documented. By the end of 2002, a beginning was made at an extensive analysis and description of the field measurements, which eventually resulted in the storm season report over 2001-2002 [Hordijk, 2003]. The intention is to describe the subsequent storm seasons in similar documents as well, so that the measurements carried out are efficiently documented and can be made available to interested parties. The report on the field measurements carried out over storm season 2002-2003, has practically the same structure as that of storm season 2001-2002. The subsequent report, however, pays more attention to the analysis and description of long waves (generated locally) with periods exceeding 30 seconds. 1.2 Background
The Netherlands are protected against flooding by the North Sea, the major rivers, and the inland seas IJsselmeer and Markermeer thanks to primary water defences. The Water Defence Act (Wet op de Waterkering) stipulates that every five years these water defences are tested against the applicable standard of hydraulic boundary conditions. Boundary conditions are defined to this purpose as water levels and wave characteristics at a particular chance of occurrence, in relation to the applicable safety level. This information is included in the Hydraulic Boundary Conditions Manual [Hydraulisch Randvoorwaardenboek].

National Institute for Coastal and Marine Management/RIKZ
4 Report on field measurements Petten Sea defense storm season 2002-2003
The RIKZ is responsible for the knowledge, the calculation equipment and the calculations used for defining the hydraulic boundary conditions for salt waters. The availability and reliability of the hydraulic boundary conditions depend on the reliable, verified and generally accepted wave models, such as SWAN. Verification of these models requires wave measurements particularly in shallow water (near the dike). 1.3 Objectives
The main objectives of the Petten survey are to follow wave propagation from deep water through the surf zone to the dike, and to measure the wave run-up against the dike. This fieldwork knowledge is then used to quantify the reliability of a wave model (such as SWAN) and of wave run-up modelling with respect to the straight Dutch coastline. The objective of writing this storm season report is to gain an understanding of the measurements carried out, and to describe the data so that they are transferable. This report therefore examines a number of general issues, such as the field site location, the equipment, data collection and data registration. It furthermore gives a description of the hydraulic conditions (wave climate, current conditions and water levels), wind conditions and bottom topography changes at the Petten Sea Defence during storm season 2002-2003. 1.4 Organisation
The measurements at the Petten field site are part of a joint research programme by the RIKZ and DWW. The primary objective of the RIKZ is “to provide applied recommendations on the basis of knowledge acquired”. This knowledge is for the use of all departments of the Netherlands Ministry of Transport, Public Works and Water Management and – subject to the boundary conditions – that of relevant external partners. From an internal point of view, the RIKZ programme is part of the HR-Meet/SBW5 project, which in turn is a subproject of “Strength and Stress on Water Defences” [Sterkte en Belasting op Waterkeringen, SBW] and aims to provide valid measurements for the improvement of scale models used to determine the hydraulic boundary conditions. The objective of project group HR-Meet is to measure, process and validate the wave data to meet the need of good measuring data required for determining hydraulic boundary conditions, for validating design and testing software, and for broadening the available knowledge of waves.

National Institute for Coastal and Marine Management/RIKZ
Report on field measurements Petten Sea defense storm season 2002-2003 5
The Rijkswaterstaat Measurement Information Service Water of Directorate North Holland carries out the measurements at and maintenance of the field site. 1.5 Data Processing Method
Processing of measurement data used to be carried out by means of ‘ad hoc’ software (Fortran scripts). On the authority of the RIKZ, in 2002 the wave processing software programme Waves2002 was developed to streamline data processing and to improve processing maintenance. This programme was tested against data from storm season 2001-2002. The present version of Waves2002 allows processing of separate days only, which would make processing of the full storm season very time-consuming and inefficient. The batch version will be developed in the second half of 2003, which will enable processing of longer time spans without too much effort. The batch version shall eventually replace all ad hoc software that has been used so far. The data processing method for storm season 2002-2003 was the same as that for previous storm seasons, ie by means of the ad hoc software. Waves2002 was used to generate a visual check of processing of, among other things, storm days. Several graphic results have been incorporated in this storm season report. Validation was carried out on the raw measuring signal, where spikes, time errors and stagnations were cleared, and data gaps were completed. A validation at parameter level, which checks parameter reliability, was not carried out; the same applies to the storms! In other words, a general but no systematic validation was carried out. As of next storm season, Measurement Information Service of Directorate North Holland is to carry out the measurement processing. At the time of writing this storm season report, the necessary preparations are being made to this purpose. 1.6 Report Outline
To begin with, Chapter 2 provides a detailed description of the field site. It starts by giving an outline of the field site set-up, followed by separate descriptions of the various instruments applied. It furthermore briefly discusses management and maintenance of the site and of data collection. Chapter 3 examines the availability of measurement data and storm data, as well as the reliability of the various types of measuring instruments. Chapter 4 describes the general characteristics and the morphological developments during measuring season 2001-2002. It also includes a brief analysis of the spectre’s low frequency energy, ie the long waves, followed by the selection of a storm period which is interesting because of wind speeds and water levels. Chapter 4 discusses data processing by means of

National Institute for Coastal and Marine Management/RIKZ
6 Report on field measurements Petten Sea defense storm season 2002-2003
Waves2002 and other software, as well as data storage. Chapter 5 gives a detailed description of the storm period selected in chapter 4, where a general description of the storm conditions is followed by, among other things, wind measurements, wave measurements and wave run-up measurements. To conclude, Chapter 6 provides the general conclusions and recommendations.
National Institute for Coastal and Marine Management/RIKZ
Report on field measurements Petten Sea defense storm season 2002-2003 7
2 Description of Petten Field Site . . . . . . . . . . . . . . . . . . . . . . . . . . . . . . . . . . . . . . . . . . . . . . . . . . . . . . . . . . . . . . . . . . . . . . . . . . . . . . . .
2.1 Location
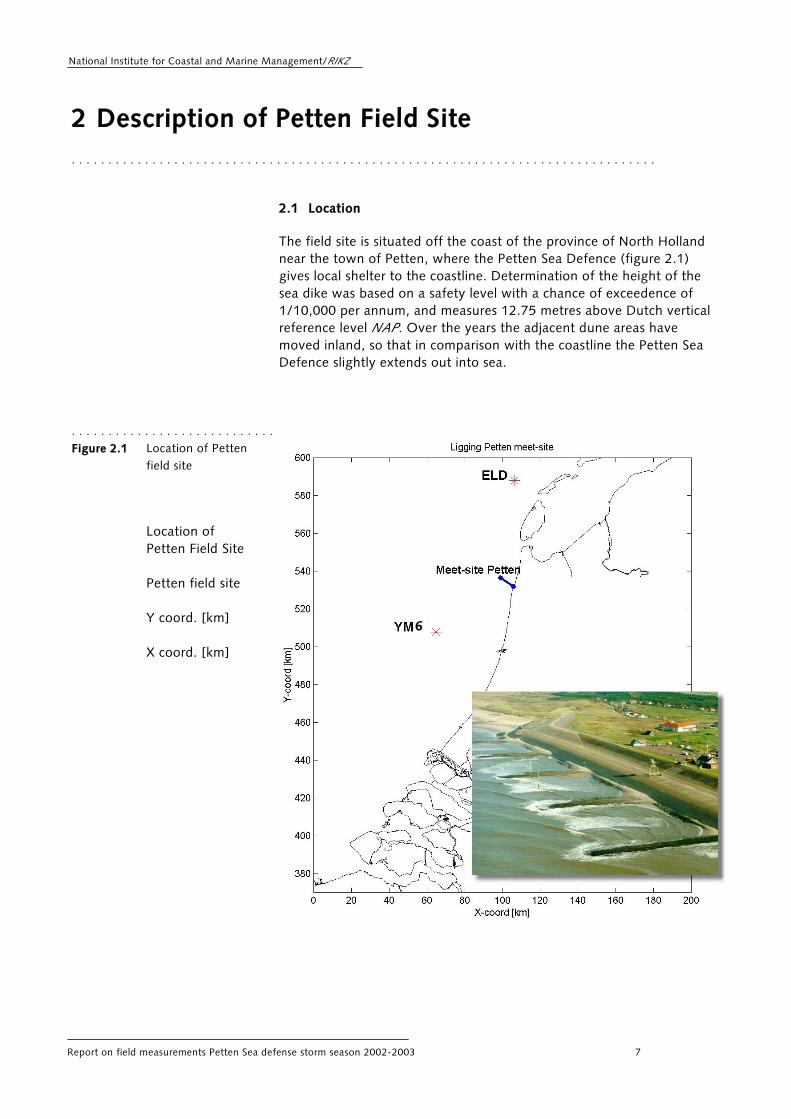
The field site is situated off the coast of the province of North Holland near the town of Petten, where the Petten Sea Defence (figure 2.1) gives local shelter to the coastline. Determination of the height of the sea dike was based on a safety level with a chance of exceedence of 1/10,000 per annum, and measures 12.75 metres above Dutch vertical reference level NAP. Over the years the adjacent dune areas have moved inland, so that in comparison with the coastline the Petten Sea Defence slightly extends out into sea.
. . . . . . . . . . . . . . . . . . . . . . . . . . . . Figure 2.1 Location of Petten
field site
Location of Petten Field Site Petten field site Y coord. [km] X coord. [km]
6

National Institute for Coastal and Marine Management/RIKZ
8 Report on field measurements Petten Sea defense storm season 2002-2003
2.2 Equipment
2.2.1 Field Site Set-up Measurements are taken at various locations to gain an understanding of wave behaviour off the Petten Sea Defence and the extent of wave run-up against this dike. These measuring points (MPs) are located on or near kilometre section 20,830 as referred to in the Rijkswaterstaat annual coastal sounding programme. The choice of measuring equipment depends on the particular location, the variables to be measured and the equipment available. The measuring points, variables to be measured and type of instrument are listed in tables 2.1 and 2.2.

National Institute for Coastal and Marine Management/RIKZ
Report on field measurements Petten Sea defense storm season 2002-2003 9
. . . . . . . . . . . . . . . . . . . . . . . . . . . .
Meas.
point
Sensor/Instrument Distance to
ref. pt.1
[m]
X coord.
RD [m]
Y coord.
RD [m]
Z [NAP
m+]
Location
MP 13 Anemometer (131)
Wind vane (132)
-35 105798 531673 Dijk te Kijk2
MP 22 Barometer (221) -35 105798 531673 Dijk te Kijk
MP 14 Video camera 1 (141) -0.2 105769 531693 17.3 Crest of dike
MP 19 Video camera 2, 3
(191, 192)
1.1 105759 531677 16.6 Crest of dike
MP 12 Pressure sensor (121) 12.7 105749 531683 9.28 Dike’s upper
slope
MP 11 Pressure sensor (111) 18.2 105744 531685 7.16 Dike’s upper
slope
MP 9 Wave run-up staff (091) 19.4
(centre)
105743 531686 6.92
(centre)
Dike’s upper
slope
MP 10 Pressure sensor (101) 25.6 105738 531689 5.60 Dike’s lower
slope
Table 2.1 Measuring points
MP 8 Pressure sensor (081) 55.7 105720 531719 0.53 Dike’s lower
slope
MP 7 Pressure sensors (071, 072) 75.4 105703 531730 0.11/
0.06
Groyne section
post
MP 6 Capacitance wire (061)
Pressure sensor (062)
Radar level meter (063)
Anemometer (064)
Wind vane (065)
ASM-IV (066)
122.9
122.7
122
122
122.7
105661
105662
105661
105661
105661
105661
531752
531752
531753
531751
531715
531715
-1.34
8.98
?
}
}
} Breaker
} bar post
}
}
MP 18 Pressure sensor (181) 170.5 105617 531771 Sea bed
MP 17 Pressure sensor (171, 175)
Current velocity meter (172,
173, 174)
276.7
276.7
105522
105522
531817
531817
-2.84
-2.91
Sea bed
Sea bed
MP 16 Pressure sensor (161, 162,
163)
436.6 105377 531886 -2.53 Sea bed
MP 3 Digital level meter (032)
Radar level meter (033)
609
609
105234
105234
531985
531985
Post
Post
MP 2 Directional Waverider (021) 3526 102896 533802 Petten Polder
MP 1 Directional Waverider (011) 7916 99003 535832 NAP –20m
1 The distance to the reference point is defined in relation to section 20,830 with
zero coordinates x= 105767, y = 531690 (corresponds approx. with crest of dike)
and direction (nautical) 297.9 ˚ 2 Vistor Information Centre ”Dijk te Kijk” (ie “Sea Dike on Show”)

National Institute for Coastal and Marine Management/RIKZ
10 Report on field measurements Petten Sea defense storm season 2002-2003
. . . . . . . . . . . . . . . . . . . . . . . . . . . .
Measuring
Point
Sensor/Instrument
Measuring variables [unit] Data Collection
Frequency (Hz)
MP 13 Anemometer (131)
Wind vane (132)
Wind direction [˚ ], Wind speed [m/s]
1/60
MP 22 Barometer (221) Atmosph. pressure [mbar] 1/60
MP 14 Video camera 1 (141) Measuring section and surf
zone
25 images/sec
MP 19 Video camera 2, 3
(191,192)
Wave run-up (also in grid) 25 images/sec
MP 12 Pressure sensor (121) Water pressure [mbar] 4.00
MP 11 Pressure sensor (111) Water pressure [mbar] 4.00
MP 9 Wave run-up staff (091) Wave run-up [m] 10.00
MP 10 Pressure sensor (101) Water pressure [mbar] 4.00
Table 2.2 Equipment and measurement variables
MP 8 Pressure sensor (081) Water pressure [mbar] 4.00
MP 7 Pressure sensors (071, 072) Water pressure [mbar] 4.00
MP 6 Capacitance wire
Pressure sensor (062)
Radar level meter (063)
Anemometer (064)
Wind vane (065)
ASM-IV (066)
Surface deviation [m]
Water pressure [mbar]
Surface deviation [m]
Wind speed [m/s]
Wind direction [˚ ] Bottom topography [NAP m]
4.00
4.00
2.56
1 min. measured
1 min. measured
3 samples / 20 min
(1/hr as of May)
MP 18 Pressure sensor (181) Water pressure [mbar] 4.00
MP 17 Pressure sensor (171, 175),
Current velocity meter
(172, 173, 174)
Water pressure [mbar]
Current velocity [m/s]
4.00 / 1.00
1.00
MP 16 Pressure sensor (161, 162,
163)
Water pressure [mbar] 4.00
MP 3 Digital level meter (032)
Radar level meter (033)
Water level [NAP m]
Surface deviation [m]
0.10
2.56/10 min.
measured
MP 2 Directional Waverider (021) Surface deviation [m] and
wave direct ion [˚ ] 1.28
MP 1 Directional Waverider (011) Surface deviation [m] and
wave direct ion [˚ ] 1.28
Figure 2.2 below gives the measuring point locations in the field site’s (full) cross shore profile. To avoid confusion, an enlarged graph of the relevant area shows the positions just off the coast.

National Institute for Coastal and Marine Management/RIKZ
Report on field measurements Petten Sea defense storm season 2002-2003 11
. . . . . . . . . . . . . . . . . . . . . . . . . . . Figure 2.2 Petten field site
(distances and heights in metres)
2.2.2 Equipment Changes Compared with Previous Season A number of equipment changes were made prior to and during storm season 2002-2003: • Due to malfunctioning during the previous storm season, the water
level staff at MP 3 was removed. In June 2003 a new Etrometa staff was mounted.
• Early November an ASMIV sea bed staff was placed next to MP 6 to gain an understanding of the sea bed changes near this measuring point during a storm.
• Prior to the storm season, two pressure sensors were added to MP 16.
• In addition to the radar level meter and pressure sensor, which seem less reliable, a capacitance wire was added to MP 6 as an ‘objective’ measuring technique.
2.2.3 Operation of Equipment This subparagraph briefly describes the operation of the instruments used on the field site, in the following order: • Directional waverider • Digital level meter (DLM) • Pressure sensor • Radar level meter • Current meter • Wave run-up staff • Video camera • Wind speed and direction meter • Barometer • Capacitance wire • ASMIV sea bed staff
Mp13,22

National Institute for Coastal and Marine Management/RIKZ
12 Report on field measurements Petten Sea defense storm season 2002-2003
Reference is made to appendix A, in which photographs illustrate all above-mentioned measuring instruments. Photograph 9 provides an overview of the measuring set-up near the dike. Directional Waverider (see photograph 1 in appendix A) The directional waverider is a buoy supplied by Datawell and has a diameter of 0.9 m. The instrument contains equipment for measuring vertical accelerations and horizontal positions, pitch, roll and heave. The buoy is furthermore equipped with two permanent accelerometers, a compass and a direction meter. The data collected are transmitted to shore by means of telemetric links. The directional waverider enables short wave registration including wave direction. MP 1 is set as the field site’s offshore reference point (approx. 8 km seaward), while MP 2 is located at the height of a sand ridge on the Petten polder (figure 2.2). Digital Level Meter (DLM) The digital level meter consists of a vertical tube with an opening below the minimum water level. The opening’s flow resistance functions as a high frequency filter. High frequencies (wind waves) do not penetrate into the tube. A float measures the water level within the tube, and is connected to a pulley by means of a metal wire. A counterbalance ensures continuous wire tension. The pulley’s rotations then show the course of water level changes. Pressure Sensor (see photographs 2 and 6 in appendix A) The pressure sensor measures the total hydrostatic pressure (atmospheric pressure, upper water layer and any current pressure). The pressure sensors on the Petten field site are installed to define the wave spectrum (MPs 6, 7, 16, 17 en 18), and to read the layer thickness of the run-up waves against the dike (MPs 8, 10, 11 en 12). An additional number of pressure sensors (sensors 161, 171 and 062) were positioned at equal distances in the surf zone to enable measurements of long wave reflection. Radar Level Meter (see photograph 4 in appendix A) The radar level meters supplied by Enraf enable measurements of water levels and wave heights. On the Petten field site, ITH evaluates the usefulness of various types of this instrument in the surf zone (033 and 063). The first results of this evaluation should be available by the end of 2003. Current Meter (see photograph 5 in appendix A) The instantaneous current velocity and current direction are measured by an (Aquadopp) current meter (172-174) in a vertical direction, and in directions along and perpendicular to the coastline. Wave Run-Up Staff (see photograph 3 in appendix A) The wave run-up staff used for measuring wave run-up against the dike, was supplied by Etrometa. Operation of this instrument, which consists of a series of electrodes at 0.05 metre distance each, is based on the principle of electronic conductivity. The wave run-up staff,

National Institute for Coastal and Marine Management/RIKZ
Report on field measurements Petten Sea defense storm season 2002-2003 13
measuring 12 metres in length, is placed in the dike revetment and registers the wave run-up height against the slope. Video Camera (see photographs 7 and 8 in appendix A) Whenever a wave run-up is expected to occur, a video is recorded (191 and 192) to get a two-dimensional picture of the wave conditions in between the two groynes and of wave run-up against the dike. A grid was placed onto the dike to enable three-dimensional wave run-up registration. Wind Speed and Wind Direction Meter Throughout the storm season, the wind speeds and relating wind directions are measured continuously at two locations, ie in the surf zone at approx. 10 metres above Dutch reference level NAP (064 and 065), and at the landward side of the dike also at a height of approx. 10 metres (131 and 132). Barometer A pressure sensor (221) located at the field site’s Visitor Information Centre “Dijk te Kijk” (“Sea Dike on Show”) measures the atmospheric pressure. This measurement is continuous throughout the storm season. Capacitance Wire (see photograph 10 in appendix A) The principle of the capacitance wire is that of measuring the capacity of two wires which are stretched closely along each other. An increase in water level along these wires results in a decrease in capacity, which allows charting of the water level deviations (for example as a result of water level changes and waves). ASMIV sea bed staff (see photographs 11 and 12 in appendix A) From November 2002 the bottom topography near MP 6 was measured by means of an ASMIV sea bed staff supplied by the German company Argus. This instrument consists of 192 optic sensors cast in a metal rod at equal distances of 1 centimetre. The measuring data show a clear distinction between the sea bed layer and the water layer above. The sea bed staff is a stand-alone sensor with 8 MB storage capacity and is programmed by using an infrared interface. The voltage is supplied by two 9 Volt batteries, which require replacement after 3 months (or 6 months). This year’s use of the ASMIV is experimental. ITH shall evaluate this sensor and set up an indication for potential. If the conclusion is that this instrument is very efficient at monitoring the sea bed during storms, the instrument shall be introduced at several Petten locations.

National Institute for Coastal and Marine Management/RIKZ
14 Report on field measurements Petten Sea defense storm season 2002-2003
2.2.4 Management and Maintenance The Information Service Water is responsible for keeping the field site operational, which entails preventive and corrective maintenance. Preventive maintenance means that the equipment is kept in such a condition that there is a mere slim chance of corrective maintenance. Corrective maintenance means that worn equipment is repaired or replaced. Installation and maintenance of the instrument set-up at the MSW3 post (MP 3) are carried out exclusively by the MSW technical management department. The MP 3 instrument set-up was therefore designed and installed by the RIKZ IT department. The MSW is responsible for operation of the DLM, but not for the operation of the radar level meter (and water level staff). These instruments are included in the maintenance programme of the MSW post. 2.3 Data Collection
In 2001 a system was developed on the basis of the Qinsy system, which allowed data transfer commands to be given from a different location. The measuring data are stored onto two PCs in a locked room at the Petten Visitor Information Centre “Dijk te Kijk”. In 2002 a network link to Petten was set up for the purpose of daily sensor operation checks. The network is used for making daily copies of the measuring data. In IJmuiden they are burned onto CD, which in turn is sent to Den Oever for the first processing procedure. In Den Oever the (raw) data are then stored onto CD and approx. once every 7 days they are sent to the RIKZ. The RIKZ then carries out detailed processing (analysis and validation) of the measuring data.
3 Monitoring System Water

National Institute for Coastal and Marine Management/RIKZ
Report on field measurements Petten Sea defense storm season 2002-2003 15
3 Data Availability and Reliability . . . . . . . . . . . . . . . . . . . . . . . . . . . . . . . . . . . . . . . . . . . . . . . . . . . . . . . . . . . . . . . . . . . . . . . . . . . . . . . .
This chapter describes the availability of measuring data concerning the full storm season 2002-2003, and for the storms (wind speed > 15 m/s) which occurred within that season. A brief discussion of the reliability of the available data is also included. 3.1 Data Availability
3.1.1 Availability of Storm Season Data The degree of availability (ie existence) of the measuring data over storm season 2002-2003, is given in the bar graphs in appendix B. Key to the colours is: Green: every day a minimum of 80% of the anticipated values is
available after processing Yellow: every day 50% to 80% of the anticipated values is available
after processing Red: every day less than 50% of the anticipated values is available
after processing Black: nil values available Instrument numbers 091-121, 141 and 191 are positioned on the dike and do not generate any output unless there is sufficient wave run-up. They are therefore not included in the bar graphs. The ASMIV sea bed staff, which was introduced early November, is not included in the bar graph either. At the beginning of the storm season, it had not yet been decided whether or not a new water level staff was to be placed at MP 3, so that this water level staff was not removed from the bar graphs. As per storm season 2002-2003, the radar is used for collecting data at MP 3 at two different frequencies. This instrument is therefore included in the bar graphs for both frequencies. The bar graph in figure 3.1 below shows the availability of measuring data for every instrument throughout the storm season. Figure 3.2 compares the data availability over storm season 2002-2003 with that over preceding storm season 2002-2002.

National Institute for Coastal and Marine Management/RIKZ
16 Report on field measurements Petten Sea defense storm season 2002-2003
. . . . . . . . . . . . . . . . . . . . . . . . . . . Figure 3.1 Data Availability
over Storm Season 2002-2003
. . . . . . . . . . . . . . . . . . . . . . . . . . . Figure 3.2 Comparison of Storm
Data Availability 2002-2003 and 2001-2002
�����������������������������������
������������������������������
��������������������
Availability of datastormseason 2002-2003
91
58
98
9085 85
97
90
59
88
9793
49
38
24
97
63
13
86
0
20
40
60
80
100
Type of instrument
Ava
ilabi
lity
(%)
Availability of data 2002-2003compared to 2001-2002
0
20
40
60
80
100
Type of instrument
Ava
ilabi
lity
(%)
2002-2003
2001-2002
National Institute for Coastal and Marine Management/RIKZ
Report on field measurements Petten Sea defense storm season 2002-2003 17
Figure 3.1 shows that data availability for the majority of instruments ranges from 85% to 98%. Several instruments however appear to have a relatively low availability percentage: • 021 directional waverider (58%): The buoy broke loose on
27 October 2002 and consequently did not generate any output for nearly two months. After the buoy was repositioned, it operated well for several days, after which the signal increasingly faded away. Due to repairs the buoy then again did not function for a longer period of time.
• 163 pressure sensor (13%): This sensor was severely damaged
during the storm at the end of October, after which it no longer generated any output.
• 181 pressure sensor (59%): Operation of this sensor was
problematic throughout the season, and caused frequent breakdowns.
• 221 barometer (63%): Due to repairs abroad, this instrument did
not generate any output for the first three months of the storm season.
• 071/072 pressure sensors (49%/38%): At low water the water
level drops below the pressure sensors, which causes an interruption of data registration for over half of the storm season.
• 081 pressure sensor (24%): Over two thirds of the storm season
the water level drops below the pressure sensor, which results in an interruption of data registration.
The availability of measuring values over the previous storm season turned out to be unacceptably low. Availability over storm season 2002-2003 required a considerable increase. The objective included in the project plan [Jacobse, 2002], was to obtain an average registration percentage of 80. Daily online checks of data collection (via the internet) and the availability of a back-up power unit, lead to a substantial increase in registration percentage. At an average of 80%, the objective was achieved. By decreasing the chance of instrument breakdowns, an even higher registration percentage is feasible for future projects. First of all an inventory needs to be made to this purpose of all possible breakdown mechanisms with their chance of occurring.

National Institute for Coastal and Marine Management/RIKZ
18 Report on field measurements Petten Sea defense storm season 2002-2003
3.1.2 Storm Data Availability One of the factors influencing the reliability of the hydraulic boundary conditions, is the reliability of the wave model used. Wave data of the storms which occurred, are essential for testing and where necessary improving the reliability of a wave model, such as the SWAN model. Furthermore good wave run-up data are of major importance for testing and designing dike heights. Illustration of storm data availability over storm season 2002-2003, first required a selection of all storm hours within this season. A storm is defined to this purpose as the situation with wind speeds exceeding 15 m/s, which corresponds with approx. 7 to 8 Beaufort. The selection is based on the wind measurements (average per hour) carried out near IJmuiden (IJmuiden semaphore) for the Royal Dutch Meteorological Institute (KNMI). The total storm duration of this dataset is calculated at 66 hours. For the equipment used at the Petten field site, the storm data availability over these 66 hours is illustrated in the bar graph of figure 3.3 below. This graph shows the storm data availability for sensors 081, 071 and 072 as shaded bars. These instruments are located on the dike and stand clear at low water levels. This distorts the equipment’s performance. As the capacitance wire and the ASMIV sea bed staff were not placed until halfway into the storm season, no storm data availability is given for these instruments.
. . . . . . . . . . . . . . . . . . . . . . . . . . . Figure 3.3 Storm Data
Availability over Storm Season 2002-2003
������������������������������������������������������������
������������������������������������������������������������
��������������������������������������������������
Availability of stormdatastormseason 2002-2003
77
57
100
89
69 69
100
91
6669
98 100
8178
61
100
48
15
95
0
20
40
60
80
100
Type of instrument
Ava
ilabi
lity
(%)

National Institute for Coastal and Marine Management/RIKZ
Report on field measurements Petten Sea defense storm season 2002-2003 19
One of the conclusions which can be drawn from figure 3.3, is that nearly all equipment actually functioned during all 66 storm hours. Even pressure sensors 071, 072 and 081, which are positioned on the dike and stand clear at low water levels, still give a high output percentage. Other instruments show a relatively low availability of storm data. Due to a defect of pressure sensor 163, for example, this instrument was available for no more than 15% of the total storm duration. Given the fact that the barometer did not commence transmission until mid December, the storm data availability percentage for this instrument is relatively low as well. In comparison with preceding storm season 2001-2002, the storm data availability has improved considerably (see figure 3.4 below). During this preceding storm season, the data collection equipment broke down quite frequently and for unnecessarily long periods of time. This problem had been solved for storm season 2002-2003, also thanks to the availability of a back-up power unit on site and the more alert response (online checks) to any malfunction and defects.
. . . . . . . . . . . . . . . . . . . . . . . . . . . Figure 3.4 Comparison of Storm
Data Availability 2002-2003 and 2001-2002
Availability of stormdata 2002-2003compared to 2001-2002
0
20
40
60
80
100
Type of instrument
Ava
ilabi
lity
(%)
2002-2003
2001-2002

National Institute for Coastal and Marine Management/RIKZ
20 Report on field measurements Petten Sea defense storm season 2002-2003
3.2 Data Reliability
Where possible this paragraph indicates the data reliability of the various field site instruments. Reliability in this context is defined as the credibility of the measuring technique under field site circumstances. The main factors of reliability are the measuring circumstances (wave breaking, currents, etc.), which are briefly discussed below for every measuring instrument: • Directional Waverider
The directional waverider is a generally accepted instrument for wave measurements at deeper water. The criterion for using this buoy is the absence of wave breaking in the measuring area. As the Petten site meets this criterion (at MPs 1 and 2), it may be assumed that the measuring data generated by the directional waveriders installed, are reliable (with the exception of the wave direction and the directional distribution in the case of long waves, over 30 seconds/ < 0,03 Hz).
• Digital Level Meter (DLM) The DLM is a generally accepted instrument for measuring water levels and is applied on a large scale throughout the national water level network MSW. The standard deviation for the full set-up (ie DLM in a subdued water level tube) is 2.5 centimetres. The DLM positioned at MP 3 is part of the national measuring network (Petten South). These measuring data can be said to be very reliable.
• Pressure Sensor
It may be said that the pressure sensors provide a virtually exact pressure measurement. There are doubts, however, about the accuracy of the process which translates the pressures measured into water level deviations, because it is not quite clear how for example the sensor distance to the water surface, the sensor distance to the sea bed, the water salinity, flow and sediment transport actually influence this process. The reliability of the final measurement results (water level deviations) generated by the pressure sensors has lately been a topic of discussion. Research into possible distorting influences such as flow, salinity and sediment transport is strongly recommended. Measurements in the past have shown that a number of sensors apparently offset long periods under water. As it turned out during the previous measuring season, this shifting offset occurs for pressure sensors which automatically compensate the atmospheric pressure. The pressure sensors which measure the hydrostatic pressure without this offset feature, seem to have a better performance.

National Institute for Coastal and Marine Management/RIKZ
Report on field measurements Petten Sea defense storm season 2002-2003 21
• Radar Level Meter The radar level meter at MP 3 (033) is a new type of radar level meter which last year appeared to be having teething problems. This Enraf 973 radar level meter was therefore evaluated at Measuring Post Noordwijk. The objective of this project was to arrive at an improved instrument, with a clear indication of its measuring performance and areas of application. The final result is expected before the end of 2003. The result will enable a pronouncement on the data reliability of radar level meter 033 at MP 3. The radar level meter at MP 6 is an old type: the Enraf 873. In principle, this type of radar level meter was approved for measuring waves at deep water (evaluation took place over 1997/1998 at Measuring Post Noordwijk). At the Petten field site, however, the sensor is applied differently, as MP 6 is positioned in the surf zone. As yet it is not suitable to apply the algorithm for determining surface deviations to wave breaking: It causes the sensor hardware to generate radar signals of long, high waves (approx. triple the average wave length) when it reads wave breaking. ITH estimates that it will take at least a year before a more reliable radar becomes available. Figure 3.5 below compares the differences in signals generated by measuring instruments 062 (pressure sensor) and 063 (radar level meter). This figure clearly shows the differences in wave heights as measured by instruments 062 and 063, as well as a phase shift in measurements. A possible explanation of this phase shift of 2 seconds is the more shoreward position of the radar level meter (mounted on a distance keeper attached to the measuring post), which results in the radar level meter taking more shoreward and consequently later measurements than the pressure sensor. As referred to above, (part of) the explanation of the wave height differences measured by signals 062 and 063, could be for example the influence of current pressures on the pressure signal and that of spray on the radar signal. Research into the reliability of surf zone measurements shall include an analysis and assessment of both signals.

National Institute for Coastal and Marine Management/RIKZ
22 Report on field measurements Petten Sea defense storm season 2002-2003
. . . . . . . . . . . . . . . . . . . . . . . . . . . Figure 3.5 Comparison of
signals 062 and 063
• Current Velocity Meter The current velocity meter is positioned in the surf zone. It is not (yet) clear if the current data measured under turbulent circumstances are reliable.
• Anemometer/ Wind Vane The wind speeds measured at two different locations (MP 6 in front of the dike, and MP 3 behind the dike) are reasonably similar. The wind speeds however show a difference of 10-20°, which may result from different calibrations for both instruments. Contributing factor could be the changing wind directions due to the dike’s geometry and (at MP 13) the building of the Visitor Information Centre. A comparison of both signals indicates that the deviation clearly depends on the wind direction. The sharpest deviations are found for southern winds.
• Barometer
The reliability of the barometer measuring data depends on the instrument’s set-up. Wind can for example distort the signal. Generally speaking, however, it can be said that the data provided by the barometer are reliable.
• ASMIV Sea Bed Staff
The measuring principle of the ASMIV sea bed staff is that of optic measurement of water turbidity. The instrument’s first results read, showed a clear distinction between water and sea bed. The results turned out to correspond closely with the simultaneous and accurate bottom height measurements. Considering the fact that this is a fairly simple measuring principle and that the measuring values closely correspond with the bottom height measurements, the conclusion was drawn that the ASMIV measuring data are very reliable. This summer a procedure will be started for this sensor to

National Institute for Coastal and Marine Management/RIKZ
Report on field measurements Petten Sea defense storm season 2002-2003 23
be included in the National Equipment Stock (LIB). An indication for potential shall be drawn up in August, and an evaluation shall be carried out in consultation with the Meetkundige Dienst.
• Capacitance Wire Considering the simplicity of the instrument’s measuring principle, the water level variations measured are reliable provided the wire is sufficiently taut. The problem of a capacitance wire is that it slackens or even breaks in particular under storm conditions. It is essential that very regular checks (maintenance) are carried out to obtain reliable measurements. The bottom end of the wire is positioned at approx. 0.20 metre below Dutch reference level NAP, which means that measurements at low water are not accurate.

National Institute for Coastal and Marine Management/RIKZ
24 Report on field measurements Petten Sea defense storm season 2002-2003

National Institute for Coastal and Marine Management/RIKZ
Report on field measurements Petten Sea defense storm season 2002-2003 25
4 Processing of Measuring Season . . . . . .. . . . . . . . . . . . . . . . . . . . . . . . . . . . . . . . . . . . . . . . . . . . . . . . . . . . . . . . . . . . . . . . . . . . . . . . . . .
This chapter describes the characteristics of storm season 2002-2003. In a brief analysis, particular attention is paid to the low frequency energy measured, being the long waves. On the basis of the wind speeds and water levels measured, this chapter selects an interesting storm period, which is discussed in further detail in chapter 5. To conclude, this chapter describes data processing by means of Fortran software and Waves2000, as well as data storage. 4.1 Wind, Wave and Current Characteristics
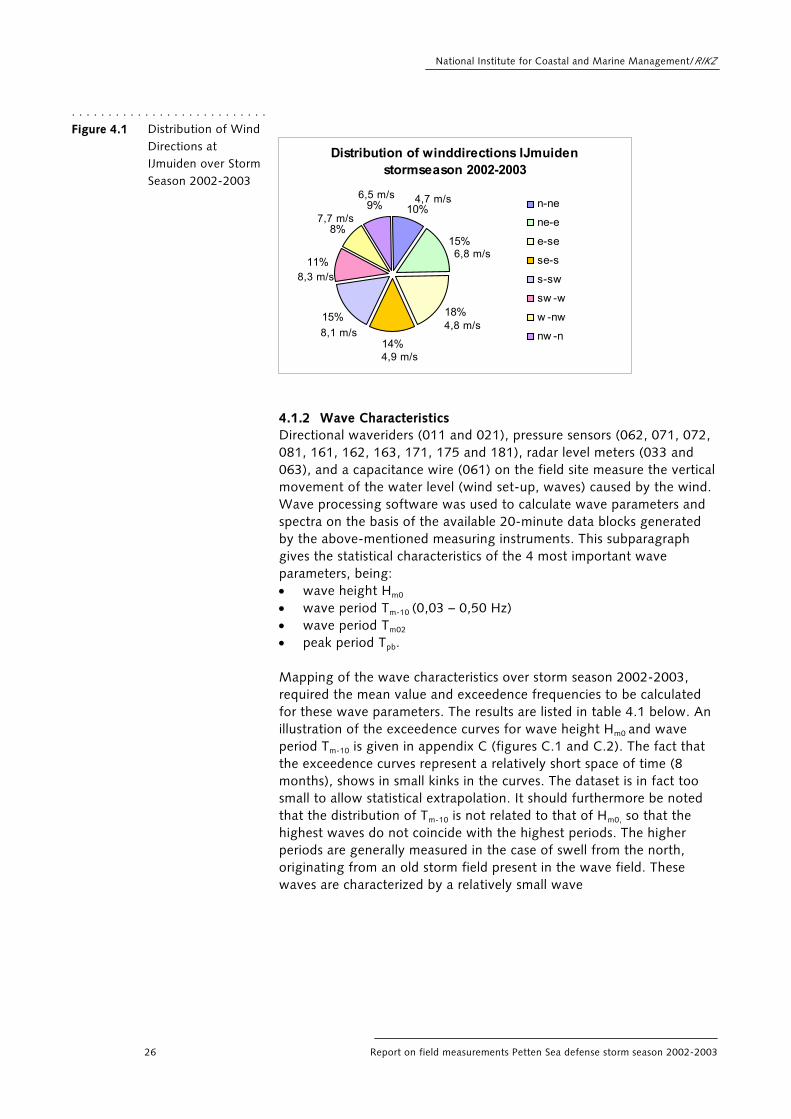
4.1.1 Wind Characteristics The wind directions and wind speeds are measured on the field site at MP 6 (in front of the dike) and MP 13 (behind the crest of the dike). A comparison of measuring values generated by these instruments shows that there is a slight difference in both wind speeds and wind directions measured. As indicated in chapter 3, an explanation of the differences in wind directions measured by MP 6 and MP 13, can be the different calibrations of both instruments. The dike’s geometry also influences the wind direction to some extent, so that the direction at MP 13 (behind the crest of the dike) possibly somewhat differs from the wind direction at MP 6 (in front of the dike). An explanation for the sometimes fairly considerable differences in wind speed, can be the wind meter positions: at sea (MP 6) the wind speeds are generally higher than ashore (MP 13). In view of the different measuring signals and the fact that the wind is not measured at the exact height of 10 metres (ie the standard height), the decision was made to describe the wind characteristics over storm season 2002-2003 on the basis of the data (average per hour) measured at IJmuiden on behalf of the Royal Dutch Meteorological Institute (KNMI)4. Measurement of these data was in fact carried out at the standard height of 10 metres. Distribution of the various wind directions over storm season 2002-2003 are summarized by the circle graph in figure 4.1 below, including the average wind speed per wind direction.
4 Data can be found on the internet: www.knmi.nl/samenw/hydra
National Institute for Coastal and Marine Management/RIKZ
26 Report on field measurements Petten Sea defense storm season 2002-2003
. . . . . . . . . . . . . . . . . . . . . . . . . . . Figure 4.1 Distribution of Wind
Directions at IJmuiden over Storm Season 2002-2003
4.1.2 Wave Characteristics Directional waveriders (011 and 021), pressure sensors (062, 071, 072, 081, 161, 162, 163, 171, 175 and 181), radar level meters (033 and 063), and a capacitance wire (061) on the field site measure the vertical movement of the water level (wind set-up, waves) caused by the wind. Wave processing software was used to calculate wave parameters and spectra on the basis of the available 20-minute data blocks generated by the above-mentioned measuring instruments. This subparagraph gives the statistical characteristics of the 4 most important wave parameters, being: • wave height Hm0 • wave period Tm-10 (0,03 – 0,50 Hz) • wave period Tm02 • peak period Tpb. Mapping of the wave characteristics over storm season 2002-2003, required the mean value and exceedence frequencies to be calculated for these wave parameters. The results are listed in table 4.1 below. An illustration of the exceedence curves for wave height Hm0 and wave period Tm-10 is given in appendix C (figures C.1 and C.2). The fact that the exceedence curves represent a relatively short space of time (8 months), shows in small kinks in the curves. The dataset is in fact too small to allow statistical extrapolation. It should furthermore be noted that the distribution of Tm-10 is not related to that of Hm0, so that the highest waves do not coincide with the highest periods. The higher periods are generally measured in the case of swell from the north, originating from an old storm field present in the wave field. These waves are characterized by a relatively small wave
Distribution of winddirections IJmuidenstormseason 2002-2003
15%
18%
14%
15%
11%
8%
9% 10% n-ne
ne-e
e-se
se-s
s-sw
sw -w
w -nw
nw -n
4,7 m/s
6,8 m/s
8,1 m/s 4,8 m/s
4,9 m/s
8,3 m/s
7,7 m/s
6,5 m/s

National Institute for Coastal and Marine Management/RIKZ
Report on field measurements Petten Sea defense storm season 2002-2003 27
height. Swell data need to be extracted to gain an understanding of the wind wave characteristics over season 2002-2003. An illustration is given in appendix C for pressure sensor 162 (figure C.3). The top figure in this appendix shows all 20-minute values of period Tm-10 compared with the related Hm0 values. The resulting scatter shows a clear distinction between swell (low Hm0, high Tm-10) and wind waves (low Hm0, low Tm-10). The bottom figure of this appendix gives the exceedence curves for the combination of wind waves including swell, and for wind waves after separating swell.
. . . . . . . . . . . . . . . . . . . . . . . . . . .
Measuring Instrument Parameter
0
11
02
1
03
3
16
1
16
2
16
3
17
1
17
5
18
1
06
1
06
2
06
3
07
1
07
2
08
1
gem 0.98 0.78 0.99 0.61 0.67 0.87 0.54 0.60 0.60 0.52 0.59 0.42 0.54 0.58 0.48
0.1% 4.85 4.65 4.84 2.91 3.21 3.54 2.03 2.48 2.75 1.68 2.30 1.71 2.02 2.07 1.65
1% 3.48 3.08 3.51 2.31 2.44 2.70 1.75 2.07 2.11 1.50 1.81 1.33 1.45 1.51 1.40
5% 2.45 2.13 2.37 1.60 1.77 1.90 1.31 1.56 1.57 1.24 1.47 1.00 1.10 1.16 1.02
Table 4.1 Wave Characteris-tics over Storm Season 2002-2003
Hm0
[m]
10% 1.93 1.62 1.91 1.24 1.40 1.53 1.12 1.30 1.24 1.05 1.14 0.80 0.92 1.00 0.82
gem 5.4 5.3 5.3 6.7 6.7 6.5 6.5 6.7 6.8 6.5 6.5 8.1 6.8 6.6 8.4
0.1% 11.2 10.1 10.6 14.6 14.7 10.7 14.0 13.2 11.8 14.1 13.4 14.9 12.1 11.5 12.5
1% 8.8 8.5 8.7 11.9 12.0 9.5 11.3 11.0 10.1 11.6 11.4 13.0 10.7 10.2 11.6
5% 7.6 7.5 7.4 9.5 9.5 8.5 9.1 8.9 8.9 9.6 9.2 11.3 9.4 9.2 10.5
Tm-10
[sec]
10% 6.9 6.9 6.8 8.7 8.7 7.8 8.4 8.3 8.3 8.6 8.3 10.4 8.7 8.5 9.8
gem 4.2 4.1 4.1 5.4 5.4 5.4 5.5 5.5 5.3 4.6 4.6 5.6 4.8 4.7 5.7
0.1% 8.3 7.4 7.4 9.8 9.9 9.1 9.2 8.0 8.0 7.9 7.9 9.7 7.8 7.5 8.0
1% 6.8 6.3 6.1 8.0 8.0 7.6 7.9 7.4 7.5 6.7 6.8 8.2 7.1 6.9 7.3
5% 5.9 5.6 5.3 7.0 7.0 6.8 7.0 6.8 6.8 6.0 6.0 7.3 6.2 6.1 6.8
Tm02
[sec]
10% 5.5 5.2 4.9 6.5 6.5 6.4 6.6 6.4 6.3 5.5 5.5 6.9 5.7 5.6 6.5
gem 6.0 5.9 6.2 7.5 7.5 7.1 7.3 7.4 7.3 7.9 8.0 8.9 8.3 8.0 8.7
0.1% 19.6 16.0 19.6 19.8 19.8 16.3 21.1 21.0 17.1 21.0 19.6 20.3 16.2 14.5 19.8
1% 14.8 14.2 14.2 16.5 16.5 12.6 16.2 16.3 14.4 17.4 16.5 17.4 14.0 13.2 15.6
5% 10.0 10.7 10.9 12.9 13.0 10.8 12.1 12.7 11.7 13.7 13.7 14.2 12.7 12.2 13.4
Tpb
[sec]
10% 8.7 9.4 9.7 11.0 11.1 9.9 10.7 10.9 10.9 11.8 11.9 12.9 12.0 11.6 12.1

National Institute for Coastal and Marine Management/RIKZ
28 Report on field measurements Petten Sea defense storm season 2002-2003
With reference to table 4.1, please note the following: • The table clearly shows a decrease in wave height towards the
coastline (in the table from left to right). • For the peak period (Tpb) it lists a number of very high and
unrealistic values. This period measure is heavily influenced by the noise in the spectrum (random peaks), and contrary to Tm-10 it is not a stable parameter.
• Period Tm-10 does not decrease towards the dike, but actually increases! This increase is the result of long wave generating.
• Tm02 is much less sensitive to (the increase of) low frequency energy and is virtually constant towards the dike.
• During rough periods the buoy at MP 2 broke down quite frequently, and therefore on average measured waves with a relatively smaller height. This immediately shows in the exceedence curves for Hm0. Due to long-term failure, also pressure sensor 163 gives deviating values for its exceedence frequencies.
• As referred to in chapter 3 above, the radar picked up shorter wave lengths at MP 6 than the pressure sensor did. This clearly shows in the Hm0 values. Radar 063 furthermore systematically and erroneously registers long waves, which results in higher Tm-10
values. • The pressure sensors 161 and 162 are similar, but sensor 163
produces deviating values and is most likely unreliable. 4.1.3 Current Velocity Measurements At MP 17 the current velocities were measured in 3 orthogonal directions by means of three instruments, being 172, 173 and 174. In theory the orbital motions can also be used to determine the propagation of long waves. Although the tidal current was determined, it was not included in the present processing (figure 4.2 below). This figure enables clear recognition of the current velocities ranging from approx. –0.5 m/s and approx. 0.8 m/s under calm weather conditions. In the case of storm, the strong wind heavily influences the current velocities in shallow water (see figure 4.2 over 25-28 October 2002).

National Institute for Coastal and Marine Management/RIKZ
Report on field measurements Petten Sea defense storm season 2002-2003 29
. . . . . . . . . . . . . . . . . . . . . . . . . . Figure 4.2 Current Velocity
Petten (Time in Days, October 2002)
4.2 Long Waves
4.2.1 General At the Petten field site, long waves are measured mostly during storms, where a distinction can be made between two types of long waves: swell waves, which originate from a storm field elsewhere, and long waves generated locally. The cause of this local generating is the interaction between shorter waves and wave breaking in shallow water. Due to their very long periods, the waves do not run up against the dike, but cause reflection which in turn leads to a temporary water surface elevation. These elevations allow the shorter waves to run up higher against the dike. This paragraph gives an analysis of the low frequency energy (LFE) measured to gain an understanding of the relative share of the long waves, being the low frequency energy as part of the total energy in the wave spectrum. 4.2.2 Choice of Equipment One way of measuring long waves is by means of pressure sensors and radar level meters. As mentioned in chapter 3, the reliability of the pressure sensors applied in particular (as well as the reliability of the radar level meters) has lately been a topic of discussion. First a (general) reliability check was carried out for the various pressure sensors and radar level meters, to decide whether or not the instruments’ signals could be included in the LFE analysis. To begin with, every pressure sensor’s wave signal

National Institute for Coastal and Marine Management/RIKZ
30 Report on field measurements Petten Sea defense storm season 2002-2003
that was calculated on the basis of the pressure signal, was averaged into 10-minute blocks, which produced the variations of water level changes. The same averaging was carried out for the radar level meters. For every instrument the resulting 10-minute water levels of 27 October 2002 (storm day) were then compared with the water levels produced by the digital level meter at MP 3 (see appendix D.1). In the most reliable case, the trend line through this scatter would have a directional coefficient of 1. Please note that the directional coefficient, being dependent on the distance between the particular instrument and the digital level meter, can be somewhat influenced by wind driven set-up. Based on the results in appendix D.1, a number of instruments was selected for the LFE analysis: radar 033 and pressure sensors 175, 181, 062 and 071. As the radar at MP 6 (063) systematically and wrongly generated long waves, this instrument is not further discussed. Pressure sensor 081 is positioned higher onto the dike and stands clear at low water (see kink in the scatter, appendix D.1), so that this instrument was also excluded from the LFE analysis. 4.2.3 Definition of Low Frequency Energy An analysis of the low frequency energy (LFE) first required the calculation of LFE wave spectra. The high frequency energy was therefore filtered out by twice calculating the running mean of the wave signal over 8.8 seconds. By twice calculating the running mean over 256 seconds, the very low frequencies (tide and seiches) were furthermore filtered out. The remaining data constitute the LFE spectrum, ie the long waves. The 15-minute spectra were averaged over 90-minute time blocks to arrive at a spectrum with fewer peaks. Figure 4.3 below gives an example of the spectra obtained after filtering out the high and very low frequencies, and shows the filter characteristic applied. Several characteristic wave parameters were then calculated by means of the LFE spectra: • Hm0_TOT: wave height Hm0 of the total wave spectrum • Hm0_LFE: wave height Hm0 of the filtered LFE spectrum • Tm-10_LFE: wave height Tm-10 of the filtered LFE spectrum

National Institute for Coastal and Marine Management/RIKZ
Report on field measurements Petten Sea defense storm season 2002-2003 31
. . . . . . . . . . . . . . . . . . . . . . . . . . . Figure 4.3 Example of LFE
spectra and filter characteristic
4.2.4 Low Frequency Energy Analysis To gain an understanding of the relative share of LFE in the energy of the total spectrum (appendix D.2), an analysis was made of both a storm period (27-28 October 2002, see paragraph 4.4) and a very calm day with (seaward) eastern wind (13 October 2002). The variations of the above-mentioned wave parameters were plotted for space (from deeper water towards the dike) and time. Developments through Time Appendices D.3 and D.4 give graphs with the developments through time of parameters Hm0_TOT, Hm0_LFE and Tm-10_LFE for three instruments: radar 033 and pressure sensors 175 and 062. This concerns the storm days 27-28 October 2002 as well as the calmer day of 13 October 2002. Apart from the figures illustrating wave heights and periods, the appendices include figures showing the ratio between wave heights Hm0_LFE and Hm0_TOT. This ratio is a measure for the relative share of long waves in the total wave height. The square of the wave length ratio is a measure for the relative share of long waves in the spectre’s total wave energy. The above-mentioned appendices clearly indicate that on the Petten field site LFE is measured both on a stormy day such as 27 October 2002 and on a calm day such as 13 October 2002. On 13 October the Hm0_LFE is no more than 0.04 metre but this is a relative share of 10% to 20% in wave height, and of 1% to 4% in the

National Institute for Coastal and Marine Management/RIKZ
32 Report on field measurements Petten Sea defense storm season 2002-2003
wave energy. It turns out that under storm conditions the low frequency wave height Hm0_LFE increases considerably (on 27 October to approx. 0.60 metre). Local generating of long waves causes this increase. On 27 October the relative share of long waves compared to the total spectrum is approx. 10% ((Hm0_LFE/ Hm0_TOT)
2 = 0.30 * 0.30) .
Spatial Variations Appendices D.5 and D.6 give the spatial variations of parameters Hm0_TOT, Hm0_LFE and Tm-10_LFE for three different points in time (just before, at and after the peak of the storm). These points in time were selected on the basis of the figures giving the developments through time of the wave parameters in the above-mentioned appendices. Furthermore a random point in time on the calm day of 13 October 2002 was included in the appendix. These figures indicate that during the storm the wave height calculated from the total spectrum shows a sharp decrease towards the coastline, whereas the wave height calculated from the LFE spectrum is virtually constant towards the coastline. In addition a minor increase in wave period occurs between MPs 18 and 6, which is an indication of long wave generating, caused by wave breaking in the intermediate shallow area. As for 13 October, a minor increase occurs in wave height Hm0_TOT, from MP 18 towards the dike, which is caused by shoaling. 4.2.5 Conclusions • At the Petten field site, long waves are measured under both calm
and stormy conditions. On 13 October 2002, a calm day with a seaward wind and short waves at a height of approx. 0.40 metre at MP 3, the relative share of long waves in the total spectrum’s energy amounts 1% to 4%. The wave height for the filtered low frequency part of the spectrum is approx. 0.04 m.
• Under storm conditions, the relative share of low frequency energy
increases as a result of local generating of long waves. On 27 October, a storm day with waves up to approx. 5.5 metres at MP 3, values are measured up to approx. 0.60 metre for wave height Hm0_LFE. With their long periods (Tm-10 is approx. 75 sec), these long waves do not run up against the dike, but result in a temporary water surface elevation of approx. 0.30 m. The relative share of long waves in the total spectrum’s energy is approx. 10%.

National Institute for Coastal and Marine Management/RIKZ
Report on field measurements Petten Sea defense storm season 2002-2003 33
4.3 Morphological Measurements
Natural processes such as currents and waves lead to sediment transport which in turn results in constant changing of the cross shore profile at the Petten Sea Defence. As the cross shore profile has a direct influence on wave height, it is essential to monitor the bottom topography changes as part of wave measurements. During storm season 2002-2003, the sea bed was drawn up several times by means of sounding and groyne section measurements. It is important to know the maximum erosion depth during a storm, as this defines the maximum wave height. From the beginning of November 2002, the bottom topography is therefore measured continuously (3 times per 20 minutes) by means of an ASMIV sea bed staff near MP 6 in the surf zone to be able to define this maximum depth. No gales occurred since November, however, so that no interesting results could be collected and no further description of the ASMIV is given. 4.3.1 Soundings The soundings were carried out for 9 Jarkus sections over 5 groyne sections, being Jarkus section 20,830 (corresponding with the measuring section) as well as 4 sections north and 4 sections south of the measuring section. The soundings were carried out on the following dates: • 6 August 2002 • 30 September 2002 • 5 November 2002 • 18 December 2002 • 3 March 2003 • 8 May 2003 • 17 June 2003 Two soundings for Jarkus section 20,830 (corresponding with the measuring section) are given in figure 4.4 to illustrate the cross shore profile at the Petten Sea Defence. This figure shows that the cross shore profile at the Petten Sea Defence is subject to change in particular closer to the coastline. An account of all sounding results is digitally available in ASCII format (see paragraph 4.5.4).

National Institute for Coastal and Marine Management/RIKZ
34 Report on field measurements Petten Sea defense storm season 2002-2003
. . . . . . . . . . . . . . . . . . . . . . . . . . . Figure 4.4 Soundings Jarkus
section 20,830
4.3.2 Groyne Section Measurements The groyne section measurements were carried out for 7 parallel sections in between the field site groynes, where the distance between the sections measured approx. 15 metres. A running measurement was taken of the sea bed level either by means of a ‘Total Station’ up to 100 to 150 metres from the crest of the dike, or it was measured further seaward by means of the ‘WESP’. The groyne section measurements were carried out on the following dates: • 2 October 2002 (Total station) • 15 November 2002 (WESP) • 6 February 2003 (WESP) • 4 March 2003 (Total station) Figure 4.5 illustrates the results of the central section (section 20,830, corresponding with the measuring section). It clearly indicates that the bottom topography near the dike shows strong fluctuations during the storm season. The reading of 2 October gives a typical summer profile with a large quantity of sand at the toe of the dike. It follows from a comparison of the first three recordings that the sea bed near the dike was subject to severe erosion. This erosion was most likely caused during a gale at the end of October 2002 (see paragraph 4.4). During the calmer months early 2003, sand deposit was gradually transported into the profile, which raised the sea bed. The observation is made that figure 4.5 gives a mere random picture of a constantly changing process.
Cross shore profile 20.830 (depth sounding)
-16
-14
-12
-10
-8
-6
-4
-2
0
0 1000 2000 3000 4000
Distance with respect to the crest of the dike [m]
Elev
atio
n [m
]
30-Sep
08-May

National Institute for Coastal and Marine Management/RIKZ
Report on field measurements Petten Sea defense storm season 2002-2003 35
. . . . . . . . . . . . . . . . . . . . . . . . . . . Figure 4.5 Results of groyne
section measurements Jarkus section 20,830
The bottom topography changes need to be considered not just in two dimensions (single section) but in three dimensions (interpolated over all 7 sections) to get a picture of – and to understand – the bottom topography changes within a groyne section. The data required for 3D processing (results from sections 20,785, 20,800, 20,815, 20,830, 20,845, 20,860 and 20,875) are digitally available in ASCII format (X, Y, Z) (see paragraph 4.5.4). 4.4 Storm Period Selection
4.4.1 General Storms measured are hind cast to enable quantification of the SWAN wave model reliability for storm conditions. The first criterion used for selecting periods which can produce interesting hind casts, is wind speed (> 15/s). The related water levels which occurred, were included as well: storms at high water levels (from Dutch reference level NAP +1.80 m) can be very interesting for the analysis of the correlation between waves near the dike, wave run-up and wave overtopping. The combination of data availability, strong wind and high water provides interesting periods for, for example, hind casting by means of the SWAN wave model and for wave run-up analyses.
Cross shore profile 20.830 (depth sounding between the groynes)
-4
-3
-2
-1
0
1
2
3
4
40 50 60 70 80 90 100 110 120 130 140 150
Distance with respect to the crest of the dike [m]
Elev
atio
n [m
]
02-Oct-02
15-Nov-02 (WESP)
06-Febr-03 (WESP)
04-Mar-03

National Institute for Coastal and Marine Management/RIKZ
36 Report on field measurements Petten Sea defense storm season 2002-2003
4.4.2 Storms Occurred The storms which occurred were selected on the basis of wind speeds measured. The selection of strong wind data, as described in subparagraph 3.1.2, is based on the average wind speeds per hour measured at IJmuiden on behalf of the Royal Dutch Meteorological Institute (KNMI). Table 4.2 lists the periods with wind speeds exceeding 15 m/s for at least several hours. It furthermore includes the mean values for wind speed and wind direction which are derived from the 10-minute (field site) measuring results.
. . . . . . . . . . . . . . . . . . . . . . . . . . .
Average Wind Speed
during Period u10
> 15m/s [m/s]
Average Wind Direction
during Period u10
> 15 m/s [nautical degr.]
Storm Period
No. of Hours
Wind Speed
> 15m/s
KNMI
IJmuiden
Meas. Pt.
(064)
KNMI
IJmuiden
Meas. Pt.
(064)
Table 4.2 Storm periods during storm season 2002-2003
26/10/02 12 16.7 18.3 259 255
27/10/02-
28/10/02
21 19.2 21.1 263 258
15/01/03 5 15.4 16.5 213 211
28/10/03 6 16.0 16.6 272 268
08/03/03 6 16.1 16.6 222 216
03/05/03 8 15.8 15.4 246 243
4.4.3 Water Levels Measured In addition to wind speed, wave height measured is another factor in determining to which extent a storm period is of interest. As the local water depth is a contributing factor in the maximum wave height, the highest waves are expected at higher water levels, which occur at a western to northwesterly storm during the high tide period. This type of storm can cause a significant wind driven set-up of the water level. The astronomical water levels and the actual water levels at Petten South (MP 3) taken from the Monitoring System Water (MSW) are both given in appendix E. This appendix shows that during one storm period only, ie 25-28 October 2002, the water levels measured exceeded 1.80 metres (figure 4.6 below). A detailed description of this storm period is given in chapter 5.

National Institute for Coastal and Marine Management/RIKZ
Report on field measurements Petten Sea defense storm season 2002-2003 37
. . . . . . . . . . . . . . . . . . . . . . . . . . . Figure 4.6 Water level and
astronomical tide 25-28 October 2002
4.5 Data Processing & Storage
4.5.1 General Wave data are generally collected in accordance with standard protocols and processed by a standard measuring system such as Measuring System North Sea of the Directorate North Sea, or measuring system ZEGE of Directorate Zeeland. These standard collection and processing procedures do not meet the processing levels required for specialized wave measurements such as those carried out near Petten. This type of measurements is usually processed by means of ‘ad hoc’ software. On the authority of the RIKZ, in 2002 the standard processing software programme Waves2002 was developed to streamline data processing and to improve the processing maintenance procedure. This programme was tested against measuring data from storm seasons 2001-2002 and 2002-2003. The present version of Waves2002 allows processing of separate days only, which would make processing of the full storm season very time-consuming and inefficient. The batch version will be developed in the second half of 2003, which will enable processing of longer periods of time without too much effort. The batch version shall eventually replace all ad hoc software used so far. As this batch version was not yet available, data processing of storm season 2002-2003 was carried out using ad hoc software. The processing methods applied by this software are identical to those of Waves2002, so that a visual check could be generated of the results obtained. This check was for example carried out for storm period 25-28 October 2002.
Waterlevel and astronomical tide DLM 032Oct 25 - 28, 2002
-1.0
-0.5
0.0
0.5
1.0
1.5
2.0
2.5
0 12 24 36 48 60 72 84 96Time [hours]
Leve
l [m
]
Waterlevel [m]Astr. Tide [m]

National Institute for Coastal and Marine Management/RIKZ
38 Report on field measurements Petten Sea defense storm season 2002-2003
4.5.2 Data Processing Processing and the eventual presentation of the measuring data in Waves2002, is done in 5 steps (figure 4.7). These steps enable the conversion of a raw measuring signal into a validated and if necessary repaired signal.
. . . . . . . . . . . . . . . . . . . . . . . . . . . Figure 4.7 Structure of
Waves2002
Pre-processing Pre-processing entails a general round of checks of the data read, which includes the deletion of for example major spikes and time errors (time data which are too fast or too slow) from the dataset. The signal is furthermore made equidistant in time, which means that the time differences between the measurements are given a constant value. The equidistant measuring data which have been checked and the processing reports are saved in various directories. Validation In the validation phase the signal is carefully checked after entry of the testing criteria (selected by the user), and any missing or rejected parts are automatically corrected. The signal is first checked for (smaller) spikes and then for stagnations in the signal. The validated signal, which can be used for wave analysis, and the processing reports are saved in various directories. Repair In the repair phase the user can, if required, manually repair or reject the validated signal. This type of data correction is very labour intensive and is therefore generally used for the analysis of very valuable storm periods only. This editing procedure is completed by saving the results in the designated directories, as is done for the previous phases. Analysis In the analysis phase, values are calculated with the validated (and if required repaired) measuring signals for a large number of characteristic descriptive parameters. A distinction is made to
Preprocessing Analysis Validation
Presentation
Repair

National Institute for Coastal and Marine Management/RIKZ
Report on field measurements Petten Sea defense storm season 2002-2003 39
this purpose between wave analysis (analysis of swell and wind waves) and low frequency analysis, ie the analysis of signals generated by complementary instruments such as barometer, DLM and anemometer. The low frequency analysis calculates 10-minute means of the relevant signals. Presentation This final phase enables the drawing of graphs and tables onto one or more sheets, depending on the output required. Reference is made to the Waves2002 user manual [Dekker et al, 2002] for a detailed description of the available options. 4.5.3 Software Settings The possibility to select for example the test type and testing criteria (in the validation and consequent phases) leaves room for the final measuring signal, which is validated and if required repaired by means of Waves2002, to be influenced by the programme user’s (subjective) judgement. This subparagraph therefore lists the settings as applied in the ad hoc software for data processing of storm season 2002-2003, in order to streamline data processing to some extent and to minimise the influence of (subjective) judgement on the final results. These settings shall in first instance also be applied in Waves2002 for processing of other storm seasons. Settings for Field Site, Instruments and Cross Shore Profile These settings depend on the field site set-up and can vary for every storm season and even within the storm season. No settings are consequently given. Validation Settings In the validation phase, any minor spikes of the data signal are deleted on the basis of the sigma/delta test with coefficient 4. For the stagnation criterion, a period of 6 seconds was set for wave signals and 12 seconds for current signals. No stagnation criterion was applied for slow signals such as atmospheric pressure, whereas a value of 2 seconds was set for the interpolation criterion. Reference is made to the Waves2002 user manual [Dekker et al, 2002] for further information on these criteria. Repair Phase Settings Processing of storm season 2002-2003 did not include repairs to signals. Any repairs of data gaps and the deletion of unreliable data for (future) processing of other storm season, are carried out on the basis of the Waves2002 user’s common sense. Analysis Phase Settings In the ad hoc software, a minimum quality of 90% was set for all instruments with respect to determining spectra and parameters. The directional correction value was set at –2. These values shall in first instance also be applied in Waves2002 for processing of other storms

National Institute for Coastal and Marine Management/RIKZ
40 Report on field measurements Petten Sea defense storm season 2002-2003
seasons. Reference is made to the Waves2002 user manual [Dekker et al, 2002] for background information on these settings. A value of 20 minutes was selected for the block length (ie the duration of the signal blocks to be analysed). This duration is long enough with respect to signal reliability, and short enough to be able to speak of a stationary signal within the block, which is generally the case for block lengths shorter than approx. 30 minutes. In the analysis the water level measured by the DLM (032) was used as a reference water level. 4.5.4 Data Storage Central Data Storage The (raw) measuring data produced by the Petten field site have so far been saved on CD-ROM. The data processed and the related processing reports are stored on a designated PC in room no. 8.12 at the RIKZ in The Hague, as well as on a network drive (Hrmeet_sbw5). All present and future Petten measuring data which are processed (including the data for storm season 2002-2003), as well as the data for other future field sites which are part of the HR-meet project, shall be stored on this drive. In future all important data shall furthermore be stored on DONAR/WADI. CD-ROM Data Storage Various data have been stored onto the CD-ROM enclosed with this report to improve data access for further analyses (such as SWAN hind casts): 1) Day Files (Validated at Signal Level): • batch files (gm files, rr files, g2 files, tm files and hm files) • gp files (parameters), gs files (spectra) en gd files (directional
spectra) • processing reports (results of general validation) 2) Storm Data: • raw data • processed data 3) Morphological Measurements: • soundings (ASCII format (X, Y, Z)) • groyne section measurements (ASCII format (X, Y, Z)) A document giving a description of the structure of the various files mentioned above is also added. The CD-ROM furthermore includes this storm season report in PDF format.

National Institute for Coastal and Marine Management/RIKZ
Report on field measurements Petten Sea defense storm season 2002-2003 41
5 Report on Storm Period 25-28 October 2002 . . . . . . . . . . . . . . . . . . . . . . . . . . . . . . . . . . . . . . . . . . . . . . . . . . . . . . . . . . . . . . . . . . . . . . . . . . . . . . . .
In chapter 4 a very interesting storm period was selected on the basis of wind speeds and actual water levels: the period from 25 up to and including 28 October 2002. The present chapter discusses this storm period in detail, not only by giving a general description of the storm conditions but also by paying attention to both wind and wave conditions. 5.1 Storm Conditions
On Sunday 27 October 2002, a storm depression passed from Ireland via the North Sea and Denmark to the Baltic Sea (figure 5.1). The central pressure was at its minimum when the depression passed north of the Netherlands: 973 hPa around 13:00 hours local time. Between 10:00 and 21:00 hours, the average 10-minute wind reached maximum values of 10 Beaufort at several locations in the western and later on the northern provinces of the Netherlands. In the early hours of the afternoon, several measuring points in the western coastal provinces measured an average 10-minute wind force 11, which constituted a gale. The highest average per hour wind speed was 28 m/s at Flushing (province of Zeeland) and at IJmuiden. By midnight the storm near the eastern Wadden Sea had subsided to wind force 9. Along the west coast, the wind had by then subsided to wind force 7.

National Institute for Coastal and Marine Management/RIKZ
42 Report on field measurements Petten Sea defense storm season 2002-2003
. . . . . . . . . . . . . . . . . . . . . . . . . . . . Figure 5.1: Atmospheric pressure 25 - 28 October 2002 [Source: Wetterzentrale Karlsruhe]
5.2 Wind Measurements
The wind directions and wind speeds were measured at MP 6 in front of the dike and at MP 13 behind the crest of the dike. Appendix F (figure F.1) gives the results (10-minutes means) as well as the values (averages per hour) measured on behalf of the Royal Dutch Meteorological Institute (KNMI). This appendix clearly shows that the wind directions measured near the field site are virtually identical to the IJmuiden values, whereas the wind speeds are slightly different. During the period 25-27 October, the wind direction varied between south and west. At 16:00 hours on 27 October the wind veered northwest, after which it stayed approx. 300˚ . There were strong wind speed fluctuations during the storm period. The maximum wind speed near the site was approx. 29 m/s, whereas IJmuiden registered a maximum wind speed of approx. 25 m/s.

National Institute for Coastal and Marine Management/RIKZ
Report on field measurements Petten Sea defense storm season 2002-2003 43
5.3 Water Level Measurements
The water levels measured by the digital level meter at MP 3 (Petten South) and the astronomical tide are given in figure 4.6 above. This figure shows that during the period 25-28 October 2002 (0–96 hours in figure 4.6), the wind driven set-up increased by over one metre on 26 October. After a gradual decrease, the wind driven set-up increased once again to a maximum value of approx. two metres on 28 October. The highest water level was approx. Dutch reference level NAP +2.10m. 5.4 Wave Measurements
For a number of points in time, the absolute (20-minute) spectra for several instruments are given to illustrate the energy density spectrum changes through time (see appendix 7, figures F.3-F.7). This appendix also includes the standardised spectra to gain an understanding of the changes in spectrum form through space (landward). The points of time were selected on the basis of the wind speeds and water levels measured: • 27 October 12:00 hours, several hours before the peak of the
storm • 27 October 16:00 hours, peak of the storm • 27 October 20:00 hours, maximum water level and north-
westerly wind • 27 October 23:20 hours, several hours after the peak of the
storm • 28 October 06:00 hours, end of the storm (wind speed
< 15 m/s) A remarkable conclusion which can be drawn from appendix F, is that the peaks of the spectra measured are relatively wide, which can be explained by the wind being south to south-westerly for a relatively long period of time and not veering round to the northwest until the end of the storm. The appendix furthermore shows that in the case of wave propagation towards the dike, energy is redistributed over both higher and lower frequencies. The redistribution to higher frequencies is caused by wave breaking, while the redistribution to the lower frequencies is caused by long wave generating. This generating even results in the energy density spectrum shifting to the left (see spectra of MP 6). To gain an understanding of the developments in wave height Hm0 and wave period Tm-10 during the storm period, appendix F (figure F.8) illustrates the variations of both parameters through time (per day). This concerns (in as far as possible) the same instruments as those for which spectra were constructed at an earlier stage (011, 021, 033, 161, 175 and 062). Figure F.8 shows that during the first two storm days, wave height reaches

National Institute for Coastal and Marine Management/RIKZ
44 Report on field measurements Petten Sea defense storm season 2002-2003
a maximum of over 5 metres at MP 1 on 26 October. The wave period increases from approx. 6-7 seconds to approx. 8 seconds. After a sharp decrease in wave height on 26 October, the wave height shows a sharp increase on 27 October to more than 6 metres at MP 1, and approx. 3 metres at MP 6. The wave period then measures over 10 seconds. After midnight the wave height and wave period gradually decrease. The observation is made with respect to figure F.8 that, contrary to the other instrument readings, wave period Tm-10 measured by the radar at MP 6 (063), shows strong fluctuations. It furthermore measures considerably higher periods. An explanation is that the radar at MP 6 continually measures (erroneously) long waves. As the low frequencies in particular are a major factor in the Tm-10 period, this systematic radar error leads to the registration of excessively high periods. Paragraph 3.2 above discusses the differences between the signals registered by the radar level meter and the pressure sensor at MP 6. This difference is clearly substantiates the wave height differences in figure F.8 5.5 Wave Run-Up Measurements
Wave run-up against the dike is measured by means of a run-up staff which is placed in the dike revetment. The bottom of this staff, measuring 8 metres in length, is located at 5.70 metres above Dutch reference level NAP. The water layer thickness is measured along the run-up staff by means of pressure sensors 101, 111 and 121, which are placed in the slope of the dike. During storm period 25-28 October 2002, the run-up was measured between 06:00 hours and 10:00 hours on 26 October, and between 18:00 hours and 24:00 hours on 27 October. The run-up staff data were of reasonably good quality on the first day, but of poor quality on the second day due to many spikes and preferential values. Only the lowest of all sensors (sensor 101) measured the thickness of the run-up water layer. The other sensors are located higher onto the slope, and stood clear. On 26 October some 30 low run-ups to approx. 6.10 metres above Dutch reference level NAP were measured. On 27 October many more as well as much higher run-ups to approx. 7 to 8 metres above NAP are measured. The validated run-ups and water layer thicknesses at the staff bottom are given in appendix F (Figure F.2).

National Institute for Coastal and Marine Management/RIKZ
Report on field measurements Petten Sea defense storm season 2002-2003 45
6 General Conclusions and Recommendations . . . . . . . . . . . . . . . . . . . . . . . . . . . . . . . . . . . . . . . . . . . . . . . . . . . . . . . . . . . . . . . . . . . . . . . . . . . . . . . .
This chapter draws the general conclusions with respect to field site performance and data reliability. It furthermore suggests possible steps for improving the field site’s shortcomings. Reference is made to Projectplan veldmetingen Pettemer zeewering 2003 [Jacobse, 2003] for a more detailed plan with the necessary points for improvement and the actions planned. There was a sharp improvement on data availability in comparison
with previous season. The minimum registration percentage of 80, which was an objective in the above-mentioned project plan, was achieved only just. An even higher registration percentage is feasible for the following seasons. In the short term, an inventory of the failing mechanisms and their chance of occurrence shall be given to this purpose. This inventory can be the basis for an efficient improvement of the field site’s solidity.
As it turned out, the results generated by the radar level meter and
the pressure sensor at MP 6 in the surf zone, showed such differences that they are unacceptable. The strong recommendation is therefore made to research the reliability of the present measuring techniques in the surf zone. An inventory needs to be made of the influences for example of sediment, of salinity and current onto the pressure signal, and of spray and wave breaking (incapsulated air) onto the radar signal. The desired measuring accuracy (for example for model input) needs to be determined. Such research can be the first step to achieving a method for measuring wave breaking.
The low frequency energy measured was analysed to gain an
understanding of the relative share of long waves in the total amount of spectrum energy. This analysis shows that long waves are measured even under calm circumstances. On 13 October 2002, a calm day with seaward wind, the relative share of long waves in the total spectrum energy was 1% to 4%. During storms, the relative share of the low frequency energy strongly increases as a result of local generating of long waves. On storm day 27 October 2002 the relative share of long waves in the total spectrum energy was approx. 10%.
It is strongly recommended that that a more detailed analysis of the measuring data is made to gain an understanding of the occurrence of long waves and of the extent to which these waves reflect against the dike. This could be an analysis of the current velocity measurements at MP 17. Model research with models such as
National Institute for Coastal and Marine Management/RIKZ
46 Report on field measurements Petten Sea defense storm season 2002-2003
Triton and Odiflocs is recommended to gain an understanding of the influence of long waves onto wave run-up and wave overtopping.

National Institute for Coastal and Marine Management/RIKZ
Report on field measurements Petten Sea defense storm season 2002-2003 47
References5 . . . . . . . . . . . . . . . . . . . . . . . . . . . . . . . . . . . . . . . . . . . . . . . . . . . . . . . . . . . . . . . . . . . . . . . . . . . . . . . .
Dekker, P.J., Foppen, T.; Kleissen, F.A.T.; Roskam A.P. Gebruikershandleiding Waves2002 Xi advies bv, report 3014.02.41.09 2002 Hordijk, D. Rapportage veldmetingen Pettemer Zeewering stormseizoen 2001-2002 RIKZ, work document RIKZ/OS-2003.101x February 2002 Jacobse, J.J. Projectplan veldmetingen Pettemer zeewering 2003 RIKZ, work document RIKZ/OS-2002.148x 2003 Roskam, A.P.; Hoekema J. Maandoverzicht Petten-metingen september 2002 t/m mei 2003 RIKZ, work documents RIKZ/OS-2003.124x-132x 2003 Roskam, A.P.; Hoekema J. Aanvullende gegevens ten behoeve van de verwerking van de Pettenmetingen, winter 2002-2003 RIKZ, work document RIKZ/OS-2003.133x 2003 Spelt, B. Pettemer Meetraai 2003, Plan van Aanpak Rijkswaterstaat Information Service Water, report 9705998 2003
5 The titles which are not translated into English, are available in Dutch only.

National Institute for Coastal and Marine Management/RIKZ
48 Report on field measurements Petten Sea defense storm season 2002-2003

National Institute for Coastal and Marine Management/RIKZ
Report on field measurements Petten Sea defense storm season 2002-2003 49
Bibliography Petten 1995-20036 . . . . . . . . . . . . . . . . . . . . . . . . . . . . . . . . . . . . . . . . . . . . . . . . . . . . . . . . . . . . . . . . . . . . . . . . . . . . . . . . . . . . . . . .
Andorka Gál, J.H. Verification Set Petten RIKZ, work document RIKZ/OS-96.137x July 1996 Andorka Gál, J.H. Case Studie Petten, Project Plan RIKZ, work document RIKZ/OS-94.128x 1994 Baak, M.A.X. van Strom Erosion Effects on Sea Dikes Delft University of Technology, dissertation October 2002 Boer, C.J.H. de The Calibration of the Numerical Wave Model SWAN Along the Petten Transect Delft University of Technology, dissertation August 1997 Bohnewald, C. Wave Height Calculation with Special Attention on the Profile Shape at the Petten and Hondsbossche Seawall[s] Delft University of Technology, dissertation August 1997 Dongeren, A.R.; Janssen, T.T. Analysis of Low Frequency Waves at Petten WL|Delft Hydraulics, report H3775 January 2001 Endt, M. van Omzetten data naar Petten 2000 format Svasek October 2001 Gent, M.R.A. van Wave Run-Up and Wave Overtopping for Double Peaked Wave Energy Spectra WL|Delft Hydraulics /Delft University of Technology, report H3351 January 1999
6 The titles which are not translated into English, are available in Dutch only.

National Institute for Coastal and Marine Management/RIKZ
50 Report on field measurements Petten Sea defense storm season 2002-2003
Groeneweg, J.; Doorn, N.; Vledder, G.Ph. van; Hurdle, D. Reliability of SWAN at the Petten Sea Defence WL|Delft Hydraulics & Alkyon, report H4197/A1044 June 2003 Hakkert, H. Metingen en meetgegevensverwerking RIKZ, work document February 1995 Hart, R. ‘t Golfoploop metingen Pettemer meetraai Road & Hydraulic Engineering Division, report DWW-2002-118 November 2002 Hart, R. ‘t Ontwerp kruinhoogte meetopstelling en vormgeving overslagbak Road & Hydraulic Engineering Division, report DWW-2002-134 December 2002 Holterman, S.R. Golfoploop op dijken met ondiep voorland Delft University of Technology, dissertation TUD-CT January 1998 Holterman, S.R. Golfoploophoogteberekeningen Pettemer zeewering RIKZ, work document RIKZ/OS-98.112x May 1998 Hordijk, D. Rapportage veldmetingen Pettemer zeewering stormseizoen 2001-2002 RIKZ, work document RIKZ/OS-2003.101x February 2003 Janssen, A. Golfoverslag Petten Directorate North Holland April 2002 Jacobse, J.J. Validatie van het SWAN-model voor de Pettemer zeewering RIKZ, work document RIKZ/OS-2000.150x December 2000 Jacobse, J.J.; Kieftenburg, A.T.M.M. Betrouwbaarheid SWAN RIKZ, work document RIKZ/OS-2002.116x November 2002

National Institute for Coastal and Marine Management/RIKZ
Report on field measurements Petten Sea defense storm season 2002-2003 51
Kamsteeg, A.T. Repairing Capawire Time Series with Pressure Sensor Data RIKZ, work document RIKZ/OS-97.108x 1997 Kruif, A.C. de Stormdata of the Petten Field Site 1995-2000 RIKZ, work document RIKZ/OS-2000.34x September 2000 Ruessink, B.G.; Rijks, D.C. Onderzoek naar lange golven in meetgegevens Petten Utrecht University September 1998 Tönis, I.E.; Veen, E.J. Onderzoek naar een minimumprofiel bij Petten RIKZ, work document RIKZ/OS-2001.113x May 2001 Verburgh, P.; Sijben, T.G.M.; Cox, H. Evaluatie van radarniveau- en golfhoogte-meters RIKZ, work document RIKZ/IT-98.040 November 1998 Vink, A.S. Transformation of Wave Spectra Across the Surf Zone Delft University of Technology, dissertation June 2001 Vogelzang, J; Jordans, R Golfmetingen met de mobiel radarcombinatie Measurement Information Service, report MD-GAR-2001-14 February 2001 Voortman, H.G.; Vriezekolk G.A.M. Hoge veiligheid voor lage landen, randvoorwaarden ontwerp Pettemer Zeewering RIKZ, work document RIKZ/OS-94.138x June 1994 Wolf, F.C.J. Analyse Meetseries Pettemer Meetraai Directorate North Holland 1998


National Institute for Coastal and Marine Management/RIKZ
Report on field measurements Petten Sea defense storm season 2002-2003
Appendix A Photographs of Instrument Set-Ups and Equipment
. . . . . . . . . . . . . . . . . . . . . . . . . . . . . . . . . . . . . . . . . . . . . . . . . . . . . . . . . . . . . . . . . . . . . . . . . . . . . . . . . . . . . . . .
List of photographs Photograph 1: MPs 1 and 2: directional waverider Photograph 2: MPs 6, 7 and 8: pressure sensors Photograph 3: MP 9: wave run-up staff with pressure sensor MP 11 to its left Photograph 4: MP 6: radar level meter Photograph 5: MP 17: Aquadopp current meter Photograph 6: MPs 10-12: pressure sensors MP 19: video cameras Photograph 7: MP 19: video cameras Photograph 8: MP 14: video camera Photograph 9: MPs 6, 17, 16, 3 resp.: set-ups near the dike Photograph 10: MP 6: capacitance wire mounted onto measuring post Photograph 11: MP 6: ASMIV sea bed staff Photograph 12: MP 6: ASMIV sea bed staff (sensors)


National Institute for Coastal and Marine Management/RIKZ
Report on field measurements Petten Sea defense storm season 2002-2003
. . . . . . . . . . . . . . . . . . . . . . . . . . . . Photograph
1
MP1 and MP2 directional waverider
. . . . . . . . . . . . . . . . . . . . . . . . . . . . Photograph
2
MP6, MP7 en MP8 pressure sensors

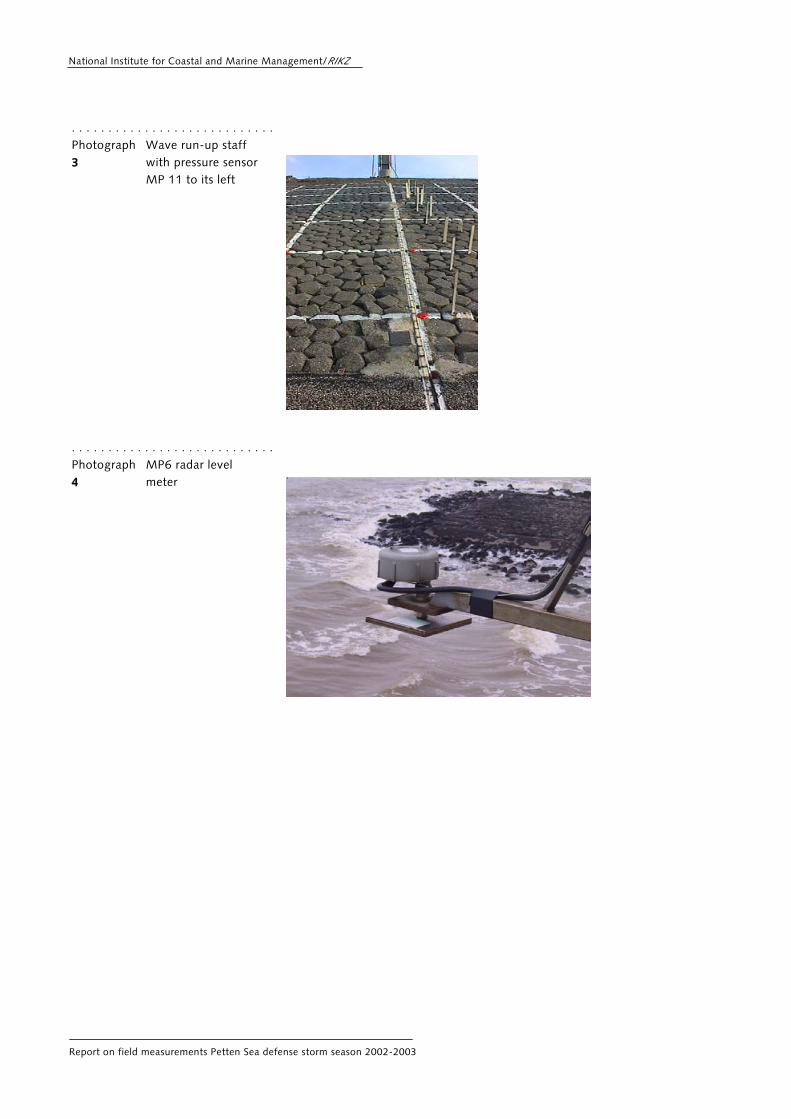
National Institute for Coastal and Marine Management/RIKZ
Report on field measurements Petten Sea defense storm season 2002-2003
. . . . . . . . . . . . . . . . . . . . . . . . . . . . Photograph
3
Wave run-up staff with pressure sensor MP 11 to its left
. . . . . . . . . . . . . . . . . . . . . . . . . . . . Photograph
4
MP6 radar level meter


National Institute for Coastal and Marine Management/RIKZ
Report on field measurements Petten Sea defense storm season 2002-2003
. . . . . . . . . . . . . . . . . . . . . . . . . . . . Photograph
5
MP17 Aquadopp current meter
. . . . . . . . . . . . . . . . . . . . . . . . . . . . Photograph
6
MP10 t/m 12 pressure sensors, MP19 videocameras


National Institute for Coastal and Marine Management/RIKZ
Report on field measurements Petten Sea defense storm season 2002-2003
. . . . . . . . . . . . . . . . . . . . . . . . . . . . Photograph
7
MP19 videocameras
. . . . . . . . . . . . . . . . . . . . . . . . . . . . Photograph
8
MP14 videocamera
. . . . . . . . . . . . . . . . . . . . . . . . . . . . Photograph
9
MPs 6, 17, 16, 3 resp.: set-ups near the dike


National Institute for Coastal and Marine Management/RIKZ
Report on field measurements Petten Sea defense storm season 2002-2003
. . . . . . . . . . . . . . . . . . . . . . . . . . . . Photograph
10
MP6 capacitance wire mounted onto measuring post
. . . . . . . . . . . . . . . . . . . . . . . . . . . . Photograph
11
MP6 ASMIV sea bed staff
. . . . . . . . . . . . . . . . . . . . . . . . . . . . Photograph
12
MP6 ASMIV sea bed staff


National Institute for Coastal and Marine Management/RIKZ
Report on field measurements Petten Sea defense storm season 2002-2003
Appendix B Data Availability over Storm Season 2002-2003
. . . . . . . . . . . . . . . . . . . . . . . . . . . . . . . . . . . . . . . . . . . . . . . . . . . . . . . . . . . . . . . . . . . . . . . . . . . . . . . . . . . . . . . .
List of figures Figure B.1 Data availability over September 2002 Figure B.2 Data availability over October 2002 Figure B.3 Data availability over November 2002 Figure B.4 Data availability over December 2002 Figure B.5 Data availability over January 2003 Figure B.6 Data availability over February 2003 Figure B.7 Data availability over March 2003 Figure B.8 Data availability over April 2003 Figure B.9 Data availability over May 2003


National Institute for Coastal and Marine Management/RIKZ
Report on field measurements Petten Sea defense storm season 2002-2003
. . . . . . . . . . . . . . . . . . . . . . . . . . . . Figure B.1 Data availability over
September 2002
. . . . . . . . . . . . . . . . . . . . . . . . . . . Figure B.2 Data availability over
October 2002


National Institute for Coastal and Marine Management/RIKZ
Report on field measurements Petten Sea defense storm season 2002-2003
. . . . . . . . . . . . . . . . . . . . . . . . . . . . Figure B.3 Data availability over
November 2002
. . . . . . . . . . . . . . . . . . . . . . . . . . . . Figure B.4 Data availability over
December 2002


National Institute for Coastal and Marine Management/RIKZ
Report on field measurements Petten Sea defense storm season 2002-2003
. . . . . . . . . . . . . . . . . . . . . . . . . . . . Figure B.5 Data availability over
January 2003
. . . . . . . . . . . . . . . . . . . . . . . . . . . . Figure B.6 Data availability over
February 2003


National Institute for Coastal and Marine Management/RIKZ
Report on field measurements Petten Sea defense storm season 2002-2003
. . . . . . . . . . . . . . . . . . . . . . . . . . . . Figure B.7 Data availability over
March 2003
. . . . . . . . . . . . . . . . . . . . . . . . . . . . Figure B.8 Data availability over
April 2003


National Institute for Coastal and Marine Management/RIKZ
Report on field measurements Petten Sea defense storm season 2002-2003
. . . . . . . . . . . . . . . . . . . . . . . . . . . . Figure B.9 Data availability over
May 2003


National Institute for Coastal and Marine Management/RIKZ
Report on field measurements Petten Sea defense storm season 2002-2003
Appendix C Exceedence Curves Hm0 en Tm-10 over Storm Season 2002-2003
. . . . . . . . . . . . . . . . . . . . . . . . . . . . . . . . . . . . . . . . . . . . . . . . . . . . . . . . . . . . . . . . . . . . . . . . . . . . . . . . . . . . . . . .
List of figures Figure C.1 Exceedence Curves Hm0 Figure C.2 Exceedence Curves Tm-10 Figure C.3 Swell for pressure sensor 162


National Institute for Coastal and Marine Management/RIKZ
Report on field measurements Petten Sea defense storm season 2002-2003
. . . . . . . . . . . . . . . . . . . . . . . . . . . . Figure C.1 Exceedence Curves
Hm0


National Institute for Coastal and Marine Management/RIKZ
Report on field measurements Petten Sea defense storm season 2002-2003
. . . . . . . . . . . . . . . . . . . . . . . . . . . . Figure C.2 Exceedence Curves
Tm-10


National Institute for Coastal and Marine Management/RIKZ
Report on field measurements Petten Sea defense storm season 2002-2003
. . . . . . . . . . . . . . . . . . . . . . . . . . . . Figure C.3 Swell for pressure
sensor 162


National Institute for Coastal and Marine Management/RIKZ
Report on field measurements Petten Sea defense storm season 2002-2003
Appendix D Long Wave Analysis Results
. . . . . . . . . . . . . . . . . . . . . . . . . . . . . . . . . . . . . . . . . . . . . . . . . . . . . . . . . . . . . . . . . . . . . . . . . . . . . . . . . . . . . . . .
list of figures Figure D.1 Water levels compared, 27 October 2002 Figure D.2 Total spectra 13, 27 and 28 October 2002 Figure D.3 Developments through Time 13 October 2002 Figure D.4 Developments through Time 27-28 October 2002 Figure D.5 Spatial variations 13 October 2002 Figure D.6 Spatial variations 27-28 October 2002


National Institute for Coastal and Marine Management/RIKZ
Report on field measurements Petten Sea defense storm season 2002-2003
. . . . . . . . . . . . . . . . . . . . . . . . . . . . Figure D.1 Water levels
compared 27 October 2002
Radar Level Meter 033 compared to Digital Level Meter 032 (Oct 27)
y = 1.0451x + 6.7926
-100
-50
0
50
100
150
200
250
-100 -50 0 50 100 150 200 250
Waterlevel DLM 032 [cm]
Wat
erle
vel R
LM 0
33 [c
m]
Pressure sensor 161 compared to Digital Level Meter 032 (Oct 27)
y = 0.8436x - 5.5836
-100
-50
0
50
100
150
200
250
-100 -50 0 50 100 150 200 250
Waterlevel DLM 032 [cm]
Wat
erle
vel p
ress
ure
sens
or 1
61 [c
m]
Pressure sensor 171 compared to Digital Level Meter 032 (Oct 27)
y = 0.8447x + 5.3237
-100
-50
0
50
100
150
200
250
-100 -50 0 50 100 150 200 250
Waterlevel DLM 032 [cm]
Wat
erle
vel p
ress
ure
sens
or 1
71 [c
m]


National Institute for Coastal and Marine Management/RIKZ
Report on field measurements Petten Sea defense storm season 2002-2003
Pressure sensor 175 compared to Digital Level Meter 032 (Oct 27)
y = 1.0435x - 7.9372
-100
-50
0
50
100
150
200
250
-100 -50 0 50 100 150 200 250
Waterlevel DLM 032 [cm]
Wat
erle
vel p
ress
ure
sens
or 1
75 [c
m]
Pressure sensor 181 compared to Digital Level Meter 032 (Oct 27)
y = 0.9953x - 3.426
-100
-50
0
50
100
150
200
250
-100 -50 0 50 100 150 200 250
Waterlevel DLM 032 [cm]
Wat
erle
vel p
ress
ure
sens
or 1
81 [c
m]
Pressure sensor 062 compared to Digital Level Meter 032 (Oct 27)
y = 1.0643x + 6.9964
-100
-50
0
50
100
150
200
250
-100 -50 0 50 100 150 200 250
Waterlevel DLM 032 [cm]
Wat
erle
vel p
ress
ure
sens
or 0
62 [c
m]


National Institute for Coastal and Marine Management/RIKZ
Report on field measurements Petten Sea defense storm season 2002-2003
Radar Level Meter 063 compared to Digital Level Meter 032 (Oct 27)
y = 1.0776x + 6.4081
-100
-50
0
50
100
150
200
250
-100 -50 0 50 100 150 200 250
Waterlevel DLM 032 [cm]
Wat
erle
vel r
adar
leve
l met
er 0
63 [c
m]
Pressure sensor 071 compared to Digital Level Meter 032 (Oct 27)
y = 1.0771x + 16.101
-100
-50
0
50
100
150
200
250
-100 -50 0 50 100 150 200 250
Waterlevel DLM 032 [cm]
Wat
erle
vel p
ress
ure
sens
or 0
71 [c
m]
Pressure sensor 072 compared to Digital Level Meter 032 (Oct 27)
y = 1.0632x + 18.872
-100
-50
0
50
100
150
200
250
-100 -50 0 50 100 150 200 250
Waterlevel DLM 032 [cm]
Wat
erle
vel p
ress
ure
sens
or 0
72 [c
m]


National Institute for Coastal and Marine Management/RIKZ
Report on field measurements Petten Sea defense storm season 2002-2003
Pressure sensor 081 compared to Digital Level Meter 032 (Oct 27)
y = 0.9733x + 30
-100
-50
0
50
100
150
200
250
-100 -50 0 50 100 150 200 250
Waterlevel DLM 032 [cm]
Wat
erle
vel p
ress
ure
sens
or 0
81 [c
m]


National Institute for Coastal and Marine Management/RIKZ
Report on field measurements Petten Sea defense storm season 2002-2003
. . . . . . . . . . . . . . . . . . . . . . . . . . . . Figure D.2 Total spectra
27 October 2002


National Institute for Coastal and Marine Management/RIKZ
Report on field measurements Petten Sea defense storm season 2002-2003


National Institute for Coastal and Marine Management/RIKZ
Report on field measurements Petten Sea defense storm season 2002-2003


National Institute for Coastal and Marine Management/RIKZ
Report on field measurements Petten Sea defense storm season 2002-2003


National Institute for Coastal and Marine Management/RIKZ
Report on field measurements Petten Sea defense storm season 2002-2003


National Institute for Coastal and Marine Management/RIKZ
Report on field measurements Petten Sea defense storm season 2002-2003


National Institute for Coastal and Marine Management/RIKZ
Report on field measurements Petten Sea defense storm season 2002-2003


National Institute for Coastal and Marine Management/RIKZ
Report on field measurements Petten Sea defense storm season 2002-2003


National Institute for Coastal and Marine Management/RIKZ
Report on field measurements Petten Sea defense storm season 2002-2003


National Institute for Coastal and Marine Management/RIKZ
Report on field measurements Petten Sea defense storm season 2002-2003
. . . . . . . . . . . . . . . . . . . . . . . . . . . . Figure D.3 Developments
through time 13 October 2002
Temporal variation of waveparameters (Oct 13)Digital Level Meter 033
0
30
60
90
120
150
180
0 4 8 12 16 20 24
Time [hours]
Wav
eper
iod
[sec
]
0.00
0.10
0.20
0.30
0.40
0.50
0.60
Wav
ehei
ght [
m]
Tm-10_LFE
Tm-10_TOT
Hm0_LFE
Hm0_TOT
Ratio of temporal variation Hm0 (Oct 13)Digital Level Meter 033
0.00
0.10
0.20
0.30
0.40
0.50
0.60
0 4 8 12 16 20 24
Time [hours]
Ratio
[-],
Wav
ehei
ght [
m]
Hm0_TOT
Hm0_LFE
Hm0_LFE/Hm0_TOT


National Institute for Coastal and Marine Management/RIKZ
Report on field measurements Petten Sea defense storm season 2002-2003
Temporal variation of waveparameters (Oct 13)Pressure sensor 175
0
30
60
90
120
150
180
Time [hours]
Wav
eper
iod
[sec
]
0.00
0.10
0.20
0.30
0.40
0.50
0.60
Wav
ehei
ght [
m]
Tm-10_LFE
Tm-10_TOT
Hm0_LFE
Hm0_TOT
Ratio of temporal variation Hm0 (Oct 13)Pressure sensor 175
0.00
0.10
0.20
0.30
0.40
0.50
0.60
0 4 8 12 16 20 24
Time [hours]
Ratio
[-],
Wav
ehei
ght [
m]
Hm0_TOT
Hm0_LFE
Hm0_LFE/Hm0_TOT


National Institute for Coastal and Marine Management/RIKZ
Report on field measurements Petten Sea defense storm season 2002-2003
Temporal variation of waveparameters (Oct 13)Pressure sensor 062
0
30
60
90
120
150
180
0 4 8 12 16 20 24
Time [hours]
Wav
eper
iod
[sec
]
0.00
0.10
0.20
0.30
0.40
0.50
0.60
Wav
ehei
ght [
m]
Tm-10_LFE
Tm-10_TOT
Hm0_LFE
Hm0_TOT
Ratio of temporal variation Hm0 (Oct 13)Pressure sensor 062
0.00
0.10
0.20
0.30
0.40
0.50
0.60
0 4 8 12 16 20 24
Time [hours]
Ratio
[-],
Wav
ehei
ght [
m]
Hm0_TOT
Hm0_LFE
Hm0_LFE/Hm0_TOT


National Institute for Coastal and Marine Management/RIKZ
Report on field measurements Petten Sea defense storm season 2002-2003
. . . . . . . . . . . . . . . . . . . . . . . . . . . . Figure D.4 Developments
through time 27-28 October 2002
Temporal variation of waveparameters (Oct 27-28)Digital Level Meter 033
0
25
50
75
100
125
150
0 4 8 12 16 20 24 28 32 36 40 44 48
Time [hours]
Wav
eper
iod
[sec
]
0.00
1.00
2.00
3.00
4.00
5.00
6.00
Wav
ehei
ght [
m]
Tm-10_LFE
Tm-10_TOT
Hm0_LFE
Hm0_TOT
Ratio of temporal variation Hm0 (Oct 27-28)Digital Level Meter 033
0.00
1.00
2.00
3.00
4.00
5.00
6.00
0 4 8 12 16 20 24 28 32 36 40 44 48
Time [hours]
Wav
ehei
ght [
m]
0.00
0.10
0.20
0.30
0.40
0.50
0.60
Ratio
[-]
Hm0_LFE
Hm0_TOT
Hm0_LFE/Hm0_TOT


National Institute for Coastal and Marine Management/RIKZ
Report on field measurements Petten Sea defense storm season 2002-2003
Temporal variation of waveparameters (Oct 27-28)Pressure sensor 175
0
25
50
75
100
125
150
0 4 8 12 16 20 24 28 32 36 40 44 48
Time [hours]
Wav
eper
iod
[sec
]
0.00
1.00
2.00
3.00
4.00
5.00
6.00
Wav
ehei
ght [
m]
Tm-10_LFE
Tm-10_TOT
Hm0_LFE
Hm0_TOT
Ratio of temporal variation Hm0 (Oct 27-28)Pressure sensor 175
0.00
1.00
2.00
3.00
4.00
5.00
6.00
0 4 8 12 16 20 24 28 32 36 40 44 48
Time [hours]
Wav
ehei
ght [
m]
0.00
0.10
0.20
0.30
0.40
0.50
0.60
Ratio
[-]
Hm0_LFE
Hm0_TOT
Hm0_LFE/Hm0_TOT


National Institute for Coastal and Marine Management/RIKZ
Report on field measurements Petten Sea defense storm season 2002-2003
Temporal variation of waveparameters (Oct 27-28)Pressure sensor 062
0
25
50
75
100
125
150
0 4 8 12 16 20 24 28 32 36 40 44 48
Time [hours]
Wav
eper
iod
[sec
]
0.00
1.00
2.00
3.00
4.00
5.00
6.00
Wav
ehei
ght [
m]
Tm-10_LFE
Tm-10_TOT
Hm0_LFE
Hm0_TOT
Ratio of temporal variation Hm0 (Oct 27-28)Pressure sensor 062
0
1
2
3
4
5
6
0 4 8 12 16 20 24 28 32 36 40 44 48
Time [hours]
Wav
ehei
ght [
m]
0.00
0.10
0.20
0.30
0.40
0.50
0.60
Ratio
[-]
Hm0_LFE
Hm0_TOT
Hm0_LFE/Hm0_TOT


National Institute for Coastal and Marine Management/RIKZ
Report on field measurements Petten Sea defense storm season 2002-2003
. . . . . . . . . . . . . . . . . . . . . . . . . . . Figure D.5 Spatial variations
13 October 2002
Spatial variation of waveparameters (Oct 13, 8:15 am)
0.00
0.10
0.20
0.30
0.40
0.50
0.60
Distance with respect to the crest of the dike [m]
Wav
ehei
ght [
m]
0
25
50
75
100
125
150
Wav
eper
iod
[sec
]
Hm0_LFE
Hm0_TOT
Tm-10_LFE
Cross-shore profile
-15
0
15
Distance with respect to the crest of the dike [m]El
evat
ion
[m]
MP
17
MP
3
MP
6
MP
18
MP
7


National Institute for Coastal and Marine Management/RIKZ
Report on field measurements Petten Sea defense storm season 2002-2003
. . . . . . . . . . . . . . . . . . . . . . . . . . . . Figure D.6 Spatial
variations 27-28 October 2002
Spatial variation of waveparameters (Oct 27, 5:15 am)
0.00
1.00
2.00
3.00
4.00
5.00
6.00
Distance with respect to the crest of the dike [m]
Wav
ehei
ght [
m]
0
25
50
75
100
125
150
Wav
eper
iod
[sec
]
Hm0_LFE
Hm0_TOT
Tm-10_LFE
Cross-shore profile
-15
0
15
Distance with respect to the crest of the dike [m]El
evat
ion
[m]
MP
17
MP
3
MP
6
MP
18
MP
7


National Institute for Coastal and Marine Management/RIKZ
Report on field measurements Petten Sea defense storm season 2002-2003
Spatial variation of waveparameters (Oct 27, 5:15 pm)
0.00
1.00
2.00
3.00
4.00
5.00
6.00
Distance w ith respect to the crest of the dike [m]
Wav
ehei
ght [
m]
0
25
50
75
100
125
150
Wav
eper
iod
[sec
]
Hm0_LFE
Hm0_TOT
Tm-10_LFE
Cross-shore profile
-15
0
15
Distance w ith respect to the crest of the dike [m]
Elev
atio
n [m
]
MP
17
MP
3
MP
6
MP
18
MP
7


National Institute for Coastal and Marine Management/RIKZ
Report on field measurements Petten Sea defense storm season 2002-2003
Spatial variation of waveparameters (Oct 28, 02:15 am)
0.00
1.00
2.00
3.00
4.00
5.00
6.00
Distance w ith respect to the crest of the dike [m]
Wav
ehei
ght [
m]
0
25
50
75
100
125
150
Wav
eper
iod
[sec
]
Hm0_LFE
Hm0_TOT
Tm-10_LFE
Cross-shore profile
-15
0
15
Distance w ith respect to the crest of the dike [m]El
evat
ion
[m]
MP
17
MP
3
MP
6
MP
18
MP
7


National Institute for Coastal and Marine Management/RIKZ
Report on field measurements Petten Sea defense storm season 2002-2003
Appendix E Water levels and astronomical Tide during Storm Periods
. . . . . . . . . . . . . . . . . . . . . . . . . . . . . . . . . . . . . . . . . . . . . . . . . . . . . . . . . . . . . . . . . . . . . . . . . . . . . . . . . . . . . . . .
Waterlevel and astronomical tide DLM 032
Oct 25 - 28, 2002
-1.0
-0.5
0.0
0.5
1.0
1.5
2.0
2.5
0 12 24 36 48 60 72 84 96Time [hours]
Leve
l [m
]
Waterlevel [m]Astr. Tide [m]
Waterlevel and astronomical tide DLM 032Jan 15, 2003
-1.0
-0.5
0.0
0.5
1.0
1.5
2.0
2.5
0 3 6 9 12 15 18 21 24Time [hours]
Leve
l [m
]
Waterlevel [m]Astr. Tide [m]
Waterlevel and astronomical tide DLM 032Jan 28, 2003
-1.0
-0.5
0.0
0.5
1.0
1.5
2.0
2.5
0 3 6 9 12 15 18 21 24Time [hours]
Leve
l [m
]
Waterlevel [m]Astr. Tide [m]

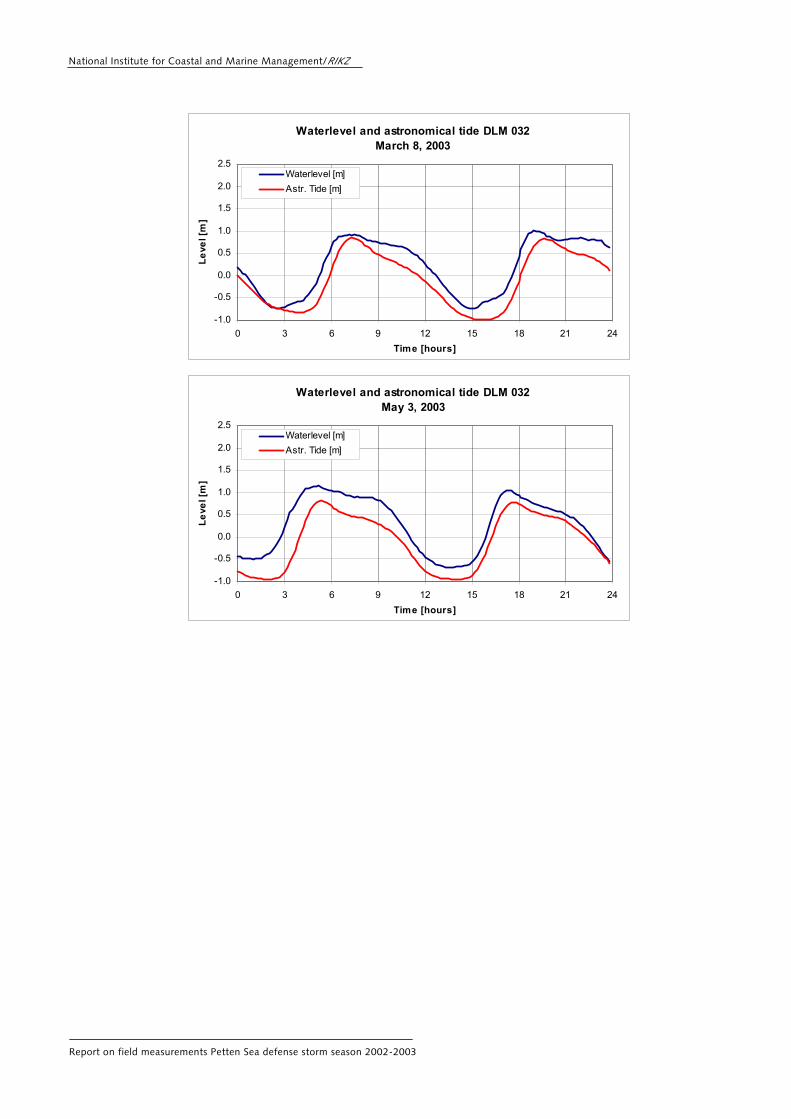
National Institute for Coastal and Marine Management/RIKZ
Report on field measurements Petten Sea defense storm season 2002-2003
Waterlevel and astronomical tide DLM 032March 8, 2003
-1.0
-0.5
0.0
0.5
1.0
1.5
2.0
2.5
0 3 6 9 12 15 18 21 24Time [hours]
Leve
l [m
]
Waterlevel [m]Astr. Tide [m]
Waterlevel and astronomical tide DLM 032May 3, 2003
-1.0
-0.5
0.0
0.5
1.0
1.5
2.0
2.5
0 3 6 9 12 15 18 21 24Time [hours]
Leve
l [m
]
Waterlevel [m]Astr. Tide [m]


National Institute for Coastal and Marine Management/RIKZ
Report on field measurements Petten Sea defense storm season 2002-2003
Appendix F Storm Period 25-28 October 2002
. . . . . . . . . . . . . . . . . . . . . . . . . . . . . . . . . . . . . . . . . . . . . . . . . . . . . . . . . . . . . . . . . . . . . . . . . . . . . . . . . . . . . . . .
List of figures Figure F.1 Wind direction and wind speed Figure F.2 Wave run-up en pressure level Figure F.3 Wave spectra 27 October 2002 (12am) Figure F.4 Wave spectra 27 October 2002 (4pm) Figure F.5 Wave spectra 27 October 2002 (8pm) Figure F.6 Wave spectra 27 October 2002 (11:50pm) Figure F.7 Wave spectra 28 October 2002 (6am) Figure F.8 Hm0 and Tm-10


National Institute for Coastal and Marine Management/RIKZ
Report on field measurements Petten Sea defense storm season 2002-2003
. . . . . . . . . . . . . . . . . . . . . . . . . . . . Figure F.1 Wind direction and
wind speed
Measured winddirection October 25-28, 2002
0
60
120
180
240
300
360
0 12 24 36 48 60 72 84 96
Time (hours)
Win
ddir
ectio
n [n
autic
al d
egre
es]
Winddirection Mp13Winddirection Mp6
Winddirection IJmuiden
Measured windspeed October 25-28, 2002
0
5
10
15
20
25
30
0 12 24 36 48 60 72 84 96
Time (hours)
Win
dspe
ed [m
/sec
]
Windspeed Mp13Windspeed Mp6Windspeed IJmuiden


National Institute for Coastal and Marine Management/RIKZ
Report on field measurements Petten Sea defense storm season 2002-2003
. . . . . . . . . . . . . . . . . . . . . . . . . . . . Figure F.2 Wave run-up and
pressure level


National Institute for Coastal and Marine Management/RIKZ
Report on field measurements Petten Sea defense storm season 2002-2003


National Institute for Coastal and Marine Management/RIKZ
Report on field measurements Petten Sea defense storm season 2002-2003


National Institute for Coastal and Marine Management/RIKZ
Report on field measurements Petten Sea defense storm season 2002-2003
. . . . . . . . . . . . . . . . . . . . . . . . . . . . Figure F.3 Wave spectra
27 October 2002 (12am)
Normalized wave spectra Oct 27, 2002 (12:00 am)
0.00
0.20
0.40
0.60
0.80
1.00
0.00 0.10 0.20 0.30 0.40 0.50 0.60
f [Hz]
E(f)
/E(f
)max
[-]
MP1 (011)
MP2 (021)
MP3 (033)MP16 (161)
MP17 (175)
MP6 (062)
W ave spectrum 011
O ct 27,2002 (12:00 am )
0
10
20
30
40
50
0.00 0.10 0.20 0.30 0.40 0.50
f [H z]
W ave spectrum 021
O ct 27,2002 (12:00 am )
0
10
20
30
40
50
0.00 0.10 0.20 0.30 0.40 0.50
f [H z]
W ave spectrum 033
O ct 27,2002 (12:00 am )
0
10
20
30
40
50
0.00 0.10 0.20 0.30 0.40 0.50
f [H z]
W ave spectrum 161
O ct 27,2002 (12:00 am )
0
1
2
3
4
5
0.00 0.10 0.20 0.30 0.40 0.50
f [H z]
W ave spectrum 175
O ct 27,2002 (12:00 am )
0
1
2
3
4
5
0.00 0.10 0.20 0.30 0.40 0.50
f [H z]
W ave spectrum 062
O ct 27,2002 (12:00 am )
0
1
2
3
4
5
0.00 0.10 0.20 0.30 0.40 0.50
f [H z]

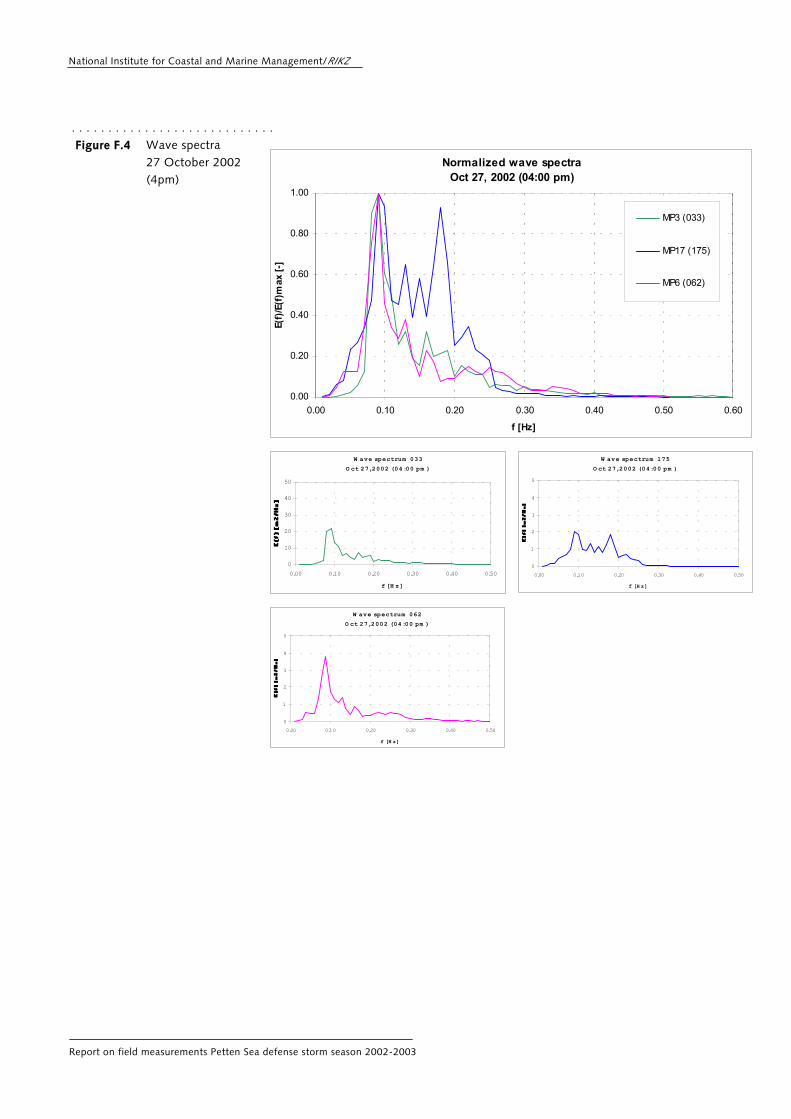
National Institute for Coastal and Marine Management/RIKZ
Report on field measurements Petten Sea defense storm season 2002-2003
. . . . . . . . . . . . . . . . . . . . . . . . . . . . Figure F.4 Wave spectra
27 October 2002 (4pm)
Normalized wave spectra Oct 27, 2002 (04:00 pm)
0.00
0.20
0.40
0.60
0.80
1.00
0.00 0.10 0.20 0.30 0.40 0.50 0.60
f [Hz]
E(f)
/E(f
)max
[-]
MP3 (033)
MP17 (175)
MP6 (062)
W ave spectrum 175
O ct 27,2002 (04:00 pm )
0
1
2
3
4
5
0.00 0.10 0.20 0.30 0.40 0.50
f [H z]
W ave spectrum 062
O ct 27,2002 (04:00 pm )
0
1
2
3
4
5
0.00 0.10 0.20 0.30 0.40 0.50
f [H z]
W ave spectrum 033
O ct 27,2002 (04:00 pm )
0
10
20
30
40
50
0.00 0.10 0.20 0.30 0.40 0.50
f [H z]


National Institute for Coastal and Marine Management/RIKZ
Report on field measurements Petten Sea defense storm season 2002-2003
. . . . . . . . . . . . . . . . . . . . . . . . . . . . Figure F.5 Wave spectra
27 October 2002 (8pm)
Normalized wave spectra Oct 27, 2002 (08:00 pm)
0.00
0.20
0.40
0.60
0.80
1.00
0.00 0.10 0.20 0.30 0.40 0.50 0.60
f [Hz]
E(f)
/E(f
)max
[-]
MP3 (033)
MP17 (175)
MP6 (062)
W ave spectrum 033
O ct 27,2002 (08:00 pm )
0
10
20
30
40
50
60
0.00 0.10 0.20 0.30 0.40 0.50
f [H z]
W ave spectrum 175
O ct 27,2002 (08:00 pm )
0
2
4
6
8
10
0.00 0.10 0.20 0.30 0.40 0.50
f [H z]
W ave spectrum 062
O ct 27,2002 (08:00 pm )
0
1
2
3
4
5
0.00 0.10 0.20 0.30 0.40 0.50
f [H z]

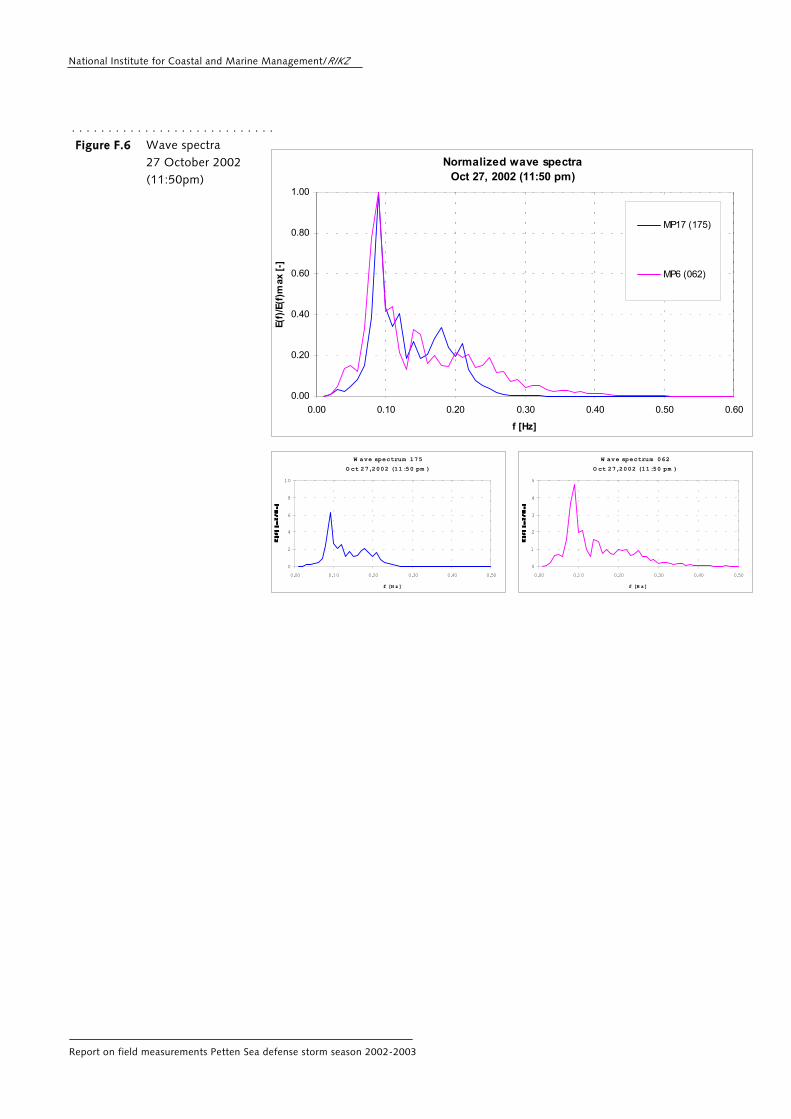
National Institute for Coastal and Marine Management/RIKZ
Report on field measurements Petten Sea defense storm season 2002-2003
. . . . . . . . . . . . . . . . . . . . . . . . . . . . Figure F.6 Wave spectra
27 October 2002 (11:50pm)
Normalized wave spectra Oct 27, 2002 (11:50 pm)
0.00
0.20
0.40
0.60
0.80
1.00
0.00 0.10 0.20 0.30 0.40 0.50 0.60
f [Hz]
E(f)
/E(f
)max
[-]
MP17 (175)
MP6 (062)
W ave spectrum 175
O ct 27,2002 (11:50 pm )
0
2
4
6
8
10
0.00 0.10 0.20 0.30 0.40 0.50
f [H z]
W ave spectrum 062
O ct 27,2002 (11:50 pm )
0
1
2
3
4
5
0.00 0.10 0.20 0.30 0.40 0.50
f [H z]


National Institute for Coastal and Marine Management/RIKZ
Report on field measurements Petten Sea defense storm season 2002-2003
. . . . . . . . . . . . . . . . . . . . . . . . . . . . Figure F.7 Wave spectra
28 October 2002 (6am)
Normalized wave spectra Oct 28, 2002 (06:00 am)
0.00
0.20
0.40
0.60
0.80
1.00
0.00 0.10 0.20 0.30 0.40 0.50 0.60
f [Hz]
E(f)
/E(f
)max
[-]
MP3 (033)
MP17 (175)
MP6 (062)
W ave spectrum 033
O ct 28,2002 (06:00 am )
0
4
8
12
16
20
0.00 0.10 0.20 0.30 0.40 0.50
f [H z]
W ave spectrum 175
O ct 28,2002 (06:00 am )
0
1
2
3
4
5
0.00 0.10 0.20 0.30 0.40 0.50
f [H z]
W ave spectrum 062
O ct 28,2002 (06:00 am )
0
1
2
3
4
5
0.00 0.10 0.20 0.30 0.40 0.50
f [H z]


National Institute for Coastal and Marine Management/RIKZ
Report on field measurements Petten Sea defense storm season 2002-2003
. . . . . . . . . . . . . . . . . . . . . . . . . . . . Figure F.8 Hm0 and Tm-10


National Institute for Coastal and Marine Management/RIKZ
Report on field measurements Petten Sea defense storm season 2002-2003


National Institute for Coastal and Marine Management/RIKZ
Report on field measurements Petten Sea defense storm season 2002-2003

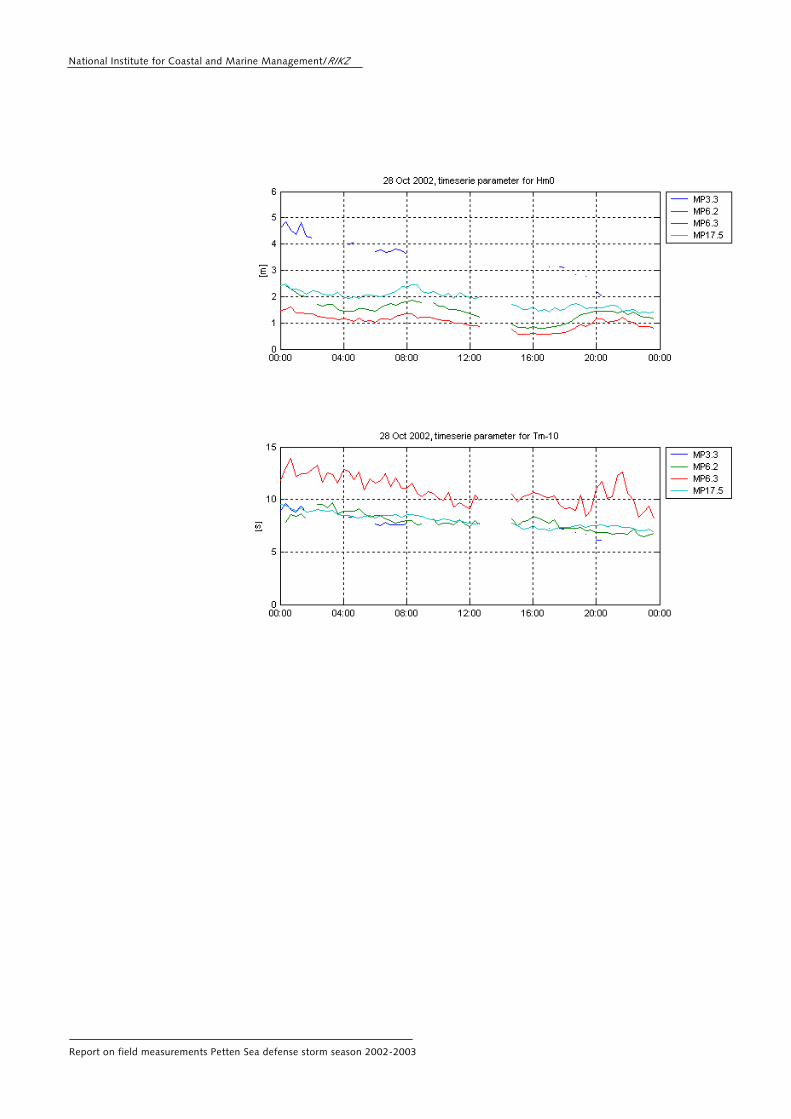
National Institute for Coastal and Marine Management/RIKZ
Report on field measurements Petten Sea defense storm season 2002-2003