report on economic issues - terena · report on economic issues november 2007 author: dai davies...
TRANSCRIPT

�
Report on Economic Issues
November 2007
Author: Dai Davies
�
ISBN 978-90-77559-12-3
Production: TERENA Secretariat Design: Stratford DesignPrinting: Noordhoek Offset b.v.
TERENA 2007 c All rights reservedParts of this report may be freely copied, unaltered, provided that the original source is acknowledged and copyright preserved.
The EARNEST foresight study was funded by the European Community through the GN2 project in the Sixth Framework Programme for Research and Technological Development. This publication does not represent the opinion of the European Community; the Community is not responsible for any use that might be made of data appearing in this publication.

�
Economic Issues > Contents
Contents 1. Executive Summary 5 2. Introduction 6
3. Analysis of costs of GÉANT2 9
4. The implications of fibre 13
5. Network cost structures 19
6. Lit fibre on expensive routes 23
7. Alternative approaches to infrastructure acquisition 26
8. Conclusions 27
9. References 29
10. Acronyms 30 Appendix 1 31

�

�
Economic Issues > Executive Summary
1. Executive SummaryThe EARNEST foresight study has looked at the expected development of research and education networking in Europe over the next 5-10 years. The study was carried out between March 2006 and November 2007. EARNEST was funded by the European Union through the GN2 project, which also provides the funding for the current generation of the pan-European research and education backbone network, GÉANT2.
The aim of EARNEST was to provide input for initiatives that could help to keep the evolution of European research networking at the forefront of worldwide developments and enhance the competitiveness of the European Research Area. EARNEST has prepared the ground for the planning of the development of research and education networking infrastructure and services after the completion of the GN2 project, at the local, national, European and intercontinental level.
EARNEST can be seen as the successor of the very successful study that was carried out in the SERENATE project in the period from May 2002 until December 2003. The results of the SERENATE study, and in particular the recommendations in its Summary Report, have been very influential on the planning and development of research and education networking in Europe in subsequent years.
After an initial preparatory phase, the EARNEST work has focused on seven study areas: researchers’ requirements, technical issues, campus issues, economic issues, geographic issues, organisation and governance issues, and requirements of users in schools, the healthcare sector and the arts, humanities and social sciences. Reports have been published on the results of each of these sub-studies, as well as an additional report on regulatory issues. The EARNEST study is rounded off by a Summary Report that contains recommendations for the relevant stakeholders.
The current report presents the findings of the study of economic issues. A detailed analysis of the underlying costs and cost structures of any activity is an important element in defining future strategy. The GÉANT2 network has changed a number of basic parameters of pan-European research networks. The GN2 project has invested in acquiring and lighting fibre over much, but not all, of the footprint of GÉANT2. It has implemented an enhanced portfolio, whereby – in contrast to the traditional best-efforts IP service – network resources can be dedicated to individual groups of users. This economic study looks at the GÉANT2 network and analyses its underlying cost structures. It draws comparisons with similar work carried out in the SERENATE study. Finally, it examines a number of cost trends, with particular reference to the relationship between these costs and their geographic distribution, and with particular consideration of the way in which funds are collected from National Research and Education Networking organisations (NRENs) to fund this common infrastructure.
�
Economic Issues > Introduction
2. IntroductionPeople only ever want to use networks. They are normally not interested in paying for them. Nevertheless, the pan-European backbone network GÉANT2 has an annualised cost of more than 40 million euro, and therefore its costs cannot be ignored and neither can, very importantly, the cost structures of pan-European networking. There obviously has to be some relationship between underlying costs and what NRENs pay for GÉANT2. An analysis of the costs of GÉANT2 is therefore essential to assist in the process of deciding about the way in which funds are collected from NRENs.
In 2003, the SERENATE study reported on the costs of the pan-European research network in an analysis based on data about the underlying costs of the GÉANT network at the time. A number of factors have changed since then. A new network, GÉANT2, has been procured. In contrast to its predecessor GÉANT, GÉANT2 includes a significant investment in acquiring fibre and the associated DWDM (Dense Wavelength Division Multiplexing) equipment. The current study, based on the results of the initial procurement for GÉANT2 and the associated costs of the GÉANT2 network, analyses cost structures related to the provision of services to the NRENs in Europe that are connected to this network. A schematic diagram of the GÉANT2 network is attached as Appendix 1.
From an economic point of view, and assuming that there is a competitive market supplying the network elements, telecommunications networks are characterised by having very high capital costs, relatively moderate operational costs and quite granular incremental costs. In this context, granular means that the changes in network capacity are not smooth; increases in capacities come in discrete ‘chunks’. There is no simple way to upgrade a connection from 10 Gb/s to 10.1 Gb/s. The most sensible increase would be to add a further 10-Gb/s link in parallel. For connections of lower speed, there is only a limited set of link capacities available. Thus the upgrade path from a 45-Mb/s link is to a 155-Mb/s link. Although there are some economies of scale, they are very dependent on technology. The upgrade from 45 Mb/s to 155 Mb/s provides more than three times the original capacity, typically for twice the costs. However, adding a second 10-Gb/s wavelength to an existing one will typically lead to an additional cost that is equivalent to the cost of the initial wavelength. Therefore, the cost of increasing capacity on a route is usually significant when compared with the costs of that route. Changes to costs also tend to be infrequent – a period of months or years – rather than short-run.
Three key cost categories need to be considered:
1. Transmission costs. These are the costs of circuits to interconnect the nodes on the GÉANT2 network as well as the costs of connections between Europe and other world regions. In GÉANT2, many of these are provided via fibre that has been acquired and lit by the GN2 project. Where this is the case, the investment in the DWDM transmission systems that are necessary to provide capacity is regarded as a hardware cost. However, there remain high-speed connections
(2.5 Gb/s and 10 Gb/s) that are leased from telecommunications operators as well as lower-speed connections for which leasing on an annual basis is the only practical way of implementation; typically, such connections incur hardware costs only for routing and switching (see category 2. below). GÉANT2 is the first generation1 of the pan-European research network based on fibre acquired and lit by the funding project. Historically, circuits have been leased from telecommunications service providers.
1 Since 1993 there have been five consecutive generations of the pan-European research backbone network: EuropaNET, TEN-34, TEN-155, GÉANT and GÉANT2.

�
Economic Issues > Introduction
Transmission costs for connections within Europe can be attributed to individual countries, and they can be analysed to constitute the basis of the cost of service provision to a particular country. There is a significant geographic element to these costs. The attribution of costs is analysed further in Chapter 3.
2. Hardware costs. These are the costs associated with the acquisition and ownership of the hardware that provides the network service to NRENs. They consist of the costs of routers and switches as well as DWDM transmission systems. They are generally based on a capital investment that is amortised over several years. Normally there is no geographic component to routing and switching costs. On a long-run basis, the costs vary as capacity is added to the network, but in general most of the costs of routers and switches as well as the investment in DWDM systems are incurred on installation. The costs of DWDM systems have a significant geographic component because these costs are dependent on the length of a DWDM route. This is analysed further in Chapter 4.
3. Operations costs. These are the costs associated with the day-to-day running of the network. They include the network operations functions, maintenance costs of equipment, and the planning and support of network development. Operations costs are generally relatively insensitive to network capacity, because they are characterised by a high fixed element that covers the provision of operations services and the maintenance of the hardware platforms. It is important to note that operations costs are directly related to the technology operated. In an IP (routing) environment it is tacitly assumed that expertise on IP operations is available. The operation of switching and DWDM systems requires technology-specific knowledge. This implies training costs for staff to acquire that knowledge as well as some additional staffing costs to maintain an appropriate pool of expertise.
For GÉANT2, the balance between these three cost categories is shown in Figure 2.1. Over the years, the cost of transmission, which used to be by far the dominant part of total costs, has declined relative to the other two categories, but for a given generation of network, the balance is quite stable over time.
Figure 2.1: GÉANT2 costs by category
In analysing network costs, transmission costs are the most significant from an economic point of view. This is because the cost of transmission is strongly related to the geography of the network. In addition, the cost of transmission, unlike that of routing, switching and network operations, reflects the competitiveness of the markets from which the connections are obtained. This means that transmission costs are by far the most ‘political’ of the cost categories. Because transmission
Transmission 58%
Hardware 20%
Operations 22%
�
Economic Issues > Introduction
costs have a strong influence on the cost of service provision to a given location, they relate to what people pay for the network service.
The SERENATE study analysed the distribution of these costs across Europe at that time and quantified the ‘digital divide’ that existed between different countries in Europe. In the EARNEST study of economic issues a new factor has emerged, namely the issue of access to fibre. The current report describes the structure and distribution of transmission costs and analyses the implications of this structure.

�
Economic Issues > Analysis of costs of GÉANT2
3. Analysis of costs of GÉANT2In contrast to the procurement of GÉANT, when only leased transmission capacity was acquired from telecommunications operators, the GÉANT2 procurement has focused on the direct acquisition of fibre as the basis for creating transmission capacity. An important factor here was the availability of international fibre routes in Europe. Leased capacity and acquired fibre are very different in terms of economic detail. Acquired fibre requires a corresponding investment in DWDM hardware and a long-term lease commitment for fibre. It is therefore a commitment for a much longer term (five years or more) than in the case of leased wavelengths, where the maximum commitment is typically for twelve months. The acquisition of fibre raises the particular issue of long-term funding. The length of the commitment to fibre has to be compared with the duration of project funding. If the duration of project funding is shorter than the period that is required to make a sensible investment case for fibre, then opportunities for saving money may not be realised. Nevertheless, the availability of leased fibre on a route, which allows the option of a directly owned transmission infrastructure, is an indicator of international competitiveness. It allows a very direct comparison of the different implementation options, i.e., leased wavelengths versus owned wavelengths.
A pan-European network procurement provides a very good opportunity to compare the costs of international connectivity across Europe. In the same way as the number of potential suppliers of leased wavelengths is an indicator for market competitiveness, so is the availability of leased fibre. This is an important indicator, because it enables comparisons of the competitiveness of such connectivity as well as of the relative cost of international connectivity to individual European countries.
The GÉANT2 procurement, which was carried out in 2005, differed from previous procurements because it invited and obtained offers for the provision of fibre-optic capacity as well as leased connectivity; the latter was what had been procured historically. In some ways, the availability of fibre-optic capacity on particular routes might be seen as indicating that these routes are more competitive, because fibre allows additional market entrants to compete. Figure 3.1 shows an analysis of international offers to individual countries in the GÉANT2 network, with a distinction between offers where fibre was an alternative and those where there were only offers of leased capacity.
The bars represent the number of offers of connectivity to a particular country. Where the bar is split, the lower part of the bar represents the number of offers of fibre capacity and the upper part the number of offers of leased capacity. Where there is no split in the bar, only leased capacity was offered.

�0
Economic Issues > Analysis of costs of GÉANT2
Figure 3.1: GÉANT2 procurement: number of offers per country by type of offer
In 2003, as part of the SERENATE study, an analysis was made of the distribution of the costs of leased connectivity in GÉANT compared with the number of potential suppliers. Figure 3.2 shows the relation between the number of suppliers and the relative cost of leased connectivity as it was analysed in 2001. It illustrates the huge variations in cost – a factor 40 between the most and the least expensive routes – as well as a strong correlation between the number of potential suppliers and cost effectiveness. This figure illustrates the digital divide that existed in Europe at that time.
Figure 3.2: GÉANT procurement (2001): cost of connectivity versus number of suppliers
numbers of offers of leased capacity numbers of fibre offers
MT CY GR LU IE IL EE LT LV PT TR HR BG SE SI RO ES PL IT HU SK CZ AT BE UK CH FR NL DE0
5
10
15
20
25
0
5
10
15
20
25
30
35
40
45
0 2 4 6 8 10 12 14
Relative cost of connectivity versus number of potential suppliers
��
Economic Issues > Analysis of costs of GÉANT2
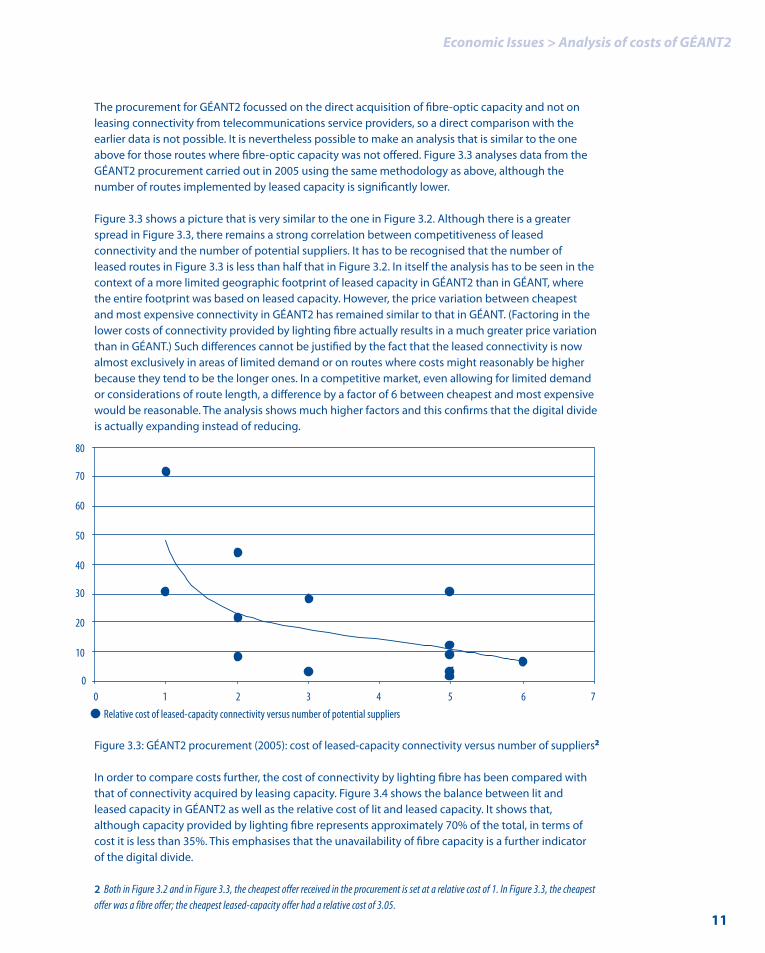
The procurement for GÉANT2 focussed on the direct acquisition of fibre-optic capacity and not on leasing connectivity from telecommunications service providers, so a direct comparison with the earlier data is not possible. It is nevertheless possible to make an analysis that is similar to the one above for those routes where fibre-optic capacity was not offered. Figure 3.3 analyses data from the GÉANT2 procurement carried out in 2005 using the same methodology as above, although the number of routes implemented by leased capacity is significantly lower.
Figure 3.3 shows a picture that is very similar to the one in Figure 3.2. Although there is a greater spread in Figure 3.3, there remains a strong correlation between competitiveness of leased connectivity and the number of potential suppliers. It has to be recognised that the number of leased routes in Figure 3.3 is less than half that in Figure 3.2. In itself the analysis has to be seen in the context of a more limited geographic footprint of leased capacity in GÉANT2 than in GÉANT, where the entire footprint was based on leased capacity. However, the price variation between cheapest and most expensive connectivity in GÉANT2 has remained similar to that in GÉANT. (Factoring in the lower costs of connectivity provided by lighting fibre actually results in a much greater price variation than in GÉANT.) Such differences cannot be justified by the fact that the leased connectivity is now almost exclusively in areas of limited demand or on routes where costs might reasonably be higher because they tend to be the longer ones. In a competitive market, even allowing for limited demand or considerations of route length, a difference by a factor of 6 between cheapest and most expensive would be reasonable. The analysis shows much higher factors and this confirms that the digital divide is actually expanding instead of reducing.
Figure 3.3: GÉANT2 procurement (2005): cost of leased-capacity connectivity versus number of suppliers2
In order to compare costs further, the cost of connectivity by lighting fibre has been compared with that of connectivity acquired by leasing capacity. Figure 3.4 shows the balance between lit and leased capacity in GÉANT2 as well as the relative cost of lit and leased capacity. It shows that, although capacity provided by lighting fibre represents approximately 70% of the total, in terms of cost it is less than 35%. This emphasises that the unavailability of fibre capacity is a further indicator of the digital divide.
numbers of offers of leased capacity numbers of fibre offers
MT CY GR LU IE IL EE LT LV PT TR HR BG SE SI RO ES PL IT HU SK CZ AT BE UK CH FR NL DE0
5
10
15
20
25
0
10
20
30
40
50
60
70
80
0 1 2 3 4 5 6 7Relative cost of leased-capacity connectivity versus number of potential suppliers
2 Both in Figure 3.2 and in Figure 3.3, the cheapest offer received in the procurement is set at a relative cost of 1. In Figure 3.3, the cheapest offer was a fibre offer; the cheapest leased-capacity offer had a relative cost of 3.05.
��
Economic Issues > Analysis of costs of GÉANT2
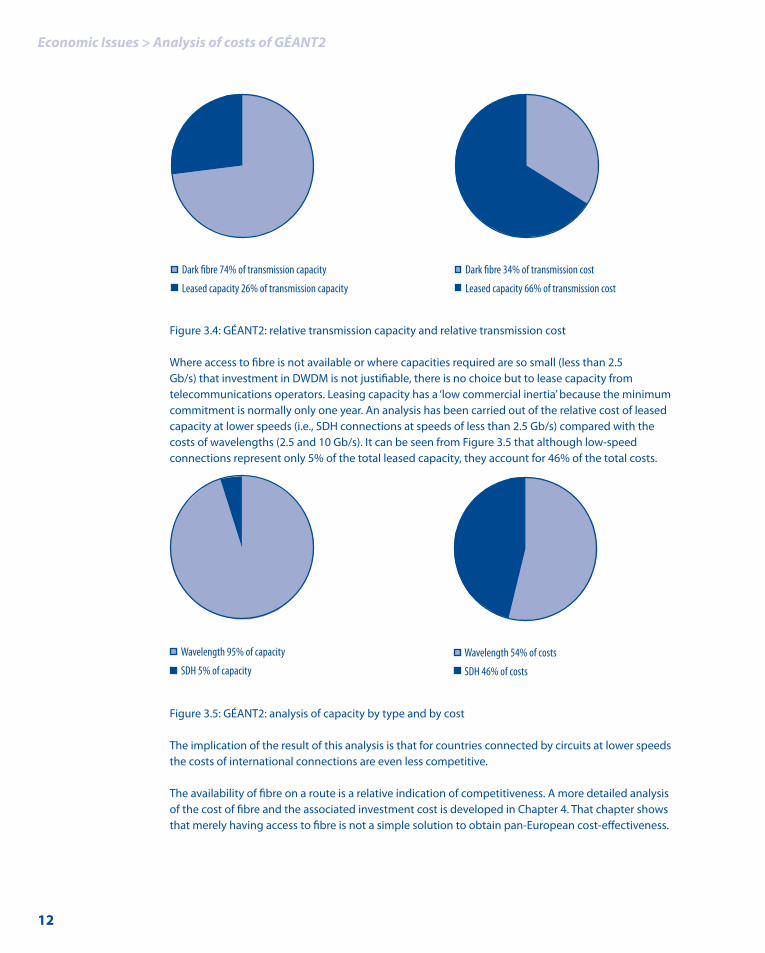
Figure 3.4: GÉANT2: relative transmission capacity and relative transmission cost
Where access to fibre is not available or where capacities required are so small (less than 2.5 Gb/s) that investment in DWDM is not justifiable, there is no choice but to lease capacity from telecommunications operators. Leasing capacity has a ‘low commercial inertia’ because the minimum commitment is normally only one year. An analysis has been carried out of the relative cost of leased capacity at lower speeds (i.e., SDH connections at speeds of less than 2.5 Gb/s) compared with the costs of wavelengths (2.5 and 10 Gb/s). It can be seen from Figure 3.5 that although low-speed connections represent only 5% of the total leased capacity, they account for 46% of the total costs.
Figure 3.5: GÉANT2: analysis of capacity by type and by cost
The implication of the result of this analysis is that for countries connected by circuits at lower speeds the costs of international connections are even less competitive.
The availability of fibre on a route is a relative indication of competitiveness. A more detailed analysis of the cost of fibre and the associated investment cost is developed in Chapter 4. That chapter shows that merely having access to fibre is not a simple solution to obtain pan-European cost-effectiveness.
Dark fibre 74% of transmission capacity
Leased capacity 26% of transmission capacity
Dark fibre 34% of transmission cost
Leased capacity 66% of transmission cost
Wavelength 95% of capacity
SDH 5% of capacity
Wavelength 54% of costs
SDH 46% of costs
Dark fibre 74% of transmission capacity
Leased capacity 26% of transmission capacity
Dark fibre 34% of transmission cost
Leased capacity 66% of transmission cost
Wavelength 95% of capacity
SDH 5% of capacity
Wavelength 54% of costs
SDH 46% of costs

��
Economic Issues > The implications of fibre
4. The implications of fibreThe major difference between GÉANT2 and previous generations of the pan-European research backbone network is that much of the transmission capacity in GÉANT2 is provided by acquiring fibre and deploying DWDM equipment to light it. The technology used by the GN2 project is not significantly different from that used by major telecommunications operators to provide leased wavelengths. That the approach adopted for GÉANT2 can make sense economically is therefore mainly due to the pricing policies that these operators have in respect of wavelengths. In general, it can make sense to invest in DWDM equipment, provided that long-term (ten years or more) cost-effective access to fibre can be obtained. Access to fibre and the costs of equipping fibre systems are therefore significant factors in the economic analysis of network costs. This is considered further below.
4.1 Cost structure of DWDM systems
It is obvious that the cost of building a fibre route is dependent on the length of that route. A very significant element of the cost will be the costs of the physical construction involved. The cost of the fibre cable will be directly dependent on the length of the route. But also the costs of the technology to equip and light a route are distance-dependent.
The relation between technology and route length is quite complicated. In general, the longer a route is, the greater the investment costs are, but the relation is not linear. In order to better understand the implications of underlying costs when implementing connectivity using lit fibre and DWDM equipment, it is necessary to look at the component elements of cost on a route. Figure 4.1 illustrates the basic elements of a DWDM system.
Regenerator spacing is circa 1000 km
Figure 4.1: DWDM components
A route is the basic structure implemented in DWDM technology. It consists of two end-stations (DWDM terminal equipment), where individual wavelengths are injected into and received from other end-stations. The fibre connects the two end-stations with each other. As the signal propagates through the route, it is attenuated by the fibre. The signal therefore needs to be amplified at regular intervals. These intervals are quite long (typically 80 km or more), and they do
DWDM TerminalEquipment
DWDM TerminalEquipmentSignal Regenerator
In-LineAmpli�ers
In-LineAmpli�ers

��
Economic Issues > The implications of fibre
not need to be completely uniform along the route. Amplification increases the strength of all the wavelengths passing along a fibre. The cost of amplification is therefore independent of the number of wavelengths on a particular route.
There is a limit to the number of times that an optical signal can be amplified, because each amplification also introduces noise. At some point the individual digital signals carried by the wavelength have to be regenerated. Regeneration consists of terminating the wavelength and recreating the digital signal that it contains in the next part of the route. Unlike amplification, regeneration is directly related to the number of wavelengths on the route, and therefore involves a ‘per-wavelength’ cost. In the GÉANT2 network there are currently only two routes where regeneration is necessary: Madrid-Geneva and Dublin-London. The incremental cost of adding wavelengths on these longer routes is therefore higher than on shorter routes3.
4.2 The competitiveness of fibre routes
In general, investment in ‘dark fibre’ is regarded as a good thing per se. The actual analysis is in fact rather more complicated. Nevertheless, there is considerable momentum behind NREN investment in fibre and the lighting of such fibre.
The costs of investments in DWDM equipment that is necessary for lighting fibre are significant and they need to be amortised over relatively long periods of time (typically, three years or more). Once investment is made in a fibre lease, the costs associated with the fibre are incurred during a long period (possibly ten years or more). This is in contrast with leased wavelengths, where the commitment is typically limited to twelve months. Therefore, where competition in fibre is expected to grow rapidly, the use of leased capacity might be desirable initially, even if there are already providers of dark fibre. However, a higher number of providers of fibre does not always immediately result in lower costs, as is illustrated below. The more general implications of investment in fibre, where there is a lack of competition to provide fibre as well as a lack of competition for leased capacity, are discussed in Chapter 6.
An analysis has been produced for the GÉANT2 fibre routes, which is similar to that for leased capacity described in Chapter 3. It compares the cost of fibre with the number of potential suppliers. As there should be a strong correlation between the costs of leased fibre and the length of a route, an analysis of cost per unit of route length can give an indication of the relative competitiveness of the market for international fibre connections to individual countries. It might be expected that if there is a competitive market for leased fibre, then there would be a strong correlation between route cost per unit length and number of suppliers. Figure 4.2 illustrates this analysis.
In contrast to similar analyses for leased capacity, Figure 4.2 shows that there is no strong correlation between the number of potential suppliers of fibre and the cost of such fibre. The figure shows that there are significant variations in route cost that are independent of the number of suppliers.
3 The incremental cost of adding a wavelength on a longer route is at least twice that on a shorter route, because each regeneration incurs a ‘per-wavelength’ investment cost. This cost is equivalent to the implementation cost of a wavelength where no regeneration is necessary.

��
Economic Issues > The implications of fibre
Figure 4.2: GÉANT2 fibre analysis: cost per kilometre versus number of suppliers
The cost of equipping fibre is strongly related to the length of a route. The number of amplifier sites needed and the potential requirement for regeneration are dependent on the route length. The relation between the cost of the fibre routes that have been equipped in GÉANT2 and their lengthhas also been analysed. Figure 4.3 shows the plot of this relation. The 0% horizontal axis represents the average cost per kilometre of a lit route. It can be seen from Figure 4.3 that the longer routesare generally somewhat more competitive. However, this is more than offset by the lengths of these routes so that in absolute terms longer routes are more expensive, even though they are more competitive in unit terms.
Figure 4.3: Comparison of GÉANT2 routes: variation (in %) of cost per kilometre versus route length (in km)
0
200
400
600
800
1000
1200
1400
1600
1800
2000
0 1 2 3 4 5 6 7 8 9
Cost per kilometre versus number of suppliers
-100
-50
50
0
100
150
200
250
300
0 500 1000 1500 2000 2500
Relative cost versus length in km
��
Economic Issues > The implications of fibre
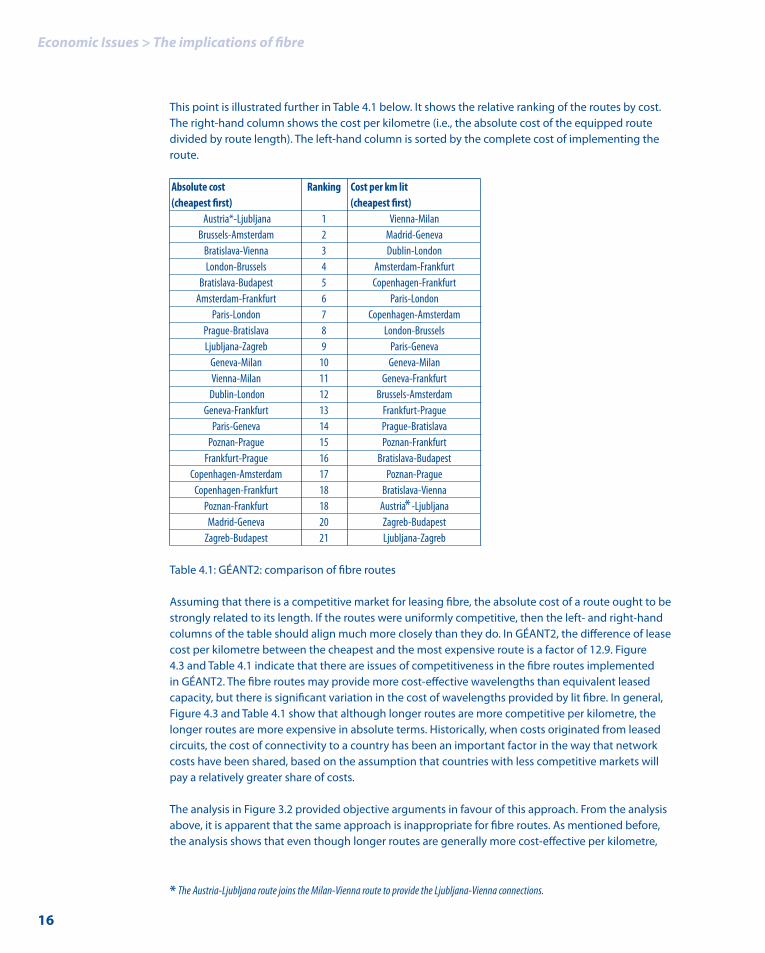
This point is illustrated further in Table 4.1 below. It shows the relative ranking of the routes by cost. The right-hand column shows the cost per kilometre (i.e., the absolute cost of the equipped route divided by route length). The left-hand column is sorted by the complete cost of implementing the route.
Absolute cost Ranking Cost per km lit (cheapest first) (cheapest first) Austria*-Ljubljana 1 Vienna-Milan Brussels-Amsterdam 2 Madrid-Geneva Bratislava-Vienna 3 Dublin-London London-Brussels 4 Amsterdam-Frankfurt Bratislava-Budapest 5 Copenhagen-Frankfurt Amsterdam-Frankfurt 6 Paris-London Paris-London 7 Copenhagen-Amsterdam Prague-Bratislava 8 London-Brussels Ljubljana-Zagreb 9 Paris-Geneva Geneva-Milan 10 Geneva-Milan Vienna-Milan 11 Geneva-Frankfurt Dublin-London 12 Brussels-Amsterdam Geneva-Frankfurt 13 Frankfurt-Prague Paris-Geneva 14 Prague-Bratislava Poznan-Prague 15 Poznan-Frankfurt Frankfurt-Prague 16 Bratislava-Budapest Copenhagen-Amsterdam 17 Poznan-Prague Copenhagen-Frankfurt 18 Bratislava-Vienna Poznan-Frankfurt 18 Austria -Ljubljana Madrid-Geneva 20 Zagreb-Budapest Zagreb-Budapest 21 Ljubljana-Zagreb
Table 4.1: GÉANT2: comparison of fibre routes
Assuming that there is a competitive market for leasing fibre, the absolute cost of a route ought to be strongly related to its length. If the routes were uniformly competitive, then the left- and right-hand columns of the table should align much more closely than they do. In GÉANT2, the difference of lease cost per kilometre between the cheapest and the most expensive route is a factor of 12.9. Figure 4.3 and Table 4.1 indicate that there are issues of competitiveness in the fibre routes implemented in GÉANT2. The fibre routes may provide more cost-effective wavelengths than equivalent leased capacity, but there is significant variation in the cost of wavelengths provided by lit fibre. In general, Figure 4.3 and Table 4.1 show that although longer routes are more competitive per kilometre, the longer routes are more expensive in absolute terms. Historically, when costs originated from leased circuits, the cost of connectivity to a country has been an important factor in the way that network costs have been shared, based on the assumption that countries with less competitive markets will pay a relatively greater share of costs.
The analysis in Figure 3.2 provided objective arguments in favour of this approach. From the analysis above, it is apparent that the same approach is inappropriate for fibre routes. As mentioned before, the analysis shows that even though longer routes are generally more cost-effective per kilometre,
* The Austria-Ljubljana route joins the Milan-Vienna route to provide the Ljubljana-Vienna connections.
*

��
Economic Issues > The implications of fibre
the length of these routes means that they are more expensive. This is an issue of geography rather than of competitiveness. It implies the emergence of a geographic divide, in which the central countries of Europe, where route lengths are shorter, incur lower network connectivity costs, even though in many cases the fibre routes lit are less competitive.
4.3 The cost structures of fibre links
The cost structure in a network where the connectivity is built from underlying lit fibre is completely different from the cost structure in a network based on leased connectivity. This is due to the fact that with lit fibre there is direct exposure to the cost structures of the individual network components, whereas in a leased-fibre network these are generally hidden from the customer by the network operator.
The basic building block of a lit fibre network can be described as the ‘hop’. A hop is a section of a route where there is no regeneration of the signal. With the exception of the two routes mentioned in Section 4.1, all routes in GÉANT2 are single-hop. However, a route is only a path between adjacent nodes of the network. In the majority of cases, paths are between two end-points that are not adjacent nodes. In order to calculate the lowest incremental cost of such a path, it is necessary to calculate the shortest path between the end-points. From this ‘hop count’ the incremental cost can be calculated. In general, the hop count will be higher for those countries that are further away from the centre of the network. As an example, Table 4.2 shows some typical hop counts to Geneva, which is a major node in the network.
Path Number of hops Dublin-Geneva 5 Budapest-Geneva 4 Frankfurt-Geneva 1 Amsterdam-Geneva 2
Table 4.2: GÉANT2 hop count to Geneva
The incremental cost of implementing additional wavelengths is directly related to the hop count.
4.4 Average versus incremental costs
A feature of GÉANT2 is the provision of point-to-point services that use dedicated capacity from the pool of transmission capacity in the backbone. Where this is implemented over fibre lit by the project, the incremental cost of this capacity is very low. ‘Incremental cost’ is the direct cost incurred when implementing an additional unit of transmission capacity. In this context, it can be seen as the direct cost of adding one wavelength. Incremental cost is, in many respects, a very attractive index, particularly because it normally generates the lowest numbers. However, it is a dangerous index to use in isolation. It ignores the fixed investment costs that are a pre-requisite for using incremental cost data. The ratio of fixed and incremental costs using lit fibre varies according to route, but is typically between 10 and 50.

��
When average costs are analysed, a different picture emerges. The average costs have a very strong geographic element, independent of the underlying infrastructure costs. That element is derived from the actual topology implemented. Wavelengths from the edge of the geographic footprint will normally affect the average price of wavelengths that are more central in the network, because they will typically involve hops in the centre of the network. However, the converse is not true, because wavelengths in the centre will not utilise investment at the edge. In 2003, GÉANT only offered an IP service and each route consisted of, at most, a single wavelength. By 2006, there was a significant provision of dedicated wavelengths in addition to the IP service. Table 4.3 illustrates this point.
Route Leased capacity GÉANT (2003) Lit fibre GÉANT2 (2006) Dublin-London (edge) 1 2 Frankfurt-Geneva (centre) 1 12
Table 4.3: Edge versus centre: number of wavelengths
As shown in the table, from a perspective of average cost, wavelengths in the centre of the network are much less expensive than those at the edge. In the example, the average cost of wavelengths between Frankfurt and Geneva is one-sixth of that between Dublin and London; that comparison is ignoring issues of route cost, which actually increase the difference. This is another example of the ‘geographic divide’ challenge that is apparent in GÉANT2.
In order to analyse this further, Figure 4.4 shows how the number of wavelengths implemented on a route influences the average cost. The figure is based on the assumption that, at most, ten wavelengths will be implemented on a route. It shows how the relative average cost declines as the number of wavelengths increases.
Figure 4.4: Relative average cost versus number of wavelengths
Economic Issues > The implications of fibre
0
1
2
3
4
5
6
7
8
1 2 3 4 5 6 7 8 9 10
Relative average cost of additional wavelenghts versus number of wavelenghts

��
Economic Issues > Network cost structures
5. Network cost structuresIt is generally difficult to have a budget algorithm for allocating network costs among network users. In the previous generations of the pan-European research backbone network, most of the network costs related to connectivity and there was only one service: a general IP service without capacity dedicated to individual users. Then it was easier to find such an algorithm, because network access capacity was strongly related to national demand. However, as illustrated in Figure 2.1, now in GÉANT2, network capacity is a significant cost but not a dominant cost in the overall budget, and there is a much higher percentage of fixed costs (hardware investment, operations and people costs).
There are three principal issues that arise from this. Firstly, significant levels of network costs are incurred whether the network is being used or not. Secondly, there are high levels of fixed costs, almost no short-term variable costs, and long-term variable costs tend to be quite granular (see Chapter 2). Finally, if the costs are shared on the basis of access capacity, then the level of usage of access will be a significant factor in the way the costs are shared. As an example, operating a 2.5-Gb/s access at 80% capacity will imply a much lower share of the costs than operating a 10-Gb/s access at 20% capacity. This gives an incentive to under-subscribe, which is somewhat negative because by doing so the network will incur a smaller level of shared cost. It is difficult to separate out the individual costs of a connection of a country to a network from the total network costs.
5.1 Cost sharing
The general model that has been adopted since 1993 for funding the subsequent generations of the pan-European research backbone network has been that the total annual cost of the network has been shared among the connected networks. Much has changed in the last thirteen years. The market for international telecommunications has been liberalised, although the effects of this have been very different in different countries. In 1993, the costs of links within Europe were only dependent on capacity; they were independent of length or geography. Today, there is very considerable variation. Historically, the variation was based on international competitiveness. The geographic footprint of the network has expanded very considerably in Central and Eastern Europe. The network is now built from components acquired in the market place rather than bought as a service from a network provider. Since 1997, there has been consistent support from the European Union for the overall activity, with the effect that 50% of the total costs are now covered from EU funds.
The cost-sharing model that has been employed to allocate costs among connected national research and education networks has developed to take account of some of these changes. Although there is some contingency built into the model, it can essentially be described as a zero-sum game. As the objective is to collect only sufficient money to cover network costs on an annual basis, a decrease of one NREN’s share of the costs is necessarily achieved by an increase in the costs for other NRENs.
There have been several phases in the development of the cost-sharing model. Prior to liberalisation of the telecommunications markets, prices for connectivity, which were then the dominant component of network costs, were practically independent of geography. There was a well-

�0
Economic Issues > Network cost structures
established empirical correlation between the speed of a connection and the price of a connection. This was used as the basis for cost sharing. It represented a simple, easily understandable economic model. With market liberalisation, the cost of international connectivity began to vary quite significantly, and consequently the simple geography-independent model became non-sustainable, because it encouraged NRENs in cheaper locations to bypass a common infrastructure. As a result, more complicated cost-sharing models were developed that reflected the cost of international connectivity to a country as part of the share of the cost of that country. In some sense, countries that were less competitive in international markets for telecommunications were forced to pay more for their network access than those countries where there was a vibrant and competitive market for international telecommunications.
A relatively complicated arithmetical model was developed, which allocated cost partly on the basis of access capacity and partly on the basis of the cost of international telecommunications to a country. This model continued to make use of the empirical relation between cost and speed of connectivity, an empirical relation that was basically derived from the economics of employing SDH-based systems. Figure 4.5 shows this empirical relation.
Figure 5.1: Relation between access speed and relative cost of access
The introduction of DWDM connectivity raised more questions as to whether this empirical approach was really applicable in a mixed environment of SDH and DWDM technology. Pragmatic changes were made to elements of the model in order to obtain more realistic results for high-speed connections (i.e., 2.5 and 10 Gb/s wavelengths).
The introduction of ‘owned’ fibre into the network, where the fibre is acquired on a long-term lease and is lit by acquiring and installing DWDM equipment as part of the network activities, represents a major change in network costs. This is because:
1. The commitment required to justify the acquisition and lighting of fibre is multi-annual. Once
0
0.2
0.4
0.6
0.8
1
1.2
20 34 45 155 310 620 1240 2500 10000
Relative cost (amount per Mb/s per year) versus access speed (in Mb/s)

��
Economic Issues > Network cost structures
the acquisition is made, the costs of this network element are effectively fixed. It is not easy to change fibre routes, because the time taken to install equipment and the need to amortise capital investment make this a less flexible option than leasing capacity. This calls into question the use of international connectivity costs as a basis for cost sharing.
2. As shown in Chapter 4, the cost structure changes significantly. The installation cost of a DWDM system is very large compared to the additional cost of adding wavelength capacity to that system. Thus the incremental cost of additional wavelengths is very small if the capital investment is ignored. This makes it quite difficult to account for (i.e., to price) such elements in an overall approach to cost sharing.
3. The cost of installing DWDM equipment is dependent on distance. Fibre costs are typically on a per-kilometre basis. Amplification of the signal is required at regular intervals (80-200 km). On longer or more complicated routes, each wavelength will need to be regenerated. Regeneration typically multiplies the incremental cost of additional wavelengths by the number of times regeneration is performed. As shown in Chapter 4, countries that are geographically more distant from the centre of Europe will necessarily have higher connectivity costs, due to the combined effects of geography and traffic flow. More traffic will always flow through the centre of a network. Therefore, connectivity costs at the centre are averaged over a higher number of flows and will be cheaper.
4. Direct investment in acquiring and lighting fibre means that GÉANT2 directly experiences its own cost base and cannot, as telecommunications operators do easily, average and smooth out costs between customers.
5.2 Pricing principles and the portfolio of network services
When the only service available on the pan-European backbone network was an IP service, the associated pricing principles were relatively simple. There was only one service to which costs could be allocated. The pricing table was established as a result of the cost-sharing algorithm. That algorithm established a price for connectivity on an annual basis at the required subscription speed. All costs were allocated to ‘access capacity dependent’ subscriptions. No consideration was given to a more complicated pricing model involving a mixture of fixed and variable elements of price. Given this approach to pricing, it was possible to project the cost to an individual NREN of an upgrade of its subscription. Fortunately, downgrades never happened. The network capacity was relatively stable over a period of twelve months. The only issue that arose was related to the level of subscription (i.e., access speed) of an individual NREN. There were never any rules as to an appropriate level of subscription, and it was always possible for an NREN to under-subscribe, by allowing its access to be more heavily loaded. That then had the effect of increasing every other NREN’s share of network costs. However, in practice the question of an appropriate level of access capacity was never actually a policy question that was addressed.
GÉANT2 has changed all this in two distinct ways. Firstly, the portfolio of services has extended beyond basic IP services to include point-to-point service. Unlike an IP service, which offers a general access to the network, point-to-point services imply dedicated facilities between two end-points. Thus it is more apparent who is consuming network resources. Secondly, the network has been implemented using a combination of leased capacity and acquired fibre that has been lit as a result of capital investment within the GN2 project. The cost structure for the provision of connectivity
0
0.2
0.4
0.6
0.8
1
1.2
20 34 45 155 310 620 1240 2500 10000
Relative cost (amount per Mb/s per year) versus access speed (in Mb/s)
��
Economic Issues > Network cost structures
over these two components is completely different. Leased capacity has a lower initial price and an additional price of upgrade that is approximately equivalent to the initial price. This is because telecommunications operators generally smooth out the costs over a number of customers. In contrast, lit fibre has a high initial cost and a rather low marginal cost for incremental capacity. The decisions in the GN2 project whether to acquire fibre or not, were partly driven by economic decisions and partly by considerations of availability.
Only a subset of the NRENs whose networks are connected to GÉANT2 can actually make use of point-to-point services, namely those that have sufficient access capacity to split out dedicated capacity for point-to-point services. Eleven of the thirty NRENs participating in GN2 are not in a position to exploit point-to-point services today. Among the NRENs that can exploit these services, the cost structure for service provision is very different for those that are connected to leased fibre compared to those that are connected to leased wavelengths.
In GÉANT2, a different approach to cost sharing has been employed. The basic principle has been retained that the total annual network cost is covered by the total network subscriptions. However, the need to provide prices for two different types of service has significantly changed the cost-sharing approach. In order to encourage the use of point-to-point services, the cost of additional point-to-point services has been set at marginal, incremental cost of providing such services. This means effectively that the basic cost of the network is funded by the subscriptions for IP service. This acts as an incentive to use point-to-point services, but it has potentially a serious distorting effect on the overall allocation of shares in the total costs, and it is not sustainable in the longer term. There are four particular reasons why it is not sustainable:
1. There are countries that cannot benefit from point-to-point services, either because those are too expensive to provide or because demand is low. These countries can claim that they are effectively subsidising other countries’ point-to-point services.
2. If, as is expected, point-to-point services become an increasingly important element in the access requirements of NRENs, then they need to cover their fair share of costs. Already today, more capacity in the network is devoted to point-to-point services than to the IP service, but the revenue from point-to-point services is much lower than the revenue from the IP service.
3. Among the countries that are able to exploit point-to-point services there is a group that can benefit from the investment in fibre. There is also a group for whom additional point-to-point services will require the provision of additional leased capacity. The differences in incremental cost between these two groups are enormous.
4. Even for those countries that can benefit from the investment in fibre, their geographic position in the network has a significant effect on the cost of providing point-to-point services.
Using principles of incremental cost to encourage the take-up of point-to-point services, with the basic network costs being paid by the IP service, is an appropriate policy to follow when there is little take-up of point-to-point services. Assuming that this is a successful policy, it will become increasingly unsustainable, as discussed above. There is significant benefit only for those NRENs whose networks are connected by fibre acquired by the GN2 project. Assuming that point-to-point services become a more significant function of the network, which has always been the design intention, they have to be priced on a basis of average or allocated costs.

��
Economic Issues > Lit fibre on expensive routes
6. Lit fibre on expensive routesThe business case for the investment in acquiring and lighting fibre depends on two factors. A major consideration is the annual cost of leased connectivity that the lit fibre would replace. The other factor is the cost itself of acquiring and lighting fibre. Knowing these two costs, it is possible to build a model for a given route that will provide a breakeven analysis for the investment in fibre. Such an analysis from GÉANT2 is presented in Figure 6.1. The figure shows the number of wavelengths that need to be lit in order to justify an investment in lighting fibre.
Figure 6.1: Breakeven analysis Lilliput-Brobdingnag: annual costs for a five-year period
The figure plots the annual cost of implementing capacity on a route and compares the cost of leased wavelengths, according to a five-year demand scenario, with the equivalent cost of providing the same capacity via lit fibre using hardware from three potential providers. It shows that, for this demand scenario, lit fibre becomes a cost-effective solution within the five-year period.
There are three qualifications that need to be applied to this approach to economic modelling:
1. The model depends on predictions of the future costs of leased wavelengths as well as on a realistic perspective of demand forecasts.
0
500
1000
1500
2000
2500
3000
2005 2006 2007 2008 2009
Leased capacity Hardware A Hardware B Hardware C

��
Economic Issues > Lit fibre on expensive routes
2. Important is the period of time for which the model is realistic. The commitment for leasing a fibre route will typically be significantly longer than that for leasing a wavelength. This is partly due to the need to amortise the investment in DWDM equipment.
3. Important are also the direct and indirect costs of changing between the two approaches. The direct costs relate to the need to have overlap during any change to ensure continuity of connectivity. The indirect costs relate to the operational implications of changing. This is particularly an issue if it is the intention to change from an investment in lighting fibre back to leasing wavelengths.
In practice, the model will be relatively stable where there is a competitive market for leased capacity and a competitive market for fibre. However, as noted in Section 4.2, it is difficult to determine the competitiveness of the market for fibre. The competitiveness of a market for leased wavelengths on a particular route is easier to understand, since there is a well-developed knowledge of the underlying DWDM cost structures. Where there is no competitive market for international leased wavelengths, the modelling is more difficult. Even then, a breakeven analysis can be made, but the implications of the analysis need to be considered further. Figure 6.2 illustrates a breakeven analysis on a route where leased wavelengths are expensive. It shows that the investment in fibre will already break even in the first year. Here, the assumptions about the cost of acquiring and lighting fibre are for a relatively expensive route.
Figure 6.2: Breakeven analysis for a given route: relative costs for expensive and cheap leased wavelength
0
5
10
15
20
25
Year 1 Year 2 Year 3 Year 4 Year 5
Leased capacity (expensive) Leased capacity (cheap) Cost of lit route

��
Economic Issues > Lit fibre on expensive routes
Investment in fibre will break even in the first year because leased wavelengths on this route are very uncompetitive: a factor of 5 higher than a competitive price. With a factor of this magnitude, which is not untypical for non-competitive routes, an investment in fibre could be justified. The figure also shows that if the leased wavelengths were to be competitive on the route, the case for investment in fibre could not be made, not even when considering a five-year period.
If international leased wavelengths on a route are uncompetitive, i.e., the pricing is unrelated to (and orders of magnitude higher than) underlying costs, then this has some potentially detrimental effects on the analysis of the investment in fibre. A breakeven case will depend on the uncompetitive leased circuit costs on the same route. If an investment in fibre is justified, then it is likely to fix costs for the route in the network for a period of several years, having the effect of institutionalising the lack of competitiveness.

��
7. Alternative approaches to infrastructure acquisitionThere is a general assumption that investment in acquiring fibre is a prudent economic approach to providing transmission capacity on an international route. However, the economic analysis is not quite as simple. Transmission capacity in a high-performance, advanced research and education network needs to be reliable and available. The technology that GÉANT2 uses is the same as that used by telecommunications operators to provide leased capacity. As a consequence, there are no fundamental cost advantages that can be achieved by lighting fibre. For each route lit in GÉANT2, a breakeven analysis was carried out. The fact that an investment case can be made is mainly due to the pricing structures that telecommunications operators use in leasing wavelengths.
In general, the price of leased wavelengths is subjected to averaging and smoothing. Averaging means that the price of single wavelengths is based on a combination of incremental costs and a share of fixed costs. If a single wavelength is leased, this is reasonable. For multiple wavelengths it becomes expensive. Discounts offered for multiple wavelengths are usually very low and this strengthens the argument for direct acquisition of fibre on routes where there will be a demand for multiple wavelengths. Smoothing, the process whereby the price of a wavelength is not directly related to the cost of a particular route but is some smoothed price looking at the costs across a number of routes, actually works in favour of leasing capacity on those routes that benefit from the smoothing - typically the longer routes -, but the effect is much weaker than the averaging effect.
In the United Kingdom, JANET(UK) has recently adopted a different approach. Instead of acquiring fibre and separately acquiring and lighting DWDM equipment themselves, JANET(UK) procured the fibre, the service management and the lit wavelengths on the route from a telecommunications operator, while at the same time allowing the telecommunications operator itself to exploit the route for its own benefit. This hybrid approach potentially has a number of advantages, because it encourages economies of scale by pooling demand from the research community and from the general telecommunications market. It shares the risk and gives the supplying telecommunications operator an incentive to use the route. It is an interesting alternative to acquiring fibre from a supplier and lighting fibre as a separate commercial activity.
Economic Issues > Alternative approaches to infrastructure acquisition

��
8. Conclusions• The cost of connectivity remains the most significant cost in the operation of the pan-
European research network GÉANT2. Unlike other costs (hardware investments and operations), connectivity costs have a significant geographic element that can be directly related to the provision of service to a country.
• Historically, when the market for international connectivity in Europe was monopolistic, there was no geographic element to the cost of connectivity. As competition in international connectivity has developed on a pan-European basis, costs of connectivity have dropped significantly in the more competitive parts of Europe. This was apparent in the procurement of the GÉANT network. A digital divide emerged with very large variations in the costs of international connectivity within Europe. This was reflected in the share of costs that individual NRENs paid for the same service.
• For GÉANT2, there has been significant investment in international fibre, which is then lit by investment in DWDM equipment. Access to fibre is only partially available in GÉANT2. This has led to a further split between those countries where fibre access is available and those where international connectivity continues to be provided by leased connections.
• For those countries where connectivity is provided by leased connections, the geographic variations in prices remain an issue. Far from reducing, the digital divide remains a significant feature in the cost of international connectivity to support pan-European research networking.
• In general, investment in fibre provides more cost-effective connectivity. An analysis based on the results of the GÉANT2 procurement shows that the market for international fibre is not uniformly competitive.
• Investing in fibre fixes costs for a much longer period of time than leasing capacity, because of the need to invest in DWDM equipment. The analysis of the combined costs of leased fibre and investment in DWDM equipment shows that the cost of connectivity on a route is dependent on distance.
• An analysis of the relative competitiveness of ‘lit routes’ in GÉANT2 fails to show a clear pattern of competitiveness. It is notable that longer routes tend to be more cost-competitive per kilometre. Routes in the centre of the GÉANT2 network are more heavily populated with wavelengths than those at the edge. This is because routes from the edge of the network transverse the centre of the network while the converse is not true. Therefore, a geographic divide has emerged with costs of international connectivity at the edge of the network being higher than those in the centre, even though the underlying competitiveness at the edge is often higher.
• The existence of this geographic divide, which is not related to market competitiveness, means that an approach to cost sharing that is based on the cost of international connectivity to a country provided via lit fibre, is not necessarily an equitable approach when looking ahead.
Economic Issues > Conclusions
��
• The GÉANT2 network is now offering dedicated point-to-point connectivity as well as an IP service. When point-to-point connectivity is being provided, it is much more obvious who is consuming resources. The existence of an enhanced service portfolio will have a significant impact on the way in which costs should be shared in the future.
• Acquiring and lighting fibre is generally seen as being a competitive and cost-effective way of providing connectivity. However, where the costs of leased circuits are high, fibre acquisition may not be the most economic option. Alternative approaches such as shared ownership look attractive.
Recommendation:
An issue that is apparent from the current study is the simple fact that more traffic is concentrated in the centre of the network than at the edge. As a consequence, there is less demand at the edge to encourage investment in infrastructure. Countries should be encouraged to implement policies to facilitate investment, particularly in international fibre, which can be made available to public-sector users.
Economic Issues > Conclusions

��
9. ReferencesEARNEST http://www.terena.org/activities/earnest/GN2 http://www.geant2.net/server/show/nav.749SERENATE http://www.serenate.org/
Economic Issues > References

�0
Economic Issues > Acronyms
10. AcronymsDWDM Dense Wavelength Division MultiplexingEARNEST Education And Research Networking Evolution StudyEU European UnionGb/s Gigabits per secondGÉANT Gigabit European Academic Network TechnologyGN2 Multi-Gigabit European Academic NetworkIP Internet Protocolkm kilometreMb/s Megabits per secondNREN National Research and Education Networking organisationSDH Synchronous Digital HierarchySERENATE Study into European Research and Education Networking As Targeted by eEurope TEN-155 Trans-European Network Interconnect at 155 Mb/sTEN-34 Trans-European Network Interconnect at 34 Mb/s

��
Economic Issues > Appendix 1
Appendix 1

��