report on diversity at the bar 2017 - bar standards board · report on diversity at the bar 2017 4...
TRANSCRIPT

Report on Diversity at the Bar 2017A summary of the latest available diversity data for the Bar
Published January 2018
If you would like this report in an alternative format, please contact the BSB Research Team on 020 7611 1467

3The Bar Standards Board
Contents1 Executive Summary ..............................................................................................4
2 Introduction ...........................................................................................................6
3 Methodology ..........................................................................................................7
Response Rates 8
4 Protected Characteristics ....................................................................................10
Gender 10Ethnicity 12Disability 14Age 16Religion and Belief 18Sexual Orientation 20
5 Socio-Economic Background ..............................................................................22
Type of School Attended 22First Generation to Attend University 24
6 Caring Responsibilities ......................................................................................26
Caring Responsibilities for Children 26Caring Responsibilities for Others 28
7 Conclusions .........................................................................................................30

Report on Diversity at the Bar 2017
4
1 Executive Summary ● This report presents a summary of the latest available diversity data for the Bar.
The report assists the Bar Standards Board (BSB) in meeting its statutory duties under the Equality Act 2010 and sets out an evidence base from which relevant and targeted policy can be developed.
Response rates
● Response rates continue to increase across all categories except for age and gender (see Table 2 for a comparison to 2016). The response rate is highest for gender at 99.97 per cent and lowest for caring responsibilities and religion or belief at 34.1 per cent.
Gender
● The proportion of women at the Bar (pupils, practising Queen’s Counsel (QC) and non-QC barristers) has increased 0.5 percentage points (pp) since the snapshot taken in December 2016. As of December 2017, women constitute 37.0 per cent of the practising Bar.
● The proportion of female QCs has increased, from 13.7 per cent in December 2016 to 14.8 per cent in December 2017.
● As observed in 2016, there is a greater proportion of female pupils in comparison to male pupils (51.7% vs 48.3%).
Ethnicity
● The percentage of Black, Asian and Minority Ethnic (BAME) barristers at the Bar has increased 0.5pp since December 2016 to 12.7 per cent, with the percentage of QCs from BAME backgrounds increasing 0.8pp year on year (to 7.2%). However, the proportion of pupils from BAME backgrounds has fallen slightly (0.2pp).
● There is still a disparity between the total percentage of BAME barristers across the profession (12.7%), and the percentage of BAME QCs (7.2%). This suggests an issue in the progression of BAME practitioners at the Bar, although the gap has narrowed by 0.3pp in comparison to December 2016.

5The Bar Standards Board
Disability
● There still appears to be an underrepresentation of disabled practitioners at the Bar. Of those that have provided information on disability status to us, 5.3 per cent of the Bar disclosed a disability. This is significantly lower than the percentage of the employed working age population in the UK that has declared a disability, estimated at 11 per cent.
Other
● Despite a low response rate (36.7%) to this question, the data suggest that a disproportionate number of barristers attended a UK fee-paying secondary school between the ages of 11-18. Even if all of the barristers who chose not to respond to this question had gone to state schools, the proportion of barristers who went to fee-paying schools is higher than in the wider population; with 12.3 per cent (including non-respondents) having primarily attended a fee-paying school between 11-18, compared to approximately 7 per cent of school children in England at any age, and 10.1 per cent of UK domiciled young full-time first degree entrants in the UK in 2015/16. Of those that provided information on school attended, around 33 per cent attended an independent school in the UK.

Report on Diversity at the Bar 2017
6
2 Introduction1. The BSB is committed to providing clear and transparent statistical diversity data
across every stage of a barrister’s career. This diversity data report is published annually, in line with the Specific Duties Regulations of the Equality Act 2010 and the statutory guidance of the Legal Services Board. It is a summary of the diversity data on practising barristers available to the BSB, as at 1 December 2017.
2. This report provides an overview of diversity at the Bar,1 and establishes evidence for both policy development and assessing the effectiveness of current initiatives aimed at increasing equality and diversity. All data are presented anonymously.
3. Unless stated otherwise, all analysis in this report is broken down by seniority. Table 1 (below) shows the simple breakdown of practising members of the profession. We have used the term ‘practising Bar’ throughout this report. This refers to all practising barristers who are not Queen’s Counsel (QC). This group of barristers is widely referred to as the ‘junior Bar’ by the profession
Table 1: Total number of people at the Bar (numbers)
Seniority Numbers
Pupil 422
Practising Bar 14,704
Queen’s Counsel (QC) 1,731
Total 16,857
4. There are three sections to the diversity analysis of the profession: protected characteristics, socio-economic background, and responsibilities regarding caring for children and others.
1. Usage of the term ‘the Bar’ in this report refers only to practising barristers as of 1 December 2017.

7The Bar Standards Board
3 Methodology5. The data for practitioners2 in this report are from the BSB’s records.
Bar Standards Board Records
6. Diversity data on pupils are collected through the Pupillage Registration Form (PRF), which must be completed before an individual commences their pupillage. The data from this form are collected annually, simultaneously with the data collection for the rest of the profession to ensure consistency.
7. The Bar Council Records Department receives data on the profession via the online “Authorisation to Practise” (AtP) system, which until the 2018 AtP process was Barrister Connect, a system introduced in 2012 to enable barristers to renew their practising certificates online. When renewing their practising certificate, the online portal includes a section which allows barristers to input their diversity monitoring data. For the 2018 AtP process and going forwards, a new platform called MyBar will be used.
8. The rate of completion varies for individual monitoring strands, as each question is voluntary and some can be left blank if desired. Barristers could access the Barrister Connect portal at any time and update their diversity monitoring information; barristers will be able to do the same on the new MyBar platform. The diversity monitoring information used in this report was extracted from our database on 1 December 2017, and represents a snapshot of the profession on this date.
9. Data on gender, ethnicity, age, and disability that had been collected by the Bar Council Records Department prior to 2012 was transferred to our database to supplement the new monitoring data.
10. All numbers have been rounded to one decimal place, so in some cases the figures may not total 100 per cent.
2 Usage of the term “practitioners” in this report refers to pupils, junior barristers, and QCs practising at the Bar as of 1 December 2017.

Report on Diversity at the Bar 2017
8
3.1 Response Rates
11. The response rate once again increased across all collected data in 2017, except for age and a very small decrease for gender. While this trend is positive, the majority of questions asked are still only responded to by just over a third of the Bar. Information on disability was provided by just over 40 per cent of the Bar. The following diversity information was not provided in any way (including prefer not to say) by over 60 per cent of barristers:
• Religion or belief • Sexual orientation • Socio-economic background • Caring responsibilities
12. Each question on both Barrister Connect and the PRF contains a ‘prefer not to say’ option, allowing individuals the option of giving a response without disclosing any information. ‘Prefer not to say’ is included as a response in the rates listed below.
Table 2: Response Rates in 2016 and 2017 (as a percentage of total barristers)
Category 2016 2017 Percentage point difference
Gender 99.99% 99.97% -0.02%
Ethnicity 91.8% 92.5% 0.7%
Age 87.6% 82.5% -5.1%
Disability 35.0% 40.2% 5.2%
Religion or belief 32.1% 34.1% 2.0%
Sexual orientation 31.8% 34.8% 3.0%
Type of school attended 31.3% 36.7% 5.4%First generation to attend
university 31.2% 34.9% 3.7%
Care of children 31.9% 37.2% 5.3%
Care for others 30.8% 36.1% 5.3%

9The Bar Standards Board
13. The decrease in response for age is due to a change in the way age bands are calculated from our new Customer Records Management (CRM) system launched in October 2017, using information from those that have disclosed a date of birth only. The previous system included those that had disclosed an age band and no date of birth, but in the absence of such data being updated yearly, we could not be sure that barristers within this group had not changed age bands since the data were first submitted.

Report on Diversity at the Bar 2017
10
4 Protected CharacteristicsGender
14. Chart 1 shows the percentage of practitioners at the Bar by gender and level of seniority. The percentage of women at the Bar across all levels of seniority has increased from December 2016 to December 2017. The greatest increase has been for QCs (13.7% to 14.8%; a difference of 1.1pp), however, it is noteworthy that the overall proportion of female QCs is low (14.8%). The proportion of female pupils has increased by 0.4pp, and for practising barristers the year on year increase is 0.5pp. The proportion of female pupils is greater than that for male pupils (51.7% vs 48.3%).3 The same was true in 2016.
Chart 1: Gender at the Bar (%)
0%
20%
40%
60%
80%
100%
Pupils Practising QC Overall
0.0%0.0%0.0%0.0% 0.2%0.1%0.2%0.0%
62.8%
85.0%
60.6%
48.3%
37.0%
14.8%
39.2%
51.7%
Female Male Prefer not to say No information
3. More information on the demographics of pupils that have entered onto pupillage following the BPTC can be found in Part 4 of the BPTC Key Statistics Report: https://www.barstandardsboard.org.uk/media/1758995/bptc_key_statistics_report_2016_-_part_4_-_bptc_graduate_progression.pdf
11The Bar Standards Board
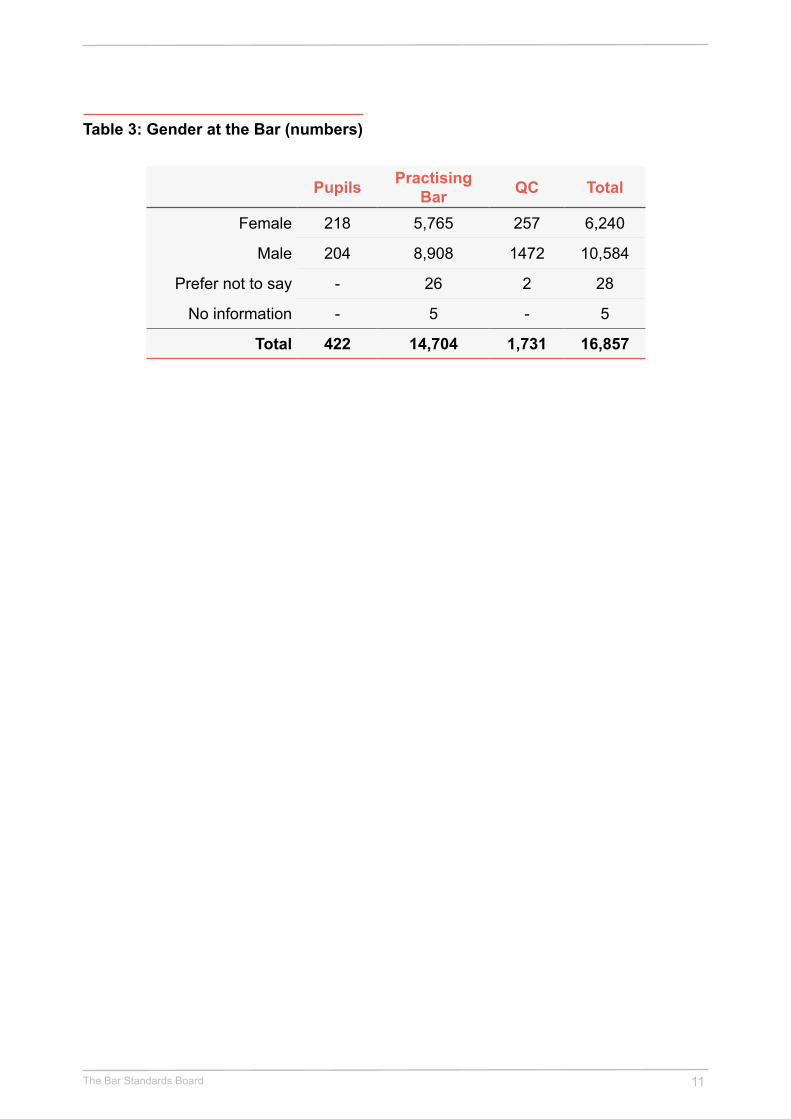
Table 3: Gender at the Bar (numbers)
Pupils Practising Bar QC Total
Female 218 5,765 257 6,240
Male 204 8,908 1472 10,584
Prefer not to say - 26 2 28
No information - 5 - 5
Total 422 14,704 1,731 16,857

Report on Diversity at the Bar 2017
12
Ethnicity
15. Chart 2 shows the percentage of practitioners at the Bar by ethnic background and level of seniority. The total percentage of BAME barristers at the Bar has increased by 0.5pp compared to December 2016. There was an increase of 0.8pp for QCs, with the percentage of BAME barristers increasing by 0.5pp for practising barristers. However, the proportion of BAME pupils showed a decrease of 0.2pp compared to December 2016.
Chart 2: Ethnicity at the Bar (%)
0%
20%
40%
60%
80%
100%
Pupils Practising QC Overall
7.5%3.4%
8.2%1.7% 0.5%0.3%0.5%0%
79.3%
89.2%
78.1%82.2%
12.7%7.2%
13.2%16.1%
BAME White Prefer not to say No information

13The Bar Standards Board
Table 4: Ethnicity at the Bar (numbers)
Pupils Practising Bar QC Total
Asian/Asian British 39 956 60 1,055
Asian/Asian British - Bangladeshi 5 81 5 91
Asian/Asian British - Chinese 3 65 4 72
Asian/Asian British - Indian 12 434 29 475
Asian/Asian British - Pakistani 11 239 16 266
Any other Asian background 8 137 6 151
Black/African/Caribbean/Black British 12 454 19 485
Black/Black British - African 7 227 6 240
Black/Black British - Caribbean 3 183 9 195
Any other Black background 2 44 4 50
Mixed/multiple ethnic groups 15 378 18 411
White and Asian 5 40 3 48
White and Black African - 45 - 45
White and Black Caribbean 1 49 1 51
White and Chinese 2 86 8 96
Any other mixed/multiple background 7 158 6 171
Other ethnic group 2 156 27 185
Arab 1 13 - 14
Any other ethnic group 1 143 27 171
White 347 11,483 1,544 13,374White - English/Welsh/Scottish/Northern
Irish/British 312 10,576 1,477 12,365
Any other White background 26 566 43 635
White - Irish 9 338 24 371
White - Gypsy or Irish Traveller - 3 - 3
Prefer not to say - 76 5 81
No information 7 1,201 58 1,266
Grand Total 422 14,704 1,731 16,857
Report on Diversity at the Bar 2017
14
Disability
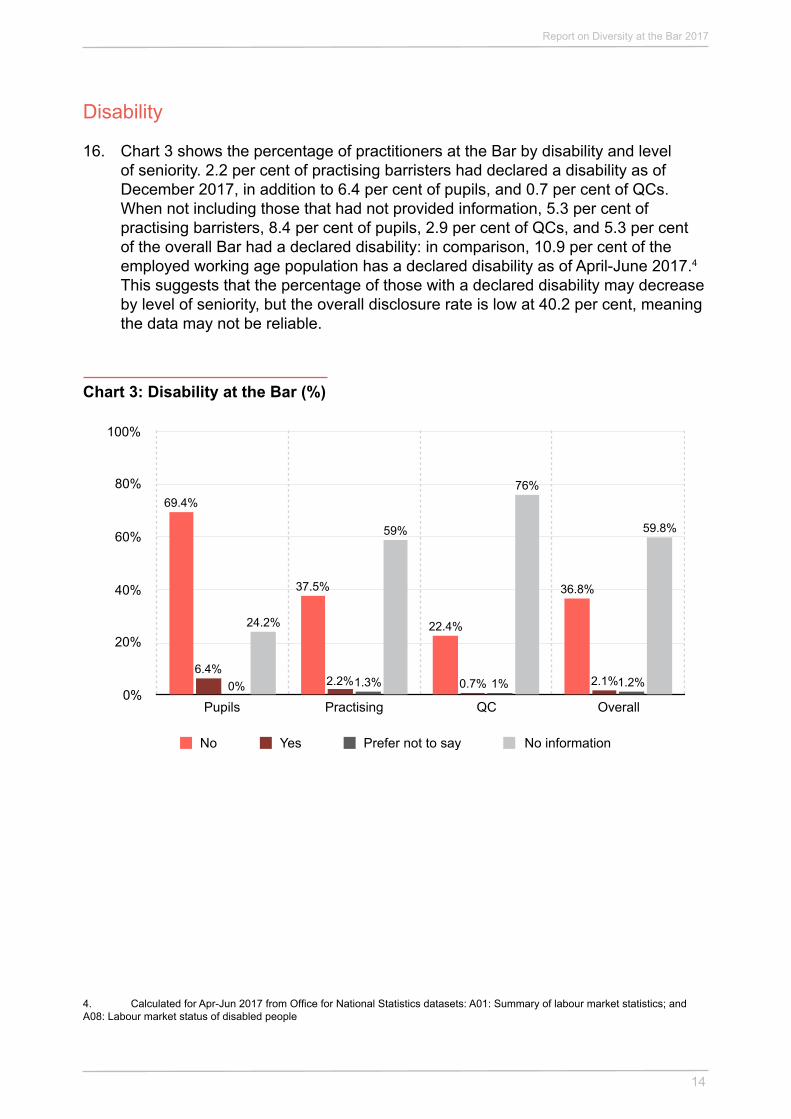
16. Chart 3 shows the percentage of practitioners at the Bar by disability and level of seniority. 2.2 per cent of practising barristers had declared a disability as of December 2017, in addition to 6.4 per cent of pupils, and 0.7 per cent of QCs. When not including those that had not provided information, 5.3 per cent of practising barristers, 8.4 per cent of pupils, 2.9 per cent of QCs, and 5.3 per cent of the overall Bar had a declared disability: in comparison, 10.9 per cent of the employed working age population has a declared disability as of April-June 2017.4 This suggests that the percentage of those with a declared disability may decrease by level of seniority, but the overall disclosure rate is low at 40.2 per cent, meaning the data may not be reliable.
Chart 3: Disability at the Bar (%)
0%
20%
40%
60%
80%
100%
Pupils Practising QC Overall
59.8%
76%
59%
24.2%
1.2%1%1.3%0% 2.1%0.7%2.2%6.4%
36.8%
22.4%
37.5%
69.4%
No Yes Prefer not to say No information
4. Calculated for Apr-Jun 2017 from Office for National Statistics datasets: A01: Summary of labour market statistics; and A08: Labour market status of disabled people

15The Bar Standards Board
Table 5: Disability at the Bar (numbers)
Pupils Practising Bar QC Total
No disability declared 293 5,519 387 6,199
Disability declared 27 321 12 360
Prefer not to say - 193 17 210
No information 102 8,671 1,315 10,088
Total 422 14,704 1,731 16,857

Report on Diversity at the Bar 2017
16
Age
17. Chart 4 shows the percentage of practitioners at the Bar by age band and level of seniority. Age is fairly evenly distributed across the Bar. Those between the ages of 25 and 54 make up almost 84 per cent of those that have provided information on age.
18. The only noteworthy change since 2016 is a decrease in disclosure rate. This is due to a change in the way age bands are calculated, using information from those that have disclosed a date of birth only. The previous system included those that had disclosed an age band only and no date of birth, but in the absence of such data being updated yearly, we could not be sure that barristers within this group had not changed age bands since the data were first submitted. The change took place in October 2017 with the launch of our new CRM system.
Chart 4: Age at the Bar (% of total for the Bar)
0%
10%
20%
30%
40%
50%
Under 25 25 - 34 35 - 44 45 - 54 55 - 64 65+ Prefer notto say
Noinformation
17.5%
0.7%2.3%
9.1%
24.2%26.1%
19.3%
0.8%

17The Bar Standards Board
Table 6: Age at the Bar (numbers)
Pupils Practising Bar QC Total
Under 25 96 35 - 131
25 - 34 280 2,970 - 3,250
35 - 44 30 4,282 92 4,404
45 - 54 13 3,504 563 4,080
55 - 64 - 1,329 200 1,529
65+ - 325 64 389
Prefer not to say - 104 12 116
No information 3 2,155 800 2,958
Total 422 14,704 1,731 16,857

Report on Diversity at the Bar 2017
18
Religion and Belief
19. Chart 6 shows the religion or belief of practitioners at the Bar. Around two thirds of the Bar have not yet provided information on religion or belief through Barrister Connect, although the response rate is up by 2pp year on year. Including those that have not provided information, the largest group are Christians (16.7%) followed by those with no religion or belief (10.1%).
Chart 5: Religion and belief at the Bar (% of total for the Bar)
Buddhist
Christian (all denominations)
Hindu
Jewish
Muslim
Sikh
Any other religion
No religion or belief
Prefer not to say
No information
0% 20% 40% 60% 80% 100%
65.9%
2.7%
10.1%
0.6%
0.4%
1.3%
1.4%
0.6%
16.7%
0.2%

19The Bar Standards Board
Table 7: Religion and belief at the Bar (numbers)
Pupils Practising Bar QC Total
Buddhist 2 31 1 34
Christian (all denominations) 101 2,531 183 2,815
Hindu 7 85 3 95
Jewish 3 192 43 238
Muslim 13 209 5 227
Sikh 2 63 4 69
Other religion/belief 2 95 4 101
No religion/belief 134 1,484 83 1,701
Prefer not to say 5 422 36 463
No information 153 9,592 1,369 11,114
Total 422 14,704 1,731 16,857

Report on Diversity at the Bar 2017
20
Sexual Orientation
20. Chart 6 shows the sexual orientation of practitioners at the Bar. The statistics are largely unchanged from last year, with an increase in the response rate being shared across the various categories.
Chart 6: Sexual orientation at the Bar (% of total for the Bar)
0%
20%
40%
60%
80%
100%
Bisexual Gayman
Gaywomen/Lesbian
Heterosexual Other Prefer notto say
Noinformation
65.2%
0%0.2%
32.4%
0.3%1.3%0.5%

21The Bar Standards Board
Table 8: Sexual orientation at the Bar (numbers)
Pupils Practising Bar QC Total
Bisexual 6 81 5 92
Gay man 8 208 9 225
Gay woman/Lesbian 5 42 - 47
Heterosexual 256 4,870 343 5,469
Other 1 24 2 27
Prefer not to say - - - -
No information 146 9,479 1,372 10,997
Total 422 14,704 1,731 16,857

Report on Diversity at the Bar 2017
22
5 Socio-Economic Background21. Socio-economic background is not a protected characteristic under the Equality Act
2010. However, where members have a balanced socio-economic profile it can be a good indicator of a meritocratic profession.
22. Unfortunately, accurately measuring socio-economic background can be challenging, and there is no universal proxy for gathering such data. The BSB uses the socio-economic questions recommended by the Legal Services Board, which are included on the Barrister Connect monitoring questionnaire and on the PRF. These questions use educational background of the barrister, and of their parents, as a proxy for determining a barrister’s social class. There is a strong correlation between a person’s social background and a parent’s level of educational attainment – particularly when choosing the type of school to attend, type of university, and career choice.5
Type of School Attended
23. Chart 7 shows a summary of the type of school mainly attended between the ages of 11-18 for practitioners at the Bar, as a proportion of the whole profession. The data suggest that a disproportionate amount of the Bar attended a UK independent school. The figures show that even if all of the barristers who chose not to respond had gone to state schools, the proportion of barristers who went to fee-paying schools is higher than in the wider population, with 12.3 per cent (including non-respondents) having primarily attended a fee-paying school between 11-18, compared to approximately 7 per cent of school children in England at any age6, and 10.1 per cent of UK domiciled young full-time first degree entrants in the UK in 2015/16 attending a fee-paying institution prior to university.7
24. Of those that provided information on school attended, around 33 per cent attended an independent school in the UK. The overall response rate for this information has increased 5.4pp year on year (to 36.7%).
5. Bukodi, E. and Goldthorpe, J.H., 2012. Decomposing ‘social origins’: The effects of parents’ class, status, and education on the educational attainment of their children. European Sociological Review, 29(5), pp.1024-1039.6. Independent Schools Council: Research. https://www.isc.co.uk/research/ (accessed 10 January 2018). We acknowledge that this comparison is not a direct one; we are lacking data on type of school mainly attended between the ages of 11-18 for Eng-land and Wales only.7. Higher Education Statistics Authority: Widening participation summary: UK Performance Indicators 2015/16. https://www.hesa.ac.uk/data-and-analysis/performance-indicators/widening-participation-summary (accessed 12 January 2018)

23The Bar Standards Board
Chart 7: Type of school attended (% of total for the Bar)
0%
20%
40%
60%
80%
100%
Schooloutside UK
UK Independent School
UK StateSchool
Prefer notto say
Noinformation
63.3%
1.7%
20.4%
12.3%
2.3%
Table 9: Type of school attended by the Bar (numbers)
Pupils Practising Bar QC Total
Attended school outside the UK 19 355 11 385
UK independent school 77 1,794 210 2,081
UK state school 188 3,122 133 3,443
Prefer not to say 3 254 23 280
No information 135 9,179 1,354 10,668
Total 422 14,704 1,731 16,857

Report on Diversity at the Bar 2017
24
First Generation to Attend University
25. Chart 8 shows whether members of the profession were the first generation to attend university or not. On the Barrister Connect monitoring questionnaire, the question asked is: “If you went to university (to study a BA, BSc course or higher), were you part of the first generation of your family to do so?”
26. The statistics are very similar to 2016. The increase in response rate (to 34.9%) has been evenly shared between those answering “Yes” and those answering “No”.
Chart 8: First generation to attend university (% of total for the Bar)
0%
20%
40%
60%
80%
100%
Did not attend No Yes Prefer not to say No information
65.1%
1.3%
15.4%17.8%
0.4%

25The Bar Standards Board
Table 10: First generation to attend university at the Bar (numbers)
Pupils Practising Bar QC Total
Did not attend university 1 44 14 59
No 72 2,770 165 3,007
Yes 63 2,367 173 2,603
Prefer not to say 3 200 19 222
No information 283 9,323 1,360 10,966
Total 422 14,704 1,731 16,857

Report on Diversity at the Bar 2017
26
6 Caring Responsibilities 27. The caring responsibilities categories used in this report are those provided to
the BSB by the Legal Services Board. These questions are aimed at ascertaining whether or not an individual has child or adult dependants for whom they care.
Caring Responsibilities for Children
28. Chart 9 shows a summary of childcare responsibilities at the Bar. On the Barrister Connect monitoring questionnaire, the question asked is: “Are you a primary carer for a child or children under 18?” The percentage of those providing a response to this question has increased 5.3pp year on year.
Chart 9: Caring responsibilities for children for those at the Bar (% of total for the Bar)
0%
20%
40%
60%
80%
100%
Pupils Practising QC Overall
62.8%
77.6%
62%
32.5%
1.1%0.8%1.1%0.5%
7.6%3.3%
8.3%2.4%
28.5%
18.3%
28.6%
64.7%
No Yes Prefer not to say No information

27The Bar Standards Board
Table 11: Caring responsibilities for children for those at the Bar (numbers)
Pupils Practising Bar QC Total
No 273 4,209 317 4,799
Yes 10 1,220 57 1,287
Prefer not to say 2 162 14 178
No information 137 9,113 1,343 10,593
Total 422 14,704 1,731 16,857

Report on Diversity at the Bar 2017
28
Caring Responsibilities for Others
29. Chart 10 below shows practitioners at the Bar who have caring responsibilities for people other than children, as a percentage of the whole profession. On the Barrister Connect monitoring questionnaire, the question asked is “Do you look after, or give any help or support to family members, friends, neighbours or others because of either long-term physical or mental ill-health/disability or problems related to old age (not as part of your paid employment)?”
30. Of those that provided a response, the clear majority do not provide care for others; with around 12 per cent of respondents at the Bar providing care for another, and with 90.8 per cent of this group providing care for between 1-19 hours a week. Including those that have not provided information for this question, 4.4 per cent of the Bar provide care for others for one hour a week or more.
31. Of those that have provided a response, the proportion that provide care for another increases with level of seniority.
Chart 10: Caring Responsibilities for others for those at the Bar (% of total for the Bar)
No
Yes, 1-19 hours a week
Yes, 20-49 hours a week
Yes, 50 or more hours a week
Prefer not to say
No information
0% 20% 40% 60% 80% 100%
63.9%
1.7%
0.2%
0.2%
4%
30.1%

29The Bar Standards Board
Table 12: Caring responsibilities for others for those at the Bar (numbers)
Pupils Practising Bar QC Total
No 264 4,499 303 5,066
Yes, 1-19 hours a week 13 611 52 676
Yes, 20-49 hours a week - 37 2 39
Yes, 50 or more hours a week - 25 2 27
Prefer not to say 4 261 16 281
No information 141 9,271 1,356 10,768
Total 422 14,704 1,731 16,857

Report on Diversity at the Bar 2017
30
7 Conclusions32. Compared with 2016, there has been no substantial change in the reported profile
of the Bar this year. This is to be expected when monitoring demographic changes in a profession on an annual basis.
33. Response rates continues to improve steadily, which is a very positive development. Apart from gender (which had a 0.02pp decrease in response rate) and age (response for which is being calculated differently this year), the average response rate across questions increased by around 3.8pp. The increase in disclosure is something we will takes steps to maintain through the use of the new portal, MyBar. As the disclosure rate increases, so does the quality of the BSB’s evidence base.
34. Overall, both gender and BAME representation at the Bar continue to move towards better reflecting the demographics of the UK population. Although the proportion of pupils from BAME backgrounds has slightly decreased, the gender and ethnic diversity of pupils are roughly in line with the population of England and Wales.
35. There may be an underrepresentation of disabled practitioners at the Bar, although the response rate (at 40.2%) is too low to draw reliable conclusions.
36. The response rates for questions on socio-economic background are too low to provide a reliable barometer of the profession in this area. However, available data indicate a disproportionately high percentage of the Bar primarily attended a fee-paying secondary school.


Contact us:Bar Standards Board
289-293 High HolbornLondon WC1V 7HZ
Tel: 020 7611 1444Fax: 020 7831 9217
Email: [email protected]: @BarStandards
Facebook: /barstandardsboardLinkedIn: /thebarstandardsboard