report on caricom construction & installation …
TRANSCRIPT
Caribbean Construction Industry Study, 2002
COUNCIL OF
CARIBBEAN
ENGINEERING
ORGANISATIONS
REPORT ON
CARICOM CONSTRUCTION & INSTALLATION SERVICES SECTOR
ELEMENTS FOR COMPETITIVE STRATEGIES
BY THE COUNCIL OF CARIBBEAN
ENGINEERING ORGANISATIONS (CCEO)

Caribbean Construction Industry Study, 2002
February 2002 Report On the CARICOM Construction & Installation Services Sector: Elements For Competitive Strategies For the Caribbean Regional Negotiating Machinery, Jamaica House, 1, Devon Road, Kingston 5, Jamaica. Written and prepared by: Dr. Eng. Timothy Michael Lewis, Department of Civil Engineering, UWI, Trinidad & Tobago with Dr. Eng. Clement A.C. Imbert, Secretary General, CCEO and contributions from: Eng. Egbert Louis, Organisation of Eastern Caribbean States (OECS) Eng. Harold Nembhard, Jamaica Eng. Grenville Phillips II, Barbados (BAPE) & Eng. Melvyn Sankies, Guyana

1
Caribbean Construction Industry Study, 2002
REPORT ON CARICOM CONSTRUCTION &
INSTALLATION SERVICES SECTOR
ELEMENTS FOR COMPETITIVE STRATEGIES
OBJECTIVES This study has two main objectives.
• One objective is to establish an understanding of the capacity of the local construction industry in the Caribbean Community (CARICOM), in terms of its resources, capabilities and sustainability.
• The second objective is to determine how policy initiatives will help enable
the industry to better compete for significant construction projects undertaken in the region specifically and also extra-regionally.
The outcome from addressing these two objectives will advise the Caribbean Regional Negotiating Machinery (CRNM) and stakeholders, including governments, on approaches that can deal with the concerns and issues facing the construction sector in the CARICOM region and to preserve the interests of the region in the accords arrived at within the various emergent international trade agreements.
1. EXECUTIVE SUMMARY 1.1 Introduction 1.1.1 Most crucial decisions on trade and economic policy are being made in the boardrooms of multinational corporations and round the table at organisations such as the World Trade Organisation. It thus becomes vital that the interests of national communities be represented at international fora and that the interests of specific industrial sectors be represented within the negotiations between national, regional and international organisations. In order to protect and preserve national interests, information has to be obtained on the strengths and weaknesses of the various sectors of the economy. 1.1.2 This executive summary contains a synopsis of this report that includes recommendations for enhancing the competitiveness of the construction sector in the region. 1.2 Methodology 1.2.1 The basic approach to the conduct of this study was to gather information and canvas the opinions of the members of the professional engineering and

2
Caribbean Construction Industry Study, 2002
allied associations in the countries that comprise the CARICOM community as well as other major stakeholders in the construction industry. Close to one hundred companies, comprising forty nine consulting firms, thirty three contractors and seventeen client organisations from the English speaking Caribbean, answered comprehensive questionnaires and this body of data was supplemented by personal interviews and seminars in several countries in the region. 1.3 Review of role of the construction sector 1.3.1 It has been maintained that the role of the construction sector is one that is dynamic and that its role varies in relation to the developmental status of the country in which it is operating. Developed countries can be expected to have a reasonably complete built environment, with close to sufficient facilities and infrastructure to meet their immediate needs, so that the construction sector finds its main emphasis in repair, rehabilitation, renovation and maintenance work. Underdeveloped and Developing countries are lacking in all sorts of facilities, (e.g. commercial, residential, industrial, cultural, educational) and infrastructure, and thus their construction industries are faced with a higher proportion of ‘new-build’ opportunities. 1.3.2 By the same token, the developmental status also determines what kind of service a country is likely to offer to the world market – biased either towards repair and maintenance or ‘new build’. It is broadly believed that the countries of CARICOM fit within the underdeveloped category, and that therefore their construction industries are still primed for new-build work, and that their resources are relatively low-cost in global economic terms. This suggests that the focus of their attention in both local and export markets should be on relatively resource intensive new-build projects in which they should have a competitive advantage. 1.4 Profile of the sector within CARICOM and other countries 1.4.1 Focus on Larger firms 1.4.1.1 The construction sector is typically dominated, numerically, by small firms. However, when it comes to their Gross Product, the small numbers of large firms dominate. These form the focus of this study. However, neither the projects nor the firms that are considered large in the local context, would normally be considered large in international terms. 1.4.2 Capability of the Regional Construction industry 1.4.2.1 The industry in the region has a great belief in its own technical ability to undertake the construction projects that arise within their home countries, and within the region. It seems reasonable to accept that there is a more than adequate level of technical expertise amongst local professionals, although there may be a shortage in their numbers. Given also that there should be no grounds for foreign firms to have a price advantage over local firms, the issue becomes, why local firms are not winning internationally bid projects either in their home

3
Caribbean Construction Industry Study, 2002
countries or in the region. Where there are tax advantages, fiscal incentives and other concessions that are enjoyed by foreign firms, these should also be available to their local counterparts. 1.4.3 Impediments to regional competitiveness 1.4.3.1 Project size: There were a number of important problems identified in our survey as holding local firms back in bidding for large projects. The most important appeared to be the overall size of the big projects in relation to their normal workload and the weightings used by the contract awarding agencies in the evaluation of proposals and bids. However, project packaging should allow local firms to be involved in project management, in order to benefit from opportunities for general contracting, and the development of multi-skilled personnel (see Appendix IV “Financial giants squeeze contractors”). 1.4.3.2 These problems do not seem intractable. There seem to be no logical or technical reasons why the majority of major projects should not be capable of being repackaged into smaller sub-projects. This would also partially address the evaluation problem because the guidelines could easily be refined to give higher weightings to local firms and to firms that have undertaken projects recently closer in size to the instant proposals and bids, rather than favouring those that have done much bigger projects recently. 1.4.3.3 Need for greater transparency: There is a very clear and strong perception within the industry that local firms are disfavoured and disadvantaged in internationally bid projects (often by their own governments), especially those projects that are in any way funded by international agencies or organisations. It is, however, not clear that there is a real bias in favour of foreign firms when other criteria are equal, even if this is perceived to be the case. This could easily be addressed by greater transparency on behalf of the contract awarding agencies, especially in relation to the evaluation of consultants’ proposals. 1.4.3.4 Other Issues At the micro-economic level, the main problems revolve around the financial issues and risks involved, the access to information, and the availability of skilled (and experienced) staff. These issues are complicated and need to be investigated in greater depth. 1.4.3.5 Finance: The financial problems revolve around the cost of bonds, insurances and other financial preliminaries, liquidated damages and provisions for fluctuations in the costs of inputs. The risk issue is also complicated, and cannot simply be dealt with by insurance. The financial services sector in the region needs to be much more creative in dealing with the special needs of the construction industry. Again, special expertise is needed to properly address the solutions to these problems.

4
Caribbean Construction Industry Study, 2002
1.4.3.6 Access to Information: The access to information can be addressed by means of a new publication or a dedicated website. Seed funding will need to be identified for either of these approaches. Governments, developmental and lending agencies should be committed to providing information on developmental plans, proposals and tenders. 1.4.3.7 Human Resources: The shortages of technical personnel are a serious impediment. The availability of skilled personnel is an issue that the Council of Caribbean Engineering Organisations (CCEO) and the Council on Human and Social Development (COHSOD) are already addressing, but it is clear that there needs to be a clearer definition of where gaps in expertise exist and where training programmes need to be focused. There is also need for a register of skilled personnel in the industry, from the professionals down to the skilled trades and craftsmen. Other issues like the registration of professional engineers are also important to the overall process of human resource management in the industry. 1.4.3.8 Joint Ventures: Firms within CARICOM have not in general addressed their shortcomings in size by entering into long-term joint ventures or partnership agreements with other firms. A significant number of partnerships and joint ventures were entered into on a project-by-project basis particularly when technical skills were needed that were not available in-house. Mechanisms for strengthening these relationships must be implemented through trade and professional organisations, the attendant information technology and appropriate legal measures. 1.5 Construction industry efficiency 1.5.1 The efficiency of the construction industry has been a source of concern internationally for many years and a number of major studies have been carried out to address this issue. There is a serious shortage of written information and statistical data about the industry and its relative performance in the Caribbean. Sadly, also, engineers in the Caribbean do not tend to write reports on their project experiences for publication. It is important that the industry in CARICOM accommodate research that allows benchmarking studies to enable comparative performance of the construction sector in the region to be measured. It is only in this way that the effectiveness of measures to improve the performance of the industry can be assessed. Given efforts in other parts of the world to improve productivity by 10% per annum, similar targets could be set and should be equally achievable in the CARICOM region. 1.6 Accreditation of qualifications 1.6.1 There is currently no detailed database of all the qualifications and procedures used in the individual countries of the CARICOM Community to become a recognised professional engineer. Such a database would be desirable and should be one of the deliverables of a special project.

5
Caribbean Construction Industry Study, 2002
1.6.2 Beyond the level of the professionals there is a need for an agreed standard for accrediting sub-professionals, technicians and skilled artisans, tradesmen and craftsmen. The approach to accrediting the skills needed for these sub-professionals and the building of a database of such skills throughout the region are two facets of a project that needs to be undertaken. 1.7 Harmonisation of regional legislation 1.7.1 The requirements for licensing extend beyond those required for entry into the profession. In order for the profession to be protected, and for that protection to be enforceable, appropriate legislation must be passed. For there to be regional equivalency, it is necessary that similar legislation be enacted in each country. This programme has been begun, but needs rapidly to be brought to a conclusion. The system should allow for reciprocal recognition of similarly registered and licensed professionals from other countries or regions. Similarity of regional legislation also applies to building codes in particular, as well as health and safety, and the environment. 1.8 Mutual recognition and reciprocity; 1.8.1 Agreement will have to be reached throughout the region on mutual recognition and reciprocity, so that once recognised in one territory professionals may be recognised as being competent to act in any jurisdiction. The region also should have a common position on the treatment of qualified foreign engineers. If it is right for a CARICOM based engineer to have to register with the Professional Institutions in, say, Canada in order to work there then it is right that a Canadian engineer should have to register with the local Professional Associations when working within CARICOM. 1.9 Professional Organisations 1.9.1 The lack of numbers of professionals in the region, among other things, makes for professional organisations that are relatively weak especially in the smaller territories where they are often inactive for periods of time. Institutional support is needed for the development and sustainability of these associations which should play a significant role in national planning, continuing education and professional development, codes and standards and regulation of the profession. 1.10 Free movement of natural people; 1.10.1 The industry should benefit from the enhanced freedom of movement as it is liberalized. However, this may best be confined to professional and supervisory staff at the outset. 1.10.2 The sudden influx of a large itinerant workforce into an area with limited socio-economic infrastructure can have damaging effects on that area. There have already been protests by residents of various districts to the wide-scale ‘importation’ of non-professional and non-supervisory labour from outside the area, on public funded projects. It is considered unlikely that firms from within the region would want to carry their entire workforce with them onto a project

6
Caribbean Construction Industry Study, 2002
within the region, unless there were very special circumstances. Thus it is felt that a restriction on this sort of exercise, on socio-economic grounds would be justifiable. In other words, it is unlikely that the construction industry would view the unrestricted movement of unskilled ‘natural’ persons with equanimity. 1.10.3 Specific mention has been made of the tendency for Asian contractors to bring their entire workforce with them, including many with very dubious ‘skills’. There is no doubt that their presence is resented locally. They may also be engaged in violation of accepted and/or legal standards of compensation, working conditions and accommodation. It is recommended that ‘imported’ personnel be limited to professional and supervisory staff in the short to medium term. 1.11 Market Access; (GATS Article XVI) 1.11.1 Market access to enable firms to work outside their home country is not usually an issue for local firms, except if it allows firms from outside those smaller countries to ‘poach’ work from the indigenous firms in those countries. Big contractors or consultants may take small jobs to get a foothold in a new market, and they may take those jobs at cost, or even at a loss for strategic reasons. Local firms cannot compete on these terms. This is a form of ‘dumping’ and under-pricing and should not be tolerated in the construction industry because of its destructive effect on local industry and competitiveness, besides which, it is rarely economical as claims often make up the difference in cost over higher bids. 1.12 Subsidies; (GATS Article XV) 1.12.1 It is widely believed within the industry that foreign governments provide their engineering firms with financial support, subsidies and incentives that affect the competitiveness of the industry. The advantages that foreign firms receive help to enable them to win construction projects in the CARICOM region and other parts of the world where the local governments are unable or unwilling to give their firms the same levels of support. 1.12.2 Given this firm belief, there is a need to examine the various concessions, in terms of support, subsidies and incentives that are available both in the home countries of the large international firms and locally that may work against the competitiveness of the local firms, especially as many of these subsidies are ‘hidden’. These are effectively market distortions that work against the free market concept. The existence and scale of such incentives are the subject of a specific study proposed by the Caribbean Coalition of Service Industries (CCSI) to the CARICOM Secretariat for funding. 1.13 Right of Establishment; (Protocol 2, Article 35 b and c) 1.13.1 Mode 1 - cross border supply 1.13.1.1 In principle, cross border supply may appear fine, however, in practice there are a number of specific problems particularly in relation to service

7
Caribbean Construction Industry Study, 2002
providers from outside the region. For example, there is a strong belief that there is a separate and distinctive Caribbean aesthetic that is expressed in our built environment. The architectural profession in some of the CARICOM countries feels strongly that this aesthetic should be preserved by restricting the practice of architectural design to firms that are established within the region.
1.13.1.2 To a lesser extent the same applies to engineering where design parameters may be affected by factors like the locally available materials, the culture, work ethic, climate and seismicity that may not be familiar to the foreign engineer. These factors could significantly affect the design if it was produced without an understanding of these issues. Exposure to the issues by having a local establishment would go a long way to overcoming these reservations. 1.13.2 Mode 2 - consumption abroad 1.13.2.1 It is expected that increasingly, foreign firms operating in the region, will employ the local construction industry to undertake their building projects, rather than having them designed and/or built by firms from their home countries. In other words, the capabilities of the local firms will eventually be recognized, as will their cost advantage. The ‘playing field’ must of course be level for this to happen, in other words there should not be the market distortions that currently exist. 1.13.3 Mode 3 - commercial presence 1.13.3.1 Currently this mode tends to be a popular approach amongst firms within the region who maintain representation or contacts within each country which are ‘operationalised’ when specific projects require such associations. This mode of supply seems well served already. 1.13.4 Mode 4 - presence of natural persons 1.13.4.1 Rights of establishment are slightly different across modes, but generally the principle is that nationals of the community should be free to adopt any mode of establishment they consider appropriate to provide their services to the community. 1.14 Restrictions on the Provision of Services 1.14.1 New restrictions on the provision of services are expressly prohibited by the terms of Article 36 of Protocol II. For example, it is inappropriate for professional organisations to propose new restrictions on their membership that are expressly discriminatory against non-nationals, unless there is very good reason. The attempts by architects to exclude such professionals on largely aesthetic grounds will require very careful scrutiny, as will any such attempts by other professional groupings. Existing restrictions on the provisions of service will need either to be removed or to be harmonized across the Community.

8
Caribbean Construction Industry Study, 2002
1.15 Improving Industry Effectiveness 1.15.1 The key issues as far as the local industry is concerned are those of appropriate project definition, and appropriate terms for market access. It is clear that there are consultants in the Caribbean area who are competent to handle the technical aspects of most of the projects that arise in the local market. If local firms are to be involved and to benefit from the projects being undertaken in their own territories and the region (which is the main concern at present), whenever possible big projects should be packaged into smaller parcels of work. It is not clear what the maximum size of project should be in order to optimize local participation, partly because it depends on the macro-economic state of the country, and partly because it depends on the micro-economic status of the firm. Within the region care must be taken to avoid domination by the larger firms (which most often are from the larger territories) to the detriment of the development of the profession in the smaller territories. 1.15.2 It should be noted that local firms suspect foreign firms of underbidding in order to win jobs, and then making up the difference in claims. This should not be allowed. In order to combat this problem one approach may be to try to minimise the opportunities for claims, perhaps by using a professional project manager to oversee projects. A specialized study could focus on these various problems. 1.15.3 The key parameters in determining the appropriate project size are the financial capacity of the local firms and the availability of professional staff. The financial issues will need the attention of the financial sector. In particular, a means of allocating and absorbing risk in a way that does not burden the contractor too heavily, will have to be found. The directories of professionals and other non-professionals in the industry in the region will be a powerful tool in determining industry capacity, and in assisting consultants and contractors in finding resources when they need them at short notice. 1.15.4 The role of the Government as a client for construction is perhaps more important in the Caribbean than elsewhere, and thus their commitment to enabling policy initiatives is even more important to the stability and success of the industry. Regional governments have a most important part to play, not only as clients, but in the provision of information, statistical analyses, education, legislation and equitable terms and conditions for bidding, awarding of contracts and construction operations. 1.15.5 Very few people in the industry know much about the Caribbean Single Market and Economy (CSME) and the various trade protocols. There is a clear and urgent need for the CARICOM Secretariat together with the specific industry sector groups to conduct a number of sensitizing seminars throughout the region to tell people what is happening with respect to the various trade protocols and how these events will affect them. An up-to-date website where people could access information on these issues would be very useful.

9
Caribbean Construction Industry Study, 2002
GLOSSARY OF ABBREVIATIONS AIC - Advanced Industrialized Country BOLT - Build-Own-Lease-Transfer BOOT - Build-Own-Operate-Transfer CAIC - Caribbean Association of Industry and Commerce CARICOM - Caribbean Community CCEO - Council of Caribbean Engineering Organizations CCSI - Caribbean Coalition of Service Industries CDB - Caribbean Development Bank CE - Continuing Education CEng - Chartered Engineer COHSOD - Council on Human and Social Development CORD - Committee for the Recognition of Degrees CPD - Continuing Professional Development CRNM - Caribbean Regional Negotiating Machinery CSME - Caribbean Single Market and Economy DE - Distance Education DFC - Design-Finance-Construct EU - European Union FTAA - Free Trade Area of the Americas GATS - General Agreement on Trade in Services GDP - Gross Domestic Product GNP - Gross National Product IMF - International Monetary Fund LDC - Less Developed Country NIC - Newly Industrialized Country NIHERST - National Institute of Higher Education, Research, Science and Technology NVQ - National Vocational Qualification OECS - Organization of Eastern Caribbean States PE or PEng - Professional Engineer PPP - Public Private Partnership PSIP - Public Sector Investment Programme RE - Registered Engineer RFP - Request for Proposals RNM - Regional Negotiating Machinery RVQ - Regional Vocational Qualification TLI - Tertiary Level Institution TOR - Terms of Reference T&T - Trinidad and Tobago TVET - Technical and Vocational Education and Training UCJ - University Council of Jamaica UTech - University of Technology UNCP - United Nations Central Product Classification UWI - The University of the West Indies WTO - World Trade Organization

10
Caribbean Construction Industry Study, 2002
TABLE OF CONTENTS OBJECTIVES .......................................................................................................1 1. EXECUTIVE SUMMARY ..................................................................................1 GLOSSARY OF ABBREVIATIONS ......................................................................9 TABLE OF CONTENTS................................................................................10 2. INTRODUCTION ............................................................................................13 3. METHODOLOGY............................................................................................15 4. REVIEW OF THE ROLE OF THE CONSTRUCTION SECTOR .....................17 5. PROFILE OF THE SECTOR...........................................................................23
5.1 Small firms.................................................................................................23 5.2 Larger firms ...............................................................................................24
6. CONSTRUCTION INDUSTRY EFFICIENCY..................................................28 6.1 The Caribbean construction industry.........................................................28 6.2 The Egan Report .......................................................................................28
7. SUMMARY OF SURVEY OF CONTRACTORS .............................................33 7.1 Note...........................................................................................................33 7.2 Management issues ..................................................................................33 7.3 Technical and operational issues ..............................................................37 7.4 Project size and prequalification issues.....................................................40 7.5 Additional comments .................................................................................45
8. SUMMARY OF SURVEY OF CONSULTANTS ..............................................46 8.1 Note...........................................................................................................46 8.2 Management issues ..................................................................................46 8.3 Technological issues .................................................................................50 8.4 Financial issues.........................................................................................51 8.5 Project size issues.....................................................................................54 8.6 Additional comments .................................................................................58
9. SUMMARY OF SURVEY OF CLIENTS..........................................................60 9.1 Note...........................................................................................................60 9.2 Management issues ..................................................................................60 9.3 Level of satisfaction..................................................................................62 9.4 Contract performance................................................................................64 9.5 Project size and markets ...........................................................................65 9.6 Additional comments .................................................................................66
10. ANALYSIS OF REGIONAL COMPETITIVENESS........................................67 10.1 Infrastructure and the construction sector ...............................................67 10.2 Public debt...............................................................................................68 10.3 Transportation .........................................................................................69 10.4 Water and sewerage ...............................................................................70 10.5 Energy.....................................................................................................71 10.6 Information and telecommunications.......................................................71 10.7 The construction sector multiplier............................................................72
11. STATISTICAL DATA FOR TRINIDAD & TOBAGO.......................................73 11.1 Notes on statistical data ..........................................................................73 11.2 Indices of wages and prices ....................................................................73
11
Caribbean Construction Industry Study, 2002
11.3 National GDP/capita and construction GDP/capita (current $s) ..............74 11.4 National GDP/capita and construction GDP/capita (constant $s)............75 11.5 Construction labour force and employment .............................................76 11.6 The money supply, national GDP and construction GDP........................77 11.7 Fixed capital formation and money supply ..............................................78 11.8 Loans to construction and building plans approved.................................79 11.9 Total GDP vs GDP/capita........................................................................79 11.10 Public debt vs GDP ...............................................................................81 11.11 Other country statistics ..........................................................................81
12. STATISTICAL DATA FOR BARBADOS .......................................................82 12.1 Notes on statistical data ..........................................................................82 12.2 Gross Domestic Product per Capita ........................................................82 12.3 Employment ............................................................................................85 12.4 Index of Wages .......................................................................................85 12.5 Index of Retail Prices ..............................................................................86
13. STATISTICAL DATA FOR GUYANA ............................................................88 13.1 Notes on statistical data ..........................................................................88 13.2 Gross Domestic Product.........................................................................88 13.3 GDP per Capita .......................................................................................91 13.4 Money Supply..........................................................................................93
14. STATISTICAL DATA FOR JAMAICA............................................................94 14.1 Notes on statistical data ..........................................................................94 14.2 Gross Domestic Product in Current $ terms............................................94 14.3 Gross Domestic Product in Constant $ Terms ........................................95 14.4 Money supply and consumer price index ................................................96 14.5 Wages and GDP .....................................................................................97 14.6 Employment ............................................................................................98 14.7 House building.........................................................................................99
15. ROLE OF TRADE POLICY.........................................................................100 15.1 CARICOM .............................................................................................100 15.2 Negotiations on trade in services issues ...............................................100 15.3 Accreditation of qualifications; (Protocol 2, Article 35 e)........................100 15.4 Harmonisation of regional legislation.....................................................103 15.5 Mutual recognition and reciprocity.........................................................103 15.6 Free movement of natural people..........................................................104 15.7 Market access; (GATS Article XVI) .......................................................105 15.8 Subsidies; (GATS Article XV) ................................................................106 15.9 Right of establishment; (Protocol 2, Articles 35 b and c) .......................107
15.9.2.1 Mode 1 - cross border supply ......................................................107 15.9.2.2 Mode 2 - consumption abroad .....................................................108 15.9.2.3 Mode 3 - commercial presence....................................................109 15.9.2.4 Mode 4 - presence of natural persons .........................................109
15.10 Restrictions on the provision of services .............................................110 16. IMPROVING INDUSTRY EFFECTIVENESS..............................................111
16.1 Market efficiency ...................................................................................111 16.2 Project Size ..........................................................................................111

12
Caribbean Construction Industry Study, 2002
16.3 Transparency ........................................................................................112 16.4 Finance..................................................................................................112 16.5 Information regarding projects...............................................................114 16.6 Human Resources.................................................................................114 16.7 Joint-ventures and partnerships ............................................................115
Appendix I .........................................................................................................118 TERMS OF REFERENCE.............................................................................119 DRAFT PROPOSAL FOR RNM STUDY.......................................................124
Appendix II ........................................................................................................129 UNCPC Construction Industry Listing ...........................................................129
Appendix III .......................................................................................................135 ENGINEERS PRAISE PIARCO PROJECT...................................................136 THE TROUBLE WITH NEW AIRPORT.........................................................136 AIRPORT TEETHING PROBLEMS EXPECTED ..........................................137
Appendix IV ......................................................................................................139 OVER-PRICED AND OVERDUE ..................................................................140 FINANCIAL GIANTS SQUEEZE CONTRACTORS.......................................143
Appendix V .......................................................................................................145 FRAUD!.........................................................................................................146 LAVALIN’S UNSETTLING SETTLEMENT ....................................................148 US$200M TRINMAR PLAN A FARCE – OWTU ...........................................151 SPANCRETE TAKES UDECOTT TO COURT;.............................................152
Appendix VI ......................................................................................................154 Cover Letter and Questionnaires used for the Survey...................................154 CONSULTANTS’ QUESTIONNAIRE ............................................................156
Showing Survey Responses .............................................................................156 CONTRACTORS’ QUESTIONNAIRE ...........................................................166
Showing Survey Responses .............................................................................166 CLIENTS’ QUESTIONNAIRE........................................................................176
Showing Survey Responses .............................................................................176 Appendix VII .....................................................................................................182 Papers presented at A Seminar ........................................................................182
FINANCING THE CONSTRUCTION INDUSTRY .........................................183 ESTABLISHMENT OF COMPETITIVE CONTRACTING IN GUYANA .........187 SUBSIDIES TO THE CONSTRUCTION INDUSTRY IN GUYANA ...............192
Appendix VIII ....................................................................................................195 JAMAICA’S PROPOSALS FOR A REVIVAL IN THE LOCAL CONSTRUCTION INDUSTRY....................................................................................................195
Appendix IX ......................................................................................................213 Summary “Statistics At a Glance” for Each Territory .....................................213

13
Caribbean Construction Industry Study, 2002
2. INTRODUCTION 2.1 “The triumph of market capitalism has stripped politicians of their ideological differences, and replaced real political debate with endless spin and haggling over narrow spending and tax plans...But there is a deeper reason for the disenchantment (with politics, politicians and even the election process)…Suspicion is growing that national governments are no longer in the driving seat – that most crucial decisions on trade and economic policy are being made in the boardrooms of multinational corporations and round the table at the World Trade Organisation.” (Editorial, New Scientist, 9 June 2001) 2.2 As the Editorial quoted above indicates, the balance of power internationally seems now to reside more with the international agencies rather than with local politicians, and it thus becomes crucial that the interests of national communities, particularly of small states, be represented at international fora and that the interests of specific industrial sectors be represented within the negotiations between national, regional and international organisations. It is this imperative that provides the focus for this study. 2.3 The CARICOM has established a Caribbean Regional Negotiating Machinery (CRNM) to negotiate on its behalf on international trade issues with other major trading blocs. The CRNM has accepted a responsibility to consult with interest groups in the region, in order to be better prepared to negotiate on their behalf, and to preserve the interests of the region in the accords arrived at within the various emergent international trade agreements. 2.4 As part of this consultation process, the CRNM has sought participation and feedback from representatives of the private sector in the various territories. This collaborative, consultative process will advise the recommendations that the RNM puts forward regarding policy initiatives that will impact on those specific sectoral interests. 2.5 This study is targeted at the construction and related installation sector and is intended to provide data and analysis that will inform the decisions of the CRNM (and other agencies including governments) about the appropriate strategy and policy to enhance the competitiveness of the industry. 2.6 Specifically, the Terms of Reference for this study required that it should “…examine in detail the Regional Construction & Installation Services market and identify requirements for effective private sector driven competition within the Global market…. Effective competition in the Global Services Market in CARICOM region as envisaged by RNM is described in two dimensions, defined as follows:-

14
Caribbean Construction Industry Study, 2002
• Regional Effectiveness – The ability of regional service providers to successfully compete against international providers for the CARICOM market.
• International Effectiveness – The ability of regional service providers to successfully compete against local and international providers in the international market for construction and installation services, particularly in the EU/Latin Americas.”
2.7 The detailed scope of the study is shown in Appendix 1 (“Terms of Reference” and “Draft Proposal for RNM Study”). From this it will be apparent that the study has two main objectives. One objective is to establish an understanding of the capacity of the local construction industry in the CARICOM region, in terms of its resources and capabilities. This has been addressed by contacting major players in the industry within the region, and requesting data on their capabilities and resources. The second and major objective is to determine how policy initiatives can help enable the industry to better compete for significant construction projects undertaken in the region and internationally. This second requirement has been met by looking at opportunities and obstacles that exist that might be responsive to policy changes.
15
Caribbean Construction Industry Study, 2002
3. METHODOLOGY 3.1 The basic approach to the conduct of this study has been primarily to gather information and canvas the opinions of the members of the professional engineering and allied associations in the countries that comprise CARICOM as well as other major stakeholders in the construction industry. Data on professionals and companies that are active within the different territories have been assembled and compiled, together with as much information about them and their resource bases as could be acquired through a questionnaire and direct contact. Some documentation was already in existence mainly amongst the professional engineering organizations and their membership lists. 3.2 This part of the study has, by virtue of the approach taken, focused on the individuals and organizations that are involved with the engineering bodies in their countries. As the focus of this study was on the firms that are large enough to bid on internationally competitive contracts, and as these firms are almost inevitably involved with the professional engineering organizations in their home countries, the coverage that has been achieved is representative of the industry in the context of the study. 3.3 The second part of the study, which looks more at policy issues and characteristics of competitiveness, was conducted by means of a survey of stakeholders in the construction and related industries, personal interviews and seminars. The questionnaires were developed to acquire data and information from three different interest groups, the clients, consultants and contractors. The three types of questionnaires were distributed to all of the major players in each of the areas – Trinidad & Tobago, Jamaica, Barbados, Guyana and the Organisation of Eastern Caribbean States (OECS). Given the nature of the survey and the natural conservatism and reservedness of the target group, the achieved response rate was satisfactory. 3.4 The questionnaire formats used for each of the three groups surveyed are shown in Appendix VI, and these also record a summary of the responses received from each of the particular groups involved. Many of the returned questionnaires also included comments and the majority of these are shown grouped with the relevant questions. 3.5 Discussions at the various industry seminars that were organized in Barbados, Jamaica, Grenada, Guyana, St Lucia and Trinidad made clear that the participants were intensely interested in the study, but were of the opinion that using a questionnaire alone would not be the best means of acquiring the information. Consequently, this enquiry was treated as a Delphi-type study, whereby experts were canvassed for their opinions. This information was then analysed and used to help construct the questionnaires, and the responses from the questionnaire survey were then synthesized into a ‘consensus’ position, as presented in this report. Finally, representatives of the same group of experts

16
Caribbean Construction Industry Study, 2002
were asked to assess, during a Reflections Group meeting, how well this distillation represented their opinions. The comments of this Reflections Group led to one or two minor modifications to this report, and a separate report on the deliberations of the Group has been prepared, 3.6 In order to contextualise the study in terms of competitiveness intra- and inter-regionally the CARICOM construction industry has to be viewed against the background of the industry internationally.

17
Caribbean Construction Industry Study, 2002
4. REVIEW OF THE ROLE OF THE CONSTRUCTION SECTOR
4.1 The global construction sector itself is a core economic activity for many countries and the global construction industry generates revenues in excess of US$ 4.4 trillion. The sheer size of the market presents significant opportunities for competent construction firms no matter where they are based, given the necessary interest, opportunities and support. The individual firm must be interested, and politically and economically they must receive support. Given these prerequisites, the opportunities in the wider international market are immense, and are not restricted to the larger firms, as small and medium-sized companies with appropriate expertise should also find niche opportunities. 4.2 The definition of the construction sector used in this study is based on the World Trade Organization's Services Sectoral Classification used by the majority of Member countries (i.e., those countries who are signatories to the World Trade Organization and thus the General Agreement on Trade in Services (GATS). This definition includes: General construction work for buildings: includes construction work (including new work, additions, alterations and renovation work) for all types of buildings, residential or non-residential, whether privately or publicly owned. General construction work for civil engineering: covers construction work for structures other than buildings such as highways and streets, railways an airfield runways, bridges and tunnels, waterways and harbours, dams, pipelines, communication and power lines, mining and manufacturing plants and stadia and sports grounds. Installation and assembly work: includes such activities as the assembly and erection of prefabricated constructions, installation work for hating and air conditioning, water plumbing, gas fitting, electrical wiring, fire alarm construction, insulation, fencing and lift construction. Building completion and finishing work: this item covers special trade construction work for the completion and finishing of buildings such as glazing, painting, floor and wall tiling, carpeting, carpentry, interior fitting and decoration, ornamentation fitting. Other: includes pre-erection work at construction sites, as well as special trade construction work such as foundation work, water well drilling, roofing, concrete work, steel bending and erection, and masonry work. It also covers renting services related to equipment for construction or demolition of buildings or civil engineering works, with operator. 4.3 One of the most characteristic features of the construction industry in most parts of the world is that it is highly cyclical, and subject to large and unpredictable swings in demand. The construction sector in Canada, for example, is three times as volatile as the service sector in general and nearly 50% more volatile than the manufacturing sector1. Over the years, the
1 Note: some of the information in this section is derived from the Canadian publications at website http://www.dfait-maeci.gc.ca/tna-nac/menu-e.asp.
18
Caribbean Construction Industry Study, 2002
construction industry has adapted to operating successfully in a ‘feast-or-famine’ market environment, and indeed its ability to survive these conditions is now being used as a model for other industries. There are a number of areas in which the construction industry differs from manufacturing and other services, and amongst the more important of these are its approaches to financial management and employment. 4.4 In order to limit their financial exposure to market downturns, firms in the construction industry operate with overheads that are very low relative to the size of the projects that they undertake. Financing and surety instruments have been developed to facilitate this. Contractors traditionally use bank and supplier credit to finance their operations, and equipment is often leased or financed through a ‘chattel mortgage’. Performance bonds are available to clients, to limit their risk of engaging a contractor with a limited asset base, and hence, little recourse for the client in times of trouble. Companies have also tended to limit their overheads by being specialized and by operating within closely defined areas of responsibility. Typically, they come together to construct a specific project and then go their separate ways. Very few construction firms provide the full range of services required to carry out the entire construction process (e.g., development, design, engineering, construction). 4.5 Employment and hiring practices in the construction industry are designed in recognition of the implications of the boom-bust cycle. Most workers are hired on a short-term or project basis - often with union acceptance, although this goes against their general principles. Firms in the industry only employ a strategic nucleus of key personnel over the long term. As a consequence, firms are able to expand and contract their operations (and enter and exit the industry) in a relatively fluid manner in response to changing business conditions. This need to remain flexible is also addressed by the widespread use of small sub-contractors to undertake elements of the work. Use of sub-contractors relieves the main contractor from the need to employ specialist personnel, and hence reduces the firm’s core work force. 4.6 Another characteristic feature of the construction industry worldwide is its geographic diversity within national boundaries. Construction projects are spread out across a country, though they do tend to cluster geographically in direct proportion to demographic and economic factors. Although patterns of clustering can be observed in retrospect, they do not permit accurate forward planning, because of the variability of project type, size and precise location. 4.7 To position themselves strategically, contracting firms tend to specialize by concentrating on a specific type of project. Broadly, the construction market comprises three major sub-sectors: residential construction; institutional, commercial and industrial construction; and engineering construction. In the more developed economies, each accounts for approximately one-third of the total market. All three are quite distinct. They respond to different market forces,

19
Caribbean Construction Industry Study, 2002
use different construction techniques and materials, and employ different labour forces. 4.8 Following on from this is another characteristic feature of the industry, which is its strong requirement for a local presence. Construction cannot be carried out at a distance. It is impossible to build a road in Trinidad for installation in Barbados, for example. It is a site-specific activity, requiring physical presence and hands-on management. These characteristics mean that firms in the industry that want to work in other parts of the world have to have knowledge of local labour conditions and regulations. 4.9 The effects of these characteristics, i.e. specialization, low overheads, the need to operate locally, and geographic dispersion have resulted in an industry that is composed primarily of a large number of small firms. 4.10 It is of interest here to consider the implications of the developmental status of the country on the structure and future prospects for its construction sector, as this may limit the focus of further investigations. Ranko Bon, a noted professor of construction economics at Reading University, has written quite extensively on this issue and he writes that “Construction is intimately related to industrialization and urbanization…the share of construction in GNP first grows and then declines as GNP per capita increases. The reasons for the inverted U-shaped relationship include less population growth, less migration, and more physical capital already in place in later stages of economic development. The same relationship holds for any one country over time. 4.11 Economic development is generally unidirectional, that is, each country goes through similar stages of economic development. Moreover, there is growing evidence that the inverted U-shaped relationship does not hold only for the share of construction in GNP, but for its volume also. In other words, the decline of construction activity switches from relative to absolute decline at some level of economic development. This refers to long-term trends, rather than short-term fluctuations that can be associated with business cycles. 4.12 The picture that emerges from several studies suggests that the construction sector follows the economic destiny of manufacturing - its primary partner in economic development. As income increases, increasingly less of it is used to satisfy the basic needs - food, shelter, and clothing. At first, the share of agricultural products in consumption is reduced and the share of industrial products and services is increased; later on, the share of industrial products drops, as well. At the same time, labor migrates from low to high productivity sectors. This is reflected in the construction sector's performance. It grows and declines together with manufacturing.” (“Whither Global Construction”, Ranko Bon, http://www.eceru.reading.ac.uk/whither.html)

20
Caribbean Construction Industry Study, 2002
4.13 According to this model, the activity curve for construction over an extended period should take the shape of an inverted-U. The higher the level of development the further down the tail of the inverted-U the industry will be. Thus, if we look at the industry GDP over a reasonable period of time we should see some a part of this inverted-U.2 4.14 Accepting certain reservations, the logic is that the industry’s activity levels will decline as the population levels stabilize and as a state of economic development is achieved, because the economy becomes more or less ‘saturated’ with constructed facilities. When this state is reached, the need for new construction falls off, and repair and maintenance work become dominant elements of the industry workload. When this occurs apparent productivity will also decline, as Bon goes on to say, “The declining share of agriculture and manufacturing in total employment does not mean that the output of these sectors is declining also. The growing productivity of agriculture and manufacturing have compensated for the employment trends. This is not true of construction. Even in the US, which is still the international productivity leader in most sectors, construction is the only major sector of the national economy with declining productivity since World War II. One reason for this is the increasing share of maintenance and repair construction in total construction, as these activities tend to be more labor-intensive than new construction activities. This means that the employment trends in construction translate directly into declining volume of output.” (ibid Bon) Thus, another indicator of economic development, or consequence of economic development in a country is an apparent decline in the productivity of the construction sector 4.15 This does not fit well with the findings of the Egan Report in which it states “…Despite low levels of investment, falling employment and cyclical downturns, the industry's output has maintained a strong long term upward trend in real terms. Over the last forty years growth in real output has broadly matched GDP. Furthermore, labour productivity appears to have risen by more than 5% per year in real terms since 1981, faster than the average for the economy as a whole.” The report recommends that the industry set itself a target for productivity growth (i.e. an increase in value added per head) of 10% per year over the next few years.
2 Unfortunately, this seems impossible either to confirm or refute empirically, as whatever the shape of the curve, it can be explained away as being the upward slope early on in the development process, on the level at the peak or on the late downward slope, or even as an anomaly due to the period chosen, or for some other reason. In other words, you can make almost any judgment call on the state of development of the economy and substantiate it by reference to the shape of the curve. For example, the shape of the construction industry GDP curve (in terms of current $s) for T&T is that of a U, not an inverted-U (See section on Discussion of Statistics, p48 et seq). Even the constant $ GDP curve shows an inverted-U followed by a U. What conclusion can we draw from that? One could say that T&T is far down the development cycle and only now on its way up to the plateau at the top of the main developmental inverted-U, but by the same token, any shape could be massaged to fit the prescription including the exact opposite!
21
Caribbean Construction Industry Study, 2002
4.16 It is difficult to reconcile the view of the UK construction industry presented by Egan with that of Bon. Bon suggests that once the economy reaches a suitably developed state its construction industry will require a steadily rising labour force, as it undertakes more labour-intensive maintenance and repair work, and with this there will be a matching decline in productivity (as measured by output per capita). The logic being that there will be the same sort of levels of output but more people will be involved in its production. This ignores changes in the capital intensity of production, but this is a common failing. 4.17 These discussions are relevant to our study because, if Bon is correct, there should be trends that will be experienced in CARICOM, the worst effects of which could be headed off by appropriate early planning. Again, if Bon is correct, then determination of the developmental status of the individual territories may help in the selection of strategies to address the most important issues for their future. This may be most important for economies that are close to the developmental peak at which the construction GDP begins to decline, and when the emphasis of construction switches from new-build to repair and maintenance. This switch would have significant implications for the mix of skills necessary to service the industry effectively, and would thereby impact on the education and training needs of those communities. This point becomes even more apposite in view of Bon’s further projections of the trends in emphasis of the construction industry in different countries. Hence, Bon states: “As construction goods such as buildings, railroads, and bridges are non-tradeable, what are the implications of the above analysis for international trade in construction services? How are trade patterns likely to be influenced by economic development? A large proportion of construction activity remains local, regional, or national at all stages of development. The segment of the construction sector that engages in multinational, continental, or global construction activity may be growing, but it is still relatively small. Only with respect to this segment is it meaningful to speak about the global market in construction services. 4.18 The global market in construction services is far from restricted to AICs (advanced industrial countries). Both LDCs (less developed countries) and NICs (newly industrialized countries) already play important parts in the global market. The weak flows emanating from today's LDCs are likely to become ever stronger, while those emanating from NICs are likely to follow the fate of AICs. Of course, today's AICs may continue providing highly specialized construction services to NICs and LDCs. These services may focus on high-technology or capital-intensive projects, as well as on highly specialized maintenance and repair construction, which is growing in AICs. Nevertheless, it is reasonable to expect that today's AICs will in time become substantial importers of construction services. 4.19 The argument concerning the shifting patterns of international trade in construction materials and components is similar to that pertaining to the

22
Caribbean Construction Industry Study, 2002
construction services, but the former market is considerably larger and more dynamic than the latter. The higher the capital intensity of production and distribution of a particular construction material or component, the greater the likelihood that AICs will maintain their dominance in that market, and vice versa. However, NICs and LDCs are likely to play increasingly important rôles in international trade of material-intensive and labor-intensive construction materials and components. This is true of product life cycles and international trade in other sectors. Namely, new products are initially exported from AICs and imported by all other countries; as they reach maturity, these products are exported by NICs and ultimately by LDCs; at the end of their product life cycles, AICs import the mature products first from NICs and ultimately from LDCs. Textile and car industries are examples of this process. 4.20 In early stages of economic development the construction sector grows faster than other sectors. As industrialization and urbanization slow down in NICs, so does the construction sector. In AICs the construction sector ultimately declines absolutely, not only relatively. What does this mean for the construction market on a continental scale? It goes without saying that there will always be significant projects to build on every continent, but we are concerned with broad trends and dominant patterns of change.” 4.21 Thus, depending on the developmental status of the countries concerned, their role in the international trade in construction services will be different. The construction industry in the AICs will be in decline, and looking abroad for opportunities to survive if not expand. NICs will be exporting construction services, and LDCs will be exporting construction labour and materials. Under this prognosis, the CARICOM Community should be becoming active in exporting less expensive labour and materials to other countries. This, of course, will only be possible where there are sufficient professionals, technicians, trades-people and labour available to service both the home industry and the foreign market. It also presupposes that there will be opportunities in the form of open-bid projects in foreign markets and that there will be no restrictions on access to those representatives of the industry. Most people would perceive the countries of the CARICOM region as being LDCs except Trinidad & Tobago which may creep into the category of NIC and Barbados, which is an MDC according to some criteria . Thus, according to Bon’s analysis, we would expect most of the territories to have fully fledged construction sectors, involved predominantly in new-build construction, and with relatively low wages and salaries and material costs that make them reasonably competitive on export markets.
23
Caribbean Construction Industry Study, 2002
5. PROFILE OF THE SECTOR WITHIN CARICOM AND OTHER COUNTRIES
5.1 Small firms 5.1.1 We are concerned with the construction sector specifically, and all of the various ‘players’ represented within that sector – the professionals (like the engineers, architects, quantity surveyors, land surveyors), the technicians (like the surveying technicians, draftsmen, supervisors and inspectors), the tradesmen and craftsmen (like the masons, carpenters, steel-fixers and plumbers), and the labourers. Table 1 in Appendix 2 gives a listing of the industrial sectors that are involved in the “construction and installation” industry. As can be seen, it is an extensive list, with a wide range of skills needed for all of the various activities involved. 5.1.2 Because of this wide range of ‘players’ the sector is an important provider of employment, usually with around 10% of the labour force employed. However, much of this employment is casual or temporary, and is quickly laid off when there is a downturn in demand. It is a characteristic that most of the firms registered in the sector are very small – even in developed economies like that of the USA, some 80% of construction firms have one or no permanent employees (over 60% are on record as having no permanent employees!). Similarly, in 1995, in Canada only 1% of general contractors had revenues exceeding $20 million, while 80% had revenues less than $250,000. Trade contractors were, of course, much smaller; 80% had revenues under $25,000, while 4% had revenues over $1 million. 5.1.3 The existence of these small firms depends on their ability to win projects and their ability to hire-and-fire as their work-load demands. Many of these small firms cease to exist in any real sense when they do not have a project to work on. The market faced by most of these small firms is for small scale infrastructure (e.g. driveways and car parks) and minor building projects, and it is hotly competitive with very low profit margins. It is difficult to estimate the overall size of this segment of the construction industry, either in terms of number of firms or employment at any point in time, as most of the firms are not registered, and employment levels vary from day-to-day as the projects demand. 5.1.4 The construction industry is also very susceptible to economic fluctuations. As J.M. Keynes showed, the accelerator effect causes the engineering industry to suffer from exaggerated booms and busts as more normal business cycles affect the rest of industry. When the going is good, engineering, and especially construction, booms with rapid and high levels of growth of demand. When economic downturns occur, the construction industry plummets. This is a feature of the industry internationally. The construction sector in Canada, for example, is three times as volatile as the service sector in general and nearly 50% more volatile than the manufacturing sector. This rapid and wide level of fluctuation

24
Caribbean Construction Industry Study, 2002
means that the industry must have a significant ‘buffer’ of firms that come and go; they take up the slack when there is excess demand and fade when there is a lack of demand. Thus policy should not attempt to make this ‘buffer’ permanent as this would be counter-productive in the longer term. 5.1.5 The market opportunities that exist in the wider international market are not restricted to the large construction firms, as small and medium-sized companies with appropriate expertise are also in demand. However, it is obviously impossible in a study of this nature and duration to look in detail at the vast majority of the industry that consists of the small, one- or two-man firms. They rarely work to any formal contract, and have little in the way of resources3. More to the point here, they would not usually be able to show serious interest in larger projects or to consider bidding for projects overseas. This does not mean that they should be ignored in terms of training opportunities, fiscal incentives, etc. However, in terms of the overriding policy issues in the instant context we must necessarily focus on the larger, more permanent firms that can apply for prequalification in order to bid for internationally tendered projects. The special interests and concerns of the smaller firms should be the focus of a much larger study, which should address some of the issues that have been identified here – perhaps the financial issues in particular. 5.2 Larger firms 5.2.1 The small number of firms that are larger in size, also characteristically dominate the market in terms of value of work done. This is because they are in a position to win the larger projects which although few in number, are also of a very much higher value than the vast majority of projects4. Thus the focus here is on a relatively small number of firms, but on a very large percentage of the GDP of the sector. 5.2.2 Neither the projects nor the firms that are considered large in the local context, would normally be considered large in international terms. The limited number and scale of the projects naturally limits the size that a firm can afford to grow to, and be in a position to sustain through a continuous workload. Thus, ‘large’ must be recognized as being a relative term. However, given these market limitations it becomes even more critical that the large local firms win the large local projects or their own future prospects will be handicapped and the local industry will find its sectoral GDP shrinking. For these very valid reasons, the larger local firms must feel that they are getting a fair shot at winning the larger local projects.
3 In terms of policy that would help them survive and grow (after all, the big firms now were once small), the most important criterion would be a steady demand and hence (hopefully) a steady workload, which would enable them to justify keeping employees on a more permanent basis, and to gradually build up from there. 4 A typical, lower income house would cost in the region of US$20,000, a large road or pipe-laying project would typically cost in the region of US$20 million.

25
Caribbean Construction Industry Study, 2002
5.2.3 There is, however, a very clear and strong perception within the industry that local firms are disfavoured and disadvantaged in internationally bid projects, especially those that are in any way funded by international agencies or organisations. This has been reported in formal studies undertaken by the Department of Civil Engineering at UWI5, and there is a vast array of less formal, anecdotal support. It is also very apparent in the responses to the survey undertaken for this study in which the majority of firms involved in construction work feel that they did not stand an equal chance of winning such projects. The most popular reasons identified were preferences of the client, and of the funding agency, for foreign firms. Interviews and verbal responses at meetings indicated that these preferences were expressed and implemented in different ways, but that the predominant feature was the use of prequalification terms that were designed to be exclusive. 5.2.4 The industry, especially in Trinidad & Tobago, has a great belief in its own technical ability to undertake the construction projects that arise within its home country, and within the region. (See for example the letter from Clifford Murray re the new airport terminal project in Trinidad (Appendix 3)). For the most part, the major projects that do arise are of no great technical difficulty, involving, as they do, mainly road and pavement construction, pipe laying and building works. This self-belief is substantiated by the record of performance of local firms, especially when compared with foreign firms, on local projects. There are no figures available to substantiate this success rate, but again there is a vast body of anecdotal evidence. 5.2.5 It seems reasonable to accept that there is a more than adequate level of technical expertise amongst local professionals, although there is a shortage in their numbers. Also, we must accept that local craftsmen, tradesmen and labourers will, in all probability, be doing the majority of the physical work whoever wins the job6; and, we can further accept that the local firms must have some sort of a price advantage, because local salaries, wages and rates of pay are much lower here than in the UK, for example; then, the local industry finds it difficult to accept that foreign firms can consistently beat them in the bidding for local projects unless the ‘playing field’ is not level. This is particularly the case on projects like pipe-laying projects, where the ‘technology’ is low and well within the competence of almost any contractor of any substance. How can local firms with undoubted competence, similar direct costs and lower overhead costs consistently lose bids to their foreign counterparts? It is the lack of a satisfactory 5 For example, “Perceptions of Bias in Procurement Procedures”, (with Roger C. Anthony), Proc. International Symposium, CIB W-65, Santiago, Chile, March, 2000 and “Implementing ISO9000 – The Caribbean experience” Proc. International Symposium, CIB W-78, Lisbon, Portugal, May 2000 6 A number of complaints were received during our survey about Chinese firms that bring with them their entire labour force (apparently indentured labourers of some sort), and house them in temporary barracks on site. Though relatively rare, these projects created considerable resentment and controversy.

26
Caribbean Construction Industry Study, 2002
answer to this latter question that creates the perception of bias in the award of these contracts. 5.2.6 Thus, local contracting and consulting engineers are particularly concerned to try to make sure that the ‘playing field’ is as level as it can be, if not tilted in their favour. After all, why should they not have an advantage – it is their country (as one contractor observed)? 5.2.7 The principal problem that was identified in our survey as holding local firms back in bidding for large projects (apart from the perceived bias on behalf of the awarding client and the lending agency) is the absolute size of the projects. For example, when a major pipe-laying project comes along it tends to be for a major improvement to the national network. This makes it too large, as a single project, for local firms to take on single-handedly. However, there is little technical or other reason why a project, involving say 20 kilometers of pipeline, should be one project rather than say 4 projects of 5 kilometers each. This rather simple disaggregation is used to illustrate the point but the same logic holds for all large projects where the main contractor has, of necessity, to split large projects into smaller components which are more often than not subcontracted to smaller firms. A single project may be more convenient in administrative terms for the lending agency, but problematic for the local industry; whereas four projects of five kilometers each would be ideal for the industry, and, in reality, only a little less convenient for the lending agency. Thus, representatives of local consultants and contractors made numerous calls during this study for more sensitive and sensible project definition and ‘packaging’, so as to try to include local firms in the bidding. 5.2.8 The issue of the size of the firms, and the projects that are available, has a number of parameters that are of concern to local industry. The main problems revolve around the financial backing and risks involved, and the availability of skilled (and experienced) staff. A majority of the firms that were interested in bidding for projects internationally indicated that finance was a problem, both in terms of the ‘exposure’ that large scale foreign contracts would create and the working capital required. The ‘exposure’ issue concerned the scale of the risk involved, in relation to the size (capitalization) of the firm, as well as to the bonding requirements of such projects. Firms were unwilling and/or unable to risk all their assets as collateral for bonds on foreign projects. 5.2.9 One consultant asked, during our study, if one wanted to build a restaurant expected to cost around US$1million, who would one choose to design or build it? Would one want a company that has designed or built five US$20million hotels or one that has designed or built five US$1million restaurants in the past five years? As it stands, the prequalification criteria and evaluation methods used by most of the international lending agencies would choose the bigger firm that had designed or built the hotels. This is one reason why local firms lose out; they tend to build the ‘restaurant-size’ not the ‘hotel-size’ projects, so their record

27
Caribbean Construction Industry Study, 2002
is not so loaded with big jobs. They do not have access to the large numbers of huge jobs that the big international firms have available, and even when a relatively large job in local terms in their own country comes up for tender, they lose out in the prequalification stakes. This problem was mentioned so often that it is clearly something that needs to be addressed by the World Bank, the CDB, the IADB and any other lending agency that operates in the CARICOM region, as well as the clients, particularly the governments which have to repay loans with taxpayers’ money.

28
Caribbean Construction Industry Study, 2002
6. CONSTRUCTION INDUSTRY EFFICIENCY 6.1 The Caribbean construction industry 6.1.1 The efficiency of the construction industry in the Caribbean area can be described as being very variable. On the one hand some firms can be world class in performance in terms of quality, cost and time, whilst at the same time others can be extremely inefficient and backward leading to poor quality, cost over-runs and late delivery. The industry can be very good and it can be very bad7. Given the extremes that exist, it is hardly sensible to think in terms of the average performance for the industry, but effectively what the industry needs is for that average to be raised very significantly, with much less variability. 6.1.2 A construction industry that is efficient and successful is in the interests of everyone. All stakeholders benefit from quality housing, infrastructure, schools and sports stadia that are constructed economically and efficiently. At their best, the firms involved with the construction industry in the Caribbean are on par with those in the industry in other parts of the world. However, there is no doubt that, on average, substantial improvements in performance are possible. It is also clear that the firms within the industry locally are not as competitive as they should be against firms from other parts of the world8. If the industry is to satisfy all of its stakeholders and to become ‘world class’, it will have to improve the quality, timeliness of delivery and efficiency of its average project. 6.1.3 Experience elsewhere has shown (at least, according to Egan) that sustained improvement is achievable if all the efforts of the industry are focused on delivering the value that its stakeholders expect, the quality that its customers want, with the economy that the industry needs. This improvement depends upon the industry being prepared to change the procedures it applies that lead to the waste and poor quality experienced now. 6.2 The Egan Report 6.2.1 It would be remiss of us not to take a closer look at the contribution made by other researchers conducting similar studies in other parts of the world. Notable amongst these, as mentioned earlier, is the study undertaken by Sir John Egan who was Chairman of the Construction Task Force, set up by the British Government to report on the performance of the construction industry in the UK. Many of the points raised in the Egan Report are of specific relevance to this study, and it may be of interest to reproduce the Executive Summary from that report, as it will advise the work of this study.
7 This creates a major problem for clients – how to know which level of performance they will get on their particular site, or how to pick firms that will deliver world class performance? 8 A significant number of professionals in the region are of the opinion that the support, subsidies and incentives (albeit often hidden) available to foreign firms create unfair terms of trade and are largely responsible for the imbalances in ‘competitiveness’ as measured by winning internationally competitively bid contracts.

29
Caribbean Construction Industry Study, 2002
6.2.2 The original text from the Executive Summary of the Egan report is in italics on the left below, and it is accompanied by a commentary in plain text on the right, regarding the relevance of the various points to the industry in the Caribbean, and what our aspirations should be.
Executive Summary – Egan Report Caribbean Industry Commentary 1a) The UK construction industry at its best is excellent. Its capability to deliver the most difficult and innovative projects matches that of any other construction industry in the world
1b) The same claim may not be made in general for the industry in the Caribbean, but we can at least aspire to doing most projects well, and efficiently.
2a) Nonetheless, there is deep concern that the industry as a whole is under-achieving. It has low profitability and invests too little in capital, research and development and training. Too many of the industry's clients are dissatisfied with its overall performance.
2b) These comments apply, perhaps even more so, to the industry in the Caribbean, with some minor exceptions.
3a) The Task Force's ambition for construction is informed by our experience of radical change and improvement in other industries, and by our experience of delivering improvements in quality and efficiency within our own construction programmes. We are convinced that these improvements can be spread throughout the construction industry and made available to all its clients.
3b) Again, these comments apply, perhaps even more so to the industry in the Caribbean.
4a) We have identified five key drivers of change which need to set the agenda for the construction industry at large: committed leadership, a focus on the customer, integrated processes and teams, a quality driven agenda and commitment to people.
4b) It would appear sensible to assume that these same parameters are of equal importance to the attempts being made in the Caribbean to improve the effectiveness of the industry, especially as they appear to be both culturally neutral and eminently sensible.
5a) Our experience tells us that ambitious targets and effective measurement of performance are essential to deliver improvement. We have proposed a series of targets for annual improvement and we would like to see more extensive use of performance data by the industry to inform its clients.
5b) Again, these comments apply, perhaps even more so to the industry in the Caribbean. There is a serious shortage of written information and statistical data about the industry and its relative performance in the Caribbean, perhaps largely because the vast majority of the firms in the construction industry are privately owned, and consider their data to be private and to define their competitive edge. Sadly, also, engineers in the Caribbean do not tend to write reports on their project experiences for publication. Because the data and information are not available, it is difficult, if not impossible, to use performance data to compare firms, or project teams and to identify strengths and weaknesses. When you don’t have a benchmark to compare against, it is hard to assess whether you have done well or badly.

30
Caribbean Construction Industry Study, 2002
6a) Our targets are based on our own experience and evidence that we have obtained from projects in the UK and overseas. Our targets include annual reductions of 10% in construction cost and construction time. We also propose that defects in projects should be reduced by 20% per year.
6b) The same targets should be achievable for the industry in the Caribbean, the most difficult aspect will be establishing a current standard against which improvements can be measured. Without intra- and inter-project performance data it is difficult to say whether an improvement has been achieved or not. This is not to say that numerical targets should not be used, simply that an agreed standard (benchmark) is necessary as a starting point or datum level. For this to happen, firms will have to be more willing to divulge financial and performance information.
7a) To achieve these targets the industry will need to make radical changes to the processes through which it delivers its projects. These processes should be explicit and transparent to the industry and its clients. The industry should create an integrated project process around the four key elements of product development, project implementation, partnering the supply chain and production of components. Sustained improvement should then be delivered through use of techniques for eliminating waste and increasing value for the customer.
7b) The same process changes will be necessary for the construction industry in the Caribbean to achieve higher performance objectives. Similarly, the four key elements seem to provide an appropriate structuring for an improved project delivery process.
8a) If the industry is to achieve its full potential, substantial changes in its culture and structure are also required to support improvement. The industry must provide decent and safe working conditions and improve management and supervisory skills at all levels. The industry must design projects for ease of construction making maximum use of standard components and processes.
8b) Again, the same sort of cultural and structural changes will be necessary for the Caribbean industry to fulfill its potential. These cultural changes should lead to improved work conditions on site, as well as working relationships both within the firm and between the different organisations working together on a specific project. The use of standard components and processes would also improve productivity, analysis of performance, maintainability, and integration with the manufacturing industry.
9a) The industry must replace competitive tendering with long term relationships based on clear measurement of performance and sustained improvements in quality and efficiency.
9b) The international trend away from competitive tendering is one that has strong academic underpinnings. This ‘traditional’ approach has been the norm in most parts of the world for much of the history of the industry, so it has been difficult to change. The same will clearly be the case for the Caribbean construction industry. The private sector already appears to have taken this advice on board, and organisations like Guardian Holdings Ltd., in Trinidad and Tobago have established long term relationships with a project manager, consultant architect and
31
Caribbean Construction Industry Study, 2002
contractor who have been involved in a series of projects for them. For the public sector, although it desperately needs to change, it is not recommended that it move from the transparency of the competitive tendering process that exists – mainly because of the perceived likelihood that race (and other forms of discrimination) nepotism and corruption will direct the process of contract award, rather than merit and competence.
10a) The Task Force has looked specifically at house-building. We believe that the main initial opportunities for improvements in house-building performance exist in the social housing sector for the simple reason that most social housing is commissioned by a few major clients. Corporate clients - housing associations and local authorities - can work with the house-building industry to improve processes and technologies and develop quality products. We propose that a forum for improving performance in house-building is established.
10b) All of the Caribbean countries have a backlog of demand for housing. Much of this shortfall is for the low-income segment of the community that is normally catered for by ‘social housing’. There is a very powerful need for an improvement in house-building performance to satisfy this demand – both in terms of the design quality and the efficiency of the construction process so that appropriate, affordable housing can be made available.
11a) The Task force has concluded that the major clients of the construction industry must give leadership by implementing projects which will demonstrate the approach that we have described. We want other clients, including those from across the public sector, to join us in sponsoring demonstration projects. We also wish to see the construction industry join us in these projects and devise its own means of making improved performance available to all its clients. Our ambition is to make a start with at least £500 million of demonstration projects.
11b) Whilst it would be nice to have a similar target of indigenous demonstration projects in the Caribbean, if we cannot get the Government and other major clients to agree to fund them then we will have to depend upon the experiences of the industry on projects in other parts of the world. The key issue here seems to be our ability to show those involved that there are substantial benefits to be gained by all concerned from trying a new approach, and from sharing that experience with others in the industry.
12a) In sum, we propose to initiate a movement for change in the construction industry, for radical improvement in the process of construction. This movement will be the means of sustaining improvement and sharing learning.
12b) The introduction of certification of quality systems (to the ISO-9000 series of standards) and Total Quality Management, with its institutionalisation of the process of sustaining improvements, are two pathways to changing the construction industry for the better. This should be less difficult to achieve than the need to share learning between organisations, that have traditionally been very unwilling to ‘discuss their business’ with others. Perhaps the policy of building longer-term relationships between organisations will lead to a greater openness with data and information on performance.
13a) We invite the Deputy Prime Minister to turn his Department's Best Practice Programme into a knowledge centre for
13b) Within the Caribbean, the regional nature of The University of the West Indies (UWI) makes it the most suitable agency to

32
Caribbean Construction Industry Study, 2002
construction which will give the whole industry and all of its clients access to information and learning from the demonstration projects. There is a real opportunity for the industry to develop independent and objective assessments of completed projects and of the performance of companies.
act as the organisation to house the knowledge centre for construction in the Caribbean. Staff within the Department of Civil Engineering at UWI are trying to find seed funding to initiate a database on construction costs for projects in Trinidad & Tobago. This database should allow both improved estimating before projects are started and comparisons to be made of performance on projects after completion. This work needs to be expanded, both within T&T and the other Caribbean countries. The accessibility of electronic data from a website suggests that this would be the appropriate medium for dissemination of the information obtained.
14a) The public sector has a vital role to play in leading development of a more sophisticated and demanding customer base for construction. The Task Force invites the Government to commit itself to leading public sector bodies towards the goal of becoming best practice clients seeking improvements in efficiency and quality through the methods that we have proposed.
14b) The role of the Government as a client for construction is perhaps more important in the Caribbean than in the UK or elsewhere, and thus its commitment is even more important to any initiative to try to improve the performance of the industry.
15a) The members of the Task Force and other major clients will continue their drive for improved performance, and will focus their efforts on the demonstration projects. We ask the Government and the industry to join with us in rethinking construction.
15b) The objective of this study is to find ways for the industry itself to improve its performance and competitiveness, as well as to identify policy initiatives that governments could put into place to improve their interactions with the industry, and to foster the improved performance and competitiveness that we are seeking.
6.2.3 It should be clear from this brief outline of the Executive Summary of the Egan Report and how its findings may be relevant to our study that there are many areas of common ground.

33
Caribbean Construction Industry Study, 2002
7. SUMMARY OF SURVEY OF CONTRACTORS THROUGHOUT THE REGION.
7.1 Note
7.1.1 The percentages given in this Summary do not always add up to 100%, this is because the respondents often missed out questions, simply made comments, or gave inappropriate answers (which were thrown out), or because they gave multiple answers when more than one answer was relevant. To reduce confusion, we have used percentages throughout. 7.1.2 Note also that there were significant regional variations in the responses given, for example, as between the contractors of Trinidad & Tobago and Guyana. For the purposes of this study and the formulation of regional policy, it is presumed that the overall summary position is the relevant viewpoint. Thus, the data have simply been accumulated and converted into a common currency base where necessary. The data for the individual territories will be preserved so that they can be reviewed at some future date for country specific policy guidelines if required.
7.2 Management issues 7.2.1 A total of 33 contractors responded to our survey. These were distributed, 3 from Barbados, 1 from the Cayman Islands, 2 from Dominica, 3 from Grenada, 4 from Guyana, 4 from Jamaica, 8 from St Lucia, 2 from St. Vincent and 8 from Trinidad & Tobago (T&T). This may seem a relatively small number, but it addresses the needs of this study as it does include responses from most of the larger contractors in the region. The vast majority of these firms have been in business for more than a decade, with 61% of the responding firms having been established before 1990, 24% being established between 1990 and 1995, and the balance of 15% between 1995 and 2000. 7.2.2 The main areas of business for these firms show that 88% of the firms undertake civil infrastructure work (e.g. roads, bridges and pipelines), 76% of them undertake commercial projects and 61% do residential work, and a further 61% are involved in industrial work. 21% are involved in ‘Other’ work that was not specified. All of the responding firms, naturally, work in their home country, and in addition 31% of them operate within the CARICOM region, and 10% operate internationally. 7.2.3 The specific areas of expertise of the firms show that 73% specialize in earthworks and foundations, 61% in structural engineering, and a further 61% focus on roofing, 52% in road and pavement laying, and 30% on decorating and finishing works, 24% on landscaping, and 6% on air conditioning, plumbing and electrical works. 3% also indicated involvement in ‘Other’, specifying ‘Utility Infrastructure’. 7.2.4 Most of the firms were limited liability (55%) with the rest being privately owned (30%), sole proprietorships (15%) and partnerships (6%). The management structures are relatively simple and old-fashioned in that 82% are

34
Caribbean Construction Industry Study, 2002
organized as a simple Line & Staff structure with another 12% being organised on a project basis. 7.2.5 The firms seemed not generally to have been involved in joint ventures or partnerships with other firms, with only 6 (18%) having entered into a joint venture with a local partner and one (3%) in joint ventures with more than one local firm, and two (6%) having entered into joint ventures with one foreign firm and a further two (6%) having entered joint ventures with more than one foreign firm. One firm (3%) had entered a partnership with one local firm, and three firms (9%) had entered partnerships with more than one local firm. None had entered partnerships with a foreign firm. However, a number of other firms indicated verbally that they entered joint ventures on a project by project basis, as required, and another wrote, “We have none at the moment but we are in discussions on one local and one foreign.” 7.2.6 Figure 7.1 below shows the numbers of professionals employed in the contracting firms that responded to our survey. Figures 7.2, 7.3, 7.4 and 7.5 respectively show the numbers of administrative staff, technical staff, trades and crafts people and unskilled labourers. It will be seen that the firms rely heavily on permanent staff (in contrast with the consultants – as will be seen later), and show quite large numbers of ‘professional’ staff. Personal knowledge of the industry suggests that the respondents have been fairly liberal in their definition of ‘professional’ for this survey, and do not restrict themselves to meaning engineers or architects or other professionals involved directly in construction.
Figure 7.1
0
10
20
30
40
50
Less than 5 5 to 10 Over 10
Number of professionals employed
Perc
enta
ge o
f firm
s em
ploy
ing
this
num
ber Permanent
staff
Temporaryemployees
The patterns shown in Figure 7.1 suggest that the firms have a hard core of professionals, but that they make fairly liberal use of temporary professional staff, particularly in numbers of less than five. Almost half the contractors responding to the survey indicated that they use up to five professionals on a part-time/temporary basis. No distinction is made here between office and site employees, and it may well be that firms have their basic staff for their ‘normal’ workload, and take on extras when their project commitment increases.
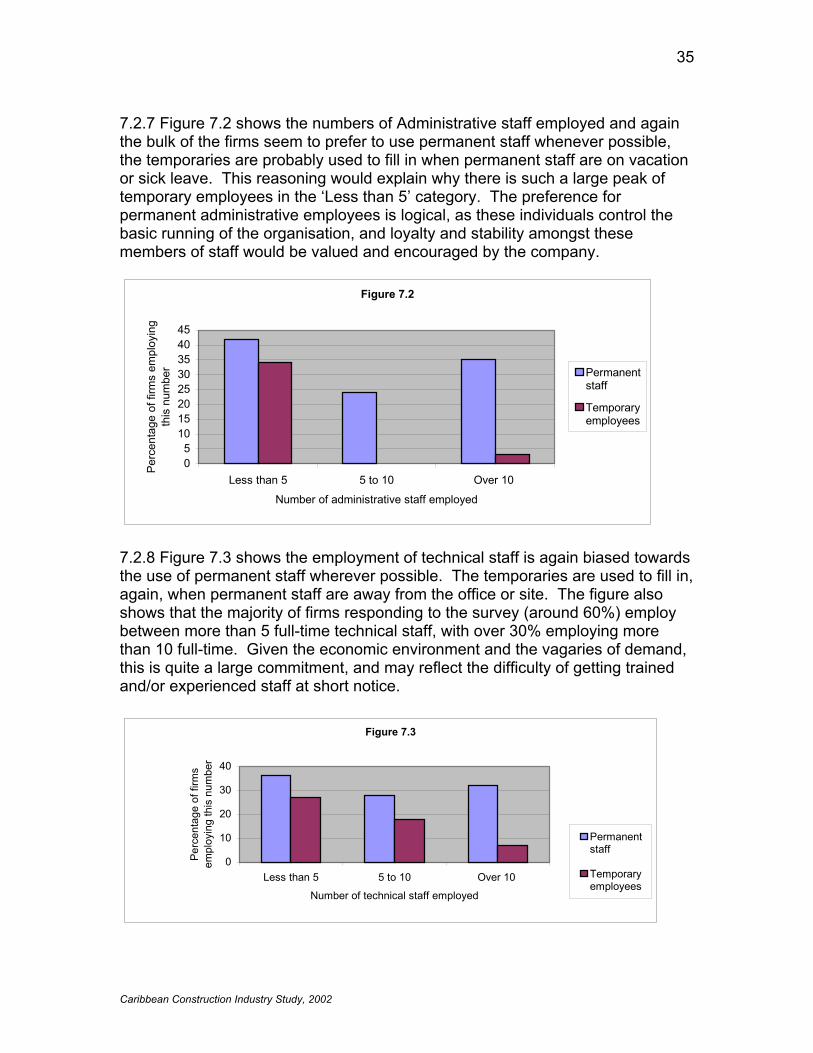
35
Caribbean Construction Industry Study, 2002
7.2.7 Figure 7.2 shows the numbers of Administrative staff employed and again the bulk of the firms seem to prefer to use permanent staff whenever possible, the temporaries are probably used to fill in when permanent staff are on vacation or sick leave. This reasoning would explain why there is such a large peak of temporary employees in the ‘Less than 5’ category. The preference for permanent administrative employees is logical, as these individuals control the basic running of the organisation, and loyalty and stability amongst these members of staff would be valued and encouraged by the company.
Figure 7.2
05
1015202530354045
Less than 5 5 to 10 Over 10
Number of administrative staff employed
Perc
enta
ge o
f firm
s em
ploy
ing
this
num
ber Permanent
staff
Temporaryemployees
7.2.8 Figure 7.3 shows the employment of technical staff is again biased towards the use of permanent staff wherever possible. The temporaries are used to fill in, again, when permanent staff are away from the office or site. The figure also shows that the majority of firms responding to the survey (around 60%) employ between more than 5 full-time technical staff, with over 30% employing more than 10 full-time. Given the economic environment and the vagaries of demand, this is quite a large commitment, and may reflect the difficulty of getting trained and/or experienced staff at short notice.
Figure 7.3
0
10
20
30
40
Less than 5 5 to 10 Over 10
Number of technical staff employed
Perc
enta
ge o
f firm
s em
ploy
ing
this
num
ber
Permanentstaff
Temporaryemployees

36
Caribbean Construction Industry Study, 2002
7.2.9 Figure 7.4 shows the employment of trade and craftsmen, and again the figures are high, and biased toward the permanent rather than temporary employees, except at the higher levels. When firms find good skilled workers, tradesmen or craftsmen, they tend to hang on to them, up to a level that can be justified by their ‘normal’ work load.
Figure 7.4
05
10152025303540
Less than 5 5 to 10 10 to 50 Over 50
Number of trade & craftsmen employed
Perc
enta
ge o
f firm
s em
ploy
ing
this
num
ber
Permanentstaff
Temporaryemployees
The histogram in Figure 7.4 again reflects the need to bring in extra staff when big projects are involved, and demonstrates that there is a large capacity in the industry for absorbing the unemployed for relatively short-term contract periods. It also shows that there is a need for a ‘reserve army’ of unemployed skilled workers (who are either unemployed or who can be available when needed) to undertake the short term bursts of work that the industry faces. If there were no unemployment, the construction industry would be in serious difficulties, especially during boom periods. Figure 7.5 shows the employment of unskilled labour by construction firms in the region. Again the histogram shows patterns that one would expect from knowledge of the industry in the region. Typically for the industry worldwide,
Figure 7.5
05
1015202530354045
Less than 5 5 to 10 10 to 50 Over 50
Number of unskilled workers employed
Perc
enta
ge o
f firm
s em
ploy
ing
this
num
ber
Permanentstaff
Temporaryemployees
7.2.10 there are relatively large levels of employment of unskilled workers amongst the firms surveyed. There is the familiar pattern of firms employing

37
Caribbean Construction Industry Study, 2002
unskilled workers as required by their ‘normal’ work load and using temporary/occasional workers to make up the numbers when needed. Again it demonstrates the high levels of demand that the industry has, especially for unskilled workers who find it difficult to get employment elsewhere. Again the industry needs its ‘reserve army’ of unemployed to pick up the slack when things get busy. This is particularly the case on larger jobs, and is reflected in the high levels of demand for the larger numbers of workers with over 70% of the firms using more than 10 temporary/occasional unskilled workers and nearly half of these using more than 50. 7.2.11 The table below gives a listing of the equipment owned by the contractors, showing the percentage of firms with the respective equipment. The listing is not exhaustive, as some firms mentioned equipment that we had not asked about, and it is clear that other firms would have had the same equipment – like, for example, generators, water pumps and concrete vibrators. Earthmoving Scraper 3% Bulldozer 28% Grader 28% Front-
Loader 45%
Dragline 6% Excavator 18% Conc pump 3% Dumper 33% Erection Mobile
crane 21% Tower crane 18% Scaffolding 55% Other 9%
General Back-hoe 61% Truck 85% Barge 3% Roller 15% IT Equipment
Computers 85% Project Management Software
66% Structural Analysis Software
21% CAD Software
45%
Other Water pump Compactor
6% 3%
Concrete Mixers Sand machine
33% 3%
Alphalt Plant Lawn mower
15% 3%
Concrete vibrators Hammer drill
6% 3%
7.3 Technical and operational issues 7.3.1 In the next section of the questionnaire we addressed some of the issues that had arisen during preliminary discussions in Trinidad and Guyana. One contractor had indicated that on large jobs he had some difficulty financing the cost of holding materials, particularly during a period of high inflation when he had tended to try to hold as much as possible. In response to the direct question “Do you think that the cost of holding materials inventory for a large project is too high for local contractors?” of those who responded, 48% said ‘Yes’, and 36% said ‘No’. It was clear that some had been hurt by losses caused by exchange rate changes and/or sudden bursts of inflation that they had not budgeted for. Others were quite happy to absorb the risk and charge the client a premium in his rates for doing so. 7.3.2 Another problem that had been indicated was the tendency for certain consultants to be too rigid and unwilling to accept suitable substitute materials – in one case, an apparently reasonable request to substitute Greenheart for Purpleheart wood was refused. However, the survey indicated that 79% of the respondents disagreed with this, noting that consultants were generally willing to

38
Caribbean Construction Industry Study, 2002
accept suitable substitutes. 21% felt that consultants were too rigid. Many felt inclined to comment on this issue and two of these touched on the same sort of issue. Hence, one wrote “What is required is effective decision making by owners and their consultants and then allowing sufficient time for contractor to procure materials” and another wrote, “Sometimes they are very rigid and cause the job to be delayed when a decision is not taken promptly”. The key point that these notes raise is the timeliness of the decision making – indicating that given sufficient time they can source the specified materials if they are available. 7.3.3 The size of firms involved in the study ranged from those capitalized at less than US$20,000 to one capitalized at over US$15 million. Most of the firms were clustered around either of two values – US$500,000 and less or US$1.5 million and above – for some reason that was not immediately apparent. Perhaps there is some kind of scale factor here that makes it appropriate for firms to be smaller (less than US half a million) or larger (greater than $ 1.5 million), with little or no advantage to being in the middle. The majority of the firms (51%) that were willing or able to disclose a figure had an annual turnover during the past five years of over US$1 million. 24% had a turnover of between US$1 million and US$ 5 million, 27% over US$ 5 million. 18% had a turnover between one quarter and one half million US$, and 15% between one half and one million US$. Only two responding firms (6%) had a turnover less than one quarter million US$. 7.3.4 There are no benchmark values for the industry in the Caribbean to compare with, but the firms that responded indicated the following approximate financial ratios for the firm? Debt to Turnover 13% Fixed assets to Total assets 32% Debt to Total assets 11% 7.3.5 The questionnaire asked a number of other questions designed to address some of the other financial commitments that were considered likely to be an issue with contractors. Hence, they were asked if the cost of performance bonds, insurances and other financial preliminaries were a problem? 36% said ‘Yes’ and 54% said ‘No’ with a number commenting that it was a cost that was passed on directly to the client, so it did not affect them directly. Presumably the contractors saying ‘No’, that these costs were not a problem were ones that had not run into difficulties through reaching the limits of their bonding capacity. Two contractors who said ‘Yes’ mentioned this issue specifically. The problem was exacerbated on particular projects where the bonding levels were 100% rather than the more normal 10% for these parts of the world. Obviously, if a contractor cannot get bonding, then he cannot take on extra work, and his bonding limit is usually determined by the collateral that he can put up. Using one’s home and car can increase the asset value of collateral, but if something goes wrong they can be forfeited, and that is a risk that most contractors are not prepared to take. The role of the banks was raised by a number of contractors, who complained , for example, that “The insurance companies charge more than banking
39
Caribbean Construction Industry Study, 2002
institutions for some types of Bonds & other financial preliminaries”, and also that the banks were disinclined to take on the risks associated with the construction sector without enormous levels of collateral cover – this issue was also discussed by Mr Ram in his paper to the seminar held in Guyana in connection with this study (see Appendix VII to this report). 7.3.6 Interestingly, one of the contractors was so concerned about it that he wrote a long note at the end of the questionnaire on this issue. The note said “The Performance Bond and Mobilisation Advance Securities are only a problem when bank guarantees are required for these bonds. The problem is that the contractor is required to secure the facility the bank provides with either property or cash as required by the bank’s Financial Institutions Act. For projects in excess of 0.5 m US $ the contractor would not have enough property to cover the bonds. A contractor who is in operation for eight years with an average turn-over for the eight years of 0.25 million US$ would not have enough cash to cover the bond. This cash earned over the years would have gone into the development of the equipment fleet. This is a problem which does not have a solution yet in Guyana.” 7.3.7 Anecdotal evidence had suggested that many in the industry felt that there was little logic in the levels of the liquidated damages put into contracts, especially for non-commercial structures that did not have any apparent critical start requirement. However, 75% of the contractors did not feel that the levels of liquidated damages were a restriction, while only 15% did. This may be because it is rare in the Caribbean for liquidated damages to be applied on a contract; most disputes and claims are settled without damages being assessed. This seems to have resulted in liquidated damage levels being set unjustifiably high in many instances, but given that they are normally irrelevant, nobody cares very much. Again, contractors raised the issue of a bonus for early completion being used (as in other parts of the world) as a counter balance to the punitive liquidated damages for late delivery. 7.3.8 A number of the states in the Caribbean have experienced periods of economic uncertainty that have led to severe foreign exchange restrictions, and to periods of significant inflation (especially in the wake of currency devaluations – as in Jamaica and Guyana). During these periods of high inflation, the construction industry has been particularly exposed and hard hit. Despite this, it is very unusual for a construction contract to have a provision for the contractor to recover the extra costs incurred through price fluctuations. The majority of responding contractors (81%) felt that there should be a provision for price fluctuations especially on jobs which extend over a period of more than a year. Those who responded negatively (15%) justified their view on the grounds that most construction projects are for less than six months or so, and anyway, it was the duty of the contractor to allow for such variations in his pricing. Local knowledge should give good contractors an advantage in making appropriate allowances for the anticipated increases due to inflation. They are, however,

40
Caribbean Construction Industry Study, 2002
unlikely to be prepared for sudden changes in external or internal circumstances that can cause a devaluation or rapid rate of inflation – circumstances that have already caught out contractors in many countries in the region. 7.3.9 Some of the countries in the Caribbean region suffer occasionally from sudden and unexpected materials shortages, and sudden and unexplained price changes. Cement is one material that was specifically mentioned as being a constant source of concern – mainly because it is such an important element in the construction process for most structures, and because its supply is dominated by one company that holds a virtual monopoly in the region. Mention had been made in preliminary discussions that foreign contractors could easier source materials from their home countries, and often at prices lower than were available locally. Of the responding firms surprisingly few (36%) said ‘Yes’ compared with those saying ‘No’ (58%). The comments indicated that the local cost and availability of materials was a constraint on both local and foreign contractors alike, and that effective materials management could overcome any perceived problems. 7.3.10 In order to get a feel for the percentage of the cost of a job that is represented by the different inputs to the cost function, the contractors indicated that on average the cost structure of a typical project in percentages is as shown in the table below. It will be seen that the cost of materials is a very significant element, representing (on average) around 44% of the project cost. The proportion of the project cost going to labour is low in international terms, where one would expect this value to be nearer one third of the overall cost, however, this is probably explained by the relatively low cost of labour in the region, especially unskilled labour. There were rather high spreads of values for the different factor inputs, but this may represent the different technologies used in road works, say, as compared with high-rise buildings.
Average Max Min Labour 29 45 5 Materials 44 64 25 Plant & Equipment 15 40 3 Overheads & Admin. 11 20 3
7.4 Project size and prequalification issues 7.4.1 The next section of the questionnaire addressed the firm’s normal scale of operations. Although a number expressed reservations about giving an ‘average’ project size, because it was so variable, the largest group of those that did respond (36%) indicated that the average project size was in the US$100,000 – 500,000 range, the next largest group (24%) indicated an average project size over a million US$. A further 15% indicated an average between one half and one million US$, and 12% selected the US$50,000 – 100,000 range. Only one firm (3%) indicated their average project to be in the US$20,000 - 50,000 range.
41
Caribbean Construction Industry Study, 2002
There were significant regional variations in these values, with the average range being lower in Guyana than in other territories. 7.4.2 In a similar way when asked what was the largest project that the firm has ever been the main contractor on the majority (45%) indicated over US$1 million, with 21% indicating between US$100,000 and 500,000, and 15% indicating between one half and one million US$. Only one firm (3%) indicated its largest project as having been in the US$ 50,000 to 100,000 range. The figures were similar when the contractors were asked what was the largest project in which they had been involved in any way, with 60% indicating it to be over US$1 million, 18% between US$100,000 and 500,000, 6% between US$ 0.5 and 1 million, and one firm said less than US$20,000. Two firms (6%) indicated that they had never been a sub-contractor, so this question was irrelevant given the one before. Unfortunately we did not enquire as to the actual size of the largest project that the firm had been main contractor on, or involved in, but one contractor did indicate that there were at least two firms in Trinidad & Tobago that could handle jobs over US$20 million, but not many more. 7.4.3 Contractors rarely focus entirely on one project, for reasons of risk spreading, resource leveling and plant optimization. Taking on more than one project at a time gives the contractor flexibility and a certain security, but it also brings additional problems in conflicting demands on resources and project control and direction. When asked how many projects the firms have been involved in at any one time, the response showed 54% to have taken on less than 5, 24% between 5 and 10, and 12% more than 10 projects. The resources and management required to juggle ten projects at the same time would appear to be rather demanding, and one would hazard to suggest that not all of these jobs were handled with efficiency. 7.4.4 One of the areas of interest of the CARICOM Secretariat is in the competitiveness of the industry in regional and international terms, so it was of interest to find out how many firms had already competed successfully overseas. 94% of the firms indicated that their main market was in their local home country, with 27% indicating a significant market involvement with other CARICOM countries. These figures applied to the last five years on average and were similar to those for the last year alone (90% and 21% respectively), so there has been no change in market access over the past year or so. 7.4.5 When asked if they had ever bid for jobs overseas, the contractors indicated that 60% had not bid on overseas jobs at all, 3% had bid on jobs within CARICOM, 3% in other Caribbean countries than those in CARICOM, and 9% had bid on jobs internationally, outside the Caribbean region 7.4.6 When asked about their plans for the next year or so, only 24% said that they would only look for work in their home country, 52% of the firms said they would bid on jobs within CARICOM, 21% the rest of the Caribbean, and 9%

42
Caribbean Construction Industry Study, 2002
would bid internationally. The balance of interest, and the increasing interest in bidding for work within the CARICOM region is reassuring given the moves to promote the Single Market and Economy within CARICOM. The increase in interest in the rest of the Caribbean may be due to the perception that countries like Cuba may be opening up to the local industry, and may offer greater opportunities in future. 7.4.7 In order to try to establish why firms that wanted or were willing to work overseas but did not, we asked what had prevented them from bidding for work or from getting onto the ‘prequalified’ listings for projects. When asked what had prevented their firms from prequalifying for overseas jobs, 24% indicated that the problem was access to information and a further 24% indicated there were personnel problems. 21% of the contractors indicted that access to adequate finance was the main problem. 9% indicated lack of experience as a problem, and 3% indicated it was a lack of equipment. 15% indicated ‘Other’ and ‘Present Commitments’ was mentioned specifically. We have indicated elsewhere that the problem of access to information could easily be addressed by creating a suitable web site on the internet, preferably hosted by a non-commercial, non-competing institution like the Engineering Institute at UWI. This would give ready access to information that was always available. Clients, including the lending agencies and governments in particular, must be committed to providing the necessary information. 7.4.8 The issue of finance is not so easily addressed because it involves the risk-aversity of local bonding institutions, foreign exchange transactions and the movement of money between territories. The risk-aversity of local bonding institutions – mainly insurance companies – cannot be addressed directly, and it is not clear how it can be changed. Fears of capital flight and cover for money laundering exercises cause local governments to be reserved about these issues. However, it should not be beyond the wit of the experts to come up with an acceptable solution. 7.4.9 In response to what would help them prequalify in future, the contractors addressed the same points, calling for financial assistance (36%) and for better access to information (15%). 12% indicated extra personnel and another 12% selected the ‘Other’ category, with one commenting that what needed to change, to improve their chances, was “Employer Attitude” 7.4.10 The other issues mentioned specifically were equipment (6%), current workload (3%), size (3%) and extra qualifications for their staff (3%). Basically these all address the same problem, and it is that if a firm is to expand its operations into another country, it must have extra resources above and beyond what it would need on a local job. Although the distances are not huge, trouble shooting on a job he has in St Kitts is not as simple for a contractor in Barbados as a local job would be. It needs extra resources, extra time and involves greater cost. All of these increase the firm’s exposure to risk, and many contractors can

43
Caribbean Construction Industry Study, 2002
keep themselves adequately busy at home, without needing to take on the ‘headaches’ of working abroad. 7.4.11 Where personnel shortages were identified, the main problems were with professional and administrative staff. Engineers were identified as being in short supply by 9% of the firms, especially ‘experienced’ engineers. 9% of the firms indicated a shortage of other professionals, and a further 9% mentioned a shortage of technical skills. 6% indicated a shortage of trade and craft skills. Two contractors (6%) specifically mentioned the need for competent office management staff. 9% of the firms indicated a shortage of ‘Other’ skills and Project Managers were specifically mentioned in this category. 7.4.12 When asked where their firms had prequalified for projects and had submitted a bid on overseas jobs, and been unsuccessful, and if they thought they knew what the reason was, 18% of the firms replied simply that their price was too high. Anecdotal evidence and newspaper articles (see Appendices to this report) suggests that local firms suspect foreign firms of underbidding in order to win jobs, and then making up the difference in claims. 9% of the firms felt that there was a preference for local firms in those countries. 6% of firms complained that lack of financial support was the reason they had failed to win the contracts. 3% of the firms felt that they lost the job because of personnel inadequacies, 3% thought that the funding agency had a preference for foreign firms, 3% that they lacked appropriate experience. A further 3% indicated under ‘Other’ that the problem was political. 7.4.13 The issue of under-pricing on contract bids is one that is difficult to deal with, because lending agencies and local authorities want to let projects to the lowest bidder, otherwise there is scope for favouritism, nepotism and corruption. However, there are other contract letting rules that are in practice in other parts of the world that specifically exclude the lowest bidder because of worldwide problems with projects awarded to the lowest bidder. Thus, the second lowest bid, or the one closest to the engineer’s estimate, for example have been used in other parts of the world. The alternative approach is to try to minimise the opportunities for claims, perhaps by using a professional project manager to oversee the project. 7.4.14 The problem of preferences of the lending agency for foreign firms should not be a issue, and it is up to the borrowing authority to make sure this bias does not exist. After all, the borrower wants to maximize the benefit to his home country from a project, and after all, he does have to repay the money borrowed, so the preferences of the lending agency should not be relevant. If it is grant aid money then the granting country may express preferences. 7.4.15 To check why firms did not prequalify or bid on local jobs that were tendered internationally, 33% said it was financial 12% indicated that the problem was access to information, and 6% indicated that there were shortages of

44
Caribbean Construction Industry Study, 2002
personnel. 3% put the problem down to equipment. The personnel shortages were spread across skills, with 12% indicating technical and another 12% selecting trade/craft skills as being a problem. 12% indicated a shortage of engineers as critical and another 12% selected ‘other professionals’ as being problematic. 6% indicated Administrative staff as being in short supply. On the topic of personnel, one firm indicated that “A change in attitude regarding work ethics is badly needed”. Presumably this is more related to the giving of a fair day’s work for a fair day’s pay, than to the moral principles of those involved. 7.4.16 When asked what was needed to improve their chances of prequalifying for local projects that are internationally bid, 27% said finance, 12% said better access to information, 12% said extra personnel, 6% said extra qualifications for their staff and 3% said extra equipment. 6% selected “Other”, and once again, the refrain was repeated that the main issue was “The desire on the part of government (politicians and civil servants) to want to hire deserving local companies”. 7.4.17 Finally, firms were asked, if they had prequalified and bid on local projects that were tendered internationally, and been unsuccessful, what did they think the reason was. 27% put it down to their price being uncompetitive, 15% said it was client preference for foreign firms and 12% put it down to bias in the funding agency for foreign firms. 6% indicated that financial problems (caused by interest rates being too high) were the key issue and 3% indicated it was personnel. A total of 15% selected ‘Other’ and wrote as explanation, amongst other comments “Too much corruption”, “Availability of true competition”, “Local companies have to bid with prices that include duties and taxes. Foreign firms do not include duties and taxes. Therefore their tender price is lower than those of local contractors and in most cases because of the low prices they are awarded the contracts. Clients have to do their research and find out current prices.” The theme seeming to be, once again that they feel the ‘playing field’ is not level. 7.4.18 Given that the Caribbean Single Market and Economy is currently coming into existence and that the member countries are negotiating between themselves over the terms of trade that will be established, and that the protocols adopted for these negotiations will affect everyone, the survey was closed with a question relating directly to this issue. The answers to this section showed that only 21% of the firms were aware of the protocols (58% were not), 42% thought they affected their firms (18% also thought not!), and a huge 79% wanted to know more about the protocols (one firm (3%) said they didn’t want to know more). This suggests that there is a clear and urgent need for the Secretariat together with the specific industry sector groups to conduct a number of sensitizing seminars throughout the region to tell people what is happening and how these events will affect them. This study has begun the process, but a lot more needs to be done.

45
Caribbean Construction Industry Study, 2002
7.5 Additional comments 7.5.1 A number of comments were appended at the end of the questionnaire and some of these are noted here. One was quite explicit, focusing on the shortcomings of the industry and stating that there was a “Need to organize the local construction industry.
1) Strengthen the Construction Association 2) Training of Tradesmen 3) Training of Management Staff 4) Implementing Building Codes 5) Cooperation from Financial Institutions to insist on codes, trained personnel”
7.5.2 Another focused on the projects, and the view that they are designed to favour foreign firms over smaller local ones, stating that “IADB/WB conditions increase project size, scope and add regulations which increase overall cost and decrease the possibility of small local contractors to be competitive. This is deliberate. An example is the aggregation of 3 + 4 bridges into a single contract.” 7.5.3 Another seemed to have been alerted to opportunities and stated that “Our company would be interested in attaining intra and extra regional affiliations with other companies who would be interested in such co-partnerships. Maybe addresses of such companies could be made available.” And, on the same subject of information availability, others noted “A greater dissemination of information as regards to jobs in and around the Caribbean” and “The setting up of a Caribbean Construction Journal.” 7.5.4 Many of these issues have arisen before in our discussion of the findings of this study. 7.5.5 It was decided that a tabulated summary of the survey data not would be included in this report as it would not be necessary at this stage.

46
Caribbean Construction Industry Study, 2002
8. SUMMARY OF SURVEY OF CONSULTANTS THROUGHOUT THE REGION
8.1 Note
8.1.1 The percentages given in this Summary do not always add up to 100%, this is because the respondents often missed out questions, simply made comments, or gave impossible answers (which were thrown out), or because they gave multiple answers when more than one answer was relevant. To reduce confusion, we have used percentages throughout. 8.1.2 There were significant regional variations in the responses given, for example, as between the consultants of Trinidad & Tobago and Guyana. For the purposes of this study and the formulation of regional policy, it is presumed that the overall summary position is the relevant viewpoint. Thus, the data has simply been accumulated and converted into a common currency base where necessary. The data for the individual territories will be preserved so that it can be reviewed at some future date for country specific policy guidelines if required.
8.2 Management issues 8.2.1 A total of 49 consultants answered the questionnaire, with the distribution of responses being: 3 from Dominica, 1 from Grenada, 8 from Guyana, 9 from Jamaica, 2 from St Vincent, 12 from St Lucia and 14 from Trinidad and Tobago. These included architects, quantity surveyors and environmental engineers as well as consultants in civil engineering works in general. 8.2.2 The distribution over the areas of specialists skills showed 55% to be specialists in structural engineering, 47% indicated specialist expertise in earthworks and foundations, 45% in roads and bridges 37% in architectural design, 22% in air conditioning, plumbing and electrical works, 16% in quantity surveying and industrial design work, 18% in landscape design, and 37% selected ‘other’, as including geotechnical engineering, mechanical and environmental engineering. This represents a good coverage of the technical skills needed to service the consulting requirements of the construction and installation engineering sector.
8.2.3 The areas of business addressed by the consultants were fairly evenly spread over the main categories of work one would expect to find i.e. 73% work on commercial projects, 63% work on residential projects, 61% work on civil infrastructure projects (e.g. roads, bridges and pipelines) and 51% on industrial projects. Fifteen firms (31%) indicated ‘other’ and mentioned marine work, ‘institutional’ structures like schools, health centers and a library in addition to those listed. The firms were predominantly focused on their home country markets but 33% had worked in the Caricom market, 2% elsewhere in the Caribbean region and 6% internationally. 8.2.4 These firms depend almost wholly on their consulting work with only 14% doing any contracting at all, and even then, it contributed less than 10% of the

47
Caribbean Construction Industry Study, 2002
firm’s turnover in all except two cases (4%) where it represented between 10 and 50%, and one (2%) where it was over 50% of turnover. 75% indicated that they do not do any contracting at all. We did not explore the issue of Design-Finance-Construct (DFC) or Build-Own-Operate-Transfer (BOOT) type projects as a separate matter. On this sort of project a consortium of firms get together to design, finance and construct specific facilities for the national community, and get paid for the work either through revenues generated by the project facilities or through government subventions over a period of time. Such projects can be considered speculative even though they have to be agreed to by the authorities before they are started, because they often depend on ‘speculative’ income to repay their investors. It is known that a number of local consultants have entered into consortia that have built such facilities on DFC and BOOT type arrangements. 8.2.5 The organisational structures of these consulting firms are simple and short with 63% having a traditional line and staff hierarchical structure, 22% having a project structure and 6% having a matrix structure. This would be consistent with expectations for relatively small firms with few employees, especially for privately owned firms. In this regard, 43% of the firms are sole proprietorships, 27% are limited liability companies, 22% private companies and 5% partnerships. One might have expected more partnerships given the need for a range of technical skills, and for extra financial muscle but that is not the case currently. 8.2.6 Although the majority of firms have not entered into any joint ventures or partnership agreements with other firms, 24% have formed joint ventures with a single local firm and a further 12% with up to 5 local firms, and one firm (2%) having been involved in more than 5 joint ventures with local firms. 20% have formed joint ventures with a single foreign firm and a further 12% with up to five foreign firms. A number of comments were received indicating that partnerships and joint ventures were entered into on a project by project basis particularly when technical skills were needed that were not available in-house. Four firms (8%) had entered into a partnership with foreign firms, two (4%) with a single firm, one (2%) with up to five other firms and one (2%) with over ten foreign firms. 7 firms (14%) had local partners, with two of these (4%) having multiple (up to five) partners. The comment “No formal partnerships. However, we do associate with local and foreign firms on a project-by-project basis when we need technical skills not available in-house” was felt to be a fairly typical summary of the consultants’ position. 8.2.7 The three figures shown below indicate the spread of employment in the firms surveyed. As will be seen from Figure 8.1, the majority of firms employ less than five professionals on a permanent basis, but are prepared to take on professional help on a temporary basis as and when needed. This is a characteristic of a small market with insufficient projects to guarantee follow-on work for the firms involved. As a result, they are unable or unwilling to take the risk of employing full time professional staff above the level required for the

48
Caribbean Construction Industry Study, 2002
workload that they customarily acquire. In terms of size, these firms would not be considered large by international standards, with less than 10% having more than ten full time professionals. The Figure also shows that there is an active market for individuals as consultants, as the employment of temporary professionals is comparable with their full-time counterparts. Indeed some 76% of firms use between one and five professionals on an occasional/temporary basis. This also helps to fragment the market and keep the size of ‘firms’ small, as an independent consultant working on his own, on a contract basis, may be represented as a ’firm’ in the statistics, particularly as only 35% of these, the larger firms in the industry in the region, have more than 5 full time professional employees (55% have less than 5 – the balance of firms in the sample did not answer this question).
Figure 8.1
0%
20%
40%
60%
80%
Less than 5 5 to 10 Over 10Number of employees
Perc
enta
ge o
f firm
s em
ploy
ing
this
nu
mbe
r
Permanentstaff
Temporaryemployees
8.2.8 Figure 8.2 shows the levels of administrative staff, and it indicates that firms use both permanent and temporary staff depending largely on their workload. It
Figure 8.2
0%10%20%30%40%50%60%70%
Less than 5 5 to 10 Over 10Number of administrative staff employed
Perc
enta
ge o
f firm
s em
plot
ying
this
num
ber
Permanent staffTemporary employees
is apparent from interviews that the temporary staff are used primarily as cover for permanent staff especially when the latter are on vacation or sick leave, but they are also used to ‘pick up the slack’ when there is a heavy workload for some
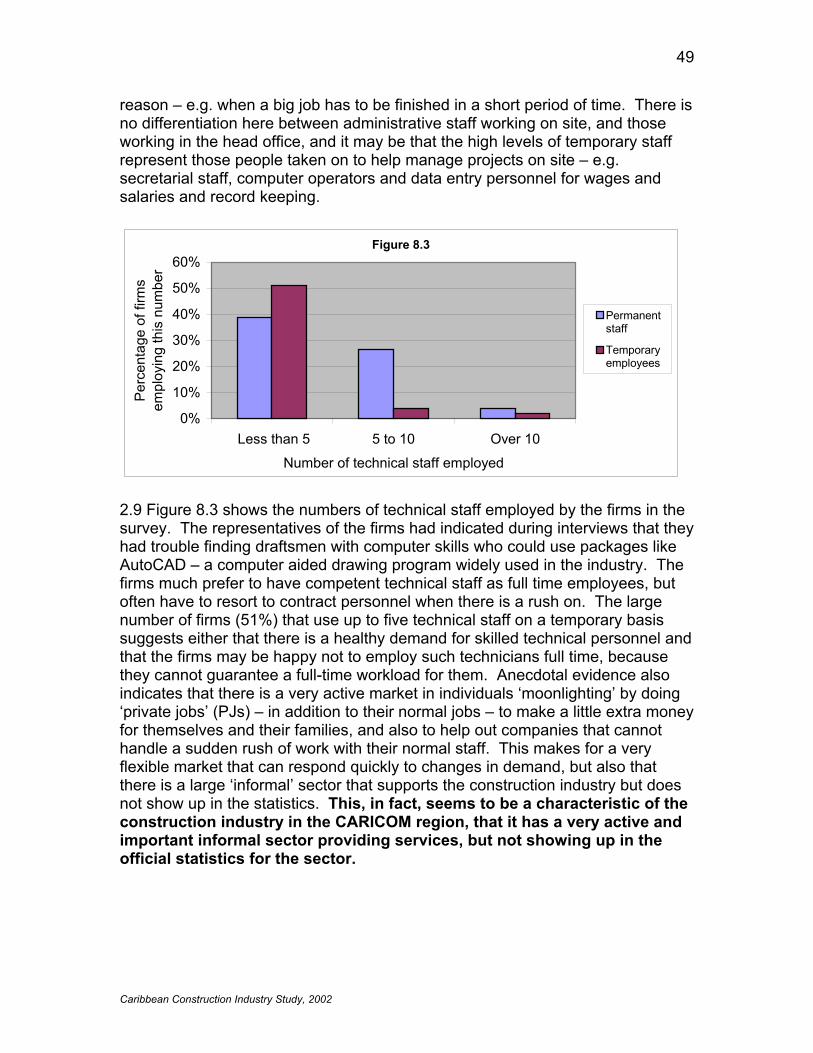
49
Caribbean Construction Industry Study, 2002
reason – e.g. when a big job has to be finished in a short period of time. There is no differentiation here between administrative staff working on site, and those working in the head office, and it may be that the high levels of temporary staff represent those people taken on to help manage projects on site – e.g. secretarial staff, computer operators and data entry personnel for wages and salaries and record keeping.
Figure 8.3
0%
10%
20%
30%
40%
50%
60%
Less than 5 5 to 10 Over 10
Number of technical staff employed
Perc
enta
ge o
f firm
s em
ploy
ing
this
num
ber
Permanentstaff
Temporaryemployees
2.9 Figure 8.3 shows the numbers of technical staff employed by the firms in the survey. The representatives of the firms had indicated during interviews that they had trouble finding draftsmen with computer skills who could use packages like AutoCAD – a computer aided drawing program widely used in the industry. The firms much prefer to have competent technical staff as full time employees, but often have to resort to contract personnel when there is a rush on. The large number of firms (51%) that use up to five technical staff on a temporary basis suggests either that there is a healthy demand for skilled technical personnel and that the firms may be happy not to employ such technicians full time, because they cannot guarantee a full-time workload for them. Anecdotal evidence also indicates that there is a very active market in individuals ‘moonlighting’ by doing ‘private jobs’ (PJs) – in addition to their normal jobs – to make a little extra money for themselves and their families, and also to help out companies that cannot handle a sudden rush of work with their normal staff. This makes for a very flexible market that can respond quickly to changes in demand, but also that there is a large ‘informal’ sector that supports the construction industry but does not show up in the statistics. This, in fact, seems to be a characteristic of the construction industry in the CARICOM region, that it has a very active and important informal sector providing services, but not showing up in the official statistics for the sector.

50
Caribbean Construction Industry Study, 2002
8.3 Technological issues 8.3.1 In order to get some idea of how technologically ‘literate’ the firms were, they were asked to indicate the information technology software and hardware that they own and use. The following table shows the responses: IT Hardware
Computers < 10
71% Computers > 10
14% Computers Networked
41% Plotter 50%
IT Software
Project Management
53% Structural Analysis
37% CAD Software
73% Digital camera
2%
Other Civil Software Estimating software
12% 9%
Printers
Digitiser
2% 2%
Geotech IT Foundn. IT Hydraulic IT
2% 2% 2%
Trucks 2%
8.3.2 As can be seen, some 85% of firms have computers, with 14% of these having more than 10. Less than half of the firms are networked, however, and must thereby lose something in their potential efficiency. The firms do seem to be committed to Information Technology in general, and are prepared to use computer software to assist in their analysis and design work, especially in the production of drawings. 73% of the firms use Computer Aided Design/Drafting (CAD) software, the vast majority indicating verbally that they have chosen AutoCAD. This latter aspect may partly be driven by client demand – in that the oil and petrochemical industry clientele that are important in Trinidad and Tobago, tend to require that their drawings are available in the electronic as well as the ‘hard’ (paper) format. However, one major architectural firm in Trinidad & Tobago did indicate that, despite various pressures, and the fact that they had computers for administrative purposes, all their drawing work is still done manually (and they have no intention of changing that policy in the near future). 8.3.3 Because it is obvious that there is a very real cost involved in keeping up to date with computer software, and that unless firms can amortise this investment over a sufficiently large workload it could be burdensome to them, it was decided that the firms should be asked if they considered the cost too high for local firms in smaller countries. 37% thought that ‘Yes’ it is too high and 53% said ‘No’ it is a necessary expense that has to be borne (“It is just too expensive, but if we want to be up to date we have no choice but to purchase just what we need”). This is a commendably pragmatic view, as clearly the costs are very significant compared with the company cash flows, but it is viewed as a ‘necessary evil’. The issue of using pirated software was not pursued. The suppliers of software complain bitterly about piracy, particularly in the Caribbean region (to the extent that some insist on selling only software with ‘dongles’ – hardware locks – in the region), but the firms in our survey seemed to be spending the necessary money to be legitimate in this regard. One firm indicated that the Customs Department often charges duties at entertainment rates on analytical engineering computer software, because they do not understand the difference, and this can add enormously to the cost.
51
Caribbean Construction Industry Study, 2002
8.3.4 Discussions prior to the start of the survey, and anecdotal evidence from previous enquiries, suggested that consultants can be excessively authoritarian in the region. One way in which this is apparent is in their sticking very rigidly to their specifications of materials. One contractor in Guyana claimed that when greenheart floorboards were not available for a school project, the consultant refused to accept purpleheart boards that were readily available instead. To address this issue, the consultants were asked if they thought that consultants in general were resistant to using substitutions when the specified materials were not readily available. Not surprisingly 69% said ‘No’, they were always willing to accept suitable substitutions, but another 20% said that ’Yes’, consultants do tend to be inflexible in these circumstances. It is to be expected that consultants would tend to support the ‘professionalism’ of consultants in general and say that they would accept suitable substitutions when appropriate, but a number of comments showed that there is some friction between different consulting professions and between the professionals and the contractors. Hence, an architect noted “Engineers dislike providing alternatives, neither do they wish to explore innovative solutions to architectural problems”. This does suggest that the contractor’s complaint was somewhat justifiable. 8.3.5 In the same light, a related question asked about dimensional rigidity – i.e. it asked whether consultants were too inflexible in their specifications of element dimensions and feature locations. This arose out of two comments received, one, again regarding floorboards in Guyana, was a complaint from a contractor that when 1”x4” floorboards were not available the consultant refused to allow 1”x6” boards, which would have done the job just as well. The other was against an architect who had specified that light switches should be 54” above ground level, the contractor put them in at what he considered the accepted ‘normal’ height of 48” above ground level, and the architect insisted that every one had to be removed and replaced (which involved a considerable expense and time loss in cutting and re-plastering etc). Again, the consultants voted 71% against the notion that they were too rigid (though two architects did note that they were ‘rigid’ (positive connotation of preserving standards) but not ‘too rigid’ (negative connotation of stubborn refusal to be sensible)). 18% said that they did consider consultants too rigid (presumably with the negative connotations) in this regard. One architect commented “There is little enough respect for architectural integrity..” to allow random variations particularly when these were motivated by “…contractor ‘innovation’ to cut cost”. Another - approving inflexibility - noted “Understandably so since professional design competence of contracting firms is generally low.” It should be noted that it is true that few contracting firms, other than the very largest, employ any professional engineers. 8.4 Financial issues 8.4.1 On the basis that the Terms of Reference (ToR) for this study wanted to find out something about the financial capacity of the firms in the industry, a number of questions were directed at this topic. Although many of the firms were
52
Caribbean Construction Industry Study, 2002
not limited liability, those that were showed a wide range of capitalisations running from around US$7,000 up to around US$700,000. This is not surprising since the firms that responded varied from a few one-man operations (typically architects) up to a multi faceted consultancy like Trintoplan Ltd or CEP Ltd. Although it may be difficult to draw any conclusion from the absolute value, the average of these figures is around US$120,000. 8.4.2 Again, existing comparable benchmark data for measuring the financial performance of a firm are not available for the region, so these data may form the basis for a benchmark study in future. To achieve an effective benchmark, it would be necessary to ensure that everyone was using the same figures to define the values used – i.e. what is included in ‘Overheads’ and what is not? However, for the purposes of this preliminary study, and without ensuring consistency of definitions, the approximate financial ratios for the firms responding to this question are: Overheads to Turnover 1 to 3.35 Debt to Total Assets 1 to 7.15 8.4.3 Many of the firms indicated (often with exclamation marks!) that they had no debt. The interest rates in many of the islands are above the international averages, and so it is wise financial management to keep debt down, provided this does not restrict their opportunities to expand or grow. However, it is felt, on the basis of the results of this survey and the interviews and anecdotal evidence that the firms may be a little too financially conservative, and that they are restricting their potential by their low-risk, debt minimization policies. Sometimes you have to spend money to make money, even if that means borrowing money to spend – at least, so Keynesian economics tells us. 8.4.4 The size of the firms in terms of average annual turnover over the past five years showed that 51% had a turnover in the range US$100,000 – 500,000, and 28% were working at a level of less than US$100,000. This gives a further indication of the relatively small size of many of the firms that responded. The balance of respondents showed, 6% in the range US$500,000 – 1 million, 4% in the range US$1m – 5m, and only one firm (2%) with a turnover of more than US$5 million. Given that these figures represent the firms’ income, and that in general, the consultant’s fees (including project management) will be of the order of 10% of the project cost, it can be said that these figures indicate involvement in projects ranging in size from around US$1 million to around US$60 million. 8.4.5 One of the issues raised with the contractors was the cost of the financial preliminaries including things like the performance bonds. As the consultant is often involved in preparing the documents that the contractor signs, it was decided to ask if they (the consultants) felt that the various financial clauses were justifiable. Again, given their involvement, it is not surprising that 59% thought that the financial preliminaries were fully justified. However, 27% thought that they were excessive. This is interesting, and presumably is the result of using

53
Caribbean Construction Industry Study, 2002
‘standard forms of contract’ without reviewing the detailed content of the various clauses involved. The low risk strategy is to use the standard form unaltered, and it seems this is the strategy of the local consultants, even when they find some of the clauses inappropriate in the local environment. One consultant who thought these financial preliminaries too high noted specifically that “The insurance premiums are too high”. 8.4.6 In a similar way, consultants were asked if they thought the levels of liquidated damages used in contract documents were logical and justified. Although 47% said ‘Yes’, 43% said ‘No’ they were not normally well thought out or justifiable. Again this supports the view mentioned above, that the consultants choose the low-risk strategy, and don’t question the terms of the contract document, even when they are considered illogical or unjustifiable. In keeping with trends elsewhere in the world where penalties for late completion are matched by bonuses for early completion, a number of comments were received along the lines “This is usually a one way street. It should go hand in hand with bonuses”. 8.4.7 Again, mirroring the questions asked of the contractors, the consultants were asked if they felt that contracts should include a ‘fluctuations’ provision to adjust the contract price according to changing economic conditions. Given the fluidity of the economic environment in many of the Caribbean countries, there are significant risks in estimating prices of local and imported materials, for example, that will be required on a project some time in the future – especially when that is more than a year away. It was interesting that 53% said that there should be a ‘fluctuations’ provision while only 24% said that there should not. It would appear that this is a contractual provision whose time has come, especially on larger contracts that are expected to last for more than a year. It is most needed in countries that have to import a significant proportion of their inputs to construction as projects in these countries are susceptible to price variations that are beyond their control or ability to predict. This either means that the client has to pay the contractor a very high risk premium or compensate him for excessive price changes when they occur. It was also made clear that for this to be implementable at all, there would have to be a reputable index of construction costs for each island that could be used as a basis for calculating fluctuations of specific bill items. 8.4.8 The answer to the question about the approximate cost structure of a typical project fell into two distinct groupings in terms of the range of figures. The architects, by and large, gave figures that seemed to represent their own cost
Average High Low Labour 33 50 20 Materials 45 65 10 Plant & Equipment 11 30 2 OH & Admin. 13 20 5

54
Caribbean Construction Industry Study, 2002
structures – and were, naturally, almost entirely for labour, whilst the engineers gave figures for the project as a whole, which were similar to the figures given by the contractors. 8.4.9 It would not have been sensible to average all of the figures because they represented different circumstances, and the figures for the consultant’s own costs were not sufficiently broken down to be useful, so the table here indicates the engineering consultants’ estimates of the breakdown of costs on a ‘typical’ project. It is interesting to note that the costs of materials represent 45% (contractors said 44%) of total costs while labour only represents 33% (contractors said 29%). This is a fairly dramatic shift from the situation in the late 1980s early 1990s in Trinidad & Tobago, when the labour costs were above 50% of the cost of construction projects, and materials were around the 30% mark. The change in their relative contributions to total cost can be explained by the fact that material prices have been rising faster than labour costs. In fact, in real terms most employees in Trinidad and Tobago are now considerably worse off than they were some twenty years ago, as their wages have not kept pace with inflation. These issues (the relationships between wages and costs in terms of current and constant dollar values) are addressed elsewhere in this study. 8.4.10 In order to get a feel for the experience of the responding firms, they were asked how long they had been in existence, and 59% of the firms were established before 1990, with 31% being established between 1990 and 1995, and the remaining one firm (2%) being established since 1995. Thus, all except one of the firms had been in existence for more than six years, and most for more than eleven. This is reasonably mature for firms in the industry. 8.5 Project size issues 8.5.1 To get a feel for the size of projects that the firms were involved in they were asked to indicate an average project size for the firm, measured by the overall cost of the completed project. 27% worked on jobs that cost, on average, US$100,000 and 500,000 and another 20% on jobs between US$50,000 and 100,000. 16% had an average project size of between US$500,000 and 1 million, and 14% indicated an average project size of more than US$5 million. 10% had an average project size of between US$20,000 – 50,000, and 4% had jobs of less than US$20,000 on average. We accepted that there would be a lot of variability, and were told so by two consultants, one of whom noted “We undertake environmental studies for projects with overall costs ranging from less than US$ 50,000 to US$ 2 Billion. To quote an “average” project size would be misleading.” 8.5.2 In addition to the overall size of the project, the firms were also asked about their average project size by consulting fees for the completed project. Here 31% said their average lay between US$25,000 and 50,000 and 29% indicated an average project fee to be between US$10,000 and 25,000. 20% indicated it to be less than US$10,000, and 10% indicated that their average project fees on
55
Caribbean Construction Industry Study, 2002
a completed project were over US$50,000. Again reservations about averaging such things across very different projects were acknowledged 8.5.3 What was more clear-cut was the size of the largest project (by overall cost) that the firm had ever been the lead consultant on. Here 53% indicated that they had been involved in projects costing over US$1 million, and another 10% indicated between US$500,000 and 1 million. By comparison, there were 8% whose largest project was less than US$20,000, 6% whose largest was between US$20,000 and 50,000, 6% whose largest was between US$50,000 and 100,000 and another 6% whose largest project, by overall cost was between US$100,000 and 500,000. These figures are relatively small, given that only just over half (53%) have been lead consultants on jobs costing more than US$ 1 million, but may reflect the fact that the smaller firms had not been the lead consultant on the bigger jobs that they had been involved in. 8.5.4 This is also suggested by the figures relating to the largest project (by consulting fees) that the firm had ever been involved in. Here 26% indicated their largest fees on a single project to have been in the range US$100,000 to 500,000. 20% had had largest fees of over US$1 million, and another 14% had had their highest fees between US$500,000 and 1 million. 12% indicated fees between US$20,000 – 50,000, and a further 10% indicated fees less than US$20,000. 6% had had their largest fee between US$50,000 and 100,000. Given a ratio of between 1:10 and 1:12 for consulting fees and total project cost (i.e. if we assume that consulting fees, including project management, are between 8 and 10 percent of total project costs), it will be seen that these figures are larger than those given in answer to the previous question, again suggesting that these firms had in general been involved in bigger projects than the ones on which they were the lead consultants. 8.5.5 Looking at their workloads, 41% indicated that their maximum workload was less than 5 projects at any one time, 31% could handle between 5 and 10, and 22% had taken on more than 10 at a time. This seems a heavy load for the relatively small firms that we are dealing with here, but it must be borne in mind that some of the firms have been through ‘boom’ periods when they were much larger than they are now – for example, Trintoplan Ltd. was some ten times it’s current size (in terms of professionals employed) in the late 1970s, and in those days, ten projects would not have been a daunting number. 8.5.6 In order to determine if the consultants were active in overseas markets, they were asked if they worked in other countries or regions during the past five years. Of course, they all worked in their home country, and 33% also found work in other CARICOM countries, while one firm (2%) had worked in the wider Caribbean and 3 (6%) had worked internationally. On average the work in the CARICOM region represented about 10% of their turnover. The figures for last year were a little lower, showing that only 16% had found work in CARICOM countries other than their own and that it represented about 8% of their turnover.
56
Caribbean Construction Industry Study, 2002
There again was a single firm that had worked in the wider Caribbean and one that had worked internationally outside the region. 8.5.7 The study also wanted to establish if firms had tried to get work overseas and had failed for some reason, and it transpired that 43% of firms had responded to requests for proposals (RFP), and put in bids for the design of overseas projects. One firm had put in more than 40 such proposals. In addition, one firm (2%) had bid for work in the wider Caribbean and 3 (6%) of the firms (architects) had bid internationally through design competitions to try to get work internationally. It may have been the relatively poor success rate, or the ready availability of work in their home countries that accounted for the fact that only 20% intended to bid for work in other CARICOM countries within the next year, although 8% intended to look for work within the rest of the Caribbean, and 2% internationally. The potential opening up of Cuba and other Spanish speaking countries may be the reason behind this switch to the wider perspective than CARICOM, but it may also reflect the lack of recognition of the market opportunities that CARICOM represents especially under the SME regime. 8.5.8 In order to find out if the firms had any specific obstacles to their involvement in overseas markets, firms were invited to identify problems that policy might address in the future. In the first instance the consultants were asked to indicate reasons why they may not have tried to get work abroad, or why they had failed if they had tried. 29% indicated that financial issues were holding them back, 27% indicated the problem was access to information about projects coming up, and 22% indicated that they had insufficient personnel and would find it difficult to recruit suitable people. Another 20% indicated “Other” as the problem and some indicated what they meant by this, with answers ranging from the one word “Size” to “We have been too busy in Trinidad to prepare bids” and “Need timely RFP advertisements in local media”. The remaining 6% that responded to this question felt that their firm’s lack of experience was holding it back. 8.5.9 Those respondents indicating that personnel were a problem, were asked to identify what kind of skills are in short supply and are needed. 20% indicated that technical and draughting were the main problem, and a further 20% indicated that it was professionals (engineers). 10% said it was professionals other than engineers, with quantity surveyors specifically identified as being needed (note there is no programme available in the Caribbean for the training of quantity surveyors), and 6% indicated that there was a shortage of administrative personnel. 8.5.10 Following closely on the answers to these last two questions firms were asked to identify what they thought would help their firm to prequalify for overseas jobs. 49% indicated that improved access to information about forthcoming projects was the main issue. The attitude was “If you don’t know what jobs are coming up, how can you bid on them?” This mirrors the comments
57
Caribbean Construction Industry Study, 2002
of the contractors and suggests even more strongly that a website providing project information would be a very powerful means of improving market access by local firms. Given the responses to the previous questions it is not surprising that 29% indicated that improved access to finance was also badly needed. . 24% indicated that extra personnel would be needed if they were to venture overseas, and availability of suitably experienced people is a problem. 12% indicated that their own staff would need retraining or upgrading in skills if they were to work abroad, and another 8% indicated that the availability and affordability of powerful and expensive, modern hardware and/or software was a problem. Two firms (4%) indicated ‘Other’ things would help them prequalify, without further explanation, but given the responses at interviews, it is likely that this was of a political nature. 8.5.11 When asked if their firm had prequalified and bid to act as consultant on an overseas jobs, and been unsuccessful, what did they think the reason was, the firms gave a wide range of responses as shown in the accompanying table. One firm did comment “It would be difficult to say what the reason may be as we are not normally privy to evaluation reports prepared for the consultancy bids”. It will be seen from the table that some 38% (18+8+12%) feel that they are bidding at a handicap when going for overseas jobs, with the home firms or international ‘foreign’ firms being given preference.
Reason for failure to win bid on overseas projects after prequalifying
% of firms giving this response
Inadequate Personnel 8% Lack of Financial Support 8% Preference of Client for foreign firm 18% Inadequate Hardware/software 2% Firm’s Lack of Experience 12% Funding agency preference for Foreign firms 8% Preference for Local Firms 12% Price (and hence own costs) was too high 10% Other 8%
8.5.12 It was known that a number of consultants had never bother to bid or even try to prequalified to bid for local projects that were tendered internationally. It was of interest to learn why they would not even bid for such jobs in their own country. The reasons given were much the same as for international jobs. Access to project information (20%) again came out as the top reason. Shortage of suitable personnel (18%) and finance (18%) were important factors. The firm’s lack of experience (5%) was followed by access to necessary IT hardware and/or software (2%) as the other reasons given. Some 20% indicated that some other factor had been principally responsible. There were a number of explanations for this. One commented that the problem was “Pre-selection of Consultants. The majority of proposals completed are done so with the perception that many consultants are used purely to satisfy the “tender” requirements and that “preferred” consultants have already been selected.” In a similar vein “Points

58
Caribbean Construction Industry Study, 2002
system favours firms with larger staff numbers and ‘last five (5) years’ requirements in a market where jobs are few (acts against local firms)”. This hardly needs further comment, as it reinforces the general perception that the ‘playing field’ is not level. 8.5.12 When asked what would help their firms to prequalify on local jobs that are to be tendered internationally, the responses were significantly different from those given previously in this section. The big issue here was the need for extra personnel (39%), with access to project information (22%) and finance (16%), and extra qualifications among existing staff (10%) as the other main issues, with the lack of modern equipment (5%) also being indicated as important. 4% indicated that the reason for failure was some other factor. One respondent suggested that the key issue would be an “Assurance that requests for prequalification are impartial”. Clearly a firm is wasting its time and resources if it is bidding for work that is already predestined to go to someone else. One consultant summed it up saying “Project information and staff to spare are vitally important along with finance in operating outside of the home country”. 8.5.13 When asked if they could identify reasons why, having prequalified, they may not have been successful in winning bids for internationally tendered contracts, the firms gave the responses shown in the accompanying table. When asked to indicate the most important issue, one consultant wrote: “Our most significant draw-back in these situations is the preference of Clients (especially Government Agencies) for Foreign Consultants”, and another noted “Agency funded projects generally have ‘strings’ attached”.
Reason for failure to win bid on internationally bid local projects after prequalifying
% of firms giving this response
Inadequate Personnel 4% Lack of Financial Support 6% Preference of Client for foreign firm 12% Inadequate Hardware/software Firm’s Lack of Experience 2% Funding agency preference for Foreign firms 16% Preference for Local Firms 6% Price (and hence own costs) was too high 12% Other 8%
8.6 Additional comments 8.6.1 Finally the consultants were asked about their knowledge of the negotiations going on, and the protocols adopted during the creation of the Caribbean Single Market and Economy (CSME). The CSME is being created and the terms of trade adopted will affect the consulting firms involved in this survey, whether they are aware of it or not. The answers to this section showed that only 29% of the consulting firms were aware of the protocols (49% were not), 53% thought they affected their firms (16% also thought not!), and a huge 71%
59
Caribbean Construction Industry Study, 2002
wanted to know more about the protocols (as compared with 6% who didn’t want to know more). This suggests that, as was the case with the contractors, there is a clear and urgent need for the secretariat together with the specific industry sector groups to conduct a number of sensitizing seminars throughout the region to tell people what is happening and how these events will affect them. This study has begun the process, but a lot more needs to be done. 8.6.2 A number of additional comments were appended to the survey questionnaire, including several addressing the issue of inadequate fees for professional consultants, which were felt to be holding back the development of the industry. One suggested the need for “Full registration machinery in local (industry) and CARICOM”. This is an issue that is being addressed by both the Caribbean Community Secretariat and the CCEO. 8.6.3 Several respondents harked back to issues raised earlier. Hence: “The threshold criteria for financial capacity, plant and equipment and overall personnel experience are too great for small island developing nations.” Another wrote: “Local firms cannot qualify for agency funded projects because of financial requirements imposed by funding agencies. Even if local firms have the necessary technical expertise, they need the financial backing of large international firms. Therefore, local firms cannot be lead consultants for such projects.” And another wrote, “Most prequalification conditions are too stringent and too high standards of financial statements required even for environmental projects”. All of these and other similar comments address the requirements of the international funding agencies and their perceived inequity and bias against local firms. This is clearly an issue that needs to be addressed by these agencies, as a major part of their remit is to serve the needs of the countries of the region and perceptions of bias are not in their best interests. 8.6.4 Many comments were received along the lines that information on up-coming projects was not readily enough available. On consultant did indicate that the Caribbean Development Bank (CDB) put out a publication that lists all upcoming projects but that it is rather expensive to subscribe to, in the same way, there are commercial websites that provide a similar service at a similar cost. It was strongly felt that a regional service should be provided that gives reasonably cheap and ready access to project information, particularly for large, publicly funded projects. The ‘transparency’ that this would create would improve both the competitiveness of the bidding process and the image of the agencies and their public sector clients. Various respondents suggested that the Engineering Institute of The University of the West Indies would be the ideal repository for the data base and website needed to provide this service – which, once established should be a self supporting venture.

60
Caribbean Construction Industry Study, 2002
9. SUMMARY OF SURVEY OF CLIENTS OF CONSTRUCTION THROUGHOUT THE REGION
9.1 Note 9.1.1 The percentages given in this Summary do not always add up to 100%, this is because the respondents often missed out questions, simply made comments, or gave inappropriate answers (which were thrown out), or because they gave multiple answers when more than one answer was relevant. To reduce confusion, we have used percentages throughout. 9.1.2 Note also that we have not attempted to separate out any regional variations in the responses given, for example, as between the clients in Trinidad & Tobago and Guyana. Given that many of the client organisations are regional in their operations (e.g. banks and insurance companies) there seems little to be gained, anyway, by trying to be country specific. For the purposes of this study and the formulation of regional policy, it is presumed that the overall summary position is the relevant viewpoint. Thus, the data have simply been accumulated and converted into a common currency base where necessary. The data for the individual territories will be preserved so that they can be reviewed at some future date for country specific policy guidelines if required.
9.2 Management issues 9.2.1 A total of 17 client organisations responded to our survey. These were distributed, 2 from Jamaica, 1 from St Kitts & Nevis, 8 from St Lucia and 6 from Trinidad & Tobago. This sample covers both public and private sector organisations that ‘often’ procure construction services. In this regard, the public sector is of prime importance throughout the CARICOM region, as it is far and away the major purchaser of construction services. However, there was considerable resistance from many public sector organisations to filling out the questionnaire, usually on the basis that clearance was required from the Permanent Secretary or Minister before any such information could be provided – and the necessary clearance was never obtained. This is felt to be a sad hangover of colonial bureaucracy where opacity rather than transparency was the order of the day. None of the information requested here could be considered ‘sensitive’ or ‘commercially valuable’ and its availability could help improve the workings of the system. Let us hope that future studies of this nature meet a more forthcoming response from the public sector agencies that are supposed to have the public interest at heart. However, although the numbers may seem relatively small, they do include many of the more important clients in the region, including a reasonable number of public sector agencies. 9.2.2 The vast majority of these organisations have been in business for more than a decade, with 82% of the responding firms having been established before 1990 and 6% being established between 1990 and 1995. As one would expect, the major purchasers of construction services tend to be the more mature organisations.
61
Caribbean Construction Industry Study, 2002
9.2.3 All of the responding firms, naturally, operate in their home country, with 76% saying that they only operate there, 12% indicated that they also operate within the CARICOM region, and 6% operate internationally. Obviously, the public sector organisations only operate on a local basis, and their orientation does tend to distort their responses when compared with commercial organisations. For example, public sector organisations are often expected to compromise efficiency for social responsibility, which is fully understandable, but does mean that their responses will not necessarily address or advise issues of economic effectiveness. 9.2.4 This tendency to compromise efficiency shows up in their response to questions about procurement strategy, where they act in one way when given freedom of choice, but another way when their choice is constrained. Hence, when asked whether international tenders were invited for new structures, quite naturally, the public sector organisations said ‘No’ with the qualifying comment “Unless working with international lending agencies”. As a result, 76% of the client organisations indicated that they only called for local tenders, 29% said that international tenders were invited, and 24% said that tenders from firms within CARICOM were invited. 9.2.5 Many public and private sector organisations nowadays use different forms of procurement like Design-Finance-Construct (DFC), Build-Own-Operate-Transfer (BOOT) and Build-Own-Lease-Transfer (BOLT) to acquire facilities. In some cases, private sector organisations (like insurance companies) take the lead by proposing and then getting involved in the provision of public sector facilities by being part of the consortia that undertake the projects. In other cases, the public sector identifies socially desirable facilities – that it cannot afford out of its current budget – and allows the private sector to put together a package to provide the facilities, and to finance them out of revenues or out of future budget allocations. When the client organisations were asked if they used these approaches, they were evenly split with 47% saying ‘Yes’ and 47% saying ‘No’. 9.2.6 A follow on question asked whether the organisations undertake ‘speculative building’. All public sector client organisations said ‘No’ – presumably because the demand is there before they procure the facilities they need, rather than building ahead of demand - which is what the term ‘speculative’ suggests. By the same taken, many of the private sector clients who build residential complexes try to pre-sell those facilities and hence establish demand ahead of procurement. However, all private sector building of this nature (i.e. apartment towers, or office blocks built by insurance companies, for example) whether effectively pre-sold or not should be considered ‘speculative’. This was not clarified for the participants, and the confusion may have led to a lower response rate to this question, with 65% saying they did not undertake speculative building and only 18% saying they did.

62
Caribbean Construction Industry Study, 2002
9.2.7 Recognising that there are synergistic benefits to be obtained from successful and repeated teamwork, the client organisations were asked if they had an understanding with a client and/or a contractor for undertaking construction projects, either to provide facilities for other clients or for themselves. 59% said ‘No’ and 35% said yes. One organisation noted that it always used the same contractor, but dealt with different consultants depending on the nature of the project. 9.2.8 Most public sector agencies that undertake significant procurement of construction services want to have representation on the project management team, either through their own personnel or through some other agency or Ministry. In the same way, many private sector client organisations have strong management capabilities and want active representation on the project management team. It was not surprising, therefore, that 65% of respondents did get involved in the management of their own projects, while 29% did not. 9.2.9 Where a level of expertise in a specific discipline is identified as an organisational strength, it is common for industrial organisations to try to exploit this. Similarly, where a public sector organisation has a capacity, it is there for a specific reason, and will often be used in similar circumstances for other public sector organisations – hence a Ministry that has construction project management skills will usually be expected to apply those skills to the benefit of other Ministries. Thus, the client organisations were asked if they used their project management skills for other owners, and 47% said they did while 41% said not. 9.3 Level of satisfaction 9.3.1 The success of any industry can only ever be judged by the satisfaction of its customers. No matter how good a job one thinks one is doing, if the customer is not satisfied then the work has not been done well. The principal objective of this study was to investigate the competitiveness of the local industry, and so finding how satisfied the industry’s customers were was a key issue. This section of the questionnaire addressed the (subjective) satisfaction of the client to the services provided by both local and foreign firms. 9.3.2 When asked whether they were satisfied with the performance of local consultants, 65% of clients said ‘Yes’, while 29% said ‘No’. The fact that half as many were dissatisfied as were satisfied cannot be considered acceptable by local consultants, particularly in view of the fact that amongst those expressing satisfaction, several commented along the lines “In general, yes, however the performance of some has been wanting” and “Predominantly professional services are provided, however there is room for improvement”. Some of the clients who were dissatisfied were quite strongly critical. 9.3.3 Local contractors fared even worse than the local consultants, in that 59% of clients were dissatisfied with their performance while only 29% were satisfied.

63
Caribbean Construction Industry Study, 2002
Again, this question provoked quite a number of comments, many focusing on the lack of qualifications of local (small) contractors. The list of areas of dissatisfaction would cover the gamut of the managerial responsibilities of a contractor, and a majority noted that local contractors require a disproportionate amount of ‘supervision.’ There is clearly no room for complacency by local contractors. The majority of their clients are dissatisfied with their work. 9.3.4 To see whether foreign consultants and contractors fared any better, the same questions were asked about satisfaction with the services they have provided historically. 71% of the client firms that had used foreign consultants were satisfied with that service while only 6% were dissatisfied. While this relatively high level of satisfaction could be considered a resounding recommendation, a number of comments indicated that everything was not as ‘rosy’ as it first appeared. Firstly, it was noted that although foreign consultants are “generally more effective”, they are also more expensive. – this is not an insignificant issue given the complaints of local consultants that their fee levels are too low. Secondly, there were a number of comments along the lines that foreign consultants “still appear to have the feeling that they are dealing with 3rd world countries and as such their work/attitudes reflect this” and “some firms come with a “my-way” attitude, despite the Terms of Reference”. In other words the clients seem to feel that foreign consultants tend to be rather arrogant, and although they respect the consultants’ expertise they resent their attitudes. 9.3.5 When asked if they were satisfied with the work of foreign contractors, only half of the sample had had experience and were able to respond. Of these exactly half were satisfied and half dissatisfied. Although they fared better than the local contractors, there are clearly problems for local client organisations with the service provided by foreign contractors. This gives the lie to the perception that everything will be okay if it is done by big foreign contracting firms, and substantiates the view of the local industry that you cannot guarantee competence just because it is imported and expensive. Comments explaining their responses indicated that the clients felt foreign contractors to be no better and no worse than local contractors. 9.3.6 The Western economies depend on competitive markets to try to establish transaction efficiency. To be competitive a market needs a ‘large number of willing and able’ sellers so that the customer has effective choice. To see if clients felt they had adequate choice, they were asked if they felt the local market for consultants was competitive enough. 53% said that it was not, while 35% said it was. The comments indicated that the clients felt that there were not enough new firms entering the market and that the lack of competition was leading to a falling off of the standards of service. 9.3.7 A similar response was obtained when the same question was asked about local contractors. In this case, 65% said it was not competitive enough while 29% said it was. The comments indicated that the clients saw a cut-off point in
64
Caribbean Construction Industry Study, 2002
the size of projects above which the local market ceased to be competitive. One indicated that the cut-off was around TT$50 Million; on larger projects there are only a few local firms competent, and as a result, overseas contractors would tend to be used. 9.4 Contract performance 9.4.1 Contractors and Consultants were asked during this study how they felt about the bonds and financial preliminaries that arise before projects start and the liquidated damages that arise after the project’s completion when it is delayed. Both of these items are supposed to give the client some measure of financial protection from poor performance by the contractor on his project. However, they both introduce an extra level of cost, for eventually the client has to pay for them. When asked if they though the cost of the financial preliminaries was justified 88% said that it was, while only 18% said not. Although this represents an overwhelming vote of confidence in the need for bonding and insurance etc., a number of comments did qualify the affirmation. In particular, the clients felt that the historic performance of the contractor should be taken into account in arranging the bonds. If a contractor performs consistently well, why should he face the same bonding requirement and the same charges at the banks or other bonding institutions as one who has a lesser record of success? Presumably if the charges came down for the good contractor, then so would his price to the client – a classical win-win situation. 9.4.2 The situation was less clear cut with the provisions for liquidated damages, but still quite solidly in favour, with 59% saying that their levels were logical and justified and 29% saying not. The comments also told the same tale, with several responding that they were “not sure”, and several commenting along the lines “I am not sure they are tied to the loss suffered by the user for lack of use” while still affirming their value. There is perhaps a need for consultants and clients to look at the figures used in the provisions for liquidated damages and also to consider the option of paying a bonus for work completed ahead of schedule (though this would require careful attention to be paid to the development of the baseline schedule). 9.4.3 Given that the countries of the Caribbean have been susceptible to exchange rate changes and relatively high rates of inflation, the clients were asked the same question as the consultants and contractors about their attitude to a ‘fluctuations’ clause in their contract documents. Would the client rather pay a premium for the contractor to assume the price risk or would they prefer to forego that premium and assume the risk themselves? Interestingly, the majority (53% to 35%) said that they would prefer to take the price risk themselves, thus indicating that they were well aware that the contractor’s premium would probably provide him with a substantial comfort margin. Those in favour did have some reservations, indicating that the fluctuations clause should be restricted to certain items or to certain specific, unexpected circumstances. For organisations that have to specify the budget for a project at the outset, this would not be

65
Caribbean Construction Industry Study, 2002
appropriate, as they would find it difficult to fund increments due to an exchange rate change or sudden inflation. 9.4.4 To extend the issues being examined under the heading of client satisfaction into more objective territory, a number of questions were asked that related to actual project performance. Hence, the client organisations were asked if their projects were normally delivered on time, and while 35% said ‘Yes’, 59% said that they were not. When asked to indicate how serious the delays had been the firms indicated that a worst case scenario was around the 100% mark, and the average between 15 and 25%. Some speculated that the reasons for the delay varied between over-optimistic scheduling, poor design, scope changes and variations. 9.4.5 The three key parameters in project delivery are time, cost and quality, so having asked about the timeliness of project delivery, the focus was then put on cost and quality. Thus the client organisations were asked if their projects were normally delivered on cost. Given the poor time performance, it was reassuring that 59% said that their projects were normally on cost as opposed to 29% who said not. An average cost overrun of 20-30% was indicated by one client who had not had a good experience. 9.4.6 To complete this section the questionnaire asked if the projects were normally delivered at an ‘acceptable quality level’. A very satisfactory 82% said ‘Yes’, while 12% said ‘No’. These results suggest that the industry puts most focus on providing a satisfactory product for the client in terms of quality, the secondary objective is delivery on cost and timeliness is a somewhat distant third. This is probably a fair reflection of the culture in most of the countries of CARICOM! 9.5 Project size and markets 9.5.1 The next section of the questionnaire addressed the client organisation’s normal scale of operations. Because we are dealing here with organisations that tend to be repeat clients and that their projects tend to be larger than average, it is not surprising that their average project size was also large. Hence, 71% indicated that their average project size was over US$ 1 million. 18% indicated their average project to lie in the range US$100,000 – 500,000, and 6% indicated an average project size less that US$100,000. 9.5.2 In a similar way when asked what was the largest project that the organisation had ever been involved in the majority (53%) indicated over US$20 million. This is quite a large project by local standards. 12% indicated their largest project to have been in the US$ 10 to 20 million range, 24% indicated between US$ 1 and 10 million, and 12% indicated that their largest project was between US$500,000 and 1 million. None selected the option for a project size smaller than this.

66
Caribbean Construction Industry Study, 2002
9.5.3 These client organisations, being repeat purchasers of construction services may also be expected to have more than one project under way at any time. It was rather surprising to learn, however, that 41% of them had had more than 10 projects going at a time. Another 35% had been involved in between 1 and 5 projects, 18% had been involved in between 5 and 10 projects and only 6% had ever been involved in only one project at a time. Given the average project size indicated above, this does seem to suggest that there is a valuable market for construction services on larger projects. 9.5.4 Because the CARICOM Secretariat is interested in the competitiveness of the industry in regional and international terms, it was of interest to find out how many client organisations were involved in project development in more than their home countries. Although 71% of the organisations indicated that their only market was in their local home country, 18% indicated a market involvement with other CARICOM countries, and 6% with other Caribbean countries. It is interesting and reassuring to note that clients are also looking at the region for developmental opportunities not just their home country. Obviously, the public sector organisations in each territory are only looking inwards, so the private sector representatives are even more active than suggested by the figures here. 9.5.5 The figures are even more reassuring when looking at the figures representing the organisations’ plans for the next year or so. While 65% of the organisations said they would only be involved in projects within their own home country , 12% said they would get involved in projects in CARICOM, 12% said the rest of the Caribbean, and 6% would get involved in projects internationally. 9.6 Additional comments 9.6.1 When asked about their knowledge of the move by CARICOM to establish a Single Market and Economy, it was again clear that there is a need for an educational effort. 53% of client organisations indicated that they were unaware of the protocols being negotiated on their behalf by the CRNM, while 24% said they were aware. 35% thought the protocols affected them while 29% felt that they did not, and, 71% wanted to know more about the protocols and what is going on, while only 12% were not interested. 9.6.2 Only one final comment was appended to any of the questionnaires, but it was a very relevant comment, so it is given here in full, “There seems to be an imbalance in the number of projects awarded to international firms against local and regional. While it can be argued that the regional firms are not outfitted (financial, expertise, equipment, man power) to undertake major regional projects, the international firms should be somehow forced to joint venture with local regional firms on projects where this is the case. The results of such could prove to be extremely beneficial to the regions quest for development of expertise on the construction arena and could continue to bring financial benefit to our regional companies, not to mention education and development of the industry”. This makes interesting reading coming, as it does, from a client.
67
Caribbean Construction Industry Study, 2002
10. ANALYSIS OF REGIONAL COMPETITIVENESS 10.1 Infrastructure and the construction sector 10.1.1 One of the most important areas generating projects for the construction industry is the creation of the nation’s physical infrastructure. Poorly developed infrastructure prevents industry from being truly competitive as well as affecting the quality of life the citizens of a country. The lack of adequate infrastructure hinders further growth in industrialized areas, and creates an obstacle to industrialization and economic take-off in rural areas. It is the catalyst that enables and enhances economic development. 10.1.2 The creation of new infrastructure impacts first and most immediately on the construction industry and, thereby on employment and on the national product. However, such investment in public works should not be considered merely in terms of its immediate impact on aggregate demand, i.e. as a means of injecting money into the system in order to activate the Keynesian multipliers of production, employment and income. The most important aspect is not so much the effect it has on the construction industry, but the longer term impact it has in boosting the nation's productive capital; in other words, the first and immediate impact is valid and valuable, but its secondary and downstream impacts are more long term and more far reaching. 10.1.3 However, our interest here is focused on the construction industry, so we will look briefly at the role of construction in the development of the national infrastructure. One problem with infrastructural works is that they are generally large and expensive, and thus tend to be procured by the public sector. The governments of the region, individually and collectively, must be the prime movers in the shaping of policy measures to enhance the competitiveness and therefore greater participation of the local (regional) construction sector. 10.1.4 It is estimated9 that well over 90% of infrastructural development in the region is funded by the public sector. Direct private sector investment is confined to a few power utilities, ports and airports. In the mid 1990s close to US$600 million per annum was spent on infrastructure and from then into the 2000s annual expenditure was expected to be in the order of US$1 billion (ibid). In order to achieve this level of investment greater private sector participation may be necessary and should provide more efficient management. The Public Private Partnership (PPP) initiatives that have been taken in a number of countries (notably Chile in this part of the world), have proved very successful at mobilizing private finance to underwrite the cost of providing public facilities in the form of infrastructural improvements – especially roads. The industry benefits in a number of ways from involvement in these initiatives, not least in being able to maintain a more level and manageable workload. 9 This discussion is based in part on the “Infrastructure for Development: A policy agenda for the Caribbean”, IADB/CDB Report, June 1996

68
Caribbean Construction Industry Study, 2002
10.1.5 The regulatory mechanisms set up to establish the relationship between state and private infrastructure investors should also incorporate policy measures to encourage local investment and enhance the competitiveness of the local construction industry (the lessons learnt by countries like Chile should be instructive in this regard). Because of the public sector involvement this means that there are a number of bureaucratic constraints on the procedures put in place for getting work done. For example, the procedures used for public tendering do not guarantee the choice of the most reliable firms; and the one element that carries any real weight in the assessment of bids is the price. Bids are often too low, and can end up in the contractor going bankrupt and works stopping, or they may be too high and appear wasteful and/or corrupt. 10.1.6 Another major factor is the timing of these projects. Informal and unplanned human settlements are very common in the Caribbean and their existence creates sudden surges in demand which local firms are ill-equipped to respond to. This puts local firms at a severe disadvantage in terms of mobilization of resources to bid on the relatively large projects that infrastructure works to service these communities require. 10.1.7 Well planned infrastructural development would go a long way in establishing a more steady level of demand and thus more stability in the construction sector so that firms in the Caribbean could better be prepared to mobilize to carry out these works. High priority should be given to public sector reforms to strengthen the institutional capacity of national and local government bodies to better plan human settlements and the attendant infrastuctural works required to service these communities. 10.2 Public debt 10.2.1 Trinidad and Tobago has been in the fortunate position in recent times of having significant reserves of oil and gas that are relatively easily exploitable. This has meant continuing high flows of revenues to the exchequer, and the consequent ability to control public debt. T&T’s public debt in 2000 was in the region of 59% of GDP compared to the Italian figure a year or so earlier of 121.6% of GDP. T&T’s ratio is probably the lowest in the CARICOM region (figures are not available yet to confirm this), so T&T is not in the same position as some of the other countries in the region. 10.2.2 When public debt is too high a proportion of GDP, as it was in T&T during the early 1990s, the state budget is almost completely absorbed by the costs of running the civil service and the servicing of national debt. In these circumstances, public expenditure can only be reduced by cutting capital account expenditure, in other words, by reducing the public sector investment programme (PSIP), to the immediate detriment of the construction industry.
69
Caribbean Construction Industry Study, 2002
10.3 Transportation 10.3.1 The competitiveness of industry in general, especially in small island states, in both internal and international markets, is affected directly by its transport costs, and these in turn are determined by the state of the transportation infrastructure, i.e. the roads, ports and airports. The quality of the road networks in the entire Caribbean region leaves much to be desired. The situation Trinidad and Tobago, the most developed of the English speaking Caribbean states, is very instructive. 10.3.2 In Trinidad and Tobago, the main problem with this infrastructure is that the main roads between different parts of the country are either overused, of poor quality, or seriously congested during peak periods, or all three, particularly in the case of Trinidad. The situation is exacerbated by the fact that the number of commuters continues to increase as both the population expands and as car ownership per capita increases. The inadequacy of the public services leads to the use of private means of transport, making the existing road network even more saturated. The situation is complicated by the fact that the main arterial routes are difficult to expand because existing structures and largely unplanned new settlements are crowding out the physical space for extending existing roads or building new roads. 10.3.3 The consequence of this is that the most significant transport infrastructure work is the extension and improvement of the road network to new parts of the country and the upgrading of intersections to try to alleviate the extensive delays that currently occur. This has implications for the construction industry, especially as most of these works are let on an internationally bid basis. Because these tend to be large contracts and are very ‘visible’ there is usually a reaction from the local industry if and when they are let to foreign consultants or contractors. 10.3.4 There is little in road design or construction that is technically beyond the competence of local consultants and contractors. It should be noted that the experience of the performance of local engineering firms involved in building the new Churchill-Roosevelt – Uriah Butler Highway interchange, with its proposed innovative arch design, will have a significant impact on the confidence of the relevant Government Ministry for future projects. It should also be noted that the uproar over the award of the design of the new airport terminal to an American firm has hardly died down, despite the fact that the award was made nearly three years ago, and the facility is now open and operating. The articles and letters to the Editors of the major local newspapers shown in Appendices III, IV and V bear witness to this fact – note that these appeared, amongst others, within a three month period while this study was in progress, in the newspapers of Trinidad & Tobago alone. This may be indicative of a widespread problem.
70
Caribbean Construction Industry Study, 2002
10.4 Water and sewerage 10.4.1 The other key parts of the national infrastructure that are of great significance to the construction industry are water and sewerage and energy. It is incredible that an industrialised and relatively rich country like Trinidad and Tobago has a water supply and sewerage disposal system with such serious problems, and it is not because of inadequate supply, but rather the distribution system. Some areas do not have the necessary infrastructure to provide even the basic services, such as access to pipe-borne drinking water and effective sewerage and drainage. On top of this, a large part of the existing water distribution system is outdated and in poor repair and the loss of water is considerable. 10.4.2 The laying of piping, for water distribution and sewerage and drainage collection, is one of the functions of the construction industry, and so the development and improvement of the system is of great significance to local consultants and contractors. They are ready, willing and able to take on the necessary works. The holdback is the finances of the Water and Sewerage Authority, which has always been under-financed and prone to political interference. Again, there is little or nothing in pipe network design or construction that is technically beyond the competence of local consultants and contractors. 10.4.3 The major reason why they have been overlooked for projects in the area in the past has been the size of the projects formulated. A number of major projects have been let in recent years, and the success of foreign firms in winning these jobs has been a sore point with the local industry. Very strong statements have been made by the local industry about rationalizing project sizes to levels appropriate to the local construction industry, without any necessary loss in efficiency. Equally strong comments have been made about the appropriateness of using prequalification criteria that favour massive firms able to handle huge projects, in order to determine who should handle relatively small-sized projects. This will be discussed in more detail later. 10.4.4 One local consultant noted that to prequalify for the design of a major pipeline contract in the past year, the contract had required the consultant to have been involved as the lead consultant on a pipeline project of equivalent size in the last five years. This, however, was the first project of this size locally for more than a decade. So, it seemed to him that the terms for prequalification had specifically been written to exclude local consultants. This view was reinforced by the lending agency’s refusal to allow the project to be broken down into smaller contracts that would have allowed local consultants to become involved. Although these views may seem paranoid to the lending agencies that probably think they are only doing what is economically efficient, they are a sincere expression of the frustrations of the local industry at what seem to be ‘Catch 22’ regulations that always seem to find a way of excluding them.

71
Caribbean Construction Industry Study, 2002
10.5 Energy 10.5.1 The relatively recent separation of electricity generation from distribution, and partial privatization has allowed the state to withdraw most of its financial support from this sector. This is meant for the system to run more economically and more efficiently. However, major beneficiaries of this privatization have been foreign interests, although it is debatable whether local enterprise is prepared to undertake running modern power generating facilities safely and cost effectively. In recent years, the role of the state is primarily to guarantee that the market operates properly, avoiding monopoly conditions and the negative consequences they bring for the consumer. The state’s other major role is to provide a long-term energy policy to reduce wastage and encourage more exploitation of renewable energy opportunities. 10.5.2 The almost total lack of interest in solar power for domestic purposes in Trinidad and Tobago is a sad indictment of public policy – and is largely both the result of and the reason why solar systems are generally far too expensive relative to the cost of grid supplied energy (the payback period on a domestic solar water heater in Barbados is less than three years, in Trinidad and Tobago it is over twenty one years – according to a study done in 200110. The development of the distribution grid is work that involves the construction industry, and again the work involved is technically well within the scope of the local construction industry. For example, when countries like Dominica, say, invest in hydroelectric generating facilities, the extension of the grid, and the construction of pylons for support, are relatively straightforward engineering exercises, but local firms seem unable to win such contracts. It is likely that electricity supply will be more localized in future. Generation will probably be more based on renewable resources (like solar or wind power) and hence more localized (with the additional benefit of hugely reduced distribution losses), and as a result, distribution will be less of a national and more of a local network development issue. This will have significant consequences for the construction industry. 10.6 Information and telecommunications 10.6.1 There can be little doubt that the future economic well-being of the country will be determined in significant measure by the sophistication of the information and telecommunication technologies that are developed and diffused throughout the country. These will be the basis not only for the economic, but also for the social and cultural development of the country. Suitable channels of communication must be established that can cope with the rapidly increasing amount of information (text, images, sound, etc.) that individuals, businesses and institutions, will want to exchange both locally and abroad, in the coming years. While doing so, particular attention must be paid to technological evolution, to try to avoid the risk of obsolescence of the physical 'architecture' even more than of the 'product'. The CARICOM region, being made up mainly of a number of small 10 Brian Pinnard, Unpublished Special Research Project, Dept of Civil Engineering, Faculty of Engineering, UWI, 2001

72
Caribbean Construction Industry Study, 2002
island territories with numerous small and medium-sized enterprises, probably needs a more sophisticated, more efficient communication network than do other trade groups. Again, the installation of the physical architecture is the role of the construction industry, and, again, it is technically well within the competence of the local industry. The current wire based technology already is outdated. Technologies such as fibre optics and/or direct satellite links are rapidly replacing the present system. Fibre optics technology requires the direct input of the construction industry (in laying the infrastructure) and will be an important source of employment in future. However, in the longer term, it is likely the direct satellite communications will replace the land based technologies, and will have its economic and technological impacts elsewhere. 10.7 The construction sector multiplier 10.7.1 Building up a country's infrastructure means providing services for businesses and for citizens. In the long and medium terms, infrastructure promotes supply – it enables the producing sectors to access their resources and markets more easily and cheaply, thus enhancing their competitiveness. In the short term, infrastructure investments are part of aggregate demand and, as such, directly affect the levels of production and employment of the firms that implement them (mainly consultants and contractors in the construction industry), and indirectly, the levels of production and employment of associated firms. This generates employment and income for those involved. 10.7.2 This direct and most immediate effect on the economic system is followed by a series of indirect effects that involve the enterprises that supply building materials and components, electricity, gas and water supplies, fittings and services. In addition to these direct and indirect effects there is also a further element, the induced effect. Newly employed workers earn income that may be spent on the purchase of consumer goods, which, in turn, leads to increased production and employment in these same sectors. 10.7.3 There is no information in the Caribbean on the multipliers involved, but it has been estimated in other countries that $1 spent on construction generates another $1.5 in indirect and induced effects. In other words, expenditure on construction has a powerful knock-on effect through the economy. This results partly from the construction workers’ characteristic high propensity to consume, and partly from the strong upstream and downstream inter-industry linkages. This latter effect will be greater in Trinidad and Tobago than in the less developed countries (LDCs) of the region because the construction industry in Trinidad and Tobago can buy the majority of raw and building materials from other industries in the country, and the income generated is mostly spent in Trinidad and Tobago. The LDCs are obliged to buy the raw materials and consumer goods that they need from the more industrialized countries (including Trinidad and Tobago), and hence much of the potential economic multiplier effect is not seen in the home territory.
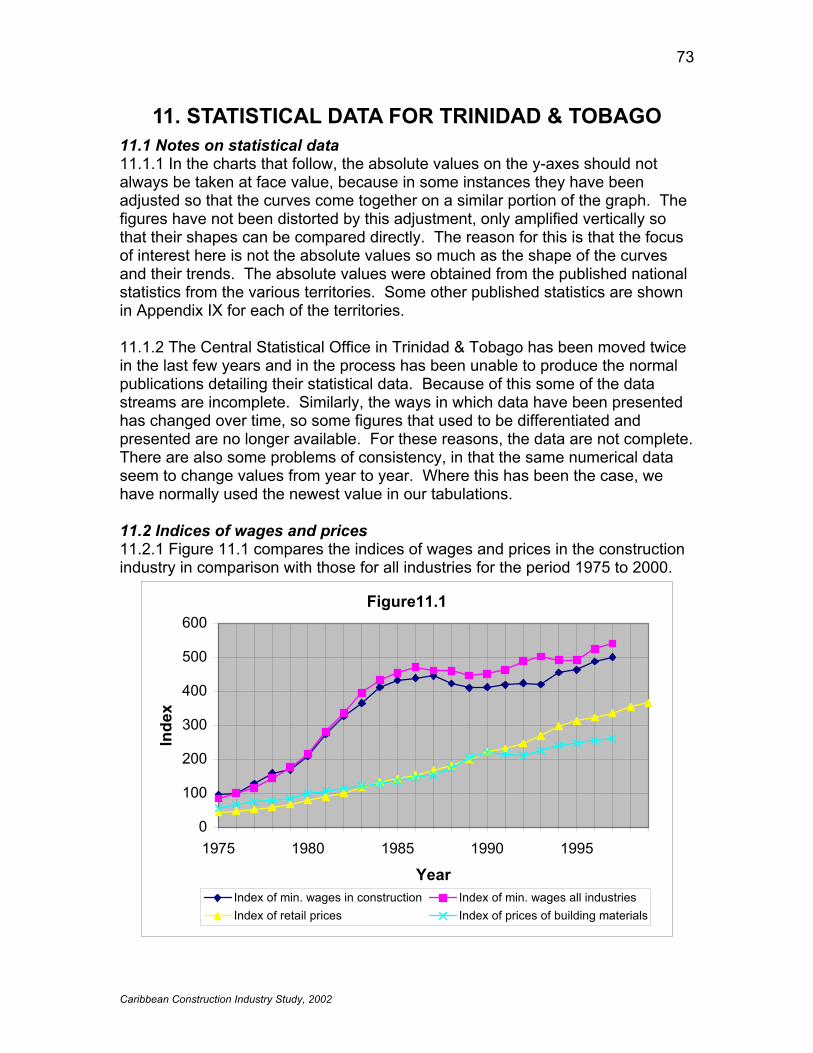
73
Caribbean Construction Industry Study, 2002
11. STATISTICAL DATA FOR TRINIDAD & TOBAGO 11.1 Notes on statistical data 11.1.1 In the charts that follow, the absolute values on the y-axes should not always be taken at face value, because in some instances they have been adjusted so that the curves come together on a similar portion of the graph. The figures have not been distorted by this adjustment, only amplified vertically so that their shapes can be compared directly. The reason for this is that the focus of interest here is not the absolute values so much as the shape of the curves and their trends. The absolute values were obtained from the published national statistics from the various territories. Some other published statistics are shown in Appendix IX for each of the territories. 11.1.2 The Central Statistical Office in Trinidad & Tobago has been moved twice in the last few years and in the process has been unable to produce the normal publications detailing their statistical data. Because of this some of the data streams are incomplete. Similarly, the ways in which data have been presented has changed over time, so some figures that used to be differentiated and presented are no longer available. For these reasons, the data are not complete. There are also some problems of consistency, in that the same numerical data seem to change values from year to year. Where this has been the case, we have normally used the newest value in our tabulations. 11.2 Indices of wages and prices 11.2.1 Figure 11.1 compares the indices of wages and prices in the construction industry in comparison with those for all industries for the period 1975 to 2000.
Figure11.1
0
100
200
300
400
500
600
1975 1980 1985 1990 1995
Year
Inde
x
Index of min. wages in construction Index of min. wages all industriesIndex of retail prices Index of prices of building materials

74
Caribbean Construction Industry Study, 2002
11.2.2 As will be seen both the indices for construction fall below the industry averages for most of the period under consideration. It is interesting that the costs of building materials leveled off so significantly after 1990 and have only begun to rise slowly again thereafter. (The figures are not available since 1997, but a significant rise in the price of cement after then would have bumped up the index for building materials significantly, especially as the heavily weighted elements tend to be cement-intensive – i. e. substructure, walls, and wall, floor and ceiling finishes which account for over 50% of the index.) This means that costs in construction have lagged behind retail prices and wages in other industries, and consequently that construction costs have been kept below the norm for the economy. This should mean that the client is getting better value for money from a $ spent on construction than for a $ spent on any other consumer good, provided that construction productivity levels have been maintained. This can be examined at the macro level by looking at the gross domestic product (i.e. the total output) of a construction worker as compared with a worker in the average of all other industries. 11.3 National GDP/capita and construction GDP/capita (current $s) 11.3.1 Figure 11.2 shows GDP per capita in construction against national GDP per capita in current $ terms. The GDP per capita in construction is consistently above the national level. This suggests that construction workers are producing more, on average, than other workers in the economy. This is surprising when set against the fact that the increases in their wages over this period have been lower than the average for other industries. This either means that they are significantly more productive in physical terms or that the rate of increase of prices in construction has outstripped the increases in other industries to such an extent that the output of construction in $ terms, per employee appears high.

75
Caribbean Construction Industry Study, 2002
Figure 11.2
0.0
10.0
20.0
30.0
40.0
50.0
60.0
70.0
80.0
90.0
100.0
1975
1977
1979
1981
1983
1985
1987
1989
1991
1993
1995
1997
1999
Year
Act
ivity
leve
ls
GDP per capita employed in Construction (Current $)National GDP/capita current $
11.3.2 This also shows that in current $ terms the output is also increasing annually for most of the study period. This does not say that the absolute output levels are increasing because the apparent increase could simply be caused by inflation. This can be tested by looking at the activity levels in constant dollar terms, i.e. in terms of values that are corrected to account for inflation during the period in question, and in this case all values are adjusted to 1985 dollar terms. 11.4 National GDP/capita and construction GDP/capita (constant $s) 11.4.1 Figure 11.3 shows GDP per capita in construction against national GDP per capita in constant $ terms. It shows a peak in 1983 followed by a trough in 1986, followed by a growth trend since then that has been reasonably consistent (accepting the sort of fluctuations normal in business cycles). Again the curve for construction is significantly above the national levels. This shows that in real terms the output per capita in construction is above the norm and is increasing, suggesting that the industry is both more efficient and more productive than the norm.

76
Caribbean Construction Industry Study, 2002
Figure 11.3
0.05.0
10.015.020.025.030.035.040.045.050.0
1975
1977
1979
1981
1983
1985
1987
1989
1991
1993
1995
1997
1999
Year
Act
ivity
leve
ls GDP percapitaemployed inConstruction(Const $)NationalGDP/capitaconstant $
11.4.2 It is worth noting that construction industry activity levels have only now (2001) begun to climb above the peak level established in 1983 while the national GDP is still below the peaks of 1982/83 in real terms. 11.5 Construction labour force and employment 11.5.1 Figure 11.4 shows the size of the construction labour force and the level of employment of that labour force. It can be seen that the size of the labour force and employment vary significantly over time, and that they tend to vary in the same way. When the economy is booming the labour force grows and employment in the industry grows. As the business cycle takes a downward turn, the workforce contracts and employment in the industry contracts.
Figure 11.4
0
20
40
60
80
100
120
140
160
180
200
1975
1977
1979
1981
1983
1985
1987
1989
1991
1993
1995
1997
1999
Year
Act
ivity
leve
ls Constructionlabour force
Constructionemployment
GDP inConstant $(/20)

77
Caribbean Construction Industry Study, 2002
11.5.2 One would normally expect the labour force to be relatively stable in size and for employment to vary with business cycles. The fact that the size of the total labour force varies significantly (e.g. declining by around 50% between 1983 and 1989) suggests that workers move from one form of employment to another as the opportunities change. Subsistence farming, driving taxi, and working on the URP (Unemployment Relief Programme) are alternatives that would be readily available for ‘construction’ workers. The volatilities of the employment figures and labour force are still significantly lower than that of the GDP of the industry even when it is mapped in constant $ terms. There seem to be lower and upper bounds on both the labour force and employment in construction. These would represent the stable, relatively-skilled workforce that maintains its employment even during a fairly prolonged recession (e.g between 1983 and 1993), and those who are easily drawn into the industry when the economy is more buoyant. 11.6 The money supply, national GDP and construction GDP 11.6.1 Figure 11.5 shows the variations of the National GDP and the construction industry GDP in current $ terms. It will be seen that the output of the construction industry varies directly with national GDP. When the national economy is doing well, the construction industry does well, and when the economy slumps, so does construction. The graph also shows the variation of the money supply during the same period, and it will be seen that the money supply (M1) varies directly with the GDP, with their movements being almost exact replicas of each other. Economic principles (especially those of the Chicago School and followers of Milton Friedman) would suggest that this should be the case, with the money supply being the driver, and GDP the follower.
Figure 11.5
0
1000
2000
3000
4000
5000
6000
1975
1977
1979
1981
1983
1985
1987
1989
1991
1993
1995
1997
1999
Year
Act
ivity
leve
ls ($
mn)
ConstructionGDP(Current $)MoneySupply M1
NationalGDP (current$x10mn)
11.6.2 Because the money supply directly affects demand (and potentially inflation) its impact on the construction industry is to be expected, and provided

78
Caribbean Construction Industry Study, 2002
productive activities keep pace with the money supply, inflation should be curbed (as seems to be the case in Trinidad & Tobago). The curves also support Keynes’ contention that the engineering industries tend to exaggerate the fluctuations of the economy as a whole (through the multiplier effect), and as the graph shows, the construction GDP curve follows the National GDP, but has higher peaks and lower troughs. 11.7 Fixed capital formation and money supply 11.7.1 Figure 11.6 shows the available data for fixed capital formation and money supply. The fixed capital formation data are only available up until 1990, but the curves for the period between 1975 and 1990 show that variations in fixed capital formation by construction follow the variations in total fixed capital formation very closely. This is as one would expect, because a large proportion of the fixed capital assets of any society are provided by the construction industry in the form of the infrastructure and buildings that it creates.
Figure 11.6
0
1000
2000
3000
4000
5000
6000
1975
1977
1979
1981
1983
1985
1987
1989
1991
1993
1995
1997
1999
Year
Act
ivity
leve
ls
Fixed capitalformation
Fixed capitalformation(Construction)
Money supplyM1
11.7.2 The notes provided by the Central Statistical Office do not make it clear whether or not the outputs of the Ministries involved in construction (e.g. Works and Transport) are included here. The similarity of the shape of the curves with that of the money supply is less clearcut, but there is a similar rise up until about 1983/4 then a falling away until around 1989 and then the start of a rise again. Given that the GDP responds to the money supply, and that economic well-being is usually expressed in physical improvements to the business and social environment, it is to be expected that fixed capital formation would respond to changes in the money supply.

79
Caribbean Construction Industry Study, 2002
11.8 Loans to construction and building plans approved 11.8.1 Figure 11.7 shows the level of loans to the construction industry and the numbers of building plans approved each year. The loans to construction are loans to the industry not mortgage loans to the general public. Because of changes in the value of the TT dollar during this period, the loan values were looked at in their full, current dollar, face-value, and also adjusted to a constant value according to the changes in value of the $. It will be seen that the fluctuations in the value of loans when adjusted mimic those of the loans in current $ terms, except that they are delayed by about two years. In other words the peaks in current $ terms lead the peaks in constant $ terms by about two years. The rate of approval of building plans lags a further two years behind this. This suggests that people apply for permission to build, and then some time later this causes an increase in loans to construction, and that people very well understand the real value of the dollars they are borrowing. This is further borne out by the similarity in shape between the adjusted loans curve and the construction GDP curve.
Figure11.7
0
1000
2000
3000
4000
5000
6000
1975
1977
1979
1981
1983
1985
1987
1989
1991
1993
1995
1997
1999
Year
activ
ity le
vel
Plansapproved
Loans toconstruction
Loansadjusted for $valueConstructionGDPconstant $
11.9 Total GDP vs GDP/capita 11.9.1 The curves in Figure 11.8 and 11.9 show the variation of GDP with GDP per Capita. In Figure 11.8, the figures represent the relationships in terms of constant 1985 $s. In other words they have been adjusted for the changing value of the dollar over time, using the inflation rate as the adjustment factor.

80
Caribbean Construction Industry Study, 2002
Figure 11.8
0.0
5000.0
10000.0
15000.0
20000.0
25000.0
1975
1977
1979
1981
1983
1985
1987
1989
1991
1993
1995
1997
1999
Year
Act
ivity
leve
l GDP -Constant $mn
GDP/Capita -constant
Figure 11.9
0.0
10000.0
20000.0
30000.0
40000.0
50000.0
60000.0
1975
1977
1979
1981
1983
1985
1987
1989
1991
1993
1995
1997
1999
Year
Act
ivity
leve
l
GDP -Current $mn
GDP/Capita- current
11.9.2 Figure 11.8 expresses the relationship in constant (1985) dollar terms while Figure 11.9 shows it in current $ terms. In both cases it will be seen that the GDP per capita gradually falls below the total GDP curve – this suggests that the population levesl were rising faster than GDP was increasing. In both cases, the situation has been worse since the early 1990s. This can either be seen as a problem of excessive population increase, or as one of insufficient growth in productivity. Either way it suggests that although the average citizen is better off, the margin of improvement is being eaten away by the insidious growth of the
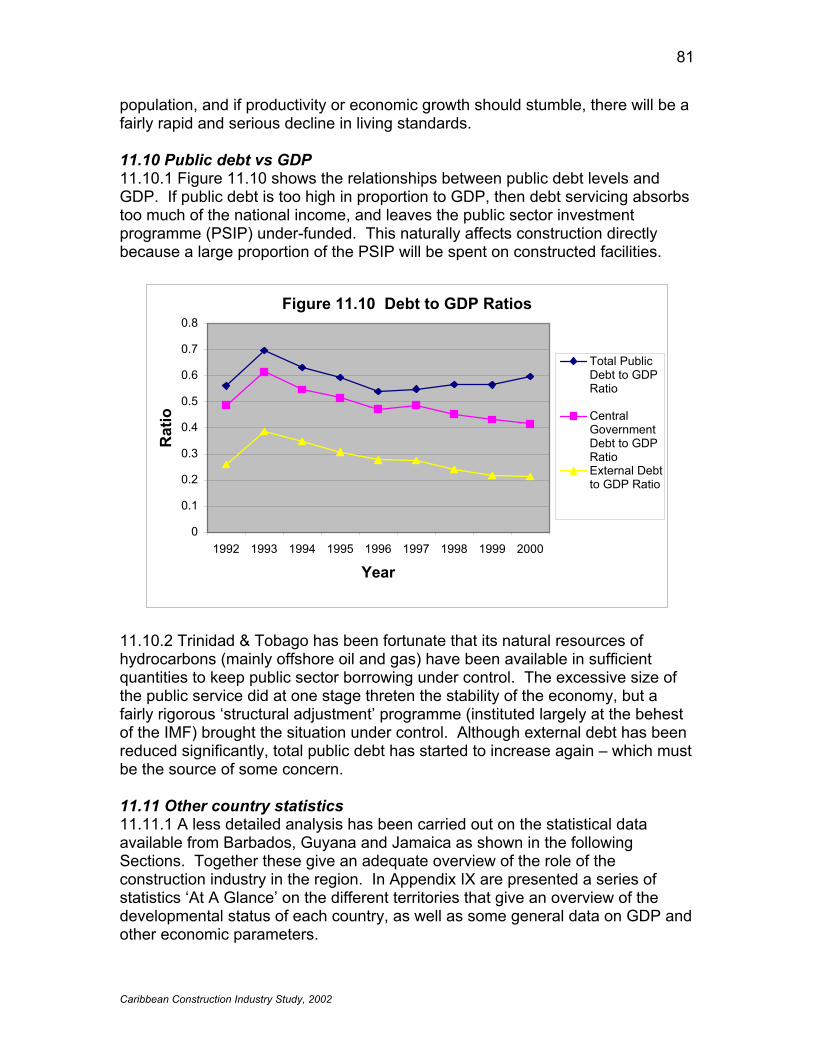
81
Caribbean Construction Industry Study, 2002
population, and if productivity or economic growth should stumble, there will be a fairly rapid and serious decline in living standards. 11.10 Public debt vs GDP 11.10.1 Figure 11.10 shows the relationships between public debt levels and GDP. If public debt is too high in proportion to GDP, then debt servicing absorbs too much of the national income, and leaves the public sector investment programme (PSIP) under-funded. This naturally affects construction directly because a large proportion of the PSIP will be spent on constructed facilities.
Figure 11.10 Debt to GDP Ratios
0
0.1
0.2
0.3
0.4
0.5
0.6
0.7
0.8
1992 1993 1994 1995 1996 1997 1998 1999 2000
Year
Rat
io
Total PublicDebt to GDPRatio
CentralGovernmentDebt to GDPRatioExternal Debtto GDP Ratio
11.10.2 Trinidad & Tobago has been fortunate that its natural resources of hydrocarbons (mainly offshore oil and gas) have been available in sufficient quantities to keep public sector borrowing under control. The excessive size of the public service did at one stage threten the stability of the economy, but a fairly rigorous ‘structural adjustment’ programme (instituted largely at the behest of the IMF) brought the situation under control. Although external debt has been reduced significantly, total public debt has started to increase again – which must be the source of some concern. 11.11 Other country statistics 11.11.1 A less detailed analysis has been carried out on the statistical data available from Barbados, Guyana and Jamaica as shown in the following Sections. Together these give an adequate overview of the role of the construction industry in the region. In Appendix IX are presented a series of statistics ‘At A Glance’ on the different territories that give an overview of the developmental status of each country, as well as some general data on GDP and other economic parameters.
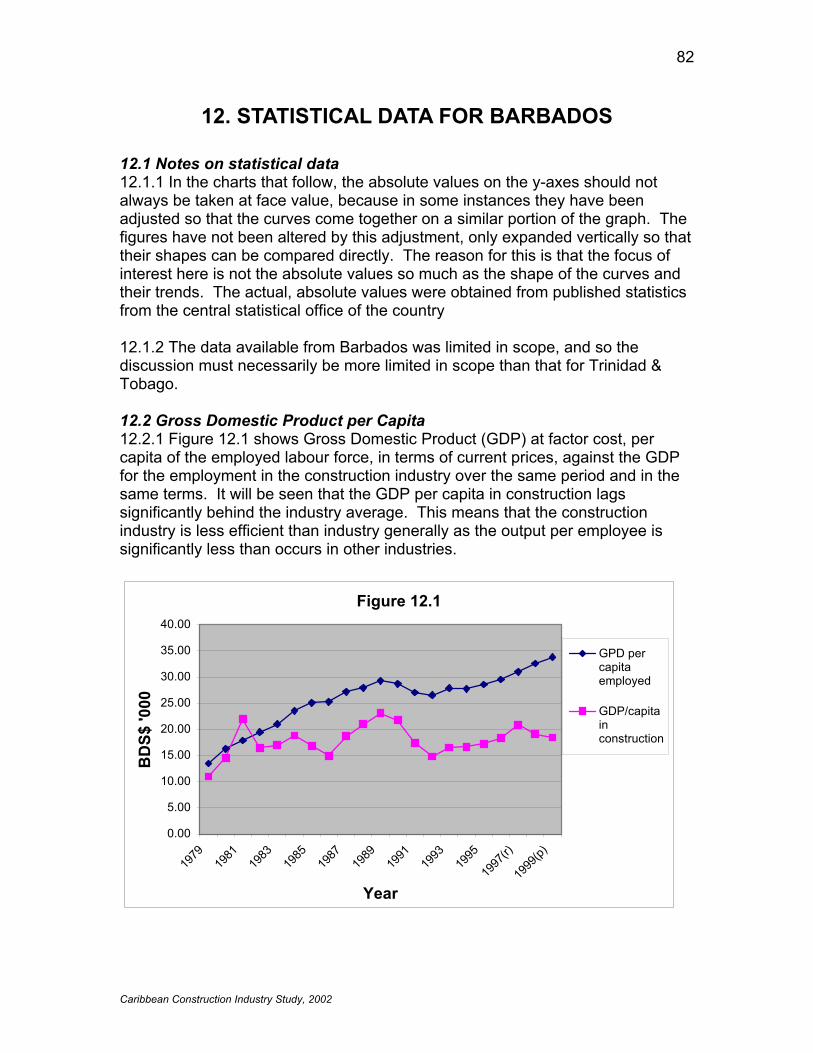
82
Caribbean Construction Industry Study, 2002
12. STATISTICAL DATA FOR BARBADOS 12.1 Notes on statistical data 12.1.1 In the charts that follow, the absolute values on the y-axes should not always be taken at face value, because in some instances they have been adjusted so that the curves come together on a similar portion of the graph. The figures have not been altered by this adjustment, only expanded vertically so that their shapes can be compared directly. The reason for this is that the focus of interest here is not the absolute values so much as the shape of the curves and their trends. The actual, absolute values were obtained from published statistics from the central statistical office of the country 12.1.2 The data available from Barbados was limited in scope, and so the discussion must necessarily be more limited in scope than that for Trinidad & Tobago. 12.2 Gross Domestic Product per Capita 12.2.1 Figure 12.1 shows Gross Domestic Product (GDP) at factor cost, per capita of the employed labour force, in terms of current prices, against the GDP for the employment in the construction industry over the same period and in the same terms. It will be seen that the GDP per capita in construction lags significantly behind the industry average. This means that the construction industry is less efficient than industry generally as the output per employee is significantly less than occurs in other industries.
Figure 12.1
0.00
5.00
10.00
15.00
20.00
25.00
30.00
35.00
40.00
1979
1981
1983
1985
1987
1989
1991
1993
1995
1997
(r)
1999
(p)
Year
BD
S$ '0
00
GPD percapitaemployed
GDP/capitainconstruction

83
Caribbean Construction Industry Study, 2002
12.2.2 Logically, what should happen under these circumstances (in a reasonably efficient market) is that labour should migrate from construction into more productive industries, unless there is some factor that prevents this movement. It is likely that the ‘problem’ is that the labour is relatively unskilled or at least that the skills of the individuals involved are not easily transferable to other industries. By the same token, it could be that the other industries are working at or close to their capacity (or, at least, their short term desired capacity), and as such there are no other employment opportunities available for the construction industry workers who would otherwise transfer. 12.2.3 It will also be seen in Figure 12.1 that the variability of the GDP per capita in construction is very much more variable than in industry generally, this is typical of the engineering/construction industry in most relatively developed economies. Normally, however, the variations in the output of the engineering/construction industry reflect the variations in the economy as a whole, but in an exaggerated manner. In other words, the industry exhibits business cycles that have more violent booms and busts than other industries. The curves in Figure 12.1 do not seem to show any such pattern except, perhaps for the peaking of both curves around 1990 that are both preceded and followed by troughs. The lack of pattern matching may be due more to changes in employment patterns and the inherent ‘stickiness’ of employment than to dissimilarities in the shapes of the fundamental curves, as will be seen later in Figure 12.3.
Figure 12.2
0.00
20.00
40.00
60.00
80.00
100.00
120.00
140.00
160.00
180.00
1979
1981
1983
1985
1987
1989
1991
1993
1995
(r)
1997
(r)
1999
(p)
Year
BD
S$ '0
00
Total GDPperemployee
GPD peremployeeengineering
GDP peremployeeconstruction
12.2.4 Figure 12.2 shows the expenditure on the GDP for the construction industry against the expenditure on GDP for the economy – in other words it

84
Caribbean Construction Industry Study, 2002
measures the inputs rather than the outputs. As one would expect, given the characteristics shown in Figure 12.1, the construction industry shows a higher cost of inputs per unit of output than the industry in general. Because the statistics do not identify the construction industry per se, the two curves shown here are compilations of the statistics for a number of headings that comprise the building and construction industry. 12.2.5 The curve for ‘engineering’ includes ‘Gross Capital Formation’ ‘Public Building Activity’, ‘Private Building Activity’ and ‘Finished Capital Goods, while that for construction includes just ‘Public Building Activity’ and ‘Private Building Activity’. Each of these heads covers economic activities that are normally associated with engineering and construction as most capital goods are facilities or structures provided by the civil engineering/construction sector. For the limited construction sector defined by the public and private sectors’ building activities, it will be seen that both the total expenditure and the variability are much lower than for the more broadly defined capital-goods-oriented sector. It is difficult to speculate as to why there should be the peaks in expenditure per employee in 1982, 1990 and 1998, unless these signify dates on which major wage agreements occurred, or there were significant bursts in inflation. Comparison with Figure 1 does show that these years also recorded output peaks for the industry, so it may simply reflect increased economic activity. 12.2.6 Figure 12.3 shows the relationships between the total national GDP at
Figure 12.3
0
1000
2000
3000
4000
5000
6000
1979
1981
1983
1985
1987
1989
1991
1993
1995
1997
(r)
1999
(p)
Year
BD
S$ M
illio
n ConstructionGDP(*10)
GDP at FactorCost
GDP at MarketPrices
factor cost and at market prices compared with the GDP for the construction industry. As will be seen, the construction industry lags behind the other two curves. Its values have been multiplied by ten to bring it to the same sort of scale as the other curves, in order to be able to see better how the shape of the curves match up. This diagram shows more the kind of relationship expected

85
Caribbean Construction Industry Study, 2002
with the construction industry exaggerating the booms and busts of the business cycle seen in the economy as a whole. 12.3 Employment 12.3.1 The curves in Figures 12.1 and 12.3 show a certain inconsistency in that the nice curve matching of Figure 12.3 is not seen in Figure 12.1. To check one possible cause of this, the figures for employment were examined, and these are shown in Figure 12.4. It will be seen that employment in construction is very variable compared with the economy as a whole, and it is clear that this is what accounts for the variability in the per capita GDP. It will be seen that the employment figures exhibit the classical pattern of the construction industry matching and exaggerating the variations that occur in the economy as a whole. The sudden and drastic recent variations shown by the peak and trough at the right hand end of the construction curve are difficult to explain without detailed inside knowledge of economic, political and industrial relations factors that could have been implicated.
Figure 12.4
0
20
40
60
80
100
120
140
160
1978
1980
1982
1984
1986
1988
1990
1992
1994
1996
1998
1996
1998
Year
'000
per
sons
Construction('00)
Totalemployment('000)
12.4 Index of Wages 12.4.1 One reason for the sudden fluctuations could have been significant changes in wage rates that either promoted or prevented employment in construction. Figure 12.5 shows an index of wages in construction compared with industry in general in Barbados.

86
Caribbean Construction Industry Study, 2002
Figure 12.5
0
50
100
150
200
250
1970
1972
1974
1976
1978
1980
1982
1984
1986
1988
1990
1992
1994
Year
Inde
x va
lue All sectors
Construction
12.4.2 This shows wages in construction to have been running at above the national average over the period from around the early 1970s until 1992, when construction wages fell relative to other sectors, and has stayed below them for as long as the statistics are available. Unfortunately, this does not cover the period of sudden late variation seen on the previous figure, and may help to explain why employment rose to such a dramatic peak, but doesn’t go far enough to be able to tell whether or not it may have been responsible later on for the subsequent fall. 12.5 Index of Retail Prices 12.5.1 For similar reasons, it was of interest to examine the index of retail prices. This is shown in Figure 12.6 below. As will be seen, the retail price index follows much the same shape as the index of wages in the economy as a whole, and as the index of wages in construction, this being a general upward trend over time, with a late leveling off in the mid 1990s. This suggests that wages and prices both react in the same way to changes in the general economy. To see how inflation relates to these indices, the inflation rate (multiplied by a factor of 10 to better see its shape) was plotted on the same figure. As can be seen, the inflation rate has trended downwards, with some significant variability in the 1980s and 1990s. It is likely that these variations owe more to external factors (like the world market price for oil) than to factors internal to the economy of Barbados. This would also help to explain why the inflation rate shows no correlation to the various price indices, which conventional wisdom suggests would respond to inflationary effects (particularly wages). It is of interest to note that recent trends have taken inflation into negative values – which means that average price levels in the economy are tending to fall rather than rise. An unusual prospect for a small, developing country.

87
Caribbean Construction Industry Study, 2002
Figure 12.6
-50
0
50
100
150
200
250
1979
1980
1981
1982
1983
1984
1985
1986
1987
1988
1989
1990
1991
1992
1993
1994
1995
Year
Inde
x va
lue
All Items
Inflationrate(*10)%
Index ofall wages
Index ofwages inconstructi
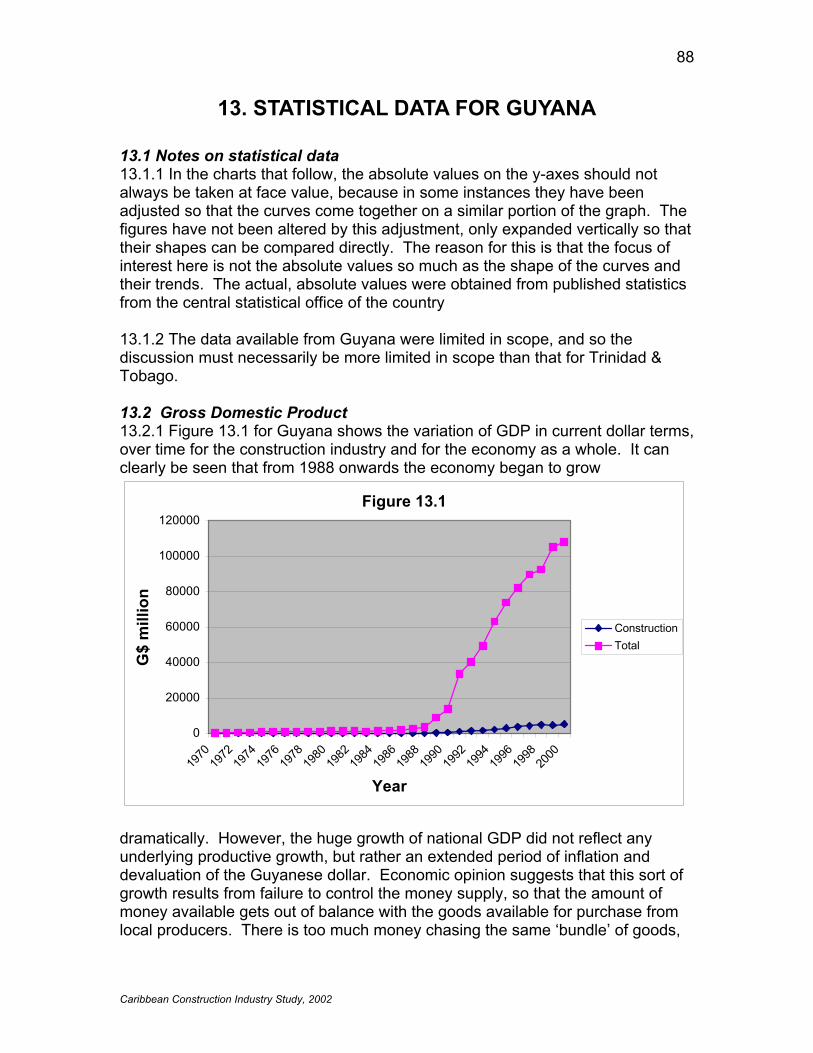
88
Caribbean Construction Industry Study, 2002
13. STATISTICAL DATA FOR GUYANA 13.1 Notes on statistical data 13.1.1 In the charts that follow, the absolute values on the y-axes should not always be taken at face value, because in some instances they have been adjusted so that the curves come together on a similar portion of the graph. The figures have not been altered by this adjustment, only expanded vertically so that their shapes can be compared directly. The reason for this is that the focus of interest here is not the absolute values so much as the shape of the curves and their trends. The actual, absolute values were obtained from published statistics from the central statistical office of the country 13.1.2 The data available from Guyana were limited in scope, and so the discussion must necessarily be more limited in scope than that for Trinidad & Tobago. 13.2 Gross Domestic Product 13.2.1 Figure 13.1 for Guyana shows the variation of GDP in current dollar terms, over time for the construction industry and for the economy as a whole. It can clearly be seen that from 1988 onwards the economy began to grow
Figure 13.1
0
20000
40000
60000
80000
100000
120000
1970
1972
1974
1976
1978
1980
1982
1984
1986
1988
1990
1992
1994
1996
1998
2000
Year
G$
mill
ion
ConstructionTotal
dramatically. However, the huge growth of national GDP did not reflect any underlying productive growth, but rather an extended period of inflation and devaluation of the Guyanese dollar. Economic opinion suggests that this sort of growth results from failure to control the money supply, so that the amount of money available gets out of balance with the goods available for purchase from local producers. There is too much money chasing the same ‘bundle’ of goods,

89
Caribbean Construction Industry Study, 2002
so the prices go up. The figure shows the growth of GDP in current dollar terms, which means that it is measured in terms of the dollars that are spent at the time to produce the output. 13.2.2 The scale of the growth and the extents of the axes make it difficult to draw any conclusions about the construction industry relative to the economy. Figure 13.2 shows the scale of the construction industry relative to the economy as a whole, and this shows that despite the inflationary growth of the economy, the construction industry has maintained a relative size of between 3% and 8% of the national economy. The trend since 1970 has broadly been downward, with quite significant annual variations, though the recent upturn (since 1994) may indicate that the trend is now changing. One would normally expect the construction industry to represent a larger proportion of the economy – it is more often around 10% than 4% or 5%, in a developing country like Guyana, especially one with a physical infrastructure in such dire need of improvement. It may be symptomatic of Guyana’s problems that its construction industry is such a small proportion of its economy, and it may be that a concerted effort to increase construction GDP would have a very beneficial impact on the economy of Guyana.
Figure 13.2
0.00
1.00
2.00
3.00
4.00
5.00
6.00
7.00
8.00
9.00
1970
1972
1974
1976
1978
1980
1982
1984
1986
1988
1990
1992
1994
1996
1998
2000
Year
Perc
enta
ge (%
)
Proportion
13.2.3 Figure 13.3 looks at the growth of the economy and the construction industry in constant dollar terms, i.e. in terms of dollar values that have been adjusted for inflation as measured by the cost of living index. Here it will be seen that national GDP fell between 1977 and 1991 before starting to grow in real terms. The GDP for construction has been increased by a factor of 10 in order to better see the shape of the changes over the years, and compare them with the changes in the economy as a whole. Again it will be seen that the

90
Caribbean Construction Industry Study, 2002
industry suffered a decline until 1985 and showed little inclination to change until around 1990 when it also began to grow in real terms.
Figure 13.3
0
1000
2000
3000
4000
5000
6000
1977
1979
1981
1983
1985
1987
1989
1991
1993
1995
1997
1999
Year
G$
mill
ion
ConstructionNational GDP
13.2.4 It will be seen that the curves run along reasonably similar lines, and with reasonably similar increases and decreases. This is untypical of the relationship that the construction industry has with the economy as a whole in most economies, as it is more normal for construction to exaggerate the business cycles observed in other industries – with a lead or lag depending on circumstances. 13.2.5 The curve shown in Figure 13.4 better reflects the situation that one would expect, in that the construction industry is shown to be between 6% and 9% of the national economy in constant $ terms. It is seen also to be on a gradual growth path. It is not clear why the figures should show such significant differences between the situation with GDP when measured in constant dollar as opposed to current dollar terms, as one would have expected the same deflationary factor to affect construction and national GDP figures proportionately during the same period of time. Thus, even though one it would be perfectly differing annual inflation rates affecting each year differently, one would expect the two curves to maintain their orientation relative to one another normal to expect that the shape of the curves would change over time with the differing annual inflation rates affecting each year differently, one would expect the two curves to maintain their orientation relative to one another.

91
Caribbean Construction Industry Study, 2002
Figure 13.4
0.001.002.003.004.005.006.007.008.009.00
10.00
1977
1979
1981
1983
1985
1987
1989
1991
1993
1995
1997
1999
Year
Perc
enta
ge (%
)
Proportion
13.3 GDP per Capita 13.3.1 Figure 13.5 shows the GDP per capita employed in construction and GDP per capita for the economy as a whole, with GDP measured in current dollar terms. Here it will be seen that the productivity of the construction sector is some four times the productivity of the economy as a whole. This is an astonishing differential, and one would not expect it to be maintained in the longer term, as workers would migrate from other industries where their labour is less productive to construction where it could make a much higher contribution. However, in a situation where the construction labour market is already saturated, so that there are no opportunities for workers from elsewhere to be used effectively, it may persist. The recent trends of the two curves are for them to diverge even further, which suggests that construction is increasing in productivity compared with the rest of the economy. 13.3.2 This is a sad reflection on the Guyanese economy, and probably indicates that there is a tendency for industry in general to use more, less-skilled workers rather than to invest in capital-intensive equipment. In the short term it may address the need to get work done, but in the longer term it will handicap industry’s opportunities for development. This prognosis is supported by the observation that the economy is growing in output in both constant and current dollar terms. For this not to be reflected in the GDP per capita, it must mean that employment is increasing as fast in not faster than output. In a country with chronically high levels of unemployment (unfortunately, there are no reasonable figures of actual employment figures available, but we are assured anecdotally that this is the case) it is hard to say that this is wrong.
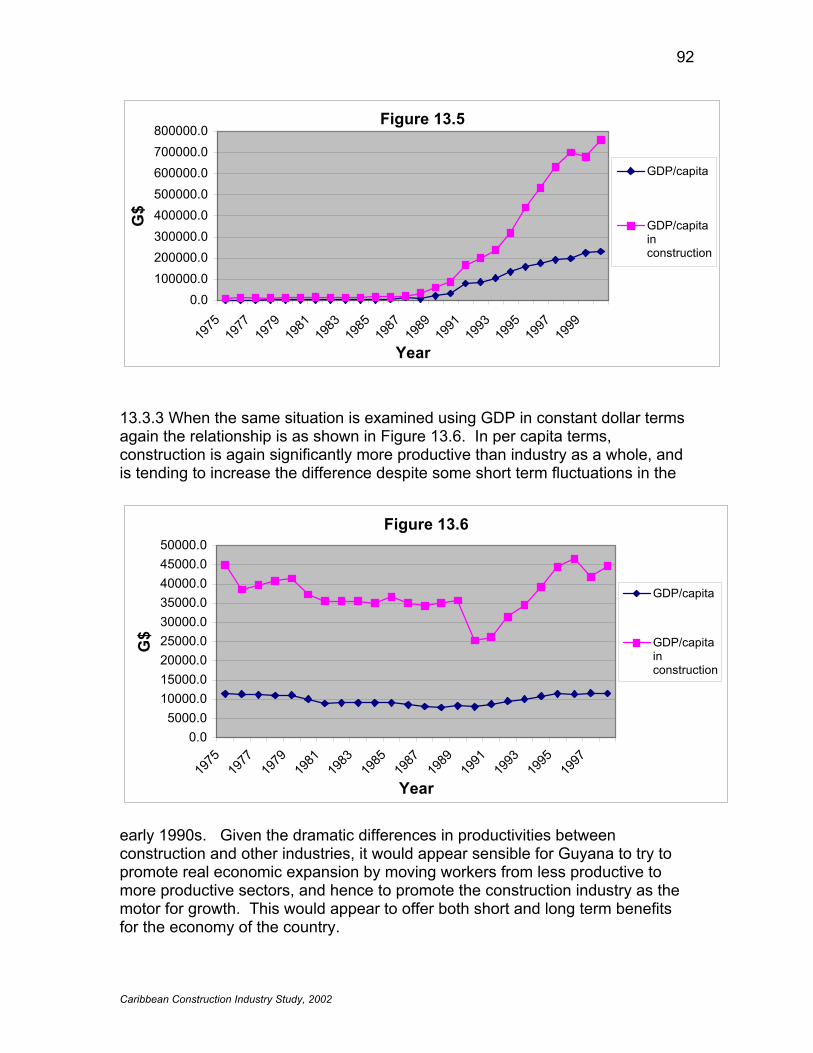
92
Caribbean Construction Industry Study, 2002
Figure 13.5
0.0100000.0200000.0300000.0400000.0500000.0600000.0700000.0800000.0
1975
1977
1979
1981
1983
1985
1987
1989
1991
1993
1995
1997
1999
Year
G$
GDP/capita
GDP/capitainconstruction
13.3.3 When the same situation is examined using GDP in constant dollar terms again the relationship is as shown in Figure 13.6. In per capita terms, construction is again significantly more productive than industry as a whole, and is tending to increase the difference despite some short term fluctuations in the
Figure 13.6
0.05000.0
10000.015000.020000.025000.030000.035000.040000.045000.050000.0
1975
1977
1979
1981
1983
1985
1987
1989
1991
1993
1995
1997
Year
G$
GDP/capita
GDP/capitainconstruction
early 1990s. Given the dramatic differences in productivities between construction and other industries, it would appear sensible for Guyana to try to promote real economic expansion by moving workers from less productive to more productive sectors, and hence to promote the construction industry as the motor for growth. This would appear to offer both short and long term benefits for the economy of the country.

93
Caribbean Construction Industry Study, 2002
13.4 Money Supply 13.4.1 Figure 13.7 looks at the rate at which the money supply has grown. As it is widely believed that increasing money supply without an accompanying increase in productivity of local industry will lead to inflation. If it is felt that the dramatic increases in GDP (shown in Figure 5 for example) have resulted more
Figure 13.7
0
20000
40000
60000
80000
100000
120000
1980
1982
1984
1986
1988
1990
1992
1994
1996
1998
2000
Year
G$
Mill
ion
MoneySupply
GDP-current
GDP-constant
from inflationary change than from real economic growth then the money supply would be expected to reflect this. This can clearly be seen in Figure 13.7. From around 1990, the GDP began to increase dramatically and at the same time money supply began to grow rapidly. The relationship could hardly be clearer. Unfortunately there are no figures available on the rate of inflation or the cost of living index, but it is clear that they will both show the same sort of accelerated growth over the same period. 13.4.2 If Guyana is to stabilise and improve its economy it seems clear that they need to regulate any future expansion of the money supply so that it is more in line with productivity growth.

94
Caribbean Construction Industry Study, 2002
14. STATISTICAL DATA FOR JAMAICA 14.1 Notes on statistical data 14.1.1 In the charts that follow, the absolute values on the y-axes should not always be taken at face value, because in some instances they have been adjusted so that the curves come together on a similar portion of the graph. The figures have not been altered by this adjustment, only expanded vertically so that their shapes can be compared directly. The reason for this is that the focus of interest here is not the absolute values so much as the shape of the curves and their trends. The actual, absolute values were obtained from published statistics from the central statistical office of the country 14.1.2 The data available from Jamaica were somewhat limited in scope and consistency, and so the discussion must necessarily be considered in this context. 14.2 Gross Domestic Product in Current $ terms 14.2.1 Figure 14.1 shows the variation of GDP for the national economy and for the construction industry, in current Jamaican dollar terms, over time. It can be seen that the GDP grew relatively slowly until 1990. Since then it has increased dramatically for the national economy as a whole. The GDP for construction has also grown but much more slowly. It is immediately apparent that the construction industry lagged significantly behind the rest of the economy in the period from around 1990 to date. Even on the grounds that the increase in national GDP can be accounted for more by inflation than real output growth, the construction industry still lagged far behind. Presuming that its inputs were being affected by price increases in the same way as the rest of the economy, its output shows nothing like the same growth. This can either mean that its real output was decreasing or that the full cost increases were not being passed on to its customers, or that it was somehow being protected from the worst excesses of inflation (by price restrictions on steel and cement for example). 14.2.2 The third curve on Figure 14.1 shows the growth of the money supply and it clearly demonstrates the close association between the money supply and the growth of the national GDP. Given that the money supply is a good barometer for inflation, the relationship between the growth of GDP and inflation rather than production seems established.

95
Caribbean Construction Industry Study, 2002
Figure 14.1
050,000
100,000150,000200,000250,000300,000350,000400,000450,000
1975
1978
1981
1984
1987
1990
1993
1996
1999
Year
$ Va
lue National G.D.P
(Current $)
ConstructionIndustry G.D.P atCurrent PricesMoney Supply(M1)
14.3 Gross Domestic Product in Constant $ Terms 14.3.1 Figure 14.2 shows the variation of the GDP in constant dollar terms for both the national economy and the construction sector. Again there appears to be a serious problem with the data, as there is an anomaly around 1990 in the national data, when the value jumps from around J$2,000 million to around J$17,000 million. It is unlikely that output during this period increased by a multiple of over eight, it is more likely that there is a problem with the statistical data. It is probable that, either the basis of measurement changed or the definition of terms or some other variation in the way data was collected or presented occurred. It is also possible that such a ‘step’ could occur due to a sudden and large devaluation of the currency. A devaluation of the J$ against
Figure 14.2
0
5,000
10,000
15,000
20,000
25,000
1975
1977
1979
1981
1983
1985
1987
1989
1991
1993
1995
1997
1999
Year
Valu
e J$
m
NationalGDP atConstantPrices
ConstructionIndustryG.D.P atConstantPrices
the US$ in an economy heavily dependent on imports could have this effect, in that prices would almost instantaneously jump to a new level. This would also have a knock-on effect in that workers would experience the price rise and

96
Caribbean Construction Industry Study, 2002
demand higher wages, which would have the effect of pushing prices higher again. 14.3.2 In this instance, however, it is not felt that this accounts for the size of the jump in relative or absolute terms. If this anomaly is ‘smoothed’ out simply by deducting the jump of 15,000 from each tabulated value, we get the graph shown in figure 14.3. 14.3.3 Figure 14.3 shows the relationship between National and construction industry GDP at constant $ terms, with the anomalous ‘step’ (of $15,000 m) removed. This shows that the real GDP stayed more-or-less constant for both curves between 1975 and 1991. After 1991 both increased, national GDP climbing to a significant peak in 1996 and declining slightly thereafter, and construction showing a jump between 1991 and 1993 and remaining relatively stable since then. It is not clear why there should have been such an increase in real national output in 1996, and it would need detailed local knowledge to explain this. It is very possible that the apparent jump in construction output between 1991 and 1993 is again a statistical anomaly that owes more to inconsistency of data than to real increases in output. What is clear, however, is that if this step is an anomaly in the data, then there has been very little increase in real GDP of the construction industry over a period of around a quarter of a century, and that in this regard it lags behind the rest of industry in Jamaica.
Figure 14.3
0
1,000
2,000
3,000
4,000
5,000
6,000
1975
1977
1979
1981
1983
1985
1987
1989
1991
1993
1995
1997
1999
Year
Valu
e J$
m National GDPat ConstantPrices
ConstructionIndustry G.D.Pat ConstantPrices
14.4 Money supply and consumer price index 14.4.1 A good proxy for inflation is the consumer price index, and Figure 14.4 shows the variations in the consumer price index with the money supply. It will again be seen that they are in close accord. This substantiates the view that the level of the money supply is a major determinant of the inflation rate as given by the consumer price index and the likelihood that it is inflation that accounts for most of the apparent growth in the Jamaican economy since around 1990.
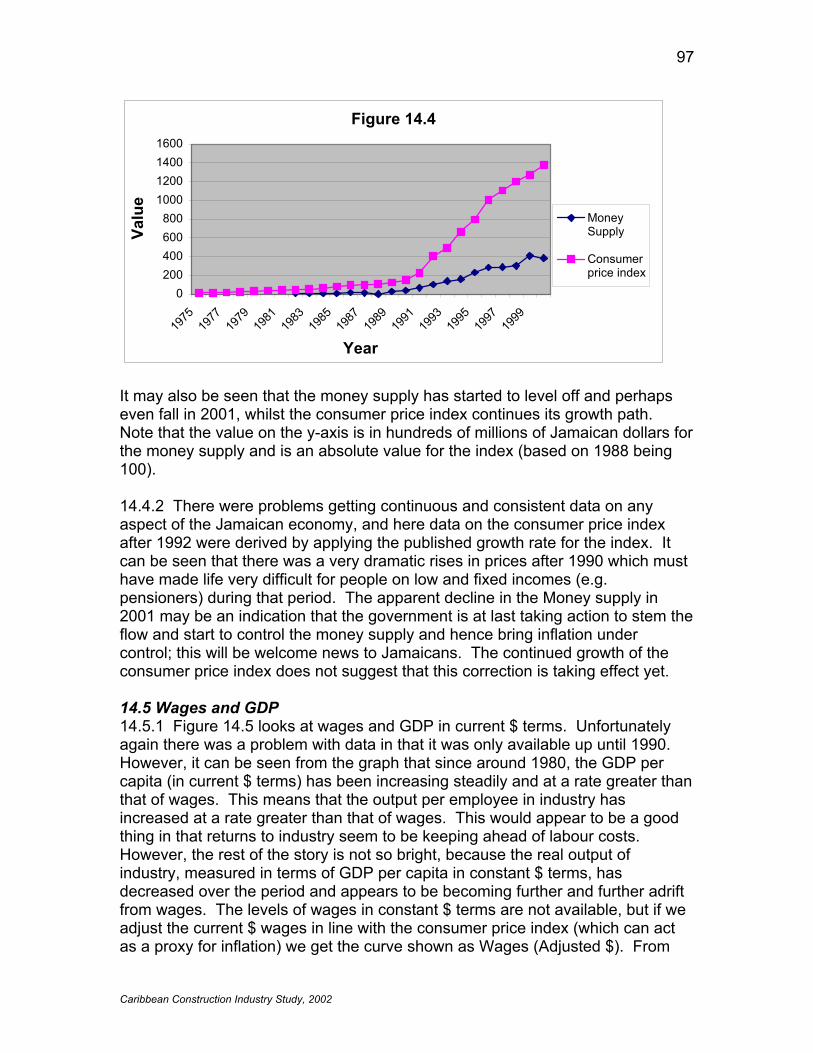
97
Caribbean Construction Industry Study, 2002
Figure 14.4
0200400600800
1000120014001600
1975
1977
1979
1981
1983
1985
1987
1989
1991
1993
1995
1997
1999
Year
Valu
e
MoneySupply
Consumerprice index
It may also be seen that the money supply has started to level off and perhaps even fall in 2001, whilst the consumer price index continues its growth path. Note that the value on the y-axis is in hundreds of millions of Jamaican dollars for the money supply and is an absolute value for the index (based on 1988 being 100). 14.4.2 There were problems getting continuous and consistent data on any aspect of the Jamaican economy, and here data on the consumer price index after 1992 were derived by applying the published growth rate for the index. It can be seen that there was a very dramatic rises in prices after 1990 which must have made life very difficult for people on low and fixed incomes (e.g. pensioners) during that period. The apparent decline in the Money supply in 2001 may be an indication that the government is at last taking action to stem the flow and start to control the money supply and hence bring inflation under control; this will be welcome news to Jamaicans. The continued growth of the consumer price index does not suggest that this correction is taking effect yet. 14.5 Wages and GDP 14.5.1 Figure 14.5 looks at wages and GDP in current $ terms. Unfortunately again there was a problem with data in that it was only available up until 1990. However, it can be seen from the graph that since around 1980, the GDP per capita (in current $ terms) has been increasing steadily and at a rate greater than that of wages. This means that the output per employee in industry has increased at a rate greater than that of wages. This would appear to be a good thing in that returns to industry seem to be keeping ahead of labour costs. However, the rest of the story is not so bright, because the real output of industry, measured in terms of GDP per capita in constant $ terms, has decreased over the period and appears to be becoming further and further adrift from wages. The levels of wages in constant $ terms are not available, but if we adjust the current $ wages in line with the consumer price index (which can act as a proxy for inflation) we get the curve shown as Wages (Adjusted $). From

98
Caribbean Construction Industry Study, 2002
this curve it will be seen that wages and output are staying more-or-less in step in both current and constant $ terms. Unfortunately, figures for the construction industry specifically are not available, to see how the industry compares with the rest of the economy.
Figure 14.5
0
1,000
2,000
3,000
4,000
5,000
6,000
7,000
8,000
9,000
10,000
1980 1981 1982 1983 1984 1985 1986 1987 1988 1989
Year
Valu
es
GDP percapita current$Wages(Current $)
GDP percapitaConstant($)Wages(Adjusted $)
14.6 Employment 14.6.1 Figure 14.6 shows the variation of employment over time, both in the economy and in the construction sector. Again there appears to be an anomaly in the data in that the ‘blip’ in national employment shown for 1982 is unlikely to have occurred in practice, as it would have involved the laying-off of some quarter of a million people!
Figure 14.6
0
200,000
400,000
600,000
800,000
1,000,000
1,200,000
1975
1976
1977
1978
1979
1980
1981
1982
1983
1984
1985
1986
1987
1988
1989
1990
1991
Year
Empl
oyed
per
sons Employment in
NationalWorkforceEmployment inConstruction
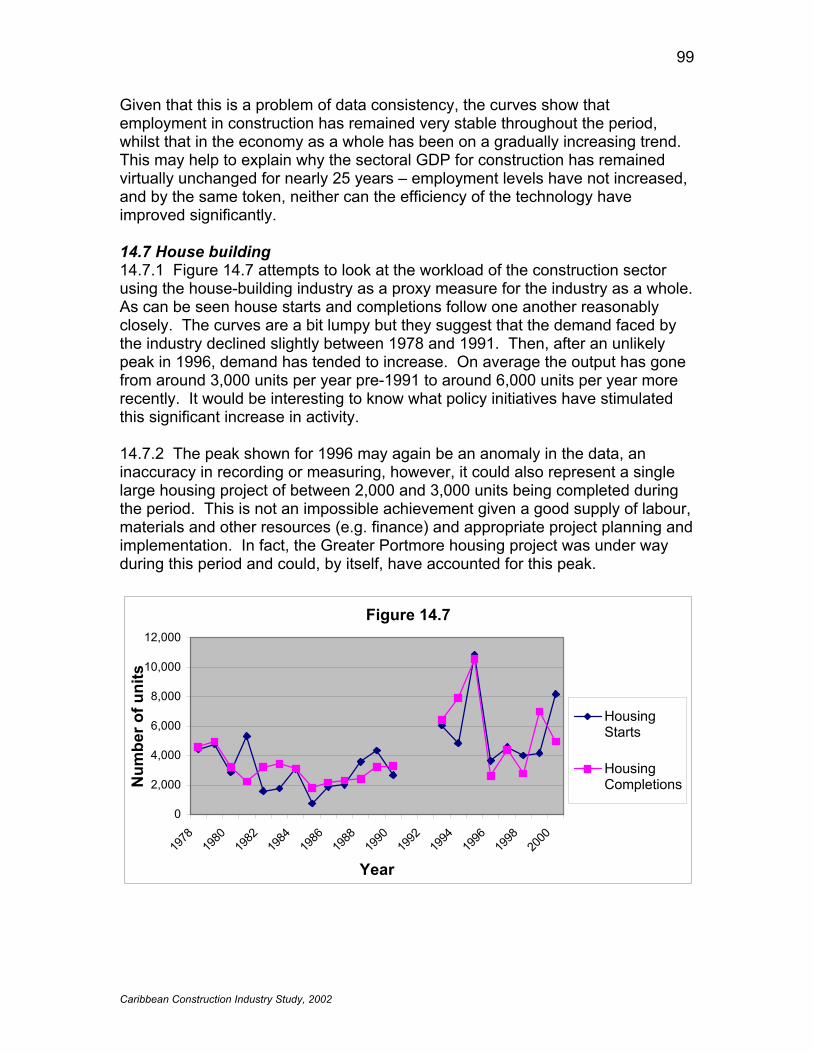
99
Caribbean Construction Industry Study, 2002
Given that this is a problem of data consistency, the curves show that employment in construction has remained very stable throughout the period, whilst that in the economy as a whole has been on a gradually increasing trend. This may help to explain why the sectoral GDP for construction has remained virtually unchanged for nearly 25 years – employment levels have not increased, and by the same token, neither can the efficiency of the technology have improved significantly. 14.7 House building 14.7.1 Figure 14.7 attempts to look at the workload of the construction sector using the house-building industry as a proxy measure for the industry as a whole. As can be seen house starts and completions follow one another reasonably closely. The curves are a bit lumpy but they suggest that the demand faced by the industry declined slightly between 1978 and 1991. Then, after an unlikely peak in 1996, demand has tended to increase. On average the output has gone from around 3,000 units per year pre-1991 to around 6,000 units per year more recently. It would be interesting to know what policy initiatives have stimulated this significant increase in activity. 14.7.2 The peak shown for 1996 may again be an anomaly in the data, an inaccuracy in recording or measuring, however, it could also represent a single large housing project of between 2,000 and 3,000 units being completed during the period. This is not an impossible achievement given a good supply of labour, materials and other resources (e.g. finance) and appropriate project planning and implementation. In fact, the Greater Portmore housing project was under way during this period and could, by itself, have accounted for this peak.
Figure 14.7
0
2,000
4,000
6,000
8,000
10,000
12,000
1978
1980
1982
1984
1986
1988
1990
1992
1994
1996
1998
2000
Year
Num
ber o
f uni
ts
HousingStarts
HousingCompletions
100
Caribbean Construction Industry Study, 2002
15. ROLE OF TRADE POLICY 15.1 CARICOM 15.1.1 The CARICOM community has taken the decision to become a single market and economy. This will confer on each the greater power of being part of a trading bloc that can negotiate with other world trading blocs as well as simplifying the trading relationships between the countries involved. One of the key sectors in this liberalization process is that of services, and the construction industry is a very important part of the service sector. Within the UNCPC, the Construction industry represents those firms classified under the codes indicated in Table 1 in Appendix II. 15.2 Negotiations on trade in services issues 15.2.1 While the GATS is a government-to-government agreement, it is of direct relevance to firms because it lays down the framework of international rules within which firms operate around the globe. The GATS establishes a basic set of rules for world trade in services, a clear set of obligations for each member country, and a legal structure for ensuring that those obligations are observed. This allows companies to identify which markets are open to foreign service providers and to be sure that markets will remain open in the future. In the event of a disagreement, the Agreement contains a dispute settlement mechanism through which Member countries can attempt to obtain the treatment that they are entitled. There are a number of issues relating to the Protocol 2 negotiations and to the negotiations with FTAA and WTO that are of significance to the engineering industries that are involved in the construction and related industries. These will be discussed under separate headings: Accreditation of Qualifications; Harmonisation of Regional Legislation; Mutual Recognition and Reciprocity; Free Movement of Natural People; Market Access; Subsidies; Right of Establishment; New Restrictions on the Provision of Services 15.3 Accreditation of qualifications; (Protocol 2, Article 35 e) 15.3.1 The overall objective is to “establish common standards and measures for accreditation or when necessary for the mutual recognition of diplomas, certificates and other evidence of qualifications…(and) to determine equivalency or accord accreditation to diplomas, certificates and other evidence of qualifications secured by nationals…(and) the coordination of legislative and administrative requirements of Member States in order to facilitate access to, and engagement in, non-wage earning activities in the Community” (Protocol 2, Article 35 e) 15.3.2 The basic academic qualification for entry into the engineering profession is an undergraduate degree in engineering. Currently UWI is the principal degree granting institution in the region amongst a range of Tertiary Level Institutions (TLIs) including UTech in Jamaica, and the Universities of Guyana, Suriname and Belize, as well as a number of technical and community colleges.

101
Caribbean Construction Industry Study, 2002
The engineering degrees from UWI are currently accredited by the British Engineering Institutions, for a number of reasons. There is the historical connection, but there is also the fact that the British were until recently the only ones who would accredit offshore degree programmes. This is limiting institutionally, but does give UWI graduates the big advantage that they are treated as fully equivalent to graduates from British universities, and thus have access to employment opportunities in a much larger market place. 15.3.3 The process of accreditation is expensive and time consuming, and there is considerable philosophical debate as to the appropriateness of following the British system through all the changes that it is currently undergoing – for example the enhanced entry requirements, the four-year degree programme and the undergraduate M.Eng. that are becoming necessary for full accreditation in the UK. The process in North America, for example, is significantly different, and represents the model of training experienced by many Caribbean engineers. Thus, there is significant pressure for change. It has been proposed that there should be a regional accreditation agency – possibly through the CCEO – that would be given the responsibility for accrediting all degree programmes in the engineering and related industries throughout the region. 15.3.4 The critical issues here are that:
1. the engineering accrediting agency should be recognized internationally as competent and capable of judging the quality of degree programmes fairly and without favour.
2. the engineering accrediting agency should be a signatory of the Washington Accord11 and should enjoy reciprocity of recognition with other accrediting agencies worldwide.
3. the engineering accrediting agency should keep up-to-date with emerging trends in the engineering profession internationally.
15.3.5 In addition to the accrediting agency that would deal directly with the engineering industry, there is also need for an overseeing Accreditation Board for the Caribbean area. This is currently being worked on, and its role will be:
1. to maintain a database of acceptable (accredited) degree awarding institutions outside the region (including Distance Education (DE) type programmes), as well as the database of accredited training programmes within the region.
2. to determine how other academic qualifications (such as the HND) should be treated in terms of equivalency.
3. to establish an acceptable standard for Technical and Vocational Education and Training (TVET) and specifically for National and Regional Vocational
11 The Washington Accord is an agreement for mutual recognition of accredited professional engineering academic qualifications among the major English-speaking countries of the world, namely Australia, Canada, Honk Kong, New Zealand, South Africa, United Kingdom and United States of America.

102
Caribbean Construction Industry Study, 2002
Qualifications (NVQs and RVQs) within the Regional Qualifications Framework.
15.3.6 The disciplines of the several branches of engineering are significantly different, and the accreditation of qualifications in each would require different knowledge bases and personnel. There is currently no detailed database of all the qualifications and the procedures used in the individual countries of the Community to become a recognised professional engineer. Such a database would be desirable and would be one of the deliverables of a special project. However, the professional engineering organisations in the region are fairly consistent in their stipulation of a Bachelor’s degree in engineering or equivalent as the educational requirement. 15.3.7 The first stage of the process of regionalizing accreditation would be to try to ensure consistency across the region in the qualifications considered acceptable for entry into the profession. This first stage has been started by the CCEO and needs expediting. Mechanisms for equivalency and/or accreditation (or mutual recognition) have been put in place by Jamaica and Trinidad & Tobago, as part of an overall plan to provide a unified system for the Community. The University Council of Jamaica (UCJ), which has overall responsibility for accreditation in that country, has recognized the engineering professional organisations as the executing agencies of the accreditation process. There isn’t quite the legal equivalent of the UCJ in other territories. In Trinidad & Tobago the National Institute of Higher Education, Research, Science and Technology (NIHERST) has a long-standing Committee for the Recognition of Degrees (CoRD), and has recently established an Interim Accreditation Committee. Guyana, Barbados, Belize and the Bahamas have taken the establishment of their national accreditation bodies to cabinet. The professional engineering associations have begun work at the regional level through CCEO to establish a regional accreditation system for engineers. A framework for incorporating academic qualifications and professional experience is being developed to harmonise the qualification requirements of the various professional bodies. Draft model legislation has been forwarded by CCEO to its various constituent members. 15.3.8 It should be noted that some of the most successful contractors in the industry in any country have little or no academic training or qualifications. Such individuals are not currently accepted into the professional associations. There is need for standardization and reciprocity in the treatment of the free movement of such persons within the region. 15.3.9 Beyond the level of the professionals there is a need for an agreed standard for accrediting sub-professionals, technicians and skilled artisans, tradesmen and craftsmen. The construction industry is dependent on these support staff for the effective and efficient running of its projects, so it is very

103
Caribbean Construction Industry Study, 2002
important that the accreditation standards for this group are worked on also. However, it is more feasible and strategic to start at the professional level. 15.3.10 Currently COHSOD is working to create a single regional Accreditation Board that will oversee the accreditation of all regional qualifications. 15.4 Harmonisation of regional legislation 15.4.1 For engineers to be described as Registered Engineers (RE or REng), Chartered Engineers (CEng) or Professional Engineers (PE or PEng) they must be legally registered and licensed by some form of Engineering Council or Board of Engineering. This registration protects the profession from having unqualified people claiming to be engineers, and the general public from incompetence, negligence or ignorance in the engineers they employ. The requirements for licensing extend beyond those required for entry into the profession. In order for the profession to be protected, and for that protection to be enforceable, appropriate legislation must be passed. For there to be regional equivalency, it is necessary that similar legislation be enacted in each country. 15.4.2 Three years ago, the CCEO constituent members endorsed the draft model legislation. This process needs to be carried forward to ensure that the common legal framework is enacted in the various territories. Legislation exists in Barbados, Jamaica, St Lucia and Trinidad & Tobago, and is under revision to comply with the essential features of the model. Several other states (most notably the Bahamas, Belize, Grenada and Guyana) have bills in various stages of legislative enactment. 15.4.3 Once there is a common regional legislative framework defining and protecting the profession there will be a sounder basis for true regionalisation of the profession. The basis for registration and licensing will involve not only the terms and conditions for entry into the profession, but also such issues as the continuing requirement for upgrading and updating of skills through a Continuing Professional Development (CPD) programme. The system should allow for reciprocal recognition of similarly registered and licensed professionals from other countries or regions. 15.5 Mutual recognition and reciprocity 15.5.1 Whilst the CARICOM region is moving to liberalise trade and the movement of nationals within its boundaries, it is also negotiating with other trade blocs about the terms under which they will treat with one another. It is felt that the principles of mutual recognition and reciprocity should guide these negotiations. In effect this means that we will deal with them as they deal with us. In the construction field, this impacts most immediately on the freedom of those involved to work on equal terms in one another’s countries. If it is right for a CARICOM based engineer to have to register with the Professional Institutions in, say, Canada in order to work there then it is right that a Canadian engineer

104
Caribbean Construction Industry Study, 2002
should have to register with the local Professional Associations when working within CARICOM. 15.5.2 The mutual registration of engineers from within the region by countries in the region should be a simple and straightforward exercise for a small fee. It is, however, felt that there is no reason why there should be a ‘single door’ that would allow a foreign engineer to register in one country within CARICOM, and then to have automatic access to other countries. Just as the different states in the USA require separate registration of engineers, it is anticipated that there would be a need for a foreign engineer to register in any territory that he/she wished to work in. 15.5.3 Provided there are suitable international oversight capabilities which can ensure that the professional registration standards are equivalent, then there should be no problems in agreeing to mutual recognition and reciprocity. The Washington Accord is supposed to provide some oversight in that signatories should accept one another’s accredited academic qualifications. Once the accreditation has been achieved to mutually acceptable standards, and registration has been achieved, professionals may be recognised as being competent to act in any jurisdiction. 15.6 Free movement of natural people 15.6.1 According to the WTO Secretariat, the international supply of construction services involves large movements of workers at all levels of skill. Although statistics regarding the movement of workers related to the industry are not readily available, analysts believe that a large proportion of the movement of workers into the industrialized countries and the Middle East from Asia, Latin America and other developing regions are construction-related. Because of the type of work involved, the majority of construction services are either supplied by the commercial presence of a foreign company or through the presence of natural persons. 15.6.2 One of the principal provisions of the Treaty Establishing the Caribbean Community is that it will work towards the ‘free movement of natural people’ between the member countries. In effect this will mean that nationals and residents of the region will be able to move between the countries of the community without the need for passports or visas or any of the other impediments to easy movement. This will be of significant benefit to the internationalization of the construction industry. Construction requires not only the professional engineers, architects and surveyors, but also a whole range of sub-professionals, artisans and laymen who undertake the work involved. The physical work of construction is undertaken by contractors who usually have a team of skilled people working for them, with whom they have an established understanding. Ideally, to maintain their efficiency, these persons should move with the contractor onto any job he may undertake. Thus, the industry should benefit from the enhanced freedom of movement as it is liberalized.

105
Caribbean Construction Industry Study, 2002
15.6.3 There is however, a down side to this. The construction industry is also a heavy user of unskilled labour. This tends to be labour that is temporarily unemployed, structurally unemployed (i.e with skills that are no longer ‘economic’) or in transition from declining industries (like agriculture). This provides a valuable source of short term employment within the economy, especially for the disadvantaged and unskilled. If contracting firms from abroad bring their whole workforce with them it will deny the locally unemployed from having the opportunity of work. Specific mention has been made of the tendency for Asian contractors to bring their entire workforce with them, including many with very dubious ‘skills’. Anecdotal evidence suggests that some Chinese contractors use indentured-type labour on overseas jobs (in the Caribbean, for example), for minimal cost. There is no doubt that their presence is resented (and in some cases feared) locally. They may also be engaged in violation of accepted and/or legal standards of compensation, working conditions and accommodation. This makes them highly competitive, though unfairly so, on purely financial terms. 15.6.4 In addition to this, the sudden influx of a large itinerant workforce into an area with limited socio-economic infrastructure can also have damaging effects on that area. Thus, while it may be beneficial in terms of enhanced efficiency for a team to travel and work together, it may not be politically or socially acceptable particularly in this region of high unemployment and a fairly literate labour pool. In the Caribbean there have been several protests (and work stoppages) by residents of various districts to the wide scale ‘importation’ of non-professional and non-supervisory labour from outside the area, on public funded projects. It is considered unlikely that firms from within the region would want to carry their entire workforce with them onto a project within the region, unless there were very special circumstances. Thus it is felt that a restriction on this sort of exercise, on socio-economic grounds would be justifiable. In other words, it is unlikely that the construction industry would view the unrestricted movement of unskilled ‘natural’ persons with equanimity. 15.7 Market access; (GATS Article XVI) 15.7.1 The underlying philosophy behind the formation of a Single Market and Economy is that trade and economic liberalization are good things. Trade liberalisation should encourage higher levels of efficiency and greater diversity of production, and economic liberalization and integration should help to protect smaller communities from the vagaries of the international economy, and shelter them from the harmful volatility of short term financial fluctuations. Thus, the CSME is intended to provide conditions in which nationals can access the “collective resources of the Region on a non-discriminatory basis” (Introduction to Protocol 2 Amending the Treaty Establishing the Caribbean Community), i.e we will share the good things and distribute the risks of the bad.

106
Caribbean Construction Industry Study, 2002
15.7.2 The intent behind provisions for market access are that smaller economies should be given the opportunity to expand by being allowed access to other markets than their own. In construction terms this would mean allowing the consultants and contractors operating in the smaller and less developed countries access to project opportunities elsewhere. In principle there should be no problem with this, however, the truth of the matter is that it is unlikely that they could grasp the opportunity. Most are fully employed servicing their local markets already, and because of their very limited size, and their shortage of resources (both human and financial) firms from the smaller territories would find it very difficult if not impractical to contemplate working outside their home countries. 15.7.3 Thus ‘Market Access’ to work outside their home country is not usually an issue for local firms, except if it allowed firms from outside those smaller countries to ‘poach’ work from the indigenous firms in those countries. Big contractors or consultants may take small jobs to get a foothold in a new market, and they will take those jobs at cost, or even at a loss for strategic reasons. It is very hard for local firms to compete on these terms (see the newspaper article reproduced in Appendix V). This is a form of ‘dumping’ and under-pricing and should not be tolerated in the construction industry in a similar way that it is not tolerated in manufacturing, because of its destructive effect on local industry and competitiveness. 15.7.4 Trinidad and Tobago is slightly different in that it has contractors and consultants that are of a size to bid on major projects that are internationally tendered at home and abroad. However, the prequalification criteria that are used by the lending agencies tend strongly to favour foreign firms because they give extra weight to extra size even when this may be irrelevant to the job at hand. 15.8 Subsidies; (GATS Article XV) 15.8.1 Most industries in countries within the larger trading blocs receive hidden subsidies that help them compete abroad. The European and American agricultural subsidies are enormous and massively distort the world trade in agricultural commodities. Butter mountains and wine lakes are an inconvenient side effect of these policies. Although the actual form of the subsidies received by the construction industry is less well known, there is no doubt that they exist (this is the topic of a project proposed by the CAIC to the Caribbean Community Secretariat). Charles Ram has undertaken a preliminary investigation of such support, subsidies and incentives affecting the construction industry in Guyana, which he presented at our seminar in Guyana (Appendix VI). The British government is well aware of the ‘invisible’ earnings from the overseas operations of the construction sector, and that they are a major contributor to that sector’s economic performance. There is little doubt that the British government is prepared to support this industry by any ‘appropriate’ means to help ensure that it

107
Caribbean Construction Industry Study, 2002
maintains its position of strength. These subsidies no doubt influence the competitiveness of firms in international markets. 15.8.2 Quite apart from such home-country subsidies the countries of the region also offer inducements to foreign firms that work against the interests of their own nationals. One form of a local subsidy is in the granting of tax concessions. These exist within the Caribbean Community just as elsewhere. One particular concession is on the waiving of import duty on machinery and equipment brought into the country by a foreign contracting firm for a construction project. Duty only becomes payable if the firm eventually sells the equipment after the project. Local firms do not enjoy this luxury. There is also a form of discrimination in the need for local contractors, in some countries, to pay duties (e.g. a consumption tax) on materials for their projects, while foreign contractors are exempted. 15.8.3 There is a need to examine the various concessions, in terms of support, subsidies and incentives, that are available both in the home countries of the large international firms and locally that may work against the competitiveness of the local firms, especially as many of these subsidies are ‘hidden’. This is the subject of a specific study proposed by the CCSI to the CARICOM Secretariat for funding. 15.9 Right of establishment; (Protocol 2, Articles 35 b and c) 15.9.1 The guiding principles for the Caribbean Community are basically laid out in the General Agreement on Trade in Services (GATS). This sets out a ‘broad framework of ground-rules concerning trade in services, together with institutional arrangements for administering these rules and negotiating additional market-opening measures subsequently. In the GATS there is a mixture of "general obligations and disciplines", which apply whether or not a member of the WTO has made commitments to market-opening measures concerning specific services, and other provisions that only apply where such specific commitments have been "scheduled" (i.e. are included in a particular member's Schedule).’
15.9.2 There are four distinct "modes" of trade defined in the GATS [Art. 1]: 15.9.2.1 Mode 1 - cross border supply 15.9.2.1.1 Mode 1, cross border supply - consists of the supply of a service from the territory of member Country A into the territory of member Country B. For example, a service supplier of Country A provides service inside Country B, though A's service supplier is not "present" inside Country B, i.e. maintains no subsidiary, sales office, or sales staff in Country B. The cross-border supply of construction services is generally assumed to be practically non-existent as a result of technical infeasibility (i.e., construction services cannot be supplied without the movement of service providers). However, some services (such as blue-print designing) may become increasingly traded over telecommunications infrastructures. As electronic commerce develops there may be some changes in the way that construction services are supplied.
108
Caribbean Construction Industry Study, 2002
15.9.2.1.2 It is also possible that, for example, a consulting engineer in Trinidad may carry out a design for a client in Guyana without ever having an office or representative in that country. In principle this may appear fine, however, in practice there are a number of specific problems particularly in relation to service providers from outside the region. For example, there is a strong belief that there is a separate and distinctive Caribbean aesthetic that is expressed in our built environment. The architectural profession in some of the CARICOM countries feels strongly that this aesthetic should be preserved by restricting the practice of architectural design to firms that are established within the region. This would have the specific intention of preventing an architect from ‘sitting in an office in London’ and designing a significant structure for an environment with which he/she is totally unfamiliar. There are some philosophical difficulties with this position however, and some of the most famous international architects, have indicated that architecture should not be a closed system within any country, but should be open to new influences. For example Santiago Calatravas, wrote “…God protect me, at least, from defending national ideals. Our profession should be devoted to a universal understanding of man. If there is a humanism in our profession, it isn’t based on nations. It’s the basic humanism of the everyman.”12
15.9.2.1.3 The same applies to engineering where design parameters may be affected by factors like the locally available materials, the culture, work ethic, climate and seismicity that may not be familiar to the foreign engineer. These factors could significantly affect the design if it was produced without an understanding of these issues. Exposure to the issues by having a local establishment would go a long way to overcoming these reservations. 15.9.2.1.4 It is not thought that there are any significant limitations on the provision of construction services via cross-border trade, although some countries do limit certain types of construction undertaken from barges, which are protected by cabotage restrictions
15.9.2.2 Mode 2 - consumption abroad 15.9.2.2.1 Mode 2 - consumption abroad, consists of the supply of a service by a service supplier of member Country A to a "service consumer" of member Country B who is present in Country A. Here, as in Mode 1, A's service supplier is not "present" in Country B. An example of this could be a contractor from Trinidad & Tobago who builds a structure in Trinidad for a Barbadian client, like, perhaps the Barbados Mutual Insurance Company building in Port of Spain, Trinidad.
15.9.2.2.2 Several firms in the region have branches, subsidiaries and other types of holdings in more than one territory, in insurance, banking, manufacturing 12 From “Suspended Animation” by Jessie Scanlon, Wired, Vol 9.09, Sept 2001

109
Caribbean Construction Industry Study, 2002
and other areas. It is anticipated that this will become a more common occurrence within the CARICOM region, especially as more firms regionalize their operations. It is also expected that increasingly, foreign firms operating in the region, will employ the local construction industry to undertake their building projects, rather than having them designed and/or built by firms from their home countries. In other words, the capabilities of the local firms will eventually be recognized, as will their cost advantage. The ‘playing field’ must of course be level for this to happen.
15.9.2.3 Mode 3 - commercial presence 15.9.2.3.1 Mode 3 - commercial presence, consists of the supply of service by a service supplier of member Country A to service consumers in the territory of member Country B, where A's service supplier is deemed to be "commercially present" in Country B. An example of this could be a Guyanese contractor who owns a company, or has a representative office or branch in Grenada, or participates in a partnership or joint venture based there in order to provide services to Grenadian clients. Currently this tends to be a popular approach amongst firms within the region who maintain representation or contacts within each country which are ‘operationalised’ when specific projects require such associations. 15.9.2.3.2 The only restrictions on commercial presence appear to be those where non-resident construction contractors are required to submit a deposit or post a bond, or where there are residency requirements, or, as in cases like Antigua and Barbuda, there are across the board restrictions on the ownership of assets, particularly real property. 15.9.2.4 Mode 4 - presence of natural persons 15.9.2.4.1 Mode 4 - presence of natural persons, consists of the supply of a service by a service supplier of member Country A to service consumers in the territory of member Country B by way of the presence in Country B of people who are themselves service suppliers of Country A, or employees of A's service supplier organisations. An example of this could be a Barbadian contractor who establishes a separate largely autonomous firm in Jamaica to provide services to the Jamaican construction sector. 15.9.2.4.2 Under circumstances where company registrations are regional rather than local, it is likely that firms will set up wholly owned, limited liability subsidiaries in other countries where they work. This is quite common practice now, especially with foreign contractors who set up ‘local’ operations (e.g. Keir, Carillion, Teamwork). This approach has the double benefit of being politically correct (it’s a local company) and of limiting their exposure (if things go wrong).
15.9.2.4.3 Rights of establishment are slightly different across modes, but generally the principle is that nationals of the community should be free to adopt any mode of establishment they consider appropriate to provide their services to

110
Caribbean Construction Industry Study, 2002
the community. In general terms there is no problem with free and fair competition within the region. It is not so clear cut when it comes to the relationship between the region and the rest of the world, however. Specifically there are reservations about firms designing and planning works for the region with little or no knowledge of the region, its culture, its climate, its geography or its geology. Most of these reservations would be removed if the firms had to have a physical presence (an establishment), or a valid association with an establishment within the region. 15.10 Restrictions on the provision of services 15.10.1 The fundamental purpose of Article 36 of Protocol 2 is that there should be no restrictions on the provision of services based on their origin. In other words, service providers from anywhere within the community will be treated equally. 15.10.2 New restrictions on the provision of services are expressly prohibited by the terms of Protocol 2, Article 36. For example, it is inappropriate for professional organisation to propose new restrictions on their membership that are expressly discriminatory against non-nationals, unless there is very good reason. The wording of the proposed new constitution of the Trinidad and Tobago Institute of Architects treads very close to the line of being an unacceptable restriction in many regards. Existing restrictions on the provisions of service will need either to be removed or to be harmonized across the Community, and this, of course, is the objective of the Working Group meetings that have been taking place since mid-2001.

111
Caribbean Construction Industry Study, 2002
16. IMPROVING INDUSTRY EFFECTIVENESS 16.1 Market efficiency 16.1.1 A number of issues have already been discussed in the previous section. Here, the focus will be placed on issues relating to market efficiency and competition. This commentary will be based around comments received during the survey underlying this study. 16.1.2 It is clear that one of the key issues is size; the size of projects, the size of local firms, and the relative size of their competitors from larger industrialized countries. The problem is not the normal market-economics one of ‘economies of scale’. The problem here is one of inappropriate size being an impediment to efficient competition in the market. The two elements of project size and firm size are of course inter-related, so that adjustments to the one will impact upon the definition of the other. Even so, it is felt that these problems are sufficiently tractable and important that they both require addressing. 16.2 Project Size 16.2.1 Firstly, the issue of appropriate project definition is relatively simple to address. It is clear that there are consultants in the Caribbean area who are competent to handle the technical aspects of most of the projects that arise in the local market. Perhaps the most technically complex project in recent years has been the new terminal building and associated works for Piarco airport in Trinidad. Even this was felt to be well within the technical competency of local consultants – both architects and civil engineers. What is less clear, however, is the scale of the project as a unified whole and the financial capacity of the local firms. 16.2.2 It has been recognised internationally, since the 1960’s at least, that some major projects nowadays are too big to be handled effectively as single projects and so they have been repackaged into a number of separate projects that are within the capabilities of the available firms, both consultants and contractors. This process of repackaging is not ‘rocket science’ and a competent local consultant could undertake the repackaging, or the project sponsor could be required to get the project repackaged as part of the design process. The process would require some further groundwork to establish what an appropriate size for the maximum project package should be, but this should not be a major exercise. Ideally, it is felt within the industry internationally, there should be around eight firms (whether consultants or contractors) who could submit a competent bid for any project. Using this as a guide, it would be relatively easy to establish what size project package would be appropriate. It should be emphasised here that this would not be intended to exclude foreign competition - quite the opposite, it would be intended to provide greater competition for all concerned. In a market economy this is considered the most economically efficient approach.

112
Caribbean Construction Industry Study, 2002
16.2.3 Most of the countries of the CARICOM region use some kind of Central Tenders Board to allocated public sector projects. Although this system has numerous problems, and is often circumscribed by the governments that have established it, it is potentially a good approach, and does provide the logical agency through which project repackaging could be organised. 16.3 Transparency 16.3.1 It is important that the award of contracts for major construction projects should be as transparent as possible, i.e. that the rules of award should be well established and widely known, and that these rules should be followed in an objective way. The widespread allegations of corruption surrounding the award of the contracts for the construction of the Piarco Airport project in Trinidad & Tobago provide a classic example of bad project procurement. It is not clear whether or not this project will result in widespread criminal proceedings against those involved, but there were many divergencies from good practice, to the extent that the forensic audit of the project undertaken by Robert Lindquist is reported to have found eleven schemes to defraud the client. These schemes included (1) price fixing and bid rigging, (2) duplicate contract payments, (3) false invoicing, (4) defective pricing, (5) co-mingling of contracts, (6) conflict of interest, (7) false representation, (8) improper release of confidential information, (9) product substitutes, (10) tailored specifications, (11) time limitations (See newspaper article reproduced in Appendix V). 16.3.2 It need hardly be said that good practice, and the legal process already requires transparency in the award of contracts, however, it is more often lacking than present, and it very rarely leads to legal proceedings. One particular case in Trinidad & Tobago currently may buck the trend, as legal proceedings have been initiated in a case (reported in a newspaper article “Spancrete takes UDeCOTT to court “ reproduced in Appendix V) in which the responsible Minister is accused of “flagrantly disregarding the bidding process and tendering regulations” over the award of a contract on a highway interchange project. However, apart from exhortation, it is not clear what more can be done, except to heed the warnings issuing from Transparency International and other such agencies, and to enforce the law when it is clearly transgressed. The fate of the Lindquist Report in the hands of the government of Trinidad and Tobago will be instructive. 16.4 Finance 16.4.1 The issue of finance and the needs of the construction industry is perhaps the key issue in attempts to improve the industry effectiveness. The major problem with finance relates to the large projects, and clearly will be reduced if projects are repackaged into smaller elements. The lack of assets of local construction firms limits their collateral base on which finance can be obtained, and this problem is exacerbated by the risk-aversion of local finance houses. It seems clear that the various issues involved in this matter need to be looked at in
113
Caribbean Construction Industry Study, 2002
greater detail y someone with appropriate expertise and the necessary data on both construction firms and finance houses. 16.4.2 Looking briefly at the issues as they were raised during this study, the Piarco Arport Terminal project once again provides a good example. The airport project was expected to cost around US$100 million (it ended up costing over US$ 200million, as is indicated in the newspaper article reproduced in Appendix IV). It is not clear that any local consulting firm could handle a job of that scale alone. Not only is there a large financial commitment, but also there is the manpower required to turn the design work into working drawings, and to supervise the construction to ensure that the design integrity is preserved. Of the consultants who responded to our survey (and most of the larger firms responded), only one firm had an average annual turnover of more than US$5 million whereas the prime consultant on the airport terminal, the American firm Birk Hillman, received over US$140 million over a four year period i.e. US$30 million per year on average. 16.4.3 This is a large step up, even if a local architect and consulting engineering firm got together to undertake the project. However, the local consulting firms seemed securely confident in their abilities and capacity to undertake large projects, with their only major reservation being in the risk element. Taking on a big project of the scale of the airport terminal would require all their resources – and perhaps more – and this was akin to ‘putting all your eggs in one basket’. This is a high-risk strategy, and one that could bring the firm down if problems occurred with that one project. It is not clear how this risk issue can be solved, but it is clear that insurance by itself is not the answer. The willingness and ability to execute such projects is certainly there among local firms who are convinced that with the political will, innovative means of packaging, financing and management can be found. 16.4.4 For local firms to be fully involved and to benefit from the projects being undertaken in their own territories, as has been noted, the big projects should, where feasible, be packaged into smaller parcels of work. It is not clear what the maximum size of project in financial terms should be in order to optimize local participation, partly because it depends on the macro-economic welfare of the country, and partly because it depends on the micro-economic status of the firm. A firm in a small island state that is suffering from a recession will be less able to take on a major foreign currency risk than one in a more economically stable environment. Also, a firm with a busy current workload cannot abandon the projects that it is already committed to, so the largest project size it can cope with is restricted by its other work. However, it does seem safe to say that local consulting firms could cope with projects up to around the US$40 million level. 16.4.5 Shifting the focus to the export market, there can be little doubt that local firms in the Caribbean are inhibited by the substantial up-front costs and the inherent risks involved in bidding on international projects and in establishing a

114
Caribbean Construction Industry Study, 2002
presence in foreign markets. Companies pursuing international projects often find it difficult to access financing and investment capital and to assemble the necessary financial packages. Financing, bonding, performance guarantees, insurance and legal services for offshore projects are not usually available in the countries of the Caribbean and hence have to be sourced abroad. This involves a significant premium, as well as a currency risk. Firms in the industry in the region have also indicated that competitors from the developed countries often have access to financial guarantees (usually provided by their governments) that are not available to local firms either for local or overseas projects. 16.4.6 It is apparent that there are a number of financial issues that need to be addressed, and that a competent agency should examine the issues in greater detail. The outcome of such a study could more than pay for itself, as the jobs that are lost, the income and the profits that are exported, and the potential for future inflows could swiftly pay the cots of undertaking a study to determine what financial conditions need to be established to improve the effectiveness of the industry locally. 16.5 Information regarding projects 16.5.1 It is obvious that if a firm does not know about a project it cannot bid for that project, and it is not just the absolute knowledge, but the timeliness of that knowledge. Firms in this study made it very clear that they were not finding out about projects in a timely way. Whether or not they were totally blameless in this failure is beside the point. There are websites and there are publications that carry information on internationally bid projects funded by international agencies, but if they do not reach their intended market then they are ineffective. If one of the main reasons for this is that they are too expensive (as was suggested by two of the participants in interviews related to this project), then the solution is simple. Make them cheaper. 16.5.2 It should be clear that the economic efficiencies of getting competitive bids on large projects would justify making advance notification of projects free to the prospective market – and this is very easily achieved on a website. It would appear that this simple move by the international lending agencies could almost immediately improve the effectiveness of the industry locally. (It needs hardly be added that a single website could provide information on projects for all international lending agencies, rather than that they should each run their own. The savings from rationalising the distribution of information could benefit both the agencies and the firms involved in the industry.) It as been noted elsewhere that the Engineering Institute at the University of the West Indies, St Augustine, would be an appropriate agency for the hosting and maintenance of such a website. 16.6 Human Resources 16.6.1 The problem of human resources in two sided. Firstly there is the industry side, where it is relatively easy to predict skill demands given macro-economic

115
Caribbean Construction Industry Study, 2002
data about the industry in relation to the economy. Hence the “Construction Industry Study” carried out by Chin et al for Trinidad & Tobago in the 1970’s made estimates of skills based on technical coefficients relating the industry to GDP, in order to attempt to identify skill bottlenecks that may occur. Similar studies could be done and estimates made from the society perspective, in order that appropriate training facilities could be put in place. A project about to be undertaken by the Caribbean Community Secretariat will be addressing one part of this need. The other side of the human resource problem, is the individual’s side. Given a demand for skills and appropriate training facilities, how do you ensure that enough people want to acquire those skills and work in that industry? 16.6.2 At a professional level, engineers have long bemoaned their lack of public recognition and respect. People seem to have higher regard other professional disciplines like medicine and the law, and this does limit the demand for places at University to study engineering. This is not currently a problem at UWI which is usually oversubscribed by students wishing to study engineering, except in as much as UWI is limited by size in the number of students it can cope with. The emergence of other University level – degree awarding – institutions in the region can only help in this regard, and again the CARICOM Secretariat project will help to establish the size of the ‘supply’ side of the market. Indeed, the study will encompass all tertiary (post-secondary school) level qualifications in the engineering fields. 16.6.3 What the CARICOM Secretariat project will not address is the demand side (based on technical coefficients and variations in the output of the industry and GDP) of the engineering qualifications issue, though another study for each country could add this dimension relatively easily, provided the statistical data is relatively readily available. 16.6.4 At the trade/artisan level, there is little in the way of formal training or skills certification currently, though these are being put in place in some of the CARICOM countries. At the moment contractors hang on to skilled workers when they find them, because they have to work very much on a ‘suck it and see’ basis to find out if workers are as skilled as they claim. If the man can do the work then he is ‘skilled’ whether or not he has had any formal training. This may be satisfactory in the local environment, where people know one another, but will not be good enough when the SME is in place, and workers want to move to projects in other countries. Clearly there is need to speed up the introduction of training programmes (through a form of Construction Industry Skills Development Centre type approach), and certification schemes that will allow vocational and trade skills to be identified and measured. This will quickly contribute to improving the effectiveness of the industry locally. 16.7 Joint-ventures and partnerships 16.7.1 A number of internationally bid projects currently require the overseas firm to enter into a joint-venture with a local firm for the execution of the project.

116
Caribbean Construction Industry Study, 2002
Quite a large number of firms have entered into such arrangements, but there seem to be quite strong reservations about their effectiveness. Firstly the local firms seem always to find themselves as the junior partner, used mainly for cosmetic purposes, and secondly, they feel that there is more of a transfer of technology out than in, as a result of these associations. Obviously an arrangement entered into under ‘duress’ is unlikely to be as open as one entered into for mutual benefit. Thus it is not clear that contractual requirements for local participation are the best way of encouraging such associations, desirable though them may be. 16.7.2 Recent experience in other parts of the world with public-private partnerships in which the participants enter the partnership by mutual consent, and on the basis of what they can ‘bring to the table’, suggest that this may be a more productive approach. Although many nations throughout the world have used public-private partnerships for some time, to procure their infrastructure needs in particular, the governments within the CARICOM region are only now beginning to show interest in this approach. This is unfortunate as it is a method that allows a smaller firm to bring its specialist skills into a venture as a fully-fledged partner. The failure to recognise the benefits of this approach has already handicapped local firms both locally and internationally as few firms within the region have experience with this type of project. This will affect them for some time to come as they will not have the experience necessary to successfully compete in international markets for projects implemented as public-private partnerships. 16.7.3 Public-private partnerships require participants to take on significantly increased risks and to arrange for financing. Most CARICOM-based construction firms lack the expertise necessary to assess the risks involved in international projects, are unused to forming the consortia necessary to develop a project, and have not developed strong links with potential sources of capital. It should be noted, however, that there have been a number of very successful Design-Finance-Construct projects built throughout the region, often with insurance companies providing the finance, and team of a consulting engineering firm, architect and contractor being put together for the project. These projects have been the exception rather than the rule, however. 16.7.4 Anecdotal evidence suggests that the insurance firms were the prime movers in these projects, but this is certainly not typical of the attitude of the financial sector within the CARICOM region. It has, in general, little experience with public-private projects and as it is extremely risk-averse it seems unlikely to be prepared to offer the financing on a broader base that is currently the case, unless it sees a particular economic advantage and a low level of risk. Furthermore, it cannot currently provide the financial advice needed to potential partnerships over the appropriate terms for financing such projects. This will work to further disadvantage the industry locally, unless strong proactive measures are taken to head off the problem.
117
Caribbean Construction Industry Study, 2002
16.7.5 It is becoming clear internationally, especially as interest rates drop, that sound, productive investment opportunities will become increasingly important. In many parts of the world, firms are creating their own investment opportunities through the medium of the DFC13 type projects, like the public-private partnership projects. Thus it will become increasingly important for the construction and financial sectors locally to become involved in these projects, as they will represent both a major segment of the market and a significant (relatively safe) investment opportunity. If the firms in the respective sectors do not show the necessary initiative and get involved early, they will never catch up. 16.7.6 As the Canadian government has noted “Many developing nations, particularly those in Asia and South America, are turning to public-private partnerships as a means of satisfying the infrastructure demands created by their rapid urban and economic growth. International financial institutions such as the World Bank and the Asian Development Bank are also increasingly seeking private sponsorship and risk-sharing in the infrastructure projects that they support.” Leading them to conclude that Canadian firms need to be more proactive. This conclusion can only be echoed “in spades” for the CARICOM region. This is so important because of its longer term impact on local projects as well as overseas projects, that it may require a public sector initiative with three prongs - one to encourage firms to learn what is involved, a second to absorb some of the financial risks, and a third to provide institutional support to the firms in structuring their relationships in these partnerships.
13 DFC=Design-Finance-Construct, but should be considered to include the whole range of projects in which a consortium designs and builds projects (usually for a public sector client) under a financial regime that the companies have themselves designed.

118
Caribbean Construction Industry Study, 2002
APPENDIX I Terms of Reference for study And Draft Proposal from CCEO
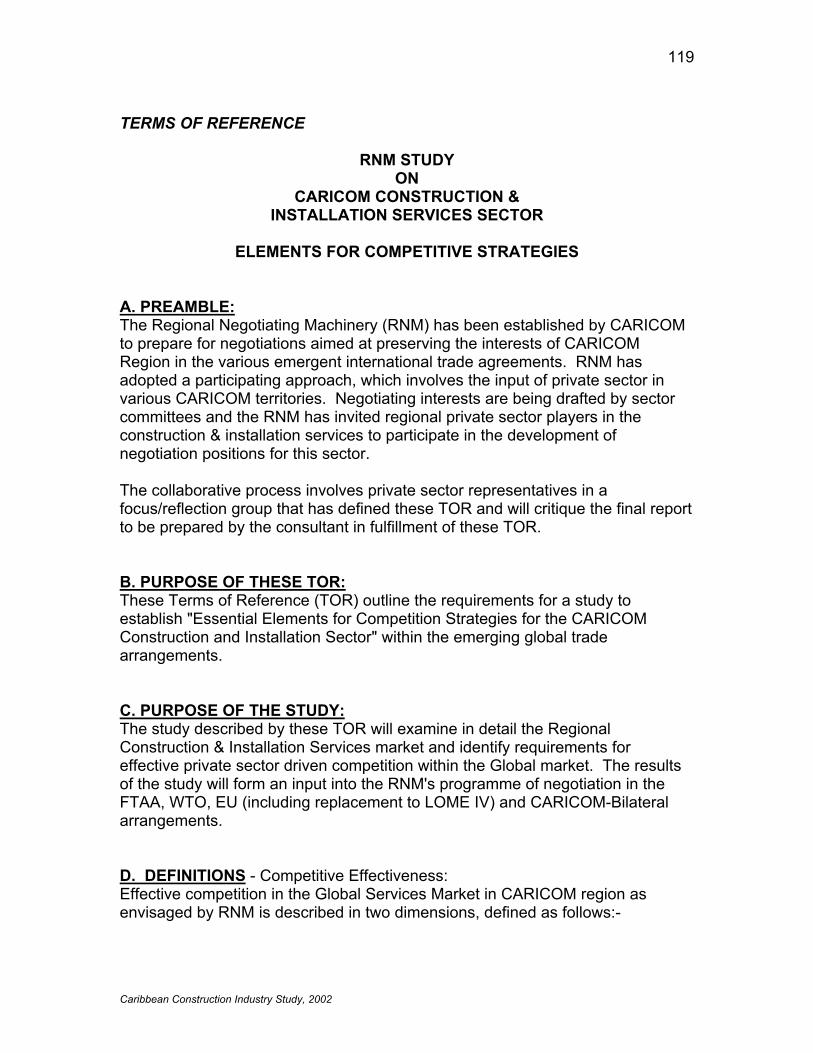
119
Caribbean Construction Industry Study, 2002
TERMS OF REFERENCE
RNM STUDY
ON CARICOM CONSTRUCTION &
INSTALLATION SERVICES SECTOR
ELEMENTS FOR COMPETITIVE STRATEGIES
A. PREAMBLE: The Regional Negotiating Machinery (RNM) has been established by CARICOM to prepare for negotiations aimed at preserving the interests of CARICOM Region in the various emergent international trade agreements. RNM has adopted a participating approach, which involves the input of private sector in various CARICOM territories. Negotiating interests are being drafted by sector committees and the RNM has invited regional private sector players in the construction & installation services to participate in the development of negotiation positions for this sector. The collaborative process involves private sector representatives in a focus/reflection group that has defined these TOR and will critique the final report to be prepared by the consultant in fulfillment of these TOR. B. PURPOSE OF THESE TOR: These Terms of Reference (TOR) outline the requirements for a study to establish "Essential Elements for Competition Strategies for the CARICOM Construction and Installation Sector" within the emerging global trade arrangements. C. PURPOSE OF THE STUDY: The study described by these TOR will examine in detail the Regional Construction & Installation Services market and identify requirements for effective private sector driven competition within the Global market. The results of the study will form an input into the RNM's programme of negotiation in the FTAA, WTO, EU (including replacement to LOME IV) and CARICOM-Bilateral arrangements. D. DEFINITIONS - Competitive Effectiveness: Effective competition in the Global Services Market in CARICOM region as envisaged by RNM is described in two dimensions, defined as follows:-

120
Caribbean Construction Industry Study, 2002
• Regional Effectiveness - The ability of regional service providers to successfully compete against international providers for the CARICOM market.
• International Effectiveness - The ability of regional service providers
to successfully compete against local and international providers in the international market for Construction and Installation services, particularly in the EU/Latin Americas.
E. CONTEXT OF STUDY: The approach, scope, results, recommendations/competitive strategies and requirements of the study must be cognizant of and fully reflect the emerging trade environment defined by EU, WTO, FTAA, CARICOM-Bilateral arrangements. Any special provision , (e.g. Cotonou Agreement).by multi-lateral and bi-lateral agreements aimed at facilitating transition by lesser developed economies, SME's, particularly in capacity building shall also be considered. F. SCOPE OF STUDY: Specific answers to be provided by the study to meet the RNM's objectives for its trade negotiations. This study must specifically address the following:- 1) Assess and describe the competitiveness of Caribbean companies,
regionally and internationally. 2) Provide a detailed profile of the Construction and Installation sector within
the study areas. This shall include details of the number of firms in the different service areas, identifying their specialties, human resource expertise, equipment and machinery, financial capacity, experience, ownership and organization structures and any other information necessary to describe the capacity and capability of the sector.
3) Identify and describe the specific barriers to participation currently
encountered by local/regional Construction & Installation service providers in the international markets. Evaluate the extent to which such barriers might increase in the new trade environment.
4) Identify and describe possibilities/opportunities for improved
competitiveness by local service providers. 5) Identify and describe opportunities/approaches for joint-ventures and
partnerships among regional private sector companies. 6) Identify arrangements to be secured with CARICOM trade partners to
facilitate access and effective participation by regional companies.

121
Caribbean Construction Industry Study, 2002
7) Specify necessary actions by territorial/regional governments to facilitate
effective participation. 8) Describe requirements for and the role of sector governance; standards,
certification and regulations; accreditation, mutual recognition/reciprocity and other bases for establishing globally acceptable practices in the Construction & Installation Services sector.
9) Identify and describe effective arrangements for working with established
trade partners (Canadians, etc.) to achieve competitiveness in regional and international markets.
The study shall encompass all areas of Construction and Installation Services, including but not limited to construction/installation contracts, consulting services and operations management. The entire CARICOM region is to be covered but particular emphasis shall be placed on Jamaica, Trinidad, Barbados and Guyana. Particular emphasis must be placed on factors that define the market and trade environment for services within the region. These shall include, inter alia: markets for services (potential volume)
laws and regulations (Customs, Immigration, Taxation, Labour, Companies Act, etc.)
financing
Standards and sector governance systems
Business practices of companies in region
Capacity of region (Technology, Human Resource capabilities, equipment, finance)
Government Procurement Practices (GP)
Existing/traditional trade practices and preferences in individual territories.
Emerging arrangements (e.g. CSM&E , Cotonou Agreement etc.)

122
Caribbean Construction Industry Study, 2002
G. SCOPE OF ACTIVITIES: The consultants shall do all things necessary to meet the objectives of this study. Activities shall include, but not limited to, the following:- 1) Research - literature review, field research, interviews across the region. 2) Analysis - to identify conflicts, opportunities, requirements. 3) Focus/Reflection Group Review Make presentations, accept and incorporate
critique, comments, recommendations from focus groups assembled from time to time by the RNM. Or, conduct workshops and/or seminars on specific aspects of the study to engage active participation representative key players and stakeholders.
4) Recommend Strategies
Resulting from research, analysis, discussions, develop implementable recommendations on "elements of competitive strategies for CARICOM private sector companies in the Construction & Installation Services." The recommendations shall include, but not be limited to, strategies on :-
1) Trade conditions; special and differential treatment, requirement, etc.
2) Financial Strategies
3) Business Strategies; Joint-Ventures, bonding and insurance, capacity
development ,technology.
4) Laws & Regulations; harmonizing relevant laws in territories.
5) Standards & Governance in Sector; region wide systems and standards.
6) Public/Private Sector Partnerships. H. DELIVERABLES: The consultant shall submit a complete report, providing all details of findings, analysis and recommendations. Format of report to be agreed with RNM. I. SERVICES TO BE PROVIDED BY RNM: RNM shall provide the following:- 1) Focus/Reflection groups for review

123
Caribbean Construction Industry Study, 2002
2) Mediums for broad-based private sector participation. J. TIMETABLE: The study will be executed on the following approximate schedule. - Issue of Request for Proposals (RFP): March 14, 2001 - Return of Proposals: March 23, 2001 - Award of Contract: March 30, 2001 - Submit Draft report: June 29, 2001 - Reflections/Focus Groups Review: July 13, 2001 - Final report Submitted: July 31, 2001 K. PROPOSALS: A. Submission of Consultant's Proposal Proposals from invited Consultants are to be submitted by (date) to the RNM (location). Proposal shall detail consultant's proposed:
a) Methodology b) Schedule c) Costs d) Commercial arrangements
B. Evaluation of Proposals A two-envelope method of submission will be used. Consultants’ technical proposals describing methodology, schedules, and resources will be evaluated.
1) Only those technical proposals deemed substantially responsive to the TOR will be considered.
2) Financial evaluation and negotiation will be done on the highest
ranked technical proposal.
3) Financial evaluation/negotiation will be done on the second highest ranked technical proposal in the event of failure to reach agreement with the highest ranked and so on.
February 16, 2001.

124
Caribbean Construction Industry Study, 2002
COUNCIL OF
CARIBBEAN
ENGINEERING
ORGANISATIONS
SECRETARY GENERAL: Eng. Dr. Clement Imbert TEL: (868) 662-6267 (W) Engineering Institute, Faculty of Engineering FAX: (868) 662-4414 (W) The University of the West Indies Email: [email protected] St. Augustine, Trinidad and Tobago TEL: (868) 662 7338 (H)
DRAFT PROPOSAL FOR RNM STUDY
ON ELEMENTS FOR COMPETITIVE STRATEGIES CARICOM CONSTRUCTION & INSTALLATION SERVICES SECTOR
This proposal is being made in accordance with the requirements set out in the
Terms of Reference for the RNM Study on the CARICOM Construction &
Installation Services Sector - Elements for Competitive Strategies and particularly
Section K, Proposals, A2, a to d.
Methodology 1. The consultant, which will comprise a team of engineers from throughout the
Caribbean set up by the Council of Caribbean Engineering Organisations (
CCEO ), expects the RNM to supply information on the emerging
trade environment defined by the EU, WTO, FTAA, Cotonou Agreement and any
other relevant matters relating to bilateral and multi-lateral arrangements aimed
at facilitating transition by the lesser developed economies in the region.
2. The information described in 1 to 9 of the SCOPE OF STUDY and the other
factors therein will be obtained by means of questionnaires, workshops and
interviews with representatives of relevant organisations such as Associations of
Architects, Building Consultants, Construction Project Managers, Contractors,
Engineers and Quantity Surveyors as well individual companies. Information will
CONSTITUENT MEMBERS: Antigua Association of Professional Engineers Association of Professional Engineers of Trinidad & Tobago Bahamas Institution of Professional Engineers Barbados Association of Professional Engineers Belize Association of Technical Professionals Dominica Association of Technical Professionals Grenada Institution of Professional Engineers Guyana Association of Professional Engineers Jamaica Institution of Engineers St. Lucia Association of Professional Engineers St. Vincent Association of Professional Engineers St. Kitts-Nevis Association of Professional Engineers

125
Caribbean Construction Industry Study, 2002
also be obtained from relevant local, regional and international institutions,
banks, government agencies and statutory bodies and suppliers of materials and
equipment with specific reference to installation, operation and service contracts.
3. Information gathering will be done throughout the CARICOM region but with
particular emphasis on Barbados, Guyana, Jamaica and Trinidad & Tobago. This
will be achieved in the first three countries mentioned primarily through
associate/corresponding members of the team. The OECS will be covered
through a member of the team located in one of them, St. Lucia being the choice,
but travelling as required. The project will be managed by CCEO from Trinidad &
Tobago, the present headquarters of CCEO, through the Team Leader and
another team member who would have similar responsibilities re information-
gathering to those outlined above. Travel through the region by the Team Leader
and one member would also be necessary in order to manage the operation
successfully.
4. The team will conduct analysis and research as deemed fit, make appropriate
presentations and recommendations to focus groups, have discussions with
them and conduct seminars/workshops on specific aspects of the Study so as to
engage the active participation of representative players and stakeholders. From
these, strategies (the major output of the project) will be recommended in
accordance with Section G. 4 of the Terms of Reference.
5. The project will done through the CCEO under the general management of the
Secretary-General Eng Dr Clement Imbert. The other names proposed as
executing members of the team are Eng Professor Desmond Imbert, Team
Leader, Eng Tony Gibbs (Reviewer), Eng Grenville Phillips (Barbados) Eng
Phillip Allsoppe (Guyana), Eng Harold Nembhard (Jamaica) and Eng Egbert
Louis (OECS) who is based in St Lucia and Eng Dr T. Michael Lewis (Trinidad &
Tobago).
.
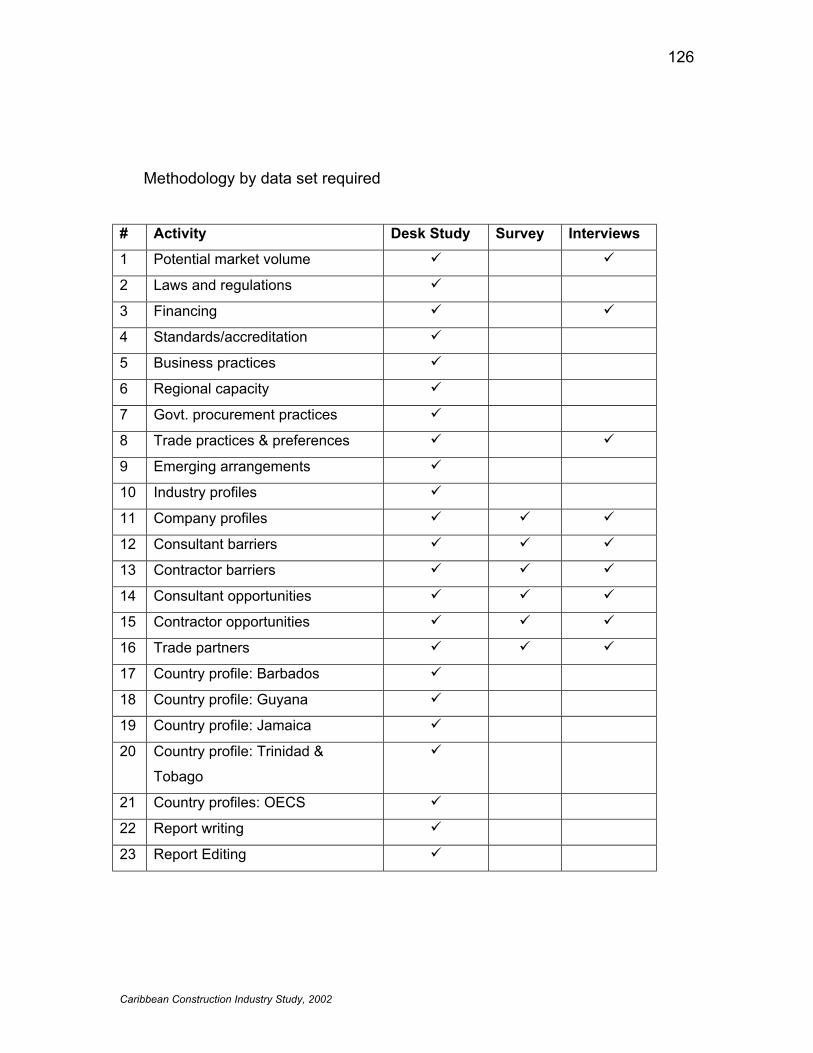
126
Caribbean Construction Industry Study, 2002
Methodology by data set required
# Activity Desk Study Survey Interviews 1 Potential market volume
2 Laws and regulations
3 Financing
4 Standards/accreditation
5 Business practices
6 Regional capacity
7 Govt. procurement practices
8 Trade practices & preferences
9 Emerging arrangements
10 Industry profiles
11 Company profiles
12 Consultant barriers
13 Contractor barriers
14 Consultant opportunities
15 Contractor opportunities
16 Trade partners
17 Country profile: Barbados
18 Country profile: Guyana
19 Country profile: Jamaica
20 Country profile: Trinidad &
Tobago
21 Country profiles: OECS
22 Report writing
23 Report Editing

127
Caribbean Construction Industry Study, 2002
Specific activities will include:
Review of similar studies of the construction industry worldwide
Access relevant trade agreements/conditions, including CARICOM,
FTAA and other regional agreements as well as WTO and EU
arrangements
Examination of Central Statistical Office data for each country
Examination of documents of public record - e.g. budget speeches
Examination of studies done by UWI staff / students
Preparation of survey instrument (questionnaire)
Interview relevant engineering-based consulting and contracting firms
Interview significant clients of construction - banks, insurance firms,
conglomerates, government and other institutions.
Access membership databases of APETT, BAPE, GAPE, JIE, and
other engineering organizations as well as relevant (kindred)
organizations such as Architects, Quantity Surveyors, Contractors,
Consultants, Engineering Geologists, etc.
Access public sector record of contracts awarded (Central Tenders
Board, Government Ministries, Water and Sewerage Authorities, Public
Electricity Companies, Airports Authorities, Ports Authorities, etc)
Access CARICOM, OAS, and other regional agencies
Access CDB, IDB, World Bank and other lending agencies, as well as
aid agencies
Access Trade Directory listings, Yellow Pages etc.
Preparation of standardised data acquisition protocol from interviews
Analysis of survey and interview data
Organise seminar for contractors
Organise seminar for consultants
Organise seminar for joint participation

128
Caribbean Construction Industry Study, 2002
Work schedule Weeks from start date -
e.g. (April)9,16,23,30, (May)7,14,21,28, (June)4,11,18,25, (July)2,9,16,23 # 1 2 3 4 5 6 7 8 9 10 11 12 13 14 15 16
1
2
3
4
5
6
7
8
9
10
11
12
13
14
15
16
17
18
19
20
21
22
23
Equivalent to 102 man-weeks of work.

129
Caribbean Construction Industry Study, 2002
APPENDIX II UNCPC Construction Industry Listing United Nations Standard Industrial Classification System – CPC Version 1.0 (UN CPC listing of code numbers up to five digits of those service sectors that comprise the construction industry)

130
Caribbean Construction Industry Study, 2002
TABLE 1 – UNCPC listing - to five digit level - of those service sectors that comprise the construction industry CPC V1.0 Code Description 1 Ores and minerals; electricity, gas and water 15 Stone, sand and clay 151 1510 15100 Monumental or building stone 1511 15110 Slate 1512 15120 Marble or other calcareous monumental or building stone 1513 15130 Granite, sandstone and other monumental or building
stone 152 1520 15200 Gypsum; anhydrite; limestone flux; limestone and other
calcareous stone, of a kind used for the manufacture of lime or cement
153 Sands, pebbles, gravel, broken or crushed stone, natural bitumen and asphalt
1531 15310 Natural sands 1532 15320 pebbles, gravel, broken or crushed stone, macadam;
tarred macadam; granules, chippings and powder of stone 1533 15330 Bitumen and asphalt, natural; asphaltites and asphaltic
rock 154 1540 15400 Clays 5 Intangible assets; land; constructions; construction
services 53 Constructions 531 Buildings 5311 Residential buildings 53111 One- and two-dwelling buildings 53119 Multi-dwelling residential buildings 5312 Non-residential buildings 53121 Industrial buildings 53122 Commercial buildings 53129 Other non-residential buildings 532 Civil engineering works 5321 Highways (except elevated highways) streets, roads,
railways, airfield runways 53211 Highways (except elevated highways) streets, roads 53212 Railways 53213 Airfield runways 5322 Bridges, elevated highways, tunnels and subways 53221 Bridges, elevated highways 53222 Tunnels and subways 5323 Harbours, waterways, dams, irrigation and other
waterworks 53231 Aqueducts and other water supply conduits, except
pipelines 53232 Harbours, waterways and related facilities 53233 Dams

131
Caribbean Construction Industry Study, 2002
53234 Irrigation and flood control waterworks 5324 Long-distance pipelines, communication and power lines
(cables) 53241 Long-distance pipelines 53242 Long-distance communication lines and power lines
(cables) 5325 Local pipelines and cables and related works 53251 Local pipelines 53252 Local cables and related works 5326 Mines and industrial plant 53261 Mining constructions 53262 Power plant constructions 53263 Chemical and related facilities 53269 Other constructions for manufacturing 5327 53270 Outdoor sport and recreational facilities 5329 53290 Other civil engineering works 54 Construction services 541 General construction services of buildings 5411 General construction services of residential buildings 54111 General construction services of one-and two-dwelling
buildings 54112 General construction services of multi-dwelling buildings 5412 General construction services of non- residential buildings 54121 General construction services of industrial buildings 54122 General construction services of commercial buildings 54129 General construction services of other non- residential
buildings 542 General construction services of civil engineering works 5421 54210 General construction services of highways (except
elevated highways) streets, roads, railways, airfield runways
5422 54220 General construction services of bridges, elevated highways, tunnels and subways
5423 54230 General construction services of harbours, waterways, dams, irrigation and other waterworks
5424 General construction services of long-distance pipelines, communication and power lines (cables)
54241 General construction services of long-distance pipelines 54242 General construction services of long-distance
communication and power lines (cables) 5425 General construction services of local pipelines and cables
and related works 54251 General construction services of local pipelines 54252 General construction services of local cables and related
works 5426 54260 General construction services of mines and industrial plant 5427 54270 General construction services of outdoor sport and
recreational facilities
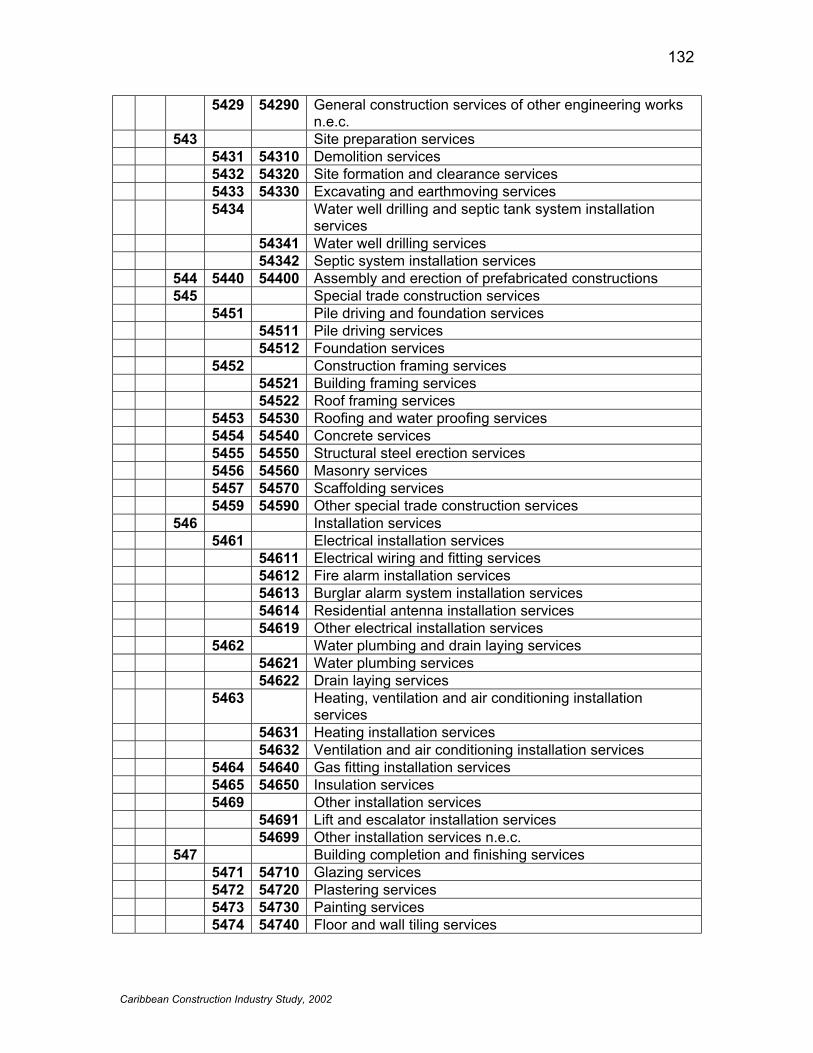
132
Caribbean Construction Industry Study, 2002
5429 54290 General construction services of other engineering works n.e.c.
543 Site preparation services 5431 54310 Demolition services 5432 54320 Site formation and clearance services 5433 54330 Excavating and earthmoving services 5434 Water well drilling and septic tank system installation
services 54341 Water well drilling services 54342 Septic system installation services 544 5440 54400 Assembly and erection of prefabricated constructions 545 Special trade construction services 5451 Pile driving and foundation services 54511 Pile driving services 54512 Foundation services 5452 Construction framing services 54521 Building framing services 54522 Roof framing services 5453 54530 Roofing and water proofing services 5454 54540 Concrete services 5455 54550 Structural steel erection services 5456 54560 Masonry services 5457 54570 Scaffolding services 5459 54590 Other special trade construction services 546 Installation services 5461 Electrical installation services 54611 Electrical wiring and fitting services 54612 Fire alarm installation services 54613 Burglar alarm system installation services 54614 Residential antenna installation services 54619 Other electrical installation services 5462 Water plumbing and drain laying services 54621 Water plumbing services 54622 Drain laying services 5463 Heating, ventilation and air conditioning installation
services 54631 Heating installation services 54632 Ventilation and air conditioning installation services 5464 54640 Gas fitting installation services 5465 54650 Insulation services 5469 Other installation services 54691 Lift and escalator installation services 54699 Other installation services n.e.c. 547 Building completion and finishing services 5471 54710 Glazing services 5472 54720 Plastering services 5473 54730 Painting services 5474 54740 Floor and wall tiling services

133
Caribbean Construction Industry Study, 2002
5475 54750 Other floor laying, wall covering and wall papering services
5476 54760 Wood and metal joinery and carpentry services 5477 54770 Fencing and railing services 5479 54790 Other building and completion services 548 5480 54800 Renting services related to equipment for construction or
demolition of buildings or civil engineering works, with operator
8 Business and production services 81 Research and development services 811 8110 81100 Research and experimental development services in
natural sciences and engineering 813 8130 81300 Interdisciplinary research and experimental development
services 83 Other professional, scientific and technical services 832 Architectural services and urban planning and landscape
architectural services 8321 Architectural services 83211 Architectural advisory and pre 83212 Architectural design and contract administration services 83219 Other architectural services 8322 Urban planning and landscape architectural services 83221 Urban planning services 83222 Landscape architectural services 833 Engineering services 8331 83310 Integrated engineering services 8332 83320 Project management services concerning construction 8333 83330 Engineering advisory and pre-design services 8334 83340 Engineering design services 8335 Engineering services during the construction and
installation phase 83351 Engineering services for buildings during the construction
and installation phase 83352 Engineering services for civil engineering works during the
construction and installation phase 83353 Engineering services for industrial plant and processes
during the construction and installation phase 83359 Engineering services for other projects during the
construction and installation phase 8339 Other engineering services 83391 Other engineering services for buildings 83392 Other engineering services for civil engineering works 83393 Other engineering services for industrial plant and
processes 83399 Other engineering services for other projects 834 Specialty design services 8341 83410 Interior design services 8349 83490 Other specialty design services 835 Scientific and other technical services

134
Caribbean Construction Industry Study, 2002
8351 83510 Geological, geophysical and other prospecting services 8352 83520 Subsurface surveying services 8353 83530 Surface surveying services 8354 83540 Map making services 839 8390 83900 Other professional, scientific and technical services n.e.c.

135
Caribbean Construction Industry Study, 2002
APPENDIX III Letters Referring to the New Airport Terminal Building in Trinidad

136
Caribbean Construction Industry Study, 2002
ENGINEERS PRAISE PIARCO PROJECT (Trinidad Express, Sunday July 15, 2001) The Editor: Having had the opportunity to inspect the new Piarco Terminal as it was completed I wish to record our Association’s satisfaction with the work and indeed the great stride forward that the Country has taken. The Association congratulates all our engineers who worked to make this project a success. However, I must add that there is little in the design of this facility that could not have been handled by local consultants. The local engineering profession dealt famously with the Twin Towers over 20 years ago and we have grown since then, so there is little doubting our ability to handle major works. There has been a recent move to export the country’s technological services in several fields and engineering should be one of these. It is important that our Government demonstrate its confidence in us by allowing us to handle our own projects if we are to attract overseas ones. Further the experience gained will be of tremendous importance to the continued development of the profession in specific areas and boos our stature in the region. It is important, therefore, that consultation be held with our Association before inviting engineering services externally on future projects.
Clifford G. Murray Association of Professional Engineers
THE TROUBLE WITH NEW AIRPORT (Trinidad Express, p 20, Wednesday July 18, 2001)
THE EDITOR: The Trinidad and Tobago Institute of Architects wishes to
express its concern and disappointment over a published letter in the Express dated June 15, from the president of the Association of Professional Engineers. The letter made a point to congratulate the Government on the project and all members (engineers) who worked to make the project a success.
It is strange that APETT has now chosen to make this statement as it was only a few years ago that APETT was represented on the Joint Consultative Council for the Construction Industry that protested over the process employed to deliver the project.
APETT was also represented on the JCC team that participated in the Deyalsingh Enquiry, which concluded that there were serious flaws in the process finding sufficient evidence of corruption in the appointment of the architects and a certain contractor.
Furthermore the Deyalsingh Enquiry also found the design to be inappropriate and criticised it for being excessive. In spite of these concerns substantial additional floor space was added in the middle of construction: a testimony to the level of poor planning and design.

137
Caribbean Construction Industry Study, 2002
The TTIA finds the above-mentioned statement by APETT to be most unfortunate and insensitive to the other organisations that took part in the protest and enquiry on the airport.
It seems necessary to remind the president of APETT that local architectural practices were completely denied any meaningful participation despite the existence of a number of local architectural firms with adequate competence to handle such a project. As such the appointment of Birk Hillman Inc was and remains a permanent scar on the architectural history in this country
It is appropriate to recall that the JCC requested permission to prepare an evaluation of the airport over a year ago. This request was declined because Birk Hillman proposed the cost of their time in preparing for a morning meeting with the JCC would be in the vicinity of US$50,000 to US$100,000. Mind you, this preparation would be for work Birk Hillman had done and with which it was intimately familiar. Consequently, the JCC was never granted an opportunity to inspect the airport. We are now most puzzled by the inspection carried out by the president of APETT, and wonder whether the views presented in his article were discussed and agreed by the wider engineering fraternity.
The TTIA has not made an official inspection of the airport. However, it is patently obvious to travellers that the terminal is poorly designed and built and at a cost of $1.5billion is an exorbitant waste of taxpayers' money.
While it is nice to have a new terminal facility that was long overdue it should be obvious that the project has fallen far short of success in many areas and can never fully represent an authentic expression of this country's creativity. From an architectural point of view, we deeply regret that .local architects are unable to share this sentiment and question whether it is indeed appropriate for the engineers to do so given the history of events.
For and on behalf of TTIA. BRIAN LEWIS Immediate past president
AIRPORT TEETHING PROBLEMS EXPECTED The Editor: I was somewhat stunned by a statement made be a representative of the Association of Professional Engineers in a letter headlined “Nice Airport, but we could have done it”. If my memory serves me right, the Association of Professional Engineers, as a member of the Joint Consultative Council for the Construction Industry (JCC), strongly protested the by-passing of the local consultants in the appointment of a foreign firm for the design and project management of the recently constructed Piarco Airport terminal. The author observed that little in the design could not have been done by our local and registered consultants, but sought on behalf of the engineers to express that “the association congratulates all members who worked to make the project a success”.

138
Caribbean Construction Industry Study, 2002
There are various field of engineering expertise which the prime consultants will have had to co-ordinate after preparation and confirmation of the construction brief with the clients (Airport Authority) for the upgrading of the Piarco air terminal, highway, drainage, environmental, mechanical/electrical, structural amongst others. Presumably the local professional engineers were called in to participate. It is expected we shall have our commissioning and teething problems, which will manifest themselves in the function, operation and maintenance of the facility. I have not had the pleasure of “inspecting” the new facility, but I was firstly surprised the initial “brief” fell so short that half-way through the construction phase, it became necessary to provide a mezzanine upper level for an increase in floor space. This is after the homework, research, briefing and approval of design were done by the Airports Authority. Structurally the design is indeed simple “post and beam, shed-type, steel-framed building”, and I offer no comment on the extent of roof, except for the idea of a glazed-dome and the likelihood of the heat to be generated in the area below. This was a problem in the cathedral in Brazilia, but which the Greeks overcame with the use of white marble slabs for the introduction of light. It was employed by the gold medallist Professor Tange in his work in Tokyo in the 1960s. I wish ourselves, the building industry, good luck. Peter Bynoe, Registered/Chartered Consulting Architect, Maraval (Peter Bynoe was the Government’s chief architect in the Ministry of Works which was responsible for the design, construction and commissioning of the Piarco Airport, 1959-62)

139
Caribbean Construction Industry Study, 2002
APPENDIX IV Lead article from the Trinidad Business Guardian, September 2001

140
Caribbean Construction Industry Study, 2002
OVER-PRICED AND OVERDUE
$1.4 billion Piarco terminal open two years behind schedule by Sherry Ann Singh, Guardian Business Desk, TRINIDAD and Tobago's most expensive and controversial structure - the
new Piareo terminal project - officially opens tomorrow, with the minister currently in charge of it declaring it comparable to the world's best.
A lavish ceremony coinciding with Prime Minister Basdeo Panday's 68th birthday has been planned and transport Minister Jearlene John believes there is every reason to celebrate.
John says someone coming from the United States' Kennedy International or England's Gatwick airport will meet the game or similar facilities when they come into Trinidad and Tobago.
"It (Piarco International) can compare with anything in the world. There is really no divergence of quality,' John said in an interview following the sitting of the Senate on Tuesday.
She feels there can be no disputing that the population of Trinidad and Tobago was getting “good value for money" in the new airport.
At $1.4 billion, the airport project will cost tax-payers nearly $700 million more than originally budgeted. And it is opening more than two years later than originally scheduled.
In August last year, Peter Cateau, the project coordinator of the Airports Development Project, estimated that the cost of the project then was in excess of $1.1 billion:
• The total construction cost of the new terminal was $769 million. • Speciality equipment - including luggage scanners and high-tech
security equipment - was expected to cost $183 million. • The two main consultants on the project - Birk Hillman and Nipdec -
collected $121 million and $30 million respectively. The former Airports Authority chairman Ameer Edoo, in 1997, estimated that
the terminal project, including consultancy fees, would cost $758 million. The project was originally due to start in March 1997 and be completed in
March 1999. Cateau explained that the increased cost was the result of additional work
on the project, including an additional floor, extended car parking facilities and a connecting road between the old and new terminals.
Government has already raised close to $1.4 billion in five separate bond/loan issues to finance the airport project. And there were indications yesterday that the project will require additional funding.
The bonds, listed below, were given unconditional government guarantees: • The Airports Authority (AA) raised $300 million, 20-year bond issue in
1998. • In 1999, the Authority (AA) raised $300 million at a fixed rate of 11.50
per cent on a 20-year syndicated loan. • In 1999, the Authority raised US$30 million (TT$189 million).

141
Caribbean Construction Industry Study, 2002
• In 2000, AA raised $239 million at 11.65 per cent fixed rate due 2020. These four bonds, which total $1.028 billion are itemised on page 410 of the 2001 Estimates of Income and Expenditure of Statutory Boards and similar bodies.
• In October last year, the Authority raised an additional $379.3 million in three tranches.
Capital market sources said yesterday that the Authority intends to come
back to the market for an additional $50 million. The new airport will boast 14 loading bridges that will allow passengers to
exit or enter planes through air conditioned tunnels. These bridges are also conduits for water, power and air-conditioning removing the need for service trucks.
The terminal will have approximately 45,000 square metres of usable space. There will be 84 ticket stations in the passenger concourse at which there will be X-ray machines to examine luggage.
Departing passengers will have a choice of 24 immigration points, 12 customs positions and two exclusively for agricultural imports, equipped with X- rays.
John says the new facility is expected to triple its throughput to three million passengers a year, up from the current figure of one million.
And it will finally enable Trinidad and Tobago to become the gateway to the Americas.
"We have been bandying that about for a long time but that can now become a reality because we actually have the facility for the hub and spoke that Conrad Aleong (BWIA Chief Executive) speaks so passionately about,” John said.
It will be another month again before the new airport becomes fully operational, but when it does it will bring to a close one of the longest and most turbulent ventures in the country's history.
The construction of the new airport has been embroiled in controversy, since its inception over eight years ago under the PNM administration.
Tendering for Project Pride (Piarco Rainbow International Development) opened in 1992 but the project was delayed when a dispute erupted over the selection of Pegasus Associates Inc of Texas as preferred bidder. Former Prime Minister Patrick Manning appointed retired High Court Judge George Collymore to investigate claims of impropriety made against the Airports Authority.
But the tempo only picked up when the UNC came into government. They first axed, then decided to resume the project with a new tendering procedure. Local contractors made allegations of breach of procedures against the Airports Authority and calls for the disqualification of lsh Galbaransingh, whose NYC consortium was awarded three of the nine packages, on grounds of conflict of interest.
A Cabinet-appointed team, under retired Judge Lennox Deyalsingh set up to probe the allegations reported that the award of a $237million contract to the NYC consortium and the $102 million contract to consultants Birk Hillman was
142
Caribbean Construction Industry Study, 2002
flaw and ordered they be scrapped. NYC was contracted for the construction of the airport terminal and Birk Hillman to design, manage and commission the facilities. The report found a measure of collusion between Galbaransingh and Birk Hillman. Galbaransingh, the central figure in the NYC consortium, was a member of the taskforce that recommended that Birk Hillman, a Florida-based firm of aviation managers and architects, be the lead consultants of the project.
The report said Galbaransingh's conduct was 'unethical' and constituted a “gross impropriety" and that he should have declared his interest and taken no part in the selection process.
The committee concluded that the NYC consortium should not have been top-ranked for the terminal building package because even allowing for the widest reasonable degree of subjectivity the ranking of NYC as number one was unfair.
Galbaransingh challenged the ruling and on July 31 1997 Justice Margot Warner ruled that the report of the Deyalsingh Committee failed to observe the requirements of procedural fairness. Galbaransingh's original contract of $207 million was later scaled down to $150 million in a secret signing ceremony with NIPDEC the following year.
John refused to comment on the airport’s controversial history saying only that “My mandate was to bring closure to this really fantastic project. Mr Baksh (former Works and Transport Minister, Sadiq Baksh) did an excellent job of it.”
As for claims that construction cost's per metre at the airport were higher than on other projects, John said she had no knowledge of what was being compared. “One does not know if one is comparing apples with apples. I'm not a civil engineer so l will have to see the basis before I can comment.”

143
Caribbean Construction Industry Study, 2002
FINANCIAL GIANTS SQUEEZE CONTRACTORS By Laura Dowrich Higher learning.- A view of the National Library from the belfry of Trinity Cathedral, Port-of-Spain. General contractors believe they are being squeezed out of Government projects like the Library, whose construction is managed by Fincor, a financial firm. (The Trinidad Guardian - Monday, January 21, 2002) General contractors believe their skills and expertise are under threat due to the increasing involvement of project and construction management companies in building projects. They accuse major financial institutions, such as Republic Bank and Guardian Holdings which operate these organisations of not using general contractors to their fullest capacity on projects, namely Government owned. In an interview on Tuesday, Winston Riley, president of the Joint Consultative Council said general contractors are being squeezed out, as their abilities to expand and operate efficiently are affected. Emile Elias, former president of the Trinidad and Tobago Contractors Association agreed. "What he (Riley) was saying, is that as a number of Insurance and financial institutions such as RGM get involved in the planning and execution of building projects, they have not been using general contractors in the fullest sense." "They have tended to break up the projects into smaller packages," he said. RGM is a firm formed by the banking and insurance consortium, Royal Bank, Guardian Life and Barbados Mutual. Elias explained that general contractors normally manage an entire project. He said if a project and construction management company becomes involved, it would not tender the project to general contractors, but break up the project and hire various contractors for each portion. He said contractors suffer because they are not allowed to hone their skills by managing an entire project. Dave Aqui, managing director of Jusamco and former president of the TTCA, said if a general contractor is not allowed to bid and tender, he would end up becoming a specialised type of contractor in order to survive. “His other resources would be left idle, he ends up losing in terms of technical capability. We will see a loss of multi-skilling, which is not good for the industry," he said. Elias also warned that contractors could be affected if they have to go into the wider Caribbean to tender for projects as many of them do.

144
Caribbean Construction Industry Study, 2002
"They will need to show on their CV's, projects to show where they have the experience. If they don't, they can't prequalify to tender," he said. Shymdeo Gosine, managing director of Doc's Engineering Group of Companies, said it was his experience. He said in order to bid for an Inter American Development Bank loan project in Guyana he was forced to join forces with a couple of contractors to show his company's strength. Gosine questioned the use of project and construction management companies, stating “we already have State agencies Nipdec and the Central Tenders Board. He also said that since project management companies are not liable to anyone, they can throw out tenders and hire whomever they please. Stating that project and construction management companies have their reputations to protect, Ashram Beharry, managing director of Guardian Properties, dismissed Gosine’s claims. He said both systems: using a project management company or a general contractor have advantages and disadvantages. The use of either one, he said, depends on the client and the project involved. Using the analogy of building a house, he said one can either use a contractor or, for a fee, an expert who can co-ordinate the timing of activities and ensure quality control. "A project manager is really doing his work when he looks at projects and allocates sub-elements," he said. RGM's managing director Laurence Bouillet is out the country and attempts to reach officials at Fincor, a Republic Bank subsidiary, were unsuccessful.

145
Caribbean Construction Industry Study, 2002
APPENDIX V Newspaper Articles Suggesting Impropriety in Award of Contracts
146
Caribbean Construction Industry Study, 2002
FRAUD! By Newsday Reporters, Wednesday November 28, 2001
The Robert Lindquist forensic interim report into the award of contracts for the $1.426 billion Piarco airport development project has found that the project was a fraud on the public of Trinidad and Tobago, and a clear abuse of public funds. The report, extracts of which were obtained by Newsday yesterday, said its findings were consistent with a conspiracy to corrupt the contract selection process beginning in 1996 and carried on throughout the contracting period.
Lindquist said that the ranking of Northern Construction as the top contractor for the construction of Package 6, the selection of Northern for a new contract following the suspension of Construction Package 6, as well as the selection of Northern following the bid process on two other contracts were all the result of an original conspiracy to corrupt the contract selection process for the benefit of Northern.
Newsday understands that the Lindquist report has been in the hands of Prime Minister Basdeo Panday since early December 2000, but no follow-up action was taken which would have enabled the investigation to continue leading to charges against a number of people.
The Lindquist report stated that there was a conspiracy to "corrupt the contract selection process for the unjust enrichment of the 'players' and of defrauding the various state agencies of considerable sums."
It stated in part: "From all information received and from the examination of available records and documents, we have reasonable grounds to believe that fraudulent schemes were developed and promoted by the various parties throughout the entire contracting period."
It listed 11 schemes which were uncovered as (1) price fixing and bid rigging, (2) duplicate contract payments, (3) false invoicing, (4) defective pricing, (5) co-mingling of contracts, (6) conflict of interest, (7) false representation, (8) improper release of confidential information, (9) product substitutes, (10) tailored specifications, (11) time limitations.
It stated that a group of individuals and companies conspired together to control the award of contracts on the airport project, and in one instance, two days before a contract was to be awarded the requirements were changed and only two companies of which Northern Construction was one could meet the requirements on time. The project which began with six contracts, was expanded to 13 contracts and questions have arisen as to whether there was duplication in the contracts leading to the work being paid for twice.
According to Lindquist: "About two months before the pre-qualification request was issued by the Airports Authority of Trinidad and Tobago in December 1996, arrangements were made to form a "group" of individuals and companies that would receive the majority of contracts to be awarded when the project got underway. To facilitate this arrangement a temporary office was set up in Miami, Florida, where invited persons could meet. Exchanges of

147
Caribbean Construction Industry Study, 2002
correspondence were apparently made using the fax equipment of (the contractors) Birk Hillman."
The Lindquist report raised questions about links between a number of other companies, including what was described as a "ghost" company, which first came to light in September, 2000, when Opposition MP Dr Keith Rowley asked for information about payment of a $TT 10 million to a company called Overseas Communication Investment.
On September 14, 2000, NIPDEC (to whom Government handed the project after Justice Deyalsingh's enquiry had revealed evidence of collusion in the first set of contract awards) published an advertisement denying any payment to OCI. Lindquist investigations found that Overseas Communications Investments is owned 100 percent by the Birk and Hillman families. Its address has been given as 101 Madeira Avenue, Coral Gables, Florida. It has no employees, the role of its officers/directors is handled by a registration officer, (one Javier Yanes who is described as a private investigator); that it has no phone line; that it is not fully operating, and that it was incorporated just prior to the start of the airport project. To date the Government has not responded to Dr Rowley's questions with respect to the payment to this company of $10M TT before work on the airport project even started, or to what kind of work was carried out by this company. Dr Rowley's questions on the OCI have received no reply either from the then Minister, Sadiq Baksh, from current minister Jearlean John, or from Prime Minister Basdeo Panday. Both NIPDEC and Birk Hillman published advertisements denying any payments to OCI.
After Rowley's questions, the Government agreed to retain the services of Robert Lindquist Forensic Partners to investigate the project with the assistance of the Anti-Corruption Squad headed by Deputy Commissioner of Police, John Grant, with Karl Hudson-Phillips, QC, as Special Counsel to the Squad.
Lindquist is a Canadian forensic accountant who investigated allegations of corruption against John O'Halloran and Francis Prevatt under the PNM government. The matter ended up in court both in Canada and the USA, and resulted in Trinidad and Tobago being paid millions of dollars in damages under the NAR Government.
148
Caribbean Construction Industry Study, 2002
LAVALIN’S UNSETTLING SETTLEMENT By Camini Marajh – Sunday Express, September 2, 2001 ANXIOUS to land a piece of Petrotrin's lucrative US$360 million refinery
upgrade contract and mindful of the IDB's preference to go with the lowest bidder, several contractors, including construction giants Wimpey and SNC Lavalin underbid on several work packages.
The two contractors won major work packages, beating rival bidders by a comfortable margin on prices substantially lower than even Petrotrin's own calculations. But they would later slap the State-owned corporation with a battery of US million dollar claims, some more than double the actual value of the original contracts.
The Sunday Express learned that SNC Lavalin, a French Canadian company which won the US$45.8 million Package C and three, five and six of the E Package of works, together with a minor work package, known as Boiler 18, priced at US$3.5 million, had a team of claim consultants ensconced at the Hilton Hotel even before the July 1994 contract kicked in.
Lavalin, closely associated with Ramkarran Baboolal's United Engineering Services Ltd. (UESL), hit Petrotrin with a US$48 million claim, a variation of 104.8 per cent on the C Package of works and another US$10.5 million on the E and B-18 Packages, a variation of 296.5 per cent.
Wimpey, which bid US$88.2 million on Package B, US$11.5 million less than Petrotrin's own estimate and US$16.2 million cheaper than Techint, the next lowest bidder, would later make several claims, varying from the low end of US$107.5 million to a high of US$117.7 million. The engineering, procurement and construction contract, signed off on November 1, 1993, comprised three components:
• a new sulphur recovery unit • a new hydrogen plant • a revamp of the Number 2 hydrotreater unit Within months, Wimpey was making cost overrun demands on the ground
that the job was substantially different from the scope of work originally anticipated. Petrotrin counter-claimed, seeking liquidated damages for Wimpey's failure to meet its contractual obligations. By January 1995, the two were locked in settlement talks.
Wimpey made an initial offer of US$107.5m. Petrotrin made a US$100.2m counter offer. The figures shifted a notch up by June 1995 but with both sides hanging tough and the risk of full-blown arbitration looming round the corner, Petrotrin went out and hired itself a claims specialist, Hill International Inc.
Hill supported the State company's contractual position but several rounds of talk later, Wimpey's claim had climbed to US$117.7m. Wimpey blamed Petrotrin for a 311 day delay, citing among other things, the August/September 1995 strike, an inaccurate analysis by Foster Wheeler and changed work conditions.
Efforts to broker a negotiated settlement stalled after four rounds of talks. Mediator Randall W. Wulff settled the dispute on February 18, 1996, awarding Wimpey a lump contract sum of US$113,458,000.

149
Caribbean Construction Industry Study, 2002
But Petrotrin's senior counsel, Dr Fenton Ramsahoye, was sharply critical of the final settlement. He felt Petrotrin could have received much more if it had pursued its claims for liquidated damages.
“Wimpey's claims were in my opinion wrongly settled to the disadvantage of Petrotrin which had a strong case in every area of dispute and was entitled to liquidated damages which would have offset part of the claims by Wimpey,” he said, in a July 19,1996 opinion.
Ramsahoye took the company's management, led by Keith Awong, to task for capitulating to Wimpey and for compromising its position in an October 5, 1995 letter which made Wimpey a US$105 million settlement offer without making clear that the offer was 'without prejudice'.
The arbitrator used the US$105 million offer as a base figure in calculating a final settlement, US$7 million more than Petrotrin's experts had valued the claim. The October 5 letter was handled by Petrotrin's legal department, then headed by Hedwige Bereaux.
Lavalin slapped Petrotrin with a claim for 144 Project Change Notices (PCNS) on Package C and 140 PCNs on the E Packages, claiming among other things, the 1995 strike; changed work specifications, inadequate design drawings and records, additional site surveys and engineering revisions.
Lavalin revised its claim several times, from an August/October 1996 demand of US$51.2 million, inclusive of interest to US$29.5 million by August 10, 1998 and a still lower figure of US$18 million later on.
The claims were bogged down first by a boardroom dispute over the hiring of British law firm Davies Arnold Cooper, the leak of insider information to Lavalin's team during negotiations on the E Packages and later by what some directors described as the private meetings and exchange of correspondence between then Energy Minister and project manager on the refinery upgrade, Finbar Gangar and Lavalin's man on the Petrotrin project, Alexander Mc Arthur.
Mc Arthur later became involved in another controversial Petrotrin-issued contract Adventurer III, to Onyx Resources Trinidad Inc. Zalil Shamshudeen, one of several lawyers retained by Lavalin to handle the refinery dispute and Baboolal are also associated with Onyx. UESL, a former employer of the ex-minister was a major subcontractor of Lavalin and provided office space for the French Canadian firm at its Pt Lisas base.
Gangar yesterday denied suggestions that he was involved in private mediation talks with Mc Arthur during his tenure as Minister. He said he may have met with him but in no way sought to influence the outcome of the negotiations.
“Numerous attempts were made to broker a settlement but all failed," he said, admitting that “considerable pressure was brought to bear on finding a solution including attempts at a Canadian-Governmental level."
He said Lavalin subsequently amended their claims downwards but “we could not agree on a way forward. They were saying they were entitled to recover costs. My position as Energy Minister and as former project manager is that they were only entitled to their contractual price”.

150
Caribbean Construction Industry Study, 2002
Stalemated and with legal costs mounting, Gangar said he instructed Petrotrin to make a final call, the bank offer of US$11 million to Lavalin. But Petrotrin insiders tell a different version of events, one that has Gangar pushing the board towards a US$18 million settlement, plus expenses.
Petrotrin insiders reported Gangar meeting with directors at key points during the long drawn-out negotiations and all but instructing them to reach a settlement.
Gangar, however, insists there were no private meetings or instructions to the board to go in at US$18 million.
He described as “preposterous and ridiculous” suggestions contained in the Integrated Security Systems (ISS) forensic report that he used UESL and Lavalin “to channel funds from which he received some financial benefit”.
“SNC Lavalin underbid the job, lost millions of US dollars. They tried to recover US$51 million. They had to settle for US$8.6 million plus interest. Not only is the allegation preposterous but it cannot stand scrutiny because there is no money to be had."
He countered that: “It also stands to reason that if the main contractor loses money on a job, his subcontractor would also lose money. I have no special relationship with SNC Lavalin. In fact, the relationship with SNC Lavalin was more acrimonious than any of the others because of their aggressive commercial posture."
As for the principals of UESL, Gangar said he knew them long before the refinery upgrade. And UESL's relationship with Lavalin? The ex-minister said: "That is UESL's private business. I don't have the details."
He said suggestions of a kickback on the refinery upgrade were simply out of place. “There was no money to kickback," said Gangar, "SNC Lavalin lost their shirt on this project.”
Dropping his own bombshell amidst reports that Lavalin played hardball, refusing to pay local contractors until the final settlement, Gangar said: “Covert attempts were made to influence my judgment in the final settlement with SNC Lavalin but I was unwavering.”
He declined to give details. The US$10.5 million Lavalin settlement was brokered in December 1999.

151
Caribbean Construction Industry Study, 2002
US$200M TRINMAR PLAN A FARCE – OWTU By Geisha Knowlessar, Sunday Guardian, August 26, 2001 THE OILFIELDS Workers'Trade Union (OWTU) has fired a salvo at the
Petrotrin Board, charging that plans to reactivate Trinmar's South West Soldado field to the sum of US$200 million are "Preposterous" and could be done at a fraction of this cost.
Ancil Roget, president of the Trinmar branch of the OWTU yesterday described Petrotrin's proposal as "simply ludicrous." The OWTU counters with the claim that the field can be re-activated for about 25 per cent of this sum.
“We are demanding that the union's proposal (of US$50 million) be given consideration before a joint venture partnership is set up, because it will not only reduce the company's expenditure, but in the long run, it will cost the country much less," Roget said.
Acting on the instruction of Energy Minister Lindsay Gillette, Petrotrin put the SW Soldado contract out for re-tender, as advertised in the press last week.
The new round of bids begins at a time when the Fraud Squad probes corruption allegations on the first award to an American firm, FW Oil Interests.
Attorney General Ramesh Lawrence Maharaj had put Petrotrin's initial attempts to re-tender on hold, pending the outcome of the Solicitor General's review of claims made by the preferred bidder.
Trinmar had pulled out of the contract amidst claims of bid-rigging on the deal, which has been investigated by British forensic experts Integrated Security System (ISS).
The ISS report had been the centre of a three-way tug-of-war between Gillette, Maharaj and Prime Minister Basdeo Panday. Roget, however, stated that corruption and nepotism was 'still the order of the day' Trinmar.
"Certain consultants," he claimed, were making recommendations for requirements that only their contractors could satisfy.
"Consultants are supposed to be independent, but instead, there is a direct connection between particular consultants and contractors, enabling (those contractors) and no other to secure the job.”
The OWTU plans to talk out against the “massive corruption which continues to plague our State enterprises,” he added.
Trinmar workers continued to mount weekly protests over the issue, the last of which took place last Thursday. Roget said workers were updated on “various strategies" the OWTU would undertake to "save the company," including participating in the “Independence March” this Wednesday.
"Our aim is not to affect the production, but we are going to make a statement about the massive corruption which continues to plague our various State enterprises.
“The Government must immediately address these issues, and if that does not succeed, then we will further intensify our struggle, and at that point, we will not be able to guarantee current or increased production levels taking place,” he said.

152
Caribbean Construction Industry Study, 2002
SPANCRETE TAKES UDECOTT TO COURT; Charges unfair contract award on Government's Interchange Project:
Newsday reporters, Thursday 29 November 2001 Implementation Minister John Humphrey was adamant that Pres-T-Con be
granted, in breach of the tendering procedures, the contract for the construction of the Interchange Project.
This was revealed in an affidavit filed in the PoS Court on October 26, by Michael Jay Williams, company director of Spancrete Caribbean Limited. SCL has taken UDeCOTT to court charging that its decision to award the contract to Pres-T-Con was unfair, discriminatory, illegal and unreasonable. Pres-T-Con initially secured the contract even though its bid was TT $83.8 million, while SCL's bid was $47.5 million. SCL's bid was in keeping with the engineers' estimate.
Williams stated that by letter dated February 13, 2001, Humphrey instructed the Chairman of UDeCOTT that a design/build contract for the Interchange be awarded "without delay" to Pres-T-Con "on condition that items of the project be negotiated using the engineers' estimate as a starting point in the negotiations". Williams said he believed that up to the time of the deadlines for the first and second tender, SCL was the only company to submit a bid for the project. At the time of the first tender, Williams stated, Richard Samlal, marketing manager, (who delivered it ten minutes before the deadline told him that at the time the Tenders Box was opened, he could see inside of it and there was no other tender. Samlal waited until seven minutes after the deadline had passed and no persons entered UDeCOTT offices.
WIlliams stated that UDeCOTT had received a tender from Pres-T-Con dated September 14, 1999, some 13 months before the first invitation to Tender was directed to the SCL.
Williams said that after he expressed concerns about the project, Humphrey agreed to meet with him. At the meeting which took place on February 19, Humphrey told him that he had worked with John Woods, owner of Pres-T-Con, over a period of time, that he had known Woods for many years and that they used to socialise together.
Williams stated that Humphrey stated that Pres-T-Con was selected on a sole selective tender bias because it was to be fast tracked. "He drew reference to the procedure used at the airport where there was no tender, but prices were negotiated against the engineers' estimate," Williams said.
"Several times during the meeting I noticed that Minister Humphrey berated UDeCOTT for not performing as he had directed," he said. Wiliams said the next day Humphrey visited SCL plant together with several consultants. "But this time he was a bit more emphatic that the contract in question 'was a done deal'. He further stated...'You can build another overpass (on the Churchill Roosevelt Highway) as a sole selective tenderer and UDeCOTT can be instructed to commence negotiations with you immediately'. I restated our position as politely as possible that 'if other firms are capable of executing the work too, we need not have a sole selective tender'. Also in jest I said 'if another

153
Caribbean Construction Industry Study, 2002
Minister in the future were to by-pass us on a project, I would have no grounds on which to complain”, Williams stated.
He said thereafter attorneys at law for SCL by letter dated February 22, 2001, called upon UDeCOTT to indicate which tender was the most favourable and threatened legal action if the contract was awarded to Pres-T-Con. Thereafter, for some reason or other unknown to me, the project was transferred on February 21/22 from Minister Humphrey's portfolio to that of Minister Carlos John, who was at the time Minister of Infrastructure".
This issue was referred to by PNM candidate Dr Keith Rowley at a meeting in St Madeleine. Rowley at the time criticised Humphrey for flagrantly disregarding the bidding process and tendering regulations.
Noting that Humphrey had no authority to instruct UDeCOTT to give a contract to the higher bidder, Pres-T-Con, Rowley said Humphrey compounded the error by offering an untendered project to SCL as an inducement to forego its claim to be treated fairly.
He said now that SCL had sued UDeCOTT, State funds were being used, as in the CCN case, to pay for a defence after politicians overstepped their limits.

154
Caribbean Construction Industry Study, 2002
APPENDIX VI Cover Letter and Questionnaires used for the Survey Cover letter Consultant’s Questionnaire, Contractors’ Questionnaire Clients’ Questionnaire NOTE: Each of these basic Questionnaires has been modified to include the summarised responses to each question as given by the relevant group in the survey.

155
Caribbean Construction Industry Study, 2002
COUNCIL OF
CARIBBEAN
ENGINEERING
ORGANISATIONS
SECRETARY GENERAL: Eng. Dr. Clément Imbert TEL: (868) 662-6267 (W) Engineering Institute, Faculty of Engineering FAX: (868) 662-4414 (W) The University of the West Indies Email: [email protected]
St. Augustine, Trinidad and Tobago TEL: (868) 662 7338 (H) Dear Colleague,
Re: CARICOM Construction Industry Study The Council of Caribbean Engineering Organisations (CCEO) is conducting a study of the construction industry in CARICOM, in order to establish whether the firms in the industry are competitive against one another and against firms from outside the region for major construction projects. In order to do this we need to establish a database of the industry’s resources and capabilities, and to survey the opinions of leaders in the industry regionally, and we are doing this by means of a structured questionnaire. We will also be arranging seminars throughout the region to capture further information and to provide feedback on our findings. Over the past decade or so, a number of major trade blocs have been established in different parts of the world. In recent years, this process has continued with barriers being lowered or removed from trade between countries internationally. These trends, referred to as liberalisation and globalisation, can have serious adverse consequences for those not involved or prepared for them. Small states are particularly vulnerable because of diseconomies of scale, limitations of resources and industrial rationalisation. In order to address some of these problems there is a move towards creating a free trade bloc as the CARICOM Single Market and Economy (CSME). This involves removal of many of the restrictions on the movement of individuals and of tariffs on trade. In addition to this intra-regional restructuring are measures that are required to enhance competitiveness extra-regionally, particularly for key industries like construction. The results of the CARICOM Construction Industry Study will assist the CARICOM Regional Negotiating Machinery (RNM) in their deliberations and negotiations on trade in services in the construction industry, regionally and extra-regionally, in the context of the World Trade Organisation (WTO), the Free Trade Area of the Americas (FTAA) and other relevant treaties, agreements and protocols. We look forward to your support in this endeavour. Clément Imbert Secretary General CCEO
CONSTITUENT MEMBERS: Antigua Association of Professional Engineers Association of Professional Engineers of Trinidad & Tobago Bahamas Institution of Professional Engineers Barbados Association of Professional Engineers Belize Association of Technical Professionals Dominica Association of Technical Professionals Grenada Institution of Professional Engineers Guyana Association of Professional Engineers Jamaica Institution of Engineers St. Lucia Association of Professional Engineers St. Vincent Association of Professional Engineers St. Kitts-Nevis Association of Professional Engineers

156
Caribbean Construction Industry Study, 2002
COUNCIL OF
CARIBBEAN
ENGINEERING
ORGANISATIONS
SECRETARY GENERAL: Eng. Dr. Clement Imbert TEL: (868) 662-6267 (W) Engineering Institute, Faculty of Engineering FAX: (868) 662-4414 (W) The University of the West Indies Email: [email protected] St. Augustine, Trinidad and Tobago TEL: (868) 662 7338 (H)
CARICOM CONSTRUCTION INDUSTRY STUDY
CONSULTANTS’ QUESTIONNAIRE Showing Survey Responses
1.1 Name of the company (Optional) 1.2 Where is Company registered? Dominica 3 .St V 2 St L 12…T&T 14 Jam 9 Guy 8 Gren 1 =49 1.3 Main area of business (if more than one category: indicate approximate percentage in each): [31] Residential, [36] Commercial, [25] Industrial,
[30] Civil infrastructure, [15] Others(please specify)library
1.4 Area of operation: Local country, 47 (av 90% low 50%) CARICOM, 16 (av 10%) International 4 (1%) 1.5 Area of special expertise [23] Earthworks/foundations 49% [27] Structural 59% [22] Roads & Bridges 46% [11] A/C/Plumbing/Electrical 24% [18] Architectural 41% [9] Landscape 17% [8] Quantity Surveying 20% [18] Other Mech; Envir; Geotech2; Industry
CONSTITUENT MEMBERS: Antigua Association of Professional Engineers Association of Professional Engineers of Trinidad & Tobago Bahamas Institution of Professional Engineers Barbados Association of Professional Engineers Belize Association of Technical Professionals Dominica Association of Technical Professionals Grenada Institution of Professional Engineers Guyana Association of Professional Engineers Jamaica Institution of Engineers St. Lucia Association of Professional Engineers St. Vincent Association of Professional Engineers St. Kitts-Nevis Association of Professional Engineers

157
Caribbean Construction Industry Study, 2002
1.6 Does the firm undertake any contracting/building work in addition to its consulting services? (Tick one) No 37 Yes <10%
turnover 7 Yes 10-50%
turnover 2 Yes >50%
turnover 1
2.0 ORGANISATIONAL STRUCTURE AND OWNERSHIP 2.1 How is the firm structured? (Tick one) Line & Staff/Hierarchy 31 Project 11 Matrix 3 Divisional 2.2 Does the firm have any joint ventures or partnerships with other firms? No Yes – 1 Yes 1-5 Yes More than 5 Local Joint Ventures 16 12 6 1 Local Partners 17 5 2 Foreign Joint Ventures 14 10 6 Foreign Partners 17 2 1 1 2.3 Who owns the firm? Sole Proprietor
21 Private company
11 Partnership 3 Limited liability
13
3.1 No. of professional staff (qualified engineers, architects, surveyors etc): Permanent staff Temporary/Occasional employees [27] Less than 5 [37] Less than 5 [13] 5-10 [5] 5-10 [4] Over 10 [3] Over 10 3.2 No. of administrative staff (managers, accountants, secretarial etc): Permanent staff Temporary/Occasional employees [32] Less than 5 [27] Less than 5 [9] 5-10 [] 5-10 [1] Over 10 [1] Over 10 3.3 No. of technical staff (technicians, draughtsmen): Permanent staff Temporary/Occasional employees [19] Less than 5 [25] Less than 5 [13] 5-10 [2] 5-10 [2] Over 10 [1] Over 10

158
Caribbean Construction Industry Study, 2002
4.0 MATERIALS, PLANT AND EQUIPMENT 4.1 What IT related hardware and software does own and use: IT Hardware
Computers < 10
35 Computers > 10
7 Computers Networked
20 Plotter 23
IT Software
Project Management
26 Structural Analysis
18 CAD Software
36 Digital camera
1
Other Civil Software Estimating
6 3
Printers Digitiser
1 1
Geotech IT Found IT Hydraulic IT
1 Trucks 1
4.2 Do you think that the cost of keeping up-to-date in IT related hardware and software is too high for local consultants? Yes18 No26 Explain: All drawings Manual; It is just too expensive but if we want to be up to date we have no choice but to purchase just what we need. Also expensive in terms of equipment and training personnel. The cost is very high in TT$ when related to the level of fees; As long as local consultants invest in licensed software, updates are sometimes free or low priced. IT hardware and peripherals are not very expensive; Insufficient utilization to amortise capital cost between upgrades; Mark-Ups; Cost of soft ware, ink cartridges, paper; The cost of good software for engineering works is high, especially with regards to electrical work analysis, CAD, programmes etc; Some programmes offer much more than would be used and as such price is high for usable portion. Customs duty on programmes are too high. Should be the same 4% as computers; The planned obsolescence of software and hardware adds to the cost since use is often infrequent for some software; General high maintenance costs also high cost of frequent update; As a polocy we no not attempt to update immediately when new software is available. In the case of hardware, in adding new units, we look at current technology. 4.3 Are consultants too rigid in their specifications of materials (i.e. they don’t allow substitutions when the specified materials are not readily available and a suitable substitute is) Yes10 No34 Explain: Engineers dislike providing alternatives, neither do they wish to explore innovative solutions to architectural problems. Ministry of Works often blamed as reason for overdesign to ensure trouble free approvals; Most consultants allow suitable alternatives as long as the substitutes are of the same quality as the materials specified and could meet the specification set out for the original materials. Specifications usually allow the contractor to supply ‘equal’ or ‘equivalent’; This does not apply for the provision of services, such as electrical, plumbing and A/C works; Generally we are flexible and tend to utilize any locally available material; We are very flexible, but in order to do so one must be current. There are new and compatible products some from emerging industrialised countries that sometimes supersedes existing products 4.4 Are consultants too inflexible in their specifications of element dimensions and feature locations (for example, they demand a 1”x4” board when a 1”x6” board will do the job as well and is more easily available) Yes9 No35 Explain: Depends on which side of the fence one is on. There is little enough respect for architectural integrity to discourage contractor “innovation” in order to cut cost; Consultants could become inflexible in their specifications if substitutions or alternatives mean additional cost to their clients. Understandably so since professional design competence of contracting firms is generally low; Very often the contractor is allowed to determine, any item which is suitable for the job as long as it does not fall below specifications; There is inadequate exploratory dialogue between the professionals, and inadequate attention given to the team approach to design solutions; Non Sequitur – An Engineer specifies what he wishes to be used. It is not an arbitrary decision. It is based on performance; Depends on the individual and cost of the substitution
159
Caribbean Construction Industry Study, 2002
5.1 What is the firm’s capitalization?……… (US$76,267)( 50,000 shares @ $1.00) $1.65 m (TT$50,000) TT$100,000) (TT$ 4,000,000) US$50,000;( US$ 360,000) Ranges from TT$50,000 to TT$4 million; $100,000.00 $50,000.00. N/A $350,000. $160,000 Do not wish to disclose at this time $40,000.00; US$10,000; US$50,000; US$40,000; US$80,000; 4000 shares 5.2 Average annual turnover over the past five years: [14] Less than US$ 100,000 [25] US$ 100,000 – 500,000 [3] US$ 500,000 – 1m [2] US$ 1m – 5m [1] Over US$ 5m 5.3 What are the approximate financial ratios for the firm? Overheads to Turnover 100%, 1:2, 1:2; 15 to 33%; 15 to 33%; 60:40;1:1.07; 5%;60:40; 15%;1:1; 0.8; 1.2; 0.94; 1:5; 80%; 60 1:4 1:1.10 1;2.5 0.7 1:10; 0.4; 55% ; 1:10; 1:10; 1:02; 30% Debt to Total assets 1:1.82; 6%;no debt;15%;2:3; no debt; 0.2; 0.25; 0.1; 1:2; 40 to 60 %; 45 to 55 %; No Debt; 1:8; 60%; 50 1;2 1:50. 25% 0.6 0:1; 0.15; 25%; 1:02; 1:02 ; 1:10; 5.4 Do you think that the cost of Performance Bonds, insurances and other financial preliminaries are justified? Yes29 No13 Explain: The insurance premiums are too high; Consultants should not have to provide performance bonds; These are readily ascertainable costs that provide some level of protection to the client/owner; They are primitive, and do not reflect the mechanisms for problem solving in a small community in contract procedure; It provides some indication of Contractor's financial viability, a key concern for employers. 5.5 Are the levels of Liquidated Damages logical and justified? Yes 23 No21 Explain: This is usually a one-way street. It should go hand-in-hand with bonuses; They are really useless and almost impossible to achieve.; Consultants should not have liquidated damages in their contracts; Nowadays damages bear no relation to ascertainable loss that the owner may suffer due to delays in completion; Unsure; Generally liquidated damages are too small and not usually enforced; There are no standards established however. On most of the jobs we have operated, there seem to be a basis for the amounts; In any event the Law of the Land has to be upheld; Generally LD charges are set to reflect actual employer losses; Though not to be treated as a penalty in most cases it is too low 5.6 Do you think that contracts should include a ‘fluctuations’ provision to adjust the contract price according to changing economic conditions? Yes26 No11 Explain: Such a clause is applicable only for multi-year contracts; unless duration of construction is envisaged to exceed 3 years; If a ‘fluctuations’ clause is not there the contractor will be carrying a risk that he will price for based on his best guess at it. If his guess is wrong someone suffers. This is a risk that the client should properly carry. It is his project; In most instances, the duration of contracts are dictated by the contractors who are most times compensated for fluctuations. The consultants on the other hand are not always so fortunate in this regard and most times have to subsidise the cost of their inputs when faced with changing economic conditions during the life of a contract. A fluctuations provision is therefore a necessity
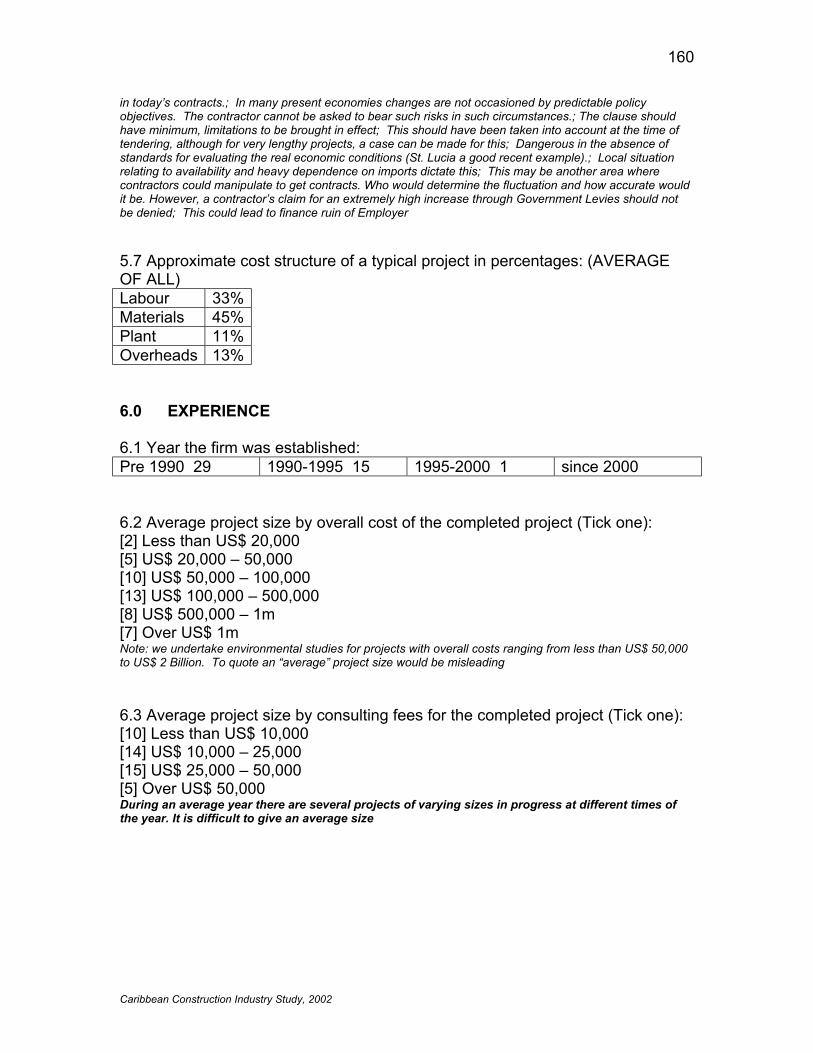
160
Caribbean Construction Industry Study, 2002
in today’s contracts.; In many present economies changes are not occasioned by predictable policy objectives. The contractor cannot be asked to bear such risks in such circumstances.; The clause should have minimum, limitations to be brought in effect; This should have been taken into account at the time of tendering, although for very lengthy projects, a case can be made for this; Dangerous in the absence of standards for evaluating the real economic conditions (St. Lucia a good recent example).; Local situation relating to availability and heavy dependence on imports dictate this; This may be another area where contractors could manipulate to get contracts. Who would determine the fluctuation and how accurate would it be. However, a contractor’s claim for an extremely high increase through Government Levies should not be denied; This could lead to finance ruin of Employer 5.7 Approximate cost structure of a typical project in percentages: (AVERAGE OF ALL) Labour 33% Materials 45% Plant 11% Overheads 13% 6.0 EXPERIENCE 6.1 Year the firm was established: Pre 1990 29 1990-1995 15 1995-2000 1 since 2000 6.2 Average project size by overall cost of the completed project (Tick one): [2] Less than US$ 20,000 [5] US$ 20,000 – 50,000 [10] US$ 50,000 – 100,000 [13] US$ 100,000 – 500,000 [8] US$ 500,000 – 1m [7] Over US$ 1m Note: we undertake environmental studies for projects with overall costs ranging from less than US$ 50,000 to US$ 2 Billion. To quote an “average” project size would be misleading 6.3 Average project size by consulting fees for the completed project (Tick one): [10] Less than US$ 10,000 [14] US$ 10,000 – 25,000 [15] US$ 25,000 – 50,000 [5] Over US$ 50,000 During an average year there are several projects of varying sizes in progress at different times of the year. It is difficult to give an average size

161
Caribbean Construction Industry Study, 2002
6.4 Largest project (by overall cost) that the firm has ever been the lead consultant on (Tick one): [4] Less than US$ 20,000 [3] US$ 20,000 – 50,000 [3] US$ 50,000 – 100,000 [3] US$ 100,000 – 500,000 [5] US$ 500,000 – 1m [26] Over US$ 1m 6.4a Largest project (by consulting fees) that the firm has ever been involved in (Tick one): [5] Less than US$ 20,000 [6] US$ 20,000 – 50,000 [3] US$ 50,000 – 100,000 [13] US$ 100,000 – 500,000 [7] US$ 500,000 – 1m [10] Over US$ 1m 6.5 Maximum number of projects the firm has been involved in at any one time. 1 1-5 20 5-10 15 More than 10 11 7.0 MAIN MARKETS 7.1a What were the firm’s main markets (by turnover) over the past 5 years Local 49
Av. 90% CARICOM 16
Av. 10% All Caribbean
1
International 3
7.1b And during last year alone? Local 48
Av. 95% CARICOM 8
Av. 8% All Caribbean 1 International 1
7.2 Has your firm ever bid for the design of an overseas project, and if ‘Yes’, where and how many? No. All local 27 Yes CARICOM 21 All Caribbean 1 International 3 Participation in proposals but not as lead consultants; Bidding through design competition – South Africa, Jamaica 7.3 Does your firm plan to bid for the design of overseas projects in the next year? No 18 Yes CARICOM 10 Yes All Caribbean 4 Yes International 2

162
Caribbean Construction Industry Study, 2002
8.0 OBSTACLES & OPPORTUNITIES If your firm has not bid or prequalified to bid to act as consultant on overseas jobs… 8.1 What has prevented your firm from prequalifying for overseas jobs? (Tick any that apply) Personnel 11
Finance 14 Access to project information 13
Knowledge Firm’s lack of experience 3
Other 10 size
Explain: Never been asked; We have been too busy in Trinidad to prepare bids; Not able to react swiftly. Need timely RFP advertisements in local media; No interest; Lack of opportunity 8.1a If personnel are a problem, what kind of skills are needed? (Tick any that apply) Engineers 10
Other professional 5 (QS)
Administrative 3
Technical/Draughting 10
Other
Explain: Insufficient no. of good engineers and technicians available to simultaneously provide the level of services required overseas and in the local market 8.2 What would help your firm to prequalify for overseas jobs? (Tick any that apply) Extra Personnel 12
Finance 14
Access to project information 24
Hardware/software 4
Extra qualifications among staff 6
Other 2
Explain: Association with local firms; Early access to RFP allows time to assemble adequate and qualified project personnel; Once we have knowledge that there is a project in the Caribbean for bid we would bid once the project is within our competence. The problem is that most of these projects are not advertised in the local newspaper; Once we have knowledge that there is a project in the Caribbean for bid we would bid once the project is within our competence. The problem is that most of these projects are not advertised in the local newspaper.; Need that finance to have additional Engineer/s employed to create the critical mass necessary 8.3 If your firm has prequalified and bid to act as consultant on overseas jobs, and been unsuccessful, what do you think the reason was? (Tick any that apply) Inadequate Personnel 4 Lack of Financial Support 4* Preference of Client for foreign firm 9 Inadequate Hardware/software 1 Firm’s Lack of Experience 6 Funding agency preference for Foreign firms 4 Preference for Local Firms 6 Price (and hence own costs) was too high 5 Other 4

163
Caribbean Construction Industry Study, 2002
Please also indicate which was the most important in your view; Preference for foreign firms. Invariably clients are impressed by the size and breath of experience of foreign firms even though the staff used is often third echelon; Another proposal considered better; There could be many reasons for not being successful and we can only guess at the reasons. Usually the reason for not being successful is that we were beaten by a firm with a better proposal; It would be difficult to say what the reason may be as we are not normally privy to evaluation reports prepared for the consultancy bids If your firm has not bid or prequalified to bid for local projects that have been tendered internationally… 8.4 What has prevented your firm from prequalifying or bidding on local jobs that have been tendered internationally? (Tick any that apply) Personnel 9
Finance 9
Access to project info. 10
Hardware/ software 1
Firm’s lack of experience 2
Other 10 Restrictions\ Procurement
Explain: Pre-selection of Consultants. The majority of proposals completed are done so with the perception that many consultants are used purely to satisfy the “tender” requirements and that “preferred” consultants have already been selected; We have prequalified and bid local jobs tendered internationally; VECL, like most other local consultants, may be considered to be lacking experience in major projects; With World Bank Funding, generally our firm has been too small; As service engineers we have not had to submit prequalification data; Points system favour firms with larger staff numbers and “last five (5) years” requirements in a market where jobs are few!!; Do not think we have the capacity to compete with the large international firms; Project not advertised by Donor /Client; Small size of firm; Not large enough to compete with international firms; I don't think there have been many such jobs for Architects, or perhaps I was not aware of them; These are normally done as joint ventures with foreign firms who who are normally the lead consultants because of size, human, and financial resource; The size of these projects are in excess of the capacity of the firm 8.4a If personnel are a problem, what kind of skills are needed? (Tick any that apply) Engineers 7
Other professional 4 (QS)
Administrative 3
Technical/Draughting 5
Other 2
Explain: Too few trained engineers and technicians available. The majority of the service engineers available have not had any training. There is hardly any programmes available for training food technicians beyond the academic level; Generally local professionals prefer to have one-man firms!!; Shortage of Engineers on the Island 8.5 What would help your firm to prequalify on local jobs that are to be tendered internationally? (Tick any that apply) Extra Personnel 19
Finance 8 Access to project info. 11
Equipment 1
Extra qualifications among staff 5
Other 2
Explain: Assurance that requests for prequalification are impartial; The above would render us more competitive; Clear cut rules of engagement which do not prejudice the small local firm are necessary. Au practices are geared to a 150,000 population base; Project information and staff to spare are virtually important along with finance in operating outside of the home country; The firm would have to expand it capacity in order to handle large value projects.
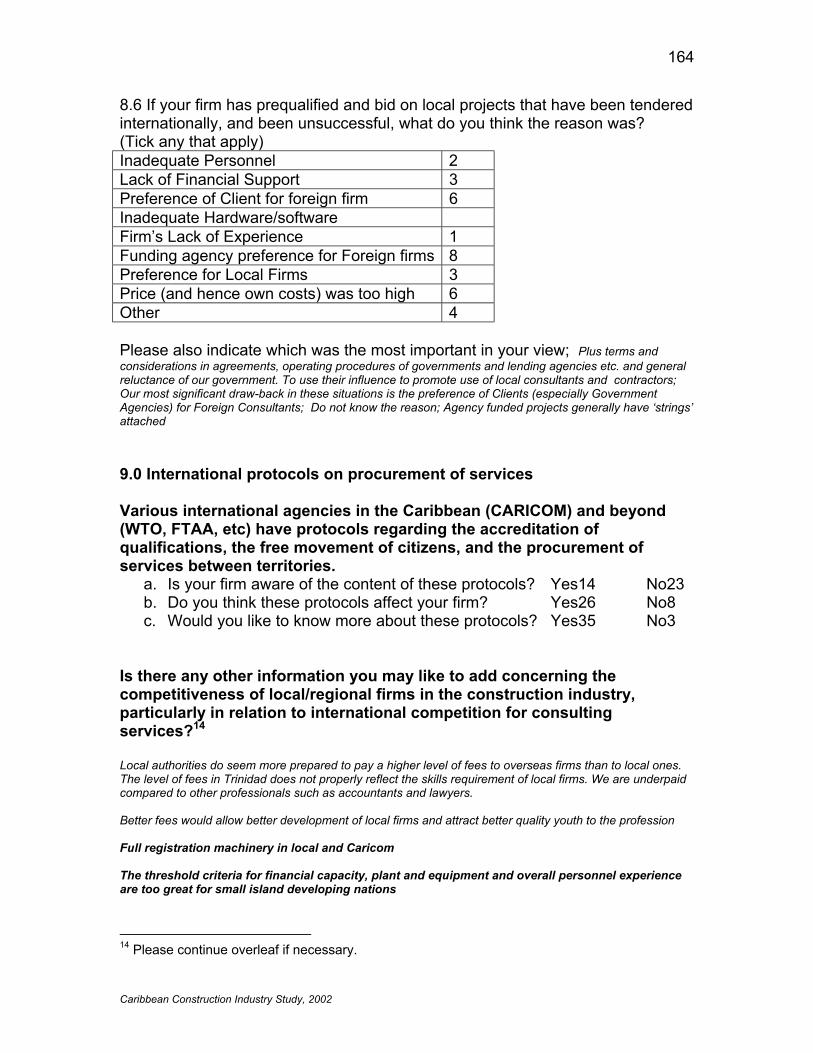
164
Caribbean Construction Industry Study, 2002
8.6 If your firm has prequalified and bid on local projects that have been tendered internationally, and been unsuccessful, what do you think the reason was? (Tick any that apply) Inadequate Personnel 2 Lack of Financial Support 3 Preference of Client for foreign firm 6 Inadequate Hardware/software Firm’s Lack of Experience 1 Funding agency preference for Foreign firms 8 Preference for Local Firms 3 Price (and hence own costs) was too high 6 Other 4 Please also indicate which was the most important in your view; Plus terms and considerations in agreements, operating procedures of governments and lending agencies etc. and general reluctance of our government. To use their influence to promote use of local consultants and contractors; Our most significant draw-back in these situations is the preference of Clients (especially Government Agencies) for Foreign Consultants; Do not know the reason; Agency funded projects generally have ‘strings’ attached 9.0 International protocols on procurement of services Various international agencies in the Caribbean (CARICOM) and beyond (WTO, FTAA, etc) have protocols regarding the accreditation of qualifications, the free movement of citizens, and the procurement of services between territories.
a. Is your firm aware of the content of these protocols? Yes14 No23 b. Do you think these protocols affect your firm? Yes26 No8 c. Would you like to know more about these protocols? Yes35 No3
Is there any other information you may like to add concerning the competitiveness of local/regional firms in the construction industry, particularly in relation to international competition for consulting services?14 Local authorities do seem more prepared to pay a higher level of fees to overseas firms than to local ones. The level of fees in Trinidad does not properly reflect the skills requirement of local firms. We are underpaid compared to other professionals such as accountants and lawyers. Better fees would allow better development of local firms and attract better quality youth to the profession Full registration machinery in local and Caricom The threshold criteria for financial capacity, plant and equipment and overall personnel experience are too great for small island developing nations
14 Please continue overleaf if necessary.
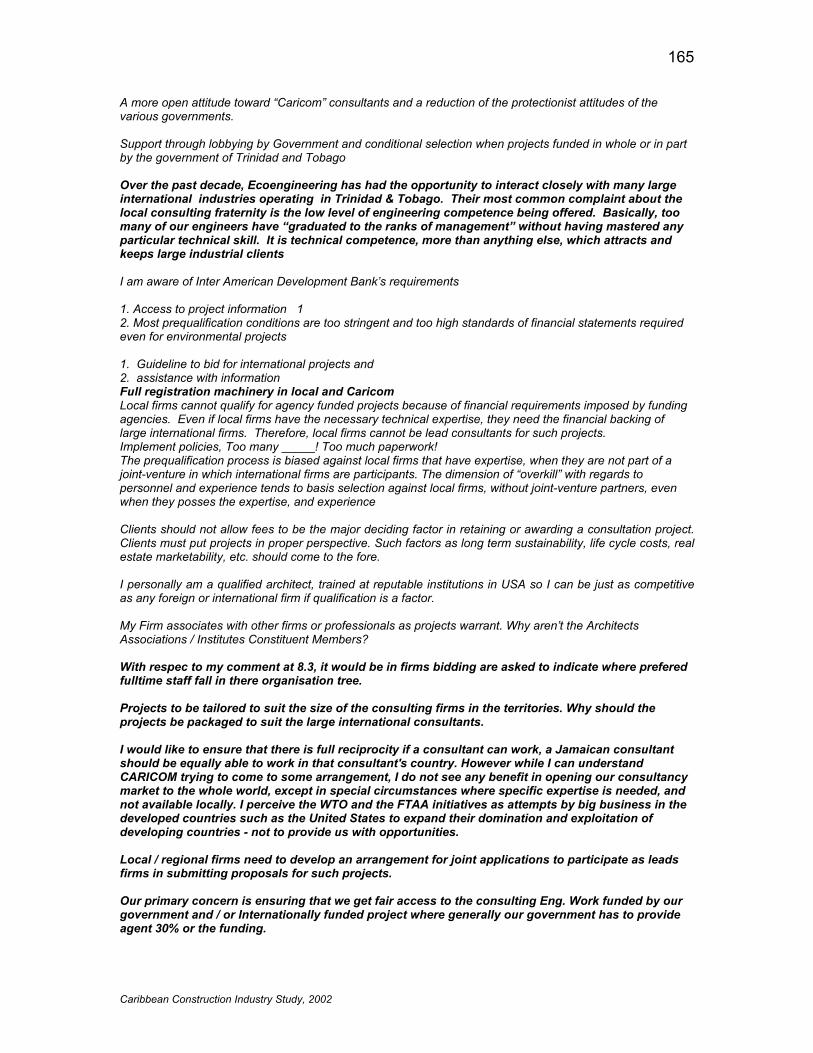
165
Caribbean Construction Industry Study, 2002
A more open attitude toward “Caricom” consultants and a reduction of the protectionist attitudes of the various governments. Support through lobbying by Government and conditional selection when projects funded in whole or in part by the government of Trinidad and Tobago Over the past decade, Ecoengineering has had the opportunity to interact closely with many large international industries operating in Trinidad & Tobago. Their most common complaint about the local consulting fraternity is the low level of engineering competence being offered. Basically, too many of our engineers have “graduated to the ranks of management” without having mastered any particular technical skill. It is technical competence, more than anything else, which attracts and keeps large industrial clients I am aware of Inter American Development Bank’s requirements 1. Access to project information 1 2. Most prequalification conditions are too stringent and too high standards of financial statements required even for environmental projects 1. Guideline to bid for international projects and 2. assistance with information Full registration machinery in local and Caricom Local firms cannot qualify for agency funded projects because of financial requirements imposed by funding agencies. Even if local firms have the necessary technical expertise, they need the financial backing of large international firms. Therefore, local firms cannot be lead consultants for such projects. Implement policies, Too many _____! Too much paperwork! The prequalification process is biased against local firms that have expertise, when they are not part of a joint-venture in which international firms are participants. The dimension of “overkill” with regards to personnel and experience tends to basis selection against local firms, without joint-venture partners, even when they posses the expertise, and experience Clients should not allow fees to be the major deciding factor in retaining or awarding a consultation project. Clients must put projects in proper perspective. Such factors as long term sustainability, life cycle costs, real estate marketability, etc. should come to the fore. I personally am a qualified architect, trained at reputable institutions in USA so I can be just as competitive as any foreign or international firm if qualification is a factor. My Firm associates with other firms or professionals as projects warrant. Why aren’t the Architects Associations / Institutes Constituent Members? With respec to my comment at 8.3, it would be in firms bidding are asked to indicate where prefered fulltime staff fall in there organisation tree. Projects to be tailored to suit the size of the consulting firms in the territories. Why should the projects be packaged to suit the large international consultants. I would like to ensure that there is full reciprocity if a consultant can work, a Jamaican consultant should be equally able to work in that consultant's country. However while I can understand CARICOM trying to come to some arrangement, I do not see any benefit in opening our consultancy market to the whole world, except in special circumstances where specific expertise is needed, and not available locally. I perceive the WTO and the FTAA initiatives as attempts by big business in the developed countries such as the United States to expand their domination and exploitation of developing countries - not to provide us with opportunities. Local / regional firms need to develop an arrangement for joint applications to participate as leads firms in submitting proposals for such projects. Our primary concern is ensuring that we get fair access to the consulting Eng. Work funded by our government and / or Internationally funded project where generally our government has to provide agent 30% or the funding.
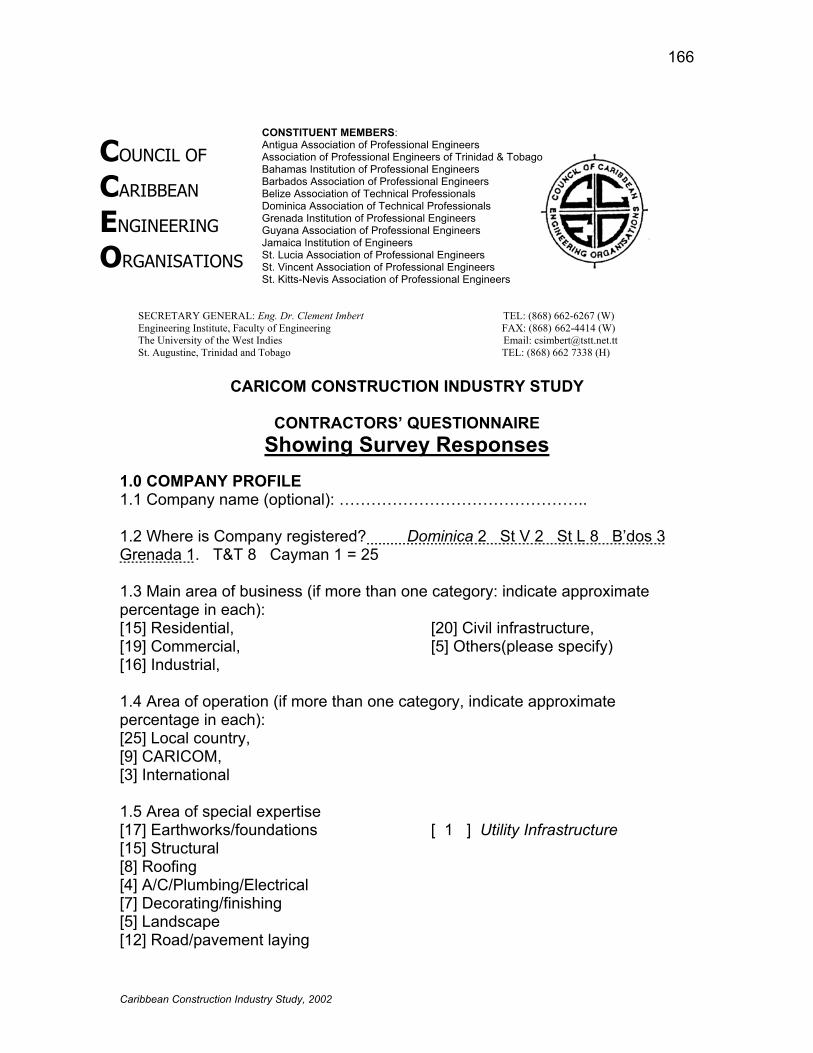
166
Caribbean Construction Industry Study, 2002
COUNCIL OF
CARIBBEAN
ENGINEERING
ORGANISATIONS
SECRETARY GENERAL: Eng. Dr. Clement Imbert TEL: (868) 662-6267 (W) Engineering Institute, Faculty of Engineering FAX: (868) 662-4414 (W) The University of the West Indies Email: [email protected] St. Augustine, Trinidad and Tobago TEL: (868) 662 7338 (H)
CARICOM CONSTRUCTION INDUSTRY STUDY
CONTRACTORS’ QUESTIONNAIRE Showing Survey Responses
1.0 COMPANY PROFILE 1.1 Company name (optional): ……………………………………….. 1.2 Where is Company registered? Dominica 2 St V 2 St L 8 B’dos 3 Grenada 1. T&T 8 Cayman 1 = 25 1.3 Main area of business (if more than one category: indicate approximate percentage in each): [15] Residential, [19] Commercial, [16] Industrial,
[20] Civil infrastructure, [5] Others(please specify)
1.4 Area of operation (if more than one category, indicate approximate percentage in each): [25] Local country, [9] CARICOM, [3] International 1.5 Area of special expertise [17] Earthworks/foundations [15] Structural [8] Roofing [4] A/C/Plumbing/Electrical [7] Decorating/finishing [5] Landscape [12] Road/pavement laying
[ 1 ] Utility Infrastructure
CONSTITUENT MEMBERS: Antigua Association of Professional Engineers Association of Professional Engineers of Trinidad & Tobago Bahamas Institution of Professional Engineers Barbados Association of Professional Engineers Belize Association of Technical Professionals Dominica Association of Technical Professionals Grenada Institution of Professional Engineers Guyana Association of Professional Engineers Jamaica Institution of Engineers St. Lucia Association of Professional Engineers St. Vincent Association of Professional Engineers St. Kitts-Nevis Association of Professional Engineers

167
Caribbean Construction Industry Study, 2002
2.0 ORGANISATIONAL STRUCTURE AND OWNERSHIP 2.1 How is the firm structured? (Tick one) Line & Staff/Hierarchy 21 Project 1 Matrix Divisional 2.2 Does the firm have any joint ventures or partnerships with other firms? No Yes – 1 Yes 1-5 Yes More than 5 Local Joint Ventures 13 2 1 Local Partners 12 3 Foreign Joint Ventures 14 2 Foreign Partners 12 We have none at the moment but we are in discussions on one local and one foreign 2.3 Who owns the firm? Sole Proprietor
5 Private company
6 Partnership 2 Limited liability
14
3.0 HUMAN RESOURCES If appropriate, give average numbers of employees over the past five years. 3.1 No. of professional staff (qualified engineers, architects, surveyors etc): Permanent staff Temporary/Occasional employees [9] Less than 5 [12] Less than 5 [6] 5-10 [] 5-10 [6] Over 10 [3] Over 10 3.2 No. of administrative staff (managers, accountants, secretarial etc): Permanent staff Temporary/Occasional employees [11] Less than 5 [8] Less than 5 [3] 5-10 [] 5-10 [9] Over 10 [1] Over 10 3.3 No. of technical staff (technicians, foremen): Permanent staff Temporary/Occasional employees [6] Less than 5 [6] Less than 5 [7] 5-10 [4] 5-10 [9] Over 10 [2] Over 10

168
Caribbean Construction Industry Study, 2002
3.4 No. of Tradesmen/Craftsmen (plumbers, carpenters, masons, electricians etc): Permanent staff Temporary/Occasional employees [1] Less than 5 [1] Less than 5 [8] 5-10 [5] 5-10 [9] 10-50 [7] 10-50 [3] Over 50 [7] Over 50 3.5 No. of unskilled workers/labourers: Permanent staff Temporary/Occasional employees [4] Less than 5 [] Less than 5 [3] 5-10 [1] 5-10 [7] 10-50 [8] 10-50 [5] Over 50 [10] Over 50 4.0 MATERIALS, PLANT AND EQUIPMENT 4.1 What equipment does the firm own: E Scraper Bulldozer 7 Grader 5 Front-
Loader 10
Dragline Excavator 5 Conc pump 1 Dumper 11 E Mobile
crane 5 Tower crane 5 Scaffolding 15 Other 3
G Back-hoe 14 Truck 20 Barge Roller 2 IT Computers 22 Project
Management Software
17 Structural Analysis Software
4 CAD Software
11
O Water pump Compactor
2 1
Concrete Mixers Sand machine
11 1
Alphalt Plant Lawn mower
2 1
Concrete vibrators
2
4.2 Do you think that the cost of holding materials inventory for a large project is too high for local contractors? Yes 11 No 10 Explain: With appropriate ordering and inventory management practices, generally purchasing imported materials locally, especially large amounts, can be more costly; Financial Institutions are generally understanding provided the contractor has a good track record. In addition most contracts will pay 75% of cost of materials on site; We order materials as we need them; The cash outlay for duty material are paid for as materials on site. 10% is held back as retention; There is usually enough time on larger projects to source materials and adjust inventory levels as necessary; Most materials are readily available. There is not much need for holding or storing; The cost is high but however the benefit out ways the cost; Because most local contractors operate on ran overdraft which attract very high interest rates. Therefore, holding inventory for large projects is actually trying one cash flow and the possibility of securing another job in months is not guaranteed; Wastage on the job and also it encourages thieves; : Storage charges, materials handling charges, transportation; Because it ties up your cash flow

169
Caribbean Construction Industry Study, 2002
4.3 Are consultants too rigid in their specifications of materials (i.e. they don’t allow substitutions when the specified materials are not readily available and a suitable substitute is) Yes 5 No 20 Explain: This is qualified yes. The testing required for a suitable substitute is often the problem; Need to keep standards; No, have found items reasonable most of the time; Consultants generally like to specify and seem reluctant to accept substitutes particularly from a non-traditional sources; A wide range of materials are available locally and importation from Miami and neighbouring countries is a viable option. What is required is effective decision making by owners and their consultants and then allowing sufficient time for contractor to procure materials; Sometimes they are very rigid and cause the job to be delayed when a decision is not taken promptly; Some are flexible 5.0 FINANCIAL CAPACITY 5.1 What is the firm’s capitalization? . EC$ 500,000.00; $50.000.00; $1,000,000.; $5,500,000($252,000 paid up) Private Limited; $400,000.00; $1.2 M. EC; US$500,000; $1,514,714; Over US$ 6 million; US$2M; US$15M; ($530,000) ($18,336,962)( US$1,755,415)(US$1,600,002) 5.2 Average annual turnover over the past five years: [1] Less than US$ 250,000 [2 ] US$ 250,000 – 500,000 [4] US$ 500,000 – 1m [7] US$ 1m – 5m [8] Over US$ 5m 5.3 What are the approximate financial ratios for the firm? Debt to Turnover . 1:10 1:10 1:4 1:4 . 7% no debt (0.1X) (0.13)(0.0018) Fixed assets to Total assets. 1:3.5 2:10 1:2.8 178401:1514714 76% (0.3%) (0.44)(0.38 Debt to Total assets. 1:8.5 1:25 1:1.4 1:3 11% .(0.5%) (0.65)(0.0037) 5.4 Are the cost of Performance Bonds, insurances and other financial preliminaries a problem? Yes 7 No 16 Explain: Cost of insurances are relatively high in Dominica; The costs are not the major problem, the problem is that there are not many financial institutions that offers these services; For local jobs not a problem. Some overseas jobs cost 25% bid bond and 100% performance bond. Local job 10% bond which is reasonable; The reluctance of local banks to grant credit facilities specifically for a large project even when assignment of the Interim Payments is made to them is a negative. Insurance companies are much more flexible; The company is family owned and managed. Management is professional – engineer and business management / accounting. Bonds have been formed between us and our bankers and insures; These are safe guards for both parties; Depends on size of contract it would be a problem to secure bonding; Performance bonds are set too high for local contractors to qualify; Performance bonds are held after handover to end of retention. This increases your bonding capacity while bonds are in place for projects completed and in use

170
Caribbean Construction Industry Study, 2002
5.5 Are the levels of Liquidated Damages a restriction? Yes 4 No 19 Explain: It should help improve construction management at least fuel the need too; We always do a contract with a positive attitude of completing on time; We deliver on time.; Some jobs may have a high level of liquidated damages un-necessarily; Its increases the contractor awareness of completing the project within the specified time Presents problems with financial institutions. Customer is covered by a contract: Bond, Insurance, Retention; Too high. Should have balancing bonus; Only when clients use prohibitive levels 5.6 Do you think that contracts should include a ‘fluctuations’ provision to adjust the contract price according to changing economic criteria? Yes 20 No 5 Explain: Especially so if contracts are of long duration and source materials far and wide; Only if Government make changes in taxes etc. during execution of a contract; Especially with the outlay ratio. Contract tend to fluctuate. We are tied to US$; The country is significantly subjected to outside influences; It has not been an item in our past projects but I think it would be necessary to protect the contractor in our unpredictable economy; Sometimes these costs help the contractor to defray additional costs of material which he may encounter; Satisfy with the provisions in the contract document to date; If changes are made and expenses are incurred or reduction in work provisions should be made to adjust the contract; Because as contractors we do not have control over the cost of materials; Generally only required on contracts over two years; Subject to time frame of project and nature of materials/products. Key area of concern still remains cement 5.7 Do you think the local cost and availability of materials is a constraint on local contractors compared with foreign contractors? Yes 8 No 16 Explain: Competent contractors (local) can access material from outside relatively easily. Compare to foreign contractors the real constrain is rigid prequalifying requirement by CDB & IFA’s; Generally local contractors can source from the same suppliers as foreign contractors; : The ability of local contractors to purchase in bulk is really where the problems lies; : If contractors knows the marketplace they can be competitive; Foreign contractors have better marketing facilities for obtaining and sourcing materials at lower prices and better discounts; Because most of the international firms purchase in very large quantity, possibly from a parent company so the advantage is always there; Supply chain not responding effectively to offer better services, innovative invoicing and better group pricing 5.8 Approximate cost structure of a typical project in percentages: Average Max Min Labour 29 45 5 Materials 44 64 25 Plant & Equipment 15 40 3 Overheads & Admin. 11 20 3 *add 8% for H/O overheads These ratios vary with the type of construction. Building as against civil engineering projects; Varies greatly from project to project e.g. construction of a playing field / road to construction of bridge / Rubble wall. 6.0 EXPERIENCE 6.1 Year the firm was established: Pre 1990 17 1990-1995 5 1995-2000 4 since 2000
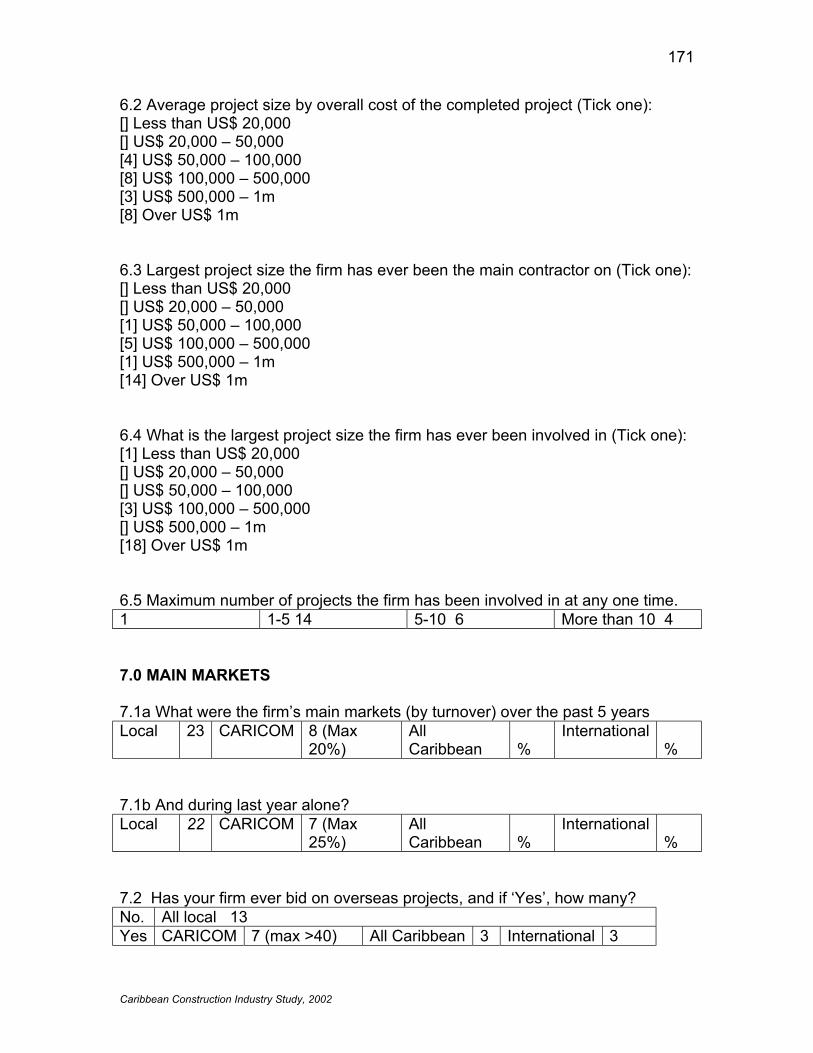
171
Caribbean Construction Industry Study, 2002
6.2 Average project size by overall cost of the completed project (Tick one): [] Less than US$ 20,000 [] US$ 20,000 – 50,000 [4] US$ 50,000 – 100,000 [8] US$ 100,000 – 500,000 [3] US$ 500,000 – 1m [8] Over US$ 1m 6.3 Largest project size the firm has ever been the main contractor on (Tick one): [] Less than US$ 20,000 [] US$ 20,000 – 50,000 [1] US$ 50,000 – 100,000 [5] US$ 100,000 – 500,000 [1] US$ 500,000 – 1m [14] Over US$ 1m 6.4 What is the largest project size the firm has ever been involved in (Tick one): [1] Less than US$ 20,000 [] US$ 20,000 – 50,000 [] US$ 50,000 – 100,000 [3] US$ 100,000 – 500,000 [] US$ 500,000 – 1m [18] Over US$ 1m 6.5 Maximum number of projects the firm has been involved in at any one time. 1 1-5 14 5-10 6 More than 10 4 7.0 MAIN MARKETS 7.1a What were the firm’s main markets (by turnover) over the past 5 years Local 23 CARICOM 8 (Max
20%) All Caribbean
%
International %
7.1b And during last year alone? Local 22 CARICOM 7 (Max
25%) All Caribbean
%
International %
7.2 Has your firm ever bid on overseas projects, and if ‘Yes’, how many? No. All local 13 Yes CARICOM 7 (max >40) All Caribbean 3 International 3

172
Caribbean Construction Industry Study, 2002
7.3 Does your firm plan to bid on overseas projects in the next year? No 7 Yes CARICOM 11 Yes All Caribbean 5 Yes International
2 8.0 OBSTACLES & OPPORTUNITIES If your firm has not bid or prequalified to bid for overseas jobs… Never bid before 8.1 What has prevented your firm from prequalifying for overseas jobs? (Tick any that apply) Personnel 5
Finance 5
Access to Information 4
Equipment 1
Firm’s Lack of Experience 2
Other 5 (Present Commitments)
Explain: Young company, Building strong local base. However, information on Regional Work is not readily available. Enough work in State; Firm’s capacity can be realized locally; Most or all projects that invites regional bids are above our financial capability; If finances are available we can put together a team of experience personnel; We have never had information on jobs outside St. Lucia; No overseas jobs due to labour financing; Registration within country . 8.1a If personnel are a problem, what kind of skills are needed? (Tick any that apply) Engineers 2
Other professional 1
Administrative 1
Technical 3
Trade/craft 2
Other 3
Explain: Lack of proper project managers; Workforce has trainable skills but mind set is the problem. Workforce unrealistic expectations 8.2 What would help your firm to prequalify for overseas jobs? (Tick any that apply) Extra Personnel 2
Finance 8
Access to Information 3
Equipment 1
Qualifications 1
Other 4 Employer Attitude
Explain: There is no definite medium to access information on regional work opportunities. Regional work opportunities is not usually advertised in other territories; We need first to quality for local jobs. Employers don’t feel that LOCALS can be as good as FOREIGN.; Because larger sums are needed to mobilize in order to work overseas; Company too small

173
Caribbean Construction Industry Study, 2002
8.3 If your firm has prequalified and bid on overseas jobs, and been unsuccessful, what do you think the reason was? (Tick any that apply) N/A Inadequate Personnel 1 Lack of Financial Support 1 Preference of Client for foreign firm 1 Inadequate Equipment Firm’s Lack of Experience 1 Funding agency preference for Foreign firms 1 Preference for Local Firms 3 Price (and hence own costs) was too high 6 Other 1 Please also indicate which was the most important in your view We have never tendered on an overseas job; Preference for Local Firms; Price. Generally as most tenders are invited from prequalified contractors Local presence If your firm has not bid or prequalified to bid for local projects that have been tendered internationally… 8.4 What has prevented your firm from prequalifying or bidding on local jobs that have been tendered internationally? (Tick any that apply) Personnel 2
Finance 8 Access to Information 3 (early)
Equipment 1
Firm’s Lack of Experience
Other 2
Explain: The prequalification stipulated by CDB & other IFA’s requirements makes it difficult for young local firms to prequalify even if those firms have fewer expertise; Paradoxically, their contract documents don’t ensure that the internation firms maintain qualified personnel to the requirements of the prequalifications information submitted during construction; We think that prequalification requirements on jobs to be tendered internationally are inordinately high in many cases; We are allowed to bid on all present projects; Bid Bond, Performance Bond, the time for which job must be financed before certificate issued; Preference for FOREIGN CONTRACTORS; The ability to secure bonding on the large projects; Because of the high level of monies required at the prequalifying bids; Politics 8.4a If personnel are a problem, what kind of skills are needed? (Tick any that apply) Engineers 3
Other professional 2
Administrative 2
Technical 4
Trade/craft 4
Other 2
Explain: Need properly trained individuals from Managers to Technicians; Practical skills as against academically derived skill are needed. A change In attitude regarding work ethics is badly needed; Way formed was filled 8.5 What would help your firm to prequalify on local jobs that are to be tendered internationally? (Tick any that apply) Extra Personnel 3
Finance 7 Access to Information 3
Equipment 1
Qualifications 2
Other 2

174
Caribbean Construction Industry Study, 2002
Explain: The desire on the part of government (politicians and civil servants) to want to hire deserving local companies; Knowing the finances are available; A lower finance pre-qualifications or having to bid as a joint venture partnership with other companies; The prequalification requirement by consultant agencies are heavily spec, local contractors therefore cannot meet prequalification requirements although capable of doing the jobs: transparency 8.6 If your firm has prequalified and bid on local projects that have been tendered internationally, and been unsuccessful, what do you think the reason was? (Tick any that apply) Inadequate Personnel 1 Lack of Financial Support 2 Preference of Client for foreign firm 3 Inadequate Equipment Firm’s Lack of Experience Funding agency preference for Foreign firms 2 Preference for Local Firms Price (and hence own costs) was too high 7 Other 4 Please also indicate which was the most important in your view Too much corruption- Cannot presently determine which one!!(is most important) Availability of true competitors 9.0 International protocols on procurement of services Various international agencies in the Caribbean (CARICOM) and beyond (WTO, FTAA, etc) have protocols regarding the accreditation of qualifications, the free movement of citizens, and the procurement of services between territories.
d. Is your firm aware of the content of these protocols? Yes 7 No 12 e. Do you think these protocols affect your firm? Yes 10 No 6 f. Would you like to know more about these protocols? Yes 19 No1
Is there any other information you may like to add concerning the competitiveness of local/regional firms in the construction industry, particularly in relation to internationally competitive tendering for contracts? Need to organize the local construction industry.
6) Strengthen the Construction Association 7) Training of Tradesmen 8) Training of Management Staff 9) Implementing Building Codes 10) Cooperation from Financial Institutions to insist on codes, trained personnel

175
Caribbean Construction Industry Study, 2002
Yes. IADB/WB conditions increase project size, scope and add regulations which increase overall cost and decrease the possibility of small local contractors to be competitive. This is deliberate. An example is the aggregation of 3 + 4 bridges into a single contract. NOT ENOUGH SPACE AVAILABLE FOR OUR VIEWS!!

176
Caribbean Construction Industry Study, 2002
COUNCIL OF
CARIBBEAN
ENGINEERING
ORGANISATIONS
SECRETARY GENERAL: Eng. Dr. Clement Imbert TEL: (868) 662-6267 (W) Engineering Institute, Faculty of Engineering FAX: (868) 662-4414 (W) The University of the West Indies Email: [email protected] St. Augustine, Trinidad and Tobago TEL: (868) 662 7338 (H)
CARICOM CONSTRUCTION INDUSTRY STUDY
CLIENTS’ QUESTIONNAIRE Showing Survey Responses
1.0 COMPANY PROFILE 1.1 Company name (optional): 1.2 Where is Company registered? Jam 2; St K&N 1, St L 8 and T&T 6 17 1.3 Does the company operate in more than one country? (Please tick): Local country, 13 CARICOM, 2 International 1 2.0 CONSTRUCTION PROCUREMENT 2.1 When the firm wants to acquire a new building does it invite tenders internationally? (Please tick. If more than one, please give approx %) Local tenders 13 (unless working with international lending agencies) CARICOM tenders 4 International tenders 5 Depends on site of contract and availability of expertise 2.2 Does the firm undertake DFC, BOOT, BOLT or any other kind of project to provide public sector facilities now that will be paid for later or by operating revenues? Yes 8 No 8 Explain: Provide own financing out of operations: School, roads special school - fees paid to company 2.3 Does the firm undertake speculative building?
Yes 3 No 11 Legislation does not permit
CONSTITUENT MEMBERS: Antigua Association of Professional Engineers Association of Professional Engineers of Trinidad & Tobago Bahamas Institution of Professional Engineers Barbados Association of Professional Engineers Belize Association of Technical Professionals Dominica Association of Technical Professionals Grenada Institution of Professional Engineers Guyana Association of Professional Engineers Jamaica Institution of Engineers St. Lucia Association of Professional Engineers St. Vincent Association of Professional Engineers St. Kitts-Nevis Association of Professional Engineers

177
Caribbean Construction Industry Study, 2002
2.4 Does the firm have an understanding with a consultant and/or a contractor for undertaking construction projects (especially for DFC, BOOT, BOLT projects) Yes 6 No 10 Explain: Although each project is treated separately in dealing with consultants we however have the same contractor for completing our project; All projects are undertaken under the company’s banner - All services available in house. 2.5 Does the firm undertake any Construction Project Management on its own projects Yes 11 No 5 Explain: Consultant is usually employed; : As above – under the Corporation Umbrella - A complete structure of services exist; Project managers are usually engaged; This is carried out generally on projects costing less than $1,000,000; 2.6 Does the firm undertake any Construction Project Management on the projects it undertakes for other owners. Yes 8 No 7 Explain: N/A; as above; We do not undertake projects for other owners 3.0 LEVEL OF SATISFACTION 3.1 Are you satisfied with the level of service provided by local Consultants? Yes 11 No5 Explain: could be improved; probably too few; Most of the consultants have not kept up with the technology and new methods. Because of this influence at work, quality to a certain extent is sacrificed In recent times projects are small enough to be handled by local consultants; Local consultant expertise are limited; Lack of professionalism; Predominantly professional services are provided, however there is room for improvement; : In general, yes, however the performance of some have been wanting; In majority of cases the consultants are not sufficiently thorough in their design and management of the project. 3.2 Are you satisfied with the level of service provided by local Contractors? Yes 5 No 10 Explain: A lot of room for improvement, but this is an entirely new subject matter; e.g. we choose the worst contractors by our own system of “lowest tender” & apparently any old fool can call himself a contractor/engineer; Most of the small-medium sized contractors overextend themselvesSame as above; Works done by local contractors generally require a great deal of supervision By HUDC; Too many non qualified contractors, poor project management skills as a result.; Lack of experience or skilled services, poor production; Required continual supervision ; Under the supervision by local consultants; Quality of work and time delivery is usually wanting; The Contractor does not usually have adequate resources: i.e., Financial and Human Resources 3.3 If you have used foreign consultants and contractors: 3.3a Are you satisfied with the level of service provided by foreign Consultants? Yes 12 No1 Explain: Construction of our Headquarters we used a consultant from Barbados – the level of services provided was satisfactory; The services by foreign consultants are generally more effective, however it’s more expensive Same as local consultants; The majority has the resources and the technical expertise to
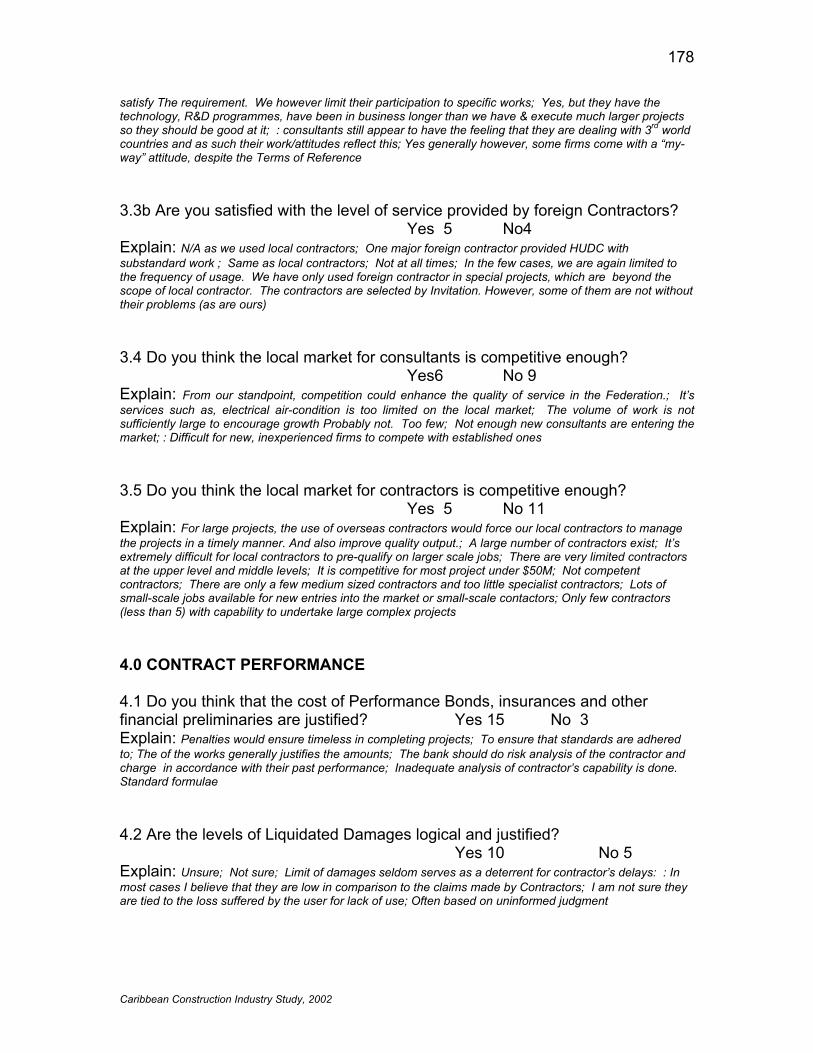
178
Caribbean Construction Industry Study, 2002
satisfy The requirement. We however limit their participation to specific works; Yes, but they have the technology, R&D programmes, have been in business longer than we have & execute much larger projects so they should be good at it; : consultants still appear to have the feeling that they are dealing with 3rd world countries and as such their work/attitudes reflect this; Yes generally however, some firms come with a “my-way” attitude, despite the Terms of Reference 3.3b Are you satisfied with the level of service provided by foreign Contractors? Yes 5 No4 Explain: N/A as we used local contractors; One major foreign contractor provided HUDC with substandard work ; Same as local contractors; Not at all times; In the few cases, we are again limited to the frequency of usage. We have only used foreign contractor in special projects, which are beyond the scope of local contractor. The contractors are selected by Invitation. However, some of them are not without their problems (as are ours) 3.4 Do you think the local market for consultants is competitive enough? Yes6 No 9 Explain: From our standpoint, competition could enhance the quality of service in the Federation.; It’s services such as, electrical air-condition is too limited on the local market; The volume of work is not sufficiently large to encourage growth Probably not. Too few; Not enough new consultants are entering the market; : Difficult for new, inexperienced firms to compete with established ones 3.5 Do you think the local market for contractors is competitive enough? Yes 5 No 11 Explain: For large projects, the use of overseas contractors would force our local contractors to manage the projects in a timely manner. And also improve quality output.; A large number of contractors exist; It’s extremely difficult for local contractors to pre-qualify on larger scale jobs; There are very limited contractors at the upper level and middle levels; It is competitive for most project under $50M; Not competent contractors; There are only a few medium sized contractors and too little specialist contractors; Lots of small-scale jobs available for new entries into the market or small-scale contactors; Only few contractors (less than 5) with capability to undertake large complex projects 4.0 CONTRACT PERFORMANCE 4.1 Do you think that the cost of Performance Bonds, insurances and other financial preliminaries are justified? Yes 15 No 3 Explain: Penalties would ensure timeless in completing projects; To ensure that standards are adhered to; The of the works generally justifies the amounts; The bank should do risk analysis of the contractor and charge in accordance with their past performance; Inadequate analysis of contractor’s capability is done. Standard formulae 4.2 Are the levels of Liquidated Damages logical and justified?
Yes 10 No 5 Explain: Unsure; Not sure; Limit of damages seldom serves as a deterrent for contractor’s delays: : In most cases I believe that they are low in comparison to the claims made by Contractors; I am not sure they are tied to the loss suffered by the user for lack of use; Often based on uninformed judgment
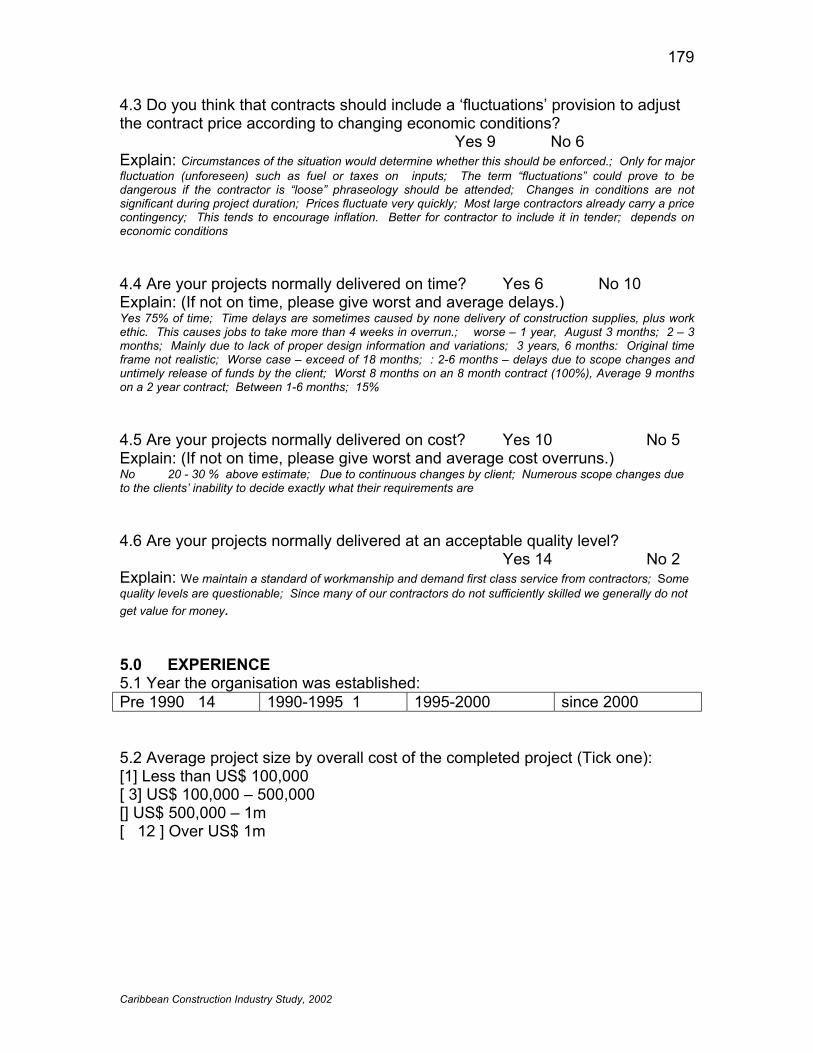
179
Caribbean Construction Industry Study, 2002
4.3 Do you think that contracts should include a ‘fluctuations’ provision to adjust the contract price according to changing economic conditions?
Yes 9 No 6 Explain: Circumstances of the situation would determine whether this should be enforced.; Only for major fluctuation (unforeseen) such as fuel or taxes on inputs; The term “fluctuations” could prove to be dangerous if the contractor is “loose” phraseology should be attended; Changes in conditions are not significant during project duration; Prices fluctuate very quickly; Most large contractors already carry a price contingency; This tends to encourage inflation. Better for contractor to include it in tender; depends on economic conditions 4.4 Are your projects normally delivered on time? Yes 6 No 10 Explain: (If not on time, please give worst and average delays.) Yes 75% of time; Time delays are sometimes caused by none delivery of construction supplies, plus work ethic. This causes jobs to take more than 4 weeks in overrun.; worse – 1 year, August 3 months; 2 – 3 months; Mainly due to lack of proper design information and variations; 3 years, 6 months: Original time frame not realistic; Worse case – exceed of 18 months; : 2-6 months – delays due to scope changes and untimely release of funds by the client; Worst 8 months on an 8 month contract (100%), Average 9 months on a 2 year contract; Between 1-6 months; 15% 4.5 Are your projects normally delivered on cost? Yes 10 No 5 Explain: (If not on time, please give worst and average cost overruns.) No 20 - 30 % above estimate; Due to continuous changes by client; Numerous scope changes due to the clients’ inability to decide exactly what their requirements are 4.6 Are your projects normally delivered at an acceptable quality level?
Yes 14 No 2 Explain: We maintain a standard of workmanship and demand first class service from contractors; Some quality levels are questionable; Since many of our contractors do not sufficiently skilled we generally do not get value for money. 5.0 EXPERIENCE 5.1 Year the organisation was established: Pre 1990 14 1990-1995 1 1995-2000 since 2000 5.2 Average project size by overall cost of the completed project (Tick one): [1] Less than US$ 100,000 [ 3] US$ 100,000 – 500,000 [] US$ 500,000 – 1m [ 12 ] Over US$ 1m

180
Caribbean Construction Industry Study, 2002
5.3 Largest project (by overall cost) that the firm has ever been involved in the construction of (Tick one): [ ] Less than US$ 500,000 [ 2] US$ 500,000 – 1m [ 4] US$ 1m – 10m [ 2] US$ 10m – 20m [ 9] Over US$ 20m 5.4 Maximum number of projects the firm has been involved in at any one time. 1 1 1-5 6 5-10 3 More than 10 7 6.0 MAIN MARKETS 6.1 Has your firm ever been involved in the construction of an overseas project, and if ‘Yes’, where and how many? No All local 12 Yes CARICOM 3 All Caribbean 1 International 6.2 Does your firm plan to get involved in the construction of overseas projects in the next year or so? No 11 Yes CARICOM 2 Yes All Caribbean 2 Yes International 1 7.0 International protocols on procurement of services 7.1 Various international agencies in the Caribbean (CARICOM) and beyond (WTO, FTAA, etc) have protocols regarding the accreditation of qualifications, the free movement of citizens, and the procurement of services between territories.
g. Is your firm aware of the content of these protocols? Yes4 No 9 h. Do you think these protocols affect your firm? Yes 6 No 5 i. Would you like to know more about these protocols? Yes 12 No 2
Is there any other information you may like to add concerning the competitiveness of local/regional firms in the construction industry, particularly in relation to international competition for construction services?15 There seem to be an in-balance in the number of projects awarded to International firms against Local and Regional. While it can be argued that the regional firms are not outfitted (financial, expertise, equipment,
15 Please continue overleaf if necessary.

181
Caribbean Construction Industry Study, 2002
man power) to undertake major regional projects, the international firms should be some how forced to joint venture with local regional firms on projects where this is the case. The results of such could prove to be extremely beneficial to the regions quest for development of expertise on the construction arena and could continue to bring financial benefit to our regional companies, not to mention education and development of the industry.

182
Caribbean Construction Industry Study, 2002
APPENDIX VII
PAPERS PRESENTED AT A SEMINAR HELD IN GUYANA ON AUGUST 17TH 2001.
Financing the Construction Industry by Conrad K Plummer Establishment of Competitive Contracting in Guyana and Scope for Involvement of Foreign Based Contractors by Philip Allsopp Subsidies to the Construction Industry in Guyana by Charles Ram

183
Caribbean Construction Industry Study, 2002
PRESENTATION TO THE COUNCIL OF CARIBBEAN ENGINEERING ORGANISATIONS' SEMINAR FOR CONTRACTORS, CONSULTANTS, ENGINEERS AND ARCHITECTS AUGUST 17th 2001
FINANCING THE CONSTRUCTION INDUSTRY BY CONRAD. K PLUMMER Let me begin by saying what a pleasure it is to be asked to address you. Since I have been requested to keep my presentation to within 15 minutes, I have had to condense most of it but will be available afterwards to expand on any area that you may wish. For this presentation, I propose to look at a theoretical construct of a large project from a contractor’s point of view, examine the financing or credit facilities that would be required, bearing in mind the impact of the Financial Institutions Act which is the Act that governs all Financial Institutions. Then close by reviewing some of the problems encountered in the past with contractors and their financing and suggest some possible reasons for those problems. We will assume that the project under consideration is from a creditable source and as such that non-payment for work done is not an issue and that most, if not all of the necessary equipment is in place. For a large project, the stages of financing are usually as follows:
• A Bid or Tender Bond at the application or bid stage. This is usually for 10% of the Contract Bid
• A Mobilisation Bond to cover mobilisation advances granted. This usually ranges between 10 - 25% of the Contract and is usually repayable in 4 equal installments. These installments being deducted from the architects valuations.
• Performance bonds usually 10% over the duration of the project and the period after the project during which claims for defects could be made.
Assume a contract of US$1,000,000: i.e. Guy$190,000,000: or US$500,000: i.e. GUY$95,000,000: the maximum Bond facilities outstanding at any one time would be equivalent to 35% of the project - 25% Mobilisation plus 10% Performance. We should note here that the mobilisation advance is on the contract price, and if we assume a profit margin of 25%, then the advance would in fact represent 33 1/3 of the cost of the project. Usually required also are some overdraft facilities in order to enable the contractor to smooth over any cash flow deficit resulting from delays in payment. Let us assume that the overdraft facilities represent 5% of the project price. This means that total facilities required are 40% of the project price or 53% of the cost
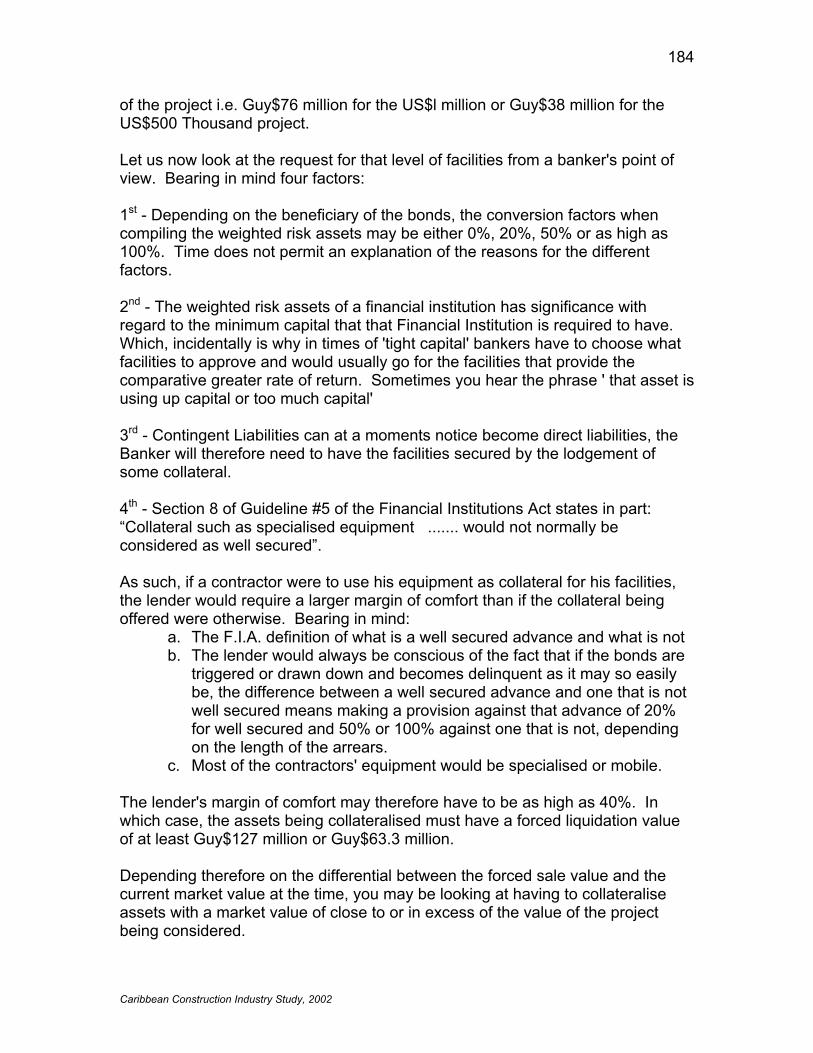
184
Caribbean Construction Industry Study, 2002
of the project i.e. Guy$76 million for the US$l million or Guy$38 million for the US$500 Thousand project. Let us now look at the request for that level of facilities from a banker's point of view. Bearing in mind four factors: 1st - Depending on the beneficiary of the bonds, the conversion factors when compiling the weighted risk assets may be either 0%, 20%, 50% or as high as 100%. Time does not permit an explanation of the reasons for the different factors. 2nd - The weighted risk assets of a financial institution has significance with regard to the minimum capital that that Financial Institution is required to have. Which, incidentally is why in times of 'tight capital' bankers have to choose what facilities to approve and would usually go for the facilities that provide the comparative greater rate of return. Sometimes you hear the phrase ' that asset is using up capital or too much capital' 3rd - Contingent Liabilities can at a moments notice become direct liabilities, the Banker will therefore need to have the facilities secured by the lodgement of some collateral. 4th - Section 8 of Guideline #5 of the Financial Institutions Act states in part: “Collateral such as specialised equipment ....... would not normally be considered as well secured”. As such, if a contractor were to use his equipment as collateral for his facilities, the lender would require a larger margin of comfort than if the collateral being offered were otherwise. Bearing in mind:
a. The F.I.A. definition of what is a well secured advance and what is not b. The lender would always be conscious of the fact that if the bonds are
triggered or drawn down and becomes delinquent as it may so easily be, the difference between a well secured advance and one that is not well secured means making a provision against that advance of 20% for well secured and 50% or 100% against one that is not, depending on the length of the arrears.
c. Most of the contractors' equipment would be specialised or mobile. The lender's margin of comfort may therefore have to be as high as 40%. In which case, the assets being collateralised must have a forced liquidation value of at least Guy$127 million or Guy$63.3 million. Depending therefore on the differential between the forced sale value and the current market value at the time, you may be looking at having to collateralise assets with a market value of close to or in excess of the value of the project being considered.
185
Caribbean Construction Industry Study, 2002
Having said that, I should point out that lenders will not always be involved in asset-based lending but will also take other factors into consideration. Among these are the track record - financial and industry-wise - of the contactor and the contactor's management of the project/overall business. Let us now turn our attention to some of the problems encountered in the past.
a. Delay in cancelling or reducing the value of or establishing maturity of bond
i. In many cases tender bonds are not cancelled on time, nor are Mobilisation bonds reduced in keeping with the payments or deductions made against the mobilisation advance. In other words, as the debt of the contractor reduces under the mobilisation advance so should the value of the bond. Most contractors and the beneficiaries of the bonds do not pay attention to this. A simple irrevocable letter by all the parties concerned should be able to achieve the necessary reductions in the bonds. The net result would be less cost to the contractor and the possibility that the lender may look favourably at the original set of credit facilities if he knows that the risk will decrease over an agreed to time frame.
b. Contractors, especially smaller ones, tend to take advances from one
job and utilise same to support many other jobs. This will only work in times of strict work and receipts schedules. As soon as there are unexpected delays, the domino effect come into play and the contractor finds himself in a cash bind.
c. Many contractors, of all sizes, take their profits out of the project too
soon. Some take it out of the mobilisation advance, which is given early in the life of the project. Profits should be taken later in the project and never all at one time. Sudden and unexpected withdrawals of profits could and often do lead to the project not being able to withstand unplanned for contingencies and the inevitable accompanying cash crunch.
d. Proper accounting procedures and financial management are areas that
often need improving in the sector nationally. Collection of receivables is also often not given the priority that it deserves. No business can survive over a long period if it keeps paying out more than it collects or its accounting systems are such that costs cannot be determined with a great degree of accuracy.
e. The use of short-term funds like overdrafts to purchase expensive fixed
assets is common in the sector. This causes a mismatching of funds and often results in tight cash flow positions with the lender.

186
Caribbean Construction Industry Study, 2002
f. The lack of accurate, up-to-date financial statements is a major
handicap when requesting credit from a lender. In conclusion, the problems associated with financing the Construction Sector are multifaceted and differ from firm to firm. They range from inadequate asset base to lack of financial management. Efforts would therefore have to be made by each individual in the sector to seriously address these deficiencies, before the sector as a whole can become more competitive, both locally and regionally.

187
Caribbean Construction Industry Study, 2002
ESTABLISHMENT OF COMPETITIVE CONTRACTING IN GUYANA AND SCOPE FOR INVOLVEMENT OF FOREIGN BASED CONTRACTORS By Philip Allsopp INTRODUCTION Although I have chosen the title of this paper I believe that, from the information given to me, that the main interest of the CARICOM Industry Study, is an examination of the likely effect of the involvement of regional contractors on projects throughout the region, bearing in mind that the conventional wisdom of globalisation would affect the industry here in Guyana. However, it seems to me that one should first consider the structure of the local industry in Guyana with its characteristics and defects and broadly outline the essential ingredients which would conduce to the development of a competitive contracting business. For unless corrections are effected and adjustments, our contractors would find themselves at a disadvantage in considering joint ventures or even sub-contracting arrangements on the larger contracts which might attract firms of international standing. I propose, therefore, to structure my presentation in the following sections:
(a) Basic facets of a competitive contracting firm as they relate to Guyana conditions.
(b) National objectives of a healthy contracting industry. (c) Categorising the expertise of contractors. (d) The question of foreign involvement.
Basic Facets Of Contracting Firms In summary, the basic facets are as follows: Organisation Success depends on Organisation and discipline in the following three areas:
(i) Capability and initiative of staff. (ii) Efficient management - failure to achieve this is often the principal
cause of failure. (iii) Recognition of financial limitations.
One person cannot accomplish these alone, but specialist assistance is often necessary. Finance Money must be set aside to offset depreciation and obsolescence of equipment. Working capital should be liquid and not tied up in fixed assets which are not readily released. Keep the business within the working capital.
188
Caribbean Construction Industry Study, 2002
Consider renting rather than purchasing some specialist equipment. Personnel Special attention must be paid to personnel - their recruitment, discipline, trade unions and public relations. Legal Assistance required in contractual affairs and in debt collection. Cost Accounting A great weakness among Guyanese contractors. No proper records kept of unit costs. Communications Always a deficiency between site and office. Equipment Poor maintenance of equipment owned causes much loss of time. Rental may be a better answer. Materials Innovative techniques in the use of new materials not studied and applied. Estimating A chronic weakness because no proper records are kept. Project Control There is need to study this more carefully. Bar charts are inefficiently prepared and difficult to monitor. Some weaknesses in the above list are not capable of self-correction and assistance might have to be given by means of appropriate training seminars. NATIONAL OBJECTIVES The construction industry thrives on the stimulus of problems for which there are no textbook solutions, but in all countries it serves national objectives whether or not the contractors themselves are conscious of them. These should be taken into consideration, particularly if the industry is under the threat of being overwhelmed by external contractors in competition. I suggest that the important national objectives are as follows:
1. Good quality of work to ensure the proper functioning of the facility to be constructed.
2. Economy in cost and time of completion. 3. Employment and the development of innovative skills.
189
Caribbean Construction Industry Study, 2002
4. Stimulating effect of self-achievement and the growth of self-employment capability among individual artisans.
The first two objectives could, in many cases, be attained by interested contractors from any part of the world, provided there are no language problems, but the latter two are entirely related to the country, in this case Guyana, in which the facility is to be provided. This means that local contractors are better positioned to serve the national interest especially as they are the ones who would have to be on hand to maintain such facilities over the years. CATEGORIES OF EXPERTISE Very few contractors, both local and regional, may be termed General Contractors with expertise covering a wide range of construction projects. But many like to be considered as such, sometimes with unfortunate consequences. Suggested categories which would enable a good examination of their skills and expertise are as follows: General Contractors Experienced in undertaking a wide variety of construction work. Earthwork Contractors Embankments, drainage and irrigation, underground pipelines. Roads and Airfields (i) Paved roads.
(ii) Low cost unpaved roads. Structures (i) Those requiring shallow foundations.
(ii) Those requiring deep foundations. Sea Defences THE QUESTION OF FOREIGN INVOLVEMENT The questions which have been posed to me and which I will discuss are-.-
(a) If a local contracting firm is weak, would it not be enhanced by a foreign partner with wider experience?
(b) What difference would it make if a foreign firm were to establish a branch of its contracting business in a local office?
(c) Should a foreign firm with no local counterpart be allowed to bid for jobs here?
Bearing in mind the weaknesses already outlined, I would answer the first question by considering the disadvantages to which the sole ownership contractor is exposed. They may be listed as follows:

190
Caribbean Construction Industry Study, 2002
(i) The sole owner is exposed to death or disability which could so handicap the business that a contract could be terminated.
(ii) The sole owner is personally liable for all business obligations and attendant claims.
(iii) Difficulty in attracting personnel of specialist capability as they feel a subordinate status.
(iv) Difficulty in raising capital may severely handicap the growth of business.
When the question of continuity is considered the weight of advantage is clearly on the side of a joint venture, or partnership, be it local or foreign. The second question will be considered from the point of view as to whether or not the national objectives would be met. Immediately the matter of the degree of local involvement in the firm is questioned. There would have to be an agreed minimum involvement of local personnel if the contracting firm is to be given the privileges of a local firm. It should preferably be organised as a partnership with at least one of the partners being local. Among the advantages of such an arrangement would be:
(i) Responsibility of management can be shared according to the capability of each partner.
(ii) Financing is easier because of assets brought by each partner. (iii) Easier to attract a better quality of management personnel because
there is always the possibility of the company upgrading qualified personnel to partners.
An answer to the third question would be conditional on whether or not the foreign firm has a sub-contracting agreement with a local firm. If there is no such agreement then there should be a financial advantage granted to local firms in the assessment of the bids. This implies that the foreign firm would only be able to win a contract if its bid is at least a certain percentage, of the bid price, below the lowest local bid. ASSOCIATION OF CONTRACTORS AND POLITICAL REGOGNITION Most contracts of significant magnitude are awarded by Government, sometimes under the aegis of international lending agencies. It is therefore unrealistic to consider the individual contractor as a totally independent entity. His voice should be most effectively heard through a vibrant Association of Contractors, and it would be unwise for any contractor to disdain membership of such an Association. When one considers the national objectives mentioned herein it should be appreciated that a great chain of mutual dependence should connect and embrace the political directorate and the Association. Money in a word is the most universal incitement; construction the most powerful instrument of human industry.

191
Caribbean Construction Industry Study, 2002
A well organised Association would multiply their experiences; without it they would be rooted to a single spot and confined to a few years of uncertain existence. An injection of foreign experience could be good and stimulating. Without some species of collaboration no group of professionals has ever preserved the reputation of achievement, ever made any considerable progress or ever possessed in any tolerable degree of perfection the useful and agreeable arts of life.

192
Caribbean Construction Industry Study, 2002
SUBSIDIES TO THE CONSTRUCTION INDUSTRY IN GUYANA By Charles Ram Thank you for inviting me to make this brief presentation to participants at this Seminar for Contractors, Consultants, Engineers and Architects sponsored by the Council of Caribbean Engineering Organisations. I note from the Programme that the organisations are conducting a Construction Industry Study to feed into the Caricom Regional Negotiating Machinery. In the context of the WTO rules which will include services and the movement of people, this is a welcome development. I wish you luck but let me first say that you have to be able to persuade your respective governments of the case for some official attention to the sectors. The first point to note is that the construction sector is widely defined. There are three major areas of physical construction in addition to the professional services of consultants, engineers and architects. They are:
1. Building: residential, commercial and industrial 2. Road Construction 3. Sea Defence
The second point is that even within countries, let alone across the region, there are differences in the policy of taxation and subsidies. Take Guyana for example: the principal savings and loans organization is tax exempt allowing that organization to compete unfairly with other lenders. A contractor who operates in the residential housing sector is in a preferential position vis a vis a contractor in the commercial sector which does not enjoy any special tax concession or subsidy. Thirdly, many major projects are financed by foreign governments and groupings such as the European Union and international financial institutions. By virtue of the conventions under which they operate, income and imports under contracts financed by them are exempt from all taxes. This then gives the large contractors a substantial advantage over their small counterparts. Plant and equipment and regained earnings carried over from contracts which enjoy tax benefits are available for other contracts, the income on which are taxable. Some Caribbean Countries still have the product based fiscal incentive regime under the post WW2 UK modeled Income Tax (in Aid of Industry) Act. This Act gives generous tax holidays, initial and annual capital allowances to manufacturing and processing activities. It does not recognize services.

193
Caribbean Construction Industry Study, 2002
The question is what is the sector doing to help itself. While it is planning to lobby the RNM and influence the WTO how effectively has it persuaded Caribbean governments individually and collectively through CARICOM? A function of an organization like GAPE is not only to provide an opportunity for professionals to meet but to lobby and advocate the interests of its members as well as speak out on issues of public concern. The profession needs to advocate for legal recognition with rules of professionalism and code of conduct for its members. At the firm level players have to understand that the one man firm simply cannot compete in the global economy - they just do not possess the technical and financial resources required to win and execute the lucrative large contracts with the potential for tax exempt income and economies for such. Firms need to cooperate across borders not only to win contracts but to take advantage of the opportunities available under the CARICOM Double Taxation Treaty. The profession needs to position itself to speak in unison and authoritatively across the region. It should consider going beyond the Accounting Profession which has country institutes making up a Caribbean Institute. An attractive and powerful option is a Caribbean Institute with local chapters. And finally the professor must stop being so self effacing, low keyed and perhaps too diplomatic. It constitutes an important sector and a significant share of GDP. Its members as professionals need to assert themselves outside of their profession. Each member is an ambassador and a spokesperson for the profession. They should join the call for Tax Reform which recognizes the potential contribution they can make while bringing some equity and logic to the playing field. How well they perform that function will define their own success and contribute to the wider societal good. Subsidies
• NBS enjoys tax exempt status hence lower rates. • Road construction (Dipcon/MP)
o Contract with Government provides for exemption not available to domestic.
• Sea Defence - Funding Source
o Duty and C.T. Exemption by virtue of Funding Source.
• Shifting Tax Exempt resources to Taxable Projects. • International Conventions prevent any restriction.

194
Caribbean Construction Industry Study, 2002
o Level playing field - inclusiveness.
• Section 12 of Customs Act and Section 18 of C Tax o As far as law is concerned - no special treatment.
• Agreements outside of Contractors over generous use of discretion.

195
Caribbean Construction Industry Study, 2002
APPENDIX VIII JAMAICA’S PROPOSALS FOR A REVIVAL IN THE LOCAL CONSTRUCTION INDUSTRY

196
Caribbea
Construction Revival 2001
PROPOSALS FOR A REVIVAL IN THE LOCAL CONSTRUCTION INDUSTRY:
REQUIREMENTS FOR SUSTAINED GROWTH
1996
2000
2001
2005
JC Jo FO NDUSTRY OF JAMTHE INSTITUTE OF QUANTITY
n Construction Indus
SURASS
int ConsultativeR THE BUILDING AND CONSTRUCTION I
AICA JAMAICAN INSTITUTE OF ARCHITECTS THE JAMAICA
try Study, 2002
VEYORS JAMAICA INSTITUTION OF ENGINEERS THE INCORPORATED MASTERBUILDERS OCIATION OF JAMAICA

197
Caribbean Construction Industry Study, 2002
CONTENTS
Page Introduction 199 PART 1: OVERVIEW 1.1 The construction and installation industry 199 1.2 Importance of the local construction industry to Jamaica’s economy 200 1.3 The current status of the industry 200 PART 2: SOME CRITICAL PROBLEMS / REQUIRED SOLUTIONS 202 2.1 Late notice of public sector projects 202 2.2 Competition from foreign companies 202 2.3 Contractor’s Levy 203 2.4 Late payments to contractors by government 203 2.5 Some requirements of the National Contracts Commission 204 2.6 Long and unpredictable Approvals Process 204 2.7 Political interference on construction sites 205 2.8 Criminal protection rackets 205 2.9 Lack of input by competent local professionals in the Built Environment 206 2.10 Lack of comprehensive integrated National Development Plan 207 2.11 Lack of enforcement of Building Regulations 207 2.12 Government offering unfair competition 208 2.13 High interest rates 210 PART 3: CONCLUSION 212

198
Caribbean Construction Industry Study, 2002
INTRODUCTION This document was prepared by the Joint Consultative Committee (JCC) for the Building and Construction Industry, which is comprised of 4 of the main participants in the construction industry - The Incorporated Masterbuilders of Jamaica, Jamaica Institution of Engineers, Jamaican Institute of Quantity Surveyors, and the Jamaican Institute of Architects. Our particular area of training and expertise, in the construction industry, is the area in which significant public resources are spent. Yet, while the national debt has risen to onerous levels, we have watched our industry deteriorate drastically for several years. We are now at the point where, of those businesses that has not yet closed, many are struggling just to survive. In basic terms, we need work, and we need it now! We have therefore prepared this document, which contains our proposals for action, and governmental policies, which we believe are necessary for a revival of the construction industry, and the economy in general. While the document is primarily intended for presentation and discussions with the government, it is also to be made public. We hope that through meaningful dialogue with the Government, and public support, we can elicit the appropriate responses which will not only bring about long term benefits, but will address the urgent and immediate needs of the industry.
PART 1: OVERVIEW 1.1 THE CONSTRUCTION AND INSTALLATION INDUSTRY The construction industry is the sector of economic activity that is involved with the built environment, and includes buildings for residential, commercial, resort, industrial public and institutional uses. It also includes the construction of roads, sidewalks, highways, bridges, utility services, sewage treatment plants, dams, drainage and the reclaiming and/or reshaping of land. The activities of this sector directly and indirectly impact the livelihood and economic status of unskilled labourers, tradesmen, contractors, subcontractor, consultants, developers, financial institutions, hardware merchants, manufacturers of building products, food vendors, security companies, public sector employees and numerous others.

199
Caribbean Construction Industry Study, 2002
1.2 IMPORTANCE OF THE LOCAL CONSTRUCTION INDUSTRY TO JAMAICA’S ECONOMIC DEVELOPMENT
• Employment: The construction industry is one of the largest employers of skilled and unskilled labour in the country, and a vibrant industry can be one of the quickest vehicles for alleviating the chronic unemployment problem.
• Economic Growth: A healthy construction industry is one of the main
indicators of a healthy economy, and is itself a strong generator of economic growth.
• Protection From Natural Hazards: An effective construction sector is critical
to Jamaica’s success in withstanding the vagaries of earthquake, hurricanes and other natural phenomena. The ability of our physical infrastructure to survive with minimum of damage thereby preventing, loss of life, and social and economic dislocation is a key requirement for continued national development.
• Preservation of the Built & Natural Environment: The collective policies
and practices of both public and private sector, particularly with respect to physical development planning and regulation, serve the important role of protecting the natural environment and quality of the built environment.
• Balance of Trade: Minimizing import content of the sector by local provision
reduces demand for foreign exchange. At the same time, the sector holds great potential as a net earner of foreign exchange especially in the context of emerging CSM&E.
1.3 THE CURRENT STATUS OF THE INDUSTRY • Declining: For the 5-year period up to the end of 1999 the industry has
experienced an average decline of approximately 4% per year. (ESSJ-1999)
1450
1550
1650
1750
1850
1950
1995 1996 1997 1998 1999 2000
Tot GDP (US$'0000) Const. Sector GDP (US$'000)
SINCE 1995 CONSTRUCION SECTOR CONTRACTED (AVG. -4.2%)
FASTER THAN NATIONAL ECONOMY (AVG. -1.5%)

200
Caribbean Construction Industry Study, 2002
• Increase in Government activities with attendant decrease in private sector
participation. Examples:
i) Change in public sector share of new housing completion from 61% in 1995 to 79% in 1999;
ii) Decrease in commercial bank mortgage loans compared to increase in NHT
1995
61%
39%
Public Sector Completion
Private Sector Completion
1999
79%
21%
Performance of the Construction Sector 1995-1999
0
1000
2000
3000
4000
5000
6000
1995 1996 1997 1998 1999
Year
J$ M
illio
n
NHT Mort Comm Bank Loans
201
Caribbean Construction Industry Study, 2002
• Decline in local private construction sector evidenced by the following: i) Reduction in number and activities of local contractors: Many firms that
have invested significant capital and human effort in the industry are currently idle or operating far below capacity. In Mandeville, there is the second largest group of contractors of which at least ten (10) are members of the Incorporated Master Builders Association of Jamaica (I.M.A.J.). Five (5) of these companies are without work, two (2) of which have closed. The other five (5) are operating at about 5% of capacity.
The experience of Mandeville is generally representative of the national condition of the industry. The situation of the firms and the industry is made worse by the fact that a number of construction companies have had their accounts taken over by FINSAC, relieving them of their collateral. The firms are also unable to pay outstanding statutory deductions and are therefore not able to qualify for Government contracts. All of this means that companies within the industry are not even left in a position to earn their way out of debt.
ii) Reduction in activities of consultants: there is significant reduction in business among industry consultants (engineers, architects, quantity surveyors etc,). There is considerable attrition among these professionals due to staff reduction at most companies and migration of experienced expert professionals accompanies this.
PART 2: SOME CRITICAL PROBLEMS & REQUIRED SOLUTIONS 2.1 Notification of Public Sector Projects Information: There are instances
where foreign firms get information on government projects long before local consultants and contractors are aware of the project, therefore putting the locals at a major disadvantage in competing.
A central clearinghouse for information on pending/upcoming projects should be instituted through PIOJ or similar organization. Systems and procedures to gather and post information with reasonable lead time on a sustained basis are needed.
2.2 Competition from Foreign Companies: Increasingly, foreign companies are
dominating the local industry, particularly on large infrastructure and other works. The pre-qualification requirements (prior experience and financial capacity) that are stipulated by local project executing agencies often

202
Caribbean Construction Industry Study, 2002
unnecessarily excludes local firms while favouring overseas companies with very large-scale financial and other resource capabilities. Local project executing agencies should, as far as possible, define the work scope in order to bid smaller work packages and give local firms the benefit of threshold and other local preference provisions allowed in the various international trade arrangements. A case in point is the North Coast Highway where after Bosung Engineering could not satisfactorily complete the work, the project was broken down into smaller contracts and subcontracted to local companies. Government should ensure through the design of the project that local professionals have reasonable opportunities to bid on assignments they are competent to execute. Government should negotiate with the funding agencies that an agreed percentage of the borrowed funds be set aside for local professionals, as is done by the developed countries.
2.3 Contractor¹s Levy Act 1995: The Act has been found to be onerous and Inequitable. Two percent (2%) of the final contract sum is deducted by the employer from each payment, and is to be paid over to the Collector of Taxes. The contractor should normally have the amounts credited to their tax account, where taxes become due on the year in question. This is sometimes not done. Also, if the contractor suffers a loss, these amounts cannot be carried over to the following year, and are not refundable. Abolish the Contractor¹s Levy Act 1995. The establishment of the requirement for current and valid Tax Compliance Certificates (TCC) as a precondition for public sector contract award and contract payments, render the Contractor’s Levy redundant and onerous.
2.4 Late Payment to Contractors by Government: Late payments to
contractors and consultants on government contracts have resulted in additional financial burdens being put on these companies. This has often led to companies incurring late penalties and interest charges on their PAYE and other statutory deductions, as well as increased time and cost overruns. Contractors are also exposed to the possibility of Liquidated Damages as well as increased financing cost for the contract works. Include a contract provision for payment of interest at commercial bank (overdraft) rate plus 2% on all outstanding payments in all Government Contracts. Also waive requirement for TCC before payment for all overdue amounts. Allow Liens against property for payments outstanding more than 120 days (alternatively, allow suspension of Works for payment more than 120 days delayed)

203
Caribbean Construction Industry Study, 2002
2.5 National Contracts Commission: Some of the recent requirements of the
National Contracts Commission could be re-examined. These are:
a) The maximum value of projects allowed for the various grades is often less than the contractors are capable of handling
b) While a contractor can be considered for 3 projects up to their grade level, they would not be allowed to bid for one project equivalent to the total (value) of the three projects.
It is necessary to re-open dialogue between NCC and IMAJ on these matters.
2.6 Long & Unpredictable Approval Process: The approval process for
development, subdivisions, and building application permits is very lengthy and tedious. In some instances the long delays have resulted in projects being changed or aborted due to: i) Increased carrying costs ii) Changes in the economic market conditions over the period of the delay.
This is a long existing problem, which, despite significant increases in building application and other fees as well as several promises over the past few years, there has not been any noticeable improvements. Revise the approval system to create an efficient well structure and easily managed process by doing the following:
a) Establish and publish planning and zoning regulations b) Establish and publish national building act. c) Provide adequate systems, procedures and technical staff in the Parish
Councils and other approval agencies. d) Continue to explore the recently announced concept of creating
regional councils, to achieve greater efficiency of scale. This however, should be done within the context of overall rationalization of the national system for planning and regulation of the built environment.
e) Reduce workload of approving agencies by accepting plans submitted
by registered professionals on an “approved as submitted” basis, with provisions for random checking or other control mechanism.

204
Caribbean Construction Industry Study, 2002
f) Integrate some of the procedures adopted for the “Fast Track” with the above recommendations to create an efficient standard system. Abandon the “Fast Track” system.
2.7 Political Interference in Contractor¹s Business Issues: It has been the experience of some contractors (local and foreign) that political officials have instructed that certain persons should go on their payroll. In some cases contractors are told which equipment rental, material suppliers and sub contractors to use. This practice has led to time delays, cost overruns, and may even have served to create the extortion rackets now being carried out openly. Political representatives must stop the practice of “forcing” labour and/or laison officers unto construction projects. They should make it clear by public announcements that the selection of labour and management of the construction sites are the prerogatives of the contractors. As such, the contractor is free to choose suitable workers based on the particular skills and other attributes required. A national certification/registration of trades-people in the industry should be established. This will give contractors the ability to identify and assess the skills and abilities while at the same time allowing applicants a fair opportunity to get work. HEART Academies, NCTVET and other vocational training institutions should work jointly with the trade unions, Ministry of Labour and the I.M.A.J. to train and employee workers for the industry, including many of those unskilled and semi-skilled persons who are being foisted upon the contractors. Wider access to training for a larger number of persons together with the registration system proposed, will create a larger cadre of skilled and semi skilled workers who are mobile. This will serve to alleviate the pressure on construction sites to employ workers whose only claim to employment is the fact that the job is being undertaken in his/her area. In instances where, political selection of labour or other input is forced upon the contractor, the contract provisions and consultants should support the contractor’s right to claim for any additional cost that is incurred contingent on such interference.
2.8 Protection Racket: Building contractors, sub-contractors and tradesmen are
forced by criminals to pay to prevent physical harm, theft and work Stoppage. The cost to the project, industry and nation are immeasurable. Examples of this situation were reported in the Gleaner of Sunday October 19, 1997 under
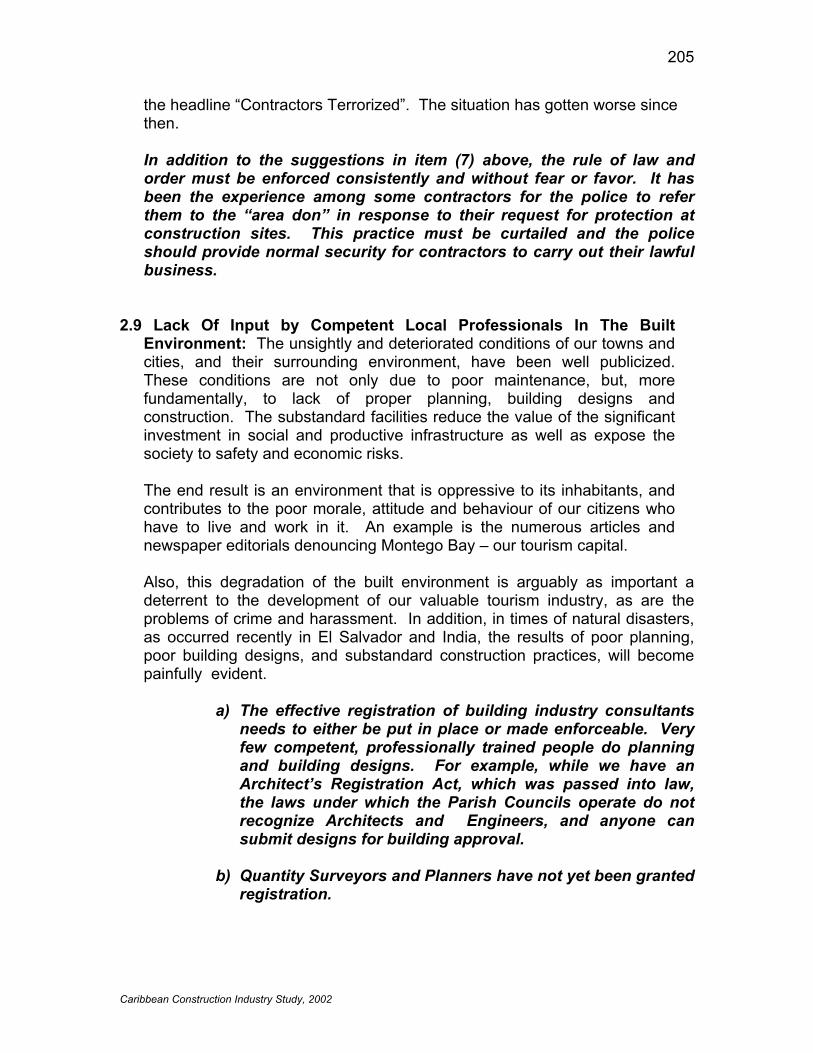
205
Caribbean Construction Industry Study, 2002
the headline “Contractors Terrorized”. The situation has gotten worse since then. In addition to the suggestions in item (7) above, the rule of law and order must be enforced consistently and without fear or favor. It has been the experience among some contractors for the police to refer them to the “area don” in response to their request for protection at construction sites. This practice must be curtailed and the police should provide normal security for contractors to carry out their lawful business.
2.9 Lack Of Input by Competent Local Professionals In The Built
Environment: The unsightly and deteriorated conditions of our towns and cities, and their surrounding environment, have been well publicized. These conditions are not only due to poor maintenance, but, more fundamentally, to lack of proper planning, building designs and construction. The substandard facilities reduce the value of the significant investment in social and productive infrastructure as well as expose the society to safety and economic risks. The end result is an environment that is oppressive to its inhabitants, and contributes to the poor morale, attitude and behaviour of our citizens who have to live and work in it. An example is the numerous articles and newspaper editorials denouncing Montego Bay – our tourism capital. Also, this degradation of the built environment is arguably as important a deterrent to the development of our valuable tourism industry, as are the problems of crime and harassment. In addition, in times of natural disasters, as occurred recently in El Salvador and India, the results of poor planning, poor building designs, and substandard construction practices, will become painfully evident.
a) The effective registration of building industry consultants
needs to either be put in place or made enforceable. Very few competent, professionally trained people do planning and building designs. For example, while we have an Architect’s Registration Act, which was passed into law, the laws under which the Parish Councils operate do not recognize Architects and Engineers, and anyone can submit designs for building approval.
b) Quantity Surveyors and Planners have not yet been granted
registration.
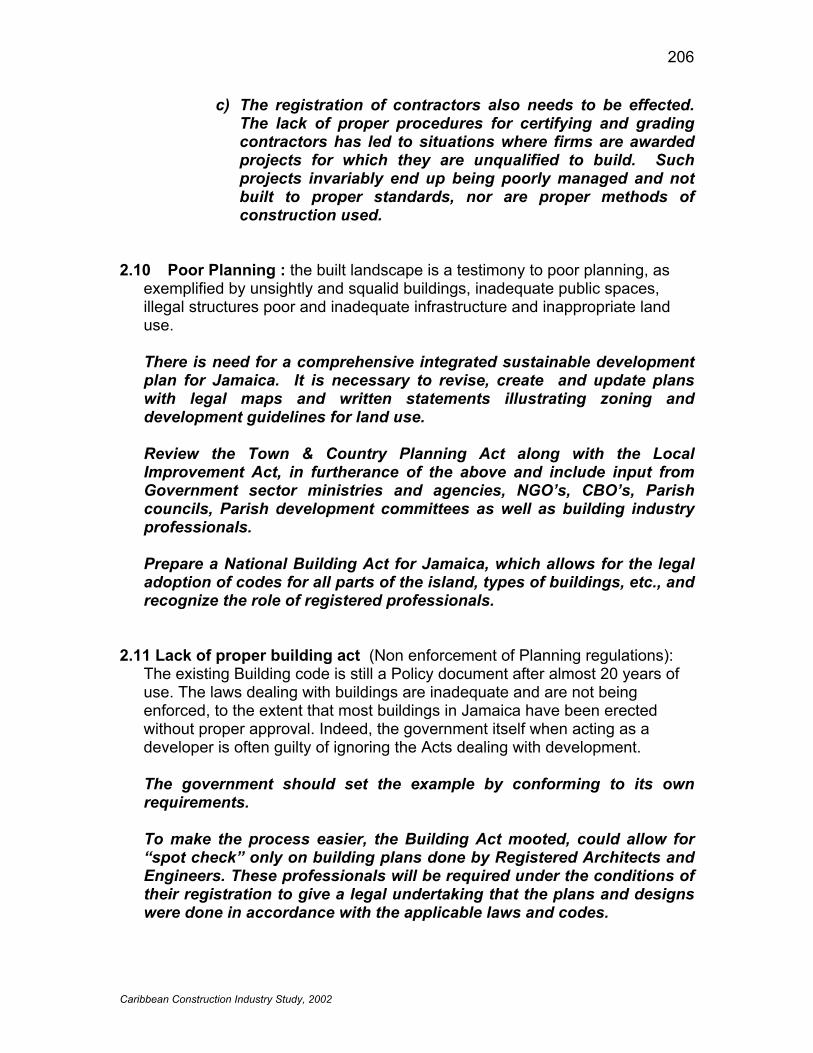
206
Caribbean Construction Industry Study, 2002
c) The registration of contractors also needs to be effected. The lack of proper procedures for certifying and grading contractors has led to situations where firms are awarded projects for which they are unqualified to build. Such projects invariably end up being poorly managed and not built to proper standards, nor are proper methods of construction used.
2.10 Poor Planning : the built landscape is a testimony to poor planning, as
exemplified by unsightly and squalid buildings, inadequate public spaces, illegal structures poor and inadequate infrastructure and inappropriate land use.
There is need for a comprehensive integrated sustainable development plan for Jamaica. It is necessary to revise, create and update plans with legal maps and written statements illustrating zoning and development guidelines for land use.
Review the Town & Country Planning Act along with the Local Improvement Act, in furtherance of the above and include input from Government sector ministries and agencies, NGO’s, CBO’s, Parish councils, Parish development committees as well as building industry professionals. Prepare a National Building Act for Jamaica, which allows for the legal adoption of codes for all parts of the island, types of buildings, etc., and recognize the role of registered professionals.
2.11 Lack of proper building act (Non enforcement of Planning regulations):
The existing Building code is still a Policy document after almost 20 years of use. The laws dealing with buildings are inadequate and are not being enforced, to the extent that most buildings in Jamaica have been erected without proper approval. Indeed, the government itself when acting as a developer is often guilty of ignoring the Acts dealing with development.
The government should set the example by conforming to its own
requirements. To make the process easier, the Building Act mooted, could allow for
“spot check” only on building plans done by Registered Architects and Engineers. These professionals will be required under the conditions of their registration to give a legal undertaking that the plans and designs were done in accordance with the applicable laws and codes.

207
Caribbean Construction Industry Study, 2002
2.12 Unfair Competition from Government: Government uses it’s resources (land & money) to unfairly compete with the private sector. This is particularly reflected in Government’s dominance of the housing sector using bridgeing and mortgage financing. There presently exists a virtual monopoly and dominance by Government in almost every area of construction development. When this occurs in areas that should best be carried out by the private sector, Government’s land resources, access to money, power to direct or bypass the approvals process, and their economic policies, present unfair competition. Examples exist in housing construction, resort hotels and financing. As pointed out in an article Business Observer Newspaper of Wednesday, December 27, 2000), titled, “Government Crowding Out Private Sector” …..“The debt secured by the state through the issue of Treasury Bills, Local Registered Stock and FINSAC Paper are far cheaper than the rates at which the private sector is able to secure loans.”
The very serious problems, which have resulted, include:
a) An ever expanding Government bureaucracy, with more and more agencies of Government setting up their own teams of Project Managers, Planners, Architects, Engineers, and Quantity Surveyors, and in the case of the Ministry of Housing – their own contracting company. The expansion also holds true for Government’s financial entities such as the National Housing Trust, whose portfolio has expanded into the provision of student housing for non-NHT contributors, and to the planning and development of a New Town!
Several of these agencies have overlapping functions, which lend themselves to duplication of expenses, lack of proper coordination and general waste. Examples include sidewalk-upgrading work being carried out by the Ministry of Water and Housing, Lift Up Jamaica, the Parish Councils, Ministry of Works, SESP and other programs. In Housing, developments have been carried out by UDC, NHT, Ministry of Housing, NHDC incorporating Operation Pride, the Civil Service Housing Company, and the now abandoned Sugar Workers Housing, to name a few.
b) The institutionalized waste of taxpayers money. The much-publicized
number of houses being built or financed by the NHT and the Ministry of Housing is in reality nothing more than the utilization of tax dollars to establish a very costly bureaucracy, providing land and subsidized loans

208
Caribbean Construction Industry Study, 2002
to selected developers/contractors, and also, to provide subsidized mortgages The NHT’s audited report ending March 2000, recorded expenditures of $1,441,835,000, which included mortgage loss provisions of $180,721,000 and losses on projects of $156,742,000 ! While it is understandable to provide assistance to the very needy, it is very questionable when scarce public resources are used to subsidize middle income and luxury homes and lots, such as currently taking place on Long Mountain.
The end result of this is the ever-increasing pressure for Government to extract more taxes, and to borrow more, and the stifling of private sector investments and initiatives.
It would be a far greater achievement to be able to declare that the economy was buoyant enough to allow the same number of individuals, or more, to save money earned from their jobs, access mortgages from private lending institutions, and buy houses from private developers. All at no cost to the taxpayers.
The solutions for this situation can only begin with acceptance by all concerned that self-interest is what provides the motivation for cost effectiveness and management efficiency, and that governments (in general) tend to be wasteful and inefficient. For this reason, Government should clearly identify what its core function needs to be (e.g. it should not include investments in luxury hotels or middle and upper income housing schemes). It needs to establish a policy framework, within which the private sector is encouraged to actively participate, without the need for Government’s patronage through individual subsidies.
In addition to action on the proposals contained herein, these policies should include: a) Lowering of interest rates (as outlined in the section entitled High Interest
Rates)
b) A tax credit for mortgage interest paid on one’s primary residence.
c) A speeding up of the approval process for development, buildings and subdivisions, and a requirement that all Government agencies doing developments go through the same process and abide by the same rules and regulations.

209
Caribbean Construction Industry Study, 2002
d) Government housing solutions undertaken on land that it owns, requires no transfer tax or stamp duty to be paid by the beneficiary. A similar benefit should be extended to private developers, or a reduction in the transfer tax.
e) A homestead exemption, where anyone selling his primary residence to
buy another within a year of selling, can get a credit for the transfer tax (7½%) and stamp duty (2¾%) paid.
2.13 High Interest Rates: The high interest rates which have prevailed for the past decade is arguably the single most important factor which has contributed to the decline and closures of businesses and financial institutions in general, and to the demise of private sector participation in the construction industry. Some of the ways in which the construction industry has been affected by high interest rates are as follows:
a) Potential investors have been able to get a relatively high return on their
capital without the effort and risk required to set up businesses or do real estate developments.
b) The high cost of money and taxes inflated the overall costs of projects to a
point where the market could no longer support them. c) High mortgage costs made it difficult for individuals to afford to purchase
residential or commercial properties. d) With the job layoffs and closures experienced by many businesses, both
commercial and residential properties became available at depreciated values. This further exacerbated the demand and feasibility of real estate development.
We realize that the Government and the various economists in the country have recognized the importance of lowering interest rates, and that achieving this on a sustainable basis has so far been elusive. However, we believe that the Minister of Finance, the Hon. Omar Davies, articulated the solution, when he said in a radio interview, that to lower interest rates, all that would be required is to borrow less and pay down the principal on existing loans. In order to assist in achieving this goal, we are recommending that the government redefines it’s core functions, that there be greater

210
Caribbean Construction Industry Study, 2002
prioritization of projects chosen for implementation, and that there be better management and accountability for projects implemented. a) Core Functions
If the government were to minimize it’s involvement in certain areas of development which should best be left to the private sector, it would greatly reduce it’s needs for ever increasing revenues and loans. One such area is in the provision of and subsidies for middle income and luxury homes. It is also arguable, that if the potential for IT (Information Technology) is so appealing, why are we spending so much money in setting up these operations to hand over to foreigners, instead of letting them bear the brunt of these “investments”?
b) Prioritization
As an example of the need for prioritization, the majority of existing roads into and around our towns and cities have been in deplorable conditions. This has had negative impact on the ability of citizens to travel to work and to transport goods, or for tourists to travel to attractions etc. While these road conditions have not been addressed, the North Coast Highway was implemented, with all its attendant cost overruns and delays. Although this work is still incomplete, along with the South Gully project in Montego Bay, bidding is proceeding to not only implement phase 2 of the Northern Coastal Highway, but to implement the first phase of Highway 2000! It is arguable, that by spending a fraction of the money earmarked for these highway projects on upgrading the existing road network, and by addressing needed improvements and maintenance of our towns and cities, the payback would be more immediate and tangible in relation to improved morale and productivity of our citizens and the benefits to the tourism sector.
c) Management and Accountability
The track record on Government administered projects has not been good, as the Auditor General’s reports have regularly highlighted every year.
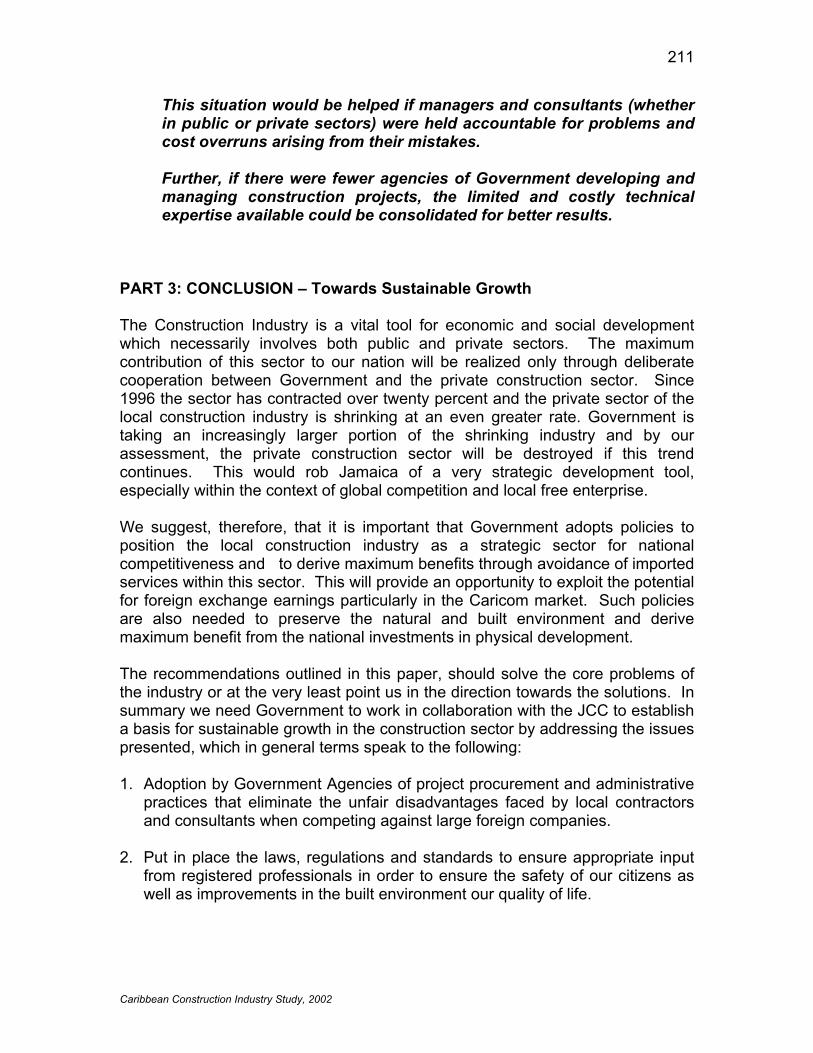
211
Caribbean Construction Industry Study, 2002
This situation would be helped if managers and consultants (whether in public or private sectors) were held accountable for problems and cost overruns arising from their mistakes. Further, if there were fewer agencies of Government developing and managing construction projects, the limited and costly technical expertise available could be consolidated for better results.
PART 3: CONCLUSION – Towards Sustainable Growth The Construction Industry is a vital tool for economic and social development which necessarily involves both public and private sectors. The maximum contribution of this sector to our nation will be realized only through deliberate cooperation between Government and the private construction sector. Since 1996 the sector has contracted over twenty percent and the private sector of the local construction industry is shrinking at an even greater rate. Government is taking an increasingly larger portion of the shrinking industry and by our assessment, the private construction sector will be destroyed if this trend continues. This would rob Jamaica of a very strategic development tool, especially within the context of global competition and local free enterprise. We suggest, therefore, that it is important that Government adopts policies to position the local construction industry as a strategic sector for national competitiveness and to derive maximum benefits through avoidance of imported services within this sector. This will provide an opportunity to exploit the potential for foreign exchange earnings particularly in the Caricom market. Such policies are also needed to preserve the natural and built environment and derive maximum benefit from the national investments in physical development. The recommendations outlined in this paper, should solve the core problems of the industry or at the very least point us in the direction towards the solutions. In summary we need Government to work in collaboration with the JCC to establish a basis for sustainable growth in the construction sector by addressing the issues presented, which in general terms speak to the following: 1. Adoption by Government Agencies of project procurement and administrative
practices that eliminate the unfair disadvantages faced by local contractors and consultants when competing against large foreign companies.
2. Put in place the laws, regulations and standards to ensure appropriate input
from registered professionals in order to ensure the safety of our citizens as well as improvements in the built environment our quality of life.

212
Caribbean Construction Industry Study, 2002
3. Improve the physical planning and development approval systems by optimization of the processes, participation of registered professionals, consolidating the various Government agencies and providing them with adequate resources.
4. Give the private sector of the construction industry opportunities for greater
participation by crafting approaches that reduce the need for extensive Government activities and allow access to the land and financial resources now being used by Government.
5. Create the market environment that facilitates private sector initiative and
viability of developers, contractors and consultants. The JCC request that Government immediately establishes a medium for working with the construction industry players towards implementation of the recommendations put forward in this paper starting within the next three months.

213
Caribbean Construction Industry Study, 2002
APPENDIX IX Summary “Statistics At a Glance” for Each Territory Antigua & Barbuda Bahamas Barbados Belize Dominica Grenada Guyana 1 Guyana 2 Jamaica 1 Jamaica 2 St Kitts and Nevis St Lucia St Vincent and the Grenadines Suriname Trinidad & Tobago 1 Trinidad & Tobago 2

Antigua and Barbuda at a glance 9/13/00
Antigua Latin Upper-POVERTY and SOCIAL and America middle-
Barbuda & Carib. income1999Population, mid-year (millions) 0.07 509 573GNP per capita (Atlas method, US$) 8,990 3,840 4,900GNP (Atlas method, US$ billions) 0.61 1,955 2,811
Average annual growth, 1993-99
Population (%) 0.7 1.6 1.4Labor force (%) .. 2.5 2.1
Most recent estimate (latest year available, 1993-99)
Poverty (% of population below national poverty line) .. .. ..Urban population (% of total population) 37 75 76Life expectancy at birth (years) 75 70 70Infant mortality (per 1,000 live births) 17 31 27Child malnutrition (% of children under 5) 10 8 7Access to improved water source (% of population) 95 75 78Illiteracy (% of population age 15+) 5 12 10Gross primary enrollment (% of school-age population) 105 113 109 Male .. .. .. Female .. .. ..
KEY ECONOMIC RATIOS and LONG-TERM TRENDS
1979 1989 1998 1999
GDP (US$ billions) 0.09 0.37 0.62 0.64Gross domestic investment/GDP 24.3 41.2 32.2 29.8Exports of goods and services/GDP 81.8 81.0 72.0 71.1Gross domestic savings/GDP 30.6 31.5 20.8 13.7Gross national savings/GDP 39.6 23.1 20.7 14.5
Current account balance/GDP -21.1 -21.2 -11.5 -15.3Interest payments/GDP 2.2 2.4 .. ..Total debt/GDP 33.6 55.9 .. ..Total debt service/exports 5.9 4.5 .. ..Present value of debt/GDP .. .. .. ..Present value of debt/exports .. .. .. ..
1979-89 1989-99 1998 1999 1999-03(average annual growth)GDP 6.9 3.1 4.4 4.6 ..GNP per capita 5.0 3.4 3.6 4.5 ..Exports of goods and services 8.4 0.6 0.3 3.3 ..
STRUCTURE of the ECONOMY1979 1989 1998 1999
(% of GDP)Agriculture 8.2 4.0 4.0 3.9Industry 15.8 22.0 18.9 19.2 Manufacturing 4.9 3.1 2.3 2.2Services 76.0 74.0 77.1 76.8
Private consumption 51.0 49.5 57.6 62.9General government consumption 18.4 19.0 21.7 23.4Imports of goods and services 75.5 90.8 83.5 87.2
1979-89 1989-99 1998 1999(average annual growth)Agriculture -2.3 0.9 4.2 3.3Industry 10.0 2.9 7.7 6.2 Manufacturing 5.0 -0.3 5.5 4.0Services 6.4 3.2 2.9 4.2
Private consumption 5.5 5.7 24.6 14.3General government consumption 6.5 5.7 9.3 12.7Gross domestic investment 10.4 2.2 -18.7 -3.2Imports of goods and services 8.4 2.5 2.9 9.3Gross national product 5.5 4.0 4.5 5.4
Note: 1999 data are preliminary estimates.
* The diamonds show four key indicators in the country (in bold) compared with its income-group average. If data are missing, the diamond will be incomplete.
-30
-15
0
15
94 95 96 97 98 99
GDI GDP
Growth of investment and GDP (%)
Antigua and Barbuda
Upper-middle-income group
Development diamond*
Life expectancy
Access to safe water
GNPpercapita
Grossprimary
enrollment
-15
-10
-5
0
5
10
94 95 96 97 98 99
Exports Imports
Growth of exports and imports (%)
Antigua and Barbuda
Upper-middle-income group
Economic ratios*
Trade
DomesticSavings
Investment
Indebtedness
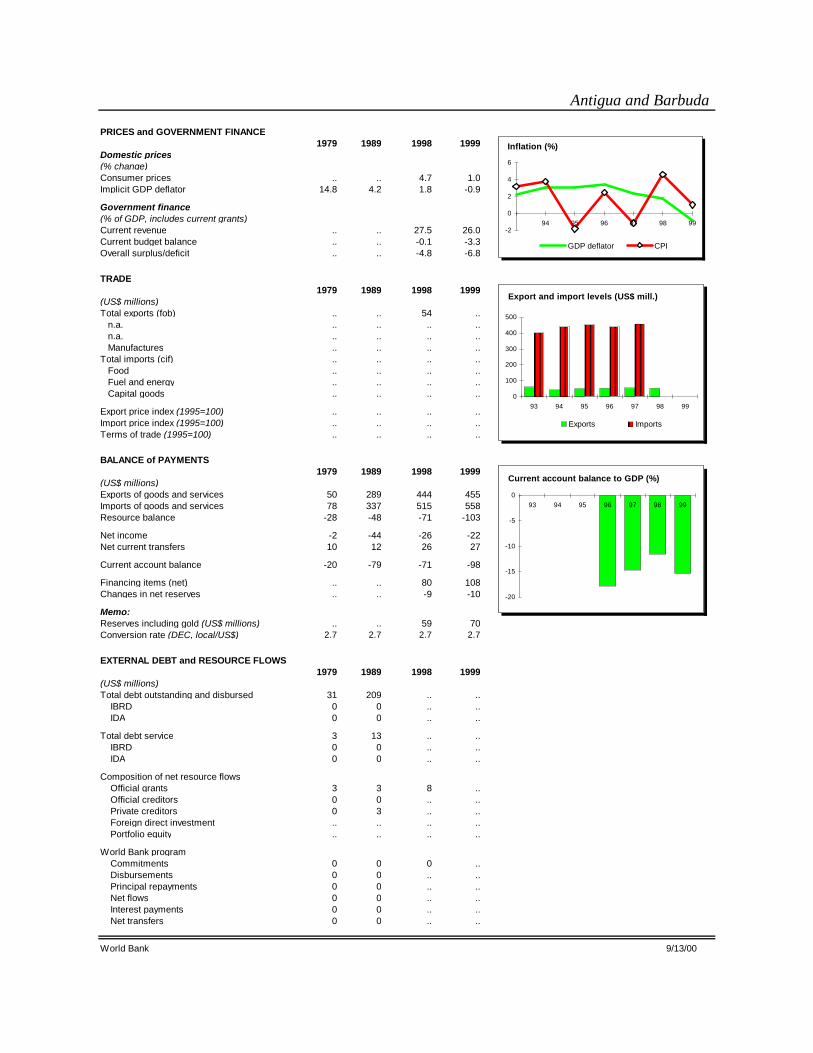
Antigua and Barbuda
PRICES and GOVERNMENT FINANCE1979 1989 1998 1999
Domestic prices(% change)Consumer prices .. .. 4.7 1.0Implicit GDP deflator 14.8 4.2 1.8 -0.9
Government finance(% of GDP, includes current grants)Current revenue .. .. 27.5 26.0Current budget balance .. .. -0.1 -3.3Overall surplus/deficit .. .. -4.8 -6.8
TRADE1979 1989 1998 1999
(US$ millions)Total exports (fob) .. .. 54 .. n.a. .. .. .. .. n.a. .. .. .. .. Manufactures .. .. .. ..Total imports (cif) .. .. .. .. Food .. .. .. .. Fuel and energy .. .. .. .. Capital goods .. .. .. ..
Export price index (1995=100) .. .. .. ..Import price index (1995=100) .. .. .. ..Terms of trade (1995=100) .. .. .. ..
BALANCE of PAYMENTS1979 1989 1998 1999
(US$ millions)Exports of goods and services 50 289 444 455Imports of goods and services 78 337 515 558Resource balance -28 -48 -71 -103
Net income -2 -44 -26 -22Net current transfers 10 12 26 27
Current account balance -20 -79 -71 -98
Financing items (net) .. .. 80 108Changes in net reserves .. .. -9 -10
Memo:Reserves including gold (US$ millions) .. .. 59 70Conversion rate (DEC, local/US$) 2.7 2.7 2.7 2.7
EXTERNAL DEBT and RESOURCE FLOWS1979 1989 1998 1999
(US$ millions)Total debt outstanding and disbursed 31 209 .. .. IBRD 0 0 .. .. IDA 0 0 .. ..
Total debt service 3 13 .. .. IBRD 0 0 .. .. IDA 0 0 .. ..
Composition of net resource flows Official grants 3 3 8 .. Official creditors 0 0 .. .. Private creditors 0 3 .. .. Foreign direct investment .. .. .. .. Portfolio equity .. .. .. ..
World Bank program Commitments 0 0 0 .. Disbursements 0 0 .. .. Principal repayments 0 0 .. .. Net flows 0 0 .. .. Interest payments 0 0 .. .. Net transfers 0 0 .. ..
World Bank 9/13/00
-2
0
2
4
6
94 95 96 97 98 99
GDP deflator CPI
Inflation (%)
-20
-15
-10
-5
093 94 95 96 97 98 99
Current account balance to GDP (%)
0
100
200
300
400
500
93 94 95 96 97 98 99
Exports Imports
Export and import levels (US$ mill.)

The Bahamas at a glance 8/9/00
POVERTY and SOCIAL The High-
Bahamas income1999Population, mid-year (millions) 0.30 891GNP per capita (Atlas method, US$) .. 25,730GNP (Atlas method, US$ billions) .. 22,921
Average annual growth, 1993-99
Population (%) 1.8 0.6Labor force (%) 2.8 0.8
Most recent estimate (latest year available, 1993-99)
Poverty (% of population below national poverty line) .. ..Urban population (% of total population) 88 77Life expectancy at birth (years) 74 78Infant mortality (per 1,000 live births) 17 6Child malnutrition (% of children under 5) .. ..Access to improved water source (% of population) 97 ..Illiteracy (% of population age 15+) 4 < 5Gross primary enrollment (% of school-age population) 98 103 Male .. 104 Female .. 103
KEY ECONOMIC RATIOS and LONG-TERM TRENDS
1979 1989 1998 1999
GDP (US$ billions) 1.1 3.0 .. ..Gross domestic investment/GDP 12.8 .. .. ..Exports of goods and services/GDP 68.9 .. .. ..Gross domestic savings/GDP 21.5 .. .. ..Gross national savings/GDP 10.5 .. .. ..
Current account balance/GDP -3.8 -2.8 .. ..Interest payments/GDP .. .. .. ..Total debt/GDP .. .. .. ..Total debt service/exports .. .. .. ..Present value of debt/GDP .. .. .. ..Present value of debt/exports .. .. .. ..
1979-89 1989-99 1998 1999 1999-03(average annual growth)GDP 4.0 -0.4 .. .. ..GNP per capita 2.4 -1.1 1.2 .. ..Exports of goods and services 5.5 .. .. .. ..
STRUCTURE of the ECONOMY1979 1989 1998 1999
(% of GDP)Agriculture .. .. .. ..Industry .. .. .. .. Manufacturing .. .. .. ..Services .. .. .. ..
Private consumption 65.9 .. .. ..General government consumption 12.6 .. .. ..Imports of goods and services 60.2 .. .. ..
1979-89 1989-99 1998 1999(average annual growth)Agriculture .. .. .. ..Industry .. .. .. .. Manufacturing .. .. .. ..Services .. .. .. ..
Private consumption 5.6 .. .. ..General government consumption 4.4 .. .. ..Gross domestic investment 8.8 .. .. ..Imports of goods and services 8.2 .. .. ..Gross national product 4.3 0.7 3.0 ..
Note: 1999 data are preliminary estimates.This table was produced from the Development Economics central database.* The diamonds show four key indicators in the country (in bold) compared with its income-group average. If data are missing, the diamond will be incomplete.
-1
0
1
2
3
94 95 96 97 98 99
GDI GDP
Growth rates of output and investment (%)
The Bahamas
High-income group
Development diamond*
Life expectancy
Access to safe water
GNPpercapita
Grossprimary
enrollment
The Bahamas
High-income group
Economic ratios*
Trade
DomesticSavings
Investment
Indebtedness

The Bahamas
PRICES and GOVERNMENT FINANCE1979 1989 1998 1999
Domestic prices(% change)Consumer prices 9.1 5.4 1.3 1.3Implicit GDP deflator 8.6 3.3 .. ..
Government finance(% of GDP, includes current grants)Current revenue .. .. .. ..Current budget balance .. .. .. ..Overall surplus/deficit 0.6 -4.1 -1.9 ..
TRADE1979 1989 1998 1999
(US$ millions)Total exports (fob) .. 946 2,000 .. Food and agricultural raw materials 39 .. .. .. Fuels, ores, and metals 2,095 .. .. .. Manufactures 155 .. .. ..Total imports (cif) .. 1,516 2,230 .. Food 95 .. .. .. Fuel and energy 946 .. .. .. Manufactures 289 .. .. ..
Export price index (1995=100) .. .. .. ..Import price index (1995=100) .. .. .. ..Terms of trade (1995=100) .. .. .. ..
BALANCE of PAYMENTS1979 1989 1998 1999
(US$ millions)Exports of goods and services 4,235 1,695 1,892 ..Imports of goods and services 4,142 1,654 2,330 ..Resource balance 93 42 -438 ..
Net income -134 -132 -190 ..Net current transfers -2 6 34 ..
Current account balance -43 -84 -594 ..
Financing items (net) 58 59 713 ..Changes in net reserves -15 25 -119 ..
Memo:Reserves including gold (US$ millions) 86 147 347 410Conversion rate (DEC, local/US$) 1.0 1.0 .. ..
EXTERNAL DEBT and RESOURCE FLOWS1979 1989 1998 1999
(US$ millions)Total debt outstanding and disbursed .. .. .. .. IBRD .. .. .. .. IDA .. .. .. ..
Total debt service .. .. .. .. IBRD .. .. .. .. IDA .. .. .. ..
Composition of net resource flows Official grants .. .. .. .. Official creditors .. .. .. .. Private creditors .. .. .. .. Foreign direct investment 10 25 235 .. Portfolio equity .. .. .. ..
World Bank program Commitments .. .. .. .. Disbursements .. .. .. .. Principal repayments .. .. .. .. Net flows .. .. .. .. Interest payments .. .. .. .. Net transfers .. .. .. ..
World Bank 8/9/00
0
1
2
3
4
94 95 96 97 98 99
GDP deflator CPI
Inflation (%)
-8
-4
0
4
93 94 95 96 97 98 99
Current account balance to GDP ratio (%)
0
1,000
2,000
3,000
93 94 95 96 97 98 99
Exports Imports
Export and import levels (US$ millions)
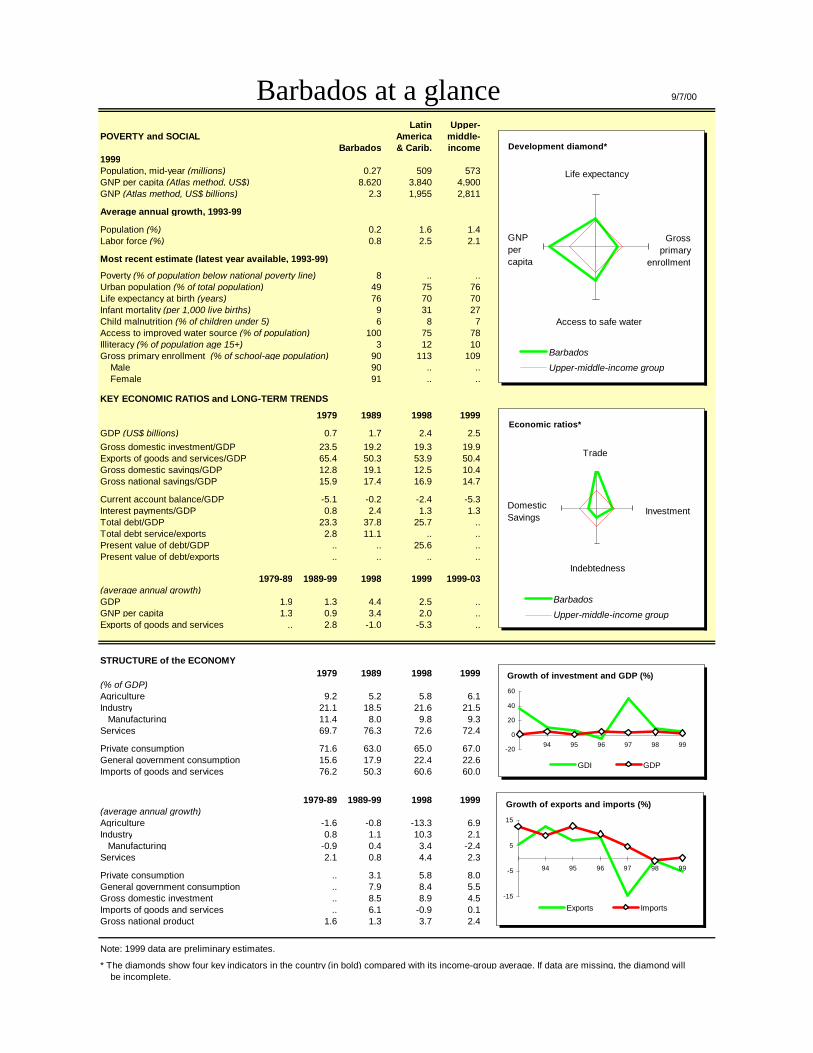
Barbados at a glance 9/7/00
Latin Upper-POVERTY and SOCIAL America middle-
Barbados & Carib. income1999Population, mid-year (millions) 0.27 509 573GNP per capita (Atlas method, US$) 8,620 3,840 4,900GNP (Atlas method, US$ billions) 2.3 1,955 2,811
Average annual growth, 1993-99
Population (%) 0.2 1.6 1.4Labor force (%) 0.8 2.5 2.1
Most recent estimate (latest year available, 1993-99)
Poverty (% of population below national poverty line) 8 .. ..Urban population (% of total population) 49 75 76Life expectancy at birth (years) 76 70 70Infant mortality (per 1,000 live births) 9 31 27Child malnutrition (% of children under 5) 6 8 7Access to improved water source (% of population) 100 75 78Illiteracy (% of population age 15+) 3 12 10Gross primary enrollment (% of school-age population) 90 113 109 Male 90 .. .. Female 91 .. ..
KEY ECONOMIC RATIOS and LONG-TERM TRENDS
1979 1989 1998 1999
GDP (US$ billions) 0.7 1.7 2.4 2.5Gross domestic investment/GDP 23.5 19.2 19.3 19.9Exports of goods and services/GDP 65.4 50.3 53.9 50.4Gross domestic savings/GDP 12.8 19.1 12.5 10.4Gross national savings/GDP 15.9 17.4 16.9 14.7
Current account balance/GDP -5.1 -0.2 -2.4 -5.3Interest payments/GDP 0.8 2.4 1.3 1.3Total debt/GDP 23.3 37.8 25.7 ..Total debt service/exports 2.8 11.1 .. ..Present value of debt/GDP .. .. 25.6 ..Present value of debt/exports .. .. .. ..
1979-89 1989-99 1998 1999 1999-03(average annual growth)GDP 1.9 1.3 4.4 2.5 ..GNP per capita 1.3 0.9 3.4 2.0 ..Exports of goods and services .. 2.8 -1.0 -5.3 ..
STRUCTURE of the ECONOMY1979 1989 1998 1999
(% of GDP)Agriculture 9.2 5.2 5.8 6.1Industry 21.1 18.5 21.6 21.5 Manufacturing 11.4 8.0 9.8 9.3Services 69.7 76.3 72.6 72.4
Private consumption 71.6 63.0 65.0 67.0General government consumption 15.6 17.9 22.4 22.6Imports of goods and services 76.2 50.3 60.6 60.0
1979-89 1989-99 1998 1999(average annual growth)Agriculture -1.6 -0.8 -13.3 6.9Industry 0.8 1.1 10.3 2.1 Manufacturing -0.9 0.4 3.4 -2.4Services 2.1 0.8 4.4 2.3
Private consumption .. 3.1 5.8 8.0General government consumption .. 7.9 8.4 5.5Gross domestic investment .. 8.5 8.9 4.5Imports of goods and services .. 6.1 -0.9 0.1Gross national product 1.6 1.3 3.7 2.4
Note: 1999 data are preliminary estimates.
* The diamonds show four key indicators in the country (in bold) compared with its income-group average. If data are missing, the diamond will be incomplete.
-20
0
20
40
60
94 95 96 97 98 99
GDI GDP
Growth of investment and GDP (%)
Barbados
Upper-middle-income group
Development diamond*
Life expectancy
Access to safe water
GNPpercapita
Grossprimary
enrollment
-15
-5
5
15
94 95 96 97 98 99
Exports Imports
Growth of exports and imports (%)
Barbados
Upper-middle-income group
Economic ratios*
Trade
DomesticSavings
Investment
Indebtedness
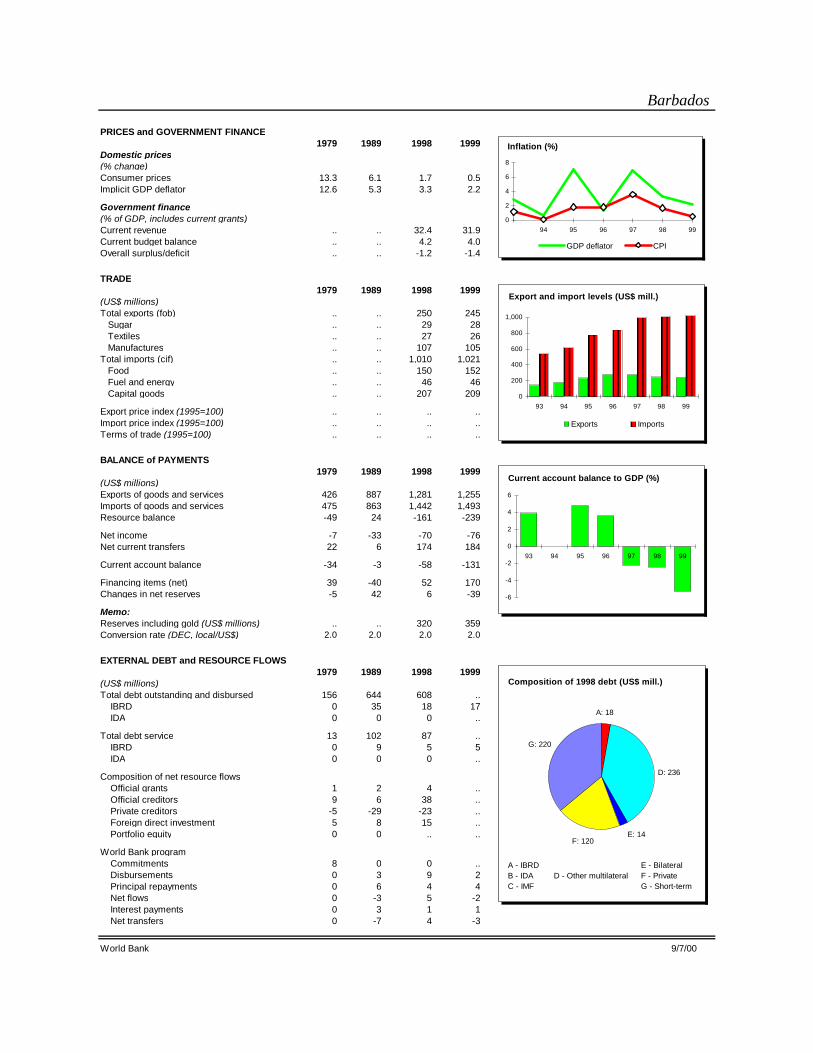
Barbados
PRICES and GOVERNMENT FINANCE1979 1989 1998 1999
Domestic prices(% change)Consumer prices 13.3 6.1 1.7 0.5Implicit GDP deflator 12.6 5.3 3.3 2.2
Government finance(% of GDP, includes current grants)Current revenue .. .. 32.4 31.9Current budget balance .. .. 4.2 4.0Overall surplus/deficit .. .. -1.2 -1.4
TRADE1979 1989 1998 1999
(US$ millions)Total exports (fob) .. .. 250 245 Sugar .. .. 29 28 Textiles .. .. 27 26 Manufactures .. .. 107 105Total imports (cif) .. .. 1,010 1,021 Food .. .. 150 152 Fuel and energy .. .. 46 46 Capital goods .. .. 207 209
Export price index (1995=100) .. .. .. ..Import price index (1995=100) .. .. .. ..Terms of trade (1995=100) .. .. .. ..
BALANCE of PAYMENTS1979 1989 1998 1999
(US$ millions)Exports of goods and services 426 887 1,281 1,255Imports of goods and services 475 863 1,442 1,493Resource balance -49 24 -161 -239
Net income -7 -33 -70 -76Net current transfers 22 6 174 184
Current account balance -34 -3 -58 -131
Financing items (net) 39 -40 52 170Changes in net reserves -5 42 6 -39
Memo:Reserves including gold (US$ millions) .. .. 320 359Conversion rate (DEC, local/US$) 2.0 2.0 2.0 2.0
EXTERNAL DEBT and RESOURCE FLOWS1979 1989 1998 1999
(US$ millions)Total debt outstanding and disbursed 156 644 608 .. IBRD 0 35 18 17 IDA 0 0 0 ..
Total debt service 13 102 87 .. IBRD 0 9 5 5 IDA 0 0 0 ..
Composition of net resource flows Official grants 1 2 4 .. Official creditors 9 6 38 .. Private creditors -5 -29 -23 .. Foreign direct investment 5 8 15 .. Portfolio equity 0 0 .. ..
World Bank program Commitments 8 0 0 .. Disbursements 0 3 9 2 Principal repayments 0 6 4 4 Net flows 0 -3 5 -2 Interest payments 0 3 1 1 Net transfers 0 -7 4 -3
World Bank 9/7/00
0
2
4
6
8
94 95 96 97 98 99
GDP deflator CPI
Inflation (%)
-6
-4
-2
0
2
4
6
93 94 95 96 97 98 99
Current account balance to GDP (%)
0
200
400
600
800
1,000
93 94 95 96 97 98 99
Exports Imports
Export and import levels (US$ mill.)
G: 220
A: 18
D: 236
F: 120E: 14
Composition of 1998 debt (US$ mill.)
A - IBRDB - IDA C - IMF
D - Other multilateralE - BilateralF - PrivateG - Short-term
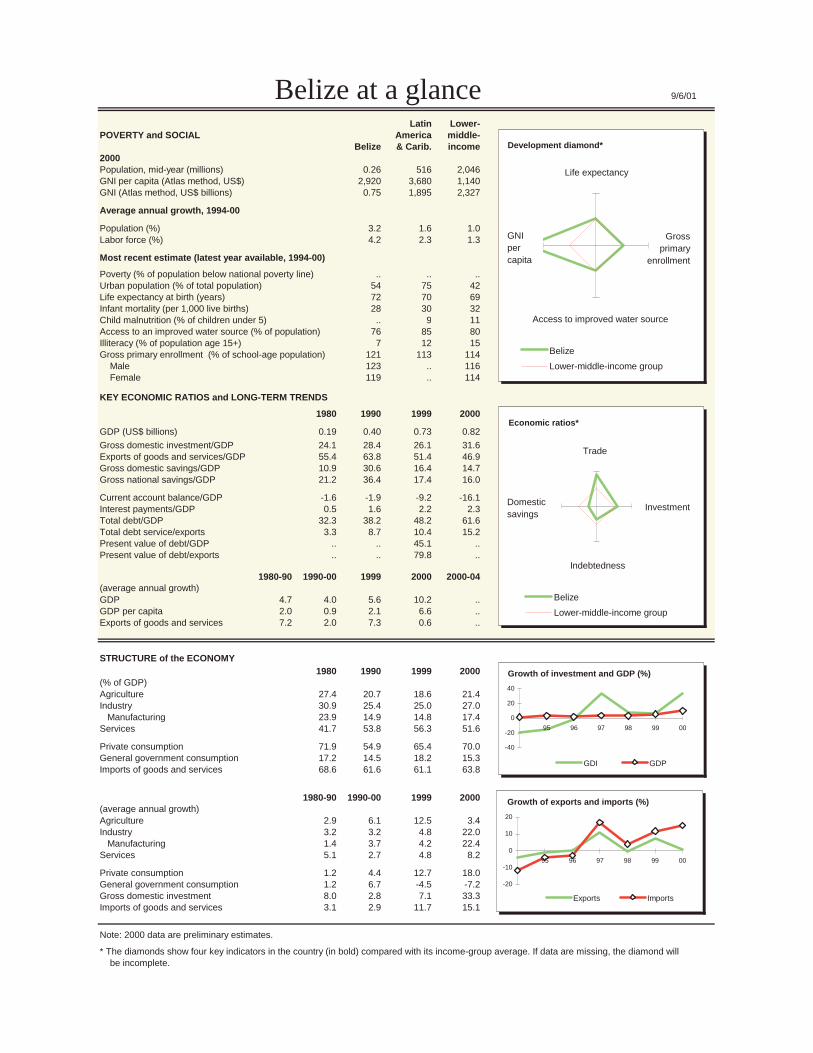
Belize at a glance 9/6/01
Latin Lower-POVERTY and SOCIAL America middle-
Belize & Carib. income2000Population, mid-year (millions) 0.26 516 2,046GNI per capita (Atlas method, US$) 2,920 3,680 1,140GNI (Atlas method, US$ billions) 0.75 1,895 2,327
Average annual growth, 1994-00
Population (%) 3.2 1.6 1.0Labor force (%) 4.2 2.3 1.3
Most recent estimate (latest year available, 1994-00)
Poverty (% of population below national poverty line) .. .. ..Urban population (% of total population) 54 75 42Life expectancy at birth (years) 72 70 69Infant mortality (per 1,000 live births) 28 30 32Child malnutrition (% of children under 5) .. 9 11Access to an improved water source (% of population) 76 85 80Illiteracy (% of population age 15+) 7 12 15Gross primary enrollment (% of school-age population) 121 113 114
Male 123 .. 116Female 119 .. 114
KEY ECONOMIC RATIOS and LONG-TERM TRENDS
1980 1990 1999 2000
GDP (US$ billions) 0.19 0.40 0.73 0.82
Gross domestic investment/GDP 24.1 28.4 26.1 31.6Exports of goods and services/GDP 55.4 63.8 51.4 46.9Gross domestic savings/GDP 10.9 30.6 16.4 14.7Gross national savings/GDP 21.2 36.4 17.4 16.0
Current account balance/GDP -1.6 -1.9 -9.2 -16.1Interest payments/GDP 0.5 1.6 2.2 2.3Total debt/GDP 32.3 38.2 48.2 61.6Total debt service/exports 3.3 8.7 10.4 15.2Present value of debt/GDP .. .. 45.1 ..Present value of debt/exports .. .. 79.8 ..
1980-90 1990-00 1999 2000 2000-04(average annual growth)GDP 4.7 4.0 5.6 10.2 ..GDP per capita 2.0 0.9 2.1 6.6 ..Exports of goods and services 7.2 2.0 7.3 0.6 ..
STRUCTURE of the ECONOMY1980 1990 1999 2000
(% of GDP)Agriculture 27.4 20.7 18.6 21.4Industry 30.9 25.4 25.0 27.0
Manufacturing 23.9 14.9 14.8 17.4Services 41.7 53.8 56.3 51.6
Private consumption 71.9 54.9 65.4 70.0General government consumption 17.2 14.5 18.2 15.3Imports of goods and services 68.6 61.6 61.1 63.8
1980-90 1990-00 1999 2000(average annual growth)Agriculture 2.9 6.1 12.5 3.4Industry 3.2 3.2 4.8 22.0
Manufacturing 1.4 3.7 4.2 22.4Services 5.1 2.7 4.8 8.2
Private consumption 1.2 4.4 12.7 18.0General government consumption 1.2 6.7 -4.5 -7.2Gross domestic investment 8.0 2.8 7.1 33.3Imports of goods and services 3.1 2.9 11.7 15.1
Note: 2000 data are preliminary estimates.
* The diamonds show four key indicators in the country (in bold) compared with its income-group average. If data are missing, the diamond willbe incomplete.
-40
-20
0
20
40
95 96 97 98 99 00
GDI GDP
Growth of investment and GDP (%)
Belize
Lower-middle-income group
Development diamond*
Life expectancy
Access to improved water source
GNIpercapita
Grossprimary
enrollment
-20
-10
0
10
20
95 96 97 98 99 00
Exports Imports
Growth of exports and imports (%)
Belize
Lower-middle-income group
Economic ratios*
Trade
Domesticsavings
Investment
Indebtedness

Belize
PRICES and GOVERNMENT FINANCE1980 1990 1999 2000
Domestic prices(% change)Consumer prices .. .. -1.1 1.0Implicit GDP deflator 11.4 0.3 3.3 2.0
Government finance(% of GDP, includes current grants)Current revenue .. .. 22.9 21.7Current budget balance .. .. 2.9 3.7Overall surplus/deficit .. .. -4.9 -6.1
TRADE1980 1990 1999 2000
(US$ millions)Total exports (fob) 82 142 213 212
Sugar .. 43 43 37Bananas .. 10 28 33Manufactures .. 20 21 20
Total imports (cif) .. 245 379 453Food .. .. 57 62Fuel and energy .. .. 33 38Capital goods .. 50 114 141
Export price index (1995=100) .. 106 86 78Import price index (1995=100) .. 102 94 96Terms of trade (1995=100) .. 103 91 81
BALANCE of PAYMENTS1980 1990 1999 2000
(US$ millions)Exports of goods and services 110 217 375 385Imports of goods and services 133 247 450 528Resource balance -23 -31 -75 -143
Net income -2 -7 -42 -53Net current transfers 22 30 49 64
Current account balance -3 -8 -67 -132
Financing items (net) 5 19 95 183Changes in net reserves -2 -11 -28 -51
Memo:Reserves including gold (US$ millions) .. .. 63 114Conversion rate (DEC, local/US$) 2.0 2.0 2.0 2.0
EXTERNAL DEBT and RESOURCE FLOWS1980 1990 1999 2000
(US$ millions)Total debt outstanding and disbursed 63 154 351 506
IBRD 0 18 41 40IDA 0 0 0 0
Total debt service 4 20 43 66IBRD 0 2 6 7IDA 0 0 0 0
Composition of net resource flowsOfficial grants 9 4 14 ..Official creditors 7 7 4 11Private creditors 6 6 12 145Foreign direct investment 0 17 4 ..Portfolio equity 0 0 0 ..
World Bank programCommitments 0 0 0 13Disbursements 0 3 3 2Principal repayments 0 1 3 4Net flows 0 3 0 -1Interest payments 0 1 3 3Net transfers 0 2 -3 -5
The World Bank Group: http://www.worldbank.org/data/ 9/6/01
-20
-15
-10
-5
0
94 95 96 97 98 99 00
Current account balance to GDP (%)
0
100
200
300
400
500
94 95 96 97 98 99 00
Exports Imports
Export and import levels (US$ mill.)
-2
0
2
4
6
8
95 96 97 98 99 00
GDP deflator CPI
Inflation (%)
G: 56 A: 40
D: 100
F: 223E: 87
Composition of 2000 debt (US$ mill.)
A - IBRDB - IDAC - IMF
D - Other multilateralE - BilateralF - PrivateG - Short-term
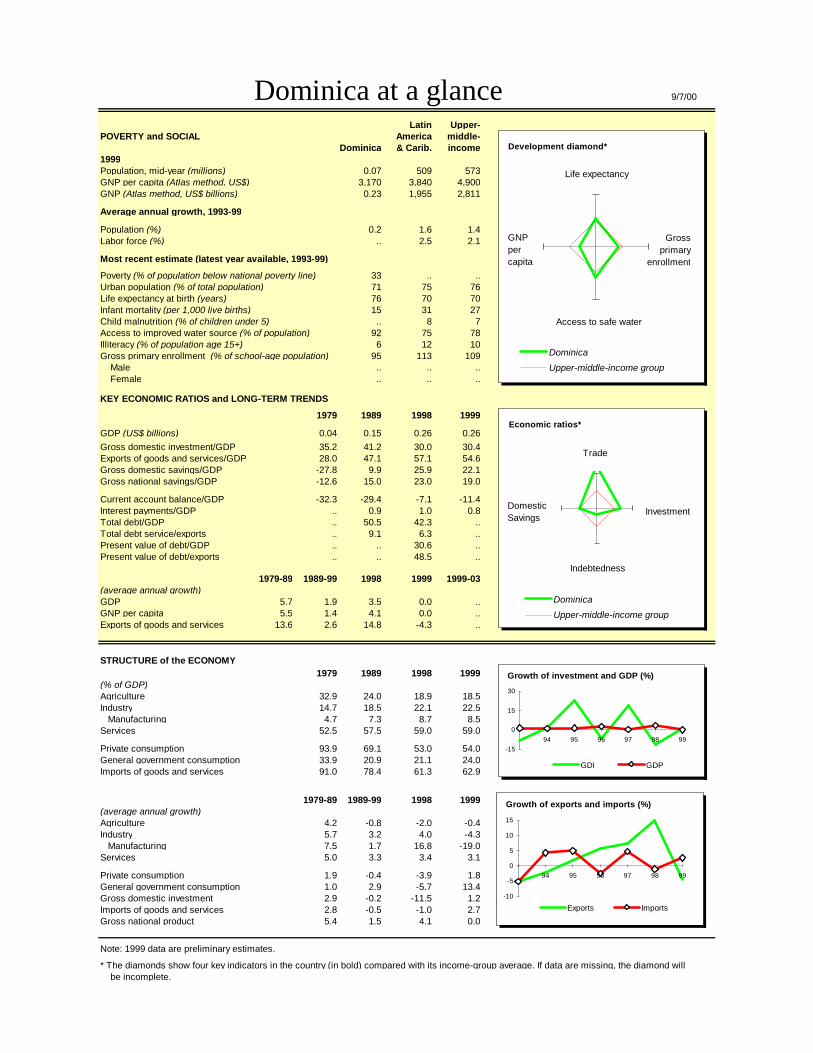
Dominica at a glance 9/7/00
Latin Upper-POVERTY and SOCIAL America middle-
Dominica & Carib. income1999Population, mid-year (millions) 0.07 509 573GNP per capita (Atlas method, US$) 3,170 3,840 4,900GNP (Atlas method, US$ billions) 0.23 1,955 2,811
Average annual growth, 1993-99
Population (%) 0.2 1.6 1.4Labor force (%) .. 2.5 2.1
Most recent estimate (latest year available, 1993-99)
Poverty (% of population below national poverty line) 33 .. ..Urban population (% of total population) 71 75 76Life expectancy at birth (years) 76 70 70Infant mortality (per 1,000 live births) 15 31 27Child malnutrition (% of children under 5) .. 8 7Access to improved water source (% of population) 92 75 78Illiteracy (% of population age 15+) 6 12 10Gross primary enrollment (% of school-age population) 95 113 109 Male .. .. .. Female .. .. ..
KEY ECONOMIC RATIOS and LONG-TERM TRENDS
1979 1989 1998 1999
GDP (US$ billions) 0.04 0.15 0.26 0.26Gross domestic investment/GDP 35.2 41.2 30.0 30.4Exports of goods and services/GDP 28.0 47.1 57.1 54.6Gross domestic savings/GDP -27.8 9.9 25.9 22.1Gross national savings/GDP -12.6 15.0 23.0 19.0
Current account balance/GDP -32.3 -29.4 -7.1 -11.4Interest payments/GDP .. 0.9 1.0 0.8Total debt/GDP .. 50.5 42.3 ..Total debt service/exports .. 9.1 6.3 ..Present value of debt/GDP .. .. 30.6 ..Present value of debt/exports .. .. 48.5 ..
1979-89 1989-99 1998 1999 1999-03(average annual growth)GDP 5.7 1.9 3.5 0.0 ..GNP per capita 5.5 1.4 4.1 0.0 ..Exports of goods and services 13.6 2.6 14.8 -4.3 ..
STRUCTURE of the ECONOMY1979 1989 1998 1999
(% of GDP)Agriculture 32.9 24.0 18.9 18.5Industry 14.7 18.5 22.1 22.5 Manufacturing 4.7 7.3 8.7 8.5Services 52.5 57.5 59.0 59.0
Private consumption 93.9 69.1 53.0 54.0General government consumption 33.9 20.9 21.1 24.0Imports of goods and services 91.0 78.4 61.3 62.9
1979-89 1989-99 1998 1999(average annual growth)Agriculture 4.2 -0.8 -2.0 -0.4Industry 5.7 3.2 4.0 -4.3 Manufacturing 7.5 1.7 16.8 -19.0Services 5.0 3.3 3.4 3.1
Private consumption 1.9 -0.4 -3.9 1.8General government consumption 1.0 2.9 -5.7 13.4Gross domestic investment 2.9 -0.2 -11.5 1.2Imports of goods and services 2.8 -0.5 -1.0 2.7Gross national product 5.4 1.5 4.1 0.0
Note: 1999 data are preliminary estimates.
* The diamonds show four key indicators in the country (in bold) compared with its income-group average. If data are missing, the diamond will be incomplete.
-15
0
15
30
94 95 96 97 98 99
GDI GDP
Growth of investment and GDP (%)
Dominica
Upper-middle-income group
Development diamond*
Life expectancy
Access to safe water
GNPpercapita
Grossprimary
enrollment
-10
-5
0
5
10
15
94 95 96 97 98 99
Exports Imports
Growth of exports and imports (%)
Dominica
Upper-middle-income group
Economic ratios*
Trade
DomesticSavings
Investment
Indebtedness
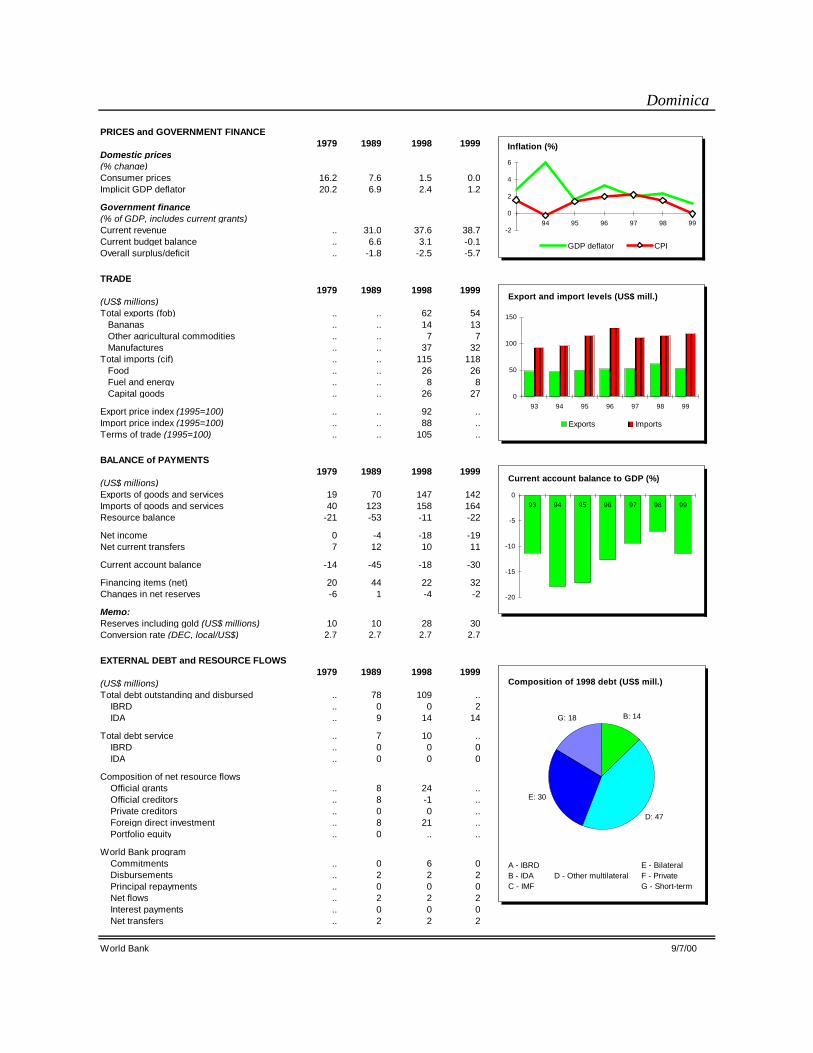
Dominica
PRICES and GOVERNMENT FINANCE1979 1989 1998 1999
Domestic prices(% change)Consumer prices 16.2 7.6 1.5 0.0Implicit GDP deflator 20.2 6.9 2.4 1.2
Government finance(% of GDP, includes current grants)Current revenue .. 31.0 37.6 38.7Current budget balance .. 6.6 3.1 -0.1Overall surplus/deficit .. -1.8 -2.5 -5.7
TRADE1979 1989 1998 1999
(US$ millions)Total exports (fob) .. .. 62 54 Bananas .. .. 14 13 Other agricultural commodities .. .. 7 7 Manufactures .. .. 37 32Total imports (cif) .. .. 115 118 Food .. .. 26 26 Fuel and energy .. .. 8 8 Capital goods .. .. 26 27
Export price index (1995=100) .. .. 92 ..Import price index (1995=100) .. .. 88 ..Terms of trade (1995=100) .. .. 105 ..
BALANCE of PAYMENTS1979 1989 1998 1999
(US$ millions)Exports of goods and services 19 70 147 142Imports of goods and services 40 123 158 164Resource balance -21 -53 -11 -22
Net income 0 -4 -18 -19Net current transfers 7 12 10 11
Current account balance -14 -45 -18 -30
Financing items (net) 20 44 22 32Changes in net reserves -6 1 -4 -2
Memo:Reserves including gold (US$ millions) 10 10 28 30Conversion rate (DEC, local/US$) 2.7 2.7 2.7 2.7
EXTERNAL DEBT and RESOURCE FLOWS1979 1989 1998 1999
(US$ millions)Total debt outstanding and disbursed .. 78 109 .. IBRD .. 0 0 2 IDA .. 9 14 14
Total debt service .. 7 10 .. IBRD .. 0 0 0 IDA .. 0 0 0
Composition of net resource flows Official grants .. 8 24 .. Official creditors .. 8 -1 .. Private creditors .. 0 0 .. Foreign direct investment .. 8 21 .. Portfolio equity .. 0 .. ..
World Bank program Commitments .. 0 6 0 Disbursements .. 2 2 2 Principal repayments .. 0 0 0 Net flows .. 2 2 2 Interest payments .. 0 0 0 Net transfers .. 2 2 2
World Bank 9/7/00
-2
0
2
4
6
94 95 96 97 98 99
GDP deflator CPI
Inflation (%)
-20
-15
-10
-5
093 94 95 96 97 98 99
Current account balance to GDP (%)
0
50
100
150
93 94 95 96 97 98 99
Exports Imports
Export and import levels (US$ mill.)
G: 18
D: 47
B: 14
E: 30
Composition of 1998 debt (US$ mill.)
A - IBRDB - IDA C - IMF
D - Other multilateralE - BilateralF - PrivateG - Short-term
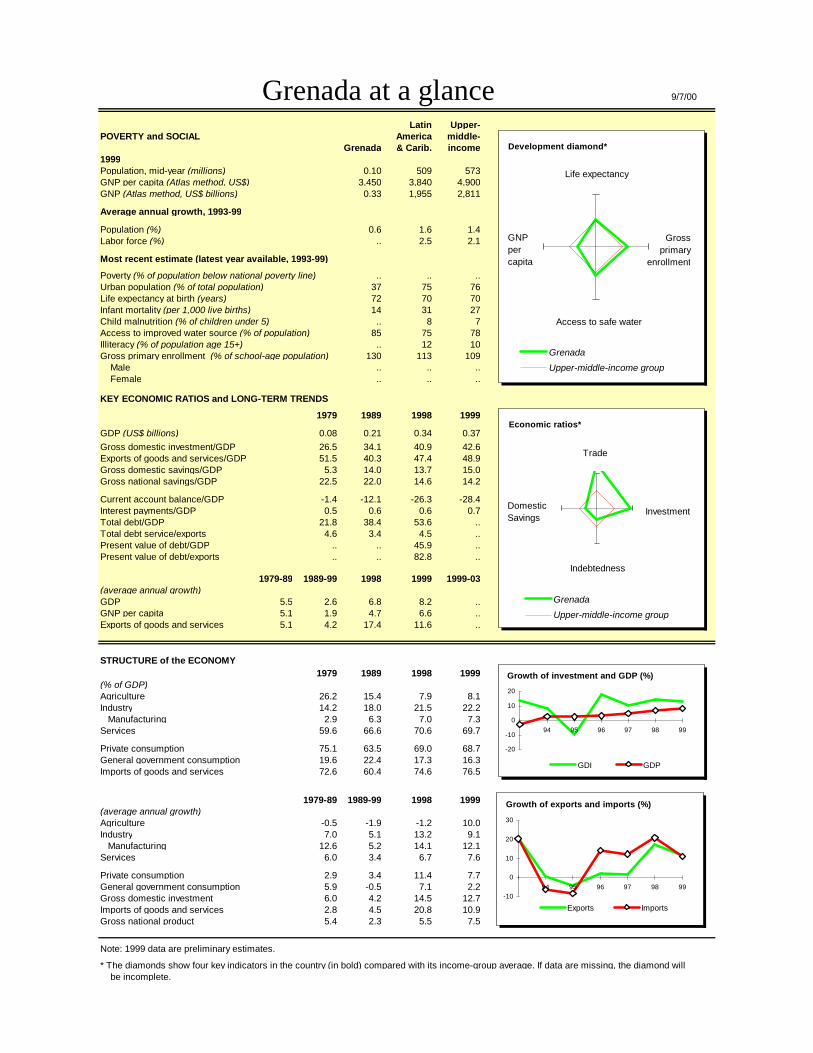
Grenada at a glance 9/7/00
Latin Upper-POVERTY and SOCIAL America middle-
Grenada & Carib. income1999Population, mid-year (millions) 0.10 509 573GNP per capita (Atlas method, US$) 3,450 3,840 4,900GNP (Atlas method, US$ billions) 0.33 1,955 2,811
Average annual growth, 1993-99
Population (%) 0.6 1.6 1.4Labor force (%) .. 2.5 2.1
Most recent estimate (latest year available, 1993-99)
Poverty (% of population below national poverty line) .. .. ..Urban population (% of total population) 37 75 76Life expectancy at birth (years) 72 70 70Infant mortality (per 1,000 live births) 14 31 27Child malnutrition (% of children under 5) .. 8 7Access to improved water source (% of population) 85 75 78Illiteracy (% of population age 15+) .. 12 10Gross primary enrollment (% of school-age population) 130 113 109 Male .. .. .. Female .. .. ..
KEY ECONOMIC RATIOS and LONG-TERM TRENDS
1979 1989 1998 1999
GDP (US$ billions) 0.08 0.21 0.34 0.37Gross domestic investment/GDP 26.5 34.1 40.9 42.6Exports of goods and services/GDP 51.5 40.3 47.4 48.9Gross domestic savings/GDP 5.3 14.0 13.7 15.0Gross national savings/GDP 22.5 22.0 14.6 14.2
Current account balance/GDP -1.4 -12.1 -26.3 -28.4Interest payments/GDP 0.5 0.6 0.6 0.7Total debt/GDP 21.8 38.4 53.6 ..Total debt service/exports 4.6 3.4 4.5 ..Present value of debt/GDP .. .. 45.9 ..Present value of debt/exports .. .. 82.8 ..
1979-89 1989-99 1998 1999 1999-03(average annual growth)GDP 5.5 2.6 6.8 8.2 ..GNP per capita 5.1 1.9 4.7 6.6 ..Exports of goods and services 5.1 4.2 17.4 11.6 ..
STRUCTURE of the ECONOMY1979 1989 1998 1999
(% of GDP)Agriculture 26.2 15.4 7.9 8.1Industry 14.2 18.0 21.5 22.2 Manufacturing 2.9 6.3 7.0 7.3Services 59.6 66.6 70.6 69.7
Private consumption 75.1 63.5 69.0 68.7General government consumption 19.6 22.4 17.3 16.3Imports of goods and services 72.6 60.4 74.6 76.5
1979-89 1989-99 1998 1999(average annual growth)Agriculture -0.5 -1.9 -1.2 10.0Industry 7.0 5.1 13.2 9.1 Manufacturing 12.6 5.2 14.1 12.1Services 6.0 3.4 6.7 7.6
Private consumption 2.9 3.4 11.4 7.7General government consumption 5.9 -0.5 7.1 2.2Gross domestic investment 6.0 4.2 14.5 12.7Imports of goods and services 2.8 4.5 20.8 10.9Gross national product 5.4 2.3 5.5 7.5
Note: 1999 data are preliminary estimates.
* The diamonds show four key indicators in the country (in bold) compared with its income-group average. If data are missing, the diamond will be incomplete.
-20
-10
0
10
20
94 95 96 97 98 99
GDI GDP
Growth of investment and GDP (%)
Grenada
Upper-middle-income group
Development diamond*
Life expectancy
Access to safe water
GNPpercapita
Grossprimary
enrollment
-10
0
10
20
30
94 95 96 97 98 99
Exports Imports
Growth of exports and imports (%)
Grenada
Upper-middle-income group
Economic ratios*
Trade
DomesticSavings
Investment
Indebtedness

Grenada
PRICES and GOVERNMENT FINANCE1979 1989 1998 1999
Domestic prices(% change)Consumer prices 21.7 5.5 1.2 1.0Implicit GDP deflator 9.4 8.9 1.3 -0.7
Government finance(% of GDP, includes current grants)Current revenue .. .. 25.2 27.0Current budget balance .. .. 1.3 4.6Overall surplus/deficit .. .. -3.1 -2.5
TRADE1979 1989 1998 1999
(US$ millions)Total exports (fob) .. 28 46 55 Nutmeg .. .. 9 15 Fish .. .. 3 3 Manufactures .. .. 16 16Total imports (cif) .. .. 204 230 Food .. .. 37 45 Fuel and energy .. .. 11 17 Capital goods .. .. 59 66
Export price index (1995=100) .. .. 109 120Import price index (1995=100) .. .. 89 86Terms of trade (1995=100) .. .. 123 139
BALANCE of PAYMENTS1979 1989 1998 1999
(US$ millions)Exports of goods and services 41 93 162 179Imports of goods and services 55 136 254 280Resource balance -15 -43 -93 -101
Net income 0 -9 -24 -26Net current transfers 13 26 27 23
Current account balance -1 -26 -90 -104
Financing items (net) 4 25 94 108Changes in net reserves -3 1 -4 -4
Memo:Reserves including gold (US$ millions) .. .. 47 51Conversion rate (DEC, local/US$) 2.7 2.7 2.7 2.7
EXTERNAL DEBT and RESOURCE FLOWS1979 1989 1998 1999
(US$ millions)Total debt outstanding and disbursed 17 82 183 .. IBRD 0 0 0 0 IDA 0 4 8 10
Total debt service 2 3 9 .. IBRD 0 0 0 0 IDA 0 0 0 0
Composition of net resource flows Official grants 1 6 4 .. Official creditors 0 5 -2 .. Private creditors 1 0 0 .. Foreign direct investment 0 11 21 .. Portfolio equity 0 0 .. ..
World Bank program Commitments 0 0 1 0 Disbursements 0 1 1 2 Principal repayments 0 0 0 0 Net flows 0 1 1 2 Interest payments 0 0 0 0 Net transfers 0 1 1 2
World Bank 9/7/00
-2
0
2
4
94 95 96 97 98 99
GDP deflator CPI
Inflation (%)
-30
-20
-10
093 94 95 96 97 98 99
Current account balance to GDP (%)
0
50
100
150
200
250
93 94 95 96 97 98 99
Exports Imports
Export and import levels (US$ mill.)
G: 70 D: 42
B: 8
F: 6 E: 57
Composition of 1998 debt (US$ mill.)
A - IBRDB - IDA C - IMF
D - Other multilateralE - BilateralF - PrivateG - Short-term

Guyana at a glance 9/16/99
Latin Lower-POVERTY and SOCIAL America middle-
Guyana & Carib. income1998Population, mid-year (millions) 0.86 502 908GNP per capita (Atlas method, US$) 770 3,940 1,710GNP (Atlas method, US$ billions) 0.66 1,978 1,557
Average annual growth, 1992-98
Population (%) 1.0 1.6 1.1Labor force (%) 1.8 2.3 1.5
Most recent estimate (latest year available, 1992-98)
Poverty (% of population below national poverty line) .. .. ..Urban population (% of total population) 37 75 58Life expectancy at birth (years) 64 70 68Infant mortality (per 1,000 live births) 58 32 38Child malnutrition (% of children under 5) 18 8 ..Access to safe water (% of population) 83 75 75Illiteracy (% of population age 15+) 2 13 14Gross primary enrollment (% of school-age population) 95 113 103 Male 95 .. 105 Female 94 .. 100
KEY ECONOMIC RATIOS and LONG-TERM TRENDS
1977 1987 1997 1998
GDP (US$ billions) 0.45 0.35 0.75 0.72Gross domestic investment/GDP 29.1 31.1 30.3 28.7Exports of goods and services/GDP 63.2 79.6 98.8 95.8Gross domestic savings/GDP 13.5 19.9 20.6 17.1Gross national savings/GDP .. .. 16.2 15.1
Current account balance/GDP .. .. -14.3 -13.6Interest payments/GDP 3.4 4.3 7.2 8.3Total debt/GDP 110.1 490.0 215.0 229.4Total debt service/exports .. .. 17.0 19.4Present value of debt/GDP .. .. 136.4 149.6Present value of debt/exports .. .. 135.8 153.9
1977-87 1988-98 1997 1998 1999-03(average annual growth)GDP -3.1 5.6 6.2 1.6 ..GNP per capita -5.7 8.6 3.8 -2.6 ..Exports of goods and services -4.5 12.2 3.2 -1.5 ..
STRUCTURE of the ECONOMY1977 1987 1997 1998
(% of GDP)Agriculture 20.7 29.9 35.4 34.7Industry 35.7 30.1 33.7 32.5 Manufacturing 12.1 13.9 11.4 11.1Services 43.6 39.9 30.8 32.8
Private consumption 60.7 52.7 62.3 65.3General government consumption 25.8 27.4 17.1 17.6Imports of goods and services 78.8 90.8 108.5 107.5
1977-87 1988-98 1997 1998(average annual growth)Agriculture 0.0 5.7 4.0 -5.1Industry -5.8 8.3 9.6 -1.1 Manufacturing -3.9 8.8 2.4 -8.9Services -2.4 3.2 5.3 0.8
Private consumption -0.2 6.0 7.7 6.5General government consumption -8.3 -0.2 13.5 4.6Gross domestic investment -10.4 10.4 6.9 -3.9Imports of goods and services -5.0 12.6 5.5 0.6Gross national product -5.0 9.5 4.9 -1.5
Note: 1998 data are preliminary estimates.
* The diamonds show four key indicators in the country (in bold) compared with its income-group average. If data are missing, the diamond will be incomplete.
-60-30
0306090
120
93 94 95 96 97 98
GDI GDP
Growth rates of output and investment (%)
Guyana
Lower-middle-income group
Development diamond*
Life expectancy
Access to safe water
GNPpercapita
Grossprimary
enrollment
-40
0
40
80
120
160
93 94 95 96 97 98
Exports Imports
Growth rates of exports and imports (%)
Guyana
Lower-middle-income group
Economic ratios*
Trade
DomesticSavings
Investment
Indebtedness
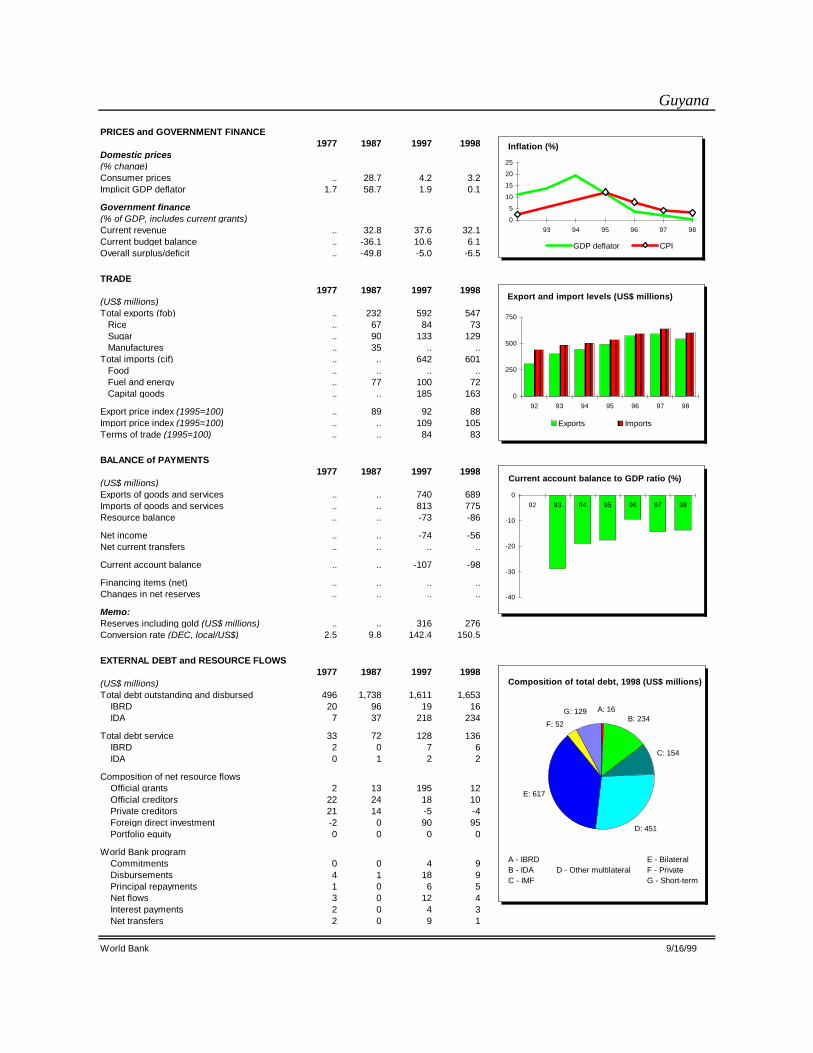
Guyana
PRICES and GOVERNMENT FINANCE1977 1987 1997 1998
Domestic prices(% change)Consumer prices .. 28.7 4.2 3.2Implicit GDP deflator 1.7 58.7 1.9 0.1
Government finance(% of GDP, includes current grants)Current revenue .. 32.8 37.6 32.1Current budget balance .. -36.1 10.6 6.1Overall surplus/deficit .. -49.8 -5.0 -6.5
TRADE1977 1987 1997 1998
(US$ millions)Total exports (fob) .. 232 592 547 Rice .. 67 84 73 Sugar .. 90 133 129 Manufactures .. 35 .. ..Total imports (cif) .. .. 642 601 Food .. .. .. .. Fuel and energy .. 77 100 72 Capital goods .. .. 185 163
Export price index (1995=100) .. 89 92 88Import price index (1995=100) .. .. 109 105Terms of trade (1995=100) .. .. 84 83
BALANCE of PAYMENTS1977 1987 1997 1998
(US$ millions)Exports of goods and services .. .. 740 689Imports of goods and services .. .. 813 775Resource balance .. .. -73 -86
Net income .. .. -74 -56Net current transfers .. .. .. ..
Current account balance .. .. -107 -98
Financing items (net) .. .. .. ..Changes in net reserves .. .. .. ..
Memo:Reserves including gold (US$ millions) .. .. 316 276Conversion rate (DEC, local/US$) 2.5 9.8 142.4 150.5
EXTERNAL DEBT and RESOURCE FLOWS1977 1987 1997 1998
(US$ millions)Total debt outstanding and disbursed 496 1,738 1,611 1,653 IBRD 20 96 19 16 IDA 7 37 218 234
Total debt service 33 72 128 136 IBRD 2 0 7 6 IDA 0 1 2 2
Composition of net resource flows Official grants 2 13 195 12 Official creditors 22 24 18 10 Private creditors 21 14 -5 -4 Foreign direct investment -2 0 90 95 Portfolio equity 0 0 0 0
World Bank program Commitments 0 0 4 9 Disbursements 4 1 18 9 Principal repayments 1 0 6 5 Net flows 3 0 12 4 Interest payments 2 0 4 3 Net transfers 2 0 9 1
World Bank 9/16/99
0
5
10
15
20
25
93 94 95 96 97 98
GDP deflator CPI
Inflation (%)
-40
-30
-20
-10
092 93 94 95 96 97 98
Current account balance to GDP ratio (%)
0
250
500
750
92 93 94 95 96 97 98
Exports Imports
Export and import levels (US$ millions)
G: 129 A: 16
D: 451
C: 154
B: 234F: 52
E: 617
Composition of total debt, 1998 (US$ millions)
A - IBRDB - IDA C - IMF
D - Other multilateralE - BilateralF - PrivateG - Short-term

Guyana at a glance 9/9/00
Latin Lower-POVERTY and SOCIAL America middle-
Guyana & Carib. income1999Population, mid-year (millions) 0.86 509 2,094GNP per capita (Atlas method, US$) 740 3,840 1,200GNP (Atlas method, US$ billions) 0.64 1,955 2,513
Average annual growth, 1993-99
Population (%) 0.8 1.6 1.1Labor force (%) 1.6 2.5 1.2
Most recent estimate (latest year available, 1993-99)
Poverty (% of population below national poverty line) .. .. ..Urban population (% of total population) 38 75 43Life expectancy at birth (years) 64 70 69Infant mortality (per 1,000 live births) 57 31 33Child malnutrition (% of children under 5) 18 8 15Access to improved water source (% of population) .. 75 86Illiteracy (% of population age 15+) 2 12 16Gross primary enrollment (% of school-age population) 96 113 114 Male 97 .. 114 Female 96 .. 116
KEY ECONOMIC RATIOS and LONG-TERM TRENDS
1979 1989 1998 1999
GDP (US$ billions) 0.53 0.38 0.72 0.68Gross domestic investment/GDP 31.0 22.2 28.8 24.4Exports of goods and services/GDP 59.8 66.3 96.2 98.9Gross domestic savings/GDP 21.6 15.0 16.7 16.2Gross national savings/GDP .. .. 15.0 13.4
Current account balance/GDP -15.6 .. -13.7 -11.1Interest payments/GDP 4.8 3.9 8.4 6.7Total debt/GDP 123.4 430.0 230.3 248.5Total debt service/exports .. .. 18.5 15.0Present value of debt/GDP .. .. 150.2 ..Present value of debt/exports .. .. 146.5 ..
1979-89 1989-99 1998 1999 1999-03(average annual growth)GDP -3.1 5.7 -1.7 3.0 3.0GNP per capita -6.3 9.2 2.4 -1.4 2.1Exports of goods and services -4.6 10.5 -4.3 5.9 1.8
STRUCTURE of the ECONOMY1979 1989 1998 1999
(% of GDP)Agriculture 22.3 39.9 34.6 35.1Industry 34.0 29.4 30.8 28.5 Manufacturing 12.4 13.3 9.4 10.1Services 43.7 30.6 34.6 36.4
Private consumption 52.2 68.5 65.6 65.3General government consumption 26.2 16.5 17.7 18.5Imports of goods and services 69.2 73.5 107.9 107.2
1979-89 1989-99 1998 1999(average annual growth)Agriculture -0.1 5.7 -6.5 13.4Industry -6.1 9.4 -0.9 -1.5 Manufacturing -6.4 11.5 -8.6 13.0Services -2.1 3.5 1.3 -0.8
Private consumption -1.8 5.8 3.5 2.6General government consumption -2.5 4.8 1.7 7.4Gross domestic investment -10.0 7.5 -6.7 -12.7Imports of goods and services -5.9 10.2 -2.3 2.3Gross national product -5.7 10.0 3.2 -0.6
Note: 1999 data are preliminary estimates.
* The diamonds show four key indicators in the country (in bold) compared with its income-group average. If data are missing, the diamond will be incomplete.
-40
-20
0
20
40
94 95 96 97 98 99
GDI GDP
Growth of investment and GDP (%)
Guyana
Lower-middle-income group
Development diamond*
Life expectancy
Access to safe water
GNPpercapita
Grossprimary
enrollment
-10
-5
0
5
10
94 95 96 97 98 99
Exports Imports
Growth of exports and imports (%)
Guyana
Lower-middle-income group
Economic ratios*
Trade
DomesticSavings
Investment
Indebtedness
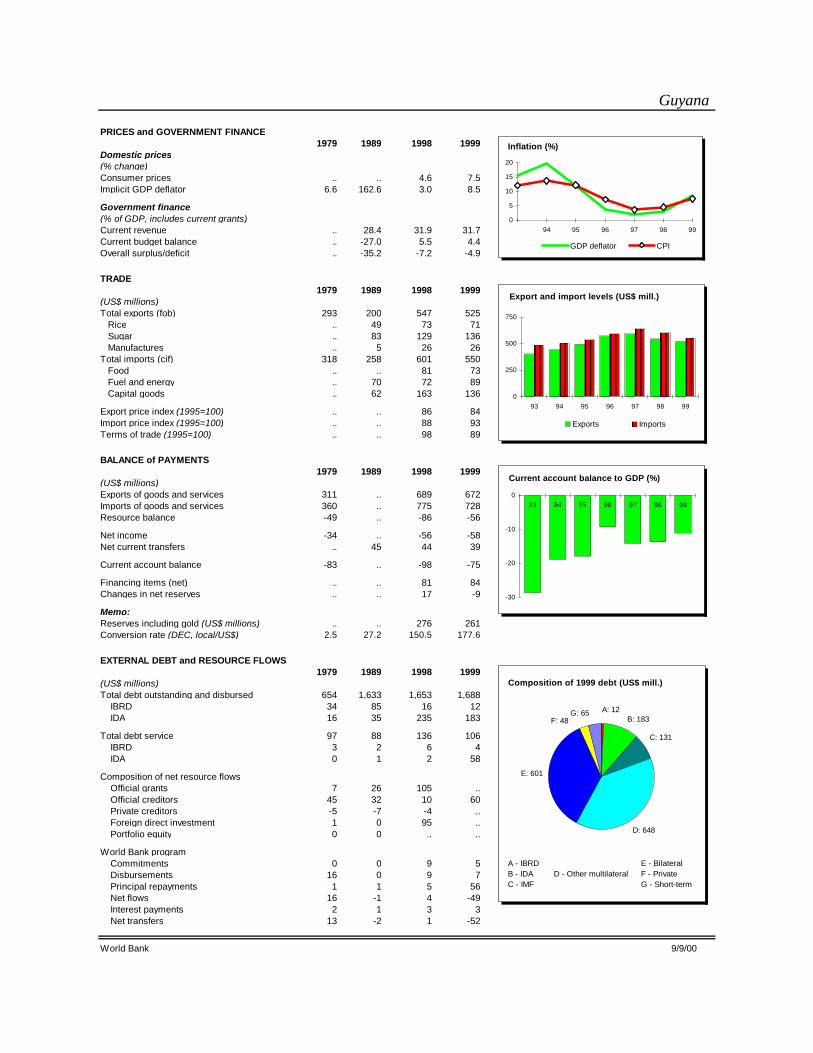
Guyana
PRICES and GOVERNMENT FINANCE1979 1989 1998 1999
Domestic prices(% change)Consumer prices .. .. 4.6 7.5Implicit GDP deflator 6.6 162.6 3.0 8.5
Government finance(% of GDP, includes current grants)Current revenue .. 28.4 31.9 31.7Current budget balance .. -27.0 5.5 4.4Overall surplus/deficit .. -35.2 -7.2 -4.9
TRADE1979 1989 1998 1999
(US$ millions)Total exports (fob) 293 200 547 525 Rice .. 49 73 71 Sugar .. 83 129 136 Manufactures .. 5 26 26Total imports (cif) 318 258 601 550 Food .. .. 81 73 Fuel and energy .. 70 72 89 Capital goods .. 62 163 136
Export price index (1995=100) .. .. 86 84Import price index (1995=100) .. .. 88 93Terms of trade (1995=100) .. .. 98 89
BALANCE of PAYMENTS1979 1989 1998 1999
(US$ millions)Exports of goods and services 311 .. 689 672Imports of goods and services 360 .. 775 728Resource balance -49 .. -86 -56
Net income -34 .. -56 -58Net current transfers .. 45 44 39
Current account balance -83 .. -98 -75
Financing items (net) .. .. 81 84Changes in net reserves .. .. 17 -9
Memo:Reserves including gold (US$ millions) .. .. 276 261Conversion rate (DEC, local/US$) 2.5 27.2 150.5 177.6
EXTERNAL DEBT and RESOURCE FLOWS1979 1989 1998 1999
(US$ millions)Total debt outstanding and disbursed 654 1,633 1,653 1,688 IBRD 34 85 16 12 IDA 16 35 235 183
Total debt service 97 88 136 106 IBRD 3 2 6 4 IDA 0 1 2 58
Composition of net resource flows Official grants 7 26 105 .. Official creditors 45 32 10 60 Private creditors -5 -7 -4 .. Foreign direct investment 1 0 95 .. Portfolio equity 0 0 .. ..
World Bank program Commitments 0 0 9 5 Disbursements 16 0 9 7 Principal repayments 1 1 5 56 Net flows 16 -1 4 -49 Interest payments 2 1 3 3 Net transfers 13 -2 1 -52
World Bank 9/9/00
0
5
10
15
20
94 95 96 97 98 99
GDP deflator CPI
Inflation (%)
-30
-20
-10
093 94 95 96 97 98 99
Current account balance to GDP (%)
0
250
500
750
93 94 95 96 97 98 99
Exports Imports
Export and import levels (US$ mill.)
G: 65 A: 12
D: 648
C: 131
B: 183F: 48
E: 601
Composition of 1999 debt (US$ mill.)
A - IBRDB - IDA C - IMF
D - Other multilateralE - BilateralF - PrivateG - Short-term

Jamaica at a glance 9/17/99
Latin Lower-POVERTY and SOCIAL America middle-
Jamaica & Carib. income1998Population, mid-year (millions) 2.6 502 908GNP per capita (Atlas method, US$) 1,680 3,940 1,710GNP (Atlas method, US$ billions) 4.4 1,978 1,557
Average annual growth, 1992-98
Population (%) 0.9 1.6 1.1Labor force (%) 1.5 2.3 1.5
Most recent estimate (latest year available, 1992-98)
Poverty (% of population below national poverty line) 34 .. ..Urban population (% of total population) 55 75 58Life expectancy at birth (years) 75 70 68Infant mortality (per 1,000 live births) 12 32 38Child malnutrition (% of children under 5) 10 8 ..Access to safe water (% of population) 93 75 75Illiteracy (% of population age 15+) 14 13 14Gross primary enrollment (% of school-age population) 101 113 103 Male 97 .. 105 Female 94 .. 100
KEY ECONOMIC RATIOS and LONG-TERM TRENDS
1977 1987 1997 1998
GDP (US$ billions) 3.3 3.0 4.1 6.3Gross domestic investment/GDP 12.2 22.2 34.5 31.5Exports of goods and services/GDP 29.8 50.5 51.0 46.2Gross domestic savings/GDP 13.6 22.6 21.6 17.0Gross national savings/GDP 10.9 14.8 28.5 24.9
Current account balance/GDP -1.3 -5.1 -9.7 -5.1Interest payments/GDP 3.0 6.8 4.1 2.7Total debt/GDP 51.1 156.1 94.6 63.3Total debt service/exports 27.1 45.9 19.0 15.9Present value of debt/GDP .. .. 87.1 ..Present value of debt/exports .. .. 106.4 ..
1977-87 1988-98 1997 1998 1999-03(average annual growth)GDP -0.1 1.1 -1.6 -0.7 2.0GNP per capita -2.4 1.1 -2.3 0.5 1.3Exports of goods and services 3.4 0.9 -5.6 -6.6 ..
STRUCTURE of the ECONOMY1977 1987 1997 1998
(% of GDP)Agriculture 8.4 7.7 8.0 8.0Industry 37.0 39.9 35.1 33.7 Manufacturing 18.4 20.9 16.3 15.1Services 54.6 52.4 56.9 58.4
Private consumption 65.7 62.4 60.6 61.3General government consumption 20.7 15.0 17.8 21.6Imports of goods and services 28.4 50.1 64.0 60.7
1977-87 1988-98 1997 1998(average annual growth)Agriculture 0.0 3.6 -14.6 -0.3Industry -1.6 0.7 -0.7 -1.6 Manufacturing -0.6 -1.1 -2.8 -4.2Services 1.1 1.0 -0.1 0.0
Private consumption 0.5 2.2 -0.5 8.7General government consumption 2.4 -0.1 18.0 -5.2Gross domestic investment -2.1 8.3 -2.1 -8.8Imports of goods and services 4.4 4.4 1.4 0.0Gross national product -1.0 2.1 -1.5 1.3
Note: 1998 data are preliminary estimates.
* The diamonds show four key indicators in the country (in bold) compared with its income-group average. If data are missing, the diamond will be incomplete.
-20
-10
0
10
20
30
93 94 95 96 97 98
GDI GDP
Growth rates of output and investment (%)
Jamaica
Lower-middle-income group
Development diamond*
Life expectancy
Access to safe water
GNPpercapita
Grossprimary
enrollment
-10
0
10
20
30
40
93 94 95 96 97 98
Exports Imports
Growth rates of exports and imports (%)
Jamaica
Lower-middle-income group
Economic ratios*
Trade
DomesticSavings
Investment
Indebtedness

Jamaica
PRICES and GOVERNMENT FINANCE1977 1987 1997 1998
Domestic prices(% change)Consumer prices 11.3 6.7 8.8 6.0Implicit GDP deflator 12.2 11.1 10.3 5.8
Government finance(% of GDP, includes current grants)Current revenue 17.7 30.1 29.7 31.7Current budget balance -10.8 1.7 -4.9 -4.9Overall surplus/deficit -20.7 0.0 -9.7 -8.2
TRADE1977 1987 1997 1998
(US$ millions)Total exports (fob) 738 708 1,699 1,590 Alumina 374 224 652 575 Bauxite 140 113 73 81 Manufactures 49 46 48 46Total imports (cif) 747 1,235 3,128 2,961 Food 54 95 258 280 Fuel and energy 226 237 411 294 Capital goods 154 347 660 551
Export price index (1995=100) .. 75 105 107Import price index (1995=100) .. 75 105 107Terms of trade (1995=100) .. 100 100 100
BALANCE of PAYMENTS1977 1987 1997 1998
(US$ millions)Exports of goods and services 950 1,576 3,192 3,165Imports of goods and services 891 1,505 4,005 4,006Resource balance 59 72 -813 -841
Net income -121 -397 -201 -94Net current transfers 20 172 614 612
Current account balance -42 -154 -401 -323
Financing items (net) 8 367 249 364Changes in net reserves 34 -213 152 -42
Memo:Reserves including gold (US$ millions) 48 174 682 707Conversion rate (DEC, local/US$) 0.9 5.5 53.3 36.7
EXTERNAL DEBT and RESOURCE FLOWS1977 1987 1997 1998
(US$ millions)Total debt outstanding and disbursed 1,678 4,724 3,913 4,001 IBRD 68 735 431 409 IDA 0 0 0 ..
Total debt service 285 750 641 537 IBRD 8 98 106 99 IDA 0 0 0 ..
Composition of net resource flows Official grants 1 71 38 .. Official creditors 39 110 -249 -144 Private creditors 41 -2 240 217 Foreign direct investment -10 53 137 150 Portfolio equity 0 0 0 ..
World Bank program Commitments 45 122 0 .. Disbursements 12 64 26 31 Principal repayments 2 42 72 72 Net flows 10 23 -46 -41 Interest payments 5 56 34 28 Net transfers 4 -34 -80 -68
World Bank 9/17/99
0
20
40
60
80
100
93 94 95 96 97 98
GDP deflator CPI
Inflation (%)
-12
-9
-6
-3
0
3
92 93 94 95 96 97 98
Current account balance to GDP ratio (%)
0
1,000
2,000
3,000
4,000
92 93 94 95 96 97 98
Exports Imports
Export and import levels (US$ millions)
G: 638 A: 409
D: 588
C: 105
F: 919
E: 1,342
Composition of total debt, 1998 (US$ millions)
A - IBRDB - IDA C - IMF
D - Other multilateralE - BilateralF - PrivateG - Short-term

Jamaica at a glance 9/9/00
Latin Lower-POVERTY and SOCIAL America middle-
Jamaica & Carib. income1999Population, mid-year (millions) 2.6 509 2,094GNP per capita (Atlas method, US$) 2,530 3,840 1,200GNP (Atlas method, US$ billions) 6.6 1,955 2,513
Average annual growth, 1993-99
Population (%) 0.8 1.6 1.1Labor force (%) 1.5 2.5 1.2
Most recent estimate (latest year available, 1993-99)
Poverty (% of population below national poverty line) .. .. ..Urban population (% of total population) 56 75 43Life expectancy at birth (years) 75 70 69Infant mortality (per 1,000 live births) 21 31 33Child malnutrition (% of children under 5) 10 8 15Access to improved water source (% of population) 70 75 86Illiteracy (% of population age 15+) 14 12 16Gross primary enrollment (% of school-age population) 100 113 114 Male 100 .. 114 Female 99 .. 116
KEY ECONOMIC RATIOS and LONG-TERM TRENDS
1979 1989 1998 1999
GDP (US$ billions) 2.4 4.1 7.1 7.2Gross domestic investment/GDP 19.2 28.5 29.0 29.6Exports of goods and services/GDP 49.8 47.2 47.2 46.7Gross domestic savings/GDP 18.4 19.0 21.0 20.3Gross national savings/GDP 13.3 20.2 26.0 25.1
Current account balance/GDP .. -7.2 -3.0 -4.5Interest payments/GDP 4.4 4.2 2.4 3.0Total debt/GDP 71.7 111.1 56.2 56.4Total debt service/exports 23.8 29.6 14.9 18.6Present value of debt/GDP .. .. 53.5 ..Present value of debt/exports .. .. 106.0 ..
1979-89 1989-99 1998 1999 1999-03(average annual growth)GDP 1.2 0.6 -0.5 0.0 1.2GNP per capita -0.6 0.5 0.0 -3.2 1.0Exports of goods and services 4.0 0.6 -3.2 0.2 2.4
STRUCTURE of the ECONOMY1979 1989 1998 1999
(% of GDP)Agriculture 7.2 6.9 7.0 6.9Industry 40.3 42.7 31.7 27.7 Manufacturing 16.4 19.6 13.9 12.4Services 52.5 50.4 61.3 65.4
Private consumption 62.3 67.0 60.4 62.3General government consumption 19.3 14.1 18.6 17.4Imports of goods and services 50.6 56.7 55.2 56.0
1979-89 1989-99 1998 1999(average annual growth)Agriculture 0.3 3.0 0.2 1.7Industry 0.8 -0.2 -1.4 -0.1 Manufacturing 1.7 -1.8 -3.9 -0.9Services 1.5 0.9 0.2 -0.1
Private consumption 3.5 -0.9 8.1 0.4General government consumption 5.2 1.5 -5.3 -2.6Gross domestic investment -1.1 5.4 -8.8 0.4Imports of goods and services 7.7 1.4 -2.3 -2.4Gross national product 0.7 1.4 0.9 -2.4
Note: 1999 data are preliminary estimates.
* The diamonds show four key indicators in the country (in bold) compared with its income-group average. If data are missing, the diamond will be incomplete.
-10
-5
0
5
10
94 95 96 97 98 99
GDI GDP
Growth of investment and GDP (%)
Jamaica
Lower-middle-income group
Development diamond*
Life expectancy
Access to safe water
GNPpercapita
Grossprimary
enrollment
-20
-10
0
10
20
94 95 96 97 98 99
Exports Imports
Growth of exports and imports (%)
Jamaica
Lower-middle-income group
Economic ratios*
Trade
DomesticSavings
Investment
Indebtedness

Jamaica
PRICES and GOVERNMENT FINANCE1979 1989 1998 1999
Domestic prices(% change)Consumer prices 28.7 14.3 6.0 8.4Implicit GDP deflator 16.6 12.6 6.9 10.4
Government finance(% of GDP, includes current grants)Current revenue .. 31.8 28.0 30.3Current budget balance .. 5.6 -4.3 -2.4Overall surplus/deficit .. 1.2 -7.2 -4.3
TRADE1979 1989 1998 1999
(US$ millions)Total exports (fob) .. 1,000 1,551 1,535 Alumina .. 475 588 672 Bauxite .. 111 83 48 Manufactures .. 69 43 44Total imports (cif) .. 1,874 3,131 3,179 Food .. 160 280 328 Fuel and energy .. 274 293 429 Capital goods .. 565 516 472
Export price index (1995=100) .. 81 107 110Import price index (1995=100) .. 81 107 111Terms of trade (1995=100) .. 100 100 99
BALANCE of PAYMENTS1979 1989 1998 1999
(US$ millions)Exports of goods and services 1,165 1,941 3,353 3,365Imports of goods and services 1,198 2,291 3,925 4,035Resource balance -32 -350 -571 -670
Net income -187 -271 -283 -354Net current transfers 80 323 638 698
Current account balance .. -298 -217 -326
Financing items (net) .. 136 204 204Changes in net reserves 159 161 13 122
Memo:Reserves including gold (US$ millions) .. .. 700 801Conversion rate (DEC, local/US$) 1.8 5.7 36.9 40.1
EXTERNAL DEBT and RESOURCE FLOWS1979 1989 1998 1999
(US$ millions)Total debt outstanding and disbursed 1,705 4,560 3,995 4,069 IBRD 127 650 410 393 IDA 0 0 0 0
Total debt service 302 643 537 674 IBRD 15 109 99 99 IDA 0 0 0 0
Composition of net resource flows Official grants 13 123 92 .. Official creditors 110 75 -144 -186 Private creditors -39 -11 217 -108 Foreign direct investment -26 57 369 .. Portfolio equity 0 0 .. ..
World Bank program Commitments 60 75 0 0 Disbursements 19 52 31 64 Principal repayments 5 54 72 75 Net flows 15 -2 -41 -11 Interest payments 11 55 28 24 Net transfers 4 -57 -68 -35
World Bank 9/9/00
0
20
40
60
94 95 96 97 98 99
GDP deflator CPI
Inflation (%)
-6
-4
-2
093 94 95 96 97 98 99
Current account balance to GDP (%)
0
1,000
2,000
3,000
4,000
93 94 95 96 97 98 99
Exports Imports
Export and import levels (US$ mill.)
G: 638 A: 393
D: 526
C: 86
F: 1,210
E: 1,216
Composition of 1999 debt (US$ mill.)
A - IBRDB - IDA C - IMF
D - Other multilateralE - BilateralF - PrivateG - Short-term

St. Kitts and Nevis at a glance 9/9/00
St. Kitts Latin Upper-POVERTY and SOCIAL and America middle-
Nevis & Carib. income1999Population, mid-year (millions) 0.04 509 573GNP per capita (Atlas method, US$) 6,420 3,840 4,900GNP (Atlas method, US$ billions) 0.26 1,955 2,811
Average annual growth, 1993-99
Population (%) -0.2 1.6 1.4Labor force (%) .. 2.5 2.1
Most recent estimate (latest year available, 1993-99)
Poverty (% of population below national poverty line) 15 .. ..Urban population (% of total population) 34 75 76Life expectancy at birth (years) 70 70 70Infant mortality (per 1,000 live births) 22 31 27Child malnutrition (% of children under 5) .. 8 7Access to improved water source (% of population) 100 75 78Illiteracy (% of population age 15+) 10 12 10Gross primary enrollment (% of school-age population) 109 113 109 Male .. .. .. Female .. .. ..
KEY ECONOMIC RATIOS and LONG-TERM TRENDS
1979 1989 1998 1999
GDP (US$ billions) 0.04 0.14 0.29 0.30Gross domestic investment/GDP 34.6 58.1 43.0 37.4Exports of goods and services/GDP 59.7 .. 53.8 48.3Gross domestic savings/GDP 10.6 20.7 26.8 15.8Gross national savings/GDP .. 25.5 26.5 11.3
Current account balance/GDP .. -22.6 -16.4 -26.0Interest payments/GDP .. 0.6 1.6 1.6Total debt/GDP .. 25.5 40.1 45.2Total debt service/exports .. .. 6.6 11.4Present value of debt/GDP .. .. 31.2 ..Present value of debt/exports .. .. 56.8 ..
1979-89 1989-99 1998 1999 1999-03(average annual growth)GDP 5.8 4.3 1.1 2.8 ..GNP per capita 6.0 4.2 2.9 2.0 ..Exports of goods and services 8.0 3.7 9.0 -4.2 ..
STRUCTURE of the ECONOMY1979 1989 1998 1999
(% of GDP)Agriculture 15.5 7.7 4.2 3.6Industry 24.9 27.8 22.4 23.8 Manufacturing 14.6 14.3 9.9 10.3Services 59.6 64.5 73.4 72.6
Private consumption 68.2 57.5 54.1 62.7General government consumption 21.3 21.8 19.1 21.5Imports of goods and services 83.8 .. 69.9 69.8
1979-89 1989-99 1998 1999(average annual growth)Agriculture -2.3 1.4 -11.7 -9.9Industry 4.7 4.0 3.4 7.3 Manufacturing 0.5 3.4 -0.9 8.0Services 8.8 4.7 1.6 2.4
Private consumption 1.6 5.0 0.6 19.1General government consumption 1.6 6.2 0.2 15.8Gross domestic investment 13.4 2.4 5.3 -7.2Imports of goods and services 6.0 3.4 6.5 6.5Gross national product 5.2 3.9 2.9 2.1
Note: 1999 data are preliminary estimates.
* The diamonds show four key indicators in the country (in bold) compared with its income-group average. If data are missing, the diamond will be incomplete.
-15
0
15
30
94 95 96 97 98 99
GDI GDP
Growth of investment and GDP (%)
St. Kitts and Nevis
Upper-middle-income group
Development diamond*
Life expectancy
Access to safe water
GNPpercapita
Grossprimary
enrollment
-10
0
10
20
94 95 96 97 98 99
Exports Imports
Growth of exports and imports (%)
St. Kitts and Nevis
Upper-middle-income group
Economic ratios*
Trade
DomesticSavings
Investment
Indebtedness

St. Kitts and Nevis
PRICES and GOVERNMENT FINANCE1979 1989 1998 1999
Domestic prices(% change)Consumer prices .. 5.0 0.9 1.8Implicit GDP deflator 14.6 4.4 3.3 1.8
Government finance(% of GDP, includes current grants)Current revenue .. .. 30.6 30.9Current budget balance .. .. 0.2 -1.4Overall surplus/deficit .. .. -6.5 -5.7
TRADE1979 1989 1998 1999
(US$ millions)Total exports (fob) .. .. 49 48 Sugar .. .. 12 10 Beverages and tobacco .. .. 1 1 Manufactures .. .. 20 20Total imports (cif) .. .. 142 145 Food .. .. 23 22 Fuel and energy .. .. 3 3 Capital goods .. .. 45 40
Export price index (1995=100) .. .. .. ..Import price index (1995=100) .. .. .. ..Terms of trade (1995=100) .. .. .. ..
BALANCE of PAYMENTS1979 1989 1998 1999
(US$ millions)Exports of goods and services .. 81 154 145Imports of goods and services .. 117 201 210Resource balance .. -36 -46 -65
Net income .. -9 -31 -31Net current transfers .. 13 30 18
Current account balance .. -32 -47 -78
Financing items (net) .. 49 55 81Changes in net reserves .. -17 -8 -3
Memo:Reserves including gold (US$ millions) .. .. 50 52Conversion rate (DEC, local/US$) 2.7 2.7 2.7 2.7
EXTERNAL DEBT and RESOURCE FLOWS1979 1989 1998 1999
(US$ millions)Total debt outstanding and disbursed .. 37 115 136 IBRD .. 0 1 4 IDA .. 0 2 2
Total debt service .. 2 10 17 IBRD .. 0 0 0 IDA .. 0 0 0
Composition of net resource flows Official grants .. 2 5 .. Official creditors .. 7 8 .. Private creditors .. 3 -2 .. Foreign direct investment .. 41 24 .. Portfolio equity .. 0 .. ..
World Bank program Commitments .. 0 10 0 Disbursements .. 0 0 3 Principal repayments .. 0 0 0 Net flows .. 0 0 3 Interest payments .. 0 0 0 Net transfers .. 0 0 3
World Bank 9/9/00
0
5
10
15
94 95 96 97 98 99
GDP deflator CPI
Inflation (%)
-35
-28
-21
-14
-7
093 94 95 96 97 98 99
Current account balance to GDP (%)
0
50
100
150
93 94 95 96 97 98 99
Exports Imports
Export and import levels (US$ mill.)
G: 2 A: 1
D: 36
C: 2B: 2
F: 17
E: 55
Composition of 1998 debt (US$ mill.)
A - IBRDB - IDA C - IMF
D - Other multilateralE - BilateralF - PrivateG - Short-term

St. Lucia at a glance 9/12/00
Latin Upper-POVERTY and SOCIAL America middle-
St. Lucia & Carib. income1999Population, mid-year (millions) 0.15 509 573GNP per capita (Atlas method, US$) 3,770 3,840 4,900GNP (Atlas method, US$ billions) 0.58 1,955 2,811
Average annual growth, 1993-99
Population (%) 1.6 1.6 1.4Labor force (%) .. 2.5 2.1
Most recent estimate (latest year available, 1993-99)
Poverty (% of population below national poverty line) .. .. ..Urban population (% of total population) 38 75 76Life expectancy at birth (years) 72 70 70Infant mortality (per 1,000 live births) 15 31 27Child malnutrition (% of children under 5) .. 8 7Access to improved water source (% of population) 75 75 78Illiteracy (% of population age 15+) .. 12 10Gross primary enrollment (% of school-age population) 94 113 109 Male .. .. .. Female .. .. ..
KEY ECONOMIC RATIOS and LONG-TERM TRENDS
1979 1989 1998 1999
GDP (US$ billions) 0.10 0.31 0.61 0.65Gross domestic investment/GDP .. 34.6 19.3 21.0Exports of goods and services/GDP 63.1 80.2 65.2 66.0Gross domestic savings/GDP .. 12.7 16.8 18.0Gross national savings/GDP .. 13.5 12.2 12.6
Current account balance/GDP -27.2 -21.1 -7.1 -8.4Interest payments/GDP .. 0.8 0.9 1.0Total debt/GDP .. 21.1 30.1 ..Total debt service/exports .. 2.0 3.8 ..Present value of debt/GDP .. .. 26.0 ..Present value of debt/exports .. .. 37.3 ..
1979-89 1989-99 1998 1999 1999-03(average annual growth)GDP 5.8 3.6 2.8 3.1 4.4GNP per capita .. 1.2 1.4 1.5 3.2Exports of goods and services 10.5 2.0 4.7 4.3 4.8
STRUCTURE of the ECONOMY1979 1989 1998 1999
(% of GDP)Agriculture 15.2 13.3 8.3 7.4Industry 22.8 20.5 18.4 19.3 Manufacturing 8.2 8.3 5.8 5.7Services 62.0 66.2 73.3 73.4
Private consumption .. 69.4 68.1 62.2General government consumption .. 17.9 15.1 19.8Imports of goods and services 101.9 102.1 67.8 69.0
1979-89 1989-99 1998 1999(average annual growth)Agriculture 7.6 -1.5 2.6 -11.6Industry 9.6 3.1 -0.9 10.1 Manufacturing 11.8 0.2 -8.0 6.3Services 6.7 3.7 2.8 3.7
Private consumption 3.9 3.3 2.7 2.7General government consumption 4.9 3.3 -0.3 2.1Gross domestic investment 4.6 -0.3 -19.3 12.8Imports of goods and services 7.2 0.5 -4.8 5.0Gross national product .. 2.8 3.0 3.1
Note: 1999 data are preliminary estimates.
* The diamonds show four key indicators in the country (in bold) compared with its income-group average. If data are missing, the diamond will be incomplete.
-20
-10
0
10
20
94 95 96 97 98 99
GDI GDP
Growth of investment and GDP (%)
St. Lucia
Upper-middle-income group
Development diamond*
Life expectancy
Access to safe water
GNPpercapita
Grossprimary
enrollment
-5
0
5
10
94 95 96 97 98 99
Exports Imports
Growth of exports and imports (%)
St. Lucia
Upper-middle-income group
Economic ratios*
Trade
DomesticSavings
Investment
Indebtedness

St. Lucia
PRICES and GOVERNMENT FINANCE1979 1989 1998 1999
Domestic prices(% change)Consumer prices 9.5 4.0 3.6 6.1Implicit GDP deflator .. 4.3 2.2 2.6
Government finance(% of GDP, includes current grants)Current revenue .. 25.1 26.1 38.1Current budget balance .. 5.6 6.2 10.6Overall surplus/deficit .. 1.7 1.8 1.6
TRADE1979 1989 1998 1999
(US$ millions)Total exports (fob) .. 109 79 87 Bananas .. 58 34 32 Fruits and vegetables .. 1 1 1 Manufactures .. 37 17 13Total imports (cif) .. 275 335 367 Food .. 50 73 73 Fuel and energy .. 16 29 28 Capital goods .. 69 71 80
Export price index (1995=100) .. 98 115 95Import price index (1995=100) .. 92 91 93Terms of trade (1995=100) .. 107 125 103
BALANCE of PAYMENTS1979 1989 1998 1999
(US$ millions)Exports of goods and services 66 250 399 426Imports of goods and services 105 318 414 446Resource balance -40 -68 -15 -19
Net income 0 -11 -43 -45Net current transfers 11 14 15 11
Current account balance -28 -66 -43 -54
Financing items (net) 30 72 53 58Changes in net reserves -2 -6 -10 -4
Memo:Reserves including gold (US$ millions) 12 39 69 72Conversion rate (DEC, local/US$) 2.7 2.7 2.7 2.7
EXTERNAL DEBT and RESOURCE FLOWS1979 1989 1998 1999
(US$ millions)Total debt outstanding and disbursed .. 66 184 .. IBRD .. 0 5 6 IDA .. 0 11 12
Total debt service .. 5 16 .. IBRD .. 0 1 1 IDA .. 0 0 0
Composition of net resource flows Official grants .. 6 14 .. Official creditors .. 12 -1 .. Private creditors .. 0 7 .. Foreign direct investment 26 27 46 .. Portfolio equity .. 0 .. ..
World Bank program Commitments .. 0 7 3 Disbursements .. 0 3 1 Principal repayments .. 0 0 0 Net flows .. 0 3 1 Interest payments .. 0 0 1 Net transfers .. 0 2 0
World Bank 9/12/00
-4
0
4
8
94 95 96 97 98 99
GDP deflator CPI
Inflation (%)
-15
-10
-5
093 94 95 96 97 98 99
Current account balance to GDP (%)
0
100
200
300
400
93 94 95 96 97 98 99
Exports Imports
Export and import levels (US$ mill.)
G: 57
A: 5
D: 70
B: 11
F: 7
E: 34
Composition of 1998 debt (US$ mill.)
A - IBRDB - IDA C - IMF
D - Other multilateralE - BilateralF - PrivateG - Short-term
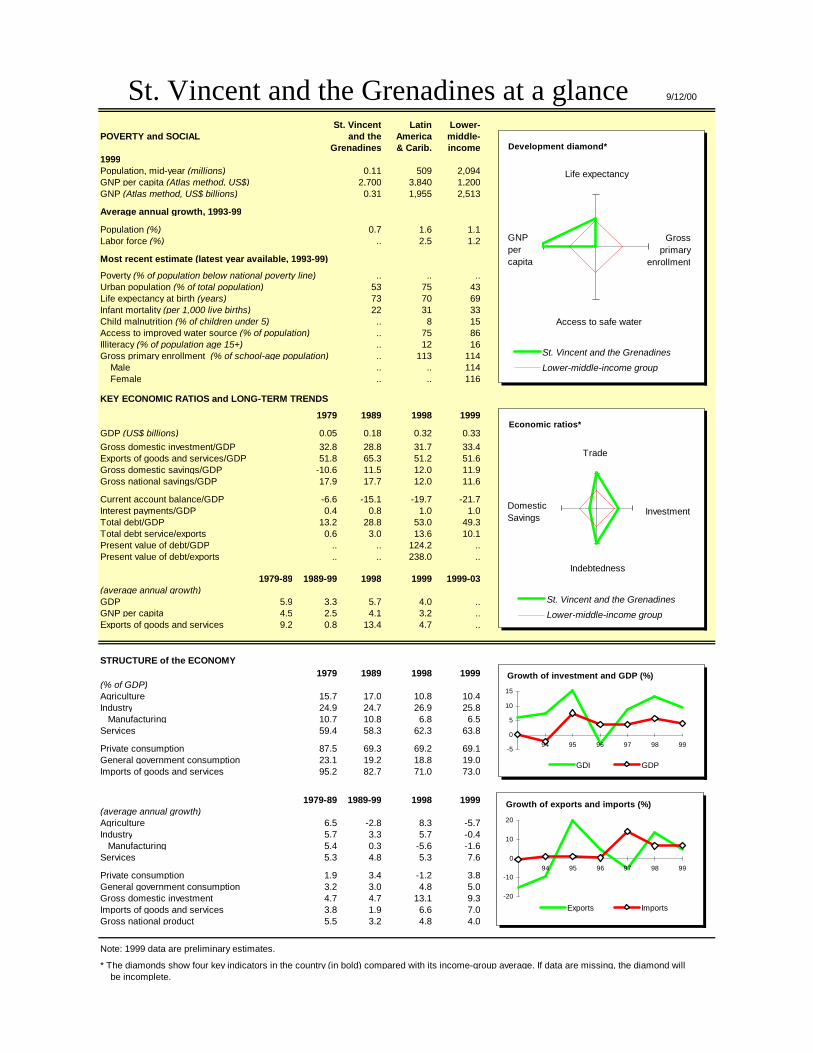
St. Vincent and the Grenadines at a glance 9/12/00
St. Vincent Latin Lower-POVERTY and SOCIAL and the America middle-
Grenadines & Carib. income1999Population, mid-year (millions) 0.11 509 2,094GNP per capita (Atlas method, US$) 2,700 3,840 1,200GNP (Atlas method, US$ billions) 0.31 1,955 2,513
Average annual growth, 1993-99
Population (%) 0.7 1.6 1.1Labor force (%) .. 2.5 1.2
Most recent estimate (latest year available, 1993-99)
Poverty (% of population below national poverty line) .. .. ..Urban population (% of total population) 53 75 43Life expectancy at birth (years) 73 70 69Infant mortality (per 1,000 live births) 22 31 33Child malnutrition (% of children under 5) .. 8 15Access to improved water source (% of population) .. 75 86Illiteracy (% of population age 15+) .. 12 16Gross primary enrollment (% of school-age population) .. 113 114 Male .. .. 114 Female .. .. 116
KEY ECONOMIC RATIOS and LONG-TERM TRENDS
1979 1989 1998 1999
GDP (US$ billions) 0.05 0.18 0.32 0.33Gross domestic investment/GDP 32.8 28.8 31.7 33.4Exports of goods and services/GDP 51.8 65.3 51.2 51.6Gross domestic savings/GDP -10.6 11.5 12.0 11.9Gross national savings/GDP 17.9 17.7 12.0 11.6
Current account balance/GDP -6.6 -15.1 -19.7 -21.7Interest payments/GDP 0.4 0.8 1.0 1.0Total debt/GDP 13.2 28.8 53.0 49.3Total debt service/exports 0.6 3.0 13.6 10.1Present value of debt/GDP .. .. 124.2 ..Present value of debt/exports .. .. 238.0 ..
1979-89 1989-99 1998 1999 1999-03(average annual growth)GDP 5.9 3.3 5.7 4.0 ..GNP per capita 4.5 2.5 4.1 3.2 ..Exports of goods and services 9.2 0.8 13.4 4.7 ..
STRUCTURE of the ECONOMY1979 1989 1998 1999
(% of GDP)Agriculture 15.7 17.0 10.8 10.4Industry 24.9 24.7 26.9 25.8 Manufacturing 10.7 10.8 6.8 6.5Services 59.4 58.3 62.3 63.8
Private consumption 87.5 69.3 69.2 69.1General government consumption 23.1 19.2 18.8 19.0Imports of goods and services 95.2 82.7 71.0 73.0
1979-89 1989-99 1998 1999(average annual growth)Agriculture 6.5 -2.8 8.3 -5.7Industry 5.7 3.3 5.7 -0.4 Manufacturing 5.4 0.3 -5.6 -1.6Services 5.3 4.8 5.3 7.6
Private consumption 1.9 3.4 -1.2 3.8General government consumption 3.2 3.0 4.8 5.0Gross domestic investment 4.7 4.7 13.1 9.3Imports of goods and services 3.8 1.9 6.6 7.0Gross national product 5.5 3.2 4.8 4.0
Note: 1999 data are preliminary estimates.
* The diamonds show four key indicators in the country (in bold) compared with its income-group average. If data are missing, the diamond will be incomplete.
-5
0
5
10
15
94 95 96 97 98 99
GDI GDP
Growth of investment and GDP (%)
St. Vincent and the Grenadines
Lower-middle-income group
Development diamond*
Life expectancy
Access to safe water
GNPpercapita
Grossprimary
enrollment
-20
-10
0
10
20
94 95 96 97 98 99
Exports Imports
Growth of exports and imports (%)
St. Vincent and the Grenadines
Lower-middle-income group
Economic ratios*
Trade
DomesticSavings
Investment
Indebtedness
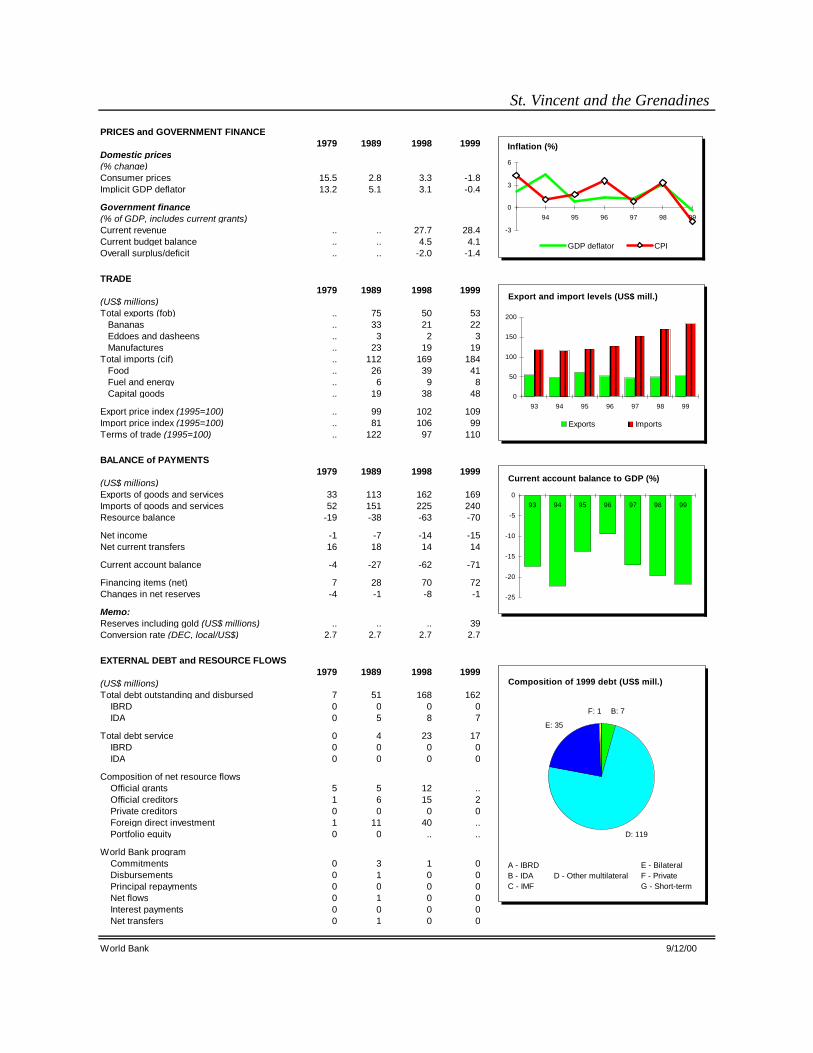
St. Vincent and the Grenadines
PRICES and GOVERNMENT FINANCE1979 1989 1998 1999
Domestic prices(% change)Consumer prices 15.5 2.8 3.3 -1.8Implicit GDP deflator 13.2 5.1 3.1 -0.4
Government finance(% of GDP, includes current grants)Current revenue .. .. 27.7 28.4Current budget balance .. .. 4.5 4.1Overall surplus/deficit .. .. -2.0 -1.4
TRADE1979 1989 1998 1999
(US$ millions)Total exports (fob) .. 75 50 53 Bananas .. 33 21 22 Eddoes and dasheens .. 3 2 3 Manufactures .. 23 19 19Total imports (cif) .. 112 169 184 Food .. 26 39 41 Fuel and energy .. 6 9 8 Capital goods .. 19 38 48
Export price index (1995=100) .. 99 102 109Import price index (1995=100) .. 81 106 99Terms of trade (1995=100) .. 122 97 110
BALANCE of PAYMENTS1979 1989 1998 1999
(US$ millions)Exports of goods and services 33 113 162 169Imports of goods and services 52 151 225 240Resource balance -19 -38 -63 -70
Net income -1 -7 -14 -15Net current transfers 16 18 14 14
Current account balance -4 -27 -62 -71
Financing items (net) 7 28 70 72Changes in net reserves -4 -1 -8 -1
Memo:Reserves including gold (US$ millions) .. .. .. 39Conversion rate (DEC, local/US$) 2.7 2.7 2.7 2.7
EXTERNAL DEBT and RESOURCE FLOWS1979 1989 1998 1999
(US$ millions)Total debt outstanding and disbursed 7 51 168 162 IBRD 0 0 0 0 IDA 0 5 8 7
Total debt service 0 4 23 17 IBRD 0 0 0 0 IDA 0 0 0 0
Composition of net resource flows Official grants 5 5 12 .. Official creditors 1 6 15 2 Private creditors 0 0 0 0 Foreign direct investment 1 11 40 .. Portfolio equity 0 0 .. ..
World Bank program Commitments 0 3 1 0 Disbursements 0 1 0 0 Principal repayments 0 0 0 0 Net flows 0 1 0 0 Interest payments 0 0 0 0 Net transfers 0 1 0 0
World Bank 9/12/00
-3
0
3
6
94 95 96 97 98 99
GDP deflator CPI
Inflation (%)
-25
-20
-15
-10
-5
093 94 95 96 97 98 99
Current account balance to GDP (%)
0
50
100
150
200
93 94 95 96 97 98 99
Exports Imports
Export and import levels (US$ mill.)
D: 119
B: 7F: 1
E: 35
Composition of 1999 debt (US$ mill.)
A - IBRDB - IDA C - IMF
D - Other multilateralE - BilateralF - PrivateG - Short-term

Suriname at a glance 8/10/00
Latin Lower-POVERTY and SOCIAL America middle-
Suriname & Carib. income1999Population, mid-year (millions) 0.41 509 2,094GNP per capita (Atlas method, US$) .. 3,840 1,200GNP (Atlas method, US$ billions) .. 1,955 2,513
Average annual growth, 1993-99
Population (%) 0.3 1.6 1.1Labor force (%) 1.2 2.5 1.2
Most recent estimate (latest year available, 1993-99)
Poverty (% of population below national poverty line) .. .. ..Urban population (% of total population) 73 75 43Life expectancy at birth (years) 70 70 69Infant mortality (per 1,000 live births) 28 31 33Child malnutrition (% of children under 5) .. 8 15Access to improved water source (% of population) 72 75 86Illiteracy (% of population age 15+) .. 12 16Gross primary enrollment (% of school-age population) 147 113 114 Male 146 .. 114 Female 148 .. 116
KEY ECONOMIC RATIOS and LONG-TERM TRENDS
1979 1989 1998 1999
GDP (US$ billions) 0.88 0.55 .. ..Gross domestic investment/GDP 22.9 20.8 .. ..Exports of goods and services/GDP 58.6 37.7 .. ..Gross domestic savings/GDP 22.5 30.7 .. ..Gross national savings/GDP .. .. .. ..
Current account balance/GDP 5.0 29.5 .. ..Interest payments/GDP .. .. .. ..Total debt/GDP .. .. .. ..Total debt service/exports .. .. .. ..Present value of debt/GDP .. .. .. ..Present value of debt/exports .. .. .. ..
1979-89 1989-99 1998 1999 1999-03(average annual growth)GDP -2.2 0.8 .. .. ..GNP per capita -2.9 0.0 2.5 .. ..Exports of goods and services .. .. .. .. ..
STRUCTURE of the ECONOMY1979 1989 1998 1999
(% of GDP)Agriculture 8.7 9.8 .. ..Industry 39.5 27.4 .. .. Manufacturing 17.9 12.9 .. ..Services 51.8 62.8 .. ..
Private consumption 55.6 39.3 .. ..General government consumption 21.9 30.0 .. ..Imports of goods and services 58.9 27.8 .. ..
1979-89 1989-99 1998 1999(average annual growth)Agriculture 0.3 .. .. ..Industry -1.9 .. .. .. Manufacturing -4.4 .. .. ..Services 0.1 .. .. ..
Private consumption .. .. .. ..General government consumption .. .. .. ..Gross domestic investment .. .. .. ..Imports of goods and services .. .. .. ..Gross national product -1.7 0.3 2.8 ..
Note: 1999 data are preliminary estimates.This table was produced from the Development Economics central database.* The diamonds show four key indicators in the country (in bold) compared with its income-group average. If data are missing, the diamond will be incomplete.
-3
0
3
6
94 95 96 97 98 99
GDI GDP
Growth rates of output and investment (%)
Suriname
Lower-middle-income group
Development diamond*
Life expectancy
Access to safe water
GNPpercapita
Grossprimary
enrollment
Suriname
Lower-middle-income group
Economic ratios*
Trade
DomesticSavings
Investment
Indebtedness

Suriname
PRICES and GOVERNMENT FINANCE1979 1989 1998 1999
Domestic prices(% change)Consumer prices 14.8 0.8 .. ..Implicit GDP deflator 15.1 5.2 .. ..
Government finance(% of GDP, includes current grants)Current revenue .. .. .. ..Current budget balance .. .. .. ..Overall surplus/deficit .. .. .. ..
TRADE1979 1989 1998 1999
(US$ millions)Total exports (fob) .. .. .. .. n.a. .. .. .. .. n.a. .. .. .. .. Manufactures .. .. .. ..Total imports (cif) .. .. .. .. Food .. .. .. .. Fuel and energy .. .. .. .. Capital goods .. .. .. ..
Export price index (1995=100) .. .. .. ..Import price index (1995=100) .. .. .. ..Terms of trade (1995=100) .. .. .. ..
BALANCE of PAYMENTS1979 1989 1998 1999
(US$ millions)Exports of goods and services 514 573 .. ..Imports of goods and services 512 422 .. ..Resource balance 1 151 .. ..
Net income -45 -6 .. ..Net current transfers 88 18 .. ..
Current account balance 44 163 .. ..
Financing items (net) -17 -163 .. ..Changes in net reserves -27 0 .. ..
Memo:Reserves including gold (US$ millions) .. .. .. ..Conversion rate (DEC, local/US$) 1.8 4.9 401.0 ..
EXTERNAL DEBT and RESOURCE FLOWS1979 1989 1998 1999
(US$ millions)Total debt outstanding and disbursed .. .. .. .. IBRD .. .. .. .. IDA .. .. .. ..
Total debt service .. .. .. .. IBRD .. .. .. .. IDA .. .. .. ..
Composition of net resource flows Official grants .. .. .. .. Official creditors .. .. .. .. Private creditors .. .. .. .. Foreign direct investment .. .. .. .. Portfolio equity .. .. .. ..
World Bank program Commitments .. .. .. .. Disbursements .. .. .. .. Principal repayments .. .. .. .. Net flows .. .. .. .. Interest payments .. .. .. .. Net transfers .. .. .. ..
World Bank 8/10/00
0
100
200
300
400
500
94 95 96 97 98 99
GDP deflator CPI
Inflation (%)

Trinidad and Tobago at a glance 9/30/98
Trinidad Latin Upper-POVERTY and SOCIAL and America middle-
Tobago & Carib. income1997Population, mid-year (millions) 1.3 494 571GNP per capita (Atlas method, US$) 4,230 3,880 4,520GNP (Atlas method, US$ billions) 5.5 1,917 2,584
Average annual growth, 1991-97
Population (%) 0.8 1.7 1.5Labor force (%) 1.8 2.3 1.9
Most recent estimate (latest year available, 1991-97)
Poverty (% of population below national poverty line) 21 .. ..Urban population (% of total population) 73 74 73Life expectancy at birth (years) 73 70 70Infant mortality (per 1,000 live births) 12 32 30Child malnutrition (% of children under 5) 7 .. ..Access to safe water (% of population) 82 73 79Illiteracy (% of population age 15+) 2 13 15Gross primary enrollment (% of school-age population) 96 111 107 Male 91 .. .. Female 102 .. ..
KEY ECONOMIC RATIOS and LONG-TERM TRENDS
1976 1986 1996 1997
GDP (US$ billions) 2.5 4.8 5.5 5.9Gross domestic investment/GDP 24.6 21.6 15.4 15.5Exports of goods and services/GDP 55.8 33.3 52.8 52.5Gross domestic savings/GDP 40.3 17.3 25.9 29.1Gross national savings/GDP 35.5 11.4 17.0 17.3
Current account balance/GDP 11.4 -8.0 1.7 1.8Interest payments/GDP 0.4 2.5 3.0 2.4Total debt/GDP 3.8 39.2 41.0 36.6Total debt service/exports 5.3 18.9 15.6 17.8Present value of debt/GDP .. .. 39.6 ..Present value of debt/exports .. .. 71.5 ..
1976-86 1987-97 1996 1997 1998-02(average annual growth)GDP 4.3 0.9 3.2 2.9 3.5GNP per capita 1.7 0.0 2.9 5.1 2.8Exports of goods and services 5.1 -2.6 -7.7 4.0 4.0
STRUCTURE of the ECONOMY1976 1986 1996 1997
(% of GDP)Agriculture 3.9 2.6 2.2 2.1Industry 59.5 39.7 45.3 43.1 Manufacturing 14.5 7.9 8.6 8.3Services 36.6 57.7 52.5 54.8
Private consumption 47.5 59.2 62.6 58.6General government consumption 12.2 23.4 11.5 12.3Imports of goods and services 40.1 37.5 42.3 39.0
1976-86 1987-97 1996 1997(average annual growth)Agriculture -7.5 3.3 7.0 4.0Industry -2.0 0.6 2.7 4.0 Manufacturing -9.4 1.7 0.0 5.0Services 4.0 -1.1 3.5 1.8
Private consumption 6.0 2.4 14.5 1.2General government consumption 5.6 -6.1 -3.1 8.6Gross domestic investment 1.3 3.4 -15.8 3.8Imports of goods and services 8.7 -5.3 -2.4 2.9Gross national product 3.3 0.8 3.7 5.9
Note: 1997 data are preliminary estimates.
* The diamonds show four key indicators in the country (in bold) compared with its income-group average. If data are missing, the diamond will be incomplete.
-20
0
20
40
60
92 93 94 95 96 97
GDI GDP
Growth rates of output and investment (%)
Trinidad and Tobago
Upper-middle-income group
Development diamond*
Life expectancy
Access to safe water
GNPpercapita
Grossprimary
enrollment
-60
-40
-20
0
20
40
92 93 94 95 96 97
Exports Imports
Growth rates of exports and imports (%)
Trinidad and Tobago
Upper-middle-income group
Economic ratios*
Trade
DomesticSavings
Investment
Indebtedness

Trinidad and Tobago
PRICES and GOVERNMENT FINANCE1976 1986 1996 1997
Domestic prices(% change)Consumer prices 10.7 7.7 3.4 6.9Implicit GDP deflator 3.2 -1.3 4.1 1.5
Government finance(% of GDP, includes current grants)Current revenue .. 30.9 29.3 25.8Current budget balance .. .. 6.0 1.4Overall surplus/deficit .. .. 1.6 -1.5
TRADE1976 1986 1996 1997
(US$ millions)Total exports (fob) .. .. 2,470 2,484 Fuel .. .. 1,217 1,194 Other fuel .. .. 606 656 Manufactures .. .. 165 ..Total imports (cif) .. .. 2,153 1,340 Food .. .. 172 161 Fuel and energy .. .. 298 263 Capital goods .. .. 661 711
Export price index (1995=100) .. .. 108 110Import price index (1995=100) .. .. 110 114Terms of trade (1995=100) .. .. 98 96
BALANCE of PAYMENTS1976 1986 1996 1997
(US$ millions)Exports of goods and services 1,391 1,650 2,933 3,096Imports of goods and services 1,002 1,823 2,167 2,298Resource balance 389 -173 766 799
Net income -103 -211 -470 -339Net current transfers .. .. -13 -355
Current account balance 285 -384 283 104
Financing items (net) -85 -338 -64 396Changes in net reserves -200 722 -219 -500
Memo:Reserves including gold (US$ millions) 1,014 476 560 838Conversion rate (DEC, local/US$) 2.4 3.6 6.0 6.0
EXTERNAL DEBT and RESOURCE FLOWS1976 1986 1996 1997
(US$ millions)Total debt outstanding and disbursed 96 1,879 2,242 2,162 IBRD 52 40 79 75 IDA 0 0 0 0
Total debt service 77 330 473 555 IBRD 6 9 10 14 IDA 0 0 0 0
Composition of net resource flows Official grants 0 1 7 9 Official creditors 3 10 -26 -52 Private creditors -54 167 23 -244 Foreign direct investment 132 -15 320 340 Portfolio equity 0 0 0 0
World Bank program Commitments 7 0 51 0 Disbursements 9 0 17 12 Principal repayments 2 6 5 9 Net flows 7 -6 12 4 Interest payments 3 3 5 5 Net transfers 3 -9 7 -1
World Bank 9/30/98
-4
-2
0
2
4
6
91 92 93 94 95 96 97
Current account balance to GDP ratio (%)
0
500
1,000
1,500
2,000
2,500
91 92 93 94 95 96 97
Exports Imports
Export and import levels (US$ millions)
0
5
10
15
92 93 94 95 96 97
GDP deflator CPI
Inflation (%)
G: 575
A: 75
D: 509
C: 4
F: 809
E: 190
Composition of total debt, 1997 (US$ millions)
A - IBRDB - IDA C - IMF
D - Other multilateralE - BilateralF - PrivateG - Short-term
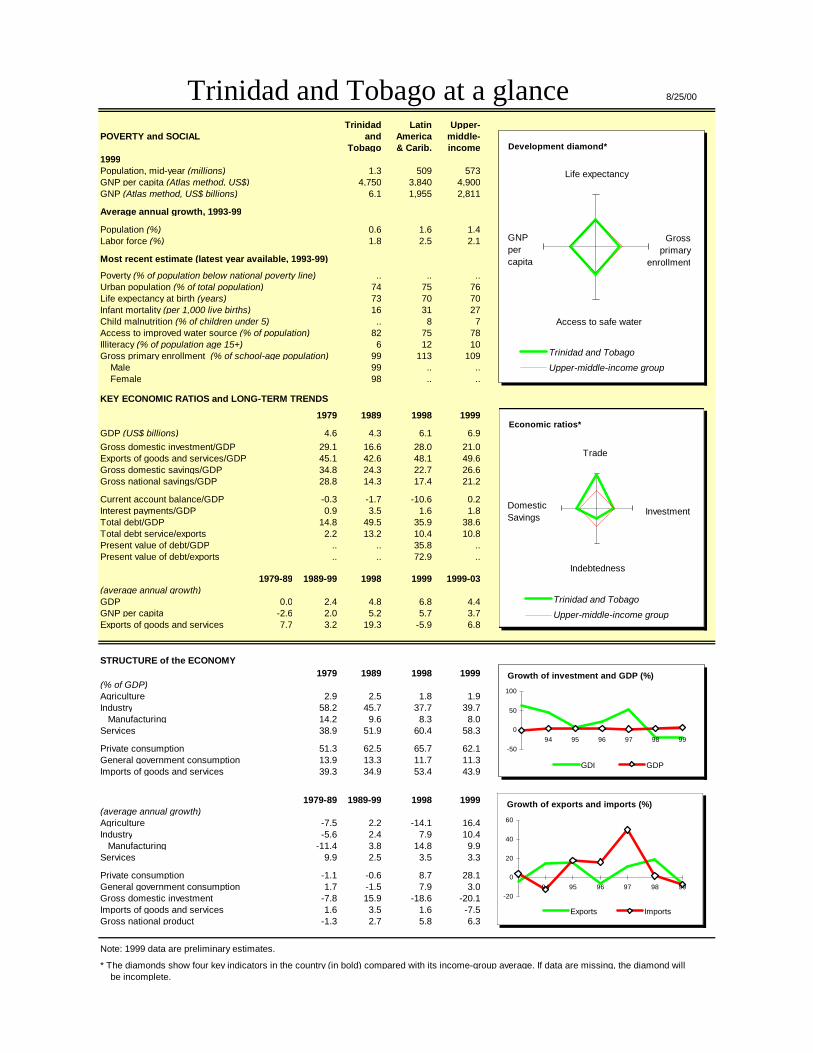
Trinidad and Tobago at a glance 8/25/00
Trinidad Latin Upper-POVERTY and SOCIAL and America middle-
Tobago & Carib. income1999Population, mid-year (millions) 1.3 509 573GNP per capita (Atlas method, US$) 4,750 3,840 4,900GNP (Atlas method, US$ billions) 6.1 1,955 2,811
Average annual growth, 1993-99
Population (%) 0.6 1.6 1.4Labor force (%) 1.8 2.5 2.1
Most recent estimate (latest year available, 1993-99)
Poverty (% of population below national poverty line) .. .. ..Urban population (% of total population) 74 75 76Life expectancy at birth (years) 73 70 70Infant mortality (per 1,000 live births) 16 31 27Child malnutrition (% of children under 5) .. 8 7Access to improved water source (% of population) 82 75 78Illiteracy (% of population age 15+) 6 12 10Gross primary enrollment (% of school-age population) 99 113 109 Male 99 .. .. Female 98 .. ..
KEY ECONOMIC RATIOS and LONG-TERM TRENDS
1979 1989 1998 1999
GDP (US$ billions) 4.6 4.3 6.1 6.9Gross domestic investment/GDP 29.1 16.6 28.0 21.0Exports of goods and services/GDP 45.1 42.6 48.1 49.6Gross domestic savings/GDP 34.8 24.3 22.7 26.6Gross national savings/GDP 28.8 14.3 17.4 21.2
Current account balance/GDP -0.3 -1.7 -10.6 0.2Interest payments/GDP 0.9 3.5 1.6 1.8Total debt/GDP 14.8 49.5 35.9 38.6Total debt service/exports 2.2 13.2 10.4 10.8Present value of debt/GDP .. .. 35.8 ..Present value of debt/exports .. .. 72.9 ..
1979-89 1989-99 1998 1999 1999-03(average annual growth)GDP 0.0 2.4 4.8 6.8 4.4GNP per capita -2.6 2.0 5.2 5.7 3.7Exports of goods and services 7.7 3.2 19.3 -5.9 6.8
STRUCTURE of the ECONOMY1979 1989 1998 1999
(% of GDP)Agriculture 2.9 2.5 1.8 1.9Industry 58.2 45.7 37.7 39.7 Manufacturing 14.2 9.6 8.3 8.0Services 38.9 51.9 60.4 58.3
Private consumption 51.3 62.5 65.7 62.1General government consumption 13.9 13.3 11.7 11.3Imports of goods and services 39.3 34.9 53.4 43.9
1979-89 1989-99 1998 1999(average annual growth)Agriculture -7.5 2.2 -14.1 16.4Industry -5.6 2.4 7.9 10.4 Manufacturing -11.4 3.8 14.8 9.9Services 9.9 2.5 3.5 3.3
Private consumption -1.1 -0.6 8.7 28.1General government consumption 1.7 -1.5 7.9 3.0Gross domestic investment -7.8 15.9 -18.6 -20.1Imports of goods and services 1.6 3.5 1.6 -7.5Gross national product -1.3 2.7 5.8 6.3
Note: 1999 data are preliminary estimates.
* The diamonds show four key indicators in the country (in bold) compared with its income-group average. If data are missing, the diamond will be incomplete.
-50
0
50
100
94 95 96 97 98 99
GDI GDP
Growth of investment and GDP (%)
Trinidad and Tobago
Upper-middle-income group
Development diamond*
Life expectancy
Access to safe water
GNPpercapita
Grossprimary
enrollment
-20
0
20
40
60
94 95 96 97 98 99
Exports Imports
Growth of exports and imports (%)
Trinidad and Tobago
Upper-middle-income group
Economic ratios*
Trade
DomesticSavings
Investment
Indebtedness

Trinidad and Tobago
PRICES and GOVERNMENT FINANCE1979 1989 1998 1999
Domestic prices(% change)Consumer prices 14.5 11.4 5.6 2.9Implicit GDP deflator 20.4 7.2 -0.1 5.2
Government finance(% of GDP, includes current grants)Current revenue .. 26.3 25.2 24.2Current budget balance .. -2.6 0.3 0.5Overall surplus/deficit .. -4.5 -1.8 -0.4
TRADE1979 1989 1998 1999
(US$ millions)Total exports (fob) .. 1,535 2,264 2,816 Fuels .. 888 1,008 1,523 Chemicals .. 291 496 529 Manufactures .. 98 196 217Total imports (cif) .. 1,208 3,008 2,752 Food .. 191 189 192 Fuel and energy .. 70 300 554 Capital goods .. 406 1,246 885
Export price index (1995=100) .. .. 130 133Import price index (1995=100) .. .. 117 109Terms of trade (1995=100) .. .. 111 122
BALANCE of PAYMENTS1979 1989 1998 1999
(US$ millions)Exports of goods and services 2,068 1,833 2,938 3,404Imports of goods and services 1,808 1,505 3,264 3,015Resource balance 259 328 -326 389
Net income -248 -376 -342 -410Net current transfers -27 -25 22 34
Current account balance -15 -72 -645 13
Financing items (net) 359 -253 726 149Changes in net reserves -344 325 -81 -162
Memo:Reserves including gold (US$ millions) 2,142 247 783 945Conversion rate (DEC, local/US$) 2.4 4.3 6.3 6.3
EXTERNAL DEBT and RESOURCE FLOWS1979 1989 1998 1999
(US$ millions)Total debt outstanding and disbursed 681 2,138 2,193 2,653 IBRD 58 26 83 85 IDA 0 0 0 0
Total debt service 49 247 311 375 IBRD 9 8 13 17 IDA 0 0 0 0
Composition of net resource flows Official grants 2 6 9 .. Official creditors 63 34 -37 -10 Private creditors 94 9 31 .. Foreign direct investment 94 149 730 .. Portfolio equity 0 0 0 ..
World Bank program Commitments 20 0 0 15 Disbursements 4 0 15 10 Principal repayments 5 6 8 8 Net flows -1 -6 7 2 Interest payments 5 2 5 6 Net transfers -6 -8 2 -4
World Bank 8/25/00
0
5
10
15
20
94 95 96 97 98 99
GDP deflator CPI
Inflation (%)
-12
-9
-6
-3
0
3
6
93 94 95 96 97 98 99
Current account balance to GDP (%)
0
1,000
2,000
3,000
93 94 95 96 97 98 99
Exports Imports
Export and import levels (US$ mill.)
G: 649A: 85
D: 707
F: 1,137
E: 75
Composition of 1999 debt (US$ mill.)
A - IBRDB - IDA C - IMF
D - Other multilateralE - BilateralF - PrivateG - Short-term