report of the u.s. geological survey lidar workshop
TRANSCRIPT

Report of the U.S. Geological Survey Lidar Workshop Sponsored by the Land Remote Sensing Program and held in St. Petersburg, FL, November 2002
By Michael Crane1, Tonya Clayton2, Ellen Raabe2, Jason Stoker3, Larry Handley4, Gerald Bawden5, Karen Morgan2, Vivian Queija6
Open File Report 2004-1456
U.S. Department of the Interior U.S. Geological Survey
2004
1 U.S. Geological Survey, EROS Data Center, Sioux Falls, SD 57198-0001 2 U.S. Geological Survey, Center for Coastal & Watershed Studies, St. Petersburg, FL 33701 3 S.A.I.C., EROS Data Center, Sioux Falls, SD 57198-0001 4 U.S. Geological Survey, National Wetlands Research Center, Lafayette, LA 70506 5 U.S. Geological Survey, Water Resources Discipline, Sacramento, CA 95819 6 U.S. Geological Survey, Northwest Geographic Science Office, Seattle, WA 98104

CONTENTS KEY WORDS……………………………………………………………………… 6 ABSTRACT……………………………………………………………………….. 6 INTRODUCTION…………………………………………………………………. 7 BACKGROUND…………………………………………………………………... 7 PLENARY AND BREAKOUT SESSIONS……………………………………… 8 PLENARY 1 – CURRENT AND FUTURE LIDAR TECHNOLOGY…. 9 Characteristics of Airborne Lidar Ranging Systems………….. 9 Aircraft Position and Attitude Determination…………………… 15 Complementing Lidar Data With Spectral Imagery……….….. 17 PLENARY 2 - LIDAR APPLICATIONS WITHIN USGS………………. 24 BREAKOUT SESSION 2………………………………………………… 25 PLENARY 3 - CALIBRATION AND ACCURACY…………………….. 29 Calibration…………………………………………………………. 29 Laser Rangefinder Error…………………………………………. 29 GPS Position Errors……………………………………………… 30 INS Orientation Error…………………………………………….. 30 Accuracy Assessment……………………………………………. 32
Vertical Accuracy…………………………………………………. 33 Horizontal Accuracy……………………………………………… 33 Accuracy Assessment Reporting……………………………….. 35
BREAKOUT SESSION 3………………………………………………… 36
2

PLENARY 4 - TOOLS FOR PROCESSING AND EVALUATING LIDAR DATA…………………………..………………………………….. 38
BREAKOUT SESSION 4………………………………………………… 39
PLENARY 5 - LIDAR DATA MANAGEMENT…………………………. 44 BREAKOUT SESSION 5………………………………………………… 47 PLENARY 6 - COMMERCIAL AND CONTRACTING ISSUES……... 49 BREAKOUT SESSION 6………………………………………………… 50
RECOMMENDATIONS………………………………………………………….. 52 WORKSHOP REPORT………………………………………………….. 52 LIDAR INITIATIVE……………………………………………………….. 53 LIDAR SPECIAL INTEREST GROUP…………………………………. 53 TECHNOLOGY TRANSFER……………………………………………. 54 DATA CLEARINGHOUSE………………………………………………. 54 STANDARDS………………………………………………………….….. 54 ACCURACY ASSESSMENT………………………………………..….. 55 FOLLOW-ON WORKSHOP(S)…………………………………………. 55 CONCLUSIONS………………………………………………………………….. 55 BIBLIOGRAPHY………………………………………………………………….. 56
SELECTED REFERENCES…………………………………………….. 57
IMPORTANT WEB SITES………………………………………………. 60 APPENDICES……………………………………………………………………. 63 APPENDIX A - WORKSHOP ATTENDEES…………………………… 64 APPENDIX B - WORKSHOP AGENDA..……………………………… 70
APPENDIX C – ACRONYMS…………………………………………… 72
3

ILLUSTRATIONS
Figure 1. Typical components of an airborne lidar ranging system include
the laser altimeter, instruments for precision navigation (aircraft position and attitude), and a down-looking digital photographic or video camera………………………………………………………. 10
2. The larger the laser spot size, the greater the degree of target
mixing………………………………………………………………….. 11
3. Full laser waveform digitization provides nearly continuous vertical (range) resolution……………………………………………. 12
4. Annotated screen-capture view of the ALPS functionally linked
viewing windows……………………………………………………… 13
5. Alina’s Reef, an inshore patch reef, and Pacific Reef, a relatively barren bank-edge reef, have different textural signatures in NASA EAARL lidar data acquired at Biscayne National Park, FL, August, 2002……………………………………………………… 15
6. A NASA EAARL lidar elevation image of the Sunshine Skyway
Fishing Pier (south), Tampa Bay, FL, January 13, 2002.………... 16
7. Sources of error in determining geolocation of laser elevation measurements………………………………………………………… 17
8. Each pixel of a hyperspectral image contains reflectance (R)
information in a number of narrow wavebands – 224 in the case of the Airborne Visible/Infrared Imaging Spectrometer (AVIRIS)……………………………………………...……………….. 18
9. AVIRIS image cube of Moffett Field, California…………………… 19
10. Hyperspectral data (selected bands) draped over digital elevation (bathymetry) model for Anniversary Reef, Biscayne National Park, Florida………………………………………………… 20 11. Passive remote sensing in optically shallow submerged environments…………………………………………………………. 22
12. Note the offsets in the runways that became apparent with alternating flight lines in opposing directions……………………… 31
4

13. Vendors typically use known geographic coordinates of features such as building corners and ground control points in the validation of their lidar systems……………………………… 32 14. Users need to be aware that the cumulative effect of errors associated
with the acquisition and production of digital elevation data create a difference between absolute true elevation and the modeled elevation
they are provided (NDEP, 2003)…………………….……………… 34
15. Multiple returns from a ponderosa pine……………………………. 39
Table 1. Comparison of NMAS/NSSDA vertical accuracy (NDEP, 2003)… 34
2. Comparison of NMAS/NSSDA horizontal accuracy (NDEP, 2003)………………………………………………………….. 35 3. Lidar tools……………………………………………………………… 40
5

KEY WORDS
Lidar, Airborne Remote Sensing, Applications, Calibration, Accuracy, Processing Tools, Data Management, Acquisition Issues
ABSTRACT
The first United States Geological Survey (USGS) Light Detection And Ranging
(lidar) Workshop was held November 20-22, 2002 in St. Petersburg, Florida to bring together scientists and managers from across the agency. The workshop agenda
focused on six themes: 1) current and future lidar technologies, 2) lidar applications within USGS science and disciplines, 3) calibration and accuracy assessment, 4)
tools for processing and evaluating lidar data sets, 5) lidar data management, and 6) commercial and contracting issues. These six themes served as the topics for
workshop plenary sessions as well as the general focus for associated breakout sessions. A number of recommendations are presented regarding the role the
USGS should play in the future application and development of lidar technology.
6

INTRODUCTION This report documents the results of the first United States Geological Survey (USGS) Lidar Workshop held November 20-22, 2002 in St. Petersburg, Florida, and attended by more than 50 scientists and managers from across the agency (see Appendix A). The USGS Land Remote Sensing Program’s Interdisciplinary Science Support Activity Project sponsored the workshop to facilitate discussion on a broad spectrum of topics and issues relating to USGS utilization of lidar data and technology, and to learn how USGS scientists are currently using lidar data and in what types of applications. For neophytes and the curious, it was an opportunity for general introduction and explanation of the potential of lidar as a means to enhance their projects. An organizing committee consisting of Bryan Bailey (EROS Data Center), John Brock (Center for Coastal and Watershed Studies), Pat Chavez (Flagstaff Field Center), Ralph Haugerud (Seattle Field Center), and Dean Gesch (EROS Data Center) developed the workshop agenda around six themes: • Current and future lidar technologies • Lidar applications within USGS science disciplines • Calibration and accuracy assessment • Tools for processing and evaluating lidar data sets • Lidar data management • Commercial and contracting issues These six themes served as topics for the workshop plenary sessions and as the general focus for associated breakout sessions. The material in this report is presented in the sequence of the workshop. An interactive format was used throughout the workshop in order to best elicit the active participation of attendees. All four USGS disciplines were represented, with 18 partaking from Geography, 19 from Geology, nine from Water, and five from Biological Resources.
BACKGROUND The term "lidar" is an acronym for light detection and ranging, a technology that is similar to radar and sonar in that it is an active form of remote sensing. There are many types of lidar instrumentation, however, the focus of the workshop was confined to airborne lidar ranging systems. Modern airborne lidar ranging systems transmit and receive laser light pulses to sense the Earth’s surface and features such as trees and buildings that exist upon it. The length of time a transmitted laser light signal takes to reach the ground and be reflected back to the aircraft is precisely measured to determine the distance from the aircraft to specific points. Given the position and attitude of the aircraft, distance measurements are then transformed into elevation values that are used to derive bare earth surfaces and three-dimensional characterizations of the built environment and vegetation communities.
7

Lasers were first developed in the late 1950’s, and scientists soon found practical applications. In 1964, the National Aeronautics and Space Administration (NASA) succeeded in placing a reflecting mirror on the Moon that was used to reflect a laser beam sent from Earth for determining the distance between the two celestial bodies. The first successful experiments using airborne lasers for remote sensing purposes were carried out in the late 1960’s (Hickman and Hogg, 1969). Then in 1975, NASA and the National Oceanic and Atmospheric Administration (NOAA) collaborated on the development of the Atmospheric Oceanographic Lidar (AOL), an airborne system used to measure a variety of oceanographic parameters, but that also provided topographic information. This system is still operational in a more current version. Commercial developments during the 1980’s resulted in airborne laser profilers that generated a single line profile of the land surface parallel to the line of flight. It wasn’t until the 1990’s that laser scanners were developed. Airborne lidar ranging systems can be categorized into two broad classes: topographic systems that are intended to operate over land (Fowler, 2001), and water penetrating systems designed to sense submerged surfaces (Guenther, 2001). Within each of these broad classes are specialized lidar types (e.g., canopy lidar, fish lidar). Water penetrating lidar systems utilize the blue/green portion of the electromagnetic spectrum because it enables their emitted signals to penetrate water with the least attenuation (usually to a depth of about 50 meters under ideal conditions). In contrast, topographic lidar systems use the infrared portion of the spectrum because this provides the strongest signal response from terrestrial surfaces. Airborne lidar is a comparatively young technology that continues to evolve and improve. The present trend is toward smaller, lighter, less expensive hybrid systems that include a digital camera component, and on-board data processing to speed delivery of products to the customer.
PLENARY AND BREAKOUT SESSIONS The workshop included six plenary sessions with topics covering current and future lidar technologies, lidar applications within the USGS science disciplines, calibration and accuracy assessment, tools for processing and evaluating lidar data sets, lidar data management, and commercial and contracting issues. A detailed program listing the plenary session topics and presenters is included in Appendix B. Associated with all but the first plenary were a sequence of breakout sessions. Attendees were assigned to one of four breakout groups that met during the breakout sessions to address specific issues relating to the topic of the preceding plenary. The questions posed to the breakout groups and their responses are provided at the end of each plenary report below.
8

PLENARY 1 - CURRENT AND FUTURE LIDAR TECHNOLOGY Characteristics of Airborne Lidar Ranging Systems Topographic and water penetrating airborne lidar systems include, in addition to the laser altimeter, components for precision navigation (Fowler, 2001). These components include a global positioning system (GPS) instrument suite and an aircraft attitude system, in addition to the laser transmitter and receiver (fig. 1). A down-looking digital photographic or video camera is optional, but for some applications is becoming almost standard equipment due to the great value of a coincident visual record. In planning lidar data collection, important survey parameters to consider include laser spot spacing, swath width, scan rate, and mapping rate. These parameters are determined in part by the nature of the laser transmitter and receiver, and in part by the nature of the flight geometry (e.g., aircraft speed and altitude). Developments in laser transmitters have focused on increasing the number of pulses transmitted per second (a 50 kHz system generates 50,000 pulses of laser energy per second). Receivers have meanwhile been developed to record multiple returns from a single laser shot. When a laser shot is intercepted by a tree, for example, the first return may provide the location of the treetop, intermediate returns may characterize the tree canopy, and the last return may give the elevation of the ground beneath the tree. Another important consideration is the laser spot size or “footprint.” The larger the spot diameter, the greater the degree of target mixing (fig. 2). However, smaller is not necessarily better. The optimal spot size will be determined by the application at hand. The inevitable trade-off between spatial resolution and signal strength must also be considered. Optimizing a lidar system for maximum water penetration, for example, requires a high-energy pulse (~5-50 mJ). Under optimal, clear-water conditions, return signals from such a system may be recovered from as deep as 3 Secchi depths (~50 meters in clear water). However, the higher the pulse energy, the lower the pulse repetition frequency (PRF). Typical water penetrating lidars may have PRFs of ~ 200 – 1000 Hz, while topographic lidars unconcerned with water penetration may have PRFs of up to 50,000 Hz. A lower PRF results in a lower spatial sampling density (i.e., more widely spaced soundings). If spatial resolution rather than water penetration is a priority for a given application, then the sensor will be designed with a higher PRF and a lower-energy pulse. The NASA Experimental Advanced Airborne Research Lidar (EAARL), a water-penetrating system recently developed for research applications, has a pulse-energy
9

Figure 1. Typical components of an airborne lidar ranging system include the laser altimeter, instruments for precision navigation (aircraft position and attitude), and a down-looking digital photographic or video camera.
of 0.05 mJ and a PRF ranging from 800 - 5000 Hz, depending on the scan angle. The net result is a more dense collection of soundings constrained to shallower depths (~ 20 m penetration in clear waters). There is no one “best” lidar system. The ideal configuration depends on each user’s particular application.
10

As the name implies, the NASA Airborne Topographic Mapper (ATM) is a lidar system used to characterize the topography of the landscape. The ATM data system includes laser ranging and inertial navigation system (INS) attitude measurements. For each laser pulse, a single two-way, first-return travel time is recorded and later converted to units of distance. GPS data are collected at both the aircraft and on the ground. With a range calibration, the initial laser range measurements are converted to calibrated range data, while the INS and GPS data are combined to compute the aircraft trajectory. Finally, from the instrument mounting parameters and the aircraft trajectory, the range data are converted to a spot elevation for each laser pulse. The ATM system is designed to receive only the first-return signal.
Figure 2. The larger the laser spot size, the greater the degree of target mixing. The two circles schematically illustrate the area illuminated by two laser pulses of differing diameters. Depicted on the left is an up-looking hemispherical view of tree canopy, whereas a ground-level view is shown on the right - both images taken on Assateague Island, MD. The ATM is used primarily for research surveys of non-vegetated beaches and ice sheets. In these environments, it is sufficient to record the time between the laser shot and the first returned signal. In vegetated environments, however, it is useful to record information not only about the time elapsed between the laser shot and the first returned signal (from the upper reaches of the vegetation canopy, for example), but also about the time elapsed until the last returned signal (from the “bald earth” beneath the vegetation). For some applications, a two-return (first- and last-return) lidar may be insufficient, and a record of intermediate returns may be desired as well. Multiple-return lidars are particularly useful in the fields of forestry and ecology. For some applications, a full elevation-backscatter record for each pulse may be desired (fig. 3). This capability can be especially useful in conjunction with data collected by passive optical sensors, which, over volume reflectors (e.g., vegetation canopy or a water column), provide a vertically integrated signal. Laser waveform digitizations can provide vertical (range) resolution within the vegetation canopy or the water column. These two types of data are highly complementary.
11

Figure 3. Full laser waveform digitization provides nearly continuous vertical (range) resolution.
Temporal waveform-digitizing lidar is potentially useful to the USGS in a number of applications. Potential terrestrial applications include topographic mapping of “bald earth” elevations beneath obscuring vegetation, estimations of fire fuel and other vegetation-related quantities, fluvial studies, and urban mapping. In the aquatic and marine realms, potential applications might include characterizations of submerged topography, as well as discrimination and characterization of shallow benthic habitats and water-column turbidity. In cross-environment applications, studies of shoreline definition and coastal change would be among those of interest. One example of a temporal waveform-digitizing lidar is the NASA EAARL instrument (Wright and Brock, 2002; Brock et al., 2002a). EAARL utilizes a low-power (0.05 mJ/pulse), green (532-nm) laser with a pulse rate that is intermediate between that of typical water penetrating and topographic surveying lidars. The EAARL laser is characterized by a short transmitted pulse (~1 nsec) and narrow beam divergence. EAARL scans 25 rasters/sec and has a relatively small laser-spot footprint (~ 20 cm diameter, at an aircraft altitude of 300 m). Under two-pass survey conditions, the result is ~ 1 x 1 m sample spacing. Depending on water clarity, maximum depth penetration ranges up to ~ 20 m. The EAARL receiver provides for rapid capture of the backscatter history of each reflection (~ 1 nsec sampling interval), and on-the-fly recognition of and response to return-waveform complexity.
12

Evaluation and exploitation of this suite of capabilities is a current focus of several USGS research scientists across the Bureau. As off-the-shelf software is not available for handling the waveforms and associated data, one precursor element of this work has been collaborative USGS/NASA development of custom software to process and interactively explore EAARL data. An important capability of this shared Airborne Lidar Processing System (ALPS) is the provision of a variety of viewing and control windows that are functionally linked (fig. 4). For viewer orientation, a flight track map is provided in one window. To view the lidar data at a given location, the user simply clicks on the flight line in their region of interest. Additional windows display the EAARL data as single laser waveforms, as
Bald Earth
Canopy
Location Map
Flight Track Map
Digital PhotographyBrowser
A Single Laser Waveform
A Single Laser Raster
Raster-Viewing
Figure 4. Annotated screen-capture view of the ALPS functionally linked viewing windows. collections of waveforms in laser rasters (i.e., cross-sections) color-coded according to backscatter intensity, and as map views of first-return and bald earth data color-coded according to elevation. A dynamically linked digital photography browser is also provided. EAARL capabilities are presently being assessed in a USGS research project to recover bald earth topography beneath various vegetation types in the vicinity of the Terra Ceia Aquatic Preserve located at the southern end of Tampa Bay, Florida.
13

The boundaries of three different vegetation communities of invasive exotics – one dominated by cogan grass, one by Australian pine, and one by Brazilian pepper – have been mapped according to orthophotograph mosaics and site visits. EAARL results in terms of first return elevations, bald earth elevations, and vegetation heights have been evaluated in each of these regions. Ongoing work involves the development of a random consensus filter to improve the bald earth retrievals, which are being compared to ground elevation surveys conducted by a local engineering firm. Another example of USGS research to evaluate the utility of new lidar capabilities comes from recent work in Biscayne National Park, Florida (Brock et. al., 2004). For a water-penetrating lidar, EAARL has a relatively small spot size with the potential for capturing significant bottom surface textural information. This data is currently being evaluated in terms of the ability to discriminate and characterize shallow benthic habitats in a variety of environments. In the northernmost Florida Keys, the initial emphasis has been the development of lidar-based measures of coral reef “optical rugosity.” Each raster scan is treated as a submarine topographic transect, and a measure of rugosity is calculated for each point along the transect as the ratio of (a) the terrain-following distance between the transect origin and the point of interest, to (b) the straight-line distance between those same two points. A perfectly flat transect has an optical rugosity value of one, while a transect surface with peaks and valleys has a value > one. Mean elevation difference between adjacent points along the transect provides another measure of surface roughness. A perfectly flat surface has a mean absolute elevation difference of zero m, while a transect surface with peaks and valleys has a mean absolute value >zero m. Among the primary study sites are Alina’s Reef, a small patch reef just east of well-known Anniversary Reef, and Pacific Reef, a relatively barren bank-edge reef. These two reefs, distinctly different to the eye and by National Park Service measures of reef status, can also be discriminated according to LIDAR-based expressions of optical rugosity (fig. 5). These preliminary results indicate that a high-PRF, narrow-beam, temporal waveform-resolving green LIDAR can provide a potentially useful view of coral reef habitat complexity, one measure of reef status. An important point emphasized throughout the Workshop is the critical need to acquire ground reference information in the field to support lidar data processing, feature extraction, and accuracy assessments. One example was provided by a joint USGS Geology/Biology disciplines study of how to characterize detailed canopy structure from the air and from the ground. Numerous other examples of ground reference data and its importance were presented throughout the course of the Workshop.
14

Alina’s Reef
Pacific Reef
Figure 5. Alina’s Reef, an inshore patch reef, and Pacific Reef, a relatively barren bank-edge reef, have different textural signatures in NASA EAARL lidar data acquired at Biscayne National Park, FL, August, 2002.
Aircraft Position and Attitude Determination The determination of aircraft position relies on kinematic dual-frequency carrier phase differential Global Positioning System (GPS), with a mobile GPS receiver mounted on the aircraft and a base station on the ground as shown in figure 1. This system provides aircraft position at sub-meter accuracy. The largest relative positioning error for typical airborne digital GPS is tropospheric in origin (0.10 m for a 50-km baseline), with lesser contributions from ionospheric (0.05 – 0.50 m), orbital (0.05 m), signal multipath (0.05 m), and receiver noise (< 0.025 m) sources. A number of different systems are available for aircraft attitude determination, with inevitable trade-offs among all. Illustrating this point is an error analysis conducted for three different attitude systems mounted with an elliptically scanning lidar: a GPS-based system, an Inertial Navigation System (INS) with a ring laser gyro, and a combination GPS/INS. Attitude errors ranged from 0.005o to 0.1o, range errors varied from 0.02 m to 0.49 m, and horizontal errors ranged from 0.09 m to 1.87 m. In every case, the combination system (most expensive) yielded the most accurate results, while the GPS-based system (least expensive) yielded the least accurate results.
15

The implications of inaccurate aircraft position and attitude determination can be illustrated with laser intensity images collected over an airport runway. The white-on-black threshold markings provide high-visibility, straightedge targets that readily reveal laser spot geopositioning errors. Such errors introduce a jagged look to the stripes that are in reality straight-edged and parallel. Most lidar operators test their equipment over well-characterized calibration sites that include a variety of terrain types (Fowler, 2001). The plane flies over the site in two opposing directions, with one or more additional orthogonal cross-flights. The lidar results for building corners and ground control points are then evaluated in terms of agreement with ground reference surveys and flightline-to-flightline concordance (fig. 6).
Figure 6. A NASA EAARL lidar elevation image of the Sunshine Skyway Fishing Pier (South), Tampa Bay, FL, January 13, 2002. The aircraft made seven passes over the structure, all at different angles, for the purpose of evaluating flightline-to-flightline differences in edge discrimination and corner definition (red circles). The brown (higher-elevation) pixels indicate reflections from a small building at the end of the pier. Distance between major ticks on both axes is 20 m.
Accurate geolocation of lidar elevation measurements is critical to many natural-science applications, such as the discrimination of microtopography and change detection, and special attention must be given to potential artifactual effects. For example, lidar elevation-difference maps may indicate apparent change at building edges, even between closely spaced surveys in stable areas. Such edges are, on the ground, stable markers, but geolocation errors, plus the difficulties of discriminating edges in lidar data alone, can produce the false appearance of change through time.
16

To summarize, there are a number of sources of error in determining the geolocation of a lidar elevation measurement (fig. 7). Potential errors include: the number of satellites visible to the GPS mobile and ground stations, baseline length (the distance between the mobile and ground GPS stations), scan angle uncertainties, instrument mounting biases, aircraft position errors (~ 5 cm), aircraft attitude errors (~0.02o), range (range walk) errors (< 5 cm), refraction at the air/water interface, errors due to spot size, local geoid error (0.1 to > 1 m), and conversion to a mean sea level vertical datum (e.g., NAVD88).
• Local Geoid Error • Conversion to MSL Vertical Datum
• Error Due to Spot Size
• Number of GPS Satellites
• Error Due to Baseline Length
• Refraction at the Water Surface
• Range (Range Walk) Error
• Scan Angle Uncertainty • Instrument Mounting Bias • Aircraft Position Error • Aircraft Attitude Error
ELEVATION
Figure 7. Sources of error in determining geolocation of laser elevation measurements.
Complementing Lidar Data With Spectral Imagery Lidar ranging systems can provide high-resolution three-dimensional structural data. Increasingly, scientists want to know more about an environment than just its three-dimensional structure, and this can be accomplished by concurrently using complementary remote sensing tools. Whereas lidar (an active remote sensing technique) provides fine structural definition of the landscape, hyperspectral imaging (also known as imaging spectroscopy) is a passive optical remote sensing technique that contributes high-resolution spectral information.
17
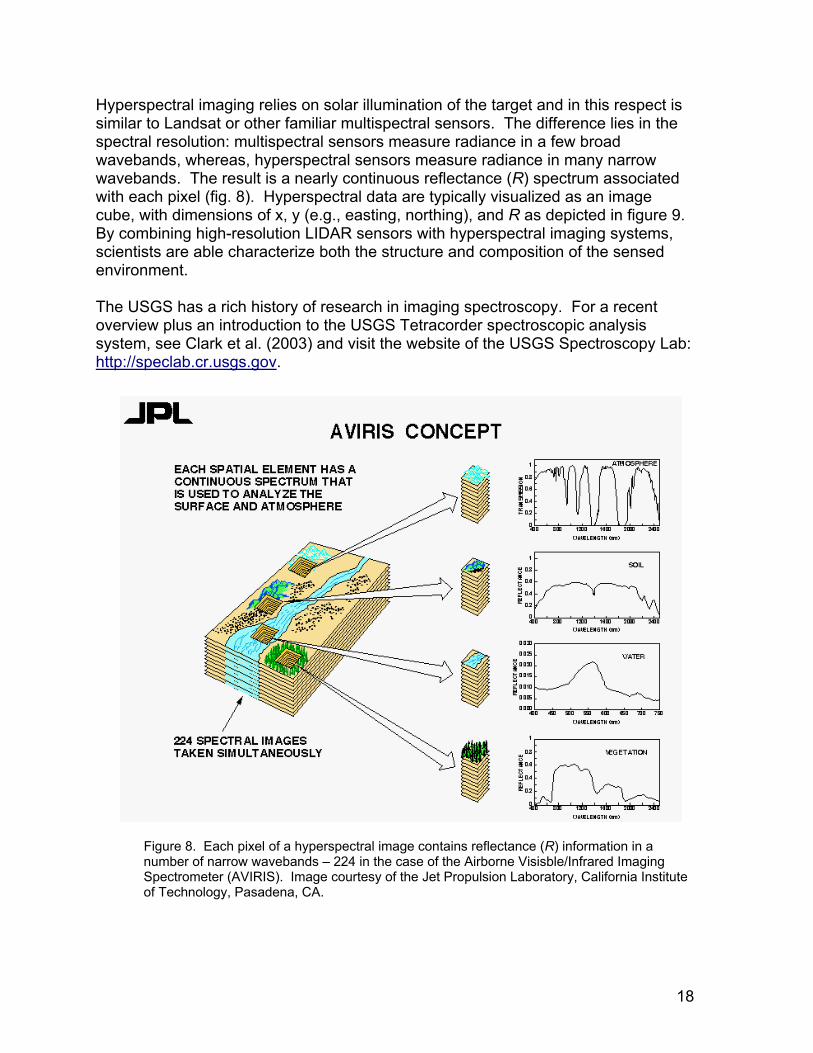
Hyperspectral imaging relies on solar illumination of the target and in this respect is similar to Landsat or other familiar multispectral sensors. The difference lies in the spectral resolution: multispectral sensors measure radiance in a few broad wavebands, whereas, hyperspectral sensors measure radiance in many narrow wavebands. The result is a nearly continuous reflectance (R) spectrum associated with each pixel (fig. 8). Hyperspectral data are typically visualized as an image cube, with dimensions of x, y (e.g., easting, northing), and R as depicted in figure 9. By combining high-resolution LIDAR sensors with hyperspectral imaging systems, scientists are able characterize both the structure and composition of the sensed environment. The USGS has a rich history of research in imaging spectroscopy. For a recent overview plus an introduction to the USGS Tetracorder spectroscopic analysis system, see Clark et al. (2003) and visit the website of the USGS Spectroscopy Lab: http://speclab.cr.usgs.gov.
Figure 8. Each pixel of a hyperspectral image contains reflectance (R) information in a
number of narrow wavebands – 224 in the case of the Airborne Visisble/Infrared Imaging Spectrometer (AVIRIS). Image courtesy of the Jet Propulsion Laboratory, California Institute
of Technology, Pasadena, CA.
18

The theoretical underpinning for the integration of lidar and hyperspectral data lies within the realm of geo-spatial data fusion: “the formal framework that expresses the means and tools for the alliance of data originating from different sources.” A discussion of geo-spatial data fusion is beyond the scope of this session, and the interested reader is referred to Wald (1999) and the Data Fusion Committee of the IEEE Geoscience and Remote Sensing Society (http://www.dfc-grss.org).
Figure 9. AVIRIS image cube of Moffett Field, California. The top of the cube is a false-color image designed to accentuate patterns observed in the water bodies. Evaporation ponds can be seen on the right; the Moffett airport can be seen on the left. Spectral information is contained in the z dimension of the cube, with wavelength increasing in the downward direction. The top of the cube contains information from the visible portion of the spectrum (400 nm), while the bottom of the cube contains information from the infrared portion of the spectrum (2500 nm). Each layer of the cube is color-coded according to response strength, with blues and blacks indicating low response and reds indicating high response. Of particular interest is the small high-response area seen on the front face of the cube, near the upper right corner. This response is from the evaporation ponds, in the red part of the spectrum (~700 nm), and is due to the presence of red brine shrimp in the pond. Image and interpretation courtesy of the Jet Propulsion Laboratory, California Institute of Technology, Pasadena, CA.
The most straightforward “integration” of active and passive optical data is simply the acquisition of a visual record of some form coincident with lidar data acquisition. Examples include video imagery used by the U.S. Army Corps of Engineers’ Scanning Hydrographic Operational Airborne Lidar Survey (SHOALS) system (Irish et al., 2000) and co-registered digital camera photography used by the NASA
19

EAARL system (fig. 4) (Brock et al., 2002). Because of the value of passive optical imagery in identifying features and interpreting anomalous returns, there is great benefit in scheduling lidar flights during daytime hours whenever possible. Several airborne lidar systems are now moving towards the simultaneous acquisition of lidar and hyperspectral data. Hyperspectral and lidar data may also be acquired independently, then subsequently merged for the purposes of three-dimensional visualization and interpretation (fig. 10). Features not detected in the lidar or passive image data alone are sometimes visible in fused data products (e.g., Borstad and Vosburg, 1993).
Figure 10. Hyperspectral data (selected bands) draped over digital elevation (bathymetry) model for Anniversary Reef, Biscayne National Park, Florida. Numerous small patch reefs are visible in both data sets. As lidar and hyperspectral capabilities mature and expand, there is a growing trend towards synergistic, integrated processing. The intent is to exploit the complementarity of the active and passive sensors not just in interpreting independently processed data sets, but in using each in the actual processing of the other. The range-resolved view provided by the lidar data is especially useful in providing structural or morphologic information about the environment, while the vertically integrated but spectrally detailed view provided by high-resolution hyperspectral data is especially useful in providing information about edges, identity, composition, and function of environmental elements.
20

Many examples of this complementarity come from the field of forestry where the integration of lidar and passive optical data is a current research focus. Lidar data can, for example, provide forest stand heights while multispectral video images provide complementary information about species composition (Gougeon et al., 2001). The video data are also used to delineate individual tree crowns in the lidar data, while the lidar data are also used to mask non-forested or poorly forested areas from the analysis. The combination of masks generated from multispectral rules plus lidar thresholding produces superior crown delineation results. In a similar application, Blackburn (2002) utilizes lidar data to improve multispectral retrievals of forest pigment concentrations. Again, the range-resolved view provided by the lidar data is especially useful in providing information about the structure of the forest environment, while the vertically integrated but spectrally detailed view provided by the spectral data is especially useful in providing a view of quantities related to forest function. In urban environments (Hepner et al., 1998; Gamba and Houshmand, 1999; Haala and Brenner, 1999), high-resolution elevation measurements from radar or lidar provide information about the two-and three-dimensional geometry of urban features, background topography, and built-structure footprints. Passive optical data provide information about land use and cover, and patterns of environmental degradation. Elevation data can also be used in processing the passive optical data – specifically, in the formulation of decision rules for unclassified pixels. Similarly, passive image data can be used in the processing and interpretation of the elevation data – specifically, to mask surfaces adjacent to structures, and to assist in the determination of the baseline topography and the segmentation of building footprints. Taking similar advantage of the edge-detection capabilities of high-resolution passive imagery, Wozencraft et al. (2002) have explored the integration of lidar and hyperspectral data in automated shoreline extraction. The lidar data provide water depth measurements, while the hyperspectral data are used to differentiate water from non-water. The lidar data are first used to locate a deepwater “seed” pixel within the image data. A similarity index is then applied to the hyperspectral data in order to define “water” and “non-water” based on spectral similarity to the lidar-identified seed (deepwater pixel). Finally, the mean index value within the lidar-identified shore zone (elevation between –0.5 and 0.5 m) is used as a threshold for auto-extraction of the shoreline. Integrated processing can be especially useful in submerged realms (Lillycrop and Estep, 1995; Wozencraft et al, 2002). Ranging lidar can provide information about water depth, vertically resolved water-column characteristics, and the reflectivity of the seafloor. Passive image data can provide information about the location of the land/water interface, water depth, integrated water-column characteristics, underwater object detection and identification, and benthic composition. Together, these two data types constitute a powerful combination.
21

One application is water-column correction of image data collected in submerged, optically shallow environments (fig. 11). A remote optical sensor measures the total upwelling radiance, LT, which must then be corrected for the effects of the incident irradiance and the atmosphere. In submerged environments, the water-leaving radiance, LW, is a function not only of the spectral signature of the bottom substrate (the quantity of interest in benthic classification efforts), but also of the overlying water column – both its thickness and its intrinsic optical properties. This water-column effect complicates the interpretation of passive image data collected over optically shallow environments. If lidar data are available to provide water-column thickness, then the retrieval of information about the benthos can proceed with the benefit of fewer assumptions and free parameters.
Figure 11. Passive remote sensing in optically shallow submerged environments. Some of the earliest published efforts in this direction were undertaken by the U.S. Army Corps of Engineers in Sarasota Bay, Florida. There, lidar and hyperspectral data were applied to the problem of sea bottom mapping (Estep et al., 1994; Wozencraft et al., 2002), with the lidar measurements of water depth providing a depth calibration for the bottom-type information contained in the imaging spectroscopy data. These data were used to map sand, seagrass, sand/seagrass mix, and channel (silt/mud) benthic classes. A similar procedure was applied to
22

beach replenishment planning in south Florida where the benthic classification maps were used to avoid dredging in hard-bottom (coral reef) areas and sand placement in seagrass areas (Wozencraft et al., 2002). Active and passive optical data can also be used together for spatial extrapolation of data limited in areal coverage. For example, passive satellite image data, useful for large-area coverage, are typically insensitive to tree height, while airborne lidar data containing tree height information are typically available only for small areas. If quantitative and consistent relations between the two data sets can be developed in areas of overlapping coverage, those relations can then be used to extrapolate spatially over the larger area of satellite image coverage (Lefsky et al., 1999; Hudak et al., 2002). Because airborne lidar remote sensing is a new technology, lidar elevation data are not available for historical analyses of temporal change. Another benefit of integrated or complementary processing is the possibility it offers for temporal extrapolation. For example, if overlapping data sets can be used to describe the relation between a modern lidar canopy height model and coincident black-and-white stereo data, then older stereo pairs can potentially be used for historical forest analysis of stand height (St.-Onge and Achaichia, 2001). The above examples combine complementary data sets (i.e., they are examples of data integration). Often, there is some offset between the acquisition times of the different data sets, which, for many applications, is of little consequence. For some applications, however, coincident collection would be preferable. As a result, several lidar operators are now moving towards flying multiple sensors on a single platform (e.g., Wozencraft et al., 2002). At least one research sensor (the NASA EAARL) is planning a move towards active+passive sensor integration, in which hyperspectral and lidar scanners “talk” to one another in real-time as the data are being acquired. The lidar elevation data, for example, will be passed to and utilized by the hyperspectral scanner in its acquisition of passive image data. Similarly, the hyperspectral record of upward radiance will be passed to the lidar sensor for utilization in the adjustment of its acquisition parameters. The result will be a grid of interleaved, co-registered hyperspectral pixel cubes and profiles of vertically resolved backscatter intensity. In summary, lidar scanners and imaging spectrometers are highly complementary sensors. The range-resolved view provided by the lidar data is especially useful in providing structural or morphologic information about the environment, while the vertically integrated but spectrally detailed view provided by high-resolution spectral data is especially useful in providing information about edges, identity, composition, and function of environmental elements. Combined, these two sensors can provide complementary, multidimensional datasets with high spectral and spatial resolution.
23
PLENARY 2 - LIDAR APPLICATIONS WITHIN USGS The introduction of a new remote sensing technology like lidar generates opportunities for new applications, improved processes, and new data types, while also providing the potential to address old research topics from a new perspective. Within the USGS, one of the earliest users of lidar ranging data was the Coastal and Marine Geology program (Sallenger et al., 1999). In Plenary 2, USGS researchers exposed workshop attendees to a sampling of current applications of lidar technology within the Survey science disciplines and programs. These include the generation of bare earth and improved digital elevation models (DEMs), as well as studies of hydrologic applications, natural hazards, earth surface processes, habitat mapping (terrestrial and aquatic), land cover, vegetation characteristics, urban development, and general feature extraction. At this time, lidar applications within the USGS are being conducted largely on an ad hoc basis. The list of existing applications illustrates the wide utility of lidar ranging data in addressing the needs of projects in all four USGS disciplines. Lidar data can be used by Geography to create and improve topographic and bathymetric maps, by Geology to monitor and model changes to the earth’s surface, by Water to evaluate watershed characteristics and model flood inundation zones, and by Biology to assess habitat characteristics. While lidar technology is still in its infancy, it clearly has the potential for much broader use throughout the USGS. Currently, USGS-funded lidar applications are concentrated within the Geology and Geography disciplines, with work in the Water discipline funded almost entirely by outside agencies and programs. Even within Geology and Geography projects, outside sources provide the bulk of funding for data acquisition and processing, and play an influential role in dictating steps to final product. Present cooperators and funding sources include the National Park Service (NPS), National Weather Service (NWS), local and state consortiums, NASA/NOAA/USGS collaboration, and Bureau of Reclamation (BOR). An increasing number of USGS programs can be expected to fund lidar data acquisitions in the near future as the value of high-resolution elevation data becomes more widely appreciated within the organization. For the most part, data acquisition itself has not been internal to the USGS. Except for the Coastal & Marine Geology Program, lidar data have been acquired primarily from commercial vendors, with a small portion contributed by universities. There are advantages to relying on external sources for the purchase and maintenance of costly aircraft and instrumentation that has been changing rapidly. However, difficulties arise with respect to data standards, quality control, proprietary information, and proprietary data processing. As the role of lidar vendors expands within the remote sensing community, it would be appropriate and in the best interest of the USGS to play a central and significant role in establishing standards for data quality, data sharing, and software codes and algorithms. There are also a number of potential, or untapped, applications for ranging lidar in
24

the USGS and other government agencies. The new lidar technologies offer opportunities to explore, understand, and evaluate issues in agriculture, disaster response, glacial movement, mining operations, atmospheric dust, monitoring and time series applications, and the development of enhanced data sets. Currently several small groups of lidar expertise exist within the Geography and Geology disciplines. The USGS needs to expand the distribution of these skill sets throughout the organization to include the Water and Biology disciplines. Biology would benefit substantially from the acquisition of lidar data sets for seasonal monitoring of sensitive ecosystems, canopy response to disturbance (natural or human induced), and biomass or species distribution. These applications would be greatly enhanced with multiple return lidar data, which offer a wealth of information about land cover structure and enable species discrimination. To date, the use of lidar ranging data has been supported by the USGS within very focused projects. However, the full capacity of the USGS in developing and utilizing lidar technology is currently constrained. Organizational constraints include a lack of knowledgeable and experienced personnel, a lack of formal standards, and a lack of prioritized funding for data acquisition and project development. Data acquisition and processing costs are being reduced as the technology matures, processing software is improved, and competition in the marketplace increases. In the near-term, the USGS role in mapping with lidar technology needs to be clarified. The USGS has traditionally played a leadership role in mapping activities, the development of standards, assessment of data quality, and dissemination of geospatial data. A ready opportunity exists to continue in this role in association with LIDAR technology, but timely action is required. Other organizational impediments relate to ad hoc procedures for archiving and distributing data, assessing data quality, sharing information and software code, and formulating metadata. In addition, USGS cost centers lack adequate infrastructure and processing capacity to handle the huge size of lidar data sets. In some cases, proprietary restrictions prevent data sharing. A major concern is the lack of baseline funding for establishing much needed guidelines, acquiring data, developing software, and enhancing research activities. It is hoped that the workshop and this report will begin a dialogue with administrators in support of a strong USGS role in developing lidar technology and applications. BREAKOUT SESSION 2 The four breakout groups were asked to address the following issues, and their responses have been consolidated below. A. Within your group make a list of current applications of lidar in the USGS
where work has actually been, or is being, done. Bare Earth and Improved DEM/Bathymetry
Integration of elevation data into the National Elevation Dataset
25

Bare earth products In the creation of seamless topo/bathy products
Hydrologic Modeling Creation of synthetic drainage networks Determination of watershed characteristics Derivation of stream channel characteristics High-resolution floodplain mapping Derivative hydrologic profiling Wave height surveys Flood inundation modeling Defining drainage basins Identification of small hydrologic features (ditches, tile drain studies) Identification of ponding areas
Natural Hazards Monitoring debris flows Monitoring volcano hazards Fire science Mapping and monitoring coastal hazards Disaster response
Earth Surface Processes Measuring earthquake deformation Sedimentation into rivers Monitoring long-term shoreline change Fault-rupture mapping Jokulhaup monitoring Delineation of volcanic structure Monitoring geomorphic processes Monitoring sea level rise
Vegetation and Habitat Mapping Delineation of canopy surface Identification of canopy gaps Characterization of canopy structure Mapping fish habitat Mapping wetland drainage
Land Cover (includes urban and feature extraction) Mapping confined urban channels vs natural stream Characterization of urban settings Delineation of building structures Urban mapping Mapping land cover and land use
B. Make a second list identifying other potential applications NOT currently
being investigated in the USGS (as far as we can tell). Hydrologic Modeling
Surface hydrology Turbidity measurements
26

Aquatic Environment Reflective surface applications Delineation of riverine bathymetry (turbid waters) Characterization of water column properties from multi-return LIDAR Monitoring sea level
Earth Surface Processes (includes geomorphology) Routine geologic mapping Mapping and monitoring glaciers and sea-ice Monitoring erosive landscapes Carbon estimates Mapping mine collapse Deformation due to groundwater change Mapping tephra deposits Mapping cliff erosion for sediment budgets
Vegetation and Habitat Mapping Inventory and monitoring of species habitat Mapping vegetation density Determination of biomass Mapping amphibian locations
Land Cover (includes urban and feature extraction) Monitoring urban growth Mapping urban ecology Mapping impervious surfaces Mapping archaeological features
Time Series/Monitoring Monitoring surface mining operations including mine tailings Measurement of dust plumes and vertical distribution of sediment in air Monitoring sand dune migration
Agriculture Discrimination of crop types
C. Identify the main technical and /or administrative roadblocks to using lidar
data in the USGS. Technical
Need a consistent process for dealing with data artifacts and differences in filtering between tiles of elevation data (slope calculations are affected). It isn’t evident which lidar system(s) provides the best delineation of shorelines. New and improved software tools are needed for working with multiple return LIDAR data, for accurately identifying buildings, impervious surfaces, crop types, and tree species, and to provide data fusion and scaling techniques. Technical guidelines for acquiring and working with lidar data do not exist. Need improved lidar systems that can discriminate wetlands and marshes, certain target materials, and deal with water sheen.
27

Administrative
There is a paucity of knowledge in the Survey about lidar technology and applications. Expertise is concentrated in Geography and Geology disciplines, but little elsewhere. The high cost of lidar data and lack of adequate project funding restricts many Survey scientists from utilizing lidar data in their investigations. Proprietary data licensing by commercial vendors severely checks our ability to share data. The use of proprietary software packages for lidar data processing and analysis impedes collaboration among scientists. A USGS “clearinghouse” is needed for the systematic management, archiving, and distribution of lidar data sets and metadata, algorithms and code, and technical information. Computing power needs to be increased for efficient processing and analysis of lidar datasets. Consistent procedures for conducting quality-control assessments of lidar data do not exist; the USGS should take the lead in establishing these procedures. Lidar elevation data are used within the USGS for both operational programs and scientific research, and this dichotomy has created conflict in regard to contracting procedures, data specifications, data sharing, and archiving. Similar friction exists between government agencies and the Management Association for Private Photogrammetric Surveyors (MAPPS) that strongly advocates lidar data acquisitions be contracted to the private sector. There is a general lack of management support ($ and fulltime equivalent positions) for the development of user guidelines and specifications for lidar data. Training is needed in the development of lidar specifications for data procurement and data processing techniques.
D. Each group identify an important issue related to lidar applications not
covered by the question above.
Experience, testing, and research is needed in regards to merging lidar and other (optical, acoutical) sensors to create enhanced data analysis tools.
A calendar of planned lidar missions is needed to enable coordination of data acquisitions and sharing of mobilization costs.
Flexible contracting mechanisms are needed to support science requirements for lidar data.
Evaluation of data sets from various lidar systems and vendors, as well as data processing and analysis techniques, would be facilitated by the designation of a USGS test site.
Identify geographic areas that need to be monitored with lidar on a regular basis.
Lidar high-resolution elevation data is needed globally.
28

Elevation data from the Shuttle Radar Topographic Mission (SRTM) need to be distributed at its finest resolution in order to meet the needs of science.
There is a need for pilot projects that connect USGS scientists through the application of lidar data to address specific research questions.
The USGS needs to be proactive in determining what its role should be in the lidar arena: a leader in data acquisition, processing, software tools development, management and archiving, accuracy assessment, applications, science, or none?
Consistent processes for the calibration of lidar surveys and the assessment of data accuracy do not currently exist.
PLENARY 3 - CALIBRATION AND ACCURACY ASSESSMENT Sensor calibration and accuracy assessment of the lidar results are very important to USGS scientists. Uncertainty was expressed by most of the workshop participants about how vendors calibrate their systems, and how they should go about assessing the accuracy of the delivered product. As knowledgeable end users, USGS scientists want to understand how vendors know their systems are working properly, and just how close to the “truth” the calibrated results are. Calibration and accuracy are interrelated because a properly calibrated system should provide more accurate results. The concepts of calibration and accuracy assessment are techniques to first correct, and then analyze the amount of error inherent in the lidar system and the resulting information provided. This section explains how and why there is error, how the vendors calibrate their systems to minimize errors, and how the resultant accuracy is assessed. Calibration The definition of calibration is to standardize (as a measuring instrument) by determining the deviation from “truth” in order to ascertain the proper correction factors. Calibration is performed for the purpose of identifying and correcting systematic errors. There are several important steps involved in calibrating a sensor. The vendor performs all calibration steps because in the end they are the party responsible for the accuracy of the data they provide. A lidar sensor is a system of interoperating instruments, all of which produce their own individual error. The total error budget for a lidar system includes the contributing error budgets of each subsystem - the laser rangefinder error, the GPS positional error, and the Inertial Navigation System (INS) orientation error. Laser Rangefinder Error Laser ranging accuracy is difficult to determine for lidar systems because of the number of potential error sources. An obvious potential source of error is the inherent pointing accuracy of the laser. Sensor-mounting biases such as small angular misalignments between the laser reference frame and the INS reference
29

frame introduce error. Noise can be generated due to the thermal sensitivity of the laser. In addition, the atmosphere acts to distort the path of the laser pulse as it is fired and reflected off an object, creating a timing error that needs to be compensated. This compensation becomes more important as aircraft altitude increases (as the amount of atmosphere increases between the aircraft and the ground). Incorporating an atmospheric model into the post-processing of the data may help to minimize atmospheric effects, although models can vary by vendor. The various scanning methods used to create the swath of data can introduce error. Systematic error will result from a mirror that is not functioning properly. Under normal operating conditions the range of error from a typical laser rangefinder system that is properly calibrated can be expected to be between two to three centimeters in normal aircraft operating conditions (100 to 2,000 meters above ground).
GPS Position Errors Airborne GPS systems are used to provide positional information about the laser platform. GPS units vary by vendor, and not all GPS units deal with timing issues and processing methods in the same way. There are several general GPS-related errors that need to be compensated for. Sources of error include satellite geometry position dilution of position (PDOP), orbital biases, multi-path, antenna phase center modeling, and atmospheric errors. Proper flight planning minimizes satellite geometry errors. The location of GPS base stations is also important for reducing error. For every GPS-related error source, there is a method to detect, eliminate or minimize that error. GPS error usually contributes five to ten centimeters of positional error. The error created by the GPS can be increased when combining the GPS with the laser rangefinder. The GPS antenna on the aircraft is generally placed outside on top of the fuselage, but as near as possible to the laser and usually directly over it. The relationship between the GPS antenna and the laser must be surveyed precisely, as any offsets will affect the accuracy of the final results. If the system is moved to a different aircraft, this spatial relationship will have to be measured again. INS Orientation Error An Inertial Navigation System (INS) records the orientation of the laser platform. There are a variety of manufacturers providing INS, with differing qualities among them. Costs of INS can range from a few thousand up to a million dollars. Most commercial lidar sensors contain INS that can record up to 0.005o pitch and roll, and 0.008 o heading. A 0.0005 o angular error corresponds to a 0.27 m (0.87 ft) error from 3048 m (10,000 ft) altitude, and a 0.52 m (1.70 ft) error from 6096 m (20,000 ft) altitude. Many of these errors can be minimized by proper system calibration prior to data collection.
30

An easy way to look for systematic INS errors is to fly over a test site, and then turn around 180 degrees and fly the same area back (fig. 12). Any misalignments will appear as offsets of features, such as the runways in the illustration below. Any systematic errors in roll or pitch can then be determined and subsequently modeled out. While not all of these errors can be corrected, many can be either eliminated or minimized through proper calibration. Major calibration is typically required whenever the system is installed into a different aircraft, or when it is operated under significantly different ambient conditions than before. Minor calibrations are normally performed every flight to determine if the system is still performing properly. Also, significant improvements in accuracy can be achieved by post-flight data calibration. There are two types of tests performed to calibrate a system. The first is to bench-test the bolted down equipment on the ground. The second test is to fly over an area where the vendor has established accurate ground reference data. Typically, this area is not completely flat and contains a variety of three-dimensional features (trees, buildings, etc.). What are needed are positions and elevations for a large number of features, surveyed with procedures more accurate and precise than the calibrated system. Minor calibrations done every flight could be as simple as flying
Figure 12. Note the offsets in the runways that became apparent with alternating flight lines in opposing directions. over the airport runway with known measurements in both directions before beginning the desired data collection. When the lidar ranging system is flown over the test area, it is usually done in two opposing directions and with additional perpendicular cross flights. The results are then not only compared with the ground information, but with the results of the other flight directions (fig.13).
31

Currently there are no formal guidelines for calibrating lidar sensors; however, the American Society for Photogrammetry and Remote Sensing (ASPRS) lidar subcommittee is working to create such guidelines. Discussions at the Workshop included the suggestion of establishing a formal unbiased test site for vendors to use in calibrating their systems. While well intended, this idea might not prove cost-effective for the USGS because of the expenses vendors would incur in flying their aircraft to the site. Vendors might translate the extra flight expense into an additive fee on data that is already very expensive.
Figure 13. Vendors typically use known geographic coordinates of features such as building corners and ground control points in the calibration of their lidar ranging systems. Accuracy Assessment While vendors are responsible for the calibration of their systems, it is usually up to the end-user to assess the accuracy of the vendors’ claims. Vendor accuracy specifications are usually derived from statistical sampling and are generally listed
32

as 1σ (68 percent of the data are within this limit), or 2σ (95 percent). Two types of accuracy need to be assessed: vertical and horizontal. A brief survey of published accuracy specifications reveals that lidar may achieve vertical accuracies of 15 cm and horizontal accuracies of 30-50 cm. Vertical Accuracy Vertical accuracy is one criterion for determining the quality of digital elevation data, and vertical accuracy requirements depend on the intended users’ applications. There are five principle applications where high vertical accuracy is normally required: 1) marine navigation and safety, 2) storm water and floodplain management in flat terrain, 3) management of wetlands and other ecologically sensitive flat areas, 4) infrastructure management of dense urban areas where planimetric maps are typically required at scales of one inch = 100 feet and larger, and 5) for special engineering applications where elevation data of the highest accuracy are required (NDEP Guidelines for Digital Elevation Data, http://www.ndep.gov/). While most users would prefer the highest accuracy achievable, they must realize that their application mayl not need 15 cm vertical accuracy, and as a result should not pay for claimed higher accuracy. National Digital Elevation Program (NDEP) recommendations state that formulations of accuracy and resolution requirements need to be cognizant of the potential harm that could be done to public health and safety in the event the digital elevation data fail to satisfy the specified vertical accuracy. End users need to consider what the results will be used for before determining the accuracy and resolution they require. It is important to specify the vertical accuracy for both the raw data and final products. As raw lidar data are X, Y, Z point data, and most digital elevation data are delivered in either raster grids, Triangulated Irregular Networks (TINs), or contours derived from TINs, the interpolation process may introduce some error, although it should be minimal. Deliverables may exhibit greater error (fig. 14) when smoothing or generalization procedures have been performed (such as smoothing contour lines to make them appear more natural). NDEP guidelines provide information about the vertical accuracy standard for specific contour intervals based upon the National Map Accuracy Standard (NMAS) and the National Standard for Spatial Data Accuracy (NSSDA). With NSSDA, the root mean squared error (RMSE) is defined in terms of feet or meters at ground scale. Because the NSSDA does not address the suitability of data for any particular product, map scale, contour interval, or other application, no error thresholds are established by that standard. Table 1 presents NDEP information about the NMAS and NSSDA vertical accuracy standards. Horizontal Accuracy Horizontal accuracy is often correlated to vertical accuracy. When a high vertical accuracy is required, the vendor needs to be certain that the Z value accurately
33

Figure 14. Users need to be aware that the cumulative effect of errors associated with the acquisition and production of digital elevation data create a difference between absolute true elevation and the modeled elevation they are provided (from NDEP, 2003). corresponds with the X, Y location. Horizontal error is more difficult to detect than vertical error because lidar systems employ a point sampling schema to characterize continuous topographic surfaces, and the two are not directly comparable. The NDEP does not require vendors to horizontally test their elevation products, however, it does require them to report the expected horizontal error thresholds established by NMAS for common map scales. Table 2 shows the NDEP guidelines for horizontal accuracy requirements primarily relevant to photogrammetric data, but these can also be of use for lidar data.
Table 1. Comparison of NMAS/NSSDA Vertical Accuracy (from NDEP, 2003).
NMAS Equivalent
Contour Interval
NMAS VMAS 90 percent confidence level Maximum Error
Tolerance
NSSDA RMSEz
NSSDA Accuracyz 95 percent
conformance level
1 ft 0.5 ft 0.30 ft or 9.25 cm 0.60 ft or 18.2 cm 2 ft 1 ft 0.61 ft or 18.5 cm 1.19 ft or 36.3 cm 4 ft 2 ft 1.22 ft or 37.0 cm 2.38 ft or 72.6 cm 5 ft 2.5 ft 1.52 ft or 46.3 cm 2.98 ft or 90.8 cm
10 ft 5 ft 3.04 ft or 92.7 cm 5.96 ft or 1.81 m 20 ft 10 ft 6.08 ft or 1.853 m 11.92 ft or 3.63 m 40 ft 20 ft 12.16 ft or 3.71 m 23.83 ft or 7.26 m 80 ft 40 ft 24.32 ft or 7.412 m 47.66 ft or 14.53 m
34

Table 2. Comparison of NMAS/NSSDA Horizontal Accuracy (from NDEP,2003).
NMAS Map Scale
NMAS CMAS 90 percent confidence level Maximum Error
Tolerance
NSSDA RMSEz
NSSDA Accuracyz 95 percent
conformance level
1” = 100’ or 1:1,200 3.33 ft 2.20 ft or 67.0 cm 3.80 ft or 1.159 m 1” = 200’ or 1:2,400 6.67 ft 4.39 ft or 1.339 m 7.60 ft or 2.318 m 1” = 400’ or 1:4,800 13.33 ft 8.79 ft or 2.678 m 15.21 ft or 4.635 m 1” = 500’ or 1:6,000 16.67 ft 10.98 ft or 2.248 m 19.01 ft or 5.794 m 1” = 1000’ or 1:12,000 33.33 ft 21.79 ft or 6.695 m 38.02 ft or 11.588 m 1” = 2000’ or 1:24,000*
40.00 ft 26.36 ft or 8.035 m 45.62 ft or 13.906 m
* The 1:24,000 and 1:25,000-scales of USGS 7.5 minute quads are smaller than 1:20,000; therefore, the NMAS horizontal accuracy test for well-defined test points is based on 1/50 inch, rather than 1/30 inch for maps with scales larger than 1:20,000 (NDEP Guidelines).
Accuracy Assessment Reporting NSSDA states that accuracy should be reported at the 95 percent confidence level and that an independent source of greater horizontal and vertical accuracy should be used as the basis for testing. NDEP guidelines state that the independent source of higher-accuracy data should be at least three times more accurate than the tested dataset whenever possible. It is important to note that the NSSDA test for accuracy is only valid when the errors follow a Gaussian (normal) distribution. Accuracy requirements should be customized for different types of terrain, relative relief, vegetative cover, and applications. Check-points should be well distributed throughout the dataset; however, higher concentrations of points could be located in areas of interest. NSSDA states that a minimum of 20 checkpoints shall be tested and distributed to represent the area of interest and the distribution of error. When 20 points are tested, the 95 percent confidence level allows one point to fail the threshold given product specifications. However, NDEP recommends utilizing a minimum of 20 checkpoints in each of the major land cover categories representative of the area for which the modeling is to be performed. This approach helps identify systematic errors in the dataset. The quality control checkpoints should be selected on flat terrain, or on uniformly sloping terrain in all directions from the checkpoint for as many meters as is representative of the resolution of the dataset. Whenever possible, the slope should not be steeper than a 20 percent grade. Checkpoints should never be selected near areas of severe breaks in slope, such as bridge abutments or edges of roads, where interpolation may increase error.
35

BREAKOUT SESSION 3 The breakout groups were asked to respond to the topics presented below. Their combined answers are listed under each topic. A. What accuracy and resolution do you need from a lidar survey and why?
Ideally, lidar accuracy and resolution specifications are driven by project objectives. An important question is, does a project need relative or absolute accuracy? The needs of research projects may be very different from those required for the creation of standard mapping products. Accuracy and resolution needs may also vary among the four USGS disciplines, i.e., resolution needed for habitat characterization may differ from that needed for floodplain delineation, and accuracy needed for a mature evergreen forest may be very different from the accuracy needed for a prairie grassland. Resolution required in flat landscapes can be vastly different than what is necessary to characterize hilly terrain. Change detection requires repeatable accuracy and high precision from one point in time to the next. Vendors are having difficulty providing accurate classifications, particularly bare-earth, with consistent results over large areas with multiple land cover and land-use types. It is desirable to have specifications that can handle requirements changing during the project or after the data have been collected.
Available funding and the cost of the lidar data play a significant role in the determination of accuracy and resolution requirements. Usually, higher accuracy and resolution requirements entail higher costs. It’s not uncommon for accuracy and resolution requirements to be adjusted downward in order to stay within the project budget.
Not all lidar systems have the same accuracy and resolution capabilities, which makes it is extremely important to verify a vendor’s ability to meet contract specifications.
With development of The National Map (http://nationalmap.usgs.gov), the Geography Discipline is interested in acquiring elevation data that can be incorporated within a consistent framework, that meet specified accuracy requirements, and that can provide products based on standards. For the elevation component of The National Map to succeed, it is imperative the specifications used for the operational acquisition of these data address the broader science requirements of the other disciplines.
B. How would you recommend we describe the accuracy and resolution of
lidar surveys? Standards need to be developed for lidar data, and these should consider the diversity of terrain characterizing the United States. The USGS is viewed by
36

industry as the most likely organization to provide standards for the lidar community to follow. Standards are requested by a variety of clients for inclusion in contracts. The NDEP specifications and standards group is developing a draft guidelines and specification sheet that is in review. The National Standard for Spatial Data Analysis (NSSDA) has written specifications for digital data versus maps and this has proven useful for Puget Sound projects. The USGS should also look at the guidelines that FEMA has developed.
An error statement could be developed for each land cover type. Root mean squared error (RMSE) as a measure in the standards or guidelines may be inadequate as an expression of accuracy. Perhaps resolution should be defined by a minimum bare earth spot size? Other variables that may be considered include spot size variation, lidar beam-width (which is instrument-dependent), and posting density versus beam spot size.
The USGS needs to develop standards for evaluating the results of lidar surveys. Many commercial vendors provide data sets through black-box processes that threaten confidence in the results. In other cases it may be possible to check the internal consistency of a data set against the "reality" of good ground control points (grid or specific locations) acquired independent of the vendor using Global Positioning Systems. It is important for the scientist working with the lidar data to get out on the ground and perform field verification. It is important to check the “raw” point data as well as the “final” grid product (DEM).
C. Would a formal calibration site improve the usefulness of lidar surveys?
The general response was “NO”, because it would be impractical and costly for vendors from aropund the U.S. to travel to a designated calibration site before the start of each project. Lidar systems require calibration before each mission is flown, and most vendors prefer to use local sites to calibrate their systems.
D. Other calibration and accuracy issues?
Metadata guidelines need to be developed for lidar data, and they should apply to mass points as well as gridded elevation data and derivative products such as building footprints and canopy structure. Vendors should provide comprehensive accuracy reports (not bare ground only) with their data deliveries. Government agencies are looking to the USGS to assess, evaluate, and provide guidelines/characterizations. When the USGS publishes accuracy results, people take notice! ASPRS is taking a lead in developing guidelines. Also, will a formal mechanism be developed to enable the USGS to check/verify data offered-up by state and local cooperators? Should this activity be funded, and if so, how? Some attendees felt it would be very beneficial if those USGS scientists who
37
have evaluated lidar data accuracy and resolution were to publish their experiences.
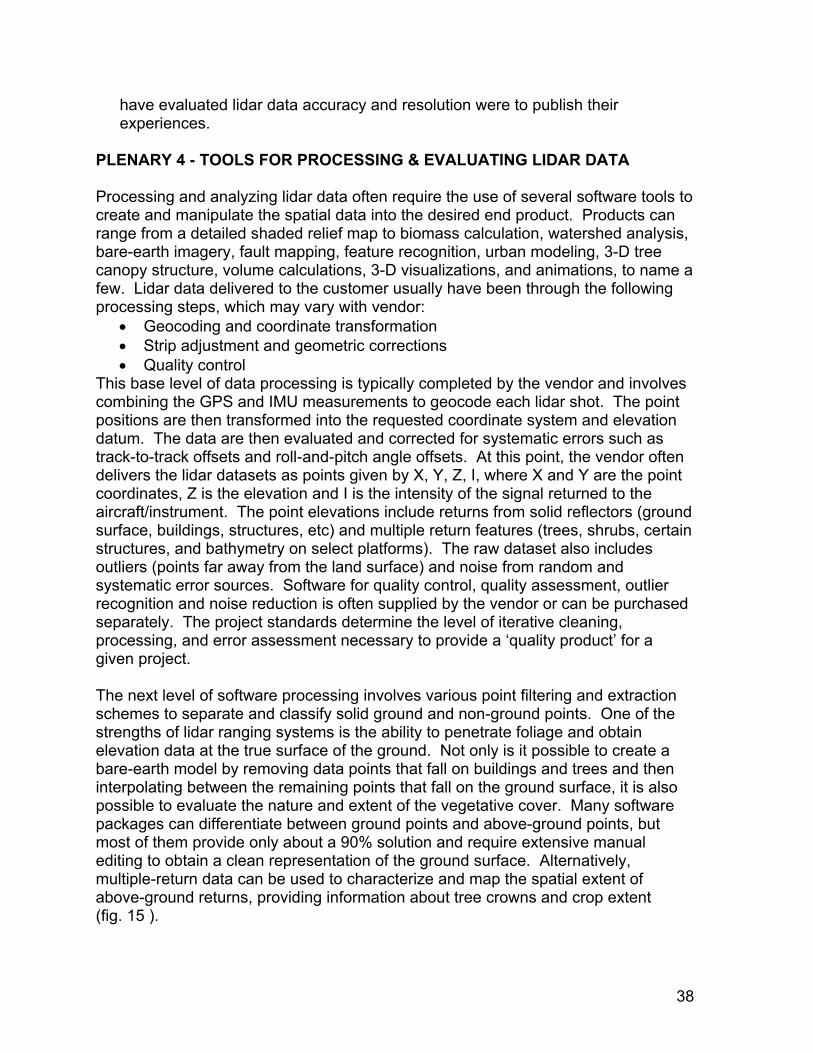
PLENARY 4 - TOOLS FOR PROCESSING & EVALUATING LIDAR DATA Processing and analyzing lidar data often require the use of several software tools to create and manipulate the spatial data into the desired end product. Products can range from a detailed shaded relief map to biomass calculation, watershed analysis, bare-earth imagery, fault mapping, feature recognition, urban modeling, 3-D tree canopy structure, volume calculations, 3-D visualizations, and animations, to name a few. Lidar data delivered to the customer usually have been through the following processing steps, which may vary with vendor:
• Geocoding and coordinate transformation • Strip adjustment and geometric corrections • Quality control
This base level of data processing is typically completed by the vendor and involves combining the GPS and IMU measurements to geocode each lidar shot. The point positions are then transformed into the requested coordinate system and elevation datum. The data are then evaluated and corrected for systematic errors such as track-to-track offsets and roll-and-pitch angle offsets. At this point, the vendor often delivers the lidar datasets as points given by X, Y, Z, I, where X and Y are the point coordinates, Z is the elevation and I is the intensity of the signal returned to the aircraft/instrument. The point elevations include returns from solid reflectors (ground surface, buildings, structures, etc) and multiple return features (trees, shrubs, certain structures, and bathymetry on select platforms). The raw dataset also includes outliers (points far away from the land surface) and noise from random and systematic error sources. Software for quality control, quality assessment, outlier recognition and noise reduction is often supplied by the vendor or can be purchased separately. The project standards determine the level of iterative cleaning, processing, and error assessment necessary to provide a ‘quality product’ for a given project.
The next level of software processing involves various point filtering and extraction schemes to separate and classify solid ground and non-ground points. One of the strengths of lidar ranging systems is the ability to penetrate foliage and obtain elevation data at the true surface of the ground. Not only is it possible to create a bare-earth model by removing data points that fall on buildings and trees and then interpolating between the remaining points that fall on the ground surface, it is also possible to evaluate the nature and extent of the vegetative cover. Many software packages can differentiate between ground points and above-ground points, but most of them provide only about a 90% solution and require extensive manual editing to obtain a clean representation of the ground surface. Alternatively, multiple-return data can be used to characterize and map the spatial extent of above-ground returns, providing information about tree crowns and crop extent (fig. 15 ).
38

Another level of software tools focuses on various ways to extract features from the lidar data or to provide specialized terrain analysis capabilities. Extraction tools include vegetation classification, building footprint recognition, stream drainage and watershed boundaries delineation, utility and infrastructure mapping, and building inventory cataloging. The functionality offered by the terrain analysis applications is too lengthy to discuss in depth here but includes: elevation contours, flood inundation mapping/models, debris flow susceptibility mapping, hydrology flow models, volcano hazard mapping, atmospheric modeling, paloeseismology investigations, and fire management.
Figure 15. Multiple returns from a ponderosa pine. The largest suite of available software is for visualization; these tools are used in producing the final and often the most visible product from a given project. Visualization software codes vary from freeware draping routines to proprietary 3-D animations and landscape models. Table 3 below is a list of software packages that were discussed at the workshop. This table is not intended to provide a comprehensive list of available software; rather, it represents software products that are currently utilized by USGS scientists or their colleagues. BREAKOUT SESSION 4 Workshop participants were asked to address the following issues: A. Within your group, make a list of software tools used within the USGS to
process, manipulate, and analyze lidar data. Keep in mind that working with the raw waveform/multiple returns is quite different than working with a rasterized lidar elevation data set.
39
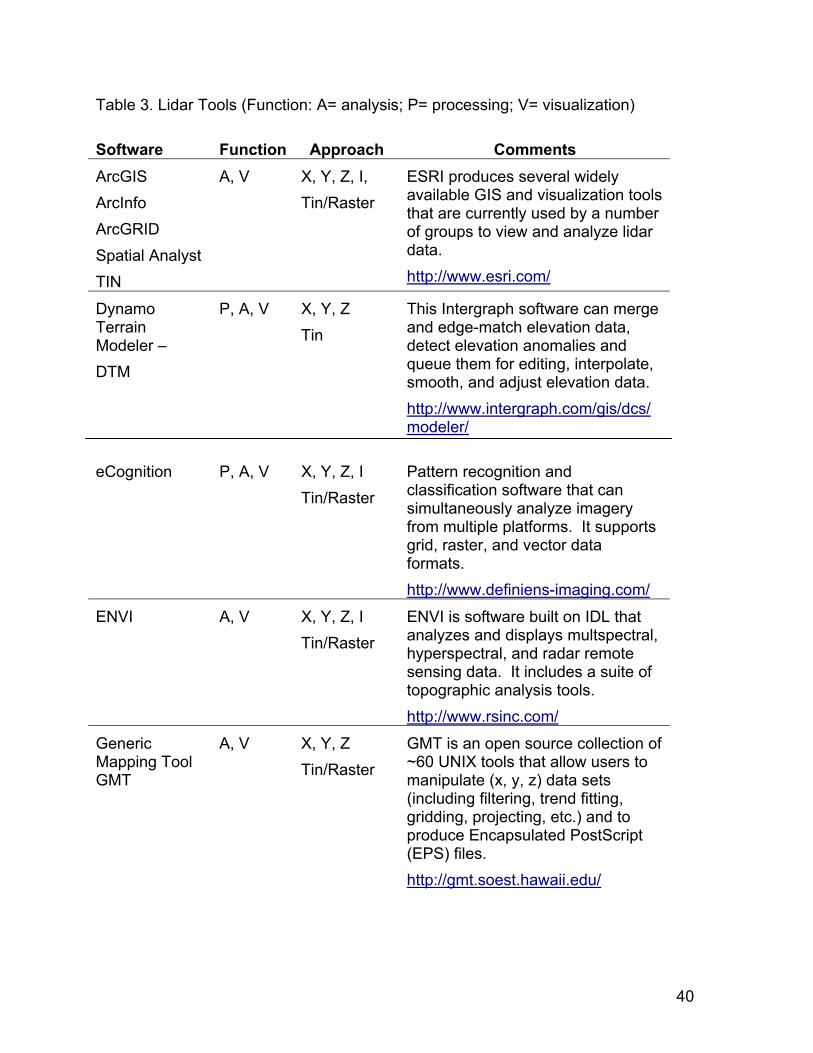
Table 3. Lidar Tools (Function: A= analysis; P= processing; V= visualization) Software Function Approach Comments ArcGIS ArcInfo ArcGRID Spatial Analyst TIN
A, V X, Y, Z, I, Tin/Raster
ESRI produces several widely available GIS and visualization tools that are currently used by a number of groups to view and analyze lidar data. http://www.esri.com/
Dynamo Terrain Modeler – DTM
P, A, V X, Y, Z Tin
This Intergraph software can merge and edge-match elevation data, detect elevation anomalies and queue them for editing, interpolate, smooth, and adjust elevation data. http://www.intergraph.com/gis/dcs/modeler/
eCognition P, A, V X, Y, Z, I
Tin/Raster Pattern recognition and classification software that can simultaneously analyze imagery from multiple platforms. It supports grid, raster, and vector data formats. http://www.definiens-imaging.com/
ENVI A, V X, Y, Z, I Tin/Raster
ENVI is software built on IDL that analyzes and displays multspectral, hyperspectral, and radar remote sensing data. It includes a suite of topographic analysis tools. http://www.rsinc.com/
Generic Mapping Tool GMT
A, V X, Y, Z Tin/Raster
GMT is an open source collection of ~60 UNIX tools that allow users to manipulate (x, y, z) data sets (including filtering, trend fitting, gridding, projecting, etc.) and to produce Encapsulated PostScript (EPS) files. http://gmt.soest.hawaii.edu/
40

IDL P, A, V X, Y, Z Tin/Raster
IDL is a programmable multi-platform data analysis, visualization, and modeling package that can perform a number of tasks including contouring, mesh generation, and 3D visualization http://www.rsinc.com/
IMAGINE P, A, V Tin/RASTER A remote sensing and visualization package that can be tailored to meet a variety of needs including multi-resolution TIN and IFSAR DEM analysis. http://gis.leica-geosystems.com/
LDART
A, V X, Y, Z Tin/Raster
LDART is a NOAA Web-based application that retrieves and manipulates archived LIDAR Data and can generate a number of DEM products in various datums and projections. http://www.csc.noaa.gov/crs/tcm/
MicroDEM A, V X, Y, Z Tin/Raster
This PC freeware program displays and merges DEMs, satellite imagery, scanned maps, vector maps data and GIS databases. http://www.usna.edu/Users/oceano/pguth/website/microdem.htm
USGS Mini Image Processing System (MIPS)
A, V XYZ Tin/Raster
MIPS is a fully functional digital image processing software package that includes routines for surface and topographic analysis. http://terraweb.wr.usgs.gov/TRS/software/mips/
PCI-Geomatica P, A, V X, Y, Z A modular software package that supports DEM building, mosaicking, and editing. http://www.pcigeomatics.com/
41

Rapid Terrain Visualization RTV
P, A, V X,Y,Z,I This software is designed to visualize high-resolution digital elevation datasets. https://peoiewswebinfo.monmouth.army.mil/jpsd/rtv.htm
REALM P, A, V X, Y, Z, I Proprietary lidar software from Optech; includes GPS point verification and vegetation removal. http://www.optech.on.ca/altmrealm.htm
SOCET-SET P, A, V X, Y,Z, I, Tin/Raster
Digital photogrammetry software package with tools for DEM mosaics, point editing, and breakline detection. http://www.gis.leica-geosystems.com/
Surfer P, A, V X,Y,Z Tin/Raster
A contouring and 3D surface mapping program that converts X,Y,Z data into contour, surface, wireframe, vector, image, shaded relief, and post maps. http://www.goldensoftware.com/
TerraPoint P, A, V X,Y,Z Tin/Raster
This software handles point cloud, TIN, and DOQ data and imagery. Supports shaded relief, bare earth, building extraction and 3-D city modeling. http://www.terrapoint.com/
ALP8 P, A, V Waveform USGS/NASA, under development. B. Identify processing capabilities outside the USGS and which ones would
be worth having available to USGS scientists. DTM eCognition (pattern recognition) Feature Analyst (ArcInfo extension)
42

Florida International University code GRASS (Linux based, open source) LDAP (NOAA – ArcView extension) PCI Geomatica REALM Remote View RTV advanced modules (SAIC) TerraSolid/Microstation Z/I Imaging
C. Identify a processing/calibration/analysis capability that is lacking in the
lidar community and would represent a major advancement if it were developed. Tools for interactive data exploration, automated data filtering and reduction, automated QA/QC, data fusion, waveform terrain classification, multi-return and multi-intensity processing, hyper-interactive processing, Lidar specific compression, and interoperability between raster and vector domains. Tools for spatial pattern-recognition that work with points as opposed to grids. Conflation software for working with attributes.
An algorithm that determines dune crests/slope breaks. Accessible TIN tools. A lidar instrument to see through the surf zone and detect sandbars. Corner cube reflectors for calibration and registration. A USGS clearinghouse for lidar processing techniques/tools.
D. Should the USGS have a standard processing package available? A strong consensus was voiced that USGS scientists should not be required to use a standard processing package. Some USGS scientists need to be involved
43

in building software tools, and such development may not be possible in a proprietary environment. For others, a ‘turnkey’ processing capability is desired so that USGS scientists needn’t become experts in all aspects of lidar data processing.
E. Each group identify an important issue related to lidar software processing packages/tool kits not covered by the questions above. A comparison of available software packages would be valuable.
Tool development needs to be platform-independent.
Creation of a USGS Lidar Users Group would be beneficial. Subject experts are needed in each USGS region and discipline.
Future workshops should include training opportunities. A coordinated effort is needed to develop USGS lidar capabilities.
PLENARY 5 - LIDAR DATA MANAGEMENT Among the many topics presented at the Workshop, lidar data management was a common thread. Discussion generated a long list of strategies for managing and distributing the enormous volume of lidar data being collected by the USGS each year. Lidar systems generate huge volumes of raw data, including mass data points, that are then processed into customer-specified products including gridded elevation data sets that can still be rather large. Because of the increasing quantity of lidar data being acquired by the USGS, data management issues are beginning to receive more attention. Many of the Workshop participants noted that less than stellar means exist for the distribution of data they collect, and expressed the need for a standard format in which to preserve that data. Presently, “desktop archives” serve as the most common form of data storage, and many participants expressed a need for a common archival site as a means of data management. Many participants distribute their own data or work with cooperators to assure their data are made available to the public. Some of the other current strategies for distributing lidar data are anonymous ftp sites, university servers, and cooperator data servers. One group hired a librarian with strong GIS skills to manage their data sets; another used a technician to organize the data, while many struggle to do it themselves. Concern was also expressed about what data format should be used for archived data. It was generally agreed that standards for lidar data formats and metadata need to be established so that anyone wishing to access the data has a known set of parameters upon which to base their work. While each scientist should be
44

responsible for archiving their data on site, the idea was presented that the USGS EROS Data Center is available as a repository for lidar data sets. EROS is the official archive for the nation’s land remote sensing data and has personnel trained and dedicated to archiving, maintaining, and distributing a wide variety of remotely sensed data. EDC, working with the USGS lidar community, would establish a standard for data submissions. Such data would have a metadata file attached describing the multiple parameters under which the data were collected. Establishment of a central data archive would help to eliminate possible redundancy in surveys, as well as create standards that would hold up to future scrutiny and preserve the validity of the data. In addition, scientists would not need to worry about archival media and distribution issues, as these would be taken care of by EDC. A number of constraints impede effective data sharing by USGS scientists. One of the more significant obstacles is the overall volume of the data collected. The shear volume of data is often prohibitive to distribution in its raw form. When combined with non-standard datums and formats, scientists are required to spend extra time reformatting the data for distribution. Additional processing is often necessary to get the data into a format the end-user can access. Other obstacles include inadequate processing power, bandwidth for transmitting data, and differences in hardware and software. Solutions to these problems focused on establishing standards around which all users could base their archives. The National Digital Elevation Project (NDEP http://www.ndep.gov/) is establishing a list of lidar data currently available. In addition, the EROS Data Center currently distributes the National Elevation Dataset (NED), and it would be within the scope of its mission to accept suitably prepared lidar data into its archive. A standard data format would need to be established for any data submitted, plus it would require associated metadata. EDC would then serve as a distribution site for anyone interested in receiving the data. Those data sets having proprietary restrictions for release would have clearly defined protocols established so that anyone inquiring about the data would know when and if it will become available and whom to contact for more information. Many of the items listed by participants for inclusion in lidar metadata are common across computer platforms and applications. Others were more project-specific, but still could be considered useful in terms of archiving. Following is a list of the metadata items participants felt would be useful to have attached to lidar data:
Vendor and instrument
Scan angle Type of aircraft used
Project name, why it was collected
Projection and datum of archived data
Description of processing procedures
Location (Lat/Long boundaries)
Projection and datum at time of collection
Filtering (what was removed and why)
45

Date collected
File sizes Sensor characteristics.
Timestamp (GMT)
Satellite geometry System specifications
Weather conditions
Off-nadir angle Atmospheric conditions
Tide levels (when near the coast) Point return number (if available)
Geoid model (if transformations were performed)
Data format and organization of data in the archive (i.e. what column is what)
A discussion about what lidar data should be archived revealed that not all Workshop attendees share the same view on this matter. Some participants feel that just the processed and gridded x, y, z data are needed, while at the other end of the spectrum others believe all the data (the mass points, break lines, gridded elevations, and aircraft attitude) should go into an archive. In the end, the consensus was that all the data should go into an archive. These data would have been post-processed using GPS ephemeris, contain ground reference corrections (if applicable), been quality checked (QA/QC’ed), and would include information on corrections done and the accuracy of the data. Other issues of importance to participants concerned international data, data management funding and storage, and an overarching group to acquire data to supply to the scientists. There aren’t a large number of international lidar projects currently involving the USGS. Projects are underway in Puerto Rico and Saudi Arabia, and participants felt there is a large potential for other international studies in the future. Provisions for organizing and storing these data sets need to be factored into the overall archiving scheme. Also discussed was the need to secure funding for archiving of data and the media on which such archiving would take place. Data management tasks such as those discussed would require time and manpower to complete. Allocation of funding to complete this task is extremely important. Consideration also needs to be given to the media on which the data are stored. Currently DVD/CD-ROM technology seems to be the most cost-effective; however, rapidly evolving technology could quickly provide new, more efficient and permanent media within a few years. Participants felt that funding a position dedicated to maintaining the archive and keeping it up-to-date was very important in the long-term outlook for lidar data archiving. Scientists are concerned that data could be lost because of an eventual inability to read the media on which it was originally stored. Lastly, participants discussed the idea of having a centralized group dedicated to acquiring data for USGS scientists. This idea was not well received, and many scientists expressed concern that they would not be able to complete their tasks due
46

largely to loss of control of the requirements for each lidar mission. Most scientists are currently directly involved in the cost negotiations, pre-planning of missions, data processing and requirements of each contract. Many expressed concern that a central acquisition group would add a layer of bureaucracy and cost that would hinder operations rather than facilitate them. Alternately, it was felt that a group that reviewed providers and created a list of vendors for scientists desiring to acquire lidar data would be useful. Each scientist would then have the freedom to contract for bids on specific jobs and have the close interaction they now enjoy. The centralized group would not be directly involved in the contract process unless requested by the scientist. BREAKOUT SESSION 5 The four discussion groups were asked to address four issues pertaining to data management, and their collective responses are presented below. A. In lidar projects with which you have been involved, how was data
management (QA/QC, archive, distribution) done? What worked, and what didn’t? What could have been done better? Lidar data management is being done very inconsistently across the Survey. In a number of cases data are being stored locally in scientists' offices, and requests for data-sharing go directly to the principal investigator who distributes it on DVD/CD-ROM media or from an ftp site. In the case of the Puget Sound Lidar Consortium, a librarian with GIS skills was hired to manage their data and distribute it from a Web site at http://pugetsoundlidar.org (since shut down by the Navy as a security risk). A growing archive of gridded elevation data sets are maintained by the EROS Data Center and these are available from http://seamless.usgs.gov. The USGS Flagstaff office reformats their lidar data to USGS quarter quads that are saved as Arc interchange files on an ftp site. Lastly, the St. Petersburg office of the USGS uses LaserMap to archive tiers of data based on their level of processing.
It is imperative that QA/QC activities be performed independent of the vendor. QA/QC operations that USGS scientists can perform include checking the internal consistency of flight lines, generating products from such as shaded relief and slope maps to check for data anomalies, and edge matching data sets. In some cases it may be possible to compare lidar data to coincident ground surveys.
B. Are there constraints on effective sharing of lidar data collections across
the USGS? If so, what are the constraints and how might they be removed? Yes, a number of constraints limit sharing lidar data within the USGS. Lack of knowledge concerning lidar data availability is perhaps the biggest obstacle.
47

This problem could easily be solved with establishment of a clearinghouse that provides a Web index listing who flew what, when, and where. Some of this is provided by NDEP at http://www.ndep.gov/. A clearinghouse would help to reduce time spent by scientists addressing requests for data.
The extremely large data volumes produced by lidar systems require users to have computer systems equipped with fast processors, maximized memory, and very large disk storage capacity. Limited bandwidth for transferring data over the internet is a problem that can be solved by increasing bandwidth and improving file compression techniques. Other problems include the inability to handle certain data formats and the lack of appropriate metadata. This latter issue could be resolved by a strong management directive requiring people to develop metadata. One of the more serious issues concerns the restrictive licensing practices by private lidar contractors. The USGS should strive for unrestricted licensing in all its lidar contracts. Some research activities have also encountered restricted use, e.g., some NASA projects where privileged access is granted to only principal investigators and collaborators.
C. What metadata elements and dataset characteristics (format, media, file sizes, etc.) have you found to be useful in your lidar projects? What didn’t you have that would have been useful? The basic metadata required is who, what, where, when, why, and how. Ancillary information concerning weather and atmospheric conditions, tide levels, GPS satellite/aircraft geometry, timestamp, scan angle, return number, beam diameter, detector sensitivity, system specifications, projections, datums, geoids, and information about any applied data processing is essential.
D. Identify any major lidar data management issues not covered in the plenary session or in the questions above. Lidar data sets are more than refined elevation grids. They include the raw mass points collected by the lidar instrument, as well as the GPS and INS data sets required for the accurate characterization of each data point. To ensure the longevity of these data, a central archive needs to be established. This could be accomplished through the USGS EROS Data Center, which serves as the Nation’s archive for all land remote sensing data. EDC has a long history of managing a broad spectrum of remote sensing and other geospatial data sets, plus they have technical specialists familiar with various data formats and transfer media. EDC also has very large network bandwidths for distributing data sets to the user community. Such an arrangement would also facilitate the distribution of research lidar data to the NDEP.
48

PLENARY 6 - COMMERCIAL AND CONTRACTING ISSUES As lidar technology continues to evolve through government, university, and vendor research and development, active end-user participation in the procurement process and the preparation of appropriate contracting specifications is essential. Contracting for services is never a simple process, and with frequent improvements in lidar systems performance it requires special diligence. With a few exceptions, the USGS has not been directly involved with lidar sensor research, and this lack of intimate knowledge can add to the difficulty of contracting for high-resolution elevation data. In view of the natural variability in the geographic terrain of this nation, it may be prudent for the USGS to establish lidar procurement specifications and standards based on regional considerations. The collective lidar data procurement experience of the workshop participants has been positive when direct dialogue between the end-user and vendor is an integral part of the contracting process. Such interaction enables the vendor to better understand the user's application, and assists the end-user in understanding the capabilities, limitations, and data deliverable options associated with the vendor. Challenges for USGS end-users come with understanding the developing technology and the legalities associated with the contracting process, both of which can be intimidating. However, end-user involvement in the development of procurement specifications provides an opportunity to learn about the technical capabilities of vendors, and ensures that the final data set will meet applied research needs. Experience has also shown that cultivating a good working relationship with the contracting officer is equally important and can assist end-users in navigating legal issues. Contract communications can become confused or unnecessarily complicated when too many people become involved in the process. Lidar is a rapidly evolving technology, and the resultant high-resolution elevation data and other products are utilized in a broad spectrum of research and applications projects. Therefore, it may not be in the USGS's best interest to get locked into long-term contracts that contain specifications based upon "old" technology. On the other hand, some attendees believe it would be helpful if a minimal set of lidar data requirements can be identified for USGS contracts including the geoid, vertical and horizontal datums, Federal Geographic Data Committee (FGDC) metadata templates, quality assurance procedures, and a final report of data integrity. When the vendor is ready to begin acquisition of the lidar data, direct communication on a daily basis is very important to ensure both parties concur on weather conditions and the timeline for deliverables. This direct communication also helps to establish a close working relationship between the vendor and end-user, which usually translates into a vendor being more willing to reprocess lidar data until it meets the users’ needs.
49

An area where USGS scientists have experienced some difficulty with vendors is in holding them to product deliverable deadlines. There have been a few cases where vendors have underestimated the intensive computer processing and quality control required for lidar data, and this miscalculation has negatively impacted the vendor’s schedule, forcing delays in the final product delivery. Lidar sensor development to date has been largely vendor-driven research without direct involvement of the science community. Therefore, lidar processing algorithms have become proprietary, perpetuating the “black box” syndrome when attempting to examine anomalies of the data. A number of attendees felt the science community should ask for open and ready access to data by leading an effort for legislative restraints on free trade to counter the commercial sector. General concern was expressed that the USGS merely responds to lobbying groups like MAPPS without formal policy development or review. Other federal agencies, such as NASA, have decided that lidar data are not cadastral survey data, thus their purchase is not subject to the Brooks Act. Therefore, an independent review of the Brooks Act by the DOI Solicitor General was suggested in order to determine the legal limits of MAPPS and other special-interest groups. A presentation was given by Dick Kleckner describing the Qualifications Based Selection (QBS) Cartographic Services Contract (CSC) contract established by the Geography Discipline that is available for use in procuring geospatial data products including lidar by USGS scientists. The QBS contract assists USGS end users by identifying vendors that meet a rigorous list of demonstrated capabilities for lidar deliverables. However, people familiar with the contracting service expressed concern and frustration with their experiences. Issues were raised about competitive pricing and data specifications in regard to the QBS process. Another option for procuring lidar data in support of research projects is through the use of a Cooperative Research Agreement with a qualified university. At the time of the workshop several universities possessed lidar systems and have either engaged in collaborative research with the USGS or expressed a desire to do so. Some advantages offered by these arrangements include timeliness of data acquisition, lower cost, a more collegial working relationship, and products that are in the public domain. BREAKOUT SESSION 6 A. In what ways can, and should, the end user be involved in the contracting
process for lidar collection by commercial firms? What are the constraints, if any, to such involvement? The end user definitely needs to be involved in the contracting process from the beginning in order to ensure a satisfactory end product. Experience shows that continuous interaction with the contractor leads to better specifications. Close
50

end-user involvement is essential for planning and establishing standards and priorities. Lack of experience by some vendors and the lack of industry standards necessitate involvement by the end user to ensure a successful project. Vendors often need feedback from the end user during the data acquisition process.
The intricacies of the technology and the contracting process can be intimidating. Lack of experience on the part of government staff can result in improper contract specifications. The complete specifications need to be established and understood by the customer and the contractor from the beginning. Too many middlemen within the USGS contracting process can work against the end-user scientist.
Lidar data are needed by the USGS for more than merely supporting topographic mapping, and the Cartographic Services Contract may be inappropriate for many of these other needs.
B. Should there be a USGS-wide set of minimum requirements for lidar
dataset characteristics (or contract deliverables)? If so, what should be included? No. Topographic mapping requirements may not be appropriate for other purposes and this would be too limiting; flexibility is needed for specific projects. Perhaps a minimum requirement should be established for metadata, and the USGS should not accept lidar data that is not fully documented.
Lidar data specifications need to be region and discipline specific to account for unique requirements. Licensing needs to be established that gives the USGS ownership of the data, including the unprojected raw x, y, z data, intensity data, and final products. There should be a general set of guidelines to aid lidar data users.
C. In your experience, what has worked well, and what hasn’t worked well, in
the procurement of lidar data? What would you do differently the next time (or what would you do the same)? Development of a close working relationship with the data provider usually results in a satisfied customer. During data acquisition, maintain direct communication with the contractor on a daily basis to discuss flight conditions, clouds, etc. The willingness to make good on deliverables varies among vendors. Some vendors have not delivered products of the accuracy specified in the contract. Timeliness of deliverables has been a general problem. Contracts need to be structured to enforce vendor performance. A number of lidar data providers
51
including the University of Florida, University of Texas Bureau of Economic Geology, and TerraPoint) have demonstrated a willingness to work with the USGS in reprocessing data until it met our needs. Several scientists have experienced difficulty contracting for lidar data. Internal contracting requirements are not always well understood, which can cause problems and delays.
Use of cooperative research agreements with the university community to procure lidar data in support of research projects has worked very well. Likewise, innovative partnerships have proven to be a successful arrangement for lidar data acquisitions.
D. Identify any major commercial and contracting issues not covered in the session opening or in your responses to the questions above. Policy development within USGS needs internal review before being reviewed by outside groups like MAPPS. Contractors on the Cartographic Services Contract are not offering competitive pricing.
The Brooks act is open to some interpretation. Need to specify that the contract deliverables (including mass points) are government property. Don't limit contract deliverables to just contour data.
RECOMMENDATIONS
WORKSHOP REPORT The Land Remote Sensing Program produced this report to document the accomplishments of the first USGS Lidar Workshop. To this end, six volunteers (folks other than the workshop conveners) were solicited from the attendees to form a Workshop report committee. The initial group of volunteers consisted of:
• Vivian Queija (Geography) • Julia Giller (Geography) • Gerald Bawden (Water) • Larry Handley (Biology) • Ellen Raabe (Geology) • Karen Morgan (Geology)
52

After some discussion, it was decided this document should be published as an official USGS Open-File Report to raise the visibility of lidar technology and applications, and the workshop within the USGS. The scope and content of the report were determined by the writing committee. It is hoped this report may serve to stimulate the USGS to propose “a lidar initiative” for Fiscal Year 2006. LIDAR INITIATIVE Larry Handley spoke about the possibility of developing a new USGS initiative focused on lidar technology. The budget of the Land Remote Sensing Program has been declining in recent years and does not provide much room for new projects, although the program manager has been able to support a few small activities such as the first USGS Lidar Workshop. Senior USGS management believes the time is right for developing a new initiative that focuses on lidar technology, and the majority of workshop attendees agree. Discussion of what a lidar initiative should include ranged widely. The initiative should cover a broad suite of related activities including development of a distributed Lidar Center of Excellence (with participation from entities such as the EROS Data Center, the Center for Coastal & Watershed Studies, the Rocky Mountain Mapping Center, the Seattle Field Office, and the Flagstaff Field Center to name a few), development of a lidar training program, formation of a standards group, and creation of an archive/clearinghouse/data warehouse. If a repository were established for the huge amount of lidar data being created by USGS projects, should it be centralized or distributed? Others suggested that it provide support for research and applications projects, and demonstrations of how the data can be used to help scientists in their investigations. Another idea was for support of a prospectus program devoted to lidar research. Some felt the initiative should focus on infrastructure because that is more likely to receive funding from the Office of Management and Budget (OMB). Others believe it would gain greater support by bringing in our sister Department of the Interior (DOI) agencies as well as other agencies like NOAA. The initiative should be multidisciplinary and extend broadly across the sciences. The concept for the initiative is not well defined at present and requires an interdisciplinary team to develop a draft proposal. The Land Remote Sensing Program has indicated it is prepared to assist in bringing this endeavor to fruition. LIDAR SPECIAL INTEREST GROUP A large number of attendees said they would very much like to see the formation of a group that has lidar ranging technology and applications as its focus. USGS scientists working with lidar are dispersed in cost centers around the United States and some don’t get many opportunities to talk with colleagues having similar interests. Creation of a Lidar Special Interest Group (LSIG) would provide a forum for scientists to discuss their ideas for research and explore areas of potential
53

collaboration. It could also serve as a clearinghouse for access to technical information, software tools, and a calendar of planned lidar data acquisitions. To facilitate communication amongst the group, it was decided to start with a USGS lidar Discussion Forum. This group has been established and is operational at http://www.gcmrc.gov. Click on “Discussion Forums” then “Lidar Forum.” TECHNOLOGY TRANSFER It should be apparent from this report that lidar high-resolution elevation/bathymetry data has broad application to many USGS programs. Currently, expertise in the use of lidar data resides largely in the Geography and Geology disciplines. A viable means needs to be found for expanding the base of expertise to include the Water and Biology disciplines. One way to encourage technology transfer across the agency is to give some emphasis to multidisciplinary lidar research projects in the various prospectuses, venture capital, and other funding mechanisms available to USGS scientists. Another suggestion for broadening the exposure of USGS scientists and managers to lidar technology is for the LSIG to organize a workshop or technical session at an appropriate conference. Possible venues include the annual USGS GIS spring workshop in Denver, American Society of Photogrammetry and Remote Sensing conferences, the annual ESRI meeting, Geological Society of America conferences, and other conferences of strategic importance. Technology transfer should also be a significant part of a USGS lidar initiative. Developing and sharing a common knowledge of lidar technology across disciplines would enable collaboration and help foster more integrated science. DATA CLEARINGHOUSE The need for a data clearinghouse, or more preferably, a professionally run archive, is clearly evident. Use of lidar technology is growing within the USGS and is only going to increase. The very large data files generated by lidar missions make it imperative that they are systematically managed, indexed, archived, have appropriate metadata, and made available for distribution when licensing permits. A clearinghouse component to an archive should provide access to algorithms and code, technical information, planned lidar missions, and scheduled training. The USGS EROS Data Center has as one of its primary missions the archiving, management, and preservation of land remote sensing data for the United States. This existing capability should be utilized instead of creating a duplicative one. . STANDARDS The USGS is recognized internationally for its leadership in the development of data standards. The agency needs to be proactive and take a leadership role in the
54

development, review, and updating of standards pertaining to the rapidly evolving world of lidar technology and the resultant data. ACCURACY ASSESSMENT Government agencies are looking to the USGS to develop objective guidelines that enable the assessment of lidar data accuracy. This is a critical requirement for both operational missions in support of The National Map and research projects. The USGS should form a multidisciplinary committee with representation from operations and research to develop objective guidelines as soon as possible. FOLLOW-ON WORKSHOPS This first lidar Workshop was held to get together USGS scientists and managers. As registration forms were received, the organizers saw a broad interest both from within and outside the agency. When canvassed during the wrap-up session about possible follow-on workshops, attendees expressed strong support of the idea. It was suggested that the next workshop be one week in length and include one day of training, an open session for USGS and other interested folks, and a closed session for only USGS employees. A follow-on workshop could include participants from NOAA, NASA, vendors, etc. The consensus was to try to have the next workshop one year hence. It was suggested the special interest group take on the responsibility for organizing the next workshop.
CONCLUSIONS The first U.S. Geological Survey Lidar Workshop was an unqualified success that exceeded the expectations of its organizers. A collegial environment evolved over the course of the Workshop that enabled scientists from the Geography, Geology, Water, and Biology disciplines of the USGS to discuss common issues from their unique perspectives. Pockets of lidar expertise were exposed, enabling attendees to broaden their base of technical support. The breadth of issues relating to lidar ranging technology and elevation data is large, and these must be prioritized in order to address them in a timely manner. Establishment of a Center of Lidar Excellence would help to coordinate these activities and provide the leadership necessary to ensure their accomplishment. Efforts should be made to sustain the enthusiasm and sense of camaraderie generated by the Workshop. Management support and encouragement would contribute to this goal.
55

BIBLIOGRAPHY
56

SELECTED REFERENCES Ackermann, F., 1999, Airborne laser scanning – present status and future expectations: ISPRS Journal of Photogrammetry & Remote Sensing, v. 54, n. 2-3, p. 64-67. Baltsavias, E. P., 1999a, A comparison between photogrammetry and laser scanning: ISPRS Journal of Photogrammetry & Remote Sensing, v. 54, n. 2-3, p. 83-94. Baltsavias, E.P., 1999b, Airborne laser scanning: existing systems and firms and other resources: ISPRS Journal of Photogrammetry & Remote Sensing, v. 54, n. 2-3, p. 164-168. Baltsavias, E. P., 1999c, Airborne laser scanning: basic relations and formulas: ISPRS Journal of Photogrammetry & Remote Sensing, v. 54, n. 2-3, p. 199-214. Blackburn, G., 2002, Remote sensing of forest pigments using airborne imaging spectrometer and lidar imagery: Remote Sensing of Environment, v. 82, n. 2-3, p. 311-321. Borstad, G., and Vosburg, J., 1993, Combined active plus passive optical bathymetric mapping: using the LARSEN lidar and the CASI imaging spectrometer: 16th Canadian Symposium on Remote Sensing, p. 153-157. Brock, J., Wright, C.W., et al., 2004, Optical rugosity analysis of coral reef status in Biscayne National Park, Florida: Coral Reefs, (in press). Published online: http://www.springerlink.com/app/home/contribution.asp?wasp=m3nhpmuxllp1f0guubex&referrer=parent&backto=issue,12,21;journal,1,38;linkingpublicationresults,id:100407,1. Brock, J., Wright, C.W., et al., 2002a, Initial results from a test of the NASA EAARL lidar in the Tampa Bay region: Transactions, Gulf Coast Association of Geological Societies and Gulf Coast Section SEPM, 52nd Annual Convention, Austin, TX, CD-ROM. Brock, J., Wright, C.W., et al, 2002b, Basis and methods of NASA Airborne Topographic Mapper lidar surveys for coastal studies: Journal of Coastal Research, v. 18, n. 1, p. 1-13. Brock, J., Sallenger, A., et al, 2001, Recognition of fiducial surfaces in lidar surveys of coastal topography: Photogrammetric Engineering & Remote Sensing, v. 67, n. 11, p. 1245-1258.
57

Clarke, R.N., Swayze, G.A., et al., 2003, Imaging spectroscopy: Earth and planetary remote sensing with the USGS Tetracorder and expert systems: Journal of Geophysical Research, (in press) Drake, J. B., Dubayah, R.O., et al, 2002, Estimation of tropical forest structural characteristics using large-footprint lidar: Remote Sensing of Environment, v. 79, p. 305-319. Estep, L.L., Lillycrop, W.J., and Parson, L.E., 1994, Sensor fusion for hydrographic applications: Proceedings, U.S. Army Corps of Engineers 1994 Training Symposium, Surveying and Mapping, Remote Sensing/GIS, New Orleans, LA, p. 1-7. Flood, M., and Satalich, J., 2001, Lidar 101, Point of Beginning, p.16. http://www.pobonline.com/CDA/ArticleInformation/coverstory/BNPCoverStoryItem/0,2340,23513,00.html. Fowler, R., 2001, Topographic lidar, in Maune, D. F. (ed.), Digital Elevation Model Technologies and Applications: The DEM User's Manual, ASPRS, Bethesda, MD, p. 207-236. Gamba, P., and Houshmand, B., 1999, Integration of high-resolution multispectral imagery with lidar and IFSAR data for urban analysis applications: ISPRS Workshop: Mapping Structure and Topography by Airborne and Spaceborne Lasers, La Jolla, CA. Gougeon, F.A., St.-Onge, B.A., et al., 2001, Synergy of airborne laser altimetry and digital videography for individual tree crown delineation: Proceedings of the 23rd Canadian Symposium on Remote Sensing, Sainte-Foy, QU. Guenther, G. C., 2001, Airborne lidar bathymetry, in Maune, D. F. (ed.), Digital Elevation Model Technologies and Applications: The DEM User's Manual, ASPRS, Bethesda, MD, p. 237-306. Gutierrez, R., Gibeaut, J., et al, 1998, Airborne laser swath mapping of Galveston Island and Bolivar Peninsula, Texas: Proceedings of the Fifth International Conference on Remote Sensing for Marine and Coastal Environments, San Diego, CA, v. 1, p. 236-243. Haala, N., and Brenner, C., 1999, Extraction of buildings and trees in urban environments: ISPRS Journal of Photogrammetry & Remote Sensing, v. 54, p. 130-137.
58

Hapke, C.J., and Richmond, B.M., 1999, The development of a Coastal Aerial Mapping System (CAMS) and its application to the study of coastal morphodynamics: Proceedings of the 4th International Symposium on Coastal Engineering and Science of Coastal Sediment Processes, Hauppauge, NY, p. 2398-2413. Haugerud, R.A., and Harding, D.J., 2001, Some algorithms for virtual deforestrationof lidar topographic survey data: International Archives of Photogrammetry and Remote Sensing, v. 34-3/W4, p. 211-218. Hepner, G.F., Houshmand, B., et al., 1998, Investigation of the integration of AVIRIS and IFSAR for urban analysis: Photogrammetric Engineering & remote Sensing, v. 64, n. 8, p. 813-820. Hickman, G.D., and Hogg, J.E., 1969, Application of an airborne pulsed laser for near-shore bathymetric measurements: Remote Sensing of Environment, v. 1, p. 47-58. Hudak, A.T., Lefsky, M.A., et al., 2002, Integration of lidar and Landsat ETM+ data for estimating and mapping forest canopy height: Remote Sensing of Environment, v. 82, p. 397-416. Irish, J.L., McClung, J., and Lillycrop, W.J., 2000, Airborn lidar bathymetry: the SHOALS system: PIANC (International Navigation Association) Bulletin, v. 103, p. 43-53. Irish, J. L., and Lillycrop, W.J., 1999, Scanning laser mapping of the coastal zone: the SHOALS system: ISPRS Journal of Photogrammetry & Remote Sensing, v. 54, n. 2-3, p. 123-129. Krabill, W.B., Wright, C.W., et al, 2000, Airborne laser mapping of Assateague National Seashore beach: Photogrammetric Engineering & Remote Sensing, v. 66, n. 1, p. 65-71. Lefsky, M. A., Cohen, W.B., et al, 2002, Lidar remote sensing for ecosystem studies: BioScience, v. 52, n. 1, p. 19-30. Lefsky, M.A., Cohen, W.B., et al, 1999, Lidar remote sensing of the canopy structure and biophysical properties of Douglas-fir western Hemlock forests: Remote Sensing of Environment, v. 70, p. 339-361. Lefsky, M.A., Cohen, A., et al., 1999, Integration of lidar, Landsat ETM+ and forest inventory data for regional forest mapping: ISPRS Workshop: Mapping Forest Structure and Topography by Airborne and Spaceborne Lasers, La Jolla CA.
59

Lillycrop, W.J., Johnson, P., et al., 2001, Airborne lidar hydrography: requirements for tomorrow: Proceedings of Oceanology International, Miami, FL, p. 1-9. Lillycrop, W.J., and Estep, L.L., 1995, Generational advancements in coastal surveying, mapping: Sea Technology, June, p. 10-16. Maune, D.F., 2001, Digital elevation model technologies and applications: The DEM users manual, Bethesda, MD, The American Society for Photogrammetry and Remote Sensing. Nelson, R., 1997, Modeling forest canopy heights: The effects of canopy shape: Remote Sensing of Environment, v. 60, p. 327-334. Plaster, R.L., and Wos, L., 2001,A lidar primer: Elevation, September, p. 20-26. Sallenger, A., Krabill, W., et al., 1999, Airborne laser study quantifies El Nino-induced coastal change: EOS, v. 80, n. 8, p. 92-93. St.-Onge, B.A., and Achaichia, N., 2001, Measuring forest canopy using a combination of lidar and aerial photography data: Workshop on Land Surface Mapping and Characterization Using Laser Altimetry, Annapolis, MD. Wald, L., 1999, Some terms of reference in data fusion: IEEE Transactions in Geoscience and Remote Sensing, v. 37, n. 3, p. 1190-1193. Wehr, A. and Lohr, U., 1999, Airborne laser scanning - an introduction and overview: ISPRS Journal of Photogrammetry & Remote Sensing, v. 54, n. 2-3, p. 68-82. Wright, C.W., and Brock, J.C., 2002, EAARL: A lidar for mapping shallow coral reefs and other coastal environments: Proceedings, Seventh International Conference on Remote Sensing for Marine and Coastal Environments, Miami, FL, (CD-ROM). Wozencraft, J.M., Hardegree, L., et al., 2002, Merging airborne lidar bathymetry and spectral imagery for more complete coastal mapping: Proceedings, Seventh International Conference on Remote Sensing for Marine and Coastal Environments, Miami, FL, (CD-ROM).
IMPORTANT WEB SITES www.airbornelasermapping.com/ Monitors the LIDAR industry
and provides links to academia, government, and vendors.
60

www.asprs.org The American Society for Photogrammetry & Remote Sensing is a professional organization for imaging and geospatial information science and technology.
www.geo.unizh.ch/rsl/services/bibliographies/lidar/ An interactive source of
recent journal articles about LIDAR technology.
www.leica-geosystems.com Leica Geosystems
manufactures and sells LIDAR systems.
www.isprs.org The International Society for
Photogrammetry and Remote Sensing is a professional organization that promotes the art, science, and technology of obtaining reliable information about the Earth and its environment using noncontact imaging and other sensor systems.
www.lidarcentral.com/lidartalk/wwwboard.shtml Current information about
LIDAR systems, applications, and issues.
http://www.ndep.gov/ Provides information on the
National Digital Elevation Program and participating members.
http://www.optech.on.ca/ Optech Inc. develops,
manufactures, and sells laser imaging systems.
osb1.wff.nasa.gov Provides information about a
number of NASA LIDAR systems and their applications.
61

rst.gsfc.nasa.gov/Sect13/Sect13_9.html Includes information on the fundamentals of spectroscopy, AVIRIS, and other imaging spectrometers.
speclab.cr.usgs.gov/hyperspectral.html Contains information on
hyperspectral imaging and the USGS Spectroscopy Lab.
http://www.ndep.gov/ Provides information on the
National Digital Elevation Program, subcommittees, and technical guidelines.
www.topeye.com Topeye, previously Saab,
manufactures LIDAR systems for mounting on helicopters.
62

APPENDICES
63

APPENDIX A: WORKSHOP ATTENDEES
Name
Email Address
Telephone
Fax
Angeli, Kim Cartographer (Geography) 12201 Sunrise Valley Drive Advanced Systems Center, MS 562 Reston, VA 20192
703-648-7885
703-648-7873
Baer, Lori Cartographer (Geography) Denver Federal Center, Bldg 810 PO Box 25046 MS 509 Lakewood, CO 80225
303-202-4636
303-212-4354
Bailey, Bryan Principal Remote Sensing Scientist (Geography) EROS Data Center Sioux Falls, SD 57197
605-594-6001
605-594-6567
Bawden, Gerald W. Geophysicist (Water) 6000 J. Street, Placer Hall Sacramento, CA 95819
916-278-3131
916-278-3013
Brock, John Oceanographer (Geology) Center for Coastal & Watershed Studies 600 Fourth St. South St. Petersburg, FL 33701
727-803-8747 ext. 3088
727-803-2031
Caruso, Vince Cartographer (Geography) MS 521 National Center Reston, VA 20192
703-648-4586
703-648-4614
Chavez, Pat Research Physical Scientist (Geography) 225 N. Gemini Drive Flagstaff, AZ 86001
928-556-7221
928-556-7169
Clayton, Tonya Research Oceanographer and Mendenhall Fellow (Geology) Center for Coastal & Watershed Studies 600 Fourth Street S. St. Petersburg, FL 33701
727-803-8747 ext. 3138
727-803-2031
64

Crane, Michael Remote Sensing Scientist (Geography) EROS Data Center 47914 252nd St. Sioux Falls, SD 57198-0001
605-594-6041
605-594-6529
Crosby, Christopher Geologist EQ Hazards (Geology) 345 Middlefield Road MS-977 Menlo Park, CA 94025
650-329-5622
650-329-5163
Crowe, John Elevation Coordinator (Geography) 12201 Sunrise Valley Drive MS 511 Reston, VA 20192
703-648-5596
703-648-4722
D’Iorio, Mimi Geologist (Geology) Pacific Science Center 1156 High Street Santa Cruz, CA 95064
831-427-4735
831-427-4748
Fisher, Gary Hydrologist (Water) 8987 Yellow Brick Road Baltimore, MD 21237
410-238-4259
410-238-4210
Gesch, Dean Senior Scientist (Geography) EROS Data Center Sioux Falls, SD 57198
605-594-6055
605-594-6529
Gibbs, Ann Geologist (Geology) USGS Pacific Science Center 1156 High Street Santa Cruz, CA 95064
831-427-4740
831-427-4748
Giller, Julia Gulf Coast Liaison (Geography) 277 N. Bronough Room 3015 Tallahasee, FL 32301
850-942-9500 ext. 3034
850-942-9521
Handley, Lawrence Geographer (Biology) National Wetlands Research Center 700 Cajundome Blvd. Lafayette, LA 70506
337-266-8691
337-266-8513
Hapke, Cheryl Coastal Geologist (Geology) USGS Pacific Science Center 1156 High Street Santa Cruz, CA 95064
831-427-4744
831-427-4748
65

Harris, Melanie Physical Scientist (Geology) Center for Coastal and Watershed (ETI Professionals, Inc.) 600 Fourth St. South St. Petersburg, FL 33701
727-803-8747 ext. 3023
727-803-2031
Haugerud, Ralph Research Geologist (Geology) Dept. of Earth & Space Science Box 351310 University of Washington Seattle, WA 98195
206-553-5542
Huang, Chengquan Scientist (Geography) EROS Data Center (SAIC) 47914 252nd Street Sioux Falls, SD 57198
605-594-6817
Kannan, Chris NC Geography Liaison (Geography) 3916 Sunset Ridge Road Raleigh, NC 27607
919-571-4030
919-571-4041
Kinzel, Paul Hydrologist (Water) Box 25046 MS 413 Denver Federal Center Lakewood, CO 80225
303-236-5001
303-236-5034
Kleckner, Richard Chief, Branch of Data Coordination (Geography) 511 National Center Reston, VA 20192
703-648-5741
703-648-4722
Kosovich, John Cartographer (Geography) PO Box 25046 MS 516 Denver Federal Center Lakewood, CO 80225
303-202-4301
303-202-4354
Lanning-Rush, Jenny Geographer (Water) 2320 La Branch Street Houston, TX 77004
713-718-3655 ext. 33
713-718-3661
Liszewski, Michael Info Tech Prgm Mgr (Biology) 2255 North Gemini Flagstaff, AZ 86001
928-556-7450
66

Lyttle, Peter Program Coord, NCGMP (Geology) 908 National Center Reston, VA 21092
703-648-6943
703-648-6937
Mark, Linda Hydrologist (Water) Cascades Volcano Observatory 1300 SE Cardinal Court Building 10, Suite 100 Vancouver, WA 98683
360-993-8974
360-993-8980
Mietz, Steve GIS Coordinator (Biology) 2255 N. Gemini Drive Flagstaff, AZ 86001
928-556-7050
928-556-7368
Molnia, Bruce Geologist (Geology) 926A National Center Reston, VA 20192
703-648-4120
703-648-4227
Morgan, Karen L.M. Geologist (Geology) Center for Coastal & Watershed Studies 600 Fourth St. South St. Petersburg, FL 33701
727-803-8747 ext. 3037
727-803-2032
Morath, Laurie Physical Scientist (Geology) PO Box 25046, MS 973 Denver, CO 80225
303-236-5361
303-236-1409
Muchoney, Doug Program Coordinator (Geography) Geographic Analysis and Monitoring 519 National Center Reston, VA 20192
703-648-6883
703-648-5542
Nayegandhi, Amar Computer Scientist (Geology) Center for Coastal & Watershed Studies (ETI Professionals, Inc.) 600 4th Street South St. Petersburg, FL 33701
727-803-8747 ext. 3026
727-803-2031
Newton, Wes Statistician (Biology) Northern Prairie Wildlife Res. 8711 37th Street SE Jamestown, ND 58401
701-253-5523
701-253-5553
67

Oimoen, Michael Scientist (Geography) EROS Data Center Sioux Falls, SD 57198
605-594-6033
Olsen, Theresa Geographer (Water) 1201 Pacific Ave So. Suite 600 Tacoma, WA 98402
253-428-3600 ext. 2652
253-428-3614
O’Neil, C.P. (Pat) Geo-spatial Data Coordinator (Geography/Biology) USGS/NWRC 700 Cajundome Blvd. Lafayette, LA 70506
pat_o’[email protected]
337-266-8699
337-266-8513
Poore, Barbara Coastal Coordinator (Geography) 521 National Center Reston, VA 20192
703-648-5971
Prentice, Carol Geologist (Geology) 345 Middlefield Road MS 977 Menlo Park, CA 94025
650-329-5690
650-329-5163
Queija, Vivian Geographer (Geography) NW Geographic Science Office 909 1st Avenue, Suite 900 Seattle, WA 98104
206-220-4565
206-220-4569
Raabe, Ellen Physical Scientist (Geology) 600 Fourth St. South St. Petersburg, FL 33701
727-803-8747 ext. 3039
727-803-2032
Reid, David Student Researcher (Geology) USGS Pacific Science Center 1156 High Street Santa Cruz, CA 95064
Roseboom, Don Hydrologist (Water) Illinois District 2200 Urbana, IL
[email protected] or [email protected]
309-697-5727
309-697-5727
Saghy, David L USGS (Geography) Coop. Topographic Mapping MS 511 12201 Sunrise Valley Drive Reston, Va 20192
703-648-4158
703-648-4722
68

Stockdon, Hilary Oceanographer (Geology) 600 Fourth St. South St. Petersburg, FL 33701
727-803-8747
727-803-2032
Stoker, Jason Sr. LIDAR Remote Sensing Scientist (Geography) EROS Data Center Sioux Falls, SD 57198
605-594-2795
Sughru, Michael Geographer (Water) 202 NW 66th St. Bldg. 7 Oklahoma City, OK 73116
405-810-4425
Terziotti, Silvia IT Specialist (Water) 3916 Sunset Ridge Road Raleigh, NC 27607
919-571-4090
919-571-4041
Weaver, Craig WRG Earthquake Hazards (Geology) University of Washington Box 351310, Rm. 63, Johnson Hall Seattle, WA 98195-1310
206-553-0627
206-553-8350
69

APPENDIX B: WORKSHOP AGENDA
USGS Lidar Workshop St. Petersburg, Florida November 20-22, 2002
Wednesday, November 20 8:00 Workshop Welcome John Brock
Center for Coastal & Watershed Studies
8:15 Workshop Perspective and Overview Brian Bailey EROS Data Center
8:30 Opening Plenary Session - Review of Lidar Workshop Participants
Activities, Experience, and Interests 10:30 Break and Colleague Interaction 11:00 Introduction to Discussion Topic 1 – Current John Brock, Moderator and Future Lidar Technologies
• Temporal Waveform Resolving LIDAR John Brock (30 min. presentation/20 min. group discussion)
• Aircraft Position and Attitude determination John Brock (10 min. presentation/10 min. group discussion)
• Integrated Lidar and Hyperspectral Scanning Tonya Clayton (30 min. presentation/20 min. group discussion)
1:00 Lunch 2:30 Introduction to Discussion Topic 2 – Lidar Pat Chavez, Moderator Applications within USGS Science Disciplines
- Topography and Geomorphology Ralph Haugerud - Coastal and Marine Applications and Habitats Pat Chavez - Vegetation/Biomass Information Extraction Jason Stoker - Hydrologic Applications Steven Mietz - Others (e.g., Urban Mapping) All
3:15 Discussion Topic 2 Breakout Session Individual Groups 4:00 Discussion Topic 2 Group Reports Group Spokespersons 5:00 Adjourn for the Day 5:30 Reception and Poster Session Thursday, November 21 8:00 Introduction to Discussion Topic 3 – Calibration Ralph Haugerud, Moderator and Accuracy Assessment
- A Conceptual Framework Ralph Haugerud - Surface Elevation, Morrison, CO Quad John Kosovich - Comparing Lidar and INSAR with Dense Ground
Ground Control, King County, WA Vivian Queija - Quality Assurance at the Puget Sound Lidar
70

Consortium Ralph Haugerud 8:30 Discussion Topic 3 Breakout Session Individual Groups 9:30 Discussion Topic 3 Group Reports Group Spokespersons 10:30 Break and Colleague Interaction 11:00 Introduction to Discussion Topic 4 – Tools for Pat Chavez, Modertor Processing and Evaluating Lidar Data Sets
- USGS/St. Petersburg LIDAR Processing Software Amar Nayegandhi - USGS/Flagstaff SHOALS Processing Software Pat Chavez - Rapid Terrain Visualization Tool Kit John Kosovich - Others (e.g., CORPS SHOALS) All
11:45 Discussion Topic 4 Breakout Session Individual Groups 12:30 Lunch 1:30 Discussion Topic 4 Group Reports Group Spokespersons 2:30 Introduction to Discussion Topic 5 – Lidar Dean Gesch, Moderator Data Management
- Formats for Archiving and Distributing Lidar Data Dean Gesch - The National Digital Elevation Program John Crowe - Metadata Jim Mauck - Lidar Data Currently Available to USGS Scientists Dean Gesch
3:00 Discussion Topic 5 Breakout Session Individual Groups 4:00 Discussion Topic 5 Group Reports Group Spokespersons 5:00 Adjourn for the Day 5:30 Tour of USGS St. Petersburg Offices Friday, November 22 8:00 Introduction to Discussion Topic 6 – Commercial Dean Gesch, Moderator and Contracting Issues
- Data Licensing: Who Owns What? Dean Gesch - The Effects of Qualifications Based Selection (QBS)
and the Cartographic Services Contract (CSC) on Lidar Data Procurement Dick Kleckner
- Working with Outside Partners for Lidar Acquisition Craig Weaver - Standards for Lidar Data Acquisition Dean Gesch - Research Grade Lidar Acquisitions vs. Commercial
Vendor Acquisitions Mike Crane 8:30 Discussion Topic 6 Breakout Session Individual Groups 9:30 Discussion Topic 6 Group Reports Group Spokespersons 10:30 Closing Plenary Session – Workshop Wrap-up, Workshop Participants Including Discussion on Establishing a USGS Lidar Interest Group
12:00 Adjourn
71

72
APPENDIX C: ACRONYMS AAG Association of American Geographers ACSM American Congress on Surveying and Mapping AGU American Geophysical Union ALB Airborne LIDAR bathymetry ASPRS American Society for Photogrammetry and Remote Sensing BIL Band interleaved by line (file format) BIP Band interleaved by pixel (file format) Biology Biology Discipline of the USGS BSQ Band sequential (file format) CSC Cartographic Services Contract DEM Digital elevation model DLG Digital line graph EAARL Experimental Advanced Airborne Research LIDAR EDC EROS Data Center FAR Federal acquisition regulation FEMA Federal Emergency Management Agency FGDC Federal Geographic Data Committee FIRM Flood insurance rate map FTP File transfer protocol Geography Geography Discipline of the USGS Geology Geology Discipline of the USGS GeoTIFF Georeferenced tagged image file format GIS Geographic information system GPS Global positioning system IFSAR Interferometric synthetic aperture radar INS Inertial navigation system KGPS Kinematic global positioning system LASER Light amplification by stimulated emission of radiation LIDAR Light detection and ranging MAPPS Management Association for Private Photogrammetric Surveyors MSL Mean sea level NAD 27 North American (horizontal) Datum of 1927 NAD 83 North American (horizontal) Datum of 1983 NASA National Aeronautics and Space Administration NAVD 88 North American Vertical Datum of 1988 NDEP National Digital Elevation Program NED National Elevation Dataset NIMA National Imagery and Mapping Agency NMAS National Map Accuracy Standard NOAA National Oceanic and Atmospheric Administration NSSDA National Standard for Spatial Data Accuracy NWS National Weather Service QBS Qualifications Based Selection OTF On-the-fly PDOP Positional Dilution of Precision PRF Pulse repetition frequency TIFF Tagged image file format TNM The National Map VMAS Vertical map accuracy standard Water Water Discipline of the USGS USGS U.S. Geological Survey