report of the standards council - … of the standards council for the 12 months ended 30 june 2011...
TRANSCRIPT
REPORT OF THE
STANDARDS COUNCILFOR THE 12 MONTHS ENDED 30 JUNE 2011
G.15
OUR VISION New Zealand’s leader in creating value through standardisation
Standards are key enablers of New Zealand’s economic success and a wide range
of public good outcomes. The Standards Council’s main purpose is to promote
and champion the benefits of Standards for all New Zealanders, while encouraging
government, industry, and the community to value and participate in our activities.
OFFICELevel 10, Radio New Zealand House 155 The Terrace, Wellington 6011 Private Bag 2439 Wellington 6140
T: (04) 498 5990 F: (04) 498 5994 [email protected] www.standards.co.nz
G.15
REPORT OF THE
STANDARDS COUNCILFOR THE 12 MONTHS ENDED 30 JUNE 2011
Presented to the House of Representatives pursuant to section 150 of the Crown Entities Act 2004

COPYRIGHT STATEMENT AND LICENCE Crown copyright ©. This copyright work is licensed under the Creative Commons Attribution 3.0 New Zealand licence. In essence, you are free to copy, distribute, and adapt this work, as long as you attribute it to Standards New Zealand and abide by the other licence terms. To view a copy of this licence, visit http://creativecommons.org/licenses/by/3.0/nz/. Attribution to Standards New Zealand should be in written form and not by reproduction of the Standards New Zealand logo.
ISSN 0302-8313 (Print) ISSN 2230-4061 (Online) G. 15

1STANDARDS COUNCIL | ANNUAL REPORT 2011
CONTENTSChair’s foreword 2
Part 1 Chief executive’s report 4
1.1 Overview 4
1.2 Financial result 4
1.3 Stakeholder engagement and satisfaction 6
1.4 Product development 8
1.5 International standing and relationships 9
1.6 Sustainability underpinned by continuous improvement 11
1.7 The future 12
Part 2 Performance measures 13
2.1 Standards Council outcomes framework 13
2.2 Statement of service performance 15
Part 3 Financial statements 16
3.1 Standards Council statement of responsibility 16
3.2 Statement of comprehensive income 17
3.3 Statement of financial position 18
3.4 Statement of changes in equity 19
3.5 Statement of cash flows 19
3.6 Notes to the financial statements 20
Independent auditor's report 41
Nominating organisations 43
Standards Council IBC
2 STANDARDS COUNCIL | ANNUAL REPORT 2011
CHAIR’S FOREWORDMinister, Hon Craig Foss, we are pleased to submit the Standards Council’s Annual Report for the year to 30 June 2011.
John Lumsden Chair Standards Council
Sharon Kletchko Member Standards Council
31 October 2011 Wellington, New Zealand
For the third year in a row we are happy to report a net budget surplus. This year our net surplus was $591K – our strongest financial showing since 1998. The surplus reflects our commitment to operating efficiently and promoting opportunities for Standards development in a wide range of sectors while seeking ways to increase publication sales, royalties, and subscriptions.
In 2010 – 2011 the Standards Council updated its strategic framework. The strategy includes four priority areas along with continued sustainability for Standards New Zealand. Many of the activities of the Council and Standards New Zealand in the past 12 months reflect work accomplished under this new strategic framework.
In broad terms, the Council’s strategy encompasses:
• growing revenue and operating surpluses for reinvestment back into the organisation to expand the range of core services and national benefits
• nurturing the use of, and support for, Standards solutions and standardisation in both the public and private sectors
• ongoing development of new products and services to meet the needs of targeted industry sectors
• investing in our staff and key technological resources to offer new and improved systems, products, and processes
• sustaining general performance and core reserves for our ongoing viability.
For Standards and standardisation to be fully used we continue to build collaborative relationships with government, industry, consumer representatives, other national Standards bodies, and international Standards bodies. Stakeholder satisfaction is one indicator of our ability to maintain many key relationships. We can report that stakeholder satisfaction remained high last year. Our 2010 – 2011 annual performance survey results showed that overall customer satisfaction with the supply of Standards rated 6.04 out of 7. Overall client satisfaction with the quality of service received for Standards development rated 5.91 out of 7, and Standards development committee satisfaction rated 6.14 out of 7.
3STANDARDS COUNCIL | ANNUAL REPORT 2011
Our solid financial showing and stakeholder satisfaction reflect the sound foundation the Council has laid to ensure that Standards New Zealand can be both sustainable and responsive in the twenty-first century. Through promoting and championing the benefits of Standards and standardisation for all New Zealanders, the Council continued to find new ways for government, industry, and the community to value and participate in our activities.
We have recently initiated activities to support strategic priorities that were developed in 2010 – 2011 by the Standards Council. Below are a few key activities that began in 2010 – 2011 and represent our current and future work.
1. National Standardisation Strategy – Work has begun on developing a National Standardisation Strategy that will clarify the priorities and goals for standardisation in New Zealand.
2. Economic research – With BRANZ and the Construction Industry Council we co-sponsored economic research by BERL to better understand the contributions of Standards to the New Zealand economy. This work will help to underpin the development of the National Standardisation Strategy.
3. Response to Canterbury earthquakes – We continue to actively seek ways to support the rebuild efforts in Canterbury, including supporting our clients, customers, and committee members.
4. Continued focus on new product and service development – We continue to work with our clients to address their needs with the appropriate solution.
On behalf of the Council, I would like to recognise the continued professionalism of Standards New Zealand’s Chief Executive, Senior Leadership Team, and staff. I would also like to take this opportunity to thank my dedicated colleagues on the Standards Council and to acknowledge former Standards Council Chair Richard Westlake who stepped down in October 2010. Over his 7 years Richard guided a strong and effective Council. The current Council continues to be high functioning and outcomes focused.
Finally, I would like to welcome you in your ministerial role for the oversight of the standards and conformance infrastructure in New Zealand. I would also like to thank Commerce Minister Hon Simon Power for his past support of the work of the Standards Council and Standards New Zealand.
Through promoting and championing the benefits of Standards and standardisation for all New Zealanders, the Council continued to find new ways for government, industry, and the community to value and participate in our activities.

4 STANDARDS COUNCIL | ANNUAL REPORT 2011
PART 1
CHIEF EXECUTIVE’S REPORT
1.1 OVERVIEWStandards New Zealand had an outstanding set of achievements in 2010 – 2011 under our strategic priorities, which have been to sustain, invest, and grow. Below are some of our key successes.
1. Financial result – We recorded a $591K budget surplus, which represents our most financially successful year for the last decade. This result has allowed us to continue to rebuild our reserves and reinvest in our infrastructure to better serve our customers and clients.
2. Stakeholder engagement and satisfaction – We maintained high levels of customer, client, and committee member satisfaction.
3. Product development – We published 156 Standards, including the limited technical review of NZS 3604:1999 Timber framed buildings. The 2011 edition is now cited as an Acceptable Solution under the New Zealand Building Code.
4. International standing and relationships – We continued to build on our strong relationship with Standards Australia and to represent New Zealand in the international Standards community.
5. Sustainability underpinned by continuous improvement – We addressed the highest business risk on our risk register by replacing our legacy computer systems and identified new ways of operating more efficiently and effectively, while ensuring value for money to our customers and clients. This Information Systems Strategic Plan (ISSP) project was delivered on time and within budget. The project has far-reaching implications for our ability to carry out our work effectively and efficiently.
The financial and non-financial results achieved this year were the result of commitment from the Standards Council, our Senior Leadership Team, and staff. Strong relationships in the sectors we work in were also critical to our success. We would particularly like to acknowledge our clients, customers, and committee members and their nominating organisations for their ongoing support.
1.2 FINANCIAL RESULTThis is the third consecutive year where we have shown a budget surplus. Our actual budget surplus of $591K was significantly higher than the $165K we had projected. This result is particularly notable in light of the challenging economic climate of 2010 – 2011. Budget surpluses are critical to our ongoing sustainability. After many years of losses, the past 3 years have delivered surpluses that enable our reserves to be replenished and ageing legacy systems to be replaced.
For the past 3 years we have been focused on sustaining, investing, and growing. We instituted a business model that has allowed us to strengthen our financial position through diversifying our client base, offering new products, and continually looking at better and improved ways of working. This year we have seen financial gains based on the following factors.
5STANDARDS COUNCIL | ANNUAL REPORT 2011
1. We have had a continued focus on the value-adding aspects of the business, including:
a. reducing levels of non-funded activity
b. realising the benefits of reassigning business relationship activities to the Senior Leadership Team and staff
c. exploring and trialling new products to better meet customer needs.
2. We have made adjustments to our costs and pricing, including:
a. recovering full costs for Standards solutions development
b. ongoing tight focus on margins and discounts
c. monitoring and reviewing our contract ‘pipeline’ for business development.
3. The publication of NZS 3604:2011 Timber-framed buildings which continues to be our strongest product offering – this Standard provides guidance for the construction of residential and commercial buildings up to three storeys high.
4. Sales and royalties from a newly revised handbook for the Australasian market, SAA/SNZ HB 76:2010 Dangerous goods – Initial emergency response guide.
5. Deepening our understanding of our clients’ and customers’ needs, and continuously improving the processes that impact on our ability to meet those needs and improve perceptions of ‘what we do’.
6. Setting clear priorities for the Standards Council’s international activity based on available resources.
7. Evaluating the broader value contained in the national Standards catalogue and expanding the existing client and customer base, as well as offering more tailored solutions to stakeholders.
Challenges in 2010 – 2011 included meeting our agreements for service target, mainly due to the impact of the global financial crisis and budgeting pressures experienced by our clients. Overall, however, due to our diversified income streams we were able to maintain a strong result.
This is the third consecutive year where we have shown a budget surplus. Our actual budget surplus of $591K was significantly higher than the $165K we had projected. This result is particularly notable in light of the challenging economic climate of 2010 – 2011.

6 STANDARDS COUNCIL | ANNUAL REPORT 2011
1.3 STAKEHOLDER ENGAGEMENT AND SATISFACTIONStandardisation spans all aspects of New Zealand’s economy and society. Given our size and finite resources, we continued to prioritise our efforts and stakeholder engagement to five key sectors: building and construction, energy and safety, health, education, and infrastructure and environment. We also built our profile, which ensured continuity of several projects and new business development opportunities.
Through independent surveys we measured satisfaction levels for three groups of stakeholders – those who served on Standards development committees, clients who contracted Standards New Zealand for Standards solutions, and customers who purchased Standards. Across all three groups we maintained high levels of satisfaction.
Our 2010 – 2011 annual performance survey results showed that overall customer satisfaction with the supply of Standards rated 6.04 out of 7. Overall client satisfaction with the quality of service received for Standards development rated 5.91 out of 7, and Standards development committee satisfaction rated 6.14 out of 7.
Work in Canterbury
We have devoted much effort this year to working with the building industry, including the Construction Industry Council, to harness support for Standards in areas such as the Building Act Review process.
We convened fora with chairs from a number of our expert committees, along with industry and sector advisory groups, to capture lessons learnt from the September 2010 Canterbury earthquake. We also considered how we could best contribute to the Royal Commission of Inquiry into Building Failure Caused by the Canterbury Earthquakes.
On an individual level, for Cantabrians affected by the earthquakes we worked with government and industry to provide free Standards access for 6 months and the use of Standards New Zealand’s office facilities in Wellington.
Recovery from the Canterbury earthquakes will take time. We will continue to be fully engaged in assisting in this important work.
Collegial and constructive relationships across all sectors we work with are critical to our success. In an effort to thank our 2000+ committee members, their employers, and nominating organisations we again hosted the annual Meritorious Service events. Awards breakfasts were held in Wellington and Auckland in April and a special awards lunch and workshop was held in Christchurch in August 2011. Commerce Minister Simon Power served as keynote speaker in Wellington and Building and Construction Minister Maurice Williamson was the keynote speaker in Auckland.
7STANDARDS COUNCIL | ANNUAL REPORT 2011
Winners this year included the following.
Meritorious Service Award winners and the sectors they work in
Nevil Hegley, environmental acoustics
Malcolm Hunt, environmental acoustics
Allan Sage, glazing
Roger Shelton, building
Clive Smith, consumer protection
Committee of the Year Award winner Timber-framed buildings committee P 3604
Standards Council Award for Outstanding Contribution to Standards and Standardisation winner
Chris Mak, fire protection
Minister Simon Power noted at the Wellington event, ‘These winners have been recognised by their peers for their outstanding contributions to Standards development. I applaud their expertise and dedication to improving New Zealanders’ economic and social well-being through Standards and standardisation.’
Chris Mak – Champion of fire protection Standards development
Chris Mak was the winner of the Outstanding Contribution to Standards and Standardisation in 2010 – 2011. Chris has over 25 years experience in the fire protection industry in engineering and management positions. He is the manager of AON's Technical Services business unit.
Involved with Standards development for over 15 years, Chris has chaired four Standards committees and has served as a member on several others. Among his colleagues Chris is known for his commitment to the ideals of his profession. His work with Standards New Zealand technical committees is driven to improve New Zealanders’ lives.
Through independent surveys we measured satisfaction levels for three groups of stakeholders – those who served on Standards development committees, clients who contracted Standards New Zealand for Standards solutions, and customers who purchased Standards. Across all three groups we maintained high levels of satisfaction.

8 STANDARDS COUNCIL | ANNUAL REPORT 2011
1.4 PRODUCT DEVELOPMENT As New Zealand’s peak Standards body, we are responsible for managing the development and distribution of Standards across a range of sectors. Standards developed by Standards New Zealand go through a robust development process – one which is transparent, open, consensus based, and trusted. Using the Standards development model we also continue to work with clients to deliver products and services that are tailored to meet their specific needs.
STANDARDS DEVELOPMENTOver the last year we continued with a strong development programme of new and revised Standards. We published 156 Standards that add to the quality and depth of the national catalogue’s stock.
In February this year we published a technical update of NZS 3604 Timber-framed buildings which is the foremost building Standard in New Zealand for the building and construction industry. The majority of new and existing residential buildings in New Zealand are timber construction, and 93% have components of NZS 3604 in their design and construction. The update was sponsored by Standards New Zealand, the Earthquake Commission, and the Department of Building and Housing, with support and input from a leadership group and technical committee that included a range of stakeholders from various industry sectors. The majority of the development costs for NZS 3604 were met by Standards New Zealand.
The Government's Building Act Review includes a look at the interface between the Building Code and Standards. When completed, the review will provide important strategic direction for Standards New Zealand's work in the building sector and help to clarify where future efforts should be focused.
Another example of Standards New Zealand’s continued Standards development includes NZS 4520:2010 Fire-resistant doorsets. NZS 4520 complements the fire-protection requirements of the New Zealand Building Code and was developed to keep the Standard up to date with changes that are appropriate in New Zealand.
NEW PRODUCTS AND SERVICESWe worked with clients to develop new products and services. For example, the Department of Internal Affairs sponsored the development of Achieving Compliance – A Guide for Compliance Agencies in New Zealand. Published in June 2011, the guide is an important part of the government’s Compliance Common Capability Programme. The guide was a major milestone for this cross-agency programme. As Harvard Kennedy School Professor Malcolm K. Sparrow stated in a foreword to the guide:
The task of managing compliance is central to a broad range of governmental responsibilities, and yet relatively little attention is paid to the distinctive nature of the challenges such work presents. The practice of regulation is seldom acknowledged as a profession in its own right. The authors of New Zealand’s ‘Achieving compliance’ have pulled together a wealth of knowledge and insights about regulatory practice and compliance management, and organised it into an easy-to-navigate format, packed with practical examples. For regulators, this guide represents an important addition to the professional body of knowledge and will be appreciated as a rich resource.
Similarly, collaborative work of the Office for the Community and Voluntary Sector, Standards New Zealand, and a network of community and government people with funding expertise led to the publication of a Code of Funding Practice in September 2010. The code was developed to help government funders and non-profit organisations work together when using public funds to benefit communities. The code complements the official guidance from the Treasury and the Office of the Auditor-General.
DISTRIBUTION CHANNELSWe also continued to develop new distribution channels by working with a range of industry organisations to assist them in promoting Standards to their members, extending our reach across many markets.

9STANDARDS COUNCIL | ANNUAL REPORT 2011
1.5 INTERNATIONAL STANDING AND RELATIONSHIPSNew Zealand looks to international Standards more and more to strengthen our trade relationships and to ensure we are aligned with international best practice. In 2010 – 2011, 1317 (42%) of our Standards were aligned with International Organization for Standardization (ISO) and International Electrotechnical Commission (IEC) equivalents. This year Standards and Standards solutions released by these two international organisations ranged from:
• ISO and the International Dairy Federation developing guidelines to help detect and prevent future adulterated milk products from entering the market (Milk, milk products and infant formulae – Guidelines for the quantitative determination of melamine and cyanuric acid by LC-MS/MS, ISO/TS 15495:2010 | IDF/RM 230:2010)
• an ISO Standard to help laboratories consistently detect potentially pathogenic Salmonella bacteria in water that supports the intent of a United Nations resolution on safe drinking water (Water quality – Detection of Salmonella spp ISO 19250:2010)
• an ISO/IEC Standard on business continuity management processes to improve security measures taken against hacking, denial of service, and malware attacks (Information technology – Security techniques – Guidelines for information and communication technology readiness for business continuity, ISO/IEC 27031:2011)
• an IEC Standard which is the first to cover all aspects of mobile phone chargers and will allow consumers to use a single one-fits-all charger with all new smartphones (Interoperability specifications of common external power supply (EPS) for use with data-enabled mobile telephones, IEC 62684:2011).
Standards New Zealand, as the national member of ISO and IEC, is an active participant in international Standards development. Through our participation we are able to share our expertise and knowledge in a number of areas, as well as ensure that New Zealand interests are considered.
We continued to prioritise our international activities and were able to maintain 100% voting compliance for New Zealand participating members for ISO and IEC technical committees in 2010 – 2011.
New Zealand participation in ISO and IEC committees
Total number of
committees
New Zealand involvement
Participant Observer
ISO
Technical Committees* 216 22 43
Subcommittees 537 44 45
IEC
Technical Committees* 94 11 44
Subcommittees 80 22 40
* Includes Joint Technical Committee 1 (JTC 1), a joint ISO and IEC initiative.
Our relationship with Standards Australia remained strong and we showed continued support for the preparation of joint Australian/New Zealand Standards. As part of our commitment, in 2010 – 2011 we initiated a project to review and update our records of New Zealand representation on joint committees.
10 STANDARDS COUNCIL | ANNUAL REPORT 2011
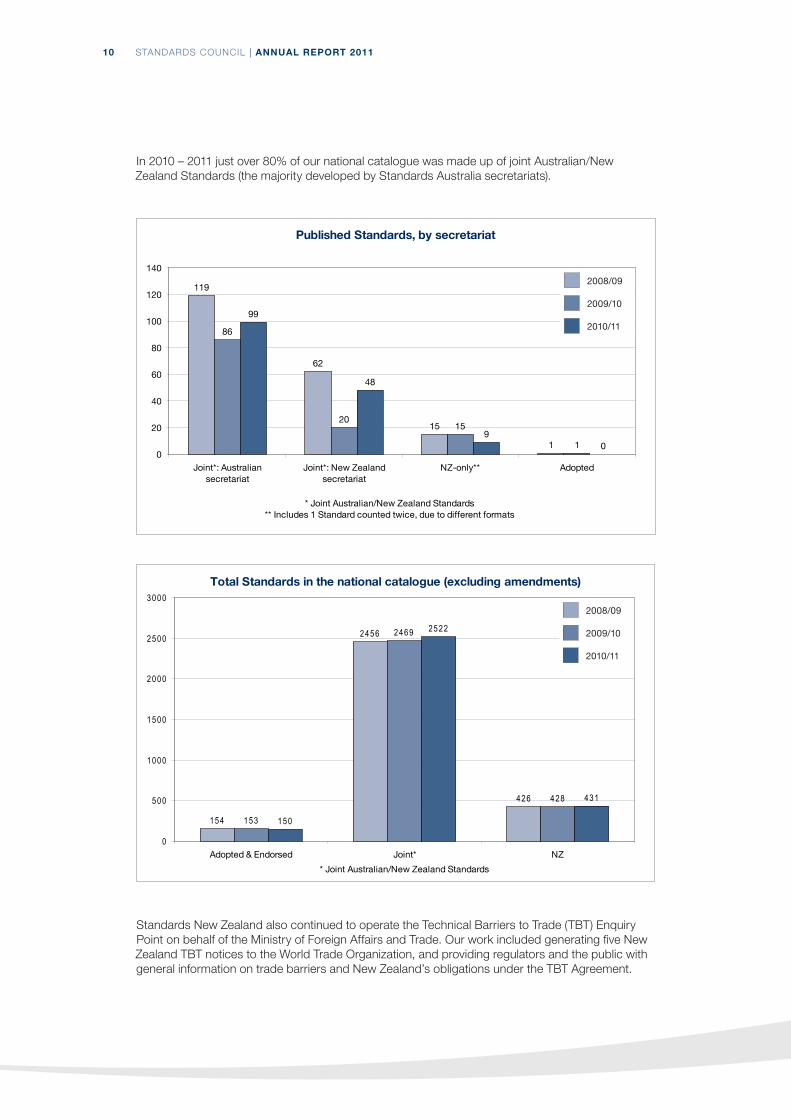
In 2010 – 2011 just over 80% of our national catalogue was made up of joint Australian/New Zealand Standards (the majority developed by Standards Australia secretariats).
Published Standards, by secretariat
119
62
15
1
86
2015
1
99
48
90
0
20
40
60
80
100
120
140
Joint*: Australiansecretariat
Joint*: New Zealandsecretariat
NZ-only** Adopted
* Joint Australian/New Zealand Standards** Includes 1 Standard counted twice, due to different formats
2008/09
2009/10
2010/11
Total Standards in the national catalogue (excluding amendments)
154
2456
426
153
2469
428
150
2522
431
0
500
1000
1500
2000
2500
3000
Adopted & Endorsed Joint* NZ
* Joint Australian/New Zealand Standards
2008/09
2009/10
2010/11
2008/09
2009/10
2010/11
2008/09
2009/10
2010/11
Standards New Zealand also continued to operate the Technical Barriers to Trade (TBT) Enquiry Point on behalf of the Ministry of Foreign Affairs and Trade. Our work included generating five New Zealand TBT notices to the World Trade Organization, and providing regulators and the public with general information on trade barriers and New Zealand’s obligations under the TBT Agreement.

11STANDARDS COUNCIL | ANNUAL REPORT 2011
1.6 SUSTAINABILITY UNDERPINNED BY CONTINUOUS IMPROVEMENT
As a not-for-profit, user-funded Crown entity we continued to ensure prudent financial management, application of more stringent business disciplines, and collaboration with key industry and government stakeholders.
We were the first to receive a full exemption from the Minister of Finance under s.143 of the Crown Entities Act 2004. This has led to streamlined accountability arrangements, and lower compliance and transaction effort with the Ministry of Economic Development and Audit New Zealand.
PROTECTING OUR INTELLECTUAL PROPERTYWe worked to ensure that our exclusive intellectual property rights were maintained under two government initiatives that would have eliminated our right to commercialise Standards copyright to recover operating costs. Both initiatives could have potentially put our sustainability at risk. This included an exemption for the Council from the Government’s Open Access and Licensing framework (NZGOAL) and protection of Standards copyright in clauses drafted for new legislation and the emerging Open Government programme.
MANAGING RISKSThis year we successfully implemented Phase 1 of our ISSP which involved the replacement of our ageing computer system. The project was delivered on time and within budget, with little interruption to the business or to the service provided to our customers and clients.
In 2010 – 2011 Standards New Zealand was recertified as compliant with AS/NZS ISO 9001:2008 Quality management systems – Requirements.
COMMITTED TO BEING A GOOD EMPLOYER Standards New Zealand has a strong focus on building and supporting a high-quality, diverse, and motivated staff.
We developed the Human Resources Plan of Action for 2011 – 2012 to ensure Standards New Zealand continues to be a quality employer and helps staff balance work demands with other parts of their lives. We have rigorous recruitment processes and a very thorough induction programme for new staff members. We have clear policies and procedures, well-established staff development programmes, and continue to strengthen coaching and mentoring within the organisation. We support staff to meet their family obligations with a flexible approach to working hours, work at home when required, and leave to meet individual needs especially in the case of staff or family illness.
Our health and safety committee works hard to maintain focus on a healthy and safe work environment. Earthquake preparedness has been an important focus over the past year.
This year we successfully implemented Phase 1 of our ISSP which involved the replacement of our ageing computer system. The project was delivered on time and within budget, with little interruption to the business or to the service provided to our customers and clients.
12 STANDARDS COUNCIL | ANNUAL REPORT 2011
Our employee code of conduct and relevant policies are available on our intranet and we regularly feature an organisational policy in our staff newsletter to ensure staff are up to date and familiar with expectations and good practice. We host regular meetings with full staff to communicate a wide range of information and the Senior Leadership Team works to be accessible and constructive in creating a positive and high-achieving workplace.
This year we offered additional professional development opportunities for staff, including training modules on regulatory frameworks, the role Standards play across sectors, and Standards development and processes. This programme has been well received and has offered staff the opportunity to share their expertise in specific areas of the business with their colleagues.
Our managers work with each staff member to identify and implement professional development programmes that meet the aims of the individual staff member and support our organisation’s goals. While the needs of each staff member may be different, we ensure equal access to development and promotion opportunities. This approach has meant that over the past year we have seen a number of staff take on new professional challenges in the workplace.
As part of our effort to recalibrate staffing levels to the operational resources of the organisation, we have had several unfilled full-time employee positions for 2010 – 2011. We recognise that the additional workload for remaining staff has had an impact on staff satisfaction and morale. We have made adjustments, including the recent hiring of additional staff. We have also worked with our teams to identify areas for improvement which will be guided by the Human Resources Plan of Action.
We seek to live out our organisation’s values – integrity, teamwork, professionalism, and dynamism – in all aspects of our work.
1.7 THE FUTUREStandards New Zealand has undertaken activities to support the Standards Council’s strategic priorities that were developed in 2010 – 2011. Below are a few key activities that began in 2010 – 2011 and represent our current and future work.
The National Standardisation Strategy work that began in 2010 – 2011 will continue into next year and will clarify the priorities and goals for standardisation in New Zealand. Economic research co-sponsored by Standards New Zealand, BRANZ, and the Construction Industry Council in 2011 will inform the strategy. Undertaken by BERL, the research will lead to a better understanding of the contributions of Standards to the New Zealand economy.
Much of our work is dependent on strong relationships with clients and expert committee members and their nominating organisations. In recognition of this, the Senior Leadership Team endorsed a volunteer participation strategy on 30 June 2011. Implementation of the strategy will assist in both the retention and recruitment of qualified committee members. We also continue to actively seek ways to support the rebuild efforts in Canterbury, including supporting our clients, customers, and committee members.
We continue to work with our clients to address their needs with the appropriate solution. An example of this was the work of a new Safety in the home guide for ACC. The development committee for this new resource, P 4102, worked throughout the first half of 2011 on content for the guide which was published in August 2011.
In June we began assessing providers for Phase 2 of our ISSP which will be focused on replacing ageing legacy systems to improve our e-service delivery.
Through these and other activities we are committed to supporting the Standards Council’s focus and outcomes by continuing to operate Standards New Zealand at optimal capability and capacity.
13STANDARDS COUNCIL | ANNUAL REPORT 2011
PART 2
PERFORMANCE MEASURES
2.1 STANDARDS COUNCIL OUTCOMES FRAMEWORK
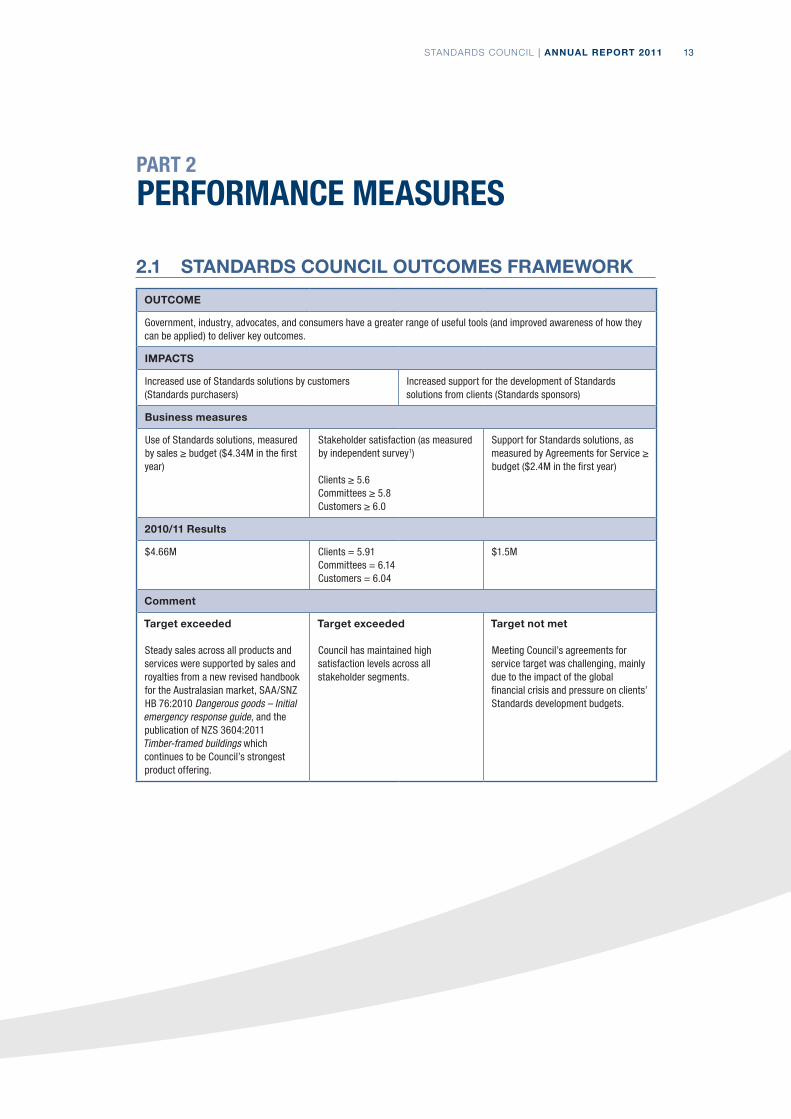
OUTCOME
Government, industry, advocates, and consumers have a greater range of useful tools (and improved awareness of how they can be applied) to deliver key outcomes.
IMPACTS
Increased use of Standards solutions by customers (Standards purchasers)
Increased support for the development of Standards solutions from clients (Standards sponsors)
Business measures
Use of Standards solutions, measured by sales ≥ budget ($4.34M in the first year)
Stakeholder satisfaction (as measured by independent survey1)
Clients ≥ 5.6Committees ≥ 5.8Customers ≥ 6.0
Support for Standards solutions, as measured by Agreements for Service ≥ budget ($2.4M in the first year)
2010/11 Results
$4.66M Clients = 5.91Committees = 6.14Customers = 6.04
$1.5M
Comment
Target exceeded
Steady sales across all products and services were supported by sales and royalties from a new revised handbook for the Australasian market, SAA/SNZ HB 76:2010 Dangerous goods – Initial emergency response guide, and the publication of NZS 3604:2011 Timber-framed buildings which continues to be Council’s strongest product offering.
Target exceeded
Council has maintained high satisfaction levels across all stakeholder segments.
Target not met
Meeting Council’s agreements for service target was challenging, mainly due to the impact of the global financial crisis and pressure on clients’ Standards development budgets.

14 STANDARDS COUNCIL | ANNUAL REPORT 2011
BUSINESS OBJECTIVE
The national Standards body’s resources are optimised to fulfil the organisation’s mission.
BUSINESS IMPACTS
The Standards Council’s financial sustainability is maintained
The Standards Council and the national Standards catalogue reflect international better practice
The Standards Council’s operational capability and capacity is well managed
Business measures
Net surplus ≥ budget ($165K)
Total financial reserves2 ≥ $2M
Proportion of the national Standards catalogue aligned with international Standards3 ≥ 44%
The StandardsCouncil is in theupper quartile forOECD countries’national Standardsbodies, basedon a combinationof pricecompetitivenessfor a key indicatorStandard4 andaverage cost, time,and consensuslevel for Standardsdevelopment in theprevious year
ISO 9001 certification is maintained by Standards New Zealand
Proportion of staff rating organisational leadership as positive5 ≥ 74%
2010/11 Results
$591K $2.97M 44% Within upper quartile
Certification maintained following Telarc audit
69.4%
Comment
Target exceeded
The Council’s surplus was the combined result of new distribution channels for the sale of Standards solutions; high levels of customer, client, and committee member satisfaction; an extended range of products and services; and effective cost management.
Target met Target met
National Standards continue to align to international Standards where appropriate.
Target met
Standards New Zealand’s pricing and Standards development practices remain well positioned internationally.
Target met Target not met
While overall staff satisfaction generally remains high, workload placed pressure on Standards New Zealand’s capacity during the year. Continuous improvement is being addressed through the Human Resources Plan of Action for 2011 – 2012.

15STANDARDS COUNCIL | ANNUAL REPORT 2011
Footnotes1. Customer and client satisfaction survey run by Andrew Fletcher Consulting annually. Methodology
includes qualitative and quantitative results, scored out of seven.
2. Represented by the total of ‘cash and cash equivalents’ and ‘short-term deposits’.
3. That is, Standards produced by the International Organization for Standardization (ISO), the International Electrotechnical Committee (IEC), and joint committees constituted by ISO and IEC.
4. Given its wide uptake, the national adoption of ISO 9001:2008 has been selected as the most appropriate indicator Standard. The price of a printed copy exclusive of membership discounts and sales taxes will be used for comparison.
5. As defined and measured in the JRA Ltd ‘Best Places to Work’ survey, common purpose section.
2.2 STATEMENT OF SERVICE PERFORMANCEThe Standards Council has been granted an exemption under section 143 of the Crown Entities Act 2004 from including its statement of service performance operational activity (outputs and associated measures) which is not directly funded (in whole or in part) by the Crown.
The Standards Council is a fully self-funded Crown entity, recovering its operating costs from third-party agreements for service, sale of publications, and sources of revenue other than direct appropriation, levies, fees, or charges prescribed by or under any Act.

16 STANDARDS COUNCIL | ANNUAL REPORT 2011
PART 3
FINANCIAL STATEMENTS
3.1 STANDARDS COUNCIL STATEMENT OF RESPONSIBILITY
Under the Crown Entities Act 2004, the Council is responsible for the preparation of the Standards Council's financial statements, and for the judgements made in them.
The Standards Council is responsible for establishing, and has established, a system of internal controls designed to provide reasonable assurance of the integrity and reliability of financial reporting.
In the Council's opinion, these financial statements fairly reflect the financial position and operations of the Standards Council for the year ended 30 June 2011.
Signed on behalf of the Council:
John Lumsden Chair Standards Council
Sharon Kletchko Member Standards Council
31 October 2011 Wellington, New Zealand
17STANDARDS COUNCIL | ANNUAL REPORT 2011
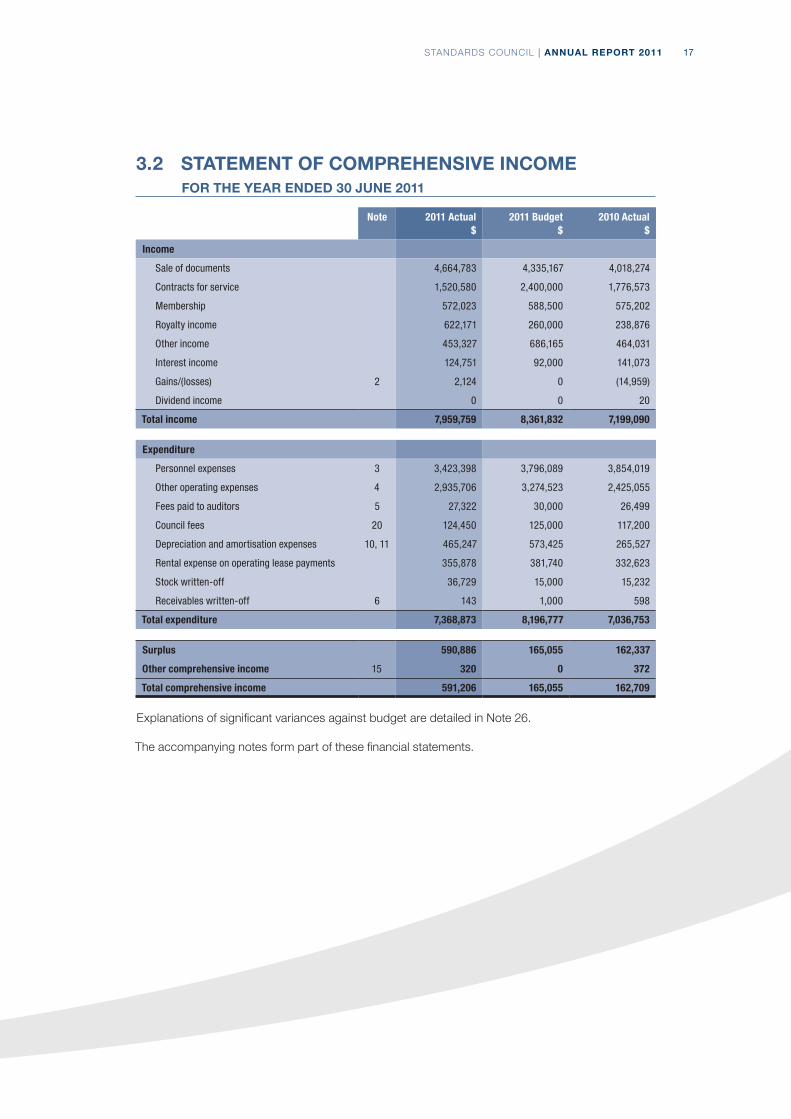
3.2 STATEMENT OF COMPREHENSIVE INCOME FOR THE YEAR ENDED 30 JUNE 2011
Note 2011 Actual$
2011 Budget$
2010 Actual$
Income
Sale of documents 4,664,783 4,335,167 4,018,274
Contracts for service 1,520,580 2,400,000 1,776,573
Membership 572,023 588,500 575,202
Royalty income 622,171 260,000 238,876
Other income 453,327 686,165 464,031
Interest income 124,751 92,000 141,073
Gains/(losses) 2 2,124 0 (14,959)
Dividend income 0 0 20
Total income 7,959,759 8,361,832 7,199,090
Expenditure
Personnel expenses 3 3,423,398 3,796,089 3,854,019
Other operating expenses 4 2,935,706 3,274,523 2,425,055
Fees paid to auditors 5 27,322 30,000 26,499
Council fees 20 124,450 125,000 117,200
Depreciation and amortisation expenses 10, 11 465,247 573,425 265,527
Rental expense on operating lease payments 355,878 381,740 332,623
Stock written-off 36,729 15,000 15,232
Receivables written-off 6 143 1,000 598
Total expenditure 7,368,873 8,196,777 7,036,753
Surplus 590,886 165,055 162,337
Other comprehensive income 15 320 0 372
Total comprehensive income 591,206 165,055 162,709
Explanations of significant variances against budget are detailed in Note 26.
The accompanying notes form part of these financial statements.

18 STANDARDS COUNCIL | ANNUAL REPORT 2011
3.3 STATEMENT OF FINANCIAL POSITION AS AT 30 JUNE 2011
Note 2011 Actual$
2011 Budget$
2010 Actual$
Assets
Current assets
Cash and cash equivalents 859,272 256,957 572,438
Debtors and other receivables 6 1,030,502 1,264,080 1,145,598
Prepayments 52,894 28,650 46,898
Inventories – stock of publications 7 91,478 102,590 71,060
Investments – short-term deposits 8 2,092,072 2,050,581 2,368,582
Total current assets 4,126,218 3,702,858 4,204,576
Non-current assets
Investment – shares 9 1,636 943 1,315
Property, plant, and equipment 10 157,647 348,152 129,369
Intangible assets 11 1,622,552 1,205,717 1,022,154
Total non-current assets 1,781,835 1,554,812 1,152,838
Total assets 5,908,053 5,257,670 5,357,414
Liabilities
Current liabilities
Creditors and other payables 12 445,214 523,336 647,009
Employee entitlements 13 673,460 596,172 564,594
Income in advance 847,016 645,133 801,076
Total current liabilities 1,965,690 1,764,641 2,012,679
Non-current liabilities
Employee entitlements 13 119,728 125,254 113,306
Provisions 14 133,000 133,000 133,000
Total non-current liabilities 252,728 258,254 246,306
Total liabilities 2,218,418 2,022,895 2,258,985
Net assets 3,689,635 3,234,775 3,098,429
Equity
General funds 15 3,688,614 3,234,446 3,097,728
Other reserves 15 1,021 329 701
Total equity 3,689,635 3,234,775 3,098,429
The accompanying notes form part of these financial statements.

19STANDARDS COUNCIL | ANNUAL REPORT 2011
3.4 STATEMENT OF CHANGES IN EQUITY FOR THE YEAR ENDED 30 JUNE 2011
Note 2011 Actual$
2011 Budget$
2010 Actual$
Balance at 1 July 3,098,429 3,069,720 2,935,720
Comprehensive income
Surplus 590,886 165,055 162,337
Other comprehensive income 320 0 372
Total comprehensive income 591,206 165,055 162,709
Balance at 30 June 15 3,689,635 3,234,775 3,098,429
The accompanying notes form part of these financial statements.
3.5 STATEMENT OF CASH FLOWS FOR THE YEAR ENDED 30 JUNE 2011
Note 2011 Actual$
2011 Budget$
2010 Actual$
Cash flows from operating activities
Receipts from customers 7,965,139 8,096,951 6,918,328
Interest received 136,675 91,961 137,648
Dividends received 0 39 20
Payments to suppliers (3,721,373) (3,991,306) (2,797,370)
Payments to employees (3,308,109) (3,756,450) (3,834,320)
Goods and services tax (net) 53,800 (19,881) (35,833)
Net cash flow from operating activities 16 1,126,132 421,314 388,473
Cash flows from investing activities
Receipts from sale of property, plant, and equipment 847 0 0
Receipts from investments – short-term deposits 276,510 458,000 367,805
Purchase of property, plant, and equipment (121,719) (359,143) (24,266)
Purchase of intangible assets (994,936) (560,196) (787,521)
Net cash flow from investing activities (839,298) (461,339) (443,982)
Cash flows from financing activities
Repayment of finance leases 0 0 0
Net cash flow from financing activities 0 0 0
Net increase/(decrease) in cash and cash equivalents 286,834 (40,025) (55,509)
Cash and cash equivalents at the beginning of the year 572,438 296,982 627,947
Cash and cash equivalents at the end of the year 859,272 256,957 572,438
The GST (net) component of cash flows from operating activities reflects the net GST paid to and received from the Inland Revenue Department.
The GST (net) component has been presented on a net basis, as the gross amounts do not provide meaningful information for financial statement purposes, and to be consistent with the presentation basis of the other primary financial statements.
The accompanying notes form an integral part of these financial statements.

20 STANDARDS COUNCIL | ANNUAL REPORT 2011
3.6 NOTES TO THE FINANCIAL STATEMENTS FOR THE YEAR ENDED 30 JUNE 2011
1 STATEMENT OF SIGNIFICANT ACCOUNTING POLICIES FOR THE YEAR ENDED 30 JUNE 2011
Reporting entityThe Standards Council (‘the Council’) is a Crown entity as defined by the Crown Entities Act 2004 and is domiciled in New Zealand. As such, the Council’s ultimate parent is the New Zealand Crown.
The Council’s primary objective is to develop Standards and to promote, encourage, and facilitate the use of Standards and other Standards solutions in New Zealand, which contribute to the health, safety, and social and economic well-being of New Zealanders, as opposed to that of making a financial return.
Accordingly, the Council has designated itself as a public benefit entity for the purposes of New Zealand Equivalents to International Financial Reporting Standards (NZ IFRS).
The Council operates a trading arm, Standards New Zealand, whose results are incorporated in these financial statements. The financial statements of the Council are for the year ended 30 June 2011. The financial statements were authorised for issue by the Council on 31 October 2011.
Basis of preparation
Statement of complianceThe financial statements of the Council have been prepared in accordance with the requirements of the Crown Entities Act 2004, which include the requirement to comply with New Zealand generally accepted accounting practices (NZ GAAP).
The financial statements comply with NZ IFRS, and other applicable financial reporting standards, as appropriate for public benefit entities.
Measurement baseThe financial statements have been prepared on a historical cost basis, except where modified by the revaluation of equity investments at fair value.
Functional and presentation currencyThe financial statements are presented in New Zealand dollars. The functional currency of the Council is New Zealand dollars.
Changes in accounting policiesThere have been no changes in accounting policies during the financial year.
Early adopted amendments to standardsThe following amendments to standards have been early adopted.
• NZ IFRS 7 Financial Instruments: Disclosures – The effect of early adopting these amendments is the following information is no longer disclosed:
– the carrying amount of financial assets that would otherwise be past due or impaired whose terms have been renegotiated
– the maximum exposure to credit risk by class of financial instrument if the maximum credit risk exposure is best represented by their carrying amount.

21STANDARDS COUNCIL | ANNUAL REPORT 2011
Standards, amendments, and interpretations issued that are not yet effective and have not been early adoptedStandards, amendments, and interpretations issued but not yet effective that have not been early adopted, and which are relevant to the Council include the following:
• NZ IAS 24 Related Party Disclosures (revised 2009) replaces NZ IAS 24 Related Party Disclosures (issued 2004) and is effective for reporting periods commencing on or after 1 January 2011. The revised standard:
– removes the previous disclosure concessions applied by the Council for arms-length transactions between the Council and entities controlled or significantly influenced by the Crown. The effect of the revised standard is that more information is required to be disclosed about transactions between the Council and entities controlled or significantly influenced by the Crown
– provides clarity on the disclosure of related party transactions with Ministers of the Crown. Further, with the exception of the Minister of Commerce, the Council will be provided with an exemption from certain disclosure requirements relating to transactions with other Ministers of the Crown. The clarification could result in additional disclosures should there be any related party transactions with Ministers of the Crown
– clarifies that related party transactions include commitments with related parties.
The Council expects the new standard will not be early adopted.
• NZ IFRS 9 Financial Instruments will eventually replace NZ IAS 39 Financial Instruments: Recognition and Measurement. NZ IAS 39 is being replaced through the following three main phases: Phase 1 Classification and measurement, Phase 2 Impairment methodology, and Phase 3 Hedge accounting. Phase 1 has been completed and has been published in the new financial instrument standard NZ IFRS 9. NZ IFRS 9 uses a single approach to determine whether a financial asset is measured at amortised cost or fair value, replacing the many different rules in NZ IAS 39. The approach in NZ IFRS 9 is based on how an entity manages its financial assets (its business model) and the contractual cash flow characteristics of the financial assets. The financial liability requirements are the same as those of NZ IAS 39, except for when an entity elects to designate a financial liability at fair value through the surplus/deficit. The new standard is required to be adopted for the year ended 30 June 2014. The Council has not yet assessed the effect of the new standard and expects it will not be early adopted.
Significant accounting policies
RevenueRevenue is measured at the fair value of consideration received or receivable.
Sale of documentsSale of documents is recognised when the product is sold to the customer.
Contracts for serviceContract for service income is initially recorded as income in advance, and recognised as revenue when earned.
Membership subscriptionsMembership subscriptions are recognised on a straight-line basis over the period of the subscription.
InterestInterest income is recognised using the effective interest method.

22 STANDARDS COUNCIL | ANNUAL REPORT 2011
RoyaltiesRoyalty income is recognised on an accrual basis in accordance with the substance of the relevant agreement.
DividendsDividends are recognised when the Council’s right to receive payment is established.
Volunteer servicesThe work of the Council is dependent on many people providing voluntary services towards the development of Standards. Volunteer services received are not recognised as revenue as the Council is unable to reliably measure the fair value of the services rendered.
Leases
Operating leasesLeases that do not transfer substantially all the risks and rewards incidental to ownership of an asset to the Council are classified as operating leases. Lease payments under an operating lease are recognised as an expense on a straight-line basis over the term of the lease in the surplus or deficit.
Income taxThe Council is a public authority and consequently is exempt from the payment of income tax. Accordingly, no charge for income tax has been provided for.
Cash and cash equivalentsCash and cash equivalents include cash on hand, deposits held at call with banks, other short-term highly liquid investments with original maturities of less than 3 months.
Debtors and other receivablesDebtors and other receivables are initially measured at fair value and subsequently measured at amortised cost using the effective interest rate method, less any provision for impairment.
Impairment of a receivable is established when there is objective evidence that the Council will not be able to collect amounts due according to the original terms of the receivable. Significant financial difficulties of the debtor, probability that the debtor will enter into bankruptcy, and default in payments are indicators that the debtor is impaired. The amount of the impairment is the difference between the asset’s carrying amount and the present value of estimated future cash flows, discounted using the original effective interest rate. The carrying amount of the asset is reduced through the use of an allowance account, and the amount of the loss is recognised in the surplus or deficit. When the receivable is uncollectible, it is written-off against the allowance account for receivables. Overdue receivables that have been renegotiated are reclassified as current (that is, not past due).
Inventories – stock of publications Inventories held for sale on a commercial basis are valued at the lower of cost and net realisable value. The cost of inventory is determined using the weighted average cost method.
The write-down from cost to net realisable value is recognised in the surplus or deficit in the period when the write-down occurs.

23STANDARDS COUNCIL | ANNUAL REPORT 2011
InvestmentsAt each balance sheet date the Council assesses whether there is any objective evidence that an investment is impaired.
Short-term depositsInvestments in bank deposits are initially measured at fair value plus transaction costs.
After initial recognition, investments in bank deposits are measured at amortised cost using the effective interest method.
For bank deposits, impairment is established when there is objective evidence that the Council will not be able to collect amounts due according to the original terms of the deposit. Significant financial difficulties of the bank, probability that the bank will enter into bankruptcy, and default in payments are indicators that the deposit is impaired.
Equity investmentsThe Council designates equity investments at fair value through other comprehensive income. Equity investments are initially measured at fair value plus transaction costs.
After initial recognition these investments are measured at their fair value. The gains and losses of equity investments are recognised in other comprehensive income, except for impairment losses, which are recognised in the surplus or deficit.
On derecognition, the cumulative gain or loss previously recognised in other comprehensive income, is reclassified from equity to the surplus or deficit.
For equity investments classified as fair value through other comprehensive income, a significant or prolonged decline in the fair value of the investment below its cost is considered an indicator of impairment. If such evidence exists for investments at fair value through other comprehensive income, the cumulative loss is measured as the difference between the acquisition cost and the current fair value, less any impairment loss on that financial asset previously recognised in the surplus or deficit. This cumulative loss, recognised in other comprehensive income is reclassified from equity to the surplus or deficit. Impairment losses recognised in the surplus or deficit are not reversed through the surplus or deficit.
Property, plant, and equipmentProperty, plant, and equipment consists of office equipment, computer hardware, leasehold improvements, heating and ventilation, and telephone systems.
Property, plant, and equipment are shown at cost, less any accumulated depreciation and impairment losses.
AdditionsThe cost of an item of property, plant, and equipment is recorded as an asset only when it is probable that future economic benefits or service potential associated with the item will flow to the Council and the cost of the item can be measured reliably.
DisposalsGains and losses on disposals are determined by comparing the proceeds with the carrying amount of the asset. Gains and losses on disposals are reported net in the surplus or deficit.
Subsequent costsCost incurred subsequent to initial acquisition is capitalised only when it is probable that future economic benefits or service potential associated with the item will flow to the Council and the costs of the item can be measured reliably.

24 STANDARDS COUNCIL | ANNUAL REPORT 2011
The costs of day-to-day servicing of property, plant, and equipment are recognised in the surplus or deficit as they are incurred.
DepreciationDepreciation is provided on a straight-line basis on all property, plant, and equipment at rates that will write-off the cost of the assets to their estimated residual values over their useful lives. The useful lives and associated depreciation rates of major classes of assets have been estimated as follows:
Office equipment 5 – 10 years 10% – 20%
Computer hardware 3 years 33.33%
Leasehold improvements 3 – 12 years 8.33% – 40%
Heating & ventilation 10 – 12 years 8.33% – 10%
Telephone systems 3 – 12 years 8.33% – 33.33%
Leasehold improvements are depreciated over the unexpired period of the lease or the estimated remaining useful lives of the improvements, whichever is the shorter.
The residual value and useful life of an asset is reviewed, and adjusted if applicable, at each financial year-end.
Intangible assets
Software acquisitionAcquired computer software licences are capitalised on the basis of the costs incurred to acquire and bring to use the specific software.
Cost associated with maintaining computer software is recognised as an expense when incurred.
As the Council’s website will generate economic benefits in the future all external costs associated with the development of software for the Council’s website are recognised as an intangible asset.
Self-funded StandardsThe costs incurred in the development of a Standard in excess of the contracted value for the services, if any, are capitalised as an intangible asset. An intangible asset is only created if it is probable that the asset will generate future economic benefits. The future economic benefit is the revenue expected to be generated from the future sale of the Standard.
Costs that are directly associated with the development of self-funded Standards include external costs, employee costs, and an appropriate portion of relevant overheads.
AmortisationThe carrying value of computer software with a finite life is amortised on a straight-line basis over its useful life. The carrying value of a self-funded Standard is amortised on a diminishing value basis over its useful life. Amortisation begins when the asset is available for use and ceases at the date that the asset is derecognised. The amortisation charge for each period is recognised in the surplus or deficit.
The useful lives and associated amortisation rates of major classes of intangible assets have been estimated as follows:
Acquired computer software 3 – 5 years 20% – 33.33% SL
Self-funded Standards 50.00% DV
25STANDARDS COUNCIL | ANNUAL REPORT 2011
Impairment of non-financial assetsProperty, plant, and equipment and intangible assets that have a finite useful life are reviewed for impairment whenever events or changes in circumstances indicate that the carrying amount may not be recoverable. An impairment loss is recognised for the amount by which the asset’s carrying amount exceeds its recoverable amount. The recoverable amount is the higher of an asset’s fair value less costs to sell and value in use.
Value in use is depreciated replacement cost for an asset where the future economic benefits or service potential of the asset are not primarily dependent on the asset’s ability to generate net cash inflows and where the Council would, if deprived of the asset, replace its remaining future economic benefits or service potential.
If an asset’s carrying amount exceeds its recoverable amount, the asset is impaired and the carrying amount is written down to the recoverable amount. The total impairment loss is recognised in the surplus or deficit. The reversal of an impairment loss is recognised in the surplus or deficit.
Creditors and other payablesCreditors and other payables are initially measured at fair value and subsequently measured at amortised cost using the effective interest method.
Employee entitlements
Short-term employee entitlementsEmployee entitlements that the Council expects to be settled within 12 months of balance date are measured at undiscounted nominal values based on accrued entitlements at current rates of pay.
These include salaries and wages accrued up to balance date, annual leave earned but not yet taken at balance date, retiring and long service leave entitlements expected to be settled within 12 months, and sick leave.
The Council recognises a liability for sick leave to the extent that compensated absences in the coming year are expected to be greater than the sick leave entitlements earned in the coming year. The amount is calculated based on the unused sick leave entitlement that can be carried forward at balance date, to the extent that the Council anticipates it will be used by staff to cover those future absences.
The Council recognises a liability and an expense for bonuses where it is contractually obliged to pay them, or where there is a past practice that has created a constructive obligation.
Long-term employee benefitsEntitlements that are payable beyond 12 months, such as long service leave and retiring leave, have been calculated on an actuarial basis.
The calculations are based on:
• likely future entitlements accruing to staff, based on years of service, years to entitlement, the likelihood that staff will reach the point of entitlement, and contractual entitlements information, and
• the present value of the estimated future cash flows.
The discount rate is based on the weighted average of interest rates for government stock with terms to maturity similar to those of the relevant liabilities. The inflation factor is based on the expected long-term increase in remuneration for employees.
26 STANDARDS COUNCIL | ANNUAL REPORT 2011
Superannuation schemes
Defined contribution schemesObligations for contributions to KiwiSaver are accounted for as a defined contribution superannuation scheme and are recognised as an expense in the surplus or deficit as incurred.
ProvisionsThe Council recognises a provision for future expenditure of uncertain amount or timing when there is a present obligation (either legal or constructive) as a result of a past event, it is probable that expenditures will be required to settle the obligation, and a reliable estimate can be made of the amount of the obligation.
Foreign currency transactionsForeign currency transactions are translated into New Zealand dollars using the exchange rates prevailing at the dates of the transactions. Foreign exchange gains and losses resulting from the settlement of such transactions and from the translation at year-end exchange rates of monetary assets and liabilities denominated in foreign currencies are recognised in the surplus or deficit.
Goods and services tax (GST)All items in the financial statements, are stated exclusive of GST, except for receivables and payables, which are stated on a GST-inclusive basis. Where GST is not recoverable as input tax, then it is recognised as part of the related asset or expense.
The net amount of GST recoverable from, or payable to, the Inland Revenue Department (IRD) is included as part of receivables or payables in the Statement of Financial Position.
The net GST paid to, or received from the IRD, including the GST relating to investing and financing activities, is classified as an operating cash flow in the Statement of Cash Flows.
Commitments and contingencies are disclosed exclusive of GST.
Budget figuresThe budget figures are derived from the Statement of Intent as approved by the Council at the beginning of the financial year. The budget figures have been prepared in accordance with NZ IFRS, using accounting policies that are consistent with those adopted by the Council for the preparation of the financial statements.
Critical accounting estimates and assumptionsIn preparing these financial statements the Council has made estimates and assumptions about the future. These estimates and assumptions may differ from the subsequent actual results. Estimates and judgements are continually evaluated and are based on historical experience and other factors, including expectations of future events that are believed to be reasonable under the circumstances. The estimates and assumptions that have a significant risk of causing a material adjustment to the carrying amounts of assets and liabilities within the next financial year are discussed below.
Leasehold restoration provisionAn analysis of the Council’s exposure surrounding the leasehold restoration provision is disclosed in Note 14.
Retirement and long service leaveNote 13 provides an analysis of the exposure in relation to estimates and uncertainties surrounding retirement and long service leave liabilities.

27STANDARDS COUNCIL | ANNUAL REPORT 2011
Property, plant, and equipment – useful lives and residual valuesWe have reviewed the useful lives and residual value of the property, plant, and equipment. Assessing the appropriateness of useful life and residual value estimates of property, plant, and equipment requires the Council to consider a number of factors such as the physical condition of the asset, expected period of use of the asset by the Council, and expected disposal proceeds from the future sale of the asset.
An incorrect estimate of the useful life or residual value will impact on the depreciation expense recognised in the surplus or deficit, and the carrying amount of the asset in the Statement of Financial Position.
The Council minimises the risk of this estimation uncertainty by:
• physical inspection of assets, and
• asset replacement programmes.
The Council has not made significant changes to past assumptions on useful lives and residual values. The carrying amounts of property, plant, and equipment are disclosed in Note 10.
Intangible assets – useful lives and residual valuesAt each balance date the Council reviews the useful lives and residual value of its intangible assets, computer software, and self-funded Standards.
Assessing the appropriateness of useful life and residual value estimates of intangible assets requires the Council to consider a number of factors such as the expected period of use of the intangible asset by the Council, and the expected future economic benefit of the intangible asset.
An incorrect estimate of the useful life or residual value will impact on the amortisation expense recognised in the surplus or deficit, and the carrying amount of the intangible asset in the Statement of Financial Position.
The Council has not made significant changes to past assumptions on useful lives, amortisation rates, and residual values.
The carrying amounts of intangible assets are disclosed in Note 11.
2 GAINS/(LOSSES)
2011 $
2010 $
Net gain/(loss) on disposal of office equipment (303) (5,783)
Net gain/(loss) on disposal of computer equipment (278) 0
Net gain/(loss) on write-off of self-funded Standards (5,603) (9,926)
Net foreign exchange gain/(loss) 8,308 750
Total gains/(losses) 2,124 (14,959)
3 PERSONNEL EXPENSES
2011 $
2010 $
Salaries and wages 3,259,643 3,781,992
Employer contributions to defined contribution plans 48,467 52,328
Increase/(decrease) in employee entitlements (Note 13) 115,288 19,699
Total personnel expenses 3,423,398 3,854,019
Employer contributions to defined contribution plans include contributions to KiwiSaver.
28 STANDARDS COUNCIL | ANNUAL REPORT 2011
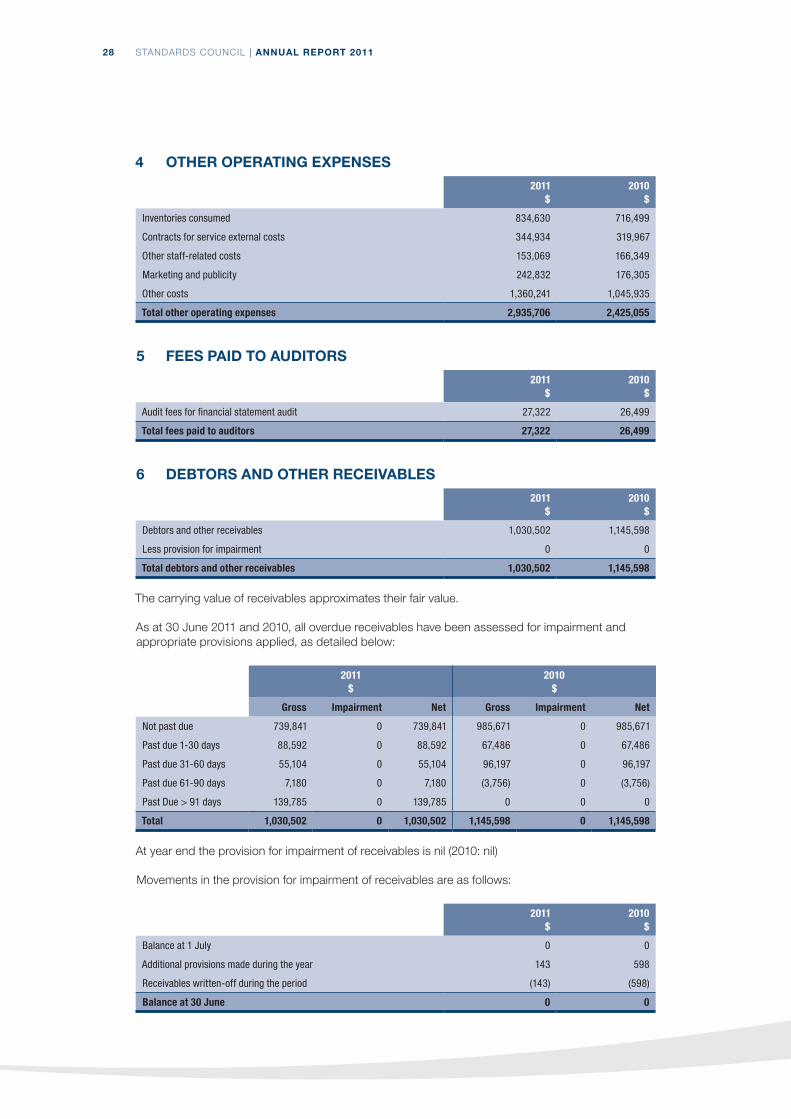
4 OTHER OPERATING EXPENSES
2011 $
2010 $
Inventories consumed 834,630 716,499
Contracts for service external costs 344,934 319,967
Other staff-related costs 153,069 166,349
Marketing and publicity 242,832 176,305
Other costs 1,360,241 1,045,935
Total other operating expenses 2,935,706 2,425,055
5 FEES PAID TO AUDITORS
2011 $
2010 $
Audit fees for financial statement audit 27,322 26,499
Total fees paid to auditors 27,322 26,499
6 DEBTORS AND OTHER RECEIVABLES
2011 $
2010 $
Debtors and other receivables 1,030,502 1,145,598
Less provision for impairment 0 0
Total debtors and other receivables 1,030,502 1,145,598
The carrying value of receivables approximates their fair value.
As at 30 June 2011 and 2010, all overdue receivables have been assessed for impairment and appropriate provisions applied, as detailed below:
2011 $
2010 $
Gross Impairment Net Gross Impairment Net
Not past due 739,841 0 739,841 985,671 0 985,671
Past due 1-30 days 88,592 0 88,592 67,486 0 67,486
Past due 31-60 days 55,104 0 55,104 96,197 0 96,197
Past due 61-90 days 7,180 0 7,180 (3,756) 0 (3,756)
Past Due > 91 days 139,785 0 139,785 0 0 0
Total 1,030,502 0 1,030,502 1,145,598 0 1,145,598
At year end the provision for impairment of receivables is nil (2010: nil)
Movements in the provision for impairment of receivables are as follows:
2011 $
2010 $
Balance at 1 July 0 0
Additional provisions made during the year 143 598
Receivables written-off during the period (143) (598)
Balance at 30 June 0 0

29STANDARDS COUNCIL | ANNUAL REPORT 2011
7 INVENTORIES – STOCK OF PUBLICATIONS
2011 $
2010 $
Publications held for sale 91,478 71,060
Total inventories 91,478 71,060
The write-down of commercial inventories amounted to $36,729 (2010: $15,232).
There have been no reversals of write-downs.
No inventories are pledged as security for liabilities; however some inventories are subject to retention of title clauses.
8 INVESTMENTS – SHORT-TERM DEPOSITSInvestments – short-term deposits are represented by short-term deposits which have maturities of 3 to 12 months from date of acquisition.
There were no impairment provisions for short-term deposits.
Maturity analysis and effective interest rates of short-term depositsThe maturity dates and weighted average effective interest rates for short-term deposits are as follows.
2011 $
2010 $
Short-term deposits with maturities of 3-12 months 2,092,072 2,368,582
Average maturity 158 days 163 days
Weighted average effective interest rates 4.60% 4.76%
The carrying amounts of short-term deposits with maturities less than 12 months approximate their fair value.
Short-term deposits are invested at fixed rates ranging from 3.62% to 5.10% (2010: 4.50% to 5.00%). As these deposits are at a fixed interest rate and measured at amortised cost, an increase or decrease in interest rates during the period would not impact on the surplus or deficit, or equity.
9 INVESTMENT – SHARESThe fair value of equity investments is determined by reference to published price quotations in an active market.
Original cost$
Fair value$
2011
SAI Global Ltd – 266 ordinary shares 615 1,636
2010
SAI Global Ltd – 266 ordinary shares 615 1,315
30 STANDARDS COUNCIL | ANNUAL REPORT 2011
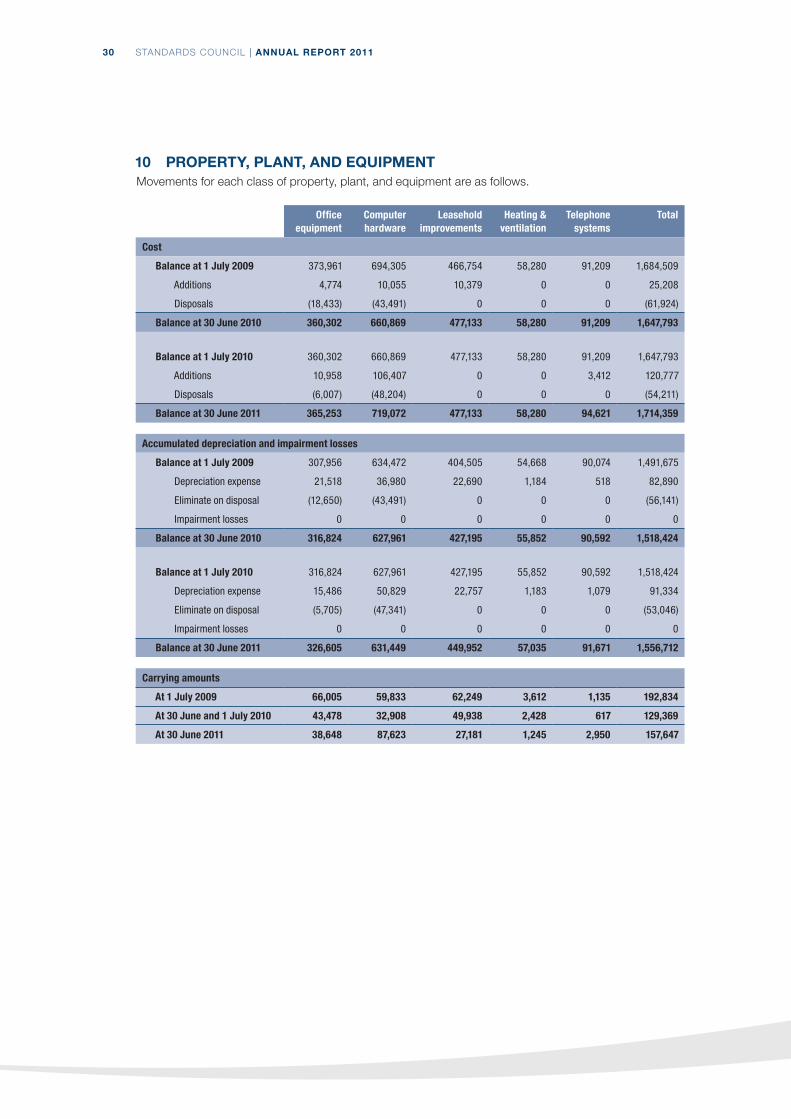
10 PROPERTY, PLANT, AND EQUIPMENTMovements for each class of property, plant, and equipment are as follows.
Officeequipment
Computer hardware
Leaseholdimprovements
Heating & ventilation
Telephonesystems
Total
Cost
Balance at 1 July 2009 373,961 694,305 466,754 58,280 91,209 1,684,509
Additions 4,774 10,055 10,379 0 0 25,208
Disposals (18,433) (43,491) 0 0 0 (61,924)
Balance at 30 June 2010 360,302 660,869 477,133 58,280 91,209 1,647,793
Balance at 1 July 2010 360,302 660,869 477,133 58,280 91,209 1,647,793
Additions 10,958 106,407 0 0 3,412 120,777
Disposals (6,007) (48,204) 0 0 0 (54,211)
Balance at 30 June 2011 365,253 719,072 477,133 58,280 94,621 1,714,359
Accumulated depreciation and impairment losses
Balance at 1 July 2009 307,956 634,472 404,505 54,668 90,074 1,491,675
Depreciation expense 21,518 36,980 22,690 1,184 518 82,890
Eliminate on disposal (12,650) (43,491) 0 0 0 (56,141)
Impairment losses 0 0 0 0 0 0
Balance at 30 June 2010 316,824 627,961 427,195 55,852 90,592 1,518,424
Balance at 1 July 2010 316,824 627,961 427,195 55,852 90,592 1,518,424
Depreciation expense 15,486 50,829 22,757 1,183 1,079 91,334
Eliminate on disposal (5,705) (47,341) 0 0 0 (53,046)
Impairment losses 0 0 0 0 0 0
Balance at 30 June 2011 326,605 631,449 449,952 57,035 91,671 1,556,712
Carrying amounts
At 1 July 2009 66,005 59,833 62,249 3,612 1,135 192,834
At 30 June and 1 July 2010 43,478 32,908 49,938 2,428 617 129,369
At 30 June 2011 38,648 87,623 27,181 1,245 2,950 157,647

31STANDARDS COUNCIL | ANNUAL REPORT 2011
11 INTANGIBLE ASSETSMovements for each class of intangible asset are as follows.
Acquiredcomputersoftware
Work in progress
computersoftware
Self-fundedStandards
Work in progress
self-funded Standards
Total
Cost
Balance at 1 July 2009 1,622,587 0 959,095 81,076 2,662,758
Additions 195,963 337,947 0 234,309 768,219
Disposals (356,556) 0 (142,731) 0 (499,287)
Balance at 30 June 2010 1,461,994 337,947 816,364 315,385 2,931,690
Balance at 1 July 2010 1,461,994 337,947 816,364 315,385 2,931,690
Additions/transfers 968,092 (337,947) 601,254 (251,224) 980,175
Disposals (36,497) 0 (172,849) 0 (209,346)
Balance at 30 June 2011 2,393,589 0 1,244,769 64,161 3,702,519
Accumulated amortisation and impairment losses
Balance at 1 July 2009 1,431,817 0 784,443 0 2,216,260
Amortisation expense 95,325 0 87,312 0 182,637
Eliminate on disposal (356,556) 0 (132,805) 0 (489,361)
Impairment losses 0 0 0 0 0
Balance at 30 June 2010 1,170,586 0 738,950 0 1,909,536
Balance at 1 July 2010 1,170,586 0 738,950 0 1,909,536
Amortisation expense 194,978 0 178,935 0 373,913
Eliminate on disposal (36,236) 0 (167,246) 0 (203,482)
Impairment losses 0 0 0 0 0
Balance at 30 June 2011 1,329,328 0 750,639 0 2,079,967
Carrying amounts
At 1 July 2009 190,770 0 174,652 81,076 446,498
At 30 June and 1 July 2010 291,408 337,947 77,414 315,385 1,022,154
At 30 June 2011 1,064,261 0 494,130 64,161 1,622,552
There are no restrictions over the title of the Council’s intangible assets, nor are any intangible assets pledged as security for liabilities.
12 CREDITORS AND OTHER PAYABLES
2011 $
2010 $
Creditors 285,333 394,172
Accrued expenses 74,099 197,847
GST payable 85,782 54,990
Total creditors and other payables 445,214 647,009
Creditors and other payables are non-interest bearing and are normally settled on 30-day terms. Therefore the carrying value of creditors and other payables approximates their fair values.
32 STANDARDS COUNCIL | ANNUAL REPORT 2011
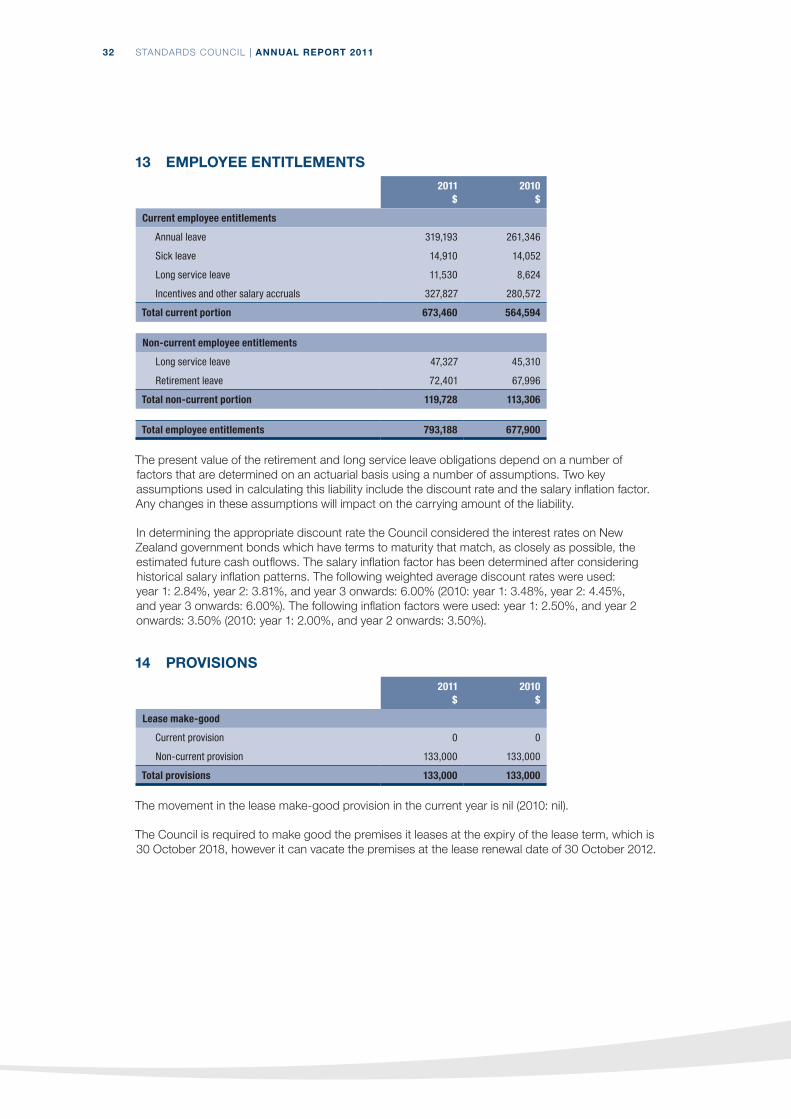
13 EMPLOYEE ENTITLEMENTS
2011 $
2010 $
Current employee entitlements
Annual leave 319,193 261,346
Sick leave 14,910 14,052
Long service leave 11,530 8,624
Incentives and other salary accruals 327,827 280,572
Total current portion 673,460 564,594
Non-current employee entitlements
Long service leave 47,327 45,310
Retirement leave 72,401 67,996
Total non-current portion 119,728 113,306
Total employee entitlements 793,188 677,900
The present value of the retirement and long service leave obligations depend on a number of factors that are determined on an actuarial basis using a number of assumptions. Two key assumptions used in calculating this liability include the discount rate and the salary inflation factor. Any changes in these assumptions will impact on the carrying amount of the liability.
In determining the appropriate discount rate the Council considered the interest rates on New Zealand government bonds which have terms to maturity that match, as closely as possible, the estimated future cash outflows. The salary inflation factor has been determined after considering historical salary inflation patterns. The following weighted average discount rates were used: year 1: 2.84%, year 2: 3.81%, and year 3 onwards: 6.00% (2010: year 1: 3.48%, year 2: 4.45%, and year 3 onwards: 6.00%). The following inflation factors were used: year 1: 2.50%, and year 2 onwards: 3.50% (2010: year 1: 2.00%, and year 2 onwards: 3.50%).
14 PROVISIONS
2011 $
2010 $
Lease make-good
Current provision 0 0
Non-current provision 133,000 133,000
Total provisions 133,000 133,000
The movement in the lease make-good provision in the current year is nil (2010: nil).
The Council is required to make good the premises it leases at the expiry of the lease term, which is 30 October 2018, however it can vacate the premises at the lease renewal date of 30 October 2012.
33STANDARDS COUNCIL | ANNUAL REPORT 2011
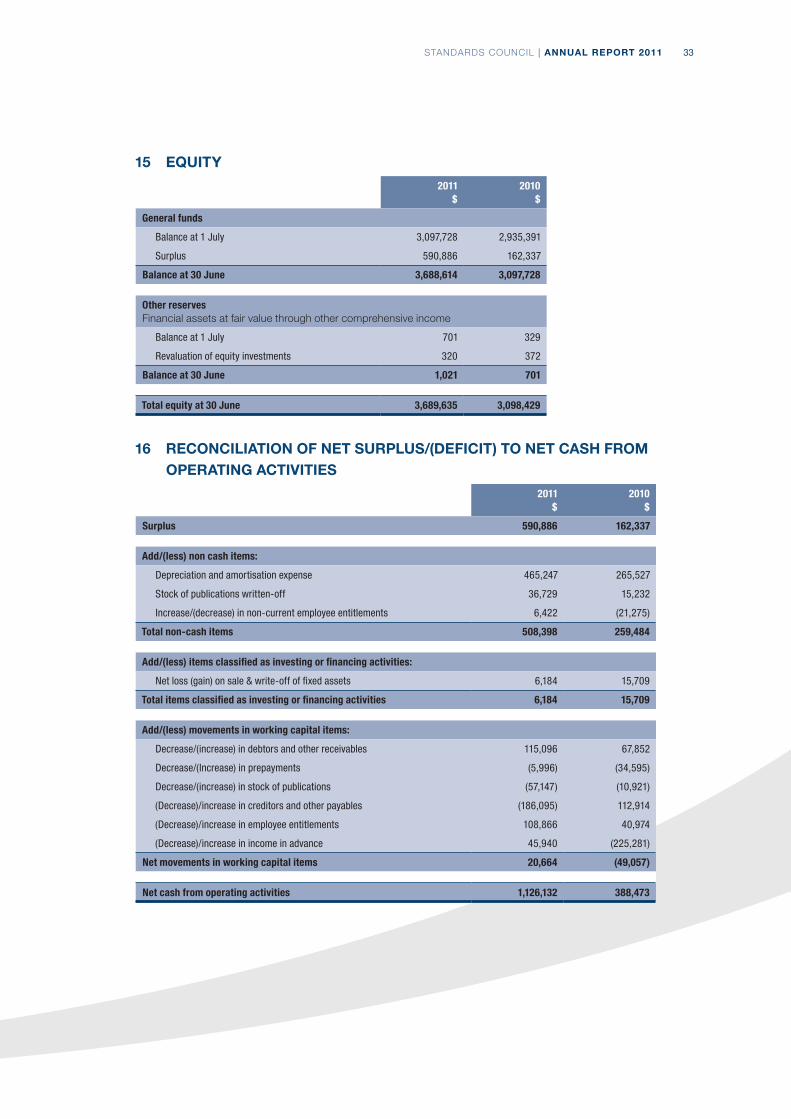
15 EQUITY
2011 $
2010 $
General funds
Balance at 1 July 3,097,728 2,935,391
Surplus 590,886 162,337
Balance at 30 June 3,688,614 3,097,728
Other reserves Financial assets at fair value through other comprehensive income
Balance at 1 July 701 329
Revaluation of equity investments 320 372
Balance at 30 June 1,021 701
Total equity at 30 June 3,689,635 3,098,429
16 RECONCILIATION OF NET SURPLUS/(DEFICIT) TO NET CASH FROM OPERATING ACTIVITIES
2011 $
2010 $
Surplus 590,886 162,337
Add/(less) non cash items:
Depreciation and amortisation expense 465,247 265,527
Stock of publications written-off 36,729 15,232
Increase/(decrease) in non-current employee entitlements 6,422 (21,275)
Total non-cash items 508,398 259,484
Add/(less) items classified as investing or financing activities:
Net loss (gain) on sale & write-off of fixed assets 6,184 15,709
Total items classified as investing or financing activities 6,184 15,709
Add/(less) movements in working capital items:
Decrease/(increase) in debtors and other receivables 115,096 67,852
Decrease/(Increase) in prepayments (5,996) (34,595)
Decrease/(increase) in stock of publications (57,147) (10,921)
(Decrease)/increase in creditors and other payables (186,095) 112,914
(Decrease)/increase in employee entitlements 108,866 40,974
(Decrease)/increase in income in advance 45,940 (225,281)
Net movements in working capital items 20,664 (49,057)
Net cash from operating activities 1,126,132 388,473
34 STANDARDS COUNCIL | ANNUAL REPORT 2011
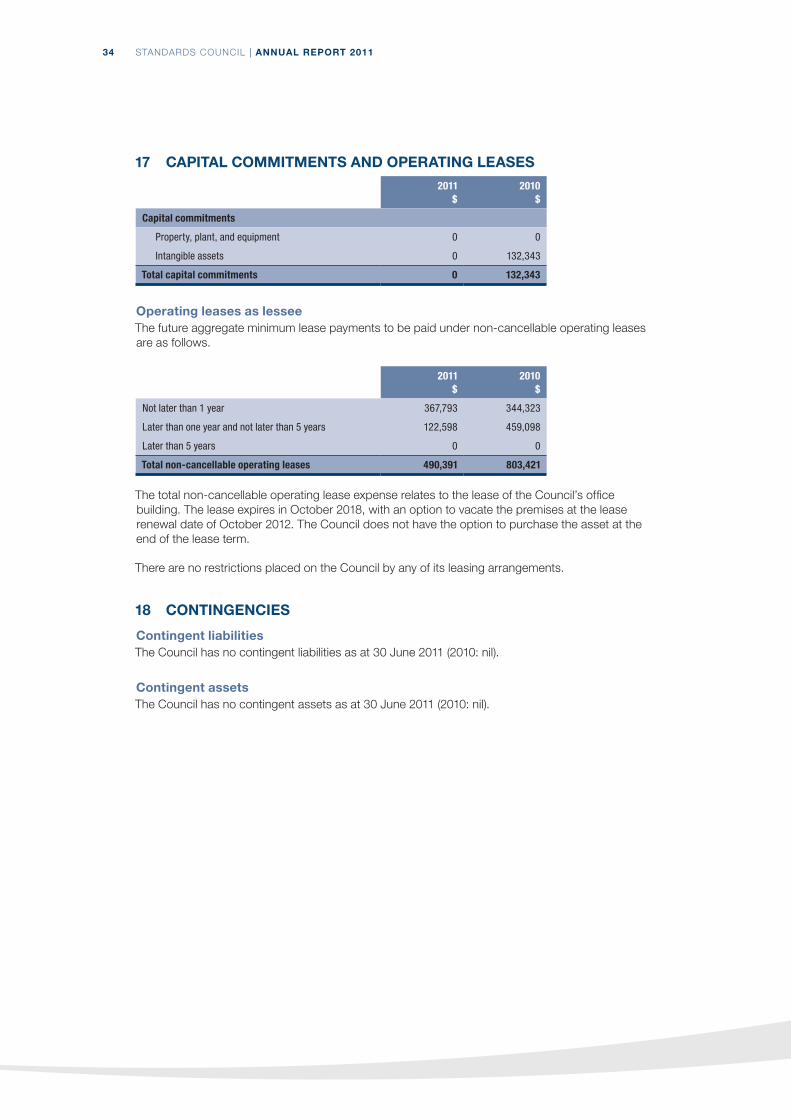
17 CAPITAL COMMITMENTS AND OPERATING LEASES
2011 $
2010 $
Capital commitments
Property, plant, and equipment 0 0
Intangible assets 0 132,343
Total capital commitments 0 132,343
Operating leases as lesseeThe future aggregate minimum lease payments to be paid under non-cancellable operating leases are as follows.
2011 $
2010 $
Not later than 1 year 367,793 344,323
Later than one year and not later than 5 years 122,598 459,098
Later than 5 years 0 0
Total non-cancellable operating leases 490,391 803,421
The total non-cancellable operating lease expense relates to the lease of the Council’s office building. The lease expires in October 2018, with an option to vacate the premises at the lease renewal date of October 2012. The Council does not have the option to purchase the asset at the end of the lease term.
There are no restrictions placed on the Council by any of its leasing arrangements.
18 CONTINGENCIES
Contingent liabilitiesThe Council has no contingent liabilities as at 30 June 2011 (2010: nil).
Contingent assetsThe Council has no contingent assets as at 30 June 2011 (2010: nil).

35STANDARDS COUNCIL | ANNUAL REPORT 2011
19 RELATED PARTY TRANSACTIONS AND KEY MANAGEMENT PERSONNEL
Related party transactionsThe Council is a wholly-owned entity of the Crown.
The Council enters into transactions with government departments, state-owned enterprises, and other Crown entities. Those transactions that occur within a normal supplier or client relationship on terms and conditions no more or less favourable than those which it is reasonable to expect the Council would have adopted, if dealing with that entity at arm’s length in the same circumstances, have not been disclosed as related party transactions.
The following transactions were carried out with related parties other than those described above.
All related party transactions have been entered into on an arms length basis.
The aggregate value of the transactions and outstanding balances relating to key management personnel and entities over which they have control or significant influence were as follows.
Transaction valueyear ended 30 June
Balance outstandingyear ended 30 June
Key personnel Transaction Ref 2011$
2010$
2011$
2010$
Richard Westlake Kiwibank Ltd – Interest income i 37,768 38,647 13,597 5,745
Richard Westlake Kiwibank Ltd – Short-term deposits i 769,035 739,119
Richard Westlake Kiwibank Ltd – Trading income i 237 5,208 0 0
Vaughan Renner Wellington Institute of Technology ii 37,240 38,351 0 436
Carol Stigley National Library of New Zealand iii 25,000 25,244 0 0
Vaughan RennerRichard Westlake
NZ Defence Force iv 22,633 25,864 1,368 0
Debbie Chin Hutt Valley District Health Board v 4,211 9,465 0 84
Tom Campbell The Todd Corporation Ltd vi 7,808 9,084 0 0
Richard Gibbons Electricity Engineers' Association vii 39,185 8,973 0 (150)
Vaughan Renner Holmes Consulting Group Ltd viii 8,566 6,513 6,498 5,972
Sharon Kletchko Nelson Marlborough District Health Board ix 2,300 4,004 0 2,418
Richard Westlake Intergen Ltd x 442,726 199,091 2,622 0
Microsoft New Zealand Ltd xi 128,541 172,159 0 23,178
Michael Wallmannsberger
ASB Bank Ltd xii 28,913 23,061 2,856 2,218
Vaughan Renner Employers' Chamber of Commerce Central xiii 5,791 13,402 2,737 0
Richard Gibbons Electricity Engineers' Association xiv 14,487 11,670 0 0
(i) Interest on short-term deposits and trading income from Kiwibank Ltd, of which Richard Westlake is a Director and Chair of Finance, Audit and Risk Committee, was earned in 2011 and 2010 on normal commercial terms.
(ii) Trading income from Wellington Institute of Technology, of which Vaughan Renner is a Council Member, was earned in 2011 and 2010 on normal commercial terms.
(iii) Trading income from National Library of New Zealand, of which Carol Stigley is Chair of Risk and Assurance Committee, was earned in 2011 and 2010 on normal commercial terms.
(iv) Trading income from NZ Defence Force, of which Vaughan Renner is a past member of NZDF – Army Support Management Board and Richard Westlake is a member of the Royal New Zealand Air Force Leadership Board, was earned in 2011 and 2010 on normal commercial terms.

36 STANDARDS COUNCIL | ANNUAL REPORT 2011
(v) Trading income from Hutt Valley District Health Board, of which Debbie Chin is a board member, was earned in 2011 and 2010 on normal commercial terms.
(vi) Trading income from The Todd Corporation Ltd, of which Tom Campbell is a board member, was earned in 2011 and 2010 on normal commercial terms.
(vii) Trading income from Electricity Engineers’ Association, of which Richard Gibbons is a board member, was earned in 2011 and 2010 on normal commercial terms.
(viii) Trading income from Holmes Consulting Group Ltd, of which Vaughan Renner is a past Director, was earned in 2011 and 2010 on normal commercial terms.
(ix) Trading income from Nelson Marlborough District Health Board, of which Sharon Kletchko is General Manager, was earned in 2011 and 2010 on normal commercial terms.
(x) Capital purchases and services from Intergen Ltd, of which Richard Westlake is a Director, were made in 2011 and 2010 on normal commercial terms.
(xi) Capital purchases and services from Microsoft New Zealand Ltd, which is not a related party, were made in 2011 and 2010 on normal commercial terms. Microsoft New Zealand Ltd had engaged Intergen Ltd as its chosen working partner for stage 1 and 2 of the replacement of the Council’s core management information system.
(xii) Purchase of services from ASB Bank Ltd, of which Michael Wallmannsberger is an employee, were made in 2011 and 2010 on normal commercial terms.
(xiii) Purchase of services from Employers’ Chamber of Commerce Central, of which Vaughan Renner is a board member, were made in 2011 and 2010 on normal commercial terms.
(xiv) Purchase of services from Electricity Engineers’ Association, of which Richard Gibbons is a board member, were made in 2011 and 2010 on normal commercial terms.
Routine sales transactions with related parties of a minor nature (less than $4,000 in total during the year) have not been included in this table. No provision has been required, nor any expense recognised for impairment of receivables from related parties (2010: nil).
Key management personnel compensation
2011 $
2010 $
Council fees 124,450 117,200
Salaries and other short-term benefits 906,843 921,076
Total key management personnel compensation 1,031,293 1,038,276
Key management personnel includes all Council members, the Chief Executive, and the salaries paid for those fulfilling the positions on the senior management team during the period.

37STANDARDS COUNCIL | ANNUAL REPORT 2011
20 COUNCIL FEESThe total value of fees paid or payable to each Council member during the year was the following.
2011 $
2010 $
John Lumsden (Chair) (Appointed November 2010) 16,667 0
Tom Campbell 12,000 1,500
Richard Gibbons 12,000 12,000
John Hannah 13,200 12,150
Sharon Kletchko 14,250 14,500
Vivian Kloosterman 12,000 12,000
Ellen Ramsay (Resigned September 2009) 0 3,000
Vaughan Renner 12,000 12,000
Fay Sowerby 12,000 1,500
Carol Stigley (Completed term May 2010) 0 11,550
Michael Wallmannsberger 12,000 12,000
Richard Westlake (Completed term October 2010) 8,333 25,000
Total Council fees 124,450 117,200
There have been no payments made to Council appointed committee members who were not Council members during the financial year.
The Council has effected professional indemnity insurance cover during the financial year to cover the liability or costs of Council members and employees.
21 EMPLOYEE REMUNERATIONThe number of employees who received remuneration and other benefits of $100,000 or more during the financial year, shown in $10,000 bands.
Total remuneration paid or payable $
2011 2010
100,000-110,000 0 1
110,000-120,000 3 2
120,000-130,000 0 2
130,000-140,000 1 0
150,000-160,000 0 2
160,000-170,000 0 2
170,000-180,000 2 1
200,000-210,000 1 0
240,000-250,000 1 0
260,000-270,000 0 1
Total employees 8 11
During the year ended 30 June 2011, 2 (2010: 6) employees were paid or payable compensation and other benefits, (including redundancy and retirement payments), in relation to cessation totalling $49,731 (2010: $170,181).

38 STANDARDS COUNCIL | ANNUAL REPORT 2011
22 EVENTS AFTER BALANCE SHEET DATEThere were no significant events after balance sheet date.
23 CATEGORIES OF FINANCIAL INSTRUMENTS
2011 $
2010 $
Loans and receivables
Cash and cash equivalents 859,272 572,438
Debtors and other receivables (Note 6) 1,030,502 1,145,598
Investments – short-term deposits (Note 8) 2,092,072 2,368,582
Total loans and receivables 3,981,846 4,086,618
Financial assets at fair value through other comprehensive income
Investment – shares (Note 9) 1,636 1,315
Financial liabilities measured at amortised cost
Creditors and other payables (Note 12) 445,214 647,009
24 FINANCIAL INSTRUMENT RISKSThe Council’s activities expose it to a variety of financial instrument risks, including market risk, credit risk, and liquidity risk.
The Council has a series of policies to manage the risks associated with financial instruments and seeks to minimise exposure from financial instruments. These policies do not allow any transactions that are speculative in nature to be entered into.
Market riskThe interest rates on the Council’s investments are disclosed in Note 8.
Fair value interest rate risk
Fair value interest rate risk is the risk that the value of a financial instrument will fluctuate due to changes in market interest rates. The Council’s exposure to fair value interest rate risk is limited to short-term deposits which are held at fixed rates of interest.
Currency risk
Currency risk is the risk that the fair value or future cash flows of a financial instrument will fluctuate due to changes in foreign exchange rates. The Council has no significant exposure to currency risk.
Credit riskCredit risk is the risk that a third party will default on its obligations to the Council, causing the Council to incur a loss.
In the normal course of business, credit risk arises from deposits with banks and accounts receivables.
The Council has short-term deposits with registered banks. The Council’s investment policy limits investments to registered banks with satisfactory credit ratings and New Zealand Government Stock. The Council’s investment policy limits the amount of credit exposure to any one institution.
The Council allows credit facilities to its members and contracts for service customers. The Council has processes in place to review the credit quality of other customers prior to granting of credit.
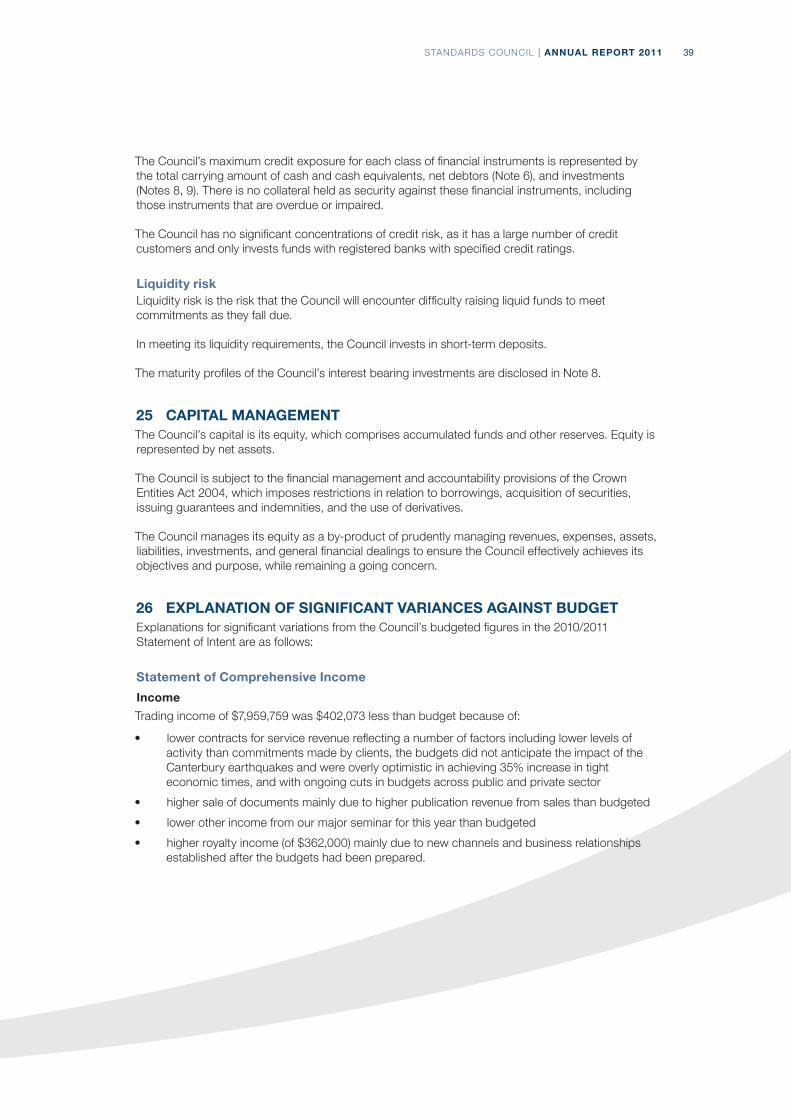
39STANDARDS COUNCIL | ANNUAL REPORT 2011
The Council’s maximum credit exposure for each class of financial instruments is represented by the total carrying amount of cash and cash equivalents, net debtors (Note 6), and investments (Notes 8, 9). There is no collateral held as security against these financial instruments, including those instruments that are overdue or impaired.
The Council has no significant concentrations of credit risk, as it has a large number of credit customers and only invests funds with registered banks with specified credit ratings.
Liquidity riskLiquidity risk is the risk that the Council will encounter difficulty raising liquid funds to meet commitments as they fall due.
In meeting its liquidity requirements, the Council invests in short-term deposits.
The maturity profiles of the Council’s interest bearing investments are disclosed in Note 8.
25 CAPITAL MANAGEMENTThe Council’s capital is its equity, which comprises accumulated funds and other reserves. Equity is represented by net assets.
The Council is subject to the financial management and accountability provisions of the Crown Entities Act 2004, which imposes restrictions in relation to borrowings, acquisition of securities, issuing guarantees and indemnities, and the use of derivatives.
The Council manages its equity as a by-product of prudently managing revenues, expenses, assets, liabilities, investments, and general financial dealings to ensure the Council effectively achieves its objectives and purpose, while remaining a going concern.
26 EXPLANATION OF SIGNIFICANT VARIANCES AGAINST BUDGETExplanations for significant variations from the Council’s budgeted figures in the 2010/2011 Statement of Intent are as follows:
Statement of Comprehensive Income
Income
Trading income of $7,959,759 was $402,073 less than budget because of:
• lower contracts for service revenue reflecting a number of factors including lower levels of activity than commitments made by clients, the budgets did not anticipate the impact of the Canterbury earthquakes and were overly optimistic in achieving 35% increase in tight economic times, and with ongoing cuts in budgets across public and private sector
• higher sale of documents mainly due to higher publication revenue from sales than budgeted
• lower other income from our major seminar for this year than budgeted
• higher royalty income (of $362,000) mainly due to new channels and business relationships established after the budgets had been prepared.

40 STANDARDS COUNCIL | ANNUAL REPORT 2011
Expenditure
Expenditure was less than budget because:
• personnel expenses were less than budget due to deferring the recruitment of vacant positions, which was offset by temps and contractors’ expenses (which was $260,000 higher than budget)
• seminar costs of nil were $186,000 less than budget as above
• transfer to intangibles above budget due to the higher levels of self-funded projects which generated the higher sale of documents revenue and royalty income as above
• the balance is made up of savings in other expenditure due to overheads being tightly managed
• depreciation and amortisation expenses were lower than budget due to timing differences, with expenditure planned for 2009/2010 occurring in 2010/2011.
Statement of Financial Position
Assets
Cash and cash equivalents above budget due to the higher surplus.
Property, plant, and equipment was lower due to deferred asset purchases (full PC replacement and collaboration tools not being purchased in the current financial year).
Intangible assets of $1,622,552 was $417,000 higher than budget due to greater investment in self-funded projects to generate higher sale of documents and royalty revenue, and the lower amortisation expense of software due to the later timing of the recognition of the purchase of the core management information system.
Liabilities
Income in advance above budget mainly due to the delays by clients specifying their work programmes.
Statement of Changes in Equity
Total comprehensive income
Total comprehensive income for the year was $591,206, compared to a budget of $165,055, due to a higher surplus. The budget variance is explained in the Statement of Comprehensive Income above.
Statement of Cash Flows
Cash flows from operating activities
Receipts from customers were $131,812 below budget and payments to suppliers and employees were $718,274 below budget due to the budget variances explained in the Statement of Comprehensive Income above. Purchase of property, plant, and equipment of $121,719 was $237,000 lower due to deferred asset purchases. Purchase of intangible assets of $994,936 was $435,000 higher than budget due to:
• greater investment in self-funded projects to generate higher sale of documents and royalty revenue
• cash outflows for the purchase of computer software was higher than budget due to timing differences, with expenditure planned for 2009/2010 occurring in 2010/2011.
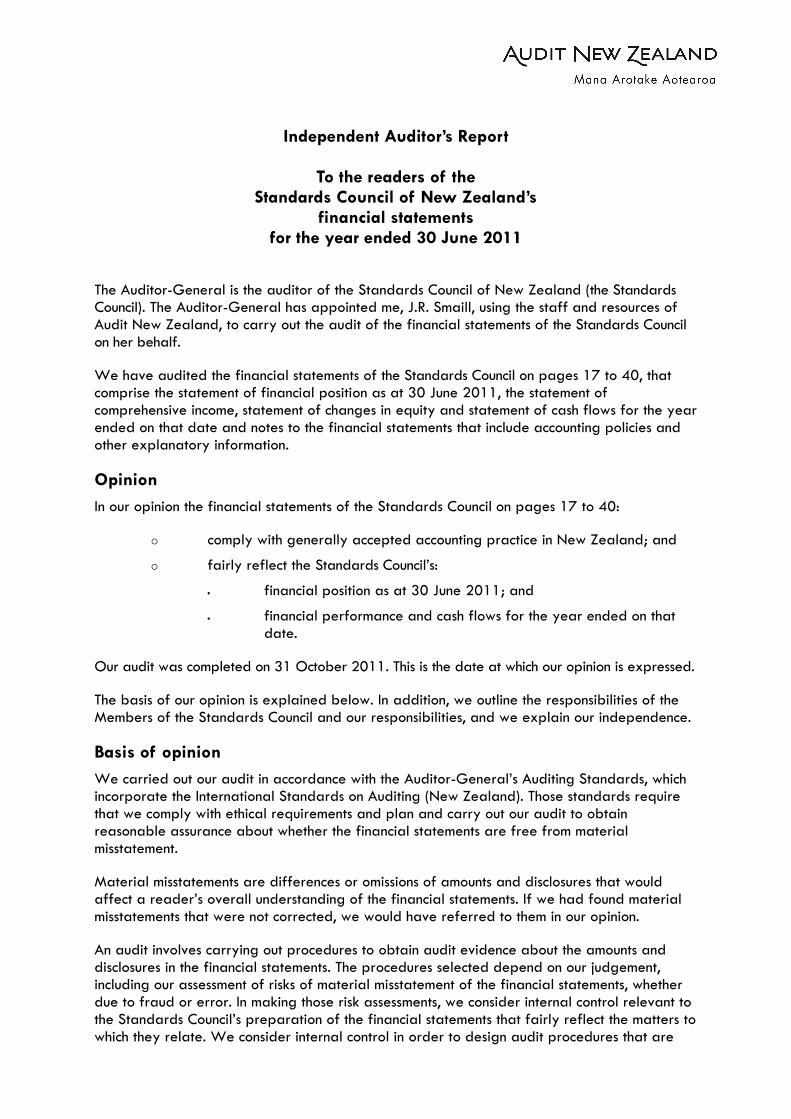
Independent Auditor’s Report
To the readers of the Standards Council of New Zealand’s
financial statements for the year ended 30 June 2011
The Auditor-General is the auditor of the Standards Council of New Zealand (the Standards Council). The Auditor-General has appointed me, J.R. Smaill, using the staff and resources of Audit New Zealand, to carry out the audit of the financial statements of the Standards Council on her behalf.
We have audited the financial statements of the Standards Council on pages 17 to 40, that comprise the statement of financial position as at 30 June 2011, the statement of comprehensive income, statement of changes in equity and statement of cash flows for the year ended on that date and notes to the financial statements that include accounting policies and other explanatory information.
Opinion In our opinion the financial statements of the Standards Council on pages 17 to 40:
comply with generally accepted accounting practice in New Zealand; and
fairly reflect the Standards Council’s:
financial position as at 30 June 2011; and
financial performance and cash flows for the year ended on that date.
Our audit was completed on 31 October 2011. This is the date at which our opinion is expressed.
The basis of our opinion is explained below. In addition, we outline the responsibilities of the Members of the Standards Council and our responsibilities, and we explain our independence.
Basis of opinion We carried out our audit in accordance with the Auditor-General’s Auditing Standards, which incorporate the International Standards on Auditing (New Zealand). Those standards require that we comply with ethical requirements and plan and carry out our audit to obtain reasonable assurance about whether the financial statements are free from material misstatement.
Material misstatements are differences or omissions of amounts and disclosures that would affect a reader’s overall understanding of the financial statements. If we had found material misstatements that were not corrected, we would have referred to them in our opinion.
An audit involves carrying out procedures to obtain audit evidence about the amounts and disclosures in the financial statements. The procedures selected depend on our judgement, including our assessment of risks of material misstatement of the financial statements, whether due to fraud or error. In making those risk assessments, we consider internal control relevant to the Standards Council’s preparation of the financial statements that fairly reflect the matters to which they relate. We consider internal control in order to design audit procedures that are
appropriate in the circumstances but not for the purpose of expressing an opinion on the effectiveness of the Standards Council’s internal control.
An audit also involves evaluating:
the appropriateness of accounting policies used and whether they have been consistently applied;
the reasonableness of the significant accounting estimates and judgements made by the Members of the Standards Council;
the adequacy of all disclosures in the financial statements; and
the overall presentation of the financial statements.
We did not examine every transaction, nor do we guarantee complete accuracy of the financial statements. We have obtained all the information and explanations we have required and we believe we have obtained sufficient and appropriate audit evidence to provide a basis for our audit opinion.
Responsibilities of the Members of the Standards Council The Members of the Standards Council are responsible for preparing financial statements that:
comply with generally accepted accounting practice in New Zealand; and
fairly reflect the Standards Council’s financial position, financial performance and cash flows.
The Members of the Standards Council are also responsible for such internal control as is determined necessary to enable the preparation of financial statements that are free from material misstatement, whether due to fraud or error.
The Members of the Standards Council’s responsibilities arise from the Crown Entities Act 2004.
Responsibilities of the Auditor We are responsible for expressing an independent opinion on the financial statements and reporting that opinion to you based on our audit. Our responsibility arises from section 15 of the Public Audit Act 2001 and the Crown Entities Act 2004.
Independence When carrying out the audit, we followed the independence requirements of the Auditor-General, which incorporate the independence requirements of the New Zealand Institute of Chartered Accountants.
Other than the audit, we have no relationship with or interests in the Standards Council.
J.R. Smaill Audit New Zealand On behalf of the Auditor-General Wellington, New Zealand
42 STANDARDS COUNCIL | ANNUAL REPORT 2011
MATTERS RELATING TO THE ELECTRONIC PRESENTATION OF THE AUDITED FINANCIAL STATEMENTSThis audit report relates to the financial statements of the Standards Council of New Zealand (the Standards Council) for the year ended 30 June 2011 included on the Standards Council’s website. The members of the Standards Council are responsible for the maintenance and integrity of the Standards Council’s website. We have not been engaged to report on the integrity of the Standards Council’s website. We accept no responsibility for any changes that may have occurred to the financial statements since they were initially presented on the website.
The audit report refers only to the financial statements named above. It does not provide an opinion on any other information which may have been hyperlinked to or from the financial statements. If readers of this report are concerned with the inherent risks arising from electronic data communication they should refer to the published hard copy of the audited financial statements as well as the related audit report dated 31 October 2011 to confirm the information included in the audited financial statements presented on this website.
Legislation in New Zealand governing the preparation and dissemination of financial information may differ from legislation in other jurisdictions.
43STANDARDS COUNCIL | ANNUAL REPORT 2011
NOMINATING ORGANISATIONSWe acknowledge the contribution to Standards development of our nominating organisations which include the following. These organisations have nominated committee members for committees active from 1 July 2010 to 30 June 2011.
ABES
Access Homehealth
Accident Compensation Corporation
Action Motor Bodies
AFNOR
AgResearch
AgriLINK New Zealand
Air New Zealand
Ambreed
Appserv Ltd
Aqualinc Research Ltd
Arbitrators' and Mediators' Institute of New Zealand Inc.
Architectural Designers New Zealand
Area 2 Inshore Finfish Management Company Ltd
Association of Accredited Certification Bodies
Association of Rotational Moulders Australasia
Auckland Council
Auckland District Health Board
Audit New Zealand
Auldhouse
Australasian Lighting Industry Association
Australia Building Codes Board
Australian & NZ Clinical Waste Management Industry Group
Australian Chamber of Commerce and Industry
Australian Communications and Media Authority
Australian Electrical & Electronic Manufacturers' Association Ltd
Australian Industry Group
Australian Information Industry Association
Australian Retailers' Association
Australian Water Association
Aviation and Marine Engineers Association
Aviation, Tourism and Travel Training Organisation (ATTTO)
Bibliothèque nationale de France
BRANZ Ltd
Building and Construction Industry Training Organisation
Building Officials' Institute of New Zealand
Building Service Contractors of New Zealand Inc.
BusinessNZ
Canterbury District Health Board
Careerforce
Casting Technology NZ Inc.
CCS Disability Action
Cement & Concrete Association of New Zealand
Central Region Electrical Inspectors Association
Centre for Advanced Engineering
Certification Interests (New Zealand)
Certified Builders' Association of New Zealand Inc.
Challenger Finfish Management Company Ltd
CHOICE
Christchurch City Council
Civil Aviation Authority of New Zealand
Community Leisure Management
Construction Information Ltd
Consulting Interests Australia
Consumer Electronics Association of New Zealand
Consumer Electronics Suppliers' Association
Consumers' Federation of Australia
Corporate Health and Safety Services
Counties Manukau District Health Board
CRV Ambreed
CSIRO Land and Water
Customs Brokers and Freight Forwarders Federation of NZ Inc.
DAA Group
Dairy Companies Association of New Zealand
DairyNZ
Dangerous Goods Management Ltd
Danish Agency for Libraries and Media
DeepWater Group Ltd
DeLaval New Zealand
Department of Building and Housing
Department of Conservation
Department of Health, South Australia
Department of Human Services
Department of Internal Affairs
Department of Justice, Tasmania
Department of Labour
Department of Mines and Petroleum WA
Department of Sustainability, Environment, Water, Population and Communities, Canberra
Department of the Prime Minister and Cabinet
Design Association of New Zealand Inc.
Disabled Persons Assembly (New Zealand) Inc.
District Health Boards New Zealand
Douglas-fir Association
Earthquake Commission
Electrical Compliance Testing Association
Electrical Contractors Association of New Zealand
Electrical Regulatory Authorities Council
Electrical Safety Organisation Inc.

44 STANDARDS COUNCIL | ANNUAL REPORT 2011
Electrical Workers' Registration Board
Electricity Commission
Electricity Engineers' Association of NZ Inc.
ElectroTechnical Association
Electrotechnology Industry Training Organisation
Enable New Zealand
Energy Efficiency and Conservation Authority
Energy Networks Association
Energy Safe Victoria
Energy Safety Department of Commerce
EnergySafety WA
Engineering Services Australia
Engineers Australia
Environment and Conservation Organisations of New Zealand
Environment Canterbury
Environmental Protection Authority
Environmental Resources Management
ERMA New Zealand
ESR Ltd
ETITO
EXITO
Faulkner Collins Ltd
Federated Farmers of New Zealand
Fire Protection Association of New Zealand
Fire Protection Contractors' Association
Fire Protection Inspection Services
Fonterra Co-operative Group Ltd
Frame & Truss Manufacturers Association of NZ Inc.
Fraser Engineering Group
Fronde Systems Group Ltd
Gas Association of New Zealand
Gas Industry Company
Gas Utilisation Institute
GEA Farm Technologies New Zealand Ltd
Global Standards One
Greenpeace NZ Inc.
Grey Power New Zealand Federation Inc.
HazKnow Limited
Health and Disability Auditing New Zealand
HealthCare of New Zealand
Heavy Engineering Research Association
Hire and Rental Association Australia
Hire Industry Association of NZ Inc.
Hospice New Zealand
Housing Industry Association
Hutt Valley District Health Board
IBM NZ Ltd
IHC
InfraTrain New Zealand Ltd
Ingenium
Injury Prevention Network of Aotearoa New Zealand
Inland Revenue Department
Institute of Electrical Inspectors Australia
Institution of Fire Engineers (NZ Branch)
Institution of Professional Engineers New Zealand
Insurance Brokers' Association of New Zealand
Insurance Council of New Zealand Inc.
Intergen Ltd
Internet Company of New Zealand
InternetNZ
Irrigation New Zealand
ISBN International
ITHAKA
Joint Accreditation System of Australia and New Zealand
Kites Trust
KiwiRail Ltd
La Trobe University
Landcare Research NZ Ltd
Lely New Zealand
Lifteye Consultancy
Lighting Council Australia
Liquigas Ltd
Livestock Improvement
Local Government New Zealand
Low Rise Elevation Suppliers' Association
LPG Association of New Zealand (Inc.)
Maritime New Zealand
Martens & Associates Pty Ltd
Massey University
Master Plumbers' & Mechanical Services Association of Australia
Master Plumbers Association of NSW
Master Plumbers, Gasfitters and Drainlayers NZ Inc.
Medical Technology Association of New Zealand
Mental Health Commission
Metal Roofing Manufacturers' Association
Microsoft New Zealand Ltd
MidCentral Health – Public Health
Milfos International Ltd
MilkTest NZ
Ministry for the Environment
Ministry of Agriculture and Forestry
Ministry of Consumer Affairs
Ministry of Economic Development
Ministry of Economic Development – Energy Safety
Ministry of Education
Ministry of Fisheries
Ministry of Foreign Affairs & Trade
Ministry of Health
Ministry of Social Development
National Association of Testing Authorities Australia
National Electrical and Communications Association
National Information Standards Organization
National Institute of Informatics
National Institute of Water and Atmospheric Research
National Library of New Zealand
National Lift Association
National On-site Regulators' Forum
National Precast Concrete Association of Australia
National Rural Fire Authority
45STANDARDS COUNCIL | ANNUAL REPORT 2011
Navigatus Consulting Ltd
New Zealand Aged Care Association
New Zealand Animal Evaluation Ltd
New Zealand Building Industry Federation
New Zealand Computer Society
New Zealand Concrete Society
New Zealand Contractors' Federation Inc.
New Zealand Council of Christian Social Services
New Zealand Council of Elders
New Zealand Dairy Breeders' Federation
New Zealand Defence Force
New Zealand Disability Support Network
New Zealand Electric Fence Energizers Manufacturers' Standards Group
New Zealand Electrical Institute
New Zealand Fire Equipment Manufacturers' Association
New Zealand Fire Service
New Zealand Forest Owners Association
New Zealand Health IT Cluster
New Zealand Holstein Friesian Association (Inc.)
New Zealand Information and Communication Technologies Group
New Zealand Institute of Architects
New Zealand Institute of Building Surveyors
New Zealand Institute of Gas Engineers
New Zealand Institute of Quantity Surveyors
New Zealand Institute of Surveyors
New Zealand Manufacturers' and Exporters' Association
New Zealand Master Pool Builders Incorporated
New Zealand Meat Industry Association
New Zealand Metal Roofing Manufacturers Inc.
New Zealand Motor Caravan Association Inc.
New Zealand Mountain Safety Council
New Zealand Nurses Organisation
New Zealand Open Source Society
New Zealand Outdoor Instructors Association
New Zealand Pine Manufacturers Association Inc.
New Zealand Planning Institute
New Zealand Police
New Zealand Portland Cement Association
New Zealand Post Ltd
New Zealand Principals' Federation
New Zealand Private Surgical Hospitals Association
New Zealand Property Investors' Federation
New Zealand Ready Mixed Concrete Association
New Zealand Recreational Fishing Council
New Zealand Retailers Association
New Zealand School Trustees Association
New Zealand Seafood Industry Council
New Zealand Society for Risk Management
New Zealand Software Association
New Zealand Specialist Trade Contractors' Federation
New Zealand Timber Industry Federation
New Zealand Transport Agency
New Zealand Underwater Association
New Zealand Utilities Advisory Group
New Zealand Wine
Noel Arnold & Associates
Northern Territory Department of Health & Community Services
NSW Fair Trading
NSW Health Department
Nurse Maude Association
Office of the Privacy Commissioner
Outdoors New Zealand
Oxygen IT
Palmerston North City Council
Pasifika Integrated Healthcare
PE International
Phillips & Smith Ltd
Pipfruit New Zealand Inc.
Plant & Food Research
Plastics New Zealand
Platform
Plumbers, Gasfitters and Drainlayers Board
Plumbing Distributors' Association of New Zealand
Plumbing, Gasfitting, Drainlaying and Roofing ITO
Porirua City Council
Powerco Ltd
Precast NZ Inc.
Property Council of New Zealand Inc.
Provoke Solutions
Queensland Department of Local Government & Planning
Queensland Fire & Rescue Service Scientific Unit
Queensland Health
Queensland University of Technology
Queenstown Lakes District Council
Radian Technology
Registered Master Builders' Federation
Reln Pty Ltd
Responsible Care New Zealand Inc.
Revera Ltd
Risk Management Ltd
Road Controlling Authorities Forum New Zealand Inc.
Road Transport Forum New Zealand (Inc.)
Royal Australasian College of Surgeons
Royal Forest and Bird Protection Society of New Zealand
Royal New Zealand Plunket Society (Inc.)
Royal NZ Foundation of the Blind
Safekids New Zealand
Safety Institute of Australia
SafeWork SA
Schneider Electric Ltd
Scion
Sempre Avanti NZ Ltd
46 STANDARDS COUNCIL | ANNUAL REPORT 2011
Sensortec Ltd
SERDA Groupe
Service and Food Workers Union
SGS Australia Pty Ltd
Shell Todd Oil Services Ltd
Site Safe New Zealand
Skills Active
Skope Industries Ltd
Society of Fire Protection Engineers
Society of Local Government Managers
Solid Energy New Zealand Ltd
State Services Commission
Steel Construction New Zealand Inc.
Structural Engineering Society New Zealand
Te Ohu Kaimoana
Te Upoko o Nga Oranga o Te Rae
Telarc SAI Ltd
Telecom New Zealand Ltd
Telecommunications Users Association of New Zealand Inc.
Testing Interests New Zealand
Thames Coromandel District Council
The Association of Consulting Engineers New Zealand Inc.
The New Zealand Home Health Association Inc.
The Northern Fisheries Management Stakeholder Company Ltd
Tourism Industry Association
Transpower New Zealand Ltd
Tranzqual ITO
Tru-Test Limited
Tyco Electronics NZ Ltd
University of Auckland
University of Canterbury
Urban Design Forum
URS New Zealand Ltd
Victoria University of Wellington
Waitakere City Council
Wastewater Practitioners' Association Queensland
Water Industry Operations Group New Zealand
Water New Zealand
Water New Zealand, Small Wastewater and Natural Systems Special Interest Group
Water Safety New Zealand Inc.
Wattyl Australia Group
Wellington City Council
Westland Milk Products
Window Association of New Zealand
Wood Processors Association of New Zealand
WorkCover New South Wales
World Wildlife Federation (WWF) New Zealand
Xero Ltd

STANDARDS COUNCILThe Standards Council was established by the Standards Act 1988. At 30 June 2011 the membership of the Council was:
CHAIR John Lumsden November 2010 Appointed by the Minister of Commerce
MEMBERSTom Campbell May 2010
Nominated by the Minister of Commerce
Richard Gibbons May 2006 Nominated by the Electricity Engineers’ Association New Zealand
John Hannah (Chair of Audit and Risk Subcommittee) May 2008 Nominated by the New Zealand Vice-Chancellors’ Committee
Sharon Kletchko September 2006 Appointed by the Minister of Commerce
Vivian Kloosterman May 2008 Nominated by the Institution of Professional Engineers New Zealand
Vaughan Renner May 2008 Nominated by Business New Zealand
Fay Sowerby May 2010 Nominated by the Minister of Commerce
Michael Wallmannsberger (Chair of Information Systems Strategic Plan Subcommittee) May 2008 Nominated by the Council of Trade Unions
STANDARDS NEW ZEALANDDebbie Chin Chief Executive
Michelle Wessing Acting General Manager Solutions and General Manager Corporate Services
Rob Warner General Manager Strategic Development and Innovation
Shona Weller General Manager Customer Services and Sales