report of the oecd task force on software … file · web viewreport of the oecd task force on...
TRANSCRIPT


STD/DOC(2003)1
The OECD Statistics Working Paper Series – managed by the OECD Statistics Directorate – is designed to make available in a timely fashion and to a wider readership selected studies prepared by staff in the Secretariat or by outside consultants working on OECD projects. The papers included are of a technical, methodological or statistical policy nature and relate to statistical work relevant to the organisation. The Working Papers are generally available only in their original language – English or French – with a summary in the other.
Comments on the papers are welcome and should be communicated to the authors or to the OECD Statistics Directorate, 2, rue André Pascal, 75775 Paris Cedex 16, France.
The opinions expressed in these papers are the sole responsibility of the author(s) and do not necessarily reflect those of the OECD or of the governments of its Member countries.
_______________________________________
http://www.oecd.org/std/research
________________________________________
Copyright OECD, 2002Applications for permission to reproduce or translate all or part of this material should be made to: Head of Publication Service, OECD, 2, rue André Pascal, 75775 Paris, Cedex 16, France.
2

STD/DOC(2003)1
Abstract: This statistical working paper is the exact copy of the report of the joint OECD/Eurostat task force that was presented at the October 2002 OECD National Accounts Expert Meeting. The report confirms that current estimates of software investment differ significantly between countries for pure statistical reasons, thus affecting the comparability of GDP. The objective of this report is to propose concrete recommendations for a harmonised re-estimation of software investment in the national accounts. Recommendations cover definitional and conceptual issues (what is software?, what is software investment?), measurement issues in international trade and price, as well as general methods of estimation (sources and commodity-flow methods). The principle of the recommendations has been adopted by a large majority of OECD member countries during the October 2002 meeting. However, new estimates based on these recommendations should only be available in the forthcoming years, depending on the implementation of new benchmark years by countries.
Résumé : Ce document de travail statistique est l’exacte copie du rapport du groupe de travail spécial conjoint OCDE/Eurostat qui a été présenté à la réunion d’octobre 2002 des experts comptables nationaux de l’OCDE. Le rapport confirme que les estimations actuelles de l’investissement en logiciel diffèrent significativement entre pays purement du fait de raisons statistiques, affectant la comparabilité des PIB. L’objective du rapport est de proposer des recommandations concrètes pour une ré estimation harmonisée de l’investissement en logiciels dans les comptes nationaux. Les recommandations couvrent les questions conceptuelles et de définition (qu’est qu’un logiciel ? qu’est ce que l’investissement en logiciel ?), les questions de mesure en commerce international et en prix, ainsi que les méthodes générales d’estimation (sources et équilibre emplois ressources du produit). Le principe de ces recommandations a été approuvé par une large majorité des pays membres de l’OCDE pendant la réunion d’octobre 2002. Les nouveaux chiffres basés sur ces recommandations ne seront cependant disponibles qu’au cours des années suivantes, au fur et à mesure de leur mise en œuvre par les pays membres dans leurs nouvelles bases de comptes nationaux.
3
STD/DOC(2003)1
TABLE OF CONTENTS
Introduction..................................................................................................................................................6Overview......................................................................................................................................................7Chapter I: Classification, Definition and Conceptual Issues.....................................................................11
1.1 Definition of software – originals, reproductions and, games...................................................111.2 Originals and own-account software..........................................................................................131.3 Licenses to use and rentals.........................................................................................................161.4 Licenses to Reproduce copies for sale and Bundled/Embedded Software...............................191.5 Royalties.....................................................................................................................................201.6 Maintenance...............................................................................................................................211.7 Small Tools................................................................................................................................221.8 Databases...................................................................................................................................221.9 Concordance Tables...................................................................................................................27
Chapter II: International Trade Flows.......................................................................................................332.1 Introduction: Identifying Imports and Exports of Software Goods and Services.....................332.2 International Trade Measurement Issues...................................................................................332.3 Concepts, Definitions and Classification issues........................................................................342.4 Results of the Survey of National Practices in the Measurement of Software in the National Accounts.................................................................................................................................................352.5 General remarks concerning responses to section 3.1 International Trade in Software............372.6 Trade in Software Goods (response to table L in the Questionnaire)........................................372.7 Draft conclusions and recommendations...................................................................................442.8 International Trade Codes for Computer Software....................................................................45
Chapter III: Deflators................................................................................................................................473.1 Introduction................................................................................................................................473.2 Deflation of pre-packaged software...........................................................................................483.3 Deflation of customised software..............................................................................................493.4 Deflation of own-account software............................................................................................503.5 Summary table of deflations used for software.........................................................................513.6 Draft Commission Decision on price and volume measures in National Accounts (Eurostat B1/CN 503 e)..........................................................................................................................................51
Chapter IV: Lessons from Business Accounting and Business Surveys...................................................534.1 Business accounting: the theory................................................................................................534.2 Business accounting: tax rules..................................................................................................564.3 Business accounting: in practice...............................................................................................564.4 A strategy for estimating software investment..........................................................................584.5 Adequate Business Surveys.......................................................................................................59
Chapter V: The supply approach...............................................................................................................625.1 Purchased software....................................................................................................................625.2 Macro-estimate of own-account software..................................................................................685.3 Other adjustments......................................................................................................................77
4

STD/DOC(2003)1
Chapter VI: Consumption of Fixed Capital, Current Year Estimation.....................................................796.1 Consumption of Fixed Capital...................................................................................................796.2 Current Year Estimation............................................................................................................80
ANNEX......................................................................................................................................................82List of participants..................................................................................................................................82
Summary of recommendations...................................................................................................................86
5

STD/DOC(2003)1
REPORT OF THE OECD TASK FORCE ON SOFTWARE MEASUREMENT IN THE NATIONAL ACCOUNTS
Château de la MuetteOctober 2002
Introduction
A change was made in the latest system of national accounts (SNA93) that recommended the capitalisation of software. This was widely welcomed since it recognised the "asset" and "investment" characteristics of software and brought the treatment of software purchased separately into line with software purchased as a bundle with hardware, which has always been capitalised. However this has come at a cost, namely, deterioration in the international comparability of economic statistics. An examination of the estimation-techniques used in National Statistics Offices (NSOs) in the OECD area suggests that this reflects differences in interpreting what software is, as much as it does differences in measurement approaches.
This is not the only area of the national accounts where issues of international comparability arise but the comparability of software estimates across countries has been the subject of much discussion and scrutiny, reflecting its importance to economic growth and investment and its role in productivity and capital services’ estimates. The differences in estimation processes are significant: the impact of harmonising definitions and measurement techniques could lead to revisions of over 1 per cent of current price GDP levels, with consequential impacts on GDP growth and ICT investment.
To address these measurement issues, and improve international comparability, an OECD Task Force was set up in October 2001. 19 countries were represented in the Task Force - 12 European and 7 non-European. A European (Eurostat) Task Force was also convened to work in parallel with the OECD Task Force. The common objective of the task forces was to propose conceptual and practical recommendations on software measurement in the national accounts that would improve the comparability of data between countries.
This report describes the recommendations of the OECD Task Force that were presented to the OECD national accounts expert meeting in October 2002. The Eurostat Task Force presented its report to the Eurostat GNP Committee in July 2002. While the two reports may differ in presentation, their recommendations are fully consistent. During the October meeting, a large majority of member countries accepted to use these recommendations as the base to estimate better more comparable data in the future. However a limited number of countries challenged the view of the task force that both originals and reproductions of originals (pre-packaged software) are to be capitalised. They viewed in this a danger of “double counting”, and this issue has been forwarded to the Canberra II international task force. A part from this conceptual issue, the real success of the task force will be measured by better convergence in the ratio GFCF/Intermediate consumption (see next page) in the future. The OECD will organize a short survey in 2003-2004 to check this convergence.
In the present report, to help the reader, recommendations have been highlighted and numbered, and a summary of recommendations is included as an annex.
6

STD/DOC(2003)1
Overview
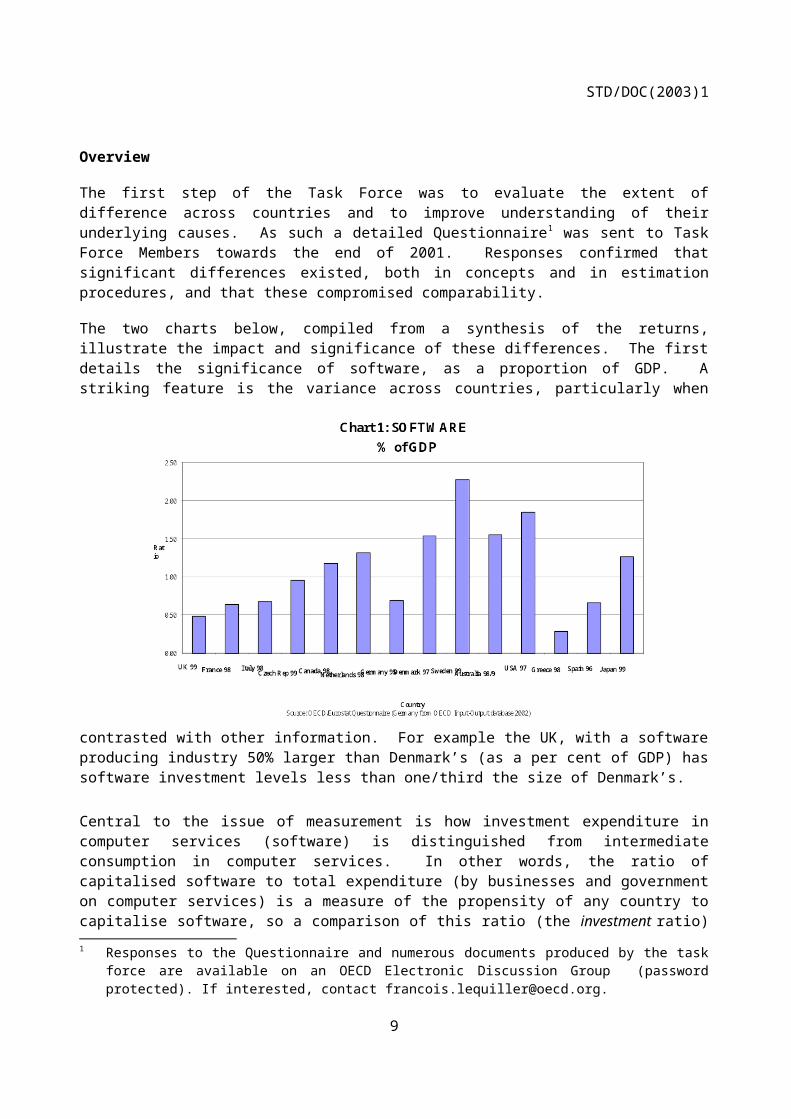
The first step of the Task Force was to evaluate the extent of difference across countries and to improve understanding of their underlying causes. As such a detailed Questionnaire1 was sent to Task Force Members towards the end of 2001. Responses confirmed that significant differences existed, both in concepts and in estimation procedures, and that these compromised comparability.
The two charts below, compiled from a synthesis of the returns, illustrate the impact and significance of these differences. The first details the significance of software, as a proportion of GDP. A striking feature is the variance across countries, particularly when contrasted with other information. For example the UK, with a software producing industry 50% larger than Denmark’s (as a per cent of GDP) has software investment levels less than one/third the size of Denmark’s.
Central to the issue of measurement is how investment expenditure in computer services (software) is distinguished from intermediate consumption in computer services. In other words, the ratio of capitalised software to total expenditure (by businesses and government on computer services) is a measure of the propensity of any country to capitalise software, so a comparison of this ratio (the investment ratio) provides insight into the scale of measurement differences across countries. The Questionnaire used a harmonised definition of computer services and the chart below compares this ratio across countries. Figure 2 below compares these ratios for 14 OECD countries. (Not all countries were able to comply exactly with the harmonised definition although all EU countries use exactly the same definition).
1 Responses to the Questionnaire and numerous documents produced by the task force are available on an OECD Electronic Discussion Group (password protected). If interested, contact [email protected].
7

STD/DOC(2003)1
A priori, assuming that common definitions and measurement procedures existed, one would have expected these ratios to be much closer together. At the more detailed level differences are starker. For example for a given expense of 100 on similar (detailed) types of software services, the US will capitalised 100, while France will capitalise only 50. One feasible and measurable objective of the Task Force, therefore, would be to obtain similar ratios for the same computer services sub-product groups across countries. It is this benchmark that will enable the Task Force to gauge its success in coming years (after NSOs adopt the changes recommended in this report). A short survey will be sent to participating countries during 2003 in order to try to measure actual or potential impacts of the present recommendations.
Responses to the questionnaire, and discussions with business accountants, revealed that one of the main sources of difference between countries is the weakness of business surveys. Business investment surveys, on the whole, use fairly general descriptions of software that leave some ambiguity in interpretation to businesses; which tend to adopt very prudent accounting rules. For example very few businesses capitalise own-account or customised software including those companies with large and valuable "software originals" such as Microsoft. Another problem, related to "prudence" is the fact that tax regulations do not in practice provide incentives for businesses to capitalise software, as they generally allow them, as an option, to be expensed.
Some countries have recognised this phenomenon explicitly in their estimation procedures and so use independently derived ("supply-based") methods to estimate software investment instead of business survey estimates. As a result, countries that base their estimates on traditional business surveys, using what businesses report as capitalised, are likely to obtain results that are much lower than countries that estimate independently. An objective of the Task Force is to improve matters here by providing a clearer definition of software investment, that can be, in due course, included in business investment surveys.
The first chapter of this report concentrates on definitional, conceptual and classification issues. It considers the distinction between and the concept of originals and reproductions of originals. In addition it presents a concordance between international product classifications and the circumstances under which expenditure should be capitalised. Own-account software production is also addressed, in particular own-account production of originals for reproduction.
The second part of the report investigates and comments on the consistency between the balance of payments and national accounts, and the impact on international trade in goods and services more generally. Two specific issues are discussed. The first relates to the fact that current statistics on
8
STD/DOC(2003)1
international trade generally only record transactions on tangible software (disks, CD-ROMs e.t.c), with intangible software (e.g. royalty payments) recorded under less descriptive headings. The second, and related point, is that national accounts’ estimates of software investment that use "supply-based" methods may consequently miscalculate investment.
The third part of the report covers deflation issues. Responses to the questionnaire on software deflators confirmed that significant differences existed in the types of deflators used, for example some countries apply quality adjustments but others do not. Between 1995 and 2000 measured software prices in the national accounts ranged from +30% (Sweden) to –25% (Australia), as shown in the graph below. The occurrence of another “statistical price-gap” between countries, as in the case of computers, should be avoided.
Chapter (4) considers business accounting, in theory and in practice, and the lessons that can be learned from this.
Finally, the report presents recommendations on the practical measurement of software investment in the national accounts using existing statistical sources. Guidelines are given on the type of information that should be included in business surveys to improve international comparability of software estimates, which are considered to be preferable to the use of supply-based estimation procedures when the recommendations in this report are adopted.
This will require some commitment from countries and there will inevitably be some cost involved that, for some, might prove too expensive or burdensome. In any case, it is unlikely that such an approach could be adopted soon by most countries. As such there may be a long implementation period before these types of changes occur. Operationally, even with a more definitive meaning of software, difficulties in estimation and statistical harmonisation are likely to persist because differences in tax regimes across countries will remain, and one cannot rule out the fact that businesses will continue to be influenced by the tax regime in operation. Furthermore it is hard to envisage valuations of own-account software being harmonised in a systematic way within countries, let alone internationally. As such supply based methods will continue to be necessary and used, despite their intrinsic difficulties, such as the adjustments needed to avoid double counting and the imputation of a macro-estimate of own-account software. In recognition of this, recommendations are also presented on ‘best-practice’ for supply-based methods.
9

STD/DOC(2003)1
What are the priority needs from basic statistics?
The measurement of GFCF in software in the national accounts will be correct only if national accountants possess the relevant basic statistics. This report concludes that the following data are needed in order of priority shown below:
1. Business surveys that include specific questions on total software expenses, differentiating between final and intermediate users, and including the information necessary to comply with the SNA definition, and not the business definition.
2. Software price indices, (at least for pre-packaged software).3. More information from international trade statistics that would allow the calculation of a global figure for
international trade in software, covering not just goods but also computer services and royalties,
Point 3 is of particular relevance to classification systems. Product classifications must recognise software as a distinct entity. In addition the distinction made by the SNA between originals and reproductions needs to be accomodated.
Net Domestic product and Gross Domestic Product
The discussions in the task force were sensitive to the impact decisions would make on GDP and investment. For many transactions it was relatively easy to define "expenditure" as either investment (GFCF) or intermediate consumption (IC). For some however the borderline between the two was not so clear. In these cases strong arguments were presented for both possibilities – IC and GFCF. Indeed, looking at some of the arguments in isolation, different recommendations could have been made by the Task Force. It is interesting to note, in this context, that the impact of different recommendations would have affected Net Domestic Product (NDP) less than it would GDP. National Accountants however mainly focus on the latter. If the emphasis was instead on the former it is possible that less importance would have been placed on the delineation between IC and GFCF (particularly where the distinction was not obvious), and instead, more on the measurement of software capital consumption. This illustrates some of the advantages of using (the often overlooked) NDP as an additional measure of economic activity in this context.
10

STD/DOC(2003)1
Chapter I: Classification, Definition and Conceptual Issues
1.1 Definition of software – originals, reproductions and, games
1.1.1 The SNA Definition
Paragraphs 10.92 and 10.93 of the SNA define software as:
Computer software that an enterprise expects to use in production for more than one year is treated as an intangible fixed asset. Such software may be purchased on the market or produced for own use. Acquisitions of such software are therefore treated as gross fixed capital formation. Software purchased on the market is valued at purchasers’ prices, while software developed in-house is valued at its estimated basic price, or at its costs of production if it is not possible to estimate the basic price. Gross fixed capital formation in software also includes the purchase or development of large databases that the enterprise expects to use in production over a period of time of more than one year. These databases are valued in the same way as software, described above.
With the exception of databases, this definition is entirely consistent with the general definition of investment in the SNA (10.26). However it is clear that, in practice, it has been difficult for National Accountants to consistently interpret this definition across countries. Part of the problem relates to the meaning of software, which has been criticised as being too ambiguous. The Task Force sought to rectify this position by providing a more detailed and descriptive definition, using descriptions in common use.
1.1.2 Task Force Definition Of Software
Recommendation 1(1): product classifications should recognise software as a distinct entity, covering the multiple physical and legal formats which support software. This entity has two sub-categories: originals and reproduction of originals. Licenses are part of the category reproduction of originals.
Software consists of computer programs, program descriptions and supporting materials for both systems and applications software. Licenses to use or reproduce software are not separated from the underlying software, and are thus included in this category. Software covers the following sub-categories:
Original software: original software are machines used in the process of production of other products, and as such are considered as investment. Originals can be produced on own-account (they are then called “own account original software”) or can be bought (“purchased original software”). This includes games’ originals. Originals cover two types:
Originals for reproduction: original software whose purpose is to be reproduced. They are generally the result of the production of software editing companies.
Other originals: software that can be used in the process of production of other products.
Reproduced software: reproductions of software are copies of original software. They include software giving users the rights, or license, to use, and software that gives the rights, or licenses, to reproduce:
Licenses to use:
They are mostly marketed, and thus called "packaged software" or "off-the-shelf software". In general they legally provide a license to use the software. This category includes reproduced software for final use and reproduced software for bundling in hardware, other equipment or other
11

STD/DOC(2003)1
software. This category also covers "multiple copy" licenses to use and software "rented" for use, for which payments often take the form of "royalties". It excludes licenses that permit copies to be made for sale.
Licenses to reproduce:
Licenses to reproduce permit companies to make further software reproductions (licenses-to-use) for subsequent sale. These reproductions can be sold via licenses-to-use or as part of a bundle, whether the bundled software is included separately or embedded directly onto hardware. Often, licenses to reproduce are paid for using royalties.
Software must be used in production for more than a year and satisfy the small tools’ rule. The development of any "original" is own-account production for investment, and should be recorded as asset category AN1122. Games’ software should be treated in the same way as conventional software, reflecting the similar production processes (and producers) for games’ and conventional software.
Double-counting? - Clearing up a misconception
In the proposed definition, above, an important distinction is made between an "original" and a "reproduction". There is an important reason for this.
In practice there has been some confusion concerning the distinction between the "reproduction" and the "original" from which it was produced. This has led some national accountants not to value "originals" on the (mistaken) grounds that doing so results in double counting. This interpretation of SNA is incorrect and the purpose of this box, and indeed the definition presented above, is to clarify this. The reason for this misconception is best explained by an example.
Consider a software producing company that produces both "originals" and "reproductions", and assume that reproduction costs are negligible. Its sales of reproductions can be directly attributed to the costs incurred in generating the original. So, the total value of reproduction sales is equal to the "imputed" value of the "original" (since the value of the original is equal to the current value of expected future revenue, sales of reproductions). In other words, if the value of the original is X, then output by the Software Company (over the lifetime of the software, greater than one year) is 2X.
Now consider the case of the software producing company selling the "original" in its entirety to another company, rather than engage in reproductions itself. In this instance output of the company is only X. Looked at from a "company" perspective, in the first example, it appears that the same inputs have been used to generate twice the output, compared to the second scenario, and, so, some might conclude that output is double-counted if the value of the "original" is capitalised.
But this conclusion overlooks an important point. The company that purchases the "original" and produces reproductions also has output "X" over the lifetime of the software. And so (in the second example) it is clear that output in the economy as a whole is also 2X. In addition the "original" is clearly an asset as it provides capital services over a period of more than one year, and so should be capitalised. In both examples there is no difference in activity and so investment should be the same, meaning that in example 1, the original should be capitalised.
The key to this is to view the original as being distinct from the reproductions or copy/ies. Or to consider the original as being equivalent to a machine that is capable of producing copies. For example if a machine could be created that produced cars out of thin air say, the machine would be investment, as would the cars purchased by businesses. In this way it is easier to see that no double counting occurs. In practice the analogy is better made by recognising that some input costs are incurred in reproduction, in the same way as a car factory (mainly investment) needs inputs to make cars.
The result of this is that originals developed by software editing companies are valued and considered as investment. This is also the case for originals developed by manufacturing companies to be embedded in the hardware they sell. (The original provides intermediate services (copies) to be embedded). This approach is consistent with SNA recommendations.
12

STD/DOC(2003)1
The remainder of this chapter defines software transactions. It looks at flows of purchased software from a user’s perspective and tries to identify how these transactions should be treated in the national accounts, providing recommendations in each case. Finally, building on this exposition, concordance tables are presented that relate transactions to international "product" classifications and their recommended treatment in the national accounts.
1.2 Originals and own-account software
1.2.1 Own-Account Software
Own-account software defines a production process that leads to the creation of a software original. As such, and by definition, own-account software is always investment (and work-in-progress, destined for investment). Own-account production only leads to the production of an original.
Works in Progress and Unsuccessful Software Developments
For many capital goods, including software, production is a staged process that occurs over a number of accounting periods, and so the corollary to production on the expenditure side is "works-in-progress" until the asset is completed, at which point the cumulative value of "works-in-progress" (WiP) is transferred to investment. In general the asset is then purchased by another company. However, it can also be invested by the producing company (own-account production). This rule should be followed for software, if possible.
For software, however, very few companies capitalise "originals" at all; meaning that, in practice, estimation is largely left to National Accountants, who cannot differentiate own-account software development that is a "work-in-progress" from the "finished asset", without detailed (and largely non-existent) surveys. The Task Force was not able to fully discuss this issue and so was not able to make recommendations on this matter. Instead the Task Force concluded that, in practice, most own-account software WiP would ultimately be recorded as investment and, so, where it was not possible to identify WiP, own-account production should be recorded directly as investment.
Some participants pointed to practical consequential problems related to direct capitalisation, particularly where subsequent transfers of assets are not directly observable. For example Balance of Payments statistics do not always record asset acquisitions when an overseas company purchases a "Start-Up"’ company. As such recording the (WiP) software development of the "Start-up" directly as investment with no subsequent sale of the asset will result in an over-estimate of the capital stock of the exporting country.
The issue of WiP raises some consequential questions. In particular, whether our approach to directly capitalise WiP implicitly includes unsuccessful projects as investment.
In the SNA, some unsuccessful developments are recorded as WiP whilst development is on-going, and then written-off when the project is abandoned (in the other change in volume account, see SNA paragraph 12.46). This is consistent with business accounting procedures. However by directly capitalising WiP from the outset this approach is not possible. Instead the Task Force looked to the analogy of mineral exploration, where unsuccessful projects are, in practice, capitalised.
Either way the Task Force concluded that the impact of including unsuccessful projects as investment was not likely to be significant, as, in practice, the costs involved are likely to be small. Since it is usually clear at an early stage (little cost) that a project is unlikely to succeed and is thus abandoned. Equally it is unlikely that software developments are merely abandoned, more plausibly, corrective modifications are made to allow development to continue, in which case they are recorded as investment.
Recommendation 1(2): All own-account software is investment. (There is the issue of how to record unfinished own-account production, that is, "work-in-progress", but ultimately this ends up as investment.).
13

STD/DOC(2003)1
1.2.2 Valuation of software systems produced in-house
Own-account production should only include the costs of associated work conducted in-house, excluding any assets, but including procured goods and services, used in the production process. Put more explicitly this means that any purchased software (e.g. reproductions) with "asset" characteristics should be recorded directly as investment; where the purchased software provides capital services to the own-account production process.
1.2.3 Which inputs should be included? - The business definition
In theory, businesses value in-house software at "market-prices". Capitalisation occurs from the point at which technical and commercial feasibility is established. Because there is no observable "market price" the valuation is usually determined using a sum of costs method (or by imputing expected future revenue). In general, the following costs are included in the valuation:
• expenditure on material and services consumed in production• salaries, and other employment related costs of personnel directly engaged in production• any expenditure that is directly attributable to production• any overheads that can be reasonably determined
These stages can be described more precisely in the following way:
(1) Feasibility analysis (2) Functional analysis(3) Detailed analysis (4) Programming(5) Tests (6) Documentation(7) Training (8) Maintenance
Only costs incurred during stages 2-6 are included in the valuation of the in-house original. So, in practice, businesses value in-house software by treating stages 2-6 (if purchased) as intermediate consumption, including any (own employee) time spent on these activities (labour costs).
Recommendation 1(3): own-account software should include the following costs: compensation of staff and all internal overhead costs incurred in own-account production on stages 2-6 above and all expenditure on stages 2 - 6, excluding any expenditure on assets.
Research and development costs – Are these capitalised?
The treatment of R&D costs is a vexed and contentious issue in the national accounts. The recommendations made above for own-account software appear to open the door to recording R&D as investment.
Software R&D costs are likely to be included within any of stages 2-6 above (more likely 2-3). Since the recommendation is to record each stage as investment or (WiP), as and when it occurs, one might conclude, by extension, that this report recommends that R&D costs should, in theory, be capitalised. Indeed software publishing companies refer to these costs as their “research and development”. However it is not clear whether this conclusion can be drawn.The estimation procedure recommended in this report is designed to estimate the "market" value of own-account production using the sum of production costs and these costs will include software R&D costs in the same way as any other intermediate inputs. In other words software R&D costs, and other input costs, are merely used to value own-account production, they are not considered as assets in their own right; in the same way that plastic and metal say, are inputs to (and so contribute to the value of) a motor car. On the other hand, it is difficult to dismiss the equivalence that can be made between the capitalisation of R&D in software and the capitalisation of software itself, particularly if one considers business accounts.
14

STD/DOC(2003)1
Purchased software in own-account production
Assets that provide "capital services" to any own-account production process should not be included in the value of own-account production. Unfortunately, for some software products, the boundary between "intermediate" and "asset" characteristics is blurred. This is partly a consequence of recording own-account production in its stages as and when it is produced. For example, from the above, if stage 3 occurs as a result of in-house production in year "t", it will be recorded as both output and investment in year "t". If however stage 3, is purchased, and not produced on own-account it can be recorded in two ways (1) directly as investment, or (2) as intermediate consumption of a process of own-account production that, eventually results in an asset. It is important to recognise that in both approaches total investment is the same, only the allocation between own-account and purchased software is different.
That said, for many software products it is possible to identify asset characteristics such that they are treated as in case (1), this means all reproduced (packaged) and customised software should not be included in the valuation of own-account estimates (see the concordance tables for more information). However for some products, in particular, systems analysis and programming services provided on a per diem basis the delineation is not so clear.
As the objective of the Task Force was to achieve comparability of the global figure for software investment (and not the split between own-account and purchased), the Task Force concluded that both approaches were acceptable as long as own-account production and purchased software were measured in a way that ensured no double counting arose. For clarity, this report mainly presents the approach where purchased software is recorded directly as investment. The concordance table, at the end of this chapter also presents some commentary on the alternative method.
Recommendation 1(4): Software purchased as part of own-account production, with "asset" characteristics, should be recorded as investment. It should not be used as an intermediate input into own-account production, or in calculating the value of own-account production. Any other software purchased by the final user for own-account production can be directly capitalised or included as intermediate consumption within own-account production. In this report the former approach is mainly presented.
Own-account software - Updates of Originals, a special case
The treatment of updates to originals for example the valuation of Word 6 (an updated Word 5) follows from the above recommendations. Only the increase in value of the changes made should be capitalised.
Recommendation 1(5): Own-account software updates should not include the value of the "original" version, and instead should only reflect the increased value.
Sales of Originals
It follows that a sale of an original (similar to a transfer of intellectual property) is recorded at the value of the actual market transaction. This transaction should be treated in the same way as sales of existing assets as specified in SNA10.39.
Recommendation 1(6): Sales of "originals" should be treated as sales of pre-existing assets as specified in SNA 10.39. Cross-country transfers should be treated as acquisition/disposal of an intangible (original) asset, not non-produced non-financial assets.
15

STD/DOC(2003)1
1.3 Licenses to use and rentals
1.3.1 Licenses to use
A license to use is defined here as being distinct from a license to reproduce; (payments can be made by royalties, commissions, fees, or a straightforward purchase). It should be interpreted uniquely as a license to use a software reproduction (copy), whereas a license to reproduce (see 1.4.1) is considered as being a license to make copies of the original (or, more accurately, a payment for services provided by/associated with the original).
Software copies purchased outright for own-use, above a certain threshold (and not for bundling), should always be viewed as final demand, and for businesses, investment. This treatment is consistent with the SNA and any real economic meaning given to investment. This issue is not in dispute. The difficulty lies in implementation of this principle in practice, since software copies are rarely sold without some conditions attached. Commonly, these definitions specify that ownership resides with the "original" owner, or that payments are made in the form of regular license payments to use the software. Since ownership of the copies appears to reside with the owner of the original, this might suggest that expenditure on the copy, under most circumstances, should be recorded as intermediate consumption and not investment.
However there are good reasons to record software licenses-to-use as investment. These are listed below:
• Software licenses-to-use bought by a final user are "machines" that render services for more than one accounting period.
• Software purchased as a bundle (that is pre-installed with office machinery) is treated as investment (and was in SNA68 too). Treating (the same) software purchased separately as intermediate consumption but software purchased as a bundle as investment would mean that whole economy investment figures are determined by retail/wholesale-mechanisms; affecting comparisons of investment across countries and time, depending on differences in these mechanisms. For example if software licenses-to-use are treated as intermediate consumption, a country that sold all software as bundles would have higher (total) investment than a country identical in every way except that software is purchased separately.
• Strict ownership is not a necessary condition to determine whether expenditure is investment. One example of this is long-term operating leases, which for many goods/services are equivalent to finance leases (see above). Because of the relatively short shelf life of software any license-to-use for a period of time approaching this, begins to attain "finance-lease" characteristics.
• The licensee has significant ownership characteristics. Namely, that as soon as the licensee cancels the license the asset (license/software copy) no longer exists. This is a particularly strong characteristic of ownership.
• Where there is an intention to use the software for more than a year, treating the software (licenses) as intermediate consumption is equivalent to saying that the licensee is renting an asset. In order for this to be consistent, in an accounting sense, the software provider will have to record an increase in its own assets, which, for national accounts users, is arguably unhelpful. It is unlikely, even under the most generous interpretations, that software producers or national accounts’ users would consider these licenses the assets of the software producers.
The strength of these arguments varies depending on the nature of the license. Four specific examples of payment are considered below:
16

STD/DOC(2003)1
1) Simple purchase. When a copy is purchased with a single (up-front) payment, all four arguments, apply, and it is clear that this transaction should be recorded as a purchase of an asset.
2) Annual Payments. Two specific cases are considered:
(I) Sequence of annual payments (an initial payment followed by smaller "maintenance" updates )
Where the transaction covers an initial payment for acquisition of the software, followed by a series of smaller "maintenance license" payments in subsequent years, payments should be recorded as "investment". The license gives the user the right to free updates. These transactions should be interpreted as purchases of software copies in the first year and purchases of updates (improvements to the first version) in subsequent years.
(II) Sequences of regular (equal) annual payments
One particular and important case is where a license-to-use limits the licensee to use for one year only, with annual payments made every year to extend the license. This type of license (and payment) is not unusual (for example SAS). Conventionally this would be recorded in the SNA as intermediate consumption every year. This is irrespective of the fact that the licensee may have every intention, at the outset, to purchase licenses-to-use the same software for the next 5 years say. Indeed, as far as software is concerned, this is more likely than not to be the case, since companies rarely acquire software for use of less than one year. The fact that payments have to be made every year largely reflects contractual obligations and not intent.
In this respect it can be argued that companies nearly always intend to use software for more than one year. The acquisition of software by a company involves significant other start-up costs such as training, and it is unlikely that companies will undertake, or be willing to undertake, these additional costs every year.
In this way it can be argued that software should be measured on the basis of "intent to use for more than one year" and not "how payments are made". This fits in with definition of software in SNA10.92, which states "Computer software that an enterprise expects to use in production for more than one year is treated as an intangible fixed asset".
Other factors complicate this issue however. As explained in the following box, the economic characteristic of software, as an intangible, is that it can be copied very easily, at close to zero cost. As a result, the borderline between purchase and rental becomes blurred, contrary to the situation for tangible capital goods.
Regular Annual Payments – Discussion Box
The treatment of annual license fees has been one of the most contentious issues discussed by the Task Force. It was relatively easy to agree that annual license fees, with an initial payment, followed by smaller "maintenance" payments should be investment since these were little different from payments for an "outright" purchase. The case is not so clear however for license fees with "regular" annual payments.
Two specific cases of these types of licenses were considered:
(1) Where the license includes a contractual obligation to supply the software for all or most of the expected lifetime of the software. In this case an analogy can be readily made with “financial leasing”, and so the transaction should reflect the acquisition of an asset (with, in principle, a consistent application of the normal accounting rules for financial leasing
(2) Where the license does not include a contractual obligation to supply the software for all or most of the expected lifetime. In these circumstances the position is less clear. For tangible products this transaction would be recorded as intermediate consumption – as rental, and so, the same might be said for software. However with tangible products, where there is "rental" there is also an asset, which is recorded within the capital stock of the asset provider.
17
STD/DOC(2003)1
For example, in acquiring the services of a tangible asset (a crane say) one has two options: to buy it, in which case it is recorded as investment; or to rent it, in which case it is the investment of the owner. In both cases (total) investment is the same. The intangible nature of software however complicates this transaction. If software is rented (for more than one year), what exactly is it that is being rented? Is it the original, or a copy of the original?
If it is the original, there is no increase in investment as a result of the "rental". If it is a copy of the original then investment of the software-provider has increased by the value of the copy, equivalent to the flow described for tangible assets. The first case is conceptually not satisfactory on the grounds that the "original" is being rented (by, in practice, more than one user). It also implies that the level of investment in the economy depends on the mode of payment. Or, that the same "original" has a different valuation depending on the mode of payment.
Therefore, where rentals occur, a copy is in practice produced. In theory this should be recorded as an increase in investment of the software provider. This raises a number of complications. The first relates to the valuation of the asset being rented, where the full cost of the asset has to be valued and estimated in the year of production. The second, and related point, concerns the point of production, since it is not readily possible to determine when the reproductions were made, only when the payments for use are recorded and received. This is not a very practical approach. Instead, it makes more sense to record investment by the "renter", as long as there is an intention to rent for more than one year.
By extension (from the box above) we can conclude that all licenses-to-use (irrespective of the duration) should be recorded as investment, as long as there is an intention to use these products (by renewing licenses) for more than one year.
This means that some software purchased (legally) for less than one year may be investment and some intermediate consumption. What distinguishes one type from another is the notion of "intent", and the interpretation of this may differ across countries or even time, but this is not a problem peculiarly specific to software. Furthermore, if licenses-to-use, (for any duration), are treated as investment one needs to impute the full costs of the software in the first year, with license payments treated as interest payments in accordance with accounting rules on financial leases. The data requirements to do this properly are severe. As such the Task Force concluded that it was prudent to record software investment on licenses-to-use as being equivalent to actual payments made in that year, without any adjustments.
Recommendation 1(7): That licenses-to-use, of any duration, intended for use of more than one year, but excluding purchases intended for bundling/embedding, are treated as investment. In principle accounting rules for financial-leases should be implemented. In practice it is acceptable to record investment as being equivalent to actual payments as and when they occur. (For software that is purchased using regular (one year or less) payments, "payments" must be depreciated fully after one year).
3) Licenses of less than one year . Licenses, intended for use for less than one year, should be treated as intermediate consumption. At present the value of these types of licenses is not significant but this may change if software is made available through the Internet, say, on a "pay per use" basis. Licenses-to-use not intended for use of more than one year, do not lead to the creation of an asset, neither in the capital stock of the provider nor the user. From the outset it can be established that the software will not last for more than one year as it is the intention of the user to "destroy" it beforehand, and so under these circumstances cannot be considered an asset.
4) Rentals. The preceding discussions apply as much to software rentals (a rare occurrence, and so of limited practical significance) as they do licenses-to-use (indeed rentals should merely be viewed as one of the payment mechanisms for licenses-to-use). And, so, where there is intent to rent for more than one year, payments should be recorded as investment.
Recommendation 1(8): That rental payments for software intended for use of more than one year are treated as investment. See also 1(7).
18
STD/DOC(2003)1
1.4 Licenses to Reproduce copies for sale and Bundled/Embedded Software
1.4.1 Licenses to reproduce
The SNA (Paragraph 6.146) states that payments for licenses to reproduce should be treated as intermediate consumption. These payments can be described in various ways, fees, commissions, royalties but they are always in respect of services provided by the owner (of the original) and the owner records the use of the original as consumption of fixed capital in the production of services. The Task Force agreed with the SNA recommendation.
Three alternative treatments were considered for licenses of longer than one year as these displayed varying degrees of "asset" characteristics but these were ultimately rejected. The three alternative treatments are presented below:
1) Treatment of licenses-to-reproduce as intangible non-produced assets
In this treatment licenses to reproduce are considered as being intangible non-produced assets. When a license is issued, a transfer is made between the "original" and the new intangible non-produced asset (made in other changes in volume of assets account) where the value of the "original" is reduced by the value of the license. The subsequent transaction of the intangible non-produced asset is recorded in the capital account.
Comparing this sequence of events with the case where the owner of the "original" manufactures copies itself, two problems arise to invalidate this approach:
I. The total stock of fixed assets in the economy is lower; andII. The intangible non-produced asset is now assumed to be a production factor but as there is no
consumption of fixed capital on intangible non-produced assets, net value added is higher.
2) Production of a new asset
This considers the case where a license-to-reproduce is considered to be a new asset. In this way a sale of a license results in the production and transfer of an asset, increasing GDP and investment. This approach is ruled out immediately, on the grounds that investment will be double counted. Since total investment will include the value of the original, sales of rights to reproduce and copies made from using the license-to-reproduce.
3) (Part) Sale of a pre-existing asset
This section considers the license to reproduce as a part sale of the "original". This option was formulated because it reflects the position of some companies, who consider the license as a (often-transferable) asset.
Three reasons invalidate this approach
a) The unity of the "original" is broken. An economically abstract concept “parts of originals is introduced.
b) A sale of a license to reproduce will not result in an increase in output or value-added of the "original" owner. If reproduction is considered to have negligible (zero) input costs it would create significantly different value-added and output estimates between companies that carried out reproduction in-house and those that sold reproduction rights (i.e. asked another company to carry out the reproduction).
19

STD/DOC(2003)1
c) The license does not adequately satisfy the "ownership" criteria. The software producer always owns the "original" not the licensee.
Recommendation 1(9): That licenses-to-reproduce are treated as intermediate consumption. Where licenses have duration of longer than one year the usual rules of accrual accounting should be applied. The payment should be distributed over the lifetime of the licensing contract and recorded as payment in advance (F.7 in the financial accounts).
1.4.2 Bundles, Embedded Software (and sub-contracting on software for sale)
Bundling/embedding of software occurs when software copies are purchased or produced with the explicit intent of on-selling as part of, or within, another product – be it office machinery, other machinery, other software etc.
In this way bundled/embedded software can be created in one of two ways: The first is when copies are purchased from a software producer and subsequently bundled and sold on to another consumer. The second is when a license to reproduce has been acquired and (the value of) the copied software is embedded in another product, which is then sold on. In both cases the transactions should always be recorded as intermediate consumption. Bundled software can be invoiced separately to the customer, in which case the purchase of software can be treated like any other purchase of software by the final-use customer. It may however be included in the purchaser's price of the bundle in which case the software is included within the value of the bundled product, normally computers. The value of total investment is not affected by the difference in treatment.
Section 1.2.2. described how bought-in software services should be recorded when used in producing own-account software. Where software services are purchased with the sole intention of inclusion in another software product for sale, these services must be included as intermediate consumption. Purchases of customised software intended for reproduction and sale, whether as a bundle or embedded in other products, should be capitalised.
Recommendation 1(10): Any software (including outsourced software) purchased for bundling or embedding into products to be sold on should be treated as intermediate consumption.
1.5 Royalties
Payments for licenses-to-reproduce and licenses-to-use (and even rentals) are often described as royalties (sometimes commissions and fees); in fact the (license) descriptions given above are rarely used. It is because "royalties", in these circumstances, cover a diverse range of transactions with specific characteristics that has led to the specification of transactions given above - licenses to reproduce and licenses to use.
Recommendation 1(11): "Royalties" is a generic term referring to payments linked to licenses. In accordance with other recommendations concerning licenses-to-use, royalties corresponding to payments for licenses-to-use should be recorded as investment, and royalties for licenses to reproduce as intermediate consumption.
20

STD/DOC(2003)1
1.6 Maintenance
It’s difficult to say with certainty where maintenance should be categorised – investment or intermediate consumption (IC). The SNA recommends that maintenance be generally treated as IC but recognises that the dividing line between IC and investment is not altogether clear. It defines ordinary, regular, maintenance and repairs as intermediate consumption, and major renovations, taken at any point in time not dictated by the condition of the asset, that increase the performance or expected service life of the asset as investment.
It is worth noting that, under this definition, Y2K expenditure should be strictly treated as intermediate consumption since remedial action was needed before a certain date. However there is some ambiguity. For example, one might view any maintenance work that is not ordinary as investment. Although the SNA further defines ordinary maintenance to include any costs that cannot be avoided if assets are to continue to be used.
That said the ambiguity, as far as Y2K expenditure is concerned may not, have proven to be too demanding. Anecdotal evidence, and responses from the Questionnaire suggest that, in practice, institutions carried out repairs that went beyond merely correcting for Y2K, often replacing systems altogether, and so some actual expenditure related to Y2K was probably investment. Either way, the point is that it is not always clear how to define investment where maintenance and repairs are concerned, and this is arguably truer for software than it is conventional tangible assets. This point is not lost on the SNA and it is explicitly referred to in paragraph 1.54:
- In practice it is not easy to draw the line between ordinary repairs and major improvements, although the System provides certain guidelines for this purpose. Some analysts, however, consider that the distinction between ordinary repairs and maintenance and major improvements and additions is neither operational nor defensible and would favour a more "gross" method of recording in which all such activities are treated as gross fixed capital formation.
What makes the consideration of maintenance and repairs particularly problematic for software is that it is difficult to describe a software repair that is not an addition to an existing software system. For example there are few equivalents to the replacement of a part, say, in conventional plant and machinery. A repair to software systems involves a change in the configuration or code of any program, but not the replacement of a part, or repairing something that no longer works. In this way software repairs may largely be seen as improvements. Repairing "faults" introduced by bugs say, may be one example where an analogy can be made with replacements of defective parts. But other repairs or modifications, for example modifying software to provide protection from a bug, can be seen as analogous to giving a car a paint-job to protect it from unusually (unanticipated) wet weather. On the other hand it might be viewed as being analogous to fitting a new all weather engine.
Maintenance on the other hand suffers less from these problems. Conventional maintenance (distinct from repairs) such as systems’ checking, does not change the characteristics of the software and so is clearly intermediate consumption. There are however some complications in practice, particularly when existing software is adapted to operate on a new operating system. In this example it is not clear whether new software (and so GFCF) has been created, or, whether maintenance has been carried out on pre-existing software to allow it to continue to be used (and so intermediate consumption).
That said evidence, from businesses, suggests that, in practice, businesses can differentiate between maintenance and repair expenditure that is intermediate consumption and that that is investment.
The task force agreed on the following definition for maintenance and repair: all changes made to software that do not add a new feature to the software and that are not made voluntarily by the owner but are
21

STD/DOC(2003)1
imposed by a change in the environment of the software are to be considered as maintenance; and the costs as intermediate consumption. In this respect, Y2K modifications strictly limited to make a program Y2K compatible are to be considered as intermediate consumption. Changes in a program imposed by a necessary adaptation to a new operating system are also intermediate consumption. On the contrary, a software editing company that develops another version of the same program adapted to another operating environment is contributing to investment. In this case, the “change” is not imposed but voluntary, (and should not be considered as maintenance and repair activity). For example, the adaptation by a software editing company of a program originally made for Windows to an Apple environment is GFCF.
Recommendation 1(12): That maintenance expenditure is classified as intermediate consumption. Maintenance and Repairs that permit software to continue to be used in the same way under normal operating conditions, without including new features for the user, should be recorded as intermediate consumption.
1.7 Small Tools
For supply-based approaches, it is very difficult, if not impossible to determine the proportion of supply that can be considered "small tools" expenditure. For practical purposes therefore one might conclude that the small tools rule should be dropped. However this argument is not specific to software.
Recommendation 1(13): That the small tools’ rule is retained.
1.8 Databases
The capitalisation of databases in the SNA has proven to be the most intractable of the issues considered by the Task Force. The Task Force formulated a number of proposals but none has proven to be conceptually or practically satisfactory. Unlike own-account software the Task Force concluded that, in practice, businesses were in many cases better placed to estimate investment in databases than National Accountants were. This recognised the fact that, in practice, businesses applied very prudent approaches to valuation, and indeed rarely capitalised them, except when acquisitions were large and also included exclusive proprietary rights, which the Task Force agreed should be recorded as investment.
The remainder of this section presents the thinking of the Task Force, including evaluations of the proposals made.
1.8.1 The SNA
In recognising that databases produced economic benefits SNA93 recommended that they should be recorded as economic assets.
SNA 10.2 and 10.3 define economic assets as:
10.2 The assets recorded in the balance sheets of the System are economic assets. These are defined as entities:
(a) Over which ownership rights are enforced by institutional units, individually or collectively; and
(b) From which their owners may derive economic benefits by holding them, or using them, over a period of time.
22

STD/DOC(2003)1
10.3 Every economic asset must function as a store of value that depends upon the amounts of the economic benefits that its owner can derive by holding it or using it. However, this value does not usually remain constant as the benefits remaining often diminish with the passage of time. Different kinds of benefits may be derived from different kinds of assets, as follows:
(a) Some benefits are derived by using assets such as buildings or machinery in production;
(b) Some benefits consist of property incomes: for example, interest, dividends, rents, etc., received by the owners of financial assets and land;
(c) Finally, assets act as stores of value that may be realised by disposing of them or terminating them. While some assets may be held until the benefits derivable from them are exhausted, others may be disposed of before that point in order to realise the capitalised values of the benefits still remaining. Some assets may be held purely as stores of values (precious metals or stones, etc.) without any other benefits being derived from them.
It is clear that many databases satisfy these criteria. For example databases held by market research companies that sell data, or indeed directory inquiry databases owned by telecommunications companies. Arguably the definition can be extended to other databases for example Statistical Office databases or databases developed purely for in-house administrative purposes, (see proposal 2 below).
One of the chief problems faced by the Task Force was in defining exactly what a database was? And indeed how the qualification “large” for large databases should be interpreted; since the SNA gives no further guidance regarding the monetary value or measurable size specified for "large". Indeed the qualification means that the definition of economic assets for databases differs from any other economic asset (where only the small tools’ rule applies).
It seems that the qualification "large" was designed to be helpful, in so far as it meant that only extremely large (and valuable) databases such as directory inquiry databases were capitalised. However, with hindsight, this has not proven to be the case. From a practical perspective it is difficult to define large in a meaningful and non-arbitrary way and, more importantly, from a conceptual perspective it means that the meaning of "economic assets" for databases differs from other economic assets. Arguably the qualification "large" should be dropped from the SNA, which would make measurement easier (at least within a conceptual framework) but what matters more is defining what a database is, in a national accounts sense.
1.8.2 Definition of Databases
As a starting point and a means of illustrating how widespread difficulties are in defining databases, it is instructive to first review country practices. Questions 38 and 39 (shown below) of the software questionnaire specifically addressed databases, and their meaning:
38: What is your definition of a database?
39: What conditions need to be satisfied for purchases of a database to be recorded as investment?
Most countries responded to these questions by referring to the SNA definition, without attempting to define "large". In fact, in practice, most countries do not capitalise databases at all. The responses below from Canada and Denmark perfectly illustrate these points.
CanadaAs a practical matter, we have not yet capitalised databases in the SNA, at least not in full. Database software either purchased (DBMS, Microsoft ACCESS) or developed on own-account
23

STD/DOC(2003)1
has been capitalised, but their content, its creation and its updating have not been capitalised. This latter remains for future consideration.
DenmarkIs there a definition? One could say that implicitly our operational definition is the share of software production by IT-personnel that is not other types of software.
Clearly the lack of a definition for databases has played no small part in this difficulty. So the question is can a database be defined in a consistent, and measurable way?
The dictionary definition of database can be summarily described as follows:
A collection of data arranged for ease and speed of search and retrieval.
A more detailed (technical) definition, available from "Webopedia" (a web-based dictionary for computer terms) is:
A collection of information organised in such a way that a computer program can quickly select desired pieces of data - an electronic filing system. Traditional databases are organised by fields, records, and files. A field is a single piece of information; a record is one complete set of fields; and a file is a collection of records. For example, a telephone book is analogous to a file. It contains a list of records, each of which consists of three fields: name, address, and telephone number. An alternative concept in database design is known as Hypertext. In a Hypertext database, any object, whether it be a piece of text, a picture, or a film, can be linked to any other object. Hypertext databases are particularly useful for organising large amounts of disparate information, but they are not designed for numerical analysis. To access information from a database, you need a database management system (DBMS). This is a collection of programs that enables you to enter, organise, and select data in a database.
"TechWeb", another on-line technical dictionary, defines databases as:
A set of related files that is created and managed by a database management system (DBMS). Today, DBMSs can manage any form of data including text, images, sound and video. Database and file structures are always determined by the software. As far as the hardware is concerned, it's all bits and bytes.
In a literal sense therefore the definition of a database seems pretty clear, since all three definitions are in broad agreement. A database consists of two parts the Database Management System (the supporting software) and the data files stored on the DBMS. But how does this translate into the National Accounts? Ignoring "large" for now, this would mean that literally any information stored on an electronic format and held in a structured (electronic) repository should be capitalised, as long as it satisfied other asset rules (e.g. the one-year-rule). But from a philosophical perspective should electronic data really be considered as having asset characteristics?
1.8.3 Electronic Data
Electronic data refers to data available in an electronic format. However it is not clear how electronic data can be defined such that it is delineated from a DBMS. For example if significant electronic data from one database is reproduced for use in Excel spreadsheets and sold to another company, is the (Excel) data itself an asset, even though it is not supported by a conventional DBMS? After all Excel also has characteristics (in this case) that are similar to a DBMS. Following this argument through suggests that all (significant) electronic data should be capitalised. Indeed some electronic data also satisfies SNA 10.2 and 10.3.
24

STD/DOC(2003)1
If one considers data as being a form of knowledge, this marks a significant precedent for the SNA - the capitalisation of knowledge. By extension one might argue why data available on (some) books or data and (preposterously) facts stored in the mind are not also capitalised.
What is it that makes electronic data so special? Electronic data is knowledge converted into a format that facilitates ease of access (usually within a conventional DBMS). In this way it becomes easier to see why books are not capitalised but an electronic version of the same book on a DBMS might be (since multiple users have access). But if it is the "improvement in access" that is the defining characteristic of databases as assets, investment in databases can be "artificially" increased in the National Accounts, since the same data can be bought, reproduced, and sold many times. On the other hand some data is clearly more accessible in hard copy than it is in electronic format, and so the argument for capitalisation might be extended to (some) books too. Indeed some books last a great deal longer than electronic data, which can become obsolete and inaccessible due to changing technology and even ageing of the storage devices (discs, tapes).
However there are some distinguishing features of electronic data, for example a long time series of electronic data can be readily analysed in a way that hard-copy data cannot (unless it is first converted into an electronic format). By extension we can conclude that (significant) data manually input, or electronically copied, onto an electronic format has asset characteristics. But what does this mean for the National Accounts, since not everything that has asset characteristics is necessarily recorded as such.
Moreover, in practice, it is very difficult to consistently determine the expected life of electronic data, since, in theory, one can argue that all electronic data lasts for longer than one year, and so is intended for use for longer than one year. On the other hand just because the data exists for more than one year does not mean that it has a productive capacity that lasts longer than one year. For example a database of national accounts’ statistics for the first quarter of 2002 would have become practically worthless once statistics for the second quarter were available.
In addition, to be conceptually coherent, all databases should be capitalised, including administrative personnel databases for example, whether the databases are for own-use (and non-market services) or for market services. And the practical implications of measuring own-account database production for all of these databases are severe. Businesses will be very reluctant to capitalise them and for National Accountants it will be literally impossible to do so in a meaningful way. Unlike own-account software production, which can be sensibly limited to "software professionals" the same cannot be said of electronic data creators - (which in practice many of us are). This note for instance could in theory be thought of as investment. It is electronic, and it will be accessible for some time to come but is it really investment?. Indeed, is there such a thing as a professional database compiler?
Crucially, one might ask at what point electronic data develops asset characteristics. Is it when hard-copy data is originally converted into an electronic format? Or, is it when the electronic data has been transferred onto a DBMS? The former can be discounted for several reasons, particularly practical (and is considered in more detail in Option 1 below). But if it is the latter, as the SNA appears to imply, this is odd, since the DBMS does not change the electronic data in any way, it only provides a facility to access the data, which, outside of the DBMS, is not investment. In the same way, a drilling machine facilitates access to underground oil, for example, and is investment, but this does not make the oil GFCF in the national accounts’ sense, so why should "data" be investment when it is accessed by a DBMS?
25

STD/DOC(2003)1
1.8.4 Task Force Proposals
All of the factors considered above play a part in the proposals that follow, each of which describes in detail an approach considered by the Task Force in its deliberations. In each case it is important to recognise that a database will always have some part capitalised, that is the software (DBMS). It is the extra value added provided by the data, separate from the software, that needs to be considered.
Option (1)
That all acquisitions of electronic data with an expected working-life of more than one year should be recorded as investment. Where electronic data can be purchased or produced on own-account.
Problems
• It is difficult to consistently determine the expected life of electronic data, since, in theory, one can argue that all electronic data lasts for longer than one year, and so is intended for use for longer than one year.
• All databases are capitalised, including administrative personnel databases.• Measurement of own-account production of electronic data is practicably impossible. One might
advocate that own-account database creation should be ignored. However capitalising purchased (electronic) data but not own-account production of electronic data would be inconsistent, and compromise cross-country comparisons and longitudinal analyses.
Option (2)
This proposal is based on the belief that the SNA initially set out to record the databases of data (base) providers only, that is databases of companies engaged in (market) data services related to the database. The principal is that these companies can be readily identified and as such, own account database production of these companies (only) should be recorded as investment. Sales of data to companies (who may have identical but non-market databases) to other companies are recorded as intermediate consumption.
Problems
• In practice it is impossible to define these companies in an economically consistent manner. For example some companies/institutions are not primarily engaged in providing data services, but use (internal) databases as inputs into their production process. Under this proposal these databases would not be recorded as assets. In addition it is not obvious how databases owned by companies/institutions that sell some, but not all, data from the database should be recorded. This is important because many statistical institutions for example sell some data. Furthermore any database produced internally by a company for own-use that is subsequently sold to a data provider (to provide market services back to the original owner) would be an asset in the books of a data-provider, although no prior (own-account) production would have been recorded. In the same way any data-company that provides data services exclusively to one company that subsequently purchases the database would be recorded as asset-destruction (intermediate consumption) and not asset-transfer. In any case it is difficult to see why databases owned by Statistical Organisations say or used primarily for internal administrative purposes should not be considered as assets, if databases that provide market services are so considered, since they both provide the same services. To reinforce this point, no distinction is made in the National Accounts (or this report) for own-account software originals produced for internal use or for market-services.
26

STD/DOC(2003)1
Option (3)
That database are capitalised databases only when all exclusive proprietary rights are sold as transfers of existing assets, in other words sales/purchases of non-financial (produced) assets. Transactions should be recorded as "other volume changes in non-financial assets n.e.c (K9)". The value of the software (as oppose to the data) included in the database should be recorded as a normal transfer of pre-existing (software) assets, and the remainder as (K9). In practice when large databases are sold from one company to another it is often because the purchasing company has seen an opportunity to use the database in ways not previously anticipated by the original owner. In this way the value of the database increases (or decreases) depending on the purchaser, in other words the intended use of the database. This is analogous to increases (and decreases) resulting from conversions of dwellings to commercial use, which are recorded as (K9) in the SNA.
Problems
• Assets are transferred but no (own-account) production of the data in the database is ever recorded.
One might contend however that:
1. Conceptually there should not be. In any case large databases are developed slowly over time, and so (annual) own-account production is not likely to be significant; and
2. That the value of databases can increase or decrease depending on its intended use. In other words the value changes at point of sale not related to any production, and so this change in value (which is usually far in excess of production costs) should be recorded as "other changes in volume".
3. Equally in practice, such transactions are unlikely to be recorded as sales of existing assets. More likely they will be recorded as "take-overs" by companies.
1.8.5 Conclusion
The Task Force has not been able to agree on a recommendation for databases. However the proposal of the Task Force that no explicit change should be made to country approaches for the time being, broadly concurs with Option 3.
The capitalisation of databases raises a number of philosophical questions. Chief amongst these is the capitalisation of data, which can be copied many times, and, over which, ownership rights rarely apply. The deliberations of the Task Force point to prudence in considering this matter; namely that data should not be capitalised, mainly on practical grounds but also on conceptual grounds that merit further discussion. The OECD Task Force on Intangibles may provide some further insight into this.
1.9 Concordance Tables
This section acts as a bridge between the present Chapter and Chapter V, which describes the implementation of the “supply” approach. This approach is based (1) on the use of sales data and (2) on a macro-estimate of own-account production. As a result two concordance tables are presented below: (1) a table for “purchased software”, reflecting the purchaser’s “external expenditure on software”, and (2) a table for “own-account software”, reflecting the “internal costs” of development (and so the costs to the developer). It is important to note that the tables are linked, in the sense that they are presented in order to ensure that no double counting of flows occurs.
27

STD/DOC(2003)1
All the recommendations described above apply. Particular consideration should be given to transactions described in Section 1.2.2. This means that any software purchased as part of own-account production, and that can on its own be considered software, should be treated as investment directly. On the other hand any software purchased to be embedded and sold-on should be treated as intermediate consumption.
Software produced by own-account methods can occur in any of the "investment" classification categories listed below but in practice it will be difficult to identify this and so, in practice, software produced on own-account should only be recorded under "originals", or "customised software". For simplicity the concordance tables presented below for own-account production make no attempt to allocate production to a specific (detailed) industrial classification within computer services. For convenience the small tools’ rule is not explicitly referred to in the tables that follow but should be considered to apply in all cases. Transactions only relate to businesses and government.
1.9.1 CPA Concordance Table
What follows are concordance tables based on the European product classification system (CPA). Where the treatment is non-contentious (and evident) no further explanation is given.
The first table considers purchases of software and the second own-account production. That is, where software is intended for final-use by the purchaser and not intended for further processing nor for bundling/embedding (including outsourced purchases) in a subsequent sale, nor where the software is purchased as part of own-account production.
Table 1 – Purchases of SoftwareCPA Code Product Description Intermediate or
Investment72.1 Hardware consultancy services2 IC72.2 Software supply services and other related services
72.20.1 Recorded data bearing media etc.This category originates from the Harmonised System and is intended to cover the exports and imports of software "goods", i.e. the physical carriers of software such as diskettes and CD-ROMs as they are registered by customs’ authorities. These carriers can contain any kind of information, such as data, databases, software, pictures, etc. It is recommended that any items recorded within this category are transferred to the appropriate CPA category below.
Ignore
2 Category 72.1 in France includes sales that would normally be classified under 72.2.3. France should apply recommendations in 72.2.3 for a large part of its category 72.1. This example is specific to France but other countries may have similar problems, and so should convert their own estimates as necessary.
28

STD/DOC(2003)1
72.20.2 Programming services of packaged software products.Our understanding is that this category includes purchases of originals (including games) and reproduced software (on-the-shelf software, whatever the media). This includes licenses to use and licenses to reproduce and rentals.
Original software – (purchases of pre-existing software originals) GFCFOther reproduced purchased, rented, leased or licensed software expected to be used in production for more than one year. Including payments for "multiple-copy" licenses. (Payment can include, royalties, commissions, fees etc).
GFCF excluding games3
Other reproduced purchased, rented, leased or licensed software, expected to be used in production for less than one year. (Payment can include, royalties, commissions, fees etc).
IC
When purchased for bundling/embedding into products for subsequent sale (whether the products are hardware, other equipment (chips on planes, cars, boats etc) or other software products or just sold-on.
IC
Payments for licenses-to-reproduce software for subsequent sale. IC 72.20.3 Software consultancy and other supply services
72.20.31 Systems and technical consulting services(includes advice and assistance on technical matters, (equivalent to Stage 1 of the production process – see Paragraph 1.2.2.1 above )
IC
72.20.32 Custom software development services(Includes development (analysis, design and programming) of software for, and to meet the requirements of, a specific client (including self) and – modification of packaged software).
Software expected to be used in production for more than one year.(including -embedding in an own-account ’original’)
GFCF
Software expected to be used in production for less than one year, (This includes "customised" software purchased to be sold-on to another user/client.)
IC
72.20.33 Systems analysis and programming services(Includes provision of systems analysts' and/or programmers' services on a per diem basis to participate in one of the phases of the development of a system. The client supervises and retains the right to their work.)
Software expected to be used in production for more than one year(For inclusion/embedding in an own-account ’original’ – the value of own-account production should not include these costs if they are directly capitalised.If the software is purchased by a final-user for inclusion in an own-account "original" the expenditure may also be treated as intermediate consumption as long as its value is included in own-account production
GFCF
Software expected to be used in production for less than one year.(This includes "customised" software purchased to be sold-on to another user/client.)
IC
72.20.34 Systems maintenance services(Includes provision of assistance to keep computer systems (software) in good working condition. The maintenance may be corrective or preventive).
IC
72.20.35 Other professional computer-related services IC72.4 Databases and Database services
3 Unless purchased by games arcades, game rental companies etc
29

STD/DOC(2003)1
Where exclusive ownership rights are transferred GFCFAll other database services, including data sales etc IC
72.5 Maintenance and repair services of office, accounting and computing machinery IC72.6 Other computer related services IC
The Table below describes the treatment of own-account production of software.
Table 2 - Own-account productionCPA Code Product Description Intermediate or
Investment72 Own-account produced software
In practice the following should be capitalised:Compensation of staff and all internal overhead costs involved in the strict development of in-house software. This includes the development of in-house originals destined for reproduction. In other words, the internal costs of software editing companies incurred in this production should also be capitalised.Costs should only include those strictly related to the software itself. Costs related to the first phase of the software (Stage 1 above) or to the last phases (stages 7 and 8) should be excluded.
GFCF
1.9.2 US SIC Concordance Table
Similar concordance tables are shown below (Table 1a and 2a) using the US SIC classification4. NAICS codes and amounts of sales (in millions of US dollars for the US for the year 97) have been added for information and clarification.
Creating a concordance for the US SIC based on the CPA table is, in most cases, relatively easy given the similarity in classification descriptions. However there is one area where there is some ambiguity: NAICS 541512 (SIC 7373 and part of SIC 7379), computer systems design services. The exact definition of this activity is the following: activity of establishments primarily engaged in planning and designing computer systems that integrate computer hardware, software, and communication technologies. The hardware and the software components of the system may be provided by this establishment or company as part of the integrated services or may be provided by third parties or vendors. These establishments often install the system and train and support users of the system.
There could be various interpretations of this activity. One interpretation is that it relates only to the integration of the various hardware components. In that case, costs linked to these services are not to be included in the value of the software asset in itself. However, another interpretation is that the software cannot function without these integration services. In that case, these costs should be included in the value of the software.
4 The SIC was used rather than the more recent NAICS because of its similarity with the NACE/CPA classification. SIC and NAICS are industry and not product classifications but used here as if they were a product classification.
30

STD/DOC(2003)1
Table 1a – Purchases of SoftwareUS SIC Code
"Product" Description Intermediate or Investment
73.71 Computer programming servicesNAICS 541511, 38,300 US$: Custom computer programming services: services of writing, modifying, testing, and supporting software to meet the needs of a particular customer. This category is similar to CPA 72.20.32 Custom software development services and CPA 72.20.33.
Software expected to be used in production for more than one year(Including – embedding in an own-account ’original).If the software is purchased by a final-user for inclusion in an own-account "original" the expenditure may also be treated as intermediate consumption as long as its value is included in own-account production
GFCF
Software expected to be used in production for less than one year, including expenditure on maintenance and repair (see Section 1.6) and "customised" software purchased to be sold-on to another user/client.
IC
73.72 Software publishersNAICS 5112, 61,700 US$: establishments in this industry produce and distribute software (design, documentation, assisting in installation, provide support services to software publishers). This category seems similar to CPA 72.20.2 Programming services of packaged software products.
Original software – (purchases of pre-existing software originals; and originals) GFCFOther reproduced purchased, rented, leased or licensed software expected to be used in production for more than one year. (Payment can include, royalties, commissions, fees etc).
GFCF excluding games4
When purchased for bundling/embedding into products for subsequent sale (whether the products are hardware, other equipment (chips on planes, cars, boats etc) or other software products or just sold-on.
IC
Other reproduced purchased, rented, leased or licensed software, expected to be used in production for less than one year. (Payment can include, royalties, commissions, fees etc).
IC
73.73 Computer systems integrators and consultants“This category covers approx. 70% of NAICS 541512 Computer systems design services, (US$ 51200, 70% =US$ 35,800). This industry comprises establishments engaged in planning and designing computer systems that integrate computer hardware, software, and communication technology”. This category is related to CPA 72.30.31 Systems and technical consulting services. The definition of this category explicitly says that sales can include hardware. If hardware is included, this should be classified as GFCF in hardware. If not, under the point of view of this table which is to treat software services, these transactions seem to relate to intermediate consumption, because these costs do not relate to the asset software itself, but to its installation.
IC
73.74 Data processing servicesNAICS 5142, 30,840 US$. This is clearly intermediate consumption.
IC
73.75 On-line information systemsNAICS 5114191, 8,000 US$
IC
73.76 Computer facilities management servicesNAICS 541513, 15,100 US$: provision of on-site management and operation of clients computer systems.
IC
73.77 Computer rental or leasing IC
4
31

STD/DOC(2003)1
NAICS 532420, 5,700 US$: not related to software73.78 Computer maintenance or repair
NAICS 811212, 7,600 US$: not related to software
IC
73.79 Other computer servicesThis category contains NAICS 334611 Software reproducing (US$ 1,300), 30% of NAICS 541512 computer systems consultant (US$ 51200, 30% = US$ 15,900), and NAICS 541519 Other computer related services (US$4400). Except for the small flow of NAICS 334611, these services seem to be classified as intermediate consumption (considering “computer systems consultant’, see classification of 73.73)
IC
Table 2a - Own-account productionUS SIC Code Product Description Intermediate or
Investment73.7 Own-account produced software
In practice the following should be capitalised:Compensation of staff and all internal overhead costs involved in the strict development of in-house software. This includes the development of in-house originals destined for reproduction. In other words, the internal costs of software editing companies incurred in this production should also be capitalised.Costs should only include those strictly related to the software itself. Costs related to the first phase of the software (Stage 1 above) or to the last phases (stages 7 and 8) should be excluded.
GFCF
Appendix : Broad Concordance Table between CPA/ISIC and CPC
CPA ISIC CPC72.1 72.1 8314172.2 72.2
72.20.1 4752072.20.2 83142 part72.20.31 83142 part72.20.32 83142 part72.20.33 83142 part72.20.34 8316072.20.35 83149
72.4 72.4 8430072.5 72.5 87120 & 8713072.6 72.6 85990
32

STD/DOC(2003)1
Chapter II: International Trade Flows
2.1 Introduction: Identifying Imports and Exports of Software Goods and Services
What is the level of international trade in computer software? How much computer software does the US export? Is Ireland really the world’s largest exporter of computer software? The current international trade classifications and statistics provide a somewhat confusing and inadequate picture concerning these questions. What can reasonably be done to clarify the picture of trade in this important commodity?
This chapter addresses the measurement of computer software transactions in international trade. It restricts itself to trade in goods and services in the national accounts and balance of payments sense, that is trade between residents and non-residents of countries. It does not address broader concepts of trade in services that interest trade negotiators and might include foreign affiliates trade in computer software or movement of software engineers, except implicitly insofar as they are involved in resident/non-resident trade.
Although the OECD-Eurostat task force was initiated to study national practices in capitalisation of software in the national accounts, the principal aim of this trade component of the study on software is to identify more accurately international flows of software, whether or not particular sets of transactions are regarded as part of capital formation. However in order that national accountants have more useful trade information there is a need to improve the link between output products and trade products, whether goods or services both in international classifications and in their national implementation including in data collection.
More specifically the chapter sets out and summarises the results stemming from the trade flows section (3.1) of the Questionnaire on Measurement of Software in National Accounts distributed in October 2001.
The chapter seeks to identify areas where measurement could be improved and makes recommendations on improvements to classifications, reporting practice and further work, in particular on the measurement of computer services, software royalty payments, trade in software goods, on software delivered online in trade in services and on the borderline between merchandise trade and trade in services.
2.2 International Trade Measurement Issues
Measuring international trade flows of software is fraught with difficulties. Software may be traded on a variety of media, both tangible and intangible, and by a variety of means. Software sales may take the form of licenses to use or reproduce software, which may or may not be accompanied by a physical supply of software. Software is often bundled with hardware or other computer or consultancy services. Computer software is only one of a number of so called digitized products along with, for example music, film, data, TV programs, news and, literature that may be regarded as presenting analogous measurement problems regarding international trade.
International trade is for practical reasons, e.g., the administrative apparatus associated with customs tax authorities’ interest in imports, partitioned into goods and services more rigidly than production. Eight examples of ways in which software can be traded as goods or services internationally are distinguished (there may be more):
33

STD/DOC(2003)1
i. The most straightforward case is where packaged software is traded with manuals on a physical disk e.g., a CD-ROM, although valuation is sometimes a problem here, if it is based on the medium (the CD-ROMs) rather than the software content and/or the extent of the user license.
ii. Software may be installed on equipment or machinery, e.g., a PC. The software traded then may be counted simply as trade in that type of equipment. Both these cases are treated as trade in goods.
iii. A single (physical or online) copy of some software may be sold to a foreign firm, which pays a license fee to make further use of it. The license payments are counted in trade in services, but will not be separately identified as software in the current international classifications.
- It is not uncommon for large firms/organisations to renegotiate the license to use agreements and ensuing payments can be divorced from any physical supply of software.
iv. A single (physical or online) copy of some software may be sold to a foreign firm, possibly an affiliated firm, under license to reproduce/sell further copies within certain (geographical/numerical) limits or bundle the software with hardware or software for resale. The royalty payments are counted in trade in services, but again will not be identified as software in the current international classifications.
v. Custom designed software, which is traded, if sold in physical format, is likely to be counted as trade in goods in the Customs reports, but may transferred to trade in computer services, following BPM5 guidelines or possibly purchase of assets depending on the nature of the transaction.
vi. Software may be traded internationally online (i.e. it is delivered online) and in such a case it will by default not be counted in customs returns, however there is as yet no international agreement on how such trade should be classified, whether as goods or services and if services which one. One OECD country counts these sales as royalties, another as computer services, and a third as a mixture of the two, but two more report that if software is purchased online by credit card from abroad it may be counted in travel expenditure. No countries are as yet able to separately identify these sales.
vii. Customers can subscribe to software services, where the software is frequently updated e.g. anti-virus software or databases and access updates online (possibly downloading all or part).
viii.Finally software may be sold internationally from one firm to an affiliated firm within the same multinational. This is likely to form a significant part of trade in software. Here there is no guarantee of uniform treatment and although this may be treated as in the cases above another possibility is that such transactions maybe treated as internal computer services, royalties, classified as miscellaneous management charges, trade in services with related enterprises, goods trade, or in extremis not recorded at all. There is also no guarantee of a market price valuation.
2.3 Concepts, Definitions and Classification issues
2.3.1 Where can software transactions be found in classifications of trade and in the balance of payments
The product "computer software" is not well identified in current international trade codes or balance of payments (BOP) items, but a number of items in the goods and services classification are relevant to software.
The international standard for recording merchandise trade is set out in the “International Merchandise Trade Statistics: Concepts and Definitions”5 (IMTS) and trade is classified into detailed products based on
5 “International Merchandise Trade Statistics: Concepts and Definitions”, United Nations 1998
34

STD/DOC(2003)1
the Harmonized System (HS) 19966. For trade in services the international standard is the IMF’s 5 th
Balance of Payments Manual (BPM5) which also sets out a classification of services. In certain countries the BPM5 categories are further disaggregated according to the Joint (OECD-Eurostat) classification. The new Manual on Statistics of International Trade in Services7 has introduced the Extended Balance of Payments Services classification (EBOPS), which is a disaggregation of the Joint classification. Annex 1 lists relevant trade and balance of payments services classification categories, in current use, that most directly relate to software.
For merchandise trade there are a number of categories of HS products which may approximately relate to trade in software goods. The IMTS in its paragraph 27 sets out guidelines for the recording of software goods in international trade. It describes goods that are carriers of software within HS heading 85.24. “This category includes, for example, ... packaged sets containing diskettes or CD-ROMs with stored computer software and/or data developed for general or commercial use (not to order), with or without a users’ manual. ..... However ... diskettes or CD-ROMs with stored computer software and/or data developed to order .... are to be excluded from international merchandise trade statistics.” IMTS goes on to add that where these goods are carrying software and/or data developed to order they should be treated as part of trade in services. It should be noted that the HS codes do not distinguish media carrying customised software from packaged software.
On valuation of trade in software goods IMTS para 123(b) states “Goods used as carriers of information and software, such as packaged sets containing diskettes or CD-ROMS with stored computer software and/or data developed for general or commercial use (not to order) be valued at their full transaction value (not at the value of the empty diskettes or CD-ROMS, paper or other materials)”.
IMTS para 48 (c) says that software goods purchased by travellers, including non-resident workers, or by foreign governements through their embassies or foreign military or other installations located in the host country are to be recorded as trade in services ( such transactions would not normally separately identify software).
For online delivery of standard (not customised) software or databases no clear classification guidance currently exists as is the case for some other digitized products. Statisticians have hesitated because of sensitivities in the "goods or services" debate about digitized products in trade negotiations in the World Trade Organization. If they are counted as goods market access agreements are much more comprehensive. Statisticians are not however necessarily bound to take the same view as trade negotiators.For software related royalty payments, which are counted in trade in services these are not at present separately identifiable from other royalty and license fee payments in the international classifications. Key questions for the study were whether these software royalties and license fees could be identified and, if so, were they sufficiently large to justify separate identification.
2.4 Results of the Survey of National Practices in the Measurement of Software in the National Accounts
This section sets out the responses to, and an analysis of, the trade flows section of the OECD-Eurostat Questionnaire on Measurement of Software in the National Accounts.
In order to assess the size of the software trade, to provide evidence on current national practices and justification for any recommendation on amending trade classifications, countries were invited to report or 6 . Harmonized Commodity Description and Coding System of the World Customs Union7 UN, Eurostat, IMF, OECD, WTO, UNCTAD http://www.oecd.org/pdf/M00017000/M00017039.pdf
35

STD/DOC(2003)1
estimate current levels of international trade in software goods and trade in services related to software e.g. computer services and that part of royalties and license fees that are related to software transactions. They were also invited to report on any national treatment/guidelines on online delivery of software and transfers of software originals.
To date 15 countries have responded to the questionnaire. Table 1 summarises the responses to the questions on the current price value of software trade flows in the reference year:
table 1Analysis of software tradeTrade summary Australia Canada Denmark US
Import Export Import Export Import Export Import ExportSoftware in: 1998-99 US$m 1998 US$m 1997 US$m 1992 US$mSoftwareGoods 518.11 67.67 289.86 46.51 130.70 77.70 100 2000Computer services 249.54 421.41 211.67 492.77 73.89 63.14 200 1400Software Royalties 218.35 185.24 N/A 883.74 288.59 32.86 100 1100Total software 986.0 674.3 501.5 1423.0 493.18 173.70 400 4500Royalties as proportion of total 0.22 0.27 N/A 0.62 0.59 0.19 0.25 0.24Table C comparison check 785.5 495.3 1.35 1134.5 419.26 110.38 400 2000**US Commodity flow data exclude trade in services in 1992
Trade summary Czech Republic Finland France GreeceImport Export Import Export Import Export Import Export
Software in: 1999 US$m 2000 US$m 1998 US$m 1998 US$mSoftware Goods 107.00 20.00 109.14 54.13 841.69 286.87 156.63 64.42Computer services 129.00 65.00 336.83 230.84 627.10 768.31 208.85 172.53Royalties on software N/A N/A N/A N/A N/A N/A 218.45 15.45Total software 236.00 85.00 445.97 284.98 1468.80 1055.18 583.92 252.41Royalties as proportion of total N/A N/A N/A N/A N/A N/A 0.37 0.06table C comparison 195 104 N/A N/A 1473.24 1057.4 583.92 252.41
Trade summary Israel Italy Japan** Netherlands***Import Export Import Export Import Export Import Export
Software in: 2000 US$m 1998 US$m 2000 US$m 1998 US$mSoftware Goods 35.91 N/A 598.06 35.10 591.26 248.99 518.72 797.99Computer services N/A N/A 781.59 285.68 3068.71 1569.16 366.48 442.10Royalties on software N/A N/A N/A N/A N/A N/A N/A N/ATotal software 35.91 0.00 1379.65 320.78 3659.98 1818.14 885.20 1240.09Royalties as proportion of total N/A N/A N/A N/A N/A N/A N/A N/Atable C comparison 183.45 5022.16 1360 300 613.95 248.41 1363.09 1421.06** Japan table C refers to 1999 and Japan computer services includes information services*** Netherlands computer services includes information services
36

STD/DOC(2003)1
table 1 contdTrade summary Spain Sweden UK
Import Export Import Export Import ExportSoftware in: 1996 US$m 1999 US$m 1999 US$mSoftware Goods 264.34 52.30 161.09 90.65 1595.97 963.99Computer services 494.09 187.41 544.03 680.67 1556.49 4006.10Royalties on software N/A N/A N/A N/A N/A N/ATotal software 758.43 239.72 705.12 771.32 3152.46 4970.09Royalties as proportion of total N/A N/A N/A N/A N/A N/Atable C comparison 1638.59 1309.35 1163.82 1170.84 2600.08 4617.70
2.5 General remarks concerning responses to section 3.1 International Trade in Software
Canada prefaced their response to the trade section with the following comments which relate the trade questions to the National Accounts questions and have a general relevance:
“There are some points of difference between the basic trade data and the basis on which investment assets are measured in the SNA*
1. Where the SNA says (for example at the outset of Section I above) that software for use in production for more than a year is classed as intangible fixed assets, the BOP trade series make no distinction as to the length of time traded goods or services are used.
2. Where the SNA calls for large size in the case of large computer data bases being included as intangible fixed assets, BOP services trade data make no distinction about the size of the base that gives rise to receipts or payments. (It is recognized that as a practical matter, Canada has not yet capitalized databases in its SNA).
3. Where the SNA includes improvement to existing fixed assets that go beyond ordinary maintenance and repair, the BOP trade by exception does record repairs in computer services rather than in goods, but the extensiveness of the repair seems not to be clearly demarcated.
4. Where the SNA values software purchases on the market at purchasers prices, and software developed in-house at basic prices where feasible, BOP software is valued at market prices, whether in the form of goods or services.
5. Basic BOP trade series make no distinction as to whether the products are for investment or for intermediate consumption.
* These extend beyond the usual differences in coverage where trade on the one hand encompasses all producers, and industrial output (whether capital or other products) is confined on the other hand to an industrial classification which may include secondary products of a different industrial category. Rectangular input-output systems typically resolve this through proration to either a product or an industry format.”
2.6 Trade in Software Goods (response to table L in the Questionnaire)
The questionnaire identified a set of five HS codes commonly regarded as mainly software, for full definitions see annex 1. All countries provided estimates of trade in software goods by HS code, but Israel was only able to provide estimates for imports.
37

STD/DOC(2003)1
Five countries further estimated the "software content" of the software goods traded namely Canada, Denmark, Italy, Netherlands and Sweden see table 2 below. All five have rather different approaches, but Italy’s and Sweden’s approaches are similar. All five countries discount entirely or partially the software content of HS 852439 - , while four discount entirely the software content of HS 852499 (Canada only for exports). Although not explicitly providing the full "software content" an estimate, France appears to concur with this approach by discounting entirely these two codes.
However different countries use different detail of commodity codes, frequently 8 or 10 digit, which allows some countries to identify software content with greater precision than others. But given a lack of user-friendliness in some of the HS descriptions one might wonder if these HS codes are all being interpreted in the same way by different countries/firms. In particular it is possible that 852499 is used more as a residual category for software in Netherlands and some other countries.
It is proposed that a revised standard set of HS codes be taken to approximate to software goods i.e. 852431, 852440, 852491 and 852499 (852439 should be excluded).
Canada noted the problem of undervaluation of software exports and the need to make BOP adjustments for customised software. The question of valuation of software at the customs frontier may relate to whether it is valued as the value of the materials (disks etc), whether the value of a single user licence is included or if it is specifically traded with a 50(say) user license, should that multiple use license be included in the value of the goods. The valuation issue is further discussed in “The Treatment of E-commerce and Software in German Foreign Trade Statistics”8. This raises the question of coordination of software measurement (valuation) in goods and services to ensure correct and uniform allocation but also to ensure full coverage and avoid double counting. This could be an issue for future follow up work.
table 2 Comparisons of estimates of software content in software goods by HS codeCanadaHS Code 1996
US$m imports imports of software % software content US$m exports exports of software % software content
852431 310.1 289.9 93.5 35.7 20.9 58.5852439 221.8 198.9 89.7 51.2 0.0 0.0852440 20.9 14.8 71.0 1.3 0.0 0.0852491 443.6 378.8 85.4 42.5 25.6 60.3852499 31.0 6.1 19.6 27.0 0.0 0.0Total of above 1027.3 887.8 86.4 157.7 46.5 29.5Denmark US$m % %HS Code 1996 imports imports of software software content exports exports of software software content852431 18.6 0.0 0.0 8.8 0.0 0.0852439 16.5 0.0 0.0 7.6 0.0 0.0852440 43.5 39.7 91.3 5.3 4.1 77.1852491 95.2 91.0 95.5 81.8 73.6 90.0852499 27.4 0.0 0.0 5.5 0 0.0Total of above 201.2 130.7 64.9 108.9 77.7 71.3Italy US$m % %HS Code 1996 imports imports of software software content exports exports of software software content852431 54.6 54.6 100.0 6.3 6.3 100.0852439 101.4 0.0 0.0 14.4 0.0 0.0852440 67.0 64.5 96.2 6.7 2.4 36.0852491 492.5 479.0 97.3 34.3 26.4 77.0852499 22.5 0.0 0.0 10.5 0.0 0.0Total of above 738.1 598.1 81.0 72.2 35.1 48.6
8 STD/NA/ITS(2001)8 Andreas Kuhn - German Federal Statistics Office
38

STD/DOC(2003)1
Netherlands US$m % %HS Code 1996 imports imports of software software content exports exports of software software content852431 106.9 - 46.3 53.43 - 24.4852439 62.0 - 46.3 92.25 - 24.4852440 11.6 - 46.3 24.19 - 24.4852491 65.0 - 100 72.08 - 100852499 221.3 - 100 506.12 - 100grossing up 103.0 99Total of above 518.7 - 798.0 -Sweden US$m % %HS Code 1996 Imports Imports of software software content exports exports of software software content852431 77.9 - 100 26.3 - 100852439 77.8 - 0 39.3 - 0852440 6.1 - part 5.6 - part852491 85.7 - part 62.0 - part852499 9.7 - 0 10.2 - 0Total of above 257.2 161.1 62.6 143.3 90.7 63.3Notes to table 2:
Canada identifies merchandise imports by 10 digit HS code and exports by 8 digit HS code. It draws attention to estimates made to remove customised software imported on physical media and to compensate for under-valuation (media valuation) of software exports to US. It also identifies Can $5m software imports in the reference year under an extra HS code 852452 (to be specific 8524529010 magnetic tapes recorded, software, of a width > 4 mm but <= 6,5 mm).Denmark uses national product V codes, which are related to HS and correspond to HS numbering at 4 digit level.Netherlands makes downwards adjustments to bring exports in line with domestic output of 7200200France also includes HS 852460 (cards incorporating a recorded magnetic stripe/recorded magnetic ledge cards ) as a relevant software code.Greece also includes parts of HS8525 (Transmission apparatus for radio-telephony, radio-telegraphy, radio-broadcasting or television, whether or not incorporating reception apparatus or sound recording or reproducing apparatus; television cameras; still image video cameras and other video camera recorders) and HS8527 (Reception apparatus for radio-telephony, radio-telegraphy or radio-broadcasting, whether or not combined, in the same housing, with sound recording or reproducing apparatus or a clock), as relevant to software.Spain provided some 8 digit HS detail for imports and export;US provides 10 digit HS (1989) codes
The questionnaire identified balance of payments services components and their codes from the IMF BPM5 and OECD/Eurostat joint classifications that were most relevant to software transactions. These components are defined in annex 1.
Fourteen countries provided at least some of the components in their response. Israel did not respond except to say that their balance of payments data were inadequate for this purpose.
Countries only considered software trade as being contained in BOP codes 262 (computer and information services), of which 263 (computer services) was generally considered the most relevant part, where it could be separately identified, although some hardware services are contained in 263, and 266 (royalties and license fees). Seven countries provided some data or estimates on the software content of trade in services components. Of these five provided data or estimates on software royalties. The software royalties ranged from 6% to 62% of the total software trade with a typical (median) figure of about 25% (see table 1). At least four of these five countries used business survey data to identify software royalties.
Of those identifying BOP code 264 information services, which contains database services, most excluded this code from the software estimate.
39

STD/DOC(2003)1
Thus one concludes that identification of trade in computer services (263) is important and that software royalties are possible to identify and that in combination these would mark an important step forward in measuring effectively software trade.
No countries were able to provide a breakdown of software services trade by type of software (i.e. standard/pre-packaged, custom etc).
The last line of table 1 adds the estimates of software trade made by the national accountants in response to the questionnaire’s table C and gives an alternative view of such trade to that compiled from trade statistics in table L of the questionnaire. While it is difficult to draw firm conclusions from this check, we note that in many cases the two totals for software trade are clearly related or reasonably close, but in some cases there appears no relation, which raises questions of data quality and coherence.
Notes:Canada: Receipts and payments of software royalties are identified in annual BOP surveys. Exports of software services are not explicitly identified in the BOP surveys; the estimate of Can$731m comes from the annual survey Software Development and Computer Services, foreign revenue by type of service. Imports of software services are not explicitly identified in the BOP surveys; the estimate of Can$314m is the BOP adjustment to remove customised software from merchandise imports.
Denmark: The estimates of software royalties are not directly based on totals from BOP statistics, because it is difficult to separate software from other services and royalty payments. Instead a distribution of payments by industry from the payments statistics of the central bank are used. A study of questionnaires from big IT firms had shown that most of their foreign trade was reported as royalties or license fees. It was decided to treat royalties in software production and wholesale trade in software as imports and exports of software. It follows that sub-classifications are not available. From 1999 a new system of payments statistics may give a more accurate picture of total trade in software and computer services.
Netherlands: Data on import and export of computer services are currently not available. From 2003 onwards, it is the intention to cover computer services as well when the compilation of the services trade balance will be transferred from the Central Bank to the Statistics Office.
US: BEA collects computer and information services trade associated with affiliated (intrafirm) transactions, however their value is not separately identifiable prior to 1997. It also collects royalties and license fees associated with affiliated (intrafirm) transactions, which do reflect software licensing agreements, however their value is not not separately identifiable prior to 1997.
2.6.1 Software delivered online
At present there are no agreed international guidelines for recording international transactions in online delivered (or use online of software) in the balance of payments.
Responses to Q45: Do you have any national guidelines in the recording of such transactions?
Twelve countries responded to this question. Those countries who responded that they had some national guidelines on recording of online delivery of software made the following points:i) this would not be separately identified;
ii) this would be included in trade in services or BOP 262, 263 or 266 or in two cases 236 "travel", if payment was made on an individual’s credit card;
iii) that mode of delivery should not necessarily determine the BOP allocation, the product itself should be a determinant and who the transaction was with;
iv) identification of Internet transactions and online delivery could be done within the context of e-commerce surveys.
40

STD/DOC(2003)1
Country notes:
Australia replied that these items are mostly included indistinguishably in BOP 263 or 266. There will be some trade in software services missing from the Australian balance of payments as international transactions in software between individuals and businesses are not covered by any survey. Where individuals pay for software delivered online by credit card this will usually be allocated as a travel debit as individual transactions are not identified.
Canada: As of 1999 reference year, respondents to BOP surveys on commercial services and transportation are asked to “include transactions concluded over the Internet”, on both the receipts and the payments side. The amounts, which relate to business-to-business (B2B) and business-to-consumer (B2C) exports, and to B2B imports, cannot be explicitly identified. For goods, see Canada’s notes to Table 2
Denmark replied that these transactions are included indistinguishably in trade in services.
Netherlands: The transactions in online delivered software that involve credit card payments are automatically classified under travel. The other transactions are treated as imports and exports of computer and information services (code 262), or as imports and exports of royalties and licence fees (code 266), depending on their specification.
US: For transactions in online delivered software, we advise our Survey respondents that reporting requirements are determined by who the transactions are with and not by where the services are performed or the location of the buyer and seller at the time of the transaction. Moreover, the mode of delivery (offline versus online is not necessarily a factor in determining where we record the transactions. For example, if a U.S. resident sells customized software to a foreign resident, we would record the transaction under computer and information services, regardless of whether this software was electronically transmitted or delivered by a U.S. resident temporarily working abroad for the foreigner. Thus reportable transactions may include those conducted over the Internet or other networks.
Finland, France, Greece, Israel, Italy, Japan, Spain, Sweden and UK do not have any national guidelines on the treatment, in the balance of payments, of software delivered online.
Responses to Q46: Do you have any empirical evidence or estimates on the value of such trade for imports and/or exports?
Fourteen countries responded, of which eleven had no empirical evidence. Those countries who responded indicated some indirect evidence about online or Internet purchases from household or Internet use surveys. Household purchases were less likely to be captured in the balance of payments than business ones. Household purchases were likely to be small at this time.
There remains a need for online sale/purchase and delivery of software to/from other countries to be further investigated through Internet use and e-commerce surveys with a view to bringing forward recommendations on BOP treatment before the next revision of the IMF’s Balance of Payments Manual.
Notes:
Australia: Whilst the value of international transactions in online delivered software will be captured in the balance of payments, it cannot be explicitly identified as the Australian International Trade in Services forms do not ask for mode of supply. Given that only a small number of adults (195 900) in 1998-99 were recorded as having purchased computer software/equipment over the Internet from Australian and/or overseas suppliers, it is expected that the value of household international expenditure would be small.
Canada: No, but a pilot estimate of services imports that consist of digital products, including software, is being evaluated. This represents a missing flow of B2C imports; it is derived from questions on a survey of Internet use by Canadian households done in 2001.
Finland: Internet trade in 2000 approximately 12 billion FIM, of which 90% domestic trade and 2/3 B2B trade.
41

STD/DOC(2003)1
2.6.2 Software Originals
It is not clear that the transfer of intellectual property rights is treated consistently across countries. The following questions attempt to establish this.
Responses to Q47: How is the transfer of intellectual property between countries treated? Is the trade recorded as a sale of a software asset original (exports). Are purchases treated as imports of an asset or are royalty payments recorded (as intermediate use of services)?
Twelve countries responded. The question of the sale of a software original and the transfer of associated intellectual property rights led to a variety of responses and some apparent confusion.
Most (seven) countries responded that this was in principle a capital account transaction and should be treated as such. The suggestion by three countries that it should be treated as a sale of a non-produced asset appears odd. Of these one country said that this would only be treated as capital account if it was a large transaction. The rest (five) indicated that it would be treated as a service (current account transaction), but it there is an element of doubt whether the question was sufficiently clear and unambiguous.
Notes:Canada: Trade in the usual BOP meaning of cross-border transactions, refers either to physical replications (ruled by the UN manual on goods trade to goods) or to services, which consist of royalty or other fee-for-use which is paid to the holder of the rights in one country by the client in the using country. The outright sale of the asset from A to B would give B the rights now to payments for the use of that asset by clients in A. The value of the asset sale is not recorded with trade in the current account of the BOP, but rather as a capital account transaction (disposal/acquisition of non-produced non-financial assets).
Australia: In the Australian balance of payments royalty and licence fees are recorded as an intermediate expense for imports and as service income for exports. Where software rights are bought or sold this is treated as the purchase or sale of an intangible asset. This is recorded in the capital account under transaction (disposal/acquisition of non-produced non-financial assets) or the net acquisition / disposal of non-produced non-financial asset. No asset breakdowns are published.
Denmark: If the guidelines of the Danish central bank were followed in 1997 trade in software originals should be recorded as sales/purchases of intangible assets. One could have doubts whether this was always the case. In new guidelines from 1998 the central bank has changed the treatment of software (and some other types of assets). Now originals should be recorded with "computer and information services". It may seem that this is a deviation from international practice in BOP-context. New proposals for international guidelines explicitly state that originals should be treated as intangible assets.(Denmark also commented that transfer of originals may be a part of FDI transactions)
Finland: Treated as import/export of assets. Royalty payments not relevant in Finnish case since all rights are retained.
Greece:The information is collected from the balance of payments. The source is the Central Bank of Greece. In the category of services the imports and exports are recorded as intellectual property (royalties), but software is not explicitly distinguished.
Israel: The trade in the mentioned items is recorded under “Services – other services” in the BoP of Israel.
Italy: The transfer of intellectual property rights between countries is recorded as a capital account transaction.
Japan: Since we have no explicit guideline for property as software original, the way of recording whether the trade in question are “Computer and Information Services” or “Royalties and Licence Fees” varies case-by-case, depending on the characteristic of the trade.
42
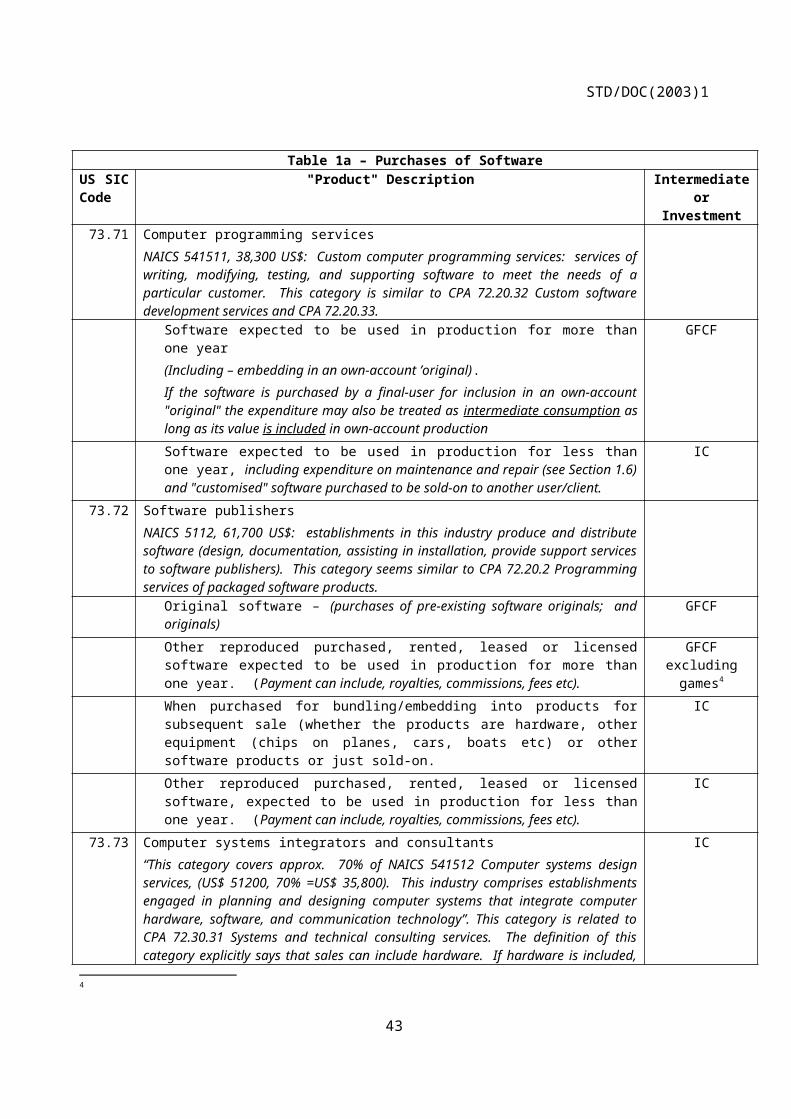
STD/DOC(2003)1
Netherlands: The current collection system does not provide for specific information on intellectual property rights. Payments for intellectual property rights may be registered under imports and exports of computer and information services (code 262), or imports and exports of royalties and licence fees (266), depending on their specification. Only for large payments it is checked whether these involve intellectual property rights. If that is the case, the payments are recorded as acquisitions (or disposals) of non-produced, non-financial assets. Otherwise the payments are treated as trade in services.
Sweden: The transfer of intellectual property rights between countries is recorded as a capital account transaction. However software is not distinguished from other inteleectual property.
Spain: If the original software is customised, then is registered as computer and information services. Otherwise, if it is a copy of general software (windows programme) is recorded as a good.
US: We record receipts and payments for the rights to distribute, reproduce, and use general-use software under royalties and license fees that was electronically transmitted or made from a master copy. This includes negotiated license fees for reproducing copies of general use software for local area network computer systems.
Responses to Q48 If transactions are between parent companies and subsidiaries, are these flows recorded? What methods e.g. transfer price taxes, are used to measure these flows?
Eleven countries responded. Several countries expressed concern about this area and planned further investigations. One country is able to check BOP returns against tax filings. It appears that most use straight reported transactions without adjustment. This is an obvious area for further research, but is an issue much wider than this specific context of software transactions.
Notes:
US: We record transactions between parents and subsidiaries. We collect transactions on the value of computer and information services on a survey. We also collect the value of transactions associated with software licensing fees between parents and subsidiaries on a survey, however, we cannot separately identify software fees from other royalty and license fee transactions.
UK: Within the UK, if subsidiaries have a separate VAT code then we have separate returns and then these flows would be recorded. Otherwise these would be internal transfers and would not be classified as capital formation. With respect to cross border transactions the issue is complicated and there are currently many unanswered questions. Further questions will have to be asked of contributors to ascertain how these transactions are handled.
Spain: Yes, the transactions are valued at market prices.
Netherlands: In the Netherlands, this is an issue of increasing importance and currently subject to further research.
Japan: Regarding the former question, the transfer of ownership is in principle recorded. Regarding the latter question, “Foreign Exchange and Foreign Trade Control Law” requires authorized foreign exchange banks and designated securities companies to report their transactions.
Israel: The transactions are recorded if transfer of currency through banks take place. Currently the measurement is being reviewed to improve estimates;
Italy: These transactions are not recorded (i.e. cannot be separately identified ?)
Finland:Recorded if parent and subsidiary located in separate countries.
Denmark: In principle these transactions should be recorded, as similar transactions between enterprises and the recorded values should be realistic. The possibilities of control might be further investigated.
Canada: Canada includes both parent to subsidiary as well as 3rd party transactions for its services, and records the affiliated transactions separately for its Commercial services component. This data is largely compiled directly from the annual BOP survey on Commercial services transactions. We are not aware of any special taxes on transactions involving transfer pricing. We do use Canada Customs and Revenue Agency filings (T106) to check and add certain coverage to our related party transactions in Commercial services. The T106 form for its part, was devised by the then Revenue Canada in the late 1980's to audit instances where transfer pricing was leading to inappropriate tax payments by tax filers.
43
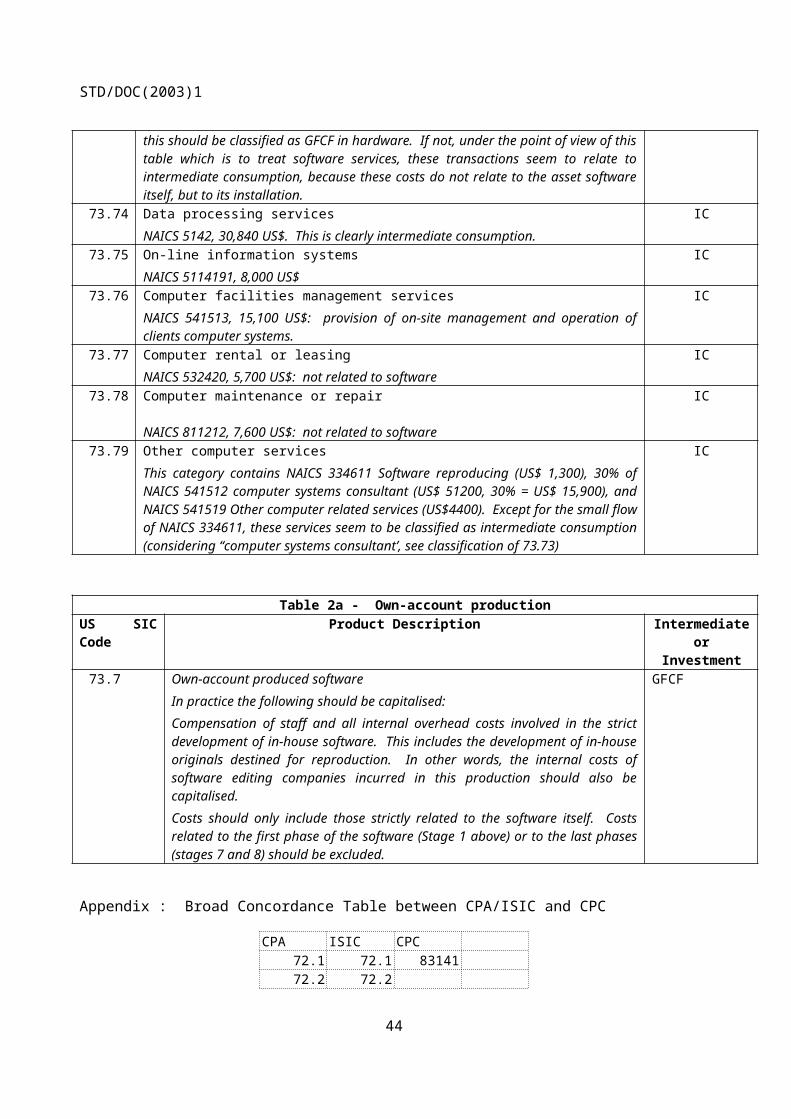
STD/DOC(2003)1
Australia: ABS asks businesses to measure transactions between parent companies and subsidiaries at the market rate and to report on a gross basis.
2.7 Draft conclusions and recommendations
Current international trade and balance of payments classifications and statistics are not as helpful as they could be in identifying international trade in computer software. Only a minority of responding countries appear to have access to a satisfactory set of data concerning trade in software. Supply-use tables should be made more consistent with trade flows in software. Indeed it is not clear to the Secretariat how countries treat trade and especially imports of software in supply-use tables.
National accountants, trade and balance of payments statisticians will need to cooperate further in this respect.
Recommendation 2(1): In order to clarify trade flows of software and increase international comparability, the product "computer software" in international trade statistics and in national accounts should be regarded as having broadly three main trade components:
i) software goods;
ii) computer services;
iii) software royalty and license fee payments.
Recommendation 2(2): The separate identification of trade in computer services (Balance of Payments (BOP) code 263) from computer and information services, where this is not already done, should be implemented.
Recommendation 2(3): The separate identification of software royalty and license fee payments in the balance of payments services classification (part of EBOPS code 266 at present) and in country reporting is recommended.
Recommendation 2(4): A standard international grouping of Harmonized System (HS) codes that represents trade in software goods to improve international comparability is desirable and the following are proposed: HS 852431, 852440, 852491, 852499 (852439 is excluded).
Combined the realisation of these four measures in trade and balance of payments would mark an important advance in effectively assessing international trade in computer software and their incorporation in the product balances of the national accounts in a more internationally comparable way.
Two main areas for follow up work are identified, where questions are unanswered and it appears premature to make any specific recommendation:
- Research into how software goods are valued and whether and how countries coordinate software measurement (valuation) in trade in goods and services to ensure a standard allocation, full coverage and avoid double counting;
- For treatment of online delivery of software in the balance of payments, it appears to be too early to make a consensus. The online sale/purchase and delivery of software to/ from other countries needs to be further investigated, probably through Internet use and e-commerce surveys, with a view to bringing forward recommendations on the balance of payments treatment before the next revision of the IMF’s Balance of Payments Manual expected in 2007.
44

STD/DOC(2003)1
2.8 International Trade Codes for Computer Software
2.8.1 Merchandise Software Trade Codes
HS 1996 [No change for 2002?-to be confirmed]8524: Records, tapes and other recorded media for sound or other similarly recorded phenomena, including matrices and masters for the production of records but excluding products of chapter 37852431 discs for laser reading systems for reproducing phenomena other than sound or image852439 discs for laser reading systems other [exclude?]852440 magnetic tapes for reproducing phenomena other than sound or image852491 other for reproducing phenomena other than sound or image852499 other - other
Are there other codes relevant to software?e.g.:-852460 cards incorporating a magnetic stripe (includes "smart" cards with embedded processing chips?)950410 video games of a kind used with a television receiver
Joint OECD-Eurostat Classification of International Trade in Services
International BOP code
262 Computer and information services
263 Computer services
EBOPS Description: Computer services consists of hardware and software related services and data processing services. Included are hardware and software consultancy and implementation services; maintenance and repair of computers and peripheral equipment; disaster recovery services, provision of advice, and assistance on matters related to the management of computer resources; analysis, design and programming of systems ready to use (including web page development and design), and technical consultancy related to software; development, production, supply and documentation of customised software, including operating systems made on order for specific users; systems maintenance and other support services such as training provided as part of consultancy; data processing services such as data entry, tabulation, and processing on a time-sharing basis; web page hosting services (i.e., the provision of server space on the Internet to host clients’ web pages); and computer facilities management.
Excluded from computer services are the provision of packaged (non-customised) software (classified as goods and therefore not included in EBOPS9) and non-specific computer training courses (included in other personal, cultural, and recreational services).
264 information services includes news agency and other information provision services includes: (EBOPS description:)
a) News agency services include the provision of news, photographs, and feature articles to the media. In the GNS/W/120 list of services that was a basis for the GATS commitments in the Uruguay Round, these services are a part of “recreational, cultural and sporting services” rather than computer and information services in the case of BPM5. These services are therefore separately identified in the EBOPS classification, thus facilitating a linkage with GNS/W/120.
9 At the time of finalisation of this Manual, the classification of the provision of software that is downloaded through the Internet was still under discussion.
45

STD/DOC(2003)1
b) Other information provision services includes database services––database conception, data storage, and the dissemination of data and databases (including directories and mailing lists), both online and through magnetic, optical, or printed media; and web search portals (search engine services that find Internet addresses for clients who input keyword queries). Also included are direct, non-bulk subscriptions to newspapers and periodicals, whether by mail, electronic transmission or other means.
c) [PK (Eurostat) remarked that HS descriptions do not distinguish customised software. He also said that database services were included in BOP code 264. He wondered if any country could provide product details from credit card payments].
266 royalties and license fees
EBOPS description: This Manual recommends a disaggregation of the BPM5 component into franchises and similar rights and other royalties and license fees. Franchises and similar rights comprise international payments and receipts of franchising fees and the royalties paid for the use of registered trademarks. Other royalties and license fees includes international payments and receipts for the authorised use of intangible, non-produced, non-financial assets and proprietary rights (such as patents, copyrights, and industrial processes and designs) and with the use, through licensing agreements, of produced originals or prototypes (such as manuscripts, computer programs, and cinematographic works and sound recordings). Payments and receipts for the outright purchase or sale of these assets and rights are excluded (following BPM5, these are recorded as capital account transactions, not as services). Excluded also are distributive rights for audiovisual products for a limited period or a limited area; these are included in audiovisual and related services.
285 services between affiliated enterprises n.i.e.
EBOPS description: Services between related enterprises, n.i.e., is a residual category. It covers payments between related enterprises for services that cannot be specifically classified to any other component of EBOPS. It includes payments from branches, subsidiaries and associates to their parent enterprise or other related enterprises that represent contributions to the general management costs of the branches, subsidiaries and associates (for planning, organising and controlling) and also reimbursements of expenses settled directly by parent enterprises. Also included are transactions between parent enterprises and their branches, subsidiaries and associates to cover overhead expenses.
N.B. There is as yet no comprehensive and clear guidance for the treatment of online delivery of digitized products including software.
[A further task is to identify the product CPC codes associated with these HS and BOP codes and to clarify the link with output products as expressed in the main National Accounts paper in terms of CPA and NAICS. The North American Product Classification system is also being developed and should be monitored]
46

STD/DOC(2003)1
Chapter III: Deflators
3.1 Introduction
The inventory of country practices showed that the price indices used for computer software investment by countries are very different. This reflects largely the situation that for many countries no indices are available. Index series like prices of office machinery or even more general indices are used instead, and those indices are normally rising whereas at least prices for pre-packaged software decrease in reality. Graphs 1 and 2 show how prices of total of software investment develop in the national accounts of 11 countries.
Graph 1:
Graph 2:
* Estimated by the OECD
It should be also noted that time series of countries are not necessary comparable over time. Different methods might have been used in the past due to differences in the availability of base data..
47

STD/DOC(2003)1
Like for any other areas of GDP, special price indices for software products should in principle be available to be used in the deflation of software expenditure. This is not the case in practice and it is unlikely that the situation would substantially improve in the very near future. Developing work has started in a number of countries and software price indices are also included in the programme of the Voorburg group but getting results and their implementation take time. Not enough experience has been accumulated so far to evaluate what kind of price indices is feasible to be developed, and more specific recommendations can only be made later on.
The Draft European Commission Decision on price and volume measures in national accounts by Eurostat provides recommendations on the deflation of software in the national accounts. The recommendations are quite general, and they are proposed to be implemented by 2005.
As a consequence of the situation, it is not provided here guidelines on what kind of price indices should be developed in the longer term but only discussed briefly on various options in present situation. Ongoing research in countries might reveal directions to go in the future. However, for achieving a reasonable comparability between countries in the short term it is appropriate to agree on basic principles to be followed until better price indices become available.
It is also self-evident that best results can be achieved in an input-output framework. This would ensure that solutions made in the deflation are internally consistent. This is particularly important because for many countries a significant share of software is imported. If prices and volumes in the use side are consistent with imports, errors, at least at the GDP level will not be very significant. It is desirable that the classification of software services is reasonably detailed but possibilities might differ in this respect country by country and specific price indices cannot possibly be formed by a detailed classification.
Price indices should be available separately at least for the three main types of software: pre-packaged, customised and own-account software. This is particularly important because their expenditure shares are changing (the share of pre-packaged software is growing and own-account software decreasing) and their price development is very different.
Recommendation 3(1): Price indices should be available separately for the pre-packaged, customised and own-account software to take into account their different price development and changing shares in software expenditure.
3.2 Deflation of pre-packaged software
Pre-packed software is the only type of software services for which prices are clearly observable. However, the difficulty is how rapid changes in the market could be reflected in price indices. There are two main options to build such an index, hedonic and matched model. In principle, hedonic models and frequently updated matched models should give close results.
US have experience on both of them and the index used for 1985-93 was an unweighted average of the percentage changes in a hedonic index and a matched model index. The hedonic index was not applied alone because of concern that it would overstate price declines. When the characteristics of high-priced packages with limited sales were incorporated into lower priced packages with much greater sales, values derived from the high-priced packages got too much weight. This example illustrates well problems in applying hedonic indices: valid results can be achieved only if an index is regularly revised, possibly even sub-annually. This is a resource-consuming and data hungry requirement.
48

STD/DOC(2003)1
As to the matched model price index, it is difficult to establish it in a fast changing market. An index based only on overlapping products in two periods and ignoring new products means that products actually sold are not sufficiently represented in the index. Normally the price movement will be underestimated.
Hedonic software price indices have not been available in US since 1993 but a matched model has been used. However, for correcting an upward bias of the index, it is adjusted downwards by 3.3 per cent. The adjustment coefficient is based on 50% of the difference between the hedonic and matched model indices in the period when both indices were available. It is difficult to evaluate how “correct” this adjustment is. In years, when both indices were available, their difference varied strongly.
It is stated in the draft Commission Decision by Eurostat as follows: The A method is to deflate with an appropriate PPI. An appropriate quality adjustment procedure (e.g. based on hedonics) is essential. Less appropriate PPIs will be B methods. Also the US index for packaged software, adjusted for exchange rate effects or different general price changes, will be a B method. Care should be taken however to reflect the different timings of releases of new software in the US and in Europe.
Self-evidently, a use of mechanically adjusted price indices is not an acceptable solution in the long term. Relying on them would indicate that the quality of a price index is not good enough. A use of a fixed adjustment would also imply that a bias of an index remains the same in the course of time which assumption is not justified. However, developing an unbiased index is difficult in practice and adjustments might still be needed. In this case any adjustments to be made should be based on available objective data and made transparent to users. An aim of adjustments is also to improve comparability of the price index with corresponding indices in other countries.
Recommendation 3(2): In the long term, price indices should be developed covering business and household (including games) software. The price indices should take adequately into account qualitative changes of software. In practice, such price indices might still be biased and adjustments are needed. If that is the case, adjustments should be based on available objective data and made transparent to users. Improvement of the comparability with other countries is an important criterion in the adjustment procedure.
Only second best solutions are available in the short term. It seems appropriate to use the US price index for pre-packaged software adjusted by changes in exchange rates. The US software has a dominant share in the market and, on the other hand, the use of the same index ensures the best comparability between countries. It should be also noted that a consistent treatment of imports and use of imported products does not cause errors at the GDP level.
Recommendation 3(3): In the short term, it is better to use the US price index for imported pre-packaged software rather than to use deflators that are not directly related to software. The index should be adjusted on the basis of changes in exchange rates and it should reflect different timings of releases of new software in the US and in a country. As to the deflation of domestic software production, there is no reason to assume that prices develop in the same way as prices of imported software. However, as long as price indices are not available, it might still be better to use the US price index adjusted by the relative inflation rate between a country and US (preferably PPI for a country vis-à-vis PPI for US) also for domestic production. It should be ensured that supply and use of software products are treated consistently for minimising errors at the GDP level.
3.3 Deflation of customised software
It is very costly to develop price indices for customised software although some data on tariffs might be observable and relatively easily available. Possibilities are model pricing or following price development
49

STD/DOC(2003)1
of contracts. However, it is difficult to find solutions to their weaknesses. Model pricing would require continuous updating of price specifications, and the main problem in the use of contract prices is to capture quality changes.
Price indices for customised software is estimated in US and Canada as a weighted average of pre-packaged software index and own-account software index (which is based on deflation of cost components). Weights of the two indices are arbitrary defined, for pre-packaged software 25 and own-account software 75.
The draft Decision by Eurostat proposes an approach based on representative pricing (that is producing companies are asked to select some of their products that are representative for their total output) could be explored and has the potential to constitute an A method. Another A method could be an approach based on model pricing, if the conditions of representative pricing are fulfilled. Those conditions are that the prices received for those products are followed over time, as well as the characteristics of the products in order to control for quality changes.
Recommendation 3(4): In the long term price indices might be possible to develop for customised software although it is not easy to establish an index that is based on representative set of products and take into account quality development. For the time being (until 2005) an index based on averaging pre-packaged software index and input-cost index might be appropriate. If output and expenditure data are available by detailed classification, it could be considered to use different weights depending to what extent the services concerned can be produced on an own-account basis.
3.4 Deflation of own-account software
The volume of own-account software is estimated in US and Canada by total costs using an average of wage and salary indices and price indices of intermediate consumption. The draft regulation of Eurostat states that the result of the model pricing of customised software approach could be used as a proxy (B method), if it can be shown that an external company could also have produced the own-account software. It is also stated in the Eurostat regulation that price indices based on input prices are not accepted after 2005.
Software originals differ from other types of own-account software. They can be deflated by the price index for pre-packaged software.
Recommendation 3(5): In the long term, when price indices for customised software become available, they can be used for own-account software services. Input-price indices should not be used. For the time being (until 2005), the best option is to rely on input-price indices, that is on the use of salary indices without any mechanical productivity adjustments, and adequate indices for intermediate consumption. Software originals can be deflated by the price index for pre-packaged software.
50

STD/DOC(2003)1
3.5 Summary table of deflations used for software
Table 2: Comparison of deflators used for softwareCountry Own-account Customised Pre-packaged
Australia Prices are assumed to fall by 6% a year.Canada Weighted average (2:1) of
programmer labour costs and non-labour inputs to the computer services industry
Weighted average of own-account and pre-packaged (1:3)
Average of U.S. index for pre-packaged adjusted for exchange rates. A new index is due for release next year
Czech Republic Price indices for the output of the computer services industryDenmark 1993-95 1996-97 1998 +
Weighted average of labour costs and PC hardware (1:1).Weighted average labour and PC hardware (3:1) Weighted labour and PC
hardware (1:1).Geometric average of labour and hardware (3:1)
Finland 1975-97 1998 +
Average earnings index for the computer services industry.Weighted average of labour costs of the computer services industry and US pre-packaged software index adjusted for exchange rates (1:1).
France 1995 (-) 1995 +
US price index adjusted for exchange ratesLabour costs
Greece General (whole inflation) price indexJapan Corporate Service Price Index for “the development of computer software tailored for
corporations”, based on the labour costs.Netherlands Labour costs of ICT
personnel.Producer price index Producer price index
Spain Based on producer price index for office machinery and the general consumer price index (excluding renting)
Sweden Average earnings index for the computer services industryUK Average earnings series adjusted for the computer services industry with 3%
productivity adjustment since 1996.US Weighted average (roughly
1:1) of programmer labour costs and non-labour inputs to the computer services industry
Weighted average of own-account and pre-packaged (1:3)
Matched-model price index with a downward adjustment of 3.3%
3.6 Draft Commission Decision on price and volume measures in National Accounts (Eurostat B1/CN 503 e)
CPA 72 - Computer and related services
For packaged software, the A method is to deflate with an appropriate PPI. An appropriate quality adjustment procedure (e.g. based on hedonics) is essential.
Less appropriate PPIs will be B methods. Also, the use of the US index for packaged software, adjusted for exchange rate effects or different general price changes, will be a B method. Care should be taken however to reflect the different timings of releases of new software in the US and in Europe.
Use of a CPI for packaged software is a C method for the deflation of output.
51

STD/DOC(2003)1
For customised services (both hardware and software consultancy) an approach based on representative pricing (see section 2) could be explored and has the potential to constitute an A method. Another A method could be an approach based on model pricing, if the conditions of section 2 are fulfilled. The result of the model pricing approach could also be used as a proxy for the price of software produced on own-account (B method), if it can be shown that the own-produced software could also have been produced by an external company.
For the service of renting out programmers on a per-diem basis, as a B method the charge-out rate could be used.
In view of the differences in the speed of quality changes, the use of an index for hardware to deflate software is a C method.
52

STD/DOC(2003)1
Chapter IV: Lessons from Business Accounting and Business Surveys
4.1 Business accounting: the theory10.
4.1.1 Introduction
Even before the introduction of SNA93, business accountants recognised that software whether purchased or produced in-house had asset characteristics. Thus business accountants were presented with much the same challenge as that faced by national accountants - how to value and define software assets. This is still a relatively new development and so, the world over, accounting standard’s bodies are currently attempting to bring these standards closer together.
4.1.2 The US Approach
The US approach GAAP, (Generally Accepted Accounting Principles) Accounting for Software Intangibles), in many ways the forerunner for other national accounting standards for software, is described below:
Financial Accounting Standards Board Statement No 86 was the first statement to address a standard method for accounting for software. Although this statement did not cover software developed in-house, for internal use, clear guidance was given for software to be sold or leased, (including "originals" produced for reproduction). This related to the capitalisation of software costs broken down by the different stages in the software development cycle and is described as:
- During the research and development stage all costs are to be expensed. At the point in time that the software becomes technologically feasible for use the costs should be capitalised and treated as a product master copy with subsequent costs capitalised as an intangible asset. Amortisation of capitalised computer software costs begins when the product is marketed. Amortisation should be either based on the revenue method or a straight-line method over the useful life.
Software produced for internal use was expensed however, so in response to a request by the SEC, the FASB subsequently issued SOB 98-1 Accounting for the Costs of Computer Software Developed or Obtained for Internal Use. This statement ( effective from December 15, 1998), stated that the costs of software developed, or purchased, for internal should also be capitalised. But that the costs in the final stage of implementation/operation such as training and maintenance are to be expensed.
The situation regarding business accounting recommendations in other countries (Japan, UK, France) is described in the more complete paper on business accounting, available on the task force’s EDG. These recommendations are generally consistent with the following international guidelines.
4.1.3 International Financial Reporting Standards (IFRS) Process of Accounting
International Financial Reporting Standard # 38 specifically addresses the appropriate accounting standards for Intangible Assets (Software Costs). It defines what is expensed and what should be capitalised and subsequently amortised. It states that an enterprise should recognise an intangible asset (at cost) only if
10 This section of the report consists mainly of extracts of the paper prepared by John Rieger, OECD/DAFFE. The complete paper is available on the task force’s EDG.
53

STD/DOC(2003)1
(a) it is probable that the future economic benefits that are attributable to the asset will flow to the enterprise; and (b) that the cost of the asset can be measured reliably.
The summary of IFRS #38 is as follows:
- Research Phase - During the research phase all costs should be expensed as incurred.
- Development Phase - Capitalise if the enterprise can demonstrate all of the following:
a) Technical feasibility, i.e. that the asset will be available for use or sale;b) Intent to complete the asset for use or for sale;c) Ability to use or sell the asset;d) Demonstrate how the intangible asset will generate probable future economic benefits;e) Availability of adequate resources to complete the process for sale or use;f) Ability to measure expenditures during the development stage.
The value of the intangible asset should be based on the accumulated costs of development, shown below.
Costs of internally generated software would include:
(a) Expenditure on materials and services used in production;(b) Salaries, wages & other employment related costs of personnel directly engaged in production;(c) Any expenditure directly attributable to generating the asset;(d) Overheads that can be allocated on a reasonable and consistent basis.
(Software costs should not include selling, administrative and other general overhead expenditure nor should they include training costs for staff)
Imputed Price: the French Business Accounting recommendations
The French business accounting recommendations try to be more precise than the IFRS. They split an in-house project in 8 phases:
(1) Pre-analysis of feasibility(2) Functional analysis(3) Detailed analysis
(4) Programming(5) Tests
(6) Documentation(7) Training
(8) Maintenance
Their recommendation is to include in the valuation of the in-house software only the costs of phases 2 to 6. The line of reasoning is simple to understand: the objective is to make a fair estimate of the market price of the intangible asset thus created. The first phase (pre-analysis of feasibility) is intended to precise the demand for the software. It is therefore not to be taken into account to estimate a fair price for the software itself. The exclusion of phases (7) and (8) speak for themselves: training costs and maintenance are not embedded in the asset. The line of reasoning of business accountants can be applied for national accounts.
Amortisation- . An intangible asset should be amortised over its useful life. IFRS further states that it is assumed that the useful life of an intangible asset will not exceed 20 years. Methods based on either the asset’s "economic benefits consumption" or using the straight-line method are allowed.
In conclusion, business accounting standards recommend the capitalisation of software as long as technical feasibility is established. As shown in the following sections, this condition is important as many companies ( in particular software editing companies) will adopt a prudent interpretation and, thus, seldom capitalise software. Two other characteristics are also of interest to national accountants:
54

STD/DOC(2003)1
1) The recommendation regarding the imputed price of in-house software using costs incurred in production;
2) Businesses will write-off capitalised expenditures if the software is eventually unsuccessful, which differs from the approach recommended in this report (see Section 1.2.1 Box on unsuccessful software).
An Emerging Issue: Accounting for Impaired Assets
Accounting for impaired assets (relatively new in the accounting field) is an important factor in understanding how business accounting methodology measures software since it is partly to blame for large deviations in software investment in different accounting jurisdictions.
In summary the concept of impaired assets states that: “in the event that the present value of the future benefit available from an asset should result in a number that is less then the carrying amount of that asset on the books, the carrying value on the books should be written down and taken as an expense on the income statement”. The result of this is that in the event a company purchases software from another company (or software internally developed) and the market changes to where that software does not have the value that was originally projected, the company should write the asset down to the present value of the future benefits attributable to the software.
An increasing amount of companies are taking advantage of the use of accounting for impaired assets. Further, the introduction of this concept has resulted in a new concept of no amortisation against intangible assets if it can be demonstrated that there has been no reduction in the value of the asset. Since this concept is subject to a wide range of subjective interpretation, there is some risk of potential abuse related to this concept. In determining a present value of future benefits several assumptions are made that are subject to the discretion of the professional making the computations.
In economic cycle downturns care must be given to the proper measurement of software capitalised by companies. During cyclical downturns there will be more frequent use of write-downs of intangible assets due to impairment. During growth cycles it is generally the perception that purchased or internally developed software has a future benefit that is at least as great as their costs of production. However, during downturns, future benefit expectations will be lowered using revised assumptions, thus resulting in excessive changes to the balance sheet for "unamortised" intangible assets with a corresponding extraordinary write-off to the income statement.
FASB statement # 144 accounting for impaired assets as issued by the United States Accounting Board and IFRS statement # 36 accounting for impaired assets as issued by the International Accounting Standards Board are the two primary documents for guidance in the use of the accounting methodology for impaired assets.
4.1.4 Financial disclosure of necessary information in business accounts
Proper identification of software costs can be a problem due to the accepted ways accounting information is reported in business accounts. For capitalised software, costs are grouped under the general heading "intangible costs". Intangible costs can include scientific or technical knowledge, design and implementation of new processes or systems, licences, intellectual property, trademarks (including brand names and publishing titles). Examples include computer software, patents, copyrights, motion picture films, customer lists, mortgage servicing rights, import quotas, and marketing rights. In addition the amortisation of intangible costs may include any or all of the above intangible assets without any specific identification of software related items.
Expensed software can also be problematic since the actual costs are often split among multiple accounts, which include consultancy expenses, research and development costs, computer expenses, labour costs, payroll costs, equipment depreciation, software amortisation, office supplies, direct manufacturing costs, miscellaneous accounts, utility costs, and other expense accounts. This disbursement makes it particularly difficult to have a comprehensive picture of the total costs on software. The expenditure problem can be particularly difficult related to product enhancements and updated versions (compared to original development costs).
55

STD/DOC(2003)1
4.2 Business accounting: tax rules
An alternative source for measuring software is tax authority records. However differences and ambiguities in legislation across countries, and within countries, present arguably, insurmountable obstacles. In the US for instance, the Internal Revenue permits companies several alternatives: all costs can be expensed within the current period; costs can be capitalised and amortised over a period of not more than 5 years; packaged software should be depreciated on a straight-line basis over a period of 36 months but bundled software can be depreciated over 5 years using an accelerated method.
The situation in France is similar to the US. Tax regulation allows that software which is capitalised in the accounts is immediately deductible. Taxpayers have thus the choice either to capitalise or amortise or record costs as expenses.
The task force was not able to extend its research to other countries but it is evident that tax regulations provide little incentive to capitalise software expenditure11.
4.3 Business accounting: in practice
Anecdotal evidence from French companies12 and a review of published accounts from a limited number of large companies13 tends to conclude that companies are more likely to expense software expenditure than to capitalise it. This evidence points to two categories of businesses that need to be distinguished: software editing companies and users of software.
4.3.1 Software editing companies
Most companies do not capitalise what they call their “research and development” costs on future software for sale. In theory this is not inconsistent with IFRS recommendations. Only costs incurred after technical feasibility of the product are capitalised. These companies simply have a prudent interpretation of technical feasibility, and in practice prefer to expense research and development costs. As explained above, tax regulations permit this.
Users of software - including purchases of pre-packaged software, and purchases or internal development of custom designed software:
• Companies generally capitalise (large) expenditures of pre-packaged software
• For custom-made software for internal use, the practice varies across companies
• Some capitalise external costs of large projects that have a real value-added for the company
• Some capitalise more extensively (including internal costs) as long as the project is large
• All companies will record a write-off of capitalised costs if the project is abandoned
4.3.2 Lessons from business accounting
The conclusions of the analysis of business accounting practices are twofold:
1) The software industry does not capitalise its research and development at all; and
11 In Austria, commercial law does not even allow self-produced software to be capitalised.12 See the annex of John Rieger’s paper13 See the paper by Roger Akers on the task force EDG.
56

STD/DOC(2003)1
2) Other industries tend to capitalise only part of their software expenses. Acquired pre-packaged software is generally capitalised but costs on custom-made or own-account software are only partially capitalised.
Thus although business accounting rules are largely consistent with the SNA, in practice, and for a variety of reasons (shown above – valuation, tax regimes etc.) businesses adopt prudent valuation procedures that in effect differ from the SNA.
In order to evaluate the significance of these differences the Questionnaire on Software asked countries to provide two estimates of software, one based on business surveys and the other on actual estimates of software used in the national accounts.
Only three country members of the software task force (Australia, Canada, France) were able to deliver this data. For Australia, reported capitalised software in the business sector was estimated at 1500 A$m while total expenses in software were estimated at 4100 A$m for the same year. Data from Canada and France showed smaller differences: 15% and 18% respectively. On first sight therefore one might conclude that the hypothesis that businesses do not in practice capitalise software in accordance with the SNA is not universally true.
However, the Questionnaire also asked countries to prepare estimates using a “supply approach” (of directly "capitalisable" software from sales, including a macro-estimate for software produced in-house). For Australia the “supply” estimates were seven times as high as the "business based" estimates shown above, for Canada they were four times as high, and for France (despite excluding a large proportion of software supply from their calculations) supply was about a third higher. For the US, the returned Questionnaire referred to the US annual capital expenditure survey on businesses for 1998, which recorded an amount of 11.8 billion US$ as “capitalised software purchased separately”. This compares to the estimate of 123 billion US$ made using the “supply approach”, which is more than ten times the reported capitalised software.
Although (and because of) only a small sample, the very low business estimates, when compared to the supply-side estimates, largely confirm the belief that business surveys have, until now, proven largely unsatisfactory as instruments to measure software. Therefore, national accountants face a dilemma:
1) National Accountants can continue to use business reports and remain consistent with these but not in practice with the spirit of the SNA and probably not across countries; or
2) National Accountants can bypass business estimates and instead measure software (consistent with the SNA) using macro-approaches
Advocates of the first solution contend that the second solution relies too heavily on relatively subjective assumptions. For example, the estimation of own account software based on a macro-estimate requires a reliable census of programmers and analysts and assumptions on the time spent by software analysts and programmers on developing new software (see Chapter 5). However, advocates of the second solution contend that the first is simply not consistent with the SNA, and indeed is not consistent across countries.
Where do national accountants and business accountants diverge?
The line of reasoning in the valuation of own-account software is the same in the national accounts and in business accounts. However, the national accounts depart from business accountants in practice. While many national accountants understand SNA 93 as a recommendation to make a full estimation for own account software even if it is very approximate, business accountants will prefer to apply a “prudent approach” and, in many cases, avoid capitalising software.
57

STD/DOC(2003)1
Business accounting recommendations effectively mention several conditions that in-house software should meet before it can be capitalised. Among these are: “the ability to use or sell the intangible asset”, “the availability of adequate technical, financial and other resources to complete the process for sale or use, etc.” As such, in practice, and prudently, business accountants prefer not to capitalise software since it is difficult to determine if (and when) these conditions are met. Moreover, because tax regulations do not oblige to capitalise software (they generally allow costs to be expensed), there is no real incentive for business accountants to do it.
One possible compromise would be to exclude own-account production of software. This would keep national accounts closer to business accounting practices and avoid macro-assumptions. However, under this approach, any change in the policy of firms regarding externalisation of software development costs would affect the time-consistency of the measure of GFCF in software. It a well known fact that businesses tended in the recent period to minimise their internal developments in software and to maximise externalisation. Without a macro-estimate of own-account production in software, this tendency would have induced a built-in increase of GFCF in software, which macro-economic interpretation could be questioned.
The main concern of the OECD in this debate is to converge on a methodology that allows consistent comparisons to be made across countries. In the current situation, two arguments point in the direction of the second solution. First, well-designed surveys on business capitalisation are not readily available. Second, adaptations to tax regulations as well as changes in business accounting practices may lead to non-comparable data between countries and in time.
As a result, the OECD proposes the following recommendation:
Recommendation 4(1): In practice, business reports on software capitalisation underestimate software capitalisation and may be affected by changes in tax regulations and business practices. As a consequence, member countries are recommended to implement an estimate of GFCF in software independent from the estimate derived from business reports on capitalised software.
An immediate consequence of this recommendation, which will be re-discussed further in the report, is that reported business profits should be adjusted by the difference between the national accounts estimate of software investment and the business estimate.
4.4 A strategy for estimating software investment
The issue now becomes the convergence on a common comparable methodology for deriving the proposed “independent” national accounts estimate of GFCF in software. Practical methods depend on the type of the source data available to the national accountants.
The first type of data may be a special survey asking each firm to value capitalised software using the definition of the national accounts. This approach is the most sensible one in the long-term, for three reasons: (1) it allows a precise breakdown of GFCF in software by industry, (2) it avoids making assumptions to exclude double-counting, and, (3) it allows a more sensible estimation of own account software than the macro-estimate which will be presented in the following section.
Some countries, such as Australia, seem to have successfully implemented such a survey. Others are trying to implement it or are adapting their existing surveys. Obviously, the OECD recommends the implementation of such surveys, which are further discussed in section 4.6.
58
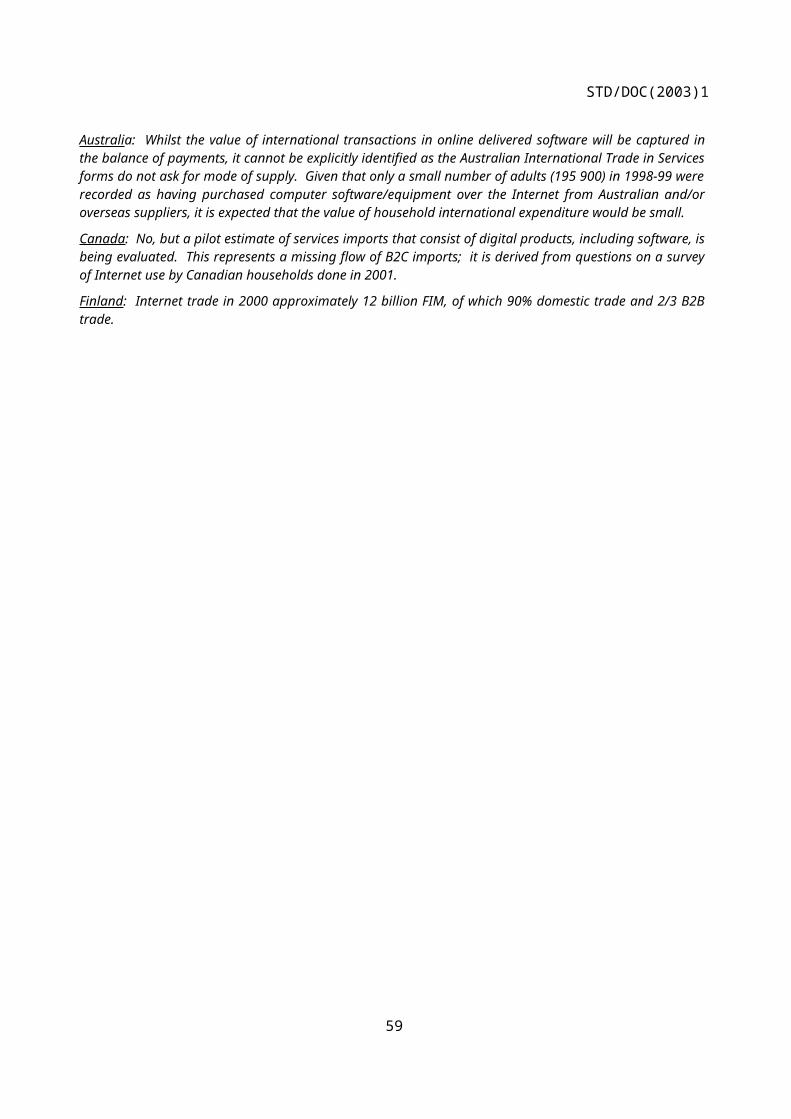
STD/DOC(2003)1
Recommendation 4(2): Business surveys should be adapted to include precise estimates of software expenditures by company, in order to derive a figure consistent with the national accounts definition of software investment.
Incorporating changes into surveys will require some commitment from countries and there will inevitably be some cost involved that, for some, might prove too expensive. In any case, it is unlikely that such an approach could be adopted soon by most countries, and the Task Force has no power to enforce such a change. As such there may be a long implementation period before this occurs. Operationally, even with a more definitive meaning of software, difficulties in estimation and statistical harmonisation are likely to persist because differences in tax-regimes across countries will remain, and one cannot rule out the fact that businesses will continue to be influenced by the tax-regime in operation. Furthermore it is hard to envisage valuations of own-account produced software being harmonised in a systematic way within countries, let alone internationally.
In recognition of these practical difficulties Chapter 5 presents a process (a supply approach) that will allow national accountants to make macro-estimates of software using readily available data sources. This second approach is to rely on sales data for the part of software capitalisation corresponding to external costs and to a macro-estimation of own-account software. Sales data are more readily available. However, as it originates from the seller and not the buyer, it includes several flaws that can lead to (1) very inaccurate breakdown of GFCF in software by industry and (2) double counting.
However, if the priority is a macro-estimate of GFCF in software, the inaccuracy of the breakdown by industry can be omitted, at least in the short-term. Secondly, methods for dealing with some double counting exist. While they may be imprecise, a consistent implementation by countries could lead to comparable figures.
Recommendation 4(3): in the medium-term and before business surveys are implemented that are able to cover correctly investment in software in the national accounts definitionit is recommended that a supply method is used to estimate GFCF in software for the benchmark year.
4.5 Adequate Business Surveys
The objective of this section is to illustrate some of the features of a “demand” side business survey14 that would be compatible with the national accounts definition of capitalised software expenditures. In theory, the survey should cover all enterprises, and include the government and the NPISH sectors. No attempt will be made here to adjust the amount of information requested from respondents to a level compatible with a reasonable burden. In that sense, it may be considered as an “ideal” business survey.
Using the rules set out in Chapter 1, a reasonable approach to obtain a value of the software expenses of the company that are to be capitalised under the national accounts definition of software would be to split the questions in two broad categories: (1) external costs (expenditures), (2) in-house costs. In addition, the survey would have to ask for the company’s own estimate of its capitalised software.
4.5.1 External costs related to software for own final use:
Businesses are requested to include in this category all their expenditures made on software related services, including expenditures made on an original software (on which the company retains all property
14 It does not cover “supply side” business surveys (i.e. surveys on turnover of software editing companies). For an extensive presentation of such surveys, one can refer to paragraph 6.2.1 of the Eurostat Task Force report (pilot enquiry prepared by Eurostat in the context of the Structural Business Statistics).
59

STD/DOC(2003)1
rights, and from which the company may make copies to be sold) but excluding all expenditures made on software to be re-sold, whether embedded in another software or in hardware. The first two sub-categories (expenditures on pre-packaged software, expenditures related to customised software) should not, in principle, contain expenditures of less than 500 Euros or US$ and expenditures on software to be used less than one year.
Purchases of pre-packaged software for own-use: value of puchases of pre-packaged software including licenses for use and multi-copy licenses for use.
Payments and royalties for own-use of pre-packaged software: include all payments, including rentals and royalties, expensed for the use of pre-packaged software (including system software) used inside the company. Exclude all payments made for licenses and royalties to reproduce copies to be re-sold as such or embedded in hardware of an original software on which the company does not have all property rights.
Payments for services related to the development of customised software for own-use: include all external costs of developing customised software for own-use of the company (this includes payments for services such as analysis, design and programming or modifications to packaged software). A software “original” developed with the view to selling copies is considered here as “own-use”. Payments for outside consultants participating in the development of in-house software is to be included. Exclude payments related to development of custom software on which the company will not retain exclusive property rights.
Purchases of all property rights of an original software: this category covers a possible purchase of all ownership rights from another company of an original software.
Other software related expenditures for own-use: including sub contracted maintenance costs.
4.5.2 Internal costs of in-house software
This category covers the internal costs of developing in-house software, whether for internal use or on which the company keeps property rights. It includes internal costs of developing an original sofware on which the company retains all property rights and of which the company will sell copies or embed copies in hardware or other material.
Total labour costs:
- Number of in-house professional staff involved in the development of software.
- Estimate of average percentage of time spent by in-house staff on software development (this time excludes maintenance tasks or commercial tasks).
- Average compensation, including wages, salaries, premiums, employee and employer social contributions and other special benefits.
Other costs:
Overhead costs that are related to the development of in-house software.
Memorandum item: Recorded amount of capitalised software, under the company’s curent accounting policy.
60

STD/DOC(2003)1
THE AUSTRALIAN EXPERIENCE
The Australian Bureau of Statistics (ABS) is one of the rare countries that has some experience in organising business surveys including precise questions on software expense and capitalisation. The annual Economic Activity Survey (EAS) covers both private and public businesses include specific questions on software expenses since 1997-1998. In September 2001, a test was conducted to include new questions in the Quarterly Survey of New Capital Expenditure.
EAS survey questionnaire (annual)- selected data items:
Question 19 Computer software expensed $ '000Including
Installation costs paid to external service providersPurchase costs
ExcludingLicence fees and royalties (include in Question 20) *see below, this item is modified in the last version of the surveyComputer software capitalised (include in Question 36(d))Software maintenance (include in Question 20) Question 20 is “Other expenses”
Question 36 - Capital expenditure including capitalised work done by own employees(d) Computer software capitalised $ ('000)Including
Installation costsPurchase or development of large databasesComputer software developed in-house
ExcludingComputer software expensed (include in Question 19)Software maintenance (include in Question 20)
If software and hardware costs cannot be separated, include total in Computers and computer peripherals
* the ABS has recently reviewed the instruction to exclude software license fees and in the next round of surveys respondents will be asked to include them.
Quarterly Survey on New Capital ExpenditureABS’ Quarterly Survey on New Capital Expenditure should shortly include a new question on actual expenditure on computer software, which definition is the following:
Included as computer software expenditurePayments to contractors who are developing software for use by this businessPurchases of existing softwareProgressive costs of developing computer software developed in-housePurchase or development of large databasesInstallation costsComputer software expensed and capitalised
Excluded from computer software expenditureDevelopment of software for saleDevelopment of software on a contract basis for another businessRoyaltiesNetwork maintenance
Noteif software and hardware costs cannot be separated, include in Part A - Machinery and Equipment
61
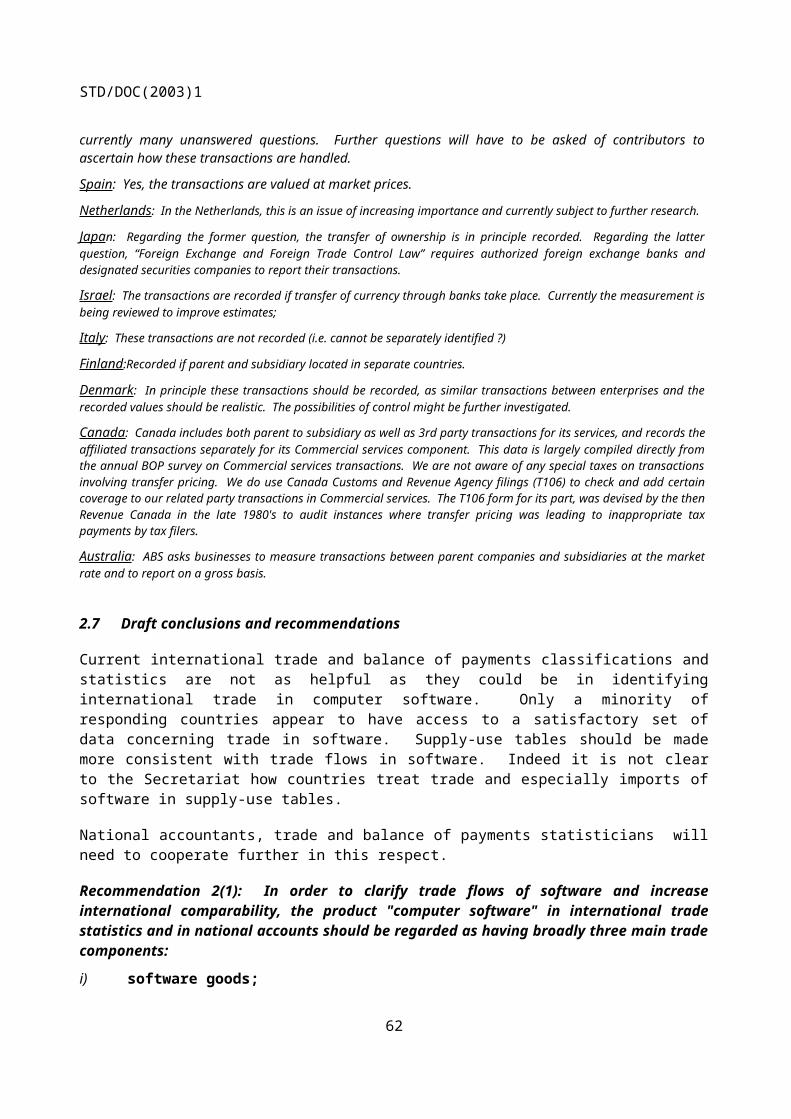
STD/DOC(2003)1
Chapter V: The supply approach
This chapter proposes a second-best method to estimate GFCF in software based on indirect, but available, statistics. The method essentially applies to a benchmark year. The main difficulty in this approach is to avoid double counting some flows, including sub-contracts. The method is twofold. For purchased software, the method uses sales data, and derives a figure for purchased GFCF as a residual in a commodity flow approach. For own-account software (absent by definition from sales statistics), the method is based on a macro-estimate of labour costs, plus a mark-up.
5.1 Purchased software
For purchased software sales statistics are available. The departure point in the commodity flow method to derive a figure for GFCF is thus sales. Based on the concordance table of Chapter I, it is obvious that sales statistics should be available in a quite detailed classification for this method to be fully applicable, in order to distinguish its possible use. In a European context, a four-digit CPA breakdown is a minimum.
Step 1: from industry data to product data
If sales data originate from statistics based on business receipts classified by activity (main activity of the business), a preliminary step is necessary to reclassify the sales data to obtain sales data of software products. Indeed, the commodity flow approach is based on resources of the product, even if it is sold as a secondary activity.
For example, in its questionnaire, Australia reports that eleven different ANZSIC categories are involved in the sales of software products (see table below). The first four are hardware industries: 2841 computer and business machine manufacturing, 2842 telecommunication, broadcasting and transceiving equipment manufacturing, 2849 electronic equipment manufacturing, 2852 electric cable and wire manufacturing. However, only a small amount of their sales are pure software products (0.6%). The next three categories are wholesaling industries: 4613 computer wholesaling, 4614 business machine wholesaling nec, 4615 electrical and electronic equipment wholesaling nec. For these categories, the amount of sales of pure software products represents 2.6% of their sales. Eventually, come the four categories of “computer services”, which are heavily involved in the production of software products: 7831 data processing services, 7832 information storage and retrieval services, 7833 computer maintenance services, 7834 computer consultancy services. For the whole of these last categories, the ABS estimates that two-thirds of sales consist of software products.
AustraliaEstimate of domestic supply of marketed software products
ANZSIC industries Title Proportion of industry market output of
column 2 allocated to software products
Estimate of supply in A$m
2841, 2842, 2849, 2852 IT manufacturing 0.6% 194631, 4614, 4615 IT wholesale 2.6% 5857831, 7832, 7833, 7834 Computer services 66.6% 6986Total supply of marketed software products 7590
Turning now to the US questionnaire, we discover that only industries classified in SIC 737 (computer programming, data processing, and other computer related services) contributed to the estimate of total
62

STD/DOC(2003)1
supply of marketed software products. It is unclear whether this is an assumption made by the US national accountants or if this is deducted from the data available to them. As can be seen in the table below, the bulk of the supply in marketed software products come from SIC 7372 for pre-packaged software, and SIC 7371 for custom software.
USA
Origin of sales of marketed software products by industryPre-packaged Custom
Total marketed computer services products (1992, in billions of US$) 19.3 23.0Origin of which 7371 Computer programming services 3.7% 86.8%7372 Software publishers 94.0% 3.8%7373 Computer systems integrators and consultants 0.6% 3.6%7374 Data processing services 0.9% 3.3%7375 Online information systems 0.2% 0.1%7376 Computer facilities management services 0.0% 1.1%7377 Computer rental or leasing 0.0% 0.0%7378 Computer maintenance 0.0% 0.2%7379 Other computer services 0.6% 1.1%
This step should also include another important verification for the consistency of the method: sales data should include revenues classified by businesses as royalties.
Recommendation 5(1): industry sales data can only be used if they are sufficiently detailed. When implementing a supply approach from industry sales data, all sales of software products should be taken into account, even if relevant businesses are not classified under the category “computer services”. For example, manufacturing businesses may produce and sell software products as a secondary activity. “Royalties” should be included in these statistics.
Step 2: inclusion of imports to obtain total resources
Consistent with the commodity flow approach, all resources have to be measured, including imports. Besides this obvious remark, this paragraph gives additional recommendations that apply to all external flows, imports and exports, consistently with Chapter II.
The table below is extracted from the questionnaire and shows for selected countries the ratio of external flows to domestic supply, under two definitions, a broad one and a narrow one. The broad definition corresponds to “total software related services” (CPA 72 in European terminology), the narrow definition to “pure software” (CPA 72.2 in European terminology).
63

STD/DOC(2003)1
Ratio of imports and exports over domestic supply (in %)France Canada USA Japan Australia UK
large definition Imports 3.6 0.9 4.5Exports 2.6 0.4 7.9Domestic supply 100.0 100.0 100.0
narrow definition Imports 9.5 31.3 0.9 16.9Exports 6.8 33.7 4.7 10.6Domestic supply 100.0 100.0 100.0 100.0
Except for Canada, it is apparent that the degree of openness of these economies to external trade seems particularly low regarding a product that is widely exchanged internationally, at least for pre-packaged software. This is specially the case for the USA and Japan. In other words, one could ask where are recorded the “exports” of Microsoft and the corresponding imports? The US questionnaire confirms that current estimates of exports and imports do not include trade in services at all.
It is interesting to analyse the case of Canada, which has a high ratio of imports and exports. Imports of software from merchandise trade amount to 131715. Exports of pre-packaged software are 10716. The data from the BoP is not precise enough to derive imports and exports of software services. Statistics Canada uses the annual survey on software development and computer services to derive figures for exports of computer services (731) and exports of royalties and license fees (1311). A significant amount of royalties and license fees (685) are also added as imports. An important result is that the inclusion of estimates for trade in services as well as for royalties and license fees increased significantly the results. This is probably the main difference with other countries.
Canada: imports and exports of software, 1998
Imports ExportsMerchandise trade 1003 107Software services 314 731Royalties and license fees 685 1311Total 2002 2150
Recommendation 5(2): in the supply approach, imports and exports definitions have to be consistent with definitions of domestic supply. Both should include royalty payments and license fees.
Step 3 : inclusion of trade margins and taxes
The confrontation, on the one hand, of statistics relating to sales (at factory-gate prices) or imports (at CIF prices) and, on the other hand purchases (at final demand price) requires an adjustment. Sales and imports should be adjusted of trade margins and indirect tax (in particular VAT for household consumption). Only after this adjustment, can the commodity-flow method (that is at the basis of the supply approach) function correctly.
For example, in Canada, trade margins and taxes on resources (sales and imports) account for 17% of the value of total supply in software products.15 Part of this flow (314) is to be considered as custom design software, because custom design software also
travels on magnetic support. This is labelled “software services” in the table. The residual (1003) is assigned to pre-packaged, and appears under “merchandise trade”.
16 After adjustment of +55% for under valuation.
64

STD/DOC(2003)1
Step 4: avoiding double counting
This is the most difficult part of the method. Assuming the sales data is now available in terms of software products, we can now refer to the concordance table on external costs (see point 2 of the agenda) to decide whether the software sale should be classified as GFCF or intermediate consumption and treat cases of possible double-counting. We will base our analysis on the concordance table expressed in SIC (and NAICS), but a similar line of reasoning is applicable to the concordance table in CPA for European countries.
Exclusion of categories classified as intermediate consumption
First, according to the concordance table, all SIC categories (considered also as product categories) from 73.73 to 73.79 are to be classified as intermediate consumption.
Exclusion of subcontracting
Regarding SIC 73.71, software products sales corresponding to the main activity of SIC 73.71 is to be classified as GFCF except for those corresponding to purchases by a non-final user of the software, in other words sub-contractants. Let’s say, company U, the final user of the software, orders a software from company A, a software consultancy company. The software will cost 100. Suppose A sub-contracts 25% of the costs of the software to company B, another software consultancy company. Then total sales of software would be equal to 125, while the value of capitalisable software is 100. The 25 subcontracted to B by A is an intermediate consumption of A, and should not be capitalised.
Problems also arise for SIC 73.72 “software publishers”, for which the concordance table distinguishes three cases for which sales should not be considered as GFCF: (1) when the software product is purchased by a bundler to be included into hardware or some other equipment, (2) when the software product is purchased by another software company to be embedded in another reproduced software for resale, (3) when the software is purchased by final user households or exported.
Exclusion of reproduced software purchased by hardware and software bundlers
This is where significant double counting may also intervene. Canada has developed the most precise and extensive methodology to avoid double counting. This section will therefore first explain the Canadian methodology and then comment on it using the concordance table.
Owing to the Canadian approach, double counting may occur both in the manipulation of sales data and in the macro-estimate of own-account production17. Three exclusions are made, called (a), (b) and (c) below.
Regarding sales data, one must distinguish pre-packaged software and customized software. To avoid double-counting the pre-packaged software bought by the hardware computer industry to be embedded in the hardware they sell, Canada excludes (a) 50% (arbitrary figure) of the purchases of pre-packaged software by the computer manufacturing industry. To avoid double counting of custom-design software embedded by industries in their products, Canada excludes (b) 40% of custom-design software purchases
17 In theory, this section does not discuss the estimation of own-account production but it is difficult to avoid discussing here the treatment of double counting in own-account software because it is linked to the part of the supply method using sales data.
65

STD/DOC(2003)1
by printing, publishing, machinery and transportation equipment, electrical and electronics and other manufacturing, as well as business services (including computer services).
Regarding the macro estimate of own-account production, Canada excludes (c) 99% of the labour costs of programmers and analysts of the software producing and embedding industries that work for the production of sold or embedded software, on the basis that these costs have already been accounted for in the supply method using the sales data. This adjustment leads to exclude 3032 million C$ from the estimate of 7117 million C$ of total labour costs for computer programmers and system analysts, which is the basis for the estimate of own account production18.
From the point of view of the concordance table, all software products purchased by final users corresponding to custom computer programming services (SIC 73.71, NAICS 541511) are to be classified as GFCF. This is in contradiction with treatment (b) of Canada, which excludes 40% of purchases of custom computer programming services by a large array of industries, on the basis that these costs will be included in the equipment sold by these companies. The view of the concordance table is that there is no double counting when including these costs to “embedding” industries, because one should distinguish clearly “originals” from “reproductions”. Indeed, external costs of custom computer programming correspond to the development of the original software owned by the embedding company. The embedding company will then reproduce this original to bundle it in its hardware. However, this operation (which has low operating costs) does not imply any double counting.
The same type of comment is to be made regarding the Canadian exclusion (c). Under this operation, Canada excludes 99% of own-account costs of software editing companies, on the basis that these costs correspond to sales already accounted for. Our view is that this exclusion leads to an underestimate of GFCF of software publishing companies in original software for reproduction. Indeed, only costs of programmers and analysts working on custom-made software for other clients than their own company should be excluded, because their costs have explicitly been accounted for using the sales data. However, costs of programmers and analysts of software publishing companies working to develop an original for reproduction which will be owned by their own company should not be excluded. These costs are not included in the sales data, because they are internal costs.
This still leaves aside the situation that was described earlier regarding sub-contracting. Some sales of SIC 73.71 could correspond to sales of software services from one software editing company to another software editing company, this company not being the final user of the software, but selling it to the final user company (which is not, in most cases a software company).
Recommendation 5(3): in the supply approach, double-counting of investment can be avoided by (1) ) by excluding flows corresponding to sub-contracts, (2) excluding 50% (if no specific data) of purchased pre-packaged software by the computer hardware industry, and (3) by excluding, in the macro-estimate of own-account production, costs of analysts and programmers corresponding to sales of custom computer programming services that have already been accounted for using the sales data.
18 In Canada, this adjustment consists in the following steps: (a) calculating the percentage of programmers and analysts labour costs over total cost for non computer related industries - this percentage is 1%;(2) this percentage is assumed to represent the percentage of the costs related to own account software in computer related industries. In other words, 99% of the costs of programmers and analysts in computer related industries are not assigned to own account software production, and are deducted from the overall labour costs for computer programmers and system analysts in the overall domestic economy.
66

STD/DOC(2003)1
Step 5: maintenance
As explained in the conceptual paper, maintenance is not GFCF. Most of Y2K and transition to the Euro costs fell under the category maintenance. There is thus the need to exclude from sales data those corresponding to maintenance in order to derive GFCF.
Countries that have implemented the supply approach have excluded in-house maintenance costs, when building their macro-estimate of own account production. However, businesses also use external services to maintain and repair their software. There is thus also the need to estimate external costs of maintenance.
Using the SIC-NAICS concordance table, external costs of maintenance are included in the category 73.71 (CPA 72.20.32 + 72.20.33): Custom computer programming services: services of writing, modifying, testing, and supporting software to meet the needs of a particular customer.
Unfortunately there is no information on the amount of sales of “modifications” among the overall sales of 73.71. We are thus obliged, as for own-account software, to make a very rough macro-estimate.
In the private study of the software industry used by the US BEA to estimate the “maintenance” part of in-house software analysts and programmers, maintenance is estimated at 38% of the working hours. BEA chose to use a prudent, rough estimate of 50%. But the task force concluded that this was a very high estimate to apply to sales data because maintenance is more characteristic of in-house programmers than of externalized services, an amount of 10 to 15% could be more realistic. It seems that a 1997 US survey showed that only 12.5% of expenditures on customised software has maintenance characteristics.
Regarding the European case, there is a special category for maintenance, CPA 72.20.34. As recommended in the concordance table in CPA, these flows should be treated as intermediate consumption. The ratio of 72.20.34 to the sum of 72.20.32+72.20.33+72.20.34 could be used to estimate a better ratio than the 10 to 15% proposed above for SIC 73.71. However evidence from the SBS pilot survey on the computer services industry suggests that the 10-15% figure if in the right ballpark. Turnover of systems maintenance services as a percentage of turnover of custom software, computer consultancy services and systems maintenance services were as follows: Denmark 11% (2000), Spain 15% (2000), France 13% (1999), Luxembourg 13% (2000), Portugal 18% (2000), Finland 17% (2000), Sweden 7% (1999), United Kingdom 25% (2000).
Recommendation 5(4): in the supply approach, external costs of maintenance are to be excluded. In SIC classification, these costs could be estimated on the basis of 10 to 15% of external sales of SIC 73.71 or using a ratio derived from other sources. In CPA classification, a special category is representative of these costs (72.20.34), and they can thus be estimated directly. These flows are to be treated as intermediate consumption.
Step 6: Exclusion of household purchases and exports.
Exclusion of household purchases.
An estimate should be made of these purchases, using household budget surveys or other relevant statistics.
The assumption here is that games (and educational, etc.) reproduced software are classified as part of SIC 73.72. Games are an important part of software expenditures of households but households buy also non-games software. However, it should be noted that purchases of non-games software which may be classified by the software industry as purchases of individual customers may be made by individuals acting as own account workers. These purchases would then correspond to GFCF.
67

STD/DOC(2003)1
The Task-Force questionnaire did not include a specific question for household consumption. Data obtained from Australia and USA seem to converge to an amount of 4 to 5% of total supply being assigned to households. It is not clear however if the data include games or not.
Canada has a similar figure while the methodological note states that its figures exclude spending on games. France has a smaller amount (2.1%).
Recommendation 5(5): in the supply approach, purchases of households should be estimated through household budget surveys or other equivalent sources and excluded from sales (adjusted for trade margins and indirect taxes) to further derive GFCF in software.
Exclusion of exports
A previous paragraph has already discussed issues regarding external flows.
Resulting recommended table for implementation of the supply approach for purchased software.
This section summarises, in the form of a table, the different steps to compile GFCF in software under the recommended method to ensure maximum international comparability in the near future.
Value of sales of capitalisable software services (SIC 73.71 + SIC 73.72; CPA 72.20.2 + 72.20.32 + 72.20.33 + 72.20.34), including royalties and license fees, including games
A
Inclusion of imports (including royalties and license fees and games) BInclusion of trade margins and taxes on domestic supply and imports CExclusion of software embedded by hardware industry (50% of purchases of pre-packaged software by hardware industry), treated as intermediate consumption
D
Exclusion of sub-contracting flows between “software companies” EExclusion of household consumption in games and other pre-packaged software FExclusion of exports (including royalties and license fees and games) GExclusion of maintenance (CPA 72.20.34, 10-15% of SIC 73.71) H
Total GFCF in purchased software A+B+C-D-E-F-G-H
It is very important to note that this total value for GFCF in software should be adjusted if software already capitalised by businesses is included in total GFCF independently from this process. This adjustment is described at the end of this chapter.
5.2 Macro-estimate of own-account software
5.2.1 General principles
According to SNA93 own-account production of software should be valued at its estimated basic price, or at its costs of production if it is not possible to estimate the basic price (10.92). Due to the lack of an observable basic price own-account production of software is valued mainly as the sum of production costs such as compensation of employees, intermediate consumption, consumption of fixed capital and other taxes (less subsidies) on production (6.85).
Business accounting standards recommend the capitalization of own-account software production. However, businesses rarely capitalize their own-account software production in practice, and so it is difficult to get a reliable estimate of own-account software investment directly from business expenditure
68

STD/DOC(2003)1
surveys. Therefore, most of countries use the "cost of production" method at a macro level in estimating own-account software investment19.
Some countries are reluctant to estimate own-account software either at a macro level or from business expenditure survey because they feel that their source data for estimating own-account software investment is insufficient. However, countries could find or create adequate source data for estimating own-account software production if decent efforts may be made to estimate them. For international comparability, considering the magnitude of own-account software (which, on average, makes up about one-third of total software investment), it is important for all countries to capitalize own-account software.
In the questionnaire out of 15 countries, 9 countries provided data on own account software investment. 7 countries show that their shares of own account software investment are located between 30-46%. From these observations, we can draw a conclusion that the average share of own account software investment is about 1/3 of total software investment.
Share of own-account software to total software investment
Own-account software (%)Australia 98-99 30.9
Canada 98 31.9Denmark 97 46.0France 98 41.1Israel 00 12.8Italy98 30.1
Netherlands 98 31.3Sweden 23.0US 92 34.7
Average 31.3
Recommendation 5(6): Own-account software investment is significant (about one-thirds of total software investment) For improved international comparability own-account software should be estimated and included in total software investment..
To understand the estimation process used by individual countries at the macro level, we need to clarify the difference between production of software professionals and own-account software production. Software production of software professionals refers to the total amount of software produced by all the software professionals, which includes both software to be used internally (own-account software) and software to be sold. Own-account software production refers to the total amount of software produced in-house by software professionals for internal use. It thus excludes the software production linked to software to be sold. It is important to note here that original software for reproduction (such as Windows for Microsoft) corresponds to software to be used internally. Only reproductions of Windows are sold, not the original.
Therefore, in order to estimate own-account software production carried out by software professionals, an adjustment needs to be made to exclude market activities (i.e. sale of original custom-made software and sale of reproductions). This adjustment allows that no double counting is recorded under the supply approach, because software sold has been already accounted for using sales data.
The production of own-account software is measured as the sum of production costs. These costs consist of compensation of employees (labour cost), intermediate inputs, indirect business taxes and consumption 19 Macro level estimation method can not consider unsuccessful own-account expenditure on software such as
abandonment of software, software failure, etc. It can only be reported at the business level.
69

STD/DOC(2003)1
of capital, etc. Due to lack of data, production costs are estimated, in general, by grouping them into two parts: labour costs and non-labour costs.
One of the basic assumptions for estimating the production of own-account software is that software is produced only by software professionals, not by non-professionals. This assumption is taken mainly for measurement purposes. In reality, software can be produced by non-professionals or non-professionals can participate in software development projects, but their contribution cannot be estimated, through the present method. It is to be hoped that it is small.
Based on this assumption, the labour cost of software production by software professionals can be derived using the number of software professionals and their average compensation. In other words, the labour cost of software production is calculated by multiplying the number of software professionals by their average compensation.
To estimate the labour cost of own-account software, the following two adjustment should be made for the labour cost of the production of software professionals:
• Exclude labour cost linked to the production of original custom-made and reproduction software to be sold. However, labour costs linked to the production of original to be used in-house (this includes original for reproduction) should not be excluded.
• Exclude labour cost linked to other activities (maintenance, etc.) than software production.
According to the above basic assumption and adjustment processes, the steps of estimating own-account software investment can be summarized as follows:
Recommendation 5(7): The best practice for the estimation of own-account software investment at macro level is the following;
1) Estimate the labour cost of own-account software
= Labour cost of software professionals (number of software professionals * Average compensation)Adjustment 1: Exclude labour cost linked to the production of software to be sold (however, do not exclude labour costs for originals for reproduction)Adjustment 2: Exclude labour cost linked to other activities (maintenance, management, etc.)
2) Add non-labour costs of own-account software (intermediate consumption, consumption of capital, etc.) including net operating surplus.
Adjustment 3: in adding non-labour costs, avoid double counting costs that have been already recorded as purchases
The first step is to estimate labour cost of own-account software. This step begins with estimating the labour cost of software professionals and then makes adjustment to exclude all the activities not related to own-account software production.
The next step is to estimate non-labour costs. In general, direct data are hardly available for estimating non-labour costs. Therefore, these are often estimated based on the ratio of labour cost to non-labour costs. This ratio is generally obtained from the survey of computer services industries.
Canada and Italy adopt the same steps to estimate own-account software production. Both countries start by estimating the labour cost of software professionals (A). However, they take a different procedure to derive the macro estimate of own-account software.
70

STD/DOC(2003)1
In Italy, first non-labour costs of software professionals (B) are estimated based on the relationship between labour cost and non-labour costs of software professionals. The total cost of software production by software professionals is derived by summing labour cost (A) and non-labour cost (B) of software professionals. Afterwards adjustments are made to estimate total cost of own-account software production: total cost of production linked to software to be sold (C) and total cost of production linked to other activities (D). Finally, total cost of own-account software is calculated by subtracting C and D from the total cost of software professionals (A+B). This process can be called as a total cost approach.
In contrast, Canada estimates labour cost (not total cost) of production linked to software to be sold (c) and labour cost of production linked to other activities (d). The total labour cost of own-account software development is estimated by making adjustments (A-c-d). The second step is to estimate non-labour costs of own-account software production (b). Non-labour costs of own-account software production are estimated using ratio of non-labour costs to labour cost from survey data of computer services industries. Finally, estimate of own-account is calculated by summing the labour cost (A-c-d) and non-labour costs of production (b). As explained in Chapter 3, our understanding is that Canada has overstated the amount of software costs to be excluded (c), by taking into account in this exclusion software costs of software editing companies that produce originals for reproduction. Originals for reproduction are own-account GFCF of the software publishing companies, and are not sold. Only reproductions are sold.
Macro estimate of own account software
Italy 98 (billion lire) Canada 98 (million CAD)Number of software professionals Number of software professionals* Average compensation * Average compensation = Labour cost of software professionals (A) 8.646 = Labour cost of software professionals (A) 8,936(+) Non-labour costs of software professionals (B)
5.226 (+) Non-labour costs of own-account software production (b)
1,062
(-) Adjustment 1 : exclude total cost of production linked to software sales (C)
5.301 (-) Adjustment 1 : exclude labour cost of production linked to software sales (c)
4,317
(-) Adjustment 2 : exclude total cost linked to other activities such as repair, management, etc. (D)
4.349 (-) Adjustment 2 : exclude labour cost linked to other activities such as repair, management, etc. (d)
2,310
Macro estimate of own-account software (A+B-C-D)
4.222 Macro estimate of own-account software (A-c-d+b)
3,372
5.2.2 Coverage of software professionals
Almost all the software is produced by software professionals. However, non-professional staff also produce some software. The volume of software production by non-professional staff are expected to be relatively small and it is usually ignored even by business. For this reason, we propose excluding them from the measurement of own-account software production. In other words, it is proposed that software is produced only by software professionals.
The number of software professionals can be estimated either by direct business surveys or employment data by occupation. Most countries use employment data by occupation to estimate the number of software professionals. Netherlands has been conducting a special annual survey (Automation Survey). This survey is very comprehensive and collects data on the number of employees working on software development. Each country has adopted its own specific version of standard classification of occupation. However, the general classification system regarding software professionals is quite similar among countries. The International Standard Classification of Occupation 88 (ISCO 88) can provide a typical example for measuring the number of software professionals.
71

STD/DOC(2003)1
The breakdown of computing professionals by ISCO 88 is shown below:
213: Computing professionals2131: Computer system designers and analysts2132: Computer programmers2139: Computing professionals not elsewhere classified312: Computer associate professionals
The majority of software professionals fall in the category of computing professionals (code 213 of ISCO 88). Some computer associate professionals (code 312 of ISCO 88) may be involved in the development of software. But their contributions to own-account software production are less important, and hard to estimate them.
Countries like France include part of computer associate professionals (code 312 of ISCO 88) in total number of software professionals. But most countries limit their coverage to the number of employees in category 213 of ISCO 88 (computing professionals) in estimating the number of software professionals.
Recommendation 5(8): When direct survey data on the number of software professionals are not available, employment data by occupation can be used. The coverage of employees should be limited to the number of computing professionals (ISCO 88; 213) for international comparability.
Although own-account software is produced mainly in computer services industries, it is also produced in all other industries. National accountants should keep in mind that the number of software professionals should cover both business sector and the government sector. Own-account software investment is calculated by summing estimates of the government sector and private sector.
Recommendation 5(9): Own-account software is produced in all industries. Therefore, the number of software professionals should be broken down by group of economic activity including government sector.
5.2.3 Coverage of compensation
In estimating own-account software at macro level, coverage of compensation is, in general, broadly defined in many countries. It should cover wages, salaries, social contributions (including imputed social contributions) and related compensations.
In Australia compensation includes "wages and salaries paid", "severance, termination and redundancy payment", "provision expenses for employee entitlements", "employer contribution to superannuating funds", "workers compensation costs". Stock options have not been included. Source data are from the Information Technology Survey.
In Canada, compensation includes wages & salaries and supplementary labour income. Compensation data are from the Census by industry. The "wages and salaries" refers to gross wages and salaries before deductions for such items as income tax, pensions and employment insurance. Tips, commissions and cash bonuses are included, as well as all types of casual earnings (including earnings in a second job not necessarily in the same occupation). The value of taxable allowances and benefits provided by employers, such as free automobile use, is excluded. Wage and salaries is adjusted to a "total compensation" concept, in order to reflect "supplementary labour income". The supplementary labour income includes mandatory employer contributions to employment insurance and public pension plans as well as non-mandatory employer contributions, on behalf of employees, to private pension funds and private and public insurance plans.
72

STD/DOC(2003)1
In the US compensation includes wages, salaries, and related compensation such as contributions to pensions. Wages are derived from Bureau of Labour Statistics data. Non-wage compensation is calculated based on the relationship between compensation and wages derived from published NIPA data by industry.
In summary, the coverage of compensation is very broad. It includes wages, salaries and all supplementary labour costs.
The following table has been made using the responses to the questionnaire. After verification, it seems that France has given only net salaries, excluding social contributions. This table is in the process of being checked. Based on these first responses, the level of average compensation of software is quite similar across countries except the US, (which is significantly higher than the Canadian figure despite the 6 year gap). Average compensation per year is about 30-40 thousand US dollars (national currency data are converted by average exchange rate of the relevant year).
Average compensation of software professionals
Country USD Country currencyAustralia 98-99 34,273 54,562 AUD
Canada 98 29,876 44,306 CADDenmark 97 35,069 231,597 DKrFrance 98 35,761 32,160 EUR
Italy98 38,941 67,601 million LitNetherlands 98 36,166 71,753 f.
Sweden99 40,631 335,690 SKrUS92 48,000 48,000 USD
Recommendation 5(10): The labour costs of software professionals used to derive the cost of own-account production should be based on compensation of employees, including net salaries and wages, but also social contributions (employer and employee, including imputed contributions).
5.2.4 Adjustments
The total labour cost of total software production by software professionals is estimated by multiplying the number of software professionals and average compensation. To calculate the labour cost of own-account software production, the following two adjustments have to be made.
Adjustment 1: Cost linked to the production of software to be sold
73

STD/DOC(2003)1
See recommendation (5.3)
Not all software professionals in the economy produce own-account software. Many of them, especially in computer services industry, are involved in the production of software to be sold. This activity should not be recorded as own-account software production. As such, including all computing professionals of this branch as the basis for the estimates of own-account output would overstate the true value since part of the staff are working on custom software to be sold, which should not be counted. In fact, only the following should be included:
(1) time spent on the development of originals of packaged software, and
(2) time spent on the development of software to be used only by the company itself ("real" own-account)
Special data or calculations will be required to estimate (1) and (2). In the absence of actual data, item (1) could be proxied by using the share of turnover from the sales of copies in total turnover as proxy for the share of staff working on originals. Item (2) is not covered by turnover, but is likely to be relatively small. Given the rough nature of the proxy for (1), it could be assumed to cover (2) as well.
Adjustment 2: Share of time spent on other activities (maintenance, management, etc.) than software production
In practice software professionals engage in other activities such as system repair, maintenance of computer system, and management and not just own-account production.
Time spent on these activities should be deducted from total time in calculating time spent on own-account software production. Unfortunately, research on the time spent only software professionals are rare.
The US adopts a 50 percent deduction rule. It is assumed that software professionals for the development of software spend 50 percent of their working time. The 50 percent share originates from a 20-year old study on the share of software development and maintenance costs in 487 business organizations reported by Barry Boehm20. The detailed shares are shown in the box. The categories that are classified as software investment are in bold italics.
Development 49 percentMaintenance 43 percent
Emergency program fixes 6 percentRoutine debugging 4 percentAccommodate changes to input data, files 8 percentAccommodate changes to hardware, operating systems 3 percentEnhancements for users:
New reportsAdded data for existing reportsOther
8 percent6 percen
7 percenttImprove documentation 3 percentImprove code efficiency 2 percentOther 8 percent
Other 2 percent
20 Barry W. Boehm, Software Engineering Economics (Englewood, NJ: Prentice-Hall, 1981): 533-35, 548-50
74

STD/DOC(2003)1
Although the result of the study shows that 62 percent of time spent is on investment, a 50 percent share was chosen to emphasize the approximate nature of the estimate. The 50 percent share is also based on anecdotal evidence that the share has diminished with the growing importance of personal computer and prepackaged software. So far, no recent study on the matter has been identified. The 50 percent deduction rule is also adopted in Canada, France and Italy.
Statistics Netherlands conducted an analysis in order to compare the result of the labour costs of own-account software production derived from two different data sources: direct survey (Automation Survey) and a labour survey (employment and wages by occupation). The main conclusion is that the correction factor of 50 percent leads to a overestimate of labour cost of own account software production.
Recommendation 5(11): If a country does not have reliable data on the share of time spent on the various tasks of computer professionals, the 50 percent deduction rule can be applied as an upper limit of the labour cost of own-account software production.
5.2.5 Non-labour costs (intermediate consumption, consumption of capital, operating surplus, etc.)
Due to lack of data, non-labour costs of production are generally estimated based on the relationship between labour cost and non-labour costs of own-account software. The data for the relationship is generally derived by survey or census data for computer services industries.
The ratio of non-labour costs to labour cost for measuring total cost of own-account software is quite different across countries. This is mainly due to the availability of data on cost structure of related industries. Some countries have data at a detailed level of computer services industries, but others might have only service industry as a whole. It is reasonable to assume that the cost structure of own-account software production is similar to custom software development or contract software programming industries. These industries tend to be more labour intensive than the service industry as a whole.
Canada uses the cost structure of a sub-sample of firms in the Survey of Computer Services for estimating other costs of own-account software production. Non-labour costs cover occupancy costs, utilities, property taxes, permits and licenses, materials and supplies and intermediate business services, depreciation, insurance, interest and bank charges, management fees, development charges and royalties. There is, however, no imputation of profit margin. Computer services industries are more labour intensive than the industry as a whole. The labour cost of computer services industries is just over two-thirds of total operating expenses, which means non-labour costs are about 50% of the labour cost. It is assumed that the cost structure facing computer services industries adequately represents the cost structure for own-account software developers across all industries.
The US categorise non-labour costs of own-account software as intermediate inputs. The intermediate inputs include depreciation, materials, rent, utilities, maintenance and repair, and general overhead. The cost of intermediate inputs is derived on the basis of relationship between intermediate inputs and compensation obtained from the Census Bureau’s economic census of service industries. Other costs (non-labour costs) are about 100 % of labour cost of own-account software production.
Canada and the US adopt almost the same procedure to calculate own-account software. However, the ratio of non-labour cost to labour cost between two countries is quite different. The Canadian ratio is about 50 percent and the US is about 100 percent. The US ratio of non-labour costs to labour cost is based on data from the Census of Service Industries. Canada derived the ratio from a sub-sample of firms in the Survey of Computer Services. The sub-sample of these firms makes the majority of their revenues from either custom software development or contract programming, which are more labour intensive than the
75

STD/DOC(2003)1
industry as a whole. It is assumed that the cost structure of custom software developers adequately represents the cost structure for own-account software development across all industries (business and government). Canada’s assumption seems more reasonable, but still needs further investigation.
Ratio of non-labour costs over labour cost
Country Unit Labour cost (A) Non-labour costs (B)
B/A (%)
Canada 95 CAD mln 2,043 939 46.0 Denmark 97 DKr mln 3,157 4,728* 149.8Finland 95 Fmk mln 1,169 1,034 88.5
Italy98 Lit bln 8,646 5,226 60.4Sweden99 SKr mln 5,238 5,211 99.5
US92 USD bln 17.2 17.5 101.7* Includes operating surplus
Adjustment 3: exclusion of non-labour costs already included as purchases.
In the presentation of the concordance tables (see the end of Chapter I), sales of programmer services included in the process of production of a final user’s in-house software, are directly recorded as investment. At the same time, the above process of estimating non-labour costs using the structure of the computer software industry, implicitly includes a mark-up for these external costs, because the computer software industry also purchases software services for its own use. There would therefore be a double-counting element if these costs were included both as purchases and, implicitly, in the mark-up process used in adding in non-labour costs. Either the first flow should not be recorded as GFCF either the mark-up should be adjusted downwards to avoid this double-counting element.
Recommendation 5(12): When calculating non-labour costs of own-account software production, based on the relationship between labour cost and non-labour costs, the data should be derived from computer industries (if possible, custom software developers would be preferable) rather than services industries in general. The ratio should be adjusted to exclude any double counting of external costs that would have been already recorded in the other branch of the supply method, covering purchases.
A macro estimate of own-account software is based on the costs of production approach, because own-account software is not traded in the market and thus has no market price. In the costs of production approach, the most difficult issue is how to treat the net operation surplus (profit margin). The country questionnaire reveals that only Denmark explicitly includes operating surplus in estimating the production of own-account software. In the OECD/EUROSTAT Task Force Meeting (22-23 April 2002), participants could not reach a consensus on how to treat net operating surplus: it is either included or not in non-labour costs.
Theoretically, the objective is to estimate a market price for this own account production. In paragraph 6.85, the SNA does not include operating surplus in its proposed “second best method” of imputing the value of an own account production based on costs. However, in this case we have an estimate of a full price, including operating surplus. So it seems to be reasonable to include operating surplus in estimating own-account software.
Recommendation 5(13): When calculating non-labour costs of own-account software production, net operating surplus should be included, using the cost structure of the computer services industry.
76

STD/DOC(2003)1
5.3 Other adjustments
When the income approach of GDP is based directly or indirectly on business reports, an adjustment has to be made when compiling gross operating surplus, because the “supply approach” leads to a significantly different breakdown between current expenses (intermediate consumption) and investment (GFCF) than that in business accounts.
The table below shows the adjustment made by Australia, USA and Canada. More than 70% of the national accounts estimate of software investment has to be added to reported gross corporate profits reported by businesses.
Adjustment to gross corporate profit: income approach
Australia 98-99 (mA$)
USA9221
(BUS$)Canada 98
(mC$)National accounts estimate of GFCF in software for all incorporated and unincorporated enterprises
7494(100)
79.2(100)
8736(100)
Business estimate of GFCF in software 1500(20)
19.7(25)
2526(29)
Positive adjustment to be made to reported gross corporate profits in the income approach to GDP
5994(80)
59.5(75)
6210(71)
( ) composition, %
This adjustment is based on the difference between the national accounts estimate of GFCF in software and the reported business estimate of GFCF in software. This shows that the implementation of the supply approach does not avoid the monitoring of software capitalisation under business accounting conventions.
Recommendation 5(14): to ensure the consistency of the national accounts, adjustments are to be made to data reported from business accounts because of the difference between the estimate of GFCF in the national accounts and in the business reports. These adjustments are based on the difference between the independent “supply approach” estimate of GFCF and what is declared capitalised by businesses. In order to compile this difference, surveys should continue to monitor capitalised software investment as they are recorded in business accounts.
The adjustment of net corporate profits will of course appear to be lower because the depreciation costs generated by the estimated software capitalisation will be added to intermediate consumption. The sum of the two will be closer to the business recording of current expenses, but will still differ (9.5 BUS$ for the USA in 1992).
Prior to the decision to implement the SNA recommendation on capitalising software, and in order to be fully consistent with SNA, all software expenses should have been treated fully as intermediate consumption and not GFCF. As a result, the above adjustment to corporate profits should not be a new feature in the process of compilation of the national accounts. In other words, before the implementation of SNA 93, corporate profits should have been adjusted by adding to intermediate consumption the software “wrongly” classified as investment in the business accounts. In parallel, GFCF reported by businesses should have been diminished by the same amount.
In fact, it seems that only the USA had implemented such consistent adjustments prior to the decision to capitalise software. Canada mentions in its methodology that it did not. Capitalised software reported by businesses was classified as hardware investment in the Canadian accounts, which could be interpreted as
21 The US has responded to the table of the questionnaire using net operating surplus rather than gross operating surplus. Figures in the table have thus been adjusted to include the BEA estimate of depreciation.
77

STD/DOC(2003)1
anticipating the decision. In this context, Canada was fully consistent and implemented a specific adjustment, described as follows.
In order to avoid another source of double counting of software capitalisation, Canada deducts from hardware investment an estimate of the built-in capitalised software already included as hardware in business reports. To achieve this, Canada compared the reports from respondents to the survey on capital expenditures (CAPEX) who declared software capitalisation to the software investment resulting from the commodity flow exercise. Statcan concluded that 36% of pre-packaged software expenses (now treated as investment in the accounts) were already reported as capitalised software and had been included as investment, under hardware. The percentages are 21% for custom-design expenses and 19% for own-account software. As a result, the amounts corresponding from these percentages are deducted to the hardware data. This resulted in a deduction of 2731 mC$ from hardware investment in 1998 (0.36*4373 + 0.21*2812 + 0.19*2982). As a result, the impact of the introduction of the SNA decision on GDP was significantly lower in the Canadian accounts than in the US accounts. Indeed, this deduction corresponds to more than 25% of investment in software obtained through the supply approach.
Recommendation 5(15): in applying the supply method, double-counting of software investment already included in the national accounts (sometimes under “hardware”), through the use of standard business survey, should be avoided. This double counting, occurs when the general process of estimation of GFCF uses business reports which include software capitalised by business. Sometimes this software, even bought separately from hardware, is included as hardware.
78

STD/DOC(2003)1
Chapter VI: Consumption of Fixed Capital, Current Year Estimation
6.1 Consumption of Fixed Capital
The Software Questionnaire contained four questions relevant to capital consumption. The first asked whether the perpetual inventory method (PIM) was used in calculating capital consumption. All of the respondents replied yes (with the exception of the Czech Republic who intend to do so).
The three other questions were:
53. What is the assumed service life for software54. What form of depreciation pattern is assumed (straight line, one-hoss shay, geometric)55. What form of retirement (mortality) function is used to account for the retirement distribution
within a cohort
The table below is a synthesis of responses to these questions:
Table 6.1: Capital consumption and Asset lives – Responses to QuestionnaireCountry Question Number
53 54 55Own-acc’t & Customised
Pre-recorded/ packaged
Australia Pre 89/90 - 8 Post 89/90 -
6
64
Hyperbolic for age efficiency function
Skewed retirement for packaged & other
Canada 5 3 Straight line Truncated normalCzech Republic 5 Business accounts Any
Denmark 6a 4b Straight line Winfrey S3Finland 5 Straight line Skewed WeibullFrance 5 Straight line Lognormal.Italy 5 Straight line Truncated normal
Japan 5 Straight line NoneNetherlands 3 Straight Line Weibull
Spain 4 Straight Line Delayed linearSweden 10a 5b Geometric None
United Kingdom 5 Straight Line NormalUnited States 5 3 Geometric None
(a) Own-account software only;(b) all purchased software.
The first and perhaps most important point to note concerns the responses to Q53. The Task Force was not able to discuss this issue within the timeframe of the report but achieving convergence in asset lives should be achievable. Particularly when one considers the emergence of a central range both for own-account and customised software, and packaged software, which many countries consider as having different asset
a
a
79
STD/DOC(2003)1
lives. In both cases a central range of 3-6 years exists, with a median of 5. National Accountants should note the Australian response, which alludes to a shortening of asset lives in recent years.
Responses to other questions also vary but (given the relatively short asset-lives) differences here are not likely to make as much of an impact on capital consumption estimates. In any case most countries use similar depreciation patterns (straight line). Differences in mortality functions are related to the choice of depreciation function, and are in any case of secondary importance.
However changes to depreciation estimates can be expected as a result of Recommendation 1.7 in this report:
Recommendation 1(7): That licenses-to-use, of any duration, intended for use of more than one year, but excluding purchases intended for bundling/embedding, are treated as investment. In principle accounting rules for financial leases should be implemented. In practice it is acceptable to record investment as being equivalent to actual payments as and when they occur. (For software that is purchased using regular (one year or less) payments, "payments" must be depreciated fully after one year).
Where actual payments (that permit use for one year or less) are capitalised, National Accountants must ensure that depreciation occurs fully within the year. Where business surveys are used questions should stipulate if possible how much expenditure is on this category of software. Where supply based methods are used National Accountants will need to estimate this expenditure. All expenditure should be depreciated within the same accounting year.
6.2 Current Year Estimation
Because current year estimates are usually based on projecting forward "benchmark" annual estimates the focus of the Task Force was mainly on improving harmonisation in annual estimation methods (which would feed through into improved sub-annual and current year estimates.
Nevertheless it was important to establish exactly how countries estimate sub-annual and current year estimates to identify country practice and whether improvements could be made.
The table below is a synthesis of responses to question 51 in the Questionnaire (covering exclusively current price estimation procedures, for nearly all countries sub-annual constant price estimates are derived in the same way as annual estimates, see Chapter III):
Q51: Please describe how estimates of other annual and quarterly estimates of investment are derived, both in constant and current prices. Give details, where appropriate, of any assumptions used. For example if constant price growth in investment is proxied by the growth in software engineers, with adjustments for productivity.
80
STD/DOC(2003)1
Table 6.2: Methods for Sub-Annual EstimationCountry Own-account PurchasedAustralia Linear Trend a Growth In importsCanada Labour Force Survey estimates, growth Commodity Flow data
Denmark Growth in Computer Services Industry (ISIC 72)Finland Growth in Computer Services Industry (ISIC 72)France Growth in Computer Services Industry (ISIC 72)Irsael "Supply Approach" with data on Supply, Imports & Exports, allocation to GFCF made using annual ratios.Italy Labour Force Survey estimates, growth Growth in Computer Services Industry (ISIC 72)
Japan N/A Growth in sales of customised softwareNetherlands Total investment only available (growth in software assumed to follow total growth)
Sweden Growth in Computer Services Industry (ISIC 72)UK Labour Force Survey estimates, growthUS Trend of GFCF in computers etc Software sales data
(a) Own-account software and customised software
What countries do is largely predetermined by the availability of sub-annual data sources and so it is difficult to make practical recommendations in this context that can be readily (if ever) adopted. However some practices are better than others, in so far as they broadly agree with recommendations outlined in this report for annual statistics; for example the Canadian method. A number of countries use growth in turnover in the computer services industry as a proxy for overall investment. However a number of factors should be borne in mind when using this approach:
• The correlation between growth in domestic production and domestic consumption is critically dependent on imports and exports - care should be taken where neither is insignificant.
• Empirical evidence suggests that the correlation between growth in own-account software and in purchased software is negative (see Chart 6.1 below).
a
Chart 6.1: Own-account as a proportion of total investmenton software (US)
0.30
0.35
0.40
0.45
0.50
0.55
1980 1981 1982 1983 1984 1985 1986 1987 1988 1989 1990 1991 1992 1993 1994 1995 1996 1997 1998Year
Ratio
81

STD/DOC(2003)1
ANNEX
List of participants
Chair Person:
Ms Carol MOYLAN Phone: 1.202.606.9715Chief, National Income and Wealth Division Fax: 1.202.606.5320Bureau of Economic Analysis (BE-54) E-mail: [email protected] Department of Commerce1441 L StreetWASHINGTON D.C. 20230United States
AUSTRALIAMr. Charles ASPDEN Phone: +61.2.6252.6711Head of National Accounts Branch Fax: +61.2.6252 5327Australian Bureau of Statistics E-mail: [email protected] Accounts DivisionP.O. Box 10BELCONNEN, ACT 2616Australia
AUSTRIAMr. Karl SCHWARZ Phone: 43.1.711.28.8149Statistics Austria Fax: 43.1.711.28.8145Hintere Zollamststrasse 2b E-mail: [email protected] VIENNAAustria
CANADAMr. Kishori LAL Phone: +1 (613) 951 9157Associate ACS (Assistant Chief Statistician Fax: +1 (613) 951 9031National Accounts & Analytical Studies Field E-mail: [email protected] Canada22-0, R.H. Coats BuildingTunney's PastureOTTAWA, Ontario K1A 0T6Canada
DENMARKMr. Soren LARSEN Phone: 45.39.17.3483Senior Consultant, National Accounts Division Fax: 45.39.17.3999Denmark Statistics E-mail: [email protected] 11DK-2100 COPENHAGEN 0Denmark
82

STD/DOC(2003)1
FINLANDMr. Jukka JALAVA Phone: +358.9.1734 33 91Expert on Productivity, Capital Stock Fax: +358.9.1734.2450and the New Economy E-mail: [email protected] FinlandTyöpajakatu 13FIN-00580 HELSINKIFinland
FRANCEMr. Francis MALHERBE Phone: +INSEE Fax: +18, boulevard Adolphe Pinard E-mail: [email protected] PARIS Cedex 14France
Mr. Olivier FROUTÉ Phone: +01 41 17 37 09INSEE Fax: +01 41 17 60 9815, bd Gabriel Péri E-mail: [email protected] MALAKOFFFrance
GERMANYMs. Oda SCHMALWASSER Phone: +49 611 752 680Statistisches Bundesamt Fax: +49 611 753 952Gustav Stresemann Ring 11 E-mail: [email protected] III C3D-65189 WIESBADEN 1Germany
ISRAELMrs Soli PELEG Phone: +972.2.659.2601Senior Director Fax: +972.2.659.2603Macro Economic Department E-mail: [email protected] Bureau of StatisticsKanfey Nesharim 66, corner Bachi St.95464 JERUSALEMIsrael
JAPANMr. Takashi YOSHINAKA Phone: +81 3 3581 0631Staff Economist of Research and Coordination Division Fax: +81 3 3581 0716Department of National Accounts E-mail: [email protected] and Social Research InstituteCabinet OfficeGovernment of Japan3-1-1 Kasumigaseki Chiyoda-kuTokyo 100-8970Japan
83

STD/DOC(2003)1
Mr. Hiromitsu SHIMADA Phone: +81 3 3581 0631Economist Fax: +81 3 3581 0716Director of Research and Coordination Division E-mail: [email protected] mailto:[email protected] Department of National AccountsEconomic and Social Research InstituteCabinet OfficeGovernment of Japan3-1-1 Kasumigaseki Chiyoda-kuTokyo 100-8970 Japan
NETHERLANDSMr. Martin MELLENS Phone: +31 70 337 5596Statistics Netherlands Fax: +31 70 337 5980Room 1156 E-mail: [email protected] Beatrixlaan 428P.O. Box 9592270 JM VOORBURGNetherlands
NEW ZEALANDMr Jeff COPE Phone: 64 4 374 8886Chief Economist National Accounts Fax: 64 4 374 8899 Statistics New Zealand E-mail: [email protected] HouseMadras StreetCHRISTCHURG, Private Bag 4741New Zealand
NORWAYMr Knut SØRENSEN Phone: +47 2109 4507Statistics Norway Fax: +47 2109 4996Kongensgate 6 E-mail: [email protected] OSLO 1Norway
UNITED KINGDOMMr. Adrian CHESSON Phone: +44 20 7533 5926Office for National Statistics Fax: +1 Drummond Gate E-mail: [email protected] SW1V 2QQ mailto:[email protected] Kingdom
EUROSTATMr. Brian NEWSON Phone: +352.43.01.32086Bâtiment Jean Monet Fax: +352.43.01.33.029Plateau du Kirchberg – rue Alcide De Gasperi E-mail: [email protected] LUXEMBOURGLuxembourg
Mr. Paul KONIJN Phone: +352.43.01.33438Bâtiment Jean Monet Fax: +352.43.01.33029Plateau du Kirchberg – rue Alcide De Gasperi E-mail: [email protected] LUXEMBOURG
84

STD/DOC(2003)1
Luxembourg
85

STD/DOC(2003)1
OECD
M. François LEQUILLER Phone: +33.1.45.24.88.06Head, National Accounts Division Fax: +33.1.45.24.96.57Statistics Directorate E-mail: [email protected], rue André Pascal 75775 PARIS CEDEX 16
Mr Paul SCHREYER Phone: +33.1.45.24.88.41Head of Section Fax: +33.1.45.24.96.57National Accounts Division E-mail: [email protected] Statistics Directorate2, rue André Pascal75775 PARIS CEDEX 16
Mr Nadim AHMAD Phone: +33.1.45.24.88.47Administrator Fax: +33.1.45.24.96.57National Accounts Division E-mai: [email protected] Directorate2, rue André Pascal75775 PARIS CEDEX 16
Mr william CAVE Phone: +33.1.45.24.88.72Administrator Fax: +33.1.45.24.96.57National Accounts Division E-mail: [email protected] Directorate2, rue André Pascal75775 PARIS CEDEX 16
Mr Seppo VARJONEN Phone: +33.1.45.24.15.44Administrator Fax: +33.1.45.24.96.57National Accounts Division E-mail: [email protected] Directorate2, rue André Pascal75775 PARIS CEDEX 16
Mr John RIEGER Phone: +33.1. (33-1) 49 10 42 80Principal Administrator Fax: +33.1. (33-1) 49 10 43 53Directorate for Financial, Fiscal and Enterprise Affairs E-mail: [email protected] bis boulevard Suchet75775 PARIS CEDEX 16
86
STD/DOC(2003)1
Summary of recommendations
Recommendation 1(1): product classifications should recognise a single entry for software, covering all the multiple physical and legal formats which support software. This unique entry has two sub-categories: originals and reproduction of originals. Licenses are part of the category reproduction of originals.
Recommendation 1(2): All own-account software is investment. (There is the issue of how to record unfinished own-account production, that is, "work-in-progress", but ultimately this ends up as investment.).
Recommendation 1(3): own-account software should include the following costs: compensation of staff and all internal overhead costs incurred in own-account production on stages 2-6 above and all expenditure on stages 2 - 6, excluding any expenditure on assets.
Recommendation 1(4): Software purchased as part of own-account production, with "asset" characteristics, should be recorded as investment. It should not be used as an intermediate input into own-account production, or in calculating the value of own-account production. Any other software purchased by the final user for own-account production can be directly capitalised or included as intermediate consumption within own-account production. In this report the former approach is mainly presented.
Recommendation 1(5): Own-account software updates should not include the value of the "original" version, and instead should only reflect the increased value.
Recommendation 1(6): Sales of "originals" should be treated as sales of pre-existing assets as specified in SNA 10.39. Cross-country transfers should be treated as acquisition/disposal of an intangible (original) asset, not non-produced non-financial assets.
Recommendation 1(7): That licenses-to-use, of any duration, intended for use of more than one year, but excluding purchases intended for bundling/embedding, are treated as investment. In principle accounting rules for financial-leases should be implemented. In practice it is acceptable to record investment as being equivalent to actual payments as and when they occur. (For software that is purchased using regular (one year or less) payments, "payments" must be depreciated fully after one year).
Recommendation 1(8): That rental payments for software intended for use of more than one year are treated as investment. In principle accounting rules for financial-leases should be implemented. In practice it is acceptable to record investment as being equivalent to actual payments as and when they occur. (For software that is purchased using regular (one year or less) payments, "payments" must be depreciated fully after one year).
Recommendation 1(9): That licenses-to-reproduce are treated as intermediate consumption. Where licenses have duration of longer than one year the usual rules of accrual accounting should be applied. The payment should be distributed over the lifetime of the licensing contract and recorded as payment in advance (F.7 in the financial accounts).
Recommendation 1(10): Any software (including outsourced software) purchased for bundling or embedding into products to be sold on should be treated as intermediate consumption.
Recommendation 1(11): "Royalties" is a generic term referring to payments linked to licenses. In accordance with other recommendations concerning licenses-to-use, royalties corresponding to payments
87

STD/DOC(2003)1
for licenses-to-use should be recorded as investment, and royalties for licenses to reproduce as intermediate consumption.
Recommendation 1(12): That maintenance expenditure is classified as intermediate consumption. Maintenance and Repairs that permit software to continue to be used in the same way under normal operating conditions, without including new features for the user, should be recorded as intermediate consumption.
Recommendation 1(13): That the small tools’ rule is retained.
Recommendation 2(1): In order to clarify trade flows of software and increase international comparability, the product "computer software" in international trade statistics and in national accounts should be regarded as having broadly three main trade components:iv) software goods;v) computer servicesvi) software royalty and license fee payments.
Recommendation 2(2): The separate identification of trade in computer services (Balance of Payments (BOP) code 263) from computer and information services, where this is not already done, should be implemented.
Recommendation 2(3): The separate identification of software royalty and license fee payments in the balance of payments services classification (part of EBOPS code 266 at present) and in country reporting is recommended.
Recommendation 2(4): A standard international grouping of Harmonized System (HS) codes that represents trade in software goods to improve international comparability is desirable and the following are proposed: HS 852431, 852440, 852491, 852499 (852439 is excluded).
Recommendation 3(1): Price indices should be available separately for the pre-packaged, customised and own-account software to take into account their different price development and changing shares in software expenditure.
Recommendation 3(2): In the long term, price indices should be developed covering business and household (including games) software. The price indices should take adequately into account qualitative changes of software. In practice, such price indices might still be biased and adjustments are needed. If that is the case, adjustments should be based on available objective data and made transparent to users. Improvement of the comparability with other countries is an important criterion in the adjustment procedure.
Only second best solutions are available in the short term. It seems appropriate to use the US price index for pre-packaged software adjusted by changes in exchange rates. The US software has a dominant share in the market and, on the other hand, the use of the same index ensures the best comparability between countries. It should be also noted that a consistent treatment of imports and use of imported products does not cause errors at the GDP level.
Recommendation 3(3): In the short term, it is better to use the US price index for imported pre-packaged software rather than to use deflators that are not directly related to software. The index should be adjusted on the basis of changes in exchange rates and it should reflect different timings of releases of new software in the US and in a country. As to the deflation of domestic software production, there is no reason to assume that prices develop in the same way as prices of imported software. However, as long as price indices are not available, it might still be better to use the US price index adjusted by the relative
88

STD/DOC(2003)1
inflation rate between a country and US (preferably PPI for a country vis-à-vis PPI for US) also for domestic production. It should be ensured that supply and use of software products are treated consistently for minimising errors at the GDP level.
Recommendation 3(4): In the long term price indices might be possible to develop for customised software although it is not easy to establish an index that is based on representative set of products and take into account quality development. For the time being (until 2005) an index based on averaging pre-packaged software index and input-cost index might be appropriate. If output and expenditure data are available by detailed classification, it could be considered to use different weights depending to what extent the services concerned can be produced on an own-account basis.
Recommendation 3(5): In the long term, when price indices for customised software become available, they can be used for own-account software services. Input-price indices should not be used. For the time being (until 2005), the best option is to rely on input-price indices, that is on the use of salary indices without any mechanical productivity adjustments, and adequate indices for intermediate consumption. Software originals can be deflated by the price index for pre-packaged software.
Recommendation 4(1): In practice, business reports on software capitalisation underestimate software capitalisation and may be affected by changes in tax regulations and business practices. As a consequence, member countries are recommended to implement an estimate of GFCF in software independent from the estimate derived from business reports on capitalised software.
Recommendation 4(2): Business surveys should be adapted to include precise estimates of software expenditures by company, in order to derive a figure consistent with the national accounts definition of software investment.
Recommendation 4(3): in the medium-term and before business surveys are implemented that are able to cover correctly investment in software in the national accounts definitionit is recommended that a supply method is used to estimate GFCF in software for the benchmark year.
Recommendation 5(1): industry sales data can only be used if they are sufficiently detailed (CPA 4-digit is a minimum for Europe); when implementing a supply approach from industry sales data, all sales of software products should be taken into account, even if relevant businesses are not classified under the category “computer services”. For example, manufacturing businesses may produce and sell software products as a secondary activity. “Royalties” should be included in these statistics.
Recommendation 5(2): in the supply approach, imports and exports definitions have to be consistent with definitions of domestic supply. Both should include royalty payments and license fees.
Recommendation 5(3): in the supply approach, double-counting of investment can be avoided by (1) ) by excluding flows corresponding to sub-contracts, (2) excluding 50% (if no specific data) of purchased pre-packaged software by the computer hardware industry, and (3) by excluding, in the macro-estimate of own-account production, costs of analysts and programmers corresponding to sales of custom computer programming services that have already been accounted for using the sales data.
Recommendation 5(4): in the supply approach, external costs of maintenance are to be excluded. In SIC classification, these costs could be estimated on the basis of 10 to 15% of external sales of SIC 73.71 or using a ratio derived from other sources. In CPA classification, a special category is representative of these costs (72.20.34), and they can thus be estimated directly. These flows are to be treated as intermediate consumption.
89

STD/DOC(2003)1
Recommendation 5(5): in the supply approach, purchases of households should be estimated through household budget surveys or other equivalent sources and excluded from sales (adjusted for trade margins and indirect taxes) to further derive GFCF in software.
Recommendation 5(6): Own-account software investment is significant (about one-thirds of total software investment) For improved international comparability own-account software should be estimated and included in total software investment..
Recommendation 5(7): The best practice for the estimation of own-account software investment at macro level is the following;
3) Estimate the labour cost of own-account software
= Labour cost of software professionals (number of software professionals * Average compensation)Adjustment 1: Exclude labour cost linked to the production of software to be sold (however, do not exclude labour costs for originals for reproduction)Adjustment 2: Exclude labour cost linked to other activities (maintenance, management, etc.)
4) Add non-labour costs of own-account software (intermediate consumption, consumption of capital, etc.) including net operating surplus.
Adjustment 3: in adding non-labour costs, avoid double counting costs that have been already recorded as purchases
Recommendation 5(8): When direct survey data on the number of software professionals are not available, employment data by occupation can be used. The coverage of employees should be limited to the number of computing professionals (ISCO 88; 213) for international comparability.
Recommendation 5(9): Own-account software is produced in all industries. Therefore, the number of software professionals should be broken down by group of economic activity including government sector.
Recommendation 5(10): The labour costs of software professionals used to derive the cost of own-account production should be based on compensation of employees, including net salaries and wages, but also social contributions (employer and employee, including imputed contributions).
Recommendation 5(11): If a country does not have reliable data on the share of time spent on the various tasks of computer professionals, the 50 percent deduction rule can be applied as an upper limit of the labour cost of own-account software production.
Recommendation 5(12): When calculating non-labour costs of own-account software production, based on the relationship between labour cost and non-labour costs, the data should be derived from computer industries (if possible, custom software developers would be preferable) rather than services industries in general. The ratio should be adjusted to exclude any double counting of external costs that would have been already recorded in the other branch of the supply method, covering purchases.
Recommendation 5(13): When calculating non-labour costs of own-account software production, net operating surplus should be included, using the cost structure of the computer services industry.
Recommendation 5(14): to ensure the consistency of the national accounts, adjustments are to be made to data reported from business accounts because of the difference between the estimate of GFCF in the national accounts and in the business reports. These adjustments are based on the difference between the independent “supply approach” estimate of GFCF and what is declared capitalised by businesses. In
90

STD/DOC(2003)1
order to compile this difference, surveys should continue to monitor capitalised software investment as they are recorded in business accounts.
Recommendation 5(15): in applying the supply method, double-counting of software investment already included in the national accounts (sometimes under “hardware”), through the use of standard business survey, should be avoided. This double counting, occurs when the general process of estimation of GFCF uses business reports which include software capitalised by business. Sometimes this software, even bought separately from hardware, is included as hardware.
91