report of the caa’s post implementation review of the...
TRANSCRIPT

Safety and Airspace Regulation Group
Report of the CAA’s Post Implementation Review of the London Airspace Management Programme (LAMP) Phase 1A Module A Airspace Change Proposal – London Stansted Airport Standard Instrument Departure (SID) Switch Proposal CAP 1692 A
Published by the Civil Aviation Authority, 2018 Civil Aviation Authority, Aviation House, Gatwick Airport South, West Sussex, RH6 0YR.
This report is part of a series of PIR reports for LAMP Phase 1A Airspace change proposal implemented on 4 February 2016.
Enquiries regarding the content of this publication should be addressed to: Airspace and ATM Aerodromes, Safety and Airspace Regulation Group, CAA House, 45-59 Kingsway, London, WC2B 6TE
The latest version of this document is available in electronic format at www.caa.co.uk

CAP 1692 A Contents
October 2018 Page 3
Contents
Contents .................................................................................................................... 3
Executive Summary ................................................................................................. 5
Operational Conclusion: ............................................................................................. 6
Complaints conclusion ............................................................................................... 6
Environmental conclusions ......................................................................................... 6
Confirmation of LAMP Phase 1A Module A Implementation ...................................... 7
Scope and Background of the PIR.......................................................................... 8
What is a Post Implementation Review ...................................................................... 8
Background to our conclusions in this PIR Decision .................................................. 8
Use of Stansted RNP1 SIDs ...................................................................................... 9
Conditions attached to the CAA’s decision to approve the change. ........................... 9
Relevant events since change ................................................................................... 9
Data collected for the purpose of the PIR ................................................................. 11
Sources of Information ...................................................................................... 11
Change Sponsor ........................................................................................ 11
Operators and Airlines ................................................................................ 11
Air Navigation Service Provider .................................................................. 12
Groups and residents local to Stansted Airport .......................................... 12
Other data we have considered ................................................................. 12
Objectives and Anticipated Impacts ..................................................................... 13
The original proposal and its objectives ................................................................... 13
Anticipated Impacts .................................................................................................. 14
CAA Assessment ................................................................................................... 16
Operational Assessment .......................................................................................... 16
Safety ................................................................................................................ 16
Operational Feedback ....................................................................................... 17
Air Navigation Service Provision ....................................................................... 17
Letters of Agreement ......................................................................................... 18
Utilisation and Track Keeping ............................................................................ 19
Traffic ................................................................................................................ 19

CAP 1692 A Contents
October 2018 Page 4
Environmental Assessment ...................................................................................... 20
Noise ................................................................................................................. 21
Overflights ......................................................................................................... 22
Summary of “overflight” impacts, as presented in the PIR data from the sponsor ...................................................................................................... 22
CO2 Emissions .................................................................................................. 23
Environmental Conclusion ................................................................................. 23
Community Stakeholder observations ...................................................................... 24
Ministry of Defence Operations ................................................................................ 26
Conclusion .............................................................................................................. 27
Operational Conclusions. ......................................................................................... 27
Environmental Conclusions. ..................................................................................... 27
Overall Conclusion. .................................................................................................. 28
Note on plain language .......................................................................................... 29
Annexes .................................................................................................................. 30
Annex A - LAMP Phase 1A PIR data provision requirements - evidence provided. ................................................................................................................. 31
Annex B - Stansted SID switch - CAA track plot analysis of change and SID usage. ...................................................................................................................... 35
Annex C: “LAMP PIR Bridging Module Analysis – Changes to population overflown by Modules A, B and C” (Version 2) ................................................... 44
Annex D - CO2 Emissions Summary ..................................................................... 45
Annex E - CAA complaints analysis by location. ................................................ 47
Annex F - CAA Gate Analysis. .............................................................................. 67

CAP 1692 A Executive Summary
October 2018 Page 5
Executive Summary
1. The CAA’s airspace change process is a seven-stage mechanism that is setout in detail in CAP 725. Under this process in February 2015, NATSsubmitted an Airspace Change Proposal (ACP) titled the London AirspaceManagement Programme (LAMP) Phase 1A proposal to the Civil AviationAuthority (CAA), to propose changes to airspace in the south-east of Englandincluding to a number of arrival and departure procedures at a number ofaerodromes. LAMP Phase 1A was a major airspace change designed todeliver modifications to airspace arrangements affecting a broad swathe ofsouth-east England from Stansted to the Isle of Wight in order to provide,primarily, capacity and efficiency benefits. There are five individual elements(referred to as Modules) of the LAMP Phase 1A proposal.
2. NATS, supported by Stansted Airport Limited (STAL), submitted a proposal tothe CAA to switch aircraft using the Standard Instrument Departure (SID) routevia Detling to Dover, onto the existing Clacton SIDs routeing towards Clactonuntil aircraft could be radar vectored by Air Traffic Control towards the northeastcoast of Kent to exit UK airspace at KONAN (approximately 24 NM to the eastof Dover); the switching of traffic was planned to occur between 0600 and 2300local time each day. Stage 7 of this process is a Post Implementation Review(PIR) that normally begins one year after implementation of the change.
3. The sponsor provided PIR data to the CAA in June 2017; on 18 October 2017,the CAA commenced the PIR of the impact of its decision and the implementedchange. The content and outcome of this review process by the CAA isdiscussed in detail in this report including its annexes.
4. On 2 January 2018, the CAA introduced a new process for making a decisionwhether or not to approve proposals to change airspace design (CAP1616).However, as this ACP was fully implemented prior to the introduction of thatdocument, and the PIR data received by the CAA prior to its introduction, thisreview has been undertaken in accordance with CAP725 and the Departmentfor Transport’s Guidance to the Civil Aviation Authority on EnvironmentalObjectives Relating to the Exercise of its Air Navigation Functions (2014).
5. During the review process, the CAA considered the data provided by thesponsor NATS and STAL. As a result, the CAA has reached the followingconclusions:

CAP 1692 A Executive Summary
October 2018 Page 6
Operational Conclusion:
6. The re-routeing of the Stansted Detling departures onto the Clacton SID flight paths have been integrated into the London Terminal Control and Area Control operations without causing disruptions to other traffic flows. Aircraft previously flying the Detling SIDs which now use the re-route via Clacton and airway (U)M84, now benefit from improved continuous climb profiles on the Clacton SIDs compared with what was achieved using the Detling SIDs. Thus, from an ATC airspace management viewpoint, the SID switching has achieved the aims and objectives of the change proposal. This has enabled the change proposed in Module C in which the London City departures using the EKNIV SIDs to the south/southeast are now able to climb above the new London City arrival flight paths. The change has also maintained a high level of safety. Without the Stansted SID switch taking place, this would not have been achievable.
Complaints conclusion
7. We have analysed the enquiries/complaints received by the Change Sponsor, NATS and the CAA as part of this Review. As a result of our analysis, we have concluded that the themes associated with a significant proportion of the total received are consistent with the traffic patterns we were expecting and observed when carrying out our aircraft track analysis.
Environmental conclusions
8. The noise impacts, as defined by the Leq contours, are consistent with the impact anticipated in the airspace change proposal. Although the population count within the actual 2016 57 dBA contour is greater than the sponsor’s forecast population count, this is most likely due to the nature of forecasts as a best estimate. Actual traffic volumes and runway usage etc will usually differ to some degree to the forecast estimate. Therefore, some impacts that occur post-implementation are as a result of differences between the forecast and actual traffic volumes etc. rather than an unanticipated impact of the airspace change itself.
9. On that basis, we consider that there has been no increase in the number of people significantly affected by noise as a direct result of the airspace change.

CAP 1692 A Executive Summary
October 2018 Page 7
10. As anticipated, there has been a net reduction in the number of peopleoverflown, whilst there is also a proportion of the population that are beingoverflown more often.
11. This Module has achieved a reduction in annual CO2 emissions that isconsistent with the anticipated reduction.
Confirmation of LAMP Phase 1A Module A Implementation
12. The CAA’s airspace change process in respect of the NATS / Stansted Airportairspace change request dated 16 February 2015 has now concluded.
13. This report, and its annexes and attachments, provide a summary of theinformation the CAA has reviewed and taken into account before reachingthese conclusions. All the information the CAA has taken into account ispublished on our website/interim portal.

CAP 1692 A Scope and Background of the PIR
October 2018 Page 8
Scope and Background of the PIR
What is a Post Implementation Review
14. The CAA’s approach to decision-making in relation to proposals to approvechanges to airspace is explained in its Guidance on the Application of theAirspace Change Process, CAP 725. This detailed Guidance provides that theseventh and last stage of the process is a review of the implementation of thedecision, particularly from an operational perspective, known as a PostImplementation Review (PIR).
15. The Guidance states that the purpose of a PIR is to determine whether theanticipated impacts and benefits in the original proposal and published decisionare as expected, and where there are differences, what steps (if any) arerequired to be taken.
16. If the impacts are not as predicted, the CAA will require the change sponsor toinvestigate why, and consider possible mitigations or modifications for impactsthat vary from those which were anticipated to meet the terms of the originaldecision.
17. A PIR is therefore focused on the effects of a particular airspace changeproposal. It is not a review of the decision on the airspace change proposal,and neither is it a re-run of the original decision process.
Background to our conclusions in this PIR Decision
18. On 13 October 2015, the CAA approved LAMP Phase 1A change proposals tochange traffic patterns for Stansted and Luton SIDs, London City arrival anddeparture routes, route network changes for London City, Gatwick,Farnborough, Southampton and Bournemouth; these changes involved avariety of changes which included RNAV1 procedures for London City arrivalsand departures and a number of new ATS routes providing connectivity to theroute network in adjacent States’ airspace. The changes for Stansted airportSIDs were proposed as Module A which is the subject of this report. In ourDecision document dated 22 December 2015 (as corrected on 4 March 2016),we provided information and background to the change. We recommendreaders of this report read that Decision in conjunction with this document.

CAP 1692 A Scope and Background of the PIR
October 2018 Page 9
Use of Stansted RNP1 SIDs
19. In the August 2016 traffic sample, we have noted that the Runway 22 ClactonSID has also been flown by aircraft using the Trial RNP 1 SIDs in addition tothose aircraft using the conventional SID. For the period of August 2016, wehave ascertained from STAL that approximately 17% of runway 22 Clactondepartures were RNP 1 departures. We believe the use of the RNP1 SIDs mayhave contributed to a slight change in the concentration as depicted in thedensity plots which has resulted in in a slight shift of the traffic pattern towardsHatfield Broad Oak. It should be noted that the Trial RNP 1 SID was subject toa separate airspace change submission to the CAA which was subsequentlyapproved for permanent operation in August 2017. The link to that airspacechange approval is here.
Note: the RNP1 SID implementation will also be the subject of a separate Post Implementation Review.
Conditions attached to the CAA’s decision to approve the change.
20. The following conditions were placed on the sponsor:
When D138A is activated by NOTAM above the normal upper limit of 6000ft, NATS is to radar monitor all aircraft using (U)M84 to ensure that aircraft are kept clear of D138A.
No Mandatory Occurrence Reports were raised concerning inadvertent penetration of D138A, therefore the CAA is satisfied this condition has been met.
Relevant events since change
21. Since the implementation of this ACP, Stansted airport reported an increase of7% in general aircraft movements between 2015 and 2016. The aircraftmovements at Stansted have increased on the CLN SIDs shown below in Table1. The data shows the impact of the number of flights being switched from theDetling route onto the Clacton route during the period 0600 – 2300 local time.

CAP 1692 A Scope and Background of the PIR
October 2018 Page 10
Table 1 – Stansted aircraft movements – Detling and Clacton SIDs.
This table is reproduced from the sponsor’s own PIR Report (Section 6) and it
shows the change in usage between the pre- and post-implementation
operations.
NPR 2015/16
Daytime
2015/16
Night Time
2015/16
Total
2016/17
Daytime
2016/17
Night Time
2016/17
Total
22 DET 17,975 666 18,641 1,331 551 1,882
04 DET 6681 271 6,952 345 282 627
22 CLN 14,592 199 14,791 30,205 322 30,527
04 CLN 5,192 63 5,255 16,008 173 16,181
Total 44,440 1,199 45,639 47,889 1,328 49,217
22. The table shows that:
Traffic on the CLN SIDs during the day more than doubled. Runway 22
CLN SIDs increased by 107% and Runway 04 CLN SIDs increased by
208%. This compares to a total increase in traffic represented in the table
of 7.8% between 2015/16 and 2016/17.
Note: Whilst the Runway 04 usage was not clarified in the PIR data,
following clarification with the airport, this increase may be attributed to by
the increased use of Runway 04 during the first year of operations.
Usage of 22 DET at night has fallen despite an overall increase in traffic.
Usage of the CLN SIDs at night has increased, over and above the
general increase in traffic. As this may have indicated that instead of the
switch from DET to CLN only occurring during daytime (0600-2300) as
was intended, there might have been a failure to switch back to using the
DET SIDs at night. This has been queried with the sponsor (Stansted)
who investigated and determined that this was not the case. Instead the
reason for the increased usage at night is changes to operator

CAP 1692 A Scope and Background of the PIR
October 2018 Page 11
preferences for routeings and timing of flights. It is not as a result of a
general continuance of using CLN in preference to DET after 2300.
Data collected for the purpose of the PIR
Sources of Information
Change Sponsor
23. By letter of 20 May 2016, the CAA requested from the change sponsor the datasets/analysis attached at Annex A by 4 May 2017. This summary of theevidence provided is also published on the CAA website. The data wasprovided to the CAA as requested.
24. During the review process, the CAA considered:
Route utilisation data.
Track plots of departure ‘whisker plots’ illustrating the route flown by
aircraft before and after the change.
Track density plots to illustrate the concentration of aircraft before and
after the change.
Radar track data samples pre and post change.
Noise monitoring reports.
Noise contours before and after the change.
The airports analysis of the impacts of the change.
Complaints delivered to STAL and NATS and the CAA.
Stansted airport community outreach engagement feedback.
Mandatory Occurrence Report (MOR) data.
25. We have noted that the change sponsor provided all of the data requested.Where we have asked for subsequent explanatory detail, we have madereference to this in our report.
Operators and Airlines
26. No specific data was required from operators and airlines as the proposalmoved aircraft from flying the Detling SIDs onto the extant Clacton SIDs duringthe period 0600-2300 local time.

CAP 1692 A Scope and Background of the PIR
October 2018 Page 12
27. STAL has advised that LAMP Phase 1A change is a topic within the Stansted Flight Evaluation Unit report presented quarterly to the Stansted Flight Operations Operational Performance and Safety Committee (FLOPSC). Implementation data collected is presented at this meeting, in terms of track keeping compliance and continuous climb statistics up to FL100 (i.e. 10,000ft). There have been no adverse comments from the airline community represented; STAL has commented that in fact this change has been welcomed in terms of the fuel and emissions savings for Stansted operators.
Air Navigation Service Provider
28. NATS is the air navigation service provider (ANSP) currently providing air traffic control services for arrivals and departures at the Airport. On 20 May 2016, the CAA confirmed with NATS the PIR data submission requirements to enable the PIR to be analysed. This request was published on the CAA’s website and the response is included at Annex A and on the CAA website together with all the data provided.
Groups and residents local to Stansted Airport
29. The CA, change sponsor, and NATS have all received feedback on the change from groups and residents much of which was directly related to the issues that the CAA required to be considered under the terms, scope and objective of this PIR.
Other data we have considered
30. We also received feedback from community outreach events conducted by STAL.
31. Complaints to the CAA were received and considered as discussed later in this report.

CAP 1692 A Objectives and Anticipated Impacts
October 2018 Page 13
Objectives and Anticipated Impacts
The original proposal and its objectives
32. NATS explained in its change proposal that:
the change was sponsored by NATS and supported by STAL. Prior to the
change, flights that departed Stansted Airport towards Kent (south east)
were becoming more inefficient as the airspace they flew through became
more congested. This proposal sought to place most of these flights onto
the extant eastbound departure routes towards Clacton, so that they may
avoid the congestion; this would reduce the risk of delay, reduce fuel
consumption and the amount of CO2 generated.
the objective is to improve environmental and operational efficiency for
Stansted DET departures. The proposed solution is to switch traffic from
the constrained DET SIDs onto the less constrained CLN SIDs, and link
the CLN SID to the original routeing at KONAN on (U)L607 at a higher
flight level.
there would be a CO2 saving per annum upon implementation.
there would also be overall noise benefits since the aircraft would be able
to climb more quickly and people beneath the current departure route
would be overflown less; however, people beneath the eastbound
departure route would be overflown more often.
this change was also to ensure that the Stansted Airport operation fits into
a wider programme of change to the use of airspace structures supporting
airports in South East England. It was an enabler for the implementation
of Point Merge arrival procedures at London City Airport.
33. In our decision we explained that:
the CAA was content that the proposal would deliver environmental
benefits to aircraft operators in terms of fuel burn and CO2 emissions for
re-routed Stansted departures, and the change would enable a significant

CAP 1692 A Objectives and Anticipated Impacts
October 2018 Page 14
improvement in the efficiency of integrating traffic through the very busy
and congested area in the south east of England, in particular through the
Detling area, and that the change would enable better departure profiles
to be achieved by London City departures routeing to the south east as
proposed in Module C of the proposal.
there would not be a significant impact on noise emissions (within the
meaning of Paragraph 9 of the Secretary of State’s 2001 directions to the
CAA).
we had taken into account that fuel and CO2 savings would be achieved
as a consequence of noise being displaced from one SID to another (the
Clacton SIDs) and therefore the population overflown beneath that SID.
We have also noted that we did not anticipate there will be a net increase
in the numbers of people exposed to noise of aircraft flying below 4000ft
AMSL, although there will be a redistribution. We took into consideration
the noise levels and the magnitude of those changes.
Anticipated Impacts
34. In our decision, the CAA Environmental Assessment concluded that despite the extra track miles there would be an overall reduction in CO2 emissions resultant from a reduction in fuel burn. In particular, the CAA’s Environmental Research and Consultancy Department (ERCD) Environmental Assessment Report concluded that:
Based upon the assessment presented in the ACP (the overarching
Environmental Benefits Section – see Reference D), NATS estimate that
the fuel savings per flight will be in the range of 120-205 kg, the variation
being principally dependent on the size and type of aircraft, the runway
direction used. Flights departing Runway 22 on the CLN SID having a 2
NM longer track distance that reduces some of the fuel savings
associated with the more efficient climb profile although the actual track
distance increase may be mitigated by tactical vectoring. In contrast,
departures from Runway 04 benefit from both a reduction in track distance
flown of approximately 6 NM and a more efficient departure climb profile,
giving larger fuel savings.

CAP 1692 A Objectives and Anticipated Impacts
October 2018 Page 15
In aggregating the savings, NATS adopted conservative values of 100-
200 kg, and has taken account of the approximately 10 percent of flights
on the DET SID that are given an efficient departure climb profile on a
tactical basis. The aggregated annual fuel savings are estimated to be in
the range of 2,000-4,000 tonnes (2012 +20% traffic) and 2,300-4,700
tonnes (2012 +40% traffic), which are consistent with the per flight savings
and the number of flights on DET SID that would benefit from the change
of SID. These equate to CO2 savings of 6,400-12,700 tonnes (2012
+20%) and 7,400-14,900 tonnes (2012 +40%) respectively.

CAP 1692 A CAA Assessment
October 2018 Page 16
CAA Assessment
Operational Assessment
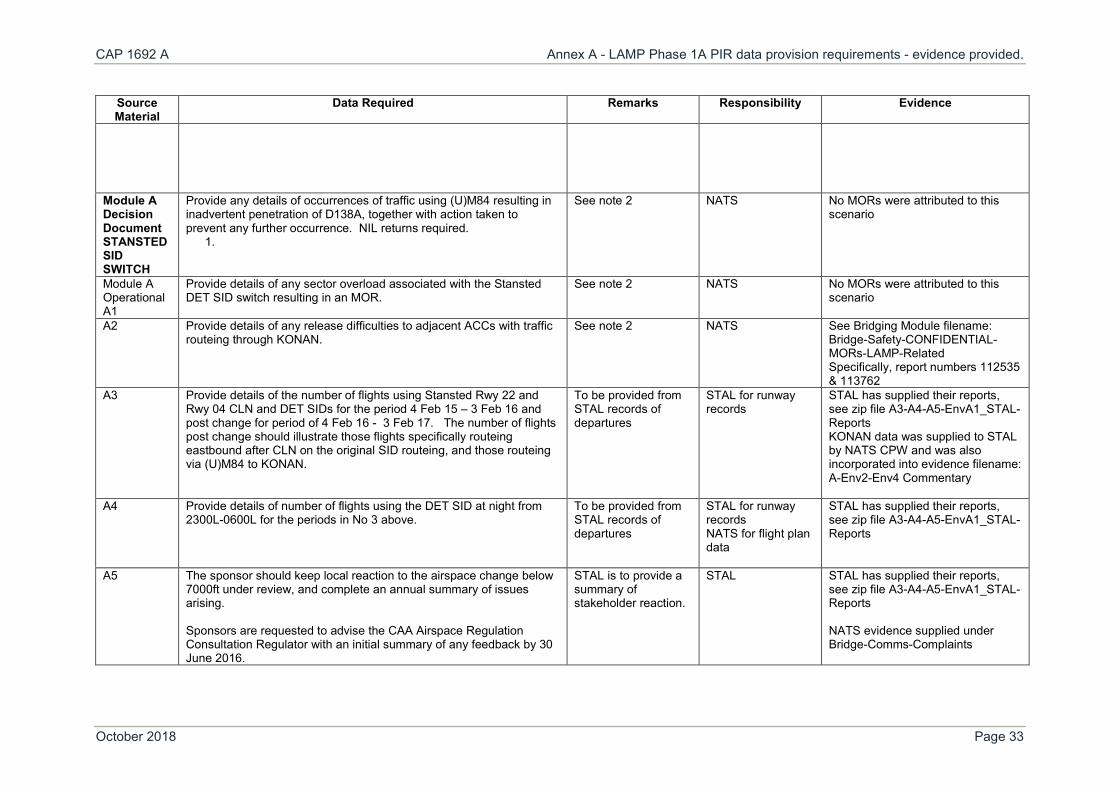
35. The CAA examined the track data plots presented by the sponsor and reviewed the evidence provided by the sponsor with regard to the set of PIR reporting requirements as highlighted at Annex A. The CAA completed a detailed analysis of procedures now being flown and compiled a report which is at Annex B. The following is a summary of the CAA’s conclusions.
Safety
36. Statistics concerning MOR, AIRPROX and Air Safety Reports events were examined to assess whether the revised airspace design was a contributory factor in those incidents or in reducing the number of incidents. Regarding the Annex A requirements, NATS provided evidence to satisfy all the PIR requirements.
37. Annex A reporting requirements:
1) Regarding inadvertent penetration of D138A, there were no MORs
relating to this scenario.
2) A1 – sector overload occurrences - there were no MORs relating to sector
overloads in respect of departures, although we noted two MORs were
attributed to arrivals – one in March and the other in May. Whilst these
occurrences were early on during the first year of operations, they could
be associated with controller familiarity with the new procedures. There
were no further reports in the first year of operations.
3) A3 – Release of traffic to adjacent Area Control Centres. There were two
MORs relating to either late transfer of traffic to Maastricht Area Control
centre (MUAC), or presentation of traffic to MUAC. Although in these
MORs, presentation of traffic to MUAC appears to have been an issue, it
was unclear if this was associated with the Stansted or Luton departures
(the latter associated with Module D changes). Whilst these occurrences
were either in March and April (early on during the first year of

CAP 1692 A CAA Assessment
October 2018 Page 17
operations), they were most likely associated with controller familiarity
with the new procedures. There were no further reports in the first year of
operations.
38. NATS concluded that the removal of the Stansted traffic from the previoustraffic towards Detling during daily operations, and thus taking it away from theinbound Heathrow flow from the east as they approach the holding pattern atLambourne, has been logically a reduction in complexity, and therefore therehas been a positive safety impact arising from this change.
39. With the re-routeing of Stansted departures, the CAA therefore concludes thatthe change proposal continues to maintain a high level of safety.
Operational Feedback
40. There has been no feedback to the sponsor from the operators other than viathe Stansted Flight Operations Safety Committee (FLOPSC). Through theFLOPSC, it was reported that the operators considered that the result of theimpacts arising from the change proposal has meant that the improved climbprofiles which the proposal brought about, have been beneficial in that,continuous climb operations are now a positive feature compared with theprevious restricted climb profile imposed via the Detling routeing due to thearrival flow mainly inbound to Heathrow from the east.
41. Feedback received from other airports regarding the impacts this ACP has hadon their operations is covered in the other LAMP PIR Modules.
Air Navigation Service Provision
42. As noted in paragraph 38, traffic complexity has seen a reduction in the numberof interacting flightpaths in the congested area to east of Lambourne where theprevious day time routeing to Detling created a number of interacting trafficflows from Stansted, Luton and Northolt, all heading towards Detling below thehigh intensity westbound flow inbound to Heathrow, This has had a positiveimpact on Safety, and whilst traffic growth at a number of London airports hasrisen significantly since 2016, NATS has had adequate resource to manage thetraffic re-routeing.
43. With regard to continuous climb operations (CCO), STAL provided a summaryof an analysis in their PIR Report. STAL reported that the overall improvement

CAP 1692 A CAA Assessment
October 2018 Page 18
in CCO has increased at the airport during the first year by 20 percentage points.
44. Both Clacton departure routes CCO have increased slightly - from 93.36% to 95.09% on Runway 22, and from 81.85% to 85.3% on Runway 04, despite the increase in departure traffic on those routes.
45. The CCO compliance on the 22 Detling SID has increased from 12.5% to 27.2%, however for those aircraft switched onto the Runway 22 Clacton SID now flying on the re-route, the CCO compliance is 95.09%; for the 04 Delting SID the CCO compliance has increased from 9% to 41.89%, however for those aircraft switched onto the Runway 04 Clacton SID now flying on the re-route, the CCO compliance is 85.3%.
46. Aircraft still using the Detling route after the change are, mainly daytime departures routeing via LYDD to northern France, or positioning flights for aircraft that position back to other London Airports because they are restricted in climb profile due to other arriving traffic into the London area. This was anticipated in the change proposal.
47. From the review of the data provided, the CAA considers that the switching over to the Clacton SID has thus enabled better climb profiles for departures which was an anticipated impact of the change. The re-routeing of traffic onto the Detling SID has taken the Stansted (together with the Luton and Northolt departures as proposed in Module D) away from the EKNIV SID departure routes proposed in Modules B and C, and therefore this re-routeing of the Detling SIDs has had the desired effect of enabling the Thames Radar sector controllers to climb the London City EKNIV departures above the arriving flows inbound to London City which would not have been possible without the changes proposed in Module A.
Letters of Agreement
48. With airway M84 being aligned east of the danger area D138A but within 5NM of the danger area boundary, NATS controllers were to ensure aircraft were kept clear of D138A when activation was notified above its normal upper limit of 6000ft (as per condition of the approval). This has not been an issue during the few occasions when activity has been raised above the normal upper limit. Therefore, the arrangements for airspace sharing with the MOD, and the utilisation of the danger areas by the MOD, which are detailed in an MoU

CAP 1692 A CAA Assessment
October 2018 Page 19
between NATS and the MOD danger area authority have not been affected by the changes introduced with this change proposal.
Utilisation and Track Keeping
49. The CAA carried out an in-depth analysis of the traffic patterns achieved byviewing traffic samples for selected periods during 4 seasonal monthsthroughout the first year of operation. The analysis report is detailed in AnnexB. The traffic samples are included on the CAA website. To understand theimpacts, interested parties should read the guidance in Annex B before readingthe track analysis and associating the comments with the relevant diagrams.
50. In broad terms, the CAA considers that utilisation and track keeping is asanticipated other than on the Clacton Runway 22 SID which shows a slight shiftin the concentration below 4000ft towards Hatfield Broad Oak. We haveascertained that 17% of Runway 22 Clacton departures in August 2016 wereaircraft using the trial RNP1 SID (see further detail in paragraph 19 of thisReport) at that time. The evidence indicates that aircraft using that trial SIDflew a tighter initial turn which results in a track that is further from HatfieldHeath but closer to Hatfield Broad Oak. On that basis, we believe that thisaspect of the change in traffic pattern is likely to be due in large part to theproportion of departures that were using the trial RNP1 SID rather than as aneffect of the airspace change.
Traffic
51. The CAA examined the traffic statistics during the period from 2012 to 2017 inorder to assist us in the analysis of the impact of the change proposal. Annualtraffic figures are shown in Table 2.

CAP 1692 A CAA Assessment
October 2018 Page 20
Table 2 - Comparison of annual traffic figures with traffic forecast from the airspace change proposal
Actual Forecast (2012+20%)
2012 2013 2014 2015 2016 2017 2016
Total traffic* 141,400 142,800 157,100 167,500 178,700 188,000 169,600
R04 (East) Usage
30% 38% 34% 29% 33% 23% 30%
R22 (West) Usage
70% 62% 66% 61% 67% 77% 70%
52. The traffic forecast that was provided in the original airspace change proposalfor 2016 was 2012 volume +20%. Using 2012 traffic volumes as the baseline,this equals a forecast of 169,600 flights for 2016. The actual traffic volume for2016 was approx. 178,700. This is 5.3% greater than the forecast for 2016, andrepresents growth of 26.4% since 2012; this shows that traffic growth hasexceeded the sponsor’s forecast.
53. As previously commented on (Table 2), we noted that traffic has increased onthe relevant SIDs such that traffic on the CLN SIDs during the day has morethan doubled. On Runway 22, CLN departures increased by 107% and Runway04 CLN departures increased by 208%. This compares to a total increase intraffic represented in the Table 2 of 7.8% between 2015/16 and 2016/17. Thiswas queried with the sponsor, who indicated that this apparent inconsistencywas due to a combination of the general increase in traffic plus the change inrunway usage which would have resulted in an increase in the proportion ofdepartures on Runway 04.
Environmental Assessment
54. The sponsor provided its analysis of the environmental impacts (see Annex Aof this report for a list of information provided) for the airspace change postimplementation review. The CAA has assessed that data and the details of thatassessment are set out below.

CAP 1692 A CAA Assessment
October 2018 Page 21
Noise
55. STAL has provided 57 dBA Leq contours for 2015 (pre-implementation) and2016 (post-implementation). It notes that the size of the contours has increasedslightly which it reasonably attributes to the growth in traffic volumes. However,it also makes the statement that the shape of the contours has not changed asa result of the SID switch. This statement required closer examination; thesouthern extremity of the contours clearly shows a difference in shape incomparison to 2015, with a more pronounced south-easterly bulge on the outercontour which therefore begins to include an area of Little Halingbury/Wright’sGreen/Gaston Green that was not within 2015’s 57 dBA Leq contour. Thischange in shape is likely to be due in part to the switch in traffic from the 22DET SID to the 22 CLN SID. However, a comparison with the forecast 2016noise contours as presented in the consultation material shows that thedifference in shape is much less pronounced. The shape and size of theforecast contours for 2016 and the actual contours for 2016 are very similar.
56. In terms of population count the 2016 forecast noise contours estimated afigure of 1,700 within the 57 dBA contour. The actual population count withinthe 57 dBA contour for 2016 was 2,050. (There were no differences betweenforecast and actual population numbers for any of the greater dBA contours.)The difference of 350 represents a larger population within the 57 dBA contourthan was anticipated.
57. Based on the fact that the shape of the forecast and actual contours for 2016are sufficiently similar, this difference in population is most likely due to:
the growth in traffic over and above what was forecast for 2016; and
a difference in runway usage. The data used for the contours shown for
2016 were actually based on 2012 actual contours (the latest available
before consultation); the 2012 contours reflected an 85% west / 15% east
split whereas the actual split for 2016 was 67% west / 33% east;
rather than as an unexpected impact of the airspace change itself.
58. On this basis, we conclude that the airspace change is has not resulted in anunexpected increase in people significantly affected by noise, as defined in ouroriginal decision.

CAP 1692 A CAA Assessment
October 2018 Page 22
Overflights
Summary of “overflight” impacts, as presented in the PIR data from the sponsor
59. The table and accompanying text should be read in conjunction with the furtherinformation at Annex C of this report. Population counts in the table have beenrounded to the nearest 100, and therefore differences will be due to rounding.
Module A - Stansted Pre-implementation
(2013)
Post-implementation
(2016)
Increase / decrease
Easterly departures
Direct overflight - Ground to
below 4,000ft
500 800 300
Direct overflight - 4,000ft to
below 7,000ft
1,500 1,700 200
Direct overflight - Ground to
below 7,000ft
2,000 2,500 500
“CAP1498 swathe”1 22,400 21,600 -900
Westerly departures
Direct overflight - Ground to
below 4,000ft
2,200 1,900 -300
Direct overflight - 4,000ft to
below 7,000ft
2,400 100 -2,200
Direct overflight - Ground to
below 7,000ft
4,500 2,000 -2,500
“CAP1498 swathe” 23,100 9,000 -14,000
Note: The Easterly and Westerly population counts cannot be combined to show a total
because some of the geographic areas are common to both Easterly and Westerly, especially
for the pre-implementation traffic pattern.
1 See CAP 1498 – paragraph 2.9 – 3.0 refers to overflight and swathes.
CAP 1692 A CAA Assessment
October 2018 Page 23
60. NATS has not used the full CAP1498 “overflight” methodology to produce a setof contours which would have given a clearer picture the proportion of thepopulation that are being overflown more often as a result of the airspacechange. Therefore, in the case of Module A, where in broad terms traffic on tworoutes was increased by switching from two other routes, a possible proxy forgauging the population being overflown more often would be the headcount forthose within the direct overflight totals (the shaded cells in the table above)though due to routes sharing a common initial segment (and therefore someresidents already experiencing the same number of flights both before and afterthe change) the numbers in the shaded cells may reflect an over-statement.
61. Therefore, whilst it is apparent that using the simplified CAP1498 swathe showsthat there has been a net reduction in the population overflown (and also a netreduction in the population directly overflown) below 7,000ft, the shaded cellsshow that there is a portion of the population that is likely to be experiencing anincrease in being overflown as a direct result of this airspace change,regardless of the increase in traffic volumes that has occurred despite theairspace change. This impact – a net reduction in the population beingoverflown, but with a proportion of the population being overflown more often –was anticipated as a result of implementing the airspace change.
CO2 Emissions
62. Further detail of the PIR assessment of the change in fuel burn and CO2
emissions can be found in Annex D of this report which summarises theimpacts across all of the LAMP Phase 1A Modules.
63. Module A has achieved a CO2 reduction in-line with the estimated change inemission that was proposed and considered when the CAA made its decisionto approve the proposed airspace change.
Environmental Conclusion
64. The CAA’s conclusion in this PIR is that environmental impacts consequentialon the implementation of any of the changes are largely as expected and areconsistent with the impacts we took into consideration in making our originaldecision.
CAP 1692 A CAA Assessment
October 2018 Page 24
Community Stakeholder observations
65. As part of the data collection process, the change sponsor was required to accept, process and collate noise enquiries/complaints and feedback relating to the implementation of this airspace change. This data was subsequently analysed by the change sponsor and the associated report has been reviewed and assessed by the CAA.
66. Whilst the analysis completed by the change sponsor confirms that there has been a significant increase in the number of enquiries/complaints received following the implementation of this airspace change, it also notes that there are other factors that need to be considered; these are increased utilisation of the westerly runway (22) and a general increase in the number of aircraft movements.
67. A total of 4,170 enquiries/complaints were analysed by the change sponsor for the purpose of this PIR and this total was generated by 670 individuals from 117 geographic locations (the change sponsor requires individuals to provide a full postal address when registering an enquiry/complaint and a full breakdown of locations was included in their report). The CAA notes that 10 individuals were accountable for more than half (2,468) of the total number of enquiries/complaints received by the change sponsor.
68. Focussing on the geographic location of the enquiries/complaints, the CAA plotted the location of those towns/villages from which more than 10 individual complainants submitted enquiries/complaints. Having discounted those locations which clearly fall outside of the scope of this Review (i.e. those locations that have not been directly affected by the implementation of this airspace change), the CAA notes that a total of 2,811 enquiries/complaints were generated by 283 individual complainants residing in 9 towns/villages that lie directly under or within close proximity of the SID centrelines associated with this airspace change proposal. The main themes that were identified when analysing these enquiries/complaints concerned the increase number of aircraft movements, noise and low flying aircraft.
69. In addition to the feedback noted and considered above, the CAA has analysed the 127 enquiries/complaints that were addressed to NATS concerning the implementation of this airspace change proposal. Of that total, the majority (84) were generated by individuals residing in the same 9 towns/villages referenced above. Although the raw data has been provided, it has been anonymised and consequently it has not been possible for the CAA to determine whether or not
CAP 1692 A CAA Assessment
October 2018 Page 25
individual complainants were responsible for multiple enquiries/complaints. Very similar themes (increase number of aircraft movements and noise) were identified when analysing these enquiries/complaints, although the CAA notes that a number of complainants deemed that the consultation associated with this airspace change proposal was insufficient and that there were a number of requests to reverse the regulatory decision approving the implementation of the airspace change.
70. Finally, the CAA analysed the enquiries/complaints which it received directlyfrom stakeholders following the implementation of this airspace change. TheCAA received a total of 48 enquiries/complaints which specifically relate toLondon Stansted airport and aircraft activity associated with it. Of the totalreceived, 16 fell outside of the scope of this review as they focussed solely onthe correctness or otherwise of our original regulatory decision, soughtclarification on the requirements of the airspace change process and/orconcerned un-related aircraft activity. As this correspondence did notspecifically concern the impact of aircraft activity following the implementationof this airspace change, it was not considered for the purposes of the PIRconclusions.
71. Of the remaining 32 enquiries/complaints, 26 were received directly fromindividuals whilst 6 were received from elected representatives (1), parishcouncils (4) and/or the airport consultative committee (1). A total of 20enquiries/complaints were generated by individuals (18) and parish councils (2)residing in/representing the 9 towns/villages reference above. Once again, anumber of common themes were identified when reviewing the content of theseenquiries/complaints, with much of the correspondence received by the CAAhighlighting that there had been a noticeable change/increase in aircraftactivity. Other common themes concerned the concentration of aircraft, lowflying and noise.
72. A comparison of complainants’ locations in relation to the post-implementationtraffic patterns was undertaken – refer to Annex E (Complaints Analysis) for theconclusions. The main conclusion from this work was that there are nounanticipated impacts revealed – other than for complaints originating fromHatfield Broad Oak. Any noise increase at that location, whilst being partly anexpected result of the airspace change, might also to be in part due to the TrialRNP1 SID that was being used by a small proportion of aircraft in 2016;however, we are unable to confirm whether this is the case given that we areunable to correlate the complaints data with actual use of the Trial SID. Thenominal track of the trial SID is closer to Hatfield Broad Oak than theconventional SID, which would therefore account for a change in traffic pattern

CAP 1692 A CAA Assessment
October 2018 Page 26
that shows the concentration of departing aircraft had moved closer to that community. (This supported by the Gate Analysis at Annex F of this report. Figures 9 and 10 of that Annex show a change in lateral spread, with a distinct “clump” that is likely to be the aircraft using the Trial RNP1 SID.) This aspect was not anticipated, but nor is it a result of the airspace change that this PIR is assessing.
73. To summarise, we have analysed the enquiries/complaints received by theChange Sponsor, NATS and the CAA as part of this Review. As a result of ouranalysis, we have concluded that the themes associated with a significantproportion of the total received are consistent with the traffic patterns we wereexpecting and observed when carrying out our aircraft track analysis and do notgive rise to any unforeseen impacts of the proposal.
Ministry of Defence Operations
74. Operations by the Ministry of Defence were not affected by the proposals inModule A.

CAP 1692 A Conclusion
October 2018 Page 27
Conclusion
Operational Conclusions.
75. The change has achieved the aims and objectives of the change proposal andthere have been no significant unforeseen or unanticipated impacts.
76. The removal of the Stansted traffic from the previous traffic flow towards Detlingduring daily operations, has reduced traffic complexity in this region. There hastherefore been a positive safety impact arising from this change.
77. There has been an improvement in CCO arising as a result of the trafficswitching onto the Clacton SIDs.
78. The change has effectively been integrated into the complex traffic flows in thesouth east of England.
79. With the re-routeing of Stansted departures, the CAA concludes that thechange proposal continues to maintain a high level of safety.
Environmental Conclusions.
80. The noise impacts, as defined by the Leq contours, are consistent with theimpact anticipated in the airspace change proposal. The greater populationcount within the actual 2016 57 dBA contour than the forecast population countis most likely due to differences between forecasts vs actual (i.e. trafficvolumes, runway usage) than an unanticipated impact of the airspace changeitself.
On that basis, there has been no increase in the number of people significantly affected by noise as a direct result of the airspace change.
As anticipated, there has been a net reduction in the number of people overflown, whilst there is also a proportion of the population that are being overflown more often.

CAP 1692 A Conclusion
October 2018 Page 28
This Module has achieved a reduction in annual CO2 emissions that is consistent with the anticipated reduction.
Overall Conclusion.
81. In respect of Module A of LAMP Phase 1A, the CAA confirms that the operational aims and objectives have been achieved. This change is now confirmed. Therefore, the CAA’s airspace change process in respect of London City Airport’s airspace change request dated 16 February 2015 has now concluded.
CAP 1692 A Note on plain language
October 2018 Page 29
Note on plain language
82. The CAA has attempted to write this report as clearly as possible. Ourapproach has been to include all the relevant technical material but also toprovide a summary and of the conclusions the CAA has reached in reliance onit in as understandable a way as possible. Nevertheless, when summarising atechnical subject there is always a risk that explaining it in more accessibleterms can alter the meaning. For that reason, the definitive version of ourassessment and conclusions are in the attached technical reports.

CAP 1692 A Annexes
October 2018 Page 30
Annexes
Annex A LAMP Phase 1A PIR data provision Requirements - evidence provided.
Annex B Stansted Airport SID switch – CAA track plot analysis of change and
SID usage.
Annex C General commentary on the sponsor’s assessment of populations
overflown.
Annex D CO2 Emissions Summary
Annex E CAA complaints analysis by location.
Annex F CAA Gate Analysis.

CAP 1692 A Annex A - LAMP Phase 1A PIR data provision requirements - evidence provided.
October 2018 Page 31
Annex A - LAMP Phase 1A PIR data provision requirements - evidence provided.
LAMP PHASE 1A PIR DATA PROVISION REQUIREMENTS ANNEX A TO LAMP PHASE1A PIR REVIEW REQUIREMENTS DATED 20 MAY 2016
Data for the PIR review is to be submitted to the CAA by 4 May 2017 unless stated otherwise in the remarks column where specific actions are required to be completed in accordance with the CAA Decision Documents dated 22 December 2015 as amended.
The following Notes relate to data provision regarding the format of submission material and responsibilities of the appropriate LAMP sponsors.
In the Table below, the last column indicates responsibility for the appropriate LAMP sponsor to provide data as appropriate; in some circumstances, this responsibility is to be shared as agreed between sponsors.
Note 1: NATS, London City Airport Ltd and London Stansted Airport Ltd are to collaborate to produce a joint PIR to match the collaborative ACP. References to ’LAMP Sponsors’ in the remarks column refer to the collective.
Note 2: MOR analysis: A number of the remarks below relate to MOR analysis. NATS is to monitor MORs generated within the region and highlight any significant issues that require further investigations to the case officer as they arise. A complete MOR summary for the year post implementation is to be provided with the PIR in May 2017. It is noted that overloads are reported as a subset of MORs.
Note 3: Density and track plot maps: NATS is to aim to produce directly comparable maps across the whole LAMP 1A region. However, given that NATS is upgrading their track processing technology, it is understood that this may mean data presentation tools change from those used in the consultation. The CAA recognises that this in turn may make it impossible to produce new maps that are directly comparable to the consultation diagrams. If this occurs NATS is to produce fresh maps using the new technology with the new data and the historic consultation data; this is to allow comparison of:
- The difference the between the old and new tools (i.e. compare consultation material with same data in new tool).
- The difference between the old and new data (i.e. comparing the consultation data and new data using the new tool).
If any of the sponsors find they are unable to produce directly comparable maps, they must advise the CAA at the earliest opportunity with a view to agreeing the best alternative presentation of data in advance of the PIR target deliverable date in May 2017.

CAP 1692 A Annex A - LAMP Phase 1A PIR data provision requirements - evidence provided.
October 2018 Page 32
Whilst airports have additional data that is not compatible with the NATS system, for example track plots distinguishing between RNAV and non RNAV arrivals, these should also be provided where relevant. Where consultation and ACP material showed plots highlighting flights over AONBs, this is to be repeated for the PIR plots. The Lmax data provided with consultation plots is to be reviewed and any difference highlighted. Note 4: Sponsors are to review the assumptions of the CO2 analyses and update the analyses accordingly. Note 5: Sponsors are to review all the ACP claims and report on whether the statements can be supported by observation post implementation.
Source Material
Data Required Remarks Responsibility Evidence
Decision Documents
CAP 1366 (Decision Document)
Not specified here; see Individual Modules, and ENV requirement under bridging Module
General ENV Requirement for track dispersion plot diagrams
The general requirement for all Modules is that any diagrams provided as part of the PIR must be directly comparable with equivalent diagrams provided as part of the consultation and/or the proposal. There should be no changes to style, format, scale, colour-coding etc.
See note 3 NATS and airports
Bridging Module 1
Updated CO2 analysis using the same principles as the assessment undertaken as part of the Bridging Module. Assumptions to be updated based upon actual post-implementation data (e.g. the proportion of traffic that is tactically vectored, runway usage, flight numbers etc). Analysis to be broken down by Module, to reflect individually all five Modules submitted.
See note 4 NATS See NATS reports: Bridge-Anticipated Impacts and Benefits Summary Bridge-Fuel-CO2-Analysis Bridge-Population-Overview-Analysis For MORs regarding overloads, see Bridge-Safety-Confidential-MORs
CAP 1692 A Annex A - LAMP Phase 1A PIR data provision requirements - evidence provided.
October 2018 Page 33
Source Material
Data Required Remarks Responsibility Evidence
Module A Decision Document STANSTED SID SWITCH
Provide any details of occurrences of traffic using (U)M84 resulting in inadvertent penetration of D138A, together with action taken to prevent any further occurrence. NIL returns required.
1.
See note 2 NATS No MORs were attributed to this scenario
Module A Operational A1
Provide details of any sector overload associated with the Stansted DET SID switch resulting in an MOR.
See note 2 NATS No MORs were attributed to this scenario
A2 Provide details of any release difficulties to adjacent ACCs with traffic routeing through KONAN.
See note 2 NATS See Bridging Module filename: Bridge-Safety-CONFIDENTIAL-MORs-LAMP-Related Specifically, report numbers 112535 & 113762
A3 Provide details of the number of flights using Stansted Rwy 22 and Rwy 04 CLN and DET SIDs for the period 4 Feb 15 – 3 Feb 16 and post change for period of 4 Feb 16 - 3 Feb 17. The number of flights post change should illustrate those flights specifically routeing eastbound after CLN on the original SID routeing, and those routeing via (U)M84 to KONAN.
To be provided from STAL records of departures
STAL for runway records
STAL has supplied their reports, see zip file A3-A4-A5-EnvA1_STAL-Reports KONAN data was supplied to STAL by NATS CPW and was also incorporated into evidence filename: A-Env2-Env4 Commentary
A4 Provide details of number of flights using the DET SID at night from 2300L-0600L for the periods in No 3 above.
To be provided from STAL records of departures
STAL for runway records NATS for flight plan data
STAL has supplied their reports, see zip file A3-A4-A5-EnvA1_STAL-Reports
A5 The sponsor should keep local reaction to the airspace change below 7000ft under review, and complete an annual summary of issues arising.
Sponsors are requested to advise the CAA Airspace Regulation Consultation Regulator with an initial summary of any feedback by 30 June 2016.
STAL is to provide a summary of stakeholder reaction.
STAL STAL has supplied their reports, see zip file A3-A4-A5-EnvA1_STAL-Reports
NATS evidence supplied under Bridge-Comms-Complaints

CAP 1692 A Annex A - LAMP Phase 1A PIR data provision requirements - evidence provided.
October 2018 Page 34
Source Material
Data Required Remarks Responsibility Evidence
Module A ENV A1
Sponsor to provide sufficient data to confirm that there have been no changes to Leq noise contours as a result of the airspace change, or alternatively to illustrate any changes to the contours. The sponsor may provide post-implementation contours for direct compassion with pre-implementation contours, or provide sufficient evidence that support any rationale that Leq contours are unchanged and do not need to be produced. Such evidence is likely to include a comparison of lateral and vertical aircraft tracks (both pre- and post-implementation).
If a rationale for not producing Leq contours cannot be provided and accepted by the CAA, then the comparison can be based on 2016 Leq contours – subject to other factors not related to the ACP being taken into account (e.g. traffic growth).
STAL STAL has supplied their reports, see zip file A3-A4-A5-EnvA1_STAL-Reports
ENV A2
In addition to the requested operational track diagrams, the sponsor is to re-perform any noise assessment that was reflected in the consultation or proposal documents, to reflect post-implementation data. This includes any swathes, altitude bands, anticipated noise levels and frequency of flights that were used to portray the expected noise impact.
See Note 3. NATS and airports are to review diagrams and assess/ provide what is required
Track plots complete, matching those in the main consultation doc (including consultation areas and AONB) See evidence folder A-Env2-Plots And filename A-Env2-Env4 Commentary
ENV A3
Sponsor to provide an assessment of the impact upon CO2 emissions as a result of the airspace change, using the same methodology as the consultation and proposals, but updated as required using actual post-implementation data (e.g. to replace or update any assumptions used, to use actual track profiles and actual track mileages. The emissions assessment must be consistent with the pattern of traffic reflected in any associated track diagrams provided for the PIR.
See note 4. NATS & Airport See Bridging Module files: Bridge-Fuel-CO2-Analysis Bridge-Population-Overview-Analysis
ENV A4
Sponsor to provide sufficient data/rationale to support any claimed environmental impacts (positive, negative or neutral) made in consultation or proposal documents (e.g. Local Air Quality, tranquillity, visual intrusion etc.)
See note 5. NATS and the airport are to review and assess what is required
Track plots from A-Env2 will be that evidence See filename A-Env2-Env4 Commentary

CAP 1692 A Annex B - Stansted SID switch - CAA track plot analysis of change and SID usage.
October 2018 Page 35
Annex B - Stansted SID switch - CAA track plot analysis of change and SID usage.
Introduction.
This analysis report provides a description of the flight paths before the SID switch change on 2 February 2016 and the changes to traffic patterns after the change. When referring to locations, as far as possible, we refer to locations visible on the associated diagrams.
For SID utilisation, this is described in the main report paragraph 21.
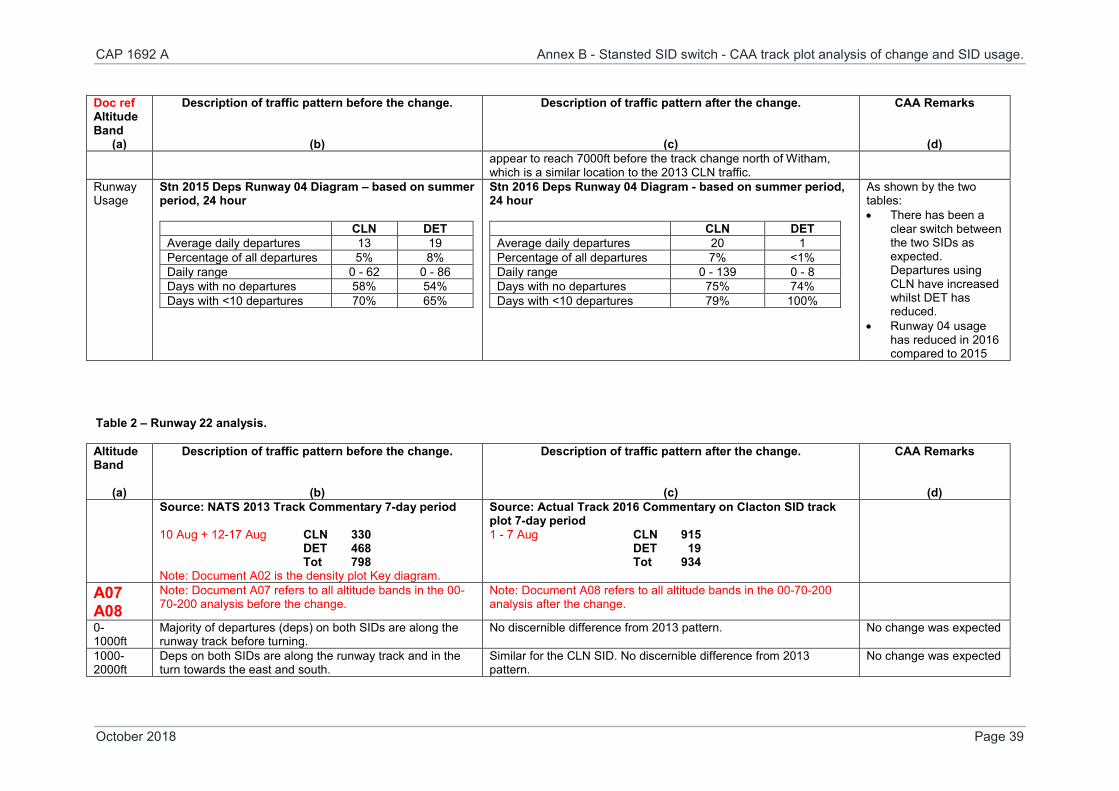
We have reviewed all the track plots provided by the sponsor. This analysis relates to the traffic sample shown in consultation representing traffic patterns between 1-7 June 2013 before the change, and a representative sample in terms of similar traffic numbers in the period 1-6 June and 8 June 2016.
General Observations:
In the 2016 traffic sample, there are very few departures using either Detling SID, therefore resulting in fewer aircraft overflying those areas and locations that had previously been overflown by the Detling departures after the Clacton and Detling routes diverge shortly after take-off. Where the 2016 traffic patterns reflect some departures still flying the Detling SID, these are most likely to be traffic at night or the occasional positioning flights to Gatwick, London City, Northolt, and North Weald or those flights routeing via Lydd as described in consultation and the change proposal.
There are new areas and locations overflown above 7000ft as aircraft which were previously on Detling SIDs are now tactically vectored from the Clacton SIDs towards north east coast of Kent. Similarly, it is obvious from the diagrams that the area previously overflown by the Detling SIDs (after both Clacton and Detling SID flightpaths diverge from each other), that traffic is no longer evident other than the occasional flights referred to above which are positioning to Gatwick or flying via Lydd.
The track distribution away from the Clacton SID above 7000ft is happening earlier for Runway 22 well before BRAIN, contrary to what was described in the change proposal. For Runway 04 departures, this is just occurring before BRAIN.
Track distribution above 7000ft was not shown in the consultation document other than the indicative flight paths (the Clacton SIDs) via Clacton, then the routeing to the southeast using airway (U)M84.
On the Clacton Runway 22 SID, the data sample for August 2016 shows a slight shift in the concentration below 4000ft towards Hatfield Broad Oak. The data sample provided for the PIR was for 330 Clacton SIDs in August 2013 and 915 Clacton SIDs in August 2016. We have ascertained that 17% of Runway 22 Clacton departures in August 2016 were aircraft using the Trial RNP1 SID (see further detail in paragraph 19 of the main PIR Report) in use at that time. The evidence indicates that aircraft using that trial SID flew a tighter initial turn which results in a track that is further from Hatfield Heath but closer to Hatfield Broad Oak. On that basis, we believe that this aspect of the change in traffic pattern is likely to be due in large part to the proportion of departures in the August 2016 traffic sample that were using the Trial RNP1 SID.

CAP 1692 A Annex B - Stansted SID switch - CAA track plot analysis of change and SID usage.
October 2018 Page 36
Table Key:
Column a illustrates the altitude band relating to the traffic samples. The cross reference to the traffic sample documents and website links are shown in red.
Column b is a commentary on the description of traffic dispersion on the Clacton SIDs prior to the change.
Column c is a commentary on the description of traffic dispersion on the Clacton SIDs after the change.
Column d indicates CAA remarks.
Table 1 – Runway 04 analysis.
Doc ref Altitude Band
(a)
Description of traffic pattern before the change.
(b)
Description of traffic pattern after the change.
(c)
CAA Remarks
(d) A01 A02
Source: NATS 2013 Track Commentary 7-day sample period:
1-7 Jun CLN 379 DET 466 Tot 845
Note: Document A02 is the density plot Key diagram.
Source: Actual Track 2016 Commentary on Clacton SID track plot 7-day sample period:1-6 + 8 Jun CLN 763 (extra 384 flights)
DET 31 Tot 794
A03 A04
Note: Document A03 refers to all altitude bands in the 00-70-200 analysis before the change.
Note: Document A04 refers to all altitude bands in the 00-70-200 analysis after the change.
0- 1000ft
Majority of departures (deps) are along the runway track before turning.
No discernible difference. No change was expected
1000- 2000ft
Deps are along the runway track and in the turn towards the east.
Similar for the CLN SID. The DET SIDs are not evident due to the SID switch.
As expected, reflecting the increase on the CLN SID arising from the SID switch.
2000-3000ft
The split of deps on the CLN and DET SIDs is evident. The lateral spread of CLN deps is similar to the 2013 CLN SID sample; however, some aircraft appear to be in this altitude band for longer. There are very few DET deps due to the SID switch.
Lateral spread is as expected, but the appearance of some aircraft travelling for longer in this altitude band was not expected. See CAA Gate Analysis at Annex F.

CAP 1692 A Annex B - Stansted SID switch - CAA track plot analysis of change and SID usage.
October 2018 Page 37
Doc ref Altitude Band
(a)
Description of traffic pattern before the change.
(b)
Description of traffic pattern after the change.
(c)
CAA Remarks
(d) 3000-4000ft
The split of deps on the CLN and DET SIDs is evident. The CLN SIDs are mainly shown in the centre of the outlined area and most aircraft are reaching 4000ft by the A120.
The lateral spread of CLN deps is similar to the 2013 CLN sample; however, some aircraft appear to be in this altitude band for longer. There are very few DET SIDs due to the SID switch.
Lateral spread is as expected, but the appearance of some aircraft travelling for longer in this altitude band was not expected. See CAA Gate Analysis at Annex F.
4000- 5000ft
The split of deps on the CLN and DET SIDs is evident. The CLN SIDs are mainly shown in the centre of the outlined area until they are vectored off the SID above the NPR vectoring restriction (4000ft), hence the spread of traffic towards the east towards the Braintree area. Some deps extend in this band along the SID flight planned track as far as the second ‘e’ in Kelvedon.
The lateral spread of deps is similar to the 2013 CLN sample. There are very few DET SIDs due to the SID switch.
As expected. with the increase in traffic.
5000-6000ft
The split of deps on the CLN and DET SIDs is evident. There is evidence of aircraft continuing along the CLN SID, but also evidence of aircraft being tactically vectored to the east over the area of Braintree.
The lateral spread of deps is similar to the 2013 CLN sample. There are very few DET SIDs due to the SID switch. Tactical vectoring is also evident, in a similar pattern to 2013, but with an increase in aircraft numbers, resulting in more aircraft flying over the vicinity of Braintree.
As expected. with the increase in traffic.
6000-7000ft
The split of deps on the CLN and DET SIDs is evident. There is evidence of aircraft continuing along the CLN SID, but also evidence of aircraft being tactically vectored eastbound over the area of Braintree towards Coggeshall.
The lateral spread of deps is similar to the 2013 CLN sample. There are very few DET SIDs due to the SID switch. Tactical vectoring continues to be evident, in a similar pattern to 2013, but with an obvious increase in aircraft numbers being vectored, resulting in more aircraft flying over the vicinity of Braintree towards Coggleshall and other areas located along the flightpaths flown before the change was implemented.
As expected with the increase in traffic.
7000ft- FL200
The split of deps on the CLN and DET SIDs is evident. There is evidence of aircraft continuing along the CLN SID, but also evidence of aircraft being tactically vectored eastbound over the area of Braintree towards Coggeshall, the Colchester area and Wivenhoe.
The lateral spread of deps is similar to the 2013 CLN sample except for the additional re-routed traffic from the Detling SID (see below). There are very few DET SIDs due to the SID switch. Tactical vectoring is also evident, in a similar pattern to 2013 for those aircraft routeing via Clacton, but with an increase in aircraft numbers, resulting in more aircraft flying over the vicinity of Braintree towards Coggleshall, areas around Colchester located along the flightpaths flown before the change was implemented. In addition, the re-routeing of aircraft that would previously have used the Detling SID now becomes apparent in this altitude band above 7000; the routeing of these departures southwards towards
There is no illustration of expected traffic patterns above 7000ft in the consultation material or proposal documentation other than Figures 4 & 11 in the Module A consultation document. Those diagrams show the anticipated traffic flow turning southbound from the CLN SIDs at a more

CAP 1692 A Annex B - Stansted SID switch - CAA track plot analysis of change and SID usage.
October 2018 Page 38
Doc ref Altitude Band
(a)
Description of traffic pattern before the change.
(b)
Description of traffic pattern after the change.
(c)
CAA Remarks
(d) the north-east coast of Kent is apparent as can be seen by the wide spread of aircraft flight paths which are now heading towards the south east, flying over a wide area that includes Witham, Maldon, Southminster and Burnham-on-Crouch. This traffic is all above 7000ft, but it is not possible to gauge from this diagram just how much above 7000ft this traffic is.
easterly point (approximately Clacton on Sea) than the traffic pattern shown in the 2016 whisker plot. In Figures 4 & 11 of the consultation document, there is no indication of traffic heading south over the locations noted in Column C. Therefore, it appears that the traffic flow shown in the 2016 whisker plot that turns southward over Witham, Maldon, Southminster, Burnham-on-Crouch etc was not anticipated in the proposal. However, we do note that this traffic pattern is above 7000ft amsl.
A05 Density Plot 0-4000ft
Slide 1. The split of deps on the CLN and DET SIDs is evident. For traffic on the CLN SID, there is evidence of aircraft continuing along the SID, but also evidence of some aircraft being tactically vectored eastbound towards Braintree, and being above 4000ft by Rayne. The majority of aircraft appear to be following the designated flight path and the CLN deps are above 4000ft by the A120. The same deps are all above 4000ft by the turn at Rivenhall.
Slide 2. The lateral spread of CLN deps is similar to the 2013 CLN sample. There are very few DET SIDs due to the SID switch (the diagram indicates these are positioning flights to London City and Biggin Hill). The majority of aircraft are above 4000ft by Stebbing, i.e. a little earlier than the 2013 traffic sample. In this altitude band, there is no evidence of aircraft being tactically vectored towards Rayne and Braintree. Density has increased on the CLN SID, reflecting the increased number of aircraft using the SID due to the SID switch.
As expected with the increase in traffic.
A06 Density Plot 4000- 7000ft
Slide 1. The split of deps on the CLN and DET SIDs is evident. There is evidence of aircraft continuing along the CLN SID, but also evidence of some aircraft being tactically vectored eastbound towards Braintree, Coggeshall and Colchester.
Slide 2. The lateral spread of CLN deps is similar to the 2013 CLN sample. There are very few DET SIDs due to the SID switch. Generally, the pattern and density of tactical vectoring appears similar to 2013. The only notable difference in traffic pattern is the increased traffic density on the CLN SID and the resulting reduction in traffic on the DET SID. The majority of aircraft on the CLN SID
As expected
CAP 1692 A Annex B - Stansted SID switch - CAA track plot analysis of change and SID usage.
October 2018 Page 39
Doc ref Altitude Band
(a)
Description of traffic pattern before the change.
(b)
Description of traffic pattern after the change.
(c)
CAA Remarks
(d) appear to reach 7000ft before the track change north of Witham,
which is a similar location to the 2013 CLN traffic. Runway Usage
Stn 2015 Deps Runway 04 Diagram – based on summer period, 24 hour
CLN DET Average daily departures 13 19 Percentage of all departures 5% 8% Daily range 0 - 62 0 - 86 Days with no departures 58% 54% Days with <10 departures 70% 65%
Stn 2016 Deps Runway 04 Diagram - based on summer period, 24 hour
CLN DET Average daily departures 20 1 Percentage of all departures 7% <1% Daily range 0 - 139 0 - 8 Days with no departures 75% 74% Days with <10 departures 79% 100%
As shown by the two tables: • There has been a
clear switch between the two SIDs as expected. Departures using CLN have increased whilst DET has reduced.
• Runway 04 usage has reduced in 2016 compared to 2015
Table 2 – Runway 22 analysis. Altitude Band
(a)
Description of traffic pattern before the change.
(b)
Description of traffic pattern after the change.
(c)
CAA Remarks
(d) Source: NATS 2013 Track Commentary 7-day period
10 Aug + 12-17 Aug CLN 330 DET 468 Tot 798 Note: Document A02 is the density plot Key diagram.
Source: Actual Track 2016 Commentary on Clacton SID track plot 7-day period 1 - 7 Aug CLN 915 DET 19 Tot 934
A07 A08
Note: Document A07 refers to all altitude bands in the 00-70-200 analysis before the change.
Note: Document A08 refers to all altitude bands in the 00-70-200 analysis after the change.
0- 1000ft
Majority of departures (deps) on both SIDs are along the runway track before turning.
No discernible difference from 2013 pattern. No change was expected
1000- 2000ft
Deps on both SIDs are along the runway track and in the turn towards the east and south.
Similar for the CLN SID. No discernible difference from 2013 pattern.
No change was expected
CAP 1692 A Annex B - Stansted SID switch - CAA track plot analysis of change and SID usage.
October 2018 Page 40
Altitude Band
(a)
Description of traffic pattern before the change.
(b)
Description of traffic pattern after the change.
(c)
CAA Remarks
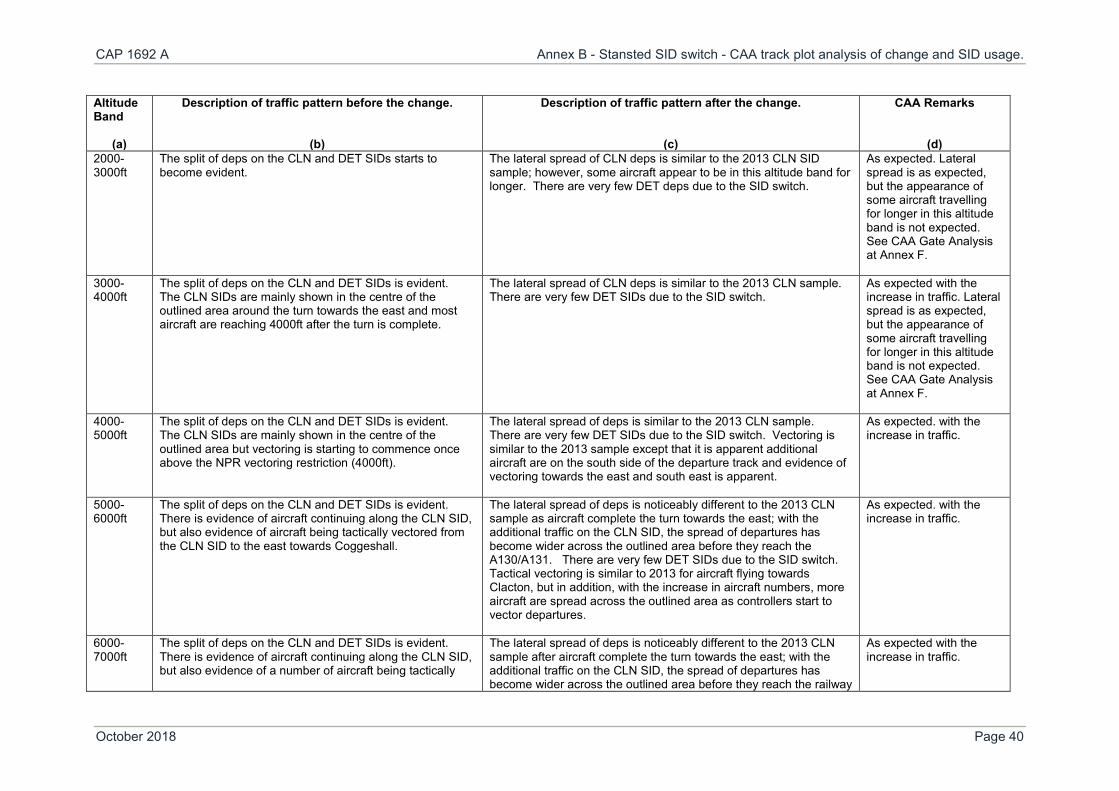
(d) 2000-3000ft
The split of deps on the CLN and DET SIDs starts to become evident.
The lateral spread of CLN deps is similar to the 2013 CLN SID sample; however, some aircraft appear to be in this altitude band for longer. There are very few DET deps due to the SID switch.
As expected. Lateral spread is as expected, but the appearance of some aircraft travelling for longer in this altitude band is not expected. See CAA Gate Analysis at Annex F.
3000-4000ft
The split of deps on the CLN and DET SIDs is evident. The CLN SIDs are mainly shown in the centre of the outlined area around the turn towards the east and most aircraft are reaching 4000ft after the turn is complete.
The lateral spread of CLN deps is similar to the 2013 CLN sample. There are very few DET SIDs due to the SID switch.
As expected with the increase in traffic. Lateral spread is as expected, but the appearance of some aircraft travelling for longer in this altitude band is not expected. See CAA Gate Analysis at Annex F.
4000- 5000ft
The split of deps on the CLN and DET SIDs is evident. The CLN SIDs are mainly shown in the centre of the outlined area but vectoring is starting to commence once above the NPR vectoring restriction (4000ft).
The lateral spread of deps is similar to the 2013 CLN sample. There are very few DET SIDs due to the SID switch. Vectoring is similar to the 2013 sample except that it is apparent additional aircraft are on the south side of the departure track and evidence of vectoring towards the east and south east is apparent.
As expected. with the increase in traffic.
5000-6000ft
The split of deps on the CLN and DET SIDs is evident. There is evidence of aircraft continuing along the CLN SID, but also evidence of aircraft being tactically vectored from the CLN SID to the east towards Coggeshall.
The lateral spread of deps is noticeably different to the 2013 CLN sample as aircraft complete the turn towards the east; with the additional traffic on the CLN SID, the spread of departures has become wider across the outlined area before they reach the A130/A131. There are very few DET SIDs due to the SID switch. Tactical vectoring is similar to 2013 for aircraft flying towards Clacton, but in addition, with the increase in aircraft numbers, more aircraft are spread across the outlined area as controllers start to vector departures.
As expected. with the increase in traffic.
6000-7000ft
The split of deps on the CLN and DET SIDs is evident. There is evidence of aircraft continuing along the CLN SID, but also evidence of a number of aircraft being tactically
The lateral spread of deps is noticeably different to the 2013 CLN sample after aircraft complete the turn towards the east; with the additional traffic on the CLN SID, the spread of departures has become wider across the outlined area before they reach the railway
As expected with the increase in traffic.

CAP 1692 A Annex B - Stansted SID switch - CAA track plot analysis of change and SID usage.
October 2018 Page 41
Altitude Band
(a)
Description of traffic pattern before the change.
(b)
Description of traffic pattern after the change.
(c)
CAA Remarks
(d) vectored eastbound over the area of Braintree towards Coggeshall.
line from Witham to Braintree. There are very few DET SIDs due to the SID switch. Tactical vectoring is similar to 2013 for aircraft flying towards Clacton, but in addition, with the increase in aircraft numbers, more aircraft continue to be spread across the outlined area as controllers’ vector departures.
7000ft- FL200
The split of deps on the CLN and DET SIDs is evident. There is evidence of aircraft continuing along the CLN SID, but also evidence of a large number of aircraft being tactically vectored eastbound over the area of Braintree towards Coggeshall, the Colchester area and Wivenhoe.
The lateral spread of deps is similar to the 2013 CLN sample except for the additional re-routed traffic from the Detling SID (see below). There are very few DET SIDs due to the SID switch. Tactical vectoring is also evident, in a similar pattern to 2013 for those aircraft routeing via Clacton, but with an increase in aircraft numbers, resulting in more aircraft flying over the vicinity of Braintree towards Coggleshall, areas around Colchester located along the flightpaths flown before the change was implemented. In addition, the re-routeing of aircraft that would previously have used the Detling SID now becomes apparent in this altitude band above 7000; the routeing of these departures southwards towards the north-east coast of Kent is apparent as can be seen by the wide spread of aircraft flight paths which are now heading towards the south east, flying over a wide area that includes Witham, Maldon, Southminster and Burnham-on-Crouch. This traffic is all above 7000ft, but it is not possible to gauge from this diagram just how much above 7000ft this traffic is.
There is no illustration of expected traffic patterns above 7000ft in the consultation material or proposal documentation other than Figures 4 & 11 in the Module A consultation document. Those diagrams show the anticipated traffic flow turning southbound from the CLN SIDs at a more easterly point (approx Clacton on Sea) than the traffic pattern shown in the 2016 whisker plot. In Figures 4 & 11 there is no indication of traffic heading south over the locations noted in Column C. Therefore, it appears that the traffic flow shown in the 2016 whisker plot that turns southward over Witham, Maldon, Southminster, Burnham-on-Crouch etc was not anticipated in the proposal. However, we do note that this traffic pattern is above 7000ft amsl.

CAP 1692 A Annex B - Stansted SID switch - CAA track plot analysis of change and SID usage.
October 2018 Page 42
Altitude Band
(a)
Description of traffic pattern before the change.
(b)
Description of traffic pattern after the change.
(c)
CAA Remarks
(d)
A05 Density Plot 0-4000ft
Slide 3. The split of deps on the CLN and DET SIDs is evident as aircraft pass Hatfield Heath and turn towards Clacton or head southbound towards Detling. Most traffic on the CLN SID appear to be above 4000ft after passing Hatfield Broad Oak. A few aircraft are still at 4000ft up to Ford End.
Slide 4. For the Clacton and Detling SIDs, the lateral spread of CLN deps is similar to the 2013 CLN sample as far as Great Hallingbury. There are very few DET SIDs due to the SID switch. As aircraft continue the turn over Hatfield Heath, this village continues to be overflown, but there is a noticeable shift in concentration in that there is a wider spread of departures over and to the north of Hatfield Heath (i.e. taking a tighter turn) taking some aircraft closer to Hatfield Broad Oak than evident in 2013. Most aircraft appear to be above 4000ft by Roundbush Green, which suggests that some aircraft are lower for longer than in 2013. A few aircraft are still at 4000ft up to Ford End. There are some positioning flights to London City, Northolt and North Weald which are evident leaving the Clacton SID after Hatfield Heath.
As expected with the increase in traffic. We believe the cause of the displacement of traffic to the north towards Hatfield Broad Oak is a result of the usage of the trial RNP1 SID which accounted for 17% of runway 22 Clacton departures. Note: The RNP 1 SIDs were subsequently permanently implemented on 17 Aug 17. See CAA Gate Analysis at Annex F.
A06 Density Plot 4000- 7000ft
Slide 3. The split of deps on the CLN and DET SIDs is evident. There is evidence of aircraft continuing along the CLN SID, but also evidence of some aircraft being tactically vectored eastbound towards Braintree, Coggeshall and Colchester.
Slide 4. The lateral spread of CLN deps is similar to the 2013 CLN sample. There are very few DET SIDs due to the SID switch. Generally, the pattern and density of tactical vectoring appears similar to 2013. The only notable difference in traffic pattern is the increased traffic on the CLN and the resulting reduction in traffic on the DET SID.
As expected.
Stn 2015 Deps Runway 22 Diagram - based on summer period, 24 hour
CLN DET Average daily departures 41 58 Percentage of all departures 16% 23%
Stn 2016 Deps Runway 22 Diagram - based on summer period, 24 hour
CLN DET Average daily departures 116 5 Percentage of all departures 43% 2%
As shown by the two tables: • There has been a
clear switch between the two SIDs as expected.

CAP 1692 A Annex B - Stansted SID switch - CAA track plot analysis of change and SID usage.
October 2018 Page 43
Altitude Band
(a)
Description of traffic pattern before the change.
(b)
Description of traffic pattern after the change.
(c)
CAA Remarks
(d) Daily range 0 - 68 0 - 88 Days with no departures 15% 10% Days with <10 departures 20% 20%
Daily range 0 - 147 0 - 15 Days with no departures 8% 9% Days with <10 departures 10% 91%
Departures using CLN have increased whilst DET has reduced.
• Runway 22 usage has increased in 2016 compared to 2015
CAP 1692 A Annex C: “LAMP PIR Bridging Module Analysis – Changes to population overflown by Modules A, B and C” (Version 2)
October 2018 Page 44
Annex C: “LAMP PIR Bridging Module Analysis – Changes to population overflown by Modules A, B and C” (Version 2)
NATS has prepared an assessment of population “overflown” in support of the PIR. This focuses on the population overflown
below 7,000ft. Commentary on the specific results for Modules A, B & C are contained within the body of each respective PIR
Report from the CAA. The commentary below is general and highlights points regarding the methodology used by the sponsor.
1. NATS has used two approaches to assess the population overflown: • The first is a simple boundary that closely encompasses the concentrated traffic pattern below 7,000ft and a count of the
population within that boundary. As a measure, this could be taken to show the population that is directly overflown on a regular basis (which NATS has defined as more than five flights per day);
• The second is a simple approximation of the methodology set out in the CAA’s document CAP14982. The precise approach that is outlined in that document as not been used; NATS has not produced “overflight” contours that would enable a better understanding of extent to which locations are overflown, nor have they used the widening swathe that represents aircraft as they climb or descend. Instead they have used a standard swathe of 1,079m for aircraft up to 4,000ft and a swathe of 1,888m for aircraft between 4,000ft and 7,000ft. Using this simplified methodology has the potential to not only over-estimate the area being “overflown” but also does not reflect the frequency of being overflown, i.e. the population count in these swathes does not differentiate between people overflown rarely and those overflown frequently.
2. This impact was not measured or portrayed by the sponsors as part of the consultation material or the formal submission of the LAMP modules; CAP1498 did not exist at the time of the original consultation and submission by the sponsor, or the decision by the CAA. These impacts are being measured and portrayed for the first time as part of the PIR. Therefore, if we use the impacts now being presented in the PIR, we need to be aware that this method for estimating and portraying “overflights” was not part of our consideration when approving the original Airspace Change Proposals.
2 CAP1498: “Definition of overflight”, April 2017

CAP 1692 A Annex D - CO2 Emissions Summary
October 2018 Page 45
Annex D - CO2 Emissions Summary Comparing forecast CO2 impact from the original Airspace Change Proposal (ACP) documents with the Post-Implementation Review (PIR) outputs
Forecast for 2016 (per original ACP) PIR Results
ACP Module Base case annual “enabled” fuel saving (tonnes)
Base case annual “actual”
fuel saving (tonnes) –
reduction of 21%
Convert to CO2 @
3.18 (tonnes)
Range for CO2 annual saving per ACP - i.e. 50% as low
case (tonnes)
NATS Report (A17035, V1.0) –
fuel saving (tonnes)
Convert to CO2 @ 3.18
(tonnes)
Module A - Stansted 4,298 3,395 10,796 5,398 - 10,796 3,557 11,311
Module B – London City Replications 03 0 0 0 0 0
Module C – London City Network
(plus Gatwick & Southend)
LCY = 4,082
Gatwick (TIMBA STARs) & Southend = 3,959
Total = 8,0412
(no separate figures for Biggin Hill)
6,352 20,199 10,099 - 20,199 LCY = -3,779
Gatwick = 178
Southend = - 81
-11,709
Module D – Luton & Northolt 1,815 1,434 4,560 2,280 - 4,560 Luton = 678
Northolt = -1
2,153
Module E – South Coast
(Farnborough, Southampton,
Bournemouth)
-265 -209 -665 -332 - -665 Farnborough = -89
Southampton = -48
Bournemouth = -8
-461
Total 13,889 10,972 34,890 17,445 – 34,890 407 1,294
3 The CO2 impacts from London City that were reported in the Bridging ACP did not distinguish between those from the Replications (Module B) or the Network (Module C) and so the entire figure
for London City was reflected in this table as being Module C.

CAP 1692 A Annex D - CO2 Emissions Summary
October 2018 Page 46
Conclusion:
The key difference in impact between the ACP and the PIR (as shown in the table above) is for Modules B & C (i.e. the changes at
London City airport). An overall fuel saving and CO2 reduction was estimated at the time of the proposal – instead the PIR shows a
significant increase in fuel and CO2, most notably for the arrivals. For the other modules (A, D & E) the changes in CO2 impacts are
broadly consistent with the estimated ranges that were considered when the CAA decision to approve was taken.
Notes:
• It should be recognised that the original estimate submitted with the ACP, as with all such CO2 estimates, has to make various assumptions when modelling the most likely changes to fuel burn and emissions. By their nature, they include a degree of uncertainty.
• The original ACP estimate (doc 44165/RPT/144, V1.2) did specifically adjust for tactical vectoring. (For example, read the statement made in the Introduction of that document about adjusting for tactical interventions in order to reflect “actual” flight trajectories. Equally the explanation of the adjustments made in Section 6 of that document to reflect “actual” fuel burn). However, what it did not do was make any assumptions about possible changes to the rate/proportion of tactical vectoring that would occur after implementation.
• The original CO2 analysis for the ACP modelled two years, 2016 and 2020. • Original ACP – the fuel burn and CO2 estimates for London City routes did reflect the sponsor’s expectations of an increase in
track mileage generally, but also balanced this against expected savings in holding time and improved vertical profiles for arriving aircraft. The result was that fuel savings and CO2 reductions were forecast for London City flights.
• The analysis excludes traffic from 4 Feb 2016 to 29 Feb 2016 because it was a period of “bedding-in” for the change. It includes traffic from 1 March 2016 to 3 Feb 2017. However, the number of movements for the full year has been used when calculating an annual total.
• The PIR assessment adjusts for fleet mix to ensure it is consistent, so that the changes in fuel burn and CO2 are not a reflection of a change in relative proportions of aircraft types.
• The anticipated number of affected arrivals in the ACP for implementation year was 116,742. In the PIR analysis the number of arrivals is actually 122,129.
• The anticipated number of affected departures in the ACP for the implementation year was 56,839. In the PIR analysis the
number of departures is actually 64,715.

CAP 1692 A Annex E - CAA complaints analysis by location.
October 2018 Page 47
Annex E - CAA complaints analysis by location.
ANNEX E - CAA ANALYSIS OF COMPLAINT DATA FROM NON-AVIATION STAKEHOLDERS Introduction. This Annex is an analysis of complaint data submitted to both co-sponsors Stansted Airport Limited (STAL) and NATS, and directly to the CAA. This report considers the location of the complaint, the altitude of aircraft as they overfly the complaint location and the impact of the change to that location. From complaints data received, we have analysed the impacts of locations where 10 or more complainants have submitted complaints. The full set of data relating to complaints to Stansted airport, is published in a STAL Noise Complaints Report 2016 (insert Link); however, it should be noted that the STAL complaints report covers complaints concerning all traffic patterns relating to Stansted airport and not solely the routes affected by the airspace change. For the purposes of this CAA analysis, the CAA has therefore examined the locations which we believe are only affected by this change where 10 or more complainants have submitted complaints. Where complaints have also been submitted to NATS and the CAA, in Table 4 below, we have specified if complaints have also been submitted from locations from where complaints have been submitted to NATS and the CAA. By restricting our analysis to locations with 10 or more complainants, we have been proportionate in our considerations, ensuring that those locations that appear to be have the greater response from communities are prioritised. Complaints raised directly to NATS and to the CAA were also reviewed and commented upon in the main body of the PIR Report (see Community Stakeholder Observations section). What we did: • We reviewed the complaints analysis undertaken by STAL. • For those locations with the most complainants – 10 or more people - (rather than the number of complaints), we compared the identified
location against the traffic patterns (as portrayed on radar track diagrams and density plots) of the Clacton SIDs before and after the change. The remaining locations represent few complainants – In this way we ensured that our analysis was proportionate but adequately considered the feedback from the vast majority of complainants.
• We excluded complaints from locations that we judged to be not affected by the SID switch (Bishops Stortford, Henham, Ware, Stansted and Birchanger) where 10 or more complainants submitted.

CAP 1692 A Annex E - CAA complaints analysis by location.
October 2018 Page 48
• We reviewed complaints submitted to NATS (NERL) by stakeholders who have written directly to NATS. Note: we are unable to publish the feedback due to data protection regulations.
• We reviewed complaints submitted to the CAA by stakeholders raising issues about the change proposal after implementation. • We described the traffic patterns in relation to those locations, with the aim of identifying if the number of complainants and the nature of
their complaints identified any effects that were not expected by the SID switch. • We noted, where relevant, it those locations were likely to be experiencing an increase or decrease in noise levels as a result of the SID
switch. In considering these complaints, it is important to bear in mind that: • They have been made against a background of increasing traffic levels at Stansted Airport; • All of the locations commented upon in this report are sited beyond Stansted’s Airport’s 57 dB LAeq noise contour and therefore
any change in noise impact would not be described as “significant” (under the auspices of the DfT Air Navigation Guidance of 2014;
• Aircraft can be tactically vectored from the SID at 4000ft and above and are therefore no longer required to adhere to the NPR beyond this altitude.
General conclusions: • Both the track diagrams and the density diagrams clearly show the switch of traffic from the Detling SIDs onto the Clacton SIDs. • The increase in traffic on the Clacton SIDs (due to the switch and a growth in overall traffic volumes) means that those locations beneath
and closest to the Clacton SIDs are likely to be experiencing an increase in noise levels. • As would have been anticipated, the largest numbers of complainants came from the most populated locations that have experienced an
increase in noise levels since the implementation of the SID switch. • Less populated locations which are similarly affected by the displaced traffic pattern also generated complaints, albeit on a much smaller
scale. • After considering the communities with the most complainants and their relative location to the traffic pattern of departing aircraft on the
Clacton SIDs, there are no unanticipated impacts revealed – other than for Hatfield Broad Oak. Any noise increase at that location, whilst being partly due to the airspace change as expected, is also likely to be in part due to the Trial RNP1 SID that was being used by a small proportion of aircraft in 2016. The nominal track of the trial SID is closer to Hatfield Broad Oak than the conventional SID, which would therefore account for a change in traffic pattern that shows the concentration of departing aircraft had moved closer to that community. (This supported by the Gate Analysis at Annex F of this report. Figures 9 and 10 of that Annex show a change in lateral spread, with a distinct “clump” that is likely to be the aircraft using the Trial RNP1 SID.) This aspect was not anticipated, but nor is it a result of the airspace change that this PIR is assessing.
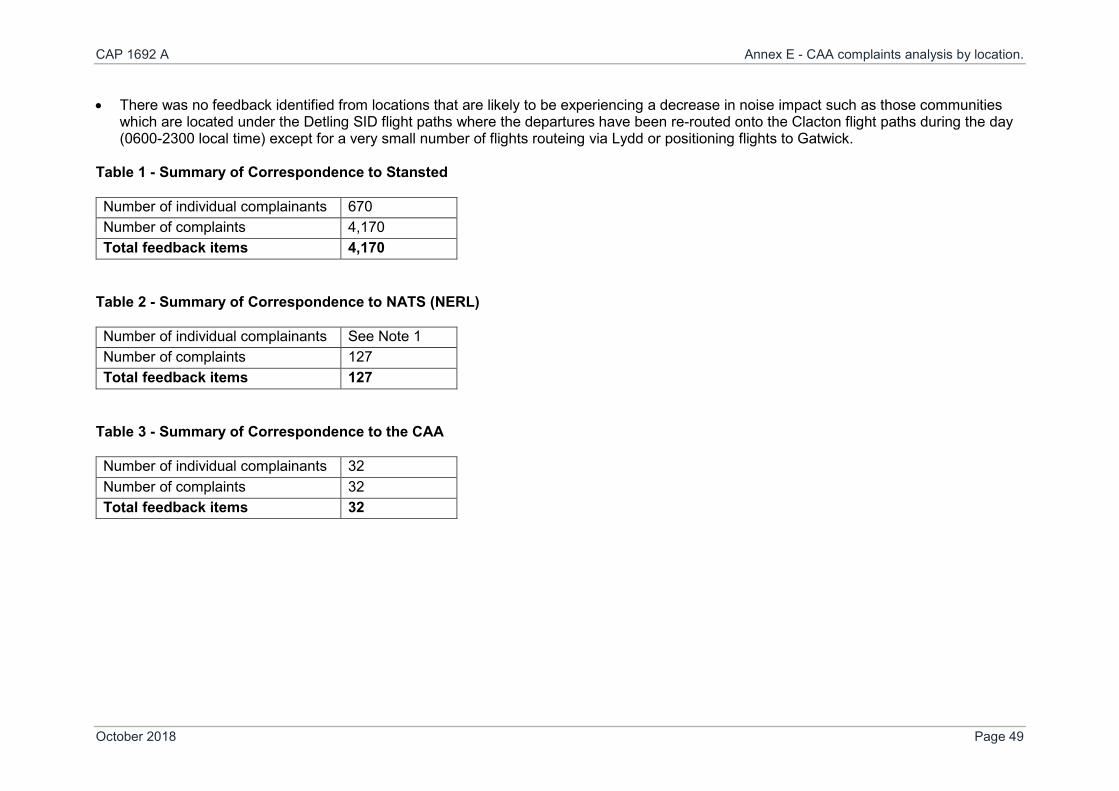
CAP 1692 A Annex E - CAA complaints analysis by location.
October 2018 Page 49
• There was no feedback identified from locations that are likely to be experiencing a decrease in noise impact such as those communities which are located under the Detling SID flight paths where the departures have been re-routed onto the Clacton flight paths during the day (0600-2300 local time) except for a very small number of flights routeing via Lydd or positioning flights to Gatwick.
Table 1 - Summary of Correspondence to Stansted Number of individual complainants 670 Number of complaints 4,170 Total feedback items 4,170
Table 2 - Summary of Correspondence to NATS (NERL) Number of individual complainants See Note 1 Number of complaints 127 Total feedback items 127
Table 3 - Summary of Correspondence to the CAA Number of individual complainants 32 Number of complaints 32 Total feedback items 32

CAP 1692 A Annex E - CAA complaints analysis by location.
October 2018 Page 50
Table 4 – Locations for complaints to Stansted Airport
Top locations by feedback numbers
Location
(a)
Rwy
(b)
Total number of individual
complainants To STAL
(c)
Total number of complaints
to STAL
(d)
Total number of complaints to
NERL (See Note 1)
(e)
Total number of complaints to the
CAA (ER and AREE)
(f)
Total number of complaints
(g)
Remarks
(h) Stebbing 04 55 237 16 3 256 High Easter 22 45 563 40 7 610 Felsted 22 41 115 5 1 121 Hatfield Broad Oak 22 40 287 1 0 288 Dunmow 04 29 237 2 1 240 Hatfield Heath 22 24 1281 9 4 1294 Braintree 04 20 31 2 1 34 Great Notley 04 19 48 4 2 54 Rayne 04 10 12 5 1 18
NOTE
1. It has not been possible to determine the total number of individual complainants responsible for generating these enquiries/complaints because the raw data was anonymised by NATS.

CAP 1692 A Annex E - CAA complaints analysis by location.
October 2018 Page 51
Table 5 – CAA Commentary and Comparison of Correspondents’ Location to Aircraft Traffic Patterns
Location (and number of complainants)
Typical altitude (amsl) of aircraft based on a review of radar track diagrams
Height above airfield elevation referring to a CAA gate analysis where relevant)
Location in respect to the SID.
Description of traffic pattern before the change.
Description of traffic pattern after the change and the associated impact.
Stebbing 55 complainants 237 complaints
2013 All aircraft are above 3000ft when passing Stebbing. Aircraft are typically in the range from 3000ft – 5000ft, although some are 6000ft or above. However, see Column (e) 2016 All aircraft are above 3000ft when passing Stebbing. Aircraft are typically in the range from 3000ft – 5000ft, although some are 6000ft or above.
From the CAA gate analysis it was determined that aircraft were passing Stebbing at an average height of 4550ft before the change (2013) and 4350ft after the change (2016).
Stebbing is located approximately 1000m to the north of the runway 04 SID nominal track centreline and approximately 10km along the flight path after take off.
TRACK DENSITY DIAGRAM The track density diagrams are the most suitable set of diagrams to show the impact on Stebbing. 2013 diagrams. From the 00-40 track density plots, the main core of runway 04 Clacton departures routes is overhead Stebbing (and Stebbing Green), therefore we would regard Stebbing as being directly overflown. The majority of aircraft have reached 4000ft by Stebbing.
2016 diagrams. From the 00-40 track density plots, the main concentration of runway 04 Clacton departures routes remains overhead Stebbing (and Stebbing Green), therefore we would regard Stebbing as still being directly overflown. The majority of aircraft have reached 4000ft by Stebbing. The purple shading indicates that there are more aircraft concentrated along the route than before the change. Fewer aircraft appear to be in the lower altitude band by Stebbing Green.

CAP 1692 A Annex E - CAA complaints analysis by location.
October 2018 Page 52
Location (and number of complainants)
Typical altitude (amsl) of aircraft based on a review of radar track diagrams
Height above airfield elevation referring to a CAA gate analysis where relevant)
Location in respect to the SID.
Description of traffic pattern before the change.
Description of traffic pattern after the change and the associated impact.
From the 40-70 track density plots, aircraft continue to overfly Stebbing with the majority remaining along the nominal track of the SID or when 4000ft or above, some tactical vectoring towards Braintree is evident.
The increased number of aircraft flying overhead Stebbing is likely to result in an increase in the noise impact for that location. From the 40-70 track density plots, aircraft continue to overfly Stebbing with the majority remaining along the nominal track of the SID, or when 4000ft or above, some tactical vectoring towards Braintree is evident. The area of overflight is similar to the 2013 traffic pattern, however the increase in flights is evident in the colour of the concentration density shading. We therefore conclude that the impact of the change is such that the same area is being overflown, however, the location of Stebbing is experiencing an increase in the number of aircraft flying overhead and therefore is likely to be experiencing an increase in noise impact. This was

CAP 1692 A Annex E - CAA complaints analysis by location.
October 2018 Page 53
Location (and number of complainants)
Typical altitude (amsl) of aircraft based on a review of radar track diagrams
Height above airfield elevation referring to a CAA gate analysis where relevant)
Location in respect to the SID.
Description of traffic pattern before the change.
Description of traffic pattern after the change and the associated impact.
anticipated as a result of the airspace change.
High Easter 45 complainants 563 complaints
2013 All aircraft are above 4000ft when passing High Easter (the 2nd W in Sawbridgeworth). Aircraft are typically in the range from 4000ft – 7000ft, although some are 7000ft or above. However, see Column (d) 2016 Most aircraft are above 4000ft when passing High Easter. Aircraft are typically in the range from 4000ft – 7000ft, although some are 7000ft or above.
From the CAA gate analysis, it was determined that before the change, (the 2013 traffic sample) aircraft were at an average height of 6100ft when passing High Easter before the change and an average height of 5700ft after the change.
High Easter is located approximately 1000m to the south of the runway 22 Clacton SID nominal track centreline and approximately 17km along the flight path after take off.
TRACK DENSITY DIAGRAM The track density diagrams are the most suitable set of diagrams to show the impact on High Easter. 2013 diagrams. From the 00-40 track density plots, the main core of runway 22 Clacton departures routes is overhead Hatfield Heath and most aircraft have left this altitude band by the time they pass north of White Roding. Therefore, by High Easter, the majority of aircraft are above 4000ft From the 40-70 track density plots, aircraft are passing High Easter in
2016 diagrams. From the 00-40 track density plots, the majority of runway 22 Clacton departures have reached 4000ft by the B184 Roman Road as they head towards High Easter. From the 40-70 track density plots, aircraft appear to be in this altitude band for longer (to the E in Essex). The area of overflight is similar to the 2013 traffic pattern, however the increase in flights is evident in the colour of the concentration density shading.

CAP 1692 A Annex E - CAA complaints analysis by location.
October 2018 Page 54
Location (and number of complainants)
Typical altitude (amsl) of aircraft based on a review of radar track diagrams
Height above airfield elevation referring to a CAA gate analysis where relevant)
Location in respect to the SID.
Description of traffic pattern before the change.
Description of traffic pattern after the change and the associated impact.
the higher end of this altitude band. The traffic pattern indicates that the majority of aircraft remain on the nominal track of the SID but with evidence that some aircraft are tactically vectored towards the Clacton area.
We therefore conclude that the impact of the change is such that the same area is being overflown, however, the location of High Easter is experiencing an increase in the number of aircraft flying overhead and therefore is likely to be experiencing an increase in noise impact. This was anticipated as a result of the airspace change.
Felsted 41 complainants 115 complaints
2013 All aircraft are above 4000ft when passing Felsted. Aircraft are typically in the range from 4000ft – 7000ft, although some are 7000ft or above. However, see Column (d) 2016 All aircraft are above 4000ft when passing Felsted. Aircraft are typically in the range from 4000ft –
A gate was not placed in the location of Felsted for the gate analysis. However, its location is between the Stebbing gate and the Great Notley gate.
The centre of Felsted is located approximately 2500m to the south of the runway 04 SID nominal track centreline and approximately 15km along the flight path after take off.
TRACK DENSITY DIAGRAM The track density diagrams are the most suitable set of diagrams to show the impact on Felsted. 2013 diagram. From the 00-40 track density plots, the vast majority of runway 04 Clacton departures pass to the north of Felsted; we would therefore regard Felsted as not
2016 diagram. From the 00-40 track density plots, the main core of runway 04 Clacton departures routes pass to the north of Felsted. Except for the very few aircraft which are most likely on the Detling SID (Departures to Lydd or positioning flights to Gatwick) As with the 2013

CAP 1692 A Annex E - CAA complaints analysis by location.
October 2018 Page 55
Location (and number of complainants)
Typical altitude (amsl) of aircraft based on a review of radar track diagrams
Height above airfield elevation referring to a CAA gate analysis where relevant)
Location in respect to the SID.
Description of traffic pattern before the change.
Description of traffic pattern after the change and the associated impact.
7000ft, although some are 7000ft or above.
being regularly directly overflown though it is likely that some residents of Felsted may have felt as though they are overflown by these departing aircraft as noise will still be audible. The majority of aircraft have reached 4000ft by Felsted but a few aircraft are still in the 0-4000ft band when they pass north of Felsted. From the 40-70 track density plots, aircraft continue to pass north of Felsted. The traffic pattern indicates that the majority of aircraft remain on the nominal track of the SID but with evidence that some aircraft are tactically vectored towards the Braintree area.
sample, Felsted is not being regularly directly overflown. The majority of aircraft have reached 4000ft by Felsted. The purple shading indicates that there are more aircraft concentrated along the route than before the airspace change, as was expected. Fewer aircraft appear to be in the lower altitude band by Stebbing Green. From the 40-70 track density plots, aircraft continue to fly to the north of Felsted with the majority remaining along the nominal track of the SID and some aircraft being tactically vectored towards Braintree is evident. The area of overflight is similar to the 2013 traffic pattern, however the increase in flights is evident in the colour of the concentration density shading. We therefore conclude that the impact of the change is such that the same area is being

CAP 1692 A Annex E - CAA complaints analysis by location.
October 2018 Page 56
Location (and number of complainants)
Typical altitude (amsl) of aircraft based on a review of radar track diagrams
Height above airfield elevation referring to a CAA gate analysis where relevant)
Location in respect to the SID.
Description of traffic pattern before the change.
Description of traffic pattern after the change and the associated impact.
overflown, however, the area of Felsted has seen the increase in flights which was predicted prior to the change. We therefore conclude that the impact of the change is such that the same area is being overflown, and that Felsted continues to be infrequently directly overflown. However, residents of Felsted are likely to be experiencing an increase in the number of aircraft flying overhead and therefore are likely to be experiencing an increase in noise impact. This was anticipated as a result of the airspace change.
Hatfield Broad Oak 40 complainants 287 complaints
2013 All aircraft are above 2000ft when passing Hatfield Broad Oak. Aircraft are typically in the range from 2000ft – 6000ft). 2016
From the CAA gate analysis, it was determined that before the change, (the 2013 traffic sample) aircraft were on average passing 3400ft by Hatfield Heath before the
Hatfield Broad Oak is located on the northern edge of the Runway 22 Clacton NPR swathe on the inside of the turn approximately 1000m from
TRACK DENSITY DIAGRAM The track density diagrams are the most suitable set of diagrams to show the impact on Hatfield Broad Oak. 2013 diagram.
2016 diagram. From the 00-40 track density plots, the majority of runway 22 Clacton departures have
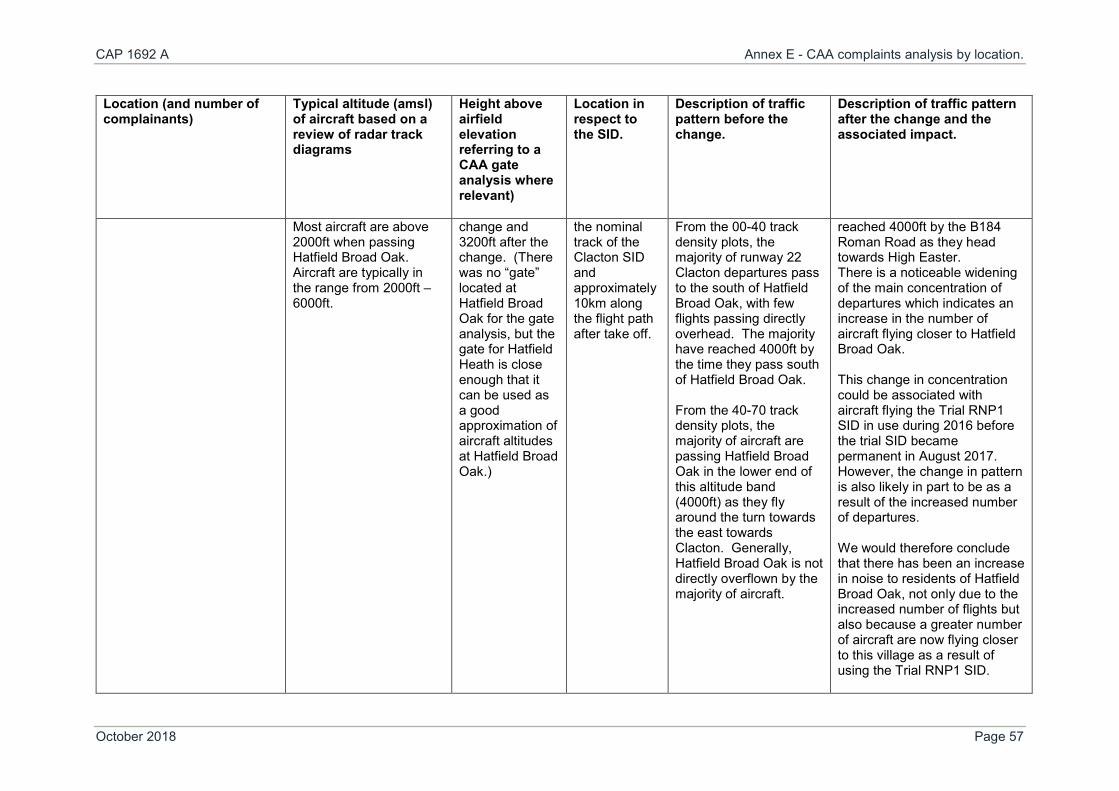
CAP 1692 A Annex E - CAA complaints analysis by location.
October 2018 Page 57
Location (and number of complainants)
Typical altitude (amsl) of aircraft based on a review of radar track diagrams
Height above airfield elevation referring to a CAA gate analysis where relevant)
Location in respect to the SID.
Description of traffic pattern before the change.
Description of traffic pattern after the change and the associated impact.
Most aircraft are above 2000ft when passing Hatfield Broad Oak. Aircraft are typically in the range from 2000ft – 6000ft.
change and 3200ft after the change. (There was no “gate” located at Hatfield Broad Oak for the gate analysis, but the gate for Hatfield Heath is close enough that it can be used as a good approximation of aircraft altitudes at Hatfield Broad Oak.)
the nominal track of the Clacton SID and approximately 10km along the flight path after take off.
From the 00-40 track density plots, the majority of runway 22 Clacton departures pass to the south of Hatfield Broad Oak, with few flights passing directly overhead. The majority have reached 4000ft by the time they pass south of Hatfield Broad Oak. From the 40-70 track density plots, the majority of aircraft are passing Hatfield Broad Oak in the lower end of this altitude band (4000ft) as they fly around the turn towards the east towards Clacton. Generally, Hatfield Broad Oak is not directly overflown by the majority of aircraft.
reached 4000ft by the B184 Roman Road as they head towards High Easter. There is a noticeable widening of the main concentration of departures which indicates an increase in the number of aircraft flying closer to Hatfield Broad Oak. This change in concentration could be associated with aircraft flying the Trial RNP1 SID in use during 2016 before the trial SID became permanent in August 2017. However, the change in pattern is also likely in part to be as a result of the increased number of departures. We would therefore conclude that there has been an increase in noise to residents of Hatfield Broad Oak, not only due to the increased number of flights but also because a greater number of aircraft are now flying closer to this village as a result of using the Trial RNP1 SID.

CAP 1692 A Annex E - CAA complaints analysis by location.
October 2018 Page 58
Location (and number of complainants)
Typical altitude (amsl) of aircraft based on a review of radar track diagrams
Height above airfield elevation referring to a CAA gate analysis where relevant)
Location in respect to the SID.
Description of traffic pattern before the change.
Description of traffic pattern after the change and the associated impact.
From the 40-70 track density plots, aircraft are passing Hatfield Broad Oak in the lower end of this altitude band (4000ft) as they fly around the turn towards the east towards Clacton. There has been a widening of the concentration of departures towards Hatfield Broad Oak and the increase in flights is evident in the colour of the concentration density shading. We therefore conclude that there has been an increase in the number of aircraft flying closer to Hatfield Broad Oak. Whilst an increase in flights was forecast, the change in traffic pattern (i.e. increase in aircraft closer to Hatfield Broad Oak) was not forecast. This change in traffic pattern is likely to be in part due to some aircraft flying the trial RNP1 SID which is aligned slightly closer to Hatfield Broad Oak than the conventional SID.

CAP 1692 A Annex E - CAA complaints analysis by location.
October 2018 Page 59
Location (and number of complainants)
Typical altitude (amsl) of aircraft based on a review of radar track diagrams
Height above airfield elevation referring to a CAA gate analysis where relevant)
Location in respect to the SID.
Description of traffic pattern before the change.
Description of traffic pattern after the change and the associated impact.
The result is that residents of Hatfield Broad Oak are likely to be experiencing an increase in noise impact partly due to the SID switch, partly due to the growth in traffic numbers, and as partly as a result of the RNP1 SID being trialled. The first of these two elements were expected when the CAA made its decision on the airspace change proposal, the third one was not.
Dunmow 29 complainants 237 complaints
2013 All aircraft are above 3000ft when passing Great Dunmow. Aircraft are typically in the range from 3000ft – 6000ft. However, see Column (e) 2016 All aircraft are above 3000ft when passing Great Dunmow.
There was no gate located at Dunmow for the gate analysis.
Great Dunmow is located approximately 3000m to the south of the runway 04 SID nominal track (centreline).
TRACK DENSITY DIAGRAM The track density diagrams are the most suitable set of diagrams to show the impact on Dunmow. 2013 diagram. From the 00-40 track density plots, the majority of runway 04 Clacton departures routes fly along the nominal track of the SID,
2016 diagram. From the 00-40 track density plots, the majority of runway 04 Clacton departures fly to the north of Dunmow, similar to the 2013 traffic pattern. The purple shading indicates that there are more aircraft concentrated along the route

CAP 1692 A Annex E - CAA complaints analysis by location.
October 2018 Page 60
Location (and number of complainants)
Typical altitude (amsl) of aircraft based on a review of radar track diagrams
Height above airfield elevation referring to a CAA gate analysis where relevant)
Location in respect to the SID.
Description of traffic pattern before the change.
Description of traffic pattern after the change and the associated impact.
Aircraft are typically in the range from 3000ft – 6000ft,
to the north of Dunmow; the location is not directly overflown by most of these departures though there is evidence of a few flights directly overhead Dunmow. From the 40-70 track density plots, the majority of aircraft continue to fly to the north of Dunmow, remaining on the nominal track of the SID. There is evidence of some aircraft being tactically vectored and some of these flights do directly overfly Dunmow.
than before the airspace change. Fewer aircraft appear to be in the lower altitude band by Stebbing Green. From the 40-70 track density plots, the majority of aircraft continue to fly north of Dunmow, remaining along the nominal track of the SID. There is evidence of some aircraft being tactically vectored towards Braintree. The area of overflight is similar to the 2013 traffic pattern, however the increase in flights is evident in the colour of the concentration density shading. We therefore conclude that the impact of the change is such that the same area is being overflown, however, the area of Dunmow, whilst generally not directly overflown is likely to be experiencing an increase in noise impact due to the increase in traffic on the Clacton SID which was expected prior to the change.

CAP 1692 A Annex E - CAA complaints analysis by location.
October 2018 Page 61
Location (and number of complainants)
Typical altitude (amsl) of aircraft based on a review of radar track diagrams
Height above airfield elevation referring to a CAA gate analysis where relevant)
Location in respect to the SID.
Description of traffic pattern before the change.
Description of traffic pattern after the change and the associated impact.
Hatfield Heath 24 complainants 1281 complaints
2013 All aircraft are above 2000ft when passing Hatfield Heath. Aircraft are typically in the range from 2000ft – 6000ft). 2016 Most aircraft are above 2000ft when passing Hatfield Heath. Aircraft are typically in the range from 2000ft – 6000ft.
From the CAA gate analysis, it was determined that before the change, (the 2013 traffic sample) aircraft were on average passing 3400ft by Hatfield Heath before the change and 3200ft after the change.
Hatfield Heath is located just to the south of the nominal track of the Runway 22 Clacton and is more or less spread across the southern side of the Runway 22 Clacton NPR swathe approximately 8km along the flight path after take off.
TRACK DENSITY DIAGRAM The track density diagrams are the most suitable set of diagrams to show the impact on Hatfield Heath 2013 diagram. From the 00-40 track density plots, the majority of runway 22 Clacton departures fly overhead Hatfield Heath and most aircraft do not reach 4000ft until they pass Hatfield Heath. From the 40-70 track density plots, the majority of aircraft are flying over Hatfield Heath in the lower end of this altitude band (4000ft) as they fly around the turn towards the east towards Clacton. There is
2016 diagram. From the 00-40 track density plots, the main core of runway 22 Clacton departures have reached 4000ft by the B184 Roman Road as they head towards High Easter, i.e. after Hatfield Heath. There is a noticeable widening of the main concentration of departures towards Hatfield Broad Oak. The text above for Hatfield Broad Oak explains the possible reason for this widening of the traffic pattern. In terms of the impact on Hatfield Heath, the density of traffic overhead that location is similar to that portrayed in the 2013 traffic pattern

CAP 1692 A Annex E - CAA complaints analysis by location.
October 2018 Page 62
Location (and number of complainants)
Typical altitude (amsl) of aircraft based on a review of radar track diagrams
Height above airfield elevation referring to a CAA gate analysis where relevant)
Location in respect to the SID.
Description of traffic pattern before the change.
Description of traffic pattern after the change and the associated impact.
evidence of some tactical vectoring of aircraft towards Braintree.
From the 40-70 track density plots, aircraft are passing Hatfield Heath in the lower end of this altitude band (4000ft) as they fly around the turn towards the east towards Clacton. There has been a widening in the concentration of departures towards Hatfield Broad Oak and the increase in flights over Hatfield Heath is evident in the colour of the concentration density shading at that location. The increase in traffic over Hatfield Heath as a result of the airspace change is likely to result in an increase in noise impact for that location. This was an anticipated impact of the airspace change.
Braintree 20 complainants 31 complaints
2013 All aircraft are above 5000ft when passing Braintree. Aircraft are typically in the range from 6000ft – 7000ft and above.
Braintree is close to the gate that was located for Great Notley. From the CAA gate analysis it was determined
Braintree is located approx. 3000m to the north of the runway 04 CLN SID nominal track.
TRACK DENSITY DIAGRAM The track density diagrams are the most suitable set of diagrams to show the impact on Braintree.

CAP 1692 A Annex E - CAA complaints analysis by location.
October 2018 Page 63
Location (and number of complainants)
Typical altitude (amsl) of aircraft based on a review of radar track diagrams
Height above airfield elevation referring to a CAA gate analysis where relevant)
Location in respect to the SID.
Description of traffic pattern before the change.
Description of traffic pattern after the change and the associated impact.
Braintree is primarily overflown by aircraft tactically vectored from the 04 CLN SID, but is also overflown (at 7000ft and above) by some aircraft that have been tactically vectored from the 22 CLN SID. 2016 All aircraft are above 5000ft when passing Braintree. Aircraft are typically in the range from 6000ft – 7000ft and above. Braintree is primarily overflown by aircraft tactically vectored from the 04 CLN SID, but is also overflown (at 7000ft and above) by some aircraft that have been tactically vectored from the 22 CLN SID.
that before the change, (the 2013 traffic sample) aircraft were on average passing 6100ft by Great Notley before the change and 6100ft after the change. .
2013 diagram. From the 00-40 track density plots, there are no aircraft overflying Braintree. From the 40-70 track density plots, it is evident that some aircraft that have been tactically vectored from the SID fly over Braintree. However the majority of aircraft remain on the SID and pass south of Braintree.
2016 diagram. From the 00-40 track density plots, there are no aircraft overflying Braintree. From the 40-70 track density plots, it is evident that some aircraft that have been tactically vectored from the SID fly over Braintree. However the majority of aircraft remain on the SID and pass south of Braintree. The traffic pattern over Braintree is similar to 2013, with a few aircraft overflying the town. However, whilst the proportion of vectored aircraft appears unchanged, it is possible that the number of aircraft that overfly Braintree has increased as a result of both the SID Switch and the general increase in traffic volume. This may result in an increase in noise impact for Braintree though this impact is as expected.

CAP 1692 A Annex E - CAA complaints analysis by location.
October 2018 Page 64
Location (and number of complainants)
Typical altitude (amsl) of aircraft based on a review of radar track diagrams
Height above airfield elevation referring to a CAA gate analysis where relevant)
Location in respect to the SID.
Description of traffic pattern before the change.
Description of traffic pattern after the change and the associated impact.
Great Notley 19 complainants 48 complaints
2013 A few aircraft are below 4000ft as they fly over Great Notley, but the vast majority are above 4000ft. Aircraft are typically in the range from 4000ft – 7000ft and above. Great Notley is primarily overflown by aircraft tactically vectored from the 04 CLN SID, but is also overflown (at 7000ft and above) by some aircraft that have been tactically vectored from the 22 CLN SID. 2016 A few aircraft are below 4000ft as they fly over Great Notley, but the vast majority are above 4000ft. Aircraft are typically in the range from
From the CAA gate analysis, it was determined that before the change, (the 2013 traffic sample) aircraft were on average passing 6100ft by Great Notley before the change and 6100ft after the change.
Great Notley is located immediately to the north of the Runway 04 CLN SID nominal track.
TRACK DENSITY DIAGRAM The track density diagrams are the most suitable set of diagrams to show the impact on Great Notley. 2013 diagram. From the 00-40 track density plots, there are very few aircraft overflying Great Notley. From the 40-70 track density plots, it is evident that the majority of aircraft remain on the SID and therefore fly over Great Notley, but at the upper range of this altitude band (i.e. towards 7000ft).
2016 diagram. From the 00-40 track density plots, there are very few aircraft overflying Great Notley. From the 40-70 track density plots, it is evident that the majority of aircraft remain on the SID and therefore fly over Great Notley, but at the upper range of this altitude band (i.e. towards 7000ft). Whilst the traffic pattern is similar to 2013, the increase in flights over Great Notley is evident in the colour of the concentration density shading at that location.
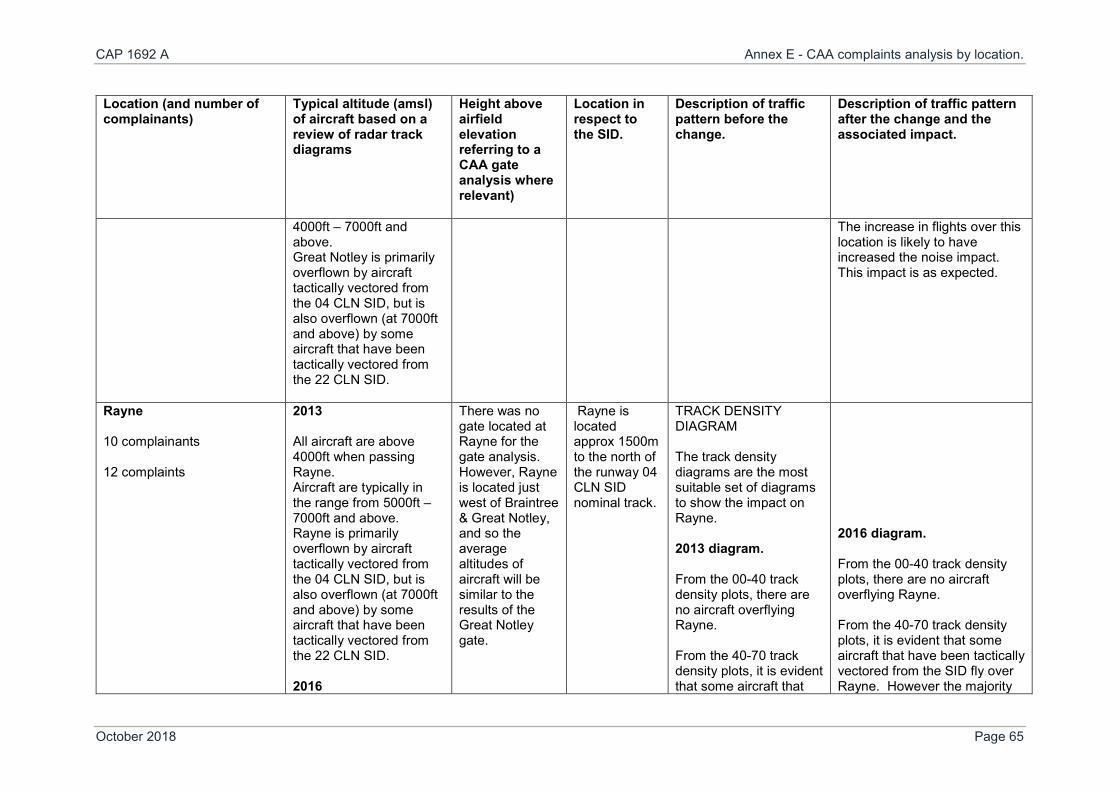
CAP 1692 A Annex E - CAA complaints analysis by location.
October 2018 Page 65
Location (and number of complainants)
Typical altitude (amsl) of aircraft based on a review of radar track diagrams
Height above airfield elevation referring to a CAA gate analysis where relevant)
Location in respect to the SID.
Description of traffic pattern before the change.
Description of traffic pattern after the change and the associated impact.
4000ft – 7000ft and above. Great Notley is primarily overflown by aircraft tactically vectored from the 04 CLN SID, but is also overflown (at 7000ft and above) by some aircraft that have been tactically vectored from the 22 CLN SID.
The increase in flights over this location is likely to have increased the noise impact. This impact is as expected.
Rayne 10 complainants 12 complaints
2013 All aircraft are above 4000ft when passing Rayne. Aircraft are typically in the range from 5000ft – 7000ft and above. Rayne is primarily overflown by aircraft tactically vectored from the 04 CLN SID, but is also overflown (at 7000ft and above) by some aircraft that have been tactically vectored from the 22 CLN SID. 2016
There was no gate located at Rayne for the gate analysis. However, Rayne is located just west of Braintree & Great Notley, and so the average altitudes of aircraft will be similar to the results of the Great Notley gate.
Rayne is located approx 1500m to the north of the runway 04 CLN SID nominal track.
TRACK DENSITY DIAGRAM The track density diagrams are the most suitable set of diagrams to show the impact on Rayne. 2013 diagram. From the 00-40 track density plots, there are no aircraft overflying Rayne. From the 40-70 track density plots, it is evident that some aircraft that
2016 diagram. From the 00-40 track density plots, there are no aircraft overflying Rayne. From the 40-70 track density plots, it is evident that some aircraft that have been tactically vectored from the SID fly over Rayne. However the majority

CAP 1692 A Annex E - CAA complaints analysis by location.
October 2018 Page 66
Location (and number of complainants)
Typical altitude (amsl) of aircraft based on a review of radar track diagrams
Height above airfield elevation referring to a CAA gate analysis where relevant)
Location in respect to the SID.
Description of traffic pattern before the change.
Description of traffic pattern after the change and the associated impact.
All aircraft are above 4000ft when passing Rayne. Aircraft are typically in the range from 6000ft – 7000ft and above. Rayne is primarily overflown by aircraft tactically vectored from the 04 CLN SID, but is also overflown (at 7000ft and above) by some aircraft that have been tactically vectored from the 22 CLN SID.
have been tactically vectored from the SID fly over Rayne. However, the majority of aircraft remain on the SID and pass just south of Rayne.
of aircraft remain on the SID and pass just south of Rayne. The traffic pattern over Rayne is similar to 2013, with a few aircraft overflying the town. However, whilst the proportion of vectored aircraft appears unchanged, it is possible that the number of aircraft that overfly Rayne has increased as a result of both the SID Switch and the general increase in traffic volume. This may result in an increase in noise impact for Rayne though this impact is as expected.

CAP 1692 A Annex F - CAA Gate Analysis.
October 2018 Page 67
Annex F - CAA Gate Analysis.
Annex F - Gate Analysis – LAMP PIR, Module A (Stansted SID Switch)
Why we investigated?
Our review of the track plots provided by the sponsor revealed that there were instances where the radar tracks showed that a few aircraft appeared to be flying for longer at certain altitude bands, with the implication being that this might reflect a more a general change in vertical profiles and aircraft heights, i.e. that they were typically flying lower than before the airspace change was implemented. As there had been no expectation for a change in aircraft altitudes (other than an improvement) as a result of the airspace change, we investigated further and asked the CAA’s Environmental Research & Consultancy Department (ERCD) to undertake further analysis.
What we did?
Choosing a range of locations that sit along the SIDs for both Runway 04 and Runaway 22, ERCD undertook a “gate analysis” to determine if the average altitude of aircraft at those locations had changed between 2013 (the pre-implementation sample) and 2016 (the post-implementation sample).
The analysis places a virtual “gate” across a location, and records the height and lateral position of each aircraft that passes through the “gate”.
The positions of the gates are shown in Figures 1 and 2 below, and the results of each gate are shown in Figures 3-14.

CAP 1692 A Annex F - CAA Gate Analysis.
October 2018 Page 68
Figure 1 - Locations of 04CLN gates (10km, 17km and 24km from start of roll)
Figure 2 - Locations of 22CLN gates (10km, 20km and 30km from start of roll)

CAP 1692 A Annex F - CAA Gate Analysis.
October 2018 Page 69
Figure 3 - Heights of 04CLN departures through Great Easton gate, 1-7 June 2013
Figure 4 - Heights of 04CLN departures through Great Easton gate, 1-6 June and 8 June 2016

CAP 1692 A Annex F - CAA Gate Analysis.
October 2018 Page 70
Figure 5 - Heights of 04CLN departures through Stebbing gate, 1-7 June 2013
Figure 6 - Heights of 04CLN departures through Stebbing gate, 1-6 June and 8 June 2016

CAP 1692 A Annex F - CAA Gate Analysis.
October 2018 Page 71
Figure 7 - Heights of 04CLN departures through Great Notley gate, 1-7 June 2013
Figure 8 - Heights of 04CLN departures through Great Notley gate, 1-6 June and 8 June 2016

CAP 1692 A Annex F - CAA Gate Analysis.
October 2018 Page 72
Figure 9 - Heights of 22CLN departures through Hatfield Heath gate, 10 August and 12-17 August 2013
Figure 10 - Heights of 22CLN departures through Hatfield Heath gate, 1-7 August 2016

CAP 1692 A Annex F - CAA Gate Analysis.
October 2018 Page 73
Figure 11 - Heights of 22CLN departures through High Easter gate, 10 August and 12-17 August 2013
Figure 12 - Heights of 22CLN departures through High Easter gate, 1-7 August 2016

CAP 1692 A Annex F - CAA Gate Analysis.
October 2018 Page 74
Figure 13 - Heights of 22CLN departures through Great Leighs gate, 10 August and 12-17 August 2013
Figure 14 - Heights of 22CLN departures through Great Leighs gate, 1-7 August 2016

CAP 1692 A Annex F - CAA Gate Analysis.
October 2018 Page 75
Results
From analysing the heights of aircraft at these gates, the average heights were calculated. These are set out in Tables 1 and 2 below.
Table 1 - All Stansted departures
Mean Height, ft
Gate 2013 sample 2016 sample Diff.
04CLN Great Easton 3,250 3,100 -150
04CLN Stebbing 4,550 4,350 -200
04CLN Great Notley 6,100 6,100 0
22CLN Hatfield Heath 3,400 3,200 -200
22CLN High Easter 6,100 5,700 -400
22CLN Great Leighs 9,150 8,650 -500
Ryanair accounted for just over 70% of all traffic on the Clacton SID in each of the study periods. We also calculated the average heights for Ryanair departures only (which generally show the same trends as above):
Table 2 - Ryanair B737-800 departures only
Mean Height, ft
Gate 2013 sample 2016 sample Diff.
04CLN Great Easton 3,250 3,000 -250
04CLN Stebbing 4,500 4,300 -200
04CLN Great Notley 6,100 6,000 -100
22CLN Hatfield Heath 3,400 3,200 -200
22CLN High Easter 6,000 5,700 -300
22CLN Great Leighs 9,050 8,700 -350
These results show that at five of the six locations, there was a reduction in the average height of aircraft between 2013 and 2016. But is it still not evident from those results that the reduction occurred after the implementation of the airspace change.
In order to test that possibility, ERCD looked more closely at one of the locations as an example (High Easter) to see if the reduction in average height occurred before the airspace change or afterwards, Figures 15 and 16 set out the results for Ryanair flights (the predominant operator at Stansted). The Figures illustrate that the average height of flights reduced in 2015, which is before the airspace change was implemented. This would suggest that any reduction in average height is not as a result of the airspace change itself but as a result of other factors, unrelated to the airspace change.
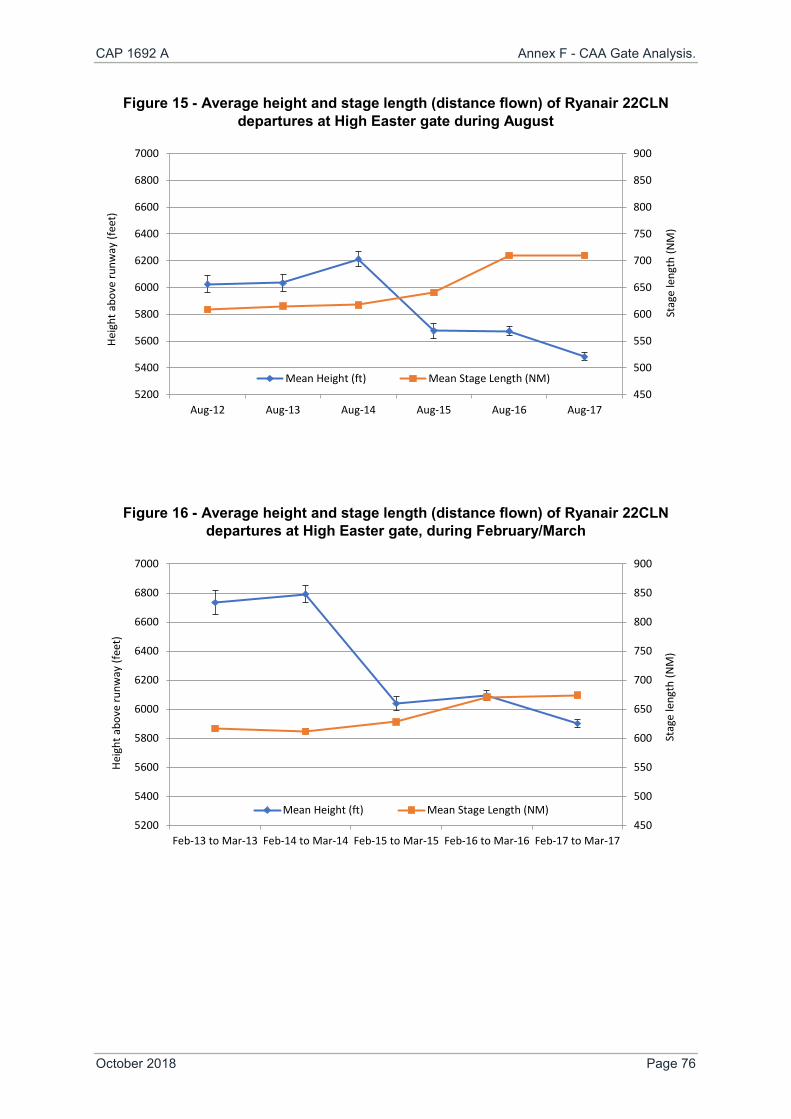
CAP 1692 A Annex F - CAA Gate Analysis.
October 2018 Page 76
Figure 15 - Average height and stage length (distance flown) of Ryanair 22CLN departures at High Easter gate during August
Figure 16 - Average height and stage length (distance flown) of Ryanair 22CLN departures at High Easter gate, during February/March
450
500
550
600
650
700
750
800
850
900
5200
5400
5600
5800
6000
6200
6400
6600
6800
7000
Aug-12 Aug-13 Aug-14 Aug-15 Aug-16 Aug-17
Stag
e le
ngth
(NM
)
Heig
ht a
bove
runw
ay (f
eet)
Mean Height (ft) Mean Stage Length (NM)
450
500
550
600
650
700
750
800
850
900
5200
5400
5600
5800
6000
6200
6400
6600
6800
7000
Feb-13 to Mar-13 Feb-14 to Mar-14 Feb-15 to Mar-15 Feb-16 to Mar-16 Feb-17 to Mar-17
Stag
e le
ngth
(NM
)
Heig
ht a
bove
runw
ay (f
eet)
Mean Height (ft) Mean Stage Length (NM)
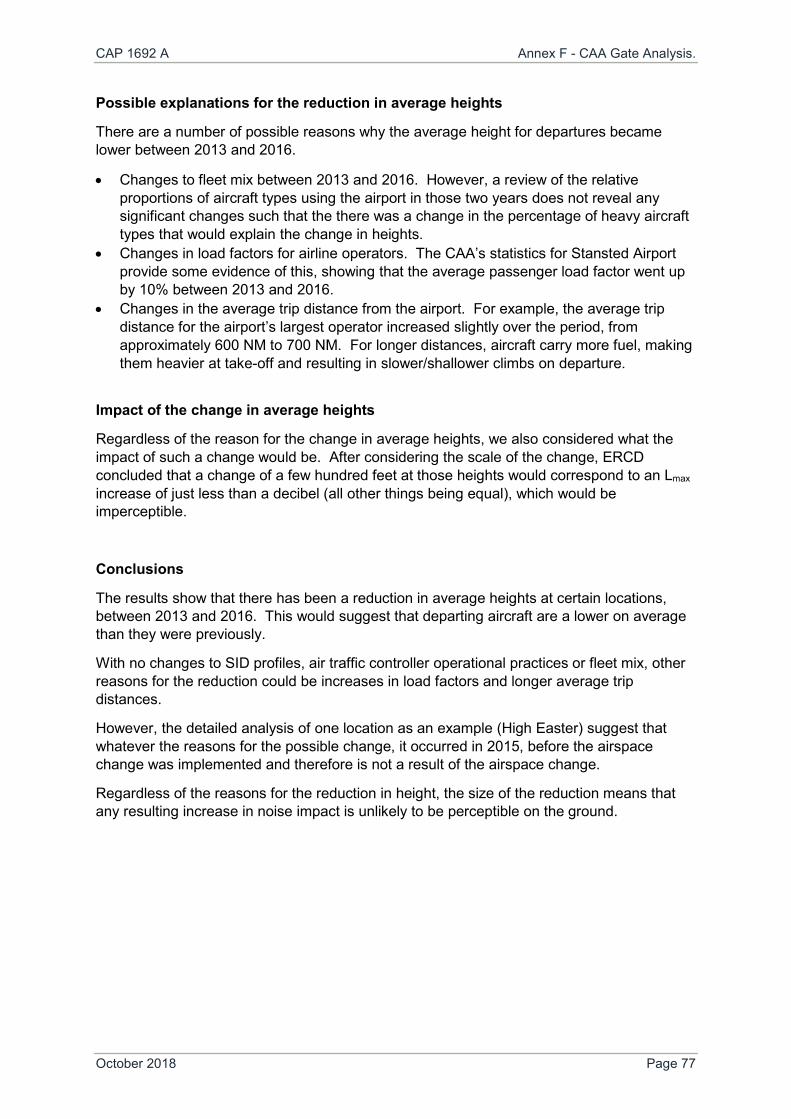
CAP 1692 A Annex F - CAA Gate Analysis.
October 2018 Page 77
Possible explanations for the reduction in average heights
There are a number of possible reasons why the average height for departures became lower between 2013 and 2016.
• Changes to fleet mix between 2013 and 2016. However, a review of the relative proportions of aircraft types using the airport in those two years does not reveal any significant changes such that the there was a change in the percentage of heavy aircraft types that would explain the change in heights.
• Changes in load factors for airline operators. The CAA’s statistics for Stansted Airport provide some evidence of this, showing that the average passenger load factor went up by 10% between 2013 and 2016.
• Changes in the average trip distance from the airport. For example, the average trip distance for the airport’s largest operator increased slightly over the period, from approximately 600 NM to 700 NM. For longer distances, aircraft carry more fuel, making them heavier at take-off and resulting in slower/shallower climbs on departure.
Impact of the change in average heights
Regardless of the reason for the change in average heights, we also considered what the impact of such a change would be. After considering the scale of the change, ERCD concluded that a change of a few hundred feet at those heights would correspond to an Lmax increase of just less than a decibel (all other things being equal), which would be imperceptible.
Conclusions
The results show that there has been a reduction in average heights at certain locations, between 2013 and 2016. This would suggest that departing aircraft are a lower on average than they were previously.
With no changes to SID profiles, air traffic controller operational practices or fleet mix, other reasons for the reduction could be increases in load factors and longer average trip distances.
However, the detailed analysis of one location as an example (High Easter) suggest that whatever the reasons for the possible change, it occurred in 2015, before the airspace change was implemented and therefore is not a result of the airspace change.
Regardless of the reasons for the reduction in height, the size of the reduction means that any resulting increase in noise impact is unlikely to be perceptible on the ground.