report no. file copy - world...
TRANSCRIPT

RETURN TO
REPORTS R E S T R I C T E DWITHIN
ONE WEE Report No. T.O. 223a
FILE COPY
This report was prepared for use within the Bank. In making itavailable to others, the Bank assumes no responsibility to them forthe accuracy or completeness of the information contained herein.
INTERNATIONAL BANK FOR RECONSTRUCTION AND DEVELOPMENT
FUJII IRON AND STEEL CO., LTD.
APPRAISAL OF BLAST FURNACE PROJECT
JAPAN
October 30, 1959
Department of Technical Operations
Pub
lic D
iscl
osur
e A
utho
rized
Pub
lic D
iscl
osur
e A
utho
rized
Pub
lic D
iscl
osur
e A
utho
rized
Pub
lic D
iscl
osur
e A
utho
rized

CURRENCY EQUIVALENTS
1 US $ - Y 3601 million Y - $2,780
All tons are metric tons of 2,200 pounds
The company's fiscal terms run from April 1to September 30 and October 1 to March 31.
When the term " fiscal year" is used, it meansthe year from April 1 of the year mentioned toMarch 31 of the following year.

TABLE OF CONTENTS
Paragraphs
Summary and Conclusions
I. Introduction 1- 8
II. The Company 9 - 6Properties 20 - 25Other Investments 26Share Capital 27 - 28Management 29Labor 30 - 31Earnings Record and Financial
Position 32 - 39Past Expansion and Modernization
of Facilities ho - 43Second Mlodernization and Ex-
pansion Program 44 - 46
III. The Market 47 - 51
IV. The Construction Program 52 - 73Raw Mlaterials, Utilities and
Labor 61Construction Schedule and En-
gineering 62 - 64Cost Estimates 65 - 71Proposed IBRD Loan 72 - 73
V. Benefits Resulting from the ExpansionProgram 74 - 77
VI. Assumptions for Future Demand andPrices 78 - 80
VII. Financing Plan and Financial Prospects 81 - 99Construction Period 83 - 90Operating Period 91 - 9Conclusions 95 - 99

LIST OF ANNEXES
1. Existing Facilities (March 1959)
2. List of Main Subsidiaries as at March 31, 1959
3e Past Financial Stateraets
4. Expenditures on Fixed Assets for Projectsincluded in the Second Modernization Programand completed between March 31, 1956 andMarch 31, 1959.
5. Market Prospects of the Japanese Steel Industry
6. Raw Materials, Utilities, Labor
7. Construction Schedule
8. Order of Priority of Projects not started onJanuary 1, 1959 as Proposed by the Company
9. Cost Estimates
10. Proposed Disbursement Schedule
11. Sales (domestic and export) and Share of theJapanese Market
12. Sales Prices
13. Return on Sales
14. Income Statement Forecasts
15. Cash Flow Forecasts
16, Balance Sheet Forecasts
17. Assumptions for Financial Forecasts
18. Consolidated Balance Sheet Forecast (with mainsubsidiaries)
Map
Chart

FUJI IRON & STEEL CO., LTD.
APPRAISAL OF BLAST FURNACE PROJECT
SUilYriPJtY AND CONCLUSIONS
The Japanese Government has asked the Bank to lend the JapanDevelopment Bank $24 million equivalent to be relent to the Fuji Iron& Steel Co., Ltd. (Fuji) to cover the imported goods and part of thelocal expenditures for a portion of the company's construction program.This program was initiated in 1959 and is expected to be completed byharch 313 1962. It is designed to expand the company's iron and steel-making facilities, located at Hirohata, *Auroran, Kamaishi and Kawasaki.
Fuji, the second largest steel company in Japan is an inte-grated producer of plates, sheets, rails, shapes and bars. It alsosells large quantities of pig iron and semi-finished steel products.
The company is well organized and managed. Its financialposition and its credit are good, Its earnings were large during the1955-1957 period, but declined substantially during the 1958 recession.
The company has made considerable efforts in recent years tomodernize and expand its facilities, However, in order to keep pacewTith the country's fast expanding demand for steel, it must increase itspig iron and steelmaking capacity. It has therefore begun to constructa large modern blast furnace, an oxygen converter plant and a slabbingmill. Its construction program also contemplates the modernization ofobsolete equipment and the addition of facilities designed to widen therange of saleable products. The whole construction program from April 1,1959 to iMlarch 31, 1962 is designed to increase annual pig iron capacityfrom 2,650,000 tons to 3,300,000 tons and ingot steel capacity from3,000,000 tons to 3,750,000 tons. The construction program engineeredby Fuji's staff is sound.
The new blast furnace, converter plant and slabbing mill atHirohata will enable Fuji to increase its production of plates and sheets.By spreading overhead and permitting a fuller utilization of the rollingmills, it will increase the company's earning power. Demand for platesseems likely to weaken in the near future because of a falling off inship construction, but demand for sheet is likely to be large enough topermit full operation of its flat product facilities. There is no pro-blem in connection with the marketing of the other finished steel productsmanufactured by Fuji.
The cost of the three-year construction program is estimatedconservatively at about *73.2 billion ($203.3 million equivalent). Thisincludes expected investments of about 13l million equivalent in renewalsand repairs, but does not include interest during construction,

- ii. -
The company's financial requirements for the three-yearperiod ending March 31, 1962 are estirnated at about 1102.4 billion($284 million equivalent). This includes some *7 billion for workingcapital and some 116.1 billion for repayrnent of existing debt.
The financing plan to meet these needs is sound. Retainedearnings, depreciation and the proceeds of a share issue should pro-vide more than Y45.6 billion; long-term borrowings (including the pro-posed Bank loan of about 48.6 billion, bond issues of about Y21.0 bil-lion and other long-term bank loans of about 126.8 billion) would total156.4 billion.
Arrangements have been made in Japan to raise part of thenecessary long-term borrowings. The company is negotiating with itsbankers to secure the part of the 126.8 billion in long-term loansthat has not yet been arranged and to obtain assurances concerningthe underwriting of the part of the Y212O billion in bonds that hasnot yet been issued.
Conservative financial projections indicate that the company'sconsolidated debt/equity ratio should not rise above 58:42 during theconstruction period and should fall rapidly thereafter. Long-term debtservice should be covered by an adequate margin (not falling below lo)
during the first four years' operations, even assuming that, contrary tonormal practice, no bond issues are refunded. The current ratio wouldreach a low point of 1.11:1 during the construction period. In order toguard against the risk of a working capital shortage during that periodthe company will obtain an undertaking to provide short-term loans up toan amount of >m'6 billion from its main bank, the Industrial Bank. Thiswill fund short-term loans during fiive years, the term of the undertaking,and, by eliminating them from current liabilities, raise the current ratioduring the construction period to a minimum of 1.59:1. It is expectedthat this backstop would be renewed every year for the ensuing period of fiveyears, until the last repayment of the Bank loan.
The cost of the portion of the construction program for whicha Bank loan has been requested - the blast furnace, the converter plantand the slabbing mill at Hirohata - is estimated at 127.J billion (075,.3million equivalent). It is a suitable basis for a Bank loan of $24 mil-lion equivalent, which would cover the imported goods and part of localexpenditures, with a term of 15 years (including two yearst grace), pro-vided that satisfactory arrangements are made for security, for a limi-tation on additional borrowings, for the protection of the company'sliquidity and for financing from Japanese sources, as suggested in paras.95 to 98.

I. INTRODUCTION
1. The Japanese Government indicated to Mr. Black, during hisvisit to Japan in IMay 1957, that the development of the steel industryand, in particular, the expansion of ironmaking facilities (to reducethe industryts dependence on imported scrap) had a high priority forJapan's econonic development.
2. The steel industry, after rehabilitating its war-damaged fa-cilities, carried out a substantial investment program between 1951 and1955. Capacity was expanded sufficiently to make possible an increasein crude steel production from about 7.7 million tons in 1953 (the pre-vious peak level) to 11.1 million tons in 1956. To keep pace with therapidly rising domestic demand, however, further expansion was needed,and in early 1956, the Japanese steel industry had embarked on a SecondExpansion and iodernization Program. It was for this program that itsought Bank help. This second program was aimed at a) expanding crudesteel capacity to 20.5 million tons by 1962; b) installing facilitiesto enable the industry to meet the demand for higher quality and a widerrange of products; and c) modernizing the mills in order to reduce opera-ting costs,
3. One of the principal objects of the investment program wasan expansion of ironmaking facilities. A stimulus for this phase of theplan was the acute shortage of scrap which developed as a result of theSuez crisis, in 1956, which forced up prices and made it difficult forthe Japanese producers to obtain adequate supplies of imported scrap.Although scrap is no longer in such short supply, a number of factorscombine to provide continued justification for the substitution of pigiron for scrap: the fluctuations in scrap supplies and prices; the factthat iron ore can be imported from the Pacific area and India whereasscrap comes from the US; and, finally, the introduction of new oxygentechniques in steelmaking which make possible an increase in the propor-tion of pig iron in the charge. These new processes - based on oxygenconverters, or an increased use of oxygen in open-hearth furnaces - arewidely used in Japan.
4. Most of the projects included in the Second Expansion andisiodernization Program have either been completed or are under way.Developments have amply justified the expansion of caPacity. In the fiscalyear 1959, production seems likely to reach 16.2 maillion tons, about3.7 million tons in excess of the previous record level, reached in 1957.The indications are that by the early 1960's, the industry will have tooperate at a high rate to meet demand.
5. The Japanese steel industry has both advantages and disadvan-tages compared with the European and US industries. It is heavily de-pendent upon imported raw materials, which carry large and fluctuatingfreight charges. It has been able to offset this disadvantage throughlow cost labor and efficient operation of facilities. Although many

?acilities are still obsolete, the substantial investments which havebeen made in facilities embodyiLng the latest advances in technology,have made it possible for Japan to compete with the US and Xawopeansteel industries in export markets.
6. Some 10% to 15% of Japanese steel production is exported inthe form of primary products and a substantial proportion is exportedir manufactured products (mainly ships to date but increasingly machineryand other products). If Japan is to maintain its competitive position,it must continue to keep pace with the European and US industries in pro-ductivity, quality, and efficiency; this will involve continued substan-tial investments in modern facilities,
7. The Bank has already made loans to the Japanese steel industry,amounting to a total of $l00.9 million equivalent. Five of the six largeststeel companies have had a portion of their expansion financed by the Bank:vawata, v5.3 million; Nippon Kokan, $2h.6 million; Kawasaki, $28 million;Sumitomo, $33 million; and Kobe, $10 million. The Bank has now been askedto consider two further projects, that of Fuji Iron & Steel Co., Ltd.,for $24 million equivalent, and that of Yawata Iron & Steel Co., Ltd., for$20 million equivalent.
8. The project which is appraised in the following report is theconstruction of facilities - the blast furnace, converter plant and slab-bing mill - at the Hirohata works of Fuji Iron & Steel Co., Ltd. (Fuji)on the inland sea. The company's construction program, which includesother facilities at Hirohata and its other works, is an integrated whole.The following appraisal therefore covers the whole construction programof the company which is designed to increase its annual output of pigiron from about 2,650,000 tons to about 3,300,000 tons and of ingot steelfrom about 3,000,000 tons to about 3,750,000 tons, with corresponding ex-pansion and modernization of finishing facilities. This appraisal isbased upon data submitted by the company and a field investigation duringJuly and August, 1959.

- 3 -
II. THE COMPANY
9. The Fuji Iron & Steel Go., Ltd. is a successor of the first inte-grated steel company to be established in Japan, the Yawata Iron Works setup in 1901 by the Imperial Japanese Government. This company dominated theJapanese steel industry in the first three decades of the century.
10. In 1934, a merger was arranged between Yawata and the independentblast furnace operators. The Imperial Government emerged as the holder of80% of the stock of the new steel company, the Japan Iron and Steel Co.,Ltd. The new company accounted for 75% of the pig iron, 43% of the rawsteel and 40% of the finished steel produced in Japan in 1934. Virtuallyall the other steel companies in the country depended upon it for theirpig iron or semi-finished steel.
11. After the close of the war, as a part of the decartelization policy,the Government sold its holdings in the Japan Iron and Steel Co., Ltd. throughthe security markets, and early in 1950 the company itself was dissolved.The bulk of its iron and steel facilities were transferred to two new com-panies, the Yawata Iron & Steel Co., Ltd., and the Fuji Iron & Steel Co.,Ltd.
12. The two new companies, Yawata and Fuji, were formally organizedon April 1, 1950 and became the two largest steel producers in Japan. Thenew Yawata company received the facilities at Yawata on Kyushu Island whiletne Fuji company was given the works at Hirohata, Kamaishi and Kawasaki inHonshu, and at Mu-oran in Hokkaido (see map).
13. Fuji is today the second largest integrated steel company in Japan,with about 30% of the whole country's output of pig iron, more than 18% ofsteel ingots and more than 15% of finished rolled steel products. It isthe principal supplier of pig iron and semi-finished steel to small producersof finished steel products.
14. The company's production capacity and output have increased by50% since it began operations. It should be noted that in most integratedsteel companies, with normally balanced facilities, pig iron, ingot steel,blooms and billets, and hot coils and hoops are used for further processitigby the company and are not sold in their original form. The proportion ofthese products sold as such by Fuji is rather high. Production capacity andsales in the Japanese fiscal year 1958 (April 1, 1958-March 31, 1959) wereas follows (in thousand tons):

-4-
ProductionCapacity Sales
Pig iron 2,647 420Ingot steel 3,024 -
Hot Rolled Products:Blooms, billets, sheet bars and slabs 2,880 202Rails, shapes, bars and wire rod 454 488Plates* ( 349Hot coils and hoops* (1,594 346Others 142
Cold Rolled Products:Cold strip and sheets* 392 235Galvanized sheets 60 50Tinplates 96 17Cold formed products 12 5
X Part of these facilities came into production during the 1958fiscal year and only a proportionate part of their capacity isincluded here.
15. In 1958, flat products accounted for 44"2% of the total tonnageof sales, bars and sections for 16.8%, wire rod for 4.9%, semi-finishedsteel and other products for 15.5% and pig iron for 18.6%.
16. The value of sales has nearly doubled in recent years. A sub-stantial proportion of total sales is for export.
Fiscal Years Sales Percentage Exported(7 million) (in value)
1954 56,404 16.2%1955 77,388 19.2%1956 98,177 12.8%1957 102,791 11.3%1958 90,525 15.4%
17. The decline in exports in 1956 and 1957 was the result of the boomin those years when the strong demand on the home market was met at the ex-pense of exports.
g8. Except in the recession of 1958, Fujils export prices for finishedsteel products have been very close to domestic prices. In 1958, averageexport prices were about 4.6% lower than domestic.

19. Fuji production costs are relatively low and compare favorablywith those of other Japanese producers. Average production cost per tonof plate, a typical product for the company, was Y31,730 ($88.14 equivalent)in September 1958, not including indirect cost and financial charges. Thiscompared with a domestic sale price of 446,000 per ton ($128 equivalent)and a U.S. sale price of $116.80 per ton (base price, fob mill).
Properties
20. The major installations at the four Fuji steel works are listedin Annex 1.
21. The Kamaishi and Muroran plants are located on the coast close toiron ore and coal mines, but rather far from the market for steel products,which is largely concentrated in the area south of Tokyo. With minor ex-ceptions such as the Kamaishi iron ore, Japanese domestic coal and iron oreare rather poor in quality and relatively expensive. However, when oceanfreights are high, the Kamaishi and Muroran plants gain an advantage throughtheir use of local raw materials. When ocean freights are low, this advar-tage is reduced and at some times the raw material costs of these plantshave been higher than those of Japanese plants using imported raw materials,thus aggravating the plants' basic disadvantage of distance from the market.However, industry is likely to expand in the north of Japan, mainly becauseof lack of space for further expansion in the south, and both Muroran andKamaishi can look forward to a rapid expansion of their local markets inthe future.
22. Muroran is an excellent plant, with a fine natural harbor and allthe space necessary for expansion. Except for an obsolete bar and shape-mill, the facilities are relatively new or recently remodeled.
23. At Kamaishi, on the other hand, there is no space for a major ex-pansion of facilities in future. Indeed, the site is inadequate for efficientoperation at present and Fuji has been obliged to resort to expensive expe-dlents, such as the building of a 2,000 m. tunnel to make possible the duinpngoZ blast furnace slag into the sea. In addition, most of the rolling facili-ties at Kamaishi are obsolete.
24. The Hirohata works are by far the finest plant of the company.Located on the inland sea, they are close to the steel market. The plantis relatively modern and efficient and the layout of the plant is good,although the rolling mill site is becoming overcrowded.
25. The company's fourth plant at Kawasaki is a small rolling mill;Its excellent location in the heart of the Tokyo industrial area and theample size of the site make it a valuable asset for Fuji.

-6-
Other Investrents
26, As of March 31, 1959, Fuji had investments totalling Y6,808 mil-lion ($18.9 million equivalent) in shares and securities, of which Y2,526million (37.1%) were in shares of six subsidiary companies. A list of thesesubsidiaries is given in Annex 2. Most of Fujits remaining investments werein banks or investment companies (15%), mining (15.5%) and metal industries(11.6%). Such large investments are customary in Japan, where industrialcompanies usually hold substantial share interests in the banks with whichthey deal, in their main suppliers and in customers. The practice of holdingsuch large portfolios often constitutes a heavy burden for industrial com-panies, although the investment riskc is well diversified.
Share Cpital
27, When Fuji was established in 1950, the share capital was Y400 mil-lion. Successive issues of new shares have brought its share capital up to420,000 million , repreaented by 400 million shares at par value (Y50) which.Care distributed among 120,000 shareholders. Although over 44% of the totalshares are held by financial institutions (as of March 31, 1959) the threelargest shareholders, the Mitsubishi Trust Bank, the Industrial Bank and theDaiwa Bank, each hold only about 2.6% of the total.
28. Fuji stock prices have followed the same course as those of otherJapenese steel companies. They reached a peak of Y86 (compared with a parvalue of Y50 and a book value of Y105) at the end of 1956 during the Suezcrisis, fell to a low of Y59 in December 1957, during the recession, andreeovered to a peak of Y122 in July 1959. The latter figure reflects anexpectation of a possible share issue in the near future; according toJapanese custom, new share issues are offered to shareholders at par (Y50),and recently it has been the practice to distribute 20% of the whole issueas stock dividend (by capitalizing part of the revaluation reserve) makingthe effective price to shareholders Y40 per share.
Management
29. Fuji's management is competent and conservative in its financialapproach. It has successfully carried out a large expansion program inreoent years without straining the company's finances. Mr. Nagano, Fuji'sPresident, is one of the outstanding figures in Japanese industry.
Iabor
$0. Fuji employed about 25,000 workers in 1958 to produce about2,300,000 tons of ingot steel. Productivity compares favorably with thatof other Japanese steel companies. Labor costs are low, as is usual inJapan. They averaged Y228 per hour ($0.63 equivalent), including all fringebenefits. The labor cost per ton of saleable product was Y6,842 ($19.00cquivalent).

31. labor is organized in unions, on a plant and company basis. Untilthis year, the occasional strikes have been settled in a few days. In March-April 1959, however, after management had granted a monthly increase of Y800in wages (1.6%), the companyt s rolling mills were paralyzed by a striXe. Thestrike ended after 44 days, without any further wage concession by the manage-ment.
Earninas Record and Financial Position
32. Total sales, adjusted net profits (after taxes) and dividend pay-ments of Fuji in recent fiscal years have been as follows (adjusted incomestatements are shown in Annex 3):
1954 1955 1956 1957 1958- - - - - - - - - (Y million) - - - - - - - -
Total sales 56,404 77,388 98,177 102,791 90!525Net Income (236) 2,328 4,492 7,844 949Dividends 420 872 1,101 1,560 2,171Annual rate on sharepar value (X50) 10% 12% 12% 12% 12%
Percentage of netearnings retained - 63% 75% 80% -
Total times interestcovered before taxes 1.1 2.4 4,4 5.5 1.8
33. The company has followed a policy of distributing an even and rea-sonable dividend. A large proportion of profits (after ordinary depreciation)ha: been retained in good yeers although dividends in poor years, 1954 and1958, have exceeded current earnings.

- 8 -
34. The comPany's balance sheets for each of the last five years,shoun in detail and commented on in Annex 3, are summarized below:
March 31 1955 1956 1957 1958 1959…(# million) - - - - - - -
Current Assets 41,352 42,759 41,937 53,106 52,323Net Fixed Assets 40,620 38,174 45,913 57,998 70,461Investments and Others 2.704 L4364 5.662 6,914 10.059
Total Assets 84,676 85,297 93,512 118,018 132,843
Current Liabilities 34,783 29,834 31,889 48,380 44,499Long-term Debt 12,528 13,419 12,930 18,216 30,464
Capital Stock 4,200 8,400 13,000 13,000 20,000Surplus and Reserves 332165 33,644 35,693 38,422 37,88
Total Liabilities 84,676 85,297 93,512 118,018 132,843
35. Fuji is reasonably conservative in its valuation of inventories.It uses the declining balance method for depreciation. It has taken thefull normal depreciation authorized by tax law and the full special acceler-ated depreciation allowed for half of its investment in new machinery.Special depreciation accruals between April 1, 1955 and March 31, 1959armounted to Y6,146 million. The company's accounts are audited by an inde-pendent auditor under Japanese regulations.
36. In spite of three successive revaluations between 1950 and 1954,adding in all over Y28 billion ($78 million equivalent) to the book valueof its facilities, and of substantial investments in new equipment (about$145 million during the last five years), net fixed assets are conservativelyvalued; investments in fixed assets amounted, on March 31, 1959, to theequivalent of $62 per ton of ingot capacit.y. This compares with an invest-ment cost for a new plant in the U.S. nowadays of about $300 or more per tonof ingot capacity. Land is carried on Fuji's books at Y621 million, whileits present worth would be about ll billion.
37. The company deals with all the leading banks in Japan and enjoystheir full confidence. It has at present a relatively large short-term debt,which is unsecured.
38. Financial ratios in past years have been as follows:
March 31 1955 1956 1957 1958 1959
Current Assets/Current Liabilitiesexcluding short-term loans 1.75:1 1.82:1 1.46:1 1.57:1 1.84:1
Current Assets/Current Liabilities 1.19:1 1.43:1 1.32:1 1.10:1 1.18:1Long-term Debt/Equity 25:75 24:76 21:79 26:74 34:66Total Debt/Equity 46:54 37:63 29:71 42:58 47-53

39. These ratios show a marked improvement up to March 31, 1957 anda deterioration since then, in spite of a share issue in 1958 which broughtY5,820 million ($16 million equivalent) in cash to the company. The declinehas been caused mainly by heavy investments during the last two years bothin fixed assets (about $95 million equivalent) and in working capital (about$40 million).
Past Expansion and Modernization of Facilities
40. When Fuji was separated from the Japan Iron and Steel Company in1950, the production facilities which were allotted to it were unevenlybalanced. Pig iron and steel ingot capacities were in excess of rollingcapacity, and the company had to sell pig iron and semi-finished steel. Agroup of steady customers for these products has been developed. Fuji nowfeels obliged to continue to provide these customers with semi-finishedproducts, although the margin of profit on such products is lower than onmore highly processed products.
41. Fuji has, however, made efforts to expand its rolling and finish-ing facilities. The first step was the installation at Hirohata in 1954 ofa cold strip mill, 56" wide, together with annealing furnaces and two semi-continuous galvanizing lines, at a total cost of X7.2 billion ($20 millionequivalent). In 1956, Fuji started work on a seven-year modernization andexpansion program, the main emphasis of which was on finishing faciLities.In 1957, a 56" wide semi-continuous hot strip mill was added at Muroran,cold f'orming equipment was installed at Kawasaki, and tinning lines wereput in at Hirohata. In 1958, work was begun on a modern 160" wide platemill at Hirohata. At the same time, Fuji completely modernized its obsoletewire rod mill at Muroran and the large section mill at Kamaishi.
42. However, relatively small investments in remodeling and enlargingblast furnaces, and in steelmaking plants (one additional open-hearth furnaceat Hirohata in 1953 and oxygen generators at the three main works) have re-sulted in substantial capacity increases in pig iron and crude steel. As aconsequence, Fuji still has a relatively high steel ingot capacity comparedwith its rolling capacity.
43. The company's strip mills are also unbalanced: it has only about35% as much cold rolling capacity as hot strip capacity. As a result, alarge part of the strip produced at 1Hirohata and at Muroran must be sold tosubsidiaries or affiliated companies in the form of hot coils, on which theprofit is relatively small.
Second Modernization and Expansion Propram
44. Fuji's s:S.z-year modernization program began officially on l5arch31, 1956. Total expenditures in fixed assets in the three years ended Malch31, 1959 were as follows (a more detailed list is given in Annex 4):

- 10 -
$ millionX billion equivalent %
Reconstruction and expansion of blast fur-naces, coke ovens and sintering plants 5.1 14.2 11.0
Expansion of steelmaking capacity 4.2 11.6 8.9Rolling mills 29.2 81.0 62.4Renewals and repairs 8. 323.2 17.7
46.8 130.0 100.0
Less payments to be made after March 31, 1959 2.5 6.9Plus preliminary expenditures on projectsto be carried out in 1959-1962 2.9 8.o
42.2 131.1
45. During these three years, Fuji's total requirements for new fundswere as follows:
$ millionX billion equivalent
Investments in plant improvements 47.2 131.1Tnvestments in shares, securities, etc. 5.6 15.6Increase in working capital (net) 7.8 21.7Repayment of long-term debt 13.2 36.6
73.8 205.0
These requirements were met from the following sources:
$ millionbillion eouivalent %
Retained earnings and depreciation 25.3 70.3 34.2Capital increase 9.8 27.2 13.2Long-term loans and bonds 29.0 80.6 39.4Net increase in short-term loans 9.7 26.9 13.2
27.8 205.0 100 0
During these three years, one of which was a recession year, while carryingout such a heavy investment program, Fuji was able to finance over one thirdof its requirements out of retained earnings and depreciaticn and close to50% out of equity.
46. In November 1957, Fuji received a $10.3 million loan from theExport-Import Bank of the United States, to finance the imported goods fora substantial part of the Second Expansion and Modernization Program. Theterm of the loan is 12 years, including 2 years grace, and the interest 5.5%.

- Jl -
III. THE MARKET
47, A general study of the Japanese steel market and the prospect forfinished products produced by Fuji is attached in Annex 5. The basic con-clusions are that by fiscal 1962, the total demand for Japanese crude steelwill amount to 17.8 million tons (implying an increase of 8%, per year indemand for crude steel from the 1956-58 average of 11.8 million tons peryear); and that in the years fcllowing 1962, total demand for Japanese crudesteel will increase at a rate of 5% per year.
48. The estimate of demand for Japanese steel in 1962 in turn restson the following assumptions: that domestic demand for finished steel prod-ucts will increase at a rate consistent with a rise of about 5% per year ingross national product over the period 1956-1962; and that exports offinished steel will amount to 1.4 million tons, or only slightly more thanactual exports in fiscal 1958 (1.3 million tons).
49. In arriving at the estimates for the years 1959-1961, it has beenassumed that demand would rise at a constant rate from the actual level in1958 to the estimated 1962 level. Since 1958 was a recession year, theseestimates are lower than estimates based on the possible alternative as-sumption that demand would rise at a constant rate from fiscal 1956 tofiscal 1962.
50. On the basis of data on actual production in the first half of thefiscal year 1959 (April 1, 1959-March 31, 1960) and of estimated sales forthe rest of the fiscal year, it is estimated that production will actuallyreach 16.2 million tons in this fiscal year. This is, of course, a verymuch higher figure than the estimate based on the assumptions set forthabove, and is only 1.6 million tons below our estimate for the fiscalyear 1962. However, it seems likely that current demand has been affectedby the U.S. steel strike. Substantial quantities of steel are also goinginto inventories. Moreover, in view of the fact that steel production issubject to wide fluctuations, a medium-range forecast should not attach toomuch weight to the magnitude of demand in a boom year. On the whole, theconclusions set forth above in paras. 47 to 49, although probably somewhatconservative, do not seem unreasonable.
51. The Japanese steel industry is at present carrying out an expansicioprogram scheduled for completion in 1962 that is aimed at (1) expanding steel-making capacity to 20.5 million tons, (2) expanding blast furnace capacityto 12 million tons to make possible the planned increase in steel productionwithout increasing the nation's dependence upon scrap, much of which mustbe imported, and (3) further modernizing rolling mills, particularly thoseproducing flat products. Even on the conservative assumptions adopted,there should be sufficient demand to enable the industry to operate at ratescomparing favorably with those reached in the generally prosperous period1953-1957.

- 12 -
IV. THE CONSTRUCTION PROGRAM
52. The company's construction program for the three years endingM'arch 31, 1962 is des5gned to increase production capacity as follows (inthousand tons):
At March 31,1959 ^1962
Blast furnaces 2,647 3,303Steel furnaces 3,024 3,768Blooming mill 2,880 6,720
Hot rolling malls:Bar and section mills 630 654Wire rod mill 240 240Plate mill 360 540Hot strip mill 1,300 1,660Sheet mill 18 18Hoop mill __96 96
2,644 3,208
Cold strip mills 456 456
Galvanizing line 60 60
Tinning lines 96 96
53. In order to achieve these aims, Fuji proposeo to carry out thefollowing improvements at the steel plants.
54. At Hirohata, Fuji will build a 1,500-ton per day blast furnacewith all related facilities, including facilities for the blending, crush-ing and screening of ore and coal; construct a 2,000-ton per day sinteringplant; rebuild coke oven plant No. 1 (75 ovens); expand the chemical by-product facilities; install two 60-ton oxygen top-blowing converters, anew slaLbing mill, and four new sets of soaking pits; remodel three setsof existing soaking pits; and improve and expand services at the plant(power and water supply, unloading and transportation facilities and store-house). It is for the above project that Fuji has requested a loan fromthe Bank.
55. In addition, the company plans to undertake the following otherimlprovements.
56. At Hirohata, enlargement of the steelmaking shop and of the portfacilities; addition of a reheating furnace to the plate mill; and instal-lation of a coke oven gas separator and of an electrolytic zinc coatingline for sheets.
57. At Muroran, remodeling of blast furnace No. 1 to increase ca-p3city to 1,000 tons per day; construction of a 200-ton openi hearth (No. 6);enlargement of the soaking pits; construction of a slabbing mill; instal-

- 13 -
lation of additional facilities for the existing hot strip mill; construc-tion of a cold rolling mill; modernization of the wire rod mill; expansionof plant services (water and power supply, harbor and unloading facilities,relocation of the storehouse); and construction of facilities to separatehydrogen from the coke oven gas.
58. At Kamnaishi, remodeling of blast furnace No. 8 to increase capa-city to 1,000 tons per day; construction of a 1,400 tons per day sinter-ing plant; enlargement of the raw material yard; reconstruction of cokeoven plant No. 2 (20 ovens); expansion of steelmaking capacity by the ad-dition of an oxygen plant; expansion of soaking pits(one set); modernizationof the large and medium section mill; remodeling of existing pullover handsheet mills to roll silicon sheets; and expansion of the stockyard and ofthe railroad.
59. At Kawasaki, expansion of facilities for manufacturing poles andof the existing cold-forming facilities; and installation of modern labora-tory facilitiee.
60. The expansion program is well conceived although it does notprovide for a sufficient expansion of rolling mills and finishing facili-ties. The company's management, well aware of the problem, is alreadystudying the feasibility of expanding cold rolling and coatLig facilities,and of installing modern bar and section equipment.
Raw Materials. Utilities. Labor
61. Fuji has taken steps to assure itself of an adequate supply ofraw materials. General services will be expanded in each plant to meet newproduction requirements. The company should have no difficulty in hiringand training the additional labor force required for the new facilities.Details are given in Annex 6.
Construction Schedule and Engineerinz
62. The construction schedule is given in Annex 7. It is reasonable.Almost all the projects will be under way by the end of 1959. The onlyexceptions are two units at the Muroran works: the hydrogen separationplant which will be started in October 1960 and the cold strip mill whichwill be started in April 1961. These plants are last in the prioritylist of the company (Annex 8).
63. Fuji has a capable engineering staff, which has efficientlyprepared the construction program. The company is well organized to super-vise construction and erection of the new facilities.
64. Fuji has further expansion plans for the period after April 1962.A fourth blast furnace of 2,000 tons per day and a third converter wouldpermit an increase in the steel ingot annual capacity to 2.4 million tonsat Hirohata where an additional cold strip mill and a bar and sectionmill would also be installed. At Muroran, a 2,000 tons per day blastfurnace and two 6 0-ton oxygen converters would increase annual ingot capa-city to 1.9 million tons. At Kamaishi, a medium shape mill would beinstalled. The timing and financing of these further investments will notbe decided for some time.

- 14 -
Cost Estimates
65. The estimated cost of the entire program in the three years April1959 to i,larch 1962 is YL73.2 billion (;203.3 million equivalent). The mainfigures are as follows (for details see Annex 9):
Total LocalCost Expenditures Imports Total
(I mil.) ($ million equivalent)Project proposed as the
basis for a Bank loan 24,973 62.2 7.2 69.4Rest of the program 34,677 93.8 2.5 96.3Renewals and repairs 11,007 30.6 - 30.6Payments on projects al-ready completed 2L520 7.0 - 7.0
Total 73,177 193.6 9.7 203.3
(Contingency allowance in-cluded in estimates) (7,525)
66. The relative emphasis on different types of facility is showrn inthe following table:
v million %
Pig iron capacity 15,396 21L0Steelmaking capacity 6,774 9.3Rolling capacity 17,960 24.6General services of theplants and harbors 11,995 16.4
Renewals and repairs 11,007 15.0Contingency reserves 7,525 10.3Projects already completed :,52Q 3.4
Total 73,177 100.0
67. Most of the present cost estimates are reliable, although thestudy of some projects has not yet been completed (cold strip mill andseparation of hydrogen at Muloran). Construction cost estimates are basedon :958 prices, but there has been no significant change in prices sincethen.
68. The total contingency reserve for the entire construction pro-gram amou-nts to ;7,525 million, or about 10.3% of proposed expendituresfrom April 1, 1959 to hla--ch 31, 1962. This figure includes I-345 million,the maximum possible escalation on import orders already placed, and anallowarnce of 6% on domestic orders already placed and of 12'o on all ordersyet to be placed. The contingency reserve should be adequate.
69. Interest during construction is not included in the cost esti-mates, but will be charged against operations.

- 15 -
70. Of the estimated total expenditures on fixed assets from April1959 to March 1962, about 5% ($9.7 million equivalent) will be for im-ported equipment. This includes the $7.2 million required for the projectsubmitted as a basis of a proposed Bank loan.
71. All contracts already let have been placed on a competitive basis.Bids have been limited to domestic suppliers only where past experiencehas shown that it was clearly more advantageous for the company to purchasethe goods in Japan. Fuji will follow these procedures in future.
Proposed IBRD Loan
72. The Bank has been asked to make a $24 million (*S,640 millionequivalent) loan, which would be sufficient to cover the imported goods($7.2 million equivalent) and about 27% of the local expenditures of theblast furnace,converter plant and slabbing mill project at Hirohata fromApril 1, 1959 onward.
73. The proposed loan represents about 32% of the cost of the pro-ject (including expenditures made before Mlarch 31, 1959) and about 12% ofthe total cost of the company's expansion program from llarch 31, 1959 untilMarch 31, 1962. Annex 10 gives an estimate of the currencies likely tobe required and details of the disbursement schedule which is sumnarizedbelow (in $ million equivalent):
Years ending M4arch 31 1960 1961 Total
Foreign exchange l.8 5.4 7.2Local expenditures 8.9 7.9 16.8
Total 10.7 13.3 _4.0

- 16 -
V. BENEFITS RESULTING FROM1 THE EXPANSION PROGRAi
74. It is difficult to isolate the effect on the company's pro-fits of the project covered by the Bank loan because it is only partof a larger investment program. The project is aimed almost entirelyat expanding production, and reductions in production costs will bemodest.
75. The return on sales (see Aumex 13) would be 12.3% in 1962,which would be somewhat above the average return in 1955-1958 of 9.9%,but below the expected return of 1h.8% in the current boom year. Thereturn expected for 1962 is lower than might be expected, due in partto the conservatism of the assumptions that have been adopted with res-pect to future production and prices.
76. For the same reasons the return on the average depreciatedinrestment in operation (Annex 13) would be about 12 g8 in 1962, againstan average of 1509% in 1955-1958 and an expected return of l5%8% in thecurrent year.
77. A large part of Fuji's total sales will continue to consistof pig iron, crude steel and semi-finished products such as hot coils,which yield low profits. However, the program lays the foundation fora low cost expansion of finishing facilities at a later date, and boththe company's earnings and the rate of return on its investment shouldincrease substantially after Fuji has made the complementary investmentsin these facilities to take full advantage of its primary producing fa-cilities,
VI, ASSUK4PTIONS FOR FUTURE DEAvlJND AND PRICES
78. The financial forecasts are based on the assumption that thetotal demand for crude steel in Japan would rise to 17.8 million ingottons in 1962, as explained in Chapter III, and that Fuji would in generalmaintain its present share of the market for each type of product (seeAnnlex 11). Changes in its share of the market for some products have beenassumed to take account of expected severe competition (sheets) or of largeinvestment by Fuji in modern facilities (shapes and rods).
79. In estimating prices (see Annex 12), it has been assumed thatboth raw material costs and finished product prices will recover from thelevels to which they fell in the recession year 1958, but will not regainthe average level of the preceding years,
8°1, In the case of raw materials, it has been assumed that priceswould be lower than before 1958 because of an expected shift from higher-priced to lower-priced sources of imported iron ore and coking coal andof a reduction in the cost of importing iron ore in Japanese boats ratherthan in chartered vessels, fith respect to finished products, it hasseemed prudent to assume that competition would ob'lige producers to passon at least part of the savings in raw material costs to their customers.The resulting assumption is that the margin between finished productprices and raw material costs would return gradually u5 the average levelof the past four years.

- 17 -
VII. FDINANCIING PLAN AED FINANCIAL PROSPECTS
81. Financial projections are attached showing the expected earningsof the company (Annex 14), its cash flow (Annex 15), and its financialposition (Annex 16) during the construction period and the first fouroperating years. The assumptions on which the calculations are based aregiven in Annex 17,
82. The projections indicate that the financing plan is sound andthat the corpany's earnings should be adequate to enable it to pay dividendsat a reasonable rate after meeting all financial obligations. The prospectivfinancial structure of the company is satisfactory. Further details are giieiin the following paragraphs.
A. Construction Period
Financing Plan
83. The corpeny s financial requirem,ents for the construction period,the three years from April 1, 1959 to Mtarch 31, 1962 are as follows:
$ million; million equivalent
Investment in fixed assets 73,177 203.3Other investments 5?,940 16.5increase in working capital 7,166 19.9Repayment of long-term loans 16,109 44.8
Total 102.,392 284.5
84e Most of the expenditures are planned to be made in 1959 and 1960and the part of the program which is covered by the Bank's loan is schedluledto be completed by November 1960.
85. Fuji proposes to meet these requirements from the follo-,ing sources
$ million9 million equivalent %
Retained earnings and depreciation 37,615 104.5 36.9Share issue 8,000 22,2 7.8Long-berm loans:
TBRD 8,640 24.0 8,6Bonds 21,000 58.3 20J5Long-term bank loans 26,820 74.5 26.2
Increase in short-term loans 317 0.9 -
Total 102,392 284,5 l00,0

- 18 -
86. The estimate that the company's retained earnings and depreciationduring the three-year construcetion period will reach 37?,615 million isbased on the market assumptions discussed above (paras. 47-51 and 78-80).
87. A share issue of i10 billion (par value) is planned for 1960,As usual in Japan, the shares 1ill be offered to existing shareholders atpar value(Y50), and 20% of the total issue will be distributed to them asa stock dividends making the effective price 'lh0 per shares The ccmpanyhas been asked to consider the desirability of offering part of the totalshare issue to the general public. Such shares could be sold at a pricesubstantially above par, which would increase the totel cash proceeds of theshare issue.
88. Fuji has concluded an agreement with the Industrial Bank: thebank will be leader of a syndicate for the issue of N20 billion in bondsduring the construction period. The company is expected to obtain satis-factory assurances as to the underwriting of all the bonds still to beissued dur'ing the construction period, and as to the total amount of long-term bank loans which have not yet been arranged for.
89. Fuji also expects to receive an undertaking from the IndustrialBank as leader of a grouD of bariks to provide such funds as may be requiredfor woiking capital needs on short term up to an amount of *16 billionOThis undertaking would run for a period of five years, during which short-term debt can for practical purposes accordingly be treated as long-termdebt. The undertaking is expected to be renewed every year for the ensuingfive years, until the last repayment of the Bank loan,
Analysis of Projections
90. The projections show that during the three-year constructionpericd:
a) Earnings after depreciation, interest, taxes, pre-profit re-serve allocation and dividends of 12% would amount to 49,152million. Total retained earnings, including a Xl,657 millionalJocation to free reserves and depreciation amounting toY26,806 million, would amount to 937,615 million (see Annex 15),
b) The company would complete its construction program and meetall its financ_al obligations wirth a net cash accrual of*2,602 million.
c) Interest on all debt would be covered by from 2.3 to 3.1 times.
d) The current ratio would reach a low of 111:1 by March 31, 1961.However, if short-term loans are excluded from current liabili-ties, because of the expected backstop on short-term loans, thecurrent ratio would be 159:1 on that date.
Until the end of the construction period, the company's workingcapital would be slightly lower than it was on March 31, 1959,but would still be adequate if short-term loans are covered by

- 19 -
a backstop agreement. If necessary, Fuji could easily fi-nance an increase in current assets of as much as 10% byrelyirg more heavily on its suppliers. It could also increaseits short-term debt without any difficulty.
e) The ratio of long-term debt to equity would rise from 34166on March 31, 1959 to 47:53 on March 31, 1962. The rat-o ofthe consolidated total debt of the company and its subsidiariesto its consolidated equity would reach a high of 58:42 onMarch 31 1Q62 (see Annex 18). For the construction period,these ratios are acceptable.
B. Operating Period
91o The company has further expansion plans, the details of whichare being finalized at present. However, it has seemed preferable notto take account of them in these financial forecasts, as the constructiontiming has not yet been fully decided and as the cost estimates, the sourcesof funds and the benefits to be derived from the facilities have not yetbeen studied in detail. The financial forecasts during the operatingperiod shotjn here are therefore somewehat unrealistic, since they assumethat the company will limit its investmernt in fixed assets to normal repairsand renewals, These financial forecasts show what Fuji's financial resultswould be if the cormipany limited its expansion to the pr3sent constructionprogram*
92. During the four years after the completion of construction (April1, 1962 - March 31, 1966) cash generated from the companyts operations(after payment of taxes, interest and a cash dividend at the rate of 10%per annum) would amount to about *55.3 billion, and proceeds of a plannedshare issue in 1962 would amount to '12 billion. Fuji is planning toreduce the dividend rate from 12% to 10% in order to prevent the continuingissues of bonus shares from increasing the cash burden of dividends dis-proportionately.
93. These monies would enable the company:
- to invest about ;28.1 billion in normal renewals and re-pairs together with some expenditures on the present con-struction program not to be incurred until 1962,
- to invest about ,993 billion in shares and subsidiaries,
to increase net working capital by about ;r6.5 billion,
. to reduce net long-tem loans by about M17.7 billion, and
- to decrease short-term loans by about W5.7 billion.
94. By the end of the period, assuming no further investments infixed assets other than normal renewals and repairs, the ratio of itslong-term debt to equity would have been reduced to 33:67 and the ratioof consolidated total debt to equity to 44:56. The company should be

- 20 -
able to carry out reasonable further expansions without having toincrease the proportion of its consolidated debt to equity beyonda prudent level. Fuji's liquidity would improve, the current ratioreaching 1.32:1 on Miarch 31, 1966 (or 1.62:1 excluding short-termloans from current liabilities).
Conclusions
95. The Japan Development Bank, which would relend the proceedsof the proposed Bank loan to the company, has the primary interest insecurity arrangements. The company's long-term loans and bonds aresecured by mortgages, and the Japan Development Bank should be satisfiedthat the arrangements proposed are in accordance with its usual require-ments.
96. Before the subsidiary loan agreement is made effective, theproposed financial undertakings to backstop short-term loans, to under-write future issues of bonds and to supply long-term loans, should havebeen evidenced in form satisfactory to the Japan Development Bank andto the Bank.
97. It is recommended that the companyts freedom to incur debtshould be limited, so as to provide that the ratio between consolidatedtotal debt and equity should not rise above 60:40 before March 31, 1964and 50:50 on or after March 31, 1964.
98. In order to protect the companyts liquidity, it is recommendedthat Fuji's freedom to distribute cash dividends should be limited, soas to provide that such distribution does not result in lowering theratio of current assets to current liabilities (after excluding short-term debt) below 1.50:1 during the life of the Bank loan.
99. Provided that the contractual arrangements incLude protectiveprovis-ons along the lines indicated in paras. 95 to 98, the project(the Hirohata blast furnace No. 3, the converter plant and the slabbingmill) -s suitable for a Bank loan of $24 million equivalent, with a termof 15 years, including two years of grace. The borrower would be theJapan Development Bank which would relend the proceeds of the loan tothe company. The loan would be guaranteed by the Japanese Government.

AN1yUX 1.
FUJI IRON & STEEL CO.. LTD.
Existin Faci.lit.iesMarch 19TTJ
Annual Capacity(thous. m. tons)
Hirohata Works
2 x 1,350 tons/diy blast furnaces 9867 x 200-ton open hearth furnaces 1,3201 blooming mill 1,3201 semi-continuous hot strip mill 86" 8201 5-stand cold strip mill 56" 3601 wide cold mill 80" 961 galvanizing line 601 tinning line 961 plate mill 160", 360
Muroran Works
1 x 1,000 tons/day and 2 x 850 tons/dayblast furnaces 986
5 x 200-ton open hearth furnaces 1,0801 blooming mill 8401 semi-continuous hot strip mill 561" 4801 medium and small section mill 1501 wire rod mill 240
Kamaishi Works
1 x 850 tons/day and 1 x 1,000 tons/dayblast furnaces 675
1 x 200 and 4 x 140-ton open hearthfurnaces 624
1 blooming mill 7201 large section mill 2161 medium section mill 1081 small section mill 961 sheet mill 18
Kawasaki Works
1 small section mill 601 hoop mill 96

FUJI IRON & STEEL CO., LTD.
List,,f Main Subsidiaries as at March 31. 1959
GuaranteesPercentage Total given byof shares Ratio Ratio loans Fuji on
Capital held by F.Y. 1959 Cur. Assets/ Total Debt/ Investment from loanabtits Nature ofStock Fu-ii Sales Cur. Liabs. Ebuitv _Prorem Fuii subsidiar Business( mil.) (V mil.) ( mil.) $ mil.) (Mm.)
Kayanuma Coal Coal Mining -Mining Co. 188 88.0 744 0.16:1 117: (17) 334 257 213 being liqui-
dated atpresent.
Kanto Steel Co. 250 65.8 869 2.20:1 51:49 203 178 415 Steel.
Daido Steel SheetMfg. Co. 750 63.1 5,730 1.20:1 58:42 2,5501/ 1,205 74 Steel Sheet.
Fuji Cement Co. 800 55.0 1,914 0.60:1 70:30 1,350 I - 702 Cement andfertilizer.
Tokai Iron and Steel companySteel Co. 2,500 51.7 - - 0:100 8,222_/ - - to be estab-
lished in Ngoya.
Yamato SteelWorks 350 24.3 3,820 0.90:1 48:52 - _ 100 Steel.
1,640 1,504
/ Daido Steel Sheet Mfg. Co. is planning to issue 1750 million in shares in 1960, and to raise 1950 millionin long-term debt in 1959.
3/ Fuji Cement Co. is planning to raise 1864 million in new loans in 1959 and 1960.
3/ Tokai Iron and Steel Co. is planning to raise 15,581 million in loans between 1959 and 1961. The Tokai Co.was established in 1958 under Fuji's sponsorship for the construction at a new integrated steel millin the Nagoya area. Present plans are to build a cold strip mill, for which hot coils will be suppliedby Fuji. At a later stage, the proposed plant will have 2 x 1,500 tons/day blast furnaces, convertersand hot strip mill.

ANNEX 3Page 1
FUJI IRON & STEEL CO., LTD.
AdJusted Profit & Loss Statements(I million)
Apr. '54- Apr. '55- Apr. '56- Apr. t57- Apr. t58-Mar. '55 Mar. t56 Mar. 157 Mar. t58 Mar. t5Q
ibt Sales 56,404 77,388 98,177 102,791 90,525
Operating ExpensesCost of sales excludlng depreciation 46,420 62,492 79,427 79,857 72,132Noreal Depreciation 4,113 4,013 3,999 4,693 5,992General Administrative and Selling Expenses 3.182 3.928 h 85,158 5.34
53,715 70,433 88,265 89,708 83,471
Operating Income 2,689 6,955 9,912 13,083 7,054Non-operating Income 873 326 358 1.020 825
Gross Income 3,562 7,381 10,270 14,103 7,879
Non-operatirg ExpensesInterest 2,788 2,520 1,944 2,257 3,682Other 49°A 1,9 A. 1,602 1.208
Net Inccme before Taxes 284 3,463 6,552 10,244 2,929
Income Taxes 520 1,135 2,060 2,400 1,980
Net Incaoe (236) 2,328 4,492 7,844 949
Surplus and Reserves at beginning of year 23,500 33.165 33.644 3569 38,422
Available for Appropriation 23,244 35,493 38,136 43,537 39,371
Surplus Appropriations:Dividends 420 872 1,101 1,560 2,171Officerst Bonus 9 11 17 20 19Additional Depreciation (568) 497 683 1,734 (1,070)Miscellaneous Adjustments (including changes
in revaluation reserve and capital surplusreserve) (9.762) 6 642 1.801 371
Surplus and Reserves at end of year 33.165 22.4 3,69 JS22 37.880
Net Income before Taxes and Interest 3,072 5,983 8,496 12,501 6,611Times Total Interest Covered 1.1 2.4 4.4 5.5 1.8
Net Incame after taxes, before depreciationand interest 6,665 8,861 10,435 14,794 10,623
T1'mes Debt service Covered 0.9 0.9 1.5 2.6 2.3
Earnings per share (after taxes)9' X (2.81) 13.9 17.3 30.2 2.4Dividends per share Y 5.0 6.o 6.0 6.0 6.oTotal Retained Earnings and Depreciation 3,448 5,458 7,373 20,957 4,751
J/ See page 3 for adjustments2/ Eamnings per share are based on nuniber af shares outstanding at the end of the year.

ANNEX 3
Page 2
FUJI IRON & STEEL CO. ,LTD.
Adjusted Balance Sheets(Y million)
March 31, March 31, March 31, March 31, March 31, March 31,1954 1955 1956 1957 1958 1959
Assets
Cash and Bank Deposits 7,996 7,887 4,090 5,455 7,076 6,885
Notes Receivable 6,810 6,850 10,861 1,792 1,903 1,309Accounts Receivable (sales on credit) 4,253 3,436 3,887 3,716 4,356 4,090Less: Reserve for Bad Debts 55 75 139 209 297 385
Total Receivables 11,008 10,211 14,609 5,299 5,962 5,014
Inventories 17,791 16,904 17,818 26,448 35,316 34,859
Other Current Assets 6.625 6.350 6.242 4,735 4,752 5.565Total Current Assets 43,420 41,352 42,759 41,937 53,106 52,323
Fixed Assets 41,057 51,861 54,086 66,71O 84,867 102,345
Less: Depreciation (including special repairs) 7.790 I1.241 15.912 20797 26.869 31.884
Net Fixed Assets 33,267 40,620 38,174 45,913 57,998 70,461
Investmentsand other minor assets 1,945 2,704 4,364 5,662 6,914 10,059
Total Assets 7B.632 84.676 85,297 93,512 118.018 132.843
Liabilities and Equity
Current Liabilities other than Short-termLoans 31,406 23,593 23,532 28,753 33,524 28,424
Short-term Loans 8,931 11,1 6302 3.13 856 16075
Total Current Liabilities 40,337 34,783 29,834 31,889 48,380 44,499
Other Long-term Debt 13,248 15,455 12,522 10,694 16,719 26,822Bonds 4,436 5,277 5,986 5,666 6,117 7,618Less: Maturing within 12 months 708 8.204 5.0s9 ._I4_2 4.620 32 976
Total Fixed Liabilities 10,595 12,528 13,419 12,930 18,216 30,464
Total Liabilities 50,932 47,311 43,253 44,819 66,596 74,963
share Capital 4,200 4,200 8,400 13,000 13,000 20,000Surplus and Reserves 23,500 33165 33 644 35,623 38.422 37.880
Total Equity 27,700 37,365 42,044 48,693 51,422 57,880
Total Liabilities and Equity 78,632 84,676 85,297 93,512 118,018 132,843
Notes Receivable Discounted (12,099) (10,538) (6,471) (3,765) (3,761) (4,430)Guarantees on loans - - - - (3,773) (4,184)
Ratios:Current Assets/Current Liabilities 1.08:1 1.19:1 1.43:1 1.32:1 1.10:1 1.18:1Current Assete/Current Liabilities
(excluding short-term loans) 1.38:1 1.75:1 1.82:1 1.46:1 1.57:1 1.44:1Long-term Debt/Equity 28:72 25:75 24:76 21:79 26:74 34:66Total Debt/Equity 49:51 46:54 37:63 29:71 42:58 47:53Total Debt (including guarantees)/Equity - - - - 45:55 49:51
Note: See page 3 for adjustments

ANNEX 3Page 3
F3TJI IRON &c STEEL CO. LTD.
NOTES
Ad.justments to Incoine Statements
Fuji's formal income statements have been adjusted in accordancewith conservative practice used in the United States:
- "Cost of sales" include all operating expenses suchas interest on payable and discount charges onreceivables.
- "Normal depreciation" is an amount of depreciation whichwould be adequate to depreciate the facilities over theireconomic life. The difference between "ordinary deprecia-tion" plus "special depreciation" as peimitted by tax lawand "normal depreciation" as taken here, is shown under"additional depreciation" in the surplus appropriation.
- "Interest" shown in "non-o-erating expenses" includes onlyinterest on bank debt and bonds.
- "Miscellaneous adjustments" include all transfers to andfrom reserves which are considered part of equity, suchas Employees Retirement Reserve, Price Fluctuation Reserves,etc.
Adstments _to Balance Sheets
Fuii's formal balance sheets have been adjusted in accordancewith conservative practice in steel companies in the United States:
- Long-term debt maturing within 12 months has been deductedfrmm fixed liabilities and added to current liabilities.
- Dividends and officers' bonus as well as estimated taxesto be paid on ending period's earnings, currently carriedin equity in Japanese practice, have been transferred tocurrent liabilities.
- Reserve for bad debts is deducted from Accounts and NotesReceivable.
-"Money received in advance fron customers" is deducted fromcurrent liabilities and from inventories.
- Receivables due in more than 12 months are included in "In-vestments" and are not in current assets.
- Spare parts are accounted with the corresponding fixed assets,and depreciated accordingly.
- The company finds no need to set aside a reserve for SpecialRepairs, but charges them to operation.

ANNEX 3Page 4.
FUJI IRON & STEEL C0., LTD.
Comments on Fi-nancial Records
Inventories
"last in, first out method" of valuation of inventories is usedexcept for "operating supplies" which represent a small proportion of thetotal and which are carried at average cost or market, whichever is lower.At September 1958, the book value of inventories was at 94% of the marketvalue at the same date. The proportion has been consistently lower onprevious dates.
Total inventories amounted to Y34,859 million on March 31, 1959,over 38% of sales in the preceding year. This proportion was higher thanfor all preceding years (lowest at March 31, 1956, when inventories repre-sented about 25% of annual sales). Almost 36% of inventories were rawmaterials, 32% goods in process, 7% finished products and 27% operatingsupplies. These proportions were not significantly different from that ofother years. Inventories, as usual in Japan, Iun much higher than is cus-tomary for the steel industry in the United States, where they vary from15% to 18% of sales.
Receivables
Total receivables decreased sharply three years ago and have re-rained low since then. Year-end receivables represented 37% of the year'svales in 1954/1955 but only 9.4% of the year's sales in March 1958 and 10.4%in March 1959. For reference, the corresponding figure is about 8% in theUnited States. This is most remarkable because the tight money policy pre-vailing since June 1957 might have been expected to put some pressure on thecompany from its customers. It shows the reliability and financial strengthof Fuji's wholesalers. Fuji has always been able todiscount a substantial partof its total receivables in the past.
Working Capital
Net working capital excluding short-term debt is rather low comparedto other steel companies. It is now up to 26.4% of the year's sales, but itwas as low as 13.4% of sales at March 31, 1957. It ran up to over 42% forsome other Japanese steel companies, who do not enjoy Fuji's financiallystrong wholesalers. Net working capital for U.S. steel companies would beabout 22% of sales.

ANNEX 3Page 5
Short-term Loans
Short-term loans have increased very substantially in the pasttwo years. About 10.7 billion waa required to finance the increased work-ing capital, and a relatively small amount, about Y2.2 billion, was used forfixed investments. It is recalled that short-term loans are usually rolledover regularly for a considerpble time in Japan and should be considered moreas a fixed liability than as a current liability.
Fixed Liabilities
Fixed liabilities also have increased by 136%, from Y12,930 millionon March 31, 1957 to Y30,464 million on March 31, 1959. This increase wasrequired to carry on the heavy construction program undertaken by Fuji.

ANNEX4
FUJI IRON & STEEL CO.. LTD. ae.
E.penditures on Fixed Asset,s for Pro.ectsincluded in the Second Modernization Program
and completed between March 31, 1956 ar,d March 31, 1959
ExpendituresTotal Cost $ Million after 1X million eqdivalent Aprill1199
Hirohata Works
Reconstruction of Blast FurnaceNo. 1 to 1,350 t/d 533 1.5
Oxygen plant - Soaking Pit No. 7auxiliary furnaces 2,495 6.9 2l41
,-Reversing plate mill, 160" wide 10,455 29.1 761-,-Reversing cold strip mill, 80" wide 1,847 5.1 180*Gontinuous annealing furnace 1,574 4.4 332
Hot dip tinning line 770 2,1 -Electrolytic tinning line 2,462- 6.8 120
20,136 55.9 1,634
Muroran Works
Rc,construction of Blast FurnaceNo. 2 to 1,000 t/d 697 1.9
Sintering plant, 1,000 tons/day 792 2.2Reconstruction of Coke Plant
No, 2 - 73 ovens 1,055 2.9 35O-ygen plant, dust precipitator 1,669 4.6 83Semi-continuous hot strip mill., 56", wide 8,616 24.0 84Modernization of wire rod mill 844 2.3 237
13,673 37.9 439
•amaijflshi Works
Reconstruction of Blast FurnaceNo. 10 to 1,000 t/d 1,012 2.8 186
Expansion of raw material yard 359 1.0 _Ccnstruction of Coke Plant No. 1(30 ovens) 671 1.9 34
Expansion of soaking pits 500 104 -THodarnization of large section mill 1,929 5.4 182Silicon sheet mill 37 0.1 13Stockyard expansion 71 0,2 _
4,579 12.8 415

ANNEX 4Pege 2
FUJI IRON & STEEL CO.. LTD.
ExpendituresTotal Cost $ Million afterX million equivalent April 1,19592!
(Y million)
awasaki
*Cold forming mill and minor equipment 132 o.4 32
132 o.4 32
teneaials and Repairs 8,276 23.0
Total L6,796 130.0 2,520
P Projects financed with Export-Inport Bank loan.
I/ Included in Total Cost.

ANNEX 5Page 1
iIARlET PROSPECTS OF THE JAPANESE STEEL LNDUSTRY
Development of the Japanese Steel Industry
The Japanese steel industry dates back to the beginning ofthe century, and expanded considerably during the first world war, butas late as 1924, produced only one million tons of crude steel, By1930, however, production had increased to 2e3 million tons, and themore rapid expansion of the 1930's and early 1940's, when armament andwar demand provided a growing market, carried it to a peak of 7,65 mil-lion tons in 1943.
At the close of the second world war, the industry was vir-tually prostrate. War damage and a lack of irmiported iron ore, cokingcoal, and scrap, on which the industry depends heavily, reduced produc-tion to a little over half a million tons in 1946. Although damagedfacilities were repaired promptly, and foreign aid and Korean war de-mand made possible a steady and rapid expansion, it was not until 1953that production recovered to the previous high level. In the next fouryears, however, output shot upward, and by 1957 had reached 1206 milliontons. The first break in the hitherto uninterrupted post-war rise camein 1958. The recession was relatively mild, with production falling byonly half a million tons, and was followed by a sharp recovery in 1959.On the basis of figures for the first half of the year, it seems likelythat production will exceed 15 million tons in 1959. Production in thefiscal year 1959 (April 1, 1959 - March 31, 1960) is estimated at 16.2mIllion tons (see Table 1). In 1958, Japan ranked sixth in the world asa steel producer, following France, which had a production of 14.6 mil-lion tons.
The 65% increase in output between 1953 and 1957 and the 25%increase in 1959 alone were made possible by a massive expansion program(the first Modernization Program, initiated in 1951 and completed in 1955)accompanied by improvements in facilities that narrowed the technologicalgap between Japan and other leading steel producers and i1rproved the com-petitive position of the Japanese industry both in costs and quality ofproduct.
The Second Modernization Program
The rapid increase in demand for Japane.ss stee-l in the middle19501 s encouraged the industry to continue expansi on and modernization.A socalled Second Iivodernization Program was initiafted in 1956c. Scheduledfor completion by fiscal 1962, the program is ain._d at 1) exnarding steel-making capacity to 205 million tons; 2) expauidirng pig ir^n c.;-acity to12 mi.llion tons, to make possible the pl aned increase in stee.l. productionwithout a corresponding increase in the industryis requirements for scrapa large fraction of which must be imported, mainly from the US; and 3) com-pleting the industryts program to modernize rolling mills, particularly for

ANNEX 5Page 2
flat products. By the close of fiscal 1962; hot strp mill capacityis expected to rise to five million tons, compared with 850,000 tonson March 31, 1953 and 1.5 million tons at the end of 195$, and coldstrip mill capacity to three million tons, compared with 160,000 tonson iMarch 31, 1953 and 1.2 million tons at the end of 1955.
Steel Demand Prospects
Whether denand for Japanese steel will continue to growrapidly enough to permit operation of the industry's greatly expandedfacilities at a relatively high rate depends, of course, upon growthprospects both at home and in Japan's principal export markets. Therapid increase in demand for steel in the 1950's was one aspect of therapid expansion of the Japanese economy in this period; between 1951and 1958 Japanese gross national product increased at an average annualrate of 7s5% 1|/,
All the indications are that growth prospects are still good.Although there is likely to be some slowing down in economic growth com-pared with the mid 1950ts, over the next few years, the average annualincrease in the gross national product is not likely to fall below 5%.An increase of this magnitude should be accompanied by a substantial in-crease in domestic demand for steel. Export prospects are more diffi-cult to estimate. However, the successful promotion of exports byJapanese steel producers in the two recession years 1954 and 1958, whendeclining domestic demand provided both incentive and capacity for in-creased exports, indicates the industry's enterprise and its ability tocompete in foreign markets.
Estimates of Demand for Steel, 1959-1962
1. Demand for Crude Steel, 1962
On the assunptions that gross national product will show anaverage annual increase of 5% over the period fiscal 1956 - fiscal 1962,that domestic demand for carbon steel rolled products (which accountsfor about 80% of total demand for crude steel) will show a related in-crease of 7% per year, that domestic demand for special steel rolledproducts and cast and forged steel will increase proportionately, and,finally, that exports of carbon steel rolled products will rise to 1.4million tons, as against 1.3 million tons in fiscal 1958, it is estimatedthat total demand for crude steel will amount to 17.8 million tons byfiscal 1962. The estimates of domestic and export demand for carbonsteel rolled products and of domestic demand for special steel rolledproducts and cast and forged steel and their crude steel equivalentsare given in Table 2 and the underlying assumptions are set forth indetail in the notes to that table. In view of the probable resultsin 1959, the estimates seem reasonably conservative,
1/ Based on a least squares line fitted to values for gross national pro-duct at constant prices (preliminary estimate for 1958).

ANMJEX 5Page 3
2, Demand for Individual Carbon Steel Rolled Products 1962
The estimate of domestic demand for carbon steel rolled pro-ducts in fiscal year 1962, given in Table 2, was based on an estimateprepared by the Japanese IMinistry of Industry and Trade (MITI), adjustedin the light of Bank assumptions as to future Japanese economic growthwhich are somewhat more conservative than the assumptions adopted byAITI. MITI's estimate of total demand for carbon steel rolled productswas supported by an alternative estimate built up from estimates of de-mand for individual products by major end use. which corresponds veryclosely to its first estimate.
MITI's estimates of dermand for individual carbon steel rolledproducts in fiscal 1962 show a distribution of total demand very similarto the actual distribution in recent years, Such changes as appear inthe proportion of total demand accounted for by individual products seenreasonable: e.g. a decline in the proportion of total demand for carbonsteel rolled products accounted for by plates, expected to result froma decline in shipbuilding activity, and increases in the proportion oftotal demand accounted for by thin flat products (sheets, tinplate andsilicon Zeilectrical7 sheets) expected to result from respectively: greaterthan average increases in the output of such heavy sheet-using productsas automobiles and other consumer durables, the output of canned foodsfor domestic use and export, and the output of electrical machinery.
MITI's estimates of demand for individual carbon steel rolledproducts were therefore used to determine the distribution of total de-mand among products, and the resulting percentages were applied to theBankts estimate of total demand given in Table 2.
3. Demand for Carbon Steel Rolled Products, 1959-61
To arrive at estimates of demand for carbon steel rolled pro-ducts in fiscal 1959-61, it was assumed arbitrarily that demand for eachproduct would increase at a constant rate from the actual level in 1958to the estimated level in 1962. The estimate for 1959 is, of course,well below the probable actual level for that year, and the estimatesfor 1960-62 are probably on the conservative side. These estimates arecompared in Table 3 with actual demand for the products in 1953-58.
Operating Rates, 1959-62
A comparison of estimated demand with estimated capacity in1959-62 indicates that even on our conservative assumptions as to demandthe industry should be able to operate at rates comparing favorably withthe operating rates in the prosperous years 1953-57.
Prices
Prices of raw materials rose steadily and substantially fromi954 to 1957 but declined sharply in 1958. The 1958 declines were at-tributable in large measure to a decline of as much as 50% in ocean

ANNEX 5Page
freights which account for a large fraction of the delivered cost ofJapanese raw materials. However, there were also declines in the fobprices of domestic ore, imported and domestic coking coal and importedand domestic scrap. It seems prudent to assume that ocean freights mayreturn to their earlier level and that there will also be a recovery inthe fob prices of raw materials. However, average raw material costsshould be lower than in 1954-58 as a result of the expected replacementof some of the higher priced imported iron ore and coking coal by ma-terials from lower cost sources and a reduction in the cost of transpor-ting ore to Japan by the substitution of Japanese industry-owned vesselsfor chartered vessels.
In estimating future prices of finished products, however,it seems prudent to assume that competition will oblige producers topass on to their customers at least part of their savings on raw ma-terials, and that, on the average, the margin between costs and priceswill not exceed the margin earned in 1954-58.
Estimates of Demand for Steel after 1962
As a basis for financial forecasts for the years beyond 1962,it has been assumed roughly that crude steel production will increaseat a rate of 5% per year after 1962. This estimate seems reasonablyconservative when compared with the actual increase of 13% per year from1953-55 to 1956-58 and the estimated increase of 8% per year from 1956-58to 1962.

ANNEX 5
TABLE 1
Japan: Production, Imports, Exports, and Apparent Home Supply of Steelin Crude Steel Eqcxivalent, 1939, 1943, 1946, 1950-58
(Thousand Metric Tons)
Production Imports Exorts Apparent Home Supply
1939 6,696 506 1,069 6,133
1943 7,650 159 125 7,684
1946 557 - 1 556
1950 4,839 2 727 4,1141951 6,502 33 1,269 5,2661952 6,988 31 1,988 5,0311953 7,662 124 1,035 6,7511954 7,750 106 1,465 6,3911955 9,408 82 2,305 7,1841956 11,106 283 1,570 9,8201957 12,570 1,584 1,219 12,9351958 12,118 200 2,1L6 10,202
1957 Jan-Mar. 3,103 363 282 3,184Apr-June 3,366 529 244 3,651July-Sep. 3,252 595 282 3,565Oct-Dec. 2,819 97 411 2,505
1958 Jan-Mar. 2,872 60 430 2,502Apr-June 2,987 40 508 2,519July-Sep. 3,040 63 491 2,612Oct.-Dec. 3,217 37 687 2,567
1959 Jan. (p.) 1,153
Source: 1939, 1943, 1946, 1950-57 - Japan Iron & Steel Federation, Annual Report.1957 Quarterly data - Production: Japan Iron & Steel Federation, Monthly Statistics
Exports and Imports: Prorated on the basis of data fromMonthly Statistics on exports of semi-finished steel,finished products and secondary products.
1958 - Annual and quarterly data from monthly data given in Monthly Statistics onproduction of crude steel and exports and imports of semi-finished steel,finished products and secondary products. Exports and imports converted intocrude steel equivalent on basis of relationship between Monthly Statisticsand Annual Statistics data for earlier years.
1939, 1943, 1946, 1950-57 Data)Exports and imports cover semi-finished and finished steel and secondary productsconverted into crude steel according to the U.N. method.

ANNEX 5Page 6
TABLE 2
Japan - Demand for Steel, FY 1962
(thousand tons)
Carbon Steel Rolled Producte:Domestic demand 11,500Exports 1 400
Less Rerolled 460
Total (finished basis) 12,440
Carbon Steel Rolled Products (hot rolledbasis) 12,750
Special Steel Rolled Products 824Cast and Forged Steel 530
Crude Steel:For carbon steel rolled products 15,680For special steel rolled products 1,270For castings and forgings 870
Total 17,820
Notes
Domestic Demand for Carbon Steel Rolled Products
Domestic demand for carbon steel rolled products in fiscalyear 1962 was estimated by the Japanese Ministry of Industry and Trade(IIlITI) in a study prepared for the Bank in December 1958, at 12.3 mil-lion tons. The underlying assumptions were as follows: 1) an annualaverage increase in gross national product over the six-year periodfiscal 1956 - fiscal 1962 of 5.85%; 2) an associated average annual in-crease in industrial production over the same period of 8.2%; and 3) anaverage annual increase in domestic demand for carbon steel rolled pro-ducts over the same period equal to the increase in industrial production.
The assumed rates of growth in gross national product andindustrial production were estimates by the Japanese Economic PlanningAgency, embodied in its Long Range Plan (1956-62). The assumption thatdomestic demand for carbon steel rolled products would increase at thesame rate as industrial production was based on past relationshipsshown between these two factors in Japan and other leading industrialcountries.
Because the wide swings that characterize demand for steelmake it difficult to select an appropriate base year for projections,the estimate of domestic demand for carbon steel rolled products in

ANNEX 5Page67
fiscal 1962 was calculated by correlating the index of mining andmanufacturing production and domestic demand for carbon steel rolledproducts for the fiscal years 1951-58 and applying the resulting re-gression equation to the estimated 1962 value for the index of miningand manufacturing production (calculated by assuming an increase of8.2% per year from the actual value in fiscal 1956) to dezive an esti-mate of domestic demand for carbon steel rolled products in fiscal 1962.In effect, however, this was equivalent to assuming an increase of 8.2%per year in domestic demand for carbon steel rolled products startingfrom the "normal" value for fiscal 1956.
I4ITIts assumption that domestic demand for carbon steelrolled products should increase at a rate equal to the rate of increasein industrial production seems reasonable for a country at Japan's cur-rent stage of economic development. The implied relationship betweenthe assumed rate of growth in gross national product and the estimatedrate of growth in domestic demand for carbon steel rolled products oflsl.4 (5:85:8.2) seems reasonably conservative; between fiscal 1951 andfiscal 1958, the ratio between these two rates of growth was 1:1.67 l/eHowever, the assumed rate of growth for gross national product (5.8 lper year from fiscal 1956 to fiscal 1962) is higher than the estimateused for purpose of this report (roughly, 5% per year).
The estimate of domestic demand for carbon steel rolled pro-ducts in fiscal 1962 shown in Table 2 (11.5 million tons) was arrivedat, therefore, on the assumption of an increase of 7% per year from the"1normal" value for demand in fiscal 1956, that is of an average annualincrease 1.h times the increase of roughly 5%G per year in gross nationalproduct.
Domestic Demand for Special Steel Rolled Products
Domestic demand for special steel rolled products in fiscal1962 was estimated by i4ITI at 870,000 tons. This estimate was arrivedat by applying to MITI's estimate of domestic demand for carbon steelrolled products for fiscal 1962 a regression equation arrived at by cor-relating actual values for domestic demand for carbon steel rolled pro-ducts and for special steel rolled products for the years 1951-58. Inview of the high correlation shown between these two series, the methodseemed acceptable, However, the Bank reduced iMITI's estimate propor-tionately to the reduction made in its estimate of domestic demand forcarbon steel rolled products, to 82h,000 tons.
Domestic Demand for Cast and Forged Products
MITI's estimate of domestic demand for cast and forged productsin fiscal 1962 of 560S000 tons was similarly calculated by applying to itsestimate of domestic demand for carbon steel rolled products for fiscal
I/ Based on least squares trend lines fitted to each of these series.

ANNEX 5Page8
1962 a regression equation derived by correlating actual values forthe latter in fiscal 1951-58 with actual values of demand for cast andforged steel. As a result of an adjustment similar to the adjustmentmade for domestic demand for special steel rolled products, MiITI's esti-mate was reduced to 530,000 tons.
Exports of Carbon Steel Rolled Products
On the basis of an analysis of past exports by product andmarket and of prospects for the next few years, TKITI estimated exportsof carbon steel rolled products in fiscal 1962 at 1.4 million tons. Theestimates allow for a prospective decline in exports to India, one ofJapan's leading markets, on the completion of its current expansion pro-gram, and on the whole seem reasonably conservative, in view of the factthat they imply an overall increase of only 100,000 tons from the actuallevel of exports in fiscal 1958.
Rerolled Steel
The estimate of production of rerolled steel is MITI's esti-mate. It compares with an actual (estimated) consumption of rerolledsteel in fiscal 1958 of 450,000 tons (domestic - 360,000, imports -90,000)
Crude Steel
Total demand for carbon steel rolled products (domestic plusexport minus rerolled) was converted to a hot-rolled basis, using con-version factors supplied by IVITI, Conversion factors supplied by iITIwere used in converting estimated demand for carbon steel rolled pro-ducts (on a hot-rolled basis), for special steel rolled products and forcast and forged steel to their crude steel equivalents.

ANNEX 5
TABLE 3
Japan: Domestic Demand and Exports of Carbon Steel Rolled Prcducts, Actual, Fiscal Years, 1953-58, Estimated 1959-62g
(th. tons)
Rails Shapes Bars Wire Rods Hoops' Plates Sheets Tin Plate Silicon Sheets Steel Tubes Others Total
(TTIres)
1953 Total 298 629 1 106 512 172 1,365 839 123 76 442 27 5 589Domestic 275 fT5 1,5 307 i66 1,193 79 112 X 7- 27 5,207Export 23 14 55 5 6 172 L2 11 2 57 - 382
1954 Total 299 514 1 287 613 118 1 226 1 214 152 65 425 44 5 957Domestic 1W T3 I 7 5 1,1211 I13T 35Export 111 24 242 17 10 250 93 18 10 57 - 832
1955 Total 319 725 1 346 740 120 1,859 1 301 207 63 499 74 7 253Doaestic 195 69Z0 f,O-70 8BT 1,70i5 1i,16 172 Tfl 1 7 m
Export 124 35 260 35 34 154 135 35 5 83 - 900
1956 Total 385 1 027 1 672 747 163 2,504 1 328 321 117 617 75 8 956Domestic U 7 E 965~ 1 ,S73 U729 2,322 9 15 T7Export 111 62 99 18 16 182 30 34 2 69 - 623
1957 Total 476 1 139 1 813 757 149 2 753 1 479 276 135 561 84 9 622Domestic 3217 1,063 E 7 232 i T Export 149 76 127 18 4 150 75 44 9 34 - 686
1958 Total 487 1,009 1 801 900 113 2,109 1 827 280 96 562 80 9,264Domestic ,2b7 99 w ZT 90 1,673 Tlt 77 75 B5 7,946Export 230 60 275 92 23 340 154 44 18 82 - 1,318
1959 Total 494 1,078 1,936 943 132 2,333 1,960 323 117 643 85 10,098
1960 Total 500 1,153 2,081 988 154 2,580 2,103 373 143 737 91 10,903
1961 Total 507 1,232 2,237 1,03h 179 2,853 2,257 431 174 844 97 11,845
1962 Total 514 1,317 2 416 1 084 209 3 155 2 425 497 214 966 103 12 900Domestic 3 1 1,242 !2,11b m 2,,75 77j7 TgIT 10 T T13Export 158 75 300 95 25 292 250 60 30 115 - 1,400
Sources: 1953-57 - MITI Report, Dec. 19581958 - FuJi Submission to Bank, April 1959 (MITI figures)1958-62 - Domestic, IBRD estimates; Exports, MITI estimates, Dec. 1958.
/ Estimates for 1959-62 computed as follows:1) Total domestic demnd in 1962 estimated by assuming a 7g per year rise fron the "nornal" level of demand in fiscal 1956, as estimated by EiTI (see Table 3); this is
consistent with the assumption that gnp will rise at a rate of 5% per year over the period 1956-62.2) Estimated domestic demand for carbon steel lolled products in 1962 distributed among individual products in the same proportions as shown in MITI's estimates.3) Total demand (domestic plus export) for individual products in 1959-61 estimated on the assumption that demand for each product will increase at a constant rate from
the actual level in 1958 to the estimated level in 1962.
/ Hoops for sale, not including hoops for welded pipe.

ANTNEX 6Page 1
FUJI IRODr & STEEL C0 LTD.
Raw Materials, Utilities, Labor
To produce 2,129,000 tons of pig iron in 1958, Fuji con-sumed 1,757,000 tons of imported iron ore, Thich were blended with870,000 tons of domestic iron ore and 566,000 tons of iron sand,pyrite cinder, etc. The blast furnaces operated with 58% sinteredore. In 1962, the pig iron production is forecast at 3,213,000 tonsfor wThich 3,179,000 tons of imported iron ore will be required, plus883,000 tons of domestic iron ore and 768,000 tons of pyrite cinder,iron sand, etc. Blast furnaces are planned to operate on 62% sinteredore. The increase in Fuji's iron ore requirements is only part of theexpected increase of the entire Japanese industry. Imports vill comefrom Malaya (27%), India and the Philippines (13% each), Goa (ll%)and miscelaneous small suppliers (36%). The industry is taking stepsto assure that these increased requirements will be met. A Japanesemission concluded last year an agreement with the Indian Governmentwhich will secure two million tons per annum of Rourkela ore for Japanafter 1962. Negotiations are under wlay to secure a further four milliontons from the Bailadila mines (India).
Fuji's blast furnaces operate vith a blend of 46% domesticcoking coal (mainly low-grade coking coal) and 54% imported, coal(mainly high-grade imported from the UTnited States). Its require-ments for imported coking coal in 1962 when it expects to produce3,213,000 tons of pig iron, wll be 1,775,000 tons (of which a littleless than half are expected to come from Australia or sources otherthan the U.S.A.). The company should have no difficulty in importingthat quantity of high-grade coking coal from the United States andAustralia, ihich is becoming an increasing and cheaper source of cokingcoal.
Total consumption of purchased scrap in Fuii's steel furnacesamounted to 302,000 tons in 1958, to produce 2,306,000 tons of steelingots - pig iron/total scrap ratio of 69.2%. In 1962, for a scheduledproduction of 3,441,000 tons of ingot steel, purchased scrap will amountto 290,000 tons - pig iron/total scrap ratio of 72.6%. As at present,half of the total scrap will come from imported sources, mainly fromthe U.S.A.
Limestone annual requirements rill increase fron the present649,000 tons to about 1,023,000 tons in 1962. The company should haveno difficulty in securing that amount from domestic sources.
Fuji is spending over Y4 billion ($ll.l million equivalent)to expand its power plant at Hirohata, and its nower distribuition and

A1NFX 6Page 2
water supply at both Hirohata and IMurroran, in order to take care ofthe expected requirements.. Arrarngenents have been made with the KansaiPower Co., the Hokkaido Power Co., the Tohokxu Power Co. and the TokyoPow^er Co. for the purchase of additional po,.rer for its four 'rorks.
Transportation facilities will be strengthened at the fourworks, Harbors at Hirohata and Muroran w^ill be deepened and enlarged,and unloading equipment added to enable these vorks to receive ironore from modern carriers up to 45,000 tons. Governmernt subsidies forthese two ports will amount tro !1,110 million out of a total cost of95,810 million.
Additional labor requ1remerits are limited to only about1,100 new wTorkers, as productivity will greatly increase. Fuji istaking steps to train these workers during the construction period.At the same time, Fuji is hiring from 40 to 70 engineers each yearvhich should be adequate to take care of all new facilities,

FUJI IRON a STEEL CO.- LTD. '7
Constructicn Schedule
Construction Period
Start CnrnpletiofHirohata -
*Blast Furnace No. 3 - Raw Materialpreparation and reconstruction ofcoke plant No. 1 Jan. 1959 Nov. 1960
*Sintering plant Jan. 1959 Sept.1960.LSlabbing mill Jan. 1959 Sept.1960*Services Oct. 1957 Nov. 1960Port Enlargement Apr. 1959 Mar. 1962Reheating furnace for plate mill Jan. 1959 Sept.196oCoke oven gas separator Oct. 1959 Mar. 1961E' ectrolytic galvanizing line Apr. 1959 Mar. 1960
IMuroran
Reconstruction of Blast Furnace No. 1 July 1959 Sept.1959Construction of open hearth No. 6 Feb. 1959 Jan. 1960Soaking Pit expansion Feb. 1959 Feb. 1960Construction of slabbing mill Feb. 1959 Feb. 1960Additional facilities for hot strip mill Dec. 1958 Feb. 1960Cold Strip Uill Apr. 1961 Mar. 1963Modernization of wire rod mill - bar mill Jan. 1960 June 1961Services Apr. 1961 Mar. 1963Port Enlargement Apr. 1959 Mar. 1962Hydrogen separation plant Oct, 1960 Sept.1962
Famaishi
Reconstruction of Blast Furnace NTo. 8 Oct. 1960 Dec. 1960Sintering plant Apr. 1959 Dec. 1960Reconstruction of Coke Plant No. 2 Oct. 1958 Nov. 1959Expansion of steelmaking capacity:
oxygen plant Oct. 1959 Mar. 1961Soaking pit expansion Oct. 1959 Mar. 1961Expansion of large section mill Oct. 1959 Sept.1960Silicon sheet equipment Apr. 1958 Sept.1959Modernization of mediin section mill Apr. 1960 Sept.1961Services Apr. 1960 mar. 1962
Kawasaki
Pole manufacturing equipment Apr. 1959 Mar. 1960Cold Forming mill Apr. 1959 Mar. 1961
*Facilities covered by IBRD Loan
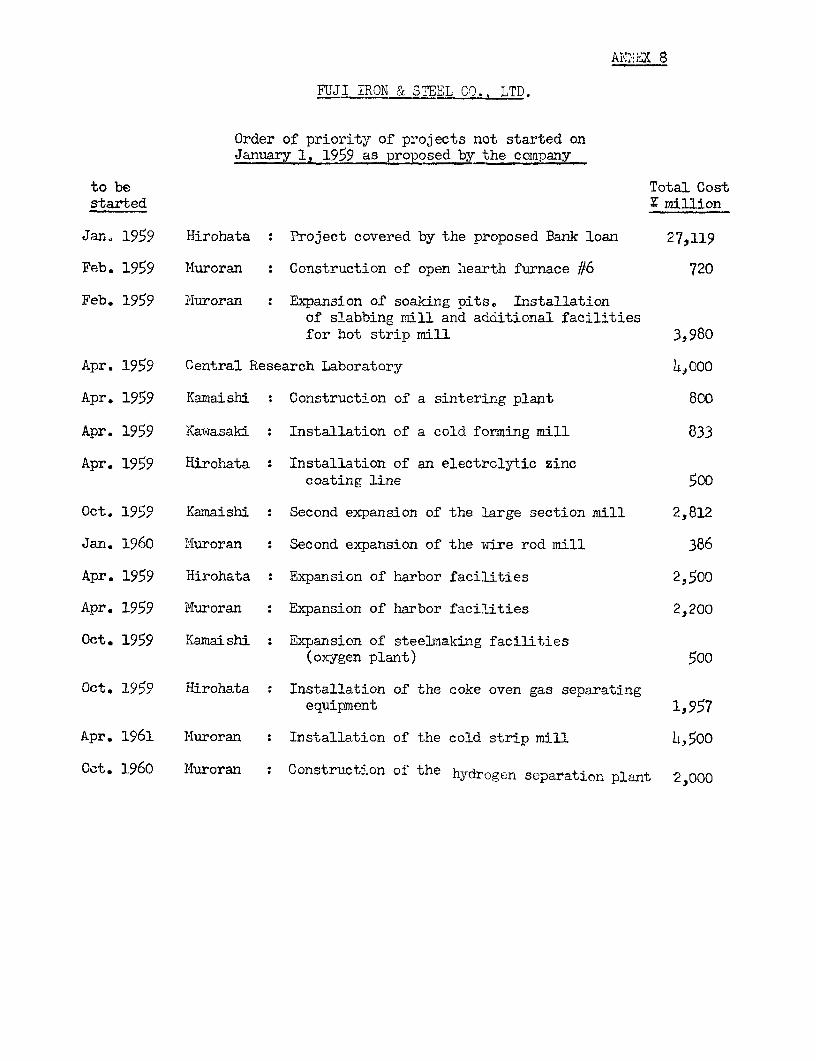
Ai"-EX 8
FUJI IRON & STEEL CO.. LTD.
Order of priority of projects not started onJanuary 1, 1959 as proposed by the company
to be Total Coststarted X million
Jan. 1959 Hirohata : Project covered by the proposed Bank loan 27,119
Feb. 1959 Muroran : Construction of open hearth furnace #6 720
Feb. 1959 Huroran : Expansion of soaking pits. Installationof slabbing mill and additional facilitiesfor hot strip mill 3,980
Apr. 1959 Central Research Laboratory 4,000
Apr. 1959 Kamaishi : Construction of a sintering plant 800
Apr. 1959 Kawasaki : Installation of a cold forming mill 833
Apr. 1959 Hirohata. Installation of an electrolytic zinccoating line 500
Oct. 1959 Kamaishi : Second expansion of the large section mill 2,812
Jan. 1960 .Iuroran : Second expansion of the wire rod mill 386
Apr. 1959 Hirohata : Expansion of harbor facilities 2,500
Apr. 1959 Muroran Expansion of harbor facilities 2,200
Oct. 1959 Kamaishi : Expansion of steelmaking facilities(oxygen plant) 500
Oct. 1959 Hirohata : Installation of the coke oven gas separatingequipment 1,957
Apr. 1961 Muroran : Installation of the cold strip mill 4,500
Oct. 1960 Huroran : Construction of the hydrogen separation plant 2,000

FUJI IRON & STEEL CO.,.LTD.
Cost Estimates
.Uul59e-i 1962le.Expenditures
Amount spent from April 1, Expendituresbefore 1959 to V} million after
Total Cost March 31. 1259 March1, 9__62 e Livalent March 31. 1962-- million - (Y million)
Under IBRD Loan(To be comipleted by Nov. 1960)
HirohataBlast furnace No. 3 3,346 1 3,345 9.3 -Preparation of raw materials 2,293 - 2,293 6.4 -Sintering Plant 2,000 t/d 1,508 1,508 4.2 _Reconstruction of coke oven Plant 1 1,551 52 1,499 4.2 _2 x 60 tons oxygen converters 4,032 523 3,509 9.8 _Expansion and reconstruction of
soaking pits 1,530 465 1,065 3.0 -Slabbing mill 4)699 6 4,693 13.0 _Expansion of by-product plant 1,129 - 1,129 3.1 -Expansion of power plant 1,428 298 1,130 3.1. -Expansion of water supply 1,618 628 990 2.8 Expansion of transportation facilities 759 144 615 1.7 -Storehouse enlargeiaent 475 29 446 1.2 -Contingency reserve _..24% - _-751 7.6 -
27,119 2,146 24,973 69.4 -Rest of the frogram
HirohataConstruction of steelmaking shop
facilities 2,045 _ 2,045 5.7 -Expansion of harbor facilities 2,500 - 2,500 6.9 -Wide plate mill, reheating furnace 1,105 14 1,091 3.1 -Coke oven pas separator 1,957 - 1,957 5.4 - (
Electrolytic zinc coating line 5t 50 1.4 5Sub-total Hirohata 35,226 2,160 33,066 91.9

ExpendituresAmount spent from April 1, Expenditures
before 1959 to $ million afterTotal Cost 1 .chl 1962 equivalent March L1, 19A62
Rest of Program (cont'd) - million - - - - - - - -
MuroranReconstruction of blast furnace No. 1 850 3 827 2.3Construction of open hearth
furnace No. 6 720 - 720 2.0 -Soaking pits expansion 880 3 877 2.4 _Construction of slabbing mill 2,500 436 2,064 5.7 -Additional facilities for hot strip mmn 600 - 600 1.7 -Cold strip mill 4,500 - 2,000 5.6 2,500Wire rod mill modernization and b miLl 386 - 386 1.1 -Expansion of water and power supply 1,000 - 300 0.8 700Expansion of harbor 2,200 - 2,100 5.8 100Unloading facilities 888 321 567 1.6 -Warehouse enlargement 200 - 57 0.2 143Separation of hydrogen from C.O. gas -1OOO -_ 800 _2.2 1_200
Sub-total Muroran 16,724 763 11,318 31.4 4,643
KamaishiReconstruction of blast furnace Ho. 8 900 - 900 2.5Sintering plant - 1,400 t/d 800 - 800 2.2 -Reconstruction of coke plant No. 2 337 19 318 0.9 -Oxygen plant and dust precipitator 500 - 500 1.4 -Expansion of soaking pits 500 500 1.4Expansion of large sec. mill 2,812 - 2,812 7.8Silicon sheet equipment 125 10 115 0.3Plodernization of medium sectionmill 390 - 390 1.1
Expansion of store yard 640 640 1.7 -Nodification of railroad track 850 850 2.4 -
Sub-total Kamaishi 7,854 29 7,825 21.7 -

ExpendituresAmount spent from April 1, Expenditures
before 1959 to $ million afterTotal Cost March 31, 1959 March 31, 1962 equivalent March 31. 1962-- million - - - - - - - - (; million)
Rest of Program (cont'd)
KawasakiPoles manufacturing facilities 60 26 34 0.1Cold forming mill 833 - 833 2.3 -Central Research Laboratory 4.000 _ 1,800 5.0 2,200
Sub-total ,Kawasaki 4,893 26 2,667 7.4 2,200
Contingency Reserve 6,029 - 4,774 13.3 1,255Renewals and Repairs 31,007 - 11,007 30.6 20,000
101,733 2,978 70,657 196.3 28,098
Payments on Projects com-pleted prior to ilarch 31, 1959 2,520 7.0
73,177 203.3
a

ANNEX 10
FUJI IRON & STEEL CO., LTD.
Proposed Disbursement Schedule
Total Expenditures on Project Prposed as Basis for Bank Loan
$ million1959 1960 Total equivalent--- - - million
Foreign exchange expenditures 632 1,960 2,592 7.2Local expenditures 11,990 10,391 22,381
12,622 12,351 24,973
Proposed Disbursement Schedule of Bank Loan
Foreign exchange 632 1,960 2,592 7.2Local expenditures 3,232 281,6 6,048 16.8
3.864 4,76 8t640 24.0
($ million equivalent):Foreign exchange 1.8 5.4 7.2Local expenditures 8.9 7.9 16.8
10.7 13.3 24.0
Estimat.ed ForeignC rrenc Requirements for For eigExchange Part of theProposed Loan
- - U.S.1000 dollars - - -
U.S. dollars 1,252 4,436 5,688D.M. (in $ equivalent) 502 1,008 1.
Total 1.,754 7.198
Note: Foreign exchange expenditures on the Proiect incurred after April 1,1959 are assumed to be fully reimbursed. A preportion of 2'1% onlocal expenditures after April 1, 1959 are also assumed to be re-imbursed as they are incurred.

FUJI IRON & STEEL 1_0., LTD.
Sales (domestic and export) and shareof the JaDanese market
- - - - - - - - - - - - - actual - - - - - - _ - - - - - - - - - - - - - - - - - - - -forecasts - - - - - - - - - - - -
Fiscal Year: 19 1955 1956 91957i -1958 1959 1900 1961 _ 1962.1,000 1,000 1,000 1,000 1,000 1 000 1,000 1,000 1,000
% Tons % Tons L Tons % Tons % ons L _on _ Tong s Tons L T
Rails 16.3 49 21.9 70 19.7 76 23.9 114 26.9 131 26.9 133 26.9 135 26.9 136 26.9 138
Shapes 13.2 68 14.6 106 13.6 140 14.4 164 11.0 111 12.1 130 12.7 147 12.6 155 13.0 171
Bars 12.6 162 12.3 166 11.2 187 9.2 166 8.0 I4 8.4 162 9.2 192 9.5 213 9.5 229
Wire rods 16.8 103 17.1 127 17.1 128 17.2 131 13.8 124 16.5 155 16.9 167 17.2 178 17.5 190
Hoops 17.6 21 23.3 28 17.2 28 22.1 33 28.3 32 37.8 50 39.0 60 38.6 69 40.0 84
Plates 24.1 295 19.6 365 15.9 399 15.1 416 19.5 412 19.3 449 19.8 511 19.9 566 20.0 631
Sheets 11.5 140 16.6 216 19.8 263 19.4 287 20.9 381 19.3 378 19.1 402 18.9 427 18.6 451
Tin Plate - - - - - - 0.7 2 6.1 17. 17.6 57 18.5 69 19.5 84 18.6 96
Silicon sheets - - _ - - 6 _ 14
Sub total I a 838 14.8 1.078 13. 6 122 14. 6 1.352 L5.4 1 L22 11.
Hoops for pipe 46 61 67 73 108 104 114 115 120
Hot coils for sale - - 8 60 172 231 301 402 516
Semi-finished steelfor sale 1A 421 337 _.27 20 2 1°,4 9- 22
Sub total 392 12 330 48 . 7
Total 1.21560 1.6M 1,____ 9 1 .2 195 1.953 2Q.0 2.192 2_O 2.44 2 2.,3

FUJI IRON & STEEL CO., LTD.
Sales Prices
… - - - - - - - - - - - Domestic - - - - - - - - - - - - - - - - - - - - Domestic - - - - - - - - - - - - Export - - -March 31, March 31, March 31, March 31, March 31, Current 1963 and Current 1960 and
1955 1956 1957 1958 1959 Prices 1960 1961 1962 after Prices after- - - - - - - - - - - -- per ton - - - - - - - - - - - - - - - - - - - - -_ -per ton - - - - - - - - - Tper ton - -
Rail 37 kg. 45,000 47,000 52,000 50,000 48,ooo 50,000 50,000 50,000 50,000 50,000 115 120
Shapes 75 x 75 m/m 37,000 45,000 50,000 45,000 41,000 44,000 44,000 44,000 44,000 44,000 110 115
Bars 19 m/m 35.000 43,000 49,000 44,000 40,000 42,000 42,000 42,000 42,000 42,000 100 105
Wire rod 5.5 m/m 39,000 44,000 49,000 47,000 42,000 44,000 44,000 44,000 44,000 44,000 105 110
Plate 12 m/m 39,000 48,000 56,000 54,000 48,ooo 52,000 52,000 50,000 48,000 48,000 110 115
Cold rolled sheet 0.8 m/m 54,000 60,000 67,000 62,000 57,000 61,000 61,000 59,000 57,000 57,000 150 155
Hot dip tinplate 95 lbs. 110,000 110,000 108,000 108,000 103,000 103,200 103,200 101,200 99,200 99,200 220 225
Basic pig iron 24,000 25,500 30,000 29,000 25,500 z5,500 26,500 26,500 26,500 26,500 - -
Foundry pig iron 25,000 26,500 32,500 31,500 28,000 28,000 29,000 29,000 29,000 29,000
Average price during fiscal Current 1963 andyears (c.i.f.) 15 1 1956 1957 1958 Prices 1960 1961 1962 after
Imported iron ore 4,979 6,217 7,369 8,298 5,694 5,389 6,365 6,286 6,159 6,159
Imported coal (U.S.A.) 6,264 7,855 10,318 11,012 7,473 6,883 9,108 9,288 9,288 9,288
Domestic iron ore 3,824 4,069 4,231 4,437 35,083 3,427 3,484 3,541 3,598 3,598
Domestic coal 6,073 6,092 6,230 7,032 6,560 6,613 6,613 6,613 6,613 6,613
Scrap: Imported 16,204 19,901 27,846 27,443 17,676 21,600 23,400 23,400 23,400 23,400
Domestic 15,977 20,427 25,527 23,901 17,768 20,000 2).,000 21,000 21,000 21,000

FUJI IRON & STEEI CO., LTD.
Return on Sales
Ap- 14 _ Apr._-_-_ tua1- - - - - - - -___ - - -_ - -_ - - - -_ - -_ f o r e c a s t - - - - - - - - - - - - - - - - - -Apr . ' 54- Apr . '55- Apr.'56- Apr. '57- Apr. '58- Apr. ' 59- Apr.' 60- Apr. '61- Apr.'62- Apr. '63- Apr. '64- Apr. '65-Mar.'S5 Mar.'56 Mar.!57 Mar.'58 Mar,'59 Mar.'60 Mar.'61 Mar.'62 Mar.'63 Mar.'64 Mar.!65 Mar.'66
Sales 56,404 77,388 98,177 102,791 90,525 105,286 119,297 131,015 142,096 146,841 152,042 153,475
Net operating income 2,689 6,955 9,912 13,083 7,054 15,572 14,875 16,294 17,421 17,788 18,501 19,179
Return on sales 4.8% 9.0% 10.1% 12.7% 7.8% 14.8% 12.5% 12.4% 12.3% 12.1% 12.2% 12.5%
Return on average deprecilalted investment in ouerat5,n(Y million)
Net operating innome 2,689 6,955 9,912 13,083 7,054 15,572 14,875 16,294 17,421 17,768 18,501 19,179
Net fixed assetsin operation 30,618 38,636 36,559 35,567 45,393 66,954 83,756 102,344 108,876 110,790 105,804 99,114 92,852
Net working capitalexcluding short-termloans from currentliabilities 12.014 17,759 19,227 13.184 19582 23,899 22.094 22,171 24.513 27,118 29.059 30,875 29.462
42,632 56,395 55,786 48,751 64,975 90,853 105,850 124,515 133,389 137,908 134,863 129,989 122,314
Average depreciatedinv.in operation 49,514 56,091 52,269 56,863 77,914 98,351 115,183 128,952 135,649 136,386 132,426 126,152
Return on avg.depre-ciated investmentin operation 5.4% 12.4% 19.0% 23.0% 9.1% 15.8% 12.9% 12.6% 12.8% 13.0% 14.0% 15.2%
1!,

FUJI IRON & STEEL CO., LTD.
INCOME STATEMENT FORECASTS(Y million)
Apr. 159- Apr. '60- Apr. '61- Apr. 162- Apr. 163- Apr. 164- Apr. 165-Mar. '60 Mar. 161 mar. 162 Mar. 163 Mar. 164 Mar. 165 Mar. 166
Net Sales 105,286 119,297 131,015 142,096 146,841 152,042 153,475Operating Expenses
Cost of sales excludirg depreciation 76,517 88,898 97,007 106,228 1 0,779 15,547 116,368Normal depreciation J 7,142 9,001 10,663 10,840 10,425 9,882 9,396General administrative and selling expenses 6.055 6.523 7.051 7,607 7.849 8112 8,532
89,714 104,422 114,721 124,675 129,053 133,541 134,296
Operating Income 15,572 14,875 16,294 17,421 17,788 18,501 19,179Non-operating Income 806 1.006 1114 1,226 1. 1.465
Gross Incom 16,378 15,779 17,300 18,535 19,014 19,844 20,644
Non-operating ExpensesInterest 4,709 5,917 6,732 6,753 6,220 5,777 5,301Other 1.944 1.791 1.876 1.907 2,131 2.161 Z.268
Net inccme before taxes 9,725 8,071 8,692 9,875 10,663 11,906 13,075
Incoms Taxes 3.816 3-137 244 3.,957 4.305 4.419 4,919
Net Income 5,909 4,934 5,244 5,918 6,358 7,487 8,156
Surplw andx Reserves at beginning of year 37.880 41.369 41.283 42.907 41.755 43.593 45.560
43,789 46,303 46,527 48,825 48,113 51,080 53,716
Less: Surplus AppropriationsDividends 2,400 3,000 3,600 4,050 4,500 4,500 4,500Officers$ Bonus 20 20 20 20 20 20 20Additional Depreciation - - - - 1,000 1,029Stock Dividend - 2.000 - 3.-
Surplus and Reserves at endx of year 41 9 41.283 42.907 41.75 43593 45.60 48.167
Net Incone before Taxes and Interest 14,434 13,988 15,424 16,628 16,883 17,683 18,376Times Total Interest Covered 3.1 2.4 2.3 2.5 2.7 3.1 3.5
Net Incore after Taxes, before Deprec. and Interest 17,760 19,852 22,639 23,511 23,003 23,146 22,853Times Debt Service Covered 2.0 1.8 1.6 1.4 1.4 1.4 1.4
Earnings per share (on shares at end of year) X 14.8 8.2 8.8 6.5 7.1 8.3 9.1Dividends per share Y 6.0 6.0 5.0 5.0 5.0 5.0 5.0Total Retained Earnings and Depreciation 10,631 10,915 12,287 12,688 12,263 12,849 13,032
aJ For definition of depreciation, see Annex 17, Page 1

FUJI IRON & STEEL CO., LTD.
Cash Flow Forecasts(E million)
Apr. '59- Apr. '60- Apr. '61- Construction Apr. '62- Apr. '63- Apr. 164- Apr. '65- OperatingMar. '60 Yar. '61 Mar. '62 Period Mar. '63 Mar. '64 Mar. '65 Mar. 66 Period
S3ources of Funds
Profit for the year, before taxes, interest,dividends and bonus 14,694 14,248 15,684 44,626 16,888 17,143 16,943 17,607 68,581
Ordinary Deprec-ation 7,142 9,001 10,663 26,806 10,840 10,425 9,882 9,396 40,543
Prenrofit free reserves (nst) 503 54R 606 1.657 ss4 532 1,564 1.611 4,291Extraordicmry de,reciation - - - - - - 1,000 1,029 2,029Increase in reserve for bad debts 70 80 56 206 35 16 16 5 72Increase in reserve for renairs and maintenance 433 468 550 1,451 549 516 548 577 2,190
Total cash generated from orerations 22,339 23,797 26,953 73,089 28,312 28,100 28,389 28,614 113,415
CaGital increase - 8,000 - 8,000 12,000 - - - 12,000
Lonrs-term Debt 2J44 17 776 15.500 56 460 3 7.000 7.0oo 7,000 24.000IBRD ,64 4,7 - 8,- - - -Bonds 7,000 7, 000 7,000 21,000 3,000 7,000 7,000 7,000 24,000Looe-term Loans (Domestic) 12,320 6,000 8,500 26,820 - - - -
Increase in short-ter, debt 167 137 13 317
Decrease in current assets other than cash - - - - - -
Increase in current liabilities other than short-term debt 2.074 1,793 1.986 5.853 2.230 J,4j 1,012 .. 24 AJ<
Total 47,764 51,503 44,452 143,719 45,542 36,511 36,401 35.63a 154,092
A, ';cation of Funds
Investments in Fixed Assets 2Q.735 28.244 16198 73.177 13.098 s.ooO 000 5s o .o000 28,098Projects related to IBRD Loan 12,622 12,351 24,973 - - - -Other Projects in Expansion Program 13,106 12,893 11,198 37.197 8,098 - - - 8,098Renewals ans Repairs 3,007 3,000 5,000 11,007 5,000 5,000 5,000 5,000 20,000
Investments 1,880 1,980 2,080 5,940 2,180 2,280 2,380 2,480 9,320
Interest 4,{709 5.917 6,732 17,358 6,753 6,220 5,777 5,301 24,051Short-tern Debt 1,119 1,132 1,137 1, 38 1,121 1757 986 842 4,015IBRD Loan 116 375 544 1,035 524 496 466 434 1,920Bonds 798 1,256 1,734 3,788 2,055 2,313 2,684 2,982 10,034Other Long-term Loans 2,676 3,154 3,317 9,147 3,053 2,345 1,641 1,043 8,082
Amortination 3.976 4,869 7.264 16.109 9.856 10,541 10.993 10307 41,697IBRD - - 212 212 444 471 499 530 1,944Bond, 965 807 454 2,226 1,297 1,536 2,559 3,530 8,922Long-term Loans (Domestic) 3,011 4,062 6,598 13,671 8,115 8,534 7,935 6,247 30,831
Taxes 2,888 3,476 3,293 9,657 3,702 4,131 4,362 4,669 16,864
Dividends and Officers' Bonus 2,419 2,420 3,620 8,459 3,620 4,520 4,520 4,520 17,180
Decrease in bhort-term Debt - - - - 474 1,108 1,222 2,911 5,715
Increase in Current Assets other than cash 2,411 3,506 4,493 10,410 5,096 2,228 1,657 345 9,326
Decrease in Current Liabilities other than short-term debt __
Total 47.018 502412 43.680 141_l1o0 !t4 36.028 35.911 35,533 152.25
Cash surplus (shortage) for the year 746 1,091 772 2,609 763 483 490 105 1,841Available at beginning of year 6,885 7,631 8,722 6,885 9,494 10,257 10,740 11,230 9,494Available at end of year 7,631 8,722 9,494 9,494 10,257 10,740 11,230 11,335 11,335

ANNEX 16
FPUJI IRON & STEEL CO.. LTD.
Balance Sheet Forecasts(0 million)
March 31, March 31, March 31, March 31, March 31, March 31, March 31, March 31,1952 1960 1961 1962 1963 1%4 1965 1966
Assets
Cash and Bank Deposits 6,885 7,631 8,722 9,494 10,257 10,740 11,230 11,335
Notes Receivable 1,309 1,348 1,535 1,701 1,858 1,928 2,004 2,025Accounts Receivable (sales on credit) 4,090 3,839 4,373 4,847 5,294 5,492 5,709 5,769Less: Reserve for Bad Debts 385 455 535 591 626 _2 658 663
Total Receivables 5,014 4,732 5,373 5,957 6,526 6,778 7,055 7,131
Inventories 34,859 37,700 40,111 43,772 47,964 49,890 51,211 51,480
Other Current Assets 5,565 5.366 5.675 5.921 6.162 6.265 6.376 6.406
Total Current Assets 52,323 55,429 59,881 65,144 70,909 73,673 75,872 76,352
Fixed Assets 102,345 131,311 158,880 172,851 185,064 187,615 191,345 195,340
Less: Deprec.(including spec.repairs) 31.884 38,935 48,063 59,116 7 W,34 $0.311 90 731 100,988
Net Fixed Assets 70,461 92,376 110,817 113,735 114,719 107,304 100,614 94,352
Investments 6ncluding other assets) 11 920 13,965 15.991 18,230 20.441 22.753 25,198
Total Assets 132,843 159,725 184,663 194,870 203.858 201.418 199.289 195.902
Liabilities and Equity
Current Liabilities other thanuhcrt-term Loans 28,424 33,335 37,710 40,636 43,791 44,614 44,997 46,890
Short-term Loans 16.075 16.242 16.379 16,392 15918 14.810 13.588 10.677Total Current Liabilities 44,499 49,577 54,089 57,028 59,709 59,424 58,585 57,567
Proposed IBRD Loan - 3,864 8,640 8,428 7,984 7,513 7,014 6,484Other Long-term Debt 26,822 36,131 38,069 39,971 31,856 23,322 15,387 9,140Bonds 7,618 13,653 19,846 26,392 28,095 33,559 38,000 41,470Less: Maturing within 12 months 3.9 67 7.264 928S6 10.541 10.993 10:307, 11.926
Total Fixed Liabilities 30,464 48,779 59,291 64,935 57,394 53,401 50,094 45,168
Total Liabilities 74,963 98,356 113,380 121,963 117,103 112,825 108,679 102,735
share Capital 20,000 20,000 30,000 30,000 45,000 45,000 45,000 45,000Surplus and Reserves 37,880 41,369 41,283 42.907 41.755 43 45560 48.167
Total Equity 57,880 61,369 71,283 72,907 86,755 88,593 90,560 93,167
Total Liabilities & Equity 132,843 159,725 184,663 194,870 203,858 201,418 199,239 195,902= = _ - = = =_
Notes Receivable Discounted (4,430) (4,563) (5,198) (5,761) (6,293) (6,528) (6,786) (6,857)Guarantees on Loans (4,184) (5,592) (10,022) (11,147) (10,664) (9,989) (9,102) (8,570)
Ratios:Current Assets/Current Liabilities 1.18:1 1.12:1 1.11:1 1.14:1 1.19:1 1.24:1 1.29:1 1.32:1Current Assets/Current Liabilities
(exclucing short-tenm loans) 1.84:1 1.66:1 1.59:1 1.60:1 1.55:1 1.65:1 1.68:1 1.62:1Long-term Debt/Equity 34:66 44:56 45:55 47:53 40:60 38:62 35:65 33:67Total Debt/Equity 47:53 53:47 54:46 56:44 49:51 47:53 45:55 42:58Total Debt (incl.guarantees)/Equity 49:51 55:45 57:43 58:42 52:48 50:50 48:52 45:55

ANNEX 17Page 1
FTJI IRO E STEEL CO. .LTD.
Assumtions for Financial Forecests
The company's financial forecasts are based on the followingassumptions:
1) The volume of production and prices would be as shown In Annexes 11 and 12.Wages would increase by 5% p.a., at about the same rate as productivity.
2) Ordinary depreciation would be, as in past years, the maximum amountpermitted by law.
3) The maximum amount of special depreciation permitted by law on equipmentcoming into production during the construction period, totalling Y11,422million, has been distributed over a five-year period following the com-pletion of each item of equipment. The distribution has been such thatin each year ordinary depreciation plus special depreciation equals whatFuji considers to be an adequate or "normal" rate of depreciation (10% ona declining balance method). In 1964 and 1965, however, the total amount ofordinary and special tiepreci¶tion exceeds normal depreciation by I2,029million.
4) The increase in the Reserve for Retirement Allowance and the Reserve forBad Debt would be the maximum allowed by law.
5) The increase or decrease in the Reserve for Repairs and Maintenance corre-sponds to the estimated cost and timing of relining and major repairs ofthe blast furnaces.
6) The company would be able to secure new long-term loans before March 31,1962 as follows:
(a) IBRD loan - 124 million (X8,640 million equivalent) for 15 years,including a two-year grace period, at an interest of 6.3% (6% forIBRD plus 0.3% for JDB).
(b) New long-term Bank loans - 426,820 million for seven years (including atwo-year grace period) at an interest rate of 9Y.
(c) New bonds - Z21,000 million for seven years (including two-yeargrace period) at an interest rate of 7.5%.
7) The company would be able to increase short-term borrowings by X317million during the construction period. Interest rate would be 7r..
8) Investments in fixed assets after the end of the expsnsion program wouldbe limited to normal renewals and repairs. Estimated amount is Y5,000million annuaIly through 1965.

ANFIX 17Page 2
9) Annual investments in shares, securities or loans to other companies -subsidiary companies included - would increase by J100 million eachyear, starting from an estimated amount of 1,880 million in 1959.
10) Taxes would continue at a rate of 43% on the net profit after ordinaryand special depreciation, interest and reserve allocation permittedby law.
11) Dividends would continue to be paid in cash at the rate of 12% of theface value of the shares until September 30, 1962 and at the rate of10% afterwards.
12) As at present, 71% of sales would be paid in cash and 29% in notesreceivable having an average life of 80 days. As invoices are pre-pared on the 20th of each month, accounts receivable at the end of themonth are assumed to amount to 50% of the monthly sales - 7VO of totalnotes receivables would be discounted.
13) R.w material inventories would amount to a three-mointh supply forini io ted iron ore and scrap, a two-month supply for imported coal, as.:kPr.ly of abou' 2.3 raznths for domestic ore and one month for dore:fticC;C>l. Finislzed produc.ts inventories -wuld increase in proportion tosa-ios, goods in procos in proportion -' production of difircEn-t t2Yesof; products, and manufacturing suppl-es in prvportiun to ingot output.
14) As at present, domestic raw materials would be paI.d for in cash, exceptfor coal which would be paid for in three-mn .- h notes. Accounts pa-able would be 2.3 nonths for the total amol- of iroorted raw mrawterials,after whlich notes payable would be issued having an ave:rage life of1.2 months. As usual terms are four-month notes for imported iron ore,or U.S. coal, three months for other imuorted coals and two months forimported scra-s Fuji could increase substantially the ar.ount of itsnotes payable if required.

FUJI IRON & STEEL CO.,LTD).
Consolidated Balance Sheet Forecast (with main subsidiaries)(Y million)
March 31, March 31, March 31, March 31, March 31, March.31, March 31, March 31,1959 1960 1961 1962 1963 1964 1965 1966
Assets
Current Assets 60,843 63,515 68,835 74,?58 81,371 84,097 86,546 87,579
Net Fixed Assets 77,371 103,302 127,370 131,599 132,548 125,098 118,373 112,076
Investymnts and other assets 6.253 7,655 _ 9,03 10.666 12.266 13890 15,542 17.9Total Assets 144.467 174.472 205.228 217.023 226,185 223.085 220,461 217.629
Liabilities and Equity
Current Liabilities other than short-termloans 33,133 39,514 44,718 48,650 52,320 53,433 54,287 56,699
short-term Loans 18.130 18.633 19.259 20.184 20.062 18.345 16398 13348Total Current Liabilities 51,263 58,147 63,977 68,834 72,382 71,77N 70,685 70,047
Bonds 7,618 13,653 19,846 26,392 28,395 34,159 38,950 42,770Long-term Loans 28,802 43,142 53,937 56,431 46,687 36,546 26,637 19,002Less: Maturing within 12 months 4,430 5.333 7.764 11.274 12.178 12,878 12.46o 14,190
Total Pixed Liabilities 31,990 51,462 65,019 71,549 62,904 57,827 53,177 47,582
Minority Interest 2,591 3,072 3,488 3,395 3,607 3,980 4,553 4,939
share Capital 20,000 20,000 30,000 30,000 45,000 45,000 45,000 45,000burclus and Reserves 38,623 41J791 41.744 43.245 42,292 44,500 47.046 50,061
Total Equity 61,214 64,863 75,232 76,640 90,899 93,480 96,599 100,000
Total Liabilities and Equity 144,467 174,472 205,228 217,023 226,185 222,085 220,461 217,629
Guarantees given by Fuji (2,680) (2,921) (3,270) (3,591) (3,993) (4,154) (4,342) (4,368)
Ratio:Total Debt (inel. guarantees)/Equity 48:52 55:45 56:44 58:42 52:48 50:50 47:53 44:56
02)

JAPAN HOKKAIDO
LOCATION OF PLANTSFUJI IRON a STEEL CO.,LTD.
1. Muroran Works2. Kamaishi Works
3. Kawasaki Works URORAN4. Hirohata Works
2 ,gK~~~AMAISHI
SEA OF JAPAN
0 KAWA SAKI 200 M
SEPTEMBE 159 lD -HIMEJI
,9IKOK~OU
f KYUSHU \lj9 {? SJ () ~~~0 50 ioO 150 200 Miles,
SEPTE116ER 1959 IORO-615

*l I -- -
(02 i i ' _ _ _ _ _ _
a- U) -~ ~ ~ ~ ~ ~~- - ------ -- -----
LLZ
00
I ~~~~~~~~~~~~ -S
-j Lz