report no: aus8930 services and manufacturing...
TRANSCRIPT

Report No: AUS8930
Services and Manufacturing
Linkages: An Empirical Analysis
for Lao PDR
February 2016
Pub
lic D
iscl
osur
e A
utho
rized
Pub
lic D
iscl
osur
e A
utho
rized
Pub
lic D
iscl
osur
e A
utho
rized
Pub
lic D
iscl
osur
e A
utho
rized


Acronyms and abbreviations
AFAS ASEAN Framework Agreement on Services
APEC Asia-Pacific Economic Cooperation
ASEAN Association of South East Asian Nations
BPO Business Processing Outsourcing
CAGR Compound Average Growth Rate
CMT Cut Make Trim
EAP East Asia and the Pacific
FDI Foreign Direct Investment
FOB Free on Board
GATS General Agreement on Trade in Services
GDP Gross Domestic Product
GTAP Global Trade Analysis Project
HHI Herfindahl-Hirshman Index
ICT Information and Communication Technologies
ISIC International Standard Industrial Classification
NEC Not Else Classified
NSEDP National Socio Economic Development Plan
OBM Original Brand Manufacturing
OBS Other Business Services
ODM Original Design Manufacturing
R&D Research and Development
RCA Revealed Comparative Advantage
SAM Social Accounting Matrix
SME Small and Medium Enterprises
SSA Sub Saharan Africa
STRI Services Trade Restrictiveness Index
TFP Total Factor Productivity
UNCTAD United Nations Conference on Trade and Development
USD United States Dollars
VA Value Added
WDI World Development Indicators
WTO World Trade Organization

Currency Equivalent
Exchange rate effective as of February 24, 2016 (from BCEL):
Currency Unit = LAK (Lao Kip)
LAK 8,110 = US$ 1.00
Fiscal Year = October to September
Acknowledgements
This report was prepared by Gonzalo Varela – Senior Economist, Trade and Competitiveness
Global Practice; Claire H. Hollweg – Trade Economist, Trade and Competitiveness Global
Practice; and Laura Gomez-Mera – Consultant, University of Miami. Esteban Rojas provided
excellent research assistance. The authors are grateful for comments received from Sebastian
Saez, Michael Geiger, Roberto Fattal-Jaef, Konesawang Nghardsaysone, Mombert Hoppe and
Sally Burningham. We would also like to thank the Government of Lao PDR, especially the
Ministry of Industry and Commerce and different agencies within the Ministry for data access
and collaboration as well as the Lao Chamber of Commerce and Industry, and other public and
private counterparts for their useful insights. This report was prepared as a part of a trade-related
analytical program of work carried out by the World Bank in Lao PDR, under the Second Trade
Development Facility program, and financed by Australia, the European Union, Germany,
Ireland, and the United States.
Disclaimer: The findings, interpretations and conclusions expressed herein are those of the
authors, and do not necessarily reflect the views of the World Bank Group, its Executive
Directors, or the governments they represent.
Regional Vice President : Axel van Trotsenburg
Country Director : Ulrich Zachau
Senior Practice Director : Cecile Fruman
Country Manager : Sally Burningham
Practice Manager : Mona E. Haddad
Primary Author : Gonzalo Varela

Table of Contents
Executive Summary ....................................................................................................................................... i
Structure of the Report and Caveats ............................................................................................................ iv
I. Assessment of Services Trade Outcomes ............................................................................................. 1
a. Services in the domestic economy .................................................................................................... 1
b. Gross exports of services .................................................................................................................. 4
i. Export growth ............................................................................................................................... 5
ii. Export composition ....................................................................................................................... 8
iii. Revealed comparative advantage and export diversification .................................................. 13
c. Value added exports of services ...................................................................................................... 15
i. Forward versus backward linkages of services in total exports .................................................. 15
ii. Sectoral composition of services in total exports ........................................................................ 18
II. Assessment of Services Value-Added Linkages ................................................................................. 23
a. Inputs into and from agriculture, manufacturing and services sectors ............................................ 25
b. Structure of domestic value added in total production and exports ................................................ 29
c. Composition of services value added in manufacturing exports .................................................... 35
d. Imports of services inputs ............................................................................................................... 41
e. Services Trade Restrictiveness Index ............................................................................................. 43
III. Economy-wide effects of services performance ............................................................................. 49
a. Literature review ............................................................................................................................. 49
i. Services reform and economy-wide gains .................................................................................. 50
ii. Services reform and services sector performance ....................................................................... 50
iii. Services reform and export competitiveness ........................................................................... 50
iv. Services reform and manufacturing productivity .................................................................... 51
b. Services Sector Performance in Lao PDR: Subjective and Objective Measures ............................ 51
i. Access to finance ........................................................................................................................ 52
ii. Electricity .................................................................................................................................... 54
iii. Transportation ......................................................................................................................... 56
iv. Telecommunications ............................................................................................................... 58
v. Determinants of cross-firm variation in perceptions ................................................................... 60
c. Effects of Services Sector Performance on Firm Performance ....................................................... 61
i. Finance ........................................................................................................................................ 63
ii. Electricity & water ...................................................................................................................... 63

iii. Transportation ......................................................................................................................... 64
iv. Telecommunications ............................................................................................................... 65
References ................................................................................................................................................... 68
Annex .......................................................................................................................................................... 71

i
Executive Summary
1. This report seeks to shed light on the ways in which the services sector has contributed
to Lao PDR’s competitiveness and integration into the global marketplace. It focuses on two
complementary roles that the services sector plays: first, as an avenue for export diversification
and growth and, second, by providing inputs into other productive sectors of the economy, such
as the manufacturing sector. As economies grow, the importance of the services sector generally
increases, but its role as an enabler of other sectors of the economy in moving up the value chain
is frequently overlooked. However, the services sector is critical in raising competitiveness of
these other sectors to boost growth and create better quality jobs.
2. Lao PDR’s services sector has made a significant contribution to economic growth
over the past decade, but it remains below its full potential. The services sector has grown
rapidly in recent years, becoming the largest contributor to Lao PDR’s GDP. Nevertheless, the
size of the services sector—at 41 percent of GDP in 2014—remains smaller than other countries’
services sectors at similar levels of development.
3. While services exports have grown considerably, they remain concentrated in
traditional services, particularly transport and travel. Services exports grew from 6.4 percent
of total services output in 2005 to 6.9 percent in 2013. However, the high reliance on a few
traditional segments makes Lao PDR’s services export basket the most concentrated among its
peers, adding to the economy’s vulnerability to sector-specific shocks.
4. As a result of the inadequate supply of modern services, not only does their direct
contribution to exports remains low, but so does their indirect contribution that is
embedded in manufacturing exports. Almost 90 percent of the services inputs used by
manufacturers come from distribution and transport, while modern services, such as business,
financial, insurance and ICT services, contribute very little to manufacturing value-added.
Normally, services sector firms are important suppliers of intermediate inputs to other sectors,
especially manufacturing firms. When taking these forward linkages into account, the total
contribution of services stands at 21 percent of total exports in Lao PDR. Nonetheless, the
contribution of modern services in value-added exports remains very small. Inadequate supply of
financial and telecommunication services—representing only 3 percent of total services inputs to
manufacturing—may also be a constraint on the diversification and upgrading of manufacturing
firms, preventing them from moving up the value chain.
5. The linkages between services and manufacturing are weaker than in peer
countries. Services only contributed about 28 percent of the economy’s inputs in terms of value-
added in 2011, a low share by international standards, with services in peer countries
contributing close to, or well over, 40 percent. Instead, agriculture, energy and minerals
contributed 68 percent of domestically supplied inputs, while manufacturing contributed just 6
percent. In Lao PDR, services are used more as inputs for manufacturing exports than as inputs
for manufacturing products for the domestic market. Both for export-oriented and for domestic
activities, Lao PDR’s manufacturing sector relies less on services inputs than peer countries.

ii
6. Improving the quality and range of services is crucial in achieving economy-wide
gains in productivity and competitiveness. The inadequate supply of services inputs in Lao
PDR acts as a tax on the production of goods that use such services. Our findings suggest there
are significant links between the quality of backbone services and firms’ productivity in Lao
PDR, as well as in other countries in the EAP region. Lao PDR firms’ performance is
particularly adversely affected by the poor quality of transport and electricity services.
Challenges with transportation services have negative impacts on productivity, according to our
results. Less conclusive evidence is found regarding the limited access to financial services and
negative impacts on productivity. While the most productive firms tend to also be more vocal
about the inadequate supply of financial services, when looking at objective measures of access
to finance we find that firms with greater access to bank financing tend to be more productive.
Policy Recommendations
7. The main policy recommendations that emerge from this report are aimed at increasing
competition in the services sector, reducing distortive regulations, and opening up the sector to
foreign participation, building up skills, both at the individual and at the firm level, and investing
in hard and soft infrastructure to promote the development of the sector. In particular, greater
attention is needed in the following areas:
8. Move forward with the implementation of WTO and ASEAN Framework
Agreement on Services (AFAS) commitments to ensure a liberalized trade and investment
regime for services. o Openness in the services sector: This is part-and-parcel of a comprehensive growth-
enhancing trade policy. Nonetheless, Lao PDR’s commitments under GATS feature
relatively low sectoral coverage and shallow obligations. There is some urgency for
Lao PDR to move ahead with its commitments in the financial and telecomm
segments, and to consider opening up the distribution and retail segments.
Restrictions on foreign firms’ entry into several tourism activities, for example guest
houses, are still in place. In transport, adding flexibility in licensing procedures would
help firms that may prefer to integrate this activity into their core business, for
example in the mining sector.
o Regional liberalization commitments (with AFAS) need to be made compatible
with multilateral ones (with GATS/WTO). Regional integration in services could
potentially be a platform for wider integration with the global marketplace. However,
while Lao PDR has made greater progress towards liberalization in the regional
setting, some inconsistencies still remain (e.g., approval requirements in the regional
setting, but not at the multilateral setting; minimum foreign ownership requirements
in the regional setting, but not in the multilateral setting, etc.). This suggests that trade
negotiation strategies would be more effective if centralized, together with a stronger
mechanism for consultation and coordination across line ministries.
9. Complement openness with sound regulatory reforms to help materialize the gains.
In order to benefit from increased openness to trade and investment, it is necessary to have an
enabling, transparent and predictable regulatory environment. In telecommunications, for

iii
example, Lao PDR has committed to ambitious regulatory reforms. In order to achieve the
benefits of this it is crucial for the country to move towards establishing an institutional and
regulatory framework, in line with the WTO Telecom Reference Paper, that provides the principles and institutional requirements needed for the regulation of telecommunications. This
must include aspects such as rules on access to and use of telecomm infrastructure, the
independence of the regulatory body and rules on anti-competitive behavior. A draft Government
Decree to this effect is currently (February 2016) under discussion.
10. Support the implementation of reforms in the services sector by empowering
relevant agencies with adequate financial resources and skilled staff. Sound and transparent
regulatory frameworks will yield few results if the capacity of institutions is not strong. Limited
budgets and poorly trained staff constrain agencies’ capacities to respond effectively to
regulatory challenges. Furthermore, in order to support transparent implementation, it would be
advantageous to design user-friendly guidelines on the main horizontal laws for both officials
and the public to ensure a common understanding of the rules and regulations.
11. Support diversification of the economy by improving the stock of human capital.
Building up skills is vital if Lao PDR is to move into more sophisticated services and
manufacturing production. For example, in order to upgrade in textiles and garments, firms need
to rely on a workforce that can undertake original design, accounting activities and marketing.
The lack of skilled workers has been identified as a serious constraint by firms in Lao PDR.
Targeted, long-term policies to strengthen basic education, reform curricula to meet market
demand, and align vocational training with private sector needs, are crucial. In the short term,
facilitating the entry of foreigners with relevant skills could temporarily alleviate some of these
constraints.
12. Invest in hard and soft infrastructure, particularly in transport and energy,
including electricity, water and internet connectivity. The development of the road network
is vital in reducing transport costs, which play an important role in the cost equation of firms. In
addition, energy distribution infrastructure (e.g., the power grid) needs to be strengthened to
ensure stable supply. In terms of internet connectivity it is important to level the playing field
between domestic and foreign providers of internet to increase competition and improve
performance. Finally, eliminating the luxury tax on internet is in order.

iv
Structure of the Report and Caveats
Two caveats are in order. First, the analysis of services value added dynamics and of services
and manufacturing linkages relies on existing data on input-output linkages. These data is
obtained from Lao PDR’s most recent update of its input-output table, dating from 2002, with
updates made on the basis of more recent data for comparable countries. Second, also related to
data availability, the report analyzes linkages between manufacturing and services in the formal
sector. Lack of data on the informal side of the economy, likely sizable in a less developed
country such as Lao PDR, prevents us from tackling this portion of the economy. The reader
should take these caveats in consideration when interpreting the results.
The structure of this report is as follows. Section II benchmarks Lao PDR’s export
performance of services, measured in gross as well as in terms of value added. Section III
explores the role of services as inputs to Lao PDR’s manufacturing sector by measuring the
value-added linkages, for domestic production of manufacturing as well as exports. Section IV
investigates the impact of services input provision on manufacturing productivity.

1
I. Assessment of Services Trade Outcomes
1. Services play a dual role for building export competitiveness in Lao PDR’s
economy. Services are not only a source of competitiveness as inputs into manufacturing and
agriculture exports, but direct exports of services provide an opportunity for export
diversification and can be used as an engine for economic growth. Many developing countries
have benefitted from the expanding opportunities offered by new technologies to become strong
exporters of modern services activities. These experiences, supported by empirical evidence,
show that while services as inputs into other economic activities will remain an important
determinant of economic performance in developing countries, these countries can also join the
club of services exporters and benefit from opening of the services market.
2. Section II of the report explores the importance of the services sector for Lao PDR
from the first role that services play: as an avenue of export diversification and growth. It
addresses the following questions. First, how has the services sector performed in Lao PDR in
terms of its contribution to the economy’s GDP and employment, over time and compared to
peer countries? Second, how have services exports performed in Lao PDR, both in gross terms,
but also value added terms once considering that services contribute to other sectors’ exports?
Box 1: Comparators of Lao PDR
Eight countries were chosen as comparators for Lao PDR. These include other regional peers of Cambodia, Thailand
and Vietnam. Nepal, Bhutan, Botswana and Mongolia have been included as other land-locked countries, while
Bangladesh is also an important exporter of garments. Lao PDR has achieved a somewhat greater level of
development than Cambodia, but slightly below Vietnam. Thailand, Botswana and Mongolia have instead achieved
substantially higher levels of economic development in terms of GDP per capita. Lao PDR’s population is smaller
than most comparators, with the exception of Bhutan, Botswana and Mongolia.
Table 1: Comparator country demographics, 2014
GDP (billion USD) GDP per capita Population (millions)
Lao PDR 11.2 1,701 6.6
Cambodia 15.2 1,010 15.1
Thailand 387.3 5,741 67.5
Vietnam 171.2 1,909 89.7
Bhutan 1.8 2,360 0.8
Bangladesh 150.0 954 157.2
Botswana 15.0 6,882 2.2
Mongolia 12.5 4,388 2.9
Nepal 19.2 691 27.8
Source: World Bank World Development Indicators.
a. Services in the domestic economy
Lao PDR’s services sector has contributed considerably to economic growth and structural
change, to have become the most important contributor to GDP in Lao PDR. Nevertheless, the
size of Lao PDR’s services sector falls significantly below other countries at similar levels of
economic development, as well as all peer countries with the exception of Bhutan.

2
3. Over the past decade, Lao PDR’s services sector has contributed considerably to
economic growth and structural change. Lao PDR’s economy has been growing steadily and
robustly since 2000. GDP has grown at about 8% per year since 2005, above rates achieved at
the beginning of the decade at about 6% (Figure 1). All sectors of the economy –manufacturing,
other industry (including mining, utility supply and construction), agriculture, and services –
have contributed positively to GDP growth since 2000.1 Other industry has been the largest
driver of GDP growth, mostly notably due to the mining sector including copper, but the services
sector has been responsible for over a quarter of GDP growth.
Figure 1: Sectoral contribution to growth, 2000 – 2014
Source: Authors’ calculations based on data from WDI
4. As a result of the sector’s strong growth performance, services now contribute the
largest share of GDP in Lao PDR. Other industry’s share in economic activity increased from
11% in 2000 to 25% in 2013 (Figure 2). Mining has most likely been driving this change, but
also construction. The share of manufacturing in GDP has increased only from 6% in 2000 to 8%
in 2013. Services share in economic activity grew more modestly, from 38% in 2000 to slightly
over 40% in 2014, but took over agriculture as the sector contributing most to GDP.
1 The sectoral classifications follow ISIC rev. 3 and include: agriculture (ISIC 1-5), manufacturing (ISIC 15-37),
other industry (10-14, 38-45), and services (50-99).
02
46
810
GD
P g
row
th c
ontr
ibution (
%)
2000
2001
2002
2003
2004
2005
2006
2007
2008
2009
2010
2011
2012
2013
2014
Services Agriculture
Mining/Utilities/Construction Manufacturing

3
Figure 2: Sectoral value added shares, 1990, 2000 and 2014
Source: Authors’ calculations based on data from WDI
5. Despite these achievements, services contribution to GDP is below expected levels. As countries become richer, the size of the services sector in the domestic economy tends to
increase, though with dispersion around the trend. The linear relationship between GDP per
capita and services share of value added in GDP has flattened slightly over time, though likely
driven by select outliers. Nevertheless, the size of Lao PDR’s services sector falls significantly
below other countries at similar levels of economic development, as well as all peer countries
with the exception of Bhutan (see Figure 3, where Lao PDR and many comparator countries are
outside the 95% confidence intervals). The size of the services sector in Vietnam, Thailand,
Cambodia, Mongolia and Bhutan also fall below expected levels. Bangladesh is the only
comparator to outperform other countries at a similar level of economic development. The size
of the manufacturing sector in Lao PDR also tends to underperform other countries at a similar
level of economic development, while the agricultural sector and the
mining/utilities/construction sector are above expected levels.
020
40
60
80
100
Secto
ral valu
e a
dded (
%)
1990 2000 2014
BG
DB
TN
BW
AK
HM
LA
OM
NG
NP
LT
HA
VN
M
BG
DB
TN
BW
AK
HM
LA
OM
NG
NP
LT
HA
VN
M
BG
DB
TN
BW
AK
HM
LA
OM
NG
NP
LT
HA
VN
M
Services Agriculture
Mining/Utilities/Construction Manufacturing

4
Figure 3: Services value added in GDP (%) vs. GDP per capita, 2012-14
Source: Authors’ calculations based on data from WDI
b. Gross exports of services
Lao PDR’s expanding domestic services sector has translated into an expanding services export
sector, with the recent export performance in services being strong among peer countries. Lao
PDR’s services export growth was mainly in ‘traditional’ as opopsed to ‘modern’ activities –
transport and travel comprise over 90% of the export basket. Communication services have also
grown in value. This growth has allowed Lao PDR to maintain a comparative advantage in
travel and communication services relative to other countries in the world.
BGD
BTN
BWA
KHM
MNGNPLTHA
VNMLAO
02
55
07
51
00
Valu
e a
dded in G
DP
(%
)
4 6 8 10 12
Log GDP per capita (current USD)
Services
BGD BTN
BWA
KHM
MNG
NPL
THA
VNM
LAO
02
55
07
51
00
Valu
e a
dded in G
DP
(%
)
4 6 8 10 12
Log GDP per capita (current USD)
Agriculture
BGD
BTNBWA
KHM
MNGNPL
THA
VNM
LAO
02
55
07
51
00
Valu
e a
dded in G
DP
(%
)
4 6 8 10 12
Log GDP per capita (current USD)
Manufacturing
BGD
BTNBWA
KHM
MNG
NPL THA
VNMLAO
02
55
07
51
00
Valu
e a
dded in G
DP
(%
)
4 6 8 10 12
Log GDP per capita (current USD)
Mining/utilities/construction

5
i. Export growth
6. Lao PDR’s expanding domestic services sector has translated into an expanding
services export sector, with the recent export performance in services being strong among
peer countries. Commercial services exports have grown 4-fold in value since 2005 (Figure 4).2
Lao PDR’s services export sector outpaced all other peer countries since 2005.
Figure 4: Commercial services export value index, 2005-2013
Source: Authors’ calculations based on data from UNCTAD
Box 2: Four modes of services supply
Services have unique characteristics that greatly affect their tradability, including intangibility and non-storability,
but they also typically require differentiation and joint production. In order to capture these aspects, the World Trade
Organization defines trade in services to span four modes of supply:
Mode 1, or cross-border trade, are services supplied from the territory of one country into the territory of
another (for example, consultancies, market research, graphic design services).
Mode 2, or consumption abroad, are services supplied in the territory of a nation to the consumers of
another (for example, tourism, education, health services).
Mode 3, or commercial presence, are services supplied through any type of business or professional
establishment of one country in the territory of another, for example, foreign direct investment (FDI)
Mode 4, or presence of natural persons, are services supplied by nationals of a country in the territory of
another (for example, a consultant or a health worker supplying their services in the importing country).
Due to these characteristics, at-the-border duties cannot be applied to services, having resulted in much weaker
measurement and accounting practices with considerable less accuracy. Thus services statistics have ample space for
2 Commercial services exports, defined as total services excluding government services, are used throughout this
report (but we point out when only total services statistics are available).Services trade that takes place through FDI
and temporary movement of people are not covered in these data. Commercial services are generally used to reflect
the developments of the private services sector, as government services include embassies, consulates, military
units, etc., as well as the transactions of international organizations. However, in some countries commercial
services can be government/publically-owned, for example a national airline, and would thus be included in the
report’s statistics. In addition, the analysis of gross services trade focuses on cross-border transaction reported in
balance of payments statistics, or modes 1 and 2. (See Box 2 for a description of the different ways, or modes, in
which services can be traded.)
12
34
5
Serv
ices e
xport
index (
2005=
1)
2005 2006 2007 2008 2009 2010 2011 2012 2013
Year
Lao PDR Bangladesh Bhutan Botswana Cambodia
Mongolia Nepal Thailand Vietnam

6
improvement in terms of measurement. In particular, with respect to modes 3 and 4, measurement is to date difficult
and incomplete. Ongoing revisions and refinements of the Balance of Payments classification work towards solving
these issues.
Gross services trade data that are used in the first and second component of this report capture cross-border trade
(Mode 1) and consumption abroad (Mode 2). Services trade that takes place through FDI and temporary movement
of people are not covered in these data. Rather, they are the focus of the analysis in the third component.
7. Services export growth was strongest in the years prior to the global crisis, but has
slowed since. After having achieved the lowest growth of comparators between 2002 and 2004
at 2% per annum, Lao PDR’s services exports grew robustly at an average of 18% per annum
between 2005 and 2007 (Figure 5). This performance was similar to many peer countries, though
Vietnam, Bangladesh and Thailand’s export sectors all grew over 20% per annum. Between
2010 and 2012, Lao PDR’s services export growth returned to relatively low levels when
benchmarked against peer countries, at about 6% per annum.3
Figure 5: Commercial services export growth rate, 2002-2012
Source: Authors’ calculations based on data from UNCTAD
8. The growth resulted in a higher export intensity of the sector. Services exports as a
percentage of GDP — a measure of export intensity — are significantly and positively correlated
with a country’s level of economic development. Lao PDR’s services export intensity increased
from 6.4% in 2005 to 6.9% in 2013. The size of the export sector relative to economic activity is
at expected levels given Lao PDR’s level of economic development (Figure 6, where Lao PDR is
inside the 95% confidence interval). Vietnam closely followed Lao PDR’s performance at 7% of
GDP. Among peer economies, Cambodia and Thailand achieved the highest export intensity, and
are the only economy among comparators to reach a level above 10%. Although Cambodia’s
services export-to-GDP ratio deteriorated slightly between the periods 2005-2007 and 2011-
2013, Thailand’s services export-to-GDP ratio instead increased to 13.5% in the period 2011-
3 Botswana’s services export sector has been contracting since the global financial crisis of 2008-09.
-10
010
20
30
40
CA
GR
of S
erv
ice E
xport
s
2002-2004 2005-2007 2010-2012
Lao PDR Bangladesh Bhutan
Botswana Cambodia Mongolia
Nepal Thailand Vietnam

7
2013. In per capita terms, services exports are also at expected levels in Lao PDR (Figure 7,
where Lao PDR lies on the regression line).
Figure 6: Commercial services exports (% of GDP) vs. income level, 2005-07 vs. 2011-2013
Source: Authors’ calculations based on data from WDI
Figure 7: Per capita services exports vs level of development, 2005-07 vs. 2011-13
Source: Authors’ calculations based on data from WDI.
9. Notwithstanding, Lao PDR’s share of services in total exports has remained
constant since 2003. Exports of services represented 26% of total exports in 2013, and has
changed little since 2003 (Figure 8). This suggests that the export performance in goods trade has
been equivalent to that of services trade for Lao PDR. This ratio is average relative to peer
economies, though Nepal is an outlier where services comprise over 50% of total exports.
BGDBTN
BWA
KHM MNG
NPL
THAVNMLAO
02
55
07
51
00
Serv
ices e
xp
ort
s t
o G
DP
(%
)
4 6 8 10 12
Log GDP per capita (current USD)
2005-07
BGDBTN BWA
KHM
MNGNPL
THAVNMLAO
02
55
07
51
00
Serv
ices e
xp
ort
s t
o G
DP
(%
)
4 6 8 10 12
Log GDP per capita (current USD)
2011-13
BGD
BTN
BWA
KHM
MNG
NPL
THA
VNMLAO
02
46
81
01
2
Per
capita s
erv
ices e
xport
s (
curr
ent
US
D)
4 6 8 10 12
Log GDP per capita (current USD)
2005-07
BGD
BTNBWAKHM MNG
NPL
THA
VNMLAO
02
46
81
01
2
Per
capita s
erv
ices e
xport
s (
curr
ent
US
D)
4 6 8 10 12
Log GDP per capita (current USD)
2011-13
8
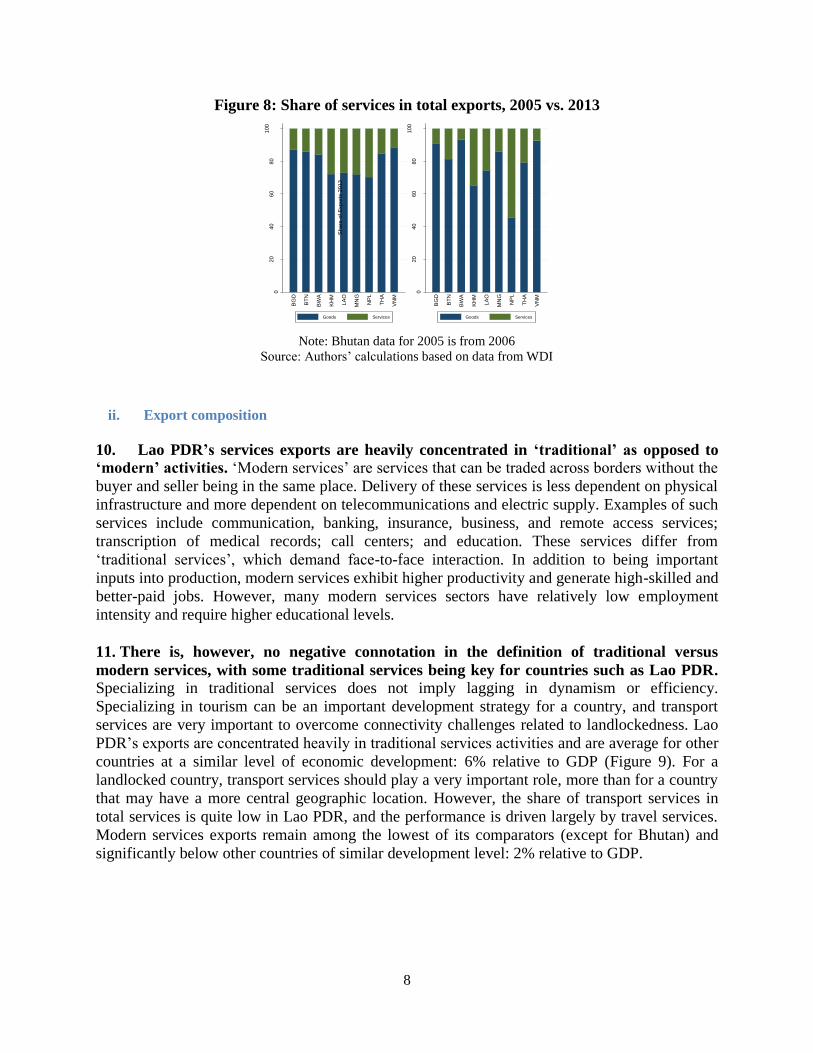
Figure 8: Share of services in total exports, 2005 vs. 2013
Note: Bhutan data for 2005 is from 2006
Source: Authors’ calculations based on data from WDI
ii. Export composition
10. Lao PDR’s services exports are heavily concentrated in ‘traditional’ as opposed to
‘modern’ activities. ‘Modern services’ are services that can be traded across borders without the
buyer and seller being in the same place. Delivery of these services is less dependent on physical
infrastructure and more dependent on telecommunications and electric supply. Examples of such
services include communication, banking, insurance, business, and remote access services;
transcription of medical records; call centers; and education. These services differ from
‘traditional services’, which demand face-to-face interaction. In addition to being important
inputs into production, modern services exhibit higher productivity and generate high-skilled and
better-paid jobs. However, many modern services sectors have relatively low employment
intensity and require higher educational levels.
11. There is, however, no negative connotation in the definition of traditional versus
modern services, with some traditional services being key for countries such as Lao PDR. Specializing in traditional services does not imply lagging in dynamism or efficiency.
Specializing in tourism can be an important development strategy for a country, and transport
services are very important to overcome connectivity challenges related to landlockedness. Lao
PDR’s exports are concentrated heavily in traditional services activities and are average for other
countries at a similar level of economic development: 6% relative to GDP (Figure 9). For a
landlocked country, transport services should play a very important role, more than for a country
that may have a more central geographic location. However, the share of transport services in
total services is quite low in Lao PDR, and the performance is driven largely by travel services.
Modern services exports remain among the lowest of its comparators (except for Bhutan) and
significantly below other countries of similar development level: 2% relative to GDP.
020
40
60
80
100
Share
of E
xport
s 2
005
BG
D
BT
N
BW
A
KH
M
LA
O
MN
G
NP
L
TH
A
VN
M
Goods Services
020
40
60
80
100
Share
of E
xport
s 2
013
BG
D
BT
N
BW
A
KH
M
LA
O
MN
G
NP
L
TH
A
VN
M
Goods Services

9
Figure 9: Traditional and modern services exports vs. GDP per capita, 2011-13
Source: Authors’ calculations based on data from WDI
12. The expansion in services exports has taken place primarily in travel but also
transport (Figure 10). Travel and transport jointly accounted for 87 percent of services exports
in 2013. The share of travel increased from 75.4 percent in 2005 to 78.3 percent in 2013. As a
result, the share of transport fell from 20 percent in 2005 to 9.2 percent in 2013. The surge in
export growth between 2005 and 2007 was driven by telecommunications, computer and
information (ICT) ($5.8 million to $17.2 million) and travel ($139 million to $189 million).
13. Although tourism (travel) has been expanding, it remains in low-end tourism. Expenditures per tourist are low, and have remained steady over the past years at about $50 USD
per day. This is largely the result of day-tourists from within the region, notably China.4 In
addition, there exists low supply of high-end tourism options in Lao PDR. This may, in part, be
due to regulations in the sector. For example, there are restrictions to the entry of foreign firms in
several tourism-related activities such as guest houses. These restrictions limit competition and
result in less options available to tourists, likely at higher prices or lower quality.
14. Government policy can play an important role in the development of a country’s
tourism sector, but also how the sector contributes to the economy at large. Traditional
services exports – including tourism – should not be overlooked as important opportunities for
countries to diversify and drive growth. Tourism has been used as a tool for economic
development throughout the world. Cape Verde is one country example that offers lessons in
developing a tourism sector as a key driver of growth and poverty alleviation. In less than two
4 According to 2014 Statistical Report on Tourism in Lao PDR, elaborated by the Tourism Development Department
of the Ministry of Information, Culture and Tourism, the average expenditure per person per day stood at 49.4 USD
in 2014, with the average length of stay being at 4.9 days. However, while Cambodian, Vietnamese, or Chinese
tourists spend on average 12-15 USD per day, tourists from outside the region spend 73.3 USD per day. These
figures have been stable. For example in 2011, the same agency reports average expenditures per day of 50.5 USD
and average length of stay of 4.5 days.
BGD BTNBWAKHM MNGNPL THA
LAO01
02
03
04
0
Serv
ices e
xp
ort
s t
o G
DP
(%
)
4 6 8 10 12
Log GDP per capita (current USD)
Modern
BGD
BTN
BWA
KHM
MNG
NPL
THA
LAO
01
02
03
04
0
Serv
ices e
xp
ort
s t
o G
DP
(%
)
4 6 8 10 12
Log GDP per capita (current USD)
Traditional

10
decades, Cape Verde has overcome significant environmental and geographic barriers and
transformed its economy, as discussed in Box 3.
Box 3: Supporting growth in the tourism sector in Cape Verde
Cape Verde experienced significant and rapid transformation through its tourism sector. It changed from a
little-known, small island country into a mass tourism destination. Tourist arrivals increased from 67,042 in 1999
to 497,000 in 2015, an average annual growth rate of 14 percent. Tourist receipts have grown twice as fast, at a
staggering 28 percent per year, resulting in high revenues per tourist, and are equivalent to a 44.5 percent share in
GDP (direct, indirect and induced). Largely as a result of its extraordinary growth in tourism, Cape Verde has
achieved an average 6.5 percent GDP annual growth rate over the last decade.
Such a complex transition that usually takes time was aided by government policies, including:
Cape Verde’s Government provided strong public leadership for tourism and developed a positive investment
climate. Attracted by a stable economy, foreign investment in tourism has boomed.
Cape Verde aggressively pursued tourism investment. The Government acquired land, and investment
incentives and a stable economy led to fast tourism growth.
High-quality airports, good aircraft maintenance facilities, and supportive air policies were crucial to
increasing arrivals. The country has an airport classified as Category I by the U.S. Government.
The tourism growth occurred quickly, and also led to a challenge for Cape Verde’s authorities. The fast
growth of tourism resulted in gaps in conservation, infrastructure and linkages to the local population. Currently,
the government must address uneven development and high leakage, by deepening the connectedness and inclu-
siveness of tourism.
To sustain growth over the long term also requires a professional private sector, high-quality suppliers,
and a large number of “destination services.” These include utilities, a skilled labor force, food and materials,
garbage collection, sanitation, environmental conservation, and transportation. Seeking growth in foreign
investment, Cape Verde overlooked the importance of these services, leaving gaps in the sequencing of
development. As a result, the sector is not well integrated with the rest of the economy and is not doing as well as
it could in terms of poverty alleviation. In addition, to fully benefit from tourism, the labor market must be
properly prepared for tourism opportunities.
Source: Christie et al. (2013).
15. ICT services have also become more important for Lao PDR’s export basket,
increasing their share from 3.2% in 2005 to 4.9% in 2013, in line with the objectives set by
Lao PDR’s 7th
National Five year Socio-Economic Development Plan (NSEDP) 2011-2015. The sector’s expansion has been targeted in the 7
th NSEDP, and faces the challenges associated
with setting up an appropriate regulatory framework.5 A solid framework would ensure that the
liberal stance to trade that Lao PDR has taken in this sector– as revealed by Lao PDR’s relatively
ambitious commitments to the WTO – results in improved performance.
5 These telecommunication services that are being exported include roaming charges and IP transit – or the transit of
information that travels through underground cables located in Lao PDR. When this information enters the territory,
it’s managed by a domestic company, who has rights over those cables and charges for that transit.

11
Figure 10: Services export composition over time for Lao PDR, 2005-2013
Source: Authors’ calculations based on data from UNCTAD
16. As the export structure demonstrates, Lao PDR outperforms only Bhutan and
Vietnam in its modern services export share. With the exception of Bhutan and Vietnam, Lao
PDR’s services export basket is less diversified towards modern services activities than other
peer countries (Figure 11). Lao PDR’s services export structure is most similar to that of
Cambodia and Vietnam. In Botswana and Bangladesh, for example, modern services represent
over 60% of the export basket, compared to 12% in Lao PDR. Thailand, Nepal, Mongolia,
Botswana and Bangladesh have all been more successful in exporting other business services.
(See Box 4 for a definition of the different services sectors.)
Figure 11: Services exports composition, 2013
Source: Authors’ calculations based on data from UNCTAD
020
40
60
80
100
2005 2006 2007 2008 2009 2010 2011 2012 2013
Construction Financial ICT
IP charges Insurance Maintenance & repair
Manuf. services Other business Personal
Transport Travel
020
40
60
80
100
BGD BTN BWA KHM LAO MNG NPL THA VNM
Construction Financial ICT
IP charges Insurance Maintenance & repair
Manuf. services Other business Personal
Transport Travel

12
Box 4: Sectoral services classifications
Services trade data used in this report are sourced from a variety of sources. Services exports with the world at a
disaggregated sectoral level are from UNCTAD. Data are measured according to countries’ Balance of Payments
statistics, and are identified in the report according to their BOP manual 6 services activity.
Services are classified into following four main categories: Goods-related services, transport, travel and other
services. Other services are further disaggregated into: construction, insurance and pension services, financial
services, charges for the use of intellectual property n.i.e., telecommunications, computer and information services,
other business services, personal, cultural and recreational services, government goods and services n.i.e., and
services not allocated.
Manufacturing services on physical inputs owned by others: Cover processing, assembly, labeling, packing,
and so forth undertaken by enterprises that do not own the goods concerned.
Maintenance and repair services n.i.e.: Cover maintenance and repair work by residents on goods that are
owned by non-residents (and vice versa). Repairs and maintenance on ships, aircraft, and other transport
equipment are included.
Transport: Includes all transport services involving the carriage of people and objects from one location to
another as well as related supporting and auxiliary services. Also included are postal and courier services.
Travel: Travel credits cover goods and services for own use or to give away acquired from an economy by non-
residents during visits to that economy. Travel debits cover goods and services for own use or to give away
acquired from other economies by residents during visits to these other economies.
Construction: Covers the creation, renovation, repair, or extension of fixed assets in the form of buildings, land
improvements of an engineering nature, and other such engineering constructions as roads, bridges, dams, and
so forth. It also includes related installation and assembly work. It includes site preparation and general
construction as well as specialized services such as painting, plumbing, and demolition. It also includes
management of construction projects.
Insurance and pension services: Include services of providing life insurance and annuities, nonlife insurance,
reinsurance, freight insurance, pensions, standardized guarantees, and auxiliary services to insurance, pension
schemes, and standardized guarantee schemes.
Financial services: Cover financial intermediary and auxiliary services, except insurance and pension fund
services. These services include those usually provided by banks and other financial corporations.
Charges for the use of intellectual property n.i.e.: Include (a) charges for the use of proprietary rights (such
as patents, trademarks, copyrights, industrial processes and designs including trade secrets, franchises) and (b)
charges for licenses to reproduce or distribute (or both) intellectual property embodied in produced originals or
prototypes (such as copyrights on books and manuscripts, computer software, cinematographic works, and
sound recordings) and related rights (such as for live performances and television, cable, or satellite broadcast).
Telecommunications, computer, and information (ICT) services: (1) Telecommunications services
encompass the broadcast or transmission of sound, images, data, or other information by telephone, telex,
telegram, radio and television cable transmission, radio and television satellite, electronic mail, facsimile, and
so forth, including business network services, teleconferencing, and support services. They do not include the
value of the information transported. Also included are mobile telecommunications services, Internet backbone
services, and online access services, including provision of access to the Internet. Excluded are installation
services for telephone network equipment (included in construction) and database services (included in
information services). (2) Computer services consist of hardware- and software-related services and data-
processing services. Exclude noncustomized packaged software (systems and applications), and video and audio
recordings, on physical media; computer-training courses not designed for a specific user; and leasing of
computers without an operator. (3) Information services include news agency services, such as the provision of
news, photographs, and feature articles to the media. Other information provision services include database
services, direct non-bulk subscriptions to newspapers and periodicals, other online content provision services,
and library and archive services.
Other business services: Cover research and development, professional and management consulting and
technical, trade-related and other business services.
Personal, cultural, and recreational services: Consist of (a) audiovisual and related services and (b) other
personal, cultural, and recreational services.

13
Government goods and services n.i.e.: Cover (a) goods and services supplied by and to enclaves, such as
embassies, military bases, and international organizations; (b) goods and services acquired from the host
economy by diplomats, consular staff, and military personnel located abroad and their dependents; and (c)
services supplied by and to governments and not included in other categories of services.
iii. Revealed comparative advantage and export diversification
17. This growth has allowed Lao PDR to maintain a comparative advantage in travel
and insurance services relative to other countries in the world. Revealed comparative
advantage (RCA) is one indicator of export performance, identifying the sectors in which a
country has a comparative edge. The RCA index computed herein compares the share of services
exports in a particular services sector of a country with the global share of exports in that same
service sector. A country with an RCA index above one is considered to have a revealed
comparative advantage in that sector. The higher the ratio, the more competitive is the country.
Exports of travel services have grown on average 20% between 2005 and 2013, and Lao PDR
has gained competitiveness in the sector, growing its RCA from 2.9 in 2007 to 3.1 in 2013
(Table 2 and Figure 12).
Table 2: Lao PDR’s revealed comparative advantages, 2005-2013 Service Category 2005 2013 CAGR
2005-2013 Value Share RCA Value Share RCA
Total commercial services 184.5 761.0 19.38
Travel 139.2 75.4 2.9 595.9 78.3 3.1 19.94
Transport 36.5 19.8 0.9 70.0 9.2 0.5 8.47
ICT 5.8 3.2 0.4 37.3 4.9 0.5 26.06
Construction
8.6 1.1 0.5
Financial
1.2 0.2 0.0
Insurance 2.9 1.6 0.6 48.1 6.3 2.4 41.80
Note: Value in million current USD.
Source: Authors’ calculations based on data from UNCTAD

14
Figure 12: RCA indexes of Lao PDR, 2005 vs. 2013
Source: Authors’ calculations based on data from UNCTAD
Figure 13: Export concentration index, 2005 and 2013
Source: Authors’ calculations based on data from UNCTAD
18. Lao PDR’s export basket is the most concentrated of peer countries, with the
exception of Cambodia. Not only is it important to transition towards sophisticated and modern
services exports, but export diversification is also important because it prevents economies from
being too dependent on one sector, thus reducing vulnerabilities to product or sector specific
shocks. Despite the importance of diversifying, however, countries tend to specialize.6 To assess
diversification, we measure its opposite, concentration, based on a standard measure, namely the
6 Cross-country empirical analysis has in fact shown that the process of diversification is related to a country’s stage
of development. Countries first diversify, in the sense that economic activity is spread more equally across sectors,
but later on in the development process they start specializing again (Imbs and Wacziarg, 2003).
0 1 2 3
Travel
Transport
Insurance
ICT
Financial
Construction
2005 2013
0.2
.4.6
BGD BTN BWA KHM LAO MNG NPL THA VNM
2005 2013
15
Hirschman-Herfindahl index (HHI). The normalized version of the index ranges from zero to
one, with higher values indicating higher concentration of exports of services. Lao PDR’s export
concentration index was 0.59 in 2013 (Figure 13). Cambodia, Vietnam, Thailand and Bhutan
also exhibited high levels of export concentration, between 0.5 and 0.6. Botswana, Mongolia and
Bangladesh instead have been more successful at diversifying their services export basket. High
or increasing concentration is not necessarily a negative outcome, when it is driven by a booming
sector. However, it adds to the vulnerability of the economy to sector-specific shocks.
c. Value added exports of services
Measuring exports on a value added basis provides a truer sense of the overall importance of the
services sector for export, because it considers that services are used as inputs for other sectors’
exports. Even when services exports are measured by their total domestic value added embedded
in gross exports, services exports are still primarily composed of transport and distribution
services, though business & ICT services become relatively more important once considering
forward linkages with the rest of the economy – implying that these services are used as inputs in
other sectors’ exports. Nevertheless, the findings of this analysis suggest that there are weak
forward linkages of services with the rest of the economy except for distribution services, once
benchmarked against other countries in the world.
i. Forward versus backward linkages of services in total exports
19. A country’s performance in gross services exports undervalues the services sector’s
real contribution to exports. Exports are traditionally measured in gross terms (i.e. their
transaction value, or the price paid for the goods or services). Alternatively, exports can be
measured by the domestic value added that they create in an economy, based on economy-wide
accounting flows between sectors, found in input-output tables. The analysis of trade in value
added nets out imports, and considers that some domestic sectors are used as intermediate inputs
to other activities’ exports. Measuring exports on a value added basis thus provides a truer sense
of the overall importance of a sector for a country’s exports. This is because some domestic
sectors support other sectors’ exports, when they act as inputs to production. This is in particular
true for services, which are important inputs to manufacturing and agricultural exports. For
example, international evidence suggests that about 30% of manufacturing value added is from
services. This means that the sector will contribute more to a country’s exported value added
than gross export values can account for.
20. When exports are measured by the value added they create in an economy, we can
split the contribution of a sector into its direct and indirect contributions. As Box 5 lays out,
an analysis of trade in value-added at the level of individual sectors can be undertaken in two
ways that yield complementary insights: forward and backward linkages. The direct contribution
is the value added a sector generates to produce its own exports directly. If measuring backward
linkages, the indirect contribution is the value added a sector pulls from intermediate-input
sectors to produce its own exports. For example, the exports of the machinery sector would
comprise the direct value-added in machinery production, as well as the value-added of
intermediate inputs that the domestic plastics industry might have provided to the exported
machinery items. Thus, machinery exports “pull” value added from the plastics sector. If
measuring forward linkages, the indirect contribution is the value added a sector generates by

16
supplying intermediate inputs to the production of other sectors’ exports. For example, exports of
food may have been produced using machinery of domestic origin. Thus, machinery “supplies”
(part of) the value added in exports of food and beverages.
Box 5: Measuring trade on a value-added basis
The analysis on services’ contribution to Lao PDR’s exports on a value-added basis relies on the World Bank’s
Export of Value Added Database. The database contains information on gross exports of services, direct value-
added exports of services, and indirect value-added exports of services. The database was developed using social
accounting matrices (SAM) from the 9th round of the Global Trade Analysis Project (GTAP), which reflects data
up until 2011. The input-output table underpinning the SAM for Lao PDR in GTAP is from 2002, though the
model is re-calibrated every round and the parameters re-defined as to reflect the updated dataset.
Exports (of both goods and services) can be measured as:
Gross exports: The transaction value of a sector’s exports, i.e. what is published as exports in the balance of
payments. Gross exports capture both the value added embodied in the production of the export, as well as all
(domestic and imported) intermediate inputs. Gross measures of trade statistics are registered in the balance of
payments at the transaction value, that is, the price for the goods or services. For example, a business process
outsourcing (BPO) company from India sells its services in Europe and India’s gross exports of BPO services
capture the invoice price of those services.
Direct value added of exports: A sector’s domestic value added embodied in its own exports, measured as
gross exports less domestic and foreign inputs. This measure captures the value added contribution of a sector
in the sector’s own exports (or the sector-specific value added of exports). For example, the Indian BPO firm
above uses telecommunications services, both from local providers and from foreign owners of satellites,
which are intermediate inputs. The direct value added of a sector’s exports deducts the value of these inputs
from the gross exports amount.
Total value added of exports: This is a measure of the total value added of a sector’s exports from a country-
wide perspective. It adds to the direct value added of exports the portion of the value added of the inputs that
are produced domestically. This measure captures the indirect contribution of sectors to another sector’s
exports, expressed in terms of forward or backward linkages. It can be calculated as the difference between
gross exports and foreign inputs only (backward linkages), or it can be calculated as the sector’s direct value
added of exports plus the value of the sector used as domestic inputs (forward linkages). This is increasingly
important in an environment where global production is fragmented across production sharing networks.
Forward linkages: The value added of a sector that is exported indirectly through exports of other sectors
that contain inputs from the sector. For example, the BPO firm may be providing services to a domestic
manufacturing firm which exports its products. The share of the BPO firm’s input to the manufacturing good
exports count as a forward linkage. Forward linkage practically treats the particular sector as an upstream
activity.
Backward linkages: The value added from other sectors that is embodied in the value of exports of a
particular sector. In this case, the particular sector as a downstream activity. To continue with the above
example, this measure captures the value added of all domestic inputs to the BPO sector’s exports, e.g.
domestically produced telecommunications services. In other words, backward linkages show how important
BPO services are to export other sector’s value added.
Value added services export data continue to capture cross-border trade (Mode 1) and consumption abroad (Mode
2). Services trade that takes place through FDI and temporary movement of people are not covered in these data.
However, production from inward/outward FDI and movement of natural persons would show up as GDP and be
included in the statistics as domestic production (not exports).
21. When measuring the contribution of services to exports on a value added basis, we
are more interested in the forward linkages: services are important suppliers of
intermediate inputs, more so than they pull intermediate inputs from other sectors. Services
are embedded as inputs in exports of manufactured and agriculture goods, while the production

17
of services exports does not necessarily involve significant input from the latter two. In general,
when taking into account forward linkages, the ratio of total value added to gross exports is
above one for services – revealing that gross exports are undervaluing the contribution of
services to export since services are used as inputs into other sectors’ exports – and below one
for manufacturing – revealing that gross exports are overvaluing the contribution of
manufacturing to exports since manufacturing use inputs from other sectors for their export. This
holds true in Lao PDR, as well as the other comparators (Figure 14). When measuring the
services linkages with manufacturing, agriculture and mining in the analysis below, however, we
are more interested instead in the backward linkages, as to understand how exports of the
manufacturing, agriculture, or mining sectors rely on value added from the services sector.
Figure 14: Ratio of total value added exports to gross exports, 1997-2011
Source: World Bank Export of Value Added Database.
22. In Lao PDR, the share of services in gross exports, as well as the share of services in
direct value added exports, is low by international standards. Direct exports of services
represent less than 10% of Lao PDR’s total domestic value added that is exported. The
importance of direct services exports (direct value added) increases as countries develop (three is
a statistically significant and positive correlation between GDP per capita and direct services
export shares). Indeed, Lao PDR has one of the lowest direct value added shares among
comparators and is significantly below other countries at similar development level.
23. Lao PDR’s relative position by international standards declines once including the
value added that services supply to other export activites. When considering the value added
that services supply to other sectors’ exports (direct plus the forward linkages), services represent
just over 20% of total exported value added. This share is the lowest not only among most peers
(with the exception of Bangladesh and Thailand) but also among other countries at similar
development level (Figure 15). This suggests that Lao PDR’s forward linkages of services is low
(which interestingly exhibits no correlation with level of economic development), given how Lao
PDR’s relative position declines in the global scatter once taking into account forward linkages.
This result is assessed in more detail in Section III below.
02
46
81
0
1995 2000 2005 2010year
01
2
1995 2000 2005 2010year
BGD BWA KHM LAO
MNG NPL THA VNM

18
Figure 15: Services’ export share (gross value, direct value added and total value added
considering forward linkages) vs. level of development, 2011
Source: World Bank Export of Value Added Database.
ii. Sectoral composition of services in total exports
24. Different services sectors have been more important for growing domestic value
added contained in Lao PDR’s exports. The change in value added embedded in Lao PDR’s
exports between 2004 and 2011 reveals that communications (18%), finance (18%), construction
(17%) and distribution (17%) have achieved the highest annual growth rates (Figure 16). The
energy/minerals, agriculture and manufacturing sectors have also experienced substantial growth
in their exported value added, 32%, 18% and 18% respectively.7 The highest growth was in
energy/minerals, which highlights the importance of the sector’s exports for the Lao PDR
economy. This sector is also considered to have immense, untapped export potential. However,
as we discuss below, the quality of domestic energy supply is still inadequate, as suggested in the
data and supported by the field interviews. This has important implications on the performance
of the domestic manufacturing and agriculture sectors. As such, further development of the
7 The agriculture sector refers to primary agriculture. The energy/minerals sector refers to minerals n.e.c., coal, gas,
oil, petroleum/coal products, gas manufacturing/distribution.
020
40
60
80
Lao PDR Bangladesh Vietnam Botswana Cambodia Mongolia Nepal Thailand
Gross Direct Total
BGD
BWAKHM
MNG
NPL
THA
VNMLAO
02
04
06
08
0
Serv
ices e
xp
ort
share
6 8 10 12
Log GDP per capita (current USD)
Gross value
BGD
BWA
KHM
MNG
NPL
THA
VNMLAO
02
04
06
08
0
Serv
ices e
xp
ort
share
6 8 10 12
Log GDP per capita (current USD)
Direct value added
BGD
BWA
KHM
MNG
NPL
THA
VNM
LAO
02
04
06
08
0
Serv
ices e
xp
ort
share
6 8 10 12
Log GDP per capita (current USD)
Total value added, fwd linkages

19
sector should be supported, not just to enforce direct exports of energy/minerals, but for
strengthening the linkages with other domestic sectors.
Figure 16: Annual growth rate of value-added in exports by sector (percent), 2004-11
Source: World Bank Export of Value Added Database.
25. Manufacturing exports are the most important for pulling together value added
from the economy, but energy and minerals is the most important supplier of domestic
value added to Lao PDR’s exports. Manufacturing contributed 50% of Lao PDR’s gross
services exports in 2011, while agriculture contributed 7% and energy extractions and minerals
34%. Once considering backward linkages, energy extractions and minerals carried forward 36%
of domestic value added in exports, and once considering forward linkages, the sector supplied
42% of domestic value added in exports (Figure 17). Put another way, 36% of Lao PDR’s
domestic value added in exports are embedded in energy extractions and minerals exports, either
directly or as inputs from other sectors. Energy extractions and minerals are also the most
important sector supplying value added, when considering the forward linkages. Put another
way, energy extractions and minerals supplied 42% of Lao PDR’s domestic value added
contained in exports, either directly or as inputs to other sectors’ exports.
26. Services’ contribution to exports increases once considering the intermediate inputs
they supply to the economy, at the expense of manufacturing. Services exports pull together
only 9% of Lao PDR’s domestic value added (considering backward linkages), but are
responsible for supplying 21% of domestic value added (considering forward linkages). This
highlights the role that services play as inputs to other sectors’ exports. Distribution services in
particular become relatively more important when forward linkages are taken into account.
27. While measuring exports on a value added basis indeed provides a truer sense of the
contribution of a sector for export, modern services exports continue to be low even when
measured in value added terms. Even when measured by the value added they create in an
economy, services exports are still primarily composed of transport and distribution services,
though business & ICT services become relatively more important once considering forward
0 10 20 30Annual growth rate (%), 2004-11
communcation
Water
Transport
Other services
Other consumer services
OBS, ICT
Manufacturing
Insurance
Finance
Energy/Minerals
Distribution
Construction
Agriculture

20
linkages. The finding thus suggests that there are weak forward linkages with the exception of
distribution.
Figure 17: Gross and value-added sectoral export shares by type of linkage, 2011
Source: World Bank Export of Value Added Database
28. Benchmarking the composition of services supplied to the country’s exports, Lao
PDR lies below or close to expected levels in all services sub-sectors. In addition, Lao PDR’s
services exports are outperformed by many of its comparators across each sub-sector (Figure 18).
This includes communications services – a sector where Lao PDR reveals a comparative
advantage in gross values – as well as business services & ICT, finance, and insurance. Instead,
water and utility supply are used more intensely as inputs than is expected.
020
40
60
80
100
Gross Total VA (bwd) Total VA (fwd)
Utilities Construction Distribution Transport
Communication Finance Insurance OBS, ICT
Other services Manufacturing Agriculture Energy/Minerals

21
Figure 18: Services sector’s export share (total value added considering forward linkages)
vs. level of development, 2011
Source: World Bank Export of Value Added Database
BGD
BWA
KHMMNG
NPL
THAVNMLAO02
46
8
Serv
ices s
ecto
r exp
ort
share
6 8 10 12
Log GDP per capita (current USD)
Construction
BGD
BWA
KHM
MNG
NPL
THAVNM
LAO
05
10
15
20
Serv
ices s
ecto
r exp
ort
share
6 8 10 12
Log GDP per capita (current USD)
Other consumer services
BGD
BWA
KHM MNGNPL
THAVNM
LAO
0.5
11
.52
Serv
ices s
ecto
r exp
ort
share
6 8 10 12
Log GDP per capita (current USD)
Water
BGD
BWA
KHM MNG
NPL
THAVNM
LAO01
02
03
0
Serv
ices s
ecto
r exp
ort
share
6 8 10 12
Log GDP per capita (current USD)
Business services & ICT
BGD
BWA
KHM
MNGNPL
THA
VNM
LAO
01
02
03
0
Serv
ices s
ecto
r exp
ort
share
6 8 10 12
Log GDP per capita (current USD)
Transport
BGDBWA
KHM
MNG
NPL
THA
VNMLAO0
51
01
52
0
Serv
ices s
ecto
r exp
ort
share
6 8 10 12
Log GDP per capita (current USD)
Finance
BGD
BWA
KHMMNG
NPL
THA
VNMLAO
01
23
45
Serv
ices s
ecto
r exp
ort
share
6 8 10 12
Log GDP per capita (current USD)
Insurance
BGD BWAKHM
MNG
NPLTHAVNMLAO
02
46
8
Serv
ices s
ecto
r exp
ort
share
6 8 10 12
Log GDP per capita (current USD)
Communications
BGD
BWA
KHM
MNG
NPL THA
VNM
LAO
02
04
06
0
Serv
ices s
ecto
r exp
ort
share
6 8 10 12
Log GDP per capita (current USD)
Distribution

22
29. With the exception of distribution, finance, and water supply, services sectors in Lao
PDR are better able to export their own value added directly than provide inputs to other
sectors’ exports (Table 3). For example, 63% of communication services value added that is
exported is done so directly by the communications sector, rather than as inputs in other sectors’
exports. This is also true for business services and ICT, communications, construction,
insurance, other consumer services and transport services. This again is suggestive that the
forward linkages between services with other sectors in the economy are weak.8 Section III
explores this finding in more detail. Distribution services include: wholesale and retail trade;
sales/maintenance/repair of motor vehicles and motorcycles; repair of personal and household
goods; and hotels and restaurants. The importance of the distribution sector for value-added
exports is thus explained largely by the importance of tourism (hotels and restaurants) for the
economy.
Table 3: Top 5 sectors exporting services’ value added, 2011
Upstream Sector
Top 5 downstream sectors exporting upstream sector’s value added
(% of sector’s forward linkages)
% in top
5
industrie
s
Business Services &
ICT OBS, ICT metals other primary lumber energy
22% 21% 17% 9% 6% 76%
Communications communication
other
primary lumber energy metals
63% 14% 6% 4% 4% 91%
Construction construction energy
other consumer
services metals
other
primary
12% 10% 8% 8% 8% 47%
Distribution metals
other
primary lumber energy chemicals
39% 17% 10% 10% 6% 82%
Finance other primary metals finance energy lumber
23% 23% 14% 11% 10% 81%
Insurance insurance
other
primary metals lumber energy
90% 3% 3% 1% 1% 98%
Other consumer
services
other consumer
services
other
primary energy lumber clothing
58% 7% 6% 6% 5% 83%
Transport transport metals other primary energy lumber
60% 23% 6% 4% 3% 95%
Water metals
other
primary energy
chemical
s lumber
50% 15% 11% 7% 6% 89%
Source: World Bank Export of Value Added Database
Note: OBS = other business services
8 The weak linkages of business services and ICT with other sectors of the economy is likely, and to some extent
related to the lack of available specialized professionals in the economy (for a detailed discussion on links between
skills, labor market outcomes and trade, see Ruppert Bulmer and Hollweg (2015).

23
II. Assessment of Services Value-Added Linkages
30. Good quality, efficient and productive inputs are important for a firm’s or sector’s
export competitiveness. Because of the value chain linkages between sectors of an economy,
the competitiveness of an upstream sector that is used as inputs to production is one important
factor for the competitiveness of other downstream sectors. Intermediate inputs from the services
sector could include, for example, a manufacturing firm hiring engineers for the design of its
exports, the supply of utilities such as water and electricity for crop production in agriculture, or
an agricultural producer hiring a trucking service to transport its crops to a market or port for
export. Agriculture may also contribute to manufacturing value added, for example, if
domestically grown fruit is processed into beverages. And manufacturing may supply inputs to
services or agriculture exports, for example, in the form of machinery. If these inputs are
supplied by domestic providers (as opposed to being imported), then these show up as
domestically-produced value added inputs in manufacturing, agriculture, or service’s exports
(what we refer to as value-added linkages).
31. Availability and distribution of services inputs – including finance, electricity and
water supply – is perceived as an obstacle to manufacturing sectors’ performance in Lao
PDR. As will be discussed in Section IV of this report, inadequate and unstable provision of
electricity and water services, severely constrains the competitiveness of manufacturing firms.
Limited access to finance is also an obstacle to firms’ performance, which as will be shown
below, acts as a tax on firm productivity. All else equal exporters are more likely to perceive the
quality of services in Lao PDR as an obstacle to their operations (See Section IV).
32. Section III explores the importance of the services sector for Lao PDR from the
second role that services play: as an input into other productive sectors, in particular
manufacturing. It addresses the following questions. What are the linkages between the services
and the manufacturing and agriculture/mining sectors in Lao PDR and how do they contribute to
export competitiveness? Do the manufacturing and agriculture/mining sectors have adequate
availability of services imports? And are regulatory constrains in the services sector inhibiting
the ability of manufacturing and agriculture/mining activities to use services as inputs?
33. The objective of this analysis is to provide information on this often hidden
relevance that the services sector has in the economy. It does so from the forward and
backward angles: the services sector’s role in ‘supporting’ other activities through value addition
(forward); and how this impacts the manufacturing and agriculture sectors ability to ‘pull’
contributions from other sectors to transform them into a particular output (backward).
34. There are many examples of how countries have developed services as both a source
of export diversification and upgrading, proving important case studies from which Lao
PDR can learn. Box 6 provides an example of Uruguay, a country that used services to diversify
its export basket away from natural resource intensive products to higher value-added activities.
By doing so, it also created the opportunity for services to be used as inputs to the production of
its goods exports.

24
35. Many factors matter in determining the potential of Lao PDR’s structural
transformation, the quality of services provision being one among them. There are other
factors, aside from the one being the focus of this report that matter in determining the potential
for diversification and upgrading of the export basket. As it has been argued, key for
diversification of export and production structures is the diversification of the country’s asset
portfolios that include natural resources, in which Lao PDR is rich, but also physical and human
capital as well as public institutions (Gill et al, 2014). In terms of human capital, for example,
Lao PDR has substantial room for improvement. Education and skills available in the labor
market, for example, have been identified as key constraints in the context of Lao PDR. Other
factors related to public institutions such as macro instability and a business climate that is not
fully conducive to investment and innovation also may play a role Lao PDR’s context.
36. In fact, insufficient skills has been identified as the main impediment to private
sector growth in Lao PDR. A recent Investment Climate Assessment (World Bank 2014b)
suggest that the natural resource boom from which Lao PDR has benefitted over the past years
has concealed to some extent the costs of inadequate workforce education and skills, which, they
argue, lag behind those of comparators and constrain private sector growth. Low literacy rates,
for example, have negative and likely long-term effects on the productivity of Lao PDR workers,
as literacy is key for other skills acquisition. This limits the potential for diversification into more
sophisticated activities, as exporting firms cannot hire workers with the right skills, discouraging
investment in productive technologies.9
Box 6: Services exports as a vehicle to diversify into more sophisticated activities
The case of small and remote Uruguay’s diversification and upgrading into services is relevant for Lao
PDR. Although boasting a higher level of development, Uruguay is a three-million-inhabitant country, abundant
in natural resources (fertile land), with an export basket that has been highly concentrated in natural resource
intensive products (leather, beef, wool, and more recently soybeans and wheat), since the incorporation of cattle
by the Spanish colonizers in the early 1600s. This concentration has spurred the debate about how to diversify the
export basket and increase its sophistication.
Services, and in modern services in particular such as information and communications technology (ICT)
related ones, have been crucial in reducing the country’s dependence on natural resource intensive exports. During the last decade, services exports increased more than four-fold, from 745 million USD in 2002 to 3158
million USD in 2013. Within services, ICT related exports increased from 14 million USD in 2002 to 180 billion
USD in 2013, accounting now for almost 6 percent of services exports. ICT, jointly with other business services,
has become the third most important services sector after travel and transport, with a consolidated comparative
advantage.
The successful internationalization of modern services firms in Uruguay has been crucial for development. In these activities, remoteness and scale – two important constraints for Uruguayan exporters of merchandise –
are less likely to be constraints for scaling up. The sector, made up of about 350 firms producing and selling
products and services to 55 markets (Betarte, Cancela, and Moleri, 2008), briefly became the largest software
exporting cluster in Latin America, and still ranks first in terms of per capita exports. More importantly, it is the
first time in Uruguay’s history that knowledge accumulation at the national level has generated significant
exports that are not based on natural resources. Further, the dynamic sector has contributed its know-how for the
sophistication of natural resource intensive exports.
9 See Pillar 3 of the Lao PDR Trade and Competitiveness Analytical Program FY 14-16 (Ruppert Bulmer, E. and
Hollweg, C., 2015) for a discussion on skills, labor outcomes and trade in Lao PDR. In that report, the authors
recommend policies to, inter alia, increase educational attainment, more support for basic education, curricula
reform to meet market demand, and aligning vocational training to private sector demand.

25
The case of Uruguay provides an example of the importance of services for diversification and upgrading
in its dual role as a direct supplier of final goods, but also through the inputs to other sectors. Knowledge-
intensive services sectors have provided key inputs for resource intensive export products such as boneless beef.
In Uruguay, the software industry played a key role in the implementation of the bovine full traceability system
that allows identification of the calves from birth to the meatpacker that allows Uruguayan beef to secure high
prices in high-end international markets.
Which policies and market conditions have contributed to the development of the ICT sector in Uruguay?
While there is no rigorous assessment of the different factors behind the dynamism of the ICT sector in Uruguay,
there is some consensus on the following contributing factors of success:
1. A successful first mover that quickly scaled up and internationalized and showed potential entrants that the
business was profitable (decreasing ‘discovery costs’) (Snoeck and Pittaluga, 2012);
2. While at the beginning of the development of the cluster there was no specific public support or incentives,
the sector benefited from the patronage of the public sector;
3. Tax exemption incentives, after the export take-off period, and the setting up of Special Economic Zones
where export-oriented firms could operate under beneficial tax conditions, helped form a geographical
cluster.
4. The presence of well-qualified professionals in the country was an important factor of success. These
professionals combined a high level of technical education with in-depth knowledge of specific sectors,
putting them in an excellent position to tune into the growing market for sector-specific software applications
and services (Kesidou and Romijn, 2008). This has been followed by coordination between the private and
public sector and the skill providers to adapt the teaching curricula to the needs of the sector.
5. Support to internationalization of firms – including the work of the export promotion agency, Uruguay XXI,
in co-financing search of information about foreign markets and potential clients, as well as developing
global business plans.
a. Inputs into and from agriculture, manufacturing and services sectors
The share of domestically-supplied inputs from the services and manufacturing sectors for
domestic production and exports are the lowest in Lao PDR relative to peer countries, and
instead domestically-supplied inputs are of agriculture and mining. The vast majority of inputs
go to manufacturing production (81%), but of all domestically-supplied inputs that go to export
activities, only 45% go to manufacturing exports. The share going to the services sector is the
lowest of all peer countries.
37. Lao PDR’s services sector provides relatively little support to productive activities. Services supply about a quarter of all domestic intermediate inputs to economy-wide production
when measured in terms of their value added contributions (26%) (Figure 19). This is a low
share by international standards. Lao PDR’s production is more reliant on primary activities as
inputs than services and manufacturing; more than two thirds of all inputs into productive
activities are from the agriculture (48) and energy extractions and minerals (20%) sectors.
Manufacturing supplies only 6% of intermediate inputs into Lao PDR’s domestic production.
38. More than three quarters of all domestic intermediate inputs are supplied to
manufacturing. Looking conversely at where domestic inputs are supplied to, over 80% of all
inputs are pulled together by manufacturing activities. In Lao PDR, only 12% of all domestic
inputs (from services, manufacturing or primary production) are pulled together by Lao PDR’s
domestic services sector. Agriculture accounts for only 3% and energy extractions and minerals

26
only 4% of domestic input demand. The fact that few inputs go towards agriculture but that
agriculture supplies most of Lao PDR’s inputs is suggestive of the upstream nature of the sector.
Figure 19: Inputs from (left) and into (right) domestic production in Lao PDR, 2011
Source: Authors’ calculations using the World Bank Export of Value Added Database.
39. This structure of value-added linkages in Lao PDR differs from most comparator
countries (Figure 20). Services linkages with domestic productive activities is lower in Lao PDR
than all comparator countries (26% of economy-wide intermediate inputs are of services).
Services’ share of inputs is highest in Botswana and Nepal (70%), Mongolia (63%), Bangladesh
(70%), and Thailand (51%). Instead, other countries rely substantially less on agriculture and
minerals and energy as inputs for exports. In Lao PDR, intermediate inputs supplied by the
agriculture and minerals and energy sectors are higher than all comparator countries (48% and
20% respectively). In Vietnam, Thailand, Botswana, and Bangladesh – countries with strong
textiles and apparel sectors – manufacturing plays a much larger role in providing inputs to the
economies’ domestic production. In Vietnam, for example, 23% of domestically produced inputs
are from the manufacturing sector, compared to 6% in Lao PDR.
All Intermediate
Inputs
48% from agriculture
6% from manufacturers 26% from
services
20% from energy / minerals
All Intermediate
Inputs
3% to agriculture
81% to manufacturers 12% to
services
4% to energy /
minerals

27
Figure 20: Inputs from productive sectors in peer countries, 2011
Source: Authors’ calculations using the World Bank Export of Value Added Database.
40. Lao PDR’s services, agriculture and minerals and energy extraction sectors use
relatively few domestically-supplied intermediate inputs, meaning growth of these sectors
in its current activities will have less of a pull on the domestic economy unless these
domestic linkages are strengthened. Agriculture and minerals and energy extraction activities
in Lao PDR demand only 3% and 4% of all domestic inputs provided to domestic production
(Figure 21). This is similar to peer countries, such as Botswana, Nepal and Vietnam. In addition,
the share of inputs pulled together by the services sector in Lao PDR is the lowest of peer
countries (12%). For example, in Vietnam, Thailand, and Cambodia – all countries with strong
tourism sectors – services absorb about 30% of all intermediate inputs. (In Botswana, Mongolia,
and the Philippines, this share is between 60 and 70%.) Manufacturing instead absorbs a higher
share of Lao PDR’s domestically-produced inputs than peer countries (81%).10
10
Backward linkages of manufacturing are also important in Cambodia (72%), Vietnam (65%) and Thailand (61%).
020
40
60
80
100
BGD BWA KHM LAO MNG NPL THA VNM
Inputs from agriculture Inputs from minerals/energy
Inputs from manufacturing Inputs from services

28
Figure 21: Inputs to productive sectors in peer countries, 2011
Source: Authors’ calculations using the World Bank Export of Value Added Database.
41. The structure of value-added linkages with export activities in Lao PDR is strikingly
different than that of domestic production. Primary activities and manufacturing exports now
absorb equal amounts of domestically-supplied inputs: 10% of all inputs are absorbed by
agriculture, 34% by energy extraction and minerals exports, and 45% by manufacturing exports.
Services exports instead absorb 9% of domestically-supplied inputs.
42. Understanding whether services provision in an economy is constraining
manufacturing or primary activities – and if so, why – is relevant from a policy perspective.
The ability for Lao PDR to integrate into the global economy, to achieve export-led growth in
non-commodity exports, and to reap the benefits that such growth has on labor markets and
poverty, will depend on achieving international competitiveness in non-traditional export sectors
of the economy. This includes direct exports of services, as well as manufacturing and
agricultural exports. And services are an important factor in the competitiveness of
manufacturing and agricultural exports. Exploring the linkages of services with these sectors, and
ultimately whether services are constraining productivity, will provide analytical support to the
government implementing policies to improving the efficiency of the services sector. The
regulatory environment in services is one primary example of polices that can impact the sector’s
efficiency.
43. There are many potential explanations for low services content of domestic
production and exports. For example, one possibility is that the forward services linkages in
Lao PDR are of low-value-added activities including wholesale and retail trade, hotels and
restaurants, and transport and storage. Another possibility is that Lao PDR’s export sectors are
not services-intensive sectors, or that Lao PDR’s position in these sectors’ GVCs is one that does
not demand high value-added services. For example, Lao PDR exports agricultural goods that
are positioned upstream in supply chains and create significant domestic value added. It may also
be that Lao PDR’s firms rely on imported services, or that Lao PDR’s agrarian economy is
distorting the manufacturing and services shares. The remainder of the analysis of Section III,
020
40
60
80
100
BGD BWA KHM LAO MNG NPL THA VNM
Inputs into agriculture Inputs into minerals/energy
Inputs into manufacturing Inputs into services

29
supported by firm-level interviews with private firms in both the manufacturing and services
sectors, shed light on these potential explanations.
b. Structure of domestic value added in total production and exports
A high share of domestic production is pulled together by the manufacturing sector in Lao PDR,
once considering the inputs that manufacturing absorbed from other sectors. Yet manufacturing
exports in Lao PDR are lower than in comparators in terms of their domestic value addition.
This contrast is explained by two sectors – beverages and tobacco and processed foods – which
generate important value for the domestic economy, but are not exported.
44. Lao PDR’s manufacturing sector relies less on domestic services inputs than in
comparator countries, when looking at either total manufacturing production or export-oriented
manufacturing. The structure of manufacturing in Lao PDR helps explain the structure of these
low linkages with services; Agri-based manufacturing sectors that generate most of the sector’s
value addition do so by pulling together value added from domestic agriculture and energy
extraction/minerals activities. The inputs that services supply to the agriculture and energy
extraction/minerals sector is about average for the country of its comparators.
45. We explore these linkages in more detail by focusing in particular on where services
inputs are supplied to, and where manufacturing and agriculture/energy
extraction/minerals inputs are supplied from. We look not just at the structure of these
linkages in total domestic production (value added), but also in the domestic production that is
exported. Such an analysis shows first how important each sector is for total domestic production
and exports of Lao PDR in terms of the value added they generate, and second how that value
added is generated (either directly within the sector, or through linkages with other sectors of the
economy).
46. The inputs that the services sector supplies to domestic production —an important
condition for competitive industry – are particularly low. The services sector contributed
over a quarter of Lao PDR’s domestic production in 2011 when considering forward linkages
(28%) (Figure 22, left). Other countries were over 40 percent.
47. In spite of this result, the structure of where these inputs are supplied to in the
domestic economy at large is similar to peer countries. Looking at the structure of value
added that services contribute to Lao PDR’s economy, 65% of services’ contribution to GDP is
generated directly within services sectors. This is close to the average of peer countries (69%).
About a fifth of services’ contribution to GDP is explained by inputs into manufacturing (18%).
This is similar to Bangladesh, Cambodia and Thailand. The share of services into primary
activities (mostly energy extractions and minerals) though is slightly above peer countries: 5% in
Lao PDR, whereas most peer counties were below 3%.
48. A different picture emerges when looking at the inputs that the services sector
supplies to exports. While continuing to generate lower value added, the structure of the
linkages of services sector in exports is strikingly different. The services sector supplied just
under a quarter of Lao PDR’s exported value added in 2011 (22%) (Figure 22, right). Services

30
exports generated lower value added directly (35% of total services exported value added) than
in peer countries such as Nepal (56%) and Cambodia (46%). Looking specifically at the value
added that services export, 42% of services value added is exported through manufacturing (9%
of total exported value added in Lao PDR) and 19% through primary production activities
(again, mostly energy extractions and minerals). In contrast, the share of total exported value
added that comes from services inputs into manufacturing in Bangladesh is 72%, Thailand 56%
and Cambodia 48%. The linkages the services generate with each other in Lao PDR (3% of total
services exported value added in Lao PDR) is the lowest of all countries.
49. Policies can be used to strengthen the linkages between the services sector and other
sectors of the economy that involve provision of information, and more importantly,
building up skills. This can include, for example, programs to match buyers with sellers.
Providing market information, and reducing information asymmetries, should be considered too.
For example, from interviews with manufacturing firms, some appeared unaware of types of
services activites that could benefit them, such as accounting advice for bookkeeping, advertising
services including printing and designing brochures, or legal advice. If such policies are
introduced, they should also be subject to impact evaluation analysis. But in addition to the
provision of information, it is also important to improve the human capital available in the
country. This requires a combination of improving vocational and tertiary education in the
country, in the long run, and, in the meantime, facilitating the entry of foreigners with relevant
skills for Lao PDR.
Figure 22: Composition of services value added (forward linkages), 2011
Source: World Bank Export of Value Added Database
020
40
60
BGD BWA KHM LAO MNG NPL THA VNM
Domestic production
020
40
60
BGD BWA KHM LAO MNG NPL THA VNM
Exports
Direct value added Inputs to agriculture
Inputs to energy/minerals Inputs to manufacturing
Inputs to services

31
50. A high share of domestic value added is created by the manufacturing sector in Lao
PDR, once considering the inputs that manufacturing pulls together from other sectors
(Figure 23). In fact, 49% of domestic output is of manufacturing, higher than all peer countries.
This is no surprise, given that the manufacturing sector in Lao PDR demands 81% of all
domestic inputs. It is also no surprise, then, that a low share of manufacturing’s value added
comes directly from the manufacturing sector (37%). This is only above Bangladesh and
Mongolia. In Vietnam, for example, 50% of manufacturing sector’s value added is created
directly, and 57% in Thailand.
51. However, a low share of total exported value added is from the manufacturing
sector in Lao PDR relative to comparators. While 45% of domestic value added in exports is
from the manufacturing sector, but this is below other countries like Bangladesh (88%),
Cambodia (76%), Thailand (80%) and Vietnam (64%). Almost half of this value added is
generated directly within the manufacturing sector (48%).
52. Lao PDR’s manufacturing sector relies less on services inputs than in comparator
countries, both for domestic production and export-oriented activities. Services inputs
represent about 10% of the total value added of manufacturing output. This is much lower than
the world average, where services typically represent about one-third of the value of
manufacturing. It is also much lower than most peer countries with the exception of Vietnam.
For example, in Bangladesh services represented 31% of manufacturing domestic value added,
and between 17%-22% in all other countries. Services instead represent about 21% of
manufacturing exports, suggesting that services are better used as inputs by export activities in
Lao PDR than those focused only on the domestic market, and that to grow manufacturing
exports it is important to have a competitive services sector.
53. Instead, manufacturing production in Lao PDR is heavily reliant on inputs from
energy extractions and minerals, and to a lesser extent agriculture. In fact, 51% of
manufacturing value added generated within the country is composed of inputs from the primary
sector. This is higher than all peer countries, though Mongolia was the closest comparator (at
48%). Bangladesh, Cambodia, Nepal, Thailand, and Vietnam all have stronger linkages between
their agricultural and manufacturing sectors.
54. Agriculture and energy extraction/minerals activities in Lao PDR are important for
domestic and exported value added (Figure 24). Once considering the inputs that agriculture
and energy extraction/minerals activities pull together from other domestic sectors, agriculture
and energy/minerals are responsible for 28% of domestic production and 46% of exported value
added. Similar to peer countries, this value added is created almost entirely within the sector
(91% of domestic production and 87% of exports). This helps explain the low inputs that this
sector demands from the economy at large. The observation that exports of this sector demand
more inputs than in the domestic economy is probably due to the structure of the manufacturing
sector, not the structure of primary activities. Put another way, the domestic production of
manufacturing relies more on inputs than export activities, i.e. export activities create more direct
value addition than what is destined to the domestic economy. The services supplied to
agriculture and energy/minerals output is about average of its comparators (5% for domestic
production and 9% for exports), though this is higher in Thailand (14%).
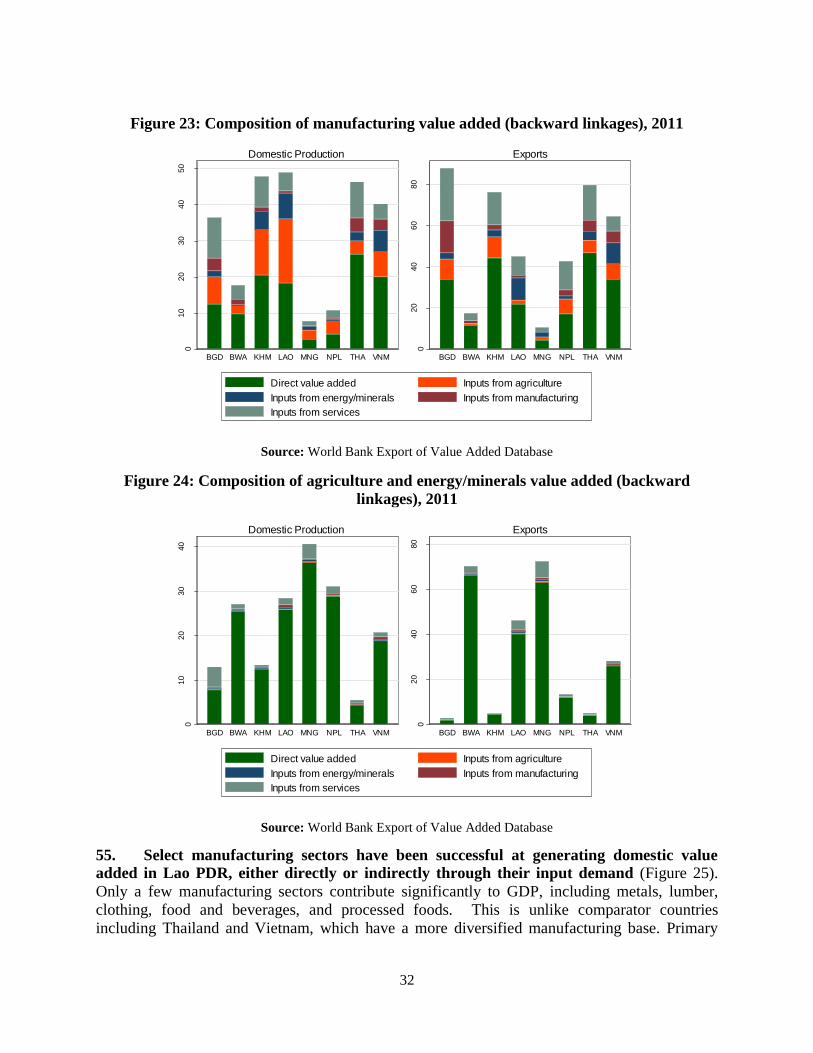
32
Figure 23: Composition of manufacturing value added (backward linkages), 2011
Source: World Bank Export of Value Added Database
Figure 24: Composition of agriculture and energy/minerals value added (backward
linkages), 2011
Source: World Bank Export of Value Added Database
55. Select manufacturing sectors have been successful at generating domestic value
added in Lao PDR, either directly or indirectly through their input demand (Figure 25).
Only a few manufacturing sectors contribute significantly to GDP, including metals, lumber,
clothing, food and beverages, and processed foods. This is unlike comparator countries
including Thailand and Vietnam, which have a more diversified manufacturing base. Primary
010
20
30
40
50
BGD BWA KHM LAO MNG NPL THA VNM
Domestic Production
020
40
60
80
BGD BWA KHM LAO MNG NPL THA VNM
Exports
Direct value added Inputs from agriculture
Inputs from energy/minerals Inputs from manufacturing
Inputs from services
010
20
30
40
BGD BWA KHM LAO MNG NPL THA VNM
Domestic Production
020
40
60
80
BGD BWA KHM LAO MNG NPL THA VNM
Exports
Direct value added Inputs from agriculture
Inputs from energy/minerals Inputs from manufacturing
Inputs from services

33
agriculture, metals and other primary sectors, notably electricity generation, all contribute
significantly to GDP in Lao PDR.
56. Most of the value addition of agri-based manufacturing sectors is done so by pulling
together inputs from domestic agriculture activities. This includes beverages and tobacco and
processed foods, which rely on domestic inputs of agricultural production. For example, 46% of
the value added generated by beverages and tobacco is done so from domestically supplied
agriculture. This reliance is even higher in processed foods (64%). Instead, lumber does not rely
on domestic agriculture/forestry/fishing, but instead on energy extractions and minerals (which
creates 83% of the sector’s domestic value addition).
57. The contrasting structure of domestic production and exports in manufacturing
value added is explained by beverages and tobacco products, and processed foods. Both of
these are very important for domestic production, but are not exported. In addition, agriculture
has low export intensity, where a small share of what is produced domestically is exported (at
least by formal channels). In contrast, energy extraction and minerals have high export intensity,
where a high share of what is produced domestically is exported. Creating export opportunities
for these manufacturing sectors would have large benefits for the agriculture sector, as well,
given the strong backward linkages. Instead, the output of other sectors, including clothing,
energy/minerals, lumber, metals and other primary products, is almost entirely for the export
market.
58. The structure of manufacturing in Lao PDR helps explain the structure of these low
linkages with services. First, many sectors rely heavily on agriculture and other primary
industries as inputs, rather than services. For example, in clothing, beverages and tobacco, other
primary agriculture, primary agriculture, and processed foods, services inputs represent less than
10% of the sector’s output. Most notably, the percent of services in agriculture is only 2% of
total value added generated. Second, Lao PDR’s manufacturing sectors have few linkages among
themselves, unlike other countries including Thailand and Vietnam. In Lao PDR, inputs from
other manufacturing sectors represent only 1% of manufacturing’s total contribution to value
added, while this number is closer to 10% in Vietnam, Thailand and Bangladesh.
59. Particular activities in Lao PDR do rely heavily on inputs from services sectors.
Metals rely little on inputs from primary production, and instead services represent about 30% of
the sector’s domestic value added brought forward. The energy/minerals sector also relies on
inputs from services (32%).

34
Figure 25: Composition of domestic (left) and exported (right) value added by sub-sectors
in levels (top) and shares (bottom), 2011
Source: World Bank Export of Value Added Database.
0 1,000 2,000 3,000
transpequip
textiles
procfoods
primaryagr
paperpub
otherprim
othermanuf
nonmetmin
metals
machinery
lumber
leather
fabmetals
energy
clothing
chemicals
bevtobacco
Domestic Production
0 1,000 2,000 3,000
transpequip
textiles
procfoods
primaryagr
paperpub
otherprim
othermanuf
nonmetmin
metals
machinery
lumber
leather
fabmetals
energy
clothing
chemicals
bevtobacco
Exports
Direct value added Inputs from agriculture
Inputs from energy/minerals Inputs from manufacturing
Inputs from services
0 20 40 60 80 100
procfoods
primaryagr
otherprim
metals
lumber
energy
clothing
bevtobacco
Domestic Production
0 20 40 60 80 100
procfoods
primaryagr
otherprim
metals
lumber
energy
clothing
bevtobacco
Exports
Direct value added Inputs from agriculture
Inputs from energy/minerals Inputs from manufacturing
Inputs from services

35
c. Composition of services value added in manufacturing exports
High quality, efficient and productive services inputs are important for a firm’s competitiveness.
In Lao PDR, most services inputs to manufacturing production and exports are ‘traditional’
services. Modern services instead contribute little inputs to manufacturing. Development of
financial and communication services in particular is lagging, rendering the inputs to
manufacturing low.
60. At the same time, though, evidence suggests that the structure of the services sector
in Lao PDR may also be a constraining factor for manufacturing. High quality, efficient and
productive services inputs are important for a firm’s competitiveness. But as further analysis will
show, the availability of services inputs are perceived as major obstacles by manufacturing firms
in the country. Not having access to such services may be preventing manufacturing from
moving into higher value-added activities.
61. The garment sector is one example where access to productive services are
important for value addition. The most basic activity in apparel is cut-make-trim. It is a form
of contract work in which a foreign buyer pays fees to the garment factory to carry out the labor
intensive task of cutting the fabric, sewing the garments, trimming and packing. All inputs are
arranged and paid for by the foreign buyer. This contrasts free-on-board activities, where the
garment factories are themselves responsible for the whole process of production including
sourcing their own inputs. However, firms need to be in a much stronger financial position to
undertake free-on-board activities, and lack of access to finance may inhibit firms from
upgrading from cut-make-trim to free-on-board. The next step in upgrading in the apparel
industry is original design manufacturing, where garment factories need to perform much more
sophisticated services such as R&D, design, advertising and marketing.
Box 7: International experiences of upgrading in apparel
Bangladesh is often cited as an example of a country that has successfully moved from CMT to FOB.
Bangladesh has one of the largest apparel export industries in terms of value ($22.8 billion) and global market
share, accounting for 6.4 percent of global apparel exports in 2012 (UNSD, 2014a). The apparel industry is also
extremely important to the economy, accounting for 83 percent of total merchandise exports (UNSD, 2014e) and
employing 4 million workers in 2012 (BGMEA, 2014). Today, the industry is dominated by locally owned firms,
accounting for over 90 percent of firms in Bangladesh (BEPZA, 2013; Yunus and Yamagata, 2014). Many of
these firms do FOB activites, but this was not always the case. FDI played a central role in initiating the industry
by providing linkages to foreign buyers, technology, and knowledge transfer.
Moving from CMT to FOB for an exporter typically requires the company to (1) have direct access to
buyers in foreign countries, and (2) access to finance to purchase the textile inputs. From a country
perspective, the firm location also needs to be the headquarters location or a single location of a domestic
company. Having direct access to buyers can happen through initial relationships through an agent or by
attending things like trade shows. Access to inputs can also be facilitated via EPZs that enable duty-free imports
if products are exported, however this limits backward linkages to building a textile industry.
To move from CMT or FOB to ODM, firms will often sell to the domestic or regional market. This was the
case for some of the Vinatex firms in Vietnam, for example. However, there have been very few, if any, real
examples to date of foreign (meaning Asian, Latin American, or African) firms moving to Original Brand
Manufacturing (OBM) for the US and European market.

36
62. Skills investment is one policy area that can be used to improve the services sector’s
linkages in an economy. As argued before, skills’ scarcity has been identified as a key
constraint for private sector growth in Lao PDR (World Bank, 2014b). Both individual and firm
level skills are relevant for the competitiveness of the services sector. The quality of labor is
another important factor affecting the performance of the services sector, given that many
modern services activities rely on a skilled workforce. For example, to upgrade in textiles and
garments, firms need to rely on a workforce that can do original design, accounting activities, or
marketing. At the level of the firm, “skills” are also important in terms of ability to comply with
international standards required to export.11
63. And it’s not just the garment sector, either. In fact, anecdotal evidence through firm-
level interviews suggest that services are constraining the performance of the energy/minerals
sector as well. For example, companies that process heavy metals such as iron into steel need a
strong energy supply, as this activity is extremely energy-intensive. Not having a sufficient
energy supply will inhibit vertical integration of the sector within the country, and lengthening
the domestic value chain of the sector to produce not just iron but stainless steel also.
64. Insufficient access to energy and electricity is also a constraint for manufacturing to
diversify and grow in Lao PDR. Lao PDR relies nearly 100 percent of hydropower which has
huge potential (in fact Lao PDR is an exporter of electricity). However, some constraints related
to the power grid make distribution not fully reliable.12
Anecdotal evidence gathered from an
energy company that in fact there were 10 energy/minerals companies on a waiting list for
energy supply (in this respect pricing may play a role – if firms were willing to pay higher prices
per kilowatt the constraint may be somehow relaxed). Interactions with energy experts revealed
that while the generation capacity exists, there is space to improve the reliability of transmission
and distribution grid through further investments.
65. In Lao PDR, most inputs to manufacturing production and exports are ‘traditional’
services. Comparing the composition of intermediate services that are embedded in
manufacturing exports reveals that Lao PDR relies on ‘traditional’ services activities such as
distribution/trade and transport (Figure 26). In fact, on average almost 90% of the services inputs
embedded in manufacturing exports are traditional. This finding is the highest among peers,
though other economies’ manufacturing production and exports relies heavily on wholesale and
retail trade as well as transport. This includes Bangladesh, Nepal, and Cambodia.
11
On a related matter, Ruppert Bulmer and Hollweg (2015) report that a garment skills development center was
established by Lao PDR Government under the World Bank-led Trade Development Facility to provide skills
training to garment factory employees covering technical and management skills. While the cost-sharing program
was initially embraced by a sizable number of employers, the authors’ report, subsequently demand fell and the
center has been unable to transition to financial independence following the subsidy period, even when it diversified
its course offerings (page 41). 12
For example, anecdotal evidence suggested some inconsistencies in distribution along the year, with supply falling
short of demand in the dry months.

37
66. Modern services instead contribute little to manufacturing value added. Development of financial and communication services in particular is lagging, rendering the
intermediate inputs supplied to manufacturing low. Only 3% of services linkages with
manufacturing production are of financial intermediation in Lao PDR, compared to 15% in
Thailand, 8% in Vietnam and 5% in Cambodia. In Vietnam, for example, communication
services represent about 10% of the services inputs into manufacturing production, compared to
3% in Lao PDR. These shares are significantly lower than all countries including those at a
similar development level.
67. In none of the firm-levels interviews did access to finance emerge as lack of supply,
as there is sufficient credit available in the domestic market. Rather, firms complaining about
lack of finance seems to be more of an issue of creditworthiness of the firm. One consulting
company stated that although firms may be in a strong financial position to borrow, they do not
have their books in order which prevents them from getting a loan. Such accounting activities are
an example of a services that can be supplied by an accounting firm.
Box 8: Ethiopian Airlines – A success story
Ethiopian Airlines provides another successful example of a services sector that contributes jointly to
export diversification, and an important input into manufacturing and agricultural exports. Similar to the
ICT sector in Uruguay (see Box 6), the airlines sector in Ethiopia performs the dual role of services. Pushed the
growth of the agricultural sector. The airline sector has driven Ethiopia’s strong growth in direct exports of
services, and helped link the landlocked country’s agricultural sector with the world economy.
Services exports are booming largely due to Ethiopian Airlines. Ethiopia is among the few developing
countries where services exports are as important as goods. Between 2005 and 2012, the services-to-goods export
ratio hovered around one, implying that services exports were as large as goods exports. Services exports are
dominated by transport (63 percent), followed by construction (15 percent), other business (10 percent), travel (5
percent) and insurance (4 percent). The majority of services export is attributed to Ethiopian Airlines, which is
Ethiopia’s biggest export earner—three times as big as coffee. Ethiopian Airlines commenced operations in 1946,
and is one of the fastest growing companies in the airline industry. Today, Ethiopian Airlines serves a network of
82 passenger destinations —19 of them domestic— and 23 freighter ones.
Ethiopia’s expansion of horticulture marks a spectacular export success of the past decade that grew
alongside Ethiopian Airlines. With the help of Ethiopian Airlines, an entire industry grew from one firm in 2000
to about 100 firms a decade later, contributing exports worth over US$200 million and supporting the livelihoods
of 250,000 people. Ethiopia’s flower exports increased 28 times in value between 2004/05 and 2013/14. Indeed, a
decisive factor in the exponential growth of the flower industry is the expansion of Ethiopian Airlines’ cargo
capacity and passenger flights. Flowers are cut and then flown overnight to foreign markets to be available the
following day for sale. While over 80 percent of the flowers are destined for the Dutch auctions, there have been
recent efforts to seek new markets. With a functioning air cargo system now in place, the experience of the flower
industry could be relevant to developing new (diversified) export opportunities, which are in close “proximity” to
flowers. New routes opened by Ethiopian Airlines, such as South Korea and Singapore often determine the
direction of this search.
Source: World Bank (2014c).

38
Figure 26: Composition of domestic services inputs into manufacturing production by
country, 2011
Source: World Bank Export of Value Added Database.
Figure 27: Composition of domestic services inputs into manufacturing exports by country,
2011
Source: World Bank Export of Value Added Database
68. The low use of financial services as inputs for production or export is also consistent
across different manufacturing sectors. The structure of services inputs into manufacturing, by
type of services sectors, is fairly similar across the important export sectors for Lao PDR (Figure
28); the reliance on traditional services activities continues to hold. Energy/minerals, metals,
primary agriculture, and other primary products rely more heavily on services inputs, as well as
inputs of the utility sector. Communication services appear to be more important for other
primary (energy/minerals) production.
0%
10%
20%
30%
40%
50%
60%
70%
80%
90%
100%
BG
D
BW
A
KH
M
LA
O
MN
G
NP
L
TH
A
VN
M
Other services
Other consumer services
Business services & ICT
Insurance
Finance
Communication
Transport
Distribution
Construction
Water
0%
10%
20%
30%
40%
50%
60%
70%
80%
90%
100%
LAO BGD BWAKHMMNG NPL THA VNM
Other services
Other consumer services
Business services & ICT
Insurance
Finance
Communications
Transport
Distribution
Construction
Water

39
Figure 28: Composition of services value added by sector in Lao PDR, 2011
Source: World Bank Export of Value Added Database.
69. In none of the top sectors are modern services activities important (top five) inputs. Table 4 looks at the top five inputs into exports of manufacturing sectors in Lao PDR. For
example, 42% of the value added that is exported by the beverages and tobacco sector is
generated directly within the sector, while 29% is from primary agriculture inputs. For metals
and lumber, distribution is the second most important input. In the other manufacturing sectors,
distribution is the fourth most important input. Transport also enters as one of the top five inputs.
Table 4: Top 5 inputs in Lao PDR manufacturing exports, 2011 (backward linkages)
Downstream sector
Top 5 upstream industries exported in downstream sector’s value added (% of sector’s backward linkages)
% in top 5 industries
Beverages and tobacco beverages and tobacco primary agriculture other primary distribution transport
42% 29% 18% 7% 2% 97%
Clothing clothing primary agriculture textiles distribution transport
69% 10% 9% 7% 1% 97%
Wood products other primary distribution lumber transport primary agriculture
81% 8% 3% 2% 1% 95%
Metals metals distribution transport water OBS, ICT
68% 18% 8% 2% 1% 97%
Processed foods primary agriculture processed foods other primary distribution transport
53% 30% 10% 4% 1% 99%
Source: World Bank Export of Value Added Database
Note: OBS = other business services
70. The support that financial intermediation and communications provides to
manufacturing export activities is, by international standards, underdeveloped. The share
of domestic financial services in manufacturing exports, as well as post and telecommunication
services, is below expected levels when benchmarking against countries of similar development
0 20 40 60 80 100
procfoods
primaryagr
otherprim
metals
lumber
energy
clothing
bevtobacco
Domestic production
0 20 40 60 80 100
procfoods
primaryagr
otherprim
metals
lumber
energy
clothing
bevtobacco
Exports
water construction distribution
transport communication finance
insurance OBS, ICT Other private
Public

40
level (Figure 29). However, there is little correlation with GDP per capita and input use of
financial services – meaning that financial services are equally important inputs for export
competitiveness in developed and developing countries alike. On the other hand, R&D and other
business services and computer activities are strongly correlated with GDP per capita, where Lao
PDR slightly underperforms countries of similar development level. The use of water, transport
and distribution services is higher in Lao PDR than the average country. The manufacturing
sector’s use of transport and distribution services is above expected levels given Lao PDR’s level
of economic development.
Figure 29: Benchmarking the composition of indirect services value added embodied in
gross manufacturing exports, 2011
BGD
BWAKHM
MNG
NPL THAVNMLAO05
10
15
20
25
Serv
ices V
A s
hare
6 8 10 12
Log GDP per capita (current USD)
Construction
BGD
BWA
KHM
MNGNPL
THA
VNM
LAO
05
10
15
Serv
ices V
A s
hare
6 8 10 12
Log GDP per capita (current USD)
Other consumer services
BGD
BWA
KHMMNG
NPLTHA
VNM
LAO
05
10
15
Serv
ices V
A s
hare
6 8 10 12
Log GDP per capita (current USD)
Water
BGD
BWA
KHM MNGNPL THA
VNM
LAO
02
04
06
08
0
Serv
ices V
A s
hare
6 8 10 12
Log GDP per capita (current USD)
Business services & ICT
BGD
BWA
KHM
MNG
NPL
THAVNM
LAO
01
02
03
04
0
Serv
ices V
A s
hare
6 8 10 12
Log GDP per capita (current USD)
Transport
BGD
BWA
KHM
MNG
NPL
THA
VNM
LAO
02
04
06
0
Serv
ices V
A s
hare
6 8 10 12
Log GDP per capita (current USD)
Finance
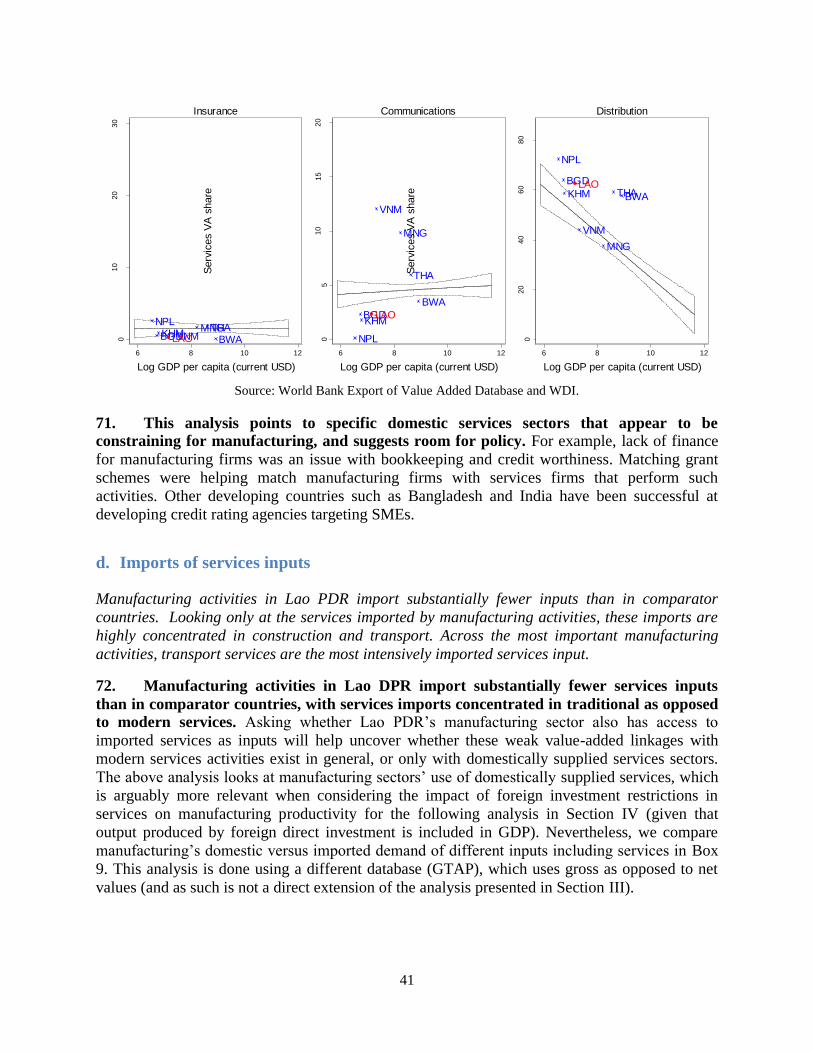
41
Source: World Bank Export of Value Added Database and WDI.
71. This analysis points to specific domestic services sectors that appear to be
constraining for manufacturing, and suggests room for policy. For example, lack of finance
for manufacturing firms was an issue with bookkeeping and credit worthiness. Matching grant
schemes were helping match manufacturing firms with services firms that perform such
activities. Other developing countries such as Bangladesh and India have been successful at
developing credit rating agencies targeting SMEs.
d. Imports of services inputs
Manufacturing activities in Lao PDR import substantially fewer inputs than in comparator
countries. Looking only at the services imported by manufacturing activities, these imports are
highly concentrated in construction and transport. Across the most important manufacturing
activities, transport services are the most intensively imported services input.
72. Manufacturing activities in Lao DPR import substantially fewer services inputs
than in comparator countries, with services imports concentrated in traditional as opposed
to modern services. Asking whether Lao PDR’s manufacturing sector also has access to
imported services as inputs will help uncover whether these weak value-added linkages with
modern services activities exist in general, or only with domestically supplied services sectors.
The above analysis looks at manufacturing sectors’ use of domestically supplied services, which
is arguably more relevant when considering the impact of foreign investment restrictions in
services on manufacturing productivity for the following analysis in Section IV (given that
output produced by foreign direct investment is included in GDP). Nevertheless, we compare
manufacturing’s domestic versus imported demand of different inputs including services in Box
9. This analysis is done using a different database (GTAP), which uses gross as opposed to net
values (and as such is not a direct extension of the analysis presented in Section III).
BGD BWAKHM
MNGNPL
THAVNMLAO0
10
20
30
Serv
ices V
A s
hare
6 8 10 12
Log GDP per capita (current USD)
Insurance
BGD
BWA
KHM
MNG
NPL
THA
VNM
LAO0
51
01
52
0
Serv
ices V
A s
hare
6 8 10 12
Log GDP per capita (current USD)
Communications
BGD
BWAKHM
MNG
NPL
THA
VNM
LAO
02
04
06
08
0
Serv
ices V
A s
hare
6 8 10 12
Log GDP per capita (current USD)
Distribution

42
Box 9: Imports of services by manufacturing activities
Different insights emerge when analyzing manufacturing’s domestic versus imported demand of different inputs
including services:
Manufacturing activities in Lao PDR import substantially fewer inputs than in comparator countries. Imported inputs represent only 7.5 percent of all inputs used in manufacturing production, compared to an
average of 13.8 percent across comparator countries. It reaches as high as 35.8 percent in Vietnam.
Looking only at the services imported by manufacturing activities, these imports are highly
concentrated in construction and transport. Lao PDR’s import structure contrasts other peer countries
(Figure 30). Interestingly, Lao PDR imports almost no financial services, contrasting Bangladesh, Mongolia,
Nepal and Vietnam. Imports of communication services are also low, also contrasting other countries such as
Bangladesh, Botswana, Cambodia, Mongolia and Vietnam.
Figure 30: Manufacturing sector’s imports of intermediate inputs, 2011
Source: GTAP
Across the most important manufacturing activities, transport services are the most important services
import (except metals which only uses water imports), ranging upwards of 90% of imports for processed
foods and beverages and tobacco sectors (Figure 31). As discussed in Section III, for example, manufacturing
firms rely heavily on Thai transportation companies, especially those involved in cross-border trade.
Communications are also important imported services for clothing production.
This analysis is done using gross as opposed to net values from GTAP. As discussed previously, gross trade data
capture cross-border trade (Mode 1) and consumption abroad (Mode 2) – what is reported in countries’ balance of
payments statistics. Services trade that takes place through FDI and temporary movement of people are not covered
in these data. For example, the finding that Lao PDR imports no financial services excludes financial services that
are provided by foreign banks that have established a local branch in Lao PDR.
As noted previously, distribution services (beyond wholesale and retail trade) include a range of different activites
including maintenance and repair of motor vehicles, repair of household goods, and hotels and restaurants. The
importance of tourism for the economy helps explain the importance of this sector when measuring exports on a
value added database. But it is also therefore no surprise to see low levels of distribution services imported by
manufacturing firms in Lao PDR, considering the fact that these statistics do not capture services provided
domestically by foreign companies established through direct investment (Mode 3).
0%
10%
20%
30%
40%
50%
60%
70%
80%
90%
100%
LAO BGD BWA KHM MNG NPL THA VNM
Water
Construction
Distribution
Transport
Communications
Finance
Insurance
Business & ICT
Other consumer services
Other services

43
Figure 31: Manufacturing sector’s imports of intermediate inputs, 2011
Source: GTAP
e. Services Trade Restrictiveness Index
Although Lao PDR does not maintain substantial limitations to foreign services providers, with
the exception of distribution and retail services, the level of regulatory restrictions in Lao PDR is
higher than expected given the country’s level of economic development, and size of the services
sector in GDP. High regulatory restrictiveness is associated with a lower gross and direct value
added contribution of services to an economy’s exports. However, they matter most for the
intermediate input supply of services, where fewer services are used as inputs to production by
the manufacturing sector in countries with more burdensome regulations.
73. High regulatory restrictiveness creates a reliance on domestic services as inputs for
manufacturing production. On average, low levels of services imports are associated with high
level of regulatory restrictiveness against foreign services providers. Services are at the very
heart of manufacturing global value chains, and many services are becoming sub-contracted
globally and nationally (known as the great unbundling), making foreign provision of these
services all the more important for manufacturing competitiveness. When particular services
aren’t available domestically, such as communications or financial services, restricting access to
imported services constrains the performance of manufacturing.
74. Relative to peers, Lao PDR does not maintain substantial limitations to foreign
services providers, though it is completely closed in distribution / retail services, but
0%
10%
20%
30%
40%
50%
60%
70%
80%
90%
100%
Water
Construction
Distribution
Transport
Communications
Finance
Insurance
Business & ICT
Other consumer services
Other services

44
relatively open in professional services. The World Bank Services Trade Restrictions Database
shows that Lao PDR exhibits average levels of restrictiveness against foreign services providers.
75. Nevertheless, Lao PDR does maintain restrictions across a range of sectors. Lao
PDR has restrictive policies in automobile and life insurance. In Lao, there was a 49 percent limit
on foreign ownership, and the licensing regime seemed burdensome as approval from the
Ministry of Planning and Investment, Ministry of Finance and Ministry of Industry and
Commerce were required. Like most ASEAN countries, Lao PDR has limited foreign investment
in fixed and mobile telecommunications services, and allows only a minority foreign share in
state entities. In retail, Lao is one of the few ASEAN countries that did not allow FDI in retail. In
education and medical services, in mode 4, Lao PDR and the Philippine required medical and
educational services to be provided by the nationals.
76. The World Bank Services Trade Restrictions Database collects and makes publicly
available information on services trade policy assembled in a comparable manner across 103
countries, five sectors (telecommunications, finance, transportation, retail and professional
services) and the key modes of service supply. The restrictiveness of the policy measures are
scored and quantified into a Services Trade Restrictiveness Index (STRI). A country is
considered completely closed if the STRI is 100, and completely open if the STRI is 0.
Cambodia maintains the most open regime – with an STRI of about 20 – while Thailand mains
the most restrictive regime – with an STRI of about 50.13
However, in Lao PDR, it is not so
much the restrictions themselves, but the implementation of the restrictions, as a regulatory
assessment that the World Bank has recently undertaken highlights (see Box 10).14
77. Nevertheless, Lao does maintain restrictions across a range of sectors. Lao PDR has
restrictive policies in automobile and life insurance. In Lao, there was a 49 percent limit on
foreign ownership, and the licensing regime seemed burdensome as approval from the Ministry
of Planning and Investment, Ministry of Finance and Ministry of Industry and Commerce were
required. Like most ASEAN countries, Lao PDR has limited foreign investment in fixed and
mobile telecommunications services, and allows only a minority foreign share in state entities. In
retail, Lao is one of the few ASEAN countries that did not allow FDI in retail. In education and
medical services, in mode 4, Lao PDR and the Philippine required medical and educational
services to be provided by the nationals.
13
There are many nuances that cannot be taken into account when quantifying policy measures into a restrictiveness
index, however. For example, restrictions to cross border financial transactions may be justified by a country’s level
of development or due to macroeconomic policy choices, but would nevertheless increase the STRI score for
financial services. The STRI also fails to account for complementary domestic reforms if a country is to reduce
restrictions to foreign services providers in a sector. This is the case for the insurance sector in Lao PDR, which has
an underdeveloped regulatory authority. 14
For example, Ward (2014), in a thorough assessment of the regulatory environment around services trade argues
that openness to services trade in Lao PDR is relatively low.

45
Figure 32: Services Trade Restrictiveness Index by sector (2012)
Source: World Bank Services Trade Restrictions Database.
78. Notwithstanding, the level of regulatory restrictions in Lao PDR is higher than
expected given the country’s level of economic development, and size of the services sector
in GDP (Figure 33). A negative relationship exists with each: more developed countries, who
also tend to have larger services sectors in their domestic economies, tend to impose fewer
services trade restrictions. With the exception of Cambodia and Mongolia, all comparator
countries impose greater regulatory restrictions on foreign services providers than the average
country at their level of economic development.
Figure 33: Services Trade Restrictiveness Index vs. GDP per capita (left) and share of
services in GDP (right)
Source: World Bank Services Trade Restrictions Database and World Bank World Development Indicators.
0
10
20
30
40
50
60
70
80
90
100
Bangladesh Cambodia Nepal Thailand Viet Nam Laos
Overall
Financial
Telecommunications
Retail
Transportation
Professional
BGD
BWA
KHM
MNG
NPL
THA
VNMLAO
02
04
06
08
0
Overa
ll S
TR
I
4 6 8 10 12
Log GDP per capita (current USD)
GDP per capita
BGD
BWA
KHM
MNG
NPL
THA
VNMLAO
02
04
06
08
0
Overa
ll S
TR
I
0 25 50 75 100
Services value added in GDP (%)
Services value added

46
79. There is some weak evidence that countries with burdensome regulations towards
foreign services providers also tend to export fewer services. High regulatory restrictiveness
is associated with a lower gross and direct value added contribution of services to an economy’s
exports, though the magnitude of the negative correlation is not large (Figure 34). Burdensome
regulations also matter for the services-manufacturing linkages, where fewer services are
used as inputs to production by the manufacturing sector in countries with more
burdensome regulations. The regulatory environment towards foreign services providers also
matters for the quality of domestically available services inputs. Regulatory restrictiveness
reduces the scope for competition in the sector, which in turn reduces the scope for the
introduction of cheaper, new, or better quality services inputs. Once considering the use of
services as inputs by other sectors, including manufacturing, the relationship with the regulatory
environment becomes significantly negative; fewer services are used as inputs to production by
manufacturing sectors in countries with burdensome regulations in services. The intensity of
services linkages with manufacturing in Lao PDR is low, even when considering the country’s
level of restrictiveness.
Figure 34: Services Trade Restrictiveness Index vs. GDP per capita (left) and share of
services in GDP (right)
Source: World Bank Services Trade Restrictions Database and World Bank World Development Indicators
80. This significant and negative relationship between regulatory restrictiveness and
services input use holds in particular for modern services, including communications and
other business and ICT services, but also for water and utilities. In fact, regulatory restrictiveness
is not correlated with distribution services or transport services.
81. Maintaining a liberal regime for trade and investment is important for
competitiveness. Openness in the services sector is part and parcel of a comprehensive growth-
enhancing trade policy. The benefits of liberalizing the services and goods markets are mutually
reinforcing, the full potential of each not being realized without adequate openness in the other.
Yet Lao PDR maintains some restrictions to FDI in crucial services sectors, remaining
completely closed in distribution and retail sectors (including restaurants). Furthermore,
BGD
BWAKHM
MNG
NPL
THA
VNMLAO
02
04
06
08
0
Se
rvic
es e
xp
ort
sh
are
0 20 40 60 80 100
STRI
Gross services exports
BGDBWA
KHMMNG
NPL
THA
VNMLAO
020
40
60
Se
rvic
es e
xp
ort s
ha
re
0 20 40 60 80 100
STRI
Direct services exports
BGD
BWA
KHM
MNG
NPL
THA
VNM
LAO
02
04
06
08
0
Se
rvic
es in
pu
t sh
are
0 20 40 60 80 100
STRI
Services inputs

47
restrictions to foreign firm entry into several tourism related activities, such as guest houses, are
still in place. In transport, adding flexibility to licensing procedures would help firms – for
example in the energy/minerals sector - that may want to opt for integrating the activity under
their main core business. Next we explore whether the quality of services provision may be
deterring firm’s productivity.
Box 10: Lao PDR’s WTO Liberalization and Regulatory Commitments in Services
Data on the STRI for Lao PDR and peers provide useful insights into the level of regulatory restrictiveness
against foreign services providers observed at the time of release of the indicators (2012). However, it is also
useful to look into the country’s liberalization commitments in services at the World Trade Organization (WTO)
to get a sense of the expected policy stance toward services trade and understand where the most important
challenges may lie ahead. This box presents a succinct summary of some of these issues, relying on a recent
regulatory assessment of services trade and investment for Lao PDR (Ward, 2014).
Lao PDR became a member of the WTO in 2013. The services sector was an important aspect in the country’s
accession negotiations. The types and levels of commitments undertaken are indicative of the areas and sectors in
which we can expect to see greater progress toward liberalization, and the more daunting implementation
challenges.
Overall, Lao PDR commitments under GATS feature relatively low sectoral coverage and rather shallow
obligations. Lao PDR has undertaken commitments on all modes of services supply in 10 sectors, including
business services, courier and telecommunication services, construction, distribution, private education,
environmental services, insurance, banking and other finances, private hospital services, tourism and air transport.
Most of these sectors have received at least a partial commitment. In only two subsectors, Lao PDR committed to
full liberalization across modes of supply: value-added telecomm services, including internet and data
transmission services; and computer services, including business outsourcing activities like IT consultancy,
software implementation and data processing. Real estate and other business services, audiovisual and
recreational services, and transport services remain largely uncommitted.
Lao PDR has made substantial use of the flexibility offered by GATS, for example, phase-out commitments
over transitional periods of 3,5, and 7 years from WTO accession. Indeed, in half of all committed services, Lao
PDR has made use of caps on foreign equity, ranging from 49 to 70 percent. These equity ceilings are subject to
transitional periods of 5-7 years, after which foreign majority participation will be allowed.
In telecommunications, Lao PDR undertook both liberalization and regulatory reform commitments. In
particular, the country committed to an ambitious 2-year transition period for the establishment of an institutional
and regulatory framework in line with the WTO “Telecom Reference Paper” that sets out principles and
institutional requirements needed for the regulation of the telecommunications sector, including aspects like rules
on access and use of telecomm infrastructure, the set-up of a regulatory body following international good
practices, and rules on anti-competitive behavior.15
A decree to this effect is currently (February 2016) still being
discussed in Lao PDR.
Regulatory reforms are crucial enabling factors for a liberal services trade regime to result in improved
services provision, and their implementation deserves substantial attention. Indeed, Ward (2014) suggests
that investors, both domestic and foreign, operate at a disadvantage due to difficulties in obtaining laws, sub-
regulations and instruments which fall below this level; and the inconsistent application of rules by different
officials on the same issues.
Strengthening the institutional capacity of the Government of Lao PDR, and its main regulatory agencies
is crucial. A sound and transparent regulatory framework will yield little results if the capacity of institutions is
not strong. Limited staff and budgets limits the agencies’ capacity to effectively respond to regulatory challenges.
15
The World Bank Group and other donors are supporting this process through the TDF-2.

48
However, serious efforts have been made to strengthen the regulatory quality, including the Law on Lawmaking
that provides clear guidance on making laws and rules below the level of laws and mandates stakeholder
consultations prior to regulatory change (Ward, 2014). The application of the rules and procedures as set forth in
this Law is likely to improve transparency and the legitimacy of regulations.
It is also important that regional liberalization commitments are compatible with multilateral ones.
Regional integration in services could potentially be a platform for a wider integration with the global
marketplace. It is important that multilateral (with GATS/WTO) and regional commitments (with AFAS) are
made compatible. While Lao PDR has made greater progress toward liberalization in the regional setting, some
inconsistencies (e.g. approval requirements in the regional setting, but not required at the multilateral setting;
minimum foreign ownership requirements at the regional setting, but not at the multilateral, etc.) suggest that the
negotiating strategies would benefit from further improved coordination unified although they have been
centralized under the Ministry of Industry and Commerce.
Source: Authors’ elaboration based on Ward (2014), and various sources from WTO and AFAS.

49
III. Economy-wide effects of services performance
82. How can openness to trade and investment in the services sector improve domestic
services performance and hence firms’ productivity? And how important is it for firm’s
productivity upgrading to have access to good quality and reliable services? This section
will address these two questions. To approach the first question, we review the existing
literature. 16
In addressing the second question, we use firm-level data for a cross-section of
countries in East Asia and other regions, as well as with a Lao PDR-specific panel. We begin by
examining data on the quality of service provision in Lao PDR and in regional comparators. We
explore both data on firms’ perceptions and on the actual difficulties faced by firms in procuring
these services. We then investigate the extent to which inadequate provision of services affects
the performance of firms in Lao PDR and in other EAP countries.17
Our findings largely confirm
that inadequate provision of backbone services, particularly weak transportation services and
infrastructure, hinder firm performance in Lao PDR (See Table 11).
a. Literature review
83. Services liberalization differs from goods trade liberalization in its effects on
domestic activity in the import-competing sector. Indeed, as pointed out by Mattoo et al
(2006), for the case of services, liberalization implies increased scale of domestic activity in
import competing sectors because foreign factors tend to locate domestically (since for many
services, cross-border trade is not feasible and so foreign provision requires the mobility of
capital or workers) or domestic competition increases by more effective regulation. These
dynamics of competition will lead to better and more reliable provision of existing services, new
varieties of services, and competitive pricing in the service sectors. It is also to be expected,
increased productivity, trade and output in the service sector, and improved economy-wide
performance through links with the productive sectors.
84. A vast literature documents the links between services sector reform and economic
performance. The existing work linking service sector reform and performance focuses on
16
Given data constraints – mainly lack of substantial variation of services trade restrictions, and of actual outcomes
in terms of FDI in the services sectors, we could not address the first question empirically. 17
In this section we will use the terms performance and total factor productivity (TFP) interchangeably. However, it
is worth mentioning that the two terms are not equivalent from a technical point of view. The notion of TFP is
associated with the efficiency with which firms can combine inputs to obtain output, being thus technical in nature.
Improvements in TFP take place when firms manage to produce the same output using less inputs. Thus, measures
of TFP should capture this technical dimension by looking at physical relationships between inputs and outputs (in
the literature, these measures are often referred as “TFP-Q”. However, due to data unavailability, productivity
measures typically rely on relationships between values produced and input bills that are deflated at some sectoral
level depending on the granularity of the deflator data (in the literature, these measures are often referred to as
“TFP-R”). This implies, for example, that within a given sector, an increase in an input price that is used more
intensively by a given firm (and similarly, a reduction in output prices), will make that firm appear as having lost
TFP, even if the amount of inputs required to produce a given amount of output remained unchanged. The term
‘performance’ is vaguer than that of TFP, likely highly associated with it, but also more broadly with profitability.
Therefore, we will refer to performance as a synonym of ‘TFP’ when measured in value terms. We also use ratios of
output values to labor costs (labor productivity) as indicators of performance.

50
different channels: (i) services reform and economy wide gains, (ii) services reform and services
sector performance, (iii) services reform and manufacturing export competitiveness, and (iv)
services reform and manufacturing productivity.
i. Services reform and economy-wide gains
85. Mattoo, Rathindran and Subramanian (2006) look at whether the impact of liberalization
of services sectors on output growth is different from that of liberalization of trade in goods in a
cross-country context for 60 countries during the period 1990-1999. The authors found that
countries with open financial and telecom sectors grew faster than other countries. This cross-
country evidence confirms the intuitions that emerge from various case studies. For example,
Hodge (1998) reports that in South Africa, foreign entrants across all segments of the financial
market have played an important part in turning the country into a regional financial center.
Foreign entry improved the competitiveness of the financial services market by reducing prices,
increasing product variety and improving service delivery.
86. Reforms are not just related to the liberalization of the sector but may also imply
improvements in the quality of regulations. In this respect, Eschenbach and Hoekman (2006)
used an index of quality of policy for different services sectors in 20 transition economies and
found that policy improvements attract FDI, and are associated with the post-1990 growth
performance in these economies.
ii. Services reform and services sector performance
87. The sequence of reforms in the services sector matters for services sector
performance. Fink, Mattoo and Rathindran (2003) use data for 86 developing countries during
the period 1985-1999 and find that privatization and competition improved performance in the
services sectors. The authors argue that comprehensive reforms bring the largest gains, and that
the sequence of reforms matters. In particular, their results suggest that competition policies
should be incorporated simultaneously with privatization, which prevent liberalization to imply
the mere substitution of domestic (usually state-controlled) monopolies for foreign monopolies.
iii. Services reform and export competitiveness
88. Telecommunications’ infrastructure is key for exporters’ competitiveness. Fink,
Mattoo and Neagu (2005) and Francois, Manchin and Pelkmans Balaoing (2009) focus on the
effects of service sector reform on manufacturers’ export competitiveness, in particular looking
at reform in the communications-related sectors. The first study uses bilateral data on
communication costs and trade flows for 107 countries, finding that costs affect trade flows
negatively, with the effect being larger for differentiated goods. The second uses a panel of
Asian countries and finds that variations in communications-related infrastructure affected export
performance in those countries. More recently, Bas (2013) examines the impact of services
reform in energy, telecommunications and transport services in India in the mid-1990s and finds
a non-negligible positive effect on the probability of exporting and on export sales shares of

51
firms producing in downstream manufacturing industries. Here again, evidence from case studies
helps us understand the underlying mechanisms in the identified result. In telecoms, Wellenius
(2000) for the case of Chile, and APEC (1998a) for the case of Philippines, show that foreign
entry and increased competition led to substantial cost reductions and introduction of new
services. Also, the expansion of internet services in the early 2000s improved communications
within Africa, and between Africa and the rest of the world.
iv. Services reform and manufacturing productivity
89. Not all services sector reforms are equal in terms of their effect on the productivity
of firms operating in downstream activities, and not all firms benefit equally. Arnold,
Javorcik and Mattoo (2011) use firm-level data for manufacturers in Czech Republic, combined
with several indicators of service sector reform, and find sizable effects on productivity.
Allowing foreign entry into services industry is found to be the key channel through which
services reform affect manufacturing productivity (compared to privatization and level of
competition). This is because foreign acquisitions resulted in dramatic changes in the
productivity and sales of acquired firms. Focusing on SSA, Arnold, Mattoo and Narciso (2008)
used data from 1000 firms in 10 countries during 2001-2005, and found a positive effect of
performance of communications, electricity, and financial services on manufacturing TFP.
Fernandes and Paunov (2012) used firm-level data of Chilean manufacturers combined with FDI
stocks in the services sector, and examined the impact of the latter stocks on manufacturing
firms’ productivity, finding a positive and significant effect both economically and statistically.
They also found that those manufacturing firms furthest from the technology frontier had most to
gain in terms of productivity improvements as a result of service sector liberalization.
90. Arnold, Javorcik, Lipscomb and Mattoo (2010) use data from Indian manufacturing firms
and construct indicators of service sector reform in the same country, and find that potential
productivity gains appear to be greatest for reforming those service sectors most closely related
to trade: transport, communications and finance. They find effects on foreign firms to be
stronger. Duggan, Rahardja and Varela (2013) look at Indonesian data for the period 1997-2009
and find that reductions in services restrictiveness toward FDI were systematically associated
with productivity gains for manufacturing firms operating in downstream sectors. Reforms in
transport and electricity gas and water sectors were found particularly relevant for manufacturing
performance. Furthermore, foreign equity limits, screening and prior approval requirements and
other restrictions related to operations of foreign firms mattered more for downstream
productivity, than relaxing restrictions on hiring foreign personnel.
b. Services Sector Performance in Lao PDR: Subjective and Objective Measures
91. The World Bank’s Enterprise Surveys provide information on the quality of provision of
key services inputs to firms in downstream sectors. Both subjective and objective measures of
local services performance are available. The subjective measures are based on firms’
perceptions (on a scale of 0 to 4) of how much of a constraint they consider electricity, water
services, transportation and access to finance to be for their businesses. The objective indicators
are derived from questions about the difficulties and incidents firms confront with their electric
and water supplies. Both types of indicators are available for the financial sector and electricity

52
services, while only subjective information is available for transport services. The surveys cover
127 different countries, including Lao PDR. Data for Lao PDR is available for 2009 and 2012.
i. Access to finance
92. Access to finance appears to be a major constraint for Lao PDR firms. Indeed, in
2009, almost 21 percent of firms in Lao PDR identified access to finance as the main obstacle to
the success of their operations. When asked to rate the degree of obstacle (from 1 to 4, or none to
severe) posed by access to finance, 19 percent of firms said inadequate access was at least a
major obstacle. More recent data points to an improvement in firms’ levels of satisfaction with
access to finance. In 2012, only 10 percent of firms said this was the number one obstacle to their
operations, compared to 18 percent for the average firm in EAP and 14.4 percent for the larger
cross-regional sample. Along the same lines, in 2012, only 11 percent of Lao PDR firms rated
access to finance as a major or severe obstacle, which is on par with the regional average for
EAP of 11.2 percent but is substantially below the cross-country average of 26 percent Figure
35a). Moreover, access to finance in Lao PDR appears to compare favorably to other countries,
including regional peer Vietnam, where 15.4 percent of firms stressed this as a major or severe
obstacle to their performance Figure 35b).
Figure 35. Percentage of firms identifying the provision of each service as a major obstacle
a. Lao PDR, East Asia Pacific, and All Countries b. Lao PDR and Comparators
Note: Data for all countries and for EAP reflects averages of responses
over one or several years between 2006 and 2014. Source: Enterprise
Surveys, World Bank
Note: Data for Bangladesh reflects the average of responses in 2007 and
2013. Data for Nepal and Mongolia is an average of responses in 2009 and
2013. Data for Bhutan and Vietnam is for 2009 only. Source: Enterprise
Surveys, World Bank
0
5
10
15
20
25
30
35
40
Finance Electricity Transport
%
Lao PDR 2009 Lao PDR 2012
All countries East Asia & Pacific
0
10
20
30
40
50
60
70
Finance Electricity Transport
%
Lao PDR
2009
Lao PDR
2012
Bangladesh
Bhutan
Mongolia
Nepal
Vietnam

53
Figure 36. Percentage of firms identifying each service as a major obstacle across regions
a. 2009 b. 2012
Source: Enterprise Surveys, World Bank Source: Enterprise Surveys, World Bank
93. Perceptions of the quality of financial services also appear to vary across regions. Firms in the capital city, Vientiane, and in Savannakhet, where almost 70 percent of all surveyed
firms are located, have the most negative perceptions of the quality of access to finance. On
average, 19 percent of firms in the capital identified finance as at least a major constraint. While
in 2009, 10 percent of firms in Savannakhet said finance was a major or severe obstacle, this
percentage almost doubled in 2012 (Figure 36). By contrast, only 4 percent of firms in
Champasak and no firms in Luang Namtha complained about access to finance in 2012 (Figure
36b). These differences in perceptions in the quality of access to finance, however, are not
statistically significant.
94. Are these perceptions consistent with the actual quality of services that firms
receive? Indeed, Lao PDR firms appear to confront serious actual difficulties when trying to
obtain financing from external sources. In a world of perfect financial markets, any investment
project that is profitable will be financed irrespective of the availability of internal funds, as
credit will be readily available. This helps firms to invest and to innovate, to introduce new
products or processes. In Lao PDR, the financial structure of firms reflects a severe bias toward
the use of internal funds, not only for financing working capital, but also for investment projects.
For example, as Table 5 shows, 84.3 percent of investments are financed internally among firms
in Lao PDR, while that percentage is 76.1 percent for the average EAP firm, and 66.9 percent for
the average firm in the sample. When focusing on firms in the capital Vientiane, where half of
the firms interviewed are located, the proportion of investments financed internally reaches
almost 91 percent. For working capital, the relevance of internal funds increases to 87.6 percent
in Lao PDR, which continues to be above the regional average of 82.2 percent and the cross-
country mean of 71.3. Similarly, only 6.8 percent of investments in Lao PDR were financed by
0
5
10
15
20
25
30
35
Finance Electricity Transport
%
Vientiane Savannakhet Champasak Luang Prabang
0
5
10
15
20
25
30
Finance Electricity Transport
%
Vientiane SavannakhetChampasak Luang Prabang

54
loans and lines of credit from banks. This is lower than the 10 percent for the average firm in
EAP and the almost 17 percent for firms in the larger sample.
ii. Electricity
95. Poor quality of electricity services is another important obstacle confronted by firms
in Lao PDR. In 2009, almost 23 percent of firms identified inadequate electricity provision as a
major or a severe obstacle to their operations – mainly issues related to distribution. This
proportion decreased to 17 percent for 2012, however. These performance valuations are on par
with the average for the East Asia and Pacific (EAP) region of 18.5 percent, but are substantially
below the cross-country average of 36.5 percent Figure 35a). Indeed, as Figure 35b shows, the
quality of electricity services in Lao PDR appears to be stronger than in other Asian countries,
such as Bangladesh and Nepal. The poor quality of electricity is not only an obstacle to the
productivity upgrading of existing industries in Lao PDR. As argued in Section III it is also a
constraint for the diversification of the production structure.
96. Perceptions of the quality of electricity services also vary across regions. Electricity
services appear to be a greater constraint for firms in the capital city, Vientiane, as well as in
Champasak, and in Luang Namtha. More than 28 percent of firms in Vientiane viewed electricity
as a major obstacle in 2009, and while this proportion decreased to just above 19 percent in
2012, electricity remained the main obstacle according to perceptions of firms in this city. The
proportion of firms that expressed concerns with the quality of electricity was even higher in
Luang Namtha (25 percent). In addition, as the comparison between Figure 36a and Figure 36b
shows, perceptions of the quality of electricity appear to have improved in some cities (Vientiane
and Champasak) and deteriorated in others (Savannakhet and Luang Prabang).
97. Evidence suggests that these rather negative perceptions are based on actual
inadequacies in electric power distribution. In fact, as Box 6 shows, there is a strong
correlation between the objective and subjective measures in the Enterprise Surveys. For
example, firms in Lao PDR wait, on average, 20 days to obtain an electric connection, with a
median wait time of 16 days, compared to a median of 10 days for the EAP region and 12 for all
countries in the sample (Table 6) – Also, as argued before in this report, there are 10
energy/minerals companies on a waiting list for energy supply– likely consequence of a
Table 5. Revealed objective indicators on access to finance Lao PDR* East Asia &
Pacific
All
coun
tries
Proportion of investments financed internally (%) 84.3 80.1 66.9
Proportion of investments financed by banks (%) 6.8 10.1 16.8
Proportion of investments financed by supplier credit (%) 2.6 2.04 5.1
Proportion of investments financed by equity or stock sales (%) 4.3 4.8 4.2
Proportion of working capital financed internally (%) 87.6 82.2 71.3
Proportion of working capital financed by banks (%) 8.04 11 13.3
Proportion of working capital financed by supplier credit (%) 2.9 4.01 11.5
*Average of firms interviewed in 2009 and 2012. Source: Enterprise Surveys, World Bank

55
mismatch between what firms are willing to pay for electricity and the price at which electricity
could actually be supplied, according to anecdotal evidence. On average, firms in Lao PDR
experience 2.5 power outages in a typical month. While this average is below the regional
average of 6.8 and much lower than the cross-country average of 17.9, when comparing the
median values, firms in Lao PDR seem to fare worse than their East Asian counterparts. Indeed,
90% of firms in Lao PDR have experienced a power outage within a month of being surveyed.18
Moreover, looking within Lao PDR, in smaller cities like Luang Prabang, power outages seem to
be more frequent than in larger ones like Vientiane or Savannakhet.
98. Similarly, firms in Lao PDR seem to confront significant problems with the
provision of water supply. For example, firms wait twice as much in Lao PDR as in other East
Asian countries to obtain a water connection (median of 14 days in 2012 compared to 7 in EAP).
Moreover, Lao PDR firms face on average twice as many water outages as firms in other EAP
countries. Yet, the average (and median) number of water supply incidents that firms in Lao
PDR experience in a typical month is below the average (and median) for the larger sample of all
countries.
Table 6. Revealed objective indicators on electricity, telecommunication, and water services
Number of days to
obtain phone
connection
Number of
power outages*
Number of days to
obtain electricity
connection
Number of days
to obtain water
connection
Number of water
supply incidents*
Percentage
of firms
owning a
generator
Mean Median Mean Median Mean Median Mean Median Mean Median
Lao PDR 2009 3.8 3 1.4 0 16 16 73 100 2 0 9.6
Lao PDR 2012 2.65 2 23 15 18.6 14 6.8 1 15.2
EAP 8.9 4 6.8 1 23.6 10 19 7 3.2 0 31.6
All countries 22.1 7 17.9 4 35.2 12 33.7 10 10 3 35.6
*Experienced in a typical month. Source: Enterprise Surveys.
Box 11: Correlation between subjective and objective measures of electricity
What is the relationship between subjective and objective measures of the quality of backbone services provision? The
data from the Enterprise Surveys shows a strong correlation between firms’ perceptions and objective measures of the quality
of electricity services. As Table B1.1 shows, there is a strong positive association between the number of power outages a
firm faces per month and the extent to which it ranks electricity as an obstacle to its operations. Each additional power outage
that a firm in Lao PDR experiences results in an increase of 0.1 in the obstacle score given to electricity. This effect appears to
be substantively larger for Lao PDR firms than for their counterparts in other EAP countries and in the larger cross-regional
sample. Indeed, for all countries in the sample, the longer the duration of each power outage, the more negative the
assessment of the quality of electricity. Moreover, considering the whole sample, we find a statistically significant association
between the number of days firms have to wait to get an electric connection and the extent to which they identify electricity as
an obstacle.
18
Source: Enterprise Survey for Lao PDR 2012.

56
Table B1.1. Electricity: Subjective and objective measures
VARIABLES
Electricity
obstacle
Electricity
obstacle
Electricity
obstacle
Electricity
obstacle
LAO PDR LAO PDR EAP ALL
Power outages 0.0938*** 0.111*** 0.0398*** 0.004704**
(0.0233) (0.0378) (0.0039) (0.001556)
Electric connection 0.00527 0.0013 0.00086***
(0.00513) (0.0009) (0.000192)
Length of power outages 0.00955***
(0.001721)
Constant 1.294*** 1.388*** 1.33***
(0.0901) (0.226) (0.051)
Observations 239 41 575 8,267
R-squared 0.087 0.176 0.095 0.031
Estimation OLS OLS OLS OLS
Robust standard errors in parentheses. *** p<0.01, ** p<0.05, * p<0.1
iii. Transportation
99. Being a landlocked country and lacking a railway system, Lao PDR depends
primarily on road transport and, to a lesser extent, on river and air transport. Road
transport accounts for 80 percent of all passenger and goods movement. While the road network
reaches all parts of the country, its density is highest in the central and southern regions of the
country (OECD, 2013). As Table 7 shows, however, road density is lower in Lao PDR than in
other countries in the region. Moreover, less than 22% of the total road network is paved, with
paved stretches serving urban areas.19
Table 7. Road infrastructure indicators in Lao PDR and comparators Total road network
(thousands km)
Road density
(km of road per thousand km2 of land area)
Cambodia 38.3 (2004) 216.7 (2004)
Lao PDR 29.6 (2009) 171.4 (2009)
Malaysia 39.6 (2009) 300.5 (2004)
Thailand 180.1 (2006) 352.4 (2006)
Vietnam 160.1 (2007) 516.3 (2007)
Source: ADB, Key Indicators for Asia and Pacific (2012)
100. Despite significant improvements in transport and connectivity in recent years,20
the
quality and availability of transportation services continues to be a problem to a sizable
proportion of firms in Lao PDR. Almost 14 percent of firms in Lao PDR identified poor
quality of transportation services as a major or severe obstacle, compared to the regional average
19
22% is in excellent or good condition, 23% in fair condition, and 55% in poor condition; seasonal closures,
particularly of local roads, are frequent due to poor surface, deficient cross drainage, lack of water crossing
structures, flooding, and slope slides. Most of the road in Lao PDR built with lower axle load compared to ASEAN
standards. 20
See, for example, TTFA, World Bank (2014).

57
of almost 11 percent. In fact, in 2012, almost 8 percent of firms in Lao PDR said transportation
was the number one constraint to their operations. In contrast, only 5 percent of firms in EAP
and 2.6 percent of firms in the larger sample of countries ranked transportation as the top
obstacle.
101. Yet, according to firm perceptions, transportation services in Lao PDR are less of a
problem than in other Asian countries, such as Nepal and Bhutan, where 30 percent and 17
percent of firms (respectively) identified transport as a major or severe obstacle Figure 35b).
Firms’ valuations, however, vary across regions within Lao PDR. Firms located along the
country’s main trading routes, which connect Vientiane, Savanakhet and Pakse with Bangkok
and Laem Chabang seaports in Thailand, tend to have more favorable assessments of the quality
of transportation services. This is not surprising, given the decreasing costs in trucking services
since restrictions to the cross-border movement of trucks were lifted in 2004. As a result, larger,
better-organized Thai trucking firms provide most of the cross-border transport services.
102. Lao PDR trucking companies, however, still face challenges in the market. These are
smaller companies using older equipment, and that serve primarily short-distance domestic
movements, and transport goods to and from the border. This requires them to load and unload
goods at the border, adding to the total cost of land transportation. Apart from being at a
competitive disadvantage relative to Thai firms, other factors discourage Lao PDR operators
from providing cross-border services, including the failure of their trucks to meet Thai safety
standards, differences in language, which expose drivers to harassment, and the fact that vehicles
are driven on different sides of the road.
103. Overall, the costs for transporting cargo within Lao PDR remains high. This is
particularly the case when compared with other developing countries, mainly due to the distance
to the ports and the large proportion of empty containers moving from the port for loading or
returning to the port after unloading (World Bank, 2014).
104. International transport firms need licenses to operate in Lao PDR, which are issued
to firms for a period of 5 years. The number of transport firms with licenses to operate between
Thailand and Lao PDR increased dramatically increased, from 3 in 2000 to 111 in 2011.
Nevertheless, anecdotal evidence suggests the system of licenses may be posing a constraint to
some local firms. When interviewing firm representatives in Lao PDR, they mentioned that some
firms were, being unable to obtain licenses, could not set up their own transport systems and had
to rely instead on established firms.
105. Restrictions associated with licensing still remain that impede firms to integrate
vertically and develop their own transport services. Anecdotal evidence suggest that this
affects many energy/minerals exporting companies that, due to the high intensity with which
they use transport inputs they prefer to integrate this activity to their core operations (for exports
of metals, for example, transport accounts for 8% of total inputs, as reported in Section III, being
the third most important input after metals themselves and distribution related inputs).
Table 8. Trade volumes, distances, and cost for major trade corridors Corridor Distance
(km)
Travel time
(hours)
Trade volume
(% of total)
Cost
(USD per container)

58
Vientiane-Bangkok 620 12 40 1,200
Savannakhet-Bangkok 645 12 19 1,100
Pakse-Bangkok 750 13 9 1,300
Source: World Bank (2014)
iv. Telecommunications
106. Evidence suggests that Lao PDR still needs to strengthen its telecommunications
performance relative to comparators, despite significant progress in updating and improving
telecommunication services in recent years. Table 9 presents data on the ICT Development Index
(ICI) for Lao PDR and other ASEAN countries, showing that in 2012, Lao PDR was ranked 123
out of 157 countries, with an index score of 2.1. While Lao PDR’s score has increased since
2010, it remains one of the lowest ranked countries in the region and below the developing
country average of 3.44.
Table 9. ICT services indicators for East Asian countries
ICT Development Index
ICT Price Basket
(% GNI per capita)
Score Ranking Score Ranking
2010 2012 2010 2012 2012 2012
Brunei Darussalam 4.85 5.06 52 58 1.0 26
Cambodia 1.88 2.3 119 120 24.3 130
Indonesia 3.01 3.43 97 97 5.5 104
Lao PDR 1.84 2.1 120 123 37.4 144
Malaysia 4.63 5.04 57 59 1.8 51
Myanmar 1.65 1.74 129 134 n/a n/a
Philippines 3.04 3.34 94 98 9.0 113
Singapore 7.47 7.65 10 15 0.4 3
Thailand 3.29 3.54 89 95 3.4 78
Vietnam 3.41 3.8 86 88 6.0 106
World (avg) 4.35
Developing countries (avg) 3.44
Source: ITU, Measuring the Information Society (2012, 2013).
107. Lao PDR is one of the countries with most expensive ICT services in the world.
Indeed, Lao PDR is ranked 144 out of 166 countries for ICT price basket, which represents an
average of fixed telephone, mobile cellular and fixed broadband sub-baskets (Table 9). The low
performance of Lao PDR in terms of ICT affordability highlights the need for further
liberalization and for progress in the removal of restrictive and anti-competitive practices.
Indeed, interviewees from the private sector complained about anticompetitive practices toward
foreign providers. For example, Lao PDR Telecom (the public provider) regulates minimum
prices, above prices charged in Thailand (5 or 6 times higher) or Vietnam, for example, that
prevent the foreign providers to compete in prices. They also limit promotions or special offers
to two weeks with prior approval. There were also issues reported with the international gateway
through which international phone traffic passes through. The government in Lao PDR created a
“Lao Gateway”, and all international traffic needs to pass through that gateway, meaning that the
costs moved from 3 cents to 6.5 cents for calls into Lao PDR.

59
108. Lao PDR also lags behind its regional comparators in terms of access to ICT. In
2013, for example, the number of fixed telephone subscriptions per 100 people in Lao PDR was
1.8, compared to 11.4 in Vietnam and 4 in Cambodia (Table 10). Lao PDR also underperformed
in terms of mobile subscriptions per 100 people, with 101.9, compared to 149 in Vietnam, 132 in
Cambodia, and 106 in the Philippines. Similarly, the percentage of households with internet
access in Lao PDR (5.1 percent) is lower than in all other countries in ASEAN, except for
Cambodia (3.9 percent) and Myanmar (1.8 percent).
Table 10. Access to internet services in East Asian countries Fixed-telephone
subscriptions*
Mobile
subscriptions*
% households
with computer
% households with
internet access
Brunei
Darussalam
17.2 113.8 86.9 72.4
Cambodia 4 132 5.4 3.9
Indonesia 15.5 115.2 15.1 6.5
Lao PDR 1.8 101.9 8.7 5.1
Malaysia 15.7 140.9 66.9 64.7
Myanmar 1.1 11.2 2.3 1.8
Philippines 4.1 106.8 16.9 18.9
Singapore 37.8 153.4 87.7 87.7
Thailand 9.1 120.3 26.9 18.4
Vietnam 11.4 149.4 17.5 15.6
*per 100 population. Source: ITU, Measuring the Information Society (2013)
109. Moreover, data from the Enterprise Surveys suggests that firms in Lao PDR have
more limited access to internet services than businesses in other countries. For example, less
than 47 percent of Lao PDR firms reportedly rely on email for communications, compared to
67.5 percent for other EAP countries and to 71 percent for the cross-regional sample. Only 30
percent of firms in Lao PDR have their own websites, compared to 43 percent of firms in EAP
and 45 of firms in the larger sample (Figure 37). This may not reflect restricted access but
demand factors, such as whether clients and other business partners rely on these means of
communications. However, evidence from interviews further confirmed the inadequacy of
internet services, in addition to its high cost. That the fact that internet is considered a luxury
good in the tax system, and hence it is taxed at 10 percent, increases costs for a service that is
crucial for innovation. This classification dates from 10 years ago but has not yet been changed.
110. The high cost of internet hampers the prospects of the tourism sector to upgrade
and to secure higher revenues per tourist, which remain low. Access to high quality ICT is
crucial to improve the competitive edge of Lao PDR in tourism and increase the expenditures per
day of tourists. ICT plays a role in the pre-travel, in the travel and in the post-travel phase. In the
pre-travel it provides a range of tools to facilitate information search, about the region and to
create travel plans. During the travel phase, it helps with real-time information about the
destination – through mappings of the cities or regions, through information about events and

60
places of interest, and in the post-travel phase provides tourists a variety of solutions to share
their travel experience with others, being an important promotion platform.21
Figure 37. Percentage of firms that rely on email and their own websites for
communications
Source: Enterprise Surveys, World Bank
v. Determinants of cross-firm variation in perceptions
111. Perceptions of the quality of services provision vary across types of firms. Compared
to other firms in EAP, firms in Lao PDR perceive access to finance (20 percent) more negatively
after controlling for differences in firm characteristics, and (12 percent) more favorably than the
average firm across all countries considered. As it is typically the case across different countries,
foreign firms operating in Lao PDR are less vulnerable to constraints in accessing finance, than
domestic counterparts of the same size, and in the same sector (Table A5). All else equal,
manufacturing firms in Lao PDR also appear to be more constrained by access to finance than
firms in other sectors. The greater sensitivity of manufacturing firms in terms of access to
finance is also observed for the average firm in EAP and in the cross-regional sample. Moreover,
in Lao PDR size does not seem to affect firms’ valuation of financial services. In EAP, in
contrast, as in the broader sample, size is negatively associated with perceptions on access.
112. Lao PDR exporters tend to have less favorable perceptions of the quality of electric
services. Firms in the manufacturing sector also seem to assess the quality of electricity more
negatively than their counterparts in other sectors. The greater sensitivity of exporters and
manufacture producers to the quality of electricity provision is also observed in EAP and in the
larger sample of all countries. More experienced firms, conversely, seem to be less constrained
by inadequate electricity provision.
21
See Baladin, S. and S. Laizane (2013)
0
10
20
30
40
50
60
70
80
Firms that use email Firms with own websites
Pe
rce
nt
Laos 2009 Laos 2012EAP All countries

61
113. Exporters in Lao PDR and in EAP are also more constrained than non-exporters by
inadequacies in transportation services. Foreign firms operating in Lao PDR and in EAP
countries, however, appear to have more positive perceptions of the quality of transport services.
Indeed, all else equal, foreign firms in Lao PDR perceive transport services 20 percent more
favorably than domestic firms. By contrast, when considering the larger cross-country sample,
foreign firms tend to have a more negative assessment of the constraints posed by transport
services.
c. Effects of Services Sector Performance on Firm Performance
114. How does the quality service provision affect the performance of downstream firms
in Lao PDR? In this section, we investigate the extent to which the performance of firms in Lao
PDR is affected by difficulties in procuring services inputs.22
115. We begin by exploring the relationship between performance and different firm
characteristics. In line with the literature, we expect a number of factors to correlate positively
with labor productivity and TFP (two measures of performance), including exporter status, firm
size, and foreign ownership. Our results, presented in Table A 6, largely conform to these
theoretical expectations.
Box 12: Estimating the Impact of Services Inputs Quality on Firms’ Performance
How do access to quality services inputs affect firms’ performance? Answering this question requires access to a
dataset on the basis of which we can obtain comparable measures of quality services input provision and of firms’
performance. Then, it is necessary to test whether a systematic relationship exists between the two. Our approach
follows that of Arnold, Mattoo and Narciso (2006).
The dataset comes from the World Bank Enterprise Surveys. Data from these surveys are available for a cross-
section of firms from 205 country-year combinations (133 countries are surveyed, with some countries being
surveyed in more than one year, of which 14 are in the East Asia and Pacific region (including Lao PDR)). The
surveys were undertaken between 2006 and 2014.
The measure of firms’ performance chosen is productivity. We use two alternative measures: (i) labor productivity
(the ratio of output to total labor costs), and (ii) total factor productivity (TFP-R) estimated in two as a residual of a
Cobb-Douglas production function, with output as a function of the capital stock, labor and intermediate inputs.
The performance of services sectors is also obtained from the Enterprise Surveys. We used subjective measures of
local services performance, which are firms’ valuations as to how much of a constraint they consider electricity,
telecommunications, transport, and access to finance for their businesses. Firms are asked to select, on a scale from
0 to 4, whether they consider each of these dimensions to be not an obstacle for their operations (0), a minor obstacle
(1), a moderate obstacle (2), major obstacle (3) and severe obstacle (4).
The empirical strategy consists in regressing the measure of productivity on measures of the performance of
services, controlling for factors that are typically identified in the literature as relevant for firms’ performance,
which include firm’s export status, firm’s size, and firm’s age. In addition, we control for country-year fixed effects,
to eliminate the potential of distortions due to changes in the relative values of the different currencies in which
output, wages, intermediates and capital stock are expressed and to eliminate the effect of country-year
22 We use firm-level data from the Enterprise Surveys, which contain information on firms’ inputs and outputs, which we use to
calculate two distinct measures of firm productivity: labor productivity and total factor productivity (TFP). We estimate TFP as a
residual of a Cobb Douglas production function, with real output as a function of capital, labor, and intermediate inputs (See Box
7 for more details on methodology).

62
unobservables that may affect both productivity and the perception of services’ quality, as well as sector fixed
effects to control for time-invariant and sector-specific unobservables.
Concerns about endogeneity arise because it is possible that poor performance affects firms’ perceptions about the
obstacles that services input provision represent. This would imply a bias upwards in the coefficient linking services
performance with productivity. This makes a specification that links firm-level perceptions of services quality with
firm-level productivity inappropriate. Our strategy, following Arnold et al (2006) consists in aggregating the
individual firm’s responses to the services-related questions on the right hand side at the regional level, within each
country. This reduces the influence that an individual firm’s performance has on the regressor. In addition, it is
likely to better summarize the quality provision of services in a given region. Still, and given the structure of the
dataset, it is likely that some endogeneity sources remain. For this reason results should be read as indicative of
conditional correlations rather than of causation.
The chosen specification is as follows:
𝜇𝑖 = 𝛼𝑐𝑡 + 𝛾𝑠 + 𝛽𝑆𝑒𝑟𝑣 𝑃𝑒𝑟𝑓𝑜𝑟𝑚𝑎𝑛𝑐𝑒𝑟 + 𝜋𝑋𝑖 + 𝜀𝑖 (1)
where 𝜇 is the indicator of productivity (labor productivity or residual from Cobb Douglas), 𝛼 is a country-year
fixed effect, 𝛾 is a sector fixed effect, ServPerformance is a vector of subjective and objective indicators of obstacles
represented by access to finance, electricity, transport, and telecommunications, that vary at the regional level, X is a
vector of controls varying at the firm level, and 𝜀 is an error term assumed orthogonal to the regressors.
116. Productivity performance is heterogeneous across firms. As typically found in the
literature, firms that are more integrated in the global marketplace show productivity premia
when compared to others in the same country, same sector, and comparable size (Table A 6). For
example, in Lao PDR, exporters are almost 40 percent more productive than non-exporters, when
focusing on TFP. The exporter premium is much stronger when focusing on firms in the EAP
region and in the larger cross-regional sample. Indeed, compared to their counterparts in EAP
and in all other countries, exporters from Lao PDR are less productive.23
Foreign-owned firms
are also substantially more productive than domestic firms, and this effect appears to be stronger
for firms in Lao PDR. In addition, firm size matters. Larger firms are slightly more productive
than smaller ones, with this premium being slightly larger for firms in Lao PDR than for the
average firm in the EAP region and in the complete sample of 133 countries.
117. We then consider the effects of different types of services on firm productivity, using
both subjective and objective indicators. To avoid potential problems of endogeneity between
firm perceptions of service provision and performance, we aggregate firm-level responses into
regional averages. We then regress firm TFP and labor productivity on subjective measures
(regional averages) and objective indicators of service performance, using the firm
characteristics mentioned above – exporter status, foreign ownership, size, and age—as
additional covariates, and controlling for industries, countries, and years. We focus on each type
of service independently first and then consider them simultaneously.
118. Firms’ productivity is associated with poor services provision. Overall, our results
show that the quality of financial, electricity, transport, and telecommunications services
provided to downstream firms, measured both through subjective and objective indicators, is
systematically associated with firm’s performance significantly. The findings are relatively
23
When adding an interaction of Lao PDR and exporter to the models in columns (2) and (3), the estimated
coefficient for this term is significant and negative.
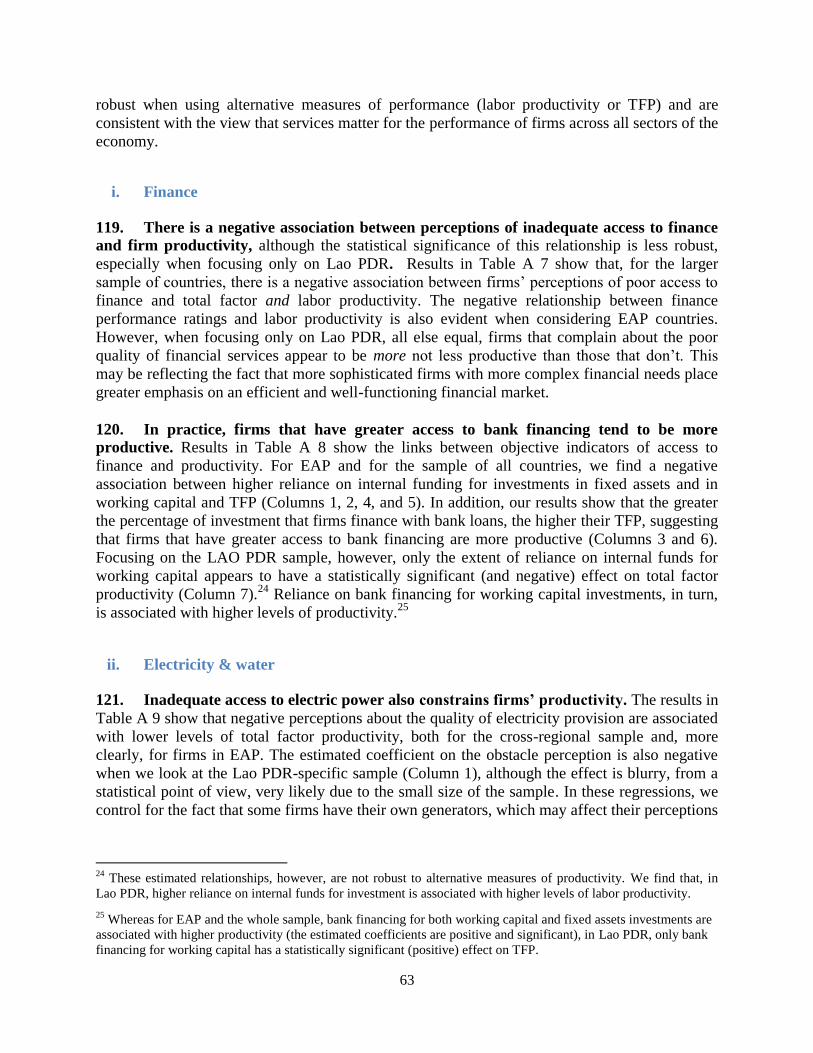
63
robust when using alternative measures of performance (labor productivity or TFP) and are
consistent with the view that services matter for the performance of firms across all sectors of the
economy.
i. Finance
119. There is a negative association between perceptions of inadequate access to finance
and firm productivity, although the statistical significance of this relationship is less robust,
especially when focusing only on Lao PDR. Results in Table A 7 show that, for the larger
sample of countries, there is a negative association between firms’ perceptions of poor access to
finance and total factor and labor productivity. The negative relationship between finance
performance ratings and labor productivity is also evident when considering EAP countries.
However, when focusing only on Lao PDR, all else equal, firms that complain about the poor
quality of financial services appear to be more not less productive than those that don’t. This
may be reflecting the fact that more sophisticated firms with more complex financial needs place
greater emphasis on an efficient and well-functioning financial market.
120. In practice, firms that have greater access to bank financing tend to be more
productive. Results in Table A 8 show the links between objective indicators of access to
finance and productivity. For EAP and for the sample of all countries, we find a negative
association between higher reliance on internal funding for investments in fixed assets and in
working capital and TFP (Columns 1, 2, 4, and 5). In addition, our results show that the greater
the percentage of investment that firms finance with bank loans, the higher their TFP, suggesting
that firms that have greater access to bank financing are more productive (Columns 3 and 6).
Focusing on the LAO PDR sample, however, only the extent of reliance on internal funds for
working capital appears to have a statistically significant (and negative) effect on total factor
productivity (Column 7).24
Reliance on bank financing for working capital investments, in turn,
is associated with higher levels of productivity.25
ii. Electricity & water
121. Inadequate access to electric power also constrains firms’ productivity. The results in
Table A 9 show that negative perceptions about the quality of electricity provision are associated
with lower levels of total factor productivity, both for the cross-regional sample and, more
clearly, for firms in EAP. The estimated coefficient on the obstacle perception is also negative
when we look at the Lao PDR-specific sample (Column 1), although the effect is blurry, from a
statistical point of view, very likely due to the small size of the sample. In these regressions, we
control for the fact that some firms have their own generators, which may affect their perceptions
24
These estimated relationships, however, are not robust to alternative measures of productivity. We find that, in
Lao PDR, higher reliance on internal funds for investment is associated with higher levels of labor productivity.
25 Whereas for EAP and the whole sample, bank financing for both working capital and fixed assets investments are
associated with higher productivity (the estimated coefficients are positive and significant), in Lao PDR, only bank
financing for working capital has a statistically significant (positive) effect on TFP.

64
on the quality and distribution of electricity.26
These results are robust to alternative measures of
productivity. Indeed, as the results in column (4) and (5) show, the estimated coefficient for
electricity obstacle is negative and significant both in the Lao PDR and in the EAP models.
Specifically, if Lao PDR’s average perceptions rating for electricity (1.35) improved to Chinese
levels (0.48), labor productivity of Lao PDR firms would increase by 4 percent.
122. The productivity losses associated with unreliable electricity services are also evident
when considering objective indicators (Table A 10). Our results show a significant negative
relationship between the number of outages that a firm experiences in a typical month and its
productivity. Indeed, for firms in EAP, each additional power outage is associated with a
decrease in TFP of 1 percent. For firms in Lao PDR, this effect seems to be much stronger. Our
findings indicate that bringing the median number of power outages experienced in Lao PDR
from 2 to 1 (the median experienced in EAP) would increase productivity by 9 percent – a
sizable increase. For the larger cross-country sample, the effect of power outages on
productivity, while negative and significant at the 1 percent level, is substantially weaker.
However, for the larger sample, we also find a significant association between the average
duration of each outage and firm performance.
123. The availability and continuity in water provision is also associated with firm
productivity. The results in Table A 11 show that both for firms in Lao PDR and for the larger
sample of EAP countries, the number of water supply incidents experienced by a firm in a
typical month is associated with lower levels of TFP. Specifically, for firms in Lao PDR, one
additional water supply interruption results in a productivity loss of 3 percent, compared to less
than 0.5 percent for the average EAP firm. For East Asian firms, the duration of water outages
also appears to have a negative and significant incidence on productivity.
iii. Transportation
124. Inadequate transportation is strongly associated with firm productivity in Lao PDR.
The results in Table A 12 show that perceptions of poor quality in transport services are
associated with a productivity loss of more than 50 percent for firms in EAP. For firms in Lao
PDR, the productivity losses associated with transportation constraints are much stronger. In
fact, if perceptions of the quality of transportation services in Lao PDR were to match
Indonesia’s (average rating = 0.83 vs. 0.98 for Lao PDR), firms’ total factor productivity would
increase by 31 percent. Focusing on labor productivity, the estimated coefficient of transport
obstacle is also negative and significant but smaller. Thus, if transportation quality perceptions in
Lao PDR improved to Indonesian levels, labor productivity of local firms would grow by 1.3
percent.
26
We also find that the more negative perceptions about the quality of electricity services, the more likely a firm in
Lao PDR (and in EAP) is to get its own generator.

65
iv. Telecommunications
125. Access to internet connectivity is associated with higher productivity of firms in Lao
PDR. While data on subjective measures is not available for Lao PDR, we focus on two
objective indicators of internet access, whether the company uses emails in communications with
clients and suppliers, and whether it has its own website. Our results, presented in Table A 13,
indicate that Lao PDR firms that rely on emails for their communications are over 110 percent
more productive (in terms of TFP) than those that don’t. Similarly, while firms that use their own
websites to communicate with potential clients and suppliers have a 40 percent higher TFP levels
than those that don’t. The productivity premium from using email services seems to be stronger
for the average firm in the EAP, but slightly lower for firms in the cross-regional sample.27
However, interestingly, for Lao PDR firms, email usage is associated with lower not higher labor
productivity (column 4). For the other two samples, in contrast, while email reliance appears to
have a smaller substantive effect on labor productivity than on TFP, this effect remains positive.
126. Our findings thus confirm the links between quality of backbone services and firm
productivity in Lao PDR and beyond. Focusing on Lao PDR in particular, our results indicate
that firms’ performance is particularly affected by the quality of transportation and electricity
services, while less conclusive evidence is found regarding the links between access to finance
and productivity. Indeed, when considering indicators of all types of obstacles simultaneously
(Table A 14), we observe that the quality of transportation services appears to have the strongest
negative effect on firm productivity (measured in terms of total factor productivity and labor
productivity). This is also in line with the findings in Box 3.
127. In Table 11, we summarize the results from the statistical analysis, including the
magnitude of the estimated effects of services quality on performance. We report standardized
coefficients that allow us to better compare effects on firm performance due to changes in the
variable that measures constraints. This is because standardized coefficients measure changes in
the dependent variable associated with a one-standard deviation change in the explanatory
variable. We find, first, that inadequate quality of services appears to be a stronger constraint in
Lao PDR than in other countries in the East Asia Pacific region. In addition, the results confirm
that changes in the quality of transportation and electricity services would have the largest effect
on firms’ performance. Specifically, a one standard deviation increase in firms’ subjective rating
of the quality of transportation is associated with a 15 percent increase in performance (measured
as TFP-R). Moreover, a standard deviation decrease in the number of power outages experienced
by a firm in a typical month would result in a 13 percent improvement in performance levels.
Table 11. Summary of results from regressions
Type of Service Indicator Expected effect
on productivity
Findings for Lao PDR
(TFP)
Findings for EAP
(TFP)
Access to finance Subjective
Perceptions of obstacle Negative 0.23* 0.22
Objective
27
Of course, these results do not imply that internet connectivity causes productivity to be 110 percent higher.
Rather, while internet connectivity is likely to have a positive impact on productivity, it is also the case that more
sophisticated firms, that may also happen to be more productive, use internet more intensively.

66
Reliance on internal funds
Reliance on bank finance
Negative
Positive
-0.15*
0.15
-0.08*
0.11*
Electricity Subjective
Perceptions of obstacle
Negative
-0.008
-0.02 *
Objective
Power outages
Negative
-0.13*
-0.05*
Transportation Subjective
Perceptions of obstacle
Negative
-0.15*
-0.06*
Objective
n/a n/a n/a n/a
Telecommunications Subjective
n/a n/a n/a n/a
Objective
Email users
Website
Positive
Positive
0.39*
0.30*
0.25*
0.17 *
Note: Standardized coefficients from regression models reported in Tables A5-A14. *Indicates estimated coefficient is
statistically significant (p< .10)
Box 13: Using Panel Fixed Effects Model to Assess Impact of Services Quality on Firms’ Performance
The World Bank Enterprise Surveys also contains data for a panel of firms from Lao PDR, which were interviewed in 2009 and in 2012.
This is very useful as it allows us to understand how changes in the perceptions of service provision quality are associated with firm’s
productivity within each firm.
We follow the same empirical strategy, regressing measures of productivity on measure of the performance of services, controlling for
observable firm characteristics, and for unobservable characteristics that are fixed over time – captured by the firm-level fixed effect, as well
as for sector and year fixed effects. Because we focus on variation in specific firms’ assessment of the quality of service provision in time,
concerns about endogeneity are weaker. We thus use data on firm-level perceptions of each type of service, instead of regional averages like
in the previous specification.
We estimate the following fixed effects model:
𝜇𝑖𝑡 = 𝛾𝑠 + 𝛽𝑆𝑒𝑟𝑣 𝑃𝑒𝑟𝑓𝑜𝑟𝑚𝑎𝑛𝑐𝑒𝑖𝑡 + 𝜋𝑋𝑖𝑡 + 𝜀𝑖𝑡 (1)
where 𝜇 is the indicator of productivity (labor productivity or residual from Cobb Douglas), 𝛾 is a sector fixed effect, ServPerformance is a
vector of perception based indicators of obstacles represented by access to finance, electricity, and transport, that vary in time, X is a vector
of controls also varying in time and at the firm level, and 𝜀 is an error term assumed orthogonal to the regressors. We also include objective
measures of the quality of telecommunications, given the lack of subjective data on these services.
Our results, presented in Table B3.1 show a negative association between firms’ perceptions of the quality of services provision and total
factor productivity. However, the estimated coefficients for the finance and electricity obstacle variables fail to reach statistical significance.
In contrast, perceptions on the quality of transportation services appear to have a significant and negative impact on firm productivity.
Specifically, firms that improved their assessment of transportation services in one unit (for example, those that went from seeing
transportation as a “severe” obstacle to viewing it as a “major” problem) experienced a productivity boost of 30 percent. Our results also
reveal a statistically positive association between access to internet and reliance on ICT services and productivity. On average, firms that
switched from not using email to using it for business communications, improve their productivity by 86 percent, while firms which set up a
website and start using it to communicate with clients and suppliers experienced a 180 percent growth in TFP.
Other interesting results include the changes in firm productivity associated with switching from focusing on the domestic market to
exporting. Firms that started exporting increase their productivity by more than 140 percent. Similarly, all else equal, firms that increase
their degree of foreign ownership to 10 percent of higher, experience a significant and substantially large productivity premium.

67
Table B3.1. Fixed effects model of determinants of productivity
(1) (2) (3) (4) (5) (6) (7)
VARIABLES TFP TFP TFP TFP TFP TFP TFP
Foreign 1.411*** 1.399*** 1.395** 1.776** 1.206** 1.304** 1.373*
(0.518) (0.519) (0.554) (0.777) (0.591) (0.533) (0.829)
Exporter 1.426*** 1.498*** 1.456*** 1.658*** 1.826*** 1.424*** 1.793***
(0.498) (0.452) (0.528) (0.310) (0.606) (0.530) (0.424)
Firm size 0.00330 0.00327 0.00317 0.00401 0.00371 0.00291 0.00278
(0.00241) (0.00221) (0.00305) (0.00335) (0.00235) (0.00229) (0.00199)
Firm age 0.0407 0.0387 0.0475 0.0934 0.0338 0.0577 0.0339
(0.0602) (0.0556) (0.0639) (0.0801) (0.0624) (0.0619) (0.0554)
Finance obstacle
-0.133
(0.307)
Electricity obstacle
-0.0959 -0.362
(0.825) (0.693)
Generator
2.212*
(1.169)
Transport obstacle
-0.330*
(0.196)
Email user
0.861**
(0.367)
Website
1.815*
(0.925)
Constant 19.18*** 19.41*** 19.18*** 18.41*** 19.48*** 18.75*** 18.45***
(1.368) (1.494) (1.321) (1.678) (1.490) (1.340) (1.157)
Sector dummies YES YES YES YES YES YES YES
Observations 338 334 338 149 337 338 338
R-squared 0.595 0.602 0.595 0.656 0.619 0.616 0.684
Number of id2009 315 311 315 128 314 315 315
Robust standard errors in parentheses; *** p<0.01, ** p<0.05, * p<0.1

68
References
APEC (1998a) “The Impact of Liberalisation: telecommunications industry in the Philippines,”
(November), Singapore: APEC Secretariat.
Arnold, J., B. Javorcik, and A. Mattoo, (2011) “Does Services Liberalization Benefit
Manufacturing Firms? Evidence from the Czech Republic.” Journal of International Economics,
Vol. 85, No.1, pp. 136-146.
Arnold, J., B. Javorcik, M.Lipscoom and A. Mattoo, (2010) “Services Reform and
Manufacturing Performance: Evidence from India.” CEPR Discussion Papers, 8011, C.E.P.R.
Discussion Papers.
Arnold, J., A. Mattoo, and G. Narciso (2008) “Services Inputs and Firm Productivity in SSA:
Evidence from Firm-Level Data.” Journal of African Economies, Vol. 17, No.4, pp. 578-599.
Bas, M. (2013) “Does services liberalization affect manufacturing firms' export performance?
Evidence from India.” CEPII Working Paper.
Christie, I., E. Fernandes, H. Messerli, and L. Twining-Ward (2013). Tourism in Africa:
Harnessing tourism for growth and improved livelihoods. World Bank: Washington, DC.
Duggan, V., S. Rahardja, and G. Varela (2013) “Service Sector Reform and Manufacturing
Productivity: Evidence from Indonesia.” World Bank Policy Research Working Paper No. 6349.
Eschenbach, F. and B. Hoekman (2006) “Services Policy Reform and Economic Growth in
Transition Economies.” Review of World Economics/Weltwirtschaftliches Archiv, Vol.142, No.
4, pp. 742-764.
Fernandes, A. and C.Paunov (2012) “Foreign direct investment in services and manufacturing
productivity: Evidence for Chile.” Journal of Development Economics, Vol. 97, No.2, pp. 305-
321.
Fink, C., A. Mattoo, and R. Rathindran (2003) “An Assessment of Telecommunications Reform
in Developing Countries.” Information Economics and Policy, Vol. 15, No.4, pp. 443-466.
Fink, C., A. Mattoo, and I.C. Neagu (2005) “Assessing the Impact of Communication Costs on
International Trade.” Journal of International Economics, Vol. 67, No.2, pp. 428-445.
Francois, J., M. Manchin, and A. Pelkmans Balaoing (2009) “Regional Integration in Asia: the
Role of Infrastructure.” In Pan-Asian Integration: Linking East and South Asia, ed. J.Rancois, P.
B. Rana and G. Wignaraja, 439-486, Houndmills, U.K. and New York: Palgrave Macmillan.
Francois, J., M. Manchin and P. Tomberger (2013) “Services Linkages and the Value Added
Content of Trade.” World Bank Policy Research Working Paper 6432
Ghani, E. and S. O'Connell (2014), "Can service be a growth escalator in low-income countries?"
World Bank Policy Research Working Paper Series 6971.

69
Gill, I., I. Izvorski, W. van Eeghen and D. De Rosa (2014). “Diversified Development: Making
the most of natural resoruces in Eurasia”. Washington, DC: World Bank.
Hodge, J. (1998) “Developing a trade and industry policy agenda for service sectors in South
Africa.” Working Paper. Pretoria: Trade and Industrial Policy Strategies.
Hollweg, C. and M. Wong (2013) “Measuring Regulatory Restrictions in Logistics Services.”
Book chapter in “Priorities and Pathways in Services Reform”.
Imbs, J. and R. Wacziarg (2003) “Stages of Diversification”. American Economic Review, Vol.
93, No. 1, pp. 63-86.
Kesidou and Romijn (2008). Do Local Knowledge Spillovers Matter for Development? An
Empirical Study of Uruguay’s Software Cluster. World Development, vol. 36 No. 10 pp 2004-
2028
Levy Yeyati, E. and S. Pienknagura (2014) “Who’s afraid of tertiarisation.” Column in Vox,
December 10th
2014
Mattoo, A., R. Rathindran, A. Subramanian (2006) “Measuring Services Trade Liberalization
and Its Impact on Economic Growth: An Illustration.” Journal of Economic Integration, Vol. 21,
No. 1, pp. 64-98.
Rodrik, D. (2014) “An African Growth Miracle?” Institute for Advanced Study, Princeton
Ruppert Bulmer, E. and C.H.Hollweg (2015) “The Labor Impact of Trade in Lao PDR” – Pillar 3
of the Lao PDR Trade and Competitiveness Analytical Program FY14-16, mimeo.
Snoeck, M. and L. Pittaluga (2012). Software discovery in Uruguay. Public-Private solutions to
coordination failures. In C. Sabel et al (eds) Export pioneers in Latin America, Inter-American
Development Bank, Washington, DC.
Ward, N. (2014) “Regulatory Assessment of Services Trade and Investment: Improving Services
Regulation in the Lao People’s Democratic Republic,” Prepared under the Second Trade
Development Facility, Foreign Trade Policy Department, Ministry of Commerce and Industry.
Wellenius, B (2002) “Closing the Gap in Access to Rural Communications Chile 1995-2002.”
World Bank Discussion Paper 430.
Windsor Place Reporting (2015) “Compliance with Trade Commitments and the Implementation
of Regulatory Best Practice in the Telecommunications Sector.” Report to the Ministry of
Industry and Commerce, Lao PDR (Final Report, February 19).
World Bank (2014) Lao PDR: Trade and Transport Facilitation Assessment. Washington D.C.:
World Bank.
World Bank (2014b) Lao PDR: Investment Climate Assessment 2014: Policy uncertainty in the
midst of a natural resource boom. Washington D.C.: World Bank.

70
World Bank (2014c) Third Ethiopian Economic Update: Strengthening Export Performance
through Improved Competitiveness, World Bank.
World Bank (2015). Trade Competitiveness Diagnostic – Uruguay, Mimeo, Washington, DC.

71
Annex
Figure A 1. Trade balance in services as a percentage of GDP, 2002-2012
Source: Authors’ calculations based on data from WDI.
Figure A 2. Services sectoral exports growth, 2002-2012
Source: Authors’ calculations based on data from UNCTAD.
-10
-50
51
0
Se
rvic
e E
xp
ort
s T
rad
e B
ala
nce (
20
02
-20
12
)
BGD BTN BWA KHM Lao PDR MNG NPL THA VNM
2002 2007 2012
0
50
0
1,0
00
1,5
00
2,0
00
Expo
rt v
alu
e (
mill
ion U
SD
)
2002 2004 2005 2007 2010 2012
-100
-50
050
10
0
CA
GR
of S
erv
ice E
xpo
rts b
y S
ecto
r
2002-2004 2005-2007 2010-2012
Communications Computer Construction
Financial Insurance Other business
Transport Travel Other

72
Table A 1. Gross and value-added sectoral export shares by type of linkage, 2004-11
(percent)
Gross exports VA in exports
(backward linkages)
VA in exports
(forward linkages)
Sector 2004 2007 2011 2004 2007 2011 2004 2007 2011
Agriculture & Energy 29.3 35.9 51.9 35.2 42.3 56.3 38.9 45.2 57.3
Manufacturing 17.4 15.8 13.2 16.1 14.5 12.1 4.2 3.5 3.0
Water 0.2 0.2 0.1 0.3 0.2 0.1 0.5 0.3 0.3
Construction 0.0 0.7 0.5 0.0 0.6 0.4 0.0 0.3 0.2
Distribution 5.9 1.7 1.2 6.3 1.8 1.2 12.6 8.6 6.8
Transport 26.2 29.6 21.8 20.0 22.6 18.2 15.0 16.2 13.5
Communications 2.6 3.1 2.2 3.0 3.6 2.3 2.9 3.2 2.2
Finance 0.2 1.4 1.0 0.3 1.7 1.1 2.5 4.0 3.0
Insurance 0.3 0.4 0.3 0.4 0.5 0.3 0.9 1.1 0.8
Business services & ICT 1.8 2.1 1.5 1.8 2.2 1.5 9.1 9.3 7.5
Other consumer services 1.4 0.9 0.7 1.4 0.9 0.6 1.3 1.0 0.7
Other services 14.6 8.3 5.8 15.2 9.2 5.9 12.1 7.4 4.8
Source: World Bank Export of Value Added Database.
Table A 2. CAGR of domestic value-added for Lao PDR and comparators by sector, 2004-
2011 (FWD linkages)
Sector LAO BGD BWA KHM MNG NPL THA VNM
Agriculture, energy extraction, & minerals 18.4 9.3 6.0 15.5 25.1 15.4 11.0 14.1
Manufacturing 19.3 12.8 8.7 10.1 13.9 10.7 11.6 18.6
Business Services & ICT 21.8 10.2 8.1 12.7 39.7 12.9 10.3 15.3
Communications 20.7 9.7 6.7 7.4 33.8 15.4 11.6 15.1
Construction 17.1 10.0 7.8 9.5 40.3 16.1 12.5 16.1
Distribution 20.1 10.6 7.4 12.6 36.3 13.1 12.0 17.8
Finance 23.5 10.8 5.9 11.9 30.2 12.9 11.7 15.2
Insurance 14.9 10.8 1.2 12.4 30.9 15.7 11.9 9.9
Other consumer services 14.6 10.4 7.4 13.8 42.5 15.3 11.5 15.8
Other services 21.0 9.7 2.6 16.0 34.2 15.4 14.9 17.3
Transport 16.0 10.4 4.9 12.1 26.5 14.2 10.0 23.6
Water 25.7 1.8 7.0 12.0 50.2 15.2 13.2 17.0
Source: World Bank Export of Value Added Database.
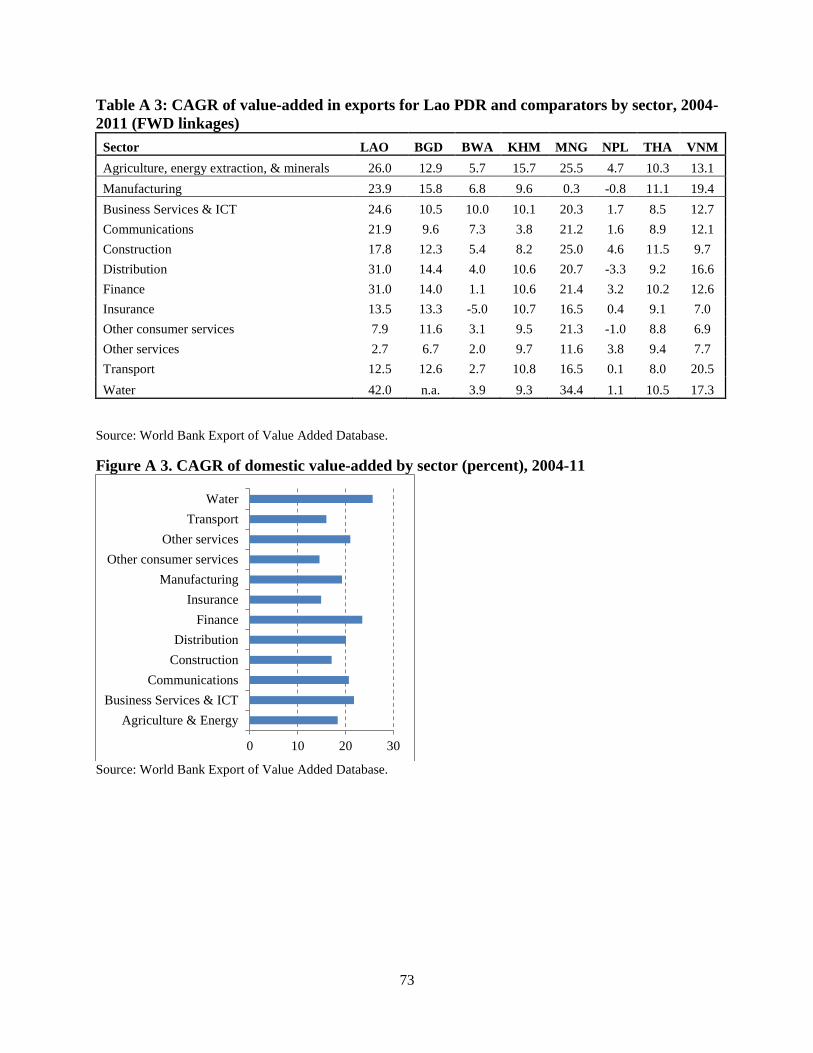
73
Table A 3: CAGR of value-added in exports for Lao PDR and comparators by sector, 2004-
2011 (FWD linkages)
Sector LAO BGD BWA KHM MNG NPL THA VNM
Agriculture, energy extraction, & minerals 26.0 12.9 5.7 15.7 25.5 4.7 10.3 13.1
Manufacturing 23.9 15.8 6.8 9.6 0.3 -0.8 11.1 19.4
Business Services & ICT 24.6 10.5 10.0 10.1 20.3 1.7 8.5 12.7
Communications 21.9 9.6 7.3 3.8 21.2 1.6 8.9 12.1
Construction 17.8 12.3 5.4 8.2 25.0 4.6 11.5 9.7
Distribution 31.0 14.4 4.0 10.6 20.7 -3.3 9.2 16.6
Finance 31.0 14.0 1.1 10.6 21.4 3.2 10.2 12.6
Insurance 13.5 13.3 -5.0 10.7 16.5 0.4 9.1 7.0
Other consumer services 7.9 11.6 3.1 9.5 21.3 -1.0 8.8 6.9
Other services 2.7 6.7 2.0 9.7 11.6 3.8 9.4 7.7
Transport 12.5 12.6 2.7 10.8 16.5 0.1 8.0 20.5
Water 42.0 n.a. 3.9 9.3 34.4 1.1 10.5 17.3
Source: World Bank Export of Value Added Database.
Figure A 3. CAGR of domestic value-added by sector (percent), 2004-11
Source: World Bank Export of Value Added Database.
0 10 20 30
Agriculture & Energy
Business Services & ICT
Communications
Construction
Distribution
Finance
Insurance
Manufacturing
Other consumer services
Other services
Transport
Water

74
Table A 4
(1) (2) (3) (4) (5) (6)
VARIABLES Exporter
Export
share
Export
share Exporter
Export
share Exporter
ALL ALL EAP EAP LAO PDR LAO PDR
Probit OLS OLS Probit OLS Probit
Capital intensity -1.051*** -17.40*** -41.69*** -1.553*** -37.94 -1.137
(0.0794) (1.409) (5.165) (0.221) (25.08) (0.897)
(2.577)
Constant -0.312 21.82*** 65.46*** 0.856*** 58.67** 0.398
(0.253) (2.881) (7.171) (0.265) (25.71) (0.910)
Country year dummies YES YES YES YES
Observations 34,607 34,623 3,649 3,662 377 377
R-squared 0.120 0.061 0.035
Robust standard errors in parentheses
*** p<0.01, ** p<0.05, * p<0.1
Table A 5. Valuations of service input provision by type of firms
(1) (2) (3) (4) (5) (6) (7) (8) (9) (10)
VARIABLES Finance obstacle
Finance obstacle
Finance obstacle
Electricity obstacle
Electricity obstacle
Electricity obstacle
Transport obstacle
Transport obstacle
Transport obstacle
Transport obstacle
LAO PDR EAP ALL LAO PDR EAP ALL LAO PDR LAO PDR ALL EAP
Foreign -0.275* -0.271*** -0.284*** 0.194 -0.0415 -0.00762 -0.222* -0.281** 0.0540*** -0.0418
(0.158) (0.0427) (0.0152) (0.175) (0.0487) (0.0166) (0.130) (0.130) (0.0150) (0.0431)
Exporter 0.0859 -0.00245 -0.0181 0.237* 0.232*** 0.0463*** 0.338** 0.315*** 0.122*** 0.205***
(0.137) (0.0399) (0.0116) (0.126) (0.0431) (0.0125) (0.131) (0.121) (0.0112) (0.04)
Firm size -0.000106 -7.76e-05** -5.74e-05*** -8.67e-05 9.56e-05** 3.33e-06 0.000815** 0.000766*** 2.89e-05*** 7.03e-05*
(0.000283) (3.48e-05) (2.08e-05) (0.000266) (4.87e-05) (1.16e-05) (0.000330) (0.000247) (1.08e-05) (4.67e-05)
Firm age -0.0281*** -0.00425*** -0.00211*** -0.0202*** -0.00138 -0.00114*** -0.0135** -0.00893 -9.87e-05 0.0016
(0.00621) (0.00116) (0.000424) (0.00678) (0.00124) (0.000389) (0.00649) (0.00613) (0.000343) (0.00119)
Manufacturing 0.241** 0.0911*** 0.126*** 0.251** 0.181*** 0.240*** -0.0235 0.0445*** -0.011
(0.120) (0.0337) (0.00971) (0.120) (0.0343) (0.0104) (0.104) (0.00938) -0.0336
Constant 1.502*** 1.372*** 1.811*** 1.433*** 1.818*** 2.607*** 0.800** 0.975*** 1.441*** 1.106***
(0.106) (0.0599) (0.0611) (0.109) (0.0645) (0.0580) (0.328) (0.0970) (0.0646) -0.0597
Country year
dummies
YES YES YES YES YES YES
Sector dummies
YES
Observations 608 6,326 82,209 617 6,528 83,038 605 605 82,667 6,401
R-squared 0.039 0.030 0.136 0.038 0.172 0.191 0.100 0.036 0.111 0.008
Robust standard errors in parentheses. *** p<0.01, ** p<0.05, * p<0.1

75
Table A 6. Determinants of total factor productivity (1) (2) (3)
VARIABLES TFP TFP TFP
LAO PDR EAP ALL
Exporter 0.394* 1.252*** 1.305***
(0.225) (0.0921) (0.0377)
Foreign 1.324*** 1.394*** 1.067***
(0.212) (0.109) (0.0458)
Firm size 0.00440*** 0.00156*** 0.00141***
(0.000624) (0.000290) (0.000205)
Firm age -0.00588 0.0268*** 0.0152***
(0.00876) (0.00386) (0.000776)
Lao PDR 0.386* 5.40***
(0.222) (0.291)
Constant 19.87*** 19.77*** 15.00***
(0.395) (0.123) (0.207)
Country-year dummies YES YES
Sector dummies YES YES YES
Observations 338 1,970 20,673
R-squared 0.457 0.762 0.777
Robust standard errors in parentheses. *** p<0.01, ** p<0.05, * p<0.1

76
Table A 7. Subjective measures of access to finance and productivity
(1) (2) (3) (4) (5) (6)
VARIABLES TFP TFP TFP
Labor
productivity
Labor
productivity
Labor
productivity
EAP LAO PDR ALL LAO PDR EAP ALL
Exporter 1.256*** 0.589** 1.305*** -0.00820 -0.00106 0.0111**
(0.0921) (0.228) (0.0377) (0.0104) (0.00391) (0.00529)
Foreign 1.404*** 1.267*** 1.065*** 0.00646 0.01000* 0.0158**
(0.109) (0.209) (0.0458) (0.00931) (0.00605) (0.00708)
Firm size 0.00155*** 0.00407*** 0.00141*** 5.54e-06 -5.55e-06** -7.70e-06***
(0.000290) (0.000625) (0.000205) (1.73e-05) (2.27e-06) (2.19e-06)
Firm age 0.0266*** -0.000560 0.0151*** 0.000837* 0.000351*** -9.97e-05
(0.00389) (0.00855) (0.000776) (0.000474) (0.000110) (7.28e-05)
Finance obstacle 0.245 1.898*** -0.100*** 0.0348** -0.00937 -0.0137**
(0.165) (0.328) (0.0346) (0.0165) (0.00657) (0.00690)
Constant 19.49*** 16.99*** 15.18*** 1.037*** 1.157*** 1.157***
(0.223) (0.623) (0.218) (0.0272) (0.0159) (0.0159)
Sector dummies YES YES YES YES YES YES
Country year dummies YES YES YES YES
Observations 1,970 338 20,673 602 5,160 64,895
R-squared 0.762 0.500 0.777 0.251 0.138 0.049
Robust standard errors in parentheses. *** p<0.01, ** p<0.05, * p<0.1

77
Table A 8. Objective measures of access to finance and productivity
(1) (2) (3) (4) (5) (6) (7)
VARIABLES TFP TFP TFP TFP TFP TFP TFP
ALL ALL ALL EAP EAP EAP LAO PDR
Exporter 1.185*** 1.298*** 1.154*** 1.212*** 1.216*** 1.198*** 0.323
(0.0461) (0.0403) (0.0498) (0.114) (0.0904) (0.114) (0.215)
Foreign 1.108*** 1.095*** 1.143*** 1.293*** 1.505*** 1.312*** 1.364***
(0.0594) (0.0508) (0.0673) (0.139) (0.107) (0.138) (0.206)
Firm size 0.0012*** 0.00135*** 0.00111*** 0.00131*** 0.00150*** 0.00132*** 0.00457***
(0.000209) (0.000207) (0.000205) (0.000265) (0.000281) (0.000263) (0.000606)
Firm age 0.0182*** 0.0154*** 0.0189*** 0.0242*** 0.0260*** 0.0241*** -0.00211
(0.00101) (0.000801) (0.00105) (0.00477) (0.00379) (0.00475) (0.00868)
Internal funds
(fixed assets) -0.0013***
-0.00285**
(0.000382)
(0.00130)
Internal funds
(working capital)
-0.0024***
-0.00763***
-0.0142***
(0.000350)
(0.00123)
(0.00354)
Bank financing
0.00431*** 0.00530***
(0.000476) (0.00162)
Constant 15.62*** 15.20*** 15.48*** 20.74*** 20.46*** 20.45*** 21.28***
(0.393) (0.207) (0.391) (0.228) (0.166) (0.204) (0.530)
Sector dummies YES YES YES YES YES YES YES
Country year dummies YES YES YES YES YES YES
Observations 9,771 17,937 8,078 940 1,956 939 338
R-squared 0.794 0.772 0.791 0.81 0.768 0.812 0.477
Robust standard errors in parentheses. *** p<0.01, ** p<0.05, * p<0.1

78
Table A 9. Subjective measures of electricity services and productivity
(1) (2) (3) (4) (5)
VARIABLES TFP TFP TFP
Labor
productivity
Labor
productivity
LAO PDR EAP ALL LAO PDR EAP
Exporter 0.849*** 1.160*** 1.236*** 0.00142 0.000938
(0.286) (0.0887) (0.0355) (0.0111) (0.00392)
Foreign 1.246*** 1.274*** 0.998*** 0.0156 0.00422
(0.292) (0.112) (0.0454) (0.0101) (0.00435)
Firm size 0.00322*** 0.00133*** 0.00133*** 9.26e-06 -6.10e-06***
(0.000491) (0.000262) (0.000196) (1.78e-05) (2.15e-06)
Firm age 0.00524 0.0253*** 0.0146*** 0.000752 0.000369***
(0.0123) (0.00382) (0.000770) (0.000583) (0.000117)
Electricity obstacle -0.0702 -0.500*** -0.0536** -0.0542** -0.0247***
(0.520) (0.182) (0.0241) (0.0249) (0.00663)
Own generator 0.603 1.000*** 0.690*** -0.0102 0.00924***
(0.367) (0.0840) (0.0291) (0.0118) (0.00327)
Constant 19.67*** 20.25*** 14.77*** 1.158*** 1.214***
(0.798) (0.228) (0.228) (0.0392) (0.0265)
Sector dummies YES YES YES YES YES
Country year dummies YES YES YES
Observations 149 1,778 20,163 388 3,657
R-squared 0.594 0.798 0.785 0.204 0.160
Robust standard errors in parentheses. *** p<0.01, ** p<0.05, * p<0.1

79
Table A 10. Objective measures of electricity services and productivity (1) (2) (3) (4)
VARIABLES TFP TFP TFP TFP
LAO PDR EAP EAP ALL
Exporter 1.110*** 1.194*** 1.138*** 1.185***
(0.328) (0.105) (0.102) (0.0472)
Foreign 2.487*** 0.993*** 1.038*** 0.855***
(0.594) (0.165) (0.137) (0.0722)
Firm size 0.00240* 0.00100*** 0.00123*** 0.00164***
(0.00118) (0.000213) (0.000261) (0.000307)
Firm age -0.0254 0.0246*** 0.0267*** 0.0124***
(0.0295) (0.00491) (0.00459) (0.00110)
Length of power outages 0.00812
-0.000836**
(0.00733)
(0.000373)
Own generator 0.519 0.843*** 0.899*** 0.689***
(0.929) (0.110) (0.0987) (0.0425)
Power outages -0.0951*
-0.0117***
(0.0547)
(0.00429)
Constant 20.59*** 20.15*** 20.10*** 15.09***
(0.612) (0.196) (0.151) (0.311)
Sector dummies YES YES YES YES
Country year dummies YES YES YES
Observations 36 880 1,184 10,714
R-squared 0.797 0.839 0.830 0.793

80
Table A 11. Access to water and productivity
(1) (2) (3) (4) (5)
VARIABLES TFP TFP TFP TFP TFP
LAO PDR LAO PDR EAP EAP EAP
Exporter 0.465 1.099 1.056*** 1.012*** 1.012***
(0.363) (1.011) (0.0888) (0.0946) (0.0946)
Foreign 1.131*** -0.576 1.055*** 0.896*** 0.896***
(0.308) (1.076) (0.113) (0.137) (0.137)
Firm size 0.00324*** 0.00548** 0.00220*** 0.00254*** 0.00254***
(0.000484) (0.00192) (0.000368) (0.000280) (0.000280)
Firm age 0.0154 0.00715 0.0170*** 0.0159*** 0.0159***
(0.0154) (0.0350) (0.00224) (0.00231) (0.00231)
Water supply incidents -0.0349* -0.00449**
(0.0196) (0.00196)
Length water outages 0.0561
-0.00453*** -0.00453***
(0.0457)
(0.00154) (0.00154)
Constant 19.70*** 20.49*** 15.13*** 15.20*** 15.20***
(0.479) (0.592) (0.431) (0.460) (0.460)
Sector dummies YES YES YES YES YES
Country year dummies YES YES YES
Observations 113 29 2,174 1,741 1,741
R-squared 0.608 0.728 0.800 0.786 0.786
Robust standard errors in parentheses. *** p<0.01, ** p<0.05, * p<0.1

81
Table A 12. Subjective measures of quality of transport and productivity
(1) (2) (3) (4) (5)
VARIABLES TFP TFP TFP
Labor
productivity
Labor
productivity
LAO PDR EAP ALL LAO PDR EAP
Exporter 0.540** 1.250*** 1.305*** -0.00691 -0.00110
(0.223) (0.0912) (0.0377) (0.0105) (0.00391)
Foreign 1.218*** 1.417*** 1.067*** 0.00607 0.0105*
(0.213) (0.108) (0.0458) (0.00921) (0.00605)
Firm size 0.00411*** 0.00156*** 0.00141*** -8.87e-07 -5.59e-06**
(0.000636) (0.000284) (0.000206) (1.74e-05) (2.31e-06)
Firm age -0.00644 0.0271*** 0.0151*** 0.000863* 0.000350***
(0.00860) (0.00388) (0.000777) (0.000474) (0.000110)
Transport obstacle -2.195*** -0.645*** 0.0437 -0.0895*** -0.0173***
(0.581) (0.144) (0.0346) (0.0184) (0.00504)
Constant 21.61*** 20.26*** 14.94*** 1.167*** 1.167***
(0.611) (0.160) (0.216) (0.0247) (0.0157)
Sector dummies YES YES YES YES YES
Country year dummies YES YES YES
Observations 338 1,970 20,673 602 5,160
R-squared 0.477 0.765 0.777 0.271 0.139
Robust standard errors in parentheses. *** p<0.01, ** p<0.05, * p<0.1

82
Table A 13. Internet connectivity and productivity (1) (2) (3) (4) (5) (6)
VARIABLES TFP TFP TFP
Labor
productivity
Labor
productivity
Labor
productivity
LAO PDR EAP ALL LAO PDR EAP ALL
Exporter 0.344* 0.780*** 0.967*** -0.00798 -0.00271 0.00994*
(0.205) (0.0830) (0.0313) (0.0107) (0.00414) (0.00593)
Foreign 0.750*** 1.100*** 0.938*** 0.0134 0.00914 0.0150**
(0.205) (0.0994) (0.0431) (0.00967) (0.00609) (0.00722)
Firm size 0.00340*** 0.00133*** 0.00125*** 1.87e-05 -6.11e-06*** -8.17e-06***
(0.000518) (0.000223) (0.000177) (1.83e-05) (2.32e-06) (2.30e-06)
Firm age -0.00177 0.0196*** 0.0132*** 0.000624 0.000330*** -0.000102
(0.00870) (0.00331) (0.000708) (0.000470) (0.000111) (7.24e-05)
Email users 1.199*** 1.318*** 0.883*** -0.0218** 0.00735** 0.0157***
(0.180) (0.0864) (0.0306) (0.00878) (0.00333) (0.00605)
Website 0.391** 0.652*** 0.718*** 0.00600 -0.00420
(0.197) (0.0822) (0.0276) (0.00917) (0.00438)
Constant 18.80*** 19.47*** 14.76*** 1.101*** 1.143*** 1.123***
(0.306) (0.108) (0.199) (0.0169) (0.0149) (0.00836)
Sector dummies YES YES YES YES YES YES
Country year dummies YES YES YES YES
Observations 338 1,965 20,360 600 5,149 64,101
R-squared 0.562 0.812 0.807 0.254 0.138 0.049
Robust standard errors in parentheses
*** p<0.01, ** p<0.05, * p<0.1
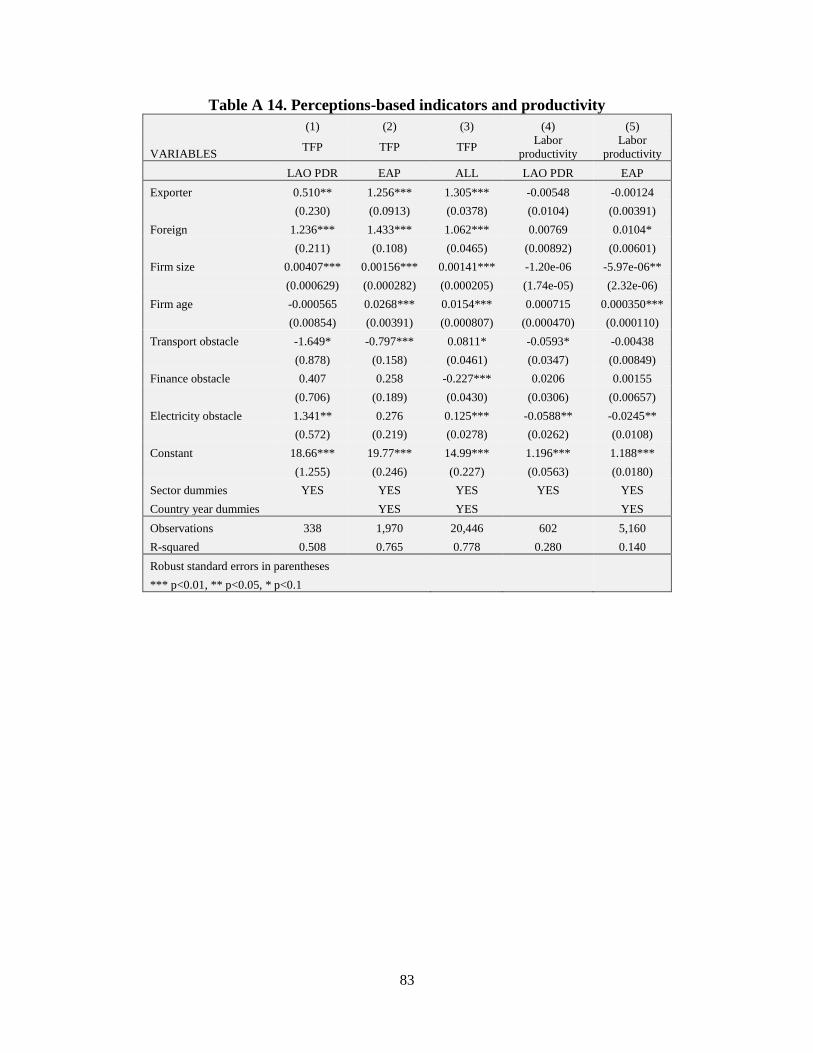
83
Table A 14. Perceptions-based indicators and productivity
(1) (2) (3) (4) (5)
VARIABLES TFP TFP TFP
Labor
productivity
Labor
productivity
LAO PDR EAP ALL LAO PDR EAP
Exporter 0.510** 1.256*** 1.305*** -0.00548 -0.00124
(0.230) (0.0913) (0.0378) (0.0104) (0.00391)
Foreign 1.236*** 1.433*** 1.062*** 0.00769 0.0104*
(0.211) (0.108) (0.0465) (0.00892) (0.00601)
Firm size 0.00407*** 0.00156*** 0.00141*** -1.20e-06 -5.97e-06**
(0.000629) (0.000282) (0.000205) (1.74e-05) (2.32e-06)
Firm age -0.000565 0.0268*** 0.0154*** 0.000715 0.000350***
(0.00854) (0.00391) (0.000807) (0.000470) (0.000110)
Transport obstacle -1.649* -0.797*** 0.0811* -0.0593* -0.00438
(0.878) (0.158) (0.0461) (0.0347) (0.00849)
Finance obstacle 0.407 0.258 -0.227*** 0.0206 0.00155
(0.706) (0.189) (0.0430) (0.0306) (0.00657)
Electricity obstacle 1.341** 0.276 0.125*** -0.0588** -0.0245**
(0.572) (0.219) (0.0278) (0.0262) (0.0108)
Constant 18.66*** 19.77*** 14.99*** 1.196*** 1.188***
(1.255) (0.246) (0.227) (0.0563) (0.0180)
Sector dummies YES YES YES YES YES
Country year dummies YES YES YES
Observations 338 1,970 20,446 602 5,160
R-squared 0.508 0.765 0.778 0.280 0.140
Robust standard errors in parentheses
*** p<0.01, ** p<0.05, * p<0.1

84
The World Bank Lao PDR
Patouxay Nehru Road
P.O Box: 345
Tel: +856 (21) 266 200
Fax: +856 (21) 266 299
Website: www.worldbank.org/lao
The World Bank
1818 H Street, NW
Washington, D.C. 20433, USA
Tel: +1 (202) 4731000
Fax: +1 (202) 4776391
Website: www.worldbank.org