report no. 544 soils proficiency testing round 5...
TRANSCRIPT

Report No. 544
SOILS PROFICIENCY TESTING
ROUND 5 (NSW & ACT)
Liquid Limit, Plastic Limit, Plasticity Index & Linear Shrinkage
June 2007
ACKNOWLEDGMENTS
PTA wishes to gratefully acknowledge the technical assistance provided for this program by Mr Peter Sheen of Testrite Laboratories Pty Ltd. This assistance included providing input into the design of the program, technical advice, sample supply, homogeneity testing and technical commentary of the final report.
© COPYRIGHT PROFICIENCY TESTING AUSTRALIA 2007
P O Box 7507 Silverwater NSW 2128 AUSTRALIA

CONTENTS
1. Foreword............................................................................................................................1
2. Program Features and Design...........................................................................................1
3. Statistical Format ...............................................................................................................2
4. PTA and Technical Advisers’ Comments ..........................................................................4
5. Outlier Results ...................................................................................................................4
6. Reference ..........................................................................................................................5
APPENDIX A – Results & Data Analysis
+425µm Sieve.………..……………………………………………………………………………..A1
Liquid Limit …………………………….…..…………………………...…………………………..A2
Plastic Limit………………………………………………………………………………………….A6
Plasticity Index .…………………………………………………………………………………...A10
Linear Shrinkage……….………………………………………………………………………….A14
APPENDIX B – Sample Homogeneity
Homogeneity Testing ………………………………………………………….…………………… B1 APPENDIX C – Documentation
Instructions to Participants …………………………………………………………………………C1
Results Sheet………………………………………………………………………………………...C2

1
1. Foreword
This report summarises the results of a proficiency testing program on selected tests of a soil. The exercise was conducted in April 2007 by the Proficiency Testing Australia (PTA). The main aim of the program was to assess the competency of participating laboratories in performing the prescribed analyses.
2. Program Features and Design 2.1 Each laboratory was randomly allocated a unique code number for the program to
ensure confidentiality of results. Reference to each laboratory in this report is by code number only.
2.2 Laboratories were provided with the "Instructions to Participants" and "Results Sheet"
(see Appendix C). NATA accredited laboratories were requested to perform the tests according to their accredited methods.
2.3 Participants were provided with one 1000g soil sample for testing.
Laboratories were asked to perform the following analyses (see Appendix C):
+425µm Sieve Liquid Limit Plastic Limit Plasticity Index Linear Shrinkage
2.4 A total of 98 laboratories throughout NSW, ACT and Papua New Guinea received
samples. 16 laboratories did not return results by the due date. 2.5 Results (as reported by participants) with corresponding summary statistics (i.e.
number of results, median, normalised interquartile range, minimum, maximum and range) are presented in Appendix A (for each of the analyses performed by each method).
2.6 A robust statistical approach, using z-scores, was utilised to assess laboratories’
testing performance. Robust z-scores, z-score charts relevant to each test and method are presented in Appendix A.
The document entitled Guide to PTA Proficiency Testing, Jan 2006 (reference [1]) defines the statistical terms and details the statistical procedures referred to in this report.
2.7 A tabulated listing of laboratories (by code number) identified as having outlier results
can be found on page 4. 2.8 Prior to sample distribution, a number of randomly selected samples were analysed
for homogeneity. Based on the results of this testing (see Appendix B) it was
2
considered that the samples utilised for this program were homogenous. As such, any results later identified as extreme could not be attributed to any significant sample variability.
3. Statistical Format
For each test, where appropriate, the following information is given:
- a table of results and calculated z-scores;
- a list of summary statistics;
- ordered z-score charts;
3.1 Outlier Results and Z-scores In order to assess laboratories’ testing performance, a robust statistical approach,
using z-scores, was utilised. Z-scores give a measure of how far a result is from the consensus value (i.e. the median), and gives a "score" to each result relative to the other results in the group.
A z-score close to zero indicates that the result agrees well with those from other
laboratories. Whereas, a z-score with an absolute value greater than three is considered to be an outlier and is marked by the symbol “§”.
Each determination was examined for outliers with all methods pooled. Please see
reference [1] for details on how these z-scores are calculated. 3.2 Results Tables and Summary Statistics Each of these tables contains the results returned by each laboratory, including the
code number for the method used, and the robust z-score calculated for each result. Results have been entered exactly as reported by participants. That is, laboratories
which did not report results to the precision (i.e. number of significant figures) requested on the Results Sheet have not been rounded to the requested precision before being included in the statistical analysis.
A list of summary statistics appears at the bottom of each of the tables of results and consists of:
- the number of results for that test/sample (No. of Results);
- the median of these results, i.e. the middle value (Median);
- the normalised interquartile range of the results (Normalised IQR);
- the robust coefficient of variation, expressed as a percentage (Robust CV) - i.e. 100 x Normalised IQR / Median;
- the minimum and maximum laboratory results; and
- the range (Maximum - Minimum).
The median is a measure of the centre of the data.
3
The normalised IQR is a measure of the spread of the results. It is calculated by multiplying the interquartile range (IQR) by 0.7413, a factor which converts the IQR to an estimate of the standard deviation. The IQR is the difference between the upper and lower quartiles (i.e. the values above and below which a quarter of the results lie, respectively).
Please see reference [1] for further details on these robust summary statistics. The following summary statistics were sent to participants shortly after the return of results to provide them with “early information” about the results for the program.
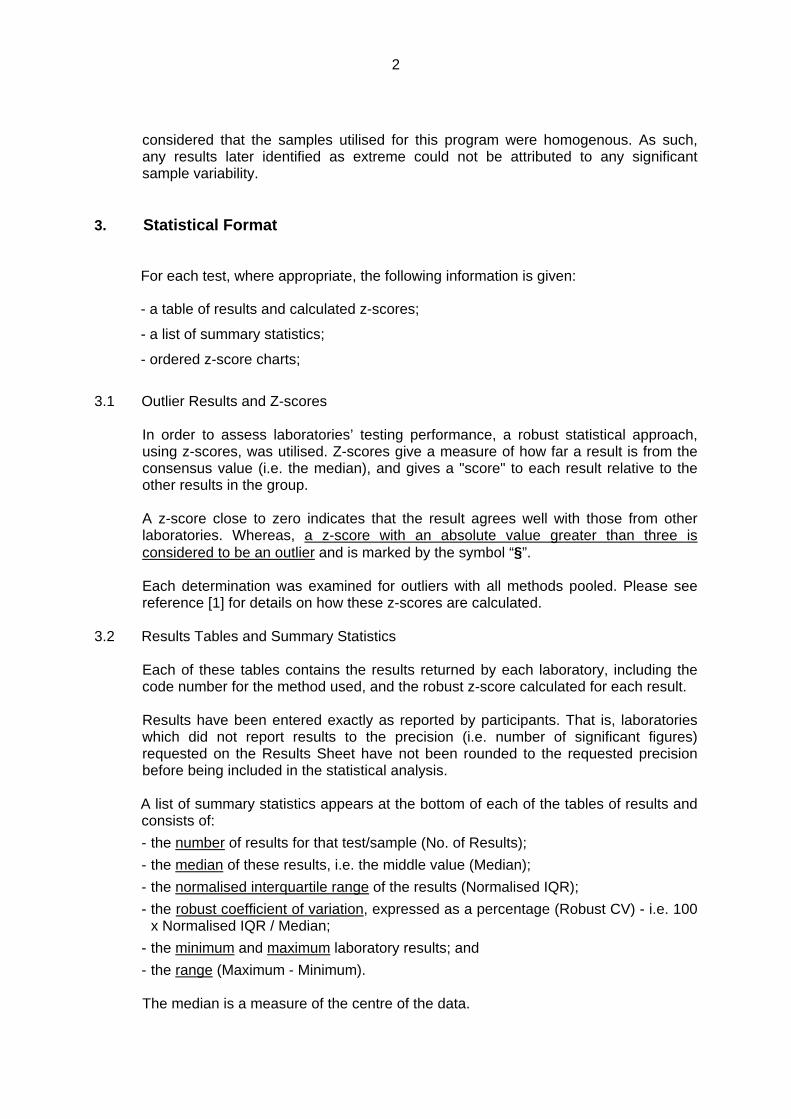
TABLE A – SUMMARY STATISTICS
Normalised Robust Number ofIQR CV Results
+425µm Sieve 1 0.74 74.1% 80
Liquid Limit 46 1.48 3.2% 82
Plastic Limit 19 1.48 7.8% 82
Plasticity Index 27 2.13 7.9% 82
Linear Shrinkage 12 1.11 9.3% 79
Analysis Median
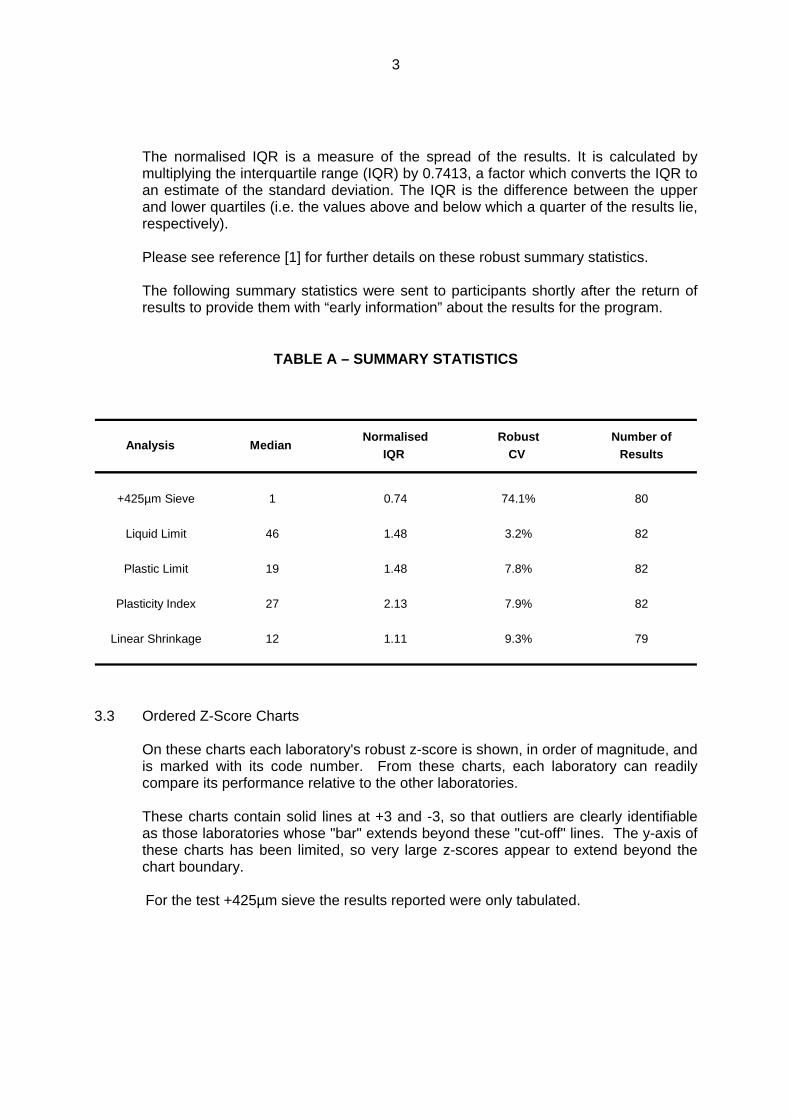
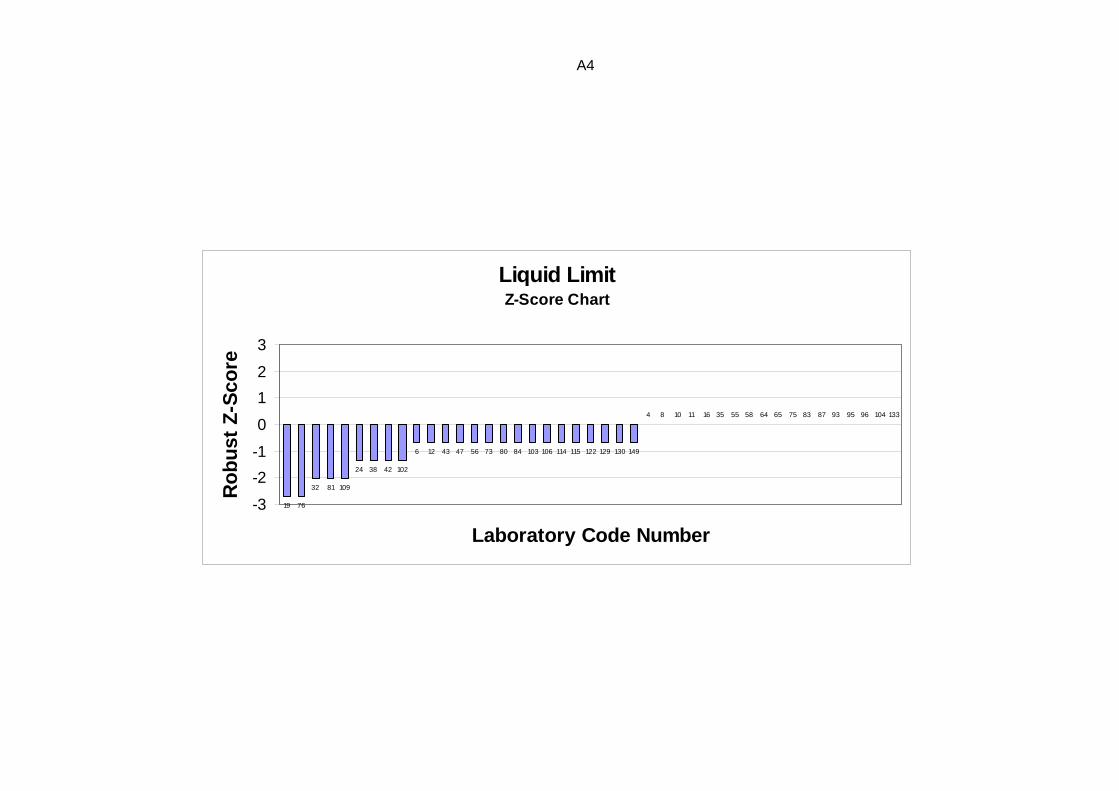
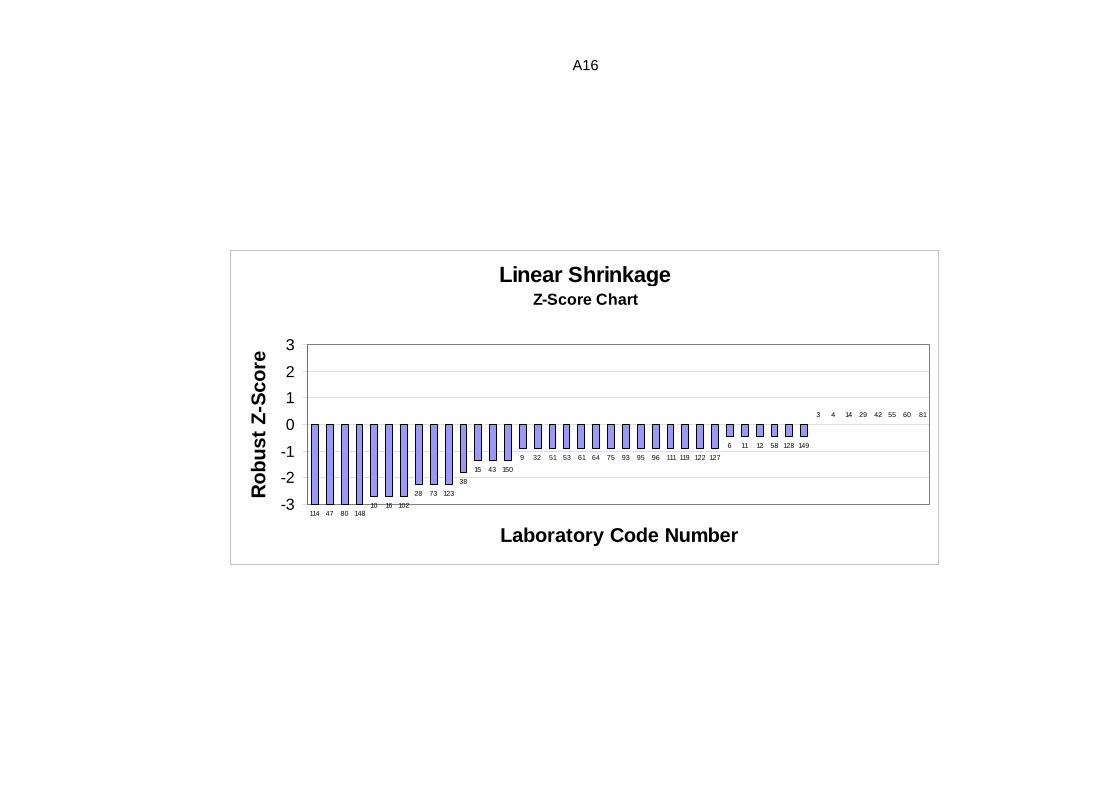
3.3 Ordered Z-Score Charts On these charts each laboratory's robust z-score is shown, in order of magnitude, and
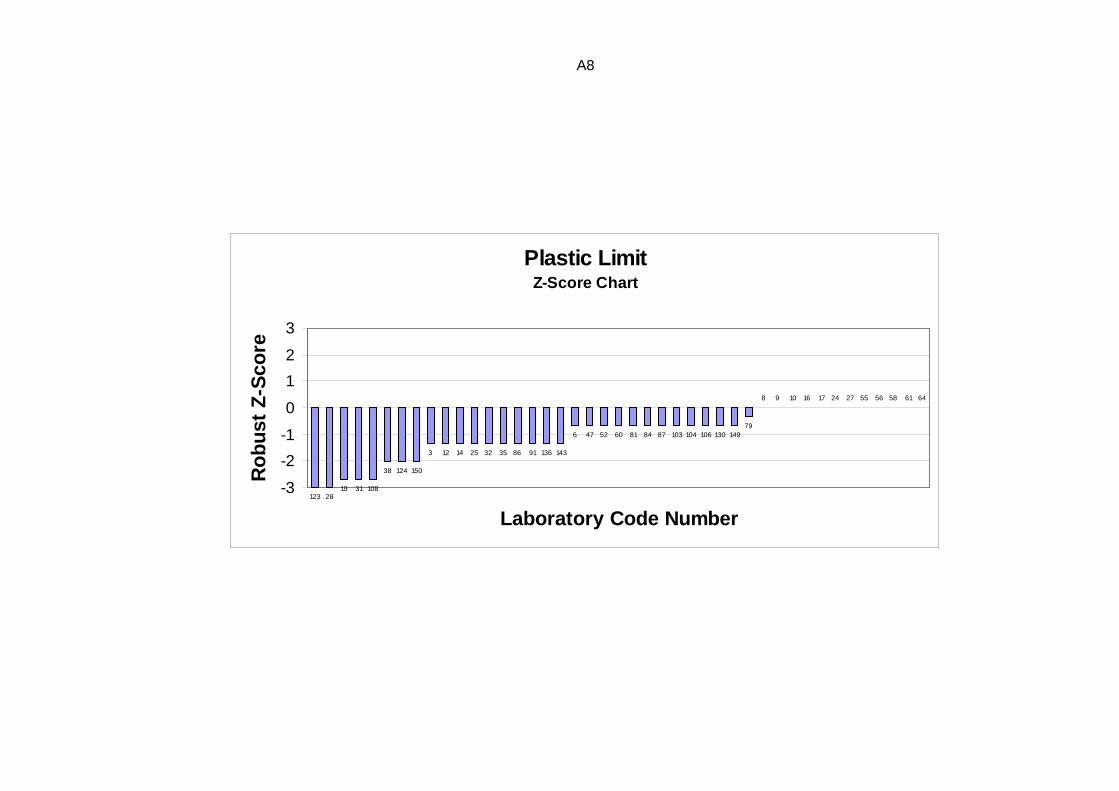
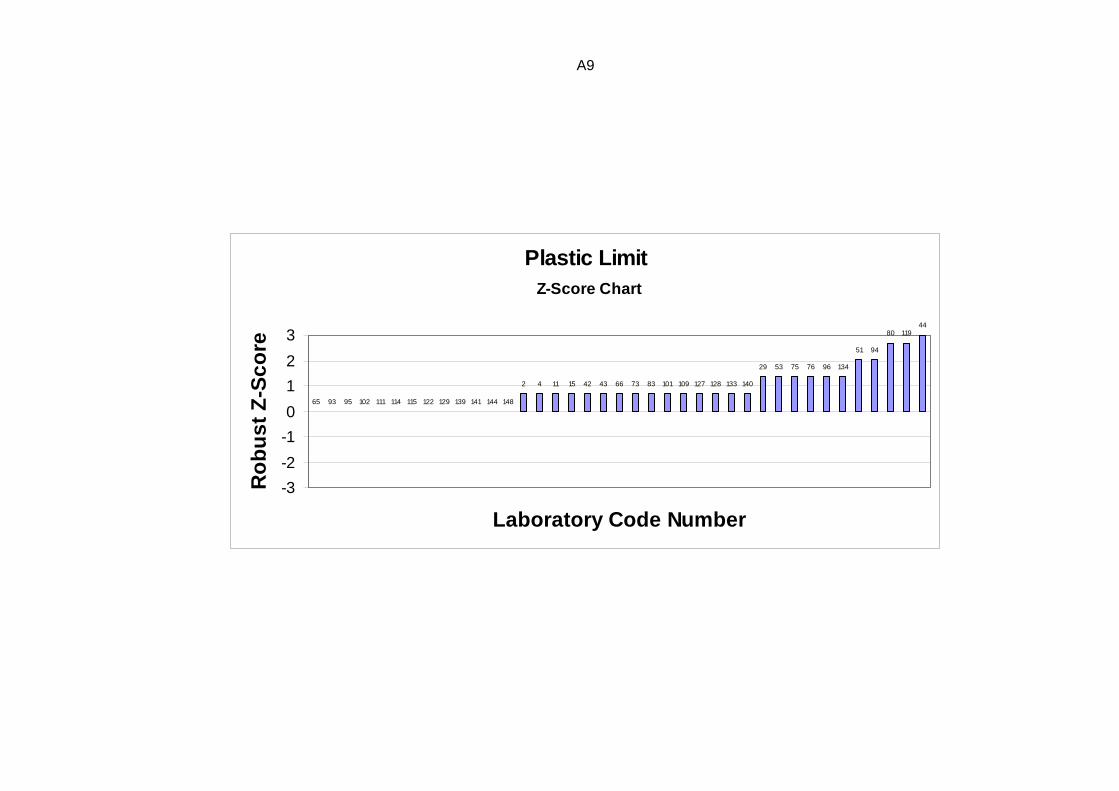
is marked with its code number. From these charts, each laboratory can readily compare its performance relative to the other laboratories.
These charts contain solid lines at +3 and -3, so that outliers are clearly identifiable
as those laboratories whose "bar" extends beyond these "cut-off" lines. The y-axis of these charts has been limited, so very large z-scores appear to extend beyond the chart boundary.
For the test +425µm sieve the results reported were only tabulated.

4
4. Outlier Results
Laboratories reporting outlier results are listed in the following table:
Lab Code Liquid Limit Plastic Limit Plasticity Index Linear Shrinka ge
28,44,123 §
123 §
47,80,114,148 §
A “§” indicates the occurrence of a z-score outlier result (i.e. those results for which |z-score|>3).
5. PTA and Technical Advisers’ Comments +425µm Sieve
Lab Codes 24, 27 & 144 have most likely reported percentage passing the 425µm sieve. If this is a misinterpretation of the request then the actual testing is in line with the norm. Taking into account the results reported for Lab Codes 24, 27 & 144 the percentage of significant error for this test is <1%. Lab Code 35 result is significantly different from the norm. The laboratory concerned should review the testing procedures.
Liquid Limit
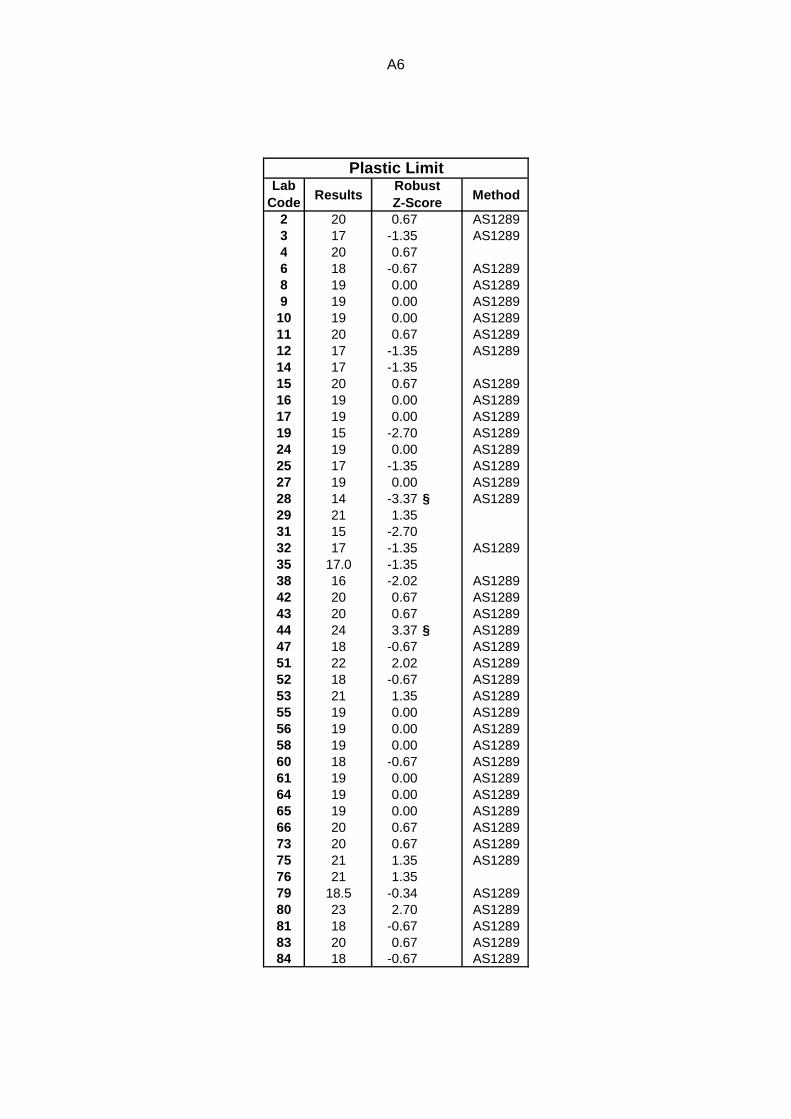
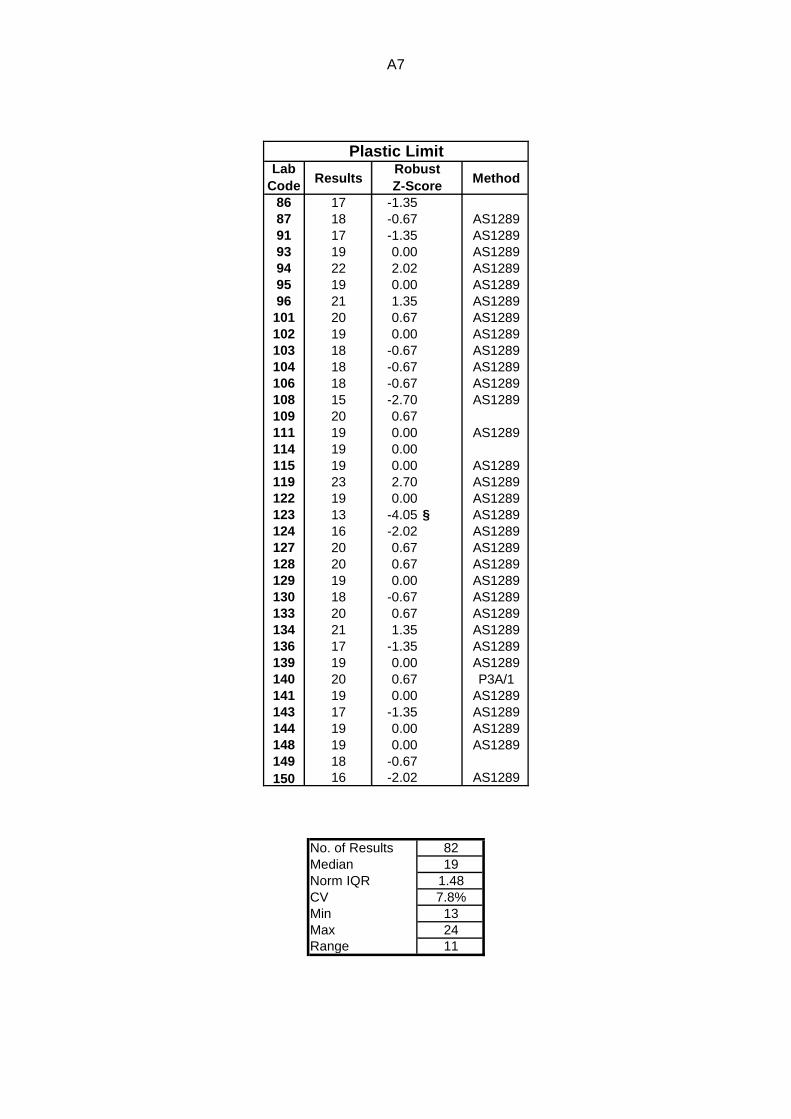
No outliers recorded. Lab Code 35 although providing a 425µm result that could be expected to provide a significant different liquid limit result, has recorded a results that is the median of all the results. Plastic Limit Three outliers were recorded for Lab Codes 28, 44 & 123.
Plasticity Index One outlier was recorded for Lab Code 123. 1.2% of returned results reported statistical outliers for this test.

5
Linear Shrinkage Four outliers were recorded for Lab Codes 47, 80, 114 and 148. These outliers are not indicated by the Liquid Limit results (close to the Liquid Limit consistency is nominated for the Linear Shrinkage Test). It is noted that all of the outliers are less than that of the median which may suggest that the test specimens were not dried out until the shrinkage ceased or the mould was not oiled.
5.1% of returned results reported statistical outliers for this test.
6. Reference
[1] Guide to Proficiency Testing Australia (Jan 2006).

APPENDIX A
Results & Data Analysis

A1
+425µm Sieve
Lab Code Results Lab Code Results2 1 79 1.03 1 80 14 nil 81 5.86 0 83 1.08 0.8 84 0.19 0 86 010 0 87 111 1 91 012 1 93 014 1 94 115 0.7 95 116 0 96 117 1 101 119 0 102 0.724 99.2 103 125 0 104 127 99 106 128 1.0 108 029 0 109 131 0 111 032 1.0 114 535 58.0 115 138 1 119 142 1 122 043 1 123 1.044 1 124 147 0.0 127 nil51 0 128 152 0 129 153 0 130 055 0 133 5.056 1.0 134 058 1 136 060 1 139 1.061 1 140 164 0 141 165 1.0 143 0.066 2 144 10073 1 148 0.875 1 149 1.076 1 150 1.0

A2
Lab Code Results Method
2 47 0.67 AS12893 48 1.35 AS12894 46 0.006 45 -0.67 AS12898 46 0.00 AS12899 47 0.67 AS128910 46 0.00 AS128911 46 0.00 AS128912 45 -0.67 AS128914 48 1.3515 48 1.35 AS128916 46 0.00 AS128917 48 1.35 AS128919 42 -2.70 AS128924 44 -1.35 AS128925 49 2.02 AS128927 48 1.35 AS128928 47 0.67 AS128929 47 0.6731 47 0.6732 43 -2.02 AS128935 46.0 0.0038 44 -1.35 AS128942 44 -1.35 AS128943 45 -0.67 AS128944 47 0.67 AS128947 45 -0.67 AS128951 47 0.67 AS128952 47 0.67 AS128953 48 1.35 AS128955 46 0.00 AS128956 45 -0.67 AS128958 46 0.00 AS128960 48 1.35 AS128961 50 2.70 AS128964 46 0.00 AS128965 46 0.00 AS128966 47 0.67 AS128973 45 -0.67 AS128975 46 0.00 AS128976 42 -2.7079 47.0 0.67 AS128980 45 -0.67 AS128981 43 -2.02 AS128983 46 0.00 AS128984 45 -0.67 AS1289
Robust Z-Score
Liquid Limit

A3
Lab Code Results Method
86 47 0.6787 46 0.00 AS128991 47 0.67 AS128993 46 0.00 AS128994 48 1.35 AS128995 46 0.00 AS128996 46 0.00 AS1289101 47 0.67 AS1289102 44 -1.35 AS1289103 45 -0.67 AS1289104 46 0.00 AS1289106 45 -0.67 AS1289108 48 1.35 AS1289109 43 -2.02111 47 0.67 AS1289114 45 -0.67115 45 -0.67 AS1289119 47 0.67 AS1289122 45 -0.67 AS1289123 48 1.35 AS1289124 47 0.67 AS1289127 47 0.67 AS1289128 49 2.02 AS1289129 45 -0.67 AS1289130 45 -0.67 AS1289133 46 0.00 AS1289134 49 2.02 AS1289136 49 2.02 AS1289139 46 0.00 AS1289140 46 0.00 P2B/2141 46 0.00 AS1289143 48 1.35 AS1289144 48 1.35 AS1289148 47 0.67 AS1289149 45 -0.67150 46 0.00 AS1289
Robust Z-Score
Liquid Limit
No. of Results 82Median 46Norm IQR 1.48CV 3.2%Min 42Max 50Range 8
A4
Liquid Limit Z-Score Chart
19 76
32 81 109
24 38 42 102
6 12 43 47 56 73 80 84 103 106 114 115 122 129 130 149
4 8 10 11 16 35 55 58 64 65 75 83 87 93 95 96 104 133
-3
-2
-1
0
1
2
3
Laboratory Code Number
Rob
ust Z
-Sco
re
A5
Liquid Limit Z-Score Chart
139 140 141 150
2 9 28 29 31 44 51 52 66 79 86 91 101 111 119 124 127 148
3 14 15 17 27 53 60 94 108 123 143 144
25 128 134 136
61
-3
-2
-1
0
1
2
3
Laboratory Code Number
Rob
ust Z
-Sco
re
A6
Lab Code Results Method
2 20 0.67 AS12893 17 -1.35 AS12894 20 0.676 18 -0.67 AS12898 19 0.00 AS12899 19 0.00 AS1289
10 19 0.00 AS128911 20 0.67 AS128912 17 -1.35 AS128914 17 -1.3515 20 0.67 AS128916 19 0.00 AS128917 19 0.00 AS128919 15 -2.70 AS128924 19 0.00 AS128925 17 -1.35 AS128927 19 0.00 AS128928 14 -3.37 § AS128929 21 1.3531 15 -2.7032 17 -1.35 AS128935 17.0 -1.3538 16 -2.02 AS128942 20 0.67 AS128943 20 0.67 AS128944 24 3.37 § AS128947 18 -0.67 AS128951 22 2.02 AS128952 18 -0.67 AS128953 21 1.35 AS128955 19 0.00 AS128956 19 0.00 AS128958 19 0.00 AS128960 18 -0.67 AS128961 19 0.00 AS128964 19 0.00 AS128965 19 0.00 AS128966 20 0.67 AS128973 20 0.67 AS128975 21 1.35 AS128976 21 1.3579 18.5 -0.34 AS128980 23 2.70 AS128981 18 -0.67 AS128983 20 0.67 AS128984 18 -0.67 AS1289
Robust Z-Score
Plastic Limit
A7
Lab Code Results Method
86 17 -1.3587 18 -0.67 AS128991 17 -1.35 AS128993 19 0.00 AS128994 22 2.02 AS128995 19 0.00 AS128996 21 1.35 AS1289101 20 0.67 AS1289102 19 0.00 AS1289103 18 -0.67 AS1289104 18 -0.67 AS1289106 18 -0.67 AS1289108 15 -2.70 AS1289109 20 0.67111 19 0.00 AS1289114 19 0.00115 19 0.00 AS1289119 23 2.70 AS1289122 19 0.00 AS1289123 13 -4.05 § AS1289124 16 -2.02 AS1289127 20 0.67 AS1289128 20 0.67 AS1289129 19 0.00 AS1289130 18 -0.67 AS1289133 20 0.67 AS1289134 21 1.35 AS1289136 17 -1.35 AS1289139 19 0.00 AS1289140 20 0.67 P3A/1141 19 0.00 AS1289143 17 -1.35 AS1289144 19 0.00 AS1289148 19 0.00 AS1289149 18 -0.67150 16 -2.02 AS1289
Robust Z-Score
Plastic Limit
No. of Results 82Median 19Norm IQR 1.48CV 7.8%Min 13Max 24Range 11
A8
Plastic Limit Z-Score Chart
123 2819 31 108
38 124 150
3 12 14 25 32 35 86 91 136 143
6 47 52 60 81 84 87 103 104 106 130 14979
8 9 10 16 17 24 27 55 56 58 61 64
-3
-2
-1
0
1
2
3
Laboratory Code Number
Rob
ust Z
-Sco
re
A9
Plastic Limit Z-Score Chart
65 93 95 102 111 114 115 122 129 139 141 144 148
2 4 11 15 42 43 66 73 83 101 109 127 128 133 140
29 53 75 76 96 134
51 94
80 11944
-3
-2
-1
0
1
2
3
Laboratory Code Number
Rob
ust Z
-Sco
re

A10
Lab Code Results Method
2 27 0.00 AS12893 31 1.88 AS12894 26 -0.476 27 0.00 AS12898 27 0.00 AS12899 28 0.47 AS128910 27 0.00 AS128911 26 -0.47 AS128912 28 0.47 AS128914 31 1.8815 28 0.47 AS128916 27 0.00 AS128917 29 0.94 AS128919 27 0.00 AS128924 25 -0.94 AS128925 32 2.35 AS128927 29 0.94 AS128928 33 2.82 AS128929 26 -0.4731 32 2.3532 26 -0.47 AS128935 29.0 0.9438 28 0.47 AS128942 24 -1.41 AS128943 25 -0.94 AS128944 23 -1.88 AS128947 27 0.00 AS128951 25 -0.94 AS128952 29 0.94 AS128953 27 0.00 AS128955 27 0.00 AS128956 26 -0.47 AS128958 27 0.00 AS128960 30 1.41 AS128961 31 1.88 AS128964 27 0.00 AS128965 27 0.00 AS128966 27 0.00 AS128973 25 -0.94 AS128975 25 -0.94 AS128976 21 -2.8279 28.5 0.70 AS128980 22 -2.35 AS128981 25 -0.94 AS128983 26 -0.47 AS128984 27 0.00 AS1289
Robust Z-Score
Plasticity Index
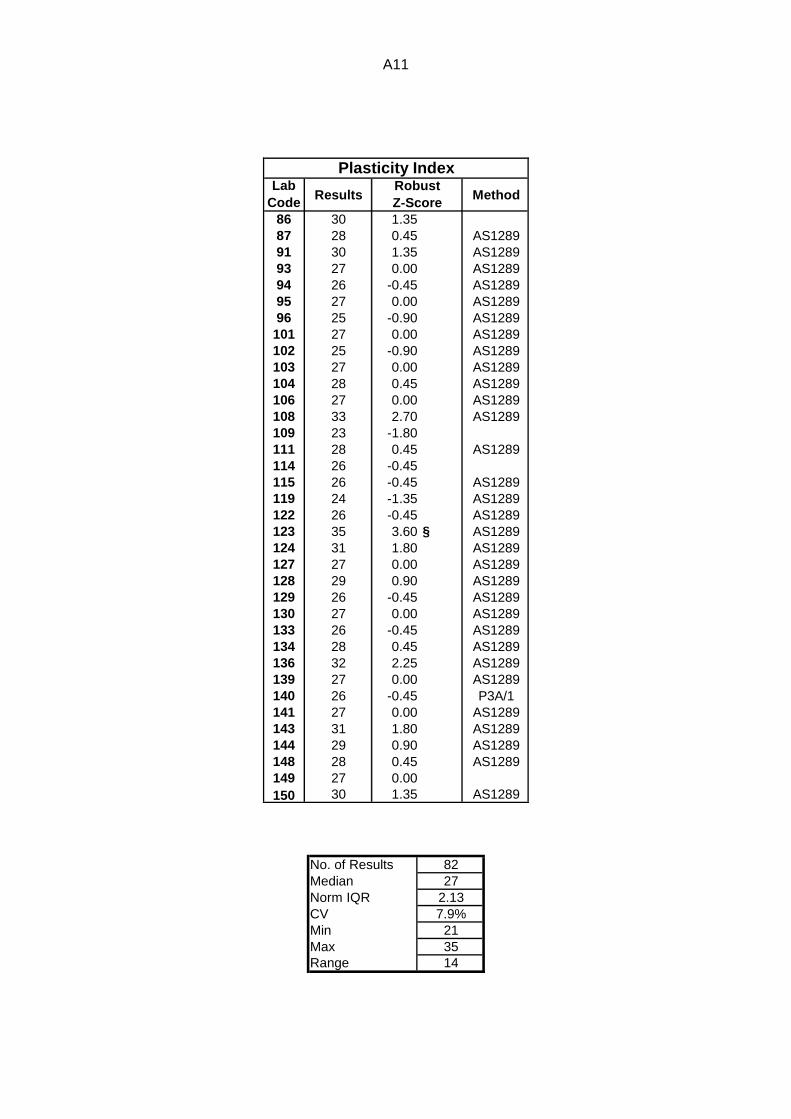
A11
Lab Code Results Method
86 30 1.3587 28 0.45 AS128991 30 1.35 AS128993 27 0.00 AS128994 26 -0.45 AS128995 27 0.00 AS128996 25 -0.90 AS1289101 27 0.00 AS1289102 25 -0.90 AS1289103 27 0.00 AS1289104 28 0.45 AS1289106 27 0.00 AS1289108 33 2.70 AS1289109 23 -1.80111 28 0.45 AS1289114 26 -0.45115 26 -0.45 AS1289119 24 -1.35 AS1289122 26 -0.45 AS1289123 35 3.60 § AS1289124 31 1.80 AS1289127 27 0.00 AS1289128 29 0.90 AS1289129 26 -0.45 AS1289130 27 0.00 AS1289133 26 -0.45 AS1289134 28 0.45 AS1289136 32 2.25 AS1289139 27 0.00 AS1289140 26 -0.45 P3A/1141 27 0.00 AS1289143 31 1.80 AS1289144 29 0.90 AS1289148 28 0.45 AS1289149 27 0.00150 30 1.35 AS1289
Robust Z-Score
Plasticity Index
No. of Results 82Median 27Norm IQR 2.13CV 7.9%Min 21Max 35Range 14

A12
Plasticity Index Z-Score Chart
76
80
44 109
42 119
24 43 51 73 75 81 96 102
4 11 29 32 56 83 94 114 115 122 129 133 140
2 6 8 10 16 19 47 53 55 58 64 65 66 84 93 95
-3
-2
-1
0
1
2
3
Laboratory Code Number
Rob
ust Z
-Sco
re
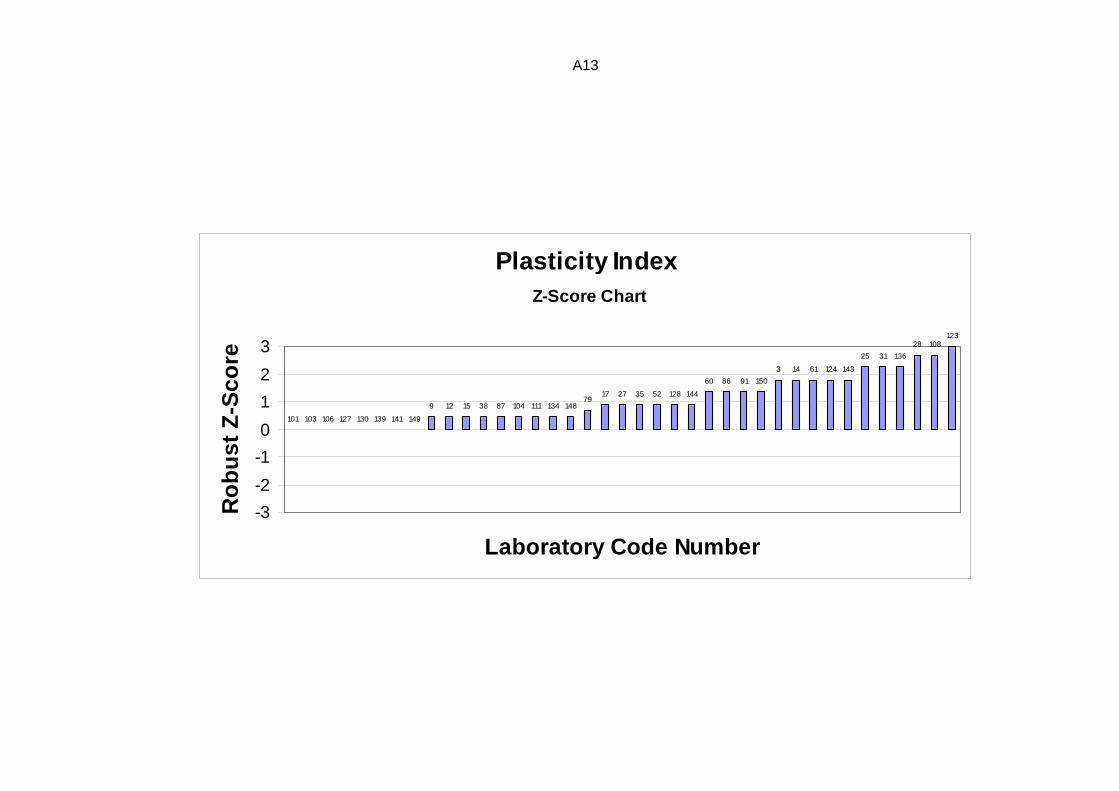
A13
Plasticity Index Z-Score Chart
101 103 106 127 130 139 141 149
9 12 15 38 87 104 111 134 14879
17 27 35 52 128 144
60 86 91 150
3 14 61 124 143
25 31 136
28 108123
-3
-2
-1
0
1
2
3
Laboratory Code Number
Rob
ust Z
-Sco
re

A14
Lab Code Results Method
2 12.5 0.45 AS12893 12.0 0.00 AS12894 12.0 0.006 11.5 -0.45 AS12898 14.5 2.25 AS12899 11 -0.90 AS1289
10 9.0 -2.70 AS128911 11.5 -0.45 AS128912 11.5 -0.45 AS128914 12 0.0015 10.5 -1.35 AS128916 9.0 -2.70 AS128917 13.0 0.90 AS128919 13.5 1.35 AS128924 12.5 0.45 AS128925 13.5 1.35 AS128927 13.5 1.35 AS128928 9.5 -2.25 AS128929 12.0 0.0031 12.5 0.4532 11 -0.90 AS128935 12.5 0.4538 10.0 -1.80 AS128942 12 0.00 AS128943 10.5 -1.35 AS128947 8.5 -3.15 § AS128951 11.0 -0.90 AS128953 11 -0.90 AS128955 12.0 0.00 AS128956 13.0 0.90 AS128958 11.5 -0.45 AS128960 12.0 0.00 AS128961 11.0 -0.90 AS128964 11.0 -0.90 AS128965 15.0 2.70 AS128966 13.5 1.35 AS128973 9.5 -2.25 AS128975 11.0 -0.90 AS128976 13 0.9079 12.5 0.45 AS128980 8.5 -3.15 § AS128981 12.0 0.00 AS128983 13.0 0.90 AS128984 13.5 1.35 AS128986 12.5 0.4587 12 0.00 AS1289
Robust Z-Score
Linear Shrinkage

A15
Lab Code Results Method
91 12.0 0.00 AS128993 11.0 -0.90 AS128994 12.5 0.45 AS128995 11 -0.90 AS128996 11.0 -0.90 AS1289101 12.0 0.00 AS1289102 9.0 -2.70 AS1289103 12.0 0.00 AS1289104 12.5 0.45 AS1289106 13 0.90 AS1289108 12.5 0.45 AS1289109 14 1.80111 11.0 -0.90 AS1289114 7.5 -4.05 §115 12.5 0.45 AS1289119 11.0 -0.90 AS1289122 11.0 -0.90 AS1289123 9.5 -2.25 AS1289124 12 0.00 AS1289127 11.0 -0.90 AS1289128 11.5 -0.45 AS1289129 13.5 1.35 AS1289130 13.0 0.90 AS1289133 14 1.80 AS1289134 12.6 0.54 AS1289136 13.5 1.35 AS1289139 14.0 1.80 AS1289140 12.0 0.00 P3A/1143 12.5 0.45 AS1289144 12.5 0.45 AS1289148 8.5 -3.15 § AS1289149 11.5 -0.45150 10.5 -1.35 AS1289
Robust Z-Score
Linear Shrinkage
No. of Results 79Median 12Norm IQR 1.11CV 9.3%Min 8Max 15Range 8
A16
Linear Shrinkage Z-Score Chart
114 47 80 14810 16 102
28 73 123
38
15 43 150
9 32 51 53 61 64 75 93 95 96 111 119 122 127
6 11 12 58 128 149
3 4 14 29 42 55 60 81
-3
-2
-1
0
1
2
3
Laboratory Code Number
Rob
ust Z
-Sco
re

A17
Linear Shrinkage Z-Score Chart
87 91 101 103 124 140
2 24 31 35 79 86 94 104 108 115 143 144 13417 56 76 83 106 130
19 25 27 66 84 129 136
109 133 139
8
65
-3
-2
-1
0
1
2
3
Laboratory Code Number
Rob
ust Z
-Sco
re

APPENDIX B
Sample Homogeneity
B1
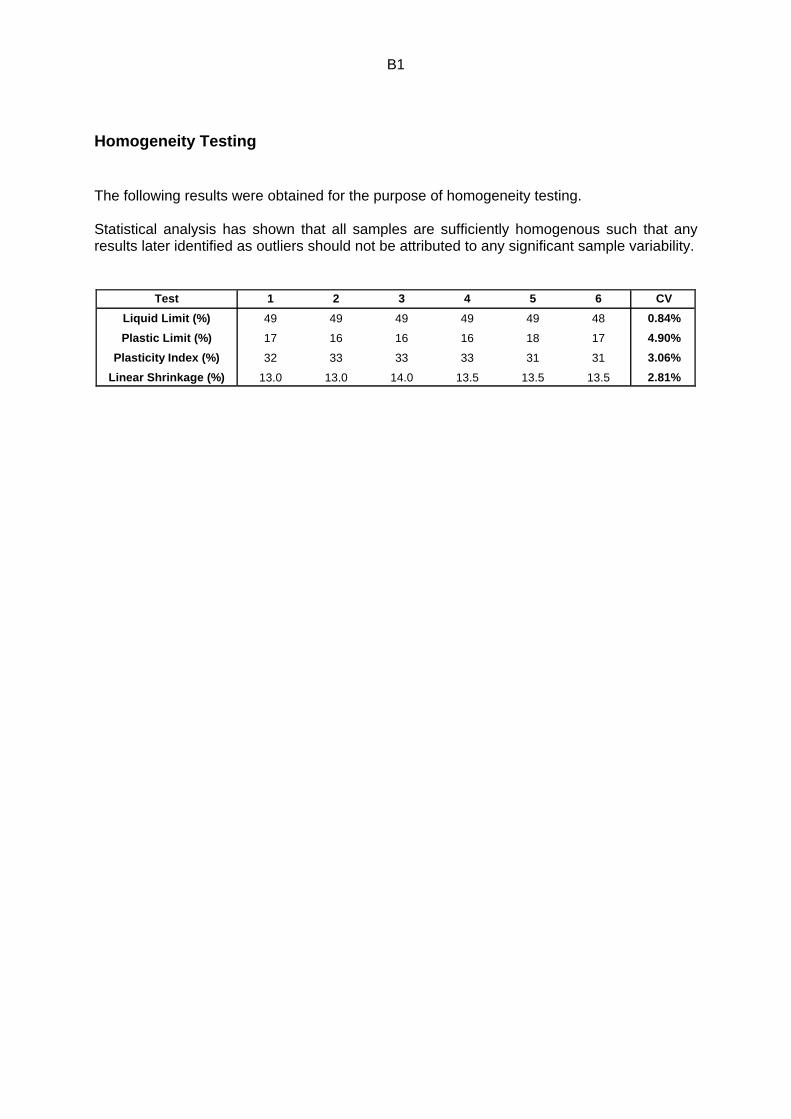
Homogeneity Testing The following results were obtained for the purpose of homogeneity testing. Statistical analysis has shown that all samples are sufficiently homogenous such that any results later identified as outliers should not be attributed to any significant sample variability.
Test 1 2 3 4 5 6 CV
Liquid Limit (%) 49 49 49 49 49 48 0.84%
Plastic Limit (%) 17 16 16 16 18 17 4.90%
Plasticity Index (%) 32 33 33 33 31 31 3.06%
Linear Shrinkage (%) 13.0 13.0 14.0 13.5 13.5 13.5 2.81%

APPENDIX C
Documentation
Instructions to Participants ……………………………………………………………… C1
Results Sheet ……………………………………………………………………………. C2
C1
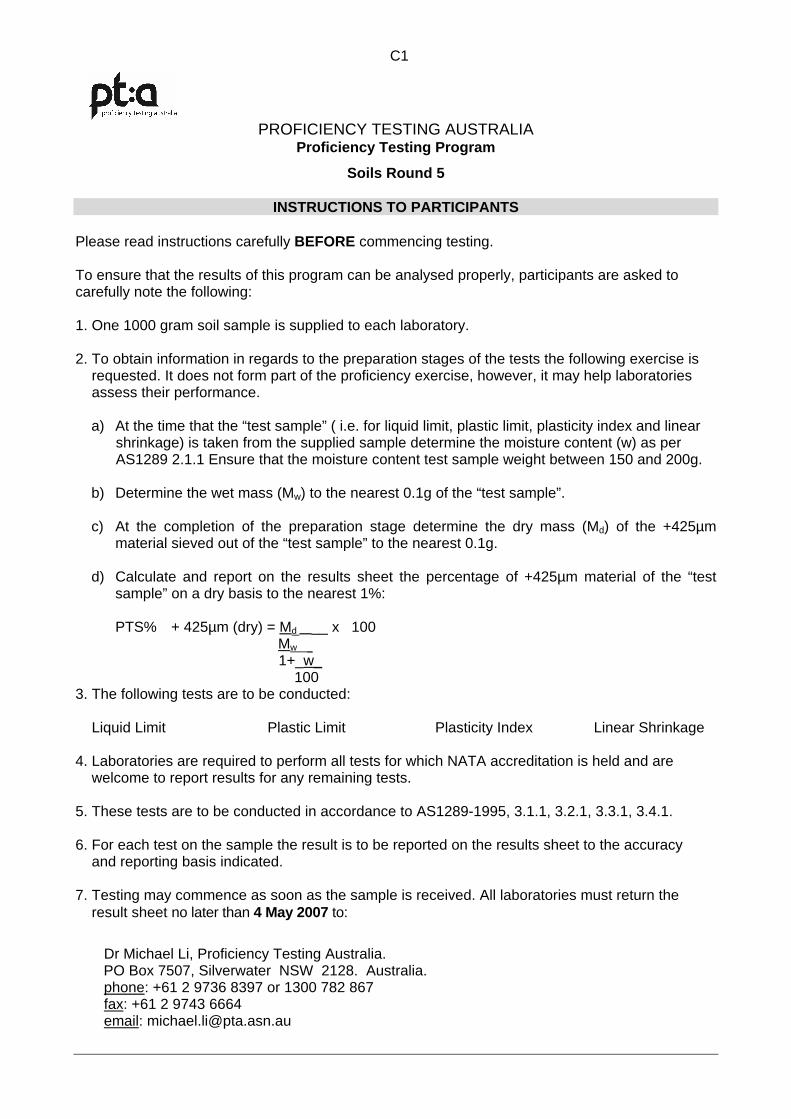
PROFICIENCY TESTING AUSTRALIA Proficiency Testing Program
Soils Round 5
INSTRUCTIONS TO PARTICIPANTS
Please read instructions carefully BEFORE commencing testing. To ensure that the results of this program can be analysed properly, participants are asked to carefully note the following: 1. One 1000 gram soil sample is supplied to each laboratory. 2. To obtain information in regards to the preparation stages of the tests the following exercise is requested. It does not form part of the proficiency exercise, however, it may help laboratories assess their performance.
a) At the time that the “test sample” ( i.e. for liquid limit, plastic limit, plasticity index and linear shrinkage) is taken from the supplied sample determine the moisture content (w) as per AS1289 2.1.1 Ensure that the moisture content test sample weight between 150 and 200g. b) Determine the wet mass (Mw) to the nearest 0.1g of the “test sample”. c) At the completion of the preparation stage determine the dry mass (Md) of the +425µm
material sieved out of the “test sample” to the nearest 0.1g.
d) Calculate and report on the results sheet the percentage of +425µm material of the “test sample” on a dry basis to the nearest 1%:
PTS% + 425µm (dry) = Md __ x 100 Mw _
1+_w_ 100
3. The following tests are to be conducted: Liquid Limit Plastic Limit Plasticity Index Linear Shrinkage 4. Laboratories are required to perform all tests for which NATA accreditation is held and are welcome to report results for any remaining tests. 5. These tests are to be conducted in accordance to AS1289-1995, 3.1.1, 3.2.1, 3.3.1, 3.4.1. 6. For each test on the sample the result is to be reported on the results sheet to the accuracy and reporting basis indicated. 7. Testing may commence as soon as the sample is received. All laboratories must return the result sheet no later than 4 May 2007 to:
Dr Michael Li, Proficiency Testing Australia. PO Box 7507, Silverwater NSW 2128. Australia.
phone: +61 2 9736 8397 or 1300 782 867 fax: +61 2 9743 6664 email: [email protected]

C2
PROFICIENCY TESTING AUSTRALIA Soils - Proficiency Testing Program
Results Sheet
Lab Code:
Test (report to) Result Method
+425µm sieve(dry mass -%) PTA Instructions No.2
Liquid Limit (%)
Plastic Limit (%)
Plasticity Index (%)
Linear Shrinkage (0.5%)
Signed: Date:
Name of Signatory: Return no later than Friday 4 May 2007 , to:
Dr Michael Li, Proficiency Testing Australia. PO Box 7507, Silverwater NSW 2128. Australia. phone: +61 2 9736 8397 or 1300 782 867, fax: +61 2 9743 6664, email: [email protected]