report no. 4148-ke kenya economic development and...
TRANSCRIPT

Report No. 4148-KE PKenyaEconomic Developmentand Urbanization Policy(In Two Volumes) Volume lI: Main Report
December 13, 1985Eastern and Southern Africa Projects DepartmentWater Supply and Urban Development Division
FOR OFFICIAL USE ONLY
Document of the World Bank
This report has a restricted distribution and may be used by recipientsonly in the performance of their official duties. Its contents may not otherwisebe disclosed without World Bank authorization.
Pub
lic D
iscl
osur
e A
utho
rized
Pub
lic D
iscl
osur
e A
utho
rized
Pub
lic D
iscl
osur
e A
utho
rized
Pub
lic D
iscl
osur
e A
utho
rized

CURRENCY EQUIVALENTS
Currency Unit = Kenya Shilling (KSh) 1/KSh 1.00 = US$ 0.07 2/
US$ 1.00 = KSh 13.9
ABBREVIATIONS AND ACRONYMS
CBS Central Bureau of StatisticsCDC Commonwealth Development CorporationCOL Commissioner of Lands
DDC District Development CommitteeEABS East African Building SocietyGPT Graduated Personal TaxGRF General Rate Fund
HABITAT United Nations Center for Human SettlementsHDD Housing Development DepartmentHFCK Housing Finance Corporation of Kenya
HRDU Housing Research and Development UnitILO International Labor OfficeiCC Joint Consultative CommitteeKIE Kenya Industrial EstatesLGLA Local Government Loans AuthorityMFP Ministry of Finance and PlanningMLG Ministry of Local GovernmentMLS Ministry of Lands and SettlementMTC Ministry of Transport and CommunicationsMWD Ministry of Water DevelopmentMWHPP Ministry of Works, Housing and Physical PlanningNCC Nairobi City Council
NCCo National Construction CorporationNHC National Housing CorporationNSSF National Social Security FundPPD Physical Planning DepartmentRIDC Rural Industrial Development CenterSLK Savings and Loan Kenya Ltd.UNDP United Nations Development ProgramUSAID United States Agency for International Development
FISCAL YEAR
Central Government and Local Authorities - July 1 to June 30
1/ The official unit of currency in Kenya is the Kenya shilling (KSh).However, in accordance with the practice of the Kenya Government,
revenues and expenditures of the central Government and the local
authorities are expressed in Kenya pounds (KE) at the rate of K£ =20 KSh.
2/ The dollar-shilling conversion factor given here is based on theapproximate exchange rate in effect in mid-1984.

FOR OFFICIAL USE ONLY
KENYA
ECONOMIC DEVELOPMENT AND URBANIZATION POLICY
Table of Contents
Page
O. INTRODUCTION ............................... o................... 1
I. ECONOMIC DEVELOPMENT AND THE URBAN SECTOR .................... 2
A. Population and Urbanization. . 3B. Spatial Distribution of Production and Employment .6C. Income Distribution in Urban Areas...... 8D. Urban Development and Kenya's Macroeconomic Strategy .... 10E. Summary .1.... ....... . 12
II. THE URBAN POLICY FRAMEWORK .................................. . 12
A. Urban Spatial Policy .............................. 13B. Urban Employment Policy ................................ 16C. Urban Investment Policy .............................. 18
D. Summary and Conclusion .............................. 25
III. URBAN DEVELOPMENT: THE INSTITUTIONAL FRAMEWORK ... 26
A. Existing Institutional Arrangements .... 28B. The Investment Planning Process . . . 32C. Agency Tasks . .. 37D. Implementation ... . .. . ... 40
IV. LOCAL AUTHORITY SERVICES AND FINANCING ... 41
A. Overview of Local Authority Revenues and Expenditures ... 43B. Recurrent Financing of Local Authorities . .... 48C. Capital Financing of Local Authorities ... 56
V. HOUSING POLICY: INSTITUTIONS AND FINANCE .. . 59
A. Performance of the Housing Sector . .. 59B. Urban Land Policy ... ... 66C. Housing Finance and the Role of Public Sector Agencies .. 72D. Conclusions . ...... 76
VI. SUMMARY OF RECOMMENDATIONS .... 78
The principal author of this report is Richard B. Westin. The initialresearch for the report was gathered by a mission consisting ofR. B. Westin, B. A. Gouveia, F. Johnson, K. C. Sivaramakrishnan, P. Gidman,N. Jorgensen, and S. S. Yahya; this information was updated in the courseof several subsequent missions in Kenya.
This document has a restricted distribution and may be used by recipients only in the performance oftheir official duties. Its contents may not otherwise be disclosed without World Bank authorization.

STATISTICAL ANNEX
Tables: Page
1.1: Population of Kenya, 1962-79 ................................... 84
1.2: Urban Centers with Population Exceeding 20,000 (1979) ..... ..... 851.3: Distribution of Towns and Their Population
by Size, 1969-79 ......................................... 861.4: Urban Growth Projections to Year 2000 .......................... 871.5: Estimated Rural-Urban Income Distribution, 1976 ................ 881.6: Wage Employment and Earnings in 22 Towns, 1982 ................. 891.7: Percentage Distribution of Wage Employment by
Town and Industry, 1982 .. ....... . .. . ........... .... .............. . . . . . . . 901.8: Growth Rates in Wage Employment and Population
by Major Towns ..................... **..**..***.**...**..t*..** 911.9: Nairobi: Household Income Distribution, 1974 ................... 92
2.1: Urban Investments in Central Government Accounts, 1980/81 ...... 932.2: Sewerage Coverage in Major Towns in Kenya, 1979 ................ 944.1: Expenditure of Locel Authorities, 1972-1983 .................... 954.2: Municipal Councils: Recurrent and Capital
Expenditure on Main Services, 1975-83 .. ........................ 964.3: Municipal Councils: Economic Analysis of
Expenditure, 1975-83 ......... . .. . . . .. . . . .. ................... .......... . 974.4: Town and County Councils: Economic Analysis of
Expenditure, 1975-83 ................ *...**. 984.5: Municipal Councils: Economic Analysis of Revenue, 1972-83 ...... 994.6: Town and County Councils: Economic Analysis
of Revenue, 1975-83 ............... ...... 100
4.7: Recurrent Revenues and Expenditures of Larger Municipalities ... 101
4.8: Summary of Fund Balances, 1981 ...... ........................... 1024.9: Source of Financing for Recurrent Expenditures ................. 1035.1: Percentage Distribution of Urban Dwelling
Units by Sector, 1979 ................ ........................................ 1045.2: Percentage Distribution of Private Housing
by Type and Tenancy Status, 1979 ............................... 1055.3: Value of Residential Building Plans Approved
by Nairobi City Council, 1974-82 ............................... 1065.4: Rent Index for Nairobi, 1974-82, by Income Groups .............. 1075.5: Sources of New Residential Plots ............................... 1085.6: Annual Urban Land Requirements, 1981-85 ........................ 1095.7: Local Authority Housing Stock, 1969-80 ......................... 1105.8: Housing Units Completed by the National Housing
Corporation, 1976-83 ................................ ......... 49* .... .....o..... 111i
CHARTS
3.1: A Process for Developing a Program for Urban Services .......... 333.2: A Process for Developing Housing Programs ...................... 355.1: Alternative Land Development Models ..... ....................... 68
MAP
Kenya: Urban Areas 1979 - IBRD No. 15860

PREFACE
The original material for this report was gathered by a WorldBank mission which visited Kenya in April 1981. This material was updatedin the course of several subsequent missions which visited Kenya for otherpurposes, and a draft of the report was discussed with the Government inNovember 1983. The report was subsequently revised and updated toincorporate changes in the institutional framework for urban development(Chapter III) and the structure of local authority revenues (Chapter IV),and reflects the state of knowledge as of the end of 1984.


0. INTRODUCTION
0.01 Discussion of urbanization policy in Kenya requires more thansimply counting the number of people one can expect over the next ten yearsand trying to identify the resources to provide a basic level of urbanservices. Kenya is rapidly changing from one of the less urbanizedcountries of the world to a country where the urban population and theurban economy play an important role in the development of the country. Inthe process, Kenya is developing a decentralized urban structure which canno longer be characterized as a single dominant capital in the midst of amainly agricultural economy. Urbanization in Kenya, because it isbeginning from a small base, is undergoing changes that are increasingrapidly in complexity. The need to provide suitable mechanisms to guidethis multi-polar multiple-actor urban economy presents the Government withat least as many challenges as finding the resources to program for itsgrowth.
0.02 This report draws as its theme the growing complexity ofurbanization in Kenya and the need to develop an institutional andfinancial base that can channel this growth in productive ways. Kenya'spolicies toward urbanization have been articulately stated in a number ofdocuments and are basically sound and compatible with Kenya's level ofeconomic development. Moreover, as discussed in more detail in thisreport, these policies have generally been applied in a consistent fashionin the Government's choice of urban investments. In choosing as the focusfor this report the supply mechanisms for urban growth, it is in fullrecognition of the Government's accomplishments in defining the directionsfor urban growth and initiating the steps to move growth in this fashion.
0.03 Chapter I of this report begins with an overview of the economicand demographic basis for urbanization in Kenya and the probable impact onurbanization patterns of current changes in Kenya's macroeconomicpolicies. Chapter II moves to urban development policies and reviews therecord of what Kenya has sought to bring about in this field in the pastten years. On this basis, the next three chapters provide the substantivediscussion of the institutional and financial framework for urbanization inKenya, with Chapter III focusing on central-local government relationshipsand investment programming, Chapter IV covering local authority servicesand financing, and Chapter V discussing housing institutions and finance.Readers of this report will notice that relatively less attention has beenpaid to defining specific investment priorities and quantifying themagnitude of the resources required to provide them. These topics havebeen covered in depth in at least two major reports, and it was not felt tobe necessary to repeat the recommendations of these studies except wherethey differ from more recently available data.1 / Instead, this report hasbuilt on previous studies to consider the implementing mechanisms that willbe required if Kenya is to sustain and expand its accomplishments in theurban field as growth continues.
1/ See "Human Settlements in Kenya," Physical Planning Department,Ministry of Lands and Settlement, 1978; and "National Urban DevelopmentStrategy for Kenya: Rural-Urban Balance," by H. W. Richardson, A.Khanna, and 0. A. Sampaio, World Bank Consultant's Report, 1978.

-2-
I. ECONOMIC DEVELOPMENT AND THE URBAN SECTOR
1.01 In the first half of the 1980s, Kenya is facing seriousconstraints on its economic development. In the immediate period, theGovernment faces substantial budget deficits and a shortage of foreignexchange. In the medium-term, there is a need for structural adjustmentsin Kenya's economy to improve economic growth and restore balance ofpayments equilibrium. In the longer-term, Kenya's population growth rate,currently in excess of 4% per annum, constitutes the country's most seriousobstacle to long-term improvements in living standards for itspopulation.2 / The adjustment to these problems requires decisions sodifficult and far-reaching as to dominate Kenya's economic developmentstrategy for at least the next decade. Indeed, the touchstone for mostsectors will be whether their development plans are consistent with effortsto solve these basic macroeconomic constraints.
1.02 Kenya's strategy to alleviate its economic constraints hasseveral aspects. The first priority is revitalization of the agriculturalsector, which is and will continue to be the main source of support for themajority of Kenya's population. This will require direct action in areassuch as land policy, agricultural marketing, and investments to improveproductivity, as well as more fundamental adjustments in pricing to improvethe terms of trade in favor of agriculture. The second sector in need ofreform is the industrial sector, which has developed behind high tariffbarriers and other restrictions. For Kenya to expand its industrial base,it will have to move from a reliance on protected import-substitutionindustries toward export-oriented industries tied more closely to itsagricultural resource base. Kenya's energy sector also requiresrationalization, primarily through more comprehensive planning and carefuleconomic scrutiny of proposed investments. Finally, Kenya's populationpolicy must face the fact that present fertility rates, even ifsubstantially curtailed over the next twenty years, will yield a doublingof Kenya's population by the turn of the century.3 /
1.03 It is within the context of these efforts that the present andfuture role of the urban sector in Kenya must be evaluated. Urban areascannot demand a larger share of development resources solely on the basisof their poor population. Many of the urban poor, even if living insubstandard and unhealthy conditions, are relatively better off than theircounterparts in rural areas. Nor can urban areas demand more resources asprestige symbols of modern sector development. Economic restraint demandsthat investments in urban areas should show concrete benefits in terms oftheir contribution to the nation's development, and that urban areas should
2/ For a detailed discussion of Kenya's economic prospects, see "Growthand Structural Change in Kenya: A Basic Economic Report," World Bank,August 31, 1982.
3/ "Kenya: Population and Development," World Bank Country Study, July1980.

-3-
tap their own resources to the greatest extent possible to pay for theirneeds. On the other hand, most economic activities in Kenya either takeplace in urban areas or rely on services and materials provided throughurban areas. Moreover, even optimistic estimates of the population holdingcapacity of Kenya's agricultural sector indicate that urban areas will haveto absorb a large share of the expected increase in the population. Theresponsibility for coping with these demands will devolve on an urbaninstitutional and financial base which is currently ill-prepared to receiveit.
1.04 For the fact is that Kenya is on the threshold of a substantialincrease in urbanization. Kenya's urban growth rate is already one of thehighest in the world, and population pressure on scarce agricultural landcan be expected to keep rural-urban migration strong. At a minimum,Kenya's urban population and labor force can be expected to triple by theyear 2000, and the share of the urban population will rise from more than15% at present to between one-quarter and one-third of the totalpopulation. Kenya does not have the option of neglecting urbanization orhoping it will take care of itself. On the other hand, East Africa ingeneral and Kenya in particular is one of the last regions of the world toenter the urban revolution. The mistakes of planning and problems ofneglect which produced the chaos of Lagos and Kinshasa elsewhere in thecontinent have not yet occurred in the cities of Kenya. With foresight andrealistic policies, urbanization in Kenya can be a positive force foreconomic development, if productive employment can be found for new urbanresidents and basic services provided for their needs. While problems ofshort-term economic management have tended to draw attention away fromlonger-term problems such as urbanization, urban development remains as oneof the major issues which Kenya must face.
1.05 In this chapter, the economic and demographic pattern of urbandevelopment in Kenya is reviewed and put into the context of the currentmacroeconomic strategy. The first three sections provide the statisticalbackground on urbanization in Kenya, focusing on trends in population,employment, and incomes. Section D considers the implications of Kenya'smacroeconomic strategy for urban development, and section E pulls togethera qualitative assessment of the economic outlook for urban areas over thenext two decades.
A. Population and Urbanization
1.06 Urbanization in Kenya has a long history among the Swahiliculture of the coast. Centers such as Mombasa and Malindi played prominentroles in Indian Ocean medieval trading patterns and provided the primarypoints of contact for Europeans until late in the 19th century. Theinterior of Kenya, however, did not develop urban centers prior tocolonization, and settlement patterns consisted of pastoral tribes andseparated farms with small centers established as trading points. Becauseof this, Kenya is one of the less-urbanized countries of the world,although not atypically so for East Africa. The urban pattern which existstoday predominantly reflects the development of British colonization andtrade, rather than traditional African population and agriculturalpatterns. Nairobi, for example, is located in an environmental transition

-4-
zone which was not densely populated prior to colonization, while westernKenya, the most densely populated area of the country, did not develop anymajor urban center during the colonial period.
1.07 Table 1.1 presents information on the growth of Kenya'spopulation since shortly before independence. The overall rate ofpopulation growth in Kenya has been increasing since 1962. This has beenmatched by an even faster acceleration of urban growth, reaching 7.9% overthe decade 1969-79. This has caused the urban population of Kenya to morethan double in ten years, and the share of the urban population to increasefrom 9% at independence to 15% in 1979.
1.08 Several factors must be accounted for in obtaining a reliableestimate of urban growth. One factor is an increase in the number of smalltowns with a population large enough to be classified as urban. Between1969 and 1979, the number of urban centers expanded from 47 to 90 on thisbasis. If the growth rate is computed solely on the basis of towns whichwere urban centers in both 1969 and 1979, the urban growth rate is 6.9%,which is close to the value of 7% used in most projections by theGovernment of Kenya.4 / Another factor has been an expansion of municipalboundaries to include existing rural settlement areas. It is common forsquatter settlements to develop on the fringes of municipal boundaries,often by the informal subdivision of agricultural land. Because of demandsfrom these inhabitants to be brought within municipal boundaries andprovided with services, most towns in Kenya had large expansions in theirboundaries during the 1970s, with corresponding inflation of their apparentgrowth rates.
1.09 Table 1.2 presents data on the population and area of urbancenters with more than 20,000 inhabitants in 1979. Several of these towns,notably Kisumu, Machakos, and Meru, had exceptionally large expansions intheir boundaries during the 1970s, with corresponding inflation of theirapparent growth rates. In order to provide a more accurate picture ofurban growth, Columns VI-VIII of Table 1.2 provide information on relativegrowth rates where it has been possible to adjust for changes in municipalboundaries. From these data, we see that between 1962 and 1969, Nairobiand Mombasa experienced the fastest urban growth rates (with the exceptionof Malindi), while the other towns grew at rates at most slightly above theoverall population growth rate. In part, this reflected the greater easeof movement of the African population after independence, which initiallyfocused migration into the larger towns. It also reflected the newGovernment's employment policies which expanded African representation ingovernment and industry and encouraged the growth of import-substitutionindustries in Nairobi. On the other hand, the secondary towns, many ofwhich were linked to colonial agriculture, did not experience much of apopulation increase in the 1962-69 period. In fact, outmigration ofsettlers was enough to cause a decline in the population of Eldoret.
4/ Of the 47 urban centers listed in 1969, five do not appear on theprovisional list of urban centers for 1979, even after accounting forknown name changes. The indicated growth rate of 6.9% is based on 42towns which are common to both lists.

-5-
1.10 During the 1970s, these urban growth patterns were reversed.While the growth rates of Nairobi and Mombasa fell, the growth rates of thesecondary towns increased to very high levels.5 / In Table 1.2, theaverage growth rate of the urban population in the secondary towns(excluding Nairobi and Mombasa and the towns for which growth rates couldnot be computed) was 7.4%, a rate which will double their population in tenyears if it is sustained. This expansion of secondary towns is brought outclearly in Table 1.3, which presents the size distribution of urban centersin 1969 and 1979. We see that the proportion of the population living intowns exceeding 100,000 in population, even with the addition of Kisumu tothis category, fell from 70% to 57% over the intercensal period. This wasoff-set by a large expansion in the population share of the second categoryof towns (20,000 to 100,000 population) from 7% to 25%.
1.11 The 1979 census figures show that urban growth in Kenya is nothighly polarized towards Nairobi and Mombasa. Nairobi's growth rate of 5%during the 1969-79 period, while relatively high by internationalstandards, has been moderate in comparison to the growth of the secondarytowns. This result is in striking contrast to experience elsewhere inAfrica, where urban growth has often been concentrated heavily on thecapital city. The 1979 census data do not provide enough information toestablish why this pattern has occurred. However, what appears to havebeen important in influencing urban growth in Kenya during the period1969-79 is the strong rural-urban linkages of the economy, which havefocused migration more into the secondary towns. It is also likely thatthe relatively neutral policies which Kenya has followed toward therural-urban income distribution, which are discussed in more detail in thenext section, have been important in preventing a shift in migration towardthe largest cities.
1.12 Demographic studies do not foresee any significant slowing ofKenya's overall rate of population growth in the near future.6 / Hence,the outlook for urban areas will depend critically on the abiTity of theagricultural sector to absorb a large increase in population, which willrequire major investments to expand arable land and difficult political
5/ The population figure for Nairobi in the provisional 1979 census issignificantly below most estimates prepared prior to the census. Tosome extent, this reflects the dispersal of Nairobi's growth intoperi-urban centers such as Ngong, Kikuyu, and Thika. Other possiblesources of error in the census figures (such as undercounting insquatter areas) could not be investigated with the data on hand.
6/ "Kenya: Population and Development," op. cit., pp. 37-40.

-6-
decisions concerning land redistribution.7/ Even if these policies aresuccessful, urban areas can expect to absorb significant population growthover the next two decades. Table 1.4 compares two sets of urban growthprojections, one based on the 1969 census and the other on the 1979census. Drawing on the 1969 census projections, the Government's PhysicalPlanning Department has predicted that Kenya's urban population in the year2000 will be in the approximate range of 8.6 million, representing 28% of atotal population of 31 million, with an average urban growth rate of 6.5%p.a.8/ As shown in Table 1.4, this projection of the overall urbanpopulation is supported by the 1979 census, but the expected spatialcomposition of the urban population is quite different when the 1979 dataare used. For example, based on the 1964-69 intercensal growth rate,Nairobi was expected to grow to a population in the range of 3.5 million bythe year 2000, representing 41% of the urban population. The 1969-79intercensal growth rate indicates a more reasonable estimate for Nairobi inthe range of 2.3 million, with an urban population share of 27%. This doesnot negate the seriousness of the problem of handling urban growth inNairobi, as even the lower estimate predicts that Nairobi's population willtriple in the next two decades. The revised estimates do indicate,however, that it is necessary to focus additional attention on the growthpatterns of secondary towns.
B. Spatial Distribution of Production and Employment
1.13 Urban areas in Kenya contribute to gross domestic product in anamount which is disproportionate to their population. This by itself isnot surprising, as except for agriculture, mining, and certain otheractivities which are bound to the land, many producers prefer to be closeto their markets and to sources of inputs such as labor and finance.Still, it is interesting to compare the relative productivity of rural andurban areas in order to assess the role of urban areas in an economicstrategy to raise output.
1.14 Direct comparisons of productivity based on the location ofeconomic activities are difficult to make. Instead, the approach used hereis to examine the distribution of income between urban and rural areas.While this approach raises its own methodological problems (such as thetreatment of urban-rural remittances), it probably gives a more accuraterepresentation of relative urban-rural productivity and is less likely toshow a "pro-urban" bias. Comparisons of the distribution of income betweenurban and rural areas for 1976 are shown in Table 1.5. From these data, wesee that urban areas contributed a share of national product almost threetimes greater than their share of population. The main reason for thisdifference is the high average earnings in the urban modern private sector
7/ "Growth and Structural Change in Kenya: A Basic Economic Report,"op. cit., pp. 50-59.
8/ "Human Settlements in Kenya," Physical Planning Department, Ministry ofLands and Settlement, 1978.

-7-
as compared to the low average earnings in the agricultural sector fromwhich the majority of Kenyans earn their living.
1.15 Productive activities are not distributed evenly across the urbanareas in Kenya. Table 1.6 presents information on the distribution ofurban wage employment and earnings in 22 towns covered by employmentsurveys of the Central Bureau of Statistics.9/ The most striking featureof this table is the dominance of Nairobi in modern sector activities.Nairobi accounted for 56% of urban wage employment and 66% of wage earningsin 1982, against a population share of 42% for the urban areas covered bythe survey. Indeed, only six urban areas had wage employment of over10,000 persons in 1982 (Nairobi, Mombasa, Nakuru, Kisumu, Thika, andEldoret), and these six towns accounted for 87% of total urban wageemployment and 91% of wage earnings.
1.16 The industrial break-down of wage employment in 1982 for the same22 towns is presented in Table 1.7. From this, we see that almost allindustries with the exception of transport and communications haverelatively high concentrations in Nairobi, with construction andbusiness-related services such as finance and insurance being particularlyconcentrated there. Mombasa has a concentration in the transport andcommunications industry, as would be expected by its role as a major port.Manufacturing shows the least relative concentration in Nairobi and Mombasaand the highest share of employment in the major secondary towns of Nakuru,Kisumu, Thika, and Eldoret. This pattern may reflect the success ofGovernment initiatives to decentralize manufacturing out of Nairobi andMombasa, or it may reflect various locational advantages for resource-basedindustries.
1.17 Table 1.8 presents growth rates for wage employment during theperiod 1970-82 for the six towns with the largest employment shares. OnlyMombasa and Thika (which serves as a satellite manufacturing town toNairobi) had growth in wage employment greater than their growth inpopulation. (Eldoret achieved this target in the latter part of theperiod.) Nairobi's growth rate in wage employment was slightly below itspopulation growth rate, in contrast to the usual assumption thatemployment growth is concentrated in Nairobi. Therefore, despite theimpressive performance of the Kenyan economy in achieving an overall growthrate for urban wage employment of 5.1%, a declining percentage of the urbanpopulation was able to find employment in the modern sector.
1.18 The concentration of modern sector activities in a relatively fewtowns is not unexpected. The wage employment patterns discussed above
9/ In the comparisons of population and employment which follow, Machakosand to a lesser extent Meru are continually shown to be outliers interms of their ratio of urban employment to population. As shown inTable 1.2, both of these towns were quite small in 1969 and grewprimarily as a result of expansion of their boundaries to include largerural areas. Hence, the employment pattern for these towns is morerural than urban.

-8-
presumably reflect agglomeration economies in terms of access toinfrastructure, labor markets, product markets, business services, andcommunications, which are readily available in only a limited number oftowns. Indeed, Table 1.7 indicates that the smallest 16 towns in thesurvey attracted a significant share of wage employment only in services(including government), trade, and resource-based industries, all of whichare less affected by the agglomeration economies of larger towns.
1.19 The magnitude of the urban employment problem in Kenya during thenext twenty years is sobering. The World Bank has estimated the size ofKenya's labor force in the year 2000 to be in the range of 9.8-12.0million, with a middle-range forecast of 10.6 million workers out of atotal population of 31 million.10/ The urban share of this labor force isexpected to be on the order of 3.0 million, as compared to a 1980 urbanlabor force of 0.9 million.11/ Therefore, the number of new workers inurban areas will more than triple in the next twenty years. This rate ofgrowth exceeds even the most optimistic estimates of the labor-absorptionpotential of Kenya's industry. The only alternative to provide for thisincrease is small-scale industry and the informal sector.
C. Income Distribution in Urban Areas
1.20 There are no satisfactory statistics on the distribution ofincome in urban areas. Relatively good information exists only forNairobi, which is not representative of other towns due to theconcentration of wage employment there. For urban areas outside Nairobi,data are available only on the distribution of earnings from wageemployment, which is of diminishing importance in all but the largesttowns. For lack of more comprehensive information, Table 1.9 presents theNairobi household income distribution derived from the 1974 HouseholdBudget Survey, which is the best available source of data on income andexpenditures.
1.21 The absence of good income data for urban areas has spawned awide variety of estimates on the extent of urban poverty. Estimates rangefrom 52% of the urban population using a "basic needs" definition of
poverty,l2/ to a value of 3% based on a rural index of nutrition. 13/Clearly such a range of estimates is too wide to play any useful role inpublic policy debate. Nevertheless, it is important to have some idea of
10/ "Kenya: Population and Development," op. cit., Table 3.3, p. 68.
I/ Based on the population aged 15-64 and available for labor.
12/ "Planning for Basic Needs in Kenya," International Labor Office,1978, p. 25.
13/ "Growth and Structural Change in Kenya," op. cit., p. 42.

-9--
the extent and nature of urban poverty, and on this issue the data compiledover the past ten years give a fairly consistent picture.
1.22 The usual definition of poverty is based on a threshold householdincome adequate to purchase the food needed for a minimum level ofnutrition. In applying this definition to urban areas, allowance has to bemade for the fact that the economy of urban areas is intrinsically moremonetarized than in rural areas. For example, the extent of urbansquatting in the sense of not paying rent is very limited; even the verypoorest generally have to make payment in some form for their living spacein urban areas. Depending on how much is allowed for these factors,estimates of "absolute poverty" range from the 3% cited above to 15% usingthe estimates of the ILO. Given the inadequacies of the data upon whichthese estimates are based, it is desirable to look at more directmeasurements of urban malnutrition. Some indication is provided by asurvey in squatter areas in Nairobi in 1972 which found that 28% ofchildren under the age of three suffered from some degree ofprotein-calorie malnutrition.14/ A more recent survey in Thika whichsampled households on a random basis rather than in squatter areas foundthat 18% of children under the age of five were mildly malnourished, withless than 1% being severely malnourished.15/ While these figures arelower than for rural areas (the corresponding figures for rural areasaround Thika were 25% mildly malnourished and 4% severely malnourished),they do indicate that urban malnutrition is an important problem in Kenya.Based on these data, one would conclude that a significant number of urbanhouseholds, at least in the range of 10-15% of the urban population, livein a state of absolute poverty.
1.23 By far the largest number of the absolute poor in Kenya live inrural areas. This is to be expected; given the rural nature of Kenya'seconomy, the cities have not yet become the last refuge of the desolute andhomeless. Instead, Kenya's cities are viewed as centers of opportunity,places to which impoverished rural families can send a household member tosupplement their income through remittances. It is estimated that 21% ofthe urban wage bill is remitted back to rural areas, providing a major
source of financing for smallholder innovation.16/ Clearly the economicattraction of urban areas will be a major factor in keeping rural-urbanmigration high for the foreseeable future.
14/ Blankhart, D.M., "Human Nutrition," in Health and Disease in Kenya,ed. by Vogel et. al., East African Literature Bureau, 1974, pp.409-428.
15/ Figures cited in "Kenya: Population and Development," p. 53.
16/ "Growth and Structural Change in Kenya," op. cit., p. 43. See also"An Analysis of Income Transfers in a Developing Country: The Case ofKenya," J.C. Knowles and R. Anker, Journal of Development Economics,pp. 205-226, 1981.

-10-
1.24 This discussion of urban poverty illustrates the difficulty ofdefining poverty solely in terms of income levels. Urban poverty in Kenyais not only a problem of income; it is also an environmental problem causedby lack of access to services which should be affordable to the poor. Itis estimated that at least 25-30% of urban residents in Kenya live inunplanned and over-crowded slum settlements, most of which lack even basicservices. The health and environmental problems in these areas arewell-documented. For example, even though malnutrition among children hasbeen found to be less severe in urban areas, a recent CBS survey in andaround Nairobi found that infant mortality is higher in urban areas becauseof environmental diseases. Urban squatters are particularly prone todiarrheal and respiratory diseases which are spread by overcrowding andpoor sanitation. These factors contribute to a decline in productivity,shortened lives, and a poorer standard of living.
1.25 Experience with various projects in Kenya designed to provideservices to the urban poor has shown that such services are affordable ifsufficient effort is made to lower their cost. For example, Bank-financedprojects in Kenya which provide an integrated package of shelter and urbanservices have shown that households down to the 20th percentile of theurban income distribution can afford a site and service approach toshelter, while households down to almost the bottom of the urban incomedistribution can be reached through upgrading of existing squattersettlements. While in the long run, the urban (and rural) poor are aidedbest by economic development which raises their income, in the medium-terma great deal can be done through the supply of basic services to amelioratethe problems of poverty and improve the lives of the least advantaged.
D. Urban Development and Kenya's Macroeconomic Strategy
1.26 Urbanization is a long-term issue, and most attention in Kenya iscurrently focused on short-term problems of economic management.Nevertheless, the macroeconomic policies which are being introduced willhave a profound influence on the pace and direction of urbanization. Inthis section, we will sketch out some of the effects which will result fromKenya's trade, pricing, and industrial promotion policies.
1.27 Kenya has avoided policies of subsidizing food prices and basicservices which have affected the distribution of income between urban andrural areas in many other African countries. By and large, urban areas inKenya are expected to pay their own way, and the Government's pricing andinvestment policies have generally been consistent with this approach. Inseveral instances, the Government has taken more direct actions to improvethe income differential in favor of rural areas. For example, throughoutthe 1970s, the Government deliberately restricted wage increases to 75% ofincreases in the cost of living. The impact of this policy was a fall inthe average real wage rate by 12.5% between 1972 and 1979, a decline whichprimarily affected modern-sector urban workers.
1.28 Nevertheless, in a more subtle way, Kenya's trade andindustrialization policies have worked to the disadvantage of the ruralsector. Kenya's impressive increase in manufactured output, which grew ata rate of 10.8% p.a. throughout the 1970s, was stimulated by increasingly

-11-
high levels of protection and an emphasis on import-substitution orientedto a domestic rather than an external market. This created acost-permissive atmosphere which contributed to a rise in the prices ofdomestically manufactured goods relative to other prices. In addition, thetrade barriers led to an overvalued exchange rate which tended tounderprice all tradeable goods, including agricultural products. Thesefactors led to urban incomes in the modern private sector being higher andagricultural incomes being lower than might have been the case with a lessprotective trade policy.
1.29 The Government has begun to take various measures to improve thesystem of import administration and rationalize the protection offered bythe tariff system. Combined with other measures to promote exports, thesepolicies will help turn the terms of trade back in favor of agriculture.The effect of these policies on urban incomes will not be uniform,however. A number of writers have pointed out the dualistic nature ofKenya's urban employment base.17/ In the view of these researchers, themodern sector has been relatively immune to fluctuations in informal sectoremployment in Kenya and has been able to maintain a level of wages andcapital intensity which is not typical of the economy as a whole. Inconsequence, the size distribution of firms in Kenya is anomalous for itsstage of economic development, bearing more resemblance to a high-wagecapital-rich country than to a low-wage labor-intensive economy.18 / Asthe Government shifts more to a policy of export-promotion andrationalization of trade barriers, one can expect a gradual erosion ofurban wages in the modern private sector and increasing labor-intensity ofurban employment. This will improve the incomes of the urban poor as wellas those employed in the rural sector.
1.30 A second important factor of Kenya's macroeconomic policy as itaffects urban areas is the spatial implications for the location ofeconomic activities and population. The types of industries which havebenefited most from Kenya's import-substitution policies are largecapital-intensive industries such as vehicle assembly. Such industriestend to locate near major urban centers such as Nairobi, both to be closeto sources of skilled labor and capital and also because they are oftendependent on imported intermediate goods rather than Kenya's domestic
17/ See, for example:
(a) Employment, Incomes, and Equality in Kenya, International LaborOffice, 1971;
(b) The Kenya Employment Problem, H. Rempel and W.J. House, 1978; and
(c) "Poverty and Growth in Kenya," Annex 1 of "Growth and StructuralChange in Kenya," op. cit.
18/ "The Industrialization Process: Growth and Structural Adjustment,"Annex III of "Growth and Structural Change in Kenya," op. cit., p. 21.

-12-
resource base. In contrast, the change in trade policies is likely topromote the development of modern small industries with higher employmentelasticity than large industries. As studies in a number of countries haveshown, such industries are more likely to locate close to markets and areasof resource availability, such as in secondary towns. The employmenteffects of Kenya's trade policy will therefore help reinforce thediversified pattern of urban growth into secondary towns which is alreadyoccurring.
E. Summary
1.31 The information presented in this chapter gives a clearqualitative view of what can be expected for urban areas over the next twodecades. Urban growth will be rapid and decentralized, a process whichwill be further strengthened by the rationalization of trade policies and ashift to export-oriented industries. Relative urban incomes in the modernprivate sector are likely to decline as modern sector employment becomesmore "open" to international forces. Small-scale industries and informalemployment, on the other hand, will be aided by these policies and shouldplay a major role in providing urban employment. Rural-urban linkages canbe expected to remain strong, both through income remittances and by thediversification of employment and services throughout Kenya.
1.32 It would be easy to use the growth projections discussed in thischapter to paint a vivid picture of the consequences of rapid urban growthand the need for massive urban investments. Certainly the Government ofKenya does face a substantial problem in providing adequate investmentfunds to service economic activities and provide for the basic needs of itsurban population. The number of urban centers which require increasinglymore expensive investments will grow, and the cost of maintenance andadministration will increase at least as rapidly. On the other hand, othersectors of the economy also have priority needs, and the difficultiescaused by Kenya's adjustment to its economic conditions will constrain theability of the Government to service them. As urban centers can beexpected to grow at a rate faster than overall population growth, there islittle chance for any real growth in Government investment per capita inurban areas over the next five to ten years.
1.33 In the next chapter, we will review the Government's urban policyresponse of the past few years. The focus will be on the performance andachievements of the Government's urban policy and whether the urban policyobjectives remain valid in the light of changing economic conditions. Onthis basis, we will be ready to move on in later chapters to discuss whatthe Government must do to improve efficiency in the use of urban resourcesand to promote alternative sources of resource generation.
II. THE URBAN POLICY FRAMEWORK
2.01 In contrast to earlier policy statements by the Government, the1984-88 Kenya National Development Plan pays relatively little attention toproblems of urbanization. Nevertheless, the basic policy objectives of the

-13-
Plan as they affect urban development remain essentially unchanged frompast Development Plans, save for the addition of the new "District Focus,"which will be discussed in Chapter III. In general, the Government'spolicy objectives in urban areas can be summarized under the threecategories:
(a) Urban Spatial Policy--Urban growth should be decentralizedthroughout the country in order to provide for the needs of ruraldevelopment, promote regional equity, and avoid excessivepopulation concentration in Nairobi and Mombasa. Particularimportance will be placed on "gateway towns" in less-developedareas and on the development of urban areas in western Kenya;
(b) Urban Employment Policy--Modern sector establishments will haveprimary responsibility for providing for the employment needs ofthe growing urban population, and an important secondary sourceof employment will be provided by growth of the informalsector; and
(c) Urban Investment Policy--Urban investment policy will emphasizethe alleviation of poverty and the fulfillment of basic needs ofthe population, with priority given to improving health andnutrition, education and training, housing, social services, andwater.
These objectives are basically sound. Moreover, they are consistent withthe focus of Kenya's economic development policy described in the previouschapter. The Government has made good progress in achieving some of theseobjectives, but implementation has been neither even nor altogethersuccessful and has become increasingly constrained by macroeconomicconditions. In this chapter, we will review the progress which has beenmade and assess the priorities for continuing action on these policies.
A. Urban Spatial Policy
2.02 For purposes of spatial planning, the Government has designatedfour levels of service centers.19/ These are: urban centers (resident
population in excess of 5,000 inhabitants), rural centers (residentpopulation between 2,000 and 10,000), market centers (resident populationbelow 2,000), and local centers (primarily a cluster of ruralinhabitants). Of these classifications, only the first two correspond tothe definition of an urban area which is used in the census (residentpopulation in excess of 2,000). Nevertheless, the service centerdesignation is useful for investment planning, as it indicates the type ofservices which each level of center can expect.2 0 / In all, almost 1,700
19/ "Human Settlements in Kenya," op. cit.
20/ E.g., Everything from water supply to roads to schools to postoffices.

-14-
centers have been designated throughout the country as service centers,with the vast majority of these being rural-oriented market and localcenters.
2.03 In defining the urban part of Kenya's spatial strategy, arecurrent theme has been the belief that Nairobi and Mombasa are growingtoo rapidly, at the expense of urban development in the rest of thecountry. As we saw in the previous chapter, this pattern of growth didtake place during the 1960s, when the special circumstances surroundingindependence focused migration initially on the largest cities. Sincethen, however, urban growth has decentralized in response to thepredominant rural-urban linkages in Kenya's economy. While this does notnegate the need for an explicit urban spatial policy, it does changesomewhat the policy measures which are required.
2.04 Outside of identifying general urban spatial priorities, the1984-88 Development Plan does not suggest any measures by which theGovernment will pursue its spatial objectives, other than by encouragingministries to take spatial priorities into account in the allocation offunds for construction of social and economic infrastructure. In thisregard, it is interesting to review the past investment decisions of theGovernment to see whether they contained a high degree of spatialselectivity. Table 2.1 presents the allocation of Government investmentfunds to urban areas based on the FY80/81 Development Estimates. Fromthis, we see that the allocation of funds for basic urban infrastructure(water, sewerage, housing, roads, and other infrastructure) generallymatched the population share of the different urban areas.2 1 / On theother hand, Government investments in small scale industrial promotionthrough KIE had moved to smaller municipalities due to the completion ofindustrial estates in the larger municipalities. Finally, the plannedinvestment in regional and national infrastructure such as provincialhospitals and airports was skewed toward larger urban areas, particularlyNairobi. From these data, we would conclude that the Government allocatedurban investment funds for basic infrastructure essentially along the linesof population share. Where Nairobi benefited disproportionately, it wasfor investments with a national orientation rather than a purely localfocus, a fact that is consistent with Nairobi's status as the capitalcity. In other words, these data do not reflect either a "pro" or "anti"Nairobi bias in the allocation of investment funds.
2.05 Some critics have argued that Kenya's spatial strategy should bemore selective and concentrate resources on a limited number of "growthcenters." Because of the lack of a major urban center in western Kenya,
21/ The allocations in the Development Estimates in any one yearpredominantly reflect investment decisions committed in previousyears. The FY80/81 commitments in Table 2.1 are heavily influenced byBank-financed projects for water supply in Nairobi (approved in 1978)and Mombasa (approved in 1975) and for low-income shelter projects inNairobi (approved in 1975) and in Nairobi, Mombasa and Kisumu(approved in 1978).

-15-
Kisumu and Eldoret are identified in the 1984-88 Development Plan asdeserving particular attention. The rationale for the growth centerargument is generally the following: (i) there is a need to provide analternative "magnet" to attract migration away from Nairobi and Mombasa,and (ii) the growth centers will benefit from economies of scale andcomplementarity of urban investments.2 2 / However, urban growth hasalready decentralized away from Nairobi on a fairly wide pattern and is notconcentrating on a selected number of points. Therefore, if the Governmentis interested in holding rural-urban migration in secondary towns, it isprobably wiser to strengthen a range of secondary towns rather thanconcentrate resources in a chosen few. The other argument, complementarityof urban investments, is of a very long-range nature and is difficult tojustify in the face of a constrained resource base. Given the currentconstraints on the Government's investment budget, it is doubtful that theGovernment has adequate latitude to mandate a substantial reallocation ofresources between urban areas. In this situation, it is probably of moreimportance that Government scrutinize priorities for investments within thevarious urban centers based on individual rates of return, rather thanattempt a significant redistribution of resources on the basis of macrocriteria.
2.06 The major value of Kenya's urban spatial strategy is that itrecognizes the importance of Kenya's secondary towns in the economicdevelopment process. As we have seen in the previous chapter, thedevelopment of secondary towns is compatible with the demographic trends ofurban growth and supportive of the export-promotion thrust of Kenya'sindustrialization strategy. However, once the importance of secondarytowns is realized, it would probably be a mistake to go further andconcentrate a significant amount of resources on a select few. Certainly,the secondary towns will grow at different rates. Eldoret, for example,has a significant advantage over Kitale, less than 100 miles away, in termsof its location on Kenya's inter-city transportation network. This helpsexplain the large share of manufacturing employment in Eldoret and itsrelative dearth in Kitale. However, while factors such as these should betaken into account in deciding on the allocation of investment resources,it should be in the context of their effect on the productivity ofindividual investments, rather than to influence a specific urban spatialpattern.
22/ The "growth center" argument for Kenya is developed in most detail in"National Urban Development Strategy for Kenya: Rural-Urban Balance,"by H.W. Richardson, A. Khanna, and O.A. Sampaio, World BankConsultant's Report, 1978. The rationale for choosing Kisumu as themajor growth center for western Kenya would stand reexamination basedon the results of the recent census. Table 1.2 shows that Kisumu hadone of the lowest urban growth rates in Kenya during the 1969-79period, once the effect of boundary changes is taken into account.

-16-
B. Urban Employment Policy
2.07 The most important employment policies for urban areas are themacroeconomic policies which are discussed in the previous chapter. Inorder to generate enough employment for the large expected increase in theurban labor force, it is essential that economic incentives be changed at amacro level to make industrialization in Kenya more efficient and toprovide for a higher rate of labor absorption. In order to facilitate thisprocess, the Government can also pursue more direct policies than "gettingthe prices right." Possibilities for stimulating more employment inKenya's industry have been analyzed in a recent World Bank Report.2 3 /In this section, we summarize some of the results of this study and relatethem to Kenya's overall urban development strategy.
2.08 The proposed rationalization of the external trade regime willencourage the development of small industries in Kenya. It is helpful tomake a distinction in this regard between modern small enterprises andartisan industries. Modern small enterprises manufacture a much widerrange of goods than artisan firms and will probably experience a fasterrate of growth. Because modern small industry depends on innovation in theuse of skills and physical inputs, the number of producers is more limitedand the profit potential is greater. Artisan industry, on the other hand,makes use of traditional production techniques, with the result that entryis more open and competition is often intense. The artisan subsectorexists by the production of "basic needs" items, low-quality consumer andproducer goods for which the only substitutes are of higher quality at afar higher price. In general, the modern small industry sector providesthe best alternative for stimulating a large number of new Africanentrepreneurs. As was previously mentioned, modern small industry is alsomore likely to respond to spatial advantages in location.
2.09 The Government considers its major program for the development ofmodern small industry to be Kenya Industrial Estates (KIE). KIE operatesfull-scale industrial estates in five municipalities (Nairobi, Mombasa,Kisumu, Nakuru, and Eldoret), smaller Rural Industrial Development Centers(RIDC's) in eight secondary towns (Nyeri, Machakos, Kakamega, Embu, Kisii,Malindi, Voi, and Homa Bay), and more modest Industrial Promotion Areas(IPA's) near RIDC's in several towns. Besides providing workshop space onthe different types of estates, KIE offers technical assistance and accessto machinery through Technical Advisory Centers (in RIDC's) and TechnicalService Centers (on industrial estates). KIE also administers a creditprogram to provide fixed and working capital to small entrepreneurs.2 4 /
23/ "The Industrialization Process: Growth and Structural Adjustment,"Annex III of "Growth and Structural Change in Kenya," op. cit.
24/ "The Industrialization Process: Growth and Structural Adjustment,"op. cit., pp. 58-65.

-17-
2.10 Besides the KIE program, it is a common feature in the planningof low-income housing estates to include some provision for workshops andother small industries. The Bank-financed Second Urban Project wasoriginally designed to provide almost 1,000 plots in three cities for theconstruction of workshops, five bulk workshop sites for development bycharitable institutions, 2,000 market stalls, and 350 artisan kiosks.Materials loans were to be provided for the construction of worksheds, andfull cost recovery was expected on all sites.25 / A further advantage ofthis approach is that the workshop sites are integrated into the planningof residential communities, providing the residents with easy access toemployment. While these targets have since been scaled back substantiallydue to cost overruns on the project, they do indicate the possibility ofinvolving organizations other than KIE in employment promotion activitieson a large scale.
2.11 Although local authorities have developed workshop sites throughlow-income housing projects, experience has also shown that the employmentplanning aspects of these projects is often weak. Neither the NationalHousing Corporation (NHC) nor the local authorities have expertise inassessing the market demand for workshops, although they do haveconsiderable experience in building design and urban planning.Consideration should be given to strengthening the employment planningaspects of low-income housing projects through the Ministry of LocalGovernment, NHC or the Town Planning Departments of the largermunicipalities. These concerns are indicative of the need for moreinter-sectoral planning in urban development, a topic we discuss inChapter III.
2.12 Besides workshop facilities, there are a number of other areaswhere urban employment concerns can be strengthened. One industry whichhas strong linkages to the local economy is the production of buildingmaterials for low-cost housing.2 6 / Organizations such as the HousingResearch and Development Unit (HRDU) at the University of Nairobi andHABITAT (the United Nations Center for Human Settlements, also located inNairobi) have done a great deal of research on the use of local materialsto lower building costs. This could be integrated with a KIE project topromote such industries, achieving both increased employment and lowercosts in housing projects.
2.13 Another area worth considering in more depth is employment in theconstruction of low-cost housing. The monitoring study of the Bank-financed site and service project at Dandora in Nairobi showed that low-income housing projects generate a substantial amount of employment for
25/ "Kenya: Second Urban Project," World Bank Staff Appraisal Report,March 23, 1978, p. 30.
26/ "The Industrialization Process," op.cit., Appendix, p. 4.

-18-
small contractors (called "fundi's" in Kenya).27/ The possibility existsof using an agency such as the National Construction Corporation (NCCo) toprovide technical assistance to these small contractors. NCCo is aparastatal established in 1967 to promote the development of the localcontracting industry in Kenya. It faces a number of problems, such as:(i) too broad a mandate, taking it into sub-contracting, equipment leasing,and construction credit, (ii) poor cost recovery because of a lack ofdetachment from its clients, and (iii) an overemphasis on a small number oflarger clients. However, NCCo would appear to have the potential toprovide substantial assistance to small contractors if its operations aresimplified and better cost control is introduced.
C. Urban Investment Policy
2.14 The 1984-88 National Development Plan states that "thealleviation of poverty and the fulfillment of basic needs have always beena major concern of Kenyan development efforts."28 / A great deal of efforthas gone into defining a basic needs investment strategy for Kenya.2 9/Because of this extensive documentation, we will mainly summarize theaccomplishments in each sector as they relate to urban areas.
2.15 The interpretation of official statistics on the provision ofurban services creates a problem about the coverage of unplanned housingdevelopments. These "squatter" areas are estimated to contain roughly 25%of the urban population of Kenya, with the specific percentage by townrunning from 15% (e.g., Thika, Kisii) to almost 40% (e.g., Eldoret).3 0/In general, the unplanned housing developments lack most urban services.Where safe water is available, it is usually off-site or inconvenient.Other municipal services such as solid waste collection are seldomprovided. These unplanned areas are often not included in official servicestatistics, either because they lie outside municipal boundaries or becausetheir existence is not officially recognized. Therefore, although theofficial statistics for urban service coverage are impressive, they canconceal or gloss-over serious service deficiencies. With this caveat, weturn to a review of urban investment policy.
27/ See in particular the MEDIS 6 report on self-help building groups andMEDIS 7 on employment linkages, Dandora Community Development Project,reports by Senga, Ndeti, and Associates, 1979.
28/ "1984-88 National Development Plan," Government of Kenya, 1983, p. 32.
29/ Two of the more comprehensive references are:a. "Kenya: Population and Development," op. cit., Chapter IV,
pp. 78-119, andb. "Planning for Basic Needs in Kenya," op. cit.
30/ "Third Urban Housing Project", Interim Report No. 1, Consultant'sReport to the Ministry of Urban Development and Housing, 1980.

-19-
2.16 Water. Returning to Table 2.1, we see that water supply accountsfor a major proportion of urban infrastructure investment, 41% in theFY80/81 Development Estimates. The Government estimated that in 1982,approximately 75% of the urban population had reasonable access to animproved water supply system.3 1/ The quality of the supply depends on thesize of the community and is generally better in the larger towns. A largepart of the investment in this sector in recent years has gone into majorworks to provide for the growth of Nairobi and Mombasa. At the same time,the Government has supported the provision of safe water in rural areas andhas improved the systems in a number of smaller urban centers andmunicipalities.
2.17 The responsibility for urban water supply is shared between thelocal authorities and the Ministry of Water Development (MWD). Most of thelarger local authorities (with the exception of Mombasa) operate their ownwater system. MWD owns and operates water supply systems in fivemunicipalities, 110 urban, and 90 rural areas. In addition, a limitednumber of water schemes in small urban and rural areas are operated byagencies such as county councils and Kenya Railways. The allocation ofwater resources, pricing of water supply, and the operation of waterundertakings are governed by the Water Act, the Public Health Act, and theLocal Government Regulations.
2.18 The financial performance of the water supply sector has beenmixed. Tariff structures approximating long-run marginal cost pricing havebeen introduced in both Nairobi and Mombasa. While these tariffs haveraised substantial financial resources which could have been used foradditional investments, the lack of appropriate financial controls hasundermined the intention of these policies. For example, Nairobi CityCouncil (NCC) established a separate water fund as part of a Bank-financedproject and built up substantial reserves to cover its local costobligations under the succeeding project. Because of persistent cashdeficits elsewhere in the Council, the water funds were diverted to pay forother recurrent expenses, leaving an inadequate cash reserve to cover NCC'scommitted obligations. A similar situation pertains to the Mombasaproject, where MWD has used excess revenues to cross-subsidize other waterprojects. In general, most local authorities charge only enough to earn acash surplus on their water account but not enough to cover the replacementcost of their assets. MWD on its part does not have financial objectivesof the type found in most water utility companies and generally seeks onlyto cover its cost of operations and maintenance.
2.19 Overall, the water supply sector has achieved reasonableperformance on the investment side. The major issue in the sector isfinancial performance, which ultimately could become a binding constrainton the ability of the sector to maintain its expansion. There may bejustification for introducing a uniform pricing policy (not necessarily thesame as uniform prices) for water in Kenya. Even this would not solve theproblem in local authorities where water revenues are diverted to pay othercouncil expenses. This problem needs to be addressed as part of the
31/ "1984-88 National Development Plan," op. cit., p. 36.

-20-
overall problem of local authority finances, which is covered inChapter IV.
2.20 Sewerage. There are about 22 public sewerage systems in Kenyaserving about 25-30% of the urban population. The FY80/81 DevelopmentEstimates allocated 9% of urban investment funds to sewerage systems,indicating that planned expansion of the system was moderate. In thelarger cities, coverage of the sewerage system can be quite good, with theexception of the unplanned housing areas. Table 2.2 provides informationon the type of sanitation provided in the major cities in Kenya. We seethat with the exception of Mombasa, most of the population living inplanned housing developments in large cities has good access to sanitationservices, either by conventional sewerage or by septic tanks.
2.21 In the unplanned housing areas in Kenya, the question ofappropriate sanitation presents a serious unresolved problem. The cost ofproviding sewerage to these areas, particularly given their irregularphysical layouts, can require a substantial investment of scarce capitalfunds. In addition, the hook-up rates to the systems can be quite lowbecause residents are obliged to make a significant additional investmentfor on-site sanitation facilities in order to properly utilize the system.Given the very low incomes of most of the residents, it is doubtful thatimposing sewerage charges on them represents a socially optimal use oftheir limited resources. Nevertheless, many of the local authorities havetaken a very conservative approach to sewerage, insisting that fullwater-borne systems have to be provided. The Kenya Low-Cost HousingBy-laws Study 32/ recommends a more flexible approach to this problem,allowing the use of various low-cost sanitation systems wheresoil conditions and population densities permit.33 / One obstacle toadopting these systems appears to be the fragmented review procedure forhousing projects used by local authorities. The Medical Officer of Healthin the local authorities, who is required to approve the health aspects ofall infrastructure and building designs, is often not familiar with thebroader socio-economic considerations involved in the design of low-costhousing projects. For example, protracted disagreements with the MedicalOfficer of Health for Nairobi City Council over sanitation options finallyled to the deletion of major parts of the Second Urban Project which wouldhave provided shelter options for the very poorest residents of Nairobi.
32/ "Kenya Low-Cost Housing By-laws Study; Final Report," (two volumes),Ministry of Urban Development and Housing, 1980.
33, There is a substantial literature available on low-cost sanitationoptions which has been produced by the World Bank Research Program inWater Supply and Sanitation. (Publications available from the WorldBank Publications Unit, Washington, D.C.) The UNDP is currentlyfunding a demonstration project in low-cost sanitation in Kenya, whichwill hopefully promote better understanding of the options availablein addition to conventional water-borne sewerage.

-21-
2.22 Housing. The Government has identified housing policy as one ofthe important components in its efforts to alleviate poverty and providefor the basic needs of the population.3 4 / The private sector is expectedto provide for the middle and upper income groups, with the Governmentproviding indirect incentives through the development of housing finance.For lower income groups, the public sector is expected to play a moredirect role in providing shelter meeting minimum standards of basic needsservices. This is to be accomplished through site and service projects andcommunity upgrading and the regulation of minimum building standards forother housing through bylaws enforcement. Thus, Kenya's housing policy isbroadly consistent with the philosophy of limiting public sectorinvolvement to situations where the private sector response is notadequate.
2.23 Central to the concept of site and service development is anemphasis on home ownership as an efficient means of mobilizing individualsavings for housing construction. Kenya's housing policy has been orientedalmost exclusively toward home ownership, with an official goal ofproviding a minimum two-room dwelling with separate kitchen and bath forevery household. Because of the high resource cost implicit in thisobjective, much of the discussion on housing policy in Kenya has focused onthe possibilities for cost reductions and the lowering of minimumstandards. Site and service projects are seen as complementary to thiseffort by making the individual homeowner rather than the Governmentresponsible for providing an adequate structure over time.
2.24 In fact, site and service projects are not new in Kenya and havebeen implemented in a limited form since prior to Independence. Localauthorities occasionally demarcated tracts of public land, laid out plotboundaries and road reserves, and allowed households to occupy the land andconstruct dwellings in return for an annual rental fee. Although onlyminimal services were provided at the beginning, the local authorities haveextended services to these settlement areas as funds became available. Thistype of incremental urbanization of land is what later site and serviceprojects were intended to improve on. The site and service concept becamepart of the formal housing policy in Kenya with the adoption of SessionalPaper No. 5 of 1966/67 on housing policy, which was based on therecommendations of a 1964 UN Mission by Bloomberg and Abrams. However,site and service projects were not implemented on a large scale until themid-1970s. At that time, the National Development Plan called for theNational Housing Corporation (NHC) to devote the major portion of itsresources to site and service projects, and the World Bank agreed tofinance two large projects providing site and service plots and communityupgrading in three major cities in Kenya. The Bank-financed projectsintroduced a number of features such as assistance in community developmentand the provision of materials loans which have helped to facilitatehousing construction.
34/ An excellent discussion of the evolution of Kenyan housing policy iscontained in R.E. Stren, Housing the Urban Poor in Africa: Policy,Politics, and Bureaucracy in Mombasa, Institute ofInternational Studies (University of California, Berkeley), 1978.

-22-
2.25 In view of the financial stringency in Kenya's budget, there islittle justification for public sector housing agencies to embrace moreexpensive shelter alternatives such as contractor-built houses. TheFY80/81 Development Estimates allocated almost 46% of urban investmentfunds to low-income housing and associated infrastructure and landacquisition. However, there is evidence that even this amount ofinvestment will not be able to keep up with the need for low-incomehousing, and the performance record and possibilities for improvements inthis sector are examined in depth in Chapter V.
2.26 Urban Transportation. From the standpoint of urban growth andplanning, roads are the framework on which cities are built. While thereis little justification for Kenya to embark on an expensive urban roadsprogram, moderate and well thought-out investments in urban roads are anecessity to provide for structured urban growth and avoid a possiblestranglehold of congestion such as found in many other cities. However,because urban roads are not classified as a basic needs investment and havetherefore attracted little donor attention in recent years, investment inurban roads has shown the sharpest decline of any major urban investmentcategory. Where roads accounted for 13% of urban investment expendituresin 1964, Table 2.1 shows that in FY80/81 only 4% of urban investment fundswere allocated to urban road construction. This neglect of urban roads issomewhat inconsistent with national policy, where approximately 25% of theFY82/83 national development budget was allocated to road infrastructureoutside of urban areas.
2.27 The continuing decline of urban road maintenance is the mostdisturbing feature of current policy. This is directly linked to thefaltering financial performance of the local authorities, which have cutback on road maintenance as their budgets have become tighter. Forexample, Nairobi City Council virtually ceased road maintenance in 1979because of a lack of funds. In Mombasa, continuing neglect of roadmaintenance led to widespread failure of road surfaces during heavy rainsin 1979, causing damage which has still not been adequately repaired. Onthe national level, Kenya has put substantial emphasis on highwaymaintenance through the Ministry of Transport and Communications (MTC).3 5/Because urban roads fall under local authorities, this expertise has notextended into urban areas. As it is, Kenya may be approaching the
35/ E.g., "Kenya: Second Highway Sector Project," World Bank StaffAppraisal Report, April 9, 1984.

-23-
situation all too common in Africa, where road surfaces give out when youcross into the city. 3 6 /
2.28 The traffic engineering quality of the urban road network inKenya is generally adequate. Only Nairobi is beginning to experienceserious congestion problems during the peak hours, and many of theseproblems could be alleviated with simple traffic engineering improvements.This would also contribute to energy conservation; it is estimated that theintroduction of traffic engineering measures in Nairobi could cut gasolineconsumption in the city on the order of 10-15%.37/ Unfortunately,budgetary restraint has severely limited the ability of the Government toconsider road improvements.
2.29 Public transport in Nairobi and Mombasa is provided by a mixedmode system based on conventional buses and paratransit vehicles locallycalled "matatus". Matatus provide virtually all the public transportservice within secondary towns and much of the inter-city passengertransport. Studies recently carried out in Nairobi have shown that themixed bus-matatu system is economically efficient and provides a highlycomplementary form of service. 3 8 / Buses and matatus are all privatelyowned and operated, and no subsidies are provided to the system. However,neither the bus company nor the matatu operators have adequate access toinvestment funds. The mandate for urban transportation policy is dividedamong several ministries, with no clear policy guidance in this field.Thus, while the situation in urban transportation is not yet critical inKenya, continuing neglect in this area could eventually constrain theeconomic efficiency of the cities in the movement of goods and people.
36/ Under the Transfer of Functions Act in 1969, only the seven majormunicipalities in Kenya retained responsibility for urban roadmaintenance, with MTC taking over responsibility for all other roadsincluding urban and rural roads previously maintained by town andcounty councils. In practice, MTC has limited its activities in theurban areas to the maintenance of classified roads (i.e., trunkroads). In consequence, the secondary urban road network in mostsmaller towns in Kenya is virtually neglected except on a piece-mealbasis as the local authorities can afford. Interestingly enough, arecent in-depth review of road maintenance in Kenya (see "TheOrganization of Road Maintenance" by Melody Mason, June 29, 1981, apaper prepared for the Projects Advisory Staff of the Transportation,Water, and Telecommunications Department of the World Bank) determinedthat maintenance of secondary urban and rural roads has not improveddespite substantial amounts of money invested in MTC, and proposes asan alternative approach "increased involvement of local administrativelevels in programming maintenance work."
37/ "Kenya: Energy Assessment", World Bank Report, January 1982.
38/ "The Matutu Mode of Public Transport in Nairobi," by S. Kapila, M.Manundu, and 0. Lamba, Mazingira Institute, 1982.

-24-
2.30 Education. Primary education is a major priority of the KenyaGovernment. Throughout the 1970s, the Government increased the access ofall students to primary education by progressively abolishing school fees.This has caused a large increase in demand for enrollments, in addition tothe places which would have been required for normal urban growth.
2.31 After the reorganization of functions in 1969, only the sevenlargest municipalities retained responsibility for primary education. Evenfor these local authorities, the central Government has taken over much ofthe control and financial responsibility for primary education. Forexample, the central Government introduced a grant for teachers' salariesin 1978 because the local authorities were unable to carry the rapidlyrising costs.3 9 / Until recently, the Government also provided a grant toreplace the loss of revenue from the abolition of school fees, although theamount provided has generally not been adequate to compensate the localauthorities for the large increase in enrollments. The major problem forlocal authorities which have retained responsibility for primary educationhas been to find investment funds to build new schools. Unlike ruralareas, self-help (Harambee) efforts have not been effective in providingthe number of urban schools required. Because of this, school constructionis a major constraint on the expansion of primary education in urbanareas. In addition, the central Government is facing major problems inmaintaining its recurrent expenditures for education because of the tightbudgetary situation. This has meant that local authorities cannot beassured of grant funds to cover teachers' salaries if they do openadditional schools.
2.32 There are no adequate statistics on the number of children deniedplaces in urban areas because of a lack of schools. In Nairobi, many ofthe children in squatter areas, such as Mathare, Kibera, and Kwongware, donot attend school, either by choice or because there are not enough schoolsin the area. Nairobi anticipates a need for 15 new schools a year over thenext several years, but it has not been able to identify the resources tobuild them. Some schools are being provided by donors as part oflow-income shelter projects, but the coverage of these efforts is unevenand has not been able to provide for the back-log of children seekingenrollment.
2.33 Health. Because doctors and hospitals are concentrated in urbanareas in Kenya, urban residents are often assumed to be adequately served.However, a number of surveys have demonstrated that health conditions inurban squatter areas are as bad or worse than conditions prevailing inrural areas. Nairobi City Council estimated in 1981 that it needed toexpand the number of basic health clinics by 50% to provide adequatecoverage of the urban area, although it could not identify the fundsrequired to construct and operate the clinics. Most of the municipalities
39/ The extension of the grant for teachers' salaries was largely a matterof equity, as teachers' salaries are set by the central Governmentand the Government had eliminated the local authorities' main sourceof revenue to pay for salaries, the Graduated Personal Tax, in 1973.

-25-
have found that the local clinics which they provide are preferred toprovincial facilities operated in the same town. Preparation studies forthe Second Urban Project also identified problems in maternal health careand infant nutrition in most squatter areas. Based on this, Nairobi,Mombasa and Kisumu have been working on the development of special programsin child nutrition, with the assistance of Bank-financing.
2.34 Other Services. Many other services are necessary to providedecent living conditions in urban areas. These include services such assolid waste disposal, markets, street cleaning, and pest control. Almostwithout exception, these services have deteriorated in recent years as thefinancial position of the local authorities have become more constrained.Moreover, as these services are financed primarily from general sources ofrevenue, there is little prospect that they will improve in the nearfuture.
D. Summary and Conclusions
2.35 Two major points can be summarized from this discussion ofKenya's urban development policies. The first point is that theGovernment's urban strategy is supportive of current demographic trends andKenya's macroeconomic policy. In particular, the explicit recognition ofthe role of secondary towns in holding rural-urban migration and supportingthe diversification of economic activity throughout the country is animportant complement to Kenya's external trade and pricing policies. Thesecond point to be drawn from the discussion is that by and large, theGovernment's actions have been consistent with its stated policies. Ingeneral, one can conclude that Kenya's urban strategy as put forward in thevarious National Development Plans is a reasonable basis for futureplanning and provides a consistent statement of priorities in urban areas.
2.36 Urban areas in Kenya are in general better serviced and bettermaintained than most cities in East Africa. This should not distractattention from the fact that there are a large number of urban residentsliving in over-crowded and unsanitary conditions. However, given theeconomic constraints on Kenya, it would be unrealistic to argue that urbanareas should receive a significantly larger share of investment funds. Therequired resources either don't exist or are needed elsewhere. At the sametime, it would be equally unrealistic to ignore urban areas or to give upon the policy gains which have been made. Urban areas have an importantsupport role to play in Kenya's economic development by absorbing a largeshare of the new population and providing for their employment and serviceneeds. The ability of urban areas to do so has to be maintained as part ofthe long-term economic development of Kenya. This does not argue for boldnew initiatives in urban areas, but it does justify sustained andreasonable support for the progress which has been made so far.
2.37 These considerations set the basis for the two major themes to bedeveloped in the rest of this report. First, the immediate priority forthe urban sector in Kenya is to consolidate the institutional and financialframework which supports urban development. Urban institutions havesustained rapid growth and change in the last few years, and they are goingto face even more rapid growth in the future. There are problems of

-26-
inadequate coordination, divided responsibilities, and over-extendedagencies which have to be dealt with in order to allow this growth to beefficiently managed. Even more importantly, urban institutions will haveto look to their own resource base as much as possible. The claims on thecentral Government budget are numerous, and urban areas are not the firstin line. External donor agencies can help somewhat, but these funds arelimited and have a high opportunity cost to the country in terms of otherforegone investments. This leaves urban areas with only hard choices;there are no others.
2.38 In order to carry out the task of providing for urban growth, theonly reasonable alternative for Kenya is the development of localcapabilities, local initiatives, and local resources, with the advice andencouragement of the central Government. Kenya has maintained a traditionof semi-autonomous local authorities, and the basis for the furtherdevelopment of local capabilities is one of the best in Eastern Africa. Atthe same time, Government actions in such areas as local revenues,budgetary responsibilities, and central-local relationships have often beendetrimental to local authorities and inadequately thought-out inexecution. The reasons for this are complex and include implicit politicalconstraints on the development of autonomous governmental units.Nevertheless, it is clear that Kenya, in implementing its economicdevelopment strategy, needs viable local authorities to carry out its urbanpolicy objectives. Responsible local authorities with a sound resourcebase and a capacity for sustaining local initiatives can be a positiveforce in accommodating urban growth and servicing the diversification ofeconomic activities throughout Kenya. On the other hand, if the Governmentallows current trends to continue, local authorities can become a drag onGovernment development initiatives and a chronic sink of poverty andinvestment funds.
2.39 The remainder of this report will explore in more detail thevarious financial and institutional mechanisms which support urbandevelopment in Kenya. Particular stress is placed on possibilities toimprove cost-efficiency and resource generation and the means by which thecentral Government and the local authorities can strengthen theseprocesses. The concerns reflected in this report can thus be viewed as anintegration of the social concerns of the 1970s, when new directions werecharted in basic needs investment policy, with the financial disciplinerequired in the 1980s to sustain the programs in the long-run. Thechallenge now is to consolidate earlier initiatives and find the resourcesto support them on the scale which will be required to provide for urbangrowth in Kenya.
III. URBAN DEVELOPMENT: THE INSTITUTIONAL FRAMEWORK
3.01 Prior to independence, local authorities in Kenya had virtuallythe sole responsibility for managing urban growth. The involvement of thecentral Government through the Ministry of Local Government was primarilyregulatory, focusing on the supervision of local elections and the reviewof annual budget proposals. During the late 1960s and throughout the

-27-
1970s, the central Government began to take more interest in influencingthe pace and direction of urban development. This involvement has beenreflected in increasingly articulate discussions of urban developmentstrategy in the National Development Plans. It was also expressed indiscrete events such as the creation of the National Housing Corporationshortly after independence, the transfer of functions from local councilsto the central Government in 1969, and increasing government control ofparticular sectors such as primary education, health, and water supplythroughout the 1970s. At the same time, the central Government has failedto develop a consistent internal framework for the planning and financingof urban development activities through local authorities, with the resultthat implementation of the urban strategies proposed in the NationalDevelopment Plans has often been poorly coordinated.
3.02 The need to improve the coordination of urban developmentplanning was emphasized in a recent Government report onpublic expenditures.4 0 / Some of the implicit concerns which justify amore coordinated approach to urban development policy are the following:
(a) The Government has no planning mechanism to ensure that itsinvestment program in urban areas is internally consistent andcompatible with the strategy laid out in the National DevelopmentPlan. This means, for example, that it is difficult to monitorcompliance with the Government's national urban spatial policyobjectives except on a sectoral basis. There are no formalmechanisms for ensuring inter-sectoral consistency betweeninvestments, such as programming for expansion of water andsewerage networks to be consistent with priorities for opening upnew urban areas for low-income housing developments.
(b) As more attention has been paid to integrated urban projects,such as site and service developments, it has been recognizedthat better inter-ministerial coordination is required to ensureefficient implementation. For example, the urban shelter andcommunity upgrading projects in the Bank-financed Second UrbanProject have required at various times inputs from ministriessuch as the Ministry of Works, Housing and Physical Planning forreview of on-site shelter investments, the Ministry of LocalGovernment for off-site investments and community facilities, theMinistry of Water Development for review of water and seweragecomponents, the Commissioner of Lands for land acquisition andvaluation, and the Ministry of Finance and Planning for authorityto award contracts and incur expenditures. Delay in obtainingthe necessary coordination between these agencies has been aserious impediment to timely implementation of the project.
(c) Finally, it was recognized that the planning of individualsectoral investments has to take account of the overall financial
4°/ "Report and Recommendations of the Working Party on GovernmentExpenditures," Government of Kenya, June, 1982, p. 56.

-28-
viability and implementation capacity of the local authorities.As an example, the Bank provided financing through several loansto Nairobi City Council for investments in water supply andshelter. Although each individual project could be shown to befinancially viable, the overall financial weaknesses of theCouncil put the projects into jeopardy in terms of availabilityof local counterpart funds, adequate revenues to sustainrecurrent costs, and the recycling of surplus revenues back intothe investment program.
3.03 In order to establish a framework for the analysis of urbanpolicy coordination in Kenya, it is suggested that urban development as aninstitutional process should have the following objectives:
(a) It should provide technical support to the Government's macro-level investment programming in terms of maintaining a pipelineof suitable investment projects and monitoring their consistencywith the Government's spatial, economic, and social objectivesfor urban areas (the MACRO objective);
(b) It should provide a focal point for inter-ministerialcoordination of investment projects to achieve efficientimplementation and inter-project consistency (the MICROobjective); and
(c) It should encourage the development of local initiatives andlocal capacities to deal with urban problems within the contextof a sound financial base (the INSTITUTIONAL objective).
In this chapter, a structure is suggested for urban development planningwhich seeks to achieve these objectives within the current institutionalframework. An important step in this process is the specification of anexplicit mechanism for policy coordination. This is provided in section B,following a brief description of the current institutional structure insection A.
A. Existing Institutional Arrangements
3.04 As in most countries, the responsibility for urban development inKenya falls on a number of agencies. The 1979-83 National Development Planlisted thirty-six separate branches of the public and private sectors whichhave a role in the formulation or implementation of urban planning anddevelopment.41! Of these, the most important are the local authorities,central Government ministries such as the Ministry of Local Government(MLG), the Ministry of Works, Housing and Physical Planning (MWHPP) and theMinistry of Water Development, and parastatals such as the National HousingCorporation and Kenya Industrial Estates.
41/ "1979-83 National Development Plan," Appendix II, p. 516.

-29-
3.05 Local Authorities. The Government's urban strategy assigns amajor role in the implementation of urban investments to the localauthorities.42 / Following the UK model, local authorities in Kenya aresemi-autonomous governmental units with prescribed rights and obligationsput forward in the Local Government Act of the Laws of Kenya. The LocalGovernment Act recognizes four categories of local authorities: municipalcouncils (which includes the City Council of Nairobi), town councils, urbancouncils, and county councils. In 1984, there were twenty municipalities,of which Nairobi and six others--Mombasa, Kisumu, Nakuru, Thika, Eldoret,and Kitale--provide the broadest range of local services, including, interalia, primary education, health services, road construction andmaintenance, water supply, sewerage, housing, solid waste management,drainage, markets, and social services.4 3 / The remaining municipalitiesare smaller and have fewer functions, with no responsibility for primaryeducation.4 4 / Town councils, of which there are currently seven, have amore limiteT range of functions. Urban councils come under thejurisdiction of county councils and are considered to be a transitionalform in the development of local representation. There were seventeenurban councils in 1984, all of which had been formed since 1979. Countycouncils, of which there are thirty-nine in number, are regional in focusand have boundaries which coincide with the district administrations.Neither county nor urban councils exercise any significant range of urbanfunctions, having had the major share of their responsibilities--primaryeducation, public health, and roads--assumed by the central Government in1969. Therefore, the major scope for local representation in the urbandevelopment process will come from the municipal and town councils. Evenwithin the larger councils, the needs, resources, and staff skills vary
42/ The report of the Working Party on Government Expenditures focuses onthe deficiencies of local authorities in the current planning process,but it continues to affirm the importance of the local authorities inpromoting urban development. See "Report and Recommendations of theWorking Party on Government Expenditures," op. cit., pp. 55-59.
43/ Mombasa does not have responsibility for water supply, which is beingprovided through the Sabaki Coastal Water Project.
44/ Between 1981 and 1982, nine town councils were elevated to municipalstatus, as well as creation of a number of town and urban councils.This wholesale elevation of various councils has had seriousimplications for the financial viability of local authorities. To givean example, Voi urban council, a town with 7,400 inhabitants in 1979,was established in 1981 with an estimated total indebtedness in excessof KSh 30 million to pay for housing and sewerage projects underconstruction. License fees had to be raised significantly in thetown, and the overall financial viability of the new council was inserious doubt. (See recommendation vii, p. 59, in the "Report andRecommendation of the Working Party on Government Expenditures,"op. cit.)

-30-
considerably. Nairobi, as the largest council, has a development budgetmore than twice that of Mombasa and three times as much as all the othermunicipal councils put together. While this is partially explained byNairobi's large population, even municipalities of comparable size, such asEldoret and Thika or Nyeri and Kitale, have significant differences intheir revenues and expenditures.
3.06 A distinct feature of local authorities in Kenya is that theyfunction as housing authorities. Patterned after the UK, this arrangementgoes back to colonial times when large municipalities like Nairobi,Mombasa, and Kisumu provided a variety of rental housing schemes forAfrican workers. Since independence, the diminishing role of public rentalhousing and greater emphasis on ownership housing have altered the pictureconsiderably. The present and future role of local authorities in housingis not very clear, and there is some ambivalence in the thinking of bothlocal and central Government levels on this issue. This topic is discussedin further detail in Chapter V.
3.07 Ministerial Responsibilities. The Ministry of Local Governmenthas the primary responsibility for overseeing the operations, financing,and management of local authorities. The Ministry of Works, Housing andPhysical Planning has responsibility for housing policy and legislation andfor the preparation of budget submissions and supervision of publicexpenditures on housing. The Physical Planning Department (PPD) in thesame ministry prepares land use plans for urban areas and does generalspatial planning.45 / In the Ministry of Lands and Settlement (MLS), theCommissioner of Lands (COL) approves the development plans for governmentland, which in many urban areas constitutes the bulk of the availablespace, controls the allocation and/or approval of acquisition of land forpublic purposes, and the registration of land titles. The Ministry ofWater Development owns and operates water systems in a number of urban andrural locations. The Ministry of Health and the Ministry of Transport andCommunications also have significant responsibilities for preparing,implementing, and maintaining development projects in urban areas.
3.08 Parastatals. The major parastatals involved in urban developmentprograms are the National Housing Corporation, the Housing FinanceCorporation of Kenya (HFCK), and Kenya Industrial Estates. NHC is themajor recipient of government investment funds for public housing, which iton-lends to local authorities for the construction of public housing. Italso supervises the construction of housing estates as an implementingagency for the smaller local authorities. The HFCK is solely involved inhousing finance, with almost all its funds devoted to mortgage finance for
451 The Ministry of Works, Housing and Physical Planning is also assigneda mandate for "urban development policy," a function that has shiftedbetween ministries several times since 1980 and has generally beenassociated with the Physical Planning Department. As the emphasis inthis chapter is on the coordination and planning of urban investments,relatively little attention will be paid to defining the potentialpolicy role for MWHPP in urban development.

-31-
middle and upper income housing. Housing finance in Kenya is dealt withfurther in Chapter V.
3.09 The "District Focus" for Development Planning. As of July 1,1983, the Government officially adopted a district-level focus for futuredevelopment planning. The purpose of the district focus is to increase thescope for local initiative in development planning and to achieve a betterintegration of development projects at the local level. As such, thisdecision to decentralize planning is compatible with the increased spatialdiversity of urban growth which was discussed in Chapter II. While theprimary objective of district planning is to improve rural developmentprojects, the local authorities in each district are required to coordinatetheir development plans through the District Development Committees(DDCs). The larger urban local authorities (municipal and town councils)are also expected to place more priority on the coordination of rural andurban development in planning their investment programs. While thisinnovation marks an important step in defining local responsibilities, itwill still be necessary for the central Government to ensure that nationaldevelopment policies are effectively translated into practice at the locallevel. The major instrument for achieving this objective will be theGovernment's Forward Budget planning process.
3.10 Coordination of Investment Planning. The principal instrumentfor coordinating Government urban investments at the ministerial-level isthe Forward Budget. The starting point for this process is provided by theindicative five-year development budgets presented in the NationalDevelopment Plans. These indicative budgets are intended to be used by thesectoral ministries to produce detailed investment guidelines for theplanning period. In practice, the process of producing detailed guidelinestakes place with varying degrees of efficiency. Performance monitoring ofplanned investments has been generally poor, and planning targets are ofteninadequately defined and overly-ambitious. The Ministry of Finance andPlanning (MFP) has recognized this problem and is issuing a series ofguidelines to improve project monitoring.
3.11 The process of determining annual development budgets is based onrolling three-year projections of development expenditures, which areprepared initially by the sectoral ministries and discussed with MFP. TheForward Budget review is carried out by two separate working groups forSectoral Planning and for Estimates, each group comprising officials fromMFP and the sectoral ministry concerned. The difference in the functionsof the two groups is one of degree. The Sectoral Planning groups ensurethat the budgets for the three forward years are consistent with each otherand reflect the pattern of development established in the NationalDevelopment Plan. They are also responsible for identifying new projects,modifying existing ones, and monitoring on-going projects in terms ofeconomic and social criteria. The Estimates groups focus more onexpenditure requirements and adjustments for ongoing and new projects.
3.12 From the standpoint of urban development, a major weakness of theForward Budget process is that the working groups are organized ministry-wise. For example, there are separate Sectoral Planning groups for theMinistry of Water Development, the Ministry of Local Government, and the

-32-
Ministry of Works, Housing and Physical Planning. Although somecoordination was maintained in the past by assigning the same staff membersfrom MFP to the different working groups, the latest alignment ofresponsibilities has broken this connection. Given the multi-sectoralnature of urban development, there is a valid argument for establishing acommon Sectoral Planning group for closely related subjects such as thosehandled by the urban-related ministries. As programs of urban developmentoften involve several agencies, this arrangement appears essential toensure that the Forward Budget exercise, intended as a management tool,does not deteriorate into a routine exercise.
B. The Investment Planning Process
3.13 Because of the number of agencies involved in the planning andimplementation of urban development projects, it is helpful to define anexplicit framework for coordination. The inter-ministerial frameworkpresented in this section draws together the tasks required of theprincipal ministries, parastatals, district development committees, and thelocal authorities. By focusing on the sequence of coordination, theframework provided here should remain valid even if, as is likely in anyministerial-type government, particular tasks and departments are laterreshuffled to different agencies.
3.14 Although the role of local authorities may appear obvious in adiscussion of urban development, the "prime client" nature of localauthorities is important to remember in a discussion of institutionalarrangements, as central Government decisions have often been made to thedetriment of this relationship. Because of this, the institutionalarrangements for urban development planning, the preparation of schemes,and the monitoring of implementation should recognize the local authorityas the starting point of the investment process. This process will have torecognize the limitations of existing local authorities and work within aflexible framework to develop their capacities. Thus, major municipalitiessuch as Kisumu, Eldoret, and Thika may have the technical ability as wellas the volume of investments to sustain project preparation andimplementation responsibilities internally. The role of the centralGovernment agencies for these municipalities should therefore consist oftechnical review and oversight, as well as playing an advocacy role for themunicipalities in the Forward Budget process. Smaller local authoritieswill generally need greater technical assistance from central agencies, andmay in some cases need to turn all itfplementation responsibility over to acentral agency. This type of flexible support role has been adopted by anumber of agencies which deal with local authorities, including theNational Housing Corporation and the Ministry of Water Development. Whatis required is not only a continuation of this facilitating role, but alsoan explicit recognition of the role of the local authorities in theinvestment planning process.
3.15 Chart 3.1 presents a framework for the coordination of urbandevelopment planning which is based on the objectives discussed earlier.The essence of the process is that it uses the urban area as the startingpoint and the local authority as the principal client. Several points areworth noting with respect to this framework. First, it calls for the

-33-
CHART 2: A PROCESS FOR DEVELOPING A PROGRAM OF URBAN SERVICES
Monitoring andMLG Evaluation
| Concerned | tatal | Implementationor or Local Authority Operation andMinistry ~~~~~~~~~~~ ~ ~~~~~MaintenanceI
+~~~~~~~~MLG or Formal Approval
Appropriate Ministry of Loan Sanctio
Inter-Ministerial inclusion of
Committee, Forward Budgetand MFP ProcessI
JCC (MLG, MWHPP,Local Authority, NHC, or Approval of City/Urban
other parastatal or Department Area Development Progco ncerned )
Financial Analysis anMLG Relation to LocalAuthority
________ j j ~~~~~~~BudgetJ
Initial Review of tDistrict Schemes and
Development 1 Aggregation at Urban +Committees Area Level _
Provincial mf o rnca Cosutats orlZaT rDevelopment SchemesAwistance or or or |uLocal (for urban services
[ nitsnAthrte and facilities)
sPh ycals 1Planning or Local Authorities DevelopmentDartment Plans
Direct Responsibility- -- ~- Feedback Responsibility
World Bank-23729

-34-
preparation of a development program for urban services and facilities,either by the local authority if staffing is available or by a Governmentagency or consultant if necessary.46/ The purpose of this developmentprogram is to define in preliminary detail a set of investment proposalswhich would be consistent with the economic potential of the urban area andthe needs of the local authority. The focus of the planning exercise wouldnot be on the traditional land-use/master planning approach, but ratherwould emphasize the urban infrastructure and other facilities needed by thetown to accommodate its expected growth. As such, the plan would considerimprovements in basic trunk infrastructure such as water, sanitation, androads, and also related services such as solid waste disposal, communityfacilities, schools, and maintenance equipment. Making the local authorityresponsible for preparation of the program would strengthen the commitmentof the local community and provide for the development of localinitiatives, as indicated in the INSTITUTIONAL objective discussedpreviously. In addition, review of the proposals at the level of the DDCshould help to improve the coordination of rural and urban developmentplanning at the local level.
3.16 Many of the local authorities, at least at the level of themunicipal and town councils, can be expected to be able to prepare anindicative statement of their investment priorities. The process could beassisted by the establishment of provincial technical assistance units orby the use of consultants. However, for specialized investments where thelocal authorities do not have an internal capability, it will often benecessary to provide direct access to specialized assistance from therelevant technical ministries. For example, NHC has four different methodsof sharing responsibility for project planning and implementation with thelocal authorities, each of which entails a different division of tasksbetween NHC, the local authority, and/or consultants. In order toincorporate this aspect of project preparation into the investment planningprocess, Chart 3.2 presents a modification of Chart 3.1 for the developmentof housing programs. A similar chart could be prepared for water andsewerage programs involving MWD. The main point is that differenttechnical ministries can be involved in the initial project identificationand preparation stages without modifying the investment planning process inany significant way.
3.17 After the preparation of the initial project proposals and reviewby the DDC to ensure coordination with other district-level investments,the proposed planning process provides for a financial review by MLG in allcases where the investment is to be financed by a debt obligation on thelocal authority. This stage is provided for in the Local Government Act,which requires local authorities to obtain a loan sanction for everyproposed investment. However, the current process considers the financialviability of the projects on a case-by-case basis only. What is perhapsmore important is to determine the impact of the package of investment
46/ This process has been initiated by MLG with the preparation ofguidelines for local authorities to prepare an individual "LocalAuthority Development Program," in connection with the planningexercise for the 1984-88 National Development Plan.

-35-
CHART 3.2: A PROCESS FOR DEVELOPING HOUSING PROGRAMS
Housing Policy
Guidelines, MonitoringMWHPP and Evaluation,
Indicative HousingPrograml
|7,~I] | Local |I| Implementation, Operation | |Or Authority and Maintenance
l~~~~~~~~~ *MLG 4 Formal Approval I
_ _ _ _ _ of Loan Sanction l
Inter-Ministerial Committee, Inclusion in Forward l
and MFP Budget Process
JCC (MWHPP, Determine FundingMLG, NHC, Arrangements;
Local Authority Inclusion in NationalHousing Program
Financial ReviewandM LG | Relation to Loca il
Authority Budget
Preparation of Housing
Schemes to be takenup by the Public Sector
(including FinancialAnalysis)
Local Authoriti'es, NHC, oIdentification of
or l b | Housing Program for the - 4Consultants Medium Term (5/6yr)
Housing Needs, l
Supply Analysis Jfor
Given Urban Area
- Direct Responsibility- - - Feedback Responsibility
World Bank-23730

-36-
proposals on the local authority's overall financial position. This couldbe accomplished by a strengthening of the financial review procedures ofthe Local Government Loans Authority (LGLA), a topic which is discussed inmore detail in Chapter IV.
3.18 Following the financial review by MLG, the investment proposalswould be reviewed by a Joint Consultative Committee (JCC). Members of theJCC would include MLG in its oversight role for local authorities,technical ministries such as MWHPP and MWD, plus representatives of theparticular local authority whose investment program is being reviewed. TheJCC would be responsible for reviewing the internal consistency of theproposed investment program as well as the expected impact on the localauthority's financial position, thereby satisfying the MICRO objective ofthe planning process discussed earlier.
3.19 Given the constraints on urban investment funds in Kenya, thecrucial part of the investment planning process is to relate the proposedprograms to the overall availability of funds. It is suggested that thisshould be carried out by an Inter-ministerial Committee at the level of thePermanent and Deputy Secretaries, which would work with MFP in the ForwardBudget process. The Inter-ministerial Committee would be expected to playan advocacy role for urban development projects and would ensure that thefunds necessary to support an integrated program of urban investments areprovided in the sectoral budgets of the different ministries. Conversely,the Inter-ministerial Committee would also provide a forum to ensure thatthe scaling back of projects would be reflected on a consistent basis inthe budgets of the various ministries. To give an example, theInter-ministerial Committee would ensure that a decision to postpone awater supply project is reflected in the scaling back of low-income housingprojects in that town until water becomes available. This step of theinvestment planning process would achieve the MACRO objective which wasdiscussed above.
3.20 Until now, the description of the planning process has emphasizedthe planning for new investments. However, this framework is alsoapplicable and perhaps even more useful for monitoring the progress ofexisting investments. Used in this way, the process would be initiated bythe regular submission of progress reports on projects undertaken by thelocal authorities.47/ The JCC would review these reports and arrange foraction to be taken on any matter which required coordination between acentral government agency and the local authority. An additional task ofthe JCC would be to monitor progress on resolving past issues which hadbeen raised in previous project reports. This would help overcome one ofthe current problems with central-local relationships, which is a lack of
47/ This procedure need not be applied for small investmentsmanaged wholly by the local authority, such as small pieces of roadconstruction. However, it could be usefully applied for largerprojects such as low-cost housing schemes which require a significantamount of liaison between the local authorities and the centralgovernment agencies. It would also apply to donor-financed projectswith their greater requirements for regular reporting.

-37-
consistent follow-up on issues which have been previously raised. Byreviewing project performance across several towns, the JCC would be in anexcellent position to spot problems which are consistently hamperingimplementation. These issues could be raised to the Inter-ministerialCommittee for discussion and resolution at the senior level ofdecision-making. The Inter-ministerial Committee would also provide aforum for monitoring the cash flow implications of the urban investmentprogram and could take steps to ensure that anticipated disbursements onthe investments are within the targets established in the DevelopmentEstimates. Finally, the project monitoring and evaluation function whichhas been included in the investment process would provide feedback on theexperience with various projects. This would constitute a valuable"learning by doing" resource which would improve the efficiency of urbaninvestments over time.
3.21 One of the main virtues of the proposed process is that it isrelatively simple and internally consistent with the existing institutionalframework which operates in Kenya. Because the urban investment program isexpanding and reaching out to more local authorities on a spatially exten-sive basis, it is necessary to formalize these procedures to ensure thatconsistent information is provided to key decision-makers on a timelybasis. This will require a careful detailing of the various steps in theprocess, including the format and information content of forms to be sub-mitted by the local authorities, the timing of the review process and thecomposition of the various committees, and the procedures for summarizinginformation at each step and presenting it for decision at the next levelof review. The next two sections provide back-up discussion of thisprocess, with section C focusing on the current and proposed taskresponsibilities of each of the major central Government agencies, whilesection D discusses in general terms some of the implementation issuesinvolved in the planning process.
C. Agency Tasks
3.22 Using the investment planning process described in the previoussection, the tasks required of the various central Government agencies canbe defined in more detail. While particular task items may be shiftedbetween agencies, it is felt that the overall institutional strategypresented here is the one most compatible with and supportive of adecentralized focus for urban development.
3.23 The Ministry of Local Government. In the Kenyan framework, theMinistry of Local Government is virtually the "guardian" of localauthorities and wields considerable authority over them. In recent years,MLG has steadily moved from a regulatory position to one of activelysupporting and strengthening the local authorities in their developmentprograms. However, by definition, urban development is multisectoral, andimplementation of Kenya's urban development strategy will involve workingwith many other ministries. Close collaboration is called for between MLGand ministries such as MWHPP, MWD, and various parastatal organizations.Given the present and anticipated resource constraints, it is importantthat priorities for public sector investments in urban areas are sustainedthrough the Forward Budget process. Considered in this light, the majortasks of MLG in the coordination of urban development projects are:

-38-
(a) formulate a program indicating the type of investments, publicand private, required in urban areas over the medium-term periodof 5 to 10 years;
(b) canvass support from other ministries and agencies to promoteeconomic development in the selected urban areas; and
(c) establish and service the Inter-ministerial Committee of agenciesdirectly concerned with urban infrastructure provision to provideguidance to the Forward Budget process.
3.24 At the same time, MLG has an important job in overseeing thefinancial position of individual local authorities. MLG also provides thecapital financing for most local authority schemes (other than housing)through the Local Government Loans Authority (LGLA). At present, the LGLAis more of a conduit for the MLG development budget rather than an activefinancing agency. Within the existing framework of enabling legislation,it is certainly feasible to refashion LGLA's work so that it can take amore active role in the financial appraisal of local authority investmentproposals. This would facilitate an integrated view of the capital andrecurrent financing needs of local authorities. Within this framework, thetasks of MLG in working with local authorities should be:
(a) provide guidelines for local authorities to prepare proposals forinfrastructure and community facilities;
(b) encourage local authorities to prepare city-wide capitaldevelopment programs;
(c) assist local authorities to evaluate the impact of the capitaldevelopment program on their financial position, both for capitaland recurrent budgets;
(d) integrate the various local authority investment proposals intothe Ministry's development budget;
(e) organize technical assistance to local authorities; and
(f) formulate and implement training programs for MLG andlocal authority staff.
3.25 Ministry of Works, Housing and Physical Planning. Housing is animportant sector of urban development. In recent years, there has been ashift in emphasis from traditional high cost housing to affordable andrealistic shelter programs for low-income families. However, an assessmentof the housing program points to the need for new initiatives (see ChapterV). The role of MWHPP in formulating housing policy is therefore veryimportant. Arising from this, the Ministry's tasks relating to housingare:
(a) provide housing policy guidelines to NHC, local authorities, andother organizations concerned with housing;

-39-
(b) formulate housing programs indicating the nature and sizeof public investment over the medium-term and integrate theseinvestment proposals into the Forward Budget process;
(c) promote mechanisms for the effective participation of the privatesector in providing housing;
(d) encourage NHC and HFCK to establish forward planning proceduresand assist these agencies to obtain funds both from governmentsources and capital markets;
(e) monitor and evaluate housing programs to assess the usefulness ofdifferent approaches; and
(f) promote research and training in housing.
3.26 Because of the Government's emphasis on shelter projects as ameans of providing basic services to the low-income population, there hasbeen a tendency in discussions of urban policy in Kenya to equate shelterprojects with urban development planning. In practice, this can promote an.enclave" approach to investment planning, where residents in a particularproject area may receive services (schools, health centers, seweragefacilities, etc.) far in excess of the standards prevailing in much of thecommunity. While it is sound practice to make provision for the eventualextension of various urban services in all areas, a city-wide approach tourban development planning may provide a broader overview of servicedeficiencies and perhaps a more equitable distribution of scarce investmentresources across the entire community.
3.27 Within MWHPP, the Physical Planning Department (PPD) has theresponsibility for preparing and updating spatial development plans foralmost all urban areas in Kenya.48 / To do this, the PPD has assembled asizeable group of experienced professional staff who have established goodworking relationships with local authorities in preparing town plans andadvising local authorities and other government agencies on issues of landuse. Over the years, the PPD has attempted to broaden its approach fromthe purely physical aspects of land use to include a concern with theeconomic and socio-demographic aspects of urban development. Nevertheless,the frequent reshuffling of PPD during cabinet realignments has hinderedthe work of the Department in integrating land-use plans with broaderaspects of urban development. Therefore, consistent with the mandate ofMWHPP for urban development policy, the PPD has a responsibility to workwithin the JCC to ensure that its expertise in spatial planning isintegrated with other concerns of urban development planning.
3.28 Ministry of Water Development. Extensions to water supply andsewerage systems are one of the key elements in determining the spatialpattern, intensity, and types of urban land use. Many aspects of urban
48/ Nairobi and Mombasa have their own Town Planning Departments to dophysical planning.

-40-
development planning must be coordinated with the planning of water andsewerage systems, from the development of low-income housing estates to thelocation of new industrial areas. In addition, water and sewerageinvestments can be a large element of a town's capital program, and thefinancial planning of these investments must be integrated into the overallfinancial position of the local authority. On this basis, the role of MWDin urban development planning is:
(a) maintain and operate water systems in urban areas falling underthe direct control of the Ministry;
(b) provide technical assistance and training to the staff of localauthorities involved in operating their own water systems;
(c) provide technical advice to MLG and the JCC on the planning ofwater and sewerage investments;
(d) liase with NHC and PPD on the land-use planning aspects ofextensions in urban water and sewerage networks;
(e) plan strategic investments in national water supplies to providefor the anticipated growth in urban and rural populations;
(f) develop pricing and financial policies for water investments andbe an advocate for sound financial management in the sector; and
(g) integrate proposed water and sewerage investments into overallurban investment profiles through the Inter-ministerial Committeeon urban development.
3.29 Coordination with Other Agencies. This discussion hasconcentrated on local and central Government agencies which are involved inthe provision of urban infrastructure. However, as Chapter II brought out,urban development requires more than investments in housing and otherservices. In particular, urban employment is likely to remain a majorproblem throughout the next two decades and beyond. Because of differencesin outlook, it is unlikely that agencies such as KIE will ever be closelyinvolved in the planning of urban development. Still, urban employmentconcerns are too important an aspect of urban development to permitinstitutional alignments to allow them to be neglected. A logicalalternative is for MLG to develop an expertise in urban employmentconcerns, first by compiling data and undertaking studies and later in thearticulation of policy directions and legislation to assist localauthorities in efforts to support urban employment concerns. This rolecould help local authorities in meeting their responsibilities for economicdevelopment planning which have been established through the districtplanning focus.
D. Implementation
3.30 The institutional structure which has been presented in thischapter relies as much as possible on the present responsibilities ofexisting agencies in Kenya. The tasks of the various sectoral ministries

-41-
and parastatals and the local authorities remain much as they are in thecurrent system. What is new is the addition of an explicit mechanism forthe coordination of urban investments, a change which is designed to givesubstance to the recommendations of the Working Party on GovernmentExpenditures.
3.31 By necessity, responsibility for urban investment coordinationwill call for some institutional changes. The Development Department ofMLG was established in 1979, and it has played a key role in working withMWHPP and the local authorities in the implementation of various projects.An important constraint on the expansion of this Department will be thedifficulty of retaining experienced personnel in Government service, aswell as the overall constraint on the expansion of staffing due to theGovernment's very tight financial situation. For this reason, MLG willhave to work with other Government agencies in establishing particularfunctions. For example, MWHPP has recently established a ProgramManagement Unit to coordinate the implementation of low-income shelterprojects, and it will be necessary for both of these agencies to worktogether to ensure efficient monitoring of urban investment programs.Finally, the important function of the financial review of proposed urbaninvestments can probably best be accomplished within the structure of LGLA,an option that is discussed in more detail in the next chapter.
3.32 Finally, it goes without saying that organizational structuresare at best enabling mechanisms and depend wholly on the staff comprisingthem. Staff training and upgrading of skills is a theme recurring in alldiscussions about administration in Kenya. Compared to most other Africancountries, Kenya's experience in the provision of urban services and in therunning of local authorities has been significant. A considerable pool ofsenior administrators is also available in the Government. Various donorshave recently been involved in an assessment of training needs and theformulation of training programs for staff in government, parastatals andlocal authorities in the field of housing and urban development. Suchefforts need to be encouraged and supported if the Government's urbandevelopment strategy is to succeed.
IV. LOCAL AUTHORITY SERVICES AND FINANCING
4.01 Local authorities are the foundation for local participation inurban development in Kenya. Until now the larger local authorities havebeen able to maintain a reasonable level of services to their residents, atleast to those living in authorized housing developments. However, becauseof the continuing decline of their financial base in relation to theirobligations, the ability of local authorities to operate as independententities is becoming increasingly constrained. It is the purpose of thischapter to set out the major factors contributing to this situation, aswell as to make suggestions for possible improvements.
4.02 Various Government policy statements, including the report of theWorking Party on Government Expenditures, have affirmed the positive roleof local authorities in providing for urban development. For example, the

-42-
1979-83 National Development Plan set the following objectives for localgovernment during the plan period:
(a) Improvement in the finances of local authorities so that they canfinance most of their own requirements for shelter andinfrastructure as well as meet maintenance and other recurrentexpenses. This objective will be achieved through fiscal andmanagement reforms with appropriate training of staff. The goalwill be to restore fiscal autonomy similar to that which existedprior to 1970, within the municipalities and town councils.
(b) To develop a grant-in-aid system to assist local authorities withinadequate resources.
(c) To promote democratic local government and public participationthrough elected representatives.
(d) To continue to train elected representatives for democraticleadership, and to train staff members in all categories ofskills required to administer local authorities efficiently.49 /
4.03 In reality, these policy statements have been honored more in thebreach than in practice. A number of Government committees and otheragencies over the past decade have examined the problems of localauthorities, with all of them coming to the conclusion that localauthorities need to be strengthened.50/ Despite these recommendations,the Waruhiu Committee in 1980 found so little progress had been made inimplementing reforms that it merely restated its agreement with therecommendations on local authorities made by the Ndegwa Commission and theNyaga Committee almost ten years earlier. While this ambiguity about therole of local authorities is perhaps understandable during a time when thecentral Government has been expanding its role in the economy, thelong-term implications of continued Government inaction on needed reformswill be for local authorities to become increasingly marginalized in theirsupport role for the Government's economic development strategy.
4.04 What is at issue is not whether the functions of localauthorities should be significantly expanded, but whether they can maintain
49/ "1979-83 National Development Plan", p. 455.
5°/ See, for example:(i) "The Report of the Public Service Structure and Remuneration
Commission, 1970-71" (Ndegwa Commission);(ii) "The Report of the Nyaga Committee," 1973;(iii) "An Analysis of Local Government Finances in Kenya with
Proposals for Reform," IMF Report, 1976;(iv) "Report of the Civil Service Review Committee, 1979-80" (Waruhiu
Committee).(v) "Report and Recommendations of the Working Party on Government
Expenditures," 1982, op. cit.

-43-
their current responsibilities in the face of a growing imbalance betweentheir obligations and their resources. It is easy to cite deficiencies inthe services provided by local authorities and their increasing dependenceon the central Government. It is less easy to propose reforms necessary toreverse this process which are also politically acceptable. For example,there is no question that the revenue base of local authorities was erodedby the Government's takeover of the Graduated Personal Tax (GPT) in1973.51/ As a result, the councils which were financially the most soundin the 1970s now register at best a marginal performance in their recurrentbudget. Where previously the local authorities were able to generatesubstantial development funds on their own, they are now almost totallydependent on the central Government development budget. Nevertheless, noconsensus has developed on reforms necessary to improve the revenueperformance of local authorities, as indicated by the decision of thecentral Government in 1984 to terminate several local authority grants thatwere introduced to compensate for the loss of the GPT. Due to continuingGovernment indecisiveness on the issue of local authority revenues, it isfair to say that the financial position of local authorities currentlyrepresents the most important constraint on urban development activities inKenya.
4.05 Section A of this chapter provides an overview of past trends inthe revenues and expenditures of local authorites in order to put theirperformance into perspective. Section B provides a more detailed analysisof the recurrent financing of the larger local authorities in order tohighlight individual differences in adaptation to an increasinglyconstrained environment and to evaluate various possibilities forimprovements. Section C provides suggestions for improvements in localauthority capital financing which would assist local authorities infulfilling the important role assigned to them in Kenya's urban developmentstrategy.
A. Overview of Local Authority Revenues and Expenditures
4.06 In the evolution of central-local relationships in Kenya, theyears 1969, 1973, 1978 and 1984 mark critical changes. In 1969, theGovernment passed the Transfer of Functions Act which transferredresponsibility for primary education, health services, and roadmaintenance, as well as revenues from the GPT, from all local authoritiesexcept the seven largest municipalities to the central Government. In1973, the Government completed the abolition of the GPT for the largestmunicipalities (with effect from January 1, 1974) and replaced it with acompensating grant which was gradually reduced over time. The loss of thisimportant revenue source for municipalities without an off-settingreduction in their responsibilities forced the Government in 1978 tointroduce several specific grants to cover the cost of services mandated bythe central Government. Of these, the most important were the grant tocover teachers' salaries and the drugs and dressings grant to cover thecost of medical supplies which the local authorities are required to
51/ The GPT was payroll tax which was easy to collect (as it was levied onemployers) and provided significant elasticity in revenues in responseto economic growth.

-44-
provide free of charge. Finally, in 1984 in response to continuingbudgetary pressures, the central Government eliminated all grants to localauthorities except for the grant for teachers' salaries. As a result ofthese changes, the local authorities have been caught between rapidlyescalating costs of services due to inflation and rapid urban growth, whilethe revenue base to support this growth has been steadily eroded.
4.07 Expenditures. The main activities and services which localauthorities are involved in can be grouped as follows:
(a) Control functions - such as land-use control, building by-laws,trading and other licenses, public health, public nuisances,traffic control, town planning, etc.
(b) Provision of facilities and services - water, sewerage, roads,drainage, street lighting, health centers, education, solid wasteremoval, recreation facilities, cemeteries, housing, markets,commercial and industrial premises, slaughter houses, etc.
As was discussed above, municipalities are involved in most or all of theseactivities. The smaller town and urban councils have diminishingresponsibilities depending on their relative strengths and the particularneeds of their jurisdiction.
4.08 There has been a fairly substantial growth since 1972 in thelevel of expenditures by local authorities. Table 4.1 provides a breakdownof the trend in total expenditures over this period by type of localauthority. We see that total expenditures by local authorities increasedfrom K£ 22.42 million in 1972 to K£ 78.15 million in 1981, a percentageincrease of 14.9% p.a.52/ While significant, this rise was smaller thanthe growth of total GDP(16.6% for the period) and much smaller than thegrowth in central Government expenditures (21.4%).53/ Given that pricesincreased during this period in excess of 14% p.a.5 7/ and urban populationgrowth was on the order of 7%, it is clear that reaT expenditures percapita by local authorities have declined sharply over the past decade.
4.09 Table 4.1 also shows that while Nairobi City Council hasdominated local authority expenditures, accounting for over half of totalexpenditures throughout the period, its relative share fell slightly from
52/ Growth trends in this section are computed for the periods 1972-81 or1975-81, because the provisional revenue data for 1982 and 1983 arenot considered to be reliable.
53/ Growth in central Government expenditures is based on FY 72/73 toFY 80/81. To the extent that transfers to local authorities have beenincorporated into central Government expenditures, this comparison isslightly inflated, although not enough to change the conclusion.
54/ Based on the change in the relative consumer price index in Kenya,International Financial Statistics and Direction of Trade, IMF.

-45-
59% of the total in 1972 to 56% in 1981. The smaller town and countycouncils showed the highest rate of growth of expenditures, which mayreflect the diversification of urban growth into secondary urban centers.
4.10 Table 4.2 provides the breakdown of expenditures by type ofservices for municipal councils over the period 1975-83.55/ From this, wesee that the most important categories of expenditure in 1981 were primaryeducation (14% of total expenditure), housing estates (10%), sanitaryservices (10%), administration (11%), water undertakings (16%), and health(9%). Interestingly enough, this percentage breakdown of expenditures in1979 is very similar to the pattern which existed in 1964, just afterindependence, when the percentage distribution for municipalities waseducation (14%), housing (11%), sanitary services (13%), administration(10%), water undertakings (10%), and health (8%). The most significantchange in expenditure was for roads, which went from 13% in 1964 to 7% in1981.
4.11 Table 4.3 provides an analysis of recurrent and capitalexpenditures by municipal councils by input category. From this, we seethat labor costs dominated the expenditures of municipal councils,accounting for 63% of recurrent costs in 1981. Purchases of goods andservices accounted for another 34% of recurrent expenditures, and varioustypes of transfers for the remaining 3%. Labor costs increased at lessthan the rate of inflation during the period 1975-81, despite the growth inthe establishment sizes, due to Government policies which restrained therate of wage increases in the public sector. Turning to capitalexpenditures; new capital investments accounted for approximatelythree-quarters of the capital expenditures for municipalities, while loanrepayments and transfers accounted for the other quarter.
4.12 Table 4.4 presents a similar analysis of expenditures for townand county councils by type of input. From this, we see that thebreak-down of recurrent expenditures in town and county councils isroughly similar to municipal councils. Recurrent costs have grown at aslightly faster rate than for municipalities, while the rate of growth ofcapital expenditures has been slower than for municipalities.
4.13 A final way of gauging the growth of expenditures by localauthorities is by comparison with the central Government. In 1964 and1969, the total expenditures of local authorities including both recurrentand capital expenditures were about 25% of the size of central Governmentrecurrent and development expenditures. By 1975, the ratio of expendituresby local authorities had fallen to 8% of central Government expenditures,and by 1979, it had been further reduced to 7.4%. These figures confirmthat the major growth in size and responsibilities of the public sector hasbeen with the central Government rather than the local authorities. As aresult of these trends, the share of the local authorities in gross capitalformation in the public sector fell from 15% in 1969 to approximately 5% in1975 and 1979.
55/ A change in the definition of categories in the official statisticsprevents extending the series back to 1972.

-46-
4.14 Revenues. In order to finance their expenditures, localauthorities have had access to a variety of revenues. The recurrentexpenditures of the councils are met from three principal sources:
(a) General revenues - primarily the property tax (rates) which islevied mainly by municipalities and town councils, plusagricultural cesses imposed by county councils;
(b) Specific fees and charges - revenues collected forspecific services provided by the local authorities (such aswater tariffs and housing rents) and charges arising from localauthority control functions (business licenses, etc.); and
(c) Government grants - which until recently consisted of:
i. the GPT Compensating grant, introduced in 1974 to compensatemunicipalities for the loss of the Graduated Personal Tax;
ii. the Teachers' Salaries grant, introduced in 1978 to coverthe cost of teachers' salaries on the grounds that thesalaries are negotiated directly with the centralGovernment;
iii. the School Fees grant, which had been increasing over timeto compensate local authorities for the loss of revenues asschools fees were progressively abolished for primaryeducation; and
iv. the Drugs and Dressings grant, to compensate localauthorities for health supplies which they are required toprovide free of charge.
As noted above, these grants have now been fully eliminatedexcept for the grant for teachers' salaries.
4.15 Capital expenditures of the local authorities are met frominternal cash generation and by loan funds, with the two principal sourcesfor loans being LGLA and NHC. In addition, Nairobi City Council isauthorized to issue its own stock (debt obligations) with the permission ofthe Ministry of Finance and Planning, and other local authorities mayobtain bank loans with permission of the Ministry of Local Government.
4.16 Table 4.5 presents the trends in recurrent and capital revenuesof municipalities for the period 1972-1983. Overall, revenues under thecontrol of the local authorities (taxes and sales of goods and services)have grown at a rate of 13% p.a. over this period, less than the rate ofinflation but reasonable considering the relatively inelastic tax baseavailable to the local authorities. Government grants decreased at a rateof 9% p.a. between 1974-81, and this decline would be even greater if itwas measured against the potential level of GPT which would have beencollected by the municipalities. Finally, while loans raised by localauthorities grew at a rate of 13% p.a. during the period 1972-81, virtuallyall of this increase took place in 1981 due to large disbursements on

-47-
donor-financed projects. Overall, it is clear that the resources which thecentral Government has made available to local authorities have grown at arate significantly below the rate of inflation and have provided no marginfor urban population growth.
4.17 Table 4.6 presents the revenue trends for town and countycouncils for the period 1975-83. The primary difference as compared tomunicipal councils is the greater extent to which town and county councilsrely on their own direct and indirect taxes for their revenues (54% ofrecurrent revenues versus 43% for municipalities in 1981). This ispartially explained by the fact that functions which were financed bygrants for the larger municipalities are operated directly by the centralGovernment for town and county councils. Table 4.6 also reflects the heavyreliance of county councils on agricultural cesses for their revenues. Afew councils, particularly those in coffee growing areas, do very well fromthe collections of cesses and probably collect more revenues than areactually needed, given the limited rage of functions carried out by thecounty councils. On the other hand, many county councils which do not haveaccess to a good base of agricultural cesses are chronically deficient inrevenues. The often chaotic financial affairs of the county councils issometimes used as an argument against the current system of localauthorities in Kenya, even though the roles and responsibilities of thecounty councils and the more urban-based municipal and town councils aredrastically different. The role of the country councils is expected tobecome even more limited as the District focus strategy is implemented,giving a stronger role in development matters to the District DevelopmentCommittees.
4.18 Staffing Situation of Local Authorities. Besides their financialproblems, several other factors which are often cited as contributing tothe difficulties facing local authorities include their managementshortcomings and their inability to retain qualified and competent staff.Local authority salaries, although generally competitive with the centralGovernment, are not so relative to the private sector. This causes severeshortages for skill groups heavily in demand by the private sector,particularly for technical staff such as engineers, surveyors, landvaluers, and financial staff. While these problems also affect the centralGovernment, to some extent the ministries have been able to compensate bythe use of limited term expatriate advisors, an option which is generallynot feasible for the local authorities. The result is that projectimplementation capacity of local authorities is severely constrained, aproblem which has caused serious delays in the implementation of variousdonor-financed projects.
4.19 Another factor which has been cited as contributing to thedifficulties experienced by the local authorities in retaining qualifiedstaff has been the influence exercised by elected councilors on theengagement, advancement, and dismissal of staff. This factor has led tomany councils being over-staffed at the lower levels, with Nairobi CityCouncil being most often cited in this regard. Because of these problems,legislation was recently enacted to bring all senior and professional staffof the local authorities, including the town clerks, under the jurisdictionof the Public Service Commission, which oversees the employment of centralGovernment personnel.
-48-
4.20 Conclusion. In summary, the ability of local authorities tomaintain their financial position within an increasingly constrainedeconomic environment has been increasingly hampered by decisions of thecentral Government which have increased their responsibilities withoutproviding an adequate increase in their revenue base. As a result, theexpenditure patterns of the local authorities have not been able to keep upwith inflation and provide for the rapid population growth which hasoccurred within most urban areas. It is clear that local authorities willnot be able to sustain their potential role in providing for urban growthunless they can be assured of an adequate resource base. For this reason,the next two sections of this chapter will focus on issues of localauthority financing. The next section provides a discussion of therecurrent financing position of the seven largest municipalities in Kenya.
B. Recurrent Financing of Local Authorities
4.21 The financial system used by local authorities is based upon theU.K. model of local government accounting. This system provides for aseparation of recurrent and capital revenues and expenditures by themaintenance of separate funds to handle major activities of the council.Most recurrent expenditures and income are handled through the General RateFund (GRF), the only statutory revenue fund specified in the LocalGovernment Act. In addition, most of the local authorities maintainseparate funds to cover activities such as water supply, public housing,trading services, abattoirs, and renewal of equipment.
4.22 Financial Performance. The financial performance of most localauthorities has been poor. Table 4.7 provides a summary of the position ofthe GRF the years 1980-82 for the seven largest municipalities, prior tothe abolition of most Government grants.5 6 / The most interesting featureof this table, aside from the overwhelming dominance of Nairobi in allcategories of revenue and expenditures, was the consistently weak positionof the GRF in most of the municipalities. Only two of the councils (Nakuruand Thika) expected to maintain a marginal surplus position in their GRFover the three-year period. The remaining local authorities expected tosustain deficits, and the trend was generally for these deficits to grow.
4.23 In order to maintain themselves financially in the face ofpersistent deficits, most of the local authorities have abandoned thepretense of separate fund management. A few of the local authorities hadbuilt up surpluses in their general reserve funds, which were being drawndown to cover the deficits in the GRF (see Table 4.8). The remaining localauthorities covered their recurrent deficits by tapping surpluses in fundssuch as water supply and housing.
56/ Because of a lack of uniformity in the presentation of financialaccounts, the various categories of revenues and expenditures are notnecessarily fully consistent across local authorities. Also,estimated budget figures should be treated with caution, as experiencehas shown that they can be unreliable as a guide to actual budgetperformance.

-49-
4.24 While looked upon as a necessity by the financially-strappedlocal authorities, the practice of using surplus balances from funds suchas water and housing amounts to little more than "begger your nextgeneration" in an economic sense. The reason for the establishment ofseparate capital funds is to permit the generation of surplus balances tocover replacement and expansion of the existing capital stock.57 / Infact, the basic rationale of the Local Government Loans Authority, which isdiscussed in the next section, was to permit local authorities to holdtheir financial surpluses in an interest bearing account, while LGLA wouldloan out the funds deposited with it to other local authorities in need ofcapital funds. This arrangement, which previously allowed the local localauthorities as a group to generate most of their required capital funds, nolonger operates in this fashion because the local authorities have divertedany surpluses to cover deficits in the GRF's. To the extent that LGLA hasfunds to lend, they are taken from the Government's overall developmentbudget at the expense of other needed investments. In effect, the localauthorities are covering their recurrent expenditures by running down theircapital stock, leaving a capital deficit which will eventually have to becovered from other sources.
4.25 Even the nominal positions of the various funds shown in Table4.8 overstate the true financial situation of the municipalities. Thesystem of local authority accounting used in Kenya realizes revenues asthey are accrued, rather than collected. Most local authorities havesubstantial arrears in their collection of rates and other fees. In orderfor the budgeted accounts to have any relation to their nominal cashposition, it would be necessary to include a provision in the estimates for"contributions to working capital in anticipation of collection ofrevenues." No local authority includes this provision in its estimates,with the result that most of the surplus balances of the various fundsactually consist of accounts receivable of dubious merit. The MLG hasrefused requests by local authorities to write-off portions of thereceivables which the local authorities deem to be uncollectable.58/ As aresult, the budget estimates submitted annually by the local authoritieshave little relation to the actual cash position of the various funds.
57/ This principle, if fully applied, would require the local authoritiesto price services at their long-run marginal cost. Most localauthority services are priced to cover average historical capital andoperating costs and perhaps to generate a small surplus. Only Nairobihas priced its water supply at a level close to long-run marginalcost, and this permitted Nairobi's Water Fund to generate largesurpluses which were eventually used to cover deficits in the GRF.
58/ A prominent example of this is the fact that most local authoritiescarry large arrears on their books for rates owned by Kenya Railways.These accumulated balances can be very large, sometimes amounting tohalf a year's total rate bill for the local authority. Given the veryweak financial position of Kenya Railways, there is little likelihoodthat these arrears will be paid; moreover, Kenya Railways is disputingthe claims. Despite this, most local authorities continue to includerates due from Kenya Railways in their budget estimates and fundbalances.

-50-
4.26 The large amount of arrears in rates is partially caused by alack of political commitment within the local authorities to enforcerevenue collection. Another important reason, however, is that the legalprovisions available to enforce collections are outmoded and difficult toimplement. The steps required to process a case of arrears are cumbersomeand time consuming. In addition, the penalty for arrears, which is fixedin the Rating Act, is below the current interest rate for commercialborrowing, making it advantageous for rate payers to delay paying theirrates as long as possible. Some of the local authorities have engagedprivate solicitors to process rate cases, but legislative reform of theRating Act would be a more efficient way of improving collections.Finally, various central Government agencies, including parastatals, havebeen among the slowest rate payers, over which the local authorities havevery limited control.
4.27 The local authorities are required to submit their budgetestimates annually to MLG for approval. In practice, there is a great dealof dissatisfaction with this process. The focus of the budget reviewprocess has often emphasized individual items of expenditure rather thanthe overall financial position of the local authority. The localauthorities complain about arbitrary changes to estimated expenditures anddelays in the approval of estimates, which can cause significant delays inthe issuing of rate notices. At the same time, the Ministry often fails totake effective action about serious financial problems, for example byneglecting persistent arrears run by many councils. Even after theestimates are approved, there is often poor expenditure control and costoverruns by the local authorities are common, despite the fact thatexpenditures in excess of budgeted amounts are supposed to be approved bythe Minister of Local Government. Given the short staffing in MLG, itwould be more effective for MLG to concentrate its efforts on assisting thelocal authorities prepare viable financial plans, while letting expenditurecontrol be covered by the audit process. Unfortunately, local authorityaudits are also significantly behind schedule.
4.28 Recurrent Revenue Sources. Prior to the recent elimination ofmost Government grants, the major local authorities relied upon rates,license fees and user charges, and Government grants in roughly equalproportions for their recurrent revenues. Table 4.9 presents thepercentage distribution of the different sources of recurrent financingavailable to the seven largest local authorities in 1980. Although thetrends are not uniform, there was a tendency for rates to constitute agreater share of revenue for the larger local authorities, withcorrespondingly less emphasis on licenses, user charges, and Governmentgrants. The smaller reliance on grants by Nairobi and Mombasa reflectedthe fact that these municipalities provided a wide range of services whichwere not covered by Government cost-reimbursement grants.
4.29 Property rates are the most important source of general revenuesfor the local authorities. Although the Valuation for Rating Act allowswide flexibility in the basis for valuing property, in practice all localauthorities in Kenya rely on unimproved site value rating, which is basedon the market value of the land only and not on the structures on theland. The Valuation for Rating Act provides for revaluation of property at

-51-
least every five years, but this has proven to be difficult because of ageneral shortage of valuers in the country (only Nairobi and Mombasamaintain their own staff of valuers). As a result, the valuation rolls formost local authorities fell substantially out of date during the 1970s.As a condition of the Bank-financed Second Urban Project, Mombasaintroduced its first updated property roll since 1959 at the end of 1981,and Nairobi introduced its first new roll since 1971 at the beginning of1982. Substantial public outcry resulted from the introduction of the newrolls, but the actions helped establish the principle of revaluation, whichwill assist other local authorities in improving their valuation base.
4.30 Until fairly recently, many local authorities waited until theirperiodic five-year revaluation in order to increase their revenue fromrates. While local authorities are legally entitled to increase their ratelevies (the percentage tax rate which is applied to the valuation base)between revaluations, political considerations have often restrained manyof the councils from taking this action. As a result, the revenue yieldfrom rates could remain essentially static for a five-year period, exceptfor small additions to the rate base from supplementary valuation rolls.Financial pressures due to the effect of inflation on expenditures have nowforced most local authorities to be more flexible, with annual or biannualincreases in rate levies becoming standard practice.
4.31 A number of suggestions have been made to introduce moreelasticity into the revenue yield from rates. One of the most frequentsuggestions has been to change to improved site value rating, which wouldinclude both structures and land in the valuation base. The administrativeproblems of changing to this valuation base are substantial, particularlygiven the shortage of qualified valuers in Kenya. The local authoritieshave been hard pressed to maintain accurate land registration rolls;introducing the valuation of individual structures would be more than thesystem could handle. There are also theoretical reasons for preferring theunimproved site value basis, on the grounds that it is neutral with respectto land development and hence discourages holding land in an unproductiveuse. As an alternative measure, many local authorities in developedcountries have indexed valuation ratings between revaluation periods, usingan index of property sale prices during the year. This change providesautomatic buoyancy in property tax collections geared to changes in landvalues, without requiring the politically difficult step of increasing taxrates. As an additional measure, many local governments have found thatbuilding permit fees can be a lucrative source of revenue. This latterchange would require improvement in the building approval and inspectionprocess to be effective, but these administrative changes may be easier toimplement than extension of the valuation base to include improved propertyvaluations.
4.32 Another possible compromise position on improved site valuerating would be to introduce a tax on the rental value of land andstructures in prime areas of the city, such as the commercial andindustrial zones. This tax would primarily benefit Nairobi and Mombasa,but towns such as Eldoret and Thika with a significant manufacturing basecould also benefit from the tax. On the other hand, because the tax couldreduce incentives for firms to locate in secondary towns, many of the
-52-
smaller local authorities may be reluctant to introduce such a tax. Analternative version of this tax has been introduced by Nairobi, whichimposed differential rate levies on the unimproved site value of land inthe commercial and industrial areas of the city as compared to the levy inresidential areas.
4.33 Another major source of recurrent revenues for the localauthorities consists of various license fees and service user charges.These cover a wide range of activities from hawkers' licenses to ambulancefees, from cesspit cleaning charges to building approval permits. Ingeneral, local authorities have not made maximum use of these charges, andthey represent a source of revenue which could be exploited further.Referring to Table 4.9, it is interesting to note that both Thika andEldoret were able to produce budgets with either a small deficit or asurplus by relying heavily on fees, despite the fact that their revenuesfrom rates were relatively low. On the other hand, Nairobi, with a verystrong rate base, ran a large deficit because the council had not raisedfees for a number of years. To the extent that user charges representpayments for services which directly benefit residents (such assolid waste collection), there is a strong case for ensuring that the feesare adequate to cover the full costs of providing such services. On theother hand, license fees and other indirect charges may not be an equitableway of raising general municipal revenues, particularly if they act todiscourage small-scale entrepreneurs, and certainly they cannot substitutefor an adequate property tax base.
4.34 From this discussion, it is clear that local authorities are notmaking adequate use of the revenue instruments which are already availableto them. In a time of scarce budgetary resources in general, the localauthorities must be encouraged to make greater use of existing taxes andcharges, and the central Government should seek to encourage greaterreliance on and enforcement of local revenue measures. Nevertheless, it isalso true that the current revenue instruments of the local authorities donot provide the elasticity required to cope with inflation and high urbangrowth rates. Revaluation of property every five years and increases inlicense fees and charges will not provide the buoyancy of revenues requiredto allow the local authorities to maintain their present services andexpand them to provide for new urban residents. The local authorities cannot expect to be unaffected by financial cutbacks or be allowed to leaveuntapped any revenue base which is open to them. On the other hand, inimposing financial discipline throughout the economy, the Government shouldseek to avoid jeopardizing its long-term economic development objectives,which should include the maintenance of strong urban local authorities.For this reason, it is necessary to review carefully the logic andimplications of the Government's decision in 1984 to eliminate most revenuegrants to the local authorities.
4.35 The IMF Report in Perspective. The last comprehensive study oflocal authority finances in Kenya was carried out by the InternationalMonetary Fund, in fulfillment of a condition of the credit agreement for

-53-
the Bank-financed First Urban Project.59 / This report has never beenofficially released by the Government, although it has been influential inthe discussions on local authority finances in Kenya. As the financialsituation which generated the IMF report (i.e., the abolishment in 1973 ofthe GPT for local authorities) is similar to the existing situation (i.e.,the recent abolishment of most central Government grants to localauthorities), it is helpful to reexamine the recommendations of this reportas they relate to the current financial circumstances of the localauthorities.
4.36 In point of fact, many of the reforms recommended by the IMFreport were implemented by the Government. At the time the DMF report waswritten, the Government had not instituted the grants to cover the cost ofteachers' salaries and drugs and dressings. With the GPT compensatinggrant being reduced, the municipalities were in a very difficult financialposition, with every expectation of a serious deterioration in theirability to provide services. Therefore, it is not surprising that the IMFreport focused largely on the problems of recurrent revenue sources andthat the remedies suggested were in fact very similar to the actions whichthe Government ultimately introduced. In particular, the mainrecommendation of the IMF report called for the establishment of grants forteachers' salaries and for drugs and dressings, actions which wereinevitable in view of the Government's mandate that these services had tobe maintained.
4.37 Other recommendations in the IMF report and their rationale andcurrent status are:
(a) Gradual elimination of the GPT compensating grant. Ingeneral, the IMF report favored changing Government grants from ageneral purpose to a cost reimbursement basis in order to improvefinancial discipline. While the GPT compensating grant has nowbeen abolished, the recent elimination of the grants for drugsand dressing and school fees means that the Government has notbeen consistent in applying the principle that centrally mandatedservices should be matched by an adequate and defined revenuesource.
(b) Regularization and centralization of the revaluation process.This was agreed as part of the Second Urban Project and has beenpartially implemented. An increase in the number of Governmentvaluers and better coordination with the local authorities wouldbe desirable to fulfill this objective.
(c) No recommendation for the introduction of improved site valuerating, except for a tax on the rental value of commercialproperty in Nairobi and Mombasa. The IMF report rejectedimproved site value rating on administrative grounds. The tax onrental values in Nairobi and Mombasa has not been implemented,
59, "An Analysis of Local Government Finances in Kenya with Proposals forReform," IMF, December 8, 1976.

-54-
but differential rate levies have been introduced in particularareas of the cities.
(d) Other taxes. The IMF report had little to say about otherpossible revenue sources and only briefly mentioned theentertainment tax (small yield), increases in fees, licenses, andother charges (not investigated), and cross-subsidies from thewater and housing funds to the GRF (no firm position).
(e) Budget preparation and approval. The IMF report noted the largediscrepancies which exist between the accrual and the cashbudgets of the local authorities, the lack of uniformity inaccounting practices, and the difficulties faced by localauthorities in maintaining current budgetary procedures.However, the recommendation of the IMF report to put all theaccounts and estimates of the local authorities on a cash basishas been rejected by many financial analysts familiar with localgovernment accounting.60 / The problems discussed in the IMFreport can be addressed by much less drastic changes than aswitch to cash budgeting.
(f) Creation of a Local Government Service Commission and secondmentof chief officers between councils. Chief officers were broughtunder the jurisdiction of the Public Service Commission in 1984.
In addition, the IMF report made similar suggestions for the smaller townand county councils and suggested a more equitable revenue sharing systemfor agricultural cesses.
4.38 In general, therefore, we see that the major thrust of the IMFrecommendations was to establish a clearer definition of local authorityservice requirements and to ensure that each service was matched by anappropriate and adequate revenue source. Where a service was purely localin nature (e.g., refuse collection, markets, water supply), the localauthority was expected to fund the service either from local revenuesources (e.g., rates) or from specific user charges on consumers of theservices (e.g., market fees or water charges). However, when the localauthorities provide services mandated by the central Government or wherethe central Government chooses to restrict revenue sources on socialgrounds (e.g., school fees), then the DIF report recommended as a matter ofequity that the central Government should provide funding for the servicethrough a cost-reimbursal grant to the local authorities. The clearestexample of this principle is in the case of primary education. The centralGovernment extended the provision of primary education nationwide as amatter of social policy, and it establishes teachers' salaries in alljurisdictions, including those where the local authority administers theschool system. In this case, providing a grant to cover teachers' salaries
60/ While there are good financial reasons for maintaining an accrualaccounting system for municipalities and town councils, there may be avalid case for introducing a simple cash accounting system for urbanand county councils because of their lack of qualified staff.

-55-
is a matter of equity (i.e., as the local authority is required to providea service funded by the central Government outside of the major urbanareas) and as a principle of fair taxation (i.e., as urban residents paytaxes to support primary education outside of urban areas, using localrevenue sources to pay teachers' salaries in urban areas would amount todouble taxation). While the central Government continued the principle ofcost-reimbursement for teachers' salaries during the latest revision oflocal authority grants, this principle was not maintained for othercentrally mandated services such as drugs and dressings (required to beprovided free through local authority health centers) and school fees(which were used by the local authorities to fund recurrent expendituresother than teachers' salaries). In general, therefore, the centralGovernment has not followed a consistent approach to local authorityrevenues, particularly with regard to centrally mandated services, and thisconstitutes an important impediment to establishing an equitable sharing ofrevenues and responsibilities between the central and local levels.
4.39 Possibilities for Improvements. There are no magic recipes forimproving local authority finances in Kenya. This report has made severalfor suggestions for improving the revenue yield of existing taxes. Inaddition, it may be worthwhile at this point to update the DMF report inorder to establish a renewed basis of agreement for the sharing of revenuesand responsibilities by the local authorities. The following suggestionsfor topics could provide an agenda for a revived discussion of localauthority finances in Kenya.
4.40 Virtually all the previous studies of local authority financeshave neglected questions of cost-efficiency and coverage in the provisionof local authority services. Local authority officials claim that servicesare being cut back and maintenance neglected. However, it is difficult todocument these trends in a way which would allow public discussion ofwhether these cuts can be justified in the face of financial restraint atall levels of Government. In the absence of reliable indicators of output,local authorities are open to charges of waste and inefficiency which theyhave no basis for disputing. It would seem clear that any discussion oflocal authority financing in Kenya should begin with a consideration ofoutput, both over time and across different local authorities. This wouldhave to be more than an extrapolation of expenditure trends, and shouldinclude the calculation of physical performance measures (such as studentsper teacher, gardeners per park, average response time per fire,administrators per staff member, etc.). Only with this factual basis can areasonable discussion proceed about the future course of local authorityservices in Kenya.
4.41 The second area which needs investigation concerns the existingrevenue sources, including user fees and license charges. Simplifiedmethodologies are available to ensure that user fees cover at least thefull cost-recovery price for the services, and the various license fees andother charges need to be classified and summarized to see if additionalrevenues can be generated from them. While it does not appear feasible tointroduce improved site value rating for property taxation at this point,serious consideration should be given to various indexing systems to adjustproperty values on an interim basis between the five-year revaluation

-56-
periods. Finally, particular effort should go into proposals to improvethe collection efficiency for existing revenues.
4.42 The area of local authority cash management, financial controls,and accounting procedures needs to be improved. This does not require theradical changes proposed in the IMF report, but rather could rely onmodifications and codifications of existing procedures to establishconsistency across local authorities. Preparation of an updated accountingmanual for local authorities would appear to have high priority, and thiseffort should be coordinated with the Kenya Institute of Administrationwhich would be responsible for instructing local authority staff in itsuse. Finally, the budget estimates for local authorities should bemodified to ensure a better correspondence between cash and accrualbudgets, in particular by requiring adequate provisions for working capitalbalances in anticipation of revenues and by formulating procedures forallowing the local authorities to write-off uncollectible debts.
4.43 On the basis of these studies, it should be possible to make areasonable assessment of the options for improving the performance of therevenue and expenditure systems currently available to the localauthorities. This will raise the related issues of: (i) what level ofservices should the local authorities be expected to maintain, and(ii) what additional revenue sources will they need to sustain this levelof activity. No matter what technical improvements are made to theexisting revenue base for local authorities, it is unlikely that they willbe adequate to provide the long-term elasticity in municipal revenuesrequired to cover the effects of inflation and continued urban growth.This will mean that additional revenue sources will be needed, and this canonly be accomplished with central Government support. In particular, arevised agreement on centrally mandated services and the designation ofadequate revenue sources to support them, whether through Government grantsor improved sources of taxation, would appear to be a prerequisite for asatisfactory resolution of the problem of local authority finances.
4.44 In addition to the subjects discussed above, it is also suggestedthat the proposed study should include the capital financing of localauthorities, a topic virtually neglected in the IMF report. The nextsection of this chapter provides an overview of local authority capitalfinancing in Kenya, as well as suggestions for improvement.
C. Capital Financing of Local Authorities
4.45 The two major sources of capital financing available to localauthorities are the LGLA for general purposes and NHC for housingprograms.60/ Reference was made in the previous section to the originalpurpose o7fthe LGLA, which was to serve as a repooling fund for surpluscapital funds generated by the local authorities. At the present time, the
60/ While there are good financial reasons for maintaining an accrualaccounting system for municipalities and town councils, there may be avalid case for introducing a simple cash accounting system for urbanand county councils because of their lack of qualified staff.

-57-
LGLA exists as little more than a conduit for channeling funds from thecentral Government development budget to the local authorities.Nevertheless, the LGLA has wide legal powers under the Local GovernmentLoans Act61/, and indeed the LGLA could be constituted as a municipaldevelopment bank under the existing legislation.
4.46 As indicated in Table 4.5, the loans raised by municipal councilsfor capital investments grew at a rate of 13% p.a. between 1972 and 1981.Considering the effects of inflation and urban population growth, this rateof growth in capital financing is clearly inadequate, especially as urbandevelopment is taking place in a larger number of urban centers throughoutthe country. Because of the macroeconomic constraints on the Government'sdevelopment budget, any improvement in the amount of urban investmentfinancing will probably take some time. When it does, the LGLA could playan important role in allocating the available funds and ensuring betterstandards of financial appraisal for proposed investments.
4.47 Various proposals have been made that LGLA should use its powersmore broadly to raise capital funds for urban investments from domesticcapital markets and international lending agencies.62 / Given thefinancial weakness of the local authorities, however, it is doubtful thatprivate financial institutions would lend to LGLA without a Governmentguarantee. As for quasi-Governmental agencies such as the National SocialSecurity Fund (NSSF), the LGLA would be competing with the Government fordevelopment funds, which are currently allocated directly through theGovernment's development budget. Finally, it is doubtful that anysignificant surplus capital funds can be generated internally by the localauthorities unless major changes are made in the structure of localauthority recurrent financing. In essense, it may be difficult for LGLA toexpand its penetration of domestic capital markets, although this can bekept open as an option for the future when the economic position of Kenyaimproves.
4.48 Where the LGLA can play a potentially important role is in thefinancial review of proposed investments, especially their relation to theoverall financing plan for the local authority. Referring back to Charts3.1 and 3.2 in Chapter III, an important step in the proposed investmentplanning process is the financial review of proposed investments and thegranting of a formal loan sanction. In present practice in Kenya, the LGLAis responsible for granting loan sanctions for proposed local authorityinvestments, and local authorities must submit an application specifying,inter alia, that the project satisfies the following criteria:
- Council approval of the project and authorization of theloan request;
- Compliance with town planning and land use requirements;
61/ Laws of Kenya, Chapter 270, revised edition 1962.
62/ See, for example, "Finance for Housing Infrastructure,"by J.D. Hagger, HRDU research paper, University of Nairobi, 1978.

-58-
Conformity with priorities set by the National DevelopmentPlan, the District Development Committee, and the Ministryof Local Government;
Ownership and availability of land where necessary;
The local authority concerned is not in default with respectto outstanding loans to LGLA;
The scheme is-technically sound, cost estimates arerealistic, and proposed implementation arrangements areappropriate;
The scheme is financially viable in that income generatedfrom the investment in the form of rents, fees, or chargeswill be adequate to cover loan charges (principal andinterest), maintenance, insurance, administration, rates,rents, and other direct costs; or
- If the scheme will not generate adequate income (such as aroad project which will not recover its costs from frontagecharges), the local authority has adequate general revenuesto cover the capital and recurrent costs of the project.
4.49 These criteria appear to be adequate to allow a technicalevaluation of the proposed investments. However, most loan sanctions havebeen granted almost routinely by LGLA, with the crucial decision on projectapproval being the actual allocation of funds. Given the general scarcityof urban investment funds, it would be desirable to improve the screeningof urban investment proposals as to their technical and economic merit inorder to ensure the most efficient distribution of the available funds.LGLA also has paid little or no attention to identifying the impact of aninvestment project on the overall financial position of a local authority.There is clearly a need for LGLA to issue guidelines and develop procedureswhich would require an analysis of the required increases in rates and/orin the level of fees and charges which would be required for the localauthority to maintain a proposed investment and cover the debt servicecharges. This type of impact analysis is a crucial step toward ensuringthat the investment planning process described in Chapter III takesadequate account of the financial capacity of individual localauthorities. It would also provide an incentive for local authorities toimprove their recurrent revenue position, as the financially stronger localauthorities would be given higher priority in the allocation of additionalcapital funds.
4.50 There are various ways in which the review of local authorityinvestment proposals can be handled within MLG. The Development Departmentwith its core of technical staff is the logical place to screen individualinvestments on their technical merit and provide input to LGLA. LGLA,because it has the responsibility for granting loan sanctions, could beupgraded to provide a financial appraisal of the local authority's overallinvestment capacity. This will require a strengthening of the staff ofLGLA and technical assistance in the development of financial forecasting

-59-
procedures. Nevertheless, it is a necessary step for MLG to move toward acapacity for allocating and overseeing urban investment funds on aspatially extensive basis.
V. HOUSING POLICY: INSTITUTIONS AND FINANCE
5.01 Housing policy has been an area of particular concern to theGovernment of Kenya, and Kenya has been a leader in articulating a housingpolicy appropriate for developing countries. This attention has beendemonstrated by events such as the establishment of the Housing Researchand Development Unit (HRDU) at the University of Nairobi and the movementof the United Nations Center for Human Settlements (HABITAT) to Nairobiduring the late 1970s. Kenya has also been the recipient of substantialfinancial assistance from multilateral and bilateral donor agencies forshelter-related projects, including the World Bank, USAID, the EuropeanDevelopment Fund, and the Commonwealth Development Corporation.
5.02 Despite the attention which has been paid to housing policy,there is a general feeling in Kenya that the performance of the sector hasbeen much less than satisfactory. The public housing sector has producedonly a fraction of the units called for in the last two NationalDevelopment Plans, even allowing for the fact that the original targetswere overly ambitious. Illegal, unplanned, and over-crowded slumsettlements continue to increase around the cities and towns in Kenya.There are unresolved differences on the question of appropriate standards,which has contributed to such problems as the inability of Nairobi CityCouncil to deal effectively with the slum settlement of Mathare Valley.These difficulties have been analyzed in a number of reports, and thetechnical deficiencies of current procedures are well-known.63 / On theother hand, the remedies which have been proposed often do not takeadequate account of the institutional environment of the housing sector andthe incentives which exist to promote change. For this reason, thischapter will focus primarily on the financial and institutional structureof the housing sector to determine if it is consistent with the needs ofhousing policy in the economic climate of the 1980s.
A. Performance of the Housing Sector
5.03 Indicators of Current Performance. The 1978-83 Development Planidentified the shortfall in housing units located in urban areas as 140,000units, with an annual addition of 30,000 units needed to provide forpopulation growth, thus giving a total five-year requirement of 290,000
63/ Kenya Shelter Sector Study and AID's Experience, Office of Housing,U.S. Agency for International Development, August 1979.

-60-
units.64/ This level of investment in housing is acknowledged to beinfeasible, as the current 1984-88 Development Plan identifies a totalhousing program for the five-year planning period of only 59,500 units,which includes rural public housing, upgrading of the existing housingstock, and private sector construction. Thus the public and the formalprivate sectors were expected to provide only one-fifth of the totalrequired units, and less than half of the units needed just to provide fornew urban growth. Implicitly, it is assumed that the remainder of theurban population will have to rely on the informal sector for their shelterneeds.
5.04 In order to evaluate any proposed targets for the housing sector,it is necessary to have some information on the sources of supply for thehousing stock. In this regard, the available data are fairly limited. Mostofficial statistics cover only a portion of the housing which isconstructed, such as publicly-owned housing. The Central Bureau ofStatistics (CBS) is planning to conduct an expanded survey of the housingstock which would do a great deal to fill this information gap. In themeantime, the data from a 1979 CBS Rent Survey in Urban Areas provideprobably the most accurate coverage of the housing stock that is currentlyavailable. 65/ Table 5.1 provides the percentage breakdown of theexisting housing stock in urban areas by ownership pattern. We see thatover 80% of the urban housing stock is owned by the private sector. Theremaining housing is made up of local authority housing, which consists of
64/ Even this figure may be an underestimate of the additionalhousing required for urban growth. Using an average urban growth rateof 7% and an average number of persons per dwelling unit of 4.16 (fromthe 1979 Rent Survey of Urban Areas), the annual requirement for newhousing in 1980 would be close to 39,000 units in order to provide forurban growth.
65/ See "Report on the 1979 Rent Survey in Urban Areas of Kenya," CentralBureau of Statistics, January 1981, and "Experience of UndertakingRent Survey in Urban Areas of Kenya," by P.O. Tindi, reproduced in"Report of the Seminar on the Role of the Private Sector in HousingDevelopment in Kenya," Ministry of Urban Development and Housing,September 1-3, 1980. The 1979 rent survey covered ten major urbanareas including Nairobi and Mombasa. A distinctive feature of thesurvey was that it was the first attempt by CBS to include coverage ofinformal settlements on a fairly comprehensive basis. While theresults of the survey are broadly consistent with other data, thereare large unexplained discrepancies between the city-specificpopulation projections of the rent survey and the population counts ofthe 1979 census for individual municipalities, particularly forNairobi and Mombasa. It is presumed that these discrepancies reflectproblems in obtaining adequate survey coverage of urban squatterareas. Since the published results of the rent survey are inaggregated form, some of the results presented here have had to beextrapolated from the tables.

-61-
staff housing and rental units mainly constructed prior to 1975, andcentral government staff housing, with Kenya Railways Corporation being oneof the larger holders. The rent survey also estimated that 18% of thehousing stock (23% of the private stock) is shanty-type housing in informaldevelopments. This is probably an understatement of the amount ofsub-standard housing in urban areas, which other surveys have estimated tocomprise 25-30% of the total housing stock.
5.05 Table 5.2 provides information on the type of structure andtenancy status of the private housing stock. One of the most strikingresults is that the implicit goal of the Government housing policy, singlefamilies occupying their own separate house, is achieved by only 4% of theoccupants of private sector housing (3% when public sector housing isincluded). In fact, less than one-fourth of private sector housing isowner-occupied, most of it in conjunction with other households under theclassification "other housing." Over three-quarters of urban householdsare renters. This is consistent with experience in the Dandora site andservice project in Nairobi, where two years after allocation of plots,two-thirds of the residents were tenants and only one-fifth of the plotswere occupied by a single household. Table 5.2 also indicates that mostKenyans have not been able to achieve the goal of having a two-roomdwelling unit, as the average number of rooms occupied by the residents of"'other housing" (82% of all residents) is 1.4 rooms per dwelling unit.These data imply that Government planning guidelines which call forsingle-family occupancy are unrealistic in the present very tight housingsitutation.
5.06 The fact that most urban housing in Kenya is rented is nowgenerally accepted. Planners of site and service projects design theinfrastructure to handle much higher plot densities than would be neededfor single family occupancy. The proto-type house designs recommended forself-help construction are adapted for subletting by the inclusion of awing of single rooms. It has also been found that lowering costs enough tomake a site and service plot affordable to the lowest third of the incomedistribution requires standards that are generally unacceptable to thelocal authorities. In order to maintain accessibility for the lowestincome group without compromising financial viability, the expected incomefrom subletting is often included with other income in defining thethreshold of "affordability." All of these measures are pragmaticadjustments to make the projects conform more realistically to the currenthousing market. Moreover, they represent a substantial change in attitudeon the part of the local authorities, as compared to an example in the late1970s when Nairobi City Council refused to approve an NHC project at Kiberaon the grounds that the proto-type house designs made explicit provisionfor subletting.
5.07 The 1979 rent survey also estimated that the number of dwellingunits in urban areas has been increasing at a rate of 8.1% p.a. over theperiod 1975-79, reflecting an average increase of 9.9% for the private
-62-
sector and 1.4% for the public sector.66 / This is compatible with data onthe value of residential building plans approved by the differentmunicipalities (shown in Table 5.3), which show a sharp increase over thisperiod in approvals of private residential building plans, particularly byNairobi City Council.67/ At the same time, the value of approved publicresidential building plans was no more than a fraction of the value ofprivate building plans and showed little growth over the period 1974-82.This result confirms that the main deficiency in performance in the sheltermarket has been with the public sector, rather than the private sector.
5.08 The final indicator of the housing market is the behavior ofrents. Table 5.4 presents rental indices for Nairobi stratified by threeincome groups. From these data, we see that increases in rental prices forupper income residents have generally matched increases in other pricesover the period 1974 to 1982, while rentals for the middle and lower incomegroups have outpaced other price changes. The lower-income group inparticular has faced increases in rents which significantly overranincreases in other prices. These price changes indicate that the housingsector has been able to maintain an adequate provision for the upper-incomegroup, but that the middle and particularly the lower-income groups havesuffered a deterioration in housing conditions over the past severalyears. This reflects the relative dominance of the private sector inserving the upper-income group and to some extent the middle-income group,while the lower-income group must depend on the public sector or theinformal private sector to obtain its housing.
5.09 The picture which emerges from these data is that of awell-functioning private sector providing housing for the upper part of theurban income distribution, while the lower-income group must rely either onsubletting of existing housing, informal housing development, or publicsector agencies. The poor performance of the public sector is notunexpected, as the period which these data represent was a time of rapidchange and experimentation in public housing policy. Nevertheless, thedata do support the dissatisfaction of many Kenyans with the urban housingmarket and the need to obtain improved performance to meet the need forurban housing resulting from rapid urban growth.
66/ These estimates should be considered as order of magnitude only. Thefocus of the study on dwelling units rather than structures may alsoconceal an increase in crowding of the existing stock.
67/ The value of building plans is considered to be a more reliableindicator of activity than the number of approvals, as a singlebuilding plan can cover a number of houses, such as for an estate. Onthe other hand, many approved building plans are never constructed oronly after a significant time lag. The CBS estimates that only 56% ofthe plans approved between 1975-79 had been completed by the end of1980.

-63-
5.10 Lessons from the Bank's Involvement in Kenya's Housing Sector.The Bank has been involved in Kenya's housing sector since 1971, startingwith technical reviews of the recommendations of the Nairobi Urban StudyGroup, a UNDP-funded project which was commissioned to provide a long-rangedevelopment plan for the city of Nairobi. Because of suggestions byseveral Bank missions, the study was broadened from a concern with land-useand transportation planning aspects of urban development to includeconsideration of affordable policies for urbanization of land and housingdevelopment in Nairobi. The result of this effort was one of the earliersite and service projects to be financed by the World Bank, the Dandoraproject in Nairobi which was presented to the Board of Directors of theBank in 1975.68/ The objective of this project was a demonstration of thefeasibility of large-scale involvement in site and service development.Planning was made for 6,000 plots to be developed at a site on the easternside of Nairobi, with the inclusion of materials loans to individualallottees, on-site construction of community facilities such as schools,health centers, and markets, and innovative approaches to physical designin order to reduce the cost of plot development.69 /
5.11 Despite official endorsement of the site and service conceptstarting in the 1974-78 Development Plan, there was by no means universalacceptance of the project concept in 1975. A number of public officialsstated reservations about the project, arguing that it would degenerateinto a slum or be taken over by higher-income groups. Moreover, theproject represented a radical change in direction for NCC, which hadpreviously emphasized the construction of higher-income tenant-purchasehousing and rental units combined with wide-scale demolition of squattersettlements.70/
5.12 In retrospect, the Dandora project has succeeded in accomplishingalmost all of its original objectives. Experience with the project hasdemonstrated the validity of most of the assumptions associated with the
68/ "Kenya: Appraisal of a Site and Service Project," World Bank StaffAppraisal Report, April 14, 1975.
69/ The objectives and features of the Dandora project have beendocumented in "Sites and Services: A Strategy for Kenyan UrbanDevelopment" by R.M. Beardmore, master's thesis in city planning,Massachusetts Institute of Technology, 1978.
70/ The demolition of squatter settlements reached a peak in theearly 1970s and had virtually ceased by the time of the Dandoraproject. As part of the loan agreement with the World Bank, NCCagreed to refrain from further demolition unless a viable alternativewas made available for the displaced residents.

-64-
site and service approach. In particular, the monitoring studies of theproject confirmed that:71 /
(a) Consolidation (completion of individual housing units) can takeplace fairly rapidly after sites are allocated. For Phase I atDandora, 70% of plot holders had completed the minimum requiredhousing construction within 18 months after construction waspermitted, and the sites on which construction had not startedwere held mostly by members of self-help contruction groups whichhad not been able to begin on the sites.
(b) If enforcement measures are rigorously applied, arrears on plotcharges can be minimal. In March 1981, less than 4% of allotteesfor Phase I in Dandora were more than six months in arrears.72 /
(c) Site and service projects can be effective in reaching lower-income groups. The target group for the Dandora project washouseholds in the 20th to 50th percentiles of the urban incomedistribution, and the monitoring studies have shown that mostallottees did in fact fall within this range.
5.13 Based on the experience of the Dandora project, the Bank approvedthe Second Urban Project in Kenya in 1978. This project introduced veryambitious objectives for the housing sector. On the physical side, theproject included both site and service developments and upgrading projectsin three cities: Nairobi, Mombasa, and Kisumu. As compared to the Dandoraproject which was located on city-owned land, the Second Urban Projectincluded a variety of sites with land tenure ranging from governmentownership to private freehold land to communal trust land. Innovativefeatures of physical design were specified, including very low standardsettlement plots for the poorest households, and a program for familyhealth and nutrition was included in all three project towns. Finally, theSecond Urban Project committed the Government to a far-reaching program ofinstitutional reforms, including basic changes in the structure ofmunicipal finance, strengthening of the MLG and the NHC, revisions ofhousing bylaws to reflect the needs of low-income housing projects, andpreparation of an urban investment program which would reach out to thesecondary towns of Kenya.
5.14 Unlike the initial phases of the Dandora project, the SecondUrban Project has suffered from significant delays in implemention whichdemonstrate weaknesses in the administrative structure for site and service
71/ "Monitoring and Evaluation Study of Dandora CommunityDevelopment Project," Senga, Ndeti and Associates, various reportsdated December, 1977 to February, 1980.
72/ By May 1984, the percentage of allottees in arrears by over sixmonths had risen to over 25% because of subsequent problems ofenforcement. NCC started a phased program of evictions in late 1984which was expected to reduce arrears to managable proportions.

-65-
projects. The first lesson is the importance of sustained politicalsupport within the local authorities for the proposed investmentprogram.73/ For this reason, Chapter III emphasized the necessity ofinvolving the local authorities at an early stage in the urban planningprocess in order to build political support for the projects. A secondlesson is that the process of land acquisition in Kenya consitutes a majorbarrier to current procedures for implementing public sector housingprojects. The appraisal team for the Second Urban Project examined theprocess of land acquisition for the project sites in depth and clearlydocumented the steps which would have to be taken to resolve the landissues. Nevertheless, four years after project appraisal, land issuescontinued to be a constraint on some of the project sites. A third lessonfrom the Second Urban Project is that the process of obtaining approvalswithin the local authorities can be very time consuming, and the process isfurther hampered by the persistent shortage of qualified techical staff.The Second Urban Project attempted to circumvent the problem byconsolidating the required staff within a Housing DevelopmentDepartment74!, but the Departments have proved to have high overheadswithout significantly improving the speed of implementation. Finally,problems arising from the persistent shortage of recurrent revenues for thelocal authorities have proved to be a continuing problem in all of thetowns.
5.15 Because of the delays in implementation, cost overruns due toinflation have forced the cities to scale back their intended projects.Recent experience with the Kayole site and service project in Nairobiindicates a cost in 1982 for construction of on-site infrastructure ofapproximately KSh 17,000 (US $1,350) per plot, as compared to an estimatedcost during project preparation in 1978 of KSh 6,600 per plot (US $800 atthe previous exchange rate), representing an increase in cost of almost160%, primarily because of project delays and changes in standards. Whenthe additional costs of implementation are added to the cost per plot(administrative overheads, materials loans, interest during construction,etc.), the total plot charge is beyond the affordability of the originalintended target group. Moreover, investment costs of this magnituderepresent a significant drain on Government funds at a time when the fundsavailable for urban areas are becoming increasingly strained. It is clearthat emphasis in future projects will have to be given to interventionswith shorter gestation periods, faster recovery of costs, and possibilitiesfor utilizing other sources and types of financing as much as possible.
73/ The Second Urban Project had unusual problems in this regard, asall of the project cities had their elected councilors dismissed atsome point during the period of project implementation, with thecouncils being run temporarily by Government commissions.
74/ The concept of a separate Housing Development Department to coordinateand implement low-income housing projects was recommended in a studyof NCC's housing operations funded by the Bank ("Nairobi's HousingNeeds: Meeting the Challenge," Coopers & Lybrand Associates Ltd.,1976, three volumes).

-66-
5.16 Summary. Despite the major innovations in housing policy whichKenya has introduced in the past decade, the performance of the sector isstill unsatisfactory. Recent experience has demonstrated that Kenya'shousing policy is at variance with current conditions in the sector in atleast three areas:
(a) housing policy in Kenya has emphasized public sectorinterventions, despite the fact that the private sector providesthe bulk of shelter for most people in urban areas;
(b) housing policy has been based on the promotion of home ownership,despite the fact that the great majority of urban residents arerenters; and
(c) Public housing projects have not demonstrated a capacity forefficient and sustained housing production at a cost generallyaffordable to the lowest income groups.
In the next two sections, we provide an in-depth review of key factorswhich have inhibited the performance of Kenya's public housing sector, withsection B focusing on urban land policy and section C on housinginstitutions and finance. Section D summarizes the major conclusions forchanges in the sector.
B. Urban Land Policy
5.17 The review of the Second Urban Project identified land issues asa major constraint on public housing policy. Up until now, most housingprojects implemented by NHC and the local authorities have been onGovernment-owned land allocated by the Commissioner of Lands or on landheld by the local authority. However, the reserve of Government and localauthority owned land suitable for low-income housing projects is rapidlydwindling in many urban areas, and the expected increase in the urbanpopulation will put severe pressure on the stock of Government land whichis remaining. Continued dependence on public land could relegate publichousing policy to a minor position in the shelter market.
5.18 Urban Land Requirements. Land in Kenya can be held under threebroad categories of rights or types of title:
(a) Customary rights, which have always been enjoyed by tribal peopleunder their own laws. These are normally based on communalownership and sharing, and the land is not formally demarcatedinto plots. Such land is now known as Trust Land, since it isheld in trust by the county councils for the respective tribes.Experience under the Second Urban Project with upgrading of trustland in the Migosi and Manyatta sites in Kisumu indicates thatthe process of regularizing land titles can be complex, slow, andexpensive under present procedures.
(b) Freehold land, being land to which an individual has obtainedabsolute title from the Government. There are some statutoryrestrictions on the use of such land, for example the Land

-67-
Planning Act, the Land Control Act, and the Land Acquisition Act,apart from the local building codes as applied by the localauthorities. Although the transfer of agricultural land isrestricted by the Land Control Act, there is no such restrictionin respect of urban land.
(c) Leasehold land, which is held for a fixed-term from either theCommissioner of Lands or the local authority. The normal term is50-99 years for urban plots and 999 years for agricultural land,although other terms can be granted, including a temporaryoccupation license of 33 years.
To the above formal classes one must add squatters' rights, which arede facto rather than de jure.
5.19 Low-income shelter projects in the past have relied onpublicly owned land or the compulsory acquisition of private land fordevelopment by public sector agencies. This method followswell-established laws and procedures, but experience has shown it to beexceedingly time-consuming. Because the pace of urbanization cannot standand wait on such a cumbersome process, it is not surprising that a varietyof de facto procedures have evolved in its place. Chart 5.1 provides adescription of the range of methods used for urbanizing land in Kenya.These procedures range from legal to informal (informal subdivision ofcompany-held land) to illegal (squatting on private land). The mainpositive qualities of the non-public initiatives are:
(a) Speed of execution. The land-owning company or the individualsquatter does not take long to decide on the location for abuilding, to assemble the materials, and to commenceconstruction.
(b) Flexibility in the sequence of steps to be taken. For instance,one can build before laying the services, or one can occupy thestructure before it is completed; transfers can take place beforesurvey; planning may occur after structures are already up.
(c) Flexibility in the standard of services provided. The quality ofinfrastructure can be improved gradually as resources permitrather than as the law will allow.
(d) The involvement of the community in the choice of options theycan afford and execute. When a private developer is servicingand subdividing the land, he can study the market and aim theproduct at a specific clientele.
Perhaps more importantly, given the current shortage of Governmentinvestment funds, these methods have the advantage that they rely on themobilization of private funds to make shelter available for urbanresidents. The primary disadvantages of these approaches are that they maynot provide a minimum level of basic needs services, or that the quality ofplanning and basic layout may be so poor as to make later improvement ofthe land and installation of services very expensive.

Chart 5.1 ALTEONATIOf LAND ____ OUN POIVAS IN IVW L
P U g 1. T C A G e N C I E 5 | P R I V A T eG C H U P S t R I Y A T E I x DI V I D U A L S Pusni.C SUBDIVISIONSS GassPAFUANML ROUPOOLING SCIHOU ISOLATID SDiTTRV(INCLUINIlG S/S) SLUM UPGRAIING AGCoC SYUArTERICOLOSY CD1fmmI3Y COOPS & CO'S UROAN LIDI OCINS MIS PAITICIPANEI KIOSK GWNIR SUSURSAN LASUNRJK PRIlVATe 1.AJSLO
Location On Kntosopsl lend Kol.iiog *qnstter Poor load by o1rtoe of lo trios... oa iota. UrIo E re. SoorhP btyategio oUSation- t- - Ida. of bigh-loo. e Vaf ot lead I. K.tb.t the nrban edgo sel_eloa ooe-tan,. ib.llty. fD. in the Higl-nd. P.p.olly *n the v_olthy oslaborheods. or.tablt-hd moe. to, of the
t-rrtin, -eviaing. big lti.s otty _:ter. end neighborbood. tonvq eep..illy
voter table or soil typo industrial area Uba.a.- llCill.plot. P-r *.allebldIgs
ootetds Nalonbl
ToDure SovetncnL orauqotrod Att,ps eade to t- .fl nd illg.1
999 Yet rgrtanl torl Fr ... d or sg. lo-lt1ral rost lond or fr. hold Public l.Dd ospeololly ehold or ab D ro.held r.atsied by
Chooges IDd sItvetled to grant stNre to ho...- ettl_nsr on govores lt ... in corporos Iso ee; no rroofer to hld by abeet.e l1ad- to-d roev, public leasehold (99 yar)- Isadlord iIe eou35-99 yar laee onesr- on preninoely or prineto od ea; f-r Inrea
1ip ldlolduel plot Onnere/ lord; .. hb Ldilidoal opve spacee. rod so hbng. fter _ _b- baiId:r oq build-
soner entae Truat or parabaced Ito. tshlte .bsra .110 llo * atqatrhe j:nhtt-ee sod oar dloietoo. eacpt for Lg only *ed paysP,toOse lnd attler fr. hold/ll.obld parbk; h abaogo In oLner-hip rAteud rt
title 11t0*
Pro IStseo 1. Prosr_lng 1. Plzanin/D g, 1. Settl.K Dt opn a eDDd S. Orfomsea oopprorde I. odiodole botid 1. Pore ooation of 1. fInd stabl I atIOr 1. PrItar" - bd,inino 1. Alloate butliang2 A..bI/AqIi.r lasnd 2. Progr_/bdgtitng oegeIotd load s_r o. otaop 2. Occupr and/r oblet pInt/hoe. oNer 2. PIbllessoorts pl sIte3. Prp are Pl -looute 3. Dlspoieeeeoo & eatablihbd neIghborhood 2. Prohase. a.D 3. Orga.ie aoop or .-P 2. Pr.par layot on 3. SiId 2. lnllt fr app. l 2. Ilottee .obeit.4. Lay aerviaee envolosen1 t of or n_r gr.htb poit. 3. SlbdtVid into plo.e 4. Parobon lead fin reponlteg/rellet- 4 Occupy (strt baLnoa by Cgorll & Pl for appes vP5: S-rv yley d-lo- I ledonetr 2. tolvc oods for env 21 i. op tn l:a .. er ea bode of 1100k) C<_I .onr of by l_dlerd edS. Allottoase h. Seraalsa ssttlars e.g. r eee 55 o 6In 5. Gtop prepare. donulnp- 3. D-.rate.s/rvy S. Seek ceaaol ItosNe- L-ode C.-oIIl7. BoIldiog parit. A . Cohty relstleas featpatbe 4. =Io ebre to cet ple oitb hlp ef ne plot 3 Srvy 3. Allott- haild
aOs N-6. 3-tvey/ 3. Coneolidete *-ttl- so indlivdnol tOD-ultante or gonro- 4. lealloct so *t- 4 INrbet plsta soope. Settl Dt r.gl-tratlna 4. lselop politicl Idoatity plot esNt ble bJe 5. o-yer pply for dor *eblet
5. Develop 1 ekt 5. =hers batld vd 6. Mo-oy ouSht for blIding p.rite 4. C-tl layseoacvv or *ubl-t oosrsdtg esaxirs0
Thre.holds - Pinoc - Co_olty *pptov-l - Offialal reoogoitito - Ideatifying a soIt- - Con-tn-ina o-or to seli - rlging o.ars - koqolrfog ealtoble Ies - Sttitteg -aity Rolala IBad * dPisoeag approvaI - Iaod -aquit:tlso/ - SeinIng t.bility & able od -nalloble - leisstilg load aqolsi- toethr - Galsieg p0bll seirviee aVoldidg ctwplty
- Allocettios dloltitloa pooonosd ftrP tinO - - .etesleia * b es acc-ptdoc. - Till ere y robose- gesistrallsn/Te.sore -. Cetting .r dit-bl ftor sharing co_te
leaders sod r_lloc taltoI- Istro " tI -d
Pinoriag Go-rsoet _ Sere ot - Prirate saloge _ Savins Savisge PtraDI otlgse - Ccrtl.l soon.. All.tte.. pep etuwd-oal authorIty - Locol sothority - Isfo L oelders B Seperasiv ok - Co-rl-ll rtob-a laurcee k tiosk ds-nlaPsrs prduo"I
- NWC loao - SOC - Self help - C-.ert,l Saak. - Self help- Senor *ageeceC - iosaor ageaotse - .6sicaltorO1 CredIt
- Self-bele0
Te Stal 2-5 yers. deteeDinod ni.i 3 year. gpeed . -rIticrl Patriy qook POIrly qotok =lo pene-e dapoadleg QOtLk pre.enco - -eetitI 1-2 y-rs; delay. Prea--s ltly Opetby h-r-ueretI deloys dtlas. aa eed by edjodi- soco os to *-tablieb credibitity cBead _ oly by plea- If Is tigt tedatl I
atitr & .cqoisitLo iny ppra-l sodlItle Horv s
Ieprdlesotr Settiog apprval so L.ok of sperlen. Offictnl oppneLtio. SabdivLeLo- Is illegal 1 aildioa Code Leak of epsf -bal- Rot1dtne aod- Sefrertora Sostillsy a_rd-standards, Land Pti itnl con.Idora- e gal disapprov l isj I- & ptoiedoro. P.binc b_ltih lsv nd rdo h e ltn dlerd.
5
naqoistlos tlon- Poeslble vdsr edjadi-LoDd osoorabip steno- c tles & loca g oveas-tore. *vnt lao.
E.ples NNC/iSS Prjats Kte opg-rdi.g ath.r. URUAN III sit.s It hth.r. Vlloy & Chge_e eponllg 11ks In ,is Irobi od 4 rinats sdabdii.oie Ki-soot -ad Cb_e-DiDder sits gib.r. Eldore. t. . "akDaji, reabk/Srloboagl Sch-, hoee heba ally itetee Is the lr-e to_. Is N1b . Al-
Chae IMly-nd-l f bShatt YTet. *n SairobI sd sod..telel -r_ 'ilrlry ;illlayeas. sWretgt
EosIOtin feede roasseesaHot Offere great probsitll Pa..le. .ctIon a big Sand potentlal far Sand potH btltl for Joint sa beo negleatd. 1 o-attl fwrpaooetlel Se On1 hat neods to hsrsr . onrae that nssd soplagltne prinais loltietlne. gnonstoo Creet poteagial for orben grevibUrben dentiop- flard. eaptoislty tappIng ond rhannelinsg *titislIoe progrea shoold ha cooi{y hasod Pohita soctor nesdeFest tnol teaure. protrotton of In the rr
1otrd enpended action. see to be toon *plarG era
teOtff relevd nt dic tloGs doct pid. reiL d L- nbatlv 2 ye ofbt eaeloatee sod and trid. I prote tarkly vith plale
lnto_eDt of teahnlque and sater tn aahbenseeolcta ororedorse. eclonal 1soa
KaJon legol Soildlog Code and Pablit N_olth Los; Trespass and Noi..na Lad Control cAt; btse a. for Freing Se- lepodiest. Tra.p. -- ; .Pbic l lsIth; L nd Cootrl At sod Seldlg Cods;Unrdl .e ublgo H_ralIE egietr Lad Art L.e.; P r isoH th ol-; H ilentag Act; Local CooPers. Ve nd Buildieg Cods; W.I-sDte Land Plaeosg Act Loonl Ososesmot
bol diig Coda G- -oerat Act Cooe lane ACt

-69-
5.20 The relative magnitude of the various urbanization processes canbe roughly estimated from existing information. Over the period 1981-85,it is estimated that approximately 30,000 residential "plots" were requiredannually in urban areas of Kenya. Table 5.5 shows the expected source ofnew residential plots, based on the current performance of the publicsector in approving subdivisions and allocating land. From this, we seethat public sector housing projects can be expected to provide onlyone-tenth of the required plots at current levels of output, and the totalamount of formally approved residential land subdivisions (both public andprivate) will amount to less than one-fourth of the required number ofplots.
5.21 Although various informal processes provide a large proportion ofnew residential plots, the formal processes still account for the majorityof land which is urbanized every year. Table 5.6 presents the estimatedannual land requirements for Nairobi and for all urban areas in Kenya,based on current settlement densities and the prevailing ratio ofresidential to non-residential land (estimated to be approximately 1:1based on studies by the Department of Physical Planning). Urban growthwill require approximately 2,000 additional hectares of urbanized land peryear in Kenya, of which about one-fourth will be provided by informal landdevelopment processes.75/
5.22 Besides the time consuming nature of the approval process, manydevelopers choose to circumvent formal approval procedures because of theinsistence by local authorities that services must be provided at "adoptivestandards." Each local council has its own adoptive standards, most ofthem based on rigid physical specifications inherited from the colonialperiod. For example, the adoptive standards required by Thika MunicipalCouncil include: 7.0 and 5.5m. paved carriageways built to the council'sstructural specifications, open lined drains and/or piped drains forstormwater drainage, 2m. wide footpaths on either side of the carriageways,and street lighting using the council's standard lanterns. Littleopportunity is provided for the developer to gradually introduce servicesas the area fills up and demand justifies the investment. This means thatthe developer must invest a substantial amount of money up front indeveloping the area and recoup his investment gradually over time as theplots are sold. Given the high interest cost of investment funds and thelimited availability of capital resources, it is not surprising that manydevelopers prefer to forego the requirement of adoptive standards.
5.23 As a solution to the continuing spread of unplanned housingdevelopments in the urban areas of Kenya, it has been proposed that theapproval process be strengthened to prevent private developers fromcircumventing the building regulations and that the requirements of
75/ Another way to arrive at this estimate is to assume that the urbanpopulation will continue to increase at a rate of 7% p.a. and thateach additional person will need an average of 140 m2 of urban space,which is somewhat smaller than the 1969 actual urban density of 160 m2
per person.

-70-
adoptive standards be modified to reduce the cost of compliance andencourage more developers to follow the formal procedures. The KenyaLow-Cost Housing By-laws Study has looked at the process of planningapprovals and considered realistic alternatives to current buildingstandards. Adoption of the recommendations of this report would be anessential step in ensuring that the formal planning and approval processdoes not become increasingly marginalized in the face of rapid populationgrowth and the high demand for urban land. Nevertheless, technicalmodifications of building regulations are unlikely to be a sufficientmechanism for halting the continuing creation of slums in the face of otherconstraints in the economic and institutional framework for shelterprovision in Kenya.
5.24 Even if building standards and planning approval procedures aresubstantially relaxed, private land owners will almost certainly continueto create substandard developments because of a lack of capital financingfor installing infrastructure. Existing housing finance institutions aregeared almost exclusively to high standard developments for the middle andupper income levels. Moreover, legal barriers, such as the problem ofshared debt liability among members of land cooperatives (which hold muchof the urban fringe land in Kenya) makes this market unattractive forcommercial finance institutions. In the meantime, the local authoritiesare the most reasonable option for extending financing for urbaninfrastructure on a scale which is commensurate with the requirements inthe sector.
5.25 Priorities for Public Sector Responses. Existing public sectorhousing programs are insufficient to ensure the continuing expansion ofbasic needs services to the low-income urban population in Kenya.Regardless of any improvements which may take place in the implementationof site and service projects, it is clear that the scale of interventionwill fall far short of the level of activity which is required. Nor willan expansion of conventional housing finance be adequate to resolve theseproblems, as the funds would almost certainly be used by higher-incomesegments of the population. The solution to this problem is not a massiveincrease in investment funds devoted to public housing projects. Thesefunds are just not available in the current ecomomic circumstances, and theexisting public sector agencies do not have the absorptive capacity toutilize a significant increase in resources. The only other option, otherthan continuing the growth of slum settlements, is for public sector toservice privately-held land at minimum standards and on a large scale.
5.26 The advantages of servicing privately-owned land without goingthrough the acquisition process are obvious. The private land owner isrequired to surrender free of charge the land needed to install roads andservices, often amounting to 20% of the total land area. The use of publicfunds in leveraging the provision of shelter is maximized, as the privateowner is responsible for housing construction using his own funds orfinancing secured on the private market. Finally, quicker methods ofrecovering public investment costs can be utilized, such as frontagecharges for road construction. Other investment costs may have to berecovered through more indirect means, such as water tariffs and increasedproperty taxes arising from changes in the land use classification.

-71-
However, since better procedures and safeguards exist for collecting waterfees and taxes than for the plot charges used in site and service projects,the lower administrative costs and better collection performance may morethan compensate for any loss in revenue as compared to plot charges.
5.27 In practice, there are a number of impediments to theimplementation of this approach. First of all, it will require the localauthorities to enter into voluntary agreements with private land owners.There are well-established procedures for obtaining these agreements(filing of a sub-division plan, approval by the local authority,registration by the Commissioner of Lands, etc.), but the process hasgenerally been used for upper and middle income housing only. The emphasison minimum standards will also be difficult for many local authorities toaccept, given the physical orientation of most urban planners and localpoliticians and the lack of a clear linkage between financial and physicalconsiderations in the approval process. Nevertheless, given the economicconditions expected to prevail in Kenya over the next decade and therestricted outlook for real growth in the investment funds available tourban areas, the only choices available for the bulk of the urbanpopulation will inevitably be between minimal standards and no standards.
5.28 One possibility for addressing the planning concerns of localauthorities and the needs of different constituencies would be to introducevarious standards of land-use control according to a graduated zoningsystem. For example, a possible four-tier structure of zoning couldprovide for the following standards of land-use control:
(a) Free zones, where there is very limited control apart fromensuring the minimum standards of public health, especially watersupply and low-cost sanitation. This type of land use wouldinclude existing unplanned housing developments and would seek toensure that a minimum level of basic services is provided andperhaps exert some control on gross densities.
(b) Minimum control areas, applicable in areas such as urban fingeland. Minimum control would seek to ensure a regular layout sothat services can be installed at minimum cost and that roadreserves and open space are retained for surrender to the localauthority when basic services are provided.
(c) Moderate control zones, of the level now being exercised underthe law, would apply to areas where resources are available toinstall urban services to an adoptive standard. A distinctioncould be made between areas where more permissive by-lawswould apply, versus areas where the local authorities might wishto retain the stricter standards of the current Building Code.
(d) Tight control zones, in which the community would wish to investlarge amounts of money for purposes of environmental protection.Such areas would include the city center, pollution-proneindustrial areas, areas of special attention to tourists, andarchitectural or historic monuments.

-72-
This system would formally recognize the prevailing standards of urban landdevelopment in Kenya, and as such it would provide a more realistic basisfor the local authorities to work with private land owners in the extensionof urban services.
C. Housing Finance and The Role of Public Sector Agencies
5.29 Compelling as the preceding argument is on financial grounds, itis up to the political process in Kenya, most especially at the level ofthe local authorities, to recognize the constraints on funding and makeprovision for the servicing of privately held land. The central Governmentcan assist by making funds available for minimum service projects whilemaintaining a limitation on the financing provided for higher qualityhousing projects. However, as the central Government and the localauthorities have a long tradition of direct support for housing projects,it is unrealistic to expect that the Government will abandon its commitmentto the direct provision of housing.
5.30 As noted in Chapter II, the Government provides financial supportto housing development in Kenya in two ways: (i) by encouraging theexpansion of commercial housing finance; and (ii) providing housing fundsdirectly to public sector agencies to implement shelter projects for thelow-income population. In this section, we discuss both types of housingfinance, considering first the provision of commercial financing andsecondly the role of public sector agencies in providing housing financefor the low-income population.
5.31 Commercial Housing Finance Resources. Kenya's housing financesector is reasonably well-developed, with three large institutions andseveral smaller ones specializing in the sector.76 / HFCK was incorporatedin 1965 as a partnership between the Government 7f Kenya and the U.K.-basedCommonwealth Development Corporation (CDC). An interesting feature of bothHFCK and EABS is that they are associated with real estate developmentcompanies. HFCK participated with CDC in the development of the Bura BuraEstates in Nairobi, a highly successful middle-income housing development,and it has also participated with NHC in some of its middle-income housingdevelopment. EABS is associated with Akiba Loans and Finance Ltd, aprivate company which carries out development of middle-income housing.
5.32 The housing finance companies experienced very good growth intheir deposits over the period 1975-80. EABS reported a growth rate of 24%p.a. in the value of deposits and 12% p.a. in the number of depositorsduring this period, while HFCK showed a growth rate of 20% p.a. in thevalue of deposits. During the period around 1980, however, all three ofthe large institutions experienced an excess demand for mortgage financecoupled with a slowing in the growth of deposits, reportedly becauseinterest rates being paid on deposits were not competitive with otherinstitutions. For this reason, the Government introduced tax-free Home
76/ The large institutions, as measured by total deposits, are HFCK,Savings and Loan Kenya Ltd. (SLK), and the East African BuildingSociety (EABS).

-73-
Mortgage Bonds in mid-1981 to stimulate deposits in HFCK and SLK. Othermeasures which have been taken in recent years include loans from theNational Social Security Fund (NSSF) to HFCK and SLK, direct Governmentloans to HFCK in the amount of KSh 20 million in FY79/80 and KSh. 25million in FY80/81, and increases in the interest rates paid to depositorsto make the institutions more competitive in attracting funds.
5.33 A number of analysts have shown that a significant gap occurs inthe provision of housing finance between the higher income market served bythe housing finance institutions and the housing loans provided with siteand service plots through Kenya's low-cost public housing programs. In1983 costs, this financing gap covered housing units in the range ofKSh 40,000 (US$3,200), which was the cost of a fully-serviced site andservice plot with a materials loan to build a bare two-room house77 /, to ahousing unit costing in the range of KSh 100,000-150,000 (US$8,000-12,000),which covered approximately the lowest cost unit being financed by HFCK.This bimodal distribution of housing finance helps explain the significantpressure by middle-income groups on the available site and service plots.
5.34 The existence of a substantial gap in the housing financemarket is unsatisfactory from a development standpoint and indicates afailure to develop sectoral policies which service the housing needs of thefull spectrum of Kenyan households. As a result, middle income householdsare largely frustrated in their desire to improve their housing and gainaccess to a significant form of asset accumulation. The Government shouldsupport innovative programs to extend the coverage of housing finance tolower and middle income households. These might include special programsinvolving private developers and housing finance companies in providinglow-cost housing using reduced building standards, as well as site andservice type programs combining housing finance companies with the localauthorities or NHC in promoting self-help development. Such programs areunderway in Zimbabwe and Malawi, as well as efforts in Kenya, and theseconcepts need to be developed and extended to provide a full range ofhousing options for urban households in Kenya.
5.35 Local Authorities. Local authorities have come relativelyrecently to their role as developers of owner-occupied housing. Theoriginal entry of local authorities into the housing market was in colonialtimes in order to provide rental accommodations to African workers. Thishas left a tradition of local authority housing as a social service thatstill influences the approach of the councils. For example, a Governmentruling in 1976 on the rentals charged by local authorities confirmed theprinciple that local authorities should make "no profit-no loss" on theirrental housing stock, citing as justification "the Government's social
77/ Based on cost estimates developed for the Bank-financed SecondaryTowns Project.

-74-
responsibility towards housing the low-income group, which must not be leftto market forces."78/
5.36 Even after more than a decade of official policy emphasizingowner-occupied housing, rental housing still dominates the stock of housingheld by the local authorities. Table 5.7 shows the composition of thelocal authority housing stock in 1969 and 1980. In 1969, rental housingcomprised 90% of the housing stock provided by local authorities, with theremainder consisting of a small amount of tenant-purchase housing and siteand service plots. By 1980, the share of rental housing had shrunk to 69%of the housing stock. If we look at the net addition to the stock between1969 and 1980, however, we find that new construction of rental housingaccounted for 37% of the increase. Over half of local authority rentalhousing is owned by Nairobi City Council, with Nakuru and Kisumu MunicipalCouncils holding the second and third largest shares respectively.
5.37 As discussed in Chapter IV, local authorities have a clearmandate to provide basic urban infrastructure. What has been added in siteand service projects is that the local authority is responsible forproviding long-term mortgage finance to the plotholder for the capital costof the plot and for the cost of housing construction through loans forbuilding materials. While some of the local authorities have accepted thisresponsibility, it is a significant administrative burden, particularly forsmaller local authorities, and a responsibility that the local authoritiesare not necessarily well disposed to carry out. Given the "social service"orientation of local authority housing, it is not surprising that a numberof local authorities have substantial arrears on their site and servicedevelopments. For example, a USAID audit of NHC-funded housing projects infive secondary towns found extremely unsatisfactory loan managementprocedures and arrears averaging 27% of amounts billed to plotholders.Given this situation, it is not surprising that a number of the localauthorities are in arrears to NHC on their loan repayments.
5.38 There would be a number of advantages from greaterparticipation of commercial housing finance institutions with localauthorities in site and service type programs. For the local authorities,it would allow them to concentrate on the provision of urban infrastructurewithout the corresponding responsibility of providing long-term mortgagefinance. Because the cost of infrastructure could be refinanced by thehousing finance companies as part of the total mortgage loan, the localauthorities would be able to recover their investment cost on a muchshorter term basis and use the money to extend urban services to new
78/ "Report by an Inter-Ministerial Committee on Rent Increases of LocalAuthority Housing in Kenya," Ministry of Housing and Social Services,August 31, 1977. The charges for rental housing are based onhistorical cost. If the councils would agree to sell part of theirrental housing stock at a price approaching the current market price,or alternatively to revalue the houses at market prices in settingrentals, they could generate substantial sums to invest in buildingnew housing without having to rely on loan funds from the centralGovernment.

-75-
housing areas. By relying on private commercial funds for mortgagefinancing rather than the Government development budget, scarce publicfunds could be leveraged to provide substantially more housing to lowerincome households. Regarding the commercial housing finance companies,they would gain access to a larger market for mortgage lending whilerelying on the local authorities for the details of infrastructureconstruction, housing inspection, and technical assistance to plotallottees. In addition, the wider availability of mortgage financing islikely to increase deposit mobilization among lower and middle incomehouseholds, thus directing additional resources into the sector.Additional incentives may also be necessary in order to ensure that thismarket is attractive to commercial lending agencies. These could include aguarantee by the local authority on stage payments made to plot allotteesduring the process of housing construction, assistance to the housingfinance agencies for enforcement of penalties on arrears and reallocationof plots after eviction proceedings, and possible mixing of public funds atattractive interest rates with private funds in covering the mortgagefinance requirements. Nevertheless, given the large premium whichcurrently exists between the cost of site and service plots and theirmarket price, this market should entail relatively low risk to allparticipants, while expanding greatly the availability of housing funds toa broader range of Kenyan households.
5.39 National Housing Corporation. NHC was established in 1966 out ofthe former Central Housing Board, following the recommendations of a 1964UN Mission to Kenya on Housing.79/ The 1979-83 National Development Planlists the following activities as the role of NHC:
(a) transmission of government funds to local authorities for thedevelopment of low-cost housing;
(b) provision of technical assistance in housing to localauthorities;
(c) development and management of housing estates;
(d) support and encouragement for housing research; and
(e) stimulation of private sector participation in mortgage housingestates.
Though this description implies that considerable initiative is left tolocal authorities, in practice NHC has taken over responsibility as themajor implementing agency for public sector housing programs in thecountry, with the exception of the largest municipalities such as Nairobi,Mombasa, and Kisumu.
79/ See "Housing Policy for Kenya," Sessional Paper No. 5 of 1966/67,Republic of Kenya; and "United Nations' Mission to Kenya on Housing,"by L.N. Bloomberg and C. Abrams, 1965.

-76-
5.40 A consultant's report on the operations of NHC has concluded thatthe past performance of NHC has been poor.8 0/ Table 5.8 presentsinformation on the housing units and site and service plots completed byNHC over the period 1976-83. NHC's major area of activity during thisperiod was in the construction of completed housing units rather than siteand service plots, despite the emphasis in the various National DevelopmentPlans on site and service development. Since the average price ofNRC-completed housing units has generally been beyond the affordable rangeof the lower income group, the amount of public sector housing fundsdirected to the lower income group by NHC has been in fact relatively smallover this period.
5.41 The consultant's report on NHC recommended a number oforganizational changes intended to improve NHC's operations. However, itis more likely that the problems faced by NHC arise because its mandate isoverly broad and not conducive to the promotion of financial discipline andcost-efficiency. One can identify at least two separate roles which arecarried out by NHC. The first role is as a housing developer, both as anagent for local authorities and by developing a limited number of schemes(tenant purchase, etc.) which it holds on its own account. However, thehousing development role can be logically separated from NHC's second majorfunction, which is to be a secondary housing bank which on-lends housingfunds to local authorities and implicitly retains the responsibility toreview and appraise projects for their technical and financialfeasibility. In effect, NHC is in a virtual monopoly position on publicfunding that reduces its incentives for cost control and innovative projectdesign. Although this tendency is supposed to be moderated by ministerialdirection through housing policy guidelines, this leverage has not beeneffective. An alternative approach would be to have NHC concentrate solelyon low-income housing development, with housing finance channeled throughother institutions such as LGLA or commercial housing finance companies.This would promote greater competition in the use of public funds and couldstimulate innovative efforts in servicing the housing needs of lower incomehouseholds in a more effective manner.
D. Conclusions
5.42 This chapter has examined a number of factors relating to theunsatisfactory performance of the housing sector in Kenya. Because of theconstrained economic situation in the country in general and the priorityneeds of other sectors in responding to Kenya's adjustment policies, theGovernment is unlikely to sanction any significant redistribution of publicresources to the housing sector. This means that new initiatives in thehousing sector should emphasize greater efficiency and improved use ofresources rather than expanded public investment requirements. At the sametime, economic constraint does not justify complaisance; there are areaswhere Kenya's housing policy is inconsistent with the current situation andcan be changed by Government action.
80/ "Study of the Operations of the National Housing Corporation,"Final Report, January, 1981, Coopers and Lybrand Associates.

-77-
5.43 First of all, in making the choice between quantity and qualityin the servicing of urban land, all of the evidence favors quantity as thehigher priority in Kenya. Public sector housing projects, including siteand service projects, are too expensive and too slow to meet the problemadequately. Private sector resources are meeting the problem, although atvery low standards. The priority of the Government should be to supplementthese private initiatives by encouraging the provision of basic servicesand minimum planning controls. Only in this way can the public sectorexpect to promote a scale of production adequate to service the rapid urbangrowth that is occurring in Kenya.
5.44 In undertaking to service private land, the Government and thelocal authorities will need to forego the tight planning controls whichhave characterized public sector housing projects up to now. This meansthat politically attractive policies such as implicit subsidies throughartificially low plot charges, allocation of land to individual plotholders, and building restrictions on the quality of housing constructionwill not be possible in most projects. Indeed, it is often thesebureaucratic controls which have limited the speed of implementation ofpublic housing projects. In effect, the Government's low-income housingpolicy should be expanded to include provision for renters on private land,rather than focusing solely on homeowners (and tenants) occupying publiclyprovided plots. This direction is consistent with conditions prevailing inthe housing sector, but it would imply a significant redirection in theGovernment's housing program.
5.45 In undertaking this change in housing policy, the localauthorities will play a major role in the identification and implementationof projects. However, it is unrealistic to expect the local authorities totake a leadership role in pursuing this policy without advice andencouragement from central Government agencies. The Secondary TownsProject includes a number of components involving the servicing of privateland. Experience with these components can play an important role indemonstrating the concepts to the local authorities and establishingprocedures and priorities for expanding the program on a larger scale.
5.46 The appropriate role of NHC in Kenya's housing policy needsbetter definition. NHC has an experienced technical staff and could be ofsubstantial assistance to the smaller local authorities in identifying andimplementing urban projects. On the other hand, NHC has not demonstratedcommitment in the past to its low-income housing program. There istherefore little justification for continuing to maintain NHC in a monopolyposition on the allocation of public housing funds. These funds could bemade available through other institutions, including LGLA and thecommercial housing finance companies, on the basis of the competitive meritof proposals to service the target income group, rather than relying solelyon NHC to provide this initiative. As for NHC's housing developmentactivities, it would need to define a position in the shelter market whichwould justify its conti'nuing involvement. One possibility is the planningand implementation of urban servicing and shelter projects on a contractbasis for the smaller local authorities, and another possibility isinnovative site and service type developments in partnership withcommercial housing finance institutions. The Government should consider

-78-
providing technical assistance to NHC for a limited period to allow it toestablish a position in the shelter market, after which NHC would beresponsible for obtaining development funds on a competitive basis ratherthan through the Government budget.
5.47 Expanding the role and participation of the commercial housingfinance companies in Kenya's low-income housing progam represents the mostimportant challenge for future policy development. Many of the localauthorities are not equipped to operate efficiently as long-term mortgagelenders. Moreover, given the constraints on the Government developmentbudget, the public sector programs will become increasingly marginalizedunless they can leverage public resources with private funds through thehousing finance institutions. Innovative efforts to combine the successfulelements of existing site and service shelter programs with the greaterfinancial discipline and resource mobilization potential of the privatesector will ultimately help bridge the gap in the housing finance marketand make a wider range of housing options available to urban households.
5.48 In considering new priorities in the housing sector, it isimportant to bear in mind that Kenya has made major advances in its housingpolicy during the past decade. Questions of physical standards, costrecovery, and affordability which were on the forefront of the housingdebate ten years ago are now accepted and incorporated into the housingpolicy which Kenya has been pursuing. If these concepts and the projectswhich introduced them have yet to provide a fully satisfactory model forsustained housing production, the issues which impede the implementation ofhousing projects are much better understood. Certainly the economicconstraints which Kenya faces will limit the resources that the Governmentcan provide to the housing sector. Nevertheless, sustained momentum in theprovision of basic urban services and access to land remains an importantpriority in terms of maintaining Kenya's ability to manage urban growth.
VI. SUMMARY OF RECOMMENDATIONS
6.01 The major findings of this report are the following:
(a) Role of Local Authorities: Urban local authorities providethe basis for the development of local capabilities,initiatives, and resources, all of which are necessary toprovide for urban growth in Kenya. The changing partnershipof the local and central agencies in urban development needsredefinition, with a clear designation of responsibilitiesand identification of the financial and human resourcesnecessary to carry them out.
(b) Local Authority Finances: The deteriorating state of localauthority finances is the major constraint on the continuedgrowth of urban services. The structure of recurrentrevenues needs improvement, with particular emphasis beinggiven to improving the buoyancy of general revenue sources.

-79-
The system of central Government grants-in-aid to localauthorities requires careful scrutiny, with a moreconsistent basis established between the obligation on localauthorities to extend services and the revenues available toto support them. Finally capital financing decisions forlocal authority investments need to pay greater attention tothe financial ability of the local authority to maintain theinvestment and cover the debt-service obligation within itsrevenue structure.
(c) Urban Investment Planning: The planning of urbaninvestments should focus on the local authorities as the"prime client" for urban development. The role of thecentral Government agencies should be to assist in thescreening of urban investments within the District Focus ondevelopment, provide technical assistance and training tolocal authorities in developing their own capabilities, andassume an advocacy role for urban development through theidentification of resources and cost-efficient programs toprovide for urban growth.
(d) Spatial Investment Criteria: Urban investments shouldbe chosen according to their individual rates of return andthe capacity of the implementing agencies, rather than toinfluence a particular spatial pattern of urban growth.This implies a policy of "evenhandedness" in choosing urbaninvestments which would primarily support growth in areaswhere it is already occurring. The secondary towns can beexpected to be major centers of urban growth and willtherefore require access to a greater share of investmentfunds.
(e) Servicing Urban Land: Major priority should be given to theextension of urban services on a widespread basis, such asthrough the servicing of privately held land. To reducecosts and mobilize private resources as much as possible,consideration should be given to the phased introduction ofbasic infrastructure, voluntary agreements with privateland-owners to obtain land rather than public acquisition ofland, faster approval procedures by local authorities,greater willingness to compromise on adoptive standards, andminimum controls consistent with public health objectives.
6.02 In support of these findings, the following actions are proposedin the report:
(a) Strengthening of local authority finances, with emphasis onmeasures to increase the elasticity of local authorityrevenues, improvements in revenue collection procedures,methods of measuring the productivity and demand for localauthority services, and clearer designation of theresponsibility for funding centrally-mandated services;

-80-
(b) Establishment of an inter-ministerial urban developmentplanning framework, which would facilitate the screening ofurban investments in the Forward Budget process, provide aforum for ensuring inter-project consistency, and undertakemonitoring and evaluation of urban investments to improvethe speed of implementation;
(c) Improvement of the financial review procedures of LGLA,with emphasis on the analysis of the impact of proposedinvestments on the overall financial position of the localauthorities;
(d) Development of criteria for pricing urban services, such aswater, housing, and trading undertakings, which would coverrecurrent costs and provide adequate funds for capitalreplacement and expansion;
(e) Adoption of the Kenya Low-Cost Housing By-laws Study;
(f) Establishment of NHC on a self-financing basis, with publichousing funds being redirected through other financialagencies; and
(g) Innovative programs to extend coverage of commercial housingfinance to lower and middle households through jointprojects with local authorities, NHC, and/or privatedevelopers.
6.03 In addition, the following actions are recommended for seriousconsideration:
(a) Clarification of the policy framework for urbantransportion, including support for urban road maintenance,allocation of a reasonable amount of investment funds forroad expansion and traffic engineering improvements, andclarification of ministerial responsibilities for publictransport policy;
(b) Adoption of a uniform pricing policy for water supply;
(c) Adoption of a graduated system of land-use zoning withvarying degrees of control on physical development;
(d) More attention to employment concerns in urbandevelopment planning; and
(e) Review of training requirements for local authoritiesand other personnel involved in urban development.
Conclusion
6.04 Urbanization in Kenya has neither top priority in theGovernment's list of current problems nor any special claim over other

-81-
sectors to increased development resources. On the other hand,urbanization is too important as a long-term issue to neglect theinstitutional and financial framework required to support this transitionin Kenya's development. Given the heavy demands on the central Government,local authorities will bear the major responsibility of providing forurbanization, both through the development of local resources and by theidentification of innovative and cost-efficient ways of extending urbanservices. However, local authorities cannot do it on their own. Thecentral Government must provide financial legislation and urban planningprocedures which support the local authorities. This report has presenteda number of recommendations for improving the cost incentives and financialdiscipline of urban development programs. As many of the recommendationswould require changes in current methods of operation, it is not expectedthat they will be accepted without additional study and carefulconsideration by the Government. It is intended that the analysispresented here should provide a framework for a continuing dialogue on therole of urbanization during the difficult economic times being experiencedin Kenya. This is an important task in preparing for the adjustments inKenya's economy which will be required during this decade.

-82-
STATISTICAL ANNEX

ccI

-84-
Table 1.1: POPULATION OF KENYA, 1962-79
Urban, asTotal Urban Percentage Number ofPopulation Population of Total Urban Centers a/
1979 15,322,000 2,307,000 15.0% 901969 10,943,000 1,080,000 9.9% 471962 8,636,000 748,000 8.7% 34
Intercensal Growth Rates
1969-79 3.4% 7.9%1962-69 3.3% 5.4%
Source: Population Census 1962, 1969, 1979.
a/ Urban centers are defined in the census as towns with a populationof more than 2,000 inhabitants.

-85-
Table 1.2: URBAN CENTERS WITH POPULATION EXCEEDING 20,000 (1979)
Population Area (km2) Population Growth Rate
(II) (VII)1969 (VI) 1969-79
(I) (adjusted (III) 1969-79 (adjusted for (VIII)1979 to 1979 1969 (IV) (V) (adjusted for urban/rural 1962-69
Town (census) boundaries) (census) 1979 1969 boundary changes) population) (census)
Nairobi 827,775 509,286 509,286 684 684 5.0 5.0 5.6Mombasa 341,148 247,073 - 247,073 210 210 3.3 3.3 4.7Kisumu 152,643 111,700 32,431 270 19 3.2 3.5 4.6Nakuru 92,851 50,700 47,151 78 32 6.2 6.2 3.1Machakos 84,320 - 6,312 324 19 -- -- --
Meru 70,439 52,900 4,475 128 2 2.9 10.4 --Eldoret 50,503 24,900 18,196 58 25 7.3 7.3 -1.1Thika 41,324 23,400 18,387 92 15 5.9 5.9 4.0Nyeri 35,753 22,600 10,004 72 7 4.7 7.3 3.5Kakamega 32,025 18,300 6,244 47 8 5.8 10.5 --
Kisii 29,661 -- 6,080 35 3 -- --Kericho 29,603 - 10,144 68 10 -- -- --
Kitale 28,327 13,300 11,573 80 18 7.9 7.9 3.1Bungoma 25,161 -- 4,401 60 2 -- -- --
Busia 24,857 -- 1,100 45 -- -- -- --
Malindi 23,275 10,800 10,757 21 18 8.0 8.0 9.2
Source: "Population Census," 1969 and 1979Central Bureau of Statistics
Definitions
Column I 1979 population by town, based on 1979 town boundaries.
Column II : 1969 population by town, adjusted to correspond to 1979 town boundaries.
Column III : 1969 population by town, based on 1969 town boundaries.
Column IV : Area of 1979 boundaries.
Column V : Area of 1969 boundaries.
Column VI : Population growth rate from census data, adjusted for changes in municipal boundaries (Cola. I and II).
Column VII : Population growth rate for the urban core, determined by deducting estimates for rural population residingwithin town boundaries.a/
Column VIII: Population growth rate, 1962-69, adjusted for changes in town boundaries prior to 1969.
a/ To compute a growth rate for the urban core, the rural population included within urban boundaries was subtracted fromthe total population using estimates of the rural-urban split provided in "Human Settlements in Kenya," PhysicalPlanning Department, Ministry of Lands and Settlement, 1978.

-86-
Table 1.3: DISTRIBUTION OF TOWNS AND THEIR POPULATION BY SIZE, 1969-79
1969 1979
Percentage PercentageNo.of Total of Urban No.of Total of Urban
Population Size Towns Population Population Towns Population Population
(in 'OOOs) (in 'OOOs)
100,000 and over 2 756 70% 3 1,322 57%
20,000 - 100,000 2 80 7% 13 568 25%
10,000 - 20,000 7 91 8% 10 140 6%
5,000 - 10,000 11 71 7% 22 154 7%
2,000 - 6,000 25 82 8% 42 123 5%
All Towns 47 1,080 100% 90 2,307 100%
Source: Population Census, 1969 and 1979

-87-
Table 1.4: URBAN GROWTH PROJECTIONS TO YEAR 2000(000's)
2000 20001979 (Based on 1969-79 (Based on 1962-69
(Actual) Growth Rates) a/ Growth Rates) b/Popu- % Share of Popu- % Share of Popu- % Share oflation Urban Pop. lation Urban Pop. lation Urban Pop.
Nairobi 828 36% 2,300 27% 3,500 41%
Mombasa 341 15% 700 8% 1,100 13%
Other ExistingCenters 1,138 49% 5,100 59% 3,500 41%
New UrbanCenters -- _ 500 6% 500 6%
Total 2,307 100% 8,600 100% 8,600 100%
Percentage ofPopulationLiving inUrban Areas 15% 28% 28%
a/ Assumed growth rates: Nairobi, 5.0%; Mombasa, 3.3%; other existingcenters, 7.4%.
b/ As given in "Human Settlements in Kenya," pp. 88-95. The estimates shownare an average of the high and low projections for the major cities andgenerally assume some diminuation of the 1962-69 growth rates.

-88-
Table 1.5: ESTIMATED RURAL-URBAN INCOME DISTRIBUTION, KENYA, 1976
Population Income Avg. Hshld.Inc.(%) (%) (KShs/yr.)
A. Urban 11.9 30.3 9,179
Private Sector (Modern) 7.0 19.6 16,100
Public Sector 1.9 5.8 10,830
Informal Sector 3.0 4.9 5,900
B. Rural 88.1 69.7 5,014
Private Sector (Modern)a/ 5.1 16.4 19,358
Public Sector 3.4 6.2 10,830
Agriculturea/ 79.6 47.1 3,776
Source: This table is adapted from the ILO report, Planning for BasicNeeds in Kenya, 1979, p. 19.
a/ Unskilled and informal workers in the rural sector have been includedunder agriculture, while they are broken out separately for the urbansector. If low-income unskilled workers in the rural sector wereincluded in the rural modern private sector, the apparent urban-ruralwage gap in the private sector would essentially disappear.

-89-
Table 1.6: WAGE EMPLOYMENT AND EARNINGS IN 22 TOWNS, 1982
Wage Employment Earnings Population (1 9 79)a/Town Number Z Rank Amount % Rank Number % Rank
(K£ 000)
Nairobi 291,327 56 1 382,609 66 1 827,775 42 1
Mombasa 95,026 18 2 93,813 16 2 341,148 18 2
Kisumu 17,454 3 4 14,729 3 4 152,643 8 3
Nakuru 20,080 4 3 18,895 3 3 92,851 5 4
Machakos 4,285 1 16 2,390 1 17 84,320 4 5
Meru 5,479 1 11 3,633 1 11 70,439 4 6
Eldoret 15,689 3 5 10,032 2 6 56,503 2 7
Thika 15,097 3 6 11,467 2 5 41,321 2 8
Nyeri 9,417 2 7 7,367 1 7 35,753 2 9
13 others 49,335 9 - 37,659 5 - 251,041 13 -
TOTAL 523,189 100Z - 582,594 100 - 1,947,797 100 -
Source: Statistical Abstract, 1983, Central Bureau of Statistics. Coverage includes 22towns with 1,000 or more persons engaged in wage employment since 1972.
a/ Population Statistics from 1979 Census.

-90-
Table 1.7: PERCENTAGE DISTRIBUTION OF WAGE EMPLOYMENT BY TOWN AND INDUSTRY, 1982
IndustryNext Employment as
Four Towns ina/ % of TotalTerms of Remaining Wage
Industry/Town Nairobi Mombasa Employment 16 Towns Employment
1. Community, Social,and Personal Serviceb/ 54 13 12 21 37
2. Manufacturing 51 18 24 7 21
3. Wholesale and RetailTrade, Restaurantsand Hotels 57 20 10 13 12
4. Transport andCommunications 41 49 6 4 9
5. Construction 70 11 6 4 9
6. Finance, Insurance,Real Estate, andBusiness Services 74 13 7 6 8
7. Other Industries c/ 59 15 7 19 4
Total Wage Employment 56 18 13 13 100
Population Percentage(1979) 42 18 17 33
Source: Statistical Abstract, 1983, Central Bureau of Statistics.
a/ Nakuru, Kisumu, Thika, Eldoret.b/ Includes Government and Parastatal Bodies.c/ Agriculture, Forestry, Mining, Quarrying, Electricity, and Water.

-91-
Table 1.8: GROWTH RATES IN WAGE EMPLOYMENT AND POPULATION BY MAJOR TOWNS
Growth Rates UrbanTown Wage Employment Population (1969-79)
(1970-82)
Nairobi 4.9 5.0
Mombasa 4.3 3.3
Nakuru 2.9 6.2
Kisumu 2.5 3.5
Thika 7.8 5.9
Eldoret 4.4 a/ 7.3
Average for 42 Towns 5.1 6.9
Source: Statistical Abstract, 1983 and 1979, Central Bureau ofStatistics.
a/ Eldoret suffered a large decline in wage employment in 1973 due tothe loss of a major industry. Wage employment subsequently grew atthe rate of 9.7% for the period 1973-82.

-92-
Table 1.9: NAIROBI: HOUSEHOLD INCOME DISTRIBUTION, 1974
Household Mean Per CapitaIncome Group Income Population Income(KSh/mo.) (KSh/mo.) % 7
0-99 15.3 1.0 0.05100-199 71.6 1.0 0.21200-299 91.2 6.5 1.80300-399 100.6 8.0 2.45400-499 147.7 6.0 2.73500-699 143.9 14.1 6.19700-999 179.2 18.1 9.88
1,000-1,499 288.0 17.6 15.491,500-1,999 291.0 8.4 7.442,000-2,499 386.0 3.0 3.54above 2,499 1,003.5 16.4 50.22
Source: "Household Budget Survey," Central Bureau of Statistics. Thistable is reproduced from "Poverty and Growth in Kenya," Annex Iof "Growth and Structural Change in Kenya," IBRD, 1982.

Table 2.1; URRAR INVESTMENTS IN CENTRAL GOVERNMENT ACCOUNTS, 1980/81(Khb 'UUU)
1979
Type of Total2i Large 6 Urbanvestment by Small Popu-
Urban Infra- Land Low-Cost Urban Industry Provincial lationArea Water Sewerage structuret Acquisition Housing Roads Area (KIE) Hospitals Airports Share
Year: 1980/81
Municipalities:
Nairobi 2,250 _ 800 100 3,650 _ 6,800(39%) 212(8Z) 2,342(51%) 1,510(66%) 36%
Mombasa 3,250 100 450 40 440 200 4,480(26%) 170(6%) 800(17%) 745(32%) 15%
Kisumu - - 500 - 760 - 1,260(7%) 184(7%) 300(6%) 42(2%) 7%
Other 1,350 300 - - 709 - 2,359(14%) 1,709(65%) 1,185(26%) _ 16%
Town Councils 250 550 _ - 650 - 1,450(8%) _ _ _ 11%
Urban and CountyCouncils 130 350 - - 500 - 980(6%) 370(14%) _ _ 15%
Not Allocated 2,030 631 370 1,475 125 644 5,275(-) - - -
Total by Typeof Investment 9,260 1,931 2,120 1,615 6,834 844 22,604 2,645 4,627 2,297
(41%) (9%) (9%) (7%) (30%) (4 . . .
Source: "Development Estimates for the Year 1980/81," Republic of Kenya
a/ As percentage of total funds, excluding those in "not allocated" category.
b/ This category consists mostly of off-site infrastructure and communityfacilities financed as part of low-cost housing projects.

Table 2.2: SEWERAGE COVERAGE IN MAJOR TOWNS IN KENYA, 1979
TOWN EXISTING SERVICE SITUATION
(1979 Septic/ConservancyPopulation) % Population Served Type of Treatment Works Tanks Pit Latrines
Nairobi 70% - sewers Full conventional & Both permitted. Septic Exist in the
(Population 20% - septic and oxidation ponds tanks with radial arms outskirts and in
828,000) conservancy Outfall to watercourse or Soakaways unauthorizedtanks development
10% - pit latrines
Mombasa 17% - sewers Partial (screening & Septic tanks form the Exist mostly
(Population 24% - septic tanks sedimentation) and commonest method, with in mainland
341,000) 59% - pit latrines oxidation ditches soakage pits down to residentialOutfalls to the sea water level areas, and in
Majengo partsof the island
Kisumu 60% - sewers Full conventional and Septic tanks with Exist in out- 'O
(Population 35% - septic tanks lagoons soakaways permitted skirts and
153,000) Outfall to the lake squatter areas
Nakuru 50% - sewers Full conventional and Septic tanks and Exist in the
(Population 45% - septic tanks lagoons soakage pits outskirts and
93,000) 5% - pit latrines Outfall to the lake permitted old parts ofthe town
Thika 99% - sewers Lagoons Permitted in the Exist in un-
(Population 1% - septic tanks Outfall to watercourse remaining 1% of the authorized
41,000) & pit latrines town area due to developmenttopographicalobstacles
Source: "Kenya Low Cost Housing By-law Study," Consultant's Report to the Ministry of Urban Developmentand Housing, 1980; Volume Two; Discussion Paper No. 3, pp. 19-20.

-95-
Table 4.1: EXPENDITURE OF LOCAL AUTHORITlES, 1972-1983KE Million
Nairobi Other Town andCity Municipal Sub- CountyCouncil Councils Total Councils Total
1972 13.13 5.77 18.90 3.52 22.421973 13.05 6.00 19.05 3.86 22.911974 13.80 7.92 21.72 3.37 25.091975 16.13 8.50 24.63 5.10 29.731976 18.74 9.71 28.34 5.58 34.031977 21.56 11.05 32.61 7.32 39.931978 24.24 11.39 35.63 9.44 45.071979 26.69 12.72 39.14 11.64 51.051980 35.36 17.93 53.29 11.05 64.341981 44.05 20.78 64.83 13.32 78.151982 * 59.03 27.15 86.18 17.57 103.751983 * 65.22 39.57 104.79 20.23 125.02
PercentageDistribution, 1981 56% 27% 83% 17% 100%
Annual PercentageIncrease, 1972-81 14.4% 15.3% 14.7% 15.9% 14.9%
* Provisional
Source: Economic Survey, Central Bureau of Statistics.
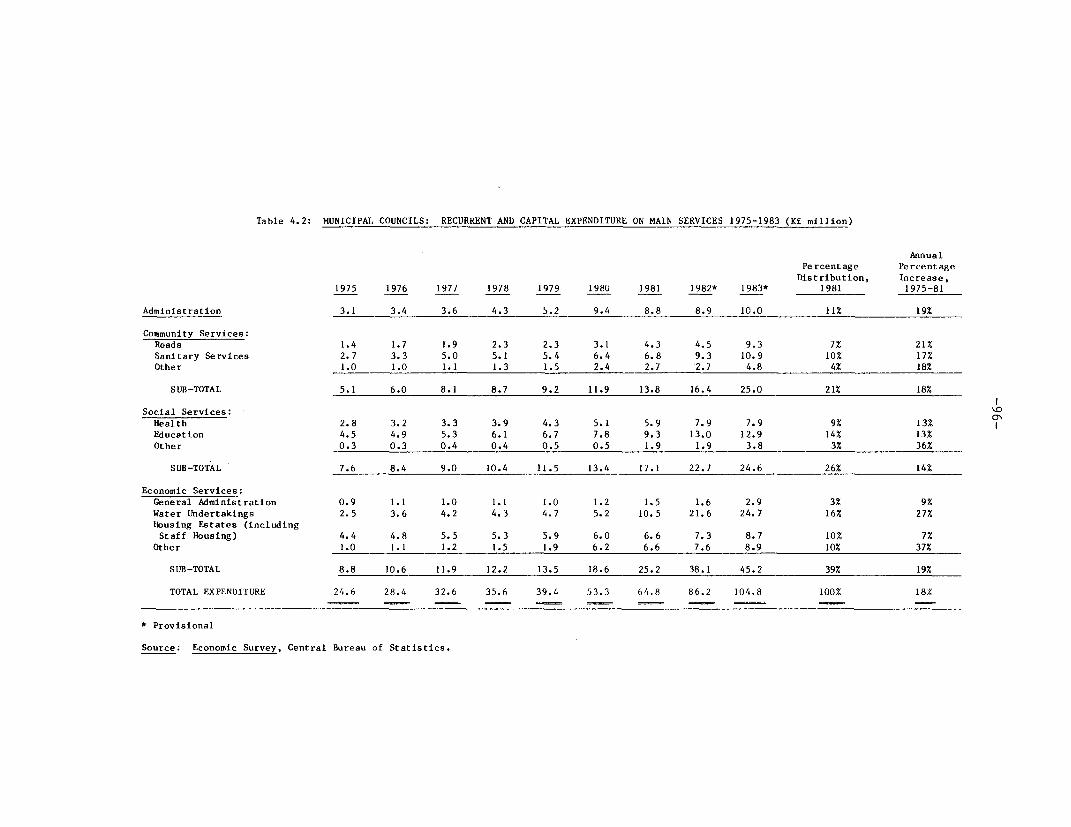
Table 4.2: MUNICIPAL COUNCILS: RECURRENT AND CAPITAL EXPENDITURE ON MAIN SERVICES 1975-1983 (KE million)
AnnualPercentage Percentage
Distribution, Increase,
1975 1976 1977 1978 1979 1980 1981 1982* 1983* 1981 1975-81
Administration 3.1 3.4 3.6 4.3 5.2 9.4 8.8 8.9 10.0 11% 19%
Community Services:Roads 1.4 1.7 1.9 2.3 2.3 3.1 4.3 4.5 9.3 7% 21%
Sanitary Services 2.7 3.3 5.0 5.1 5.4 6.4 6.8 9.3 10.9 10% 17%
Other 1.0 1.0 1.1 1.3 1.5 2.4 2.7 2.7 4.8 4% 18%
SUB-TOTAL 5.1 6.0 8.1 8.7 9.2 11.9 13.8 16.4 25.0 21% 18%
Social Services:Health 2.8 3.2 3.3 3.9 4.3 5.1 5.9 7.9 7.9 9% 13%
Education 4.5 4.9 5.3 6.1 6.7 7.8 9.3 13.0 12.9 14% 13%
Other 0.3 0.3 0.4 0.4 0.5 0.5 1.9 1.9 3.8 3% 36%
SUB-TOTAL 7.6 8.4 9.0 10.4 11.5 13.4 17.1 22.7 24.6 26% 14%
Economic Services:General Administration 0.9 1.1 1.0 1.1 1.0 1.2 1.5 1.6 2.9 3% 9%
Water Undertakings 2.5 3.6 4.2 4.3 4.7 5.2 10.5 21.6 24.7 16% 27%
lousing Estates (includingStaff Housing) 4.4 4.8 5.5 5.3 5.9 6.0 6.6 7.3 8.7 10% 7%
Other 1.0 1.1 1.2 1.5 1.9 6.2 6.6 7.6 8.9 10% 37%
SUB-TOTAL 8.8 10.6 11.9 12.2 13.5 18.6 25.2 38.1 45.2 39% 19%
TOTAL EXPENDITURE 24.6 28.4 32.6 35.6 39.4 53.3 64.8 86.2 104.8 100% 18%
* Provisional
Source: Economic Survey, Central Bureau of Statistics.

Table 4.3: MUNICIPAL COUNCILS: ECONOMIC ANALYSIS OF EXPENDITURE, 1975-1983 (KE million)
AnnualPercentage Percentage
Distribution, Increase
1975 1976 1977 1978 1979 1980 1981 1982* 1983* 1981 1975-81
Recurrent ExpenditureLabor Costs 10.92 11.97 12.66 14.31 15.28 18.99 24.43 30.26 32.13 63% 14%Other Goods and Services 5.37 5.73 6.66 7.23 9.06 10.82 13.30 16.92 23.07 34% 16%Transfer to Households
and Enterprises .45 .69 .42 .63 .55 .69 .95 .93 .79 2% 13%Transfer to Funds (current) .19 .30 .31 .58 .30 .32 .36 .49 .45 1% 11%
TOTAL RECURRENT 16.93 18.69 20.05 22.75 25.19 30.82 39.03 48.60 56.43 100% 15%
Capital ExpenditureGross Fixed CapitalFormation 4.15 5.57 7.81 7.98 9.24 16.59 19.65 29.35 40.19 76% 30%Loan Repayment** 3.43 3.92 4.50 4.49 4.93 5.38 5.61 7.29 7.21 22% 9%Transfer to Funds (capital) .12 .27 .25 .40 .05 .50 .55 .94 .97 2% 29%
TOTAL CAPITAL 7.70 9.76 12.56 12.87 14.22 22.47 25.81 37.58 48.36 100% 22%
TOTAL EXPENDITURE 24.63 28.45 32.61 35.63 39.41 53.29 64.84 86.18 104.79 18%
* Provisional** Includes interest.
Source: Economic Survery, Central Bureau of Statistics.

Table 4.4: TOWN AND COUNTY COUNCILS: ECONOMIC ANALYSIS OF EXPENDITURE, 1975-1983 (KE million)
AnnualPercentage PercentageDistribution Increase
1975 1976 1977 1978 1979 1980 1981 1982* 1983* 1981 1975-81
Recurrent Expenditure
Labor Costs 2.36 2.95 3.50 4.60 5.40 5.56 6.54 8.67 10.08 71% 19%Other Goods and Services .98 1.28 1.83 1.87 1.79 1.99 2.04 3.47 4.26 23% 13%Transfers to Households
and Enterprises .45 .18 .36 .32 .47 .25 .41 .45 .56 4% -2%Transfer to Funds (current) .04 .05 .06 .10 .14 .18 .19 .32 .17 2% 30%
TOTAL RECURREsNT 3.83 4.46 5.75 6.89 7.80 7.97 9.17 12.90 15.08 100% 16% tCo
Capital Expenditure
Gross Fixed CapitalFormation .95 .77 1.23 2.12 1.46 2.62 3.76 3.73 4.44 91% 26%
Loan Repayments** .28 .32 .31 .32 .34 .34 .26 .63 .47 6% -1%Transfer to Funds (capital) .04 .03 .03 .11 .03 .11 .13 .31 .26 3% 22%
TOTAL CAPITAL 1.27 1.12 1.57 2.55 1.83 3.08 4.15 4.67 5.16 100% 22%
TOTAL EXPENDITURE 5.10 5.58 7.32 9.44 9.63 11.05 13.32 17.57 20.23 17%
* Provisional
** Includes interest.
Source: Economic Survey, Central Bureau of Statistics.

Table 4.5: MUNICIPAL COUNCILS: ECONOMIC ANALYSIS OF REVENUE, 1972-1983 (Kt million)
AnnualPercentage PercentageDistribution Increase
1972 1973 1974 1975 1976 1977 1978 1979 1980 1981 1982* 1983* 1981 1972-81**
Recurrent Revenue
Graduated PersonalTax 3.90 3.23 .02 -- -- -- -- -- -- -- -- -- -- --
Direct and IndirectTaxes (Rates,Licenses, Cesses) 3.86 4.15 5.00 5.87 7.08 7.59 7.76 8.47 9.39 16.20 16.88 23.67 43% 17%Sales ot Goodsand Services andOther Income 7.45 8.03 9.06 10.10 12.46 13.95 15.57 16.31 20.15 19.06 25.08 33.88 51% 11%
Government Grants .14 1.43 4.34 5.40 5.65 5.33 6.42 6.95 2.68 2.28 5.34 4.25 6% -9%
TOTAL RECURRENT 15.35 16.84 18.42 21.37 25.19 26.87 29.75 31.73 32.22 37.54 47.30 61.80 100% 10%
Capital Revenue
Loans 4.19 3.01 3.89 3.02 5.69 5.73 5.79 5.87 7.72 12.29 13.52 17.84 -- 13%
* Provisional
** Percentage annual increase for Government grants computed for period 1974-79.
Source: Economic Survey, 1982, Central Bureau of Statistics.

Table 4.6: TOWN AND COUNTY COUNCILS: ECONOMIC ANALYSIS OF REVENUE, 1975-83 (KE million)
AnnualPercentage Percentage
Distribution Increase
1975 1976 1977 1978 1979 1980 1981 1982* 1983* 1979 1975-79
Recurrent Revenue
Direct Taxes (Rates**) .57 .46 .98 .91 1.00 .91 1.32 1.44 1.43 13% 15%
Indirect Taxes (Licensesand Cesses) 1.73 3.22 5.43 4.12 3.77 4.57 4.36 5.56 6.12 41% 17%
Income from Property .63 .72 .83 1.12 1.03 .83 .98 .82 1.48 9% 8%
Current Transfers .07 .18 .26 .45 .45 .71 .74 .88 1.38 7% 48%
Sale of Goods and Services 1.62 2.02 2.23 2.65 2.79 3.43 3.15 5.09 4.62 30% 12% I
TOTAL RECURRENT 4.62 6.70 9.73 9.25 9.04 10.45 10.55 13.79 15.03 100% 15% °
Capital Revenue
Loans Raised .40 .36 .31 .46 .63 .78 1.54 3.23 2.86 25%
* Provisional** Paid by households and enterprises.
Source: Economic Survey, 1982, Central Bureau of Statistics.

Table 4.7: IE IlI REUENES AND EXPE1rruREs OF IARL ER lUNICIPALrrIES (KE ODO)
Peveies 51qendituresUcenses and T Ihers'
Service GFPr Salaries/ Other Total Total dxlget SurplusUser Goensatirg School Grants Pecurrent Public Social blic Finarce and Pecurrent (lWficit) an
Council Buiget Year Rates (aig- Grant Fees Grant and Income Revemjes Education Health Services Works Mministration Other Expenditures General Fund
1. Nairobi 1980 Actual 6,380 3,127 1,000 3,229 804 14,540 4,450 6,344 1,127 2,284 1,757 943 16,905 (2,365)City 1981 Prdbable 10,240 3,670 617 4,177 804 19,508 5,838 7,722 1,440 2,778 2,461 1,731 21,970 (2,462)Co,Idil 1982 Estinate 11,320 4,892 562 4,268 804 21,846 6,463 8,503 1,590 2,925 2,690 2,223 24,394 (2,548)
2. Mbra 1980 Actual 1,115 1,231 300 986 119 3,751 1,379 1,135 125 1,238 295 39 4,211 (460)lMiicipal 1981 Probable 2,609 1,604 199 1,472 125 6,009 1,685 1,679 204 1,563 358 84 5,573 436Ocxicil 1982 Estimate 2,609 1,821 185 1,334 125 6,074 2,111 2,077 289 2,141 494 112 7,224 (1,150)
3. Kisumu 1980 Actual 169 401 67 339 40 1,016 193 332 103 382 213 - 1,223 (207)lxnicipal 1981 Probable 320 490 67 181 50 1,108 396 417 141 320 275 - 1,549 (441)0hncil 1982 Estinate 350 841 67 896 50 2,204 1,046 604 152 367 363 - 2,532 (328)
4. Nakuru 1979 Actual 353 423 67 535 45 1,423 616 301 124 256 31 - 1,328 95?Micipal 1980 Actual 452 439 54 624 45 1,614 726 374 145 275 38 - 1,558 56(xincil 1981 Probable 423 468 59 868 75 1,893 900 448 158 333 38 - 1,877 16 °
5. Eldoret 1979 Actual 113 306 39 154 14 626 149 68 43 203 52 45 560 661xnicipal 1980 Probabe 131 346 27 197 14 715 209 97 57 315 79 62 819 (104)Couil 1981 Estimate 131 385 27 197 14 754 244 111 65 341 93 82 936 (182)
6. lhika 1979 Actual 100 239 37 163 13 552 144 80 23 135 155 29 566 (14)tmnicipal 1980 Prbable 30(a/ 318 31 138 18 805 168 140 40 169 216 45 778 27Coumcil 198l Fstieste 201 359 30 140 47 777 154 96 32 198 220 54 754 23
7. Kitale 1979 Actual 96 127 31 139 11 404 125 58 32 122 91 - 428 (24)midipal 1980 Prdbale 98 153 23 173 18 465 204 75 46 141 119 - 585 (120)
Coamcil 1981 Estimte 98 150 31 218 25 522 214 83 51 148 109 - 605 (83)
a/ Includes collection of arrears.

-102-
Table 4.8: SUMMARY OF FUND BALANCES, 1981 a/(K£ '000)
Reserve Water Housing OtherCouncil Fund Fund Fund Funds Total
Nairobi City Council (4,105) 12,977 (1,736) _ 7,136Mombasa Municipal Council 936 - 276 - 1,212
Kisumu Municipal Council (331) 393 420 130 612Nakuru Municipal Council (16) 249 464 - 697Eldoret Municipal Council 412 409 141 19 981Thika Municipal Council (168) 700 161 - 693Kitale Municipal Council (297) (42) 114 - (225)
Source: Budget Estimates for various towns; all balances are estimated asof end 1981.
a/ Excluding Capital and Renewal Funds.

-103-
Table 4.9: SOURCE OF FINANCING FOR RECURRENT EXPENDITURES a/
Licensesand User Surplus (-)
Rates Charges Grants Deficit (+)
Nairobi 38% 18% 30% + 14%Mombasa 27% 29% 33% + 11%Kisumu 14% 33% 36% + 17%Nakuru 26% 32% 49% - 7%Eldoret 20% 55% 37% - 12%Thika 18% 42% 38% + 2%Kitale 22% 30% 42% + 6%
a/ Nairobi, Mombasa, Kisumu (1980).Nakuru, Eldoret, Thika, Kitale (1979).

-104-
Table 5.1: PERCENTAGE DISTRIBUTION OF URBAN DWELLING UNITSBY SECTOR, 1979 a/
Private Sector
Formal b/ 64%Informal c/ 18%
Sub-total 82%
Public Sector
Local Authorities 10%Central Government d/ 8%
Sub-total 18%
Notes:
a/ A dwelling unit is defined as a place of residence for a family, anindividual, or a group of persons eating together and sharing the budgetfor common provisions. A single housing structure may contain multipledwelling units.
b/ Includes site and service plots provided by the public sector.
c/ Informal housing includes both squatter settlements and housingdeveloped by land-owners who have not completed the required legalprocedures of sub-division and registration. Much of the latter type ofhousing is owned by land companies, such as those holding large tractsin Mathare Valley in Nairobi.
d/ Includes public boards and corporations.
Source: "Report on the 1979 Rent Survey in Urban Areas of Kenya," Central Bureau ofStatistics, 1981.

-105-
Table 5.2: PERCENTAGE DISTRIBUTION OF PRIVATE HOUSINGBY TYPE AND TENANCY STATUS, 1979
Tenancy/Type a! House Block Other Sub-total
Owner-occupied 4% 2% 18% 24%
Rental 5% 7% 64% 76%
Sub-total 9% 9% 82% 100%
Average Number of Rooms
per Dwelling Unit 4.1 3.3 1.4
a/ Definitions:
House: A self-contained dwelling unit on its own compound andoccupied by a single family or group of people sharing acommon budget for basic provisions.
Block: Includes both flats (a self-contained dwelling unit joined toothers in a single multi-storied building) and maisonettes(a semi-detached or terraced self-contained dwelling unit ontwo floors).
Other: All other dwelling units, such as structures occupied byseveral families in dwelling units that are not self-contained,for example by having toilet facilities outside the main dwellingunit.
Source: "Report on the 1979 Rent Survey in Urban Areas of Kenya," Central Bureau ofStatistics 1981

-106-
Table 5.3: VALUE OF RESIDENTIAL BUILDING PLANSAPPROVED BY NAIROBI CITY COUNCIL
1974-82 (KE '000)
Private Public
1974 11,204 1,324
1975 7,961 1,415
1976 6,927 598
1977 15,177 2,964
1978 26,202 4,115
1979 33,641 1,765
i980 53,238 1,322
1981 56,269 1,952
1982 34,013 6,091
Source: Statistical Abstract, Central Bureau of Statistics

Table 5.4: RENT INDEX FOR NAIROBI, 1974-82, BY INCOME GROUPS a/
AverageAverage AnnualAnnual Change inChange in Price Index
Year b/ Rent for All OtherIncome Group 1974 1975 1976 1977 1978 1979 1980 1981 1982 Index Commodities
Upper Income 96.9 109.3 115.6 135.1 145.7 164.1 186.1 221.0 259.4 20.3 20.9Annual Change 12.4 6.3 19.5 10.6 18.4 22.0 34.9 38.4
Middle Income 96.2 111.1 120.5 146.3 158.7 175.3 195.2 243.5 288.3 24.0 20.0 ,Annual Change 14.9 9.4 25.8 12.4 16.6 19.9 48.3 44.8
Lower Income 95.3 114.0 124.3 161.0 187.7 205.1 232.0 277.6 314.6 27.4 21.2Annual Change 18.7 10.3 39.7 23.7 17.4 26.9 45.6 37.0
Residential Bldg n.a. n.a. 181.0 198.9 217.9 250.1 n.a. n.a. n.a.Cost Index c/ 17.9 19.0 32.2
a/ (Base: January-June, 1975 - 100)b/ Computed at December of each year.c/ (Base: December, 1972 - 100)n.a. - not available.
Source: Statistical Abstract, Central Bureau of Statistics.

-108-
Table 5.5: SOURCES OF NEW RESIDENTIAL PLOTS( ANNUAL AVERAGE 1981-85)
Plots
Allocated by Commissioner of Lands 1,000
Private - legal subdivisions 4,000
squatting and informal subdivisions 23,000
Allocated by NHC and Local Authorities 2,000
Source: Mission estimates, based on Commissioner of Lands monthly reports,approved subdivision statistics, NCC monthly minutes, and NHCstatistics. The definition of a "plot" in an informal subdivisionis a loose concept and may include a single room in a multi-familyrental structure.

-109-
Table 5.6: ANNUAL URBAQN LAND REQUIREMENTS(1981-85)
Nairobi Kenya
DU's a/ Land (ha) DU's Land (ha)
NEW DWELLINGS
Government/ParastatalLocal Authority@ 250 m2 /DU 2,000 50 3,000 75
Private Authorized@ 10 DU's/ha 2,500 250 4,000 400
Private Unauthorized@ 50 DU's/ha 10,000 200 23,000 460
Total Residential 14,500 500 30,000 935
NON RESIDENTIAL 500
Commercial and OtherUses (based on estimated1:1 ratio of residential landto other land in urban areas) 500 935
TOTAL 1,000 1,870
Source: Mission estimates based on prevailing densities forresidential construction and published statistics of approvednon-residential development for 1976-1978.
a/ DU = dwelling units.

Table 5.7: LOCAL AUTHORITY HOUSING STOCK,(1969-80)
1969 1976 1980 1969-80
Type Number Percent Number Percent Number Percent Percentage AnnualChange
Rental Housing 27,092 90% 30,674 80% 34,820 69% 2.3%
Tenant Purchase 1,852 6% 4,185 11% 6,243 12% 11.7%
Site-and-Service Plots 1,321 4% 3,593 9% 9,861 19% 20.1%
Total 30,265 100% 38,452 100% 50,924 100% 4.8%
Source: Up to 1974, "Local Authority Housing in Kenya," HRDU, 1978.Thereafter, NHC Annual Reports.

-111-
Table 5.8: HOUSING UNITS COMPLETED BY THE NATIONAL HOUSING CORPORATION(1976-83)
HOUSING UNITS
NAIROBI ELSEWHERESITE AND
Average Average SERVICENo. of Value of No. of Value of PLOTS a/Units Units (KE) Units Units (KE) No. of Plots
1976 1,031 596 752 1,164 1,1281977 586 2,399 1,226 874 3551978 862 3,042 682 1,861 1,0771979 3,056 1,694 1,029 1,264 2,3891980 616 2,604 2,911 1,395 2,4541981 1,072 898 1,683 1,192 2,7191982 2,311 878 617 3,538 2,5501983 -- -- 680 2,878 598
TOTAL 6,767 6,695 10,405
a/ Includes site and service plots completed by local authorities withNHC financing.
Source: Economic Survey, Central Bureau of Statistics

I

IBRD 15860R
S U D A N ._-.7 I
// E T H I 0 P I A
I \\.--. EASTERNr
U G A N D A - \i
<
/
K 0~~~~~~~~~~~~~~~~~~~~
IFT VALLEY NORTH EASTERN 5-
UGA DA ) / ) N
1F 1 NY'SZAS A/ v CENT
24 i W .~~~~NAIROBI(Kos 9
KENYA i * RIF VALLEYURBAN AREAS 1979 COASTRA
T.-n a,h p.plbt- wer 10,000 \ \
. / 95.f0-1 ; "Om,
Sooo ,b A F R I c A :wrA,2~
S N.t,on.l -cp-:l K-nyo/ \K-P-ovnc cait l 0 40 ro W2 Wh K
o~~~~~~~~~~~~~~~~~~~~~~~~~~~~~~~~
. -- Provi... b-udarifs . J >hoW4 20 40 WO BO 1~0. MLES
URBAN AR S 1 9AUGUST 1985