report handbook of uncertainty calculations for ultrasonic oil … · 2019-03-20 · bergen -...
TRANSCRIPT

BERGEN - 31.12.2015 Ref. No.: CMR-15-A14071-RA-1 Rev.: 00
REPORT
Handbook of uncertainty calculations for ultrasonic oil flow metering stations Documentation of uncertainty models and internet tool
Authors
Kjell-Eivind Frøysa, Per Lunde, Gaute Øverås Lied


Handbook of uncertainty calculations for ultrasonic oil flow metering stations Report
Ref. no.: CMR-15-A14071-RA-1 Rev.: 00 Date: 31.12.2015 Page 3 of 66
© Christian Michelsen Research AS. This document is an original Christian Michelsen Research (CMR) document.
Table of Contents
Disclaimer ............................................................................................................................................... 5
1 Introduction ................................................................................................................................ 6
2 Description of metering stations .............................................................................................. 8
3 Oil measurement uncertainties ................................................................................................ 9
3.1 Temperature measurement ......................................................................................................... 9
3.2 Pressure measurement .............................................................................................................. 10
3.3 Density measurement ................................................................................................................ 11
4 Functional relationships.......................................................................................................... 13
4.1 Overall functional relationships .................................................................................................. 13
4.1.1 Volumetric flow rate at standard conditions ............................................................... 13
4.1.2 Volumetric flow rate at line conditions ....................................................................... 15
4.1.3 Mass flow rate ............................................................................................................ 16
4.2 Oil volume expansion coefficients .............................................................................................. 17
4.2.1 Overall expression ..................................................................................................... 17
4.2.2 Temperature volume expansion coefficient ............................................................... 17
4.2.3 Pressure volume expansion coefficient ..................................................................... 18
4.3 Steel volume expansion coefficients .......................................................................................... 18
4.3.1 Temperature volume expansion coefficient ............................................................... 19
4.3.2 Pressure volume expansion coefficients ................................................................... 19
5 Uncertainty models .................................................................................................................. 22
5.1 Volumetric flow rate at standard conditions ............................................................................... 22
5.2 Volumetric flow rate at line conditions ........................................................................................ 22
5.3 Mass flow rate ............................................................................................................................ 23
5.4 Calibration uncertainties............................................................................................................. 23
5.5 Proving uncertainties .................................................................................................................. 24
5.6 Metering uncertainties ................................................................................................................ 25
5.7 Oil and steel expansion factor uncertainties .............................................................................. 26
5.7.1 Volumetric flow rate at standard conditions ............................................................... 26
5.7.2 Volumetric flow rate at line conditions ....................................................................... 28
5.7.3 Mass flow rate ............................................................................................................ 29
5.8 Expansion factor model uncertainties ........................................................................................ 31
5.8.1 Oil expansion factor - introduction ............................................................................. 31
5.8.2 Oil expansion factor pm
liqA , ...................................................................................... 32
5.8.3 Oil expansion factor pm
liqA ,........................................................................................ 34
5.8.4 Oil expansion factor p
liqA ........................................................................................... 35

Handbook of uncertainty calculations for ultrasonic oil flow metering stations Report
Ref. no.: CMR-15-A14071-RA-1 Rev.: 00 Date: 31.12.2015 Page 4 of 66
© Christian Michelsen Research AS. This document is an original Christian Michelsen Research (CMR) document.
5.8.5 Steel expansion factor cpm
steelA ,, .................................................................................. 36
6 Program .................................................................................................................................... 39
6.1 Software platform ....................................................................................................................... 39
6.2 Installation and use .................................................................................................................... 39
6.3 Program overview ...................................................................................................................... 39
6.3.1 Specify metering station template ............................................................................. 40
6.3.2 Oil Properties Page ................................................................................................... 42
6.3.3 Equipment Page ........................................................................................................ 43
6.3.4 Calibration Page ........................................................................................................ 45
6.3.5 Proving Page ............................................................................................................. 47
6.3.5.1 Proving with Ultrasonic or Turbine Master Meter ...................................................... 47
6.3.5.2 Proving with displacement prover .............................................................................. 48
6.3.6 Metering Page ........................................................................................................... 50
6.3.7 Results Page ............................................................................................................. 51
6.3.8 Uncertainty Budget Charts Page ............................................................................... 54
6.3.9 Uncertainty Range Plots Page .................................................................................. 55
6.3.10 Uncertainty Report Page ........................................................................................... 55
6.3.11 Note about “Save” and “Open” functionality .............................................................. 57
6.3.12 Note about “opening” an uncertainty analysis file ..................................................... 57
7 Summary ................................................................................................................................... 58
8 References ................................................................................................................................ 59
Appendix A Detailed formulas for the linearity contribution to the proving uncertainty ......... 61
A 1 Functional relationship ............................................................................................................... 61
A 2 Uncertainty model ...................................................................................................................... 62
Appendix B List of symbols ............................................................................................................ 65

Handbook of uncertainty calculations for ultrasonic oil flow metering stations Report
Ref. no.: CMR-15-A14071-RA-1 Rev.: 00 Date: 31.12.2015 Page 5 of 66
© Christian Michelsen Research AS. This document is an original Christian Michelsen Research (CMR) document.
Disclaimer
CMR is not liable in any form or manner for the actual use of the documents, software or other results made available for or resulting from a project and does not warrant or assume any liability or responsibility for the completeness or usefulness of any information unless specifically agreed otherwise in the tender and resulting contract document.

Handbook of uncertainty calculations for ultrasonic oil flow metering stations Report
Ref. no.: CMR-15-A14071-RA-1 Rev.: 00 Date: 31.12.2015 Page 6 of 66
© Christian Michelsen Research AS. This document is an original Christian Michelsen Research (CMR) document.
1 Introduction
Documentation of uncertainty of flow rates measured by fiscal flow metering stations is essential as part of the evaluation of the condition of such metering stations. Authorities have requirements with respect to maximum uncertainty in order to secure the national interests. The partners selling the oil have interests in the uncertainty to secure their incomes. Finally, buyers of oil have interest in ensuring that they are not getting a lower amount of oil than what they pay for. In order to get all parties to accept an uncertainty analysis, it is important to obtain standardized ways of carrying out such analyses. The ISO Guide to the expression of uncertainty in measurement, [ISO GUM] provides general methodology for carrying out uncertainty analyses. This methodology can also be applied in uncertainty analysis of fiscal oil metering stations. However, the ISO GUM does not give detailed methods for the specific uncertainty analyses for such metering stations (or other applications). Therefore models have to be developed based on the ISO GUM methodology. Similarly the ISO 5168 [ISO 5168] provides general procedures for evaluation of uncertainty for the measurement of fluid flow. Also the procedures in this standard have to be developed further in order to approach the uncertainty evaluation of a specific metering station. The Norwegian Society for Oil and Gas Measurement (NFOGM) in cooperation with the Norwegian Petroleum Directorate (NPD) and The Norwegian Society of Graduate Technical and Scientific Professionals (Tekna) have earlier issued Handbook for uncertainty calculations for gas metering stations [Frøysa et al, 2014]. That handbook is in agreement with the ISO GUM methodology. The calculation of the uncertainty according to that Handbook can be done free of charge using a Microsoft Silverlight based calculation program available at www.nfogm.no. Prior to that handbook, some more technology-specific uncertainty handbooks for a fiscal ultrasonic gas metering station [Lunde et al, 2002] and for a fiscal orifice gas metering station and a turbine oil metering station [Dahl et al, 2003] have been issued. These works are also in agreement with the ISO GUM methodology, and were based on a previous version of the ISO GUM from 1995. The calculation of the uncertainty have in these works been based on an Excel spread sheet that can be downloaded for free from www.nfogm.no. In addition, uncertainty models for fiscal turbine oil metering stations [Dahl et al, 2003] and fiscal ultrasonic oil metering stations [Lunde et al, 2010] have been established. The present work is a similar Handbook as [Frøysa et al, 2014], but for fiscal oil metering stations with ultrasonic flow meters used as duty meters. The intention of this work is to establish an uncertainty analysis model covering common fiscal oil metering station configurations in use on the Norwegian Sector. The intention is also to make a tool in which a complete uncertainty analysis for an oil metering station can be performed within one tool in a minimum of time. This is achieved as the tool calculates all necessary parameters from a minimum of inputs, having reasonable default values, having default input values for uncertainty in accordance with requirements in the Norwegian measurement regulations and NORSOK and by making it easy to define the most common metering station configurations in the tool. The uncertainty model has been made flexible, allowing (i) ultrasonic master meter prover (ii) turbine mater meter prover or (iii) volume prover. The uncertainty model is implemented on a web-based Microsoft Silverlight technology. This can be accessed for free from www.nfogm.no. This Handbook is a documentation of the uncertainty models developed and the web-based calculation tool. It should be noted that the example input values in that calculation tool are just examples, and should not be regarded as recommended values by NFOGM, CMR, NPD or any other party. Chapter 2 describes on an overview level the metering stations covered in the Handbook. In Chapter 3, uncertainties related to secondary instrumentation temperature, pressure and density are covered. Chapter 4 presents the functional relationships defining the metering stations, Chapter 5 documents the uncertainty models for the metering stations and Chapter 6 documents the web-based uncertainty calculation program. Chapter 7 includes a brief summary of the Handbook.

Handbook of uncertainty calculations for ultrasonic oil flow metering stations Report
Ref. no.: CMR-15-A14071-RA-1 Rev.: 00 Date: 31.12.2015 Page 7 of 66
© Christian Michelsen Research AS. This document is an original Christian Michelsen Research (CMR) document.
Appendix A contains some details with respect to the uncertainty model related to adjustments of a flow meter after flow calibration. Appendix B contains a list of symbols. The uncertainty models presented here are based on the ISO GUM uncertainty methodology. The measurement regulations by the Norwegian Petroleum Directorate and the NORSOK standard I-106 on fiscal measurement systems for hydrocarbon gas [NORSOK I-106] have been important references with respect to layout of the meter stations and requirements to the uncertainty of individual instruments and the operation of the metering station as a whole. A series of ISO, API MPMS and other international standards and reports have also been essential in this work. The details are covered in the relevant sections of the Handbook. It is also referred to the reference list in Chapter 8. The present work has been carried out for Norwegian Society for Oil and Gas Measurement (NFOGM) with financial support also from Norwegian Petroleum Directorate and Tekna. A reference group consisting of the following members has reviewed the work:
Dag Flølo, Statoil and NFOGM
Bjørnulv Johansen, Statoil
Frode Flåten, ConocoPhillips
Jostein Eide, Statoil
Reidar Sakariassen, MetroPartner
Steinar Vervik, Norwegian Petroleum Directorate
Skule Smørgrav, FMC Technologies Dag Flølo has been especially involved with regular project meetings and discussions throughout the project.

Handbook of uncertainty calculations for ultrasonic oil flow metering stations Report
Ref. no.: CMR-15-A14071-RA-1 Rev.: 00 Date: 31.12.2015 Page 8 of 66
© Christian Michelsen Research AS. This document is an original Christian Michelsen Research (CMR) document.
2 Description of metering stations
In the present Handbook, three metering station configurations are covered. They are all based on an ultrasonic flow meter as the primary flow meter. The ultrasonic flow meter is proved by a displacement prover or a master meter:
Configuration 1: Displacement prover [API MPMS 4.2]
Configuration 2: Ultrasonic master meter prover [API MPMS 4.5 and 5.8]
Configuration 3: Turbine master meter prover [API MPMS 4.5 and 5.3] It is assumed that the proving of the primary flow meter is carried out at a single flow rate. The calibration of the proving device will in case of master meter provers be carried out at a series of flow rates. In case of a displacement prover, the prover is calibrated at a single flow rate only. The metering station is also equipped either with densitometer giving the density at the densitometer pressure and temperature conditions, or provided e.g. with sampling and laboratory analysis, which gives yje standard density with a given uncertainty. Water in oil is not covered. Therefore, uncertainty related to sampling and analysis is not explicitly covered. The densitometer, the flow meter and the proving device are all equipped with pressure and temperature measurements.

Handbook of uncertainty calculations for ultrasonic oil flow metering stations Report
Ref. no.: CMR-15-A14071-RA-1 Rev.: 00 Date: 31.12.2015 Page 9 of 66
© Christian Michelsen Research AS. This document is an original Christian Michelsen Research (CMR) document.
3 Oil measurement uncertainties
This chapter will address the uncertainty models for the measurements of temperature in Section 3.1, pressure in Section 3.2 and density in Section 3.3.
3.1 Temperature measurement
The uncertainty model for the temperature measurement follows the similar model in [Lunde et al, 2002] and [Dahl et al, 2003]. The uncertainty in the measured temperature can be specified in two ways:
Overall level.
Detailed level. In case of the overall level, the absolute uncertainty in the measured temperature is specified directly by the user of the uncertainty calculation program. In case of the detailed level, the following uncertainty model is used:
,22
,
2
22
,
2
,
2
miscelemstabtemp
RFItransmstabtransmelem
TuTuTu
TuTuTuTu
(3-1)
where
transmelemTu ,: standard uncertainty of the temperature element and temperature transmitter, calibrated
as a unit. Typically found either in product specifications or in calibration certificates.
transmstabTu ,: standard uncertainty related to the stability of the temperature transmitter, with respect
to drift in readings over time. Typically found in product specifications.
RFITu : standard uncertainty due to radio-frequency interference (RFI) effects on the
temperature transmitter.
tempTu : standard uncertainty of the effect of temperature on the temperature transmitter, for
change of gas temperature relative to the temperature at calibration. Typically found in product specifications.
elemstabTu ,: standard uncertainty related to the stability of the temperature element. Instability may
relate e.g. to drift during operation, as well as instability and hysteresis effects due to oxidation and moisture inside the encapsulation, and mechanical stress during operation. Typically found in product specifications.
miscTu : standard uncertainty of other (miscellaneous) effects on the temperature transmitter.
This uncertainty model is quite generic, and can be used on a series of industrial products. In cases where this model does not fit with the product specifications, the miscellaneous uncertainty contributions can be used for specification of other uncertainty contributions. Alternatively, the uncertainty of the temperature measurements can be calculated manually, and the result can be given to the program using the overall input level. When the average of two temperature measurements is used, it is assumed that the two temperature measurements are uncorrelated. The reason for this assumption is that often the two probes are not calibrated at the same time. This means that even if they are calibrated using the same procedure, the

Handbook of uncertainty calculations for ultrasonic oil flow metering stations Report
Ref. no.: CMR-15-A14071-RA-1 Rev.: 00 Date: 31.12.2015 Page 10 of 66
© Christian Michelsen Research AS. This document is an original Christian Michelsen Research (CMR) document.
time difference generates an uncorrelated drifting term, both in the reference and in the temperature measurement itself. This means that the uncertainty in the average of two temperature measurements is assumed to be equal to the uncertainty for one measurement, divided by the square root of two.
3.2 Pressure measurement
The uncertainty model for the pressure measurement follows the similar model in [Lunde et al, 2002] and [Dahl et al, 2003]. The uncertainty in the measured pressure can be specified in two ways:
Overall level.
Detailed level. In case of the overall level, the relative uncertainty in the measured pressure is specified directly by the user of the uncertainty calculation program. In case of the detailed level, the following uncertainty model is used:
,222
2222
miscatmtemp
RFIstabilityrtransmitte
PuPuPu
PuPuPuPu
(3-2)
where
rtransmittePu : standard uncertainty of the pressure transmitter, including hysteresis, terminal-based
linearity, repeatability and the standard uncertainty of the pressure calibration laboratory.
stabilityPu : standard uncertainty of the stability of the pressure transmitter, with respect to drift in
readings over time.
RFIPu : standard uncertainty due to radio-frequency interference (RFI) effects on the pressure
transmitter.
tempPu : standard uncertainty of the effect of ambient air temperature on the pressure transmitter,
for change of ambient temperature relative to the temperature at calibration.
atmPu : standard uncertainty of the atmospheric pressure, relative to 1 atm. = 1.01325 bar (or
another nominal value that is used), due to local meteorological effects. This effect is only of relevance for units measuring gauge pressure. It can be reduced by using the actually measured barometric pressure instead of a nominal atmospheric pressure.
miscPu : standard uncertainty due to other (miscellaneous) effects on the pressure transmitter,
such as mounting effects, etc. This uncertainty model is quite generic, and can be used on a series of industrial products. In cases where this model does not fit with the product specifications, the miscellaneous uncertainty contributions can be used for specification of other uncertainty contributions. Alternatively, the uncertainty of the pressure measurements can be calculated manually, and the result can be given to the program using the overall input level. When the average of two pressure measurements is used, it is assumed that the two pressure measurements are uncorrelated. The reason for this assumption is that often the two probes are not calibrated at the same time. This means that even if they are calibrated using the same procedure, the time difference generates an uncorrelated drifting term, both in the reference and in the pressure
Handbook of uncertainty calculations for ultrasonic oil flow metering stations Report
Ref. no.: CMR-15-A14071-RA-1 Rev.: 00 Date: 31.12.2015 Page 11 of 66
© Christian Michelsen Research AS. This document is an original Christian Michelsen Research (CMR) document.
measurement itself. This means that the uncertainty in the average of two pressure measurements is assumed to be equal to the uncertainty for one measurement, divided by the square root of two.
3.3 Density measurement
The uncertainty model for the density measurement follows the similar model as in [Dahl et al, 2003]. The uncertainty in the measured density can be specified in two ways:
Overall level.
Detailed level. In case of the overall level, the relative uncertainty in the measured density is specified directly by the user of the uncertainty calculation program. In case of the detailed level, the uncertainty model is more complicated than for the temperature and pressure measurements above. The density measurement consists of several steps:
Measurement of an uncorrected density from the period measurement of a vibrating string.
Corrections based on temperature difference between calibration and measurement.
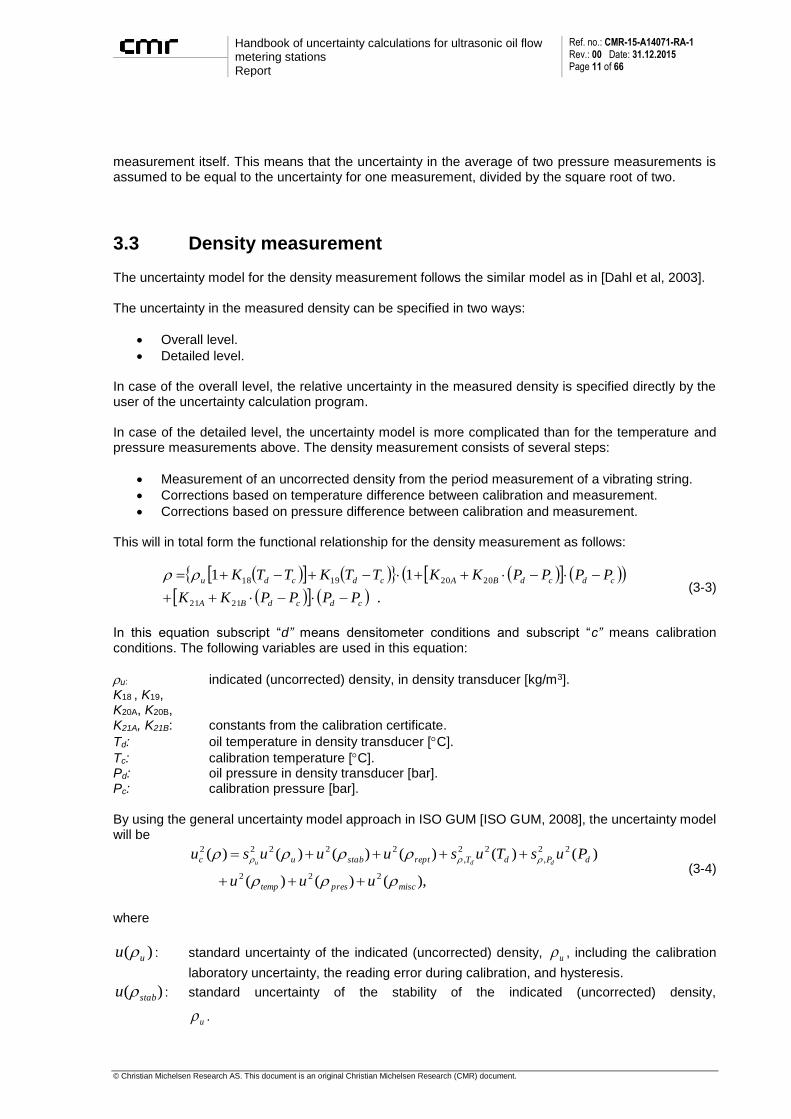
Corrections based on pressure difference between calibration and measurement. This will in total form the functional relationship for the density measurement as follows:
.
11
2121
20201918
cdcdBA
cdcdBAcdcdu
PPPPKK
PPPPKKTTKTTK
(3-3)
In this equation subscript “d” means densitometer conditions and subscript “c” means calibration conditions. The following variables are used in this equation:
u: indicated (uncorrected) density, in density transducer [kg/m3]. K18 , K19, K20A, K20B, K21A, K21B: constants from the calibration certificate.
Td: oil temperature in density transducer [C].
Tc: calibration temperature [C]. Pd: oil pressure in density transducer [bar]. Pc: calibration pressure [bar]. By using the general uncertainty model approach in ISO GUM [ISO GUM, 2008], the uncertainty model will be
),()()(
)()()()()()(
222
22
,
22
,
22222
miscprestemp
dPdTreptstabuc
uuu
PusTusuuusuddu
(3-4)
where
)( uu : standard uncertainty of the indicated (uncorrected) density, u , including the calibration
laboratory uncertainty, the reading error during calibration, and hysteresis.
)( stabu : standard uncertainty of the stability of the indicated (uncorrected) density,
u .

Handbook of uncertainty calculations for ultrasonic oil flow metering stations Report
Ref. no.: CMR-15-A14071-RA-1 Rev.: 00 Date: 31.12.2015 Page 12 of 66
© Christian Michelsen Research AS. This document is an original Christian Michelsen Research (CMR) document.
)( reptu : standard uncertainty of the repeatability of the indicated (uncorrected) density, u .
)( dTu : standard uncertainty of the oil temperature in the densitometer, dT .
)( dPu : standard uncertainty of the oil pressure in the densitometer, dT .
)( tempu : standard uncertainty of the temperature correction factor for the density, representing
the model uncertainty of the temperature correction model used,
cdcdu TTKTTK 19181 and the pressure correction model used,
.1 21212020 cdcdBAcdcdBA PPPPKKPPPPKK This
includes also the uncertainty of the various K-coefficients, and the measurement of the pressure and temperature during calibration.
)( miscu : standard uncertainty of the density, accounting for miscellaneous uncertainty contributions,
such as due to:
reading error during measurement (for digital display instruments),
possible deposits on the vibrating element,
possible corrosion of the vibrating element,
mechanical (structural) vibrations on the oil line,
variations in power supply,
self-induced heat,
flow in the bypass density line,
possible liquid viscosity effects,
effect of a by-pass installation of the densitometer,
other possible effects. The sensitivity coefficients in Eq. (3-4) can be calculated from the functional relationship Eq. (3-3) by use of the ISO GUM methodology:
cdcdBAcdcd PPPPKKTTKTTKsu
20201918 1)()(1 , (3-5)
cdcdBAuT PPPPKKKKsd
20201918, 1 , (3-6)
.2
21
2121
20201918,
cdBA
cdBAcdcduP
PPKK
PPKKTTKTTKsd
(3-7)
These expressions are in practice obtained by partially derivation of the density (Eq. (3-3)) with respect
to u , dT and dP , respectively.
Handbook of uncertainty calculations for ultrasonic oil flow metering stations Report
Ref. no.: CMR-15-A14071-RA-1 Rev.: 00 Date: 31.12.2015 Page 13 of 66
© Christian Michelsen Research AS. This document is an original Christian Michelsen Research (CMR) document.
4 Functional relationships
In this Chapter, overall functional relationships for the volumetric flow rates at standard and line conditions, and for mass flow rate are presented in Section 4.1. The functional relationships for the oil expansion coefficients for the expansion of oil due to pressure and temperature are covered in Section 4.2. The functional relationships for the steel expansion coefficients for the expansion of steel due to pressure and temperature are covered in Section 4.3.
4.1 Overall functional relationships
In this section, the functional relationship for the volumetric flow rate at standard conditions is covered in Section 4.1.1. In Section 4.1.2 the functional relationship for the volumetric flow rate at line conditions is covered, and in Section 4.1.3 the functional relationship for the mass flow rate is covered.
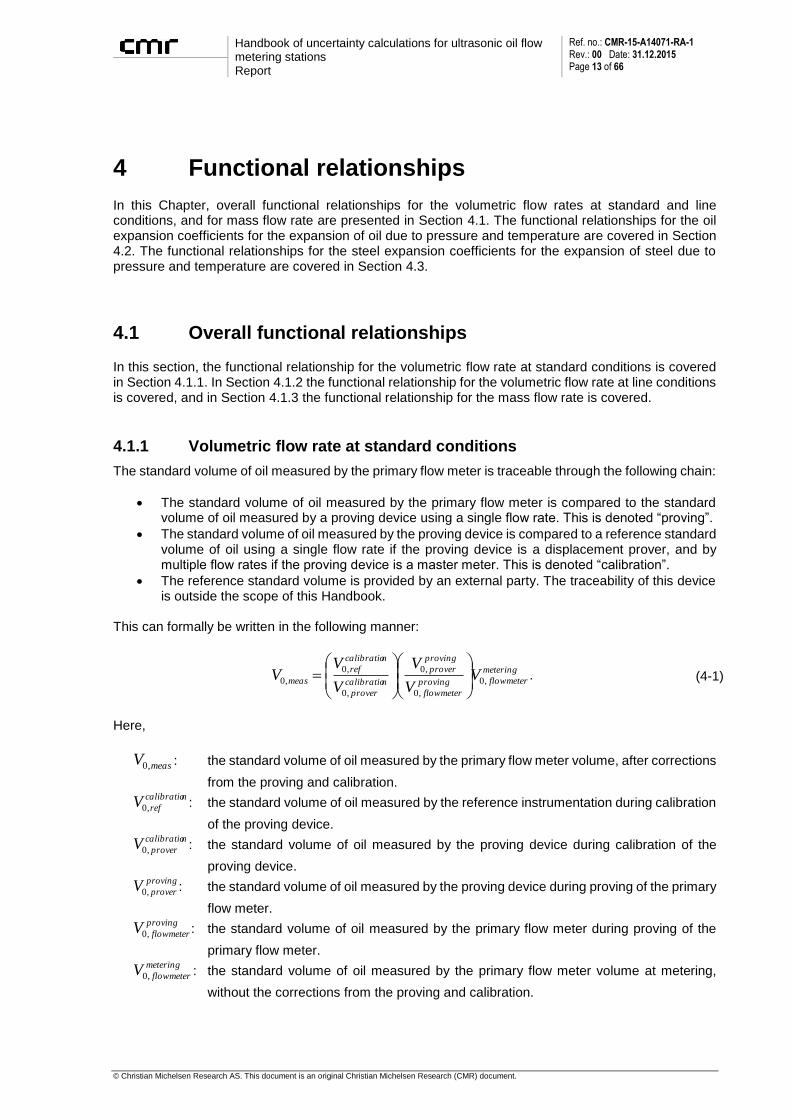
4.1.1 Volumetric flow rate at standard conditions
The standard volume of oil measured by the primary flow meter is traceable through the following chain:
The standard volume of oil measured by the primary flow meter is compared to the standard volume of oil measured by a proving device using a single flow rate. This is denoted “proving”.
The standard volume of oil measured by the proving device is compared to a reference standard volume of oil using a single flow rate if the proving device is a displacement prover, and by multiple flow rates if the proving device is a master meter. This is denoted “calibration”.
The reference standard volume is provided by an external party. The traceability of this device is outside the scope of this Handbook.
This can formally be written in the following manner:
metering
flowmeterproving
flowmeter
proving
prover
ncalibratio
prover
ncalibratio
ref
meas VV
V
V
VV ,0
,0
,0
,0
,0
,0
. (4-1)
Here,
measV ,0 : the standard volume of oil measured by the primary flow meter volume, after corrections
from the proving and calibration. ncalibratio
refV ,0 : the standard volume of oil measured by the reference instrumentation during calibration
of the proving device. ncalibratio
proverV ,0 : the standard volume of oil measured by the proving device during calibration of the
proving device. proving
proverV ,0 : the standard volume of oil measured by the proving device during proving of the primary
flow meter. proving
flowmeterV ,0 : the standard volume of oil measured by the primary flow meter during proving of the
primary flow meter. metering
flowmeterV ,0 : the standard volume of oil measured by the primary flow meter volume at metering,
without the corrections from the proving and calibration.

Handbook of uncertainty calculations for ultrasonic oil flow metering stations Report
Ref. no.: CMR-15-A14071-RA-1 Rev.: 00 Date: 31.12.2015 Page 14 of 66
© Christian Michelsen Research AS. This document is an original Christian Michelsen Research (CMR) document.
The second parenthesis is the correction from the proving (using a single flow rate) and the first parenthesis is the correction from the calibration, for the flow rate used at proving. The standard volume of oil through the primary flow meter and the proving device is typically found from the actual volume of oil (at a measured pressure and temperature), through volume correction factors. However, at calibration, standard volumes are compared. After a calibration, the calibration certificate including uncertainty is usually given for this comparison of standard volumes. Therefore, the above equation is modified as follows:
metering
flowmeter
met
plm
met
tlmproving
flowmeter
prov
plm
prov
tlm
proving
prover
prov
plp
prov
tlp
ncalibratio
prover
ncalibratio
ref
meas VCCVCC
VCC
V
VV
,0
,0
,0. (4-2)
Volumes without subscript “0” are here actual volumes at the relevant pressure and temperature.
Furthermore tlxC is the temperature volume expansion coefficient for oil and
plxC is the pressure volume
expansion coefficient for oil, from actual temperature and pressure to standard temperature and pressure. “x” is replaced by “m” when the actual oil temperature and pressure are the ones at the primary flow meter. “x” is replaced by “p” when the actual oil temperature and pressure are the ones at the proving device. The superscript “prov” or “met” indicates whether the actual temperature and pressure during proving or during normal measurement shall be used. The volumes defined by the flow meter and the proving device have also to be corrected for steel expansion due to pressure and temperature, relative to a reference temperature and pressure, at which a nominal volume is given:
.,
,
,
,,0
,0
,0
metering
flowmeternom
met
psm
met
tsm
met
plm
met
tlmproving
flowmeternom
prov
psm
prov
tsm
prov
plm
prov
tlm
proving
provernom
prov
psp
prov
tsp
prov
plp
prov
tlp
ncalibratio
provernom
cal
psp
cal
tsp
ncalibratio
ref
meas
VCCCCVCCCC
VCCCC
VCC
VV
(4-3)
Here tsxC is the temperature volume expansion coefficient for steel and
psxC is the pressure volume
expansion coefficient for steel, from a base temperature and pressure to actual temperature and pressure. “x” is replaced by “m” when the actual steel temperature and pressure are the ones at the primary flow meter. “x” is replaced by “p” when the actual steel temperature and pressure are the ones at the proving device. The superscript “cal”, “prov” or “met” indicates whether the actual temperature and pressure during calibration, during proving or during normal measurement shall be used. Furthermore,
ncalibratio
provernomV ,,0 : the standard volume of oil that would have been measured by the proving device during
calibration of the proving device, if temperature and pressure expansions in steel not had been taken into account.
proving
provernomV , : the actual volume of oil (line conditions) that would have been measured by the proving
device during proving of the primary flow meter, if temperature and pressure expansions in steel not had been taken into account.
proving
flowmeternomV , : the actual volume of oil (line conditions) that would have been measured by the primary
flow meter during proving of the primary flow meter, if temperature and pressure expansions in steel not had been taken into account.

Handbook of uncertainty calculations for ultrasonic oil flow metering stations Report
Ref. no.: CMR-15-A14071-RA-1 Rev.: 00 Date: 31.12.2015 Page 15 of 66
© Christian Michelsen Research AS. This document is an original Christian Michelsen Research (CMR) document.
metering
flowmeternomV , : the actual volume of oil (line conditions) that would have been measured by the primary
flow meter volume at metering, without the corrections from the proving and calibration, if temperature and pressure expansions in steel not had been taken into account.
Eq. (4-3) can be re-formulated as
.,,0
,0
,
,
,,0 ncalibratio
provernom
ncalibratio
ref
proving
flowmeternom
proving
provernommetering
flowmeternomprov
psm
prov
tsm
cal
psp
cal
tsp
met
psm
met
tsm
prov
psp
prov
tsp
prov
plm
prov
tlm
met
plm
met
tlm
prov
plp
prov
tlp
measV
V
V
VV
CCCC
CCCC
CC
CCCCV
(4-4)
The two parenthesis in this expression will for simplicity be denoted
,,
prov
plm
prov
tlm
met
plm
met
tlm
prov
plp
prov
tlppm
liqCC
CCCCA (4-5)
and
prov
psm
prov
tsm
cal
psp
cal
tsp
met
psm
met
tsm
prov
psp
prov
tspcpm
steelCCCC
CCCCA ,,
. (4-6)
The three superscripts m, p and c in these expressions refer to metering, proving and calibration,
respectively. The in the superscripts is given when there are two temperature and pressure corrections of relevance for the given process (metering, proving or calibration). In this way, Eq. (4-4) can be simplified as follows:
ncalibratio
provernom
ncalibratio
ref
proving
flowmeternom
proving
provernommetering
flowmeternom
cpm
steel
pm
liqmeasV
V
V
VVAAV
,,0
,0
,
,
,
,,,
,0
. (4-7)
The volumetric flow rate at standard conditions, measvq ,0 , can now be written as
ncalibratio
provernom
ncalibratio
ref
proving
flowmeternom
proving
provernommetering
flowmeternom
cpm
steel
pm
liqmeasvV
V
V
VqAAq
,,0
,0
,
,
,
,,,
,0, (4-8)
where metering
flowmeternomq , is the volumetric flow rate of oil at line conditions that would have been measured by
the primary flow meter during metering, without the corrections from the proving and calibration, and if temperature and pressure expansions in steel not had been taken into account.
4.1.2 Volumetric flow rate at line conditions
The volumetric flow rate at line conditions, measvq , , can be found from the volumetric flow rate at standard
conditions as follows:
met
plm
met
tlm
measv
measvCC
,0
, . (4-9)

Handbook of uncertainty calculations for ultrasonic oil flow metering stations Report
Ref. no.: CMR-15-A14071-RA-1 Rev.: 00 Date: 31.12.2015 Page 16 of 66
© Christian Michelsen Research AS. This document is an original Christian Michelsen Research (CMR) document.
By use of Eqs. (4-5), (4-7) and (4-8) above, the volumetric flow rate at line conditions, Eq. (4-9), can be written as
ncalibratio
provernom
ncalibratio
ref
proving
flowmeternom
proving
provernommetering
flowmeternom
cpm
steel
p
liqmeasvV
V
V
VqAAq
,,0
,0
,
,
,
,,
,, (4-10)
where
prov
plm
prov
tlm
prov
plp
prov
tlpp
liqCC
CCA
. (4-11)
4.1.3 Mass flow rate
The mass flow rate, measmq , , can be found by multiplying the volumetric flow rate at standard conditions,
Eq. (4-8), with the standard density (density at standard temperature and pressure), 0 :
ncalibratio
provernom
ncalibratio
ref
proving
flowmeternom
proving
provernommetering
flowmeternom
cpm
steel
pm
liqmeasmV
V
V
VqAAq
,,0
,0
,
,
,
,,,
0, . (4-12)
When the density is found from laboratory analysis, this is the relevant functional relationship. When the density is measured by a densitometer, oil volume correction factors must be applied to get the standard density. In that case, Eq. (4-12) has to be elaborated on in the following manner:
.,,0
,0
,
,
,
,,
,,0
,0
,
,
,
,,,
,,0
,0
,
,
,
,,,
0,
ncalibratio
provernom
ncalibratio
ref
proving
flowmeternom
proving
provernommetering
flowmeternom
cpm
steelprov
plm
prov
tlm
prov
plp
prov
tlp
met
pld
met
tld
met
plm
met
tlm
dens
ncalibratio
provernom
ncalibratio
ref
proving
flowmeternom
proving
provernommetering
flowmeternom
cpm
steel
pm
liqmet
pld
met
tld
dens
ncalibratio
provernom
ncalibratio
ref
proving
flowmeternom
proving
provernommetering
flowmeternom
cpm
steel
pm
liqmeasm
V
V
V
VqA
CC
CC
CC
CC
V
V
V
VqAA
CC
V
V
V
VqAAq
(4-13)
The condition “d” in the oil volume correction factors means that the actual temperature and pressure
are the ones at the densitometer (i.e. densitometer conditions). dens is the density at the densitometer
conditions. This means that the functional relationship for the mass flow rate in the case where the density is measured by a densitometer can be written as
ncalibratio
provernom
ncalibratio
ref
proving
flowmeternom
proving
provernommetering
flowmeternom
cpm
steel
pm
liqdensmeasmV
V
V
VqAAq
,,0
,0
,
,
,
,,,
, , (4-14)
where
prov
plm
prov
tlm
prov
plp
prov
tlp
met
pld
met
tld
met
plm
met
tlmpm
liqCC
CC
CC
CCA ,
. (4-15)

Handbook of uncertainty calculations for ultrasonic oil flow metering stations Report
Ref. no.: CMR-15-A14071-RA-1 Rev.: 00 Date: 31.12.2015 Page 17 of 66
© Christian Michelsen Research AS. This document is an original Christian Michelsen Research (CMR) document.
4.2 Oil volume expansion coefficients
In this Section, the oil volume expansion formulas used in this Handbook will be presented. In Section 4.2.1, the overall correction model is given. In Section 4.2.2 the specific formula for the temperature expansion coefficient is given and in Section 4.2.3 the specific formula for the pressure expansion coefficient is given.
4.2.1 Overall expression
The volume of a given quantity of oil depends on the temperature and pressure. Temperature and pressure expansion factors are provided to calculate how much such a volume is changed when pressure and temperature are changed. More specific, if the volume V of oil at a temperature Tx and pressure Px is known, the volume of the same amount of oil, V0, at standard temperature T0 and pressure P0 can be found from the following expression:
VCCV plxtlx0, (4-16)
where tlxC is the temperature expansion coefficient and
plxC is the pressure expansion coefficient. Here
“x” denotes the condition (either “p” for prover, “m” for flow meter or “d” for densitometer).
4.2.2 Temperature volume expansion coefficient
The temperature volume expansion coefficients for oil can be found in API MPMS Chapter 11.1. Based on that standard, the following formula is used in this work:
228.0 xx TT
tlx eC
, (4-17)
where
2
0
1
2
0
0 KKK
, (4-18)
and
0TTT xx . (4-19)
This formula corrects the volume from the temperature Tx to the standard reference temperature T0. 0
is the density at standard reference pressure and temperature. K0, K1 and K2 are coefficients that depend on the type of oil. The formula above includes two minor approximations compared to the API MPMS 11.1 standard. The first approximation is that no calculation between the old ITS-68 and the new ITS-90 temperature scales have been included. For the purpose of this uncertainty model, this is acceptable as the difference between the two scales is minimal, much less than the typical uncertainty of a temperature measurement. The second approximation is that these formulas here are used with another standard reference temperature than 60 °F. To be strict, a calculation of the volume change from the temperature Tx to the standard reference temperature of 15 °C shall according to API MPMS 11.1 be carried out by first calculating the volume change in the temperature change from Tx to 60 °F, with 60 °F as standard reference temperature, and standard reference density at 60 °F. Thereafter the volume change in a

Handbook of uncertainty calculations for ultrasonic oil flow metering stations Report
Ref. no.: CMR-15-A14071-RA-1 Rev.: 00 Date: 31.12.2015 Page 18 of 66
© Christian Michelsen Research AS. This document is an original Christian Michelsen Research (CMR) document.
temperature change from 60 °F to 15 °C is calculated, also with a standard reference temperature of 60 °F. See API MPMS 11.1.3.6 and 11.1.3 7 for reference. In stead the above formulas have been used with 15 °C as standard reference temperature and the standard density is referred to 15 °C. The difference in volume correction factor due to this approximation is minimal, typical in the order of 0.001 % and thus several orders of magnitude below the uncertainty requirements for fiscal oil metering of about 0.25 - 0.30 % (depending on country). For the uncertainty model in focus here, this model is therefore sufficient. API MPMS 11.1 gives several sets of values for the coefficients K0 and K1, depending on the type of oil. Among these are (i) crude oil, (ii) fuel oil, (iii) jet group and (iv) gasoline. Crude oil is there classified with API gravity at 60 °F between 100 and -10, corresponding to reference density at 15 °C and 1 atm between 611.16 and 1163.79 kg/m³. In API MPMS 11.1.6.1, the coefficients K0 and K1 are given for the four liquid hydrocarbon types mentioned above. These coefficients are multiplied by 1.8 to convert from Fahrenheit to Celsius temperature scale. The data set then obtained is shown in Table 4.1.
Table 4.1 Temperature expansion coefficient for selected types of oil, for use with temperature on Celsius scale.
Crude Oil Fuel Oil Jet Group Gasoline
K0 613.97226 186.9696 594.5418 346.42277
K1 0 0.48618 0 0.43883
K2 0 0 0 0
4.2.3 Pressure volume expansion coefficient
The pressure volume expansion coefficients for oil can be found in API MPMS Chapter 11.1. Based on that standard, the following formula is used in this work:
FPPC
ex
plx
1001
1, (4-20)
where
xx DTCBTAeF
2
0610610
. (4-21)
The coefficients A, B, C and D have the following values:
A = -1.6208,
B = 0.00021592,
C = 0.87096,
D = 0.0042092. In Eqs. (4-20) and (4-21) it is important to use the unit bar for the pressure and °C for the temperature.
4.3 Steel volume expansion coefficients
The steel volume expansion coefficients refers to expansion from a base temperature and pressure, typically but not necessarily 15 °C and 1 atm = 1.01325 bar. Below, the base temperature and base pressure have the subscript b.
Handbook of uncertainty calculations for ultrasonic oil flow metering stations Report
Ref. no.: CMR-15-A14071-RA-1 Rev.: 00 Date: 31.12.2015 Page 19 of 66
© Christian Michelsen Research AS. This document is an original Christian Michelsen Research (CMR) document.
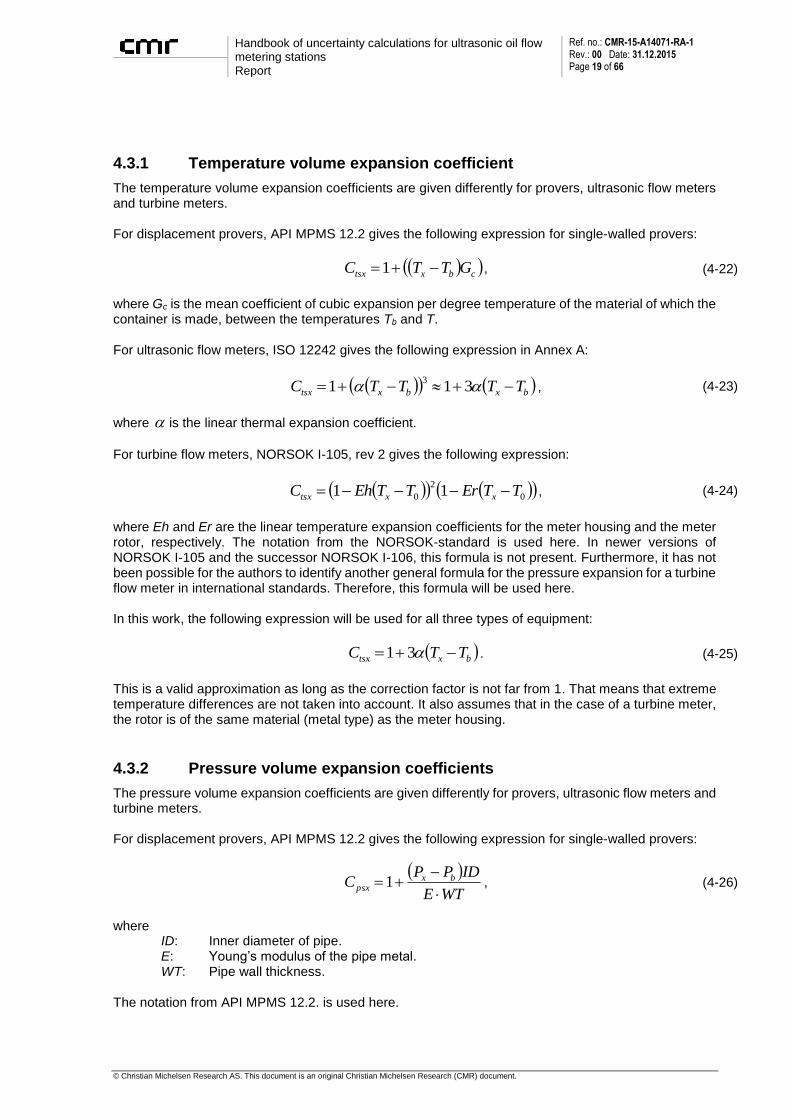
4.3.1 Temperature volume expansion coefficient
The temperature volume expansion coefficients are given differently for provers, ultrasonic flow meters and turbine meters. For displacement provers, API MPMS 12.2 gives the following expression for single-walled provers:
cbxtsx GTTC 1 , (4-22)
where Gc is the mean coefficient of cubic expansion per degree temperature of the material of which the container is made, between the temperatures Tb and T. For ultrasonic flow meters, ISO 12242 gives the following expression in Annex A:
bxbxtsx TTTTC 3113
, (4-23)
where is the linear thermal expansion coefficient.
For turbine flow meters, NORSOK I-105, rev 2 gives the following expression:
0
2
0 11 TTErTTEhC xxtsx , (4-24)
where Eh and Er are the linear temperature expansion coefficients for the meter housing and the meter rotor, respectively. The notation from the NORSOK-standard is used here. In newer versions of NORSOK I-105 and the successor NORSOK I-106, this formula is not present. Furthermore, it has not been possible for the authors to identify another general formula for the pressure expansion for a turbine flow meter in international standards. Therefore, this formula will be used here. In this work, the following expression will be used for all three types of equipment:
bxtsx TTC 31 . (4-25)
This is a valid approximation as long as the correction factor is not far from 1. That means that extreme temperature differences are not taken into account. It also assumes that in the case of a turbine meter, the rotor is of the same material (metal type) as the meter housing.
4.3.2 Pressure volume expansion coefficients
The pressure volume expansion coefficients are given differently for provers, ultrasonic flow meters and turbine meters. For displacement provers, API MPMS 12.2 gives the following expression for single-walled provers:
WTE
IDPPC bx
psx
1 , (4-26)
where
ID: Inner diameter of pipe. E: Young’s modulus of the pipe metal. WT: Pipe wall thickness.
The notation from API MPMS 12.2. is used here.

Handbook of uncertainty calculations for ultrasonic oil flow metering stations Report
Ref. no.: CMR-15-A14071-RA-1 Rev.: 00 Date: 31.12.2015 Page 20 of 66
© Christian Michelsen Research AS. This document is an original Christian Michelsen Research (CMR) document.
For ultrasonic flow meters [Lunde et al, 2007] has demonstrated that the expansion depends on a series of issues. These include
Type of material (steel) in the meter spool.
Pipe wall thickness.
Upstream and downstream piping.
Geometry of ultrasonic transducers.
Number of and location of the acoustic paths, including distance between the acoustic path and the flanges.
Etc. In ISO 12242, Appendix A, and in ISO 17089-1, Appendix E, this is addressed. A worst case expression is given as follows:
E
PP
rR
rRC bx
psx
22
22
41 , (4-27)
where
r: Inner diameter of pipe. R: Outer diameter of pipe. E: Young’s modulus of the pipe metal. µ: Poisson’s ratio of the pipe metal.
The notation from the ISO-standards is used here. This expression will be used here, because the topic is an uncertainty model. Indicative numbers of the size of the coefficient and on dependencies on the pressure are therefore sufficient for the purpose in focus here. For turbine flow meters, the NORSOK I-105, Rev 2 from 1998 contains the following expression:
tRATE
RePPC bpsx
2)/(1
221
2, (4-28)
where
R: Inner diameter of pipe. t: Pipe wall thickness of pipe. E: Young’s modulus of the pipe metal.
e: Poisson’s ratio of the pipe metal. AT: The area in the pipe cross section that is occupied by the rotor blades. (In the program
to be given in percent of the total cross sectional area.) The notation from the NORSOK-standard is used here. In newer versions of NORSOK I-105 and the successor NORSOK I-106, this formula is not present. Furthermore, it has not been possible for the authors to identify another general formula for the pressure expansion for a turbine flow meter in international standards. Therefore, this formula will be used here. This means that generally, the pressure expansion coefficient can by written as
bxpsx PPC 1 . (4-29)
The expression for β depends on the equipment, and is given as follows: Displacement prover:

Handbook of uncertainty calculations for ultrasonic oil flow metering stations Report
Ref. no.: CMR-15-A14071-RA-1 Rev.: 00 Date: 31.12.2015 Page 21 of 66
© Christian Michelsen Research AS. This document is an original Christian Michelsen Research (CMR) document.
wdE
R
. (4-30)
Ultrasonic flow meter:
22
224
RdR
RdR
Ew
w. (4-31)
Turbine flow meter:
wT dRAE
R
2)/(1
222
. (4-32)
Here the notation of the steel expansion factors is uniformed between the different technologies, as follows: R: Inner diameter of pipe. dw: Pipe wall thickness of pipe. E: Young’s modulus of the pipe metal.
µ: Poisson’s ratio of the pipe metal. AT: The area in the pipe cross section that is occupied by the rotor blades. (In the program
to be given in percent of the total cross sectional area.)

Handbook of uncertainty calculations for ultrasonic oil flow metering stations Report
Ref. no.: CMR-15-A14071-RA-1 Rev.: 00 Date: 31.12.2015 Page 22 of 66
© Christian Michelsen Research AS. This document is an original Christian Michelsen Research (CMR) document.
5 Uncertainty models
In this Chapter, the uncertainty models for volumetric flow rate at standard conditions, volumetric flow rate at line conditions and mass flow rate are given in Sections 5.1, 5.2 and 5.3, respectively. These uncertainty models are quite general, and the various components of them are detailed in the next sections. In Sections 5.4, 5.5, and 5.6, respectively, the uncertainty contributions related to the calibration process, the proving process and the flow metering are addressed. In Section 5.7, the uncertainty contribution related to the oil and steel expansion coefficient is addressed. In Section 5.8 the model uncertainty of these oil and steel expansion coefficients is addressed more in detail.
5.1 Volumetric flow rate at standard conditions
The relative standard uncertainty of the volumetric flow rate at standard conditions can be deduced from Eq. (4-8), and is here written as follows:
2
0
0
2
0
0
2
0
0
2
,,,
,,,2
,0
,0
met
v
met
v
prov
v
prov
v
cal
v
cal
v
cpm
steel
pm
liq
cpm
steel
pm
liq
measv
measv
q
qu
q
qu
q
qu
AA
AAu
q
qu. (5-1)
The interpretation of this equation is that the uncertainty consists of contributions related to expansion of oil and steel (first term), contributions related to the calibration process (second term), contributions related to the proving process (third term) and contributions related to the flow metering (last term). The first term on the right hand side of Eq. (5-1), related to the expansion of oil and steel, is discussed further in Section 5.7. The second term on the right hand side of Eq. (5-1), related to the calibration process, is discussed further in Section 5.4. The third term on the right hand side of Eq. (5-1), related to the proving process, is discussed further in Section 5.5. The fourth term on the right hand side of Eq. (5-1), related to the flow metering, is discussed further in Section 5.6.
5.2 Volumetric flow rate at line conditions
The relative standard uncertainty of the volumetric flow rate at standard conditions can be deduced from Eq. (4-10), and is here written as follows:
2
0
0
2
0
0
2
0
0
2
,,
,,2
,
,
met
v
met
v
prov
v
prov
v
cal
v
cal
v
cpm
steel
p
liq
cpm
steel
p
liq
measv
measv
q
qu
q
qu
q
qu
AA
AAu
q
qu. (5-2)
The interpretation of this equation is that the uncertainty consists of contributions related to expansion of oil and steel (first term), contributions related to the calibration process (second term), contributions related to the proving process (third term) and contributions related to the flow metering (last term). The first term on the right hand side of Eq. (5-2), related to the expansion of oil and steel, is discussed further in Section 5.7.

Handbook of uncertainty calculations for ultrasonic oil flow metering stations Report
Ref. no.: CMR-15-A14071-RA-1 Rev.: 00 Date: 31.12.2015 Page 23 of 66
© Christian Michelsen Research AS. This document is an original Christian Michelsen Research (CMR) document.
The second term on the right hand side of Eq. (5-2), related to the calibration process, is discussed further in Section 5.4. The third term on the right hand side of Eq. (5-2), related to the proving process, is discussed further in Section 5.5. The fourth term on the right hand side of Eq. (5-2), related to the flow metering, is discussed further in Section 5.6.
5.3 Mass flow rate
The relative standard uncertainty of the mass flow rate can in the case when the density is determined from laboratory analysis be deduces from Eq. (4-12), and is here written as follows:
2
0
0
2
0
0
2
0
0
2
,,,
0
,,,
0
2
,
,
met
v
met
v
prov
v
prov
v
cal
v
cal
v
cpm
steel
pm
liq
cpm
steel
pm
liq
measm
measm
q
qu
q
qu
q
qu
AA
AAu
q
qu
. (5-3)
When the density is measured by a densitometer, the relative standard uncertainty of the mass flow rate can be deduced from Eq. (4-14), and is here written as follows:
2
0
0
2
0
0
2
0
0
2
,,,
,,,2
,
,
met
v
met
v
prov
v
prov
v
cal
v
cal
v
cpm
steel
pm
liqdens
cpm
steel
pm
liqdens
measm
measm
q
qu
q
qu
q
qu
AA
AAu
q
qu
. (5-4)
The interpretation of these two equation is that the uncertainty consists of contributions related to density measurement and expansion of oil and steel (first term), contributions related to the calibration process (second term), contributions related to the proving process (third term) and contributions related to the flow metering (last term). The first term on the right hand side of Eqs. (5-3) and (5-4), related to the density measurement and expansion of oil and steel, is discussed further in Section 5.7. The second term on the right hand side of Eqs. (5-3) and (5-4), related to the calibration process, is discussed further in Section 5.4. The third term on the right hand side of Eqs. (5-3) and (5-4), related to the proving process, is discussed further in Section 5.5. The fourth term on the right hand side of Eqs. (5-3) and (5-4), related to the flow metering, is discussed further in Section 5.6.
5.4 Calibration uncertainties
The calibration uncertainty can be understood as the uncertainty in a newly calibrated device that operates under the same flow rates, oil quality, pressure and temperature, and in case of a master meter, installed in the same place in the same flow loop as under calibration. This means that it is the uncertainty in the meter output related to an as-left flow test carried out for the same flow rates as where the flow calibration were carried out.

Handbook of uncertainty calculations for ultrasonic oil flow metering stations Report
Ref. no.: CMR-15-A14071-RA-1 Rev.: 00 Date: 31.12.2015 Page 24 of 66
© Christian Michelsen Research AS. This document is an original Christian Michelsen Research (CMR) document.
The calibration uncertainty refers to the second term on the right hand of Eqs. (5-1), (5-2), (5-3) and (5-4) and can be written as follows:
2
0
,0
2
0
,0
2
0
0
cal
v
cal
proverreptv
cal
v
cal
refv
cal
v
cal
v
q
qu
q
qu
q
qu. (5-5)
Here the first term on the right hand side is the relative standard uncertainty of the calibration reference:
If the proving device is a displacement prover, this uncertainty term refers to the reference system used at the on-site calibration of the prover.
If the proving device is a master meter (flow meter), there are two options. If the master meter is calibrated off-site, at a flow laboratory, the uncertainty term refers to the uncertainty of the flow reference at the flow laboratory.
If the master meter is calibrated on-site, typically by use of a compact portable prover with transfer meter, the uncertainty term refers to the uncertainty in that prover/transfer meter system.
The second term on the right hand side is the relative standard uncertainty due to the repeatability obtained during calibration of the proving device. This is found from the repeatability checks carried out under such calibrations. Note that the term relates to the uncertainty and not the repeatability itself.
5.5 Proving uncertainties
The proving uncertainty can be understood as the extra uncertainty contributions related to a proving device when used in the proving process, compared to the calibration uncertainty. It is assumed that the proving is carried out at a single flow rate only. The proving uncertainty refers to the third term on the right hand of Eqs. (5-1), (5-2), (5-3) and (5-4) and can be written as follows:
.
2
0
,0
2
0
,0
2
0
,0
2
0
,0
2
0
0
prov
v
prov
profilev
prov
v
prov
linearityv
prov
v
prov
flowmeterreptv
prov
v
prov
proverreptv
prov
v
prov
v
q
qu
q
qu
q
qu
q
qu
q
qu (5-6)
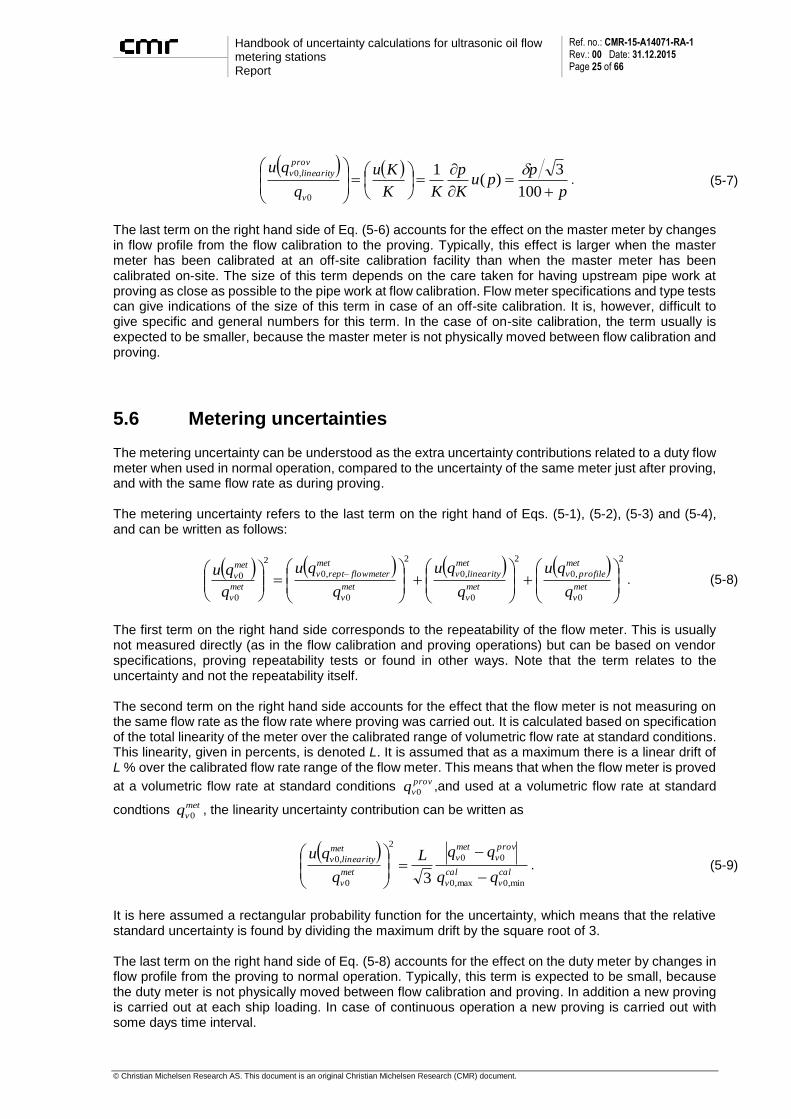
The first two terms on the right hand side correspond to the repeatability of the prover and the flow meter. Normally they can be merged to a single term, which is found from the repeatability check carried out under proving. Note that the term relates to the uncertainty and not the repeatability itself. The third term on the right hand side accounts for the effect that the proving is not carried out at the same flow rate as used in the flow calibration. It is only relevant when the proving device is a master meter. This is dealt with in the same way as in [Frøysa et al, 2014] (Uncertainty of the correction factor estimate). The uncertainty contribution is described in Appendix A. It is calculated from the deviation between the master meter flow rate and the flow rate measured by the reference meter at flow calibration, at a series of flow rates. The adjustment of the master meter is assumed to be carried out
by linear interpolation. The actual expression for any uncorrected percentage deviation, p , and the
related uncertainty of the master meter after adjustment of the master meter is given in Appendix A. As described in Appendix A, the relative standard uncertainty of the correction factor estimate can be written as
Handbook of uncertainty calculations for ultrasonic oil flow metering stations Report
Ref. no.: CMR-15-A14071-RA-1 Rev.: 00 Date: 31.12.2015 Page 25 of 66
© Christian Michelsen Research AS. This document is an original Christian Michelsen Research (CMR) document.
p
ppu
K
p
KK
Ku
q
qu
v
prov
linearityv
100
3)(
1
0
,0 . (5-7)
The last term on the right hand side of Eq. (5-6) accounts for the effect on the master meter by changes in flow profile from the flow calibration to the proving. Typically, this effect is larger when the master meter has been calibrated at an off-site calibration facility than when the master meter has been calibrated on-site. The size of this term depends on the care taken for having upstream pipe work at proving as close as possible to the pipe work at flow calibration. Flow meter specifications and type tests can give indications of the size of this term in case of an off-site calibration. It is, however, difficult to give specific and general numbers for this term. In the case of on-site calibration, the term usually is expected to be smaller, because the master meter is not physically moved between flow calibration and proving.
5.6 Metering uncertainties
The metering uncertainty can be understood as the extra uncertainty contributions related to a duty flow meter when used in normal operation, compared to the uncertainty of the same meter just after proving, and with the same flow rate as during proving. The metering uncertainty refers to the last term on the right hand of Eqs. (5-1), (5-2), (5-3) and (5-4), and can be written as follows:
2
0
,0
2
0
,0
2
0
,0
2
0
0
met
v
met
profilev
met
v
met
linearityv
met
v
met
flowmeterreptv
met
v
met
v
q
qu
q
qu
q
qu
q
qu. (5-8)
The first term on the right hand side corresponds to the repeatability of the flow meter. This is usually not measured directly (as in the flow calibration and proving operations) but can be based on vendor specifications, proving repeatability tests or found in other ways. Note that the term relates to the uncertainty and not the repeatability itself. The second term on the right hand side accounts for the effect that the flow meter is not measuring on the same flow rate as the flow rate where proving was carried out. It is calculated based on specification of the total linearity of the meter over the calibrated range of volumetric flow rate at standard conditions. This linearity, given in percents, is denoted L. It is assumed that as a maximum there is a linear drift of L % over the calibrated flow rate range of the flow meter. This means that when the flow meter is proved
at a volumetric flow rate at standard conditions prov
vq 0,and used at a volumetric flow rate at standard
condtions met
vq 0, the linearity uncertainty contribution can be written as
cal
v
cal
v
prov
v
met
v
met
v
met
linearityv
qqL
q
qu
min,0max,0
00
2
0
,0
3
. (5-9)
It is here assumed a rectangular probability function for the uncertainty, which means that the relative standard uncertainty is found by dividing the maximum drift by the square root of 3. The last term on the right hand side of Eq. (5-8) accounts for the effect on the duty meter by changes in flow profile from the proving to normal operation. Typically, this term is expected to be small, because the duty meter is not physically moved between flow calibration and proving. In addition a new proving is carried out at each ship loading. In case of continuous operation a new proving is carried out with some days time interval.

Handbook of uncertainty calculations for ultrasonic oil flow metering stations Report
Ref. no.: CMR-15-A14071-RA-1 Rev.: 00 Date: 31.12.2015 Page 26 of 66
© Christian Michelsen Research AS. This document is an original Christian Michelsen Research (CMR) document.
5.7 Oil and steel expansion factor uncertainties
In this Section, the uncertainty models for the combined oil and steel expansion factors the first term on the right hand of Eqs. (5-1), (5-2), (5-3) and (5-4) are addressed. Note that this uncertainty term is different for the each of the four situations covered in Eqs. (5-1), (5-2), (5-3) and (5-4). In Section 5.7.1 the model for the uncertainty of the expansion factor found in Eq. (5-1) and related to the volumetric flow rate at standard conditions, is presented. In Section 5.7.2 the model for the uncertainty of the expansion factor found in Eq. (5-2) and related to the volumetric flow rate at line conditions, is presented. In Section 5.7.3 the models for the uncertainty of the expansion factors found in Eqs. (5-3) and (5-4) and related to the mass flow rate, are presented.
5.7.1 Volumetric flow rate at standard conditions
The uncertainty model for the volumetric flow rate at standard conditions is given in Eq. (5-1). The
relative standard uncertainty of cpm
steel
pm
liq AA ,,, is part of that equation. This relative standard uncertainty
will now be discussed. cpm
steel
pm
liq AA ,,, can from Eqs. (4-5) and (4-6) be found as
prov
psm
prov
tsm
cal
psp
cal
tsp
prov
plm
prov
tlm
met
psm
met
tsm
prov
psp
prov
tsp
met
plm
met
tlm
prov
plp
prov
tlpcpm
steel
pm
liqCCCCCC
CCCCCCCCAA ,,,
. (5-10)
When the expressions for all expansion coefficients (see Sections 4.2 and 4.3) are inserted, Eq. (5-10) can formally be written as
0
,,, ,,,,,,,, met
m
met
m
prov
m
prov
m
prov
p
prov
p
cal
p
cal
p
cpm
steel
pm
liq PTPTPTPTfAA . (5-11)
Each of these input parameters have uncertainty. In addition, there are material constants for the oil and the steel. These have also uncertainty. In this work they are considered as part of the model uncertainty
for each type of expansion factors that are included in cpm
steel
pm
liq AA ,,, . That means that uncertainty in
temperature expansion coefficient and pressure expansion coefficient for oil, and the same for steel are considered to be part of the model uncertainty.
It should be noted here that the temperature cal
pT (the temperature at the proving device during
calibration) and the temperature prov
pT (the temperature at the proving device during proving) are
measured by the same temperature measurement device. Similarly pressure cal
pP (the pressure at the
proving device during calibration) and the pressure prov
pP (the pressure at the proving device during
proving) are measured by the same pressure measurement device. However, there can be several months or more between the measurements during calibration and the measurements during proving. The temperature measurement device and the pressure measurement device can drift in-between these measurements, and there may also be re-calibrations of these equipments. Therefore, in the uncertainty
model, cal
pT and cal
pP will be assumed to be uncorrelated with prov
pT and prov
pP .

Handbook of uncertainty calculations for ultrasonic oil flow metering stations Report
Ref. no.: CMR-15-A14071-RA-1 Rev.: 00 Date: 31.12.2015 Page 27 of 66
© Christian Michelsen Research AS. This document is an original Christian Michelsen Research (CMR) document.
In the same way, the temperature prov
mT (the temperature at the flow meter during proving) and the
temperature met
mT (the temperature at the flow meter during ordinary flow metering) are measured by
the same temperature measurement device. Similarly pressure prov
mP (the pressure at the flow meter
during proving) and the pressure met
mP (the pressure at the flow meter during ordinary flow metering)
are measured by the same pressure measurement device. Opposite to the case for the temperature and pressure measurements at the proving the device, the temperature and pressure measurements at the flow meter (during proving and at ordinary flow metering) are carried out within few days or less.
Therefore, in the uncertainty model, prov
mT is considered to be totally correlated with met
mT , and prov
mP is
considered to be totally correlated with met
mP .
The uncertainty model forcpm
steel
pm
liq AA ,,, can then be written as
,
1
2
,,
,,
mod,
2
,
,
mod,
2
0
0
2
2
22
222
,,,
2
,,,
,,,
cpm
steel
cpm
steel
pm
liq
pm
liq
met
mmet
m
prov
mprov
m
met
mmet
m
prov
mprov
m
prov
pprov
p
prov
pprov
p
cal
pcal
p
cal
pcal
p
cpm
steel
pm
liq
cpm
steel
pm
liq
cpm
steel
pm
liq
A
Au
A
Auu
f
PuP
fPu
P
f
TuT
fTu
T
f
PuP
fTu
T
f
PuP
fTu
T
f
AAAA
AAu
(5-12)
where the two last terms represent model uncertainties. It will further be assumed that when a temperature or pressure device is used two times (in both calibration and proving operation or both in proving and normal flow metering operation), the absolute standard uncertainty of this temperature or pressure device is the same in the two cases. This is consistent with the specifications of most temperature and pressure devices and in agreement with the uncertainty models for temperature and pressure given in Sections 3.1 and 3.2. This means that the notation will be simplified as follows:
.)(
,)(
,)(
,)(
met
m
prov
mm
met
m
prov
mm
prov
p
cal
pp
prov
p
cal
pp
PuPuPu
TuTuTu
PuPuPu
TuTuTu
(5-13)
Eq. (5-12) now simplifies to

Handbook of uncertainty calculations for ultrasonic oil flow metering stations Report
Ref. no.: CMR-15-A14071-RA-1 Rev.: 00 Date: 31.12.2015 Page 28 of 66
© Christian Michelsen Research AS. This document is an original Christian Michelsen Research (CMR) document.
.
1
2
,,
,,
mod,
2
,
,
mod,
2
0
0
2
2
2
2
2
22
2
222
,,,
2
,,,
,,,
cpm
steel
cpm
steel
pm
liq
pm
liq
mmet
m
prov
m
mmet
m
prov
m
pprov
p
cal
p
pprov
p
cal
p
cpm
steel
pm
liq
cpm
steel
pm
liq
cpm
steel
pm
liq
A
Au
A
Au
uf
PuP
f
P
f
TuT
f
T
fPu
P
f
P
f
TuT
f
T
f
AAAA
AAu
(5-14)
The model uncertainty term for oil expansion factors,
pmliq
pmliq
A
Au
,
,mod,
, is addressed in Section 5.8.3. The model
uncertainty term for steel expansion factors,
cpmsteel
cpmsteel
A
Au
,,
,,mod,
, is addressed in Section 5.8.5.
5.7.2 Volumetric flow rate at line conditions
The uncertainty model for the volumetric flow rate at line conditions is given in Eq. (5-2). The relative
standard uncertainty of cpm
steel
p
liq AA ,,is part of that equation. This relative standard uncertainty will now
be discussed. cpm
steel
p
liq AA ,,can from Eqs. (4-6) and (4-11) be found as
prov
psm
prov
tsm
cal
psp
cal
tsp
prov
plm
prov
tlm
met
psm
met
tsm
prov
psp
prov
tsp
prov
plp
prov
tlpcpm
steel
p
liqCCCCCC
CCCCCCAA ,,
. (5-15)
When the expressions for all expansion coefficients (see Sections 4.2 and 4.3) are inserted, Eq. (5-15) can formally be written as
02
,, ,,,,,,,, met
m
met
m
prov
m
prov
m
prov
p
prov
p
cal
p
cal
p
cpm
steel
p
liq PTPTPTPTfAA . (5-16)
The methodology and assumptions for finding the uncertainty cpm
steel
p
liq AA ,, is similar to the methodology
and assumptions for finding the uncertainty cpm
steel
pm
liq AA ,,, in Section 5.7.1. The relative standard
uncertainty of cpm
steel
p
liq AA ,,then becomes

Handbook of uncertainty calculations for ultrasonic oil flow metering stations Report
Ref. no.: CMR-15-A14071-RA-1 Rev.: 00 Date: 31.12.2015 Page 29 of 66
© Christian Michelsen Research AS. This document is an original Christian Michelsen Research (CMR) document.
.
1
2
,,
,,
mod,
2
mod,
2
0
0
22
2
22
2
2
222
2
2
2
2
2
2
2
2
2
2
,,
2
,,
,,
cpm
steel
cpm
steel
p
liq
p
liq
mmet
m
prov
m
mmet
m
prov
m
pprov
p
cal
p
pprov
p
cal
p
cpm
steel
p
liq
cpm
steel
p
liq
cpm
steel
p
liq
A
Au
A
Au
uf
PuP
f
P
f
TuT
f
T
fPu
P
f
P
f
TuT
f
T
f
AAAA
AAu
(5-17)
The model uncertainty term for oil expansion factors,
pliq
pliq
A
Au
mod,
, is addressed in Section 5.8.4. The model
uncertainty term for steel expansion factors,
cpmsteel
cpmsteel
A
Au
,,
,,mod,
, is addressed in Section 5.8.5.
5.7.3 Mass flow rate
The functional relationship and the uncertainty model for the mass flow rate depends on whether the density is determined from laboratory analysis or measured by an online densitometer. These two cases must therefore be addressed individually. DENSITY FROM LABORATORY ANALYSIS The uncertainty model for the mass flow rate when the density is determined by laboratory analysis is
given in Eq. (5-3). The relative standard uncertainty of cpm
steel
pm
liq AA ,,,
0
is part of that equation. This
relative standard uncertainty will now be discussed. cpm
steel
pm
liq AA ,,,
0
can from Eqs. (4-5) and (4-6) be
found as
prov
psm
prov
tsm
cal
psp
cal
tsp
prov
plm
prov
tlm
met
psm
met
tsm
prov
psp
prov
tsp
met
plm
met
tlm
prov
plp
prov
tlpcpm
steel
pm
liqCCCCCC
CCCCCCCCAA 0
,,,
0 . (5-18)
When the expressions for all expansion coefficients (see Sections 4.2 and 4.3) are inserted, Eq. (5-18) can formally be written as
03
,,,
0 ,,,,,,,, met
m
met
m
prov
m
prov
m
prov
p
prov
p
cal
p
cal
p
cpm
steel
pm
liq PTPTPTPTfAA . (5-19)
Each of these input parameters have uncertainty. In addition, there are material constants for the oil and the steel. These have also uncertainty. In this work they are considered as part of the model uncertainty
for each type of expansion factors that are included in cpm
steel
pm
liq AA ,,, . That means temperature expansion
coefficient and pressure expansion coefficient for oil, and the same for steel.

Handbook of uncertainty calculations for ultrasonic oil flow metering stations Report
Ref. no.: CMR-15-A14071-RA-1 Rev.: 00 Date: 31.12.2015 Page 30 of 66
© Christian Michelsen Research AS. This document is an original Christian Michelsen Research (CMR) document.
The methodology and assumptions for finding the uncertainty cpm
steel
pm
liq AA ,,,
0
is similar to the
methodology and assumptions for finding the uncertainty cpm
steel
pm
liq AA ,,, in Section 5.7.1. The relative
standard uncertainty of cpm
steel
pm
liq AA ,,,
0
then becomes
.
1
2
,,
,,
mod,
2
,
,
mod,
2
0
0
32
2
33
2
2
332
2
3
2
3
2
2
3
2
3
2
,,,
0
2
,,,
0
,,,
0
cpm
steel
cpm
steel
pm
liq
pm
liq
mmet
m
prov
m
mmet
m
prov
m
pprov
p
cal
p
pprov
p
cal
p
cpm
steel
pm
liq
cpm
steel
pm
liq
cpm
steel
pm
liq
A
Au
A
Au
uf
PuP
f
P
f
TuT
f
T
fPu
P
f
P
f
TuT
f
T
f
AAAA
AAu
(5-20)
The model uncertainty term for oil expansion factors,
pmliq
pmliq
A
Au
,
,mod,
, is addressed in Section 5.8.3. The model
uncertainty term for steel expansion factors,
cpmsteel
cpmsteel
A
Au
,,
,,mod,
, is addressed in Section 5.8.5.
DENSITY FROM ONLINE DENSITOMETER The uncertainty model for the mass flow rate when the density is determined by densitometer is given
in Eq. (5-4). The relative standard uncertainty of cpm
steel
pm
liqdens AA ,,, is part of that equation. This relative
standard uncertainty will now be discussed. cpm
steel
pm
liqdens AA ,,, can from Eqs. (4-6) and (4-15) be found
as
prov
flowmeterpsm
prov
flowmetertsm
cal
proverpsp
cal
provertsp
met
pld
met
tld
prov
plm
prov
tlm
met
flowmeterpsm
met
flowmetertsm
prov
proverpsp
prov
provertsp
met
plm
met
tlm
prov
plp
prov
tlp
dens
cpm
steel
pm
liqdensCCCCCCCC
CCCCCCCCAA
,,,,
,,,,,,, . (5-21)
When the expressions for all expansion coefficients (see Sections 4.2 and 4.3) are inserted, Eq. (5-18) can formally be written as
.,,,,,,,,,,, 04
,,,
dens
met
d
met
d
met
m
met
m
prov
m
prov
m
prov
p
prov
p
cal
p
cal
p
cpm
steel
pm
liqdens PTPTPTPTPTfAA (5-22)
It is here assumed that the standard density, 0 , is calculated from the measured density at the
densitometer, and used in the volume correction coefficients. Each of these input parameters have uncertainty. In addition, there are material constants for the oil and the steel. These have also uncertainty. In this work they are considered as part of the model uncertainty for each type of expansion
factors that are included in cpm
steel
pm
liq AA ,,, . That means temperature expansion coefficient and pressure
expansion coefficient for oil, and the same for steel.

Handbook of uncertainty calculations for ultrasonic oil flow metering stations Report
Ref. no.: CMR-15-A14071-RA-1 Rev.: 00 Date: 31.12.2015 Page 31 of 66
© Christian Michelsen Research AS. This document is an original Christian Michelsen Research (CMR) document.
The methodology and assumptions for finding the uncertainty cpm
steel
pm
liqdens AA ,,, is similar to the
methodology and assumptions for finding the uncertainty cpm
steel
pm
liq AA ,,, in Section 5.7.1. The relative
standard uncertainty of cpm
steel
pm
liqdens AA ,,, then becomes
.
1
2
,,
,,
mod,
2
,
,
mod,
2
0
4
2
0
0
4
2
2
42
2
42
2
44
2
2
442
2
4
2
4
2
2
4
2
4
2
,,,
2
,,,
,,,
cpm
steel
cpm
steel
pm
liq
pm
liq
dens
dmet
d
dmet
d
mmet
m
prov
m
mmet
m
prov
m
pprov
p
cal
p
pprov
p
cal
p
cpm
steel
pm
liqdens
cpm
steel
pm
liqdens
cpm
steel
pm
liqdens
A
Au
A
Au
uf
uf
PuP
fTu
T
fPu
P
f
P
f
TuT
f
T
fPu
P
f
P
f
TuT
f
T
f
AAAA
AAu
(5-23)
It should be noted here that a small approximation has been carried out. It is assumed that the uncertainty of the relative density used in the volume correction coefficients is uncorrelated with the
density dens that is explicitly written in Eq. (5-21). As the sensitivity for the relative density in the volume
correction coefficients is quite small, this is a reasonable approximation.
The model uncertainty term for oil expansion factors,
pmliq
pmliq
A
Au
,
,mod,
, is addressed in Section 5.8.2. The model
uncertainty term for steel expansion factors,
cpmsteel
cpmsteel
A
Au
,,
,,mod,
, is addressed in Section 5.8.5.
5.8 Expansion factor model uncertainties
In this Section the model uncertainty of the different combined expansion factors is addressed. First in Section 5.8.1, some general assumptions and approach for the oil expansion factors is presented. Then in Sections 5.8.2, 5.8.3 and 5.8.4, the model uncertainties for respectively the oil expansion factors
pm
liqA ,,
pm
liqA , and
p
liqA are derived. Finally, in Section 5.8.5, the model uncertainty for the steel
expansion factor cpm
steelA ,,is derived.
5.8.1 Oil expansion factor - introduction
The model uncertainty term for oil expansion factors,
pmliq
pmliq
A
Au
,
,mod,
,
pmliq
pmliq
A
Au
,
,mod,
and
pliq
pliq
A
Au
mod,
need some more
focus. They are related to the model uncertainties of the temperature and pressure expansion factors

Handbook of uncertainty calculations for ultrasonic oil flow metering stations Report
Ref. no.: CMR-15-A14071-RA-1 Rev.: 00 Date: 31.12.2015 Page 32 of 66
© Christian Michelsen Research AS. This document is an original Christian Michelsen Research (CMR) document.
tlxC and plxC . These factors calculate the volume change from a given temperature and pressure to
standard temperature and pressure. The model uncertainties are given in API MPMS 11.1. When calculations between other temperatures and pressures are carried out by combining several expansion factors, the model uncertainty for the total calculation will be different. For example, if a volume correction is carried out from 50 °C to 51 °C, it is expected that the model uncertainty is much less than for a volume correction from 50 °C to 15 °C. In Section 5.8.2, 5.8.3 and 5.8.4 models for model
uncertainty that account for this will be derived, for pm
liqA ,,
pm
liqA , and
p
liqA. For the derivations, it is
assumed that the temperature correction factor depends on a parameter TB which represents the model
uncertainty. This is an artificial constant, but can be thought of as a combination of the oil quality input
parameters ( 0K , 1K and 2K ). The model uncertainty of a temperature expansion coefficient can then
be written as
T
T
tlxtlx Bu
B
CCu
mod. (5-24)
Similarly, it is assumed that the pressure correction factor depends on a parameter. The model uncertainty of a pressure expansion coefficient can then be written as
P
P
plx
plx BuB
CCu
mod. (5-25)
This will be the basis for the derivations in the next three Sections. It should also be mentioned that in API MPMS 11.1, the model uncertainty of the volume correction
coefficients plxtlx CC , are specified as a fixed percentage (fixed relative uncertainty) over wide ranges
of pressure and temperature. This is implicitly used below in the derivation of the uncertainty models. An alternative, and maybe better approach would have been a model for the model uncertainty similar to the approach for steel expansion factors, see Section 5.8.5. However, in such a case, the model uncertainty of the oil volume correction factors would have to be defined as a linear function of the difference between line and standard temperature and between line and standard pressure. Because this is not the case in API MPMS 11.1, such an approach has not been selected here.
5.8.2 Oil expansion factor pm
liqA ,
The oil expansion factor pm
liqA ,is given in Eq. (4-15) and repeated here for convenience:
prov
plm
prov
tlm
prov
plp
prov
tlp
met
pld
met
tld
met
plm
met
tlmpm
liqCC
CC
CC
CCA ,
. (5-26)
The model uncertainty pm
liqAu ,
mod, of pm
liqA , is of relevance for the mass flow rate, when the density is
measured by a densitometer, see Eq. (5-23). It can be found as

Handbook of uncertainty calculations for ultrasonic oil flow metering stations Report
Ref. no.: CMR-15-A14071-RA-1 Rev.: 00 Date: 31.12.2015 Page 33 of 66
© Christian Michelsen Research AS. This document is an original Christian Michelsen Research (CMR) document.
.
2
2
2,
2,
2
mod
,
2
2
PCC
CCCCCCCCCCCC
CC
CC
TCC
CCCCCCCCCCCC
CC
CC
P
P
pm
liq
T
T
pm
liqpm
liq
Bu
Bu
BuB
ABu
B
AAu
metpld
provplm
metpld
TB
provplm
metpld
provplmPB
metplm
provplp
metpld
provplm
metplm
PB
provplp
metplm
provplpPB
mettld
provtlm
mettlm
provtlp
mettld
provtlm
mettld
TB
provtlm
mettld
provtlmTB
mettlm
provtlp
mettld
provtlm
mettlm
TB
provtlp
mettlm
provtlpTB
metpld
provplm
metplm
provplp
(5-27)
It is now assumed that all the derivatives related to temperature are equal and that all derivatives related
to pressure are equal. This is similar to assuming that the temperatures (met
d
met
m
prov
m
prov
p TTTT ,,, ) in
question here are not too far away from each other, and similarly that the pressures
met
d
met
m
prov
m
prov
p PPPP ,,, in question here are not too far away from each other. This means that the
notation will be simplified as follows:
.
,
met
pld
P
met
plm
P
prov
plm
P
prov
plp
P
pl
P
met
tld
T
met
tlm
T
prov
tlm
T
prov
tlp
T
tl
T
CB
CB
CB
CB
CB
CB
CB
CB
CB
CB
(5-28)
Eq. (5-27) then simplifies to
.
2
mod2
2
mod2
2
2
2
2
2
mod
,
plmet
pld
prov
plm
met
pld
prov
plm
met
plm
prov
plp
met
pld
prov
plm
prov
plp
met
plm
prov
tlm
met
tlm
prov
tlp
tlmet
tld
prov
tlm
met
tld
prov
tlm
met
tlm
prov
tlp
met
tld
prov
tlm
prov
tlp
met
tlm
prov
plm
met
plm
prov
plp
Ppl
Pmet
pld
prov
plm
met
pld
prov
plm
met
plm
prov
plp
met
pld
prov
plm
prov
plp
met
plm
met
tld
prov
tlm
met
tlm
prov
tlp
Ttl
Tmet
tld
prov
tlm
met
tld
prov
tlm
met
tlm
prov
tlp
met
tld
prov
tlm
prov
tlp
met
tlm
met
pld
prov
plm
met
plm
prov
plp
pm
liq
CuCC
CCCCCCCC
C
CC
CuCC
CCCCCCCC
C
CC
BuCBCC
CCCCCCCC
CC
CC
BuCBCC
CCCCCCCC
CC
CC
Au
(5-29)
Expressed with relative standard uncertainties, Eq. (5-29) becomes
.1
1
2
mod
2
2
mod
22
,
mod
,
met
plm
pl
met
pld
met
plm
prov
plm
met
plm
prov
plp
met
plm
met
tlm
tl
met
tld
met
tlm
prov
tlm
met
tlm
prov
tlp
met
tlm
pm
liq
pm
liq
C
Cu
C
C
C
C
C
C
C
Cu
C
C
C
C
C
C
A
Au
(5-30)

Handbook of uncertainty calculations for ultrasonic oil flow metering stations Report
Ref. no.: CMR-15-A14071-RA-1 Rev.: 00 Date: 31.12.2015 Page 34 of 66
© Christian Michelsen Research AS. This document is an original Christian Michelsen Research (CMR) document.
5.8.3 Oil expansion factor pm
liqA ,
The oil expansion factor pm
liqA ,is given in Eq. (4-5) and repeated here for convenience:
prov
plm
prov
tlm
met
plm
met
tlm
prov
plp
prov
tlppm
liqCC
CCCCA ,
(5-31)
The model uncertainty pm
liqAu ,
mod, of pm
liqA , is of relevance for volumetric flow rate at standard
conditions, see Eq. (5-14), and for mass flow rate, when the reference density is measured in a laboratory, see Eq. (5-20). It can now be found:
.
2
2
2
2
2,
2,
2
mod
,
Pprov
plm
prov
plmB
met
plm
prov
plp
prov
plm
met
plmB
prov
plp
met
plm
prov
plpB
prov
tlm
met
tlm
prov
tlp
Tprov
tlm
prov
tlmB
met
tlm
prov
tlp
prov
tlm
met
tlmB
prov
tlp
met
tlm
prov
tlpB
prov
plm
met
plm
prov
plp
P
P
pm
liq
T
T
pm
liqpm
liq
BuC
CCCCCCCC
C
CC
BuC
CCCCCCCC
C
CC
BuB
ABu
B
AAu
PPP
TTT (5-32)
As in Section 5.8.2, it is assumed that all the derivatives related to temperature are equal and that all derivatives related to pressure are equal. Eq. (5-32) then simplifies to
.
2
mod2
2
mod2
2
2
2
2
2
mod
,
plprov
plm
met
plm
prov
plp
prov
plm
prov
plp
met
plm
prov
tlm
met
tlm
prov
tlp
tlprov
tlm
met
tlm
prov
tlp
prov
tlm
prov
tlp
met
tlm
prov
plm
met
plm
prov
plp
Ppl
Pprov
plm
met
plm
prov
plp
prov
plm
prov
plp
met
plm
prov
tlm
met
tlm
prov
tlp
Ttl
Tprov
tlm
met
tlm
prov
tlp
prov
tlm
prov
tlp
met
tlm
prov
plm
met
plm
prov
plppm
liq
CuC
CCCCC
C
CC
CuC
CCCCC
C
CC
BuCBC
CCCCC
C
CC
BuCBC
CCCCC
C
CCAu
(5-33)
Expressed with relative standard uncertainties, Eq. (5-33) becomes
2
mod
22
mod
22
,
mod
,
11
met
plm
pl
prov
plm
met
plm
prov
plp
met
plm
met
tlm
tl
prov
tlm
met
tlm
prov
tlp
met
tlm
pm
liq
pm
liq
C
Cu
C
C
C
C
C
Cu
C
C
C
C
A
Au. (5-34)

Handbook of uncertainty calculations for ultrasonic oil flow metering stations Report
Ref. no.: CMR-15-A14071-RA-1 Rev.: 00 Date: 31.12.2015 Page 35 of 66
© Christian Michelsen Research AS. This document is an original Christian Michelsen Research (CMR) document.
5.8.4 Oil expansion factor p
liqA
The oil expansion factor p
liqAis given in Eq. (4-11) and repeated here for convenience:
prov
plm
prov
tlm
prov
plp
prov
tlpp
liqCC
CCA
. (5-35)
The model uncertainty p
liqAu
mod, of p
liqA is of relevance for volumetric flow rate at line conditions, see
Eq. (5-17). It can now be found as
.
2
2
2
2
22
2
mod
Pprov
plm
prov
plmB
prov
plp
prov
plm
prov
plpB
prov
tlm
met
tlm
prov
tlp
Tprov
tlm
prov
tlmB
prov
tlp
prov
tlm
prov
tlpB
prov
plm
prov
plp
P
P
p
liq
T
T
p
liqp
liq
BuC
CCCC
C
CC
BuC
CCCC
C
C
BuB
ABu
B
AAu
PP
TT (5-36)
As in Sections 5.8.2 and 5.8.3, it is assumed that all the derivatives related to temperature are equal and that all derivatives related to pressure are equal. Eq. (5-36) then simplifies to
.
2
mod2
2
mod2
2
2
2
2
2
mod
plprov
plm
prov
plp
prov
plm
prov
tlm
prov
tlp
tlprov
tlm
prov
tlp
prov
tlm
prov
plm
prov
plp
Ppl
Pprov
plm
prov
plp
prov
plm
prov
tlm
prov
tlp
Ttl
Tprov
tlm
prov
tlp
prov
tlm
prov
plm
prov
plpp
liq
CuC
CC
C
C
CuC
CC
C
C
BuCBC
CC
C
C
BuCBC
CC
C
CAu
(5-37)
Expressed with relative standard uncertainties, Eq. (5-37) becomes
2
mod
22
mod
22
,
mod 11
prov
plm
pl
prov
plm
prov
plp
prov
tlm
tl
prov
tlm
prov
tlp
pm
liq
p
liq
C
Cu
C
C
C
Cu
C
C
A
Au. (5-38)

Handbook of uncertainty calculations for ultrasonic oil flow metering stations Report
Ref. no.: CMR-15-A14071-RA-1 Rev.: 00 Date: 31.12.2015 Page 36 of 66
© Christian Michelsen Research AS. This document is an original Christian Michelsen Research (CMR) document.
5.8.5 Steel expansion factor cpm
steelA ,,
The steel expansion factor cpm
steelA ,,is given in Eq. (4-6) and repeated here for convenience:
prov
psm
prov
tsm
cal
psp
cal
tsp
met
psm
met
tsm
prov
psp
prov
tspcpm
steelCCCC
CCCCA ,,
. (5-39)
The model uncertainty cpm
steelAu ,,
mod,
of
cpm
steelA ,, is of relevance for all flow rates covered in this Handbook,
See Eqs. (5-14), (5-17), (5-20) and (5-23). As discussed in Sections 4.3.1 and 4.3.2, the temperature and pressure volume correction factors for steel can be written as
bxtsx TTC 31 , (5-40)
and
bxpsx PPC 1 . (5-41)
see Eqs. (4-25) and (4-29). The parameters α and β depends on the type of flow meter / prover and on
the type of steel quality. The model uncertainty of cpm
steelA ,, will be calculated from the uncertainty in the
α and β parameters. The derivation will be divided into two different cases:
Ultrasonic flow meter as master meter
Turbine flow meter as master meter, or a displacement prover First, the case where an ultrasonic flow meter is used as master meter, is addressed. In that case it is assumed that it is the same type of flow meter that is in use both for the duty meter and the master
meter. Therefore, the α and β coefficients will be the same for the two meters. In this case cpm
steelA ,, can
be written as
b
prov
mmb
prov
mmb
cal
pmb
cal
pm
b
met
mmb
met
mmb
prov
pmb
prov
pmcpm
steelPPTTPPTT
PPTTPPTTA
131131
131131,,
. (5-42)
The model uncertainty of cpm
steelA ,, can be written as
2
,,2
,,2,,
mod,
m
m
cpm
steelm
m
cpm
steelcpm
steel uA
uA
Au
. (5-43)
By inserting Eq. (5-42) into Eq. (5-43) and carrying out the differentiation, the relative standard model uncertainty can be written as

Handbook of uncertainty calculations for ultrasonic oil flow metering stations Report
Ref. no.: CMR-15-A14071-RA-1 Rev.: 00 Date: 31.12.2015 Page 37 of 66
© Christian Michelsen Research AS. This document is an original Christian Michelsen Research (CMR) document.
By inserting Eq. (5-42) into Eq. (5-43) and carrying out the differentiation, the relative standard model uncertainty can be written as
.
11
11
31
3
31
3
31
3
31
3
22
22
2
,,
,,
mod,
m
m
b
prov
mm
b
prov
mm
b
cal
pm
b
cal
pm
b
prov
pm
b
met
mm
b
prov
pm
b
prov
pm
m
m
b
prov
mm
b
prov
mm
b
cal
pm
b
cal
pm
b
prov
pm
b
met
mm
b
prov
pm
b
prov
pm
cpm
steel
cpm
steel
u
PP
PP
PP
PP
PP
PP
PP
PP
u
TT
TT
TT
TT
TT
TT
TT
TT
A
Au
(5-44)
Next, the case of where a turbine flow meter is used as master meter, or a displacement prover is used, is addressed. In that case there will be different α and β coefficients for the flow meter and the
proving device, and they have to be treated as four uncorrelated variables pmpm ,,, with respect
to the uncertainty. In this case cpm
steelA ,, can be written as
b
prov
mmb
prov
mmb
cal
ppb
cal
pp
b
met
mmb
met
mmb
prov
ppb
prov
ppcpm
steelPPTTPPTT
PPTTPPTTA
131131
131131,,
. (5-45)
The model uncertainty of cpm
steelA ,, can be written as
.
2,,
2,,
2,,
2,,
2,,
mod,
m
m
cpm
steelm
m
cpm
steel
p
p
cpm
steelp
p
cpm
steelcpm
steel
uA
uA
uA
uA
Au
(5-46)
By inserting Eq. (5-45) into Eq. (5-46) and carrying out the differentiation, the relative standard model uncertainty can be written as

Handbook of uncertainty calculations for ultrasonic oil flow metering stations Report
Ref. no.: CMR-15-A14071-RA-1 Rev.: 00 Date: 31.12.2015 Page 38 of 66
© Christian Michelsen Research AS. This document is an original Christian Michelsen Research (CMR) document.
.
11
3131
3
11
3131
3
22
22
22
222
,,
,,
mod,
m
m
b
prov
mmb
met
mm
prov
m
met
mm
m
m
b
prov
mmb
met
mm
prov
m
met
mm
p
p
b
cal
ppb
prov
pp
cal
p
prov
pp
p
p
b
cal
ppb
prov
pp
cal
p
prov
pp
cpm
steel
cpm
steel
u
PPPP
PP
u
TTTT
TT
u
PPPP
PP
u
TTTT
TT
A
Au
(5-47)

Handbook of uncertainty calculations for ultrasonic oil flow metering stations Report
Ref. no.: CMR-15-A14071-RA-1 Rev.: 00 Date: 31.12.2015 Page 39 of 66
© Christian Michelsen Research AS. This document is an original Christian Michelsen Research (CMR) document.
6 Program
This Chapter documents the web-based computer program for carrying out uncertainty analyses based on the uncertainty models described in this Handbook. It should here be emphasised that the example input values in that calculation tool are just examples, and should not be regarded as recommended values by NFOGM, CMR, NPD or any other party.
6.1 Software platform
The «Oilmetering» application is implemented in the “Microsoft Silverlight 5” framework, a subset of “Microsoft .Net” that can be installed in a web browser. This framework facilitates running applications with rich functionality in the web browser, without need for installation and with high security (“sandboxed”). When the user visits a specific web page, the complete application will be downloaded and run securely without need for any further communication with the web server. The application is stored in the web browser cache and will only be downloaded again if there is a new version available.
The choice of Silverlight was based on the need for an object-oriented implementation language (C#) and reuse of existing source code base (framework).
Microsoft Silverlight 5 is available for Windows and Mac OSX, and will be supported and updated at least until October 2021. Note that this does not imply that a Silverlight 5 application will stop working after this date, but that Microsoft will not update the Silverlight 5 platform any further (the same way that “mainstream support” for Windows 7 expired January 13, 2015).
6.2 Installation and use
The web address for the application will be published on http://NFOGM.no. By visiting the published address, the complete application will be downloaded and run. The download is about 4 MB and will only be downloaded again if there is a newer version available. If the client PC does not have “Microsoft Silverlight 5” framework installed, the user will be redirected to a web page on Microsoft.com that offers to install Silverlight on the client machine. This is a less than 7 MB download and should install in less than a minute.
6.3 Program overview
The “Oilmetering” application uses input consisting of
Metering station template (the general type of instruments and layout of these).
Oil properties.
Properties for the different equipment included in the template.
Process conditions and measurement results from the calibration, proving and metering phases.
From this input the application then can
1. Compute and visualize the resulting uncertainty in flow measurement values. 2. Compute additional relevant properties of the oil and process conditions. 3. Generate a report in different formats and print the report. 4. Save work in a file for future use and reference.
The following sections describe the functionality in more detail and uses screenshots from the application to illustrate.

Handbook of uncertainty calculations for ultrasonic oil flow metering stations Report
Ref. no.: CMR-15-A14071-RA-1 Rev.: 00 Date: 31.12.2015 Page 40 of 66
© Christian Michelsen Research AS. This document is an original Christian Michelsen Research (CMR) document.
6.3.1 Specify metering station template
The start page of the application (Figure 6.1) is also the page where the user specifies the metering station template, meaning the general type of instruments and the layout of these. There are several aspects of the metering station that is modeled:
Flow Meter: what type of meter is used and what configuration of sensors is used to measure the
line temperature and line pressure. In the first version of the application only ultrasonic is
available, but the choice of meter could be expanded in the future.
Stationary prover / master meter: what type of stationary prover / master meter is used
(Ultrasonic, Turbine or Displacement Prover) and what configuration of sensors is used to
measure the temperature and pressure of the prover / master meter (single, dual or average).
Density measurement: what type of density measurement is used, laboratory measurement or
installed densitometer. If an installed densitometer is used, what configuration of sensors is used
to measure the densitometer temperature and pressure (single, dual or average).
By specifying choices for each of these aspects, the user is in effect selecting a metering station template. When the user then presses the “Accept and Continue”-button a copy of the selected template is created and the application moves to the first of several input pages, “Oil Properties” (Figure 6.2). A page navigation menu below the application header is also displayed, where the user now can move freely between different pages (Figure 6.3), some related to input and others related to computed results and visualizations. The pages typically organize content in several sections, and the user can select a section with some form of navigation control.
The selected metering station template is set up with some example values, so the user can explore the application functionality without first finishing all the data input.
The following pages are available after the metering station template has been selected:
Metering Station: start page where the selected template is displayed. The user can also create
a new or open an existing from a file.
Oil: input regarding oil product type and also other properties like base pressure and
temperature.
Equipment: input regarding properties and uncertainty in the metering station equipment, for
example flow meter, master meter, and the temperature and pressure sensors used.
Calibration: input regarding calibration conditions and uncertainty in the calibration procedure.
This input page is not applicable when the selected stationary prover is of type “Displacement
Prover”.
Proving: input regarding proving conditions and uncertainty in the proving procedure.
Metering: input regarding metering conditions and uncertainty in the metering procedure.
Results: computed uncertainty of the main flow measurement variables (absolute volume flow,
standard volume flow and mass flow), volume correction factors and density measurement, all
displayed as uncertainty budgets tables.
Charts: computed uncertainty of the main flow measurement variables (absolute volume flow,
standard volume flow and mass flow), volume correction factors and density measurement, all
displayed as uncertainty budgets tables.
Plots: computed uncertainty of the main flow measurement variables (absolute volume flow,
standard volume flow and mass flow) as function of a selected flow rate range, displayed as
plots.
Report: summary of the uncertainty analysis formatted as an on-screen report. This can be
printed, exported to Excel (XLSX) and PDF format, and it is possible to save the analysis in a file
for later use, sharing and reference.

Handbook of uncertainty calculations for ultrasonic oil flow metering stations Report
Ref. no.: CMR-15-A14071-RA-1 Rev.: 00 Date: 31.12.2015 Page 41 of 66
© Christian Michelsen Research AS. This document is an original Christian Michelsen Research (CMR) document.
The user can move between the input pages in any order, but due to computational dependencies the following work flow is recommended when input data: “Oil”->”Equipment”->”Calibration”->”Proving”->”Metering”. In addition, the logical flow between sections in each page is typically from left to right.
The following discusses each of the pages.
Figure 6.1 Oilmetering application start page, where the user specifies the metering station template. It is also possible to open a previously saved file.

Handbook of uncertainty calculations for ultrasonic oil flow metering stations Report
Ref. no.: CMR-15-A14071-RA-1 Rev.: 00 Date: 31.12.2015 Page 42 of 66
© Christian Michelsen Research AS. This document is an original Christian Michelsen Research (CMR) document.
Figure 6.2 “Oil”-page with “Product Type”-section selected, where the user specifies the oil product type from a set of API standards, or model another product type by entering values for a set of API constants.
Figure 6.3 Page navigation menu where the user can move freely between different pages, some related to input and others related to computed results and visualizations.
6.3.2 Oil Properties Page
There are two sections on the oil properties page, one concerning the reference density and API model of the oil, and the other concerning the operating conditions:
Product Type: specification of oil density at reference conditions and API standard oil product
type, defined by a set of API constants (Figure 1.2).
Conditions: specification of base pressure and temperature and equilibrium vapor pressure
(Figure 6.4).
The available oil product types is as defined in API. An oil product not in the API standard can be specified by choosing the “Other”-checkbox. The table listing the API standard constants (Figure 6.2) will then be enabled (it is read-only otherwise) and relevant model parameters can be input and will be used in the calculation. The model uncertainties for “Ctl” and “Cpl” is also given as either API standards, or user defined. When specified as “API” the actual values (temperature and pressure dependent) is
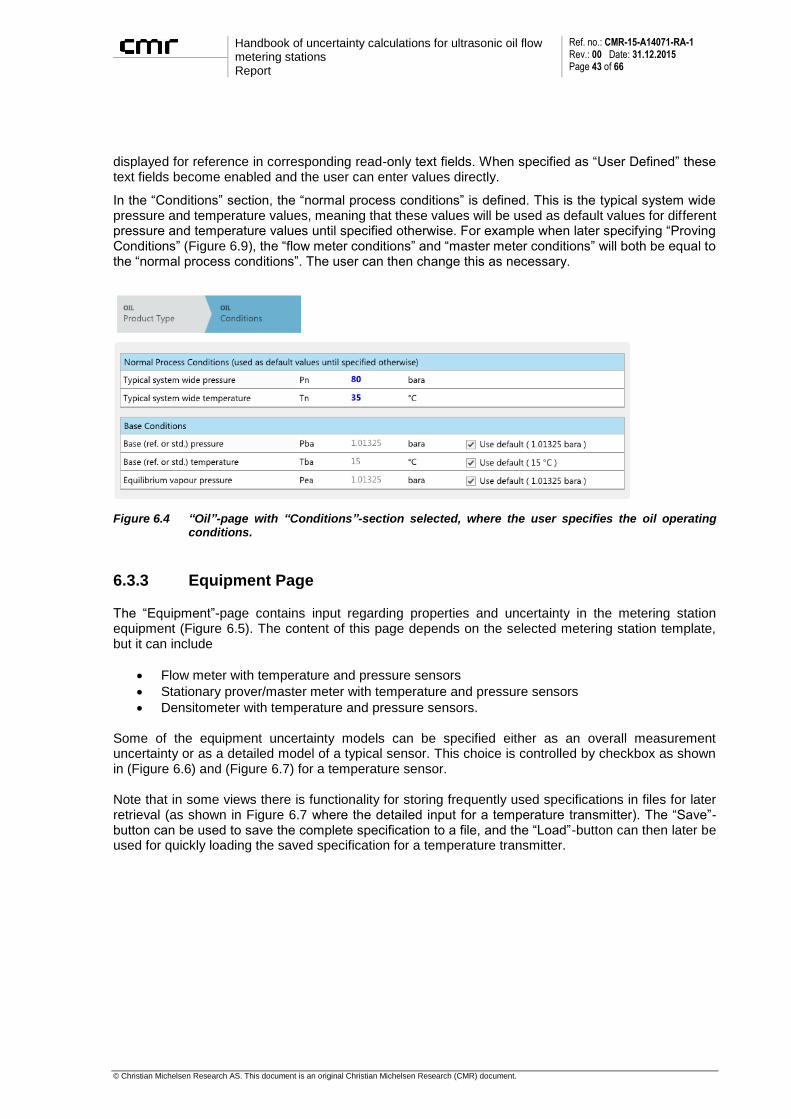
Handbook of uncertainty calculations for ultrasonic oil flow metering stations Report
Ref. no.: CMR-15-A14071-RA-1 Rev.: 00 Date: 31.12.2015 Page 43 of 66
© Christian Michelsen Research AS. This document is an original Christian Michelsen Research (CMR) document.
displayed for reference in corresponding read-only text fields. When specified as “User Defined” these text fields become enabled and the user can enter values directly.
In the “Conditions” section, the “normal process conditions” is defined. This is the typical system wide pressure and temperature values, meaning that these values will be used as default values for different pressure and temperature values until specified otherwise. For example when later specifying “Proving Conditions” (Figure 6.9), the “flow meter conditions” and “master meter conditions” will both be equal to the “normal process conditions”. The user can then change this as necessary.
Figure 6.4 “Oil”-page with “Conditions”-section selected, where the user specifies the oil operating conditions.
6.3.3 Equipment Page
The “Equipment”-page contains input regarding properties and uncertainty in the metering station equipment (Figure 6.5). The content of this page depends on the selected metering station template, but it can include
Flow meter with temperature and pressure sensors
Stationary prover/master meter with temperature and pressure sensors
Densitometer with temperature and pressure sensors. Some of the equipment uncertainty models can be specified either as an overall measurement uncertainty or as a detailed model of a typical sensor. This choice is controlled by checkbox as shown in (Figure 6.6) and (Figure 6.7) for a temperature sensor. Note that in some views there is functionality for storing frequently used specifications in files for later retrieval (as shown in Figure 6.7 where the detailed input for a temperature transmitter). The “Save”-button can be used to save the complete specification to a file, and the “Load”-button can then later be used for quickly loading the saved specification for a temperature transmitter.

Handbook of uncertainty calculations for ultrasonic oil flow metering stations Report
Ref. no.: CMR-15-A14071-RA-1 Rev.: 00 Date: 31.12.2015 Page 44 of 66
© Christian Michelsen Research AS. This document is an original Christian Michelsen Research (CMR) document.
Figure 6.5 “Equipment”-page with “Flow Meter”-section selected. This page concerns uncertainty in the metering station equipment.
Figure 6.6 Overall input for a temperature transmitter.

Handbook of uncertainty calculations for ultrasonic oil flow metering stations Report
Ref. no.: CMR-15-A14071-RA-1 Rev.: 00 Date: 31.12.2015 Page 45 of 66
© Christian Michelsen Research AS. This document is an original Christian Michelsen Research (CMR) document.
Figure 6.7 Detailed input for a temperature transmitter. The “Save”-button can be used to save the complete specification to a file, and the “Load”-button can then later be used for quickly loading the saved specification.
6.3.4 Calibration Page
The “Calibration”- page contains input regarding calibration conditions and uncertainty in the calibration procedure of the master meter (Figure 6.8). Note that this input page is not applicable when the selected stationary prover is of type “Displacement Prover”. It contains the following sections:
Calibration Conditions: pressure and temperature conditions for master meter at calibration. These are used to calculate corresponding liquid and steel volume correction factors.
Master Meter Calibration: specifies the result from the master meter calibration procedure. The “deviation”-curve together with calibration reference uncertainty and repeatability for the master meter at the different calibration flow rates is specified. The calibration curve is also displayed for convenience.

Handbook of uncertainty calculations for ultrasonic oil flow metering stations Report
Ref. no.: CMR-15-A14071-RA-1 Rev.: 00 Date: 31.12.2015 Page 46 of 66
© Christian Michelsen Research AS. This document is an original Christian Michelsen Research (CMR) document.
Figure 6.8 “Calibration”-page with “Master Meter Calibration”-section selected. This page concerns calibration conditions and uncertainty in the calibration procedure.

Handbook of uncertainty calculations for ultrasonic oil flow metering stations Report
Ref. no.: CMR-15-A14071-RA-1 Rev.: 00 Date: 31.12.2015 Page 47 of 66
© Christian Michelsen Research AS. This document is an original Christian Michelsen Research (CMR) document.
6.3.5 Proving Page
The “Proving”-page contains input regarding proving conditions and uncertainty in the proving procedure. There is significant differences between the scenario where proving is performed with an ultrasonic or turbine master meter, and the scenario where a displacement prover is used. Therefore, these are now described separately.
6.3.5.1 Proving with Ultrasonic or Turbine Master Meter
The input page contains the following sections:
Proving Conditions: pressure and temperature conditions for duty meter and master meter, at proving (Figure 6.9). These are used to calculate corresponding liquid and steel volume correction factors.
Proving Uncertainty: specifies the proving flow rate and the uncertainty in proving of duty meter against master meter at this flow rate (Figure 6.10). Repeatability for both duty meter and master meter at the proving flow rate can be specified, and in addition an uncertainty due to flow profile and fluid effects on master meter. There is also an uncertainty of the proving result for the flow meter due to difference between proving flow rate and nearest calibration flow rate for the master meter, and this is automatically computed and included in the model. This contribution is also visualized as shown in Figure 6.10.
Figure 6.9 “Proving”-page with “conditions”-section for scenario with duty meter proving by ultrasonic or turbine master meter.

Handbook of uncertainty calculations for ultrasonic oil flow metering stations Report
Ref. no.: CMR-15-A14071-RA-1 Rev.: 00 Date: 31.12.2015 Page 48 of 66
© Christian Michelsen Research AS. This document is an original Christian Michelsen Research (CMR) document.
Figure 6.10 Uncertainty in proving of duty meter against master meter at a given proving rate. Note the visualization of the uncertainty contribution due to difference between proving flow rate and nearest calibration flow rate for the master meter.
6.3.5.2 Proving with displacement prover
The input page contains the following sections:
Proving Conditions: pressure and temperature conditions for duty meter and displacement prover, at proving (Figure 6.11). These are used to calculate corresponding liquid and steel volume correction factors.
Proving Uncertainty: specifies the proving flow rate and the uncertainty in proving of duty meter against displacement prover at this flow rate (Figure 6.12). Repeatability for flow meter at the proving flow rate and displacement prover uncertainty at proving flow rate can be specified.

Handbook of uncertainty calculations for ultrasonic oil flow metering stations Report
Ref. no.: CMR-15-A14071-RA-1 Rev.: 00 Date: 31.12.2015 Page 49 of 66
© Christian Michelsen Research AS. This document is an original Christian Michelsen Research (CMR) document.
Figure 6.11 “Proving”-page with “conditions”-section for scenario with duty meter proving by displacement prover.
Figure 6.12 Uncertainty in proving of duty meter against displacement prover.

Handbook of uncertainty calculations for ultrasonic oil flow metering stations Report
Ref. no.: CMR-15-A14071-RA-1 Rev.: 00 Date: 31.12.2015 Page 50 of 66
© Christian Michelsen Research AS. This document is an original Christian Michelsen Research (CMR) document.
6.3.6 Metering Page
The “Metering”-page contains input regarding metering conditions and uncertainty in the metering procedure. It contains the following sections:
Metering Conditions: pressure and temperature conditions for flow meter at metering (Figure 6.13). These are used to calculate corresponding liquid and steel volume correction factors.
Metering Uncertainty: specifies the metering flow rate, the operating range and the linearity of the flow meter in the operating range, and the uncertainty in the flow measurement procedure at this flow rate (Figure 6.14). In the uncertainty model, repeatability for flow meter at the metering rate can be specified, and in addition an uncertainty due to flow profile and fluid effects on the flow meter. There is also an uncertainty contribution due to difference between metering flow rate and proving flow rate, and this is automatically computed using the linearity of the flow meter and included in the model. This contribution is also visualized as shown in Figure 6.14.
Figure 6.13 “Metering”-page with “conditions”-section.
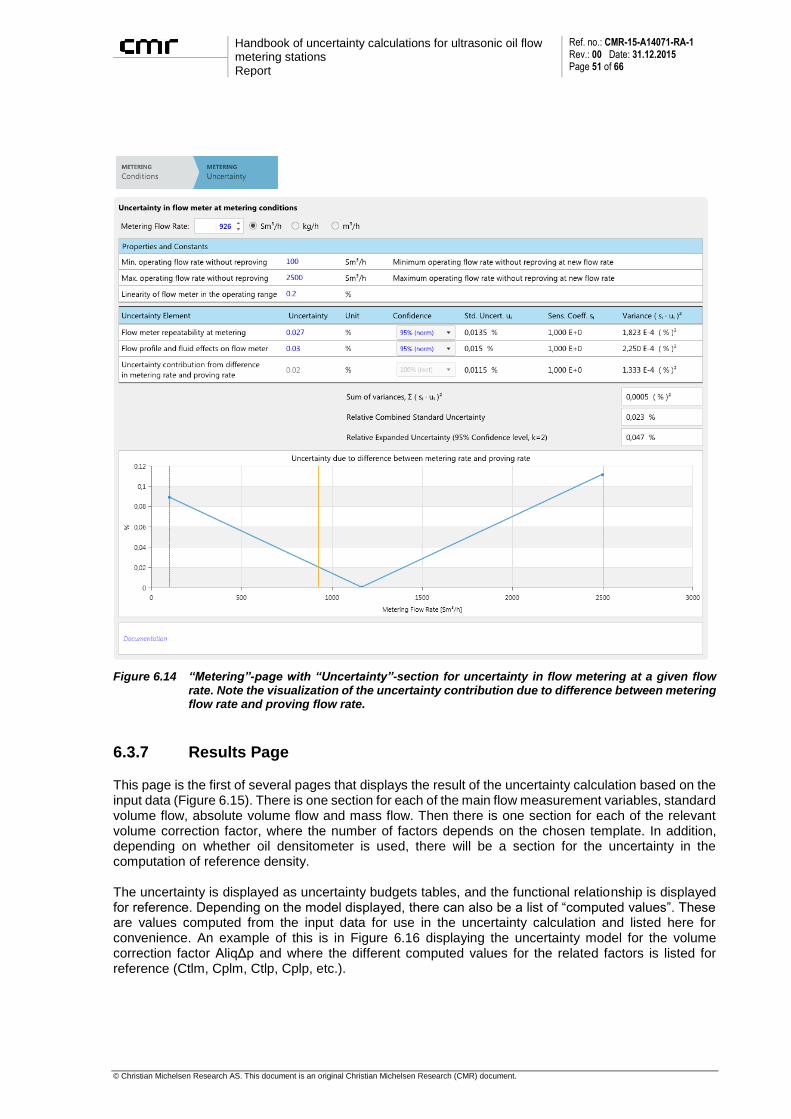
Handbook of uncertainty calculations for ultrasonic oil flow metering stations Report
Ref. no.: CMR-15-A14071-RA-1 Rev.: 00 Date: 31.12.2015 Page 51 of 66
© Christian Michelsen Research AS. This document is an original Christian Michelsen Research (CMR) document.
Figure 6.14 “Metering”-page with “Uncertainty”-section for uncertainty in flow metering at a given flow rate. Note the visualization of the uncertainty contribution due to difference between metering flow rate and proving flow rate.
6.3.7 Results Page
This page is the first of several pages that displays the result of the uncertainty calculation based on the input data (Figure 6.15). There is one section for each of the main flow measurement variables, standard volume flow, absolute volume flow and mass flow. Then there is one section for each of the relevant volume correction factor, where the number of factors depends on the chosen template. In addition, depending on whether oil densitometer is used, there will be a section for the uncertainty in the computation of reference density. The uncertainty is displayed as uncertainty budgets tables, and the functional relationship is displayed for reference. Depending on the model displayed, there can also be a list of “computed values”. These are values computed from the input data for use in the uncertainty calculation and listed here for convenience. An example of this is in Figure 6.16 displaying the uncertainty model for the volume correction factor AliqΔp and where the different computed values for the related factors is listed for reference (Ctlm, Cplm, Ctlp, Cplp, etc.).

Handbook of uncertainty calculations for ultrasonic oil flow metering stations Report
Ref. no.: CMR-15-A14071-RA-1 Rev.: 00 Date: 31.12.2015 Page 52 of 66
© Christian Michelsen Research AS. This document is an original Christian Michelsen Research (CMR) document.
Figure 6.15 Computed uncertainty of the main flow measurement variables (standard volume flow, absolute volume flow and mass flow) and some other essential values, displayed as uncertainty budgets tables.

Handbook of uncertainty calculations for ultrasonic oil flow metering stations Report
Ref. no.: CMR-15-A14071-RA-1 Rev.: 00 Date: 31.12.2015 Page 53 of 66
© Christian Michelsen Research AS. This document is an original Christian Michelsen Research (CMR) document.
Figure 6.16 Uncertainty model for the volume correction factor AliqΔmΔp with the different computed values for the related factors listed for reference.

Handbook of uncertainty calculations for ultrasonic oil flow metering stations Report
Ref. no.: CMR-15-A14071-RA-1 Rev.: 00 Date: 31.12.2015 Page 54 of 66
© Christian Michelsen Research AS. This document is an original Christian Michelsen Research (CMR) document.
6.3.8 Uncertainty Budget Charts Page
This page displays the same data as the “Result”-page, but as uncertainty budget charts (Figure 6.17). That is, there is one chart for each of the main flow measurement variables, standard volume flow, absolute volume flow and mass flow. Then there is one chart for each of the relevant volume correction factors, where the number of factors depends on the chosen template. In addition, depending on whether oil densitometer is used there will be a chart for the uncertainty in the computation of reference density. Note that the “Export Image”-button let the user save an image of the chart to a file.
Figure 6.17 Computed uncertainty of the main flow measurement variables (standard volume flow, absolute volume flow and mass flow) and some other essential values, displayed as uncertainty budgets charts. The “Export Image”-button let the user save an image of the chart to a file.

Handbook of uncertainty calculations for ultrasonic oil flow metering stations Report
Ref. no.: CMR-15-A14071-RA-1 Rev.: 00 Date: 31.12.2015 Page 55 of 66
© Christian Michelsen Research AS. This document is an original Christian Michelsen Research (CMR) document.
6.3.9 Uncertainty Range Plots Page
The “Plots”-page contains computed uncertainty of the main flow measurement variables (standard volume flow, absolute volume flow and mass flow) as function of a selected flow rate range, displayed as plots (Figure 6.18). It is possible to select the flow rate range and the flow rate unit (Sm3/h, kg/h, m3/h). Note that the “Export Image”-button let the user save an image of the plot to a file.
Figure 6.18 Computed uncertainty of the main flow measurement variables plotted over a selectable flow range.
6.3.10 Uncertainty Report Page
The “Report”-page contains a summary of the uncertainty analysis formatted as an on-screen report (Figure 6.19). There are 4 essential features represented by the 4 buttons on the top of the page:
Save uncertainty analysis: it is possible to save the analysis in a file for later use, sharing and reference. The file is encrypted so that it cannot be tampered with (note that this does not imply that it is password protected and it can still be shared with others).
Print report: the on-screen report containing a summary of the analysis can be sent to a printer if available.
Save report to XLSX: a more detailed report containing the input data and analysis results can be saved in a XLSX file. This is the standard file format for Excel, but several other spreadsheet application is compatible with this format today.
Save report to PDF: the same report as for XLSX can be saved in PDF format.

Handbook of uncertainty calculations for ultrasonic oil flow metering stations Report
Ref. no.: CMR-15-A14071-RA-1 Rev.: 00 Date: 31.12.2015 Page 56 of 66
© Christian Michelsen Research AS. This document is an original Christian Michelsen Research (CMR) document.
Figure 6.19 “Report”-page contains a summary of the uncertainty analysis formatted as an on-screen report. This can be printed and it is possible to save the analysis in a file for later use and reference.
The on-screen report includes the following:
Header which integrates the <Name>, <Date> and <Description> input from start page.
Graphic that displays the selected metering station template.
Tables listing the line metering operating conditions, proving conditions and calibration conditions.
Uncertainty budget for standard volume flow at the given flow rate in units of Sm3/h, for mass flow at the given flow rate in units of kg/h and for absolute volume flow at the given flow rate in units of m3/h. The respective functional relationship is displayed together with any relevant computed values used in the models.
Uncertainty budget for additional measurements, depending on template. For example if the template included a densitometer, there is an uncertainty budget for the uncertainty of the reference density computation.
The more detailed XLSX and PDF report includes in addition the following:

Handbook of uncertainty calculations for ultrasonic oil flow metering stations Report
Ref. no.: CMR-15-A14071-RA-1 Rev.: 00 Date: 31.12.2015 Page 57 of 66
© Christian Michelsen Research AS. This document is an original Christian Michelsen Research (CMR) document.
Detailed data regarding oil product type and operating conditions like base pressure and temperature, as given by the user on the “Oil”-page.
Uncertainty in the calibration procedure as given by the user on the “Calibration”-page.
Uncertainty in the proving procedure as given by the user on the “Proving”-page
Uncertainty in the metering procedure as given by the user on the “Metering”-page
6.3.11 Note about “Save” and “Open” functionality
When the user saves an uncertainty analysis to file, it will always be a new file, named from a standard “Save File As..”-dialog. It is not possible to save “changes” to an existing file. In practice, this is not a limitation. If the user opens an uncertainty analysis file and want to “save changes”, it is always possible to just use the same file name and thereby overwrite the file. While this mechanism seems like an unnecessary limitation, it is in fact an important security feature of Silverlight. A Silverlight application cannot generally access the file system on a computer. The only exception to this is if the user is shown a file select dialog (controlled by the system, not the application) and then selects a specific file to open and read (read-only) or a name for a file to create (write-only). Through the system controlled file dialog the user has full control over what files the application can read, and over what file areas and file name the application can write to.
6.3.12 Note about “opening” an uncertainty analysis file
When the application start page is first shown the two buttons at the bottom right “Accept and Continue” and “Open From File” is both enabled. If the user chooses either of these the application moves to the “Oil” page. If the user now goes back to the start page the “Open From File” button is no longer enabled and the “Accept and Continue” button have changed name to “Create New”. It is therefore not possible to open an uncertainty analysis file from this state. To either create a new uncertainty analysis or open an existing from file the user must first press the “Create New” button. This returns the application to the initial state where both the “Accept and Continue” and “Open From File” is enabled.

Handbook of uncertainty calculations for ultrasonic oil flow metering stations Report
Ref. no.: CMR-15-A14071-RA-1 Rev.: 00 Date: 31.12.2015 Page 58 of 66
© Christian Michelsen Research AS. This document is an original Christian Michelsen Research (CMR) document.
7 Summary
This Handbook documents uncertainty models for fiscal oil metering stations using ultrasonic flow meter. Proving device is either a displacement prover, an ultrasonic flow master meter or a turbine flow master meter. The uncertainty models cover volumetric flow rate at standard conditions, volumetric flow rate at line conditions and mass flow rate. The density is either measured by an online densitometer or obtained through sampling and laboratory analysis. The uncertainty models are implemented on a web-based Microsoft Silverlight technology. This can be accessed free of charge from www.nfogm.no. The present work is related to a similar work on fiscal gas metering stations, see [Frøysa et al, 2013]. It is also based on [Dahl et al, 2003], [Lunde et al, 2002] and [Lunde et al, 2010].

Handbook of uncertainty calculations for ultrasonic oil flow metering stations Report
Ref. no.: CMR-15-A14071-RA-1 Rev.: 00 Date: 31.12.2015 Page 59 of 66
© Christian Michelsen Research AS. This document is an original Christian Michelsen Research (CMR) document.
8 References
API MPMS 4.2, “Manual of Petroleum Measurement Standards – Chapter 4: Proving Systems, Section 2 – Displacement Provers,” American Petroleum Institute, Washington DC, 2003. API MPMS 4.5, “Manual of Petroleum Measurement Standards – Chapter 4: Proving Systems, Section 5 – Master-Meter Provers,” American Petroleum Institute, Washington DC, 2011. API MPMS 5.3, “Manual of Petroleum Measurement Standards – Chapter 5: Metering, Section 3 – Measurement of Liquid Hydrocarbons by Turbine Meters,” American Petroleum Institute, Washington DC, 2005. API MPMS 5.8, “Manual of Petroleum Measurement Standards – Chapter 5: Metering, Section 8 – Measurement of Liquid Hydrocarbons using Ultrasonic Flow Meters,” American Petroleum Institute, Washington DC, 2011. API MPMS 11.1, “Manual of Petroleum Measurement Standards – Chapter 11: Physical Properties Data, Section 1 – Temperature and Pressure Volume Correction Factors (VCF) Software for Generalized Crude Oils, Refined Products, and Lubricating Oils,” American Petroleum Institute, Washington DC, 2004. API MPMS 12.2, "Manual of Petroleum Measurement Standards – Chapter 12: Calculation of Petroleum Quantities, Section 2 - Calculation of Petroleum Quantities Using Dynamic Measurement Methods and Volumetric Correction Factors," Part 1-5, American Petroleum Institute, Washington DC, 1995 (Part 1), 2003 (Part 2), 1998 (Part 3), 1997 (Part 4), 2001 (Part 5). Dahl, E., Frøysa, K.-E. and Lunde, P.: “Handbook of Uncertainty Calculations - Fiscal Orifice Gas and Turbine Oil Metering Stations”, Issued by Norwegian Society for Oil and Gas Measurement (NFOGM) and Norwegian Petroleum Directorate, 2003. Frøysa, K.-E. and Lied, G. Ø.: “Handbook for uncertainty calculations for gas flow metering stations. Documentation of uncertainty models and internet tool”, CMR report no. CMR-14-A10099-RA-1-Rev01, issued by Norwegian Society for Oil and Gas Measurement (NFOGM) and Norwegian Petroleum Directorate, 2014. Lunde, P. and Frøysa, K.-E.: “Handbook of Uncertainty Calculations, ultrasonic fiscal gas metering stations,” Issued by Norwegian Society for Oil and Gas Measurement (NFOGM) and Norwegian Petroleum Directorate, 2002. Lunde, P. and Frøysa, K.-E.: ”Ormen Lange ultrasonic gas flow meters. A study for establishment of corrections for pressure and temperature effects.” CMR report no. CMR-06-A10048-RA-01, March 2007. Lunde, P., Frøysa, K.-E., Lied, G., Skatvedt, R. and Vervik, S.: "Handbook of uncertainty calculations. Fiscal oil metering stations based on ultrasonic duty and master meters," in proceedings from the 28th International North Sea Flow Measurement Workshop, St. Andrews, Scotland, October 2010. ISO 5168, “Measurement of fluid flow – Procedures for the evaluation of uncertainties,” ISO. Geneva, 2005. ISO 12242, “Measurement of fluid flow in closed conduits – Ultrasonic transit-time meters for liquid,” ISO, Geneva, 2012. ISO 17089-1, “Measurement of fluid flow in closed conduits – Ultrasonic meters for gas – Part 1: Meters for custody transfer and allocation measurement,” ISO, Geneva, 2010.

Handbook of uncertainty calculations for ultrasonic oil flow metering stations Report
Ref. no.: CMR-15-A14071-RA-1 Rev.: 00 Date: 31.12.2015 Page 60 of 66
© Christian Michelsen Research AS. This document is an original Christian Michelsen Research (CMR) document.
ISO GUM, “Uncertainty of measurement – Part 3: Guide to the expression of uncertainty in measurement (GUM:1995),” ISO guide 98-3, ISO, Geneva, 2008. NORSOK I-105: “Fiscal measurement system for hydrocarbon liquid,” NORSOK standard I-105, Rev. 2, 1998. NORSOK I-106: “Fiscal measurement system for hydrocarbon liquid and gas,” NORSOK standard I-106, Ed. 2, 2014. NPD, “Regulations relating to measurement of petroleum for fiscal purposes and for calculation of CO2-tax (The measurement regulations),” The Norwegian Petroleum Directorate (NPD), 2001, last translated 2012.

Handbook of uncertainty calculations for ultrasonic oil flow metering stations Report
Ref. no.: CMR-15-A14071-RA-1 Rev.: 00 Date: 31.12.2015 Page 61 of 66
© Christian Michelsen Research AS. This document is an original Christian Michelsen Research (CMR) document.
Appendix A Detailed formulas for the linearity contribution to the proving uncertainty
This Appendix gives the details regarding the linearity contribution to the proving uncertainty in the case of a master meter proving device. The uncertainty contribution appears in the third term on the right hand side of Eq. (5-6). This uncertainty contribution is caused by the fact that the flow calibration of the master meter is carried out at a limited number of flow rates. The correction of the flow (master) meter is based on an interpolation over flow rates of the deviations from reference at the flow rates used in the flow calibration. The results presented here are based on [Lunde et al, 2002], [Lunde et al, 2010] and [Frøysa et al, 2014].
A 1 Functional relationship
After flow calibration, an adjustment of the flow meter shall be performed. The flow calibration is carried out by comparing the output flow rate from the flow meter with the similar reading from a reference measurement. This is carried out at a set of N different flow rates where the reference meter measured
the flow rate irefvq ,, and the flow meter measured the flow rate
iMetervq ,,, i = 1, …, N. A full correction of
the flow meter at each of these flow rates can therefore be written as
iMeterviiv qKq ,,, , (A.1)
where
iMeterv
irefv
iq
qK
,,
,, . (A.2)
The relative difference in per cent between the flow rate as measured by the flow meter and the reference meter can be written as
irefv
irefviMeterv
iq
qqp
,,
,,,,100
. (A.3)
The relation between these two quantities is
i
i
i
ii
pK
K
Kp
100
100;
1100 . (A.4)
From these correction factors a general correction factor valid for all flow rates (and not only at the specific flow rates where the flow calibration is carried out) is established. This can formally be written as
Metervv Kqq , , (A.5)
where
vN qKKKfK ,,,, 21 . (A.6)

Handbook of uncertainty calculations for ultrasonic oil flow metering stations Report
Ref. no.: CMR-15-A14071-RA-1 Rev.: 00 Date: 31.12.2015 Page 62 of 66
© Christian Michelsen Research AS. This document is an original Christian Michelsen Research (CMR) document.
This factor corresponds to correcting a percentage deviation of p %, where
pKK
Kp
100100;
1100 . (A.7)
In practice, such a correction could have been carried out by different methods, including
i. no correction, ii. a constant percentage correction, iii. linear interpolation, and iv. other methods (splines and other curve fittings).
If one of the two first methods is used, there will be known systematic errors left which are not corrected for. This is not in accordance with the Norwegian Petroleum Directorate Measurement Regulations [NPD, 2012], where one requirement in Section 8 is that “The measurement system shall be designed so that systematic measurement errors are avoided or compensated for”. They will therefore not be covered here. In the third method, the adjustment will be based on a linear interpolation between the adjustment factors established for the flow rates used in the flow calibration. Such an interpolation can be carried out either on K, or on the percentage deviation p. Here, a linear interpolation in p is described. Both for the correction and for the uncertainty analysis, the results will almost be the same whether the interpolation is carried out on p or on K. The linear interpolation can be written as
.
;
1,,,,,
,,,
,,1,,
1
iMetervMeterviMeterv
iMetervMeterv
iMeterviMeterv
iii
qqqwhen
qqqq
pppp
(A.8)
K can then be found from Eq. (A.7). It should be commented that this third method provides a correction such that the flow meter’s flow rate will be corrected to the reference meter flow rate, when the flow rate is equal to any of the flow rates used in the flow calibration. This case is therefore in agreement with the Norwegian Petroleum Directorate Measurement Regulations. The fourth method is a generalization of the third method, where the linear interpolation is replaced with a non-linear interpolation (e.g. based on splines) or a partially linear interpolation where more interpolation points than the ones used in the flow calibration (ref. method (iii)) are used. In such cases, it is recommended that for the uncertainty analysis, it is treated as method (iii).
A 2 Uncertainty model
The uncertainty of the flow rate due to the above mentioned adjustment of a flow meter after flow calibration will now be described. This is the linearity contribution to the proving uncertainty, as appearing in the third term on the right hand side of Eq. (5-6). It can be written as
22
0
,0
K
Ku
q
quprov
v
prov
linearityv. (A.9)
with a reference to Eq. (A.5). The term is related to the percentage difference, p, between flow rate from the flow meter and the reference measurement, because of Eq. (A.4). The actual expression depends
on the adjustment method for the flow meter, and of any uncorrected percentage deviations, p ,

Handbook of uncertainty calculations for ultrasonic oil flow metering stations Report
Ref. no.: CMR-15-A14071-RA-1 Rev.: 00 Date: 31.12.2015 Page 63 of 66
© Christian Michelsen Research AS. This document is an original Christian Michelsen Research (CMR) document.
between the flow meter and the reference meter. As discussed above, only a linear interpolation correction method will be addressed here. More specific, the correction is carried out using a linear interpolation in the percentage deviation between the flow meter and the reference meter. The linear interpolation provides an approximate value for the deviation from reference for flow rates between the ones used in the flow calibration. This is illustrated in an example shown in Figure A.1, where a flow meter is flow calibrated at volume flow rates at standard conditions of 500 m³/h and 2000 m³/h. The deviation from reference at 500 m³/h is in this example 0.3 %. At 2000 m³/h it is 0.1 %. The blue curve represents the interpolated for volume flow rates at standard conditions between 500 m³/h and 2000 m³/h. The correction of the meter is based on this curve. However, such a linear interpolation is an approximation, and the exact shape of the deviation curve is not known. In this work it is assumed that the true curve is somewhere inside the red parallelogram. It is further assumed that the probability is the same for the curve to be anywhere inside the parallelogram. The maximum (and unknown) uncorrected percentage deviation after correction is therefore not larger than:
when 21,,0,,0,0,,0 iMeterviMetervMeterviMeterv qqqq :
;1
,,01,,0
,,0,0
ii
iMeterviMeterv
iMetervMetervpp
qqp
(A.10)
when 1,,0,01,,0,,0 2 iMetervMeterviMeterviMeterv qqqq :
.1
,,01,,0
,01,,0
ii
iMeterviMeterv
MeterviMetervpp
qqp
(A.11)
This maximum percentage deviation is shown in Figure A.2. For flow rates outside the calibrated range, extrapolation is carried out for getting an estimate for the uncorrected percentage deviation. In this case, the uncorrected percentage deviation increases as the flow rate leaves the calibrated range, and is calculated as
,
;
1,,0,0
12
1,,02,,0
1,,0,0
MetervMeterv
MetervMeterv
MetervMeterv
qqwhen
ppqq
qqp
(A.12)
and
.
;
,,0,0
1
1,,0,,0
,,0,0
nMetervMeterv
nn
nMetervnMeterv
nMetervMeterv
qqwhen
ppqq
qqp
(A.13)
The expression for p is considered to be expanded uncertainty of p with 100 % confidence level and
rectangular distribution function. The standard uncertainty of p is then found by dividing p with the
square root of 3. The relative standard uncertainty of the correction factor estimate can now be written as

Handbook of uncertainty calculations for ultrasonic oil flow metering stations Report
Ref. no.: CMR-15-A14071-RA-1 Rev.: 00 Date: 31.12.2015 Page 64 of 66
© Christian Michelsen Research AS. This document is an original Christian Michelsen Research (CMR) document.
p
ppu
K
p
KK
Ku
q
quprov
v
prov
linearityv
100
3)(
1
0
,0 . (A.14)
Figure A.1 Example of deviation from reference at flow calibration at a standard volume flow rate of 500 m³/h (here deviation of 0.3 %) and 2000 m³/h (here deviation of 0.1%). For the correction of the flow meter, the deviation at flow rates between 500 m³/h and 2000 m³/h are found by linear interpolation (blue curve). It is assumed that the “true” deviation curve is somewhere within the red parallelogram.
Figure A.2 Relative standard uncertainty related to the correction factor for the example shown in Figure A.1.

Handbook of uncertainty calculations for ultrasonic oil flow metering stations Report
Ref. no.: CMR-15-A14071-RA-1 Rev.: 00 Date: 31.12.2015 Page 65 of 66
© Christian Michelsen Research AS. This document is an original Christian Michelsen Research (CMR) document.
Appendix B List of symbols
This appendix contains a list of the most relevant parameters used throughout this Handbook.
liqA : Combinations of pressure and temperature volume coefficients, of relevance when
calculating the volumetric flow rate at standard conditions, the volumetric flow rate at
line conditions and the mass flow rate. liqA is combined with superscripts “p” (for
proving) and/or “m” (for metering). A delta (Δ) in front of “p” or “m” means that volume correction between two conditions during proving or metering. No delta (Δ) means that the volume correction to standard pressure and temperature is calculated.
steelA : Combinations of pressure and temperature volume coefficients, of relevance when
calculating the volumetric flow rate at standard conditions, the volumetric flow rate at
line conditions and the mass flow rate. steelA is combined with superscripts “c” (for
calibration), “p” (for proving) and/or “m” (for metering). A delta (Δ) in from of “c”, “p” or “m” means that volume correction between two conditions during proving or metering. No delta (Δ) means that the volume correction to standard pressure and temperature is calculated.
plxC : Volume correction coefficient for oil (liquid), for pressure changes from the pressure at
condition “x” to standard pressure.
psxC : Volume correction coefficient for steel, for pressure changes from a base pressure to
the pressure at condition “x”.
tlxC : Volume correction coefficient for oil (liquid), for temperature changes from the
temperature at condition “x” to standard temperature.
tsxC : Volume correction coefficient for steel, for temperature changes from a base
temperature to the temperature at condition “x”.
K : Correction factor to be applied after flow calibration, see Eq. (A.5) p : Percentage deviation that is corrected after flow calibration, see Eq. (A.7)
xP : Absolute pressure at condition “x”.
0P : Absolute standard pressure (1 atm = 101325 Pa)
measmq , : Mass flow rate, as measured by the primary flow meter, after corrections from the
proving and calibration.
measvq , : Volumetric flow rate at line (flow meter) conditions, as measured by the primary flow
meter, after corrections from the proving and calibration.
measvq ,0 : Volumetric flow rate at standard conditions (volumetric flow rate converted to standard
temperature and pressure), as measured by the primary flow meter, after corrections from the proving and calibration.
metering
flowmeternomq , Volumetric flow rate at line conditions that would have been measured by the primary
flow meter during metering, without the corrections from the proving and calibration, and if temperature and pressure expansions in steel not had been taken into account.
xT : Temperature (°C) at condition “x”.
0T : Standard temperature (15 °C)
)(Xu : Standard uncertainty of quantity X
XXu )( : Relative standard uncertainty of quantity X

Handbook of uncertainty calculations for ultrasonic oil flow metering stations Report
Ref. no.: CMR-15-A14071-RA-1 Rev.: 00 Date: 31.12.2015 Page 66 of 66
© Christian Michelsen Research AS. This document is an original Christian Michelsen Research (CMR) document.
measV ,0 : the standard volume of oil measured by the primary flow meter volume, after corrections
from the proving and calibration. metering
flowmeterV ,0 : the standard volume of oil measured by the primary flow meter volume at metering (line
conditions), without the corrections from the proving and calibration. proving
flowmeterV ,0 : the standard volume of oil measured by the primary flow meter during proving of the
primary flow meter. ncalibratio
provernomV ,,0 : the standard volume of oil that would have been measured by the proving device during
calibration of the proving device, if temperature and pressure expansions in steel not had been taken into account.
ncalibratio
refV ,0 : the standard volume of oil measured by the reference instrumentation during calibration
of the proving device. ncalibratio
proverV ,0 : the standard volume of oil measured by the proving device during calibration of the
proving device. proving
proverV ,0 : the standard volume of oil measured by the proving device during proving of the primary
flow meter. metering
flowmeternomV , : the actual volume of oil (line conditions) that would have been measured by the primary
flow meter volume at metering, without the corrections from the proving and calibration, if temperature and pressure expansions in steel not had been taken into account.
proving
flowmeternomV , : the actual volume of oil (line conditions) that would have been measured by the primary
flow meter during proving of the primary flow meter, if temperature and pressure expansions in steel not had been taken into account.
proving
provernomV , : the actual volume of oil (line conditions) that would have been measured by the proving
device during proving of the primary flow meter, if temperature and pressure expansions in steel not had been taken into account.
p : Uncorrected percentage deviation after flow calibration, see Section A 2.
dens : Oil density at densitometer conditions
0 : Oil density at standard conditions
Conditions substituting “x”: Index “d” means densitometer conditions, index “m” means line (flow meter) conditions, index “p” means proving device condition and index “c” means flow calibration conditions.
Superscript “met” means during normal metering, “prov” means during proving and “cal” means during flow calibration.