report from the commission to the european parliament and the
TRANSCRIPT
EN EN
EUROPEAN COMMISSION
Brussels, 9.10.2013 COM(2013) 698 final
REPORT FROM THE COMMISSION TO THE EUROPEAN PARLIAMENT AND THE COUNCIL
PROGRESS TOWARDS ACHIEVING THE KYOTO AND EU 2020 OBJECTIVES
(required under Article 21 of Regulation (EU) No 525/2013 of the European Parliament and of the Council of 21 May 2013 on a mechanism for monitoring and reporting
greenhouse gas emissions and for reporting other information at national and Union level relevant to climate change and repealing Decision No 280/2004/EC)
{SWD(2013) 410 final}
EN 2 EN
REPORT FROM THE COMMISSION TO THE EUROPEAN PARLIAMENT AND THE COUNCIL
PROGRESS TOWARDS ACHIEVING THE KYOTO AND EU 2020 OBJECTIVES
(required under Article 21 of Regulation (EU) No 525/2013 of the European Parliament and of the Council of 21 May 2013 on a mechanism for monitoring and reporting
greenhouse gas emissions and for reporting other information at national and Union level relevant to climate change and repealing Decision No 280/2004/EC)
EN 3 EN
TABLE OF CONTENTS
REPORT FROM THE COMMISSION TO THE EUROPEAN PARLIAMENT AND THE COUNCIL PROGRESS TOWARDS ACHIEVING THE KYOTO AND EU 2020 OBJECTIVES ............................................................................................................................ 1
1. Summary ...................................................................................................................... 3
2. Actual progress 1990-2011 .......................................................................................... 6
2.1. GHG emissions trends in Member States .................................................................... 6
2.2. GHG intensities and emissions per capita in 2011....................................................... 7
2.3. GHG emissions in 2011 compared to 2010 ................................................................. 8
2.4. Emission trends in the main sectors ............................................................................. 9
3. Progress towards meeting the Kyoto target ............................................................... 10
3.1. First Commitment Period (2008-2012)...................................................................... 10
3.1.1. EU-28 ......................................................................................................................... 10
3.1.2. EU-15 ......................................................................................................................... 11
3.1.3. EU-11 ......................................................................................................................... 11
3.2. Projected use of Kyoto mechanisms by Operators and Union's governments........... 12
3.3. Projected use of carbon sinks..................................................................................... 13
4. Progress toward the 2020 target................................................................................. 13
4.1. Union's GHG emission reduction target by 2020 ...................................................... 13
4.2. Projected distance to targets....................................................................................... 14
5. State of implementation of the Union's climate change policy.................................. 16
5.1. Reducing emissions.................................................................................................... 16
5.2. Adaptation to climate change..................................................................................... 19
5.3. Climate Finance ......................................................................................................... 20
5.4 Climate research & innovation
6. Situation in the Union's candidate and potential candidate countries ........................ 20
EN 4 EN
1. SUMMARY
Overaccomplishing the Kyoto target, 2008-2012
In 2011, total EU-28 greenhouse gas (GHG) emissions without emissions and removals from Land Use, Land Use Change and Forestry (LULUCF) and excluding emissions from international aviation were 18.3 % lower compared to 1990 levels. GHG emissions continue to follow the general decreasing trend seen from 2004 onwards. Emissions in 2011 reached their lowest levels since 1990.
According to the most recent inventory data in 2011 the EU-15 and EU-28 GHG emissions decreased by 4.2 % and 3.3 % respectively compared to 2010. The 2011 emissions decrease was largely due to a milder winter in 2011 compared to 2010, which led to a lower demand for heating. This decline followed a small increase in 2010, partially due to the economic recovery, that came after a sharp drop in 2009 largely due to the effects of the 2008 economic crisis. Preliminary estimates show that EU-15 and EU-28 emissions further decreased by respectively 0.5 % and 1.3 % in 2012.
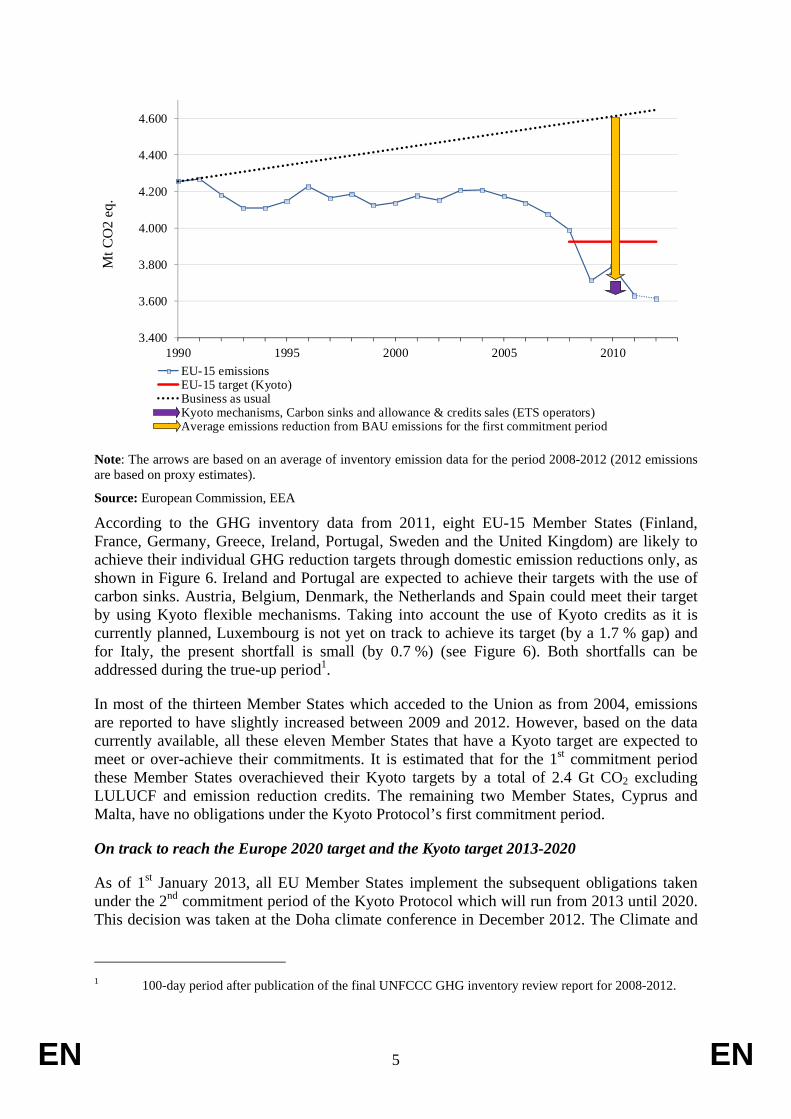
Under the Kyoto Protocol, the EU-15 has agreed to reduce its GHG emissions by 8 % by 2008–12 compared to base year levels. Based on the latest available inventory data for 2011, total GHG emissions in the EU-15 as shown in Figure 1 were 14.9 % below base year levels (without LULUCF). The EU-15 is therefore not only on track to achieve its Kyoto target for the first commitment period from 2008-2012, but will overachieve it. Over and above the EU-15 Kyoto target, an accumulated amount of 0.9 Gt CO2 eq. will have been saved during the first commitment period. Despite the fact that emissions were below the EU-15 Assigned Amount, EU-15 Member States and companies located in these Member States offset part of their emissions with emission reduction credits bringing the overachievement to a total of 1.6 Gt CO2 eq., almost doubling the reduction effort compared to the initial Kyoto target.
GDP growth for the period 1990-2011 was 44 % for the EU-15 and 45 % for the EU-28. While the economy grew significantly emissions decreased demonstrating the decoupling between economic growth and GHG emissions. Accordingly, between 2010 and 2011 the EU-28 GDP increased by 1.4%, while GHG emissions fell by 3.3 %.
Figure 1: Actual emissions (MtCO2-eq.) for EU-15
EN 5 EN
3.400
3.600
3.800
4.000
4.200
4.400
4.600
1990 1995 2000 2005 2010
Mt C
O2
eq.
EU-15 emissionsEU-15 target (Kyoto)Business as usualKyoto mechanisms, Carbon sinks and allowance & credits sales (ETS operators)Average emissions reduction from BAU emissions for the first commitment period
Note: The arrows are based on an average of inventory emission data for the period 2008-2012 (2012 emissions are based on proxy estimates).
Source: European Commission, EEA
According to the GHG inventory data from 2011, eight EU-15 Member States (Finland, France, Germany, Greece, Ireland, Portugal, Sweden and the United Kingdom) are likely to achieve their individual GHG reduction targets through domestic emission reductions only, as shown in Figure 6. Ireland and Portugal are expected to achieve their targets with the use of carbon sinks. Austria, Belgium, Denmark, the Netherlands and Spain could meet their target by using Kyoto flexible mechanisms. Taking into account the use of Kyoto credits as it is currently planned, Luxembourg is not yet on track to achieve its target (by a 1.7 % gap) and for Italy, the present shortfall is small (by 0.7 %) (see Figure 6). Both shortfalls can be addressed during the true-up period1.
In most of the thirteen Member States which acceded to the Union as from 2004, emissions are reported to have slightly increased between 2009 and 2012. However, based on the data currently available, all these eleven Member States that have a Kyoto target are expected to meet or over-achieve their commitments. It is estimated that for the 1st commitment period these Member States overachieved their Kyoto targets by a total of 2.4 Gt CO2 excluding LULUCF and emission reduction credits. The remaining two Member States, Cyprus and Malta, have no obligations under the Kyoto Protocol’s first commitment period.
On track to reach the Europe 2020 target and the Kyoto target 2013-2020
As of 1st January 2013, all EU Member States implement the subsequent obligations taken under the 2nd commitment period of the Kyoto Protocol which will run from 2013 until 2020. This decision was taken at the Doha climate conference in December 2012. The Climate and
1 100-day period after publication of the final UNFCCC GHG inventory review report for 2008-2012.
EN 6 EN
Energy package2 adopted in 2009 provides an integrated package of policies and measures to implement the new obligations under Kyoto's 2nd commitment period and to tackle climate change until 2020 and beyond. It also forms one of the five headline targets of the Europe 2020 strategy for jobs and smart, sustainable and inclusive growth demonstrating that climate action is fully integrated into the EU's overarching policies.
The total effort of the Union to reduce greenhouse gas emissions by 20 % by 2020 compared to 1990 is divided between the EU ETS and non-ETS sectors. With regard to the EU ETS, the phase 3 (2013-2020) preparation has been succesfully finalised before 1st January 2013, including the procurement of the auction platforms, the Single Union Registry and harmonised rules on monitoring, reporting, accreditation and verification.
As regards sectors not covered by the EU ETS, pursuant to the Effort Sharing Decision3 (‘ESD’), each Member State has individual binding annual emission limits for the period 2013-2020. While the EU is on track to meet its overall 2020 target for sectors not covered by the EU-ETS, 13 Member State need to implement additional policies to meet their individual 2020 targets. The monitoring of the state of implementation of the non-ETS obligations is particularly ensured under the European Semester4.
In 2011, EU-28 emissions (including international aviation) were 16.9 % below 1990 level. According to approximated data for 2012, emissions further decreased by 1 % in 2012 and were subsequently 18 % lower than in 1990.
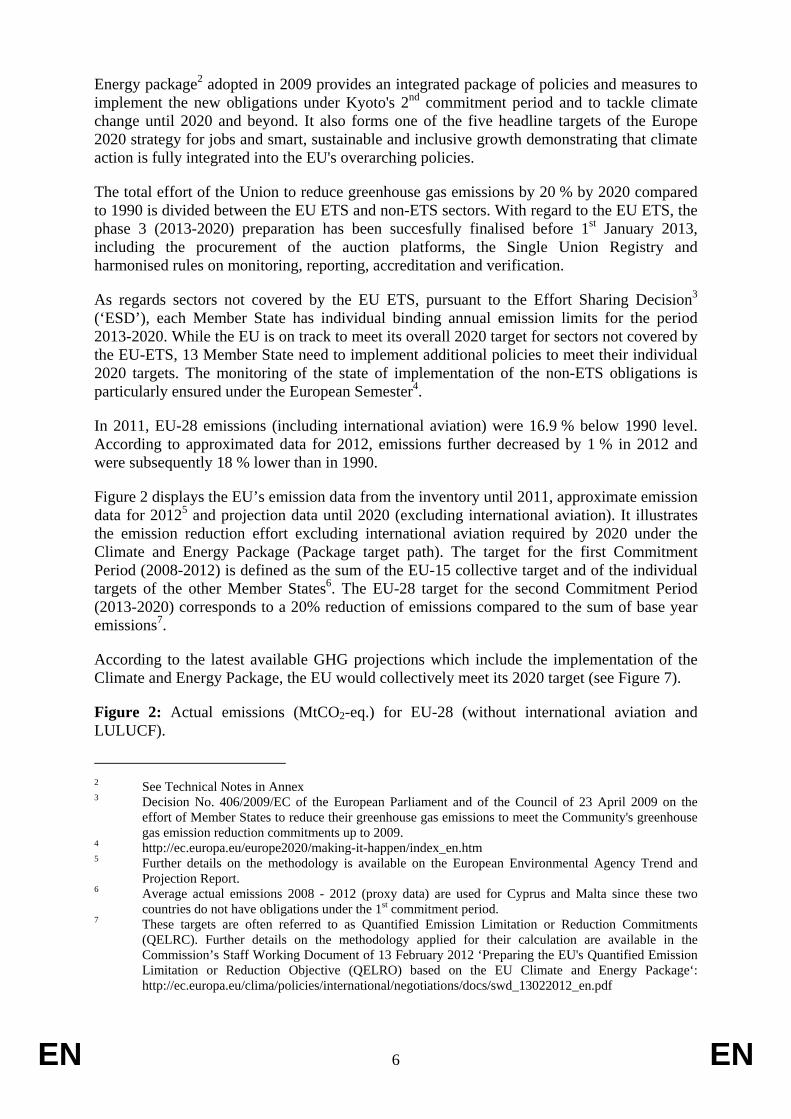
Figure 2 displays the EU’s emission data from the inventory until 2011, approximate emission data for 20125 and projection data until 2020 (excluding international aviation). It illustrates the emission reduction effort excluding international aviation required by 2020 under the Climate and Energy Package (Package target path). The target for the first Commitment Period (2008-2012) is defined as the sum of the EU-15 collective target and of the individual targets of the other Member States6. The EU-28 target for the second Commitment Period (2013-2020) corresponds to a 20% reduction of emissions compared to the sum of base year emissions7.
According to the latest available GHG projections which include the implementation of the Climate and Energy Package, the EU would collectively meet its 2020 target (see Figure 7).
Figure 2: Actual emissions (MtCO2-eq.) for EU-28 (without international aviation and LULUCF).
2 See Technical Notes in Annex 3 Decision No. 406/2009/EC of the European Parliament and of the Council of 23 April 2009 on the
effort of Member States to reduce their greenhouse gas emissions to meet the Community's greenhouse gas emission reduction commitments up to 2009.
4 http://ec.europa.eu/europe2020/making-it-happen/index_en.htm 5 Further details on the methodology is available on the European Environmental Agency Trend and
Projection Report. 6 Average actual emissions 2008 - 2012 (proxy data) are used for Cyprus and Malta since these two
countries do not have obligations under the 1st commitment period. 7 These targets are often referred to as Quantified Emission Limitation or Reduction Commitments
(QELRC). Further details on the methodology applied for their calculation are available in the Commission’s Staff Working Document of 13 February 2012 ‘Preparing the EU's Quantified Emission Limitation or Reduction Objective (QELRO) based on the EU Climate and Energy Package‘: http://ec.europa.eu/clima/policies/international/negotiations/docs/swd_13022012_en.pdf
EN 7 EN
Note: (*) defined as the sum of EU-15’s collective target and EU-13 national individual targets (average 2008-2012 (proxy data) emissions for Malta and Cyprus) (**) defined as the sum of Member States’ annual emission allocations under the ESD and ETS cap excluding international aviation. Source: European Commission, EEA
2. ACTUAL PROGRESS 1990-2011
2.1. GHG emissions trends in Member States
The overall EU GHG emission trend remains strongly influenced by the trends of the two largest emitters, Germany and the United Kingdom, accounting for about one third of total EU emissions. These two Member States have achieved total GHG emission reductions of 539 Mt CO2-equivalents compared to the Kyoto base year. The main reasons for the favourable trend in Germany were increasing efficiency in power and heating plants, increases in the share of renewable energies and the economic modernisation of the five new Länder after German reunification. The reduction of GHG emissions in the United Kingdom was primarily the result of switches from oil and coal to natural gas in electricity production and N2O emission reduction measures in the production of adipic acid.
In 2011, Italy was the third largest emitter in the EU (accounting for 10.7 % of the EU-28 total), slightly above France (with a share of 10.6 %). Italy's GHG emissions were 5.4 % below 1990 levels in 2011. Between 1990 and 2004, emissions in Italy increased primarily from road transport, electricity and heat production and petroleum refining but since then the country's total GHG emissions decreased by more than 15 %. France's emissions were 12.7 % below 1990 levels in 2011. In France, large reductions were achieved in N2O emissions from adipic acid production, but CO2 emissions from road transport increased between 1990 and 2011.
Poland and Spain remain the fifth and sixth largest emitters in the EU-28, accounting respectively for 8.7 % and 7.7 % of total GHG emissions in 2011. Poland decreased its emissions by 12.6 % between 1990 and 2011, and by 29.1 % since the base year (1988). The
EN 8 EN
main factors for decreasing emissions in Poland — as for other new Member States — were the improvement of the energy efficiency of heavy industries and the overall modernisation of the economy in the late-1980s and early 1990s. The notable exception was transport (especially road transport) where emissions increased significantly. Spain increased emissions by 23.9 % between 1990 and 2011 and by 21 % since the base year. This was largely due to emission increases from road transport, electricity and heat production, and manufacturing industries.
In 2011, twenty-one Member States had emissions below base-year levels. Spain, Portugal, Greece, Austria and Ireland had GHG emissions above base-year levels (mostly 1990). Cyprus and Malta do not have emission reduction commitments under the Kyoto Protocol's first commitment period. In those two Member States, emissions in 2011 were around 50 % above 1990 levels. The percentage changes of GHG emissions from the base year to 2011 range from -56 % (Lithuania) to +21 % (Spain).
2.2. GHG intensities and emissions per capita in 2011
Emissions in both the EU-28 and the EU-15 have been decreasing while the economy has grown significantly. Figure 3 demonstrates that the decoupling of economic growth from GHG emissions has been progressing steadily since 1990.
Figure 3: Evolution of GDP (in real terms), GHG emissions and emission intensity (ie. ratio of greenhouse gas emissions produced to GDP) – Index (1990 = 100)
Source: EEA, DG ECFIN (Ameco database), Eurostat
Between 1990 and 2011, the EU-28 GDP grew by 45 % while emissions decreased by 18.3 %. The EU-15 GDP increased by 44 % with a 14.9 % reduction of GHG emissions. Between 2010 and 2011, the EU-28 GDP increased by 1.4%, while GHG emissions fell by 3.3 %.
EN 9 EN
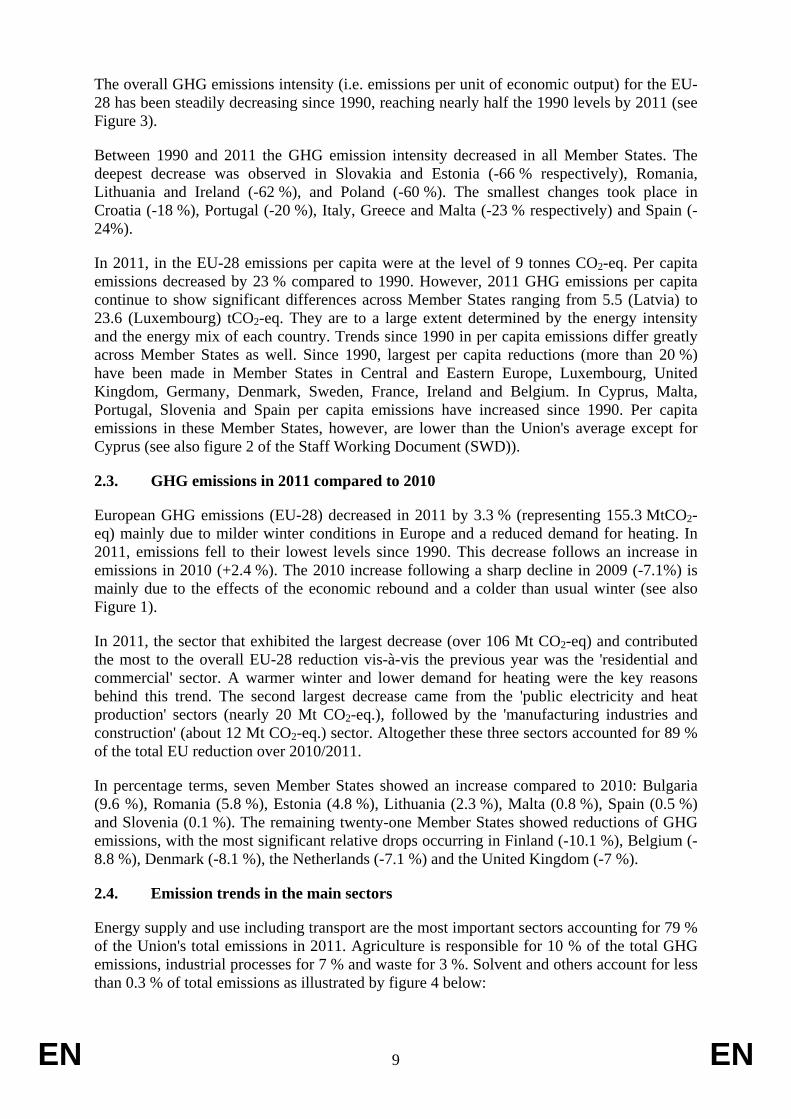
The overall GHG emissions intensity (i.e. emissions per unit of economic output) for the EU-28 has been steadily decreasing since 1990, reaching nearly half the 1990 levels by 2011 (see Figure 3).
Between 1990 and 2011 the GHG emission intensity decreased in all Member States. The deepest decrease was observed in Slovakia and Estonia (-66 % respectively), Romania, Lithuania and Ireland (-62 %), and Poland (-60 %). The smallest changes took place in Croatia (-18 %), Portugal (-20 %), Italy, Greece and Malta (-23 % respectively) and Spain (-24%).
In 2011, in the EU-28 emissions per capita were at the level of 9 tonnes CO2-eq. Per capita emissions decreased by 23 % compared to 1990. However, 2011 GHG emissions per capita continue to show significant differences across Member States ranging from 5.5 (Latvia) to 23.6 (Luxembourg) tCO2-eq. They are to a large extent determined by the energy intensity and the energy mix of each country. Trends since 1990 in per capita emissions differ greatly across Member States as well. Since 1990, largest per capita reductions (more than 20 %) have been made in Member States in Central and Eastern Europe, Luxembourg, United Kingdom, Germany, Denmark, Sweden, France, Ireland and Belgium. In Cyprus, Malta, Portugal, Slovenia and Spain per capita emissions have increased since 1990. Per capita emissions in these Member States, however, are lower than the Union's average except for Cyprus (see also figure 2 of the Staff Working Document (SWD)).
2.3. GHG emissions in 2011 compared to 2010
European GHG emissions (EU-28) decreased in 2011 by 3.3 % (representing 155.3 MtCO2-eq) mainly due to milder winter conditions in Europe and a reduced demand for heating. In 2011, emissions fell to their lowest levels since 1990. This decrease follows an increase in emissions in 2010 (+2.4 %). The 2010 increase following a sharp decline in 2009 (-7.1%) is mainly due to the effects of the economic rebound and a colder than usual winter (see also Figure 1).
In 2011, the sector that exhibited the largest decrease (over 106 Mt CO2-eq) and contributed the most to the overall EU-28 reduction vis-à-vis the previous year was the 'residential and commercial' sector. A warmer winter and lower demand for heating were the key reasons behind this trend. The second largest decrease came from the 'public electricity and heat production' sectors (nearly 20 Mt CO2-eq.), followed by the 'manufacturing industries and construction' (about 12 Mt CO2-eq.) sector. Altogether these three sectors accounted for 89 % of the total EU reduction over 2010/2011.
In percentage terms, seven Member States showed an increase compared to 2010: Bulgaria (9.6 %), Romania (5.8 %), Estonia (4.8 %), Lithuania (2.3 %), Malta (0.8 %), Spain (0.5 %) and Slovenia (0.1 %). The remaining twenty-one Member States showed reductions of GHG emissions, with the most significant relative drops occurring in Finland (-10.1 %), Belgium (-8.8 %), Denmark (-8.1 %), the Netherlands (-7.1 %) and the United Kingdom (-7 %).
2.4. Emission trends in the main sectors
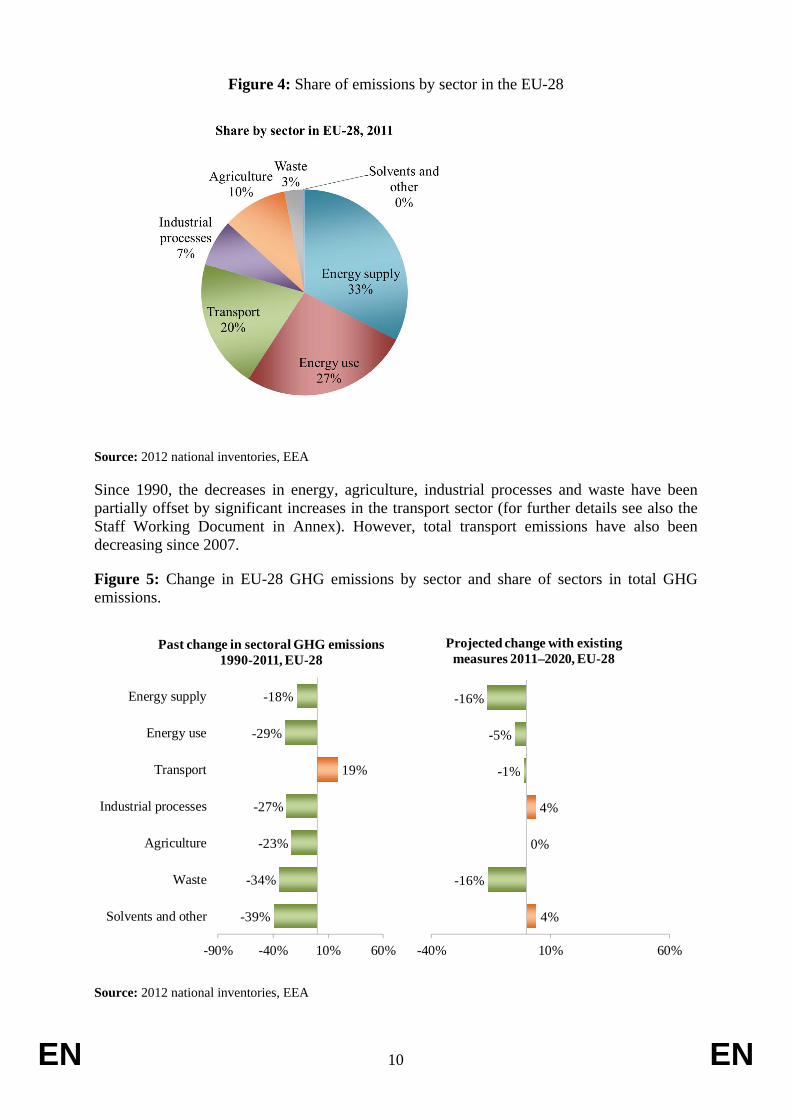
Energy supply and use including transport are the most important sectors accounting for 79 % of the Union's total emissions in 2011. Agriculture is responsible for 10 % of the total GHG emissions, industrial processes for 7 % and waste for 3 %. Solvent and others account for less than 0.3 % of total emissions as illustrated by figure 4 below:
EN 10 EN
Figure 4: Share of emissions by sector in the EU-28
Source: 2012 national inventories, EEA
Since 1990, the decreases in energy, agriculture, industrial processes and waste have been partially offset by significant increases in the transport sector (for further details see also the Staff Working Document in Annex). However, total transport emissions have also been decreasing since 2007.
Figure 5: Change in EU-28 GHG emissions by sector and share of sectors in total GHG emissions.
-18%
-29%
19%
-27%
-23%
-34%
-39%
-90% -40% 10% 60%
Energy supply
Energy use
Transport
Industrial processes
Agriculture
Waste
Solvents and other
Past change in sectoral GHG emissions 1990-2011, EU-28
-16%
-5%
-1%
4%
0%
-16%
4%
-40% 10% 60%
Projected change with existing measures 2011–2020, EU-28
Source: 2012 national inventories, EEA
EN 11 EN
According to projections based on existing measures, emissions from energy supply will further decrease between 2011 and 2020, mainly due to the renewable energy policy and the ETS. Emissions from energy use and, to a lesser extent, from transport are also projected to decrease. For transport, it is expected that the increasing demand will be compensated by the improvement of the efficiency of the means of transport and also to a limited extent by the promotion of rail. Emissions from agriculture are projected to remain almost stable until 2020. According to national projections, emissions in the industrial sector will start increasing again. Emissions from waste will continue to decrease while those from solvents and other sectors will increase.
3. PROGRESS TOWARDS MEETING THE KYOTO TARGET
3.1. First Commitment Period (2008-2012)
3.1.1. EU-28
In 2011, total EU-28 GHG emissions were 18.3 % below 1990 levels. This estimate is based on Member States’ inventory data, as reported to the Commission (EU-27) and the UNFCCC inventory submission by Croatia. This decline is even bigger when the effect of acquisitions of credits via the Kyoto mechanisms by governments and carbon sinks are taken into consideration.
3.1.2. EU-15
According to the latest inventory data, the total GHG emissions of the EU-15 were on an annual average 14.9 % below base year levels by 2011 and 12.2 % below base-year level over the first Commitment Period (2008-2012)8. Furthermore, when including,
(1) the government use of the Kyoto mechanisms which is expected to deliver an additional 1.9 % emission reduction (cf. para. 3.2), and
(2) the total removal of carbon sinks due to activities referred to in Art. 3.3 and 3.4 of the Kyoto Protocol in the EU-15 corresponding to a 1.5 % reduction (see section 3.3),
the EU-15 is expected to have reduced its emissions by 15.5 % over the first commitment period. The EU-15 is therefore on track to almost double its reduction target for the first comitment period under the joint fulfillment agreement under the Kyoto Protocol.
3.1.3. EU-11
By 2011, the other eleven countries with targets under the Kyoto Protocol's first commitment period (i.e. excluding Cyprus and Malta) reduced their emissions by 38.7 % vis-à-vis the Kyoto base years. Emissions are expected to have decreased further in 2012. According to the 2011 inventory data, these eleven Member States are likely to meet their Kyoto target for the first Commitment Period. Slovenia is the only Member State out of the EU-11 that considered until recently using credits from projects under the Kyoto mechanism to complement
8 Based on approximate data for 2012.
EN 12 EN
domestic reduction measures. Based on the latest data, Slovenia could meet its Kyoto target without making use of these mechanisms. The other EU-11 Member States have sold or plan to sell part of their unused Assigned Amount Units (AAUs) (see section 3.2).
Figure 6: Relative gaps between GHG emissions in the non-ETS sectors for the first commitment period and the respective 2008-2012 Kyoto targets (including LULUCF) with and without the use of Kyoto mechanisms. Gaps are expressed in percentage of base year emissions (including ETS and non-ETS). Negative and positive values respectively indicate overdelivery or shortfall.
Source: EEA

EN 13 EN
3.2. Projected use of Kyoto mechanisms by Operators and Union's governments
Under the EU ETS, the second National Allocation Plans (NAPs) establishes a limit for each Member State for the maximum use of project-based credits from Joint Implementation (JI) and Clean Development Mechanism (CDM) by operators. In total and on average, up to 278 million CERs or ERUs may be used per year by ETS installations from all Member States between 2008 and 2012, which corresponds to 13.4 % of the EU-wide cap for this period. Actually, operators used 1058.7 million CERs or ERUs which was 10.8 % of all units surrendered for compliance. The amount of credits surrendered increased from 4 % of total verified emissions in 2008 to 26 % in 2012 due to the falling prices of international offsets. From 2013 onwards the rules for the use of JI and CDM credits have been revised as set in the EU ETS Directive.
Nine Member States of the EU-15 as well as Slovenia have indicated to purchase and use international credits from Kyoto mechanisms to reach their Kyoto targets. Together, these Member States estimated that they would acquire up to 82 Mt CO2-eq. per year for compliance under the first commitment period under the Kyoto Protocol. This would represent 1.9 and 4.9 percentage points towards the Kyoto targets for the EU-15 and for Slovenia, respectively (see Table 12 in the SWD).
These 10 Member States together anticipated to invest up to € 2.4 billion to acquire units through JI, CDM or AAU trading. Austria, the Netherlands, Spain, Ireland and Belgium allocated the largest budgets for the five-year commitment period. In Slovenia, the budget has been estimated at € 80 million. However, given the impact of the continuing economic recession on GHG emissions, Member States might not need as many international credits as initially estimated.
As regards AAUs sold by Member States, according to most recent data available, about 68.2 Mt CO2-eq. have been transferred so far, while some contracted amounts may not be delivered yet. Bulgaria, the Czech Republic, Estonia, Hungary, Latvia, Lithuania and Slovakia reported that they intend to further sell AAUs. One Member State (UK) has legislated that it would cancel any surplus AAUs between the Kyoto target and the UK unilateral ‘carbon budget’ after the first commitment period.
3.3. Projected use of carbon sinks
In addition to the policies and measures targeting various sources of GHG emissions, Member States can make use of carbon sinks. The information provided so far indicates that total net sequestration during the commitment period from afforestation and reforestation activities under Art. 3.3 of the Kyoto Protocol will be 17.1 MtCO2 per year for the EU-15. In addition, the use of activities under Article 3.4 is projected to contribute about 46.7 MtCO2 per year of the commitment period in the EU-15. Taking in addition into account contributions from EU-13, the accounting of these activities will amount to 23.3 and 60.6 MtCO2 per year (for details see Table 13 in the accompanying Staff Working Document).
Together, activities under Article 3.3 and 3.4 in the EU-15 Member States are projected to reduce emissions by 63.9 Mt CO2 per year of the commitment period. This is equivalent to about 1.5 percentage point of the EU-15 reduction commitment during the first commitment period compared to base year emissions.
EN 14 EN
4. PROGRESS TOWARD THE 2020 TARGET
4.1. Union's GHG emission reduction target by 2020 The Climate and Energy Package set a 20% GHG emission reduction target for EU-28 by 2020 compared to 1990, which is equivalent to -14% compared to 2005. This is also the basis for the EU's international obligation under the 2nd commitment period under the Kyoto Protocol from 2013-2020. This effort will be divided between the EU ETS and non-ETS sectors as follows:
(a) 21% reduction in EU ETS sector emissions by 2020 compared to 2005 and
(b) Under the Effort Sharing Decision (‘ESD’), a reduction of around 10% by 2020 compared to 2005 for the sectors that are not covered by the EU ETS. The ESD mainly covers emissions from transportation, buildings, small businesses and services, agriculture and waste.
While the ETS provides an EU-wide cap, the ESD relies mostly on Member States defining and implementing additional national policies and measures to limit their emissions in the ESD sectors. The ESD sets annual emission allocations from 2013 to 2020.
4.2. Projected distance to targets
According to Member States’ projections submitted in 2013, when international aviation is included, EU emissions are projected to be 21% lower in 2020 than in 1990 and 22 % lower when international aviation is excluded. The EU-28 is currently on track to meet its EU 2020 target. However, 13 Member States will need additional efforts to meet their 2020 targets for the non-ETS sectors while 15 Members States are already projected to reach these commitments with existing policies and measures.
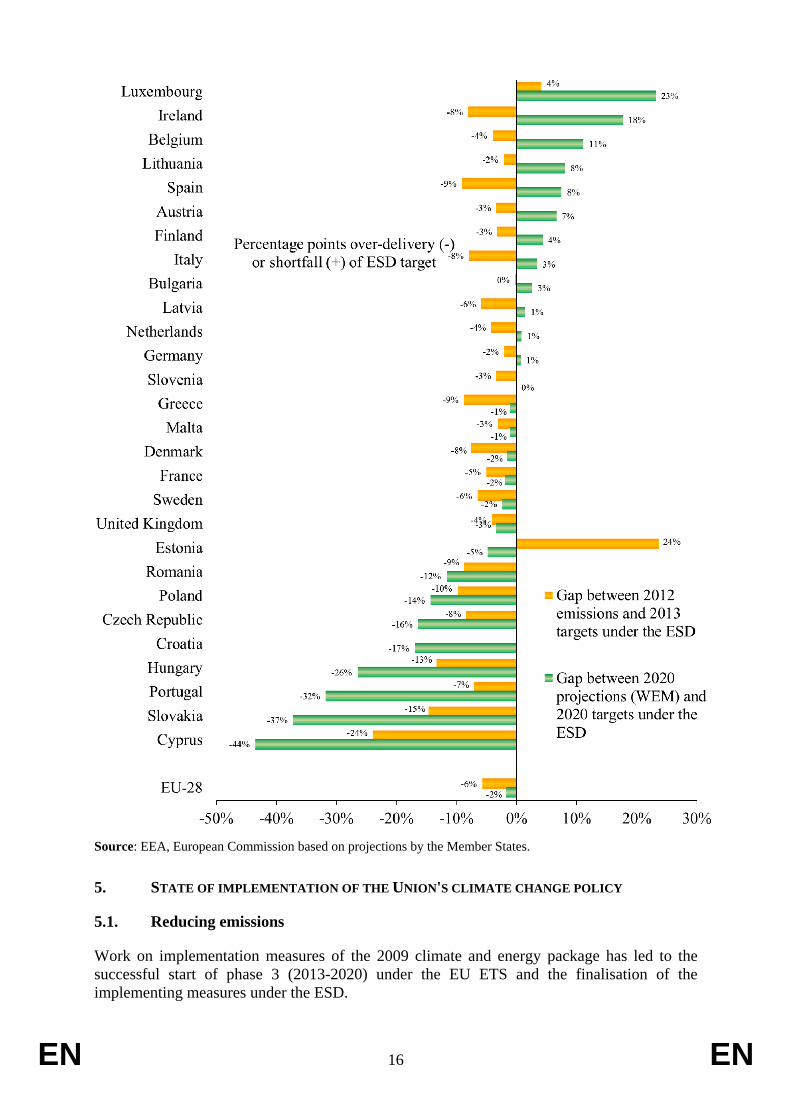
Figure 7 shows the gap per Member State between non-ETS GHG emissions projections by 2020 based on existing measures and the 2020 targets as a percentage of 2005 emissions. This analysis does not yet take into account the use of flexibilities provided for in the ESD, such as the use of international project credits or transfers of surplus emissions allocations among Member States. The graph also shows the gaps between the 2012 emissions and the 2013 national targets under the ESD.
As part of the European Semester, the Commission carries out specific analysis on the situation of individual Member States as regards progress towards their 2020 targets based on projected emissions with existing measures. The most recent analysis, reflected in the Commission Staff Working Documents (SWD) published as part of the European Semester in early June 20139, lead to the following main conclusions which are confirmed by the latest projections provided by Member States after completion of quality check and gap-filling by the European Environmental Agency10:
9 http://ec.europa.eu/europe2020/making-it-happen/country-specific-recommendations/index_en.htm 10 Member States submissions were quality-checked, gap-filled and adjusted where necessary. An
estimation of the share of non-ETS emissios had to be made for several Several Member States. For the gap filling and ETS/non-ETS split estimation, data from the 2012-13 EU baseline with adopted measures projection based on the PRIMES and GAINS models have been used. The latter projections
EN 15 EN
• GHG emissions in Luxemburg are projected to exceed the national target by a wide margin (gap of 23 percentage points). Emissions in 2012 are also above the 2013 targets under the ESD. Significant GHG emission reductions could be achieved by increasing taxation on energy products for transport, as underlined in the Country Specific Recommendation (CSR).
• Ireland’s GHG emissions are also expected to exceed the target by a wide margin (gap of 18 percentage points) due to a large increase of emissions in transport and in agriculture. Ireland however proposed in 2013 a range of initiatives to reduce emissions under the Low-Carbon Development Bill.
• Emissions in Belgium are also projected to fall short of the national target by 11 percentage points. In this regards, the CSR for Belgium stressed the need for a clear division of tasks between authorities to ensure progress reaching the targets, in particular in the field of transport and buildings. Measures should also be taken to shift taxes from labour to less growth-distortive tax bases, notably environmental taxation.
• Furthermore, projections show also that five other Member States (Lithuania, Spain, Austria, Finland and Italy) are expected to miss their target by a gap of more than 3%. For these Member States, current measures are expected not to be sufficient for achieving national targets.
• According to their national projections, Poland and Estonia would overachieve their target by a wide margin. However, Polish projections were carried out in 2010 and 2011. Recent EU baseline projections based on PRIMES and GAINS models indicate that Poland could face difficulties in delivering on its commitment. Estonia’s emissions are higher than expected. According to approximated data, Estonia’s emission will exceed in 2012 its 2013 ESD target and could face also difficulties in meeting its commitment.
In the context of the 2013 European Semester, the Council adopted several country-specific recommendations relevant to GHG emissions reduction. The Council recommended that Belgium, the Czech Republic, France Hungary, Italy, Latvia, Lithuania, Romania and Spain shift the tax burden away from labour to taxes less detrimental to growth, including environmental taxes. It recommended Estonia, Lithuania and Luxembourg to enact appropriate fiscal measures to improve the energy efficiency of the transport sector. The Council also recommended Bulgaria, the Czech Republic, Estonia, Latvia, Lithuania, Malta, Poland, Romania and Slovakia to pursue efforts to improve energy efficiency. The UK was recommened to stimulate investments in new energy capacity, including in renewable energy.
Figure 7: Projected gap to 2020 targets for non-ETS sectors and gap between the 2012 emissions and the non-ETS 2013 target. Negative and positive values respectively indicate overdelivery and shortfall in percentage of 2005 emissions.
also indicate the sensitivity of projection results to different methodologies, assumptions and specific parameters behind the trends.
EN 16 EN
Source: EEA, European Commission based on projections by the Member States.
5. STATE OF IMPLEMENTATION OF THE UNION'S CLIMATE CHANGE POLICY
5.1. Reducing emissions
Work on implementation measures of the 2009 climate and energy package has led to the successful start of phase 3 (2013-2020) under the EU ETS and the finalisation of the implementing measures under the ESD.

EN 17 EN
5.1.1. EU ETS
The EU ETS covers more than 12 000 power plants and manufacturing installations in the 28 EU member states, Iceland, Norway and Liechtenstein and also, from 2012, emissions from airlines flying between airports in these countries and to closely connected areas. The EU-wide average annual cap for 2008-2012 amounted to 2081 million allowances per year.
Verified emissions of greenhouse gases from stationary installations have continued to fall, dropping to 1 867 million tonnes of CO2-equivalent in 2012, about 2% below the 2011 level for installations and 10% below the cap. Verified emissions reported by airlines amount to almost 84 million tonnes.
The level of compliance by the installations remains very high. Only less than 1% of the installations participating in the EU ETS did not surrender allowances covering all their 2012 emissions by the deadline of 30 April 2013.
As of 2012, aviation emissions are subject to a cap in the EU ETS. Aircraft operators responsible for over 98 % of the 2012 aviation emissions covered by the EU ETS have successfully taken the necessary steps by 30 April 2013 to comply with the EU ETS legislation. In accordance with the provisions of the "stop the clock" Decision adopted in April 2012, aircraft operators may limit their responsibility for 2012 to flights within Europe only, in which case they may also have taken a further step by 27 May to return free allocations for flights outside Europe.
As provided for by the revised EU ETS Directive, all EU ETS operations are centralised into a single registry operated by the Commission. In May 2013, the regulatory framework applicable to the registry was revised to finalise the functionalities needed for phase 3. The new Regulation also provides for the accounting in the registry of transactions under the Effort Sharing Decision.
The Commission is currently finalising the assessment of the National Implementation Measures (NIMs) to Commission Decision 2011/278/EU. The Commission is assessing whether the preliminary free allocation of allowances to industrial installations in each Member State has been done in compliance with the harmonised allocation rules for phase 3 of EU ETS.
A review of the Auctioning Regulation is on-going as regards the auction time profile. In this context the proposal for a Decision to clarify the provisions of the EU ETS Directive regarding the Commission’s powers to adapt the timing of auctions of emission allowances in exceptional circumstances is currently undergoing co-decision. Furthermore, the Commission has also adopted a report on the state of the European carbon market, which sets out a range of possible structural measures that can be taken to tackle the imbalances.
The European Commission authorised, under strict application of the Directive, requests from 8 Member States to grant transitional free allocations of allowances to their power sectors beyond 2012.
In June the Commission has prepared a draft Regulation specifying the maximum limits up to which operators under the EU ETS may use eligible credits from the Kyoto Protocol’s project based mechanisms (i.e. CDM and JI) for compliance with emission limits from 2013 to 2020.
EN 18 EN
Work on facilitating implementation of the two new Regulations on monitoring and reporting of GHG emissions by operators and aircraft operators covered by the EU ETS and on the verification of emission reports and the accreditation and supervision of verifiers is ongoing and aims for improved harmonisation of the applied rules. A complete suite of guidance documents, templates and FAQs is being developed to support Member States' implementation of the third ETS period.
In a major step towards the first full inter-continental linking of emission trading systems, the Commission and Australia agreed in 2012 on a pathway for linking the EU ETS and the Australian emissions trading scheme. In May the Commission received a mandate from the Council to negotiate, on behalf of the EU, a treaty by mid-2015 for the full link, which is supposed to happen no later than 1 July 2018. Based on a mandate from the Council, the Commission is also negotiating with Switzerland on linking the EU ETS with the Swiss ETS.
5.1.2. Other policies and measures
Member States' annual emission allocations in CO2-equivalents under the Effort Sharing Decision for each year in 2013 to 2020 were determined in 2012 and adopted in March 2013.
A new EU Monitoring Mechanism Regulation was adopted, revising and replacing the previous Monitoring Mechanism Decision, and a new Decision was adopted for accounting of land use, land-use change and forestry.
The Commission adopted a Communication setting out a strategy for progressively including GHG from maritime transport in the EU's policy for reducing its overall GHG emissions. As a first step in implementing this strategy, the Commission proposed a Regulation which would establish an EU-wide system for the monitoring, reporting and verification of CO2 emissions from large ships starting in 2018. The draft Regulation is under consideration of the Parliament and the Council.
The Energy Efficiency Directive was adopted in October 2012. This directive will contribute to achieving Europe's 20% energy efficiency target for 2020.
On 24 January 2013, the European Commission adopted the "Clean Power for Transport Package", aimed at gradually reducing oil dependence through the use of alternative fuels in transport. The package includes the proposal for a Directive establishing binding targets for alternative fuel distribution infrastructures such as electricity, hydrogen and fuel cells.
The NER 300 funding programme is a mechanism for the financing of commercial demonstration CCS and RES projects, covering 300 million allowances from the new entrants reserve of the EU ETS. Under this programme, the Commission adopted funding awards in December 2012 for a total value of € 1.2 billion to 23 renewable energy projects. This amount is estimated to have leveraged additional funding of over € 2 billion from private sources. A second call for CCS and RES project proposals was launched in April 2013. Awards in mid-2014 will be funded from the sale of the remaining 100 million allowances and unused funds from the first call.
Implementation of Regulation (EC) 443/2009 related to CO2 from cars and Regulation (EU) 510/2011 related to CO2 from light commercial vehicles is almost completed. The Commission approved already two eco-innovations to help reduce CO2 emissions from passenger cars.
EN 19 EN
It also made proposals on modalities for reaching the 2020 target to reduce CO2 emissions from new passenger cars and from new light commercial vehicles (vans) which are currently under consideration in the Council and the Parliament.
In November 2012 the Commission proposed to the Council and the Parliament a new Regulation on fluorinated greenhouse gases in order to reduce emissions from this sector further.
In order to mitigate against the indirect land use change greenhouse gas emissions impacts from biofuel production, the Commission also proposed a number of amendments to the Renewable Energy and Fuel Quality Directives.
On the mainstreaming of climate action into EU policies, a political agreement on the next Multiannual Financial Framework (MFF) 2014-2020 has been reached. All Institutions have agreed that at least 20% of the overall budget should be climate related.
The Commission adopted in March a consultative Communication that launched a public debate on how best to design a new international agreement for 2015, which will lay down the international regime for fighting climate change post 2020.
In March 2013 the Commission took the first step towards developing a 2030 framework for EU climate change and energy policies adopting the Green Paper "A 2030 framework for climate and energy policies". This document launched a public debate on an EU energy and climate change strategy for 2030.
A list of legal acts recently adopted is available in section 3 of the SWD.
5.2. Adaptation to climate change
On 16 April 2013, the Commission adopted the EU Strategy on Adaptation to Climate Change aiming at contributing to a more climate resilient Europe. The strategy will enhance the preparedness and capacity to respond to the impacts of climate change at local, regional, national and EU levels, and it will develop a coherent approach and improved coordination. It focuses on three objectives:
• Promoting action by Member States: The Commission will encourage all Member States to adopt comprehensive adaptation strategies (currently 15 have strategies) and will provide funding to help them implementing their adaptation policies. It will also support adaptation in cities by launching a voluntary commitment based on the Covenant of Mayors initiative.
• 'Climate-proofing' action at EU level by further promoting adaptation in key vulnerable sectors such as agriculture, fisheries and cohesion policy, ensuring that Europe's infrastructure is made more resilient, and promoting the use of insurance against natural and man-made disasters.
• Better informed decision-making by addressing gaps in knowledge about adaptation, also in link with Horizon 2020, and further developing the European climate adaptation platform (Climate-ADAPT) as the 'one-stop shop' for adaptation information in Europe.
EN 20 EN
EU-Cities Adapt, an EU initiative providing capacity building and assistance for cities in developing and implementing adaptation strategies, was successfully completed in 2013.
5.3. Climate Finance
The EU has been the largest contributor to both mitigation-related and adaptation-related ODA in 2010 and 2011, with a share of around 50% according to OECD DAC reporting. As part of the fast-start finance commitment by developed countries of USD$30 billion, the EU and its Member States committed to providing EUR 7.2 billion over the period 2010-2012. The EU and its Member States fulfilled their commitment by allocating EUR 7.34 billion to fast-start finance over that period, as reported in the submission to the UNFCCC by the EU and its Member States in May 2013. The funds committed in 2012 are € 2.67 billion. More information can be found in the report European Union fast start funding for developing countries11.
Furthermore, pursuant to Article 16 of the MMR, as of 2013 Member States shall report annually by 30 September on financial and technology support provided to developing countries.
5.4. Climate research & innovation
Climate research is one of the main research themes of the EU's Seventh Framework Programme (FP7, 2007-2013) and will be central to Horizon 202012, the new EU programme for research and innovation 2014-2020.
Climate change research in FP7 aims to support projects that analyse the pressures on the environment (oceans, atmosphere, and ecosystems) and improves our understanding of the complex climate system, also through Earth System modelling. Another key research area is assessing impacts, vulnerabilities and solutions for adapting to climate change, developing strategies for disaster risk reduction and to stimulate a transition to a low-carbon society. A preliminary estimation indicates that in FP7, from 2007 to 2013, about 900 Million euro have been spent to support climate-related research.
As for the future programme, it is worth mentioning that 35% of the Horizon 2020 budget of around 70 billion euro is expected to be invested in climate-related research and innovation actions.
6. SITUATION IN THE UNION'S CANDIDATE AND POTENTIAL CANDIDATE COUNTRIES
Iceland's GHG emissions between 1990 and 2011 increased by 26% and in 2011 were 4.4% lower than in 2010. Taking into account decision 14/CP.7, and according to the GHG projections included in the 5th National Communication, Iceland is on track to meet its Kyoto target.
Turkey’s GHG emissions (excluding LULUCF) increased by 124 % between 1990 and 2010 and 5% between 2010 and 2011. While Turkey is an Annex I Party, it has no GHG target under the 1st or the 2nd commitment period of the Kyoto Protocol.
11 http://ec.europa.eu/clima/policies/finance/international/faststart/docs/fast_start_2012_en.pdf 12 http://ec.europa.eu/research/horizon2020/index_en.cfm
EN 21 EN
An up-to-date inventory of GHG emissions in the former Yugoslav Republic of Macedonia (FYROM) is not available. FYROM is a non-Annex I Party. Between 1990 and 2005 total GHG emissions decreased by around 19%.
Similarly, Montenegro which is also a non-Annex I Party to the Convention saw its total GHG emissions (excluding LULUCF) increased by around 4.9 % between 1990 and 2003.
No recent information is available for Serbia.