report from the commission to the european … · en en european commission brussels, 19.6.2017...
TRANSCRIPT
EN EN
EUROPEAN COMMISSION
Brussels, 19.6.2017
COM(2017) 327 final
REPORT FROM THE COMMISSION TO THE EUROPEAN PARLIAMENT, THE
COUNCIL, THE EUROPEAN ECONOMIC AND SOCIAL COMMITTEE AND THE
COMMITTEE OF THE REGIONS
Progress report on implementation of the TEN-T network in 2014-2015

2
Progress report on the implementation of the TEN-T Network in 2014 and 2015
(Text with EEA relevance)
1. INTRODUCTION
1.1. Main results
Based on the TENtec Information System, the current state of implementation of TEN-T
transport infrastructure in terms of compliance with the TEN-T Regulation requirements
reaches between 75% and 100% for half of the currently available indicators, whereas for the
other half it is still below 75%.
For the railway infrastructure network, compliance is already reached to a good extent in
terms of electrification, track gauge and line speed whereas ERTMS, axle load and train
length are still far from being compliant. As for roads, the compliance with the criteria of
express road/motorway is also still below 75%. The inland waterways are almost fully
compliant with respect to the CEMT requirement for class IV and to a good extent also with
respect to RIS implementation, whereas compliance with the criteria of permissible draught is
still below 75%. 100% of the seaports are connected to rail, but the connection of ports to the
inland waterways of CEMT class IV is far from being compliant. Finally, the connection of
airports to rail is still below 75% of compliance.
Next to the state of the technical implementation of the TEN-T, the present report also
analyses the efforts of financial investments made on the TEN-T. In the course of 2014 and
2015 the total investment made by the EU institutions from their financial sources (i.e. TEN-
T/CEF, ERDF/CF and EIB loans) in TEN-T core and comprehensive network infrastructure
amounted to EUR 30.67 billion in all 28 Member States.
With regard to modal shares, the highest investment volume with respect to EU grants
altogether (TEN-T/CEF and ERDF+CF equalling to EUR 16.98 billion) is reported for rail
which absorbed as much as 51.5% of total EU expenditures in the TEN-T network in 2014
and 2015. The share of road infrastructure investment reached 30.6% of total expenditure,
followed by 9.2% for ports and Motorways of the Sea, 5.5% for airports (including SESAR),
2.1% for multimodal infrastructure and 1.1% for inland waterways.
1.2. Policy context
Transport is a cornerstone of the European integration process and enables connectivity,
convergence and cohesion across the Union. A smart, sustainable and fully interconnected
transport network is a key condition for the completion and good functioning of the European
single market and for linking Europe with the world's markets. It thus contributes to the
European economic growth, jobs and competitiveness agenda.
Infrastructure investments are of vital importance for GDP growth. According to the
International Monetary Fund (IMF) a 1 percent increase in spending on infrastructure
raises the level of output by about 0.4 percent in the same year and by 1.5 percent four

3
years after the increase1. If countries plan and execute infrastructure well, the return is
even greater: 2.6 percentage points over four years.
Transport investment gaps: while transport infrastructure needs are estimated at about
EUR 1.3 trillion per year at the global level2 and around EUR 130 billion per year at
the European level, the average investment levels in the EU are well below EUR 100
billion since the beginning of the crisis3.
The 2011 White Paper estimated that investments of EUR 1.5 trillion in European
transport are necessary for the period 2010-2030 in order to cope with the expected
increase in demand. The Commission estimates that the investment needs for the
completion of the core network corridors alone in the period 2014-2030 amount to
more than EUR 700 billion4 for approximately 2500 transport infrastructure projects
either within Member States' territories or across the borders of several Member States
(cross-border projects)5. As much as EUR 500 billion will need to be invested over
the entirety of the TEN-T network already by 2020 of which an estimated EUR 250
billion in the core network infrastructure of TEN-T.
Transport infrastructure enables value added services which all together generate more
jobs and economic activity. If transport stops, the whole economy stops. At the recent
G7 meeting of transport ministers in Japan, a clear message was given: with the
current investment gap we will not be able to solve the challenge of meeting high
mobility needs over the next 30 years6.
Transport is an enabler of competitiveness and EU global leadership. The limited
investments are reflected in a declining trend of EU transport infrastructure
competitiveness, according to the latest rankings from the World Economic Forum
Global competitiveness report.
At the end of 2013, a major milestone in the European transport policy was reached. Upon a
proposal of the European Commission, the Council and the European Parliament agreed upon
a new framework for the development of the backbone of EU transport infrastructure, by
laying down guidelines for the development of the trans-European transport network
(Regulation (EU) No 1315/2013, hereafter TEN-T Regulation7). Furthermore, access to EU
support from Cohesion Fund (CF) and European Regional Development Fund (ERDF) for
investments on the TEN-T was linked to the existence of comprehensive transport plans at
regional and/or national level.
1 IMF World Economic Outlook, October 2014. 2
White Paper on Transport (2011). Roadmap to a Single European Transport Area – Towards a competitive and
resource efficient transport system. COM(2011)144 final. 3 ITF (2015), ITF Transport Outlook 2015, OECD Publishing, Paris. 4 The Commission is collecting data on investment needs identified by the Member States, local and regional
authorities and infrastructure managers in the context of Core Network Corridor work plans. 5 Core network corridor studies 2016. https://ec.europa.eu/transport/themes/infrastructure/ten-t-
guidelines/corridors/corridor-studies_en 6 G7 Transport Ministers Declaration. Nagano. September 2016. 7 Regulation (EU) No 1315/2013 of the European Parliament and of the Council of 11 December 2013 on Union
guidelines for the development of the trans-European transport network and repealing Decision No
661/2010/EU, OJ L 348, 20.12.2013
4
With this, the 'blueprint' for a new transport infrastructure network which incorporates all
transport modes – railways, inland waterways, roads, ports, airports and other transport
systems – as well as equipment for innovative alternative fuels and intelligent transport
solutions has been reinforced considerably in the last years.
The TEN-T guidelines place strong emphasis on Europe’s major global gateways for
maritime and air transport – to ensure that Europe’s trade flows are not restricted (in terms of
capacity, technology or administrative procedures).
The TEN-T policy establishes a comprehensive and a core network to promote better
accessibility of all regions to European and global markets on the one hand, and to provide for
a strong focus on infrastructure of strategic importance on the other. Both the core and the
comprehensive networks focus on modal integration, interoperability and on the coordinated
development of infrastructure, in particular in cross-border sections to bridge missing links
and remove bottlenecks. The TEN-T policy also paves the way for the future of the transport
system, notably through facilities that stimulate low-emission solutions, new-generation
service concepts and other fields of technological innovation.
The TEN-T Regulation sets clear deadlines for the completion of the core network (by 2030)
and the comprehensive network (by 2050).
Considerable financial support from the EU is available in the 2014-2020 period in particular
for investment projects in the less-developed regions and Member States of the Union and for
investment projects of common interest and EU added value.
The Connecting Europe Facility (CEF) with a budget of EUR 24.05 billion, including
EUR 11.3 billion ring-fenced for the Member States eligible for support from the
Cohesion Fund, has been set up to support projects on the TEN-T core network or
linked to horizontal priorities, such as the deployment of ERTMS.
In addition, around EUR 70 billion in EU co-funding from the Cohesion Fund (CF)
and the European Regional Development Fund (ERDF) have been programmed. This
includes EUR 34 billion for TEN-T infrastructure and EUR 36 billion for transport
investment projects which connect to or complement the TEN-T projects.
An amount of EUR 6.3 billion from Horizon 2020 is allocated to finance research and
innovation projects in transport sectors.
Lastly, the European Fund for Strategic Investment (EFSI) support together with
traditional EIB lending are available to bridge the investment gap in transport. EFSI
support can be combined with EU grants from the Connecting Europe Facility (CEF),
Horizon 2020 as well as from the European Structural and Investment Funds (ESIF).
In order to report to European citizens and policy-makers on the effectiveness of the TEN-T
policy, intermediate results need to be measured and reported to ensure that the TEN-T is
completed according to the agreed deadlines. To this end, Article 49.3 of the TEN-T
Regulation requires the Commission to publish, every two years, a progress report on the
implementation of the trans-European transport network and present it to the European
Parliament, the Council, the European Economic and Social Committee and the Committee of
the Regions.
5
The present progress report is the first in a series of biennial reports submitted by the
Commission to the other EU institutions, as foreseen by Regulation No 1315/2013. The
present report is the starting point for a process of regular and comprehensive reporting at the
highest level on the technical and financial status of the core and comprehensive trans-
European transport network. Such reporting will create transparency, foster coordination
between all parties involved, help to plan and prioritise investments and facilitate the
mobilisation of the necessary resources, both financial and technical, to complete the TEN-T8.
2. SCOPE AND METHODOLOGY
Article 49.3 of the TEN-T Regulation defines the scope of the Commission's reporting
obligation. The Commission should analyse the development of the trans-European transport
network on the basis of information on the progress of project implementation transmitted by
the Member States, in particular through the interactive geographical and technical system for
trans-European transport network (TENtec). In addition, the Commission is required to make
available information on the use of various forms of financial assistance for all transport
modes as well as other elements of the core and comprehensive network in each Member
State. The report should also outline the Commission's coordination of all forms of financial
assistance with a view to supporting a coherent application of the TEN-T Regulation in line
with its objectives and priorities.
This report presents an estimate of co-financing from the EU budget for investments made on
the TEN-T network infrastructure and the corresponding realisation of the network made
during the period 2014 - 20159. The progress in the use of financial assistance in the reporting
period is measured with reference to financial sources listed in TEN-T and CEF Regulations10
as well as other sources of financing available for the trans-European network, namely the
budget available under the TEN-T Programme for the period 2007-2013, the European
Structural and Investment Funds and the support provided by the European Investment
Bank11
.
As for the Member States' national budgets, the individual reports provided by Member States
for the reporting years 2014 and 2015 were unfortunately not of sufficient quality in terms of
comparability of results and accuracy of data. For this reason, the present report does not
include the national budgets invested on TEN-T yet. However, this report identified the
reporting challenges with regard to the national budgets. On this basis, conclusions were
drawn for future reporting (see chapter 5 on the reporting strategy).
A clear scope and criteria for reported projects was defined to focus the reporting only on
investments which effectively contributed to the implementation of the TEN-T network.
Therefore, the scope of this progress report covers exclusively works and/or mixed (works
8 With regard to CEF funding, the European Parliament and Member States are continuously informed about the
implementation progress, in particular in the context of CEF Calls for proposals. 9 The report covers the projects which were running or completed in 2014 and 2015 regardless of their start date. 10 The forms of financial assistance to be reported, other than the ones provided under TEN-T Guidelines (CEF),
are defined in Art. 49.1 and include the Cohesion Fund, the European Regional Development Fund, Horizon
2020 and loans and financing instruments established by the European Investment Bank. 11 The inclusion of TEN-T Programme budget in calculation was necessary as a number of projects with
financial assistance granted under 2007-13 financing period were still ongoing in the years 2014-2015.

6
and studies) projects12
, leading to the development of new infrastructure or the
upgrade/rehabilitation of the existing ones. Given the above criteria, the financing assistance
from Horizon 2020, where funding is generally available for research activities only, is not
taken into consideration, but only mentioned in an aggregated manner under chapter 4.2.
The report draws on one side on the study performed by external experts13
, commissioned by
the Commission to facilitate the production of a first progress report on the development and
implementation of the trans-European network. As the work on the development of the
TENtec database and the Core Network Corridor studies (CNC studies) was still on-going at
the time of this report, the study was necessary to address the remaining information gaps and
data quality issues. On the other side, the data already available in the TENtec information
system14
was used to the extent possible for the analysis of the technical realisation of the
TEN-T. This TENtec data is mainly based on two currently ongoing data collection studies
(Lot 1 on Railways, Roads and Airports and Lot 2 on Ports and Inland Waterways). However,
it has to be underlined that the data collected and encoded in the TENtec database via these
two studies is expected to be validated by Member States by the end of 2017.
The present study identifies the financial and technical data sources necessary to assess the
level of implementation of the TEN-T network by the end of 2015. With regard to financial
aspects, the data has been collected from the Innovation and Networks Executive Agency
(INEA), the Directorate-General for Regional and Urban Policy (DG REGIO) and the
European Investment Bank (EIB).
The analysis of the implementation of TEN-T technical parameters was performed through
the comparison of information and data stored in the TENtec information system with a set of
key performance indicators (KPIs) defined on the basis of transport infrastructure
requirements foreseen in the TEN-T Regulation. This allowed for the assessment of the
current level of TEN-T implementation in terms of compliance with the TEN-T standards per
type of network and transport mode.
Finally, in order to assess the state of realisation of the TEN-T network by the end of 2015,
the level of reported investment per transport mode was compared with the current level of
technical implementation as shown by the KPIs selected to assess the transport infrastructure
network.
This first report should be considered as a work in progress and a starting point for the
formulation of a sound, reliable and transparent TEN-T reporting system for the future, with
enhanced measurement of the impact of financed investments.
The reported results should be seen as indicative as mapping and defining the progress of
TEN-T implementation constitutes an ongoing challenge for national regulatory bodies and
for the Commission. There is currently no common reporting system and process in place
12 Studies are therefore not covered by the scope of this report as they do not directly result in a progress in the
implementation of the TEN-T network. 13 Article 49.3 Study: Review of existing sources of information/data and support for the preparation of the
progress report on the implementation of the TEN-T network, Panteia, delivered in 2016. 14 The European Commission's information system TENtec stores technical, geographical and financial data for
the analysis, management and political decision-making related to TEN-T and the underlying funding
programme (CEF).
7
which would allow the Commission to obtain complete and harmonised data sets on TEN-T
projects from various sources at EU and national level.
The use of different methodologies, calculation methods, payment schemes and data formats
by EU bodies and Member States entails the risk of omission or double-counting of reported
projects and seriously limits the comparability of data. The differences in reporting systems
(e.g. direct vs. shared management of funds) result in significant information gaps and further
undermine the robustness of reported data15
. Lastly, the TENtec information system, while
being the most suitable source of technical and geographical data on TEN-T, is currently in
the process of increasing its data input rate and data quality. These factors may negatively
affect the reliability of the data analysis process for this first report.
In this context, it is important to explore possible improvements in the implementation of Art.
49.1 of the TEN-T Regulation, which sets out that Member States are to provide to the
Commission on a regular, comprehensive and transparent basis information on the progress
made in implementing projects, including annual data for all projects benefitting from EU
funding16
.
3. STATUS OF TEN-T IMPLEMENTATION: TECHNICAL PROGRESS
The TEN-T Regulation establishes the comprehensive and core networks based on a
methodology relying on objective criteria and quantitative thresholds which was used by the
European Commission, the European Parliament and the Council in the legislative
procedure17
. The core and comprehensive networks are associated with defined technical
requirements and priority targets.
The progress made with regard to the realisation of the TEN-T needs to be benchmarked with
these technical standards with the help of key performance indicators. The regular update of
the definition of the TEN-T network and the monitoring of the quantitative thresholds to be
fulfilled also form an integral part of the progress reporting.
3.1. Key Performance Indicators in the TENtec information system
In the course of 2014-2016 the Core Network Corridor studies identified a set of key
performance indicators (KPIs) in line with these technical requirements and common to all
the nine core network corridors. The target values for each KPI have been defined on the
basis of the requirements set out in the TEN-T Regulation, with particular reference to Article
39. The primary objective of KPIs is to measure the evolution of the TEN-T corridors over
time and monitor their compliance levels with infrastructure quality standards set out in the
TEN-T Regulation. The table in Annex I presents the list of key performance indicators and
the calculation method, used to measure the technical progress achieved on the TEN-T
network. It also includes the different values of 2015 that are known at the time of this report.
15 With regard to the European Regional Development Fund and the Cohesion Fund precise information on
portion of expenditures related to TEN-T in the reporting period was still unavailable at the EU level at the time
of drafting this report and had to be estimated. 16 In this context, it is worth recalling that the European Regional Development Fund and the Cohesion Fund are
implemented through shared management between the Commission and Member States. 17 The planning methodology for the trans-European transport network (TEN-T), Commission staff working
document, COM(2013) 940 final.

8
To date, TENtec links geographical information and technical parameter data of the TEN-T
infrastructure and enables the user to easily compile information and create timely reports and
maps, covering the TEN-T core and comprehensive networks18
. These databases incorporate
the data collected from the Member States and provide the Commission with the means of
identifying critical issues, transport “bottlenecks” and issues related to interoperability across
borders.
However, at the time of this report a significant part of data for different sections and modes
is still missing in TENtec, suffering from data quality issues (e.g. inconsistencies) or is still
pending validation from Member States after the data was encoded following external studies.
In addition, the quality of information varies significantly between parameters. For instance,
the data input rate is at 100% only for one road indicator and one airport indicator. With
regard to rail, the data input rate is relatively high for some basic parameters (e.g.
electrification, track gauge, axle load), but remains low for some others (e.g. ERTMS
implementation). Indeed, as regards ERTMS deployment, the data in TENtec is currently only
available for core network corridor sections. For IWW, the parameters for which the data is
currently available allow only for the calculation of some indicators (e.g. at present no data is
available for KPIs such as permissible height under bridges). Finally, the availability and
quality of information for ports and freight terminals remains relatively poor at the moment,
so the reported results should be treated as indicative only.
In order to increase the data quality and input rate in TENtec, dedicated data collection studies
have been launched in 2015 and 2016 and will provide results in 2017 and 2018. In addition,
studies on Motorways of the Sea and ERTMS deployment have data collection elements
which together lead to a comprehensive coverage across transport modes.
Once TENtec has an increased data input rate, the calculation of the entire set of performance
indicators will enable the measuring of progress for the technical implementation of TEN-T in
a comprehensive and reliable manner.
This progress report presents only the part of KPIs which could be calculated based on the
currently available data in TENtec. In addition, it needs to be underlined that the full data sets
encoded at present by the various TENtec studies have been taken into account, regardless
whether the data has been validated by Member States or not yet. This means that the missing
data for some sections and infrastructure components and/or unvalidated data may have an
impact on the robustness of the final data result.
18 Eight categories of data are available in TENtec at the moment: Airports; Bridges; Dams Locks; Inland
Waterways; Ports; Rail; Road; and Rail-Road Terminals. There are currently more than 300 technical parameters
available for all these categories together.

9
3.2. Technical implementation of TEN-T network by KPI
Based on the present TENtec Information System, the current state of implementation of
TEN-T transport infrastructure in terms of compliance with the TEN-T Regulation
requirements reaches between 75% and 100% for half of the currently available indicators,
whereas for the other half it is still below 75%.
Railways
With regard to rail, the currently available data indicates that the standard track gauge of 1435
mm is present on 77% of the rail core network and 76% of the comprehensive rail network.
As for electrification, around 81% of the TEN-T network (81.3% for core, 80.6% for
comprehensive) is compliant with the TEN-T requirement. The ERTMS is in operation only
on 9.5% of core network corridors sections as of end 2015 (the information for the other
sections is not available yet) suggesting the clear need for more investment. In line with the
recently adopted European Deployment Plan (EDP) for ERTMS, more progress seems to be
made on average on the core network than on the comprehensive network, which can be
perceived as a good sign of the effective prioritisation of investments. Indeed, the new EDP
sets targets until 2023 by which about 30-40% of the Core Network Corridors shall be
equipped. In 2023, the ERTMS European Deployment Plan will be updated again setting out
the precise implementation dates for the remaining part of the Corridors between 2024 and
2030.
Roads
For roads, the main indicator calculated is the total number of kilometres compliant with
motorways/expressways road types. The results show that 74.5% of the core network is
currently compliant with the standard, whereas only 58.1% of roads on comprehensive
network fulfil the requirement. No information on the availability of clean fuels is currently
available in TENtec as the data availability is limited and a common approach across Member
States and providers is lacking. In the framework of the Alternative Fuels Directive
2014/94/EU, the Commission is however currently analysing the national policy frameworks
for the market development of alternative fuels and their infrastructure. In addition, the
Commission financed a study on "clean power for transport infrastructure deployment" which
results have recently been presented. More detailed information is expected to be presented in
the second progress report.
Ports and Inland Waterways
Concerning inland waterways, the core network is already 95% compliant with regard to the
CEMT requirements for class IV, 79.6% compliant with regard to RIS implementation and
68% in terms of permissible draught of 2.5 m.
As regards seaports, the connection to rail indicator shows full compliance with TEN-T
requirements. However, this indicator will be refined to also encompass the need for
improvements to increase the capacity for freight transport. The rate of connection to CEMT
Class IV inland waterways is 46% for the core and 9% for the comprehensive network.
However, the data for IWW and ports should be treated with caution as the information in the
TENtec database is either not validated yet by the Member States or not at all available. In the
latter, the figures for these KPIs have thus been based on the Article 49.3 study results.

10
Airports
As far as airports are concerned, Regulation (EU) 1315/2013 defines that only the core
airports that are marked with a star in Annex 2 of the Regulation (i.e. 38) are falling under the
obligation of Article 41(3), i.e. to be connected with the railway and road transport
infrastructure of the trans-European transport network by 2050 (except where physical
constraints prevent such connection) and to be integrated into the high-speed rail network
wherever possible, taking into account potential traffic. In 2015, 23 core airports out of the 38
core airports (60.5%) that fall under this obligation are already connected to rail. This data is
based on very reliable data with a data input rate of 100% reached for this indicator.
3.3. Technical update of the definition of the TEN-T network
The European Commission ensures close monitoring of the technical parameters of the
infrastructure components of the TEN-T network. Article 49.4 of the TEN-T Regulation
indeed provides for the possibility to adopt delegated acts to adapt Annexes I and II to take
account of possible changes resulting from the quantitative thresholds establishing the
infrastructure components of the comprehensive network.
The Commission launched the updating process at the TEN-T Committee meeting held on 30
September 2015 and consulted experts of Member States' competent authorities, in the
presence of experts of the European Parliament, in a meeting on 9 December 2015, on 16
March and on 28 September 2016. This led to the adoption of a delegated act on 7 December
2016 which is expected to enter into force after the two months' scrutiny period of the
European Parliament and the Council.
The adaptations of the list and the maps for the purposes of this delegated act were based on
quantitative thresholds laid down in Articles 14, 20, 24 and 27 of the TEN-T regulation. They
relied on the latest relevant available Eurostat statistics and information provided by Member
States and other relevant sources concerning the progress made in completing the network.
This exercise led to 250 change requests which have been presented and 235 have been
approved and integrated in line with the provisions of Article 49, paragraph 4, of the
regulation.
The adaptations resulted in the inclusion of nodes pursuant to point (a) of Article 49(4), such
as inland ports, maritime ports, rail-road terminals, logistic platforms and airports. They also
led to the adjustments of the rail, road and inland waterway network, based on information
provided by the Member States concerned, so as to reflect the progress made in completing
the network pursuant to point (c) of Article 49(4). However, the adaptations did not include
exclusions according to point (b) of Article 49(4) since this assessment would only have been
relevant if carried out six years after the adoption of the regulation. Indeed, the application of
the exclusion thresholds would have shown cases where certain infrastructure components
would have been below both the initially applied threshold and the new inclusion threshold.
Therefore, these elements were at this stage not taken into account for the updating exercise.
11
4. STATUS OF TEN-T IMPLEMENTATION: PROGRESS IN INVESTMENTS SUPPORTED BY EU
CO- FINANCING
4.1. Use of financial assistance in 2014 and 2015
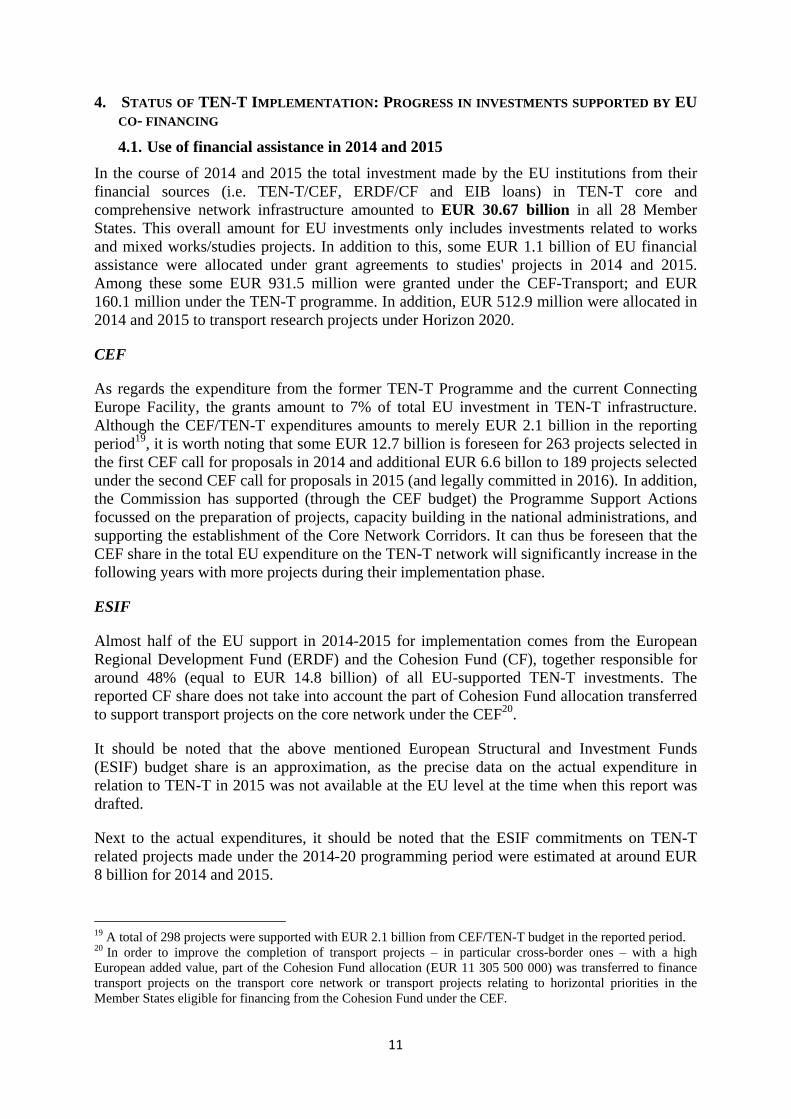
In the course of 2014 and 2015 the total investment made by the EU institutions from their
financial sources (i.e. TEN-T/CEF, ERDF/CF and EIB loans) in TEN-T core and
comprehensive network infrastructure amounted to EUR 30.67 billion in all 28 Member
States. This overall amount for EU investments only includes investments related to works
and mixed works/studies projects. In addition to this, some EUR 1.1 billion of EU financial
assistance were allocated under grant agreements to studies' projects in 2014 and 2015.
Among these some EUR 931.5 million were granted under the CEF-Transport; and EUR
160.1 million under the TEN-T programme. In addition, EUR 512.9 million were allocated in
2014 and 2015 to transport research projects under Horizon 2020.
CEF
As regards the expenditure from the former TEN-T Programme and the current Connecting
Europe Facility, the grants amount to 7% of total EU investment in TEN-T infrastructure.
Although the CEF/TEN-T expenditures amounts to merely EUR 2.1 billion in the reporting
period19
, it is worth noting that some EUR 12.7 billion is foreseen for 263 projects selected in
the first CEF call for proposals in 2014 and additional EUR 6.6 billon to 189 projects selected
under the second CEF call for proposals in 2015 (and legally committed in 2016). In addition,
the Commission has supported (through the CEF budget) the Programme Support Actions
focussed on the preparation of projects, capacity building in the national administrations, and
supporting the establishment of the Core Network Corridors. It can thus be foreseen that the
CEF share in the total EU expenditure on the TEN-T network will significantly increase in the
following years with more projects during their implementation phase.
ESIF
Almost half of the EU support in 2014-2015 for implementation comes from the European
Regional Development Fund (ERDF) and the Cohesion Fund (CF), together responsible for
around 48% (equal to EUR 14.8 billion) of all EU-supported TEN-T investments. The
reported CF share does not take into account the part of Cohesion Fund allocation transferred
to support transport projects on the core network under the CEF20
.
It should be noted that the above mentioned European Structural and Investment Funds
(ESIF) budget share is an approximation, as the precise data on the actual expenditure in
relation to TEN-T in 2015 was not available at the EU level at the time when this report was
drafted.
Next to the actual expenditures, it should be noted that the ESIF commitments on TEN-T
related projects made under the 2014-20 programming period were estimated at around EUR
8 billion for 2014 and 2015.
19 A total of 298 projects were supported with EUR 2.1 billion from CEF/TEN-T budget in the reported period. 20 In order to improve the completion of transport projects – in particular cross-border ones – with a high
European added value, part of the Cohesion Fund allocation (EUR 11 305 500 000) was transferred to finance
transport projects on the transport core network or transport projects relating to horizontal priorities in the
Member States eligible for financing from the Cohesion Fund under the CEF.

12
EIB and EFSI
The reported volume of EIB loans signed in 2014 and 2015 equals EUR 13.7 billion which
supported 69 transport operations on the TEN-T network in the reported period.
The European Fund for Strategic Investment (EFSI) was launched in November 2014. The
period 2014-2015 was mainly devoted to establishing the new instruments and the various
initiatives and measures foreseen under the three pillars of the Investment Plan for Europe.
National resources mobilised
It should be noted that the EU co-funding of transport infrastructure projects in the range of
20% and 85% requires the existence of additional funds, often provided from Members States'
national funding. Therefore, in order to benefit from EU funds, the Member States allocate
considerable national budgetary resources to the projects supporting EU priorities. In 2014
and 2015, the EUR 2.1 billion invested from CEF/TEN-T budget were co-financed with more
than EUR 6 billion of investments from other sources, primarily Member States' national
budgets.
4.2. Reinforcing the strategic framework for transport investments
At the end of 2013, a new blueprint for the development of the back bone of the EU transport
system was agreed when the revised guidelines for the TEN-T network were adopted by the
European Parliament and the Council. A commitment was made for transport infrastructure
development that will take decades to implement on the ground, require an estimated EUR 1.5
trillion in investment, and involve a large number of private and public stakeholders. An
endeavour of this magnitude, complexity, and cost requires a solid foundation for policy and
investment decisions.
Considerable effort was made in 2014 and 2015 to reinforce the strategic framework for
transport projects beyond the provisions of the TEN-T Regulation and thereby to enhance
planning security for investors.
Based on the proposal made by the European Coordinators, the Member States agreed on
detailed work plans for the nine TEN-T core network corridors. A European Deployment Plan
for ERTMS was adopted in December 2016 and a Detailed Implementation Plan for the
Motorways of the Sea was put forward by the European Coordinator21
.
A considerable part of the CEF budget has been earmarked for transport infrastructure
projects on TEN-T, providing in particular financial support to the core network and
horizontal projects and activities identified in Part I of the Annex to the CEF Regulation. In
order to concentrate efforts in that regard, priority is given to projects of common interest as
defined in the TEN-T Regulation.
Similarly, Cohesion Fund and ERDF support is provided for TEN-T and other transport
infrastructure that has been identified as a priority for the development of the TEN-T and/or
the Member State and region concerned.
21 http://ec.europa.eu/transport/node/4876

13
Considerable effort was made in 2014 and 2015 to finalise the programming for the 2014-
2020 period: Cohesion Fund and ERDF will continue to provide tangible support for the
development of the TEN-T network (around EUR 34 billion) in the coming years, in
particular in the less developed Member States and regions where considerable effort is still
needed to close missing links and remove bottlenecks in the transport networks. Additionally,
the ESI Funds will support national, regional and local transport infrastructure projects which
are not located on the TEN-T network, as well as the procurement of rolling stock.
This is crucial for building a seamless door-to-door transport system which caters to the needs
of long-distance and cross-border transport, as well as local mobility. In all Member States,
cohesion policy will support a transition towards a multimodal, intelligent and more
sustainable transport system.
Furthermore, as required by the ex-ante conditionality for receiving financial support from CF
and ERDF under Thematic Objective 7 (sustainable transport), comprehensive national and
regional transport plans, were developed in 20 Member States, including mature project
pipelines and measures to strengthen the capacity of administrations and beneficiaries.
The development of these comprehensive transport plans was an important step forward: they
set out in detail how the development of the TEN-T will be taken forward in 20 Member
States and numerous regions of the Union (where CF/ERDF provide co-funding).
Furthermore, they provide a basis for a balanced and complementary development of non-
TEN-T infrastructure at national, regional, and local level. This is an important step in
ensuring that the development of the TEN-T is not done in isolation but as part of an
overarching effort to develop a seamless door-to-door system which provides for long-
distance and cross-border transport, as well as for local mobility.
In this context it is also noteworthy that the Commission had presented in 2013 a new concept
for the development of Sustainable Urban Mobility Plans. In the programming period 2014-
2020, many EU urban areas will benefit from Cohesion Fund and ERDF support in the
development and implementation of such plans. Around EUR 12.5 billion have been
programmed in support for clean urban transport infrastructure and promotion, plus around
EUR 3.5 billion for intelligent transport systems and soft mobility. These investments will
help increase the performance of the urban nodes, reduce congestion and remove bottlenecks
on the TEN-T, and improve last-mile connectivity.
4.3. Mobilising private capital for TEN-T implementation
Despite the high EU financial contributions to transport infrastructure on the TEN-T network,
the main financing challenge still rests with the Member States. The development of
sustainable and sufficient sources of financing (both public and private) is of key importance
to overcome the deficit of funding presently available.
Cohesion Fund, ERDF and CEF support, whilst tangible (around EUR 60 billion for TEN-T
investments in 2014-2020), is relatively modest in comparison to the investment needs
identified for the core and comprehensive network. Therefore, ensuring the greatest impact of
EU funds requires a coordinated and targeted use of both grants and of financial instruments
where they can catalyse private investments.
Because of the ex-ante conditionalities for transport, effective framework conditions for the
ESI Funds investments into the transport sector are in place (comprehensive national or

14
regional transport plans and sufficient administrative capacity). This supports the planning of
transport investments, both public and private. A realistic and mature pipeline for CF/ERDF
supported projects developed in the context of this exercise provides a basis for coordination,
synergies and complementarities with CEF and EFSI.
Private funding often builds on public-private partnership (PPP) schemes. EU funds (such as
CEF) can be used to improve the risk profiles and strengthen the contractual arrangements of
PPPs, thereby increasing their marketability. This allows the promoters of eligible
infrastructure projects to attract additional private finance from institutional investors such as
insurance companies and pension funds. ESI Funds can be used to support strategic
infrastructure projects which pool other financial resources, be it in the form of national
public and private co-financing, financing provided by the EIB or – more recently – financing
provided with the risk bearing capacity of EFSI22
.
In order to enhance – where possible - the leveraging effect of EU resources (CF, ERDF,
CEF) on other sources of financing, the Commission makes use of innovative financing
solutions, which can be developed into many different types of support instruments, for
example, through risk-sharing instruments deployed jointly with the European Investment
Bank. Such instruments can mobilise investment volumes ranging from six (equity
investment) to fifteen times (risk sharing instruments such as project bonds) the grant
component. The innovative financing solutions proposed by the Commission build on the
experience with previous instruments, notably the Marguerite Fund and the Loan Guarantee
for TEN Transport (LGTT).
The most prominent example of such an instrument is the pilot phase of the Project Bonds
Initiative (PBI) which has been carried over under the CEF Programme in three sectors:
transport, energy and ICT. The mechanism attracts additional funding allowing the project
promoter or prospective beneficiary to raise debt funding on capital markets (in the form of
bonds) to finance high EU added value pan-European infrastructure projects.
In 2014 and 2015, this support from the PBI mechanism was approved for the expansion of
the A7 motorway in Germany23
; the construction of the new A11 motorway link in
Belgium24
; and the expansion of the port of Calais in France. The latter is also a first example
of the combined use of innovative financial instruments (PBI) and CEF grants25
.
The CEF Debt Instrument (CEF DI) with the European Investment Bank, which is operational
since July 2015 aims to support projects of common interest where the instrument can
facilitate access to debt capital from commercial lending institutions, institutional investors or
senior lending from the European Investment Bank.
The Commission takes further action to ensure synergies between EU funds and support from
the European Fund for Strategic Investments (EFSI) are effectively exploited to mobilise
private financing for strategic transport investments within the EU. The Commission has
22 EIB financing with EFSI support can however not be regarded as national co-financing. 23 http://www.eib.org/infocentre/press/releases/all/2014/2014-182-a7-extension-first-financing-operation-in-
germany-with-eu-project-bonds.htm 24 http://www.eib.org/infocentre/press/releases/all/2014/2014-066-eib-backs-a11-belgian-motorway-link.htm 25 The Project Bond was used to reduce cost of debt and therefore reduce the need for public support, while the
CEF grants were used to cover remaining eligible costs for activities of high EU added value.

15
already published practical guidance26
on how to combine and use in a complementary
manner ESI Funds and EFSI and continues to further simplify the overall framework to
develop such diversification of sources of funding and financing. In 2015, four EFSI transport
projects were signed and another three approved, drawing a total of more than €1.5 billion in
EU loans27
.
An example of combining grant resources under the CEF with resources enabled by EFSI is
the project on “Accessibility Ports Infrastructure” in Spain. An EFSI guarantee enabled EIB
and ICO (national promotion bank) to support with loans a pool of Port accessibility projects
in Spain in order to connect 13 pre-identified ports of the trans-European transport network
during 2015-2020. The total investment (related to the EFSI part of the project) amounts to
EUR 425 million. These EIB and ICO loans were complemented by a CEF co-financing to
some of these projects.28
The Commission develops an innovative blending mechanism, i.e. combining grants from the
Connecting Europe Facility programme with instruments available under the European Fund
for Strategic Investments and private financing. The Commission published a Work
Programme and a call for proposals on 8 February 2017 with an aim to blend EUR 1 billion of
CEF grants with EFSI financing or other private capital sources.
5. DEFINITION OF REPORTING STRATEGY
This first progress report should also propose a monitoring and reporting mechanism enabling
the Commission to fulfil its reporting obligations as defined in Article 49.3 of the TEN-T
Regulation. This means in particular reinforcing the strategy used for Member States'
reporting under Art 49.1 and Art 49.2 of the TEN-T Guidelines. To set up sound and coherent
monitoring and reporting mechanisms, the strategy shall take into account all available
sources of information and data and shall be coherent with the application of the TEN-T
Regulation in line with its objectives and priorities.
The shortcomings identified in the present report indicate that the quality of information and
the methodologies applied to collect and process data need to be further improved at EU level.
To guarantee necessary data harmonisation, in the future the Commission will use a common
pre-filled template for the data collection on EU financial sources as part of its reporting
strategy. This should allow for the creation of a common and harmonised database gathering
all the relevant information on TEN-T projects with EU funding from the relevant Member
State authorities. In this context, it should be noted that EUROSTAT does not collect data on
transport infrastructure expenditures, and more specifically on TEN-T, as it is not foreseen by
the relevant legal basis.
In addition, the reporting mechanism should allow the Commission to indicate how the
various inputs (e.g. EU funds, EIB financing, private leveraged funds) enable the realisation
of outputs (e.g. built infrastructure, deployed ITS) and ultimately contribute to measuring
outcomes (e.g. transport efficiency, passenger/freight transport capacity, safety,
decarbonisation) and estimated impacts (e.g. growth, jobs). This analysis would build upon
the assessment made in the context of CNC work plans.
26 http://ec.europa.eu/regional_policy/sources/thefunds/fin_inst/pdf/efsi_esif_compl_en.pdf 27
http://www.eib.org/efsi/efsi-projects/?c=&se=5 28 http://www.eib.org/projects/pipelines/pipeline/20150115
16
Another key barrier in developing the TEN-T network is the lack of a common source of
reliable information on the current status of the network, its evolution, and ongoing projects
and investments. This requirement should be addressed through the TENtec information
system. TENtec already establishes a harmonised information system for transport
infrastructure underpinned with a strong legal basis29
.
As the TEN-T development unfolds through the implementation of the core and
comprehensive network, it is necessary to ensure the availability and completeness of
information through timely encoding of quality data in TENtec. A general need for
improvement, identified in this report, centres especially on increasing the data input rate of
the system. It is necessary to increase the information content and strengthen it in terms of
accuracy, completeness and consistency in collaboration with Member States and within the
EU institutions and bodies concerned.
The studies launched by the Commission aim at ensuring that a high quality and sufficient
coverage dataset on the state of play of the TEN-T infrastructure is available in TENtec. The
ongoing TENtec data collection exercise currently aims at assessing and verifying the existing
TENtec data in terms of data quality and consistency. The studies also follow a predefined
data collection plan to identify all relevant data sources per country and technical parameter.
The data is collected per geographical network section and node and provides a high level of
detail. The first phase of the data gathering process is nearing completion and will allow
Member States to validate the newly encoded data. The studies will be completed by the end
of 2017 resulting in the update of TENtec data from 2014 and 2015. In the next progress
report, the technical parameter indicators will be recalculated, as the data is expected to be of
higher quality.
In the long-term, the necessity for Member States to complete the information on TEN-
T infrastructure on a regular yearly basis is crucial. The TENtec studies will provide the
Commission with the documentation of data sources and the methodology applied to the
identification of each parameter allowing an easy update of the database. This should
facilitate the data encoding of the required information in the future by Member States.
Furthermore, the current reporting process shows that automated upload should be developed.
As long as the technical data in TENtec is incomplete, all the sections and infrastructure
components which have not been updated in the system should be considered as non-
compliant with the TEN-T requirements. This would eliminate cases where the indicator
reports full compliance with TEN-T standards as a result of low input rate for a given
infrastructure component.
The biennial reporting on the progress of TEN-T implementation could also benefit from
setting a clear timeline for the delivery of future progress reports. The collection, processing
and analysis of financial and technical data from a 2-year TEN-T implementation period
require significant time and resources. A large part of the financial information is available by
the end of the second or third year after the allocation of funds. Similarly, the reporting of
technical data on newly constructed or upgraded infrastructure is often delayed and may
include incomplete or erroneous information. Hence, to deliver a robust, comparative and
aggregate analysis (comparison with previous reporting periods) of biennial progress in the
29 TEN-T Regulation 1315/2013 sets requirements in Article 49 for Member States to transmit annual data to
TENtec, and for the Commission to ensure that TENtec is easily accessible.

17
implementation of TEN-T, the Commission aims to apply a "n+2" rule, in order to be able to
issue the progress reports two years after the end of each reporting period.
Lastly, the assessment of the existing data of the TENtec system allowed the Commission to
elaborate some first ideas on how to improve and further develop the methodology for the
TENtec data analysis. In the context of ongoing CNC studies, the Commission is currently
analysing the impact of TEN-T infrastructure on the environment and climate change as well
as on growth and jobs. In addition, a study will be carried out on the overall impact on growth
and jobs that could be realised through the realisation of the TEN-T core network. This
analysis will lead to the definition of new KPIs for projects which could be added to the
existing technical requirements in the future progress reports. This will need to be further
investigated in the next progress report, where the data input rate and quality will be
significantly increased in TENtec.
6. CONCLUSION
As the final element of the TEN-T progress report, Article 49.3 of TEN-T Regulation requires
the Commission to analyse the development of the trans-European transport network.
Accordingly, this final chapter compares the level of investment in project implementation, as
reported in chapter 4, with the technical implementation status described under chapter 3, to
present an assessment of overall progress made in development of the TEN-T network in the
course of the years 2014 and 2015. The analysis provides conclusions for the core and
comprehensive networks by assessing the realisation of the network and drawing conclusions
on the levels of investment and the output reached in terms of infrastructure compliance.
If EU financial grant support for the development of the TEN-T network is broken down by
modal share, the highest investment volume is reported for rail which absorbed as much as
51.5% of total expenditure in 2014 and 2015. The share of road infrastructure investment
reached 30.6% of total expenditure, followed by 9.2% for ports and Motorways of the Sea,
5.5% for airports (including SESAR), 2.1% for multimodal infrastructure and 1.1% for inland
waterways.
The highest investment level reported for rail (51.5% of the total investment) is in line with
the lower levels of compliance for half of the rail indicators (less than 75% for ERTMS, axle
load and train length), as well as the general TEN-T policy objective of supporting low-
carbon, sustainable transport modes. This is further evidenced by the support granted under
the TEN-T and Connecting Europe Facility, where the overall support for rail projects in
2014-2015 was more than twice the amount of funding granted to all the others modes of
transport together (70% of total TEN-T/CEF expenditures).
With regard to road, the technical compliance indicators are only at 75% for the core network
and 58% for the comprehensive network. In relation to this, the investment level is relatively
high, equal to 30.6% of total expenditure. On average, higher investment in road
infrastructure was made in Cohesion Member States, as evidenced by the relatively large
financial contribution granted under ERDF and Cohesion Fund. In contrast, the share of TEN-
T/CEF expenditure dedicated to road infrastructure amounted to merely 3% in 2014 and 2015.
As regards IWW, the investment level was very low and amounted to only 1.1% of total
investments made on TEN-T (even though the figure is foreseen to increase given the
commitments made by CEF in 2014 and 2015). Whilst for RIS implementation 79% of
compliance and for CEMT IV class 95% of compliance are already reached, the permissible
draught is still relatively far from compliance (68%), which may suggest the need for more

18
investment in IWW infrastructure in the future. In this context, increasing EU financing
should be considered.
For sea ports, the connection to rail, for both the core and comprehensive network is already
fully compliant, according to the data in TENtec. However, capacity issues on rail sections
leading to ports are still present in many cases. The investment level share of 9.2% did not
address the problem of connections to CEMT Class IV inland waterways where the
compliance rate is 46% for the core and merely 9% for the comprehensive network.
Regarding airports, the level of investment remains relatively low (5.5%) even though the
compliance rate with regard to rail connections on both the core (35.5%) and the
comprehensive networks (12.2%) is very low.
Overall, it can be assumed that in most cases significant improvements are still required and
significant investment needed to reach the objectives of the TEN-T Regulation.
Having this presumption in mind, this report paints a rather positive picture of the progress
already achieved on the TEN-T core and comprehensive network. Indeed, large parts of TEN-
T already show a high compliance level with TEN-T Regulation requirements. The level of
expenditure on different TEN-T infrastructure components coming from EU sources generally
matches the investment needs and reflects the TEN-T transport policy goals such as enhanced
accessibility, modal integration, interoperability, sustainability, reduction of emissions,
environmental protection and promotion of innovative mobility solutions. In future reports,
the level of investment at Member States' level needs to be analysed in detail as to complete
the above picture in terms of investment priorities and financial needs in relation to the
technical compliance of the network.
To summarise, the first two years of implementing the new policy approach show that a wide
range of different instruments have been successfully put in place in order to realise the TEN-
T. The progress made in implementing projects for that purpose now needs to be carefully and
continuously monitored so as to ensure that the core network, including its core network
corridors, will be completed by 2030 and the comprehensive network by 2050.

19
Annex 1 - KPIs and calculation method used to measure technical implementation of TEN-T network
Mode Indicator
Passenger (P)
Freight
(F)
Unit Calculation
Target
(in 2030 for core)
(in 2050 for
comprehensive)
Value in 2015
Data input rate
Comments
Rail
Electrification P/F % Electrified rail
network kms as a
proportion of relevant
rail network kms.
100%
81.3% (core)
80.6% (comprehensive)
95.9% (core)
96.2% (comprehensive)
Based on TENtec data encoded
through TENtec study (Lot 1),
pre-validated by ERA but
not validated yet by MS
Track gauge
1435mm P/F %
Standard (1435mm)
track gauge as a
proportion (%) of
relevant rail network
kms.
100%
77% (core)
75.8% (comprehensive)
98.2% (core)
98.7% (comprehensive)
Based on TENtec data encoded
through TENtec study (Lot 1),
pre-validated by ERA but
not validated yet by MS
ERTMS
implementation P/F %
Length of Permanent
Operation of both
ERTMS and GSM-R
on rail network, as a
proportion of relevant
rail network kms
100%
9.5% of core network
corridor sections
96.5% (core network
corridors)
Based on TENtec data encoded
through the ERTMS
Deployment Management
Team, pre-validated by ERA
but not yet validated yet by
MS. Data is limited to core
network corridor sections.
Further data collection ongoing
through ERTMS study
Line speed
(≥100km/h) F %
Length of freight and
combined line
allowing for a
maximum operating
speed greater than or
equal to 100 km/h, as
a proportion of
relevant rail network
kms without load
100%
86.8% (core)
86.6% (comprehensive)
89.4% (core)
86.9% (comprehensive)
Based on TENtec data encoded
through TENtec study (Lot 1),
pre-validated by ERA but
not validated yet by MS

20
restriction.
Axle load
(≥22.5t) F %
Length of freight and
combined line with a
permitted axle load
greater than or equal
to 22.5 tonnes, as a
proportion of relevant
rail network kms.
100%
66.8% (core)
66.6% (comprehensive)
97.5% (core)
97.5% (comprehensive)
Based on TENtec data encoded
through TENtec study (Lot 1),
pre-validated by ERA but
not validated yet by MS
Train length
(≥740m) F %
Length of Freight and
combined line with a
permitted train length
greater than or equal
to 740m, as a
proportion of relevant
rail network kms.
100%
46.5% (core)
46.6% (comprehensive)
79.9% (core)
76.2% (comprehensive)
Based on TENtec data encoded
through TENtec study (Lot 1),
pre-validated by ERA but
not validated yet by MS
Road
Express road/
motorway P/F %
Road network kms
classified as motorway
or express road, as a
proportion (%) of
road section kms.
100%
74.5% (core)
58.1% (comprehensive)
100% (core)
100% (comprehensive)
Based on TENtec data encoded
through TENtec study (Lot 1),
pre-validated by ERA but
not validated yet by MS
Availability of
clean fuels P/F
Number of fuel
stations offering plug-
in electricity,
hydrogen, liquid
biofuels, LNG/CNG,
bio-methane or LPG
along road sections or
within 10km from its
junctions (units in
absolute number, not
%)
n.a.
n.a.
n.a.
Data availability is currently
limited. Member States have to
deliver their annual plans for
the deployment of clean fuels
infrastructure. This exercise is
still ongoing.

21
IWW
CEMT
requirements
for class IV
IWW F
%
Length of Inland
waterways classified
as at least CEMT
class IV, as a
proportion (%) of
waterway network
kms.
100%
95.4%
n.a.
Based on TENtec data
collected through TENtec
study (Lot 2), subject to pre-
validation and not validated
yet by MS
Permissible
Draught (min
2.5m) F
%
Inland waterway
network kms
permitting a vessel of
2.5m draught, as a
proportion (%) of
waterway section kms.
100%
68%
n.a.
Data based on
Art. 49.3 study of 2016;
More precise data collection
ongoing through TENtec study
(Lot 2)
Permissible
Height under
bridges(min.
5.25m) F
%
Inland waterway
network kms with
vertical clearance of
at least 5.25m under
bridges, as a
proportion (%) of
waterway section kms.
100%
n.a.
n.a.
Data collection ongoing
through TENtec study (Lot 2)
RIS
implementation
(% of km on
which the
minimum
requirements
set out by the
RIS directive
are met)
F %
Inland waterway
network kms on which
the minimum technical
requirements of the
RIS directive are met,
as a proportion (%) of
waterway section kms.
100%
79.6%
n.a.
Based on TENtec data
collected through TENtec
study (Lot 2), subject to pre-
validation and not validated
yet by MS

22
Ports
Connection to
rail F %
Number of ports with
a rail connection as a
proportion (%) of the
number of relevant
core and
comprehensive ports.
100%
100% for seaports
n.a.
Data based on
Art. 49.3 study of 2016;
More precise data collection
ongoing through MoS study
Connection to
IWW CEMT
IV
F %
Number of ports with
a (hinterland) inland
waterway connection
of at least CEMT IV
class, as a proportion
(%) of the number of
relevant core and
comprehensive ports.
100%
46% (core)
9% (comprehensive)
n.a.
Data based on
Art. 49.3 study of 2016;
More precise data collection
ongoing through MoS study
Availability of
clean fuels F %
Number of ports
offering (at least one
of) LPG, LNG, liquid
biofuels, or synthetic
fuels as a proportion
(%) of the total
number of core and
comprehensive ports.
n.a.
n.a.
n.a.
Data collection ongoing
through TENtec study (Lot 2)
Availability of
at least one
freight terminal
open to all
operators in a
non-
discriminatory
way and
application of
transparent
charges
F %
Number of ports with
at least one open
access terminal, as a
proportion (%) of the
total number of core
and comprehensive
ports.
n.a.
n.a.
n.a.
Currently no data available.
Data will be subject to an
upcoming data collection
campaign.

23
Facilities for
ship generated
waste (only for
seaports)
P/F %
Number of seaports
offering facilities for
accepting PRF
mandatory
(MARPOL13 Annexes
I, IV, and V)
categories of ship-
generated waste, as a
proportion (%) of the
total number of core
and comprehensive
ports.
n.a.
n.a.
n.a.
Data collection ongoing
through TENtec study (Lot 2)
Airports
Connection to
rail P/F %
Number of airports
with a rail connection
as a proportion (%) of
the number of relevant
core and
comprehensive
airports.
100% (i.e. all 38
core airports)
23 out of 38 core airports
that fall under this
compliance criterion
(60.5%)
(For information: 35.5%
of all core airports, and
12.2% of all
comprehensive airports)
100% (core)
100% (comprehensive)
Based on TENtec data encoded
through TENtec study (Lot 1),
not validated yet by MS
Availability of
at least one
terminal open
to all operators
in a non-
discriminatory
way and
application of
transparent,
relevant and
fair charges
P/F %
Number of airports
offering liquid biofuels
or synthetic fuels for
aeroplanes, as a
proportion (%) of the
total number of core
and comprehensive
airports
n.a.
n.a.
n.a.
Currently no data available.
Data will be subject to an
upcoming data collection
campaign.

24
Availability of
clean fuels P/F %
Number of airports
with at least one open
access terminal, as a
proportion (%) of the
total number of core
and comprehensive
airports.
n.a.
n.a.
n.a.
Currently no data available.
Data will be subject to an
upcoming data collection
campaign.
RRT
Capability for
Intermodal
(unitised)
transhipment
F %
Number of road rail
terminals with the
capability of handling
intermodal units, as a
proportion (%) of the
total number of core
and comprehensive
RRTs.
n.a.
n.a.
n.a.
Currently no data available.
Data will be subject to an
upcoming data collection
campaign.
740m train
terminal
accessibility
F %
Number of road rail
terminals with the
capability of handling
740m trains (without
decoupling), as a
proportion (%) of the
total number of core
and comprehensive
RRTs.
n.a.
n.a.
n.a.
Currently no data available.
Data will be subject to an
upcoming data collection
campaign.
Electrified train
terminal
accessibility
F %
Number of road rail
terminals with the
capability of handling
electrified trains, as a
proportion (%) of the
total number of core
and comprehensive
RRTs.
n.a.
n.a.
n.a.
Currently no data available.
Data will be subject to an
upcoming data collection
campaign.

25
Availability of
at least one
freight terminal
open to all
operators in a
non-
discriminatory
way and
application of
transparent
charges
F %
Number of RRTs with
at least one open
access terminal, as a
proportion (%) of the
total number of core
and comprehensive
RRTs.
Currently no data available.
Data will be subject to an
upcoming data collection
campaign.
26
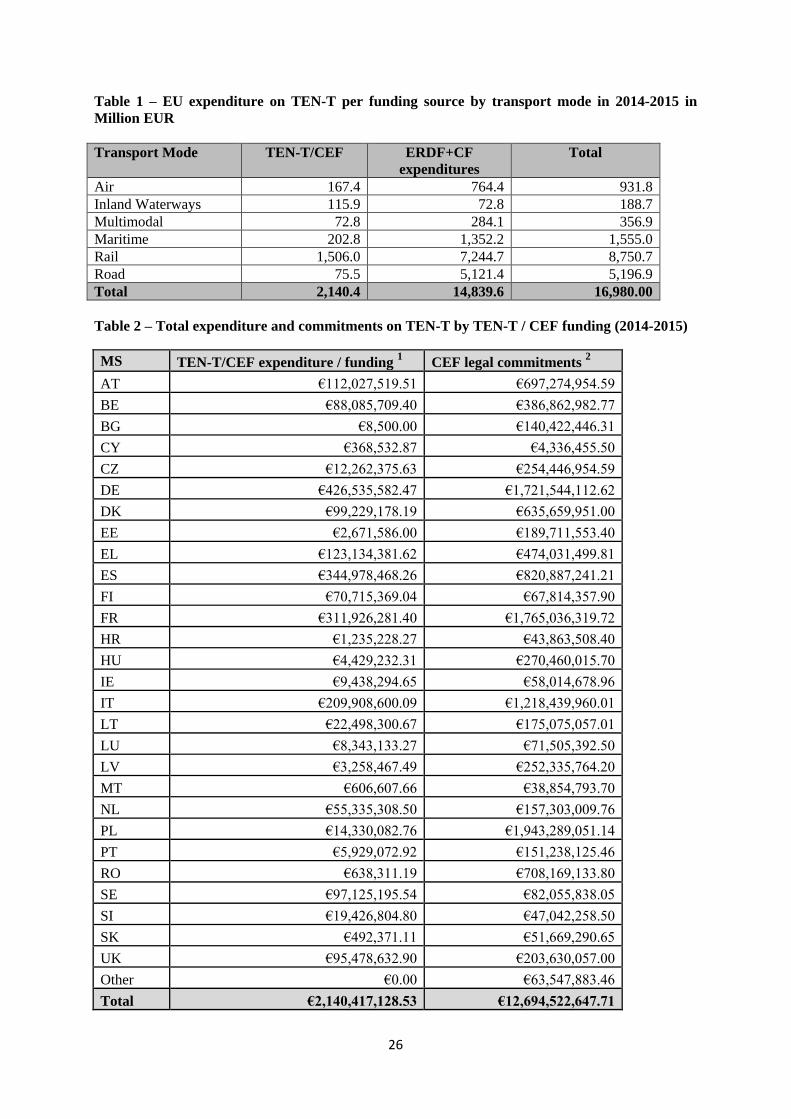
Table 1 – EU expenditure on TEN-T per funding source by transport mode in 2014-2015 in
Million EUR
Transport Mode TEN-T/CEF ERDF+CF
expenditures
Total
Air 167.4 764.4 931.8
Inland Waterways 115.9 72.8 188.7
Multimodal 72.8 284.1 356.9
Maritime 202.8 1,352.2 1,555.0
Rail 1,506.0 7,244.7 8,750.7
Road 75.5 5,121.4 5,196.9
Total 2,140.4 14,839.6 16,980.00
Table 2 – Total expenditure and commitments on TEN-T by TEN-T / CEF funding (2014-2015)
MS TEN-T/CEF expenditure / funding 1 CEF legal commitments
2
AT €112,027,519.51 €697,274,954.59
BE €88,085,709.40 €386,862,982.77
BG €8,500.00 €140,422,446.31
CY €368,532.87 €4,336,455.50
CZ €12,262,375.63 €254,446,954.59
DE €426,535,582.47 €1,721,544,112.62
DK €99,229,178.19 €635,659,951.00
EE €2,671,586.00 €189,711,553.40
EL €123,134,381.62 €474,031,499.81
ES €344,978,468.26 €820,887,241.21
FI €70,715,369.04 €67,814,357.90
FR €311,926,281.40 €1,765,036,319.72
HR €1,235,228.27 €43,863,508.40
HU €4,429,232.31 €270,460,015.70
IE €9,438,294.65 €58,014,678.96
IT €209,908,600.09 €1,218,439,960.01
LT €22,498,300.67 €175,075,057.01
LU €8,343,133.27 €71,505,392.50
LV €3,258,467.49 €252,335,764.20
MT €606,607.66 €38,854,793.70
NL €55,335,308.50 €157,303,009.76
PL €14,330,082.76 €1,943,289,051.14
PT €5,929,072.92 €151,238,125.46
RO €638,311.19 €708,169,133.80
SE €97,125,195.54 €82,055,838.05
SI €19,426,804.80 €47,042,258.50
SK €492,371.11 €51,669,290.65
UK €95,478,632.90 €203,630,057.00
Other €0.00 €63,547,883.46
Total €2,140,417,128.53 €12,694,522,647.71

27
1 TEN-T share of expenditure for works and mixed works/studies projects. Expenditure based
on declared costs in Action Status Reports and final payment claims. CEF share of expenditures /
funding based on declared costs / payment claims, whenever applicable, or on funding expected to be
absorbed by the project on the basis of the latest information available (taking into account budget
breakdowns in grant agreements).
2 EU funding currently allocated via the latest grant agreement (for ongoing actions) or final
funding for terminated / closed actions. This variable takes into account reduction of funding via
amendments.
Table 3 – Total expenditure and commitments on TEN-T by ERDF / Cohesion Fund in 2014-
2015
MS
ERDF + CF Expenditures
(2014-2015) 2007-2013
period1
ERDF + CF Estimated
amount of commitments
(2014-2015) 2014-2020 period2
AT €2,934,472.00 €0.00
BE €46,136.00 €0.00
BG €568,041,108.00 €283,168,179.00
CY €8,616,572.00 €10,867,022.00
CZ €875,526,552.00 €638,315,795.00
DE €368,407,819.00 €550,138.00
EE €129,279,226.00 €100,579,525.00
ES €582,659,100.00 €388,654,854.00
FI €3,403,446.00 €0.00
FR €95,387,637.00 €11,952,785.00
GR €1,088,333,130.00 €349,050,764.00
HR €80,655,785.00 €213,936,269.00
HU €990,951,073.00 €381,435,124.00
IT €591,732,086.00 €338,966,553.00
LT €456,818,713.00 €173,677,344.00
LV €261,879,728.00 €221,134,278.00
MT €1,309,272.00 €18,565,514.00
NL €250,000.00 €0.00
PL €4,924,498,892.00 €3,258,444,121.00
PT €174,551,330.00 €138,470,240.00
RO €2,250,442,506.00 €923,420,160.00
SE €2,102,460.00 €8,221,453.00
SI €480,243,393.00 €56,681,911.00
SK €616,618,969.00 €512,834,678.00
TC/CB* €161,326,899.00 €15,360,141.00
UK €123,611,227.00 €40,004,023.00
Total €14,839,627,531.00 €8,084,290,869.00

28
* TC/CB stands for programmes implemented under the European territorial cooperation objective,
which had no access to the Cohesion Fund and covered regions from different Member States
1 The estimates provided in these tables are based on data collected in the framework of the Ex
post evaluation of Cohesion Policy programmes 2007-2013, focusing on the European Regional
Development Fund (ERDF) and Cohesion Fund (CF) Work Package 13 and the latest adopted version
of programmes in October 2016.
2 Based on data from adopted programmes extracted in October 2016 and include only ERDF or
Cohesion Fund resources, not the national contribution.
Table 4 – EIB loans signed in 2014-2015 on TEN-T projects
MS EIB loans signed 1
AT €990,000,000.00
BE €340,000,000.00
BG €180,000,000.00
CY €4,000,000.00
CZ €0.00
DE €407,000,000.00
DK €0.00
EE €0.00
EL €325,000,000.00
ES €2,439,000,000.00
FI €102,000,000.00
FR €973,000,000.00
HR €47,000,000.00
HU €296,000,000.00
IE €319,000,000.00
IT €1,819,000,000.00
LT €62,000,000.00
LV €0.00
NL €402,000,000.00
PL €3,761,000,000.00
SE €132,000,000.00
SI €181,000,000.00
SK €322,000,000.00
UK €591,000,000.00
Total €13,692,000,000.00
1 EIB loans / operations on TEN-T signed in 2014 and 2015