report for bmc tmdl feasibility project final€¦ · · 2008-02-16tetra tech, inc. blackwood...
TRANSCRIPT


Tetra Tech Blackwood Creek Watershed Restoration and Fisheries Habitat Improvement Plan i
TABLE OF CONTENTS Section Page 1. INTRODUCTION AND BACKGROUND................................................................................................ 1-1
1.1 Project Purpose .......................................................................................................... 1-1 1.2 Setting........................................................................................................................ 1-2
1.2.1 Physical Description....................................................................................... 1-2 1.2.2 Uplands......................................................................................................... 1-4 1.2.3 Stream Corridor ............................................................................................. 1-6 1.2.4 Blackwood Creek Fisheries............................................................................. 1-9
2. PROBLEM STATEMENT.................................................................................................................. 2-1 2.1 Specific Problem Statements ....................................................................................... 2-2
3. NUMERIC TARGETS: WATER QUALITY INDICATORS AND ENDPOINTS................................................... 3-1 3.1 Conceptual Model ...................................................................................................... 3-1 3.2 Endpoint Selection Process.......................................................................................... 3-4 3.3 Linkage Indicators and Numeric Targets ...................................................................... 3-6 3.4 Trend Indicators........................................................................................................ 3-11
4. SOURCE ANALYSIS...................................................................................................................... 4-1 4.1 Instream Source Analysis............................................................................................. 4-2 4.2 Upland Source Analysis .............................................................................................. 4-2
4.2.1 Grazing ......................................................................................................... 4-6 4.2.2 Logging ......................................................................................................... 4-6 4.2.3 Recreation ..................................................................................................... 4-7
5. LINKAGE ANALYSIS..................................................................................................................... 5-1
6. ALLOCATIONS ........................................................................................................................... 6-1 6.1 SCS Curve Number / Peak Flow .................................................................................. 6-1 6.2 Hillslope Sediment Yield ............................................................................................ 6-1 6.3 Lateral Bank Erosion Rates .......................................................................................... 6-2 6.4 Bed Elevation ............................................................................................................. 6-2 6.5 Transport through Gravel Mine ................................................................................... 6-2 6.6 Barriers to Fish Passage ............................................................................................... 6-2
7. DATA NEEDS AND RECOMMENDATIONS FOR MONITORING EVALUATION PLAN..................................... 7-1 7.1 Data Needs Primarily for Design of Restoration Measures ............................................ 7-2 7.2 Monitoring for Assessment of Numeric Targets and Evaluation of Restoration Efforts ..... 7-3
8. IMPLEMENTATION ...................................................................................................................... 8-1 8.1 Upland Restoration Recommendations ........................................................................ 8-2 8.2 Stream Corridor Restoration Measures ......................................................................... 8-5
9. MARGIN OF SAFETY - KEY UNCERTAINTIES ...................................................................................... 9-1
Tetra Tech Blackwood Creek Watershed Restoration and Fisheries Habitat Improvement Plan ii
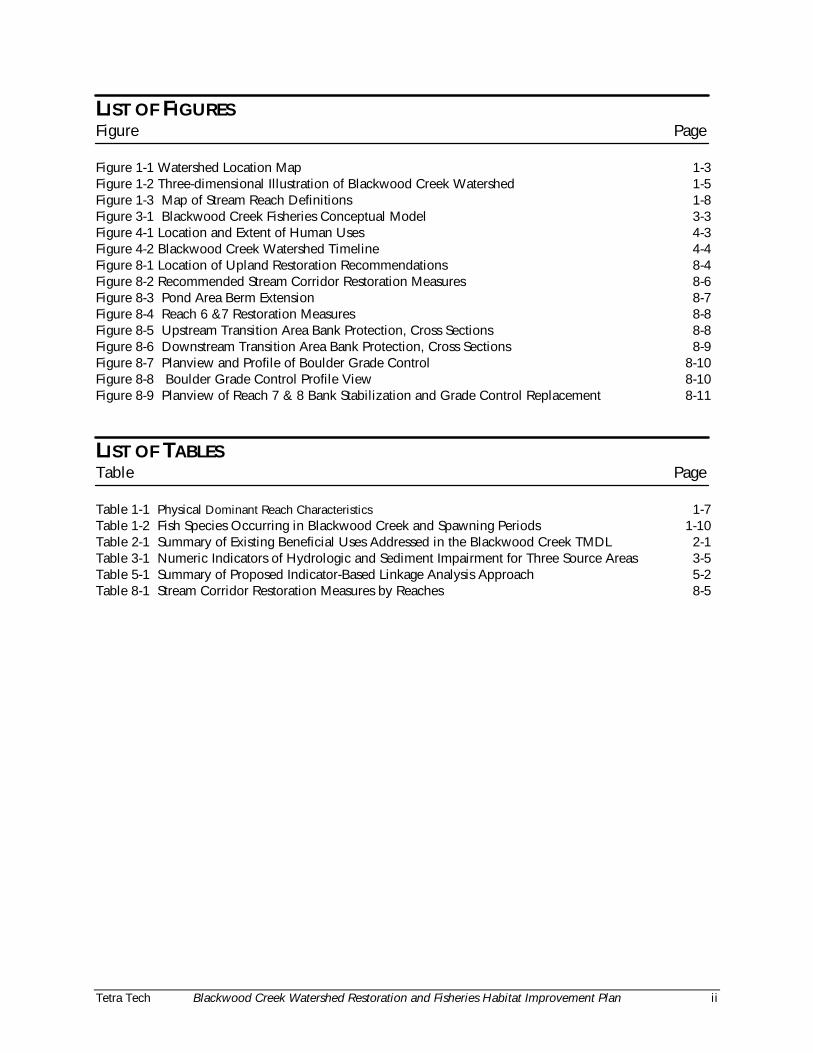
LIST OF FIGURES Figure Page Figure 1-1 Watershed Location Map 1-3 Figure 1-2 Three-dimensional Illustration of Blackwood Creek Watershed 1-5 Figure 1-3 Map of Stream Reach Definitions 1-8 Figure 3-1 Blackwood Creek Fisheries Conceptual Model 3-3 Figure 4-1 Location and Extent of Human Uses 4-3 Figure 4-2 Blackwood Creek Watershed Timeline 4-4 Figure 8-1 Location of Upland Restoration Recommendations 8-4 Figure 8-2 Recommended Stream Corridor Restoration Measures 8-6 Figure 8-3 Pond Area Berm Extension 8-7 Figure 8-4 Reach 6 &7 Restoration Measures 8-8 Figure 8-5 Upstream Transition Area Bank Protection, Cross Sections 8-8 Figure 8-6 Downstream Transition Area Bank Protection, Cross Sections 8-9 Figure 8-7 Planview and Profile of Boulder Grade Control 8-10 Figure 8-8 Boulder Grade Control Profile View 8-10 Figure 8-9 Planview of Reach 7 & 8 Bank Stabilization and Grade Control Replacement 8-11
LIST OF TABLES Table Page Table 1-1 Physical Dominant Reach Characteristics 1-7 Table 1-2 Fish Species Occurring in Blackwood Creek and Spawning Periods 1-10 Table 2-1 Summary of Existing Beneficial Uses Addressed in the Blackwood Creek TMDL 2-1 Table 3-1 Numeric Indicators of Hydrologic and Sediment Impairment for Three Source Areas 3-5 Table 5-1 Summary of Proposed Indicator-Based Linkage Analysis Approach 5-2 Table 8-1 Stream Corridor Restoration Measures by Reaches 8-5

Tetra Tech, Inc. Blackwood Creek Sediment TMDL Report 1-1 03/27/01
SECTION 1 INTRODUCTION AND BACKGROUND
1.1 PROJECT PURPOSE The purpose of this report is to provide background technical information and specific recommendations on all required elements of a sediment TMDL for Blackwood Creek. This report will serve as a foundation and workplan for completion of the Blackwood Creek sediment TMDL. The primary source of technical information and recommendations is a report completed by Tetra Tech for the USDA Forest Service Lake Tahoe Basin Management Unit, “Blackwood Creek Watershed Restoration and Fisheries Habitat Improvement Plan: Project Feasibility Study.” The goal of this report is to provide an effective translation of the watershed restoration feasibility study and the regulatory and scientific requirements for a successful nonpoint source TMDL. This report also identifies information and data gaps between the feasibility study and the information necessary to complete the TMDL for Blackwood Creek.
The report format and structure is consistent with several sediment TMDLs that have been approved by the US Environmental Protection Agency
(USEPA), Region 9, including TMDLs for the Garcia River, Redwood Creek, the South Fork of the Trinity River, and the South Fork of the Eel River. While there are similarities between these waterbodies and Blackwood Creek there are also differences. Features unique to Blackwood Creek include snowmelt-dominated hydrology (versus rainfall), intrusive volcanic lithology (versus coastal marine sediment), and the fish species of concern (trout versus salmon). The example sediment TMDLs reviewed by the project team were all for waterbodies primarily impaired due to sediment inputs from upland areas of their watersheds. The primary source of sediment that impairs Blackwood Creek is channel instability. These differences are reflected in the recommendations for indicators, source assessment, allocations, implementation strategy, and monitoring for
The Blackwood Creek Watershed Restoration and Fisheries Habitat Improvement Plan: Project Feasibility Study assessed and evaluated the stream channel, watershed hydrology, and fisheries and aquatic habitat through field reconnaissance and surveys of channel morphology and fisheries habitat, and detailed appropriate alternatives to enhance and restore watershed and fisheries conditions in the Blackwood Creek watershed.

1. Introduction and Background
Tetra Tech, Inc. Blackwood Creek Sediment TMDL Report 1-2 03/27/01
Blackwood Creek.
The conditions in the Blackwood Creek watershed will likely require a phased nonpoint source TMDL that relies on a network of numeric endpoints that have well understood relationships. However it is very difficult to quantify these relationships. To ensure that the proposed numeric endpoints have credibility the project team has relied on four key technical documents to develop the recommendations included in this report:
1. U.S. Environmental Protection Agency. 1999. Protocol for Developing Sediment TMDLs. EPA 841-B-99-004. Office of Water (4503F), United States Environmental Protection Agency, Washington, D.C.
2. MacDonald, Lee H. Alan W. Smart, Robert C. Wissmar. 1991. Monitoring Guidelines To Evaluate Effects of Forestry Activities on Streams In the Pacific Northwest and Alaska. U.S. Environmental Protection Agency Region 10. EPA 910-9-91-001. Seattle, Washington.
3. U.S. Environmental Protection Agency. 1997. Compendium of Tools for Watershed Assessment and TMDL Development. EPA 841-B-97-006. Washington D.C.
4. Bauer, S.B., S.C. Ralph. 1999. Aquatic Habitat Indicators and Their Application to Water Quality Objectives Within the Clean Water Act. EPA –910-R-99-014. United States Environmental Protection Agency. Seattle, WA.
This report translates the technical information included in the restoration feasibility study into the required TMDL elements. A source area approach was adopted for organizing this analysis and the three source areas are hillslope, floodplain and riparian and channel. The mechanisms contributing to the impairment in each source area were divided into two categories: hydrology and sediment. Hydrology refers to alterations in peak and base flows and sediment refers to processes related to increased loading of coarse and fine sediments and alteration of sediment transport regimes.
1.2 SETTING
1.2.1 Physical Description
The Blackwood Creek Watershed encompasses 11.2 square miles on the west-central side of the Lake Tahoe basin (Figure 1.1 Watershed Location Map). The overall Lake Tahoe basin is designated as Cataloging Unit (HUC) 16050101. The Blackwood Creek watershed is oval shaped with a length of 6 miles and an average width of 2 miles. Elevations in the basin range from 6,230 feet at Lake Tahoe to 8,878 at Twin Peaks. The surficial geology of the basin is dominated by extrusive volcanics. This is in contrast to the majority of the Tahoe basin, which is comprised of metamorphic and igneous lithologies.

1. Introduction and Background
Tetra Tech, Inc. Blackwood Creek Sediment TMDL Report 1-3
03/27/01
Figure 1-1 Watershed Location Map

1. Introduction and Background
Tetra Tech, Inc. Blackwood Creek Sediment TMDL Report 1-4 03/27/01
Precipitation in the Blackwood Creek Watershed is greatest near the western summits where an average of 80 inches of precipitation falls per year. The precipitation decreases to the east as elevations drop and the average annual precipitation near the lake is 40 inches. The average precipitation over the watershed has been estimated to be on the order of 60 inches per year. Of this amount, about 90 percent falls as snow. Average annual runoff is 27,000 acre-feet per year. This represents an estimated average surface water yield of 70 percent.
The valley through which Blackwood Creek flows is rather flat and broad, owing to the influence of glaciation. The downstream third of the valley has a gradient of less than one percent. The middle third slopes at an average of 2 percent. The gradient of the upper third is in excess of 10 percent as the stream breaks into several tributaries that originate at the watershed divide.
Coniferous forests dominate the hillsides. The exceptions are areas of steep, barren rock and outcrops that are most numerous in the highest areas of the watershed. Along the narrower stream corridors, cottonwoods, aspen and deciduous shrubs are the dominant vegetation. In the broader areas of the valley, willows, sedges and riparian grasses form several large meadows. It is in these meadows that some of the most obvious impacts of watershed instabilities can be observed. Due to severe bank erosion, many acres of meadow and wetlands have been eroded and converted to mostly barren gravel bars.
1.2.2 Uplands The steep valley walls and low gradient valley floor of Blackwood Creek watershed were formed primarily by periods of glaciation thousands of years ago. Blackwood Creek Canyon has a broad oval form with very steep valley slopes that allow for rapid concentration of runoff into the main channel (Figure 1.2). The Blackwood drainage is composed of predominantly volcanic rocks including both andesite flows and volcanic mudflows (laharic breccias). Over 40 percent of the watershed rock type is classified as surficial consisting of morainal outwash and alluvial deposition (Hill, 1987). The low surface relief of the drainage and high sediment production rate indicates that these rocks are very easily eroded. It is probable that these volcanic rocks are considerably more erodible than the surrounding granitic drainages. Soils in the valley bottom are loamy coarse sands that are deep to very deep. (Loam is defined as soil composed of a mixture of sand, clay, silt, and organic matter.) Upslope soils on the south side of the stream are coarse sandy loams and cobbly loams. Much of the north ridge and headwaters is rock outcrop.

1. Introduction and Background
Tetra Tech, Inc. Blackwood Creek Sediment TMDL Report 1-5 03/27/01
Figure 1-2 Three-dimensional Illustration of Blackwood Creek Watershed

1. Introduction and Background
Tetra Tech, Inc. Blackwood Creek Sediment TMDL Report 1-6 03/27/01
In the 1800s Blackwood Canyon was primarily Jeffrey pine forest. Growth of both red fir and white fir was suppressed by naturally occurring wildfires. Today, the canyon supports a mixed-conifer forest. South slopes are predominantly western white pine and Jeffrey pine, while the north slope is red fir, white fir and Jeffrey pine. The old growth Jeffrey pine is gone from the lower slopes and valley bottom and has been replaced with young growth white fir, red fir, and lodgepole pine. The valley bottom supports a variety of riparian vegetation, including sedges, willows, aspen and cottonwoods. Lodgepole pine is encroaching in areas of the watershed.
Steep slopes with southern exposures in the Blackwood Creek drainage have the least vegetative cover and the highest erosion potential. These slopes are dried out by sun exposure and generally have little soil, making establishment of vegetation very difficult. During some winters these southern slopes will have considerably thinner winter snowpacks and are much more susceptible to surface erosion during heavy winter rainfall events. The Blackwood Creek drainage has a high percentage of these steep southern slopes (Todd, 1989).
The network of system and non-system roads is a significant feature of the uplands that have a major impact on watershed processes. Barker Pass Road is the primary road in the watershed starting at the mouth of the creek and extending to the watershed summit at Barker Pass. Many of the roads and skid trails constructed for logging are still visible in the canyon after 40 or more years. Several miles remain compacted and continue to erode. Most are poorly drained if they have drainage structures at all. In addition, uncontrolled off-highway vehicle (OHV) activity has created another several miles of trails crisscrossing the stream zone of Blackwood Creek. While some road improvements have been made, several projects identified in previous watershed improvement and erosion control program planning documents remain unimplemented.
Gullies of various origins are another significant feature of Blackwood Canyon uplands. There are over twenty-six gullies in the watershed that have been included in an inventory of erosion control projects (LTBMU, 1989). Gullies often form because of over grazing and improper development of skid trails during logging operations. The gullies serve to concentrate overland runoff and deliver large amounts of sediment to the stream system at high velocities.
1.2.3 Stream Corridor The stream channel of Blackwood Creek has undergone severe changes in character over time. Primarily the channel has incised and/or widened to accommodate larger, higher energy flows caused by increased uplands runoff resulting from roads and gullies and loss of vegetation. Many channel reaches now contain the 50-year recurrence interval flows within the bank full channel, focusing high flow energy on the streambanks that would normally be diffused over a wider floodplain. Higher flow and energy have also contributed to increased large woody debris recruitment in the stream channel leading to debris jams and decreased canopy cover and shading.
1. Introduction and Background
Tetra Tech, Inc. Blackwood Creek Sediment TMDL Report 1-7 03/27/01
Changes in channel size and shape have led to altered sediment transport regimes. The primary interruption in the sediment transport regime is the historic in-channel gravel mine, where flow velocity decreases causing the bed load of coarse sediments and cobbles to drop out which reduces the availability of these sediment sizes in downstream areas. Fine sediments are eroded from upland areas and stream banks and are washed downstream rapidly as a result of higher flows and are transported into Lake Tahoe more efficiently. Vehicular (particularly OHV) traffic near and across the stream channel has also significantly contributed to instability and introduction of sediment to the system.
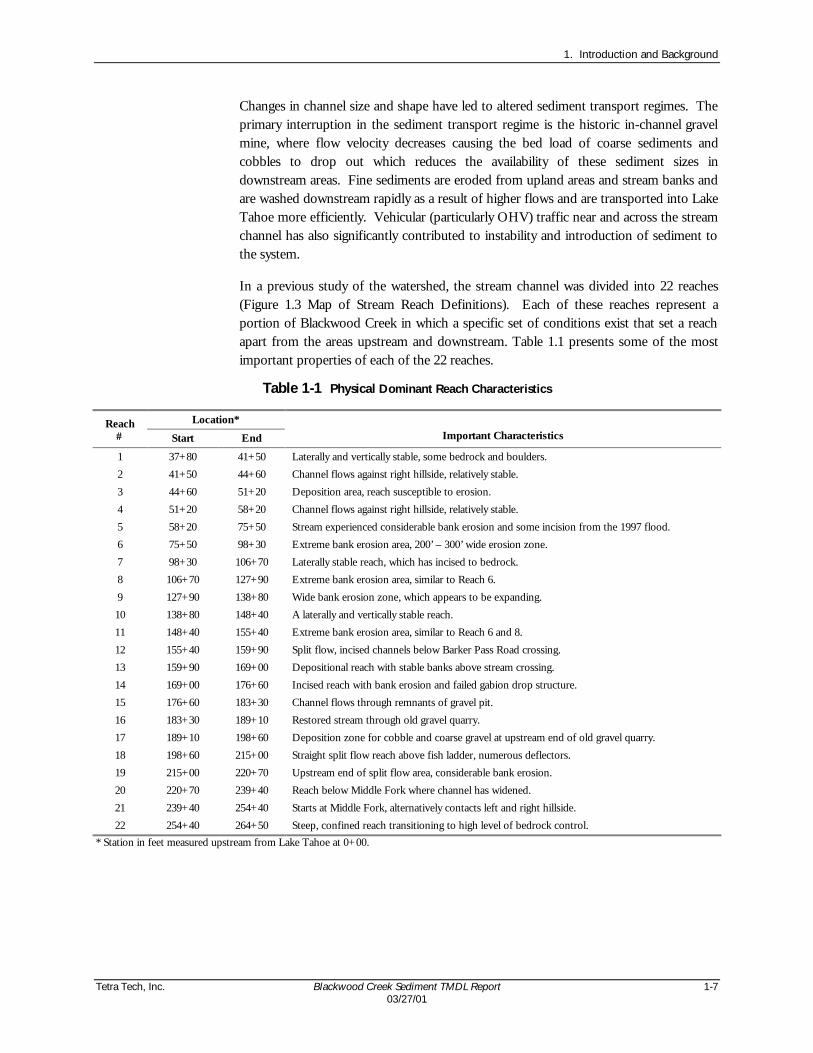
In a previous study of the watershed, the stream channel was divided into 22 reaches (Figure 1.3 Map of Stream Reach Definitions). Each of these reaches represent a portion of Blackwood Creek in which a specific set of conditions exist that set a reach apart from the areas upstream and downstream. Table 1.1 presents some of the most important properties of each of the 22 reaches.
Table 1-1 Physical Dominant Reach Characteristics
Location* Reach # Start End Important Characteristics
1 37+80 41+50 Laterally and vertically stable, some bedrock and boulders. 2 41+50 44+60 Channel flows against right hillside, relatively stable. 3 44+60 51+20 Deposition area, reach susceptible to erosion. 4 51+20 58+20 Channel flows against right hillside, relatively stable. 5 58+20 75+50 Stream experienced considerable bank erosion and some incision from the 1997 flood. 6 75+50 98+30 Extreme bank erosion area, 200’ – 300’ wide erosion zone. 7 98+30 106+70 Laterally stable reach, which has incised to bedrock. 8 106+70 127+90 Extreme bank erosion area, similar to Reach 6. 9 127+90 138+80 Wide bank erosion zone, which appears to be expanding. 10 138+80 148+40 A laterally and vertically stable reach. 11 148+40 155+40 Extreme bank erosion area, similar to Reach 6 and 8. 12 155+40 159+90 Split flow, incised channels below Barker Pass Road crossing. 13 159+90 169+00 Depositional reach with stable banks above stream crossing. 14 169+00 176+60 Incised reach with bank erosion and failed gabion drop structure. 15 176+60 183+30 Channel flows through remnants of gravel pit. 16 183+30 189+10 Restored stream through old gravel quarry. 17 189+10 198+60 Deposition zone for cobble and coarse gravel at upstream end of old gravel quarry. 18 198+60 215+00 Straight split flow reach above fish ladder, numerous deflectors. 19 215+00 220+70 Upstream end of split flow area, considerable bank erosion. 20 220+70 239+40 Reach below Middle Fork where channel has widened. 21 239+40 254+40 Starts at Middle Fork, alternatively contacts left and right hillside. 22 254+40 264+50 Steep, confined reach transitioning to high level of bedrock control.
* Station in feet measured upstream from Lake Tahoe at 0+00.

1. Introduction and Background
Tetra Tech, Inc. Blackwood Creek Sediment TMDL Report 1-8
03/27/01
Figure 1-3 Map of Stream Reach Definitions

1. Introduction and Background
Tetra Tech, Inc. Blackwood Creek Sediment TMDL Report 1-9 03/27/01
Gravel mining has a particularly important impact on the instream morphology of Blackwood Creek. Gravel extraction activity took place in the Blackwood Creek valley bottom from 1960 to 1968. After the valley bottom was rezoned residential/agriculture, allowing the area to be developed for recreational and subdivision purposes, private interests obtained permits for a land development that included gravel extraction and rock crushing. A total of fifteen acres of a floodplain and meadow area were leveled and surfaced to provide a staging area for the operation. Blackwood Creek was diverted south of its original channel by construction of a diversion channel allowing the creek’s gravel to be mined. The flow of Blackwood creek was diverted over fragile and unstable soils rapidly increasing the creek’s sediment load. Sediment yields were estimated at four times their normal rate for even minor runoff events during the gravel mining period. Where the meadow and broad alluvial valley formerly allowed floods to spread out, deposit much of their sediment load, and dissipate their energy, they now carried large amounts of soil and logging debris downstream. The diversion structure was breached several times during storm events, particularly during a devastating rain-on-snow event in 1964 with a peak flow measured at 2100 cubic feet per second at the mouth of Blackwood Creek. The 1964 flood caused the creek to change its course above the diversion channel. Such high waters carried logging debris into the quarry and throughout the main channel, causing bank scour, weakening stream banks, and undermining riparian trees that added to the debris. Gravel removal and its related disturbances had also increased the stream gradient at and above the mined site.
Gravel mining was abandoned after 1968. After the departure of the mining contractor, the USFS constructed a drop structure to re-divert the creek back into its original channel and through the abandoned gravel pits. An unintended consequence of this action has been to trap coarse bedload from upstream within the gravel pit. As a result, flood flows below the gravel pit tend to have excess capacity for sediment transport, which is compensated by erosion of the channel and banks.
1.2.4 Blackwood Creek Fisheries Blackwood Creek is one of the major spawning streams in the Lake Tahoe Basin. There are nine fish species that may use Blackwood Creek. Gamefish species include rainbow trout (Oncorhynchus mykiss), brook trout (Salvelinus fontinalis), and brown trout (Salmo trutta). There is a remote possibility that kokanee salmon (Onchorhynchus nerka) spawn in the creek, but since high stream flows are necessary to gain access to Blackwood Creek, kokanee have access only during high flows in wet years. These salmonid species typically migrate from Lake Tahoe and use the stream to spawn. Other fish species that occur in Blackwood Creek include the Tahoe sucker (Catostomus tahoensis), mountain sucker (Catostomus platyrhynchus), Lahontan redside (Richardsonius egregius), speckled dace (Rhinichthys osculus), and Piute sculpin (Cortus beldingi). Table 1.2 lists general spawning periods of the nine fish species.

1. Introduction and Background
Tetra Tech, Inc. Blackwood Creek Sediment TMDL Report 1-10 03/27/01
Table 1-2 Fish Species Occurring in Blackwood Creek and Spawning Periods
Species Spawning Period Rainbow trout May through July Brook trout October to November Brown trout mid-September to January Kokanee salmon October to November Tahoe sucker April to June Lahontan redside Late-May through August Speckled dace June and July Mountain suckers May through mid-August Piute sculpin May through August
The erosion of Blackwood Canyon and disturbances along the stream channel detrimentally affected the creek’s fisheries. Blackwood Creek once supported some of the largest runs of rainbow trout in the spring and more modest runs of brown trout in the fall. Sediment deposition, erosion of streambanks, loss of riparian vegetation, and reduction of pool habitats created poor conditions for these spawning runs. It was concern for the loss of the fishery that helped spur control of damaging activities in the watershed. This concern led to initial efforts to understand the canyon’s erosive nature as the first step toward rehabilitation. Fish are still not considered abundant in the creek. In many respects, the quality of fish habitat in Blackwood Creek is capable of supporting fish populations. However, significant fish passage problems exist, such as road culverts and the stream diversion structure/fish ladder. The delta of sediment from upstream sources that has formed in the mouth of Blackwood Creek is suspected to have become an obstacle to fish passage. Geomorphic changes in the lower portion of the creek restrict fish passage during low flow periods. Due to dewatering, a ½ mile section of the stream above the diversion is unavailable to spawning rainbow and brown trout. This diversion results from a rerouting of the stream to facilitate the extraction of gravel from the original streambed. The entire stream was rerouted (diverted) to the south side of the valley to allow mining in the center of the valley. The dewatering is a result of seepage into the streambed. There is a strong possibility that the seepage into the streambed was increased by the gravel mining activities and the stream alterations associated with gravel mining. The stream alterations involved bulldozing and straightening of the channel (possibly constructing a new channel?) above the point at which the stream was diverted around the gravel mining area. The use of the term “dewatering” in this report is meant the lack of surface flow in the stream as opposed to someone actively removing the water by pumping or diverting. In addition another problem is the drying of the stream channel in certain reaches in high channel erosion areas below Barker Pass Road, largely due to geomorphic changes. The primary problem upstream of the diversion is the lack of fish passage at the ladder (the upstream point of the old diversion). Levels of fines (anything smaller in diameter than coarse sand) observed in 1996 in areas of the creek bottom were judged to be less than that observed in 1990 when the entire streambed was heavily embedded in coarse sand. Proportions of runs, riffles, and pools are not ideal but sufficient to support life histories of the variety of fish species.

Tetra Tech Blackwood Creek Sediment TMDL Report 2-1 03/27/01
SECTION 2 PROBLEM STATEMENT
Blackwood Creek is listed under Section 303(d) of the Clean Water Act as impaired due to sediment. Water quality standards (WQS) adopted for Blackwood Creek are contained in the Water Quality Control Plan for the Lahontan Region (the Basin Plan, LRWQCB, 1998). The WQS for Blackwood Creek are comprised of the beneficial uses of water and the water quality objectives designed to protect the most sensitive of the beneficial uses. In Blackwood Creek the most sensitive beneficial uses to be addressed in the TMDL include: cold freshwater habitat (COLD); migration of aquatic organisms (MIGR); and spawning, reproduction, and/or early development (SPAWN). These are all existing designated beneficial uses in the basin (Table 1). The water quality objectives to be addressed in this TMDL include sediment and siltation. There are no numeric standards for these parameters.
Table 2-1 Summary of Existing Beneficial Uses Addressed in the Blackwood Creek TMDL
Beneficial Water Uses Description Cold Freshwater Habitat (COLD) Uses of water that support cold water ecosystem including, but not
limited to, preservation or enhancement of aquatic habitat, vegetation, fish, or wildlife, including invertebrates.
Migration of Aquatic Organisms (MIGR)
Uses of water that support habitat necessary for migration or other temporary activities by aquatic organisms, such as anadromous fish.
Spawning, Reproduction, and/or Early Development (SPAWN)
Uses of water that support high quality aquatic habitats suitable for reproduction and early development of fish.
The cold-water fishery and other life cycle related components of migration and spawning are the most impaired beneficial uses in the basin. Fish populations in the basin depend on habitat availability and quality as determined by stream flow, channel form and structure, and physical barriers. These in turn have a significant impact on other essential components of water temperature; water chemistry; food supply; and predation. Blackwood Creek experiences ongoing water quality related problems such as degraded stream habitat due to excessive coarse sediment generated primarily within the unstable stream channel. Watershed degradation has resulted in extreme hydrologic

2. Problem Statement
Tetra Tech Blackwood Creek Sediment TMDL Report 2-2 03/27/01
conditions that contribute to the unstable channel conditions and contribute to the excessive sediment load to the stream. Several previous studies have noted that management and recreation activities in the watershed have accelerated the rate of stream bank failures, degraded riparian habitat conditions, increased number of fish passage barriers, streambed scouring, and increased levels of sediment deposition. The studies that provide documentation of past and present activities and conditions within Blackwood Creek watershed are listed within Appendix A of the report: Blackwood Creek Watershed Restoration and Fisheries Habitat Improvement Plan Project Feasibility Study. The project library, which includes all the listed documents, is on file with the Lake Tahoe Basin Management Unit.
In addition to impairment within Blackwood Creek itself, nutrient and sediment loads originating from Blackwood Creek may contribute to impairment within Lake Tahoe. Both fine sediment loading and the promotion of algal growth by nutrient loading contribute to reduced water clarity in Lake Tahoe and associated reduction in support of designated uses. The Blackwood Creek basin is believed to be one of the largest contributors of sediment to Lake Tahoe. In part, this is due to the unique geology, topography, and location of the Blackwood Creek basin, which would naturally make it one of the highest sediment producing tributary drainages to Lake Tahoe. However, the nearly one hundred year history of human-induced watershed disturbances in the Blackwood Creek watershed have further increased the load exported to the lake.
Determination of protective goals for sediment loading from Blackwood Creek to Lake Tahoe will require completion of the ongoing Lake Tahoe TMDL. The Lake Tahoe TMDL could potentially result in more stringent sediment allocations for Blackwood Creek than would be required to attain uses within the creek itself, although this is not certain at this time. This document estimates a sediment TMDL for Blackwood Creek based on attainment of instream uses only; however, the associated risks associated with sediment and nutrient export from Blackwood Creek to Lake Tahoe are explicitly included within the problem statement.
2.1 SPECIFIC PROBLEM STATEMENTS The general description provided above has been formulated into four specific problem statements. Each of these problem statements takes the form of a “risk hypothesis” that attempts to describe the complex causal relationships between stressor sources and impacts on beneficial uses.
1) Destabilization and Alteration of Channel Morphology: The destabilization and alteration of the channel morphology has had the most significant influence on the deterioration in the Blackwood Creek fisheries. Historical land use practices (logging, grazing), coupled with existing roads and OHV activity have led to gully formation, an expansion of the channel network, and reduced land cover by vegetation and vegetative litter. These lead to an increase in peak flow in the stream relative to natural conditions. . Logging within the stream corridor directly disturbed banks, reduced vegetation that stabilized banks and created excessive debris that overloaded the stream.. In addition, the historic gravel mining operation

2. Problem Statement
Tetra Tech Blackwood Creek Sediment TMDL Report 2-3 03/27/01
interrupts the natural transport of cobbles and other large material in bedload along the stream axis. Downstream of the mining site, the stream’s power exceeds the sediment load. The increased peak flows and excess stream power below the gravel mine cause incision of the upper reaches of the stream accompanied by bank failure, which increases total suspended sediment load. In the downstream reaches, the changes in flow regime, disturbances in the stream corridor and increased sediment load result in widening and shallowing of the stream, along with infill of pools. Geomorphic instabilities are so severe in some reaches that fish passage is effectively blocked during low flow periods. This results in reduced upstream access for fish, which in turn causes reduced reproductive success.
The geomorphic factors resulting from the destabilization of the system that have contributed to the decline in fisheries include:
(a) Rapidly shifting thalweg (center line of stream) due to both bank erosion and reworking of wide, unconfined bed material deposits (the morphology has changed from a relatively stable single thread channel to a more braided nature where the channel(s) shift rapidly across the wide erosion zone),
(b) Unstable vertical profile that does not promote creation of stable riffle/pool sequences,
(c) Abundance of reworked cobble and gravel lacking any sand and fines to seal the bed and prevent infiltration of low flows,
(d) Increased sediment loading from bank erosion and headcutting of adjacent tributaries,
(e) Potential for reduction in late summer and fall baseflows due to lowered channel draining wetlands and meadows more rapidly as well as reduction in area of these water retaining features by continued bank erosion, and
(f) Loss of shading and cover due to removal of bank vegetation.
These morphological factors have in turn negatively impacted the fisheries in several ways.
(a) Greatly reduced the diversity of riffle/pool habitat and created many areas that are fairly uniform runs ( a and b above),
(b) Highly mobile and shifting bed as well as many reaches of the channel that completely dry up do not promote growth of benthic community and consequently reduces the food source for the fisheries (a, b, c, and e above),
(c) Lack of late summer and fall flows greatly reduce rearing habitat and strand fish in isolated reaches that may eventually dry up or are not sufficient for survival (c and e above),

2. Problem Statement
Tetra Tech Blackwood Creek Sediment TMDL Report 2-4 03/27/01
(d) Lack of shade reduces thermal regulation and may result in high water temperatures above optimal ranges (f above),
(e) Movement of fish is hampered by lack of flow and lack of resting areas (a, b, c and e above), and
(f) Spawning success is reduced by high sediment loads and mobile nature of bed material (a, b, and d above).
2) Structural blockages associated with culverts and the fouled fish ladder: Impact on Fisheries Due to Man-Made Structures. Man-made structures have impacted fisheries beyond the contribution that these structures have had in destabilizing the channel morphology. The man-made structures or mechanical manipulation of the channel that have impacted the fisheries include:
(a) Gravel mining resulting in a discontinuity in grade,
(b) Gravel mining resulting in additional infiltration of low flows in the gravel mined area,
(c) Construction of Barker Pass Road culverts, and
(d) Channelization of Blackwood Creek above the gravel mining area.
The human activities have directly impacted the fisheries by:
(a) Created barriers to fish movement and migration (a and c above upstream direction and b above both upstream and downstream),
(b) Lack of late summer and fall flows greatly reduce rearing habitat and strand fish in isolated reaches that may eventually dry up or are not sufficient for survival (b above).
3) Excess Fine Sediment Load in Blackwood Creek: Historical land use practices (logging, grazing), coupled with existing roads and OHV activity have led to gully formation and an expansion of the channel network. These conditions promote gully erosion, and have a self-reinforcing effect as vegetation and ephemeral channels are destabilized and the network further expands. This leads to elevated sediment loading from the watershed to the stream, particularly loading of finer sediment. The increased fine sediment load leads to infill of spawning gravels and contributes to the filling of refuge pools. The result is reduced spawning and rearing habitat, and consequent reduction in spawning success.
4) Lake Loadings: Blackwood Creek is one of the largest contributors of sediment to Lake Tahoe. Because of the extreme changes in watershed hydrology and stream
2. Problem Statement
Tetra Tech Blackwood Creek Sediment TMDL Report 2-5 03/27/01
channel modifications that have resulted in altered stream morphology, the sediment budget for the watershed is out of equilibrium. The former gravel mine and other constrictive stream sections inhibit transport of bed load coarse sediments and cobbles allowing some fines to pass. The sediment deficit after the gravel mine causes the stream to pick up more fine sediments through incision and further bank erosion (stream deepening and widening). Additionally uplands contributions of fine suspended sediment from erosion of bare areas, wetlands, roads and gullies as well as tributary head cutting are added to the stream channel contributions. Sediment from these multiple sources is then released into Lake Tahoe and settles at or near the mouth of Blackwood Creek.
Secondary to, but closely tied to sediment contributions, is nutrient loading. Nutrient delivery is generally associated with smaller sediment sizes such as silts and clays. As runoff and erosion increases so does the amount of nutrient rich soil, decomposing vegetation, animal waste, and other organic matter carried along.
Tetra Tech Blackwood Creek Sediment TMDL Report 3-1 03/27/01
SECTION 3 NUMERIC TARGETS: WATER QUALITY INDICATORS AND ENDPOINTS
The numeric target section identifies the specific instream and hillslope goals or endpoints for the TMDL, which equate to attainment of the designated uses. For many TMDLs where applicable standards are expressed in numeric terms it is appropriate to set the numeric target equal to the numeric water quality standard. This simple approach is not available for a sediment TMDL, as there are no numeric water quality standards applicable. Instead, the TMDL is based on attaining narrative standards. As set forth in USEPA Region 9 guidance, it is then appropriate to develop a quantitiative interpretation of the narrative standards. Since TMDLs are an inherently quantitative analysis, it is necessary to determine appropriate quantitative indicators of the water quality problem. To complete a sediment TMDL it is also often necessary to supplement instream indicators and targets with hillslope targets, which are measures of conditions within the watershed that are associated with the waterbody meeting water quality standards and supporting uses.
3.1 CONCEPTUAL MODEL To develop appropriate numeric targets, it is first appropriate to consider the specific problem statements or risk hypotheses set forth in Section 1.2. These specific problem statements have been summarized in simplified schematic form in the conceptual model illustrated in Figure 3.1, Blackwood Creek Fisheries Conceptual Model. The conceptual model, typically displayed as a flow chart, aggregates risk hypotheses to display the linkages from stressors to assessment endpoints, and assists in the identification of measurement endpoints which can serve as indicators along specific pathways in the flow chart.

3. Numeric Targets
Tetra Tech Blackwood Creek Sediment TMDL Report 3-2 03/27/01
The conceptual model presented here summarizes the problems associated with fisheries in Blackwood Creek. The stressor sources are presented at the top of the diagram, while assessment endpoints associated with the uses are presented at the bottom. It is important to note that the stressors and processes identified in the diagram are not occurring equally or simultaneously in all Blackwood Creek stream reaches.
The model also separates the hydrologic stressors from the sediment stressors when in reality they are closely linked. The increased runoff volume and concentration provides the energy to dislodge sediment, deliver it to the stream channel, and to destabilize the stream channel leading to additional sediment inputs. It is possible that early disturbances in the watershed transported larger volumes of sediment from the uplands than is currently being delivered today. The decline in sediment delivery from the uplands would result from soil depletion. The highest source of excess sediment in the channel today is likely from eroding streambanks and the transport of sediment from aggraded areas upstream. While the degraded uplands continues to contribute to the severe hydrologic regime it is the containment of these high-energy flows within incised channels that results in channel instabilities. The overall sediment budget disequilibria continues to have dramatic impacts on aquatic habitat and stream biota.
As discussed in Section 1.2, potential problems associated with loading to Lake Tahoe are acknowledged throughout this document, but are not used as the primary basis for the sediment TMDL within Blackwood Creek. Therefore, no conceptual model was developed for sediment / nutrient loading to Lake Tahoe. However, a conceptual model for lake loading will have a high degree of similarity with the fish model, emphasizing that efforts to attain instream uses will also provide benefits to reducing loads to the lake.

3. Numeric Targets
Tetra Tech Blackwood Creek Sediment TMDL Report 3-3 03/27/01
Figure 3-1 Blackwood Creek Fisheries Conceptual Model

3. Numeric Targets
Tetra Tech Blackwood Creek Sediment TMDL Report 3-4 03/27/01
3.2 ENDPOINT SELECTION PROCESS Water quality endpoints and indicators were identified using the conceptual model to evaluate significant linkages and processes in the Blackwood Creek watershed. Because it is difficult to quantify the linkages and processes affecting beneficial uses in Blackwood Creek several endpoints and indicators have been selected. The proposed “network” of endpoints and indicators provide lines of evidence to interpret the impact of management actions on improving water quality in Blackwood Creek. Several of the endpoints provide specific numeric targets while others recommend general trends. The proposed endpoints and indicators address both hydrologic change and sediment delivery processes. The endpoints also address various components of the Blackwood Creek watershed including: uplands, riparian, stream channel, and the aquatic biological community. The numeric targets and indicators will require a significant monitoring program. Monitoring recommendations are discussed in Section 7 of this report.
Chronic instability of channel morphology is the dominant impact to designated uses in Blackwood Creek. Increased peak flows due to grazing, logging and road network; direct disturbances in the riparian corridor by logging; and the in-stream gravel mining operation are the management related triggers that initiated the channel instability. These initial instabilities generate additional localized sediment supply from bank erosion causing depositional features to force flows into adjacent banks – leading to further instability. Thus the dominant processes in this sediment TMDL assessment relate to channel morphology rather than fine sediment inputs from upslope sources- although fine sediment loading from upslope is an important secondary process for lake loading.
A source area approach was adopted for organizing this analysis and the three source areas are: hillslope, floodplain/riparian, and channel. The mechanisms contributing to the impairment in each source area were divided into two categories: hydrology and sediment. Hydrology refers to alterations in peak and base flows and sediment refers to processes related to increased loading of coarse and fine sediments and alteration of sediment transport regimes.
Two types of numeric indicators are proposed for the TMDL: linkage indicators and trend indicators. The linkage indicators are assigned numeric target values that relate directly to the causes of impairment (e.g. bank erosion rates), while the trend indicators establish a trajectory by which to evaluate recovery of elements associated with recovery of functional processes (e.g., increased occurrence of overbank flooding within specific reaches).
Additional data collection or further analysis of existing data is required to develop numeric targets for many of the indicators. It is beyond the scope of this project to actually develop many of the numeric targets called for in this section. We have presented a large list of potential numeric indicators and outlined the analyses required to establish the actual numeric targets. The Regional Board can decide which indicators to develop based on an evaluation of the utility of each proposed indicator and the estimated effort required to develop each target.
The proposed indicators and numeric targets are summarized in Table 3-1 below.

3. Numeric Targets
Tetra Tech Blackwood Creek Sediment TMDL Report 3-5
03/27/01
Table 3-1 Numeric Indicators of Hydrologic and Sediment Impairment for Three Source Areas in Blackwood Creek

3. Numeric Targets
Tetra Tech Blackwood Creek Sediment TMDL Report 3-6 03/27/01
3.3 LINKAGE INDICATORS AND NUMERIC TARGETS 1. SCS Curve Number. The primary source area for increased peak flows is the hillslopes,
which have decreased soil and vegetation cover and increased road and gully density compared to reference conditions. A simple numeric indicator for the hydrology mechanism in the hillslope source area is the SCS curve number. The SCS Curve number is a numeric index which combines numerous factors related to runoff processes such as vegetation condition, soil condition and routing of flows to the channel (Table 2.1). The numeric target is to return the hillslope areas to a condition so the SCS Curve number is closer to reference conditions, i.e. increased vegetation coverage, increased soil storage capacity, and decreased road density. Identifying reference conditions would be a significant challenge in applying the SCS curve indicator.
A relatively simple analysis of current vegetation cover, road density and soil types would be required to develop SCS Curve numbers representing current conditions on a subwatershed scale throughout the Blackwood Creek basin. The process can be partially automated using a GIS. An analysis of historic conditions would be required to develop SCS Curve numbers representing historic or reference conditions for the watershed. Development of current and historic SCS Curve number’s is somewhat qualitative and includes a degree of Best Professional Judgement (BPJ). Since many of the changes pre-date data that could be used to develop historic curve numbers, another approach may be to locate a reference watershed in the area. No matter which approach is adopted, BPJ will be required.
The aggregate SCS Curve Number of sub-basin areas is included for consideration as an indicator because it provides a relatively simple summary index of the propensity of an area to produce concentrated overland flow. The Curve Number approach has a long history, relates to observable parameters, and can be implemented (to a large extent) in a GIS.
The proposed target associated with this indicator is to return Curve Numbers to an approximation of natural undisturbed condition.
The Curve Number does not take into account routing of flows to the channel. The Curve Number can, however, be used to estimate peak flow (accounting for routing) through use of the SCS Unit Hydrograph method.
The intended purpose of this indicator is to get at peak flow generation processes and identify areas where peak flows are significantly elevated relative to natural conditions. As a quantitative indicator, this could be better formulated in terms of peak flow response. Peak flow unit response using the SCS Unit Hydrograph is given by
qp = A/(480 + tp)
where qp is the peak unit response (m3/sec/mm-excess precipitation), and tp is peak time (hours), which is assumed to be equivalent to 1.833 times the lagtime, tl.
Lagtime (hours) is in turn calculated from

3. Numeric Targets
Tetra Tech Blackwood Creek Sediment TMDL Report 3-7 03/27/01
tl = LF x tl’
where LF is the lag factor and tl’ is the uncorrected lagtime.
The lag factor is a function of Curve Number (CN) and percent impervious cover (PRCT):
LF = 1 – PRCT (-0.006789 + 0.000335 CN – 0.0000004298 CN2 – 0.00000002185 CN3)
The uncorrected lagtime is:
tl’ = 1/7053 x L0.8 (S + 25.4)0.7 / (SI)0.5
where L is the length of overland flow (m), SI is the percent slope of the watershed, and S (mm) is the storage factor, also a function of CN:
S = 25,400/CN – 254
Finally, the precipitation excess, Q, in response to precipitation of volume P, is also a function of the storage factor:
Q = (P – 0.2 S)0.5 / (P + 0.8 S) if P > 0.2 S.
Combining these equations, the hydrograph peak is estimated as a function of the CN, impervious cover, and two topographic parameters (length of overland flow and percent slope).
If imperviousness is low, the key variable distinguishing undisturbed and disturbed condition response is the Curve Number, which is why this variable was suggested as an indicator. It might be more appropriate, however, to estimate and compare peak flow response to a specified design storm. This could also be implemented within a GIS format.
Conceptually, the Curve Number (at given antecedent moisture conditions) depends primarily on the soil hydrologic group, the type of vegetative cover, and the condition of that cover. As a result, measures of condition, type, and extent of vegetative cover are likely to be good indicators for tracking progress toward goals. A quantitative analysis of runoff peaks is, however, recommended to convert this tracking indicator into an indicator that is amenable for prediction of actual hydrologic response and is thus useful for completing the TMDL linkage.
2. Volume of Sediment from Hillslope Source Areas (tons/acre/year). Upland factors contributing to fisheries impairment are a combination of historic land use practices and the presence of existing roads and OHV activity. These influences have lead to reduced vegetative cover and litter, gully formation, and expansion of the channel network. These factors affect flow rates and current velocities as well as volumes of eroded material. Increased flows contribute to stream incision in upper reaches while increased velocities create greater shear stresses on stream banks, increasing sediment load. In lower reaches the

3. Numeric Targets
Tetra Tech Blackwood Creek Sediment TMDL Report 3-8 03/27/01
stream channel widens creating more shallow flow and contributing to infill of pools. These factors inhibit fish movement, reducing reproductive success.
Assessment and treatment of hillslope sediment sources will decrease fine sediment loading to Lake Tahoe and more importantly for Blackwood Creek, treatment (revegetation, improved road drainage, decommissioning roads and OHV trails, etc.) is likely to reduce peak flows in the watershed. The numeric target would be to reduce hillslope fine sediment inputs to near natural background rates of erosion for the watershed.
Development of the numeric indicator for hillslope fine sediment contributions in mass per unit time requires completion of a hillslope sediment source analysis. Completion of the hillslope sediment source analysis would fill in the last piece of missing data required for a complete sediment budget in Blackwood, since there is already sufficient channel data. A hillslope sediment source analysis with enough detail to prescribe treatments is a quantitative and field intensive exercise and would likely cost $70,000 to $100,000 to complete. It should be validated based on a sediment budget for the watershed and comparison with the measured sediment loads at the USGS station near the watershed mouth.
3. Channel Stability. This set of three indicators has the most direct linkage to in channel conditions affecting the designated uses, and may be the most important measure of recovery. The most likely indicators for assessing channel stability include: lateral bank erosion rates, bed elevation trends, and sum of linear distance of un-vegetated banks. Further data analysis will be required to develop these indicators, however no additional data collection would be required.
3.1. Lateral Bank Erosion Rates. There is sufficient data to quantify historic lateral bank erosion rates for many of the reaches in the watershed and it is straight forward and highly quantitative to re-measure cross sections in the future. This bank erosion data could be summarized for each sampling station and placed into categories of erosion severity. For example banks with erosion rates in excess of 10 inches per year may be labeled “extreme”; 6-10 inches/year “high”, 3-6 inches/year “moderate”, <3 inches/year “low” and no measured erosion would be “stable”. Once the distribution of erosion rates is known, a trend indicator could be used with the goal of reducing the quantity of banks in the ‘extreme’ and ‘high’ erosion categories each time bank erosion is re-measured (likely on a 5 year schedule). Additionally, it is not just an overloading problem, even if the stream could transport all the sediment generated, this might not be good. Say the stream was straightened (increased gradient), channel narrowed and deepened to increase shear stress and velocity, the channel might transport all the sediment through, but this would not be the geomorphology that would restore the fisheries, nor would it be consistent with a recovered watershed. An assessment of historic bank erosion rates could be performed utilizing aerial photo analysis. Aerial photos date back to 1939 and have been collected on subsequent intervals of 10 to 15 years. This historic assessment would provide further perspective on current bank erosion conditions and may offer additional insight on defining recovery of the system. Finally, the aerial photo analysis could be used as part of the sediment budget to define the contribution of sediment from bank erosion.

3. Numeric Targets
Tetra Tech Blackwood Creek Sediment TMDL Report 3-9 03/27/01
3.2. Bed Elevation. Raising bed elevations in areas of excessive channel incision is key to re-connecting the channel with the floodplain during smaller return interval events, which will decrease bank erosion. It is possible to establish numeric targets for what bed elevation would be required in each reach in order to re-establish overbank flooding. In conjunction with bed elevation changes, a reduction in channel width in the over-widened reaches would also be necessary to re-establish frequent overbank flooding. Further HEC-RAS modeling would be required to establish these numeric targets. The modeling would require additional cross sections in some reaches as well as office work to construct the revised HEC-RAS model with improved spatial resolution. The combined effort would be expected to run about $20,000.
HEC-RAS modeling predicts water surface profiles in response to flow events of specified magnitude. The predicted water surface elevations depend on the channel cross section and downstream backwater effects. A HEC-RAS model can be used to infer the flow volume necessary to cause overbank flooding, which can in turn be related to the flow recurrence interval. Thus, HEC-RAS can be used to determine what channel cross section (and thus what increase in bed elevation) is consistent with attaining bank full conditions at a flow of a specified recurrence, such as a once-in-two-year recurrence flow.
The HEC-RAS model was applied in the restoration feasibility study to provide information on the hydraulic conditions present in specific reaches. These conditions included velocity, depth, topwidth, shear stress, water surface elevation, and percentage of discharge in the main channel and the overbanks. This information was developed for a range of flows from less than the 1.5-year up to the 100-year peak. The basic data needed for the HEC-RAS model, cross sections, distance between cross sections and Manning’s n-value were gathered during the field survey. The approach take for gathering the geometric information was to concentrate on shorter subreaches within each reach where cross section density would be high and the model results used to characterize the reach. Between these more detailed subreaches, more sparsely surveyed cross sections were included to allow a continuous model, but with the realization that the resolution and accuracy were highest in the detailed subreach survey areas.
For the future, it was envisioned, that as the stream recovered, the new cross section surveys (from the monitoring program) could be input to the HEC-RAS model. The model would then reveal that floodplain connectivity was improving (Lower percentage of flow in the main channel and higher percentage flow in the overbanks) and that hydraulic forces were being decreased at the larger flows (lower shear stress, lower velocity). Blackwood Creek may have re-established a flood plain at a new lower base level that has adequate width in the most severely eroded areas, but this is not the case for all the unstable reaches. The HEC-RAS model could be used to help in determining what a sufficiently wide floodplain was.
3.3 Sum of Linear Distance of un-vegetated streambanks. This is a more qualitative measure of streambank stability than the lateral distance of erosion. That is because not all un-vegetated banks erode at the same rate and some are actually stable. However, it

3. Numeric Targets
Tetra Tech Blackwood Creek Sediment TMDL Report 3-10 03/27/01
may be a better indicator of long term recovery since the establishment of vegetation on the banks will enhance stability against future flows. On the other hand, the lack of lateral erosion over a period may be the result of lack of significant flows over that period. Thus, it may be useful to combine lateral bank erosion rates with a vegetation index into one indicator. The vegetated streambank component of this indicator could be determined using either pedestrian surveys or analysis of aerial photos.
4. Restoration of Channel Gradient through the Gravel Mine. A significant risk to fisheries in Blackwood Creek is the historic gravel mining operation that interrupts the natural transport of gravels and cobbles and other large material along the stream axis. Downstream of the mining site, the stream’s power exceeds the sediment load. As a result, the stream is incising and widening below the mining site, generating an increased suspended sediment load and causing progressive head-cutting of tributaries, which also increases load. In the downstream reaches these factors result in widening and shallowing of the stream, along with infill of pools. This results in reduced upstream access for fish, which in turn causes reduced reproductive success. Recovery of this area has been initiated both by natural processes and projects undertaken by the Forest Service. Upstream sediments have filled much of the old gravel pit and deposition of coarse material below the fish ladder, the upper end of the historic gravel pit, have restored approximately 50 percent of the original elevation at this point.
The most direct indicator of the recovery of this area would be surveying the gradient to determine if it had returned to the estimated historic profile. However, re-establishment of sediment continuity through this reach will also require that the cross section have the proper geometry to transport coarse bed load. A wide and shallow channel will still act as a sediment trap where-as a narrower and deeper channel will have the competence to transport gravels and cobbles. Thus, a cross-sectional geometry indicator could also be established based on sediment transport analysis. In performing the development of this indicator, it needs to be recognized that the area has served historically, before gravel mining, as a partial sediment trap. This is due to the natural break in gradient and the widening of the valley at this point compared with the upstream reaches. However, in the current configuration, the area is a deposition zone for all gravel and cobble sized sediments.
An alternative indicator of recovery in this reach would be the size of sediment passing through the reach. This would be a direct functional assessment of the level of recovery of the stream’s bed load transport capacity. Unfortunately, measurement of bed load would need to be performed at high flows and safely and accurately doing this would require a bridge or cableway. An alternative would be to monitor sediment sizes in depositional features, such as bars, near the downstream end of the reach. This would provide a less direct indicator of the size of bed load transported, but a much more practical field measurement to perform.
It should also be noted, that re-establishment of sediment continuity through the gravel mining area is necessary to provide the supply of sediment to re-fill many of the former meadow areas below Barker Pass road where the channel has widened and incised. Thus,
3. Numeric Targets
Tetra Tech Blackwood Creek Sediment TMDL Report 3-11 03/27/01
assessment of the recovery of the gravel mining area is important not just for the localized reach, but also for the rest of the stream system downstream of this disturbance.
5. Barriers to Fish Migration. The second highest direct risk to fish after the gravel pit is the presence of structural blockages that limit upstream fish access. These blockages include road culverts and the fouled fish ladder and can be easily quantified. The culverts and fouled fish ladder are easy to identify barriers, however the presence of dry reaches during baseflow periods are not as predictable in their occurrence and location. Additional data collection and/or ongoing monitoring would be required to track the location and extent of dry reach barriers. The numeric target for this indicator is 0 barriers to migration present in the watershed.
3.4 TREND INDICATORS 1. Decrease in Ratio of Annual Water Yield to Annual Precipitation. This metric
addresses the issue of increased peak flows, which are a root cause of channel instability, which in turn affect the fisheries designated uses. Direct measurement of peak flows in relation to precipitation events is complicated by antecedent conditions, snowpack effects on runoff and other factors. Over the long term a trend of decreasing annual water yield in proportion to annual precipitation will indicate a recovery of hydrologic function in the watershed. Continued collection and analysis of USGS gage data and precipitation data in the watershed will be sufficient to detect this trend. This indicator can also be quantitatively predicted to some extent through use of the SCS curve number analysis.
Other possible indicators of hydrologic recovery would be a reduction in the flashiness of the runoff response and increase in base flows. The flashiness could be indicated by such parameters as the time to respond to precipitation (time of concentration or travel) or a reduction in the diurnal fluctuation of snowmelt runoff. The utility of these metrics is based on the hypothesis that as the watershed recoveries, it will respond more slowly to given hydrologic inputs. The base flow could be measured directly by stream gages. Additional gaging stations might be installed to provide better spatial resolution. Base flows are expected to increase as the watershed recovers as more water is stored during runoff for slow release back in the system after the passing of the hydrologic events.
2. Decrease in Width to Depth Ratio of Channel. This trend would indicate that the channel is becoming primarily narrower.. A narrower channel will improve fish habitat, help to decrease stream temperatures and indicate a return to more stable channel morphology. As the channel narrows, the depth of flow at a given discharge will increase. However, the maximum depth of the channel may decrease as the incision in some reaches is reversed. It must be kept in mind that the existing channel may contain the 50- to 100-year event within its banks, where-as the channel undergoing recovery may only contain a 2-year to 5-year event. This metric can be readily calculated after each set of channel monitoring measurements are recorded and the HEC-RAS hydraulic model is updated (see indicator 3).
3. Increasing Ratio of Pools and Riffles to Runs. These indicators of habitat structure relate directly the fisheries designated uses. An optimum proportion of pools, riffles and runs has not been determined for Blackwood Creek. However, data from Tetra Tech (1999)
3. Numeric Targets
Tetra Tech Blackwood Creek Sediment TMDL Report 3-12 03/27/01
indicates that runs dominate the habitat types in Blackwood and this is not an ideal condition for fish species. The Tetra Tech report presents USFS fish habitat survey data from 1990 indicates that pool habitat constituted less than 10% of the available habitat in the lower reaches of Blackwood Creek. In general, pool enhancement projects are considered when primary pools comprise less than 40 percent of the length of total stream habitat.” (Referenced: Flosi, G., Downe, S., Hopelain, J., Bird, M., Coey, R., and Collins, B., 1998. California Salmonid Stream Habitat Restoration Manual, Third Edition, California Department of Fish and Game.)
The TMDL allocation / implementation measures should not include in stream habitat restoration activities, such as the creation of pools, because of the instability of the streambed. However, as channel instability is reduced, some of the pools, which have been filled in by sediments, should begin to reform. A possible BPJ goal of 20% pool habitat as a function of stream length could be supported by the literature. This could also be a trend target or developed from reference streams within the region, or historical fishery habitat survey data.
Another reference of note is “Many salmonids prefer to spawn in the transitional area between pools and riffles (Hazzard 1932; Hobbs 1937; Smith 1941; Briggs 1953; Stuart 1953 – as presented in Bjornn, T. C., and Reiser D. W., 1991. Habitat Requirements. American Fisheries Society Special Publication 19: 83-138.”
4. Increase Proportion of Benthic Macroinvertebrates That are Adapted to Stable Bed Morphologies. The diversity and composition of the benthic macroinvertebrate community provides an index of overall stream health. Within Blackwood Creek it is likely that the biological community will increase in abundance and diversity as physical conditions within the stream channel recover, i.e. more stable bed morphology, increased abundance of pools and riffles, decreased sediment transport, increased riparian shade, etc. Using macroinvertebrates as a numeric target serves as a linkage between in-channel stressors and recovery of designated uses, because: 1) the composition of the invertebrate population is an indicator of the condition of physical processes and, 2) populations of invertebrates are an indicator of habitat quality for fish species, as they are a key food source.
Standard protocols for macroinvertebrate sampling have been developed by the California Department of Fish and Game and are known as The California Stream Bioassessment Procedures (CSBP). Generally macroinvertebrate sampling would be conducted in year 1 to establish baseline data and then re-collected every 5 or so years after that to monitor trends. There are multiple methods of data analysis and interpretation for macroinvertebrate data. There is currently a statewide effort to develop regional criteria for stream health based on macroinvertebrate data. This has not been completed yet, however there are some agreed upon indicators to use in the meantime.
The EPT index is commonly used to track the trend of stream recovery. Increasing numbers of families or genus’ represented within each order (Ephemeroptera, Plecoptera, or Tricoptera) indicate improving stream health. More precise indices are likely to be in place

3. Numeric Targets
Tetra Tech Blackwood Creek Sediment TMDL Report 3-13 03/27/01
by the time the second round of sampling is completed on Blackwood Creek, in 5 or so years. Each round of sampling and data analysis is likely to cost $5-10k.

Tetra Tech Blackwood Creek Sediment TMDL Report 4-1 03/27/01
SECTION 4 SOURCE ANALYSIS
The objective of the source analysis is to identify the sources or causes of problems in Blackwood Creek. Because the source analysis provides the key basis for determining the levels of stressor reductions needed to meet water quality standards, quantified source analyses are necessary. In a standard TMDL, the source analysis would provide estimates of the amounts of pollutants entering the receiving water of concern, categorized by source area. This simple approach is not appropriate for the Blackwood Creek sediment TMDL. As noted in the Problem Statement and repeated in the Conceptual Model, the major sources of excess sediment and altered morphology in Blackwood Creek are believed to be channel instability and channel alteration. Upland sediment yield plays a relatively smaller role in the impairment of Blackwood Creek, and it is the influence of upland land condition on peak flows that is the most significant external stressor to the system.
Given the complex nature of the processes that have led to impairment in Blackwood Creek, the source analysis is not a simple tabulation of loads, but rather a summary of instream processes coupled with an analysis of upland peak flows and sediment loads. At this stage, only the instream analysis has been completed. While there is qualitative knowledge regarding upland processes and their contribution to impairment (summarized in the Problem Statements and Conceptual Model), additional work would be required to complete a quantitative upland source analysis sufficient to quantify peak runoff and sediment loading rates from specific upland contributing areas. For instance, a watershed model could be constructed to estimate upland runoff and sediment yield on a subwatershed scale. However, a full upland water and sediment budget would be of limited value for the TMDL because the impairment is primarily controlled by instream processes and establishing an absolute, quantitative target for upland loads does not appear to be feasible given the current state of knowledge.
Based on these considerations, we recommend that it is most appropriate to conduct the upstream source analysis on a relative, rather than absolute basis. That is, it is most appropriate to evaluate upstream sources in terms of the relative degree to which they exceed natural or reference conditions. This reflects the fact that loading present under natural conditions represents the best/most appropriate condition available to the stream, given the unique topography and geology of the Blackwood Creek basin.

4. Source Analysis
Tetra Tech Blackwood Creek Sediment TMDL Report 4-2 03/27/01
4.1 INSTREAM SOURCE ANALYSIS The instream source analysis consists of the evaluation of bank stability, incipient bed motion, and morphological anomalies in the Blackwood Creek mainstem. The instream source analysis is thus equivalent to the “Stream Corridor Conditions” discussion presented at length in the Blackwood Creek Watershed Restoration and Fisheries Habitat Improvement Plan Project Feasibility Study (Tetra Tech, 1999). This material is incorporated by reference into this document, and is not repeated here.
4.2 UPLAND SOURCE ANALYSIS As noted above, the upland source analysis should be undertaken in relative terms. The two key factors to be evaluated are peak flow and sediment yield. As discussed in Section 3.3, these two factors can be evaluated using two indicators: SCS Curve Number and sediment yield, both of which can be compared to pre-disturbance conditions.
The analysis to evaluate these indicators has not yet been undertaken, so the upland source analysis cannot be completed at this time in quantitative terms. It is, however, possible to provide a qualitative discussion of the sources of increased upland flow and sediment yield. These sources primarily represent the ongoing, existing impact of historical land uses in the watershed.
Over 100 years of land use practices in Blackwood Canyon have contributed significantly to increased peak flows, erosion problems, sediment runoff, and destruction of riparian vegetation and instream habitat. The effects of grazing, logging, gravel mining, and recreational pursuits have been particularly deleterious in the canyon due to Blackwood’s steep topography, minimal topsoil, and easily erodible rock types. Damages wrought by human activities and natural events is slow to recover due to these same conditions. The location and extent of a portion of these human uses are illustrated in Figure 4.1. Many of the activities have been summarized in the attached timeline (Figure 4.2 Blackwood Creek Watershed Timeline). The vegetation changes, stream channel incision, gully formation, and other consequences are aggravated by the inability of the watershed to absorb the forces from periodic high water flows, resulting in further damage. With the ability of the watershed to recover hindered, conditions tend to persist for longer periods of time.
The USFS Lake Tahoe Basin Management Unit is currently evaluating upland conditions. The results of this analysis can be used to better determine what portions of disturbance from the upland source areas are “treatable.” It is likely that little of the sediment in the stream channel or delivered to Lake Tahoe (through suspended sediment) is derived from the upland areas of the watershed. However, the uplands could be making a significant contribution to second component of the stressor (hydrology) that contributes to channel disequilibria. However, the treatable analysis should be useful in guiding allocations for the TMDL. If the uplands has suffered a permanent loss of a natural elements it makes it an unlikely candidate for an allocation.

4. Source Analysis
Tetra Tech Blackwood Creek Sediment TMDL Report 4-3 03/27/01
Figure 4-1 Location and Extent of Human Uses: Documented Timber Harvests and Gravel Mining Operations

4. Source Analysis
Tetra Tech Blackwood Creek Sediment TMDL Report 4-4 03/27/01
Figure 4-2 Blackwood Creek Watershed Timeline 1865 Sheep grazing begins by Hampton Craig Blackwood 1889-1905 Logging clearcut of eastern 1.5 mile of drainage. 1905 Charles H. Shinn notes overstocked conditions in “Report on the Proposed Addition to the Lake
Tahoe Forest Preserve, California,” which covered the area including Blackwood Canyon. 1926 Cattle grazing allotments are discontinued and sheep months reduced due to conditions of
overgrazing 1930s Cutthroat trout disappears throughout the Lake Tahoe Basin. 1939 Aerial photos taken. 1944 USFS range report expresses concern over general condition of land in Blackwood Canyon,
overgrazing, and scarcity of forage. Gullies had begun to form and meadows were diminishing under incursion of lodgepoles and willows. At this time, land along the creek is in private ownership.
1953 Logging of two 40 acre parcels along lower reaches of slope north of Blackwood Creek and within 1.5 miles of Lake Tahoe.
1956 Sawmill constructed. Upper reaches of south side of Stanford Rock Mountain are roaded extensively to log about 160 acres.
1956 CDFG sponsored a fishery improvement project in Sunken Meadows locate in southwest part of Blackwood Creek watershed. Notched logs, 6-10” in diameter, were placed along the length of the small stream to create pools for resident trout and increase carrying capacity.
1957 USFS range report notes that timber was closing out much of the meadow area. Area northeast of Barker Peak heavily eroded.
1959 USFS range report recommends closing Blackwood allotment to grazing to prevent further watershed damage. Notes poor available feed, heavy use in meadows and valley bottoms.
1959-60 Logging of 1.5 square miles along main channel of Blackwood Creek by Denny Brothers Logging Company.
1959-62 Logging of three square mile stretch near main creek channel. 1960 Permitting and construction of a gravel extraction and rock crushing operation on site of a large
meadow. Dike constructed to divert Blackwood Creek around the site. 1960-70 USFS acquires most of the private land in Blackwood Canyon. 1962 Last year of grazing activity in Blackwood Canyon. 1962-65 Roading of area along North Fork of Blackwood Creek and 650 acres logged. 1963 USFS acquires land in Blackwood Canyon encompassing the gravel quarry site (gravel extraction
rights and permits retained by Teichert and Sons). 1964 Devastating rain-on-snow storm event that caused widespread and very damaging floods. Peak of
flood was 2100 cubic feet per second at mouth of BC. High waters breached diversion dike, distributed logging debris, caused bank scour, weakened stream banks, and undermined trees along the bank. Lost meander, creek course change noted by residents.
1965 Concern expressed over gravel extraction operations impact on water quality. 1965 Aerial photos taken. 1966 Tahoe Regional Planning Agency established.

4. Source Analysis
Tetra Tech Blackwood Creek Sediment TMDL Report 4-5 03/27/01
1968 Teichert & Sons signs a quitclaim deed eliminating further mining of the creek bed. 1968 CDFG directs removal of fish passage barriers such as woody debris and beaver dams in an
attempt to re-open parts of Blackwood to spawning and migration of lake run rainbow and brown trout.
1969 Major violation of logging permit by private contractor leads to cessation of large scale logging activity by 1971. Tahoe Regional Planning Agency has authority to oversee logging activity.
1971 Forest Service, recognizing the deterioration of the Blackwood Creek watershed conducted a study to evaluate the condition of the watershed, identify causes of sedimentation problems and recommend actions for reducing sediment movement in the watershed (Suhr, 1971). As a result of the study, funds were requested for FY1973 to begin work on the watershed improvements. However, the process of implementing the improvements was lengthier than anticipated.
1971 summer
Large scale debris removal program of 1.5 miles of channel from gravel pit east towards Lake Tahoe coordinated by the Lake Tahoe Area Council.
1975 Tahoe Research Group sets up seven water quality stations around Lake Tahoe. Blackwood is shown as having worst water quality per area in the Lake Tahoe Basin.
1976 Aerial photos taken 1977 or 78 Anonymous report indicates a shorter channel length by 1600 feet between the confluence with
North Fork and the low water crossing of the Barker Pass Road. Notes channel has steepened from 0.92% to 1.4% in grade.
1978 An environmental analysis report (LTBMU,1978) was prepared for many of the actions recommended in the 1971 Suhr report. Many of the proposed actions centered on restoration of the stream through the gravel quarry area.
1978-79 Rediversion structure completed to redirect Blackwood Creek back into its original channel. Old roads along stream channel between the gravel ponds and Highway 89 closed, ripped, and reseeded. Barker Pass and North Fork Roads waterbarred.
1983 USGS installed a system of cross sections to monitor channel changes in Blackwood Creek. Turned over to the USFS in 1986.
1984 More roads closed. Main road from Highway 89 to stream crossing paved. Trees and shrubs planted in various sections of the watershed including the cut banks of the Barker Pass road near its summit. Small ephemeral tributaries were stabilized by rock lining. Culverts installed where runoff channels intersected system roads. More debris was removed in main channel. One low water crossing and three bottomless arch culverts constructed on jeep trail to Barker Pass. Altogether, nearly $750,000 spent between 1978 and 1984
1986 Tahoe Research Group’s data interpreted as indicating overall improvement in water quality, old skid trails and logging roads continued to revegetate and stabilize, recent fishery habitat improvements had success.
1987 Beginning of very active period of restoration activities. 1994 More restoration activities. 1997 January rain-on-snow event resulted in flood peaks of 2,940 cfs. 1998 Integrated Restoration Plan for Blackwood Canyon initiated.

4. Source Analysis
Tetra Tech Blackwood Creek Sediment TMDL Report 4-6 03/27/01
4.2.1 Grazing The major historic use of range in Blackwood appears to have been for sheep, with cattle only occasionally foraging mainly in the lower reaches along the creek due to their inability to graze the higher, steeper slopes. During the late 1800s sheep were often left on the range until little or no edible vegetation remained. The headwaters of the drainage were considerably affected by overgrazing, particularly south-facing slopes preferred for sheep bedding areas. Overgrazing left highly erodible soils unprotected from storm events. Ground conditions prevented the reestablishment of grasses and allowed water from storm events to quickly concentrate and erode the soils. The effects of overgrazing were noted as early as 1905 in a report covering the area of Blackwood Canyon for addition to a Lake Tahoe Forest Reserve. Grazing permits and allotments were reduced in the late 1920s. A 1944 USFS range report noted scarcity of forage, formation of gullies, and meadows diminished by erosion and incursion of timber growth. Gravel and erosion pavement had also overtaken meadow edges. Range reports in the 1950s continued to describe heavy use and degraded conditions. Closure of the Blackwood allotment to grazing was recommended in 1959 with use continuing but diminishing through 1962. The 39 years since have allowed vegetation cover to improve but any natural recovery will still take hundreds of years. It is also likely that factors such as recreational uses and wind erosion contribute to maintaining the disturbed conditions of gravel and erosion pavement.
4.2.2 Logging Logging probably began in Blackwood in the late 1800s, with records showing that the eastern one and a half miles of the drainage had been logged sometime between 1889 and 1905. Harvesting was by clearcutting, as was the practice at the time, and stands of even aged mixed conifer in the general area of this cut support this assumption. More extensive logging began in the 1950s when most of Blackwood was in private ownership and continued through 1970 under Forest Service management. A sawmill was built in Blackwood Canyon in 1956 and the watershed’s steep slopes were roaded and logged. Most harvesting at this time was by selection cutting. Extensive timber removal also occurred along the three mile stretch of the main channel itself. The roads and skid trails are still visible and show signs of limited vegetation recovery. An egregious violation of logging practices by a private contractor which occurred in 1969 precipitated the end of logging in Blackwood Canyon. Since that time, there has only been some thinning of thick stands of second growth trees. The Forest Service currently allows only small scale collection of timber and vegetation by individual parties as part of vegetation management practices intended to eliminate excess fuel buildup to reduce the risk of forest fire starts and damage.
The past removal of vegetation by logging is believed to have resulted in reduced evapotranspiration and caused increased runoff and bank scour in lower channels following timber harvests. The many miles of poorly located and improperly built roads and skid trails have seriously reduced watershed stability and served as conveyance for elimination of much of the watershed’s topsoil. Roads and trails extended the channel network, intercepted runoff and subsurface flow, and hastened concentration of runoff
4. Source Analysis
Tetra Tech Blackwood Creek Sediment TMDL Report 4-7 03/27/01
during large flow events. Logging debris left to clog stream channels formed debris jams and increased bank scour.
4.2.3 Recreation The Blackwood area is heavily used for recreation. Fishing, hiking, hunting, backpacking, horseback riding, off-highway vehicle travel (OHV), and camping are the major uses, primarily in the summer months. OHV are used for access for these pursuits as well as a recreational pursuit in itself. Many roads and trails receive heavy use by 4-wheel drive vehicles and motorcycles. Blackwood Canyon is an access route to the Pacific Crest Trail. In the winter, cross-country skiing and snowmobiling are popular. The USFS maintains a winter snowpark and semi-primitive campsite in the valley bottom near Highway 89.
The greatest impact on watershed conditions has occurred with the increasing popularity of OHVs (and the roads on which they travel). OHV trails within the basin channelized some hillslope drainages and removed vegetation. Logging roads which were ripped and revegetated have been used and damaged by OHV travel. These conditions increased hillslope erosion and sediment delivery and slowed or prevented the recovery of vegetation. The maze of OHV routes through the riparian zone developed for access to camping sites damaged streambanks and riparian vegetation in many areas.

Tetra Tech Blackwood Creek Sediment TMDL Report 5-1 03/27/01
SECTION 5 LINKAGE ANALYSIS
The TMDL Linkage Analysis is designed to quantify the links between stressors and impairment. The end result of the Linkage Analysis is an estimate of the loading capacity of the waterbody, usually described as the maximum amount of a pollutant that may be delivered to the waterbody while still achieving water quality standards. This simple description is not fully appropriate to the Blackwood Creek sediment TMDL, where instream morphological processes play a greater role than external pollutant loads in causing impairment. As noted in USEPA Region 9 TMDL guidance, “A range of methods can be used from predictive water quality models to inferred linkages based on comparison of local reference conditions with existing conditions in the watershed of concern.” For the Blackwood Creek TMDL, the Linkage Analysis will consist of determining values of the linkage indicators presented in Section 3.3 that are consistent with achieving water quality standards. The loading capacity will therefore be implicitly defined as the suite of channel conditions and upland management that are consistent with mitigating impairment.
The linkage analyses have not been completed at this time. Data needs and proposed approaches for completing the linkage analysis were presented in Section 3.3 and are summarized in Table 5.1, Summary of Proposed Indicator Based Linkage Analysis Approach.

5. Linkage Analysis
Tetra Tech Blackwood Creek Sediment TMDL Report 5-2 03/27/01
Table 5-1 Summary of Proposed Indicator-Based Linkage Analysis Approach
Indicator Linkage Analysis Approach SCS Curve Number Estimate existing and undisturbed Curve Numbers and associated peak flows for
source areas. Reduce elevated CNs to specified ratio of natural condition.
Hillslope Sediment yield Estimate existing and undisturbed sediment yield for source areas. Reduce areas of elevated yield to specified ratio of natural condition.
Lateral Bank Erosion Rates
Evaluate bank erosion rates by reach, establish reduction target for areas with extreme erosion rates.
Bed Elevation Evaluate fraction of reaches with incised beds, use HEC-RAS modeling to establish appropriate stability criteria.
Transport through Gravel Mine
Propose restoration plans designed to re-establish transport of coarse bed load through the gravel mine.
Barriers to Fish Passage Propose restoration/mitigation plans to remove all significant structural blockages to fish migration in the Blackwood Creek mainstem.

Tetra Tech Blackwood Creek Sediment TMDL Report 6-1 03/27/01
SECTION 6 ALLOCATIONS
Because this is a TMDL scoping document, rather than a completed TMDL, final allocations cannot be established at this time. Instead, the process for establishing the allocations is presented.
As described in Section 5, the linkage analysis will be conducted in terms of the ratios of quantifiable indicators relative to natural conditions, rather than through a quantified estimate of loading capacity. In general, the instream channel condition indicators are believed to reflect the greatest constraint on achieving water quality standards. These indicators will therefore receive the primary emphasis in the allocations. Allocations for the uplands will generally reflect a movement from existing conditions toward natural conditions for the watershed, as measured by the selected indicators. If possible, an unimpaired reference site with similar geology should be identified. Comparison to such a reference site would aid in the selection of final target values for the indicators, and thus help determine the implicit allocations.
The allocation methodologies are discussed below in terms of the six linkage indicators.
6.1 SCS CURVE NUMBER / PEAK FLOW The allocation for this indicator can be expressed in terms of meeting a target of a return to within some factor of the pre-disturbance regime for flow. As discussed in Section 3.3, this target could be developed through comparison to a reference site or through BPJ. Allocations to specific source areas could be expressed implicitly as the type or area of specific upland restoration projects (e.g., revegetation and stabilization) needed to attain goals.
6.2 HILLSLOPE SEDIMENT YIELD It is not possible to develop quantitative allocations for hillslope sediment yield at this time because sediment-related impairment is dominated by instream processes and bank stability. But, instream restoration may fail if upland sources are not also controlled. Therefore, a management effort (and implicit allocation) is required to mitigate areas of

6. Allocations
Tetra Tech Blackwood Creek Sediment TMDL Report 6-2 03/27/01
excessive hillslope sediment yield. The allocation could be based on (1) returning to a specified fraction of natural condition, (2) by analogy to a reference site that supports uses, or (3) by specifying a degree of implementation of management measures that is estimated by BPJ to significantly reduce the risk associated with hillslope sediment yield. This allocation should be made within the context of a phased TMDL, in which conditions will be monitored and the initial (implicit) allocation will be revisited based on the monitored progress of the site in re-establishing use support.
6.3 LATERAL BANK EROSION RATES The allocation for bank erosion rates should also be implicit, and will be defined in terms of implementing stabilization and restoration efforts on a specified fraction of reaches that (1) have high lateral bank erosion rates and (2) are feasible for restoration based on analysis of hydraulic conditions. For this reason, the allocation for lateral bank erosion is coupled with the allocation to hillslope peak flows. As with hillslope sediment yield, this allocation should be made within the context of a phased TMDL, in which conditions will be monitored and the initial restoration efforts (and thus the implicit allocation) will be re-evaluated based on the monitored status of the waterbody.
6.4 BED ELEVATION The allocation for restoring bed elevation can be defined in terms of implementing stabilization and restoration efforts on a specified fraction of reaches that (1) have severely incised beds and (2) are feasible for restoration based on analysis of hydraulic conditions. The allocation for bed elevation is also coupled with the allocation to hillslope peak flow rates, and should be implemented within the context of a phased TMDL.
6.5 TRANSPORT THROUGH GRAVEL MINE The allocation for this indicator is defined in terms of management measures: restore natural bedload transport through the grade anomaly. The allocation is implicitly achieved through specification of an implementation plan that restores natural bedload transport through the gravel mining area.
6.6 BARRIERS TO FISH PASSAGE The implementation plan calls for the removal or mitigation of all significant structural barriers to fish passage along the Blackwood Creek mainstem. The allocation is therefore defined as zero significant barriers associated with man-made structures.

Tetra Tech Blackwood Creek Sediment TMDL Report 7-1 03/27/01
SECTION 7 DATA NEEDS AND RECOMMENDATIONS FOR MONITORING EVALUATION PLAN
The approach to developing a TMDL for Blackwood Creek that has been outlined in the preceding sections falls within the concept of a phased TMDL that must be accompanied by continued monitoring to evaluate progress toward attaining water quality standards. The allocations that will result from the TMDL should result in a best estimate of what is needed to restore uses in Blackwood Creek. However, large uncertainties remain, and adaptive management with revision of implementation approaches may be needed to ensure restoration. Such adaptive management can only be effective if detailed monitoring of Blackwood Creek is continued.
There are also deficiencies in current knowledge of the system that need to be rectified to refine or complete the TMDL analyses described in the previous sections. This section discusses data needs and monitoring recommendations to address both the refinement of the TMDL and tracking of progress in restoring Blackwood Creek.
Various data are needed to develop and assess the targets identified in Chapter 4. Additionally, data will also be needed to design and maintain restoration measures as identified by Tetra Tech (1999). Since many of the data needs serve more than one of these functions, recommendations for the entire spectrum of the restoration of Blackwood Creek watershed are presented.
In developing the data needs, attention was given to historic and current data availability. Making recommendations for future data needs that are consistent with current data availability, to the extent practical, allows for incorporation of historic conditions and trends, and possibly identification of baseline conditions. The primary categories of historic data collected for Blackwood Creek include: USGS flow data (1961 to present), USGS suspended sediment data (1975 to present excluding 1979 and 1992), aerial photography at 10 to 20 year intervals (1939 to present) and cross section

7. Data Needs and Recommendations for Monitoring Evaluation Plan
Tetra Tech Blackwood Creek Sediment TMDL Report 7-2 03/27/01
surveys of the stream channel (mid-1980s to present). The USGS gauging station is located 400’ upstream of the Highway 89 bridge.
A database system that incorporates GIS should be implemented so that all information is readily accessible. A large amount of information has already been gathered on the Blackwood Creek watershed. The proposed monitoring effort will expand the volume of information. To efficiently store and utilize this information, it should be organized in a GIS format.
The results of the monitoring project should be contained in an annual report that presents the basic data and an assessment of the success of restoration efforts. The report should evaluate the proposed activities for the next year and see if results of the monitoring indicate whether changes in proposed activities are warranted. Annual reports will help ensure that monitoring results will be in an organized format readily accessible to future managers.
7.1 DATA NEEDS PRIMARILY FOR DESIGN OF RESTORATION MEASURES The following list of data needs required for design was taken primarily from Tetra Tech (1999). The items are arranged in order of highest to lowest priority. Several of the data needs supply information necessary in assessing the numeric targets. In these cases, the associated numeric target(s) are identified in parentheses.
1. Topographic Mapping. Obtain detailed topographic mapping at 1 foot contour intervals for the stream corridor from above the North Fork confluence to Lake Tahoe.
2. Control Survey. Perform a control survey to translate the Tetra Tech 1998 survey to the State Plane coordinate system (This was performed in October, 2000 as part of geomorphic study and mapping effort on the lower 4,000 feet of the stream through the Tahoe Conservancy property conducted by Tetra Tech for the Corps of Engineers).
3. Coordination of Restoration Efforts. Coordinate with the Tahoe Conservancy to ensure that any restoration efforts planned on the lower 3,800 feet of channel have been accounted for and that projects compliment each other.
4. Survey Additional Cross Sections (Targets 3, 4 and 7). Evaluate cross section coverage and proposed restoration activities to determine areas where additional cross sections may be needed. Establish these cross sections and perform surveys. Cross sections that will be useful for future monitoring should be permanently monumented.
5. Update Hydraulic Model (Targets 3 and 7). Update the Tetra Tech hydraulic, HEC-RAS, analysis to include additional cross sections from surveys and the topographic mapping. The floodplain portion of the Tetra Tech cross sections should be updated to include more accurate floodplain representation based on the

7. Data Needs and Recommendations for Monitoring Evaluation Plan
Tetra Tech Blackwood Creek Sediment TMDL Report 7-3 03/27/01
topographic mapping. The hydraulic analysis should be updated for the existing conditions and a new analysis performed that includes restoration measures.
6. Reference Reach/Watershed (Target 1). Identify a suitable reference condition stream that best represents Blackwood Creek prior to its deterioration. The reference condition stream should have similar geology, hydrology, topography, soils and vegetation. Morphometric measurements from field cross sections and aerial photographic analysis to determine channel geometry and planform for the reference stream should be performed.
7. Sediment Transport Analysis (Targets 2 and 4). Perform a detailed sediment transport analysis to determine the response of the system to proposed restoration measures. Particular attention should be given to the area between Reaches 7 and 18 to determine optimum elevation for grade controls, the proposed Barker Pass Road crossing and the replacement of the failed gabions weir at the upstream end of Reach 14 (Reach numbers from Tetra Tech, 1999). The analysis should include a current sediment budget that addresses sediment sources both in the uplands and riparian zone.
8. Reconnaissance of Other Tahoe Basin Restoration Projects. Perform a reconnaissance on all significant stream and watershed restoration efforts in the Lake Tahoe Basin. Document what procedures have worked and what procedures have failed. This information should be used to develop a final design with the highest potential for success.
9. 1939 Aerial Coverage. Obtain complete coverage of the watershed for the 1939 aerial photographs.
10. Locate Other Historic Cross Sections (Target 3 and 7). Perform a final attempt to locate all historic cross sections, perform current survey of the cross sections and survey coordinates of the end points.
7.2 MONITORING FOR ASSESSMENT OF NUMERIC TARGETS AND EVALUATION OF RESTORATION EFFORTS
Once project implementation starts, data collection needs to be conducted in order to monitor the performance of restoration efforts and the response of the system to restoration efforts. Because the restoration project will be implemented over a period of time, feedback from the monitoring will allow an adaptive management strategy to be applied. Under this strategy, future measures can be modified based on evaluation of the success of past restoration activities, as well as the needs for future efforts as conditions in the watershed evolve. Monitoring is also essential to provide the background necessary to take what will be learned at Blackwood Creek and apply it to other watersheds.

7. Data Needs and Recommendations for Monitoring Evaluation Plan
Tetra Tech Blackwood Creek Sediment TMDL Report 7-4 03/27/01
The following is a list of important aspects of an ongoing monitoring effort to both assess TMDL targets and pursue an adaptive management strategy for the restoration project.
1. USGS Station Flow Data (Targets 1, 2, 3, and 6). It is essential that the U.S. Geological Survey gauging station at the downstream end of Blackwood Creek be continued. This will provide the flow record necessary to assess the success of the restoration efforts in response to different flow events. It will also allow assessment of recovery the watershed in terms of its hydrologic response. In addition, water quality and suspended sediment measurements need to be continued. This will allow assessment of the project’s improvement in pollutants delivered to Lake Tahoe.
2. USGS Station Suspended Sediment Data (Targets 2 and 3). Total suspended sediment (TSS) data should continue to be collected at the existing USGS gage above Highway 89. To better understand the sediment transport issues present in Blackwood Creek, sediment grain size distribution data will be required. A full range of sizes would be useful, but may be cost prohibitive for every sample. Representative samples from a range of conditions depending on factors such as flow, TSS concentration, and type of event (rain, snowmelt, rain on snow, and baseflow) could be analyzed for a full range of sizes. Other samples could simply be broken down into silt/clay versus sand sized sediments. Bed load samples should also be taken and analyzed for gradation using sieve analysis. The bed load data would aid in understanding fluvial processes within the stream channel. The size breakdowns of TSS and bed load samples can assist in at least semi-quantitatively accessing the contribution of sediments from various watershed components. The majority of silt and clay would be generated in the uplands from soil erosion. The sand –sized fraction may be generated from both erosion of upland soils and erosion of streambanks and adjacent wetlands and riparian meadows. The gravels captured in the bed load sampling would be primarily generated by channel be erosion and possibly erosion of coarse lenses in the channel banks. Collection of soils, bank and bed material samples throughout the watershed could assist in providing more quantitative assessment of the sources of the various sediment sizes found in the TSS and bed load samples.
3. Periodic Cross Section Surveys (Targets 3, 4 and 7). Cross section surveys should be performed on five year intervals for the permanently monumented sections. In years when the peak runoff exceeds 1,000 cfs at the Blackwood Creek gage near Lake Tahoe, additional surveys should be conducted in areas where erosion or deposition are evident. The previously established permanent cross sections should be utilized for this purpose. These cross sections should be located to provide information on the performance of restoration efforts and the response of the system in critical areas, including active erosion locations. The cross sections are one of the most quantitative means of determining the response of the system to the restoration efforts.

7. Data Needs and Recommendations for Monitoring Evaluation Plan
Tetra Tech Blackwood Creek Sediment TMDL Report 7-5 03/27/01
4. Periodic Aerial Photography (Targets 1 and 3). Aerial photography of the entire watershed should be obtained on a five year basis or after significant floods if the results of cross section monitoring and the stream reconnaissance show significant changes. The aerial photographs provide the best documentation of changes in the channel planform and can assist in assessing recovery of the upland areas.
5. Annual Site Inspection (Targets 3 and 5). On an annual basis, an interdisciplinary team should perform a reconnaissance of the entire stream corridor to assess changes in the stream condition. To supplement this information, photo points should be established. This will provide valuable feedback on the success restoration efforts and also allow identification of areas which additional measures may be required.
6. Vegetation Transects (Target 1). Transects should be established and a program of vegetation monitoring implemented to determine the success of re-vegetation efforts in the upland areas and along the stream corridor. This is extremely important since revegetation is a challenging undertaking and feedback on the best techniques is essential.
7. Precipitation and Sno-tel Gages (Targets 1 and 6). Installation of a precipitation gage and Sno-tel station in the Blackwood Creek Watershed should be pursued. This is necessary to fully evaluate any improvements in hydrologic response of the watershed.
8. Benthic Macro-invertebrates (Target 9). Sampling of benthic macro-invertebrates at selected locations in the channel should be conducted on an annual basis. These will provide feedback concerning recovery of aquatic habitat in response to watershed and stream restoration.
9. Bed Material Sampling (Targets 3 and 4). Bed material sampling should be performed on five year intervals for the permanently monumented sections at the same time as the cross section surveys are performed.
10. Riffle Pool Ratio (Target 8). Determination of riffle pool ratios should be performed on five year intervals in the areas containing the permanently monumented sections at the same time as the cross section surveys and bed material sampling are performed.
11. Bed material sampling. Bed material sampling should be performed on five year intervals for the permanently monumented sections at the same time as the cross section surveys are performed.
12. Additional Gauging Stations (Targets 1, 2, 3 and 6). Ideally, additional stream gages should be installed further upstream in the watershed to determine the change in hydrology and sediment transport as the drainage area decreases. Better resolution could be achieved by installing additional monitoring stations at several

7. Data Needs and Recommendations for Monitoring Evaluation Plan
Tetra Tech Blackwood Creek Sediment TMDL Report 7-6 03/27/01
points along the stream. Potential useful locations include: 1) on the main stem just upstream of the Barker Pass Rd. crossing, 2) on the north fork just upstream of the confluence with the main stem, 3) on middle fork just upstream of confluence with the main stem, and 4) on the main stem just above the middle fork confluence. At the additional stations, both flow data and sediment transport data per items 1 and 2 above should be collected.
13. Event Driven Hydrologic Monitoring Stations (Targets 1, 2, 3 and 6). To further define the dynamics of the sediment balance, several stations where less continuous, more event driven data were collected would be useful. These would be on some of the smaller tributaries and gullies that would be representative of various watershed conditions considering land use and geology/soils influences. Data collected would be flow and sediment transport (see items 1 and 2 above). Sediment transport data would ideally include bed load (at representative flows), TSS and size breakdowns of representative suspended sediment samples.

Tetra Tech Blackwood Creek Sediment TMDL Report 8-1 03/27/01
SECTION 8 IMPLEMENTATION
Restoration of Blackwood Creek to predisturbance conditions is not possible, due to the occurrence of irreversible changes in stream morphology. At the current trajectory continued bank erosion will create a new floodplain (in certain locations) at a lower elevation. However there are two very important consequences to this passive restoration option: 1) All of the eroded material is direct loading to Lake Tahoe, and 2) thousands of years of soil development processes will have been lost. A primary goal of the recommended implementation activities is to regain a natural overbank flood regime. There is a clear restoration strategy that could significantly increase the rate to restoring a less extreme hydrologic regime and increase bank stability leading to lower rates of sedimentation.
The strategy has five key elements:
1. Inserting grade controls that incrementally raise bed elevations at key control locations.
2. Reshaping and revegetating streambanks where evaluations have determined that sheer stress is low enough that the restoration measure will remain intact.
3. Eliminating (decommissioning) old skid trails, OHV created roads, and upgrading the remaining road network though storm proofing (dispersion bars, properly sized culverts, bridge on Barker pass road).
4. Elimination of fish barriers primarily at road crossings and at the old gravel pit.
5. Restoration of bedload continuity – eliminate the disconnect at the site of the historic gravel mining operations.

8. Implementation
Tetra Tech Blackwood Creek Sediment TMDL Report 8-2 03/27/01
It is unlikely that the analyses identified in the TMDL recommendations made in the previous sections of this report will substantively alter the recommendations in the existing restoration feasibility analysis. The watershed network scale that is described in the feasibility study will address the key TMDL stressors and the recommended allocation measures. It is important to note that the time-scale to achieve the preferred conditions represented by the numeric targets will occur over decades not years.
The following restoration / implementation measures are taken from the feasibility analysis.
8.1 UPLAND RESTORATION RECOMMENDATIONS RC1 (Road Closure 1): Closing a popular OHV road could be a difficult management decision for the U.S. Forest Service to make and implement. Therefore the Tetra Tech project team took a conservative approach to this restoration management option. The impact of the OHV trail that provides access to the North Fork tributary has resulted in a significant contribution of sediment to the North Fork stream channel and created several gullies that are impacting the system downstream. The closure of the North Fork OHV trail should follow the implementation of Re-vegetation Pilot 2 and Gully Mitigation 3.
RU1 (Road Upgrade 1): The purpose of this Road Upgrade 1 is to replace culverts on the Middle Fork OHV where it crosses the North Fork channel. The existing culverts are subject to clogging and debris jams that result in overtopping of the road. The recommended restoration measure calls for the placement of a concrete dip channel structure similar to the existing concrete dip channel structure on the Middle Fork. The structure would help mitigate the effect of vehicles crossing the channel at this location.
RU2 (Road Upgrade 2): The U.S. Forest Service has already installed several upgrades on Barker Pass Road. However, following the 1997 floods it appears that there is more work to be done. These upgrades include improving road channel drainage and flow dispersion structures that would significantly reduce the impact of this transportation corridor on the stream channel.
RU3 (Road Upgrade 3): Road Upgrade 3 is for the closed road at the bottom of Blackwood Canyon on the south side of the stream channel that may need to be temporarily opened to support restoration measures for road on the south side of the channel. The road will be needed for accessing stream reaches 7, 8, 10, and 11 for stream channel stabilization measures.
GM1 (Gully Mitigation 1): The gullies in the immediate vicinity of the gravel pit area are a source of a significant amount of concentrated flows and sediment to the main stream channel. The quarry site gullies were also selected as the first gully priority because they are more easily accessed than gullies at higher elevations in the watershed. The gully mitigation measures include backfilling, and creation of a rocked or rip rap
8. Implementation
Tetra Tech Blackwood Creek Sediment TMDL Report 8-3 03/27/01
channel with fabric filter material underneath to inhibit washing out of fines from beneath rock fill.
GM2 (Gully Mitigation 2): The gullies on the south facing slopes below the gravel mining area require a different mitigation approach than that recommended for GM1. The location of GM2 has little potential for re-vegetation because of exposure and is too steep and extensive for backfill operations. However, improving the wetland condition at the base of the gully, which is located between the gully and the stream channel, offers the opportunity to reduce the impact of the flows from the gully. The enhanced wetland can reduce the energy associated with overland flows and filter sediments from the water before it enters the main stream channel.
GM3 (Gully Mitigation 3): The stream channel of the North Fork has been diverted into three gullies that have formed a short distance above its confluence with the main Blackwood Creek channel. These gullies should be backfilled and the flow should be redirected back into a single channel. This mitigation measure should not be undertaken unless the U.S. Forest Service is able to close the North Fork OHV trail.
GM4 (Gully Mitigation 4): The gullies that have formed on the South Fork tributary (unamed tributary extending near Ellis Lake) are in steep terrain that is not accessed by road or trail. However, these gullies discharge high energy flows directly into the South Fork channel and should receive some consideration for mitigation. Because of access the mitigation measures would have to be on a smaller scale than those previously identified.
RVP 1 & 2 (Re-vegetation Pilots): The vegetation cover in the watershed has been extensively impacted by past grazing and timber removal operations. Exposure of the highly erosive soils in Blackwood watershed has resulted in the loss of soil profiles in many locations throughout the watershed. Without a soil profile it is difficult to reestablish vegetation and begin the soil forming process once again. Little is known about the methods for initiating the cycle of soil formation and reestablishing vegetation in alpine conditions. The U.S. Forest Service should consider the development of a pilot project in Blackwood Creek for revegetation of damaged alpine environments. The project team has identified two locations for consideration in the watershed where soils have been lost and little vegetation cover exists. The locations were chosen because it is believed the areas once supported vegetation and they can be accessed for implementation and monitoring.

8. Implementation
Tetra Tech Blackwood Creek Sediment TMDL Report 8-4 03/27/01
Figure 8-1 Location of Upland Restoration Recommendations

8. Implementation
Tetra Tech Blackwood Creek Sediment TMDL Report 8-5 03/27/01
8.2 STREAM CORRIDOR RESTORATION MEASURES The various concepts for stream corridor restoration measures recommended in the Tetra Tech study would address the allocations required for this source category. Table 8-1 presents a reach by reach summary of recommended stream restoration measures. Figure 8-2, Recommended Stream Corridor Restoration Measures, shows the location of these measures.
Table 8-1 Stream Corridor Restoration Measures by Reaches
Reach Restoration Recommendations 1 Coordinate with Tahoe Conservancy, continue to monitor and take corrective actions if necessary.
2 Grade control installation, U/S & D/S toe and upper bank protection, vegetation plantings
3 Toe and upper bank protection, vegetation plantings.
4 Grade control installation, U/S & D/S toe and upper bank protection, vegetation plantings
5 Toe and upper bank protection, vegetation plantings.
6 U/S Transition area toe and upper bank protection, vegetation plantings.
7 Grade control installation, U/S & D/S toe and upper bank protection.
8 Grade control installation, U/S & D/S toe and upper bank protection.
9 No action except monitoring and take corrective measures if conditions worsen.
10 Grade control installation, U/S & D/S toe and upper bank protection, vegetation plantings
11 Grade control installation, U/S & D/S toe and upper bank protection, vegetation plantings
12 U/S Replacement of Dip-X with bridge, backfill upper left abandoned channel, grade control installation below bridge.
13 D/S Replacement of Dip-X with bridge, grade control installation, toe and upper bank protection.
14 U/S Grade control replacement, toe protection, upper bank protection, vegetation plantings.
15 D/S Grade control replacement, berm extension, toe protection, upper bank protection.
16 No action proposed except monitor to determine if maintenance of existing restoration is necessary.
17 Replace or modify fish ladder with series of boulder drops or rapid (not currently in 6 year plan)
18 Return primary flow to left channel, bank protection and possibly grade controls in left channel.
19 Return primary flow to left channel, construct flow split control at upstream end of reach, possibly remove deposition left channel.
20 Construct split flow control structure at downstream end of reach.
21 No action except monitoring, access is difficult.
22 No action except monitoring, access is difficult.

8. Implementation
Tetra Tech Blackwood Creek Sediment TMDL Report 8-6 03/27/01
Figure 8-2 Recommended Stream Corridor Restoration Measures

8. Implementation
Tetra Tech Blackwood Creek Sediment TMDL Report 8-7 03/27/01
Reach 15 Berm: The purpose of this portion of the project is to assist in restoring pre-mining bed load transport conditions through the old gravel pit area. This measure achieves this by confining the flow in the lower portion of Reach 15 to a channel width of approximately 60 feet rather than allowing the flow to dissipate in the remnants of the old pond. Figure 5-3 shows a conceptual layout for the improvements. Key components of the project will be the construction of the berm to define the right bank of the channel. A small opening near the lower end of the berm can be incorporated to allow exchange of water between the pond and the main channel. The berm itself should be designed to contain the 5-year discharge with considerations for future bed elevation increases due to aggradation.
Figure 8-3 Pond Area Berm Extension
Reach 6 and 7 Bank Protection: It is proposed that bank protection be installed in the area of the transition between Reaches 6 and 7. Currently, the area in Reach 6 is eroding and may impact the positive influence on channel stability of the Reach 7 control area. The purpose of the project would be to maintain the integrity of the Reach 7 control. Conceptual sketches of Reach 6 and 7 bank protection area are provided in Figure 5-4. The proposed measures include boulder toe protection along each bank, soil encapsulated lifts with willow cuttings on the intermediate bank zone, and shaping and re-vegetation of the upper bank zone. Review of past bank stabilization efforts in the Tahoe area should be used to assist in defining the appropriate elevation for each of the three zones.

8. Implementation
Tetra Tech Blackwood Creek Sediment TMDL Report 8-8 03/27/01
Figure 8-4 Reach 6 &7 Restoration Measures
Figure 8-5 Upstream Transition Area Bank Protection, Cross Sections

8. Implementation
Tetra Tech Blackwood Creek Sediment TMDL Report 8-9 03/27/01
Figure 8-6 Downstream Transition Area Bank Protection, Cross Sections
Barker Pass Road Bridge: A clear span bridge should be installed to replace the existing culvert and dip crossing on Barker Pass Road. The purpose of this effort would be to remedy the local erosion problems caused by the current configuration and to restore natural bed load transport conditions through the crossing area. The bridge would consist of a clear span on the order of 50 to 60 feet wide, bank protection efforts upstream and downstream of the structure, installment of a boulder grade control to maintain stream bed elevations and elimination of the eroded channel on the left side of the current crossing. Figure 5-5 shows a sketch of a boulder grade control structure.
Reach 14 Grade Control: A grade control needs to be installed in Reach 14 to replace the failed gabion checkdam. The purpose of the control will be to hold the elevation in the area of the old gravel pit pond. Figure 5-2 shows the general configuration of this feature. The structure details would be similar to Figure 5-4, if a boulder type structure may be possible. In either case, bank protection should be included to prevent flanking of the structure. The bank protection would be similar to the bank details provided in Figure 5-3. The protection should toe back to the sand area and continue on the order of 50 feet below the grade control.
Reach 7 Grade Control / Reach 8 Bank Protection: This element of the restoration plan includes a grade control at the upstream end of Reach 7 and measures to stabilize the eroding banks throughout Reach 8. The grade control would be similar to Figure 5-4 with some modification to make the structures compatible with the bed rock control at the upstream end of Reach 7. The

8. Implementation
Tetra Tech Blackwood Creek Sediment TMDL Report 8-10 03/27/01
Figure 8-7 Planview and Profile of Boulder Grade Control
Figure 8-8 Boulder Grade Control Profile View

8. Implementation
Tetra Tech Blackwood Creek Sediment TMDL Report 8-11 03/27/01
modification would possibly include tie in of the boulders to the bedrock by drilling and steel re-bar or other anchoring mechanisms. Bank protection in Reach 8 would follow the current erosion zone and not the existing channel alignment. The elevation and alignment of the current channel is not one that is appropriate for final restoration. The concept behind this design is to stabilize the edges of the current erosion zone and with the use of the grade control and planting of vegetation in the stream corridor to promote deposition in the existing incised channel. After the elevation of the channel zone has been sufficiently raised to reconnect it to the floodplain, then measures to restore a channel with appropriate alignment and channel geometry can be undertaken. Plantings of vegetation within the eroded channel zone should be conducted with the ultimate alignment of the restored channel in mind. Figure 5-6 illustrates this concept.
Figure 8-9 Planview of Reach 7 & 8 Bank Stabilization and Grade Control Replacement
Reach 10 Grade Control/ Reach 11 Bank Protection: After the validity of the approach taken in Reaches 7 and 8 is verified by monitoring, a similar strategy can be adapted in Reaches 10 and 11. The grade control would be installed at the upstream end of Reach 10. Protection of the edges of the eroded stream zone would be conducted in Reach 11.
Reach 2 and 4 Grade Control / Reaches 3, 5 and 6 Bank Protection: This will be a similar project to the work in Reaches 7 and 8 and Reaches 10 and 11. However, this is on a much larger scale and should be undertaken after positive monitoring results have been obtained from the other smaller installations. The previous projects will allow the design of this project to be fine-tuned. The grade control in Reach 2 will serve Reach 3. The grade control in Reach 4 will serve the lower portion of Reach 5. As the project progresses, it may be necessary to incorporate grade controls to serve the upper portion of Reach 5 and Reach 6. This would require several additional structures.

8. Implementation
Tetra Tech Blackwood Creek Sediment TMDL Report 8-12 03/27/01
Return Flow to Left Channel in Reaches 18 and 19: Reaches 18 and 19 consist of the split flow section starting immediately upstream of the fish ladder. The proposed effort for this area consists of making the left channel the primary channel for low and moderate flows. Currently, the artificial right channel constructed during the gravel mining period is the primary flow channel. The proposed effort consists of several measures. At the upstream split flow location, a boulder bed elevation control structure should be installed. The purpose of the structure will be to control the flow split between the right and left channels. The structure should be designed to divert the entire low and moderate flows up to approximately the 1.5-year return period into the left channel. As flows increase, the right channel should receive an increasingly large proportion of the total flow. At the 100-year flow level, it would be ideal to have the right channel conveying at least an equal share of the flow. The effort will require some alterations to the left channel. The channel should be thoroughly surveyed and a detailed hydraulic analysis performed. The results of this analysis should be used to determine areas in which sediment deposits and debris should be removed to restore its historic capacity. Towards the lower portion of the left channel, there are areas in which bank erosion is evident. This is particularly true where the alignment takes two abrupt 90-degree bends. Bank stabilization treatments need to be applied to this area and at other locations where significant erosion is observed. Toward the lower end of the reach, riparian vegetation is sparse at many locations along the banks. Plantings of willows should be installed in these areas to promote rapid recovery of the banks. Finally, it appears that the channel may be somewhat incised in the lower portions of Reach 18. This is most likely a result of headcutting during the gravel mining period. The detailed hydraulic analysis should be used to determine if the left channel has excess capacity in this area and will not have frequent flood plain interaction. If this is the case, then several grade controls should be installed to promote the return to an appropriate bed level. Monitoring in this reach will be particularly important. If the left channel is being damaged by high flows, then additional stabilization efforts should be implemented and the possibility of increasing the flow split to the right channel should be considered.

9 Margin of Safety - Key Uncertainties
Tetra Tech Blackwood Creek Sediment TMDL Report 9-1 03/27/01
SECTION 9 MARGIN OF SAFETY - KEY UNCERTAINTIES
A margin of safety must be included in allocations to account for uncertainty in the analysis. The purpose of this section is to identify those areas o the analysis that are likely to require some form of implicit or explicit assignment of load allocation to account for potential under estimates of allowable loading.
SCS Curve Number / Peak Flow and Hillslope Sediment Yield:: Uncertainty with these allocations could be addressed by including a requirement in the TMDL that the development and implementation of upland restoration projects must continue until the target SCS Curve Number has been achieved or until the use support is reestablished.
Lateral Bank Erosion Rates: Decreasing loading from bank erosion rates (lateral and longitudinal) has several components of uncertainty associated with estimates for restoration and stabilization of streambanks including:
§ Developing accurate estimates of current loading from this source.
§ Estimating the success of restoration measures in reducing the rate of streambank erosion.
§ Ability of upland restoration measures to reduce the intensity of hydrological inputs.
§ Potential impact of extreme hydrologic event (i.e., rain on snow) on restored streambanks.
The margin of safety for streambank stabilization would involve completing first those stream channel restoration options that reestablish natural flow and sediment regimes. These must be completed in conjunction with measures that reduce the intensity of hydrologic inputs (e.g., gully removal) and other stressors impacting streambank stability (e.g., OHV traffic).

9 Margin of Safety - Key Uncertainties
Tetra Tech Blackwood Creek Sediment TMDL Report 9-2 03/27/01
Bed Elevation: Uncertainty and safety factor is best addressed through the context of the phased TMDL monitoring program that assess the progress o restoring severely incised or aggraded stream reaches.
Transport through Gravel Mine: The margin of safety is linked to obtaining a firm commitment that recommended management measures will be undertaken to restores natural bedload transport through the gravel mining area.
Barriers to Fish Passage: The key uncertainty associated with barriers to fish passage is the length of time before subsurface flows in heavily aggraded channels resurface, along with the elimination of other barriers associated with channel stability (e.g., gravel bars). The uncertainty associated with man-made structures (e.g., clogged culverts) could be addressed through commitment to a well defined management plan for eliminating the barriers.