report-ottawasdw.enr.gov.nt.ca/nwtdp_upload/2016-17 final report - cimp162... · web viewsubmit...
TRANSCRIPT

Appendix K: Final Report Template
Instructions: Complete the Final Report only if this is the final year of the project. Otherwise complete the
Annual Status Report if the project is ongoing (e.g. NWT CIMP approved your proposal for multi-year funding).
Submit as a Word document, not a pdf. To check a box, right-click on the box and choose ‘Properties’. Change the default value to
‘checked’. Final Reports should clearly provide information being requested in each section. Please contact
NWT CIMP staff for further clarity or advice on how to address information being requested. It is advised that applicants contact NWT CIMP staff well in advance of the final report submission deadline.
Please provide a photo that best depicts your project. It must be no smaller than 1M. All Final Reports will be reviewed for completeness. Within three months of receiving Final Reports, NWT CIMP may contact Principal Investigators
for one round of revisions. Final Project Reports of a particular year(s) or from a particular region may be collated
and published by NWT CIMP.

NWT Cumulative Impact Monitoring Program
2017/18 Final Report Form
1) Project Information
NWT CIMP # 162Project Title Multi-species monitoring using winter track surveys in
the Sahtú Settlement RegionProject length (years of CIMP funding)
3
Date Submitted May 26, 2017Author(s) & their Organizations:(add rows as appropriate)
James Hodson (GNWT-ENR), Deborah Simmons (SRRB), Joe Hanlon (SRRB), Heather Sayine-Crawford (GNWT-ENR), Stephanie Behrens (GNWT-ENR), Jesse Tigner (Explor)
Contact InformationInclude mailing address, email, telephone and website
James HodsonWildlife Division, Department of Environment & Natural Resources, Government of the Northwest Territories, P.O. Box 1320, Yellowknife, NT, X1A 2L9Telephone: 867-767-9237 ext. 53227Fax: 867-873-0293e-mail: [email protected]/
Deborah SimmonsExecutive Director, Sahtú Renewable Resources Board ( ehdzo Got’ ne Gots’ Nakedı)Ɂ ı e ,P.O. Box 134Tul t'a, NT Canadaı X0E 0K0Telephone: 867-588-4040Fax: 867-588-3324e-mail: [email protected]://srrb.nt.ca/index.php
Joe HanlonProgram Coordinator, Sahtú Renewable Resources Board ( ehdzo Got’ ne Gots’ Nakedı)Ɂ ı e ,P.O. Box 134Tul t'a, NT Canadaı X0E 0K0Telephone: 867-588-4040Fax: 867-588-3324e-mail: [email protected]://srrb.nt.ca/index.php

Heather Sayine-CrawfordManager, Wildlife Research and ManagementWildlife Division (formerly Manager, Wildlife Research & Monitoring, Sahtú Region)Department of Environment & Natural ResourcesGovernment of the Northwest TerritoriesP.O. Box 1320, Yellowknife, NT, X1A 2L9Telephone: 867-767-9237 ext. 53230Fax: 867-873-0293e-mail: [email protected]/
Stephanie BehrensCumulative Effects Biologist, Wildlife Research & Monitoring, Sahtú RegionDepartment of Environment & Natural ResourcesGovernment of the Northwest TerritoriesP.O. Box 130, Norman Wells NT, X0E 0V0Tel: (867)587- 3518Fax: (867)587-3525e-mail: [email protected]/
Jesse TignerExplorSuite 1500, 630 6th Avenue SW, Calgary, ABT2P 0S8Tel : 403-263-5950Fax : 403-269-5252e-mail : [email protected]://www.explor.ca/index.php
Type of Research ☒ Science ☐ TK
Valued ComponentCheck all that apply. If ‘other’ please specify.
☒ Caribou ☐ Fish ☐ Water ☒ Other (Furbearers, ungulates, carnivores)
Geographic Area/Region ☐ Akaitcho ☐ Dehcho ☒ Sahtú ☐ Gwich’in☐ ISR ☐ Wek’èezhii
Project Keywords (at least 4) wildlife, tracks, occupancy, distribution,Location In decimal degrees (dd.mmm) provide coordinates for the general study location; or if regional, provide 4 coordinates for the bounding box.
Study area centered on the towns of Tul t’a and Norman Wells:ı
NW corner: –127.8647 W / 65.4721 N; SW corner: –1257.3416 W / 64.6018N; NE corner:125.4696 W/ 65.7023 N; SE corner: –125.0111 W / 64.8341N
ConsentI acknowledge that the completed report will be posted for public access on the NWT Discovery Portal.
☒ I agree

2) AbstractClearly and concisely identify the purpose, methodology, results and conclusions of the project.This project aimed to design and test a monitoring program based on surveys of winter wildlife tracks that could be used to detect changes in the distribution of multiple species due to exploration and development of oil and gas resources in the Sahtú Settlement Region. Thepilot study focussed on measuring species occupancy using teams of surveyors consisting of youth and elders from the communities of Tul t’a and Norman Wells. Track surveys were conducted by snowmobile along existing ı trails and seismic lines. Mobile data collection applications (TrailmarkTM or ODKcollectTM) on handheld computers were used to help standardize data collection by having a pre-determined set of questions that had to be answered each time observers stopped to record a track or other type of wildlife sign. This included taking georeferenced photos of each track and surrounding habitat. Twelve different species were detected during 3 winters of surveys (2015-2017). Marten, lynx and moose tracks recorded by Tul t’a surveyors in winter 2015, and by Explor during their 2012/13 2D seismic program, were used to ı investigate how different combinations of landscape grid cell size (cell widths of 3 to 10 km) and survey route segment length (500 m or 1000 m) influenced detection probability, spatial dependence in detections along successive segments, and occupancy estimates accounting for imperfect detection. Power analysis was used to determine sampling effort required to detect a 20% decline in occupancy over a 5 year period under different combinations of cell size, segment length and number of repeated surveys. At least 60 cells will need to be surveyed 3 times per winter in order to detect this level of change with 80% power. Dividing survey routes into 500 m segments, and using grids of 5 x 5 km and 10 x 10 km cells will likely be appropriate for monitoring occupancy of a range of species with different home range sizes. Several logistic and capacity challenges were encountered during the first two winters of field work in Tul t’a that needed to be addressed through discussions with the Tul t’a Renewable ı ı Resource Council and Sahtu Renewable Resources Board. In the final winter of the project the Tul t’a ı Renewable Resource Council took a lead role in coordinating the field work and this proved to be a successful approach to implementing the monitoring program. The program will need to be initiated in other Sahtú communities in order to obtain sample sizes large enough to detect changes wildlife distribution, and there may be barriers to implementation that are specific to each community. There is also an opportunity for industry to undertake surveys within their areas of operation, which will help to achieve the regional coverage necessary for monitoring changes to wildlife distribution brought about industrial development, natural disturbance and climate change.
3) Key MessagesProvide (in bullet form) the key messages and/or results of this project. Maximum of 5 bullets. These are high level summary points.
- Snow track surveys provide a non-invasive way for community members to monitor relative abundance and distribution of several mammal species that are active during winter, and an opportunity for knowledge transfer between elders and youth working together to conduct the surveys
- The use of mobile data collection apps on rugged handheld computers or tablets helps to ensure standardization of the information recorded, promotes paperless data collection, and enables collection of georeferenced photos of tracks so that identification can be audited by independent experts
- At least 60 landscape grid cells (5 x 5 km or 10 x 10 km) will need to be surveyed at least 3 times each winter to provide adequate power detect changes in species distribution over a 5 year period
- Surveys should be conducted by at least 2 communities to achieve minimum required sampling

effort; industry participation could help to increase spatial and temporal coverage of surveys, but their participation may on a renewal of oil and gas exploration and development activity in the region.
- Involvement of the Renewable Resource Councils in the coordination of the field work and data management will be key to the long-term success of a track monitoring program, but logistical and capacity challenges will likely differ among each community

4) IntroductionThis section should include the background, purpose, rationale and objectives of the project.In 2010-2011, fourteen oil and gas exploration licences covering roughly ~1.35 million hectares of the central Mackenzie Valley in the Sahtú Settlement Area were issued granting rights to six companies to explore oil and gas resources in the Canol and Bluefish shale formations (NEB 2015). Applications submitted to the Sahtú Land and Water Board to carry out 2D and 3D seismic surveys, drilling and hydraulic fracturing, and to build roads, camps and airstrips to support these activities, raised concerns about the potential impacts on wildlife and their habitat. Reviews of these applications highlighted that there was little baseline data on wildlife within the exploration licence areas and no monitoring programs in place to detect potential impacts of exploration on wildlife. Shale oil exploration was expected to increase the human disturbance footprint in the region, increase linear feature density, facilitate access in to remote areas, and cause sensory disturbance to wildlife. Although the companies that were active in the region began to collect baseline data on wildlife and habitat, it did not appear that data were being collected in a coordinated or standardized manner. Without such coordination, interpretation of wildlife response to activity at spatial scales appropriate to assessing cumulative impacts would be difficult.
To address these concerns, this project aimed to design and test a monitoring program based on surveys of winter wildlife tracks that could be used to detect changes in relative abundance and distribution of multiple wildlife species within and outside of areas of oil and gas exploration and development. It was important that the program directly involve community members and that it could eventually be applied at a regional scale by communities, industry, and government to detect cumulative impacts of shale oil exploration and development. Snow track surveys are a non-invasive method for monitoring changes in abundance and distribution of wildlife that is very well suited to involving local hunters and trappers in data collection because they already have extensive knowledge in the identification and interpretation of wildlife tracks. The Finish track survey program, where volunteer hunters have been conducting snow track surveys on a nation-wide network of “wildlife triangles” annually since 1989, is a good example of local harvester involvement in collection of data to support decisions about wildlife harvesting (Helle et al. 2016). In Canada, the Alberta Biodiversity Monitoring Institute (ABMI) has used winter track surveys along 10-km transects to monitor cumulative impacts on a variety of mid- to large-sized mammals within 20 x 20 km grid cells distributed across the province for almost 10 years (Fisher and Burton 2012). In addition to monitoring changes in species abundance over time, the data from such programs has been used to evaluate species associations with different habitat types (e.g. Kurki et al. 1998), the response of different wildlife species to variation in the extent of human disturbance footprint from industrial development (e.g. Toews et al. 2017), and changes in species ranges due to climate change (e.g. Dawe et al. 2014).
Winter track surveys can yield indices of species relative abundance (usually measured as the number of tracks of a species per kilometer per day since last snowfall) or distribution based on the presence/absence of the species within different survey units in a study area (usually based on a sampling grid overlaid on the landscape). A challenge facing most wildlife monitoring programs that aim to estimate or measure changes in species distribution is false absences – i.e. failing to detect a species when it is in fact present due to imperfect detection (Mackenzie et al. 2002). Imperfect detection may lead to an underestimation of the true proportion of a study area occupied by a species (Mackenzie et al. 2002). This problem can be addressed by conducting more than one survey within a sampling unit, using either several repeated surveys over time or several spatial replicates within a sampling unit. The history of detections and non-detections among spatial or temporal replicates within a sample unit can then be used to estimate detection probability, which is the likelihood of actually detecting a species when it is present (Mackenzie et al. 2006). Accounting for detection probability can then yield more robust estimates of true occupancy of a species across sample units. The use of spatial replicates to

estimate detection probability on a single survey occasion has recently been developed for application to surveys of tracks along linear survey routes, in order to estimate the occupancy of rare species with large home ranges such as tigers and wolverine (Hines et al. 2010, Whittington et al. 2014). Survey routes are typically broken down into a series of segments (spatial replicates), and the pattern of detection/non-detections along successive segments can then be used to estimate detection probability and occupancy of a species within landscape grid cells that are sampled by the survey routes. For example, a monitoring program conducted in Banff National Park uses track surveys along existing trail networks to estimate the proportion of survey units (a grid of cells overlaid on the landscape) occupied by different wide-ranging species (Whittington and Heuer 2012). The Banff program was used as a model for the development of a similar wildlife monitoring program based on track surveys in the Sahtú, as there is already an extensive network of seismic lines and trails from oil and gas exploration in the region that could be used as track survey routes. Over the long term, the Sahtú winter track survey program will be used to monitor cumulative impacts on a wide range of species by assessing whether changes to the landscape as a result of future oil and gas development or natural disturbances such as fire are having an impact on species distribution. This will be accomplished by including covariates describing landscape composition and human disturbance footprint in occupancy analysis to assess their influence on the probability that different species are present in different grid survey cells overlaid on the landscape, and to assess whether changes in the extent of human disturbance footprint are related to changes in the proportion of cells occupied by different species over time. One of the focal species for these analyses will be boreal woodland caribou given their status as a threatened species (COSEWIC 2014, Species at Risk Committee 2012) and their observed sensitivity to oil and gas development in neighbouring jurisdictions such as Alberta (Sorensen et al. 2008; Hervieux et al. 2013).
The objectives of this 3-year pilot project were to work with the Sahtú Renewable Resources Board and the Tul t’a Renewable Resources Council to:ı
- Obtain input from the community on the design of the monitoring program and their participation in the collection of data
- Test different devices that would allow for paperless data collection, and assess their ease of use by community members and reliability
- Obtain sufficient data to conduct power analyses to determine the spatial and temporal sampling effort required to detect a 20% change in species occupancy over 5 years
- Assess logistical issues, and determine costs and human resource requirements to implement a regional scale snow track monitoring program
- Identify and understand challenges that may limit the capacity of wildlife co-management organizations in the Sahtú to lead or coordinate aspects of the field program and data management
5) MethodsThis section should clearly identify the methods and protocols used to collect data.Community EngagementGiven that the Sahtú Renewable Resources Board is a lead partner on the project and is based in the community of Tul t’a, it was decided that Tul t’a was the best location to pilot the monitoring program in ı ı collaboration with the Tul t’a Renewable Resources Council. Before the first winter of data collection,ı a 2-day workshop was held in Tul t’a with participants (18 in total) that included ENR and SRRB staff, ı youth environmental monitors in training, harvesters, and elders from the community. Representatives from Explor and ConocoPhilips also attended portions of the workshop by teleconference. The Tul t’a ı RRC and other oil and gas companies active in the region (Husky Energy Inc.) were also invited to attend.

The goal of the workshop was to get community feedback and input on the objectives and monitoring questions to be answered, the design of the snow track survey program, methodology, selection of survey equipment and survey routes, and logistical/safety considerations. The workshop included a presentation from Trailmark Systems (https://www.trailmarksys.com/), a company that provides web-based and mobile data collection applications and mapping software to support traditional knowledge and land use studies. They provided an overview of their web-based and mobile data collection services and discussed their involvement with a similar community-based monitoring program in Nunavut.
ENR applied for wildlife research permits for each field season, and permit applications were reviewed and endorsed by the TRRC prior to starting field work. Each winter, surveyors identified by the TRRC and SRRB were hired from the community of Tul t’a to work the project. Surveyors worked in teams of atı least two monitors (one youth and one elder per team). ENR staff provided training in the use of the hand held computers and data collection app, GPS, digital cameras and safety equipment at the beginning of each season and participated in several of the surveys with the Tul t’a surveyors each winter.ı
Following each field season a summary report of the surveys conducted and the data collected was sent to the SRRB and TRRC. In the fall preceding each winter field season, a workshop was held in Tul t’a to ı review the results of the previous field season, discuss logistical challenges and to plan for the upcoming season.
In addition to the meetings held in Tul t’a, ENR provided presentations and demonstrations of the projectı at the 2015 Sahtú Cross Cultural Research Camp (organized and hosted by the Sahtú Environmental Research and Monitoring Forum [SERMF]), the Sahtú Environmental Research and Monitoring Forum (SERMF) results workshop, and at a Norman Wells High School winter camp (March 2016) to help build awareness of the project in the region.
In the final year of the project we approached the Norman Wells RRC (NWRRC) to see if they were interested in trying out survey routes around their community, and a few surveys were conducted with surveyors identified with input from the NWRRC (see Results for further details).
Study Area and Sampling DesignSeismic lines and trails within a 50 km radius around Tul t’a were reviewed with community members ı and 5 potential survey routes were identified based on their accessibility, state of regrowth (i.e. open enough to be traveled by snow mobile), and to attempt to survey the broadest area possible.
Four new survey routes were added in the second winter of the project. In the third winter of the project, 9 new routes were surveyed around the community of Norman Wells (Figure 1).
In addition to the routes surveyed for this project, Explor conducted extensive track surveys in winters 2012 and 2013 along seismic lines they prepared for 2D seismic surveys on the west side of the Mackenzie River, between Tul t’a and Norman Wells. Explor provided their track survey data to this ı project to increase the amount of data available to evaluate different sampling designs (see below) and power analysis.

Figure 1. Routes surveyed for winter wildlife tracks around the communities of Tul t’a (2015-2017) andı Norman Wells (2017) in the Sahtú Settlement Region. Additional wildlife track survey data was provided by Explor from seismic lines surveyed in winters 2012 and 2013 to increase sample size for occupancy and power analysis.
Track surveys can provide indices of relative abundance based on the number of tracks detected along a km surveyed distance divided by the number of days since the last snowfall >1 cm or track-obliterating wind event, or indices of species occupancy or distribution based on the presence or absence of tracks of a species within a surveyed grid cell.
Occupancy study designGiven that species are not always detected during a survey even when they are present, spatial and temporal replication was used to estimate detection probability and occupancy of different wildlife species (Whittington et al. 2014). The design of occupancy studies based on surveys of linear transects requires consideration of the appropriate size of landscape cells within which species are assessed as present or absent, and how transects are sub-divided into segments to provide spatial replication and to assess spatial correlation in detection probability (i.e. how long segments should be). Inference about the occupancy of a species within a given cell is based on the detection history of the species along a series of consecutive segments within the cell. Landscape cell sizes are usually based on the average home range size of the species being surveyed; therefore different grid cell sizes would be required to assess occupancy of smaller vs. larger sized species. In this study we evaluated how grids cell widths ranging from 3 to 10 km influenced occupancy estimates of marten (winter home range size: 7-14 km2), lynx (winter home range size: 15-25 km2) and moose (winter home range size: 175 km2), to determine which size would be most appropriate to track changes in their distribution. We focussed on these three

species as the represented a home range sizes and tracks of these species were commonly encountered both the Tul t’aı and Explor track surveys. We also evaluated how using segment lengths of 500 and 1000 m influenced detection probability of the three focal species and spatial dependence in detections on successive segments along a survey route. Because species activity patterns and detection probability may also be sensitive to variation in temperature, snow conditions and lunar phase (Gilbert and Boutin 1991), we also attempted to survey each route a minimum of 2 times per season to achieve temporal replication. This combination of spatial and temporal replication allows for occupancy analysis to estimate the probability that a species is truly absent within a grid cell versus the probability that it is present but not detected.
Track SurveysTrack surveys were conducted by snowmobile along selected survey routes, in teams of 2-3 surveyors. Survey teams always included at least one experienced harvester/trapper and one youth. At the start of each survey, surveyors recorded the starting coordinates, time, number of days since last snowfall >1 cm, and temperature in a field notebook. Survey routes were traveled at low speed (<10 km/hr) and fresh tracks of all ungulates and furbearers, except snowshoe hare and red squirrels, were recorded when encountered. Tracks of snowshoe hare, red squirrel, ptarmigan and grouse were not systematically recorded in the surveys because they were too numerous and would have resulted in less ground being covered in each survey, thus limiting the capacity to survey wider-ranging species. However, when tracks of species that were included in the surveys were encountered, surveyors noted whether tracks of snowshoe hare, red squirrel and ptarmigan/grouse were present in the area.
In the first year of the project (winter 2015), three devices were used to record tracks: Juniper Systems Archer2 (rugged handheld computer), Garmin Oregon 650 Global Positioning System (with integrated digital camera; hereafter referred to as “GPS”), and Olympus TG-3 digital camera (with integrated GPS; hereafter referred to as “digital camera”). The Archer2’s were leased from Trailmark Systems (https://www.trailmarksys.com/), along with a subscription to use the Trailmark Mobile data collection application (hereafter “Trailmark app”) and web interface. The Trailmark app allows users to develop a series of custom data collection forms, each of which include questions that must be answered every time a surveyor stops to record an observation (Figure 2). The use of this technology for the project was intended to eliminate the need for using paper data sheets and to help ensure that the information recorded is standardized and complete each time a surveyor stops to record a track. The Trailmark survey forms developed for this project included questions about the weather, snow texture, species, number of individuals, direction of travel (along or across the survey route), other types of wildlife signs (scats, fur, kill sites, etc.), habitat type, and an open question to record observations related to traditional and local knowledge (hereafter “TK”) (Table 1). Each of the forms for tracks, other wildlife signs, habitat and TK included the option to take georeferenced photos or audio recordings. Spatial coordinates were recorded with each entry in the Trailmark app. Surveyors took two photos of each track – one close-up photo of the prints, and another photo showing a series of prints (Figure 3). A ruler or glove was placed on the snow beside the track to provide scale. Tracks were classified as either “crossing”, “joining”, or “leaving” the survey route. The “joining” and “leaving” categories were included to record animals that walked on to the survey route, travelled along the route for some distance, and then left the route. By recording where an individual joined and left the survey route, it is then possible to infer which of the survey route segments the individual travelled along, and was thus present on for the purpose of occupancy analysis. Surveyors also took two photos of the habitat surrounding each track observation, one along the survey route and another perpendicular to the survey route. To compare ease of use, photo quality and location accuracy, georeferenced photos of each track and surrounding habitat were also taken using the GPS and the digital camera. In addition, a track log was recorded for each survey using the GPS. Surveyor’s followed closely behind one another along the survey route and all team members stopped to record each track that was encountered using a different device (meaning there was 2or 3

duplicate photos of each track). In some cases the first surveyor travelling along a route missed a track and kept going, but the other surveyor(s) travelling behind them stopped to record it. At the end of each survey, surveyors recorded the time and final coordinates of where the survey was stopped in their field notebooks.
Figure 2. Screenshot of Trailmark’s web-based set up of the mobile data collection application. A series of 9 survey forms were set up to capture different types of information relative to each wildlife track or other type of wildlife sign recorded during the track surveys.
Table 1. Questions and answer forms used for the track survey Trailmark mobile data collection appForm Number
Question Possible Answers Photo Audio
1 Cloud Cover Sunny, partly cloudy, cloudy2 Snowfall None, light, heavy3 Snow Texture Powder, wet, hard crust
4 Species Marten, Fox, Lynx, Coyote, Wolf, Wolverine, Moose, Caribou, Muskox, Weasel/Ermine, Porcupine, Muskrat, Beaver, Otter, Mink, Other, Unknown, Not applicable
5 Number of tracks Single, two to five, six to ten, trail (can’t tell), not applicable
Yes Yes
6 Direction of travel Crossing, along, joining, leaving7 Other wildlife sign Fur or Feathers, Scat or Pellets,
Push-up Lodge or Den, Kill Site,Visual Sighting,Other,Not applicable
Yes Yes
8 Habitat Spruce forest, Pine forest, Mixed forest, Deciduous forest, Burn, Other
Yes Yes
9 TK Observation Blank text box to fill in Yes Yes

Figure 3. Example of a surveyor recording a marten track using the Trailmark mobile data collection app on an Archer2 handheld computer, and examples of photo of a marten track and the surrounding habitat taken with the Archer2.
In the second winter of the project (2016) we also tested the Cedar Tree CT-7 rugged tablet (Juniper Systems; insert link) and the free Open Data Kit (ODK) Collect data collection app (https://opendatakit.org/use/collect/). ODK Collect runs on Android devices and is similar to the Trailmark Mobile app in that users can create a set of custom survey forms, data can be uploaded wirelessly to the ODK server, and subsequently downloaded in tabular format. We duplicated the survey form questions used in the Trailmark Mobile app in ODK Collect to directly compare the performance of the two apps.
Once surveyors returned to Tul t’a, back-ups were of the data recorded on each of the devices were madeı on a computer hard drive. Data recorded using Trailmark were then uploaded wirelessly to Trailmark’s server. Because Trailmark is proprietary software, the data file created using the mobile data collection app can only be opened using Trailmark’s software. This means it is necessary to upload the data to Trailmark’s server before the specific answers to the survey questions on the mobile app can be viewed. Once the data is wirelessly synced to Trailmark’s server, photos recorded on the handheld computers are automatically deleted. Surveyors and project staff each had an account with Trailmark that allowed them to log into the Trailmark web interface and view recorded observations on a map and the answers entered for each form, or download a copy of the data in tabular format. ENR and SRRB staff that were coordinating the project had Trailmark user accounts with administrative privileges that allowed them to view and download all of the data recorded in the field, but surveyors had accounts that only allowed them to visualize the data that their team collected. At the end of each season a complete dataset of the information recorded using Trailmark was downloaded from their website in .csv format.
Metadata from photos taken with the Garmin GPS and Olympus Camera were extracted using the free software BR’s EXIFextractor (http://www.br-software.com/extracter.html) which generates a data table with the time stamp and geographic coordinates associated with each photo. The species and habitat type associated with each photo were then entered manually in a Microsoft Excel spreadsheet by matching each GPS or digital camera photo to photos and information recorded with the Trailmark app based on similarity of the time stamp and geographic coordinates. This revealed tracks that were recorded by the surveyor using the GPS or digital camera but were missed by the surveyor using Trailmark (56 out of 270 tracks recorded in winter 2015, and 7 out of 153 tracks recorded in winter 2016). Observations from Trailmark, GPS and digital camera were then combined into one dataset, and duplicate observations were flagged based on the time stamp and spatial coordinates (observations <2

min or 5 m apart that were of the same species were considered duplicates) and filtered out prior to generating detection history data for occupancy analysis. As most survey routes were surveyed more than once, a field in the data table was added to number each temporal replicate of each survey route within a year.
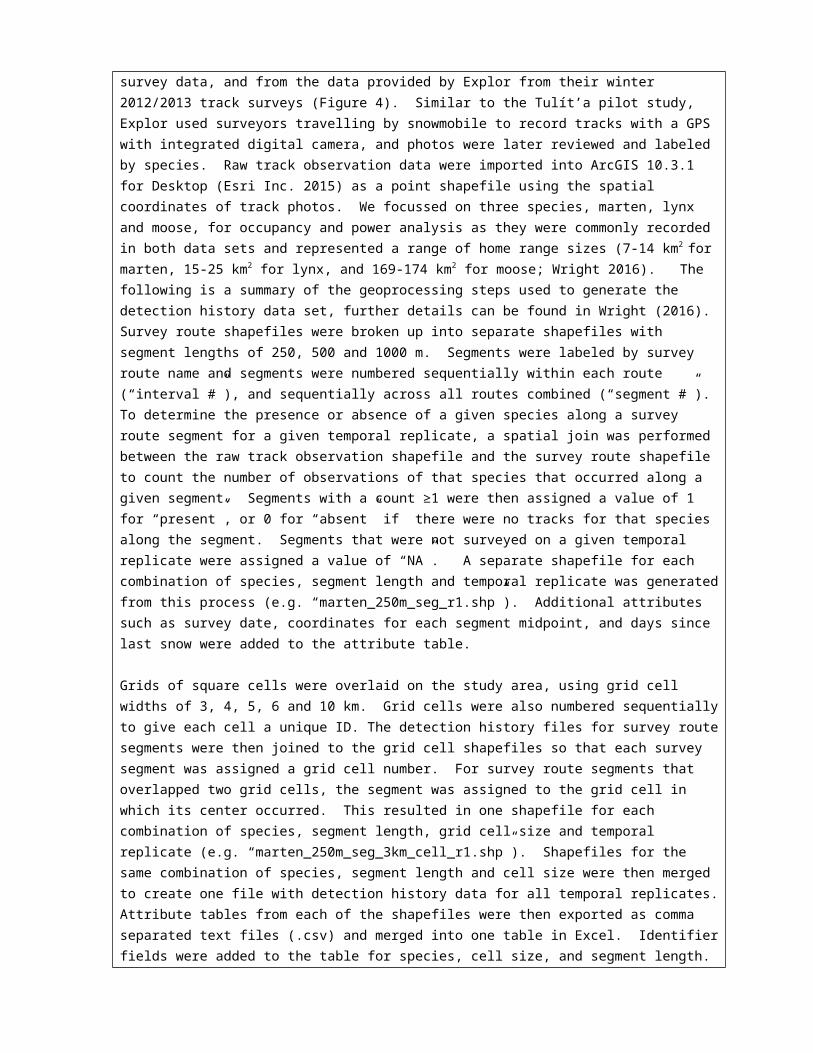
Preparation of detection history dataDetection history data were generated from the winter 2015 Tul t’a track survey data, and from the data ı provided by Explor from their winter 2012/2013 track surveys (Figure 4). Similar to the Tul t’a pilot ı study, Explor used surveyors travelling by snowmobile to record tracks with a GPS with integrated digital camera, and photos were later reviewed and labeled by species. Raw track observation data were imported into ArcGIS 10.3.1 for Desktop (Esri Inc. 2015) as a point shapefile using the spatial coordinates of track photos. We focussed on three species, marten, lynx and moose, for occupancy and power analysis as they were commonly recorded in both data sets and represented a range of home range sizes (7-14 km2 for marten, 15-25 km2 for lynx, and 169-174 km2 for moose; Wright 2016). The following is a summary of the geoprocessing steps used to generate the detection history data set, further details can be found in Wright (2016). Survey route shapefiles were broken up into separate shapefiles with segment lengths of 250, 500 and 1000 m. Segments were labeled by survey route name and segments were numbered sequentially within each route (“interval #”), and sequentially across all routes combined (“segment #”). To determine the presence or absence of a given species along a survey route segment for a given temporal replicate, a spatial join was performed between the raw track observation shapefile and the survey route shapefile to count the number of observations of that species that occurred along a given segment. Segments with a count ≥1 were then assigned a value of 1 for “present”, or 0 for “absent” if there were no tracks for that species along the segment. Segments that were not surveyed on a given temporal replicate were assigned a value of “NA”. A separate shapefile for each combination of species, segment length and temporal replicate was generated from this process (e.g. “marten_250m_seg_r1.shp”). Additional attributes such as survey date, coordinates for each segment midpoint, and days since last snow were added to the attribute table.
Grids of square cells were overlaid on the study area, using grid cell widths of 3, 4, 5, 6 and 10 km. Grid cells were also numbered sequentially to give each cell a unique ID. The detection history files for survey route segments were then joined to the grid cell shapefiles so that each survey segment was assigned a grid cell number. For survey route segments that overlapped two grid cells, the segment was assigned to the grid cell in which its center occurred. This resulted in one shapefile for each combination of species, segment length, grid cell size and temporal replicate (e.g. “marten_250m_seg_3km_cell_r1.shp”). Shapefiles for the same combination of species, segment length and cell size were then merged to create one file with detection history data for all temporal replicates. Attribute tables from each of the shapefiles were then exported as comma separated text files (.csv) and merged into one table in Excel. Identifier fields were added to the table for species, cell size, and segment length.
Statistical analysisStatistical analyses focussed on estimating occupancy rates for marten, lynx, and moose, assessing the effects of temperature and days since last snow on detection probability, and assessing how different combinations of landscape cell size and survey segment length influenced occupancy estimates. Landscape grid cell widths of 3, 4, 5, 6, and 10 km, and survey route segment lengths of 500 and 1000 m were used in the analyses. Standard occupancy models were compared to models that tested for serial correlation in detection of a species along successive survey route segments (Markovian models). Power analyses were performed using simulations to assess the sampling effort required to detect a 20% change in occupancy of a species over 5 years with 80% power (Type II error rate of β = 0.2). A contractor (J. Whittington) was hired to perform the occupancy and power analysis, using both the Tul t’a (2015) and ı Explor (2012/2013) track survey data. Full details of the statistical analysis are provided in Appendix B

(Whittington 2017).
6) ResultsIn this section, the results of the project must be provided. Appropriate values for all statistical tests, if applicable, must be reported. Figures and tables should be included where appropriate.Community input at project initiationA key priority identified at the November 2014 planning workshop in Tul t’a was to ensure that youth, and ı elders work together on the project. The intention is to provide an opportunity for transfer of knowledge among generations and an opportunity for relationship building and learning about Dene relationships with wildlife and respect for the land. Harvesters and elders at the workshop emphasized the importance of passing on knowledge and traditions to youth given that they will be the future leaders of the community. Participants at the workshop also recommended potential survey routes around Tul t’a and specific people toı talk to for information about those areas, and identified hazardous areas to watch out for when crossing the Mackenzie River. Participants were supportive of trying out the Trailmark data collection app and recommended that the survey forms should include an open-ended category related to traditional knowledge so that surveyors could record text, audio or photos related to significant places, animal behavior, or landscape change. There was interest in using data from the project to monitor range expansion of muskox in the Tul t’a area. Project costs such as the price of gas, daily wages for surveyors, snow mobile rental fees ı were discussed and agreed upon at the meeting, and participants had made recommendations about safety equipment that should be carried by surveyors.
Community involvement in the projectIn March 2015, we worked with 4 community members from Tul t’a to conduct the surveys. Two of the threeı youth from Tul t’a that worked on the project in 2015 were environmental monitors in training ı (http://www.eco.ca/beahr/) and were able to use their experience on the project towards completing their certification requirements. We worked with one harvester from the community who was very skilled in identification and interpretation of wildlife tracks and the surveys provided an opportunity to pass this knowledge on to the younger field crew members. Surveyors received training in the use of the GPS and hand held computers (Archer2’s) and had an opportunity to visit and learn about new areas around Tul t’a ı that they had not been to before.
In November 2015, a meeting was held in Tul t’a with the SRRB and Tul t’a RRC to review the results from ı ı the first field season and to discuss plans for the upcoming winter 2016 field season. The second field season started with a week of training in January 2016. Three of the surveyors had worked on the project in winter 2015, and one new team member joined the project. We re-surveyed four of the same routes as in 2015 and established three new survey routes to increase spatial coverage in the study area. A training and instruction manual was developed to outline the daily tasks to be completed by a coordinator that was to be hired for the project. This included coordinating the timing of surveys conducted by field crew, archiving and uploading data at the end of each day, and managing survey equipment and supplies. A monitoring coordinator was hired by the SRRB and began training in February 2016, but unfortunately only completed two weeks of work. After the initial week of training, the two survey teams each consisting of two field crew members completed three more surveys on their own, including establishing one more new survey route on the west side of the Mackenzie River. Unfortunately no further surveys were completed after mid-February 2016. A meeting was held in Tul t’a in late April 2016 with the TRRC to discuss why the surveys didn’t continue into ı March as planned and potential adjustments that could be made to increase chances for success during the final year of the pilot project. At the time, the TRRC expressed a desire to take on a larger role in coordinating the field work to help ensure that surveys would be completed as planned, but it was agreed that another meeting was required closer to the next field season. This meeting was held in Tul t’a in November 2016 to ı discuss plans for the upcoming winter 2017 field season, including the role of the TRRC in coordinating aspects of the field work such as purchase of gas and oil, paying daily wages and snow mobile rental fees to

field crew members, and ensuring that surveys followed a regular weekly schedule. The TRRC was provided with the funds to manage coordination of the field program and payment of field crew members through a contribution agreement with the SRRB.
GNWT-ENR also met with the Norman Wells RRC (NWRRC) in November 2016 to gauge their interest in trying out the track surveys around Norman Wells. Funds were provided to the NWRRC through a contribution agreement to hire up to 4 surveyors to conduct a limited number of surveys in winter 2017. The funds were to cover daily wages and snow mobile rental fees for the field crew members. Surveys in Norman Wells were coordinated by the regional ENR office. This included purchasing gas and oil for the surveys, performing data back-ups, managing survey equipment and ensuring safety protocols were followed.
In all years of the project SRRB staff helped to coordinate the Tul t’a field crew, provided space for ı equipment storage and computers to back up data, office and meeting space for project team members, and handled financial aspects of the project such as purchase of gas, payment of field crew members and meeting participants, and contribution agreements with the RRCs. ENR staff oversaw the purchase and rental of equipment for the project, safety protocols, surveyor training, data management and analysis, and reporting.
Track SurveysIn winter 2015 (Year 1) track surveys were conducted during two 1-week sessions in March, along 5 different survey routes (Routes #1-5; Figure 1). Four of the routes were surveyed twice to provide temporal replicates for occupancy analysis. A total of 98 km was surveyed (90 km of which was surveyed twice). Ten different species and 270 track observations were recorded. Surveys occurred between 1-5 days since the previous snowfall >1 cm. In winter 2016 (Year) seven routes were surveyed, including two new routes (Routes #1-4 and 6, 8 and 9; Figure 1). A third new route (#8 Tagatui Lake; Figure 1) was scouted but was not surveyed. A total distance of 140 km was surveyed, 24 km of which was from two routes that were re-surveyed (Little Bear River and Enbridge Pipeline South survey routes, Figures 1). Nine species and a total of 153 track observations were recorded (Table 2). Surveys occurred between 1-3 days since snowfall >1 cm. In both winters, marten tracks were the most numerous of all the species recorded. Maps of all species detections recorded in winters 2015 and 2016 are provided in Appendix A.
In winter 2017, two survey teams consisting of two surveyors per team conducted surveys on 8 routes around Tul t’a. Each of the 8 routes was surveyed 4 times between January-March 2017. Nine new routes ı around Norman Wells were surveyed in February and March 2017. The four surveyors from Norman Wells initially identified for the project, did not return after the first 3 days of training, so two surveyors from Tul t’a traveled to train two new surveyors from Norman Wells and help conduct the surveys. Data from the ı winter 2017 season has not yet been fully compiled, but preliminary results suggest that tracks from at least 12 species were recorded. New species recorded in 2017 that were not encountered in winters 2015/16 include beaver, coyote and porcupine. Coyote tracks will need to be verified, but this potentially represents evidence of a northward extension of their range in the NWT (Cluff 2006). Boreal woodland caribou and wolf tracks were encountered in winters 2015 and 2017, but not in 2016.
Table 2. Total number of track observations recorded by species, and number of tracks observed per km per day since last snow, from surveys conducted along survey routes around the community of Tul t’a during ı March, 2015 and January-February, 2016
2015 2016
Species
Total Number of Track
Observations
Number of tracks/km/day since
last snow
Number of tracs
km/day since last snow

Min Mean Max
Total Number of Track
Observations Min Mean Max
Caribou 11 0.04 0.13 0.21 ND
Fox 31 0.03 0.19 0.41 15 0.15 0.15 0.15
Lynx 38 0.03 0.10 0.25 27 0.02 0.12 0.53
Marten 113 0.07 0.26 0.63 53 0.03 0.21 0.69
Mink 10 0.02 0.05 0.07 3 0.02 0.04 0.07
Moose 42 0.03 0.12 0.31 28 0.04 0.11 0.46
Muskrat NDa 1 0.03 0.03 0.03
Otter 3 0.01 0.03 0.05 ND
Porcupine ND 1 0.03 0.03 0.03
Weasel / Ermine
10 0.01 0.04 0.06 21 0.03 0.07 0.20
Wolf 7 0.03 0.06 0.11 ND
Wolverine 5 0.04 0.04 0.04 4 0.02 0.04 0.08
Grand Total 270 153a ND = No Detections
Evaluation of different devices and software used to collect dataExperience from the first two winters of surveys (2015 and 2016) indicate that the rugged handheld computers (Archer2’s) and rugged tablets (Cedar Tree CT-7) running either Trailmark Mobile or ODK Collect provided a user-friendly means to standardize data collection across observers. The units tested to date proved to be reliable in temperatures down to -27°C (surveys were not conducted at any temperatures lower than this), and we did not encounter any issues with battery life or the touchscreens due to the cold provided the units were fully charged prior to each survey.
The Olympus TG-3 camera was the simplest device to operate in that it works just like any other point-and-shoot digital camera, but it also records geographic coordinates for each photo. The digital cameras provided the highest resolution photos, which made it easier to identify tracks to species when reviewing the photos at a later date; however, the digital cameras did not provide reliably precise coordinates for the photos when compared with the Garmin GPS and Archer2’s. During winter 2015, we worked in teams of 3-4 people, and each surveyor recorded the same tracks with a different device yielding duplicate observations from these devices. The photo coordinates provided by the Olympus camera had a median distance from the coordinates of photos taken by the Archer2 and Garmin GPS of 267 and 284 m respectively (Table 2). By comparison the median distance for coordinates from photos of the same track taken by the Garmin and Archer2 was 4.2 m. The high degree of inaccuracy of the Olympus cameras was likely due to surveyors not waiting long enough time for the cameras to obtain an updated and accurate location. Unlike the Archer2s and GPSs that were operating continuously throughout the surveys (and thus continuously receiving a satellite signals to provide an accurate location), the Olympus cameras were turned off in between each track observation. We may simply have not been giving the cameras enough time to obtain an updated location each time we stopped to record a track. Doing so would have added several minutes to the time needed to record each track, so these cameras were deemed unsuitable for the surveys and were not used again in winters 2016 and 2017.
Table 2. Median distance, and range, between spatial coordinates of photos of the same track taken by the Garmin Oregon 650 GPS, the Archer2 handheld computer, and Olympus TG-3 digital GPS camera
Device 1 vs.Device 2
Median (range) distance between same observation
Garmin vs. Archer2 4.2 m(0.4 m – 761.2 m)
Garmin vs. Olympus 284.0 m(0.6 m – 38,015.4 m)
Archer2 vs. Olympus
266.7 m(3.1 m – 38,011.1 m)
Occupancy analysis and power analysisThe following is a summary of the main findings reported in Appendix B (Whittington 2017). Occupancy analyses used data from 2567 km of snow track surveys conducted over three winters by Explor (2012/2013) and Tul t’a surveyors (2015), and focussed on marten, lynx and moose (Figure 4). Survey ı routes were broken down into 500 m and 1000 m segments for the occupancy analysis. Half of the segments on all the survey routes were surveyed two or more times in a given winter. At the smallest grid cell width (3 km), 243 grid cells were surveyed, and at the largest grid cell width (10 km), 50 grid cells were surveyed. Naïve occupancy rates, meaning the simple tally of all grid cells where a species was detected, were all substantially lower than modeled (“realized”) occupancy estimates that accounted for imperfect detection, and this trend was generally consistent over all combinations of grid cell size and survey route segment length (Figure 5). Modeled occupancy rates for marten and lynxin the Tul t’a (2015) survey area were all ı close to 1, suggesting that they were likely present in all surveyed cells, whereas estimated occupancy rates for marten and lynx were lower in the Explor survey area(Figure 5). Moose were estimated to be present in almost all the cells surveyed in both the Explor and Tul t’a survey areas (Figure 5).ı

Figure 4. Detections of marten, lynx, and moose from snow tracking surveys conducted by Explor in winters 2012 and 2013, and conducted by surveyors from the community of Tul t’a, NWT in March 2015 (reproducedı from Figure 3. in Whittington 2017).

Figure 5. Naïve occupancy from observed detections (blue squares) and predicted occupancy and 95% CI from Markovian detection and Markovian occupancy models. Occupancy estimates are shown for the Explor and Tul t’a studies and for varying cell widths and segment lengthsı (reproduced from Figure 6 in Whittington 2017).
There was evidence of strong serial correlation in the detection of all three species on survey route segments (see Figure 7 in Appendix B – Whittington 2017). This means that when tracks of marten, lynx, or moose were encountered on one survey segment they were more likely to be encountered on adjacent segments. In other words we would be more likely to encounter a marten track on a segment if there had been one encountered on the previous segment surveyed. This serial correlation can result either from individuals of a species that travel long distances along the survey route (and are thus present along several consecutive segments) or because their tracks are clustered within patches of suitable habitat. Serial correlation among detections needs to be accounted for in the occupancy models otherwise there is a risk of overestimating detection probability and underestimating occupancy. Markovian models were thus best suited for estimating occupancy of marten, lynx and moose. Tracks of each these species were about 1.5 times more likely to be encountered on a survey route segment if they were encountered on the previous segment. With the Tul t’a data, the analysis suggested there was generally an 80% chance of detecting marten, lynx or ı moose if they were present in a grid cell. This held true across all grid cell sizes for marten, but probability of detection for moose and lynx decreased as grid cell size decreased. The probability of detecting marten increased with the number of days since the last snow, but this variable did not influence detection probability for moose and lynx. Moose were less likely to be detected as the 7-day average temperature preceding the survey increased. This could be because moose tended to move more at lower temperatures and would thus leave more tracks that would be encountered during a survey. Temperature did not seem to influence the probability of detecting lynx and marten.
Power to detect a 20% decrease in occupancy across five years of sampling was modeled for different combinations of landscape cell width (5 or 10 km,) survey route segment length (500 or 1000 m), baseline detection rates (probability of detecting a species on a segment when it was not detected on a previous segment; 0.05 to 0.25), and number of temporal replicates of survey routes (1 to 3). Across most combinations of grid cell size, segment length and number of temporal replicates, a sample of at least 60 grid cells would be required to detect a 20% change in occupancy over 5 years with 80% power (see Figure 14 in Appendix B – Whittington 2017). Species with very low baseline detection rates (<0.1) would likely require may require sampling more than 60 cells, but conducting at least 3 temporal replicates would provide greater

power to detect changes than completing just one survey per winter. Using a survey route segment length of 500 m rather than 1000 m also improved power to detect changes of species with low baseline detection rates. Whittington (2017) recommends that grid cell widths of 3 or 4 km could be used for monitoring marten occupancy, whereas grid cell widths of 5 or 10 km would be more suitable for monitoring wider ranging species like lynx and moose. Survey route segment lengths of 500 m would likely be suitable for all species and would provide more sensitivity to model occupancy because it results in their being more spatial replicates (segments) per grid cell.
Project costs and human resource requirementsThe following project cost estimates reflect a full-scale monitoring program in one community, with two teams of two surveyors. In winters 2015 and 2016 surveyors were paid $200/day as a daily wage, plus $150/day for the rental of their snow mobiles. The daily wage was increased to $250/day in winter 2017 after discussion with the NWRRC. We budgeted for $50/person/day for gas. For 16 days of work per winter, this amounts to $6400 per surveyor. In 2017 we also budgeted for 36 hours of work for project coordinator duties (obtaining gas + oil, data backups, equipment upkeep) at $100/hr, for a total of $3600. Leasing the handheld computers from Trailmark cost $249/unit/month, plus a $150 shipping fee, and a 6-month subscription to Trailmark software cost $1494.00 ($249/month). The first year of the monitoring program in each community also requires an investment of roughly $8000 to cover the cost of other sampling and safety equipment, including GPSs, Satellite phones, SPOT units, first aid kits, tool kits, batteries, notebooks, etc. Costs for the field component of the program are summarized in Table 3.
Table 3. Summary of yearly costs for the field-work component of a full-scale track survey program in one Sahtú community. Costs related to ENR travel for surveyor training and community engagement are not included in these estimates.
Item CostSurveyor –daily wages: $250/day x 4 surveyors x 16 days/surveyor
$16,000
Snowmobile rental fees: $150/day x 4 surveyors x 16 days/surveyor
$9,600
Gas: $50/day x 4 surveyors x 16 days/surveyor $3,200Project coordinator: $100/hour x 36 hours $3,600Trailmark equipment lease: 2 handheld computers x $199/month x 5 months + $150 shipping
$2,140
Trailmark software subscription: $249/month x 6 months $1,494Sampling + Safety equipment $8,000Total 44034
The above cost breakdown is for the field work component of the monitoring program and does not include administrative fees paid to the RRC’s and the SRRB to handle contribution agreements, which amount to roughly $6000 per season.
These cost estimates also do not include ENR travel expenses or snow mobile rental and gas for ENR staff to conduct surveyor training, or the cost of travel, honoraria and other meeting expenses to hold pre- and post-field season engagement meetings. ENR travel for these aspects of the monitoring program costs roughly $10,000 per season per community. Each meeting also costs roughly $2000 to cover honoraria, venue rental, catering and admin fees ($4000 total per season).
Altogether it costs about $65,000 for the first year of a full-scale track monitoring program in one community. In subsequent years, expenditures on equipment should be less, so we might expect costs to go down to roughly $60,000 per community per year.

There are also human resource requirements for ENR and the SRRB to run the program which are provided in-kind. It is difficult to estimate the number hours required for ENR and SRRB staff to oversee the field program, travel for meetings and surveyor training, and to compile the field data, analyze data and prepare reports. Typically two ENR staff (one from headquarters in Yellowknife and one regional staff from Norman Wells) and two SRRB staff (one program coordinator and one office manager) have been involved in the project each winter. ENR involvement in the project is likely equivalent to half a full time equivalent per year for both staff combined. SRRB staff dedicated on average one day per week from December to March coordinate work with Tul t’a surveyors and the TRRC. A similar time investment was required by TRRC staff ı and volunteer coordinator during winter 2017.
7) Resource Management ImplicationsIn this section, describe how the results will apply to northerners, particularly environmental regulators, Aboriginal organizations, and community members. (3-5 bullets)
Data collected from this project will contribute to baseline information on the distribution and relative abundance of up to 12 species of the active winter mammal community, both within and outside of areas of recent oil and gas exploration.
Occupancy and power analyses undertaken thus far have helped to determine appropriate grid cell sizes and survey segment lengths to use for common species such as marten, lynx and moose, and the minimum sampling effort that will be required to detect temporal changes in occupancy over a 5 year period.
The data collected can be used by ENR, the SRRB and the RRCs to help inform preliminary screenings and environmental assessments of development projects for their potential impacts to wildlife.
Data can be further analyzed to assess relationships between different aspects of landscape composition (e.g. proportion of different habitat types in a grid cell) and human disturbance and species occupancy within different grid cells.
Training and experience gained by community members that are hired as surveyors will help to build a pool of qualified environmental monitors in each community.
Having older and younger harvesters work together in teams helps to ensure knowledge transfer about wildlife track identification and interpretation.
Ongoing collaboration between ENR, SRRB and the RRC’s on this project will help to strengthen working relationships between these organizations.
Experience from this project has provided important lessons about the challenges of implementing a monitoring program that relies extensively on community involvement, such as: the need for ongoing engagement with project partners, availability of surveyors and conflicts with other employment opportunities, the need for training and skill development for community-based project coordinators, limited staff capacity within the SRRB and RRC to actively participate in and benefit from the program, and repair and maintenance of surveyor’s snowmobiles.
The methods and protocols for track surveys used in the project can be easily adopted by oil and gas companies that may operate in the region, and the data collected within their exploration or production licence areas could be pooled with data collected by communities to provide greater spatial coverage and in turn, power to detect cumulative impacts on wildlife
8) Project LinkagesPlease state how NWT decision-makers and communities are engaged in the project as approved in the original proposal. Identify any new linkages that have emerged during the project and the value of those

new linkages. Eg. A new decision-maker has been identified that can use the data or results. Include a list of dates and times of meetings and presentations with communities and/or decision-makers. Include a description of who attended the meetings. (Suggest 2 paragraphs)Although the original project proposal sought to establish a track monitoring program in each of the 5 Sahtú communities, and to work with oil and gas companies that were active in the region at the time (ConocoPhilips Ltd., Husky Energy Inc. and MGM Energy Corp.) to establish programs within their exploration licence areas, it was decided through discussion with the SRRB that a pilot program in one community was a more realistic goal for the project. GNWT-ENR has worked closely with the SRRB and the TRRC on a pilot program for the past three years, which has provided numerous lessons about the challenges of establishing a community-based monitoring program which can be applied when introducing this program in other Sahtú communities. Prior to starting field work we sought input from the SRRB and TRRC on several aspects for the project including project goals, survey equipment, logistics and safety considerations, and survey route selection. Following each field season summary reports about the work undertaken and data collected were provided to the SRRB and TRRC. Each fall we held meetings in Tul t’a to discuss the results and challenges from the previous winter and plans for the ı upcoming winter. Additionally, we provided overviews of the project and hands-on demonstrations at the 2015 Sahtú Cross Cultural Research Camp, and at the Norman Wells High School winter camp. In the final year of the project we introduced the program in Norman Wells and surveyed 9 routes around that community.
Oil and gas exploration in the Sahtú region started to wind down during the first winter of the project, so we were unable to involve industry in the field data collection. However, we worked closely with Explor on the preliminary occupancy analysis and power analysis to further inform the design of the program (Whittington 2017). Explor provided an extensive track survey data set that they collected during their 2012/2013 Tul t’a 2D seismic program.ı
Enbridge Inc. has conducted wildlife surveys along the Norman Wells to Zama pipeline for many years, and there may be an opportunity to discuss whether they might adopt the methodology and technology used in this project for their pipeline surveys.
Meetings and Presentations (not including ENR participation in field work and surveyor training):
A 2-day workshop was held in Tul t’a, Nov. 26-27, 2014. Participants (18 in total) at the workshop ı included SRRB staff, youth environmental monitors in training, harvesters, and elders from Tul t’a, and ı ENR staff. Representatives from Explor and ConocoPhilips also participated in portions of the workshop by teleconference. (http://sdw.enr.gov.nt.ca/nwtdp_upload/Sahtú%20winter%20snow%20tracking%20program%20-%20summary%20for%20ESRF%20CCR%20camp%20-%2001July2015.pdf )
Presentation and hands-on demonstration – Sahtú ESRF Cross-cultural Research Camp – July 4-11, 2015 - Sahtú community members, ENR, SRRB, and youth environmental monitors in training – (http://sdw.enr.gov.nt.ca/nwtdp_upload/Sahtú%20winter%20snow%20tracking%20program%20-%20summary%20for%20ESRF%20CCR%20camp%20-%2001July2015.pdf )
Project Results Presentation and Fieldwork Planning Meeting – Tul t’a – Nov. 10, 2015ı - ENR, SRRB, Tul t’a RRC and community members (ı http://sdw.enr.gov.nt.ca/nwtdp_upload/Snow%20track%20monitoring%20program%20presentation%20-%20Tul t’a%20-%2010Nov2015%20-ı %20CIMP162%20-%20for%20NWT%20Discovery%20Portal.pdf )
Poster Presentation – Yellowknife Geoscience Forum –Nov. 25, 2015 - Industry, Government, Academia (http://sdw.enr.gov.nt.ca/nwtdp_upload/Sahtú%20widlife%20snow%20track%20monitoring%20program%20-%20NWT%20Geoscience%20Forum%20-%202015%20-v2-1.pdf )

Hands-on project demonstration – Norman Wells High School Winter Camp – March 16, 2016 - Two ENR staff and 6 high school students
Community meeting – Tul t’a – April 27, 2016ı – ENR, SRRB and TRRC members – meeting to discuss issues encountered during winter 2016 field season
Community meeting – Tul t’a – November 08, 2016ı – ENR, SRRB, TRRC members and surveyors – meeting to discuss issues encountered during winter 2016 field season, winter 2016 results, and plans for winter 2017 field season
Meeting with NWRRC – Norman Wells - November 28, 2016 – ENR and NWRRC members (~10 people) – Provided an overview of the track survey project and discussed whether NWRRC was interested in starting up the program in Norman Wells
9) DiscussionThis section should explain the results of the project and must clearly articulate how the project results advance the understanding of cumulative impacts in the NWT.The primary goal of this project was to design and test a wildlife monitoring program based on winter surveys of wildlife tracks that could be used to detect and monitor cumulative impacts to wildlife from oil and gas exploration and development within the Sahtú Settlement Area. The need for such a program arose from the potential for a large increase in oil and gas exploration and development activity associated with the discovery of significant shale oil resources in the region (NEB 2015). At present there are no long term monitoring programs in place for wildlife within the Sahtú region that could detect changes to abundance and distribution of wildlife due to oil and gas development.
Winter track surveys have been used elsewhere as a cost-effective, non-invasive means of monitoring medium- to large-sized mammal species and there is extensive literature on methodological aspects of track surveys and application of the data to different management questions. This project focussed on developing a model for such a program in the Sahtú region by conducting a pilot project in collaboration with wildlife co-management organizations based in the community of Tul t’a over a three year period. ı To be effective at detecting cumulative impacts of industry on multiple wildlife species, the winter track survey program will need to be conducted at a regional scale and over multiple years. It is intended that this program will be introduced to other Sahtú communities in the future and hopefully adopted by oil and gas companies or other proponents of development projects operating in the region so that it can be appropriately scaled to provide the regional coverage necessary to measure cumulative impacts. This project provided essential information on the design of occupancy-based wildlife monitoring program and the sampling effort that will be required to detect changes in wildlife distribution over time attributable to cumulative development effects. This project also provided important information on challenges that will be faced in trying to continue the program in Tul t’a and to expand it to other Sahtú ı communities.
Community involvementGiven the current lull in oil and gas exploration activity in the Sahtú region, this project was entirely focussed on a community-based model for carrying out the track surveys. Early engagement with the SRRB and TRRC prior to starting up any field work was essential to building support for the project from these organizations and for identifying some of the logistical and capacity challenges that we would face early on. One challenge was to try and build a program that would be robust from a scientific perspective while also ensuring meaningful involvement of community members and collection of

information that was pertinent to their interests. As recommended by the TRRC, having surveyors work in teams consisting of one older and one younger harvester provided an excellent opportunity for inter-generational knowledge exchange and training the next generation of harvesters in the identification of wildlife tracks. When conducting the training sessions and surveys we always looked to the older harvesters to confirm track identification and they provided interpretations about the tracks we were seeing that would not have been possible without their involvement. Participation in the track survey project also helps to contribute towards skill development that monitors will need to complete their environmental monitor certification. Although it is not a primary goal of this project, the track survey program also provided surveyors with part-time employment and income at a time when there were few opportunities available in the community.
Study DesignWinter track surveys may be able to provide monitoring data to detect changes in the relative abundance or distribution of at least 10 mammal species in the Sahtú region, as well detection of species that may be expanding their range to new areas of the NWT (e.g. coyote tracks recorded in winter 2017 and reports of muskox range expansion). Power analysis suggested that to detect a 20% change in the distribution of a given species over a 5 year period we would need to sample at least 60 landscape cells with at least three surveys per cell each winter. In the final year of this project, Tul t’a surveyors were able to conduct 4 ı replicate surveys on each of 8 survey routes between January and March. These 8 survey routes sampled 28 five by five (5x5) km landscape cells. While it is not likely feasible for one community to sample the recommended 60 cells to achieve sufficient power to detect a 20% change in occupancy of a species over five years, sampling 30 - 5x5 km cells per community should be feasible, and data from each community could be combined to achieve the target minimum sample 60 cells. Norman Wells and Tul t’a are close ı enough together that one contiguous study area between the two communities could be surveyed. At the largest cell size (10 x 10 km), it may only be feasible to reach the 60 cell minimum sample size by establishing study areas around all 5 Sahtú communities, or if oil and gas companies resume oil and gas exploration and development in the region and establish further study areas within their tenures. This may limit the capacity to monitor changes in the distribution of species with the largest winter home ranges such as boreal caribou, wolverine and wolves. Although boreal caribou were a focal species in the proposal for this project they were only detected in five of the 5 x 5 km cells in the first winter of the project (2015), all of which were along the same survey route to Willow Lake. Preliminary results from winter 2017 suggest there were more boreal caribou tracks detected, including along the new routes surveyed around Norman Wells. Future analyses will focus on this species to determine detection probability and realized occupancy accounting for imperfect detection.
There is likely room for further sensitivity analysis to determine the appropriate landscape cell size for different species. If the cell size used is too large models will likely predict 100% occupancy and it might take drastic changes in species abundance or distribution before the occupancy models detect a change. It will take at least three more winters of data collection in Tul t’a before temporal trends in occupancy ofı different species can be assessed.
Data collectionThe use of mobile data collection apps is becoming increasing popular in citizen science (Newman et al. 2012). For this project, it represented a means to ensuring standardization and completeness of data collection because the data collection app required surveyors to answer the same set of questions each time they stop to record a wildlife track. The option to record audio files on a subset of the forms also ensures that there is flexibility to record other information that is not captured in the pre-set answers on the survey forms. Taking georeferenced photos of tracks and other wildlife signs could allow for independent verification of species identification if desired. Recording the exact location of each track encounter as opposed to simply tallying the number or presence/absence of tracks of a species on a given

survey route segment also means the data can be used for additional purposes such as habitat selection analyses. The elimination of paper from most of the data collection also represents a large time saving as project team members do not need to enter data manually into a database at the end of the season. The use of mobile data collection technology was relatively simple to implement using either proprietary (Trailmark) or free software (ODK collect), and the technology should be easily adopted by other Sahtú communities and oil and gas companies operating in the region.
Feedback from surveyors that used the Trailmark Mobile app indicated that it was generally easy to use and appreciated that it helped with standardization because all the survey questions had to be answered each time they stopped to record an observation. However, the Trailmark Mobile app tended to crash a few times each day and the app had to be restarted each time. This did not result in any data loss, but did result in some delays in the field. The CT-7 tablet running the ODK Collect app was only tested by the project lead (J.Hodson) during 5 days in winter 2016, but based on this limited testing the CT-7 seemed to work just as well under the field conditions encountered as the Archer2’s, and the ODK Collect app proved to be reliable in the field. The CT-7 tablet has a larger screen, a higher resolution camera and is lighter weight than the Archer2’s but seemed to have a more limited battery life and is likely less durable in the long run than the Archer2’s. While ODK Collect is freeware (versus Trailmark which has a $250/month subscription fee), the interface for designing the data collection forms, visualizing data, and downloading data from the ODK collect website is not as user friendly as Trailmark and there is no technical support available. One key difference between the two apps is that Trailmark Mobile also includes map tiles that are downloaded onto each handheld unit so that surveyors can visualize the route travelled and observations recorded appear as waypoints on the map. The Trailmark web interface also allows users to upload spatial data to the website that is then displayed on the map in Trailmark Mobile, which may be useful if surveyors need to follow a survey route that they are not yet familiar with. Because Trailmark uses freely available maps for their mobile app, there are limitations to how detailed the maps displayed on the devices can be (i.e. how far you can zoom in), which currently limits theutility of this features for the track surveys. The main advantage to using a mobile data collection app to record the track survey data is that all pertinent information is entered in the field, the data can be uploaded at the end of each day to cloud storage, and can then be accessed by other project team members remotely. Paperless data collection also saves time post-field season as it eliminates the need to enter data manually, and avoids issues associated with trying to decipher hand writing. One of the limitations of having to answer all the questions on the mobile data collection forms each time a surveyor stopped to record a track is there is a trade-off between deciding whether to have surveyors record redundant information each time they stop, or having them record some information on paper. For example, surveyors had to record the survey start and end time, start and end locations, temperature and days since last snow in a field notebook. If we had included these variables in the Trailmark Mobile data collection forms, surveyors would have had to enter this information every time they stopped to record a track, which would have resulted in unnecessary duplication of information and increased time required to record pertinent information each time they stopped. This may not be an issue in the future as Trailmark now allows users to run more than one data collection project on each device, so we could for example create one series of forms for survey start-up, one for recording track observations, and one for the end of the survey. ODK collect also allows for multiple data collection projects to be run on the same device. This would allow for completely paperless data recording in the future.
Although the younger surveyors were comfortable using Trailmark Mobile to record data (likely given their familiarity with the use of smart phones), the older surveyors (those with greater experience in track identification) were not as interested in learning to use the app, and instead preferred just to take photos of tracks and surrounding habitat using either the Garmin Oregon 650 GPS or the Olympus TG-3 digital camera. The GPS and digital camera are much simpler to use, but have the disadvantage that information associated with each track is not recorded simultaneously, and tracks must be then be

identified to species when reviewing the photos back in the office. It is often difficult to identify tracks to species when light conditions are poor (e.g. tracks are hard to distinguish from the surrounding snow when there are cloudy skies or dim light due to low contrast) or the photos are out of focus. Some training is also required to ensure that surveyors are recording a track log with the GPS each time they go out.
It is recommended that survey teams continue to record observations with both the mobile app and the GPS to provide some redundancy. The GPS also provides a continuous track log from each survey day which can be useful for verifying the starting and ending locations of each survey. To decrease costs in the long term project partners may wish to investigate the development of a mobile app that is specifically tailored to this project to eliminate annual subscription fees, and to purchase rugged tablets or field computers rather than leasing them on an annual basis.
Logistical and community capacity challenges and solutionsThe pilot project with Tul t’a helped to identify a number of logistical and capacity challenges that will ı likely be faced in each of the Sahtú communities as the program expands. Identifying survey routes was not as straightforward as we might have thought. Despite there being a long history of oil and gas exploration in the region that has left an extensive network of seismic lines, many of these lines are overgrown and no longer easily travelled by snow mobile. Identifying potential routes also requires finding the right people in the community that are knowledgeable about an area of interest. Community members tend to travel predominantly in areas where their families have traditionally travelled, hunted and trapped and they may not be familiar with all the areas surrounding the community. People were also not familiar with all of the seismic lines in the area and could not provide information on whether they could be easily traveled. This means that new survey routes will need to be scouted first to see if they are suitable as long-term survey routes.
One of the long-term goals of this project is to build capacity within each Sahtú community so that they can coordinate and carry out the field work with minimal oversight from ENR. Although field crew have the necessary skills and experience to easily undertake the surveys, there is a clear need for a project coordinator within the community to ensure that they have what they need to do the surveys (gas, oil, and equipment), to make sure they are going out to do the surveys as scheduled, to oversee their safety, and to manage the data and equipment. Finding capacity within wildlife co-management or establishing partnerships with other organizations in each Sahtú community to fulfill these roles will be key to the long-term success of this monitoring program. The fact that the SRRB office and staff are based in Tul t’a ı contributed greatly to the success of this pilot project, as they were able to provide coordination and oversight for the project, space to store the equipment, and computers and wireless network for data management. In Norman Wells, the ENR office can fulfill this coordinating role, but it is not yet clear who will be able to fulfill these roles if the program is introduced in the remaining Sahtú communities.
An important logistical challenge we encountered in Tul t’a was that gas can only be purchased during ı restricted times of day (11:00-12:00 and 14:00-16:00), meaning that surveyors are not able to get gas before they head out in the morning or when they return in the evening, making it challenging to complete several successive days of surveys. Having a coordinator in town that can ensure there are full jerry cans for surveyors to refill their snowmobiles at the beginning or end of each survey day helped to address this issue. After each survey day, data collected needs to be backed up on a local computer hard drive, and before the Trailmark data is uploaded through a wireless network to Trailmark’s server. Once data is uploaded wirelessly to Trailmark’s server it is automatically deleted from the units. Photos and track logs on the GPSs also needs to be backed up, and other survey and safety equipment needs to be recharged. The Tul t’a RRC does not have full time staff to complete these tasks, nor do they have the ı office space necessary to accommodate the equipment for the project. As such, we relied heavily on the

SRRB office as our base of operations. During the first winter, the project lead participated in all the surveys and undertook all of the data and equipment management in the evenings. In the second winter (2016) of the project, we intended to hire a project coordinator that would work part time out of the SRRB office and for the Tul t’a field crew members to continue doing the track surveys on their own ı during February and March after the initial week of training in January. Unfortunately, only three more surveys were completed after the week of training, and the coordinator that was hired for the project quit after 2 weeks. At meetings held in Tul t’a in May, and again in November, 2016, to discuss what went ı wrong in winter 2016, some of the issues brought forth included:
o Underestimating the time required for the SRRB to train a coordinator, and the computer skillset necessary for the coordinator to be able to take on this role without too much supervision;
o Given that there was no coordinator or clear leader for the project in the community, field crew may have been waiting around for someone to tell them it was o.k. to go out and survey, and then lost interest when they didn’t hear from anybody for a while;
o We didn’t pre-determine the survey teams so people weren’t sure who they were supposed to work with;
o Existing SRRB staff didn’t have the capacity to take on the coordination role at the time due to the demands of other projects; and,
o There were other full time job opportunities that arose that pulled people away from participating in the track survey project.
To address these issues in the final winter of the project (2017) it was suggested that the TRRC take on the coordination of purchasing gas and oil for the monitors and paying monitor daily wages and ski doo rental fees. It was also suggested that the teams be fixed throughout the season, and that surveyors should go out on specific days of the week rather than waiting for the coordinator to call them to tell them conditions were appropriate to go out and survey. In the end it was decided that teams would go out every Tuesday and Thursday, and teams rotated which routes they surveyed so that each team surveyed each route twice (a total of 8 routes were each surveyed 4 times). If conditions were not appropriate to go out on scheduled days, the surveys were pushed back to a later day that week. Rather than hiring an additional person on a part time basis to work at the SRRB to perform the data and equipment management, one of the field crew members was trained and paid an extra weekly wage to complete these tasks and came in to the SRRB office on the days following a survey. This seemed to be a successful model that could be built upon in future years, as all of the surveys were completed as planned and the TRRC remained within their budget for the work. Although this approach worked well, there was still a need for SRRB staff to provide support and oversight for the project.
In Norman Wells we had difficulty finding NWRRC members and monitors that were available to do the work in winter 2017. ENR staff in Norman Wells were coordinating the project which included getting gas and oil for the monitors and completing the data backups and equipment upkeep. Four people were initially trained and completed two surveys, but they then left the project due to conflicts with their full time jobs. Some of the Norman Wells monitors would have preferred to do the work on the weekends, but weather conditions were not appropriate for surveys when they were available. . Later in the season two of the Tul t’a surveyors travelled to Norman Wells to help complete one survey on each of the 8 ı routes that had been identified in discussion with NWRRC. They also trained two new Norman Wells field crew members on the survey methodology and use of Trailmark and the GPSs.
Having a fixed schedule for surveyors to go out and conduct the surveys will likely work better than having them go out on an on-call basis, as there is more predictability for the surveyors and less need for a coordinator to monitor weather conditions and call people when it’s appropriate to go out. However, there is a trade-off in that the surveys may not end up being conducted under ideal conditions which is

generally 3-6 days since the last snowfall > 1 cm (Bayne et al. 2006).
Snow mobile maintenance and repairs were a topic of ongoing discussion throughout the project. Although field crew were paid a daily snow mobile rental fee of $150 that was intended to cover the regular maintenance cost for their snow mobiles, there were some mechanical issues that arose that cost in excess of $2000 to fix and we had to use unallocated project funding to cover the costs of these repairs. After this first incident, it was decided to maintain a reserve fund of $5000 each year to cover these more costly repairs. As there are no snow mobile dealers in the communities, finding qualified mechanics and the parts for the repairs is a challenge. If costly mechanical issues or damage to snow mobiles occur early in the field season, monitors would not be able to cover the cost of repairs based on the daily snow mobile rental fee and could end up without a snow mobile and potentially be unable to continue to work on the project for the rest of the season. It would be helpful in future years to have a written snow mobile rental agreement signed by surveyors and project staff that clarifies expectations around the condition of their snow mobile at the start of the season and what the rental fees are intended to cover in terms of ongoing maintenance costs.
10) RecommendationsIn this section, provide recommendations regarding how the results of the project can be applied to advance the understanding of cumulative impacts in the NWT or how NWT CIMP can help to continue the transfer of this knowledge to NWT decision-makers and communities. Projects should clearly describe how the results and knowledge generated from the project could be used to make effective resource management decisions. Please explain the next steps for follow-up to this project, if applicable.To provide adequate data to detect and monitor cumulative impacts of oil and gas development in the Sahtú region on wildlife based on changes in species occupancy, the winter track monitoring program will need to expand to at least three communities to reach the minimum recommended sample size of landscape cells surveyed. In Tul t’a, the program needs to be slightly expanded to ensure that at least 30 ı landscape cells are sampled. Another 30 cells could easily be sampled around Norman Wells based on the routes that were surveyed in 2017, but we will need to identify community members that are available to do the surveys throughout the winter. Introducing the program in Fort Good Hope would be the next logical step as they are closer to the areas of shale oil exploration than Deline or Colville Lake. Each community would need to have two teams of two surveyors working 15-20 days per winter to ensure that each route is surveyed at least three times.
With the data collected in winter 2017 it should be possible to conduct occupancy analyses for additional species such as boreal caribou, mink, weasels, and wolverine. We can also begin to evaluate whether landscape covariates such as habitat composition and disturbance footprint within survey cells explain the likelihood of a landscape cell being occupied by a given species. The community-based track survey program is, however, currently limited to surveying areas that can be reached within one day, making it difficult to sample some of the areas of focus for oil and gas exploration that are on the west side of the Mackenzie River. Multi-day surveys with teams staying overnight at remote cabins (where available) in some areas may be feasible but this will add to logistical complexity and safety risks. If and when oil and gas exploration resumes in the Sahtú region it may be more appropriate for industry to sample these more remote areas as they will have the camps and infrastructure in place to support the work. It would also be of value to survey areas further away from communities where there is less potential for industrial development in order to provide a wider gradient in human development footprint.
For the track survey program to be of value to participating Sahtú communities it will be essential that they have access to the data and receive regular reports and updates on the project. Data collected to date around Tul t’aı and Norman Wells will be provided to each participating RRC and to the SRRB so that it can be used to support their decision making processes. The data collected by this projectwill also be

entered into the GNWT-ENR’s Wildlife Management Information System so that it can be shared with other users upon request and subject to approval by ENR, the RRCs and SRRB. The long-term viability of the winter track survey program will of course depend on securing adequate annual funding from the GNWT, the CIMP program or other funding sources. It will also depend on the continued support of Sahtú wildlife co-management organizations and community members, which in turn requires ongoing engagement with participating communities. This element of the project will be key to its success and should be factored into any future funding requests. Although it could be argued that with the current lull in oil and gas exploration in the region the need for a long-term multi-species wildlife program is not as pressing, we should view it as an important opportunity to establish such a program to gather baseline data before oil and gas activity resumes. Otherwise we may lose an opportunity to measure wildlife distribution before further landscape change brought about by development occurs.
11) AcknowledgementsIf applicable.NWT CIMP and GNWT-ENR Wildlife Division provided financial support necessary to carry out this project. An extensive track survey data from the Tul t’a area was provided in-kind by Explor for use in ı the sensitivity and power analyses used to inform the design of the track monitoring program.
Extensive support was provided by Sahtú Renewable Resources Board (SRRB) staff and associates: Deb Simmons, Joe Hanlon, Lori Ann Lennie, Ceilidh Stubbs. The SRRB provided in-kind staff support and office space necessary to carry out the Tul t’aı pilot project and served as a key liaison with the Renewable Resource Councils and Tul t’aı community members. The SRRB also provided extensive administrative support in terms of disbursing surveyor salaries and snowmobile rental fees, purchasing gas and supplies, paying honoraria to meeting participants and organizing meeting logistics.
Several Tul t’a surveyors contributed to the track surveys and ensured they were conducted in a safe and ı responsible manner: William Horassi, Jonathon Yakeleya, Philip Clement, Robert Horassi, Joanne Krutko, Dion Lennie, and Joseph Ayah.
Many Tul t’a RRC board members and staff provided valuable input, support and participation: Rı odrick Yallee, Gordon Yakeleya, Rocky Norweigan, Lindsay Norweigan, Ricky Andrew, Angus Lennie. Roy Desjarlais volunteered to coordinate the Tul t’a field work in 2017 on behalf of the TRRC.ı
Norman Wells surveyors included Christopher Brass, Bryson Rogers, Stuart Pope, Norm Hodson Jr., Brian Leblue, Kaden Lennie. The Norman Wells RRC administered surveyor wages and snowmobile rentals.
Jesse Tigner from Explor provided advice on track survey logistics, the CIMP funding proposal, prepared the Explor track data for analysis, and provided input and review of the occupancy and power analyses.
Jesse Whittington provided advice on the design of occupancy-based wildlife monitoring and snow track surveys, and conducted the occupancy and power analysis.
Wendy Wright developed GIS methodology and tools to prepare track survey data for occupancy analysis.
GNWT-ENR Sahtú region office and staff (Stephanie Behrens, Heather Sayine-Crawford, Jennie Vandermeer, Liam Coedy, Ron Doctor and Richard Popko) provided advice on study design, logistical support, as well as a snowmobile (sorry I broke it!) and equipment in winter 2015. Stephanie Behrens

provided coordination of the Norman Wells surveys in winter 2017. Tonya Makletzoff with GNWT-ENR Conservation Assessment and Monitoring Division assisted with getting field work started in winter 2017. Bryana Matthews and Kimberly Heisler assisted with data entry.
12) Literature CitedFinal reports must provide appropriate citationsAlberta Biodiversity Monitoring Institute (ABMI). 2014. Terrestrial field data collectionprotocols (abridged version) 2014-03-21. Alberta Biodiversity Monitoring Institute, Alberta, Canada.Report available at: abmi.ca
Bayne, E.M., Gray, C. and Litke, J. 2006. ABMP winter tracking via snowmobile. 2005/2006 protocol assessment. The Alberta Biodiversity Monitoring Program, Alberta, Canada. Available from ABMP, c/o Alberta Research Council, Bag 4000, Vegreville, AB T9C 1T4, Canada.
Cluff, H. Dean. 2006. Extension of Coyote, Canis latrans, breeding range in the Northwest Territories, Canada. Canadian Field-Naturalist 120(1): 67-70.
COSEWIC. 2014. COSEWIC assessment and status report on the Caribou Rangifer tarandus, Newfoundland population, Atlantic-Gaspésie population and Boreal population, in Canada. Committee on the Status of Endangered Wildlife in Canada. Ottawa. xxiii + 128 pp. (www.registrelep-sararegistry.gc.ca/default_e.cfm).
Dawe, K.L., Bayne, E.M. and S. Boutin. 2014. Influence of climate and human land use on the distributionof white-tailed deer (Odocoileus virginianus) in the western boreal forest. Canadian Journal of Zoology 92: 353–363
Fisher, J.T., and C. Burton. 2012. Monitoring Mammals in Alberta: Recommendations for Remote Camera Trapping. Alberta Innovates - Technology Futures and Alberta Biodiversity Monitoring Institute. Edmonton, Alberta, Canada. 42 pp.
Gilbert, B. S., & Boutin, S. 1991. Effect of moonlight on winter activity of showshoe hares. Arctic and Alpine Research, 61-65.
Helle, P., Ikonen, K. and A. Kantola. 2016. Wildlife monitoring in Finland: online information for gameadministration, hunters, and the wider public. Canadian Journal of Forest Research 46: 1491-1496.
Hervieux, D., M. Hebblewhite, N. J. Decesare, M. Russell, K. Smith, S. Robertson, and S. Boutin. 2013. Widespread declines in woodland caribou ( Rangifer tarandus caribou ) continue in Alberta. Canadian Journal of Zoology 882: 872–882.
Hines, J.E., J.D. Nichols, J.A. Royle, D.I. Mackenzie, A.M. Gopalaswamy, N. Samba Kumar, and K.U. Karanth. 2010. Tigers on trails: occupancy modeling for cluster sampling. Ecological Applications 20(5): 1456-1466.
Kurki, S., Nikula, A., Helle, P., and H. Lindén. 1998. Abundances of red fox and pine marten in relation to the composition of boreal forest landscapes. Journal of Animal Ecology 67(6): 874–886
Lindén, H., Helle, E., Helle, P., and Wikman, M. 1996. Wildlife triangle scheme in Finland: methods and aims for monitoring wildlife populations. Finnish Game Research, 49: 4–11.

MacKenzie, D.I., J.D. Nichols, G.B. Lachman, S. Droege, J. A. Royle, and C.A. Langtimm. 2002. Estimating site occupancy rates when detection probabilities are less than one. Ecology 83(8): 2248-2255.
MacKenzie, D.I., J.D. Nichols, J.A. Royle, K.H. Pollock, L.L. Bailey, and J.E. Hines. 2006. Occupancy estimation and modeling: inferring patterns and dynamics of species occurrence. Elsevier, New York, USA.
National Energy Board. 2015. Energy Briefing Note - An Assessment of the Unconventional Petroleum Resources of the Bluefish Shale and the Canol Shale in the Northwest Territories. 12 pp.
Sorensen, T., P. D. McLoughlin, D. Hervieux, E. Dzus, J. Nolan, B. Wynes, and S. Boutin. 2008. Sustainable levels of cumulative effects for boreal caribou. Journal of Wildlife Management 72:900-905.Species at Risk Committee. 2012. Species Status Report for Boreal Caribou (Rangifer tarandus caribou) in the Northwest Territories. Species at Risk Committee, Yellowknife, NT.
Toews, M., F. Juanes, and A. C. Burton. 2017. Mammal responses to human footprint vary with spatial extent but not with spatial grain. Ecosphere 8(3):e01735. 10.1002/ecs2.1735
Whittington, J. and K. Heuer. 2012. Multi-species occupancy monitoring using snow surveys in Banff National Park. Banff National Park of Canada, Parks Canada Agency. Banff, Alberta.
Whittington, J., K. Heuer, B. Hunt, M. Hebblewhite, and P. M. Lukacs. 2015. Estimating occupancy using spatially and temporally replicated snow surveys. Animal Conservation 18:92-101
Whittington, J. 2017. Spatial distribution of marten, lynx, and moose and power to detect trends in occupancy using snow-tracking data from the Tul t’a and Norman Wells region of the Northwest ı Territories. Report submitted to GNWT-ENR. Available at: http://sdw.enr.gov.nt.ca/nwtdp_upload/Whittington%202017%20NWT%20SnowTracking%20Report_final.pdf
Wright, W. 2016. Preliminary Data Preparation and Analysis to Inform Future Power Analyses and Study Design Assessment for a Sahtú Winter Snow Track Survey Program. Report submitted to GNWT-ENR. Available at: http://sdw.enr.gov.nt.ca/nwtdp_upload/Preliminary%20data%20preparation%20and%20analysis%20-%20Sahtú%20winter%20snow%20track%20survey%20program_04Feb2016.pdf
13 ) AppendicesAttach Appendices as appropriate.Appendix A – Maps of species detections from track surveys conducted around the community of Tul t’a ı in winters 2015 and 2016
Appendix B - Whittington, J. 2017. Spatial distribution of marten, lynx, and moose and power to detect trends in occupancy using snow-tracking data from the Tul t’a and Norman Wells region of the ı Northwest Territories. Report submitted to GNWT-ENR. (pdf copy attached)

Appendix A – Tracks of species encountered during track surveys conducted around the community of Tul t’a in winters 2015 and 2016. Five by five km grid ı cells are displayed on each map.
# Caribou
E Fox
^ Lynx
X Marten
$ Mink
! Moose
D Otter
7 Porcupine
> Weasel/ermine
!. Wolf
"/ Wolverine
Survey Routes

Appendix B – Whittington (2017)
Spatial distribution of marten, lynx, and moose and power to detect trends in occupancy using snow-tracking data from the Tulita and Norman Wells region of the Northwest Territories
Jesse WhittingtonCanmore, AlbertaJanuary, 2017
Report prepared forJames HodsonWildlife Biologist, Environmental Assessment/HabitatWildlife Research and Management UnitWildlife DivisionDepartment of Environment and Natural ResourcesGovernment of the Northwest Territories
Funding provided by:
(Project 162)

Table of Contents
Introduction........................................................................................................................................... 1
Methods................................................................................................................................................... 2DATA COLLECTION...................................................................................................................................................................................2DATA ANALYSIS......................................................................................................................................................................................... 3POWER ANALYSIS..................................................................................................................................................................................... 5
Results..................................................................................................................................................... 6SNOW TRACKING...................................................................................................................................................................................... 6STATISTICAL POWER...........................................................................................................................................................................13
Discussion............................................................................................................................................ 14
Acknowledgements........................................................................................................................... 15
Literature cited................................................................................................................................... 16
Appendix.............................................................................................................................................. 18
ii

Table of FiguresFigure 1. The cumulative probability of detecting a species at least once across replicate surveys depends on the probability of detection p and the number of replicate surveys........................................................................................1Figure 2. Map of snow-tracking transects in the Norman Wells and Tulita regions of the Northwest Territories.......................................................................................................................................................................................................... 2Figure 3. Detections of marten, lynx, and moose from snow tracking surveys, NWT.....................................................7Figure 4. Number of grid cells surveyed by Explor, Tulita, and the two studies together..............................................8Figure 5. Boxplots for the number of spatial (segments per grid cell) and temporal (repeat surveys) versus grid cell width and segment length.........................................................................................................................................................8Figure 6. Naïve occupancy from observed detections (blue squares) and predicted occupancy and 95% CI from Markovian detection and Markovian occupancy models. Occupancy estimates are shown for the Explor and Tulita studies and for varying cell widths and segment lengths.......................................................................................9Figure 7. Probability of segment use given cell occupancy in the left graph depended on whether the previous segment was used. The right graph shows probability of detection with 95% CI given cell occupancy and segment use....................................................................................................................................................................................................... 9Figure 8. Probability of detection and 95% CI given cell occupancy for Markovian detection models. The left graph shows probability of detection when the species was and was not detected on the previous segment. The right graph shows how detecting a species on the previous segment increases probability of detection on the logit scale..................................................................................................................................................................................................10Figure 9. Cumulative probability of detection from sampled grid cells. Cumulative probability of detection was calculated 1 - (1 - pmean)k, where k was the number of spatial and temporal replicates and pmean was the equilibrium probability of detection from when the species was and was not detected on the previous segment. Studies should aim to have a cumulative probability of detection > 0.8 or 0.9...........................................10Figure 10. Effect of cumulative NDVI and 95% CI on cell occupancy when included in the top Markovian detection or Markovian occupancy model........................................................................................................................................11Figure 11. Effect of days since last snow on detection probability when included in the top Markovian detection or Markovian occupancy model........................................................................................................................................11Figure 12. Effect of average temperature on detection probability when included in the top Markovian detection or Markovian occupancy model........................................................................................................................................12Figure 13. Model fit assessed by Bayesian p-values for Markovian detection and Markovian occupancy models. Values close to 0.5 indicate excellent fit and values less than 0.05 or greater than 0.95 indicate poor fit.......................................................................................................................................................................................................................... 12Figure 14. Effect of detection probability, cell width, segment length, and number of spatial (segments) and temporal replicates on statistical power to detect a 0.2 decline in occupancy across five years of sampling. Statistical power was assessed using Markovian detection models with the beta coefficient for an increase in detection probability given the species was detected on the previous segment.............................................................13
List of TablesTable 1. Model rank for covariates selected with Gibbs variable selection for both Markovian detection and Markovian occupancy models. Models were ranked by the proportion of MCMC iterations each combination of variables was selected (prob). I selected top models with a cumulative probability less than 0.95. Values of 0 and 1 represent covariates being excluded and included in their respective model.................................................18
iii

1 Introduction
Occupancy surveys are a common method for efficiently tracking changes in the relative abundance and the spatial distribution of wildlife (MacKenzie et al. 2002). Rather than trying to count the number of individuals, occupancy surveys simply determine whether or not a species was present, and are thus well suited for species such as grizzly bears and lynx that are not identifiable by their colour or markings. Imperfect detection, where an animal is present but undetected, is a challenge faced by all occupancy and abundance surveys. When a species is detected (yi = 1) at site i, it is known to occur (true state zi = 1). However, if species is undetected (yi = 0), the true state is unknown as the species could either be truly absent from the site (zi = 0) or the species could be present but undetected (zi = 1). Repeat surveys at a site are typically used to estimate probability of detection p given a species is present (zi = 1). As the cumulative probability of detecting a species at least once across repeat surveys approaches 1, studies can have confidence that species are truly absent (zi = 0) when undetected. The cumulative probability of detection p* can be calculated as p* = 1 - (1 - p)k, where k is the number of repeat sampling occasions at a site (Figure 1). Power to detect changes in occupancy depends on p* and the number of sites M. Previous studies recommend p* > 0.8 (Long and Zielinski 2008) or near 0.9 (McKann et al. 2013) and at least 60 sites to estimate occupancy rates ψ (McKann et al. 2013, Whittington et al. 2015, Steenweg et al. 2016) and approximately 120 sites to estimate colonization and extinction (McKann et al. 2013).
Figure 1. The cumulative probability of detecting a species at least once across replicate surveys depends on the probability of detection p and the number of replicate surveys.
Replicate surveys are commonly repeated in time, where surveyors visit a site multiple times with the caveat that occupancy within in a site does not change from the first to last survey. Some occupancy surveys use multiple observers to estimate detection probability, although probability of detection for the two observers should be independent. Occupancy surveys can also use spatial replicates (Hines et al. 2010, Thorn et al. 2011) or a combination of spatial and temporal replicates (Charbonnel et al. 2014, Whittington et al. 2015). With spatial replicates, detection data (yi) is collected along multiple linear transects or trail segments within a grid cell. Encounter histories along the spatial replicates are used to estimate whether or not each grid cell is occupied. The challenge with these surveys, is that species presence on a given trail segment may depend on whether the species was detected on the previous segment, especially for animals that travel long distances on trails. Successive
4

correlation in detection probability must be appropriately modelled (Hines et al. 2010, Charbonnel et al. 2014, Hines et al. 2014, Whittington et al. 2015), otherwise occupancy models may overestimate detection probability and underestimate both occupancy and associated confidence intervals.
Snow tracking data was collected in the Norman Wells and Tulita regions of Northwest Territories (NWT), Canada (Figure 2). Explor collected snow tracking data during 2012 and 2013 southwest of Norman Wells along recently cut seismic lines (hereafter referred to as the Explor data). In 2015 , the GNWT Department of Environment and Natural Resources, in collaboration with community members collected snow tracking data near Tulita (hereafter referred to as the Tulita data). The objectives of this study were to estimate occupancy rates for marten, lynx, and moose, assess the effects of temperature and sampling window on detection probability, determine the optimal study design in terms of grid size and segment length, and to assess power to detect changes in occupancy.
Figure 2. Map of snow-tracking transects in the Norman Wells and Tulita regions of the Northwest Territories.
1 Methods
1 DATA COLLECTIONSnow tracking data was collected in 2012 and 2013 by Explor southwest of Norman Wells and in 2015 by GNWT-ENR and community members within 40 km of Tulita (Figure 2). Surveyors recorded their travel route and wildlife tracks that they observed en route. Surveyors also recorded the date and the time since the last snow. Survey routes were discretized into 250, 500 and 1000 m segments and species detections (y = 0 or 1) were recorded for each segment. Marten data was entered for all three segment
5

lengths; lynx data was entered for lengths of 500 and 1000m; and moose data was entered for the 1000 m segments. I omitted the 250 m marten data after a preliminary analysis found it produced similar results to the 500 m segment lengths. I created square grid cells of 3, 4, 5, 6, and 10 km widths. I created an occupancy model for each species, grid width, and segment length combination, which resulted in 22 data sets and models.
2 DATA ANALYSISOccupancy data is frequently modelled as zero-inflated binomial models (MacKenzie et al. 2002). These models contain two hierarchical components: a logistic regression model for whether or not a site is occupied. The state of zi is unknown when the species is not detected and is thus a latent variable. The second component of the model is another logistic regression for whether or not a species is detected conditional on the site being occupied (zi = 1). Within this hierarchical framework, covariates can be included on a logit scale. Standard occupancy models can be easily fit using a maximum likelihood framework using either the unmarked package (Fiske and Chandler 2011) in R (R Development Core Team 2016) or in the program Presence (Hines 2006). I used a Bayesian approach for the analysis because occupancy models can easily be expanded to model more complicated process such as serial correlation among segments or colonization and extinction. The books Bayesian population analysis using WinBugs (Kéry and Schaub 2012) and Applied hierarchical modelling in ecology (Kéry and Royle 2016) offer excellent introductions to Bayesian analyses and occupancy models. I used the R interface to JAGS 4.2 (Plummer 2003) using the jagsUI 1.4.4 (Kellner 2016) package. Using JAGS/WinBugs notation, the observation component for a standard occupancy model with independent temporal replicates can be coded as:
Standard Occupancy Model: ψ(.)p(.)for (i in 1:n.sites){ # Loop through each site. logit(psi[i]) <- B0 + B1*X1[i]# Probability of site occupancy with covariates z[i] ~ dbern(psi[i]) # Likelihood for occupancy. z[i] is a latent variable 0/1 for (j in 1:n.temporal){ # Independent Temporal and Spatial replicates within site i logit(p[i, j]) <- A1 + A2*X2[i,j] # Probability of detection with covariates # calculate likelihood for detection probability using observed data y[i, j] y[i, j] ~ dbern(p[i, j] * z[i]) # Likelihood for p. Note p equals 0 when z[i] = 0 } }
Data from snow tracking surveys with spatial replication can have high serial correlation in detection probability either because animals travel along the survey route or because of spatial correlation in habitat quality. Two approaches can be used to model this serial correlation in detection probability: Markovian detection and Markovian occupancy models. The two methods produce similar estimates, but model slightly different ecological processes. The simplest method is to use Markovian detection models to model serial correlation in detection probability, which is ideal for situations where animals travel large distances and especially for when they travel along survey routes. The observation model for detection probability includes a covariate for whether the species was detected on the previous segment on the same survey (i.e. same temporal replicate). However, for the first segment of a survey we do not know if a species was detected on the previous survey and therefore must use the equilibrium probability of detection, which can be calculated as pmean = p / p + (1 - p’) where p is detection probability
6

when the species was not detected on the previous segment and p’ is detection probability when the species was detected on the previous segment. Using JAGS/WinBugs, the observation component of the Markovian detection model can be written as:
Markovian Detection Model: ψ(.)p(.)p’(.)for (i in 1:n.sites){ # Loop through each site. logit(psi[i]) <- B0 + B1*X1[i]# Probability of site occupancy with covariates z[i] ~ dbern(psi[i]) # Likelihood for occupancy for (j in 1:n.temporal){ # Temporal replicates within site i # Detection probability for first segment is p.mean because no previous detection. # Alag is the coefficient for serial correlation when detected on previous. # A2 and X2 are beta coefficients and data for covariates on detection probability logit(p0[i,j,1]) <- A1 + A2*X2[i,j,1] # Not on previous. logit(p1[i,j,1]) <- A1 + Alag + A2*X2[i,j,1] # On previous. p[i,j,1] <- p0[i,j,1] / (p0[i,j,1] + (1 - p1[i,j,1]) # Mean p. y[i,j,1] ~ dbern(p[i,j,1] * z[i]) # Likelihood for p. Note p equals 0 when z[i] = 0 for (k in 2:n.spatial){ # Spatial replicates within site i and temporal replicate j logit(p[i,j,k]) <- A1 + Alag*y[i,j,k-1] + A2*X2[i,j,k]# Probability of detection y[i,j,k] ~ dbern(p[i,j,k] * z[i]) # Likelihood for p. Note p equals 0 when z[i] = 0 } }
The Markovian detection models are ideal for serial correlation in tracks because animal tracks and movements are observed for short period of time (within a temporal replicate) and then they are covered by new snow or wind. Conversely, Markovian occupancy models, also referred to as Markovian segment models (Whittington et al. 2015), are ideally suited for spatial correlation in animal use associated with habitat related features. They add a third level to the hierarchical occupancy model such that the model includes likelihoods for probability of site occupancy ψ, probability of segment use at θany point in time conditional on site occupancy, probability of segment use ’ given the previous segmentθ was used, and probability detection p conditional on site occupancy and segment use. Because of imperfect detection, is also considered a latent variable (i.e. a species could be present but unobserved θon a segment). Note that p is conditional on and therefore detection probabilities from Markovian θdetection and Markovian occupancy models cannot be directly compared. JAGS/WinBugs code for the observation component of a Markovian occupancy model with covariates for ψ and p, but not can be θwritten as:
Markovian Occupancy Model: ψ(.) (.) ’(.)θ θ p(.)logit(theta0) <- T1 # Previous segment not usedlogit(theta1) <- T1 + Tlag # Previous segment usedtheta.mean <- theta0 / (theta0 + (1 - theta1)) # Mean probability of usefor (i in 1:n.sites){ # Loop through each site. logit(psi[i]) <- B0 + B1*X1[i] # Probability of site occupancy with covariates z[i] ~ dbern(psi[i]) # Likelihood for occupancy # For first segment, do not know if it was ever previously used. Thus, use mean. # z.seg[i, j] is a latent variable for segment use. theta[i,1] <- theta.mean
7

z.seg[i,1] ~ dbern(theta[i,1] * z[i]) # Likelihood for segment use. for (j in 2:n.spatial){ # Spatial replicates within site i # Probability of use depends on whether the animal used the previous segment theta[i,j] <- theta0*(1 - z.seg[i, j-1]) + theta1*z.seg[i,j-1] z.seg[i,j] ~ dbern(theta[i,j] * z[i]) # Likelihood for segment use. for (k in 1:n.temporal){ # Temporal replicates within site i logit(p[i,j,k]) <- A1 + A3*X3[i,j,k] # Probability of detection y[i,j,k] ~ dbern(p[i,j,k] * z.seg[i,j])# Likelihood for p. } }
Markovian detection and Markovian occupancy models generally produce similar estimates of ψ (Hines et al. 2010, Charbonnel et al. 2014, Whittington et al. 2015). Markovian occupancy models are increasingly used in multi-season occupancy surveys for large mammals (Hines et al. 2014, Thapa and Kelly 2016) and in breeding bird surveys (Clement et al. 2016). Markovian occupancy models marginally outperform Markovian detection models in some situations (Hines et al. 2010, Charbonnel et al. 2014), but they require more data, are more likely to encounter convergence failure (Hines et al. 2010), sometimes produce larger confidence intervals (Charbonnel et al. 2014, Whittington et al. 2015), and take a lot longer to run (e.g. 5 days vs a few hours to run the 22 models). More importantly, interpretation can be more complicated with the inclusion of covariates. For the analysis of the NWT data, I ran both Markovian detection and Markovian occupancy models.
I combined the Explor and Tulita data into a single analysis to improve estimates of covariates on occupancy and detection probability. However, I included separate intercepts for occupancy and detection probability for the two studies given that they occurred in different regions and in different years. However, I combined the two years of Explor data into a single occupancy estimate and thus assumed that occupancy did not change from 2012 to 2013.
I considered the following covariates in the Markovian detection models. First, I included a dynamic habitat index (Coops et al. 2008) calculated as the cumulative normalized difference vegetation index (NDVI) from 2003 to 2014 with a resolution of 1 km2 (http://silvis.forest.wisc.edu/dhi). I included cumulative NDVI as a covariate on occupancy (range 0 to 8.8, mean 6.3). I calculated the average cumulative NDVI across the each grid cell. Second, I included the effects of the average previous week’s temperature (range -37 to -12 , mean = -24 ) on detection probability because it has influenced detection rates in other snow tracking surveys (Kawaguchi et al. 2015). I downloaded Environment Canada daily weather data from the Norman Wells weather station and used the mean daily temperature averaged across the week prior to the survey date. Finally, I included days snow (range 0 to 8, mean = 2.0) as it can influence probability of detection (Whittington et al. 2015). I scaled all covariates by their mean and standard deviation prior to modelling to improve convergence. I used Gibbs variable selection (GVS) for the covariates cumulative NDVI, serial correlation in detection, temperature, and days snow (Hooten and Hobbs 2015, Linden and Roloff 2015). I first fit a global model with all covariates and then used parameter estimates and standard deviation of posterior estimates as hyper-parameters for variable selection. Resulting posterior estimates from covariates subject to GVS were not model averaged, whereas covariates included in all models were averaged across all models. I used vague priors N(0, 100) on a logit scale for all parameters and ran all models with 3 chains, 1000 iterations for adapting the tuning parameters, 500 iterations of burnin, and then ran the model for 10 000 iterations. I thinned the posterior samples by saving every 5th iteration. I assessed model convergence by examining trace plots and assessing Gelman-Rubin diagnostics with values greater than 1.1 indicating lack of convergence. I assessed model fit using Bayesian goodness of fit tests where values close to 0.5 indicate good model fit and values less than 0.05 and greater than 0.95 indicate poor model fit (Kéry and Royle 2016).
8

3 POWER ANALYSISI used simulations to assess the effects of survey effort on power to detect an absolute decline in occupancy of 0.2 collected over five years of sampling. For each simulation, I simulated five independent years of data with occupancy rates declining linearly on a logit scale from ψ = 0.7 to 0.5 over the five years. I estimated occupancy rates for each year using the Markovian detection models. I used the resulting coefficients and standard errors for occupancy on a logit scale to test for a significant decline βusing the metafor package (Viechtbauer 2010). The meta-analysis models thus included both point estimates and measures of uncertainty. I tested for a linear decline in occupancy by comparing meta-analysis models with and without a linear covariate for year and classified the simulation as successfully detecting a decline if the p-value was less than 0.10 (i.e. I used a Type I error of = 0.10). I ran over 500 αsimulations per scenario and calculated power as the proportion simulations that detected the decline in occupancy. Monitoring programs usually strive for statistical power of 0.8 (Type II error rates = 0.2). β
I assessed statistical power for 360 scenarios using the following parameters. Values of parameters used to simulate data were based on observed NWT data and Markovian detection model parameter estimates with NDVI, DaysSnow, and Temperature set to their mean value.
Number of grid cells: 50, 60, 70, 80, 90, 100 Number of temporal replicates: 1, 2, 3 Number of spatial replicates: 10, 20, 40 Segment length: 500, 1000 m Detection probability, species not detected on previous segment: 0.05, 0.10, 0.15, 0.20, 0.25 Increase in detection probability if species detected on previous segment on logit scale: 1.5
1 Results
1 SNOW TRACKINGThe Explor and Tulita studies tallied over 2567 km of snow tracking surveys (Figure 3). Lynx, marten, and moose were detected at least once in most regions of the study area. I varied grid cell sizes from 3 km wide to 10 km wide, which influenced the number of grid cells surveyed (range 50 to 243, Figure 4). Similarly, the choice of grid cell size and segment length influenced the number of spatial replicates per grid cell and the cumulative probability of detection (Figure 5). Half of the segments were surveyed two or more times (Figure 5).
Naïve occupancy estimates that simply tallied the number of grid cells where a species was detected, substantially under estimated true occupancy rates (Figure ). As expected, occupancy rates increased with grid cell size. The Markovian occupancy models generally produced slightly higher realized occupancy estimates compared to the Markovian detection models. Lynx occupancy rates ranged between 0.5 and 1.0 in the Explor region but were near 1.0 in the Tulita region. Marten occupancy rates were near 0.8 in Explor and 1.0 in Tulita. Moose occupancy rates were near 1.0 in both regions.
There was strong serial correlation in segment use (Figure 7) and detection probability (Figure 8) for the Markovian occupancy and Markovian detection models respectively. The coefficient for serialβ correlation in detection probability in the Markovian detection models was near 1.5 for all species. The serial correlation in detection probability should decrease as segment length is increased because segments should become more independent (Hines et al. 2010). When moving from 500 m to 1000 km segments, the lag term decreased for marten but surprisingly increased for lynx, perhaps because of habitat related effects. The median observed cumulative probability of detection exceeded 0.8 for marten in all study designs (Figure 9). The median cumulative probability of detection for lynx exceeded 0.8 for
9

the 10 km grid cells and was near 0.8 for the 5 and 6 km grid cells. The cumulative probability of detection for moose exceeded 0.8 in all Tulita surveys but none of the Explor surveys.
The Markovian occupancy models generally had a higher number of plausible candidate models and thus higher model uncertainty compared to Markovian detection models (Appendix Table 1). The cumulative NDVI averaged within each grid cell had a marginally positive effect on lynx, marten, and moose occupancy rates, but only for the Markovian occupancy models (Figure 10). Days snow had a strong positive effect on marten detection rates but not on lynx or moose detection rates (Figure 11). The average weekly temperature had a negative effect on moose detection rates, but not on lynx or marten detection rates (Figure 12). All models had excellent fit with Bayesian p-values near 0.5 (Figure 13).
10

Figure 3. Detections of marten, lynx, and moose from snow tracking surveys, NWT.
11

Figure 4. Number of grid cells surveyed by Explor, Tulita, and the two studies together.
Figure 5. Boxplots for the number of spatial (segments per grid cell) and temporal (repeat surveys) versus grid cell width and segment length.
12

Figure 6. Naïve occupancy from observed detections (blue squares) and predicted occupancy and 95% CI from Markovian detection and Markovian occupancy models. Occupancy estimates are shown for the Explor
and Tulita studies and for varying cell widths and segment lengths.
13

Figure 7. Probability of segment use given cell occupancy in the left graph depended on whether the previous segment was used. The right graph shows probability of detection with 95% CI given cell
occupancy and segment use.
14

Figure 8. Probability of detection and 95% CI given cell occupancy for Markovian detection models. The left graph shows probability of detection when the species was and was not detected on the previous segment.
The right graph shows how detecting a species on the previous segment increases probability of detection on the logit scale.
15

Figure 9. Cumulative probability of detection from sampled grid cells. Cumulative probability of detection was calculated 1 - (1 - pmean)k, where k was the number of spatial and temporal replicates and pmean was the
equilibrium probability of detection from when the species was and was not detected on the previous segment. Studies should aim to have a cumulative probability of detection > 0.8 or 0.9.
16

Figure 10. Effect of cumulative NDVI and 95% CI on cell occupancy when included in the top Markovian detection or Markovian occupancy model.
17

Figure 11. Effect of days since last snow on detection probability when included in the top Markovian detection or Markovian occupancy model.
18

Figure 12. Effect of average temperature on detection probability when included in the top Markovian detection or Markovian occupancy model.
19

Figure 13. Model fit assessed by Bayesian p-values for Markovian detection and Markovian occupancy models. Values close to 0.5 indicate excellent fit and values less than 0.05 or greater than 0.95 indicate poor
fit.
20

2 STATISTICAL POWER
Figure 14. Effect of detection probability, cell width, segment length, and number of spatial (segments) and temporal replicates on statistical power to detect a 0.2 decline in occupancy across five years of sampling.
Statistical power was assessed using Markovian detection models with the beta coefficient for an increase in detection probability given the species was detected on the previous segment.
Statistical power to detect a 0.2 decrease in occupancy over five years of sampling increased with detection probability, the number of grid cells and number of temporal and spatial replicates. At least 60 sites were required to achieve 80% power in all simulations. In simulations with low detection probability and one temporal replicate, 500 m segments appeared to have more power than 1000 m segments even when the total number of km tracked was the same. However, the 500 and 1000 m segments had similar power at higher rates of detection probability and with additional temporal
21

replicates. The 5 km wide grid cells had higher power than 10 km grid cells, given that for a given area there would be four times as many 5 km wide grid cells as 10 km wide grid cells.
1 Discussion
Occupancy rates for marten, lynx, and moose were high throughout the Explor and Tulita study areas. There was strong serial autocorrelation in detection probability and segment use. Failure to account for this spatial correlation would lead to overestimates of detection probability and underestimates of occupancy with poor confidence interval coverage. Cumulative NDVI was a weak predictor of occupancy for all species and especially lynx. The probability of marten, lynx, and moose occurrence increased with NDVI and thus productivity for some but not all the grid cell widths and models. The reason why NDVI was a stronger predictor in the Markovian occupancy models likely stemmed from higher realized occupancy rates in areas with high NDVI. Probability of marten, but not lynx or moose, detection increased with DaysSnow. DaysSnow was used as a sampling window but the true sampling window can be difficult to estimate because the tracks of heavier animals such as moose persist longer and require more snow or wind to wipe clean. One reason moose detection probability was much lower for Explor data compared to Tulita data could be that Explor surveyors only recorded moose tracks if they occurred since the last snowfall, whereas Tulita surveys recorded tracks even if they occurred prior to the snow fall. Another, albeit imperfect, method for future surveys is to estimate the sampling window for carnivores and ungulates separately based on animal weights and cumulative snowfall (Whittington et al. 2015). However, when using this method confidence intervals overlapped zero for all species except lynx and moose. Moose detection rates were negatively associated with temperature for both classes of model and all grid cell sizes. Thus, moose detection rates decreased with increasing temperature and moose either moved more at lower temperatures or were more likely to occur near survey routes during low temperatures. While we found covariates that influenced occupancy and detection probability, future analyses could examine the effects of finer scale habitat characteristics such as landcover class, fire history, and forest cover. Understanding factors affecting occupancy and detection probability would lead to more precise occupancy estimates, increased statistical power, and links to how human activities and interspecific competition influences the ecology of the Northwest Territories.
Previous researchers recommended at least 60 sites for single year estimates of occupancy (McKann et al. 2013, Whittington et al. 2015, Steenweg et al. 2016), 120 sites for multi-year models with colonization and extinction (McKann et al. 2013), and a cumulative probability of detection > 0.8 (Long and Zielinski 2008) or 0.9 (McKann et al. 2013). Sixty sites were required in simulations that included perfect detection (Whittington et al. 2015). Thus, the number of sites is influenced by the characteristics of logistic regression and the absolute change in occupancy. One feature of the binomial proportions is that variation can be calculated as p * (1 - p)/S where p is detection probability and S is the number of sites. Thus variation is highest for values of p = 0.5 and lowest near 0 and 1 (Guillera-Arroita and Lahoz-Monfort 2012, Steenweg 2017). I examined the change in occupancy from ψ = 0.7 to 0.5, which is near the centre of the Bernoulli distribution. Thus, statistical power could be slightly higher for changes in occupancy with ψ near 0 and 1.
I examined the influence of using segment lengths of 500 m vs 1000 m. I expected the two lengths to have similar power because detection probability should increase with segment length and serial correlation should decrease with segment length (Hines et al. 2010). However, because baseline detection probability and serial correlation in detection probability were similar for the two segment lengths, the power analysis suggested that using 500 m segment lengths will provide more power because of the increased number of spatial replicates. Other studies using spatial replication used
22

segment lengths of 1 km (Hines et al. 2010, Thorn et al. 2011, Whittington et al. 2015), 5 km (Wibisono et al. 2011), or 0.6 km (Thapa 2014, Thapa and Kelly 2016).
The choice of grid cell width depends on animal home range sizes but is also influenced by the number of cells required to detect changes in occupancy using logistic regression, survey effort required to achieve a cumulative probability of detection greater than 0.8 and preferably 0.9 (McKann et al. 2013). Grid cell size can vary among species because it can be defined after data collection. A grid cell width of 3 or 4 km could be used for marten because they have small home ranges, high baseline detection probability (p ranged from 0.08 to 0.25), and high cumulative probability of detection. Moose could use grid cell widths of 5 km or 10 km. Moose had a high baseline probability of detection (p approximately 0.17) and thus statistical power in Tulita, but not Explor (p approximately 0.03). Explor data would likely have had much higher probability of detection had they recorded tracks made prior to the most recent snow fall and thus would have similar power to Tulita. Lynx had lower detection probabilities (p ranged between 0.03 and 0.12), lower cumulative probability of detection, and lower power and could use either 5 or 10 km cell widths. Widths of 5 km had higher power to detect changes in occupancy but had marginal cumulative probability of detection.
Originally, the choice of grid cell size and the density of sampling sites was thought to influence how occupancy models track changes in abundance (He and Gaston 2000). However, simulations and analysis of remote camera data shows that the number of sites within a study area (i.e. density of sites and grid cell size) influences precision but not the occupancy-abundance relationship (Steenweg et al. 2017 In Review). Thus, with point sampling, decisions about grid cell size revolve around precision not occupancy-abundance relationships. However, grid cell size does influence occupancy abundance-relationships when sampling an entire grid cell rather than points in space. It is unclear how choice of grid cell size would affect occupancy-abundance relationships for snow-tracking surveys because they sample a portion of the grid cell rather than points in space. If they sample a relatively small proportion of the grid cell, then grid cell size should not influence occupancy-abundance curves. Most other studies using spatial replication for mammals used grid cell sizes that were approximately equal to or larger than the home range size of the focal species: cell widths of 13.7 or 17 km were used to estimate occupancy rates of tigers (Hines et al. 2010, Wibisono et al. 2011), 20 km for brown hyenas (Thorn et al. 2011), and 1.8 km for tigers and multiple other species in Nepal (Thapa 2014, Thapa and Kelly 2016). However, cell widths of 10 km were used for large mammals in the Canadian Rockies (Whittington et al. 2015) because that width had been used for wolverine surveys in Alaska (Magoun et al. 2007) and power to detect changes in wolverine occupancy were similar at 10 and 15 km cell widths and then decreased with 30 km cell widths (Ellis et al. 2014). The decision about what grid cell size to select is also influenced by levels of home range overlap for the focal species (Ellis et al. 2014) and the scale at which management decisions are made. In summary, grid cell widths of 3 km are likely appropriate for marten, 5 km for moose, and either 5 or 10 km for lynx even though lynx home ranges are often around 200 km2.
Snow tracking surveys conducted in the Norman Wells and Tulita regions of the Northwest Territories show promise for monitoring large scale changes in the distribution of multiple large mammal species. A minimum of 60 grid cells are required to have sufficient statistical power to detect changes over time. Standardized survey routes and set survey intervals would increase sampling efficiency, be clearer for technicians when animals repeated travel on and off the survey route, and would simplify data preparation for analysis. Conversely, if points are recorded along survey routes other techniques such as distance to detection could be used to estimate occupancy (Guillera-Arroita 2011). Most importantly, standardizing data collection methods would provide a foundation for monitoring how changing climatic conditions, interspecific competition, and changes to the landscape affect the large scale distribution of large mammals.
23

1 Acknowledgements
James Hodson from GNWT-ENR and Jesse Tigner from Explor coordinated data collection and preparation for analysis and offered valuable insights on data collection methods and factors influencing results. Numerous staff and members of the local community conducted the snow-tracking surveys.
1 Literature cited
Charbonnel, A., F. D'Amico, A. Besnard, F. Blanc, L. Buisson, M. Némoz, and P. Laffaille. 2014. Spatial replicates as an alternative to temporal replicates for occupancy modelling when surveys are based on linear features of the landscape. Journal of Applied Ecology 51:1425-1433.
Clement, M. J., J. E. Hines, J. D. Nichols, K. L. Pardieck, and D. J. Ziolkowski. 2016. Estimating indices of range shifts in birds using dynamic models when detection is imperfect. Global Change Biology 22:3273-3285.
Coops, N. C., M. A. Wulder, D. C. Duro, T. Han, and S. Berry. 2008. The development of a Canadian dynamic habitat index using multi-temporal satellite estimates of canopy light absorbance. Ecological Indicators 8:754-766.
Ellis, M. M., J. S. Ivan, and M. K. Schwartz. 2014. Spatially explicit power analyses for occupancy-based monitoring wolverine in the U.S. Rocky Mountains. Conservation Biology 28:52-62.
Fiske, I., and R. Chandler. 2011. unmarked: An R package for fitting hierarchical models of wildlife occurrence and abundance. Journal of Statistical Software 43:1-23.
Guillera-Arroita, G. 2011. Impact of sampling with replacement in occupancy studies with spatial replication. Methods in Ecology and Evolution 2:401-406.
Guillera-Arroita, G., and J. J. Lahoz-Monfort. 2012. Designing studies to detect differences in species occupancy: power analysis under imperfect detection. Methods in Ecology and Evolution 3:860–869.
He, F., and K. J. Gaston. 2000. Occupancy-abundance relationships and sampling scales. Ecography 23:503-511.
Hines, J. 2006. PRESENCE. Software to estimate patch occupancy and related parameters. USGS, Patuxent Wildlife Research Center, Laurel, Maryland, USA.
Hines, J., J. Nichols, J. Royle, D. MacKenzie, A. Gopalaswamy, N. S. Kumar, and K. Karanth. 2010. Tigers on trails: occupancy modeling for cluster sampling. Ecological Applications 20:1456-1466.
Hines, J. E., J. D. Nichols, and J. A. Collazo. 2014. Multiseason occupancy models for correlated replicate surveys. Methods in Ecology and Evolution 5:583–591.
Hooten, M. B., and N. T. Hobbs. 2015. A guide to Bayesian model selection for ecologists. Ecological Monographs 85:3-28.
Kawaguchi, T., A. Desrochers, and H. Bastien. 2015. Snow tracking and trapping harvest as reliable sources for inferring abundance: a 9-year comparison". Northeastern Naturalist 22:798-811.
Kellner, K. F. 2016. jagsUI: A Wrapper Around rjags to Streamline JAGS Analyses. R package version 1.4.4.
Kéry, M., and J. Royle. 2016. Applied hierarchical modeling in ecology: analysis of distribution, abundance and species richness using R and BUGS, vol 1. Prelude and static models. Academic Press, San Diego.
Kéry, M., and M. Schaub. 2012. Bayesian population analysis using WinBUGS: a hierarchical perspective. Academic Press, Waltham, MA, USA.
24

Linden, D. W., and G. J. Roloff. 2015. Improving inferences from short-term ecological studies with Bayesian hierarchical modeling: white-headed woodpeckers in managed forests. Ecology and Evolution 5:3378-3388.
Long, R. A., and W. J. Zielinski. 2008. Designing effective noninvasive carnivore surveys. Pages 8-44 in R. A. Long, P. MacKay, and W. J. Zielinski, editors. Noninvasive survey techniques for carnivores. Island Press, Washington, DC.
MacKenzie, D. I., J. D. Nichols, G. B. Lachman, S. Droege, J. Andrew Royle, and C. A. Langtimm. 2002. Estimating site occupancy rates when detection probabilities are less than one. Ecology 83:2248-2255.
Magoun, A. J., J. C. Ray, D. S. Johnson, P. Valkenburg, F. Dawson, and J. Bowman. 2007. Modeling wolverine occurrence using aerial surveys of tracks in snow. Journal of Wildlife Management 71:2221-2229.
McKann, P. C., B. R. Gray, and W. E. Thogmartin. 2013. Small sample bias in dynamic occupancy models. The Journal of Wildlife Management 77:172-180.
Plummer, M. 2003. JAGS: A program for analysis of Bayesian graphical models using Gibbs sampling. Page 125 in Proceedings of the 3rd international workshop on distributed statistical computing. Vienna.
R Development Core Team. 2016. R: A language and environment for statistical computing. Vienna, Austria.
Steenweg, R. 2017. PhD. University of Montana.Steenweg, R., M. Hebblewhite, J. Whittington, P. M. Lukacs, and K. McKelvey. 2017 In Review.
Sampling scales define occupancy and the occupancy-abundance relationship in animals. Ecology.
Steenweg, R., J. Whittington, M. Hebblewhite, A. Forshner, B. Johnston, D. Petersen, B. Shepherd, and P. M. Lukacs. 2016. Camera-based occupancy monitoring at large scales: Power to detect trends in grizzly bears across the Canadian Rockies. Biological Conservation 201:192-200.
Thapa, K. 2014. Ecology of Tigers in Churia Habitat and a Non-Invasive Genetic Approach to Tiger Conservation in Terai Arc, Nepal.
Thapa, K., and M. J. Kelly. 2016. Prey and tigers on the forgotten trail: high prey occupancy and tiger habitat use reveal the importance of the understudied Churia habitat of Nepal. Biodiversity and Conservation:1-24.
Thorn, M., M. Green, P. W. Bateman, S. Waite, and D. M. Scott. 2011. Brown hyaenas on roads: Estimating carnivore occupancy and abundance using spatially auto-correlated sign survey replicates. Biological Conservation 144:1799-1807.
Viechtbauer, W. 2010. Conducting meta-analyses in R with the metafor package. Journal of Statistical Software 36:1-48.
Whittington, J., K. Heuer, B. Hunt, M. Hebblewhite, and P. M. Lukacs. 2015. Estimating occupancy using spatially and temporally replicated snow surveys. Animal Conservation 18:92-101.
Wibisono, H. T., M. Linkie, G. Guillera-Arroita, J. A. Smith, Sunarto, W. Pusparini, Asriadi, P. Baroto, N. Brickle, Y. Dinata, E. Gemita, D. Gunaryadi, I. A. Haidir, Herwansyah, I. Karina, D. Kiswayadi, D. Kristiantono, H. Kurniawan, J. J. Lahoz-Monfort, N. Leader-Williams, T. Maddox, D. J. Martyr, Maryati, A. Nugroho, K. Parakkasi, D. Priatna, E. Ramadiyanta, W. S. Ramono, G. V. Reddy, E. J. J. Rood, D. Y. Saputra, A. Sarimudi, A. Salampessy, E. Septayuda, T. Suhartono, A. Sumantri, Susilo, I. Tanjung, Tarmizi, K. Yulianto, M. Yunus, and Zulfahmi. 2011. Population status of a cryptic top predator: an island-wide assessment of tigers in Sumatran rainforests. PLoS ONE 6:e25931.
25

1 Appendix
Table 1. Model rank for covariates selected with Gibbs variable selection for both Markovian detection and Markovian occupancy models. Models were ranked by the proportion of MCMC iterations each combination of variables was selected (prob). I selected top models with a cumulative probability less than 0.95. Values
of 0 and 1 represent covariates being excluded and included in their respective model.
Data Set Species Cell Width
km
Segment Length (m)
prob rank NDVI p’ or ’θ DaysSnow
Temp-erature
Markovian Detection
1 Lynx 4 500 0.52 1 1 1 0 0
Lynx 4 500 0.46 2 0 1 0 0
2 Lynx 5 500 0.62 1 0 1 0 0
Lynx 5 500 0.36 2 1 1 0 0
3 Lynx 6 500 0.90 1 0 1 0 0
Lynx 6 500 0.08 2 1 1 0 0
4 Lynx 10 500 0.84 1 0 1 0 0
Lynx 10 500 0.14 2 1 1 0 0
5 Lynx 4 1000 0.89 1 0 1 0 0
Lynx 4 1000 0.09 2 1 1 0 0
6 Lynx 5 1000 0.66 1 0 1 0 0
Lynx 5 1000 0.32 2 1 1 0 0
7 Lynx 6 1000 0.94 1 0 1 0 0
Lynx 6 1000 0.03 2 1 1 0 0
8 Lynx 10 1000 0.75 1 0 1 0 0
Lynx 10 1000 0.24 2 1 1 0 0
9 Marten 3 500 0.81 1 0 1 1 0
Marten 3 500 0.18 2 1 1 1 0
10 Marten 4 500 0.96 1 0 1 1 0
11 Marten 5 500 0.95 1 0 1 1 0
12 Marten 6 500 0.96 1 0 1 1 0
13 Marten 10 500 0.89 1 0 1 1 0
Marten 10 500 0.10 2 1 1 1 0
14 Marten 3 1000 0.66 1 0 1 1 0
Marten 3 1000 0.33 2 1 1 1 0
15 Marten 4 1000 0.93 1 0 1 1 0
Marten 4 1000 0.07 2 1 1 1 0
16 Marten 5 1000 0.93 1 0 1 1 0
Marten 5 1000 0.07 2 1 1 1 0
17 Marten 6 1000 0.94 1 0 1 1 0
Marten 6 1000 0.05 2 1 1 1 0
18 Marten 10 1000 0.90 1 0 1 1 0
Marten 10 1000 0.10 2 1 1 1 0
19 Moose 4 1000 0.54 1 0 1 0 1
Moose 4 1000 0.17 2 0 1 0 0
26

Data Set Species Cell Width
km
Segment Length (m)
prob rank NDVI p’ or ’θ DaysSnow
Temp-erature
Moose 4 1000 0.12 3 1 1 0 1
Moose 4 1000 0.05 4 0 1 1 1
Moose 4 1000 0.05 5 0 1 1 0
Moose 4 1000 0.03 6 1 1 0 0
20 Moose 5 1000 0.48 1 0 1 0 1
Moose 5 1000 0.19 2 0 1 0 0
Moose 5 1000 0.12 3 1 1 0 1
Moose 5 1000 0.07 4 0 1 1 0
Moose 5 1000 0.05 5 0 1 1 1
Moose 5 1000 0.05 6 1 1 0 0
21 Moose 6 1000 0.53 1 0 1 0 1
Moose 6 1000 0.20 2 0 1 0 0
Moose 6 1000 0.12 3 1 1 0 1
Moose 6 1000 0.06 4 0 1 1 0
Moose 6 1000 0.04 5 1 1 0 0
Moose 6 1000 0.03 6 0 1 1 1
22 Moose 10 1000 0.53 1 0 1 0 1
Moose 10 1000 0.19 2 1 1 0 1
Moose 10 1000 0.12 3 0 1 0 0
Moose 10 1000 0.05 4 0 1 1 1
Moose 10 1000 0.04 5 0 1 1 0
Moose 10 1000 0.04 6 1 1 0 0
Markovian Occupancy
1 Lynx 4 500 0.85 1 0 1 0 0
Lynx 4 500 0.09 2 1 1 0 0
Lynx 4 500 0.03 3 0 0 0 0
2 Lynx 5 500 0.86 1 0 1 0 0
Lynx 5 500 0.10 2 1 1 0 0
3 Lynx 6 500 0.83 1 0 1 0 0
Lynx 6 500 0.13 2 1 1 0 0
4 Lynx 10 500 0.65 1 1 1 0 0
Lynx 10 500 0.28 2 0 1 0 0
Lynx 10 500 0.03 3 0 0 0 0
5 Lynx 4 1000 0.77 1 0 1 0 0
Lynx 4 1000 0.17 2 1 1 0 0
Lynx 4 1000 0.03 3 0 1 1 0
6 Lynx 5 1000 0.46 1 0 1 0 0
Lynx 5 1000 0.39 2 1 1 0 0
Lynx 5 1000 0.10 3 1 0 0 0
Lynx 5 1000 0.02 4 0 1 1 0
7 Lynx 6 1000 0.82 1 0 1 0 0
Lynx 6 1000 0.09 2 1 1 0 0
Lynx 6 1000 0.06 3 0 0 0 0
27

Data Set Species Cell Width
km
Segment Length (m)
prob rank NDVI p’ or ’θ DaysSnow
Temp-erature
8 Lynx 10 1000 0.68 1 1 1 0 0
Lynx 10 1000 0.26 2 0 1 0 0
Lynx 10 1000 0.04 3 1 1 1 0
9 Marten 3 500 0.54 1 1 1 1 0
Marten 3 500 0.45 2 0 1 1 0
10 Marten 4 500 0.53 1 0 1 1 0
Marten 4 500 0.46 2 1 1 1 0
11 Marten 5 500 0.52 1 1 1 1 0
Marten 5 500 0.47 2 0 1 1 0
12 Marten 6 500 0.67 1 1 1 1 0
Marten 6 500 0.33 2 0 1 1 0
13 Marten 10 500 0.65 1 1 1 1 0
Marten 10 500 0.35 2 0 1 1 0
14 Marten 3 1000 0.56 1 1 1 1 0
Marten 3 1000 0.43 2 0 1 1 0
15 Marten 4 1000 0.88 1 0 1 1 0
Marten 4 1000 0.11 2 1 1 1 0
16 Marten 5 1000 0.70 1 1 1 1 0
Marten 5 1000 0.29 2 0 1 1 0
17 Marten 6 1000 0.52 1 0 1 1 0
Marten 6 1000 0.47 2 1 1 1 0
18 Marten 10 1000 0.73 1 0 1 1 0
Marten 10 1000 0.26 2 1 1 1 0
19 Moose 4 1000 0.34 1 0 1 0 1
Moose 4 1000 0.19 2 0 1 1 0
Moose 4 1000 0.15 3 0 1 0 0
Moose 4 1000 0.07 4 0 0 0 1
Moose 4 1000 0.06 5 1 1 0 1
Moose 4 1000 0.06 6 0 1 1 1
Moose 4 1000 0.03 7 1 1 1 0
Moose 4 1000 0.03 8 0 0 1 0
Moose 4 1000 0.02 9 0 0 0 0
Moose 4 1000 0.02 10 1 1 0 0
20 Moose 5 1000 0.29 1 0 1 0 1
Moose 5 1000 0.22 2 1 1 0 1
Moose 5 1000 0.11 3 0 0 0 1
Moose 5 1000 0.07 4 0 1 1 0
Moose 5 1000 0.06 5 1 1 1 0
Moose 5 1000 0.06 6 0 1 0 0
Moose 5 1000 0.05 7 0 1 1 1
Moose 5 1000 0.05 8 1 1 1 1
Moose 5 1000 0.03 9 1 1 0 0
Moose 5 1000 0.03 10 0 0 0 0
21 Moose 6 1000 0.48 1 0 1 0 1
28

Data Set Species Cell Width
km
Segment Length (m)
prob rank NDVI p’ or ’θ DaysSnow
Temp-erature
Moose 6 1000 0.14 2 0 1 0 0
Moose 6 1000 0.14 3 0 1 1 0
Moose 6 1000 0.09 4 0 0 0 1
Moose 6 1000 0.05 5 0 1 1 1
Moose 6 1000 0.04 6 1 1 0 1
Moose 6 1000 0.02 7 1 0 0 1
22 Moose 10 1000 0.28 1 1 1 0 1
Moose 10 1000 0.19 2 0 1 0 1
Moose 10 1000 0.14 3 0 1 1 0
Moose 10 1000 0.12 4 1 1 1 0
Moose 10 1000 0.07 5 1 1 0 0
Moose 10 1000 0.06 6 1 1 1 1
Moose 10 1000 0.05 7 0 1 0 0
Moose 10 1000 0.05 8 0 1 1 1
29