report documentation page f · pdf filereport documentation page f i omb no. 0704-c188 ......
TRANSCRIPT

REPORT DOCUMENTATION PAGE FI OMB No. 0704-C188
Pubic s-pohns burden fo t 06 d kt i bdarmatlon i esimaed to nerep I hour pe response. Ik*ding the time fr oeriewng istru ti. ser ing eming da scum..gl0hedflt m fth tw daf needed. mW oconylrlbIg td reWAng the collection d Intor orn. Send oomrrna regeding this burden esimme or aWy other aspec of thiolaieon of Inrmadon. ding suggesone for redudng thi buWden. to Washington Hoedqurtrs Servwies. Dkecorte ior Intorneison Opteio end R oRts. 1215 JeffersonO"s ftIgwa, 8syto 1204. Arlirgton, VA M22.4302. and to the 01los of Maegement and Budget. Pqeptik Reduction Project (0704.01S). Waslon. DC 20M4.
1. AGENCY USE ONLY (L.ave Blink) 2. REPORT DATE I. REPORT TYPE AND DATES COVERED
December 1990 Final4. TITLE AND SJBTITLE
S. FUNDING NUMBERSMaintenance and Repair of Steel Pile Structures (U)
DACA-88-88-D-00306. AUTHOR(S) WU 33280
Lowell Greimann and James Stecker
7. PERFORMING ORGANIZATION NAME(S) AND ADORESS(ES) 8. PERFORMING ORGANIZATIONREPORT NUMBER
Engineering Research Inst.Iowa State UniversityAmes, Iowa 50011
9. SPONSORINGIMONITORING AGENCY NAME(S) AND ADDRESS(ES) 10. SPONSORINGMONITORING
AGENCY REPORT NUMBER
US Army Construction Enginecring Research Laboratory REMR-OM-9PO Box 4005Champaign, IL 61824-4005
11. SUPPLEMENTARY NOTESCopies are available from the National Technical Information Service, 5285 Port Royal Road, Springfield, VA22161. Software is available from U.S. Army Engineer Waterways Experiment Station, ATTh: CEWES-IM-DS,3909 Halls Ferry Road, Vicksburg, MS 39180-6199 (telephone (601) 634-2581)
12a. DISTRIBUTIONIAVAILABILITY STATEMENT 12b. DISTRIBUTION CODE
Approved for public release; distribution is unlimited.
13. ABSTRACT (Maximum 200 words)
For much of its early history. the US Army Corps of Engineers concentrated on designing and constructing new facilities. Butnow the mission of the Corps is shifting from construction to maintenance of existing facilities. As part of the Repair, Evaluation.Maintenance, and Rehabilitation (REMR) program, this research focuses on the evaluation and repair of the steel sheet pilestructures within the Corps' Civil Works projects.
The objectives of this work were to (1) develop an inspection and rating system that uniformly and consistently describes thecurrent condition of steel sheet pile structures, and (2) develop guidelines for the maintenance and repair of these structures.
This report discusses the current inspection and rating system and provides the definition of a condition index and a briefdescription of sheet pile distresses. A detailed description of the inspection process is included.
Inspection data are entered onto a computer disk through a PC program that summarizes the safety and serviceability problemsassociated with the structure. By supplying the initial costs, expected life, downtime costs, interest rates, and inflation rates, anexperienced engineer can make a preliminary maintenance and repair plan for the structure.
14. SUBJECT TERMS 15. NUMBER OF PAGES
Maintenance Steel sheet pile structures 140preventive maintenance pile structures 16. PRICE CODE
17. SECURITY CLASSIFICATION 18. SECURITY CLASSIFICATION 19. SECURITY CLASSIFICATION 20. LIMITATION OF ABSTRACTOF REPORT OF THIS PAGE OF ABSTRACT
Unclassified Unclassified Unclassified SAR
NSN 7540-01-20-500 Soo Fam 28 (RMv. 2-8PuI d bl ANSI Sd .IS
M296
L_ _ _ _ _ _ _ __ _ _ _ _ _ _ _

PREFACE
This study was authorized by Headquarters, US Army Corps of Engineers
(HQUSACE), under Civil Works Research Work Unit 32280, "Development of Uniform
Evaluation for Procedures/Condition Index for Deteriorated Structures and
Equipment," for which Dr. Anthony M. Kao is Principal Investigator. This work
unit is part of the Operations Management Problem Area of the Repair,
Evaluation, Maintenance, and Rehabilitation (REMR) Research Program sponsored
by HQUSACE. Mr. James E. Crews (CECW-OM) is the REMR Technical Monitor for
this work.
Mr. Jesse A. Pfeiffer, Jr. (CERD-C) is the REMR Coordinator at the
Directorate of Research and Development, HQUSACE; Mr. Crews and Dr. Tony C.
Liu (CEMP-ED) serve as the REMR Overview Committee; Mr. William F. McCleese
(CEWES-SC-A), US Army Engineer Waterways Experiment Station, is the REMR
Program Manager; Dr. Kao is also the Problem Area Leader for the Operations
Management problem area.
The study was performed by the College of Engineering, Iowa State
University, under contract to the US Army Construction Engineering Research
Laboratory (USACERL). Principal Investigators for Iowa State University were
Professors Lowell Greimann and James Stecker.
The study was conducted under the general supervision of Dr. Paul A.
Howdyshell, Acting Chief of Engineering and Materials Division (EM), USACERL,
and under the direct supervision of Dr. Anthony M. Kao who was the Contracting
Officer's Representative. The technical editor was Gloria J. Wienke, USACERL
Information Management Office.
COL Everett R. Thomas is the Commander and Director of USACERL, and
Dr. L. R. Shaffer is Technical Director.
AoeesloANoaus I...
NTIS G1RA&t Z0DTIC TAD 0
Adoo Unanounce4
Justifteat.
Diatr bStleo
Availabillty Codse
Dist jSpeelal
CONTENTS
Page
PREFACE 1LIST OF FIGURES 4CONVERSION FACTORS, NON-SI TO SI UNITS OF MEASUREMENT 5
PART I: INTRODUCTION 7
Background 7Objectives and Scope 7Mode of Technology Transfer 8
PART II: OVERVIEW 9
Field Inspection 9Condition Index 9Maintenance and Repair Analysis 11Steel Sheet Pile Component Identification 12
PART III: FIELD INSPECTION 17
Inspection Concepts 17Overview of the Inspection Sheet 18
PART IV: STRUCTURAL CONDITION INDEX 46
Factor of Safety Relationship 53
PART V: FUNCTIONAL CONDITION INDEX 55
Distress Descriptions and X,, 56Distress Code 1: Misalignment 57Distress Code 2: Corrosion 58Distress Code 3: Settlement 64Distress Code 4: Cavity Formation 64Distress Codes 5-8: Interlock Separation, Holes, Dents, Cracks 65Multiple Distresses 66Field Testing 68
PART VI: MAINTENANCE AND REPAIR ANALYSIS 72
Prolems-Lios 72Maintenance and Repair Alternatives List 72kaintienance and Repair Solutions 73Consequence Modeling 73Life Cycle Cost Analysis 74Final Solution 74
PART VII: SUMMARY AND RECOMMENDATIONS 76
, Swmuary 76RecommendAtions 77
REOFR~fidE? 78
TABLES 1-9 79
APPENDIX A: BASIC DATA Al
2

(CONTENTS cont'd)
APPENDIX B: USERS' GUIDE B1
Overview B1Notation Conventions BiInstallation of SSP B1Inspection Sheet Input BI0Condition Index Calculation BI3Maintenance and Repair Analysis BI4Problem and Alternative Data Base B29
APPENDIX C. SAMPLE REPORTS Cl
3

LIST OF FIGURES
No. Pae
1 Maintenance and repair analysis of steel sheet pile. 102 Lock and dam facility. 143 Terminal facility. 154 Typical components of steel sheet pile structures. 155 Cellular walls. 166 Inspection sheet and comments. 207 Anchored wall design by equivalent beam method. 478 Cantilevered wall. 489 Failure modes for cellular structures. 51
10 Water level worst case. 5211 Relationship between factor of safety and structural condition
index. 5412 Functional condition index related to X/X,,. 5713 Causes of misalignment. 5914 Zones of corrosion. 6115 Corrosion in atmospheric zone. 6116 Weight adjustment factor for functional condition index. 6717 Comparison of functional condition index rating with
experts' rating. 71B1 Primary menus for SSP and procedure guide. B5B2 Organization of SSP menus. B6B3 Main Menu. B7B4 File maintenance menu. B7B5 Projects on this data disk. B8B6 Create new project files. B9B7 Steel Sheet Pile Analysis menu. B10B8 Create SSP data files. BllB9 Print SSP data files. B12
BIG Calculation of functional condition index. B13Bll Safety Factors. B14B12 Maintenance and Repair Analysis menu. 815B13 Analysis Parameters. B17B14 M&R solution form. B17B15 Problem List window. B19B16 Notes window. B20B17 M&R Alternative List window. B20B18 Example of selected M&R alternative. B21B19 Saving an M&R solution. B22B20 Review list of previously selected alternatives. B23B21 Description of M&R Solutions. B24B22 M&R modeling menu. B25B23 Edit distresses. B27B24 Modeled functional condition index. B28B25 Structural Modeling Parameters. B28B26 Life cycle cost parameters. B29B27 Life cycle cost data. B30B28 Select structure type. B32B29 Edit Structure Data. B33B30 Problem list. B33B31 Problem notes. B34B32 Alternatives for this Problem. B35B33 Edit Alternative Data. B35B34 Add problem to alternative list. B36B35 Problem solved by M&R alternative. B37Cl Sample inspection report. C2C2 Summary report. C8C3 Description of M&R solutions. C9C4 Consequence modeling report. CI0
4

CONVERSION FACTORS, NON-SI TO SI (METRIC)UNITS OF MEASUREMENT
Non-SI units of measurement used in this report can be converted to SI
(metric) units as follows:
Multiply By To Obtain
degrees 0.0174533 radians
cubic ft (ft3) 0.0283 cubic metres
feet 0.3048 meters
inches 25.4 millimetres
pounds (force) 4.448222 newtons
pounds (force) per square foot 47.88026 pascals
pounds (force) per square inch 0.006894757 megapascals
pounds (mass) per cubic foot 16.01846 kilograms per cubic metre
5
MAINTENANCE AND REPAIR OF
SHEET PILE STRUCTURES
PART I: INTRODUCTION
Background
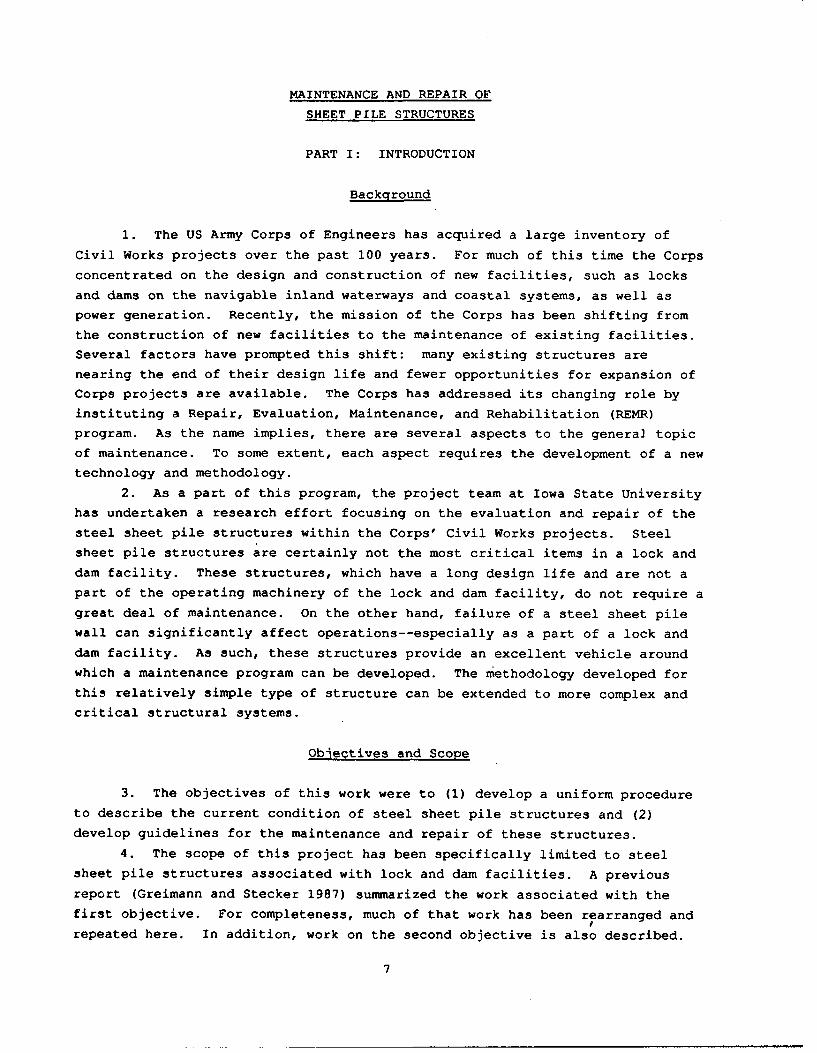
1. The US Army Corps of Engineers has acquired a large inventory of
Civil Works projects over the past 100 years. For much of this time the Corps
concentrated on the design and construction of new facilities, such as locks
and dams on the navigable inland waterways and coastal systems, as well as
power generation. Recently, the mission of the Corps has been shifting from
the construction of new facilities to the maintenance of existing facilities.
Several factors have prompted this shift: many existing structures are
nearing the end of their design life and fewer opportunities for expansion of
Corps projects are available. The Corps has addressed its changing role by
instituting a Repair, Evaluation, Maintenance, and Rehabilitation (REMR)
program. As the name implies, there are several aspects to the general topic
of maintenance. To some extent, each aspect requires the development of a new
technology and methodology.
2. As a part of this program, the project team at Iowa State University
has undertaken a research effort focusing on the evaluation and repair of the
steel sheet pile structures within the Corps' Civil Works projects. Steel
sheet pile structures are certainly not the most critical items in a lock and
dam facility. These structures, which have a long design life and are not a
part of the operating machinery of the lock and dam facility, do not require a
great deal of maintenance. On the other hand, failure of a steel sheet pile
wall can significantly affect operations--especially as a part of a lock and
dam facility. As such, these structures provide an excellent vehicle around
which a maintenance program can be developed. The methodology developed for
this relatively simple type of structure can be extended to more complex and
critical structural systems.
Objectives and Scope
3. The objectives of this work were to (1) develop a uniform procedure
to describe the current condition of steel sheet pile structures and (2)
develop guidelines for the maintenance and repair of these structures.
4. The scope of this project has been specifically limited to steel
sheet pile structures associated with lock and dam facilities. A previous
report (Greimann and Stecker 1987) summarized the work associated with the
first objective. For completeness, much of that work has been rearranged and
repeated here. In addition, work on the second objective is also described.
7

Mode of Technolory Transfer
5. The inspection procedures developed in this study for steel sheet
piles will be incorporated into ER 1110-2-100, "Periodic Inspection and
Continuing Evaluation of Completed Civil Works Structures." Software will be
available from U.S. Army Engineer Waterways Experiment Station's Engineering
Computer Program Library (ECPL). Address requests to: Commander and
Director, U.S. Army Engineer Waterways Experiment Station, ATTN: CEWES-IM-DS,
3909 Halls Ferry Road, Vicksburg, MS 39180-6199 or call (601) 634-2581. All
other inquiries should be directed to Commander and Director, U.S. Army
Construction Engineering Research Laboratory, P.O. Box 4005, Champaign, IL
61824-4005, telephone (217) 373-7011.
8

PART II: OVERVIEW
6. During the past 3 years, Corps personnel, Iowa State University
(ISU) personnel, and others have met several times to develop and refine a
steel sheet pile evaluation process. The project team at ISU has conducted
several site visits and field investigations, including a field trip to the
Chicago area in July, 1987. Experts from the Corps of Engineers were asked to
rate nine walls. Their ratings were compared to a preliminary version of the
rating system, and modifications were made to reflect the experts' opinions
more accurately. During meetings with these experts, a number of maintenance
and repair alternatives were also identified. This information has been
assembled and the entire rating procedure and maintenance and repair analysis
process has been impleme.ated into a personal computer program.
Field Inspection
7. The maintenance and repair procedure is illustrated schematically in
Figure 1. The entire process is based on a thorough field inspection of the
steel sheet pile structure. During this inspection, current physical attri-
butes of the systems are obtained. Data, such as the location of the wall,
inspection history, historical water level, and maintenance history, are
recorded on the first two pages of the inspection sheet developed specifically
for this purpose. Another page is used to describe some of the structural
details, such as cross section type, soil information, and anchor configura-
tion. Alternate pages exist for anchored or cantilevered walls, single cells
and multiple cells. On the next page, the loading data behind the wall and
the dredge depth adjacent to the structure are recorded. The last page is
used to describe distresses that have occurred to the wall during its lifetime
(e.g., misalignment, corrosion, cracks, and dents).
8. The information collected on the inspection form is entered into a
data file through a program on a personal computer. The program permits
editing of the file and handles the data for all of the succeeding steps.
Condition Index
9. The rating process is the next step. Information from the inspec-
tion data is used in the program to calculate a condition index for the struc-
ture. A condition index is a numerical measure of the current state of a
structure. It is part of the objective of this project to define a condition
index that uniformly and consistently describes and ranks the condition of
steel sheet pile structures. The condition index is primarily a planning
tool, with the index values serving as an indicator of the general condition
level of the structure. The index is meant to focus management attention on
9

E INSPECTION
PCDATA FILE
FUNCTIONALCI STRUCTURAL CI
COMBINED CI
PROBLEM LIST ALTERNATIVE FILE
CONSEQUENCES AND LCCA
Figure 1. Maintenance and repair analysis of steel sheet pile
those structures most likely to warrant immediate repair or further
evaluation. In addition, the CI values can be used to monitor change in
general condition over time and can serve as an approximate comparison of the
condition of different structures.
10. During the meetings that have been held on this subject, a common
definition of condition index for the REMR work has evolved. The REMR Condi-
tion Index (CI) is a numbered scale, from a low of 0 to a high of 100. The
numbers indicate the relative need to perform REMR work because of deteriora-
tion of the functional and safety characteristics of the structure. The
10

condition index scale in Table 1 has been adopted. For management purposes,
the condition index scale is calibrated to group structures into three basic
categories or zones, as listed in Table 2.
11. Two general structural criteria for evaluating the condition index
are available: safety and serviceability. Safety relates to the performance
of a structure beyond normal service conditions, for example, under abnormal
conditions such as excessive load or unexpectedly poor soil conditions.
Serviceability relates to the performance of a structure under normal service
conditions, for example, excessive misalignment. Two condition indexes were
formulated to describe the structure relative to these criteria. The first,
the structural condition index, is based upon a structural analysis of the
sheet pile structure. It includes primarily safety aspects. The second, the
functional condition index, is based upon field measurements of the distresses
and the subjective opinion of experts. It includes both safety and service-
ability aspects.
12. As the condition index zones in Table 2 indicate, one purpose of
the condition index is to draw attention to a particular problem that may
require further investigation (Zone 3). In this regard, the combined condi-
tion index or, simply, the condition index will be defined as
Condition Index = Minimum of:
Structural Condition Index
Functional Condition Index
Hence, if the structure has a poor condition index, a flag is raised and the
engineer can trace back to determine whether the cause is a low safety or
functional condition index. Indeed, the engineer would presumably trace back
through the entire rating process and possibly conduct a more detailed field
inspection or structural analysis to establish the basic cause.
Maintenance and Repair Analysis
13. After an evaluation of the current condition of the structure, the
user of the computer program has an option to investigate and compare several
maintenance and repair possibilities. After the program has displayed a list
of problems associated with this structure, the user can select from a list of
maintenance and repair alternatives that would provide various levels of
remedial action for each of the distresses. Some alternatives may fix only
one distress; others may fix several. A set of alternatives is collected
together to form one maintenance and repair solution.
14. Several different solutions can be formulated, and the program can
be used to compare and evaluate each of them. The consequences of each
solution are obtained by calculating a new condition index that reflects the
as-repaired structure. If the user provides cost and lifetime information
about each solution, the program will calculate an annualized cost by a life
11

cycle cost analysis. With this maintenance and repair analysis option within
the program, the user can make a preliminary evaluation of a maintenance plan.
15. Realistically, the program has limitations of which the user should
be aware. The entire process is intended to be a preliminary assessment. The
inspection is not sufficiently detailed to isolate the cause of all dis-
tresses. For example, wall misalignment is a symptom of several possible
causes (anchor failure, toe failure, impact, or overload). Before selecting a
maintenance or repair alternative, the user may need to conduct a more
thorough investigation. Some alternatives may not fix the cause. Also, the
cost analysis is intended to be indicative only and is based upon preliminary
estimates. Detailed cost estimates and analyses may be required to differen-
tiate between two competing solutions.
Steel Sheet Pile Component Identification
16. To inspect and rate steel sheet pile structures, the user must
clearly identify their functions and components.
Functions
17. Lock Chamberwall--One of two long parallel walls that form the lock
chamber. The lock chamberwalls will generally extend just beyond the recesses
for the lock gates (Figure 2).
18. Lock Guidewall--A wall used to guide barge traffic into and out of
the lock; this wall begins at the end of the lock chamberwall. The guidewall
may be upstream or downstream from the lock and on the land side or river side
of the lock approach (Figure 2).
19. Transition Wall--A retaining wall used in the transition from the
lock guide walls to the natural bank or levee (Figure 2).
20. Cutoff Wall--A wall used to retard the flow of water under a lock
dam or other structure. The wall is usually completely buried and has no
anchorage system.
21. Mooring Cell Structure--A structure to which a barge is tied. The
mov- common type is a steel sheet pile cell filled with concrete or coarse
aggregate (Figure 3).
22. Protection Structure--A structure used to prevent damage from barge
collisions to bridge piers, lock facilities, and the like. The most common
type is a steel sheet pile cell filled with aggregate and covered with a
concrete cap.
Components (Figure 4)
23. Steel Sheet Pile--Hot-rolled and cold-formed steel sections that
may have a variety of shapes (Z, arch, straight) and methods of interlock
(thumb and finger, ball and socket). The sections are driven vertically into
the soil. Each sheet is interlocked continuously from top to bottom with
adjacent sheets. (See Appendix A.)
12

24. Wale--Rolled-steel section running horizontally along a steel sheet
pile wall and used to transfer loads from the steel sheet pile wall to a tie-
rod and anchor system. The wale generally consists of two channels back to
back with 2 in. or 3 in. spacers. The sheets are often bolted to the wale.
25. Tie-Rod--Steel rod used to transfer loads from the wale to an
anchor system. The rod is threaded at each end in order to bolt it to the
wale and anchor it with a turnbuckle in between. The tie-rod is usually a 2-
to 3-in. diameter rod. A steel cable may also be used.
26. Anchor--A structure that transmits the tie-rod loads to the soil.
It may consist of a sheet pile wall and wale, a concrete block, some battered
pile and cap arrangement, or a soil anchor. A battered pile bolted directly
to the wale may also be used for an anchor.
27. Cap--A wood, steel, or concrete structure placed on top of the
sheet piles. A railing may be attached to the cap.
28. Fenders--Structures used to prevent damage to the piles from
barges. These may be wood or steel and are usually bolted horizontally to the
sheets above the water level.
29. Armor Plating--A curved steel section welded between flanges of Z
piles to help protect the wall from barge collisions. The void is usually
filled with concrete.
Structural Form
30. Cantilevered Wall--Wall that resists the active earth pressure, or
water and ice force as a vertical cantilever. The horizontal force and moment
resistance are provided by the passive soil pressure on the embedded portion.
31. Anchored Wall--Wall that resists active earth pressure as a beam
spanning between the passive soil pressure on the embedded portion and the
anchor tie-rods near the top. (Figure 4).
32. Single Cells--A series of interconnected, straight-web steel sheet
piles usually arranged in a circular shape. The interior is filled with soil
and concrete and/or stone. The structure resists the applied forces (e.g.,
mooring and impact as well as wave and ice loads), principally by gravity and
sliding forces.
13

BANK PROTECTION
FLOW1
TRANSITION WALL
GUDEWALLGUIDEWALL
UPPER LANDGUIDEWALL
- -BI LL NOSE
DAM- UPPER LOCK GATE
- - -CONTROL HOU SE
ILOCK WALLFUTURE LOCK GATE -LC-WL
..CHAMBERWALL
LOWER LOCK GATE
LOWER LAND GUtDEWALL
BANK PROTECTION
Figure 2. Lock and dam facility
14
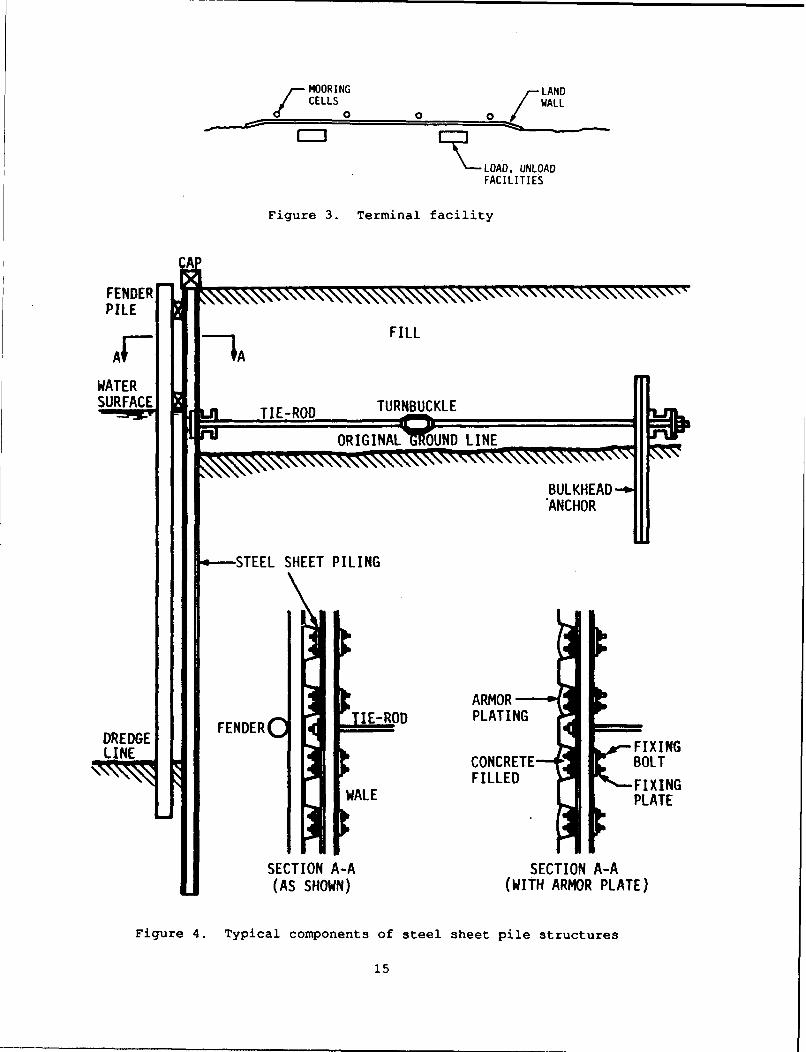
F-MOORING i-LAND
CELLS WALL0 0 0
LOAD, UNLOADFACILITIES
Figure 3. Terminal facility
FENDER ,PILE
WATERSURFACE TIE-ROD TURNBUCKLE
UNORIGINA N LINE
BULKHEAD-ANCHOR
a--STEEL SHEET PILING
ARMOR
DREDGE FENDER IE-ROD PLATING
DRINE FIXINGLINE CONCRETE BOLTFILLED FIXING
ALE PLATE
SECTION A-A SECTION A-A(AS SHOWN) (WITH ARMOR PLATE)
Figure 4. Typical components of steel sheet pile structures
15

33. Cellular Wall--A wall formed by interconnected cells. Figure 5
illustrates some of the possible plan views. A cellular wall resists forces
in a manner similar to single cells.
(a) CIRCULAR CELLS (b) DIAPHRAGM CELLS (c) CLOVERLEAF TYPE CELL
Figure 5. Cellular walls
16
PART III: FIELD INSPECTION
Inspection Concepts
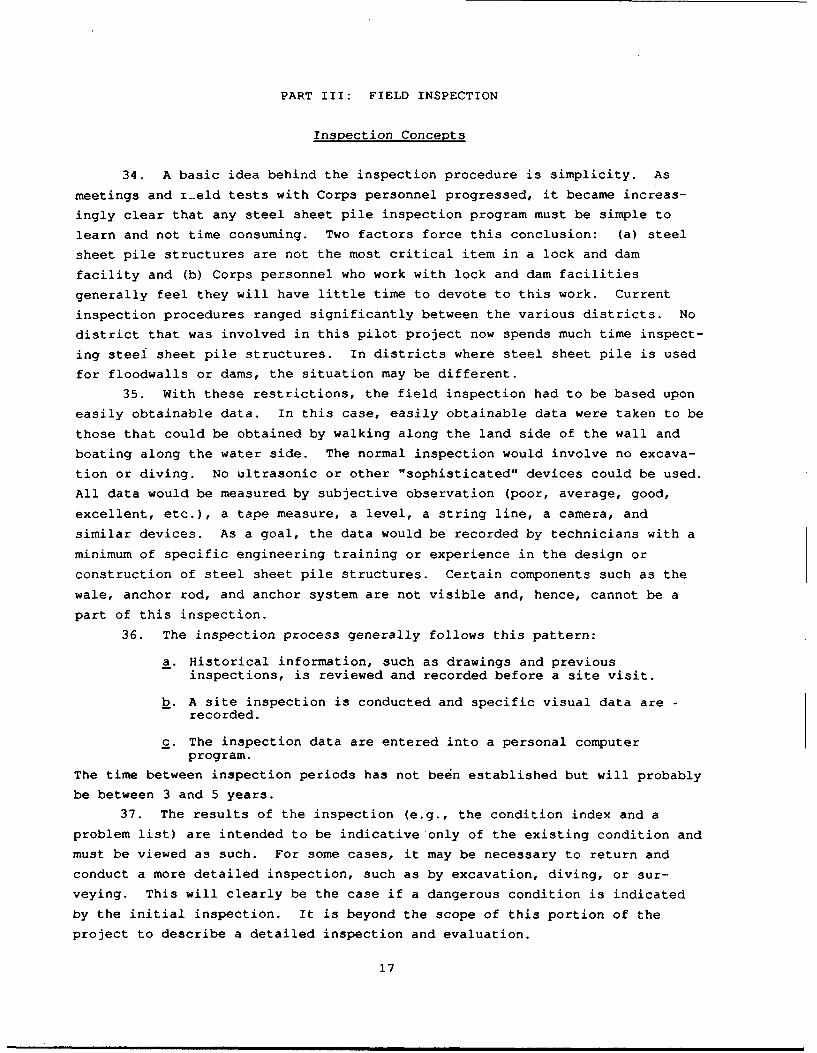
34. A basic idea behind the inspection procedure is simplicity. As
meetings and rLeld tests with Corps personnel progressed, it became increas-
ingly clear that any steel sheet pile inspection program must be simple to
learn and not time consuming. Two factors force this conclusion: (a) steel
sheet pile structures are not the most critical item in a lock and dam
facility and (b) Corps personnel who work with lock and dam facilities
generally feel they will have little time to devote to this work. Current
inspection procedures ranged significantly between the various districts. No
district that was involved in this pilot project now spends much time inspect-
ing steel sheet pile structures. In districts where steel sheet pile is used
for floodwalls or dams, the situation may be different.
35. With these restrictions, the field inspection had to be based upon
easily obtainable data. In this case, easily obtainable data were taken to be
those that could be obtained by walking along the land side of the wall and
boating along the water side. The normal inspection would involve no excava-
tion or diving. No ultrasonic or other "sophisticated" devices could be used.
All data would be measured by subjective observation (poor, average, good,
excellent, etc.), a tape measure, a level, a string line, a camera, and
similar devices. As a goal, the data would be recorded by technicians with a
minimum of specific engineering training or experience in the design or
construction of steel sheet pile structures. Certain components such as the
wale, anchor rod, and anchor system are not visible and, hence, cannot be a
part of this inspection.
36. The inspection process generally follows this pattern:
a. Historical information, such as drawings and previousinspections, is reviewed and recorded before a site visit.
b. A site inspection is conducted and specific visual data are -recorded.
c. The inspection data are entered into a personal computerprogram.
The time between inspection periods has not be~n established but will probably
be between 3 and 5 years.
37. The results of the inspection (e.g., the condition index and a
problem list) are intended to be indicative only of the existing condition and
must be viewed as such. For some cases, it may be necessary to return and
conduct a more detailed inspection, such as by excavation, diving, or sur-
veying. This will clearly be the case if a dangerous condition is indicated
by the initial inspection. It is beyond the scope of this portion of the
project to describe a detailed inspection and evaluation.
17

Overview of the Inspection Sheet
38. The inspection sheet in Figure 6 has been designed to provide
flexibili:y in documenting a variety of field conditions within one uniform
sheet. Though there are seven pages in the inspection form, not all pages are
used for every structure nor will every question have an answer. The follow-
ing section illustrates the use of the inspection form. The following para-
graphs briefly outline the inspection form.
Historical Information
39. Historical information related to the steel sheet pile structure is
recorded on pages 1 and 2. Information requested includes project reference
data to identify and to locate the specific structure. Further data categor-
ize the structure into a particular type and function. This information helps
the inspector determine which of the structural component forms (Page 3A, 3B,
or 3C) is to be completed. The information is also used to sort through the
base of expert rules in the evaluation model. The recent history of mainten-
ance, modifications, and inspections is recorded. Finally, a section to
record current physical conditions of nonessential steel sheet pile
accessories is also provided.
Structural Components
40. Information relative to the structural components of specific steel
sheet pile structures is recorded on page 3A, 3B, or 3C of the inspection
form. Page 3A is used for anchored (tied-back) or cantilevered wall types,
page 3B for single cells, and page 3C for multiple-cell walls or bulkheads.
The appropriate page is determined by the structure type or wall system type
selected on page 1. The information compiled on these pages provides the
basis for an elementary review of the structural adequacy of the structure.
Most of the structural data will be recorded on the sheet before the site
visit and verified during field inspection. The prior information may be
taken from original design drawings, as-built construction drawings, or draw-
ings of field modifications to the structure. The structural data sheets are
set up to record multiple subsections of wall types or cellular structures.
Whenever there is a change in steel pile components or construction conditions
along a wall length, the subsection changes. It is not unusual in a steel
sheet pile project for a wall section to be composed of two or three subsec-
tions of wall with variable sized components or different construction condi-
tions. For example, the first 500 feet of wall might be a PZ27 steel sheet
pile cross-section and the second 500 feet a PZ32. Or the overall length of
the steel sheet pile might become shorter over the length of the wall because
the pile steps up with the rising grade of the river bottom. A separate
structural data sheet is filled out for each subsection; complete as many
copies of page 3A as required. The use of station-to-station references for
18

distance location of subsection changes further identifies the wall
characteristics.
Loading and Dredge Line
41. Page 4 of the inspection sheet provides additional information
required to review the structural adequacy of the steel sheet pile structure.
The format of the sheet allows one section for specific information regarding.
load magnitudes (surcharges) and location by station reference along the
structure length. The second section, for dredge depths, records the existing
grade levels of the dredge line or river bottom. This information is corre-
lated with the structural component data from pages 3A, 3B, or 3C to give a
structural condition evaluation along all points of the structure length.
Distress Profile
42. The distress profile (page 6 of the inspection sheet), is a record
of distresses in the structure. Refer to Part V for more complete
descriptions of the distresses and their limits.
General Notes
43. The layout of the inspection sheet in Figure 6 has been designed to
facilitate both the data collection process and also the computer input and
evaluation model. After the initial inspection and computer modeling of a
structure, the data on pages 1 through 3C will become relatively permanent and
will require only nominal editing of computer data files to keep them current.
Pages 4, 5, and 6, however, are data pages that in general must be filled out
in the field during the inspection because the information is subject to
change. The following pages of this report duplicate the actual inspectionsheet with entries from an actual test inspection. The side-by-side arrange-
ment of the pages displays specific explanations adjacent to the entry on the
inspection form. Pages 4, 5, and 6 also have notes on how to measure and
record critical data.
44. For all pages on the inspection sheet, station coordinates are used
to locate structure characteristics or distresses. This reference is the
familiar civil engineering standard of 0+00 equals a starting point and 1+50
is 150 feet away from the starting point. Every effort should be made to have
the stationing be the same as for an existing system, such as when the
structure was constructed. It is important that the station references on all
pages of the inspection form be consistent. This should be discussed and
agreed on before the field inspection. The sketch requested on page 2 of the
inspection sheet is used to identify the beginning station reference location.
Station locations should be entered as whole numbers, that is, 250 in lieui of
2+50.
19
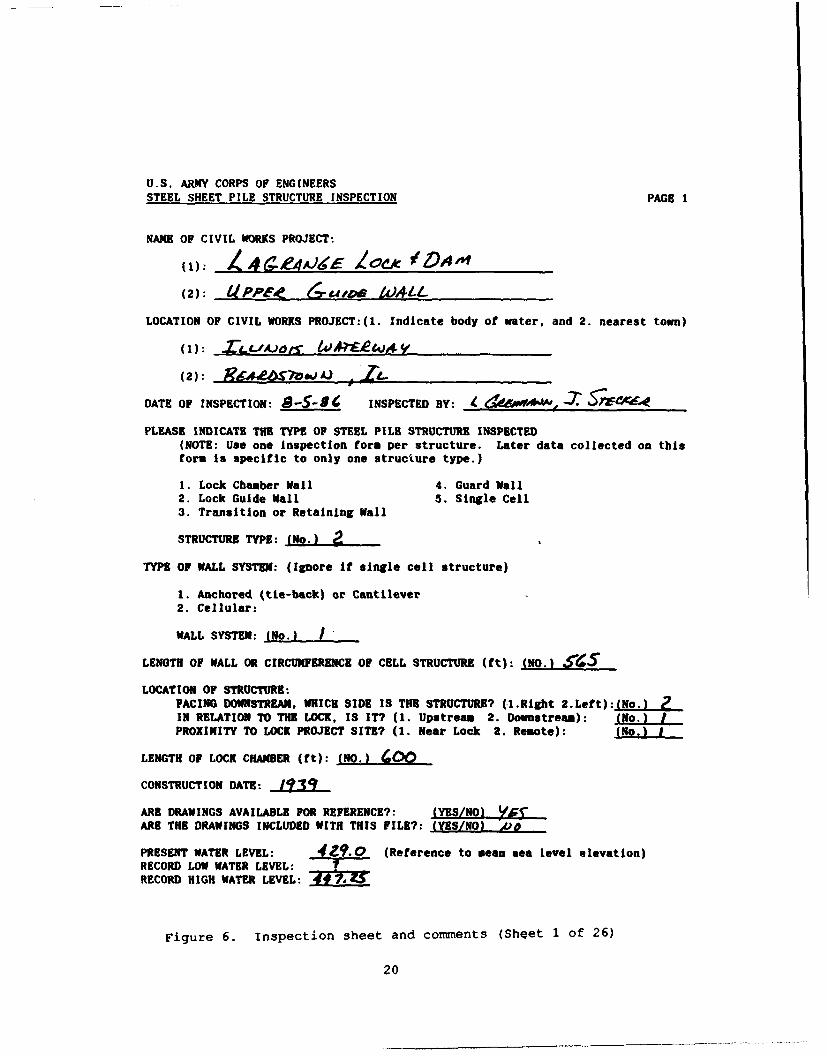
U.S. ARMY CORPS OF ENGINEERSSTEEL SHEET PILE STRUCTURE INSPECTION PAGE 1
NANE OF CIVIL WORKS PROJECT:
(1): 1L4ae4AJ6E Zoek(2): U PAM-i 4 -9'&-OR WA4LL
LOCATION OF CIVIL WORKS PROJECT:(1. Indicate body of water, and 2. nearest town)
(1): .ZLLJA.)jS IOA?CAL4 49Y
(2): RS U ,AJ
DATE OF INSPECTION: i-S-5g INSPECTED BY: .. %WM'¢ - S4 -Aue
PLEASE INDICATE THE TYPE OF STEEL PILE STRUCTURE INSPECTED(NOTE: Use one Inspection form per structure. Later data collected on thisform is specific to only one structure type.)
I. Lock Chamber Wall 4. Guard Wall2. Lock Guide Wail 5. Single Cell3. Transition or Retaining Wall
STRUCTURE TYPE: (No.) a
TYPE OF WALL SYSTEM: (Ignore if single cell structure)
1. Anchored (tie-back) or Cantilever2. Cellular:
WALL SYSTEM: (No.) i
LENGTH OF WALL OR CIRCUMFERENCE OF CELL STRUCTURE (ft): (NO. "
LOCATION OF STRUCTURE:PACING DOWNSTREAM, WHICR SIDE IS THE STRUCTURE? (1.Right 2.Left):g_.LIN RELATION TO THE LOCK. IS IT? (1. Upstream 2. Downstream): (NO.)PROXIMITY TO LOCK PROJECT SITE? (1. Near Lock 2. Remote): (No.) I
LENGTH OF LOCK CHAMBER (it): (NO.) (10
CONSTRUCTION DATE:
ARE DRAWINGS AVAILABLE FOR REFERENCE?: (YES/NO) YA"ARE THE DRAWINGS INCLUDED WITH THIS FILE?: (YES/NO) -0
PRESENT WATER LEVEL: 4&.o (Reference to mean sea level elevation)RECORD LOW WATER LEVEL:RECORD HIGH WATER LEVEL:
Figure 6. Inspection sheet and comments (Sheet 1 of 26)
20

Page 1 Commnents: Historical or Recordkeeping Data
Completed prior to the site inspection and verified or changed during the siteinspection.
Data blanks on page 1 prefaced by (No.) must be recorded as numbers.
Enter in (1) the CORPS OF ENGINEER PROJECT TITLE (55 characters). Line (2) isfor additional title description.
Indicate the BODY OF WATER (1). This may be a river, canal or improvedchannel, lake, or coastline.
Indicate SSP STRUCTURE TYPE and WALL SYSTEM TYPE by entering the appropriatenumber in the blank following each name. Refer to the section called "SteelSheet Pile Component Identification" for descriptions and illustrative figuresif additional information is required to identify structure or wall types.
NOTE: Only one structure type is allowed per inspection form. Page 3A, 3B,or 3C (of this inspection form) is selected for further data collection basedon the selections made in these two questions.
Actual length of SSP STRUCTURE to nearest whole foot. For SINGLE CELLSTRUCTURES, the circumference of the cell is recorded.
Enter nominal LENGTH OF LOCK CHAMBER (e.g., 600 ft or 1200 ft).
Information from the design or as-built drawings is necessary to completestructural data sections on Page 3A, 4, or 5 later in this form. The drawingsmay be useful for review in the field during an inspection.
Water level gauge readings referenced to mean sea level. PRESENT and RECORDLOW and HIGH WATER LEVELS are important for reference at a later date. Lowand high water levels are used in some safety calculations. Include the dataif known.
Figure 6. (Sheet 2 of 26)
21

U.S. ARMY CORPS OF ENGINEERSSTEEL SHEET PILE STRUCTURE INFECTION PAGE 2
GENERAL INFORMATION - Use the back of this page to list additional informationthat will not fit In spaces provided.
PAST 10 YEAR HISTORY OF:
MAJOR MAINTENANCE. REPAIRS. OR OTHER MODIFICATIONSDATE DESCRIPTION
(2): __,_, ('
CHANGES IN BACKFILL, BUILDING STRUCTURES, ROADS. EQUIPMENT. STOCK PILES, ETC.ADJACENT TO STRUCTURE. OR BEHIND STRUCTURE UP TO A DISTANCE OF 1/2 THE SSPSTRUCTURE HEIGHT
DATE DESCRIPTION
(1): _op,
(2):(3):
PREVIOUS INSPECTIONS OR STRUCTURAL REVIEWS (Attach copies if available)DATE DESCRIPTION
(1): - ,- LA ,AasP
(2):
PRESENT DAY: - Use this section of the Inspection Form to describe the locationand physical condition of SSP accessories such as Cap, Railing. ArmorProtection. Fender, Mooring Posts. Rins. etc.
STATIONSFROM TO DESCRIPTION (Materials, type connections, etc.)
Ex.1 0 600 Fenders, 3 Rows 6 x S Oak TimbersEx.2 250 300 Steel Channel Ca Is missing(1): 0D m W7)-ew Aua c & r JW drAr-(2): -.0 X6 ._.t $I"(3): . fc__.__ __ _ _ _ _ _ _
(6): - 109ft 46
(7):(9}:
(10):
Attach a general site plan of the civil works project. Use ATTACHMENT FORM A orother available plan and include with the Inspection Form.Attach a sketch of the particular SSP section covered by this inspection. UseATTACHMENT FORM B or other plan and include with the Inspection Form.
Figure 6. (Sheet 3 of 26)
22

Page 2 Comments: Historical or General Data
Completed prior to the site inspection and verified or changed during the siteinspection.
The first three sections are expanding records and can record up to five linesof data. Dates and descriptions are entered on one line as one record. Eachrecord is limited to '3 characters.
Enter SSP component MODIFICATIONS or REPAIR operations performed on thestructure within the last 10 years.
Examples: 1977 Sandblast and epoxy paint all exposed steel1979 Replace SSP Sta. 100 to 120 from tow collisionsin 1978
Enter CHANGES IN BACKFILL from original construction; record additions orremoval of building structures, roads, heavy equipment, material stockpiles,and the like from the area immediately behind the SSP or within the area ofSSP cells.
Example: 1981 Store concrete rubble Sta. 350 to 550 to load bargesfor transfer to dam site
Note: two records were used for one note.
Enter brief description of any PREVIOUS INSPECTIONS OR STRUCTURAL REVIEWS ofthe specific structure inspected. General inspections of the civilian projectshould be cited when the structure is specifically noted.
Example: 1981 Structural review of anchor rating for surcharges.
Enter PRESENT DAY status of miscellaneous 3SP accessories observed during theinspection of the structure. The items noted in this section are forinformation only and do not affect the condition index rating of thestructure. They are recorded in the inspection file so that futureobservations can note changes that have occurred in the accessories. See Ex.1 and 2 on form at left. This section can be expanded up to 20 records.Stations and description are entered on one line and are one record. As inthe example above, it is acceptable to use two records to define onecondition.
Sketch a general layout drawing as ATTACHMENT A or attach a copy of theproject site plan. Note locations of SSP structures.
Sketch a general layout of the SSP structure or attach a detail design drawinglaying out the structure as ATTACHMENT B. Note the beginning stationreference must coincide with rest of inspection pages.
Figure 6. (Sheet 4 of 26)
23

U.S. ARMY CORPS OF ENGINEERS
STEEL SHEET PILE STRUCTURE INSPECTION PAGE 3A
ANCHORED OR CANTILEVER WALL CROSS-SECTION
NOTES FOR USE OF THIS DATA PAGE:I. Use this Data Page for recording dimensions if the wall system selectedon Page I Is an anchored or cantilevered wall.2. Use more than one sheet for recording data on multiple subsections of thewall components or measurements for the cross-section change.
FROM STATION: 0 FIGUREI :WALL CROSS-SECTION
TO STATION: DITAC SURCHARGEDISTACE
WALL TYPE: I L .1i -1 -1 -_ .. .
I. Anchored I ()2. Cantilever (S)(No.) 71
(S)ANCHOR ROD DIANE1ER(1fl(9)ANCHOR ROD SPACIN(ft)
ANCHOR SYSTEM DRAWINGS ATTACHED? (II)ANCHOR ROD COATING
(YES/NO) AWo(2) . SOIL (A)
SOIL COMPOSITION:1. Sand 5. Medium Clay SOIL (8)
2. Gravel 6. Stiff Clay SOIL (C)3. Rock 7. Unknown4. Soft Clay 8. Not Applicable
SOIL(A): (No.) 2SOIL(B): (No.)SOIL(C): (No.) .
WALL CROSS-SECTION: (Refer to Figure 1)(1) DATUM ELEVATION: 4A v(2) PILE LENGTH (ft):(3) TOP-TO-DREDGE (ft):(4) TOP-TO-SOIL(B) (ft.): 44_ FIGURE 7: PILE CROSs-SEclop
(5) TOP-TO-WATER (ft): .(6) TOP-TO-SOIL(A) (ft): V 4- 747
(7) TOP-TO-ANCHOR ROD (ft): 7-0 -(8) ANCHOR ROD DIAMETER (in):..(9) ANCHOR ROD SPACING (ft): A-0
(10) ANCHOR DEPTH (ft):(11) ANCHOR ROD COATING: _ _2 -
PILE CROSS-SECTION: Provide the Design SSP SECTION Z K
SHAPE DESIGNATION (Ex. PZ32 or PSA28) in (1.) ordimension the appropriate section as shown at theright in Fig. 2 in blanks (2) thru (6).
(1) SECTION DESIGNATION: _ __ LI(2)
(2) DRIVING WIDTH(in): ______
(3) FLANGE WIDTH(in): 6;_____
(4) FLANGE THICKNESS(in): N E(5) WEB THICKNESS(in):(6) CROSS-SECTION DEPTH(In):(7) YIELD STRENTH:
(If left blank, 36,000 is assumed)
Figure 6. (Sheet 5 of 26)
24

Page 3A Comments: Structural Components Data
Complete data entry on Page 3A if:o Structure type noted on page 1 is Type 1, 2, 3, or 4 ando Wall type note on page 1 is No. 1 (anchored or cantilevered).
Complete prior to the site inspection and verify or change data during thesite inspection. Data blanks on Page 3A prefaced by (No.) must berecorded as numbers.
It is possible to have more than one configuration (or cross-section detail)of an SSP structure. When the configuration changes, use additional sheets ofthis form to record the separate subsections of the wall.
Examples: Use two forms for the following conditionSta. 0 to 250 Design pile length is 28 ftSta. 250 to 600 Design pile length is 34 ft
NOTE: The beginning station reference for the first subsection must be thesame as the beginning station on the other inspection form pages.
WALL TYPE: Select anchored or cantilevered. If unsure of condition, reviewdesign drawings. This selection is used in .i 3afety analysis. Whena wall changes from an anchored wall to a _;antilevered wall, then anew inspection form for a new SSP stiucture must be used, not just anew subsection page.
SOIL COMPOSITION: Select the appropriate soil type from information usuallyfound on the as-built construction drawings. If Type 7 (unknown) isselected, the soil is assumed to be soft clay.
WALL CROSS-SECTION: Provide the information requested based on dimensionsavailable on the design drawings. The dimensions must be entered inthe order noted and in the units noted.
PILE CROSS-SECTION: Figure 2 on the opposite page illustrates the severalSSP shapes that have been and are currently available. The sectiondesignation (1) must be entered into the computer program. If it is not
available on the drawings, record the field dimensions for the actualSSP sheet, i.e., (2) through (6), and see Appendix A for severaltables of SSP sheet sections. Select the section that matches mostclosely the dimensions (2) through (6) and enter this sectiondesignation in (1).
YIELD STRENGTH: Several yield strength steels are used in SSP sheets. If ayield strength is known, e.g., 55,000 psi, enter the value in thisentry. The default is 36,000 psi.
Figure 6. (Sheet 6 of 26)
25

U.S. ARMY CORPS OF ENGINEERSSTEEL SHEET PILE STRUCTURE INSPECTION #or A,.AOCALt- 7-0 PAGE 3B
SINGLE CELL CROSS-SECTION j.4"A)&L "860. 6W 4'9-
NOTES FOR USE OF THIS DATA PAGE:1. Use this Data Page for recording dimensions if a single cell Is thestructure type selected on Page 1.2. Only one cell can be recorded on this Data Page. Use a separateInspection form. Pages 1. 38, etc.. to record each Individual cell.
CELL CROSS-SECTION: (Refer to Figure I or 2) FIGURE I: ROCK OR STIFF CLAY
(1) DATUM ELEVATION: (ft.) FOUNDAl ION
(2) TOP-TO-WATER: (ft.) 02 T
(3) TOP-TO-DREDGE: (ft.) P----I I(4) PILE LENGTH: (ft.) ' (2)
(5) CELL DIAMETER: (ft.) SLA
A(3)LOADING ON CELL: (Refer to Figure 1 or 2)P - HORIZONTAL: (bs) __(4_
(Concentrated pull or impact load) soI- IS C
Q2- SURCHARGE: (Uniform psf) !
INTERIOR BACKFILL AND FOUNDATION MATERIAL: SOIL S - ROCK OR STIFF CLAY
1. Sand 5. Medium Clay NOTE:-SOIL C MAY SE ABSERT WITH
2. Gravel 6. Stiff Clay ROCK OR COULD sE ANY
3. Rock 7. Unkcnown OTHER SOIL TYPE
4. Soft Clay 8. Not Applicable FIGURE 2: SAND. GRAVEL. OR
SOFT TO MEDIUM CLAYSOIL (A) : (No.) Interior backfill atSOIL (B):(NO.} Foundation soil or rock r(I) OATUMSOIL (C):(No.) Soil layer over rock 71 .)
PILE CROSS-SECTION: (Refer to Figure 3) SOIL A
Provide the Design SSP SECTION SHAPE 4 • (3)
DESIGNATION (1) (Ex. PSA28); or dimension the (4)
DRIVING WIDTH (2) & FLANGE THICKNESS (3).(1) SECTION DESIGNATION: SOIL t: ,(2) DRIVING WIDTH: (IN.) A_,r'_" "(3) APPROX. THICKNESS: (IN.) , __ __,'2
SOIL S - SAND, GRAVEL. ORCELL CAP: SOFT TO MEDIUM CLAY
TYPE (None, Concrete. Asphalt): -
THICKNESS OF CELL CAP: (ft.)ACCESS MANHOLE/PORT EXIST?:(Y or N) (5)
CELL PURPOSE:(I.Protection, or 2.Xoorng):(No:.
PLAN - BOTH FIG.
FIGURE : PILE CROSS-SiCTION
Figure 6. (Sheet 7 of 26)
26

Page 3B Comments: Structural Components Data
Complete data entry on page 3B if structure type noted on page 1 is Type 5.
Complete prior to the site inspection and verify or change data during thesite inspection.
Data blanks on page 3B prefaced by (No.) must be recorded as numbers.
More than one configuration of steel sheet pile within one cellular SSPstructure is not likely. However, if the configuration changes, useadditional sheets of this form to record the separate subsections of the cell.
CELL CROSS-SECTION: Provide the information requested based on dimensionsavailable on the design drawings. The dimensions must be entered inthe order noted and in the units noted. These data are used in analysis
of factors of safety for the SSP components. Occasionally the pilelengths will vary around the circumference of the cell. When thatoccurs, enter the shortest pile length (4).
LOADING ON CELL: The force P represents a concentrated force applied to thecell, for example, by a barge. It may include impact. Q2 is auniform surcharge applied to the top at the cell.
INTERIOR BACKFILL MATERIAL: Select the appropriate soil type frominformation usually found on the as-built construction drawings. IfType 7 (unknown) is selected, the soil is assumed to be soft clay.Figure 1 opposite is used if the foundation is rock or soft clay;otherwise, Fig. 2 opposite is used.
PILE CROSS-SECTION: Figure 3 on the opposite page illustrates the typicalSSP shape that has been used for cells and is currently available.The SSP section designation (1) must be entered into the computerprogram. If it is not available on the drawings, record the fielddimensions for the actual SSP sheet (2) and (3) and see Appendix A forseveral tables of SSP sheet sections. Select the section that mostclosely matches the dimensions (2) and (3) and then enter this sectiondesignation in (1) and the computer program.
CELL PURPOSE: The purpose of the single cell is significant in theevaluation of the condition index for the cell structure.
Figure 6. (Sheet 8 of 26)
27
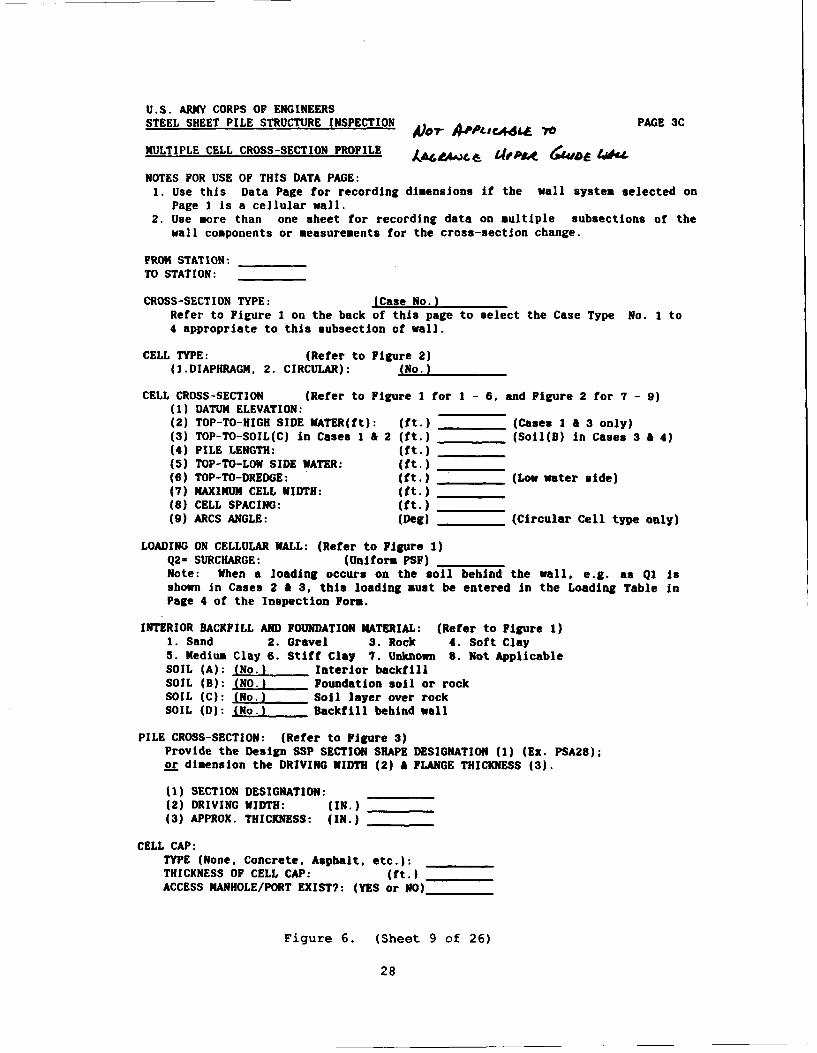
U.S. ARMY CORPS OF ENGINEERSSTEEL SHEET PILE STRUCTURE INSPECTION )o 4 -Potc44& 7o PAGE 3C
MULTIPLE CELL CROSS-SECTION PROFILE A( .Aiie & if 4*4"
NOTES FOR USE OF THIS DATA PAGE:I. Use this Data Page for recording dimensions if the wall system selected on
Page 1 is a cellular wall.2. Use more than one sheet for recording data on multiple subsections of the
wall components or measurements for the cross-section change.
FROM STATION:TO STATION:
CROSS-SECTION TYPE: (Case No.)Refer to Figure 1 on the back of this page to select the Case Type No. 1 to4 appropriate to this subsection of wall.
CELL TYPE: (Refer to Figure 2)(I.DIAPHRAGM, 2. CIRCULAR): (No.)
CELL CROSS-SECTION (Refer to Figure 1 for I - 6, and Figure 2 for 7 - 9)(1) DATUM ELEVATION:(2) TOP-TO-HIGH SIDE WATER(ft): (ft.) (Cases 1 & 3 only)(3) TOP-TO-SOIL(C) In Cases 1 & 2 (ft.) (Soil(B) in Cases 3 & 4)(4) PILE LENGTH: (ft.)(5) TOP-TO-LOW SIDE WATER: (ft.)(6) TOP-TO-DREDGE: (ft.) (Low water side)(7) MAXIMUM CELL WIDTH: (ft.)(8) CELL SPACING: (ft.)(9) ARCS ANGLE: (Deg) _ (Circular Cell type only)
LOADING ON CELLULAR WALL: (Refer to Figure 1)Q2- SURCHARGE: (Uniform PSF)Note: When a loading occurs on the soil behind the wall, e.g. as QI isshown in Cases 2 & 3, this loading must be entered in the Loading Table inPage 4 of the Inspection Form.
INTERIOR BACKFILL AND FOUNDATION MATERIAL: (Refer to Figure 1)1. Sand 2. Gravel 3. Rock 4. Soft Clay5. Medium Clay 6. Stiff Clay 7. Unknown 8. Not Applicable
SOIL (A): (No.) Interior backfillSOIL (B): (NO.) Foundation soil or rockSOIL (C): (No.) Soil layer over rockSOIL (D}: (No.) Backfill behind wall
PILE CROSS-SECTION: (Refer to Figure 3)Provide the Design SSP SECTION SHAPE DESIGNATION (1) (Ex. PSA28);or dimension the DRIVING WIDTH (2) & FLANGE THICKNESS (3).
(1) SECTION DESIGNATION:(2) DRIVING WIDTH: (IN.)(3) APPROX. THICKNESS: (IN.)
CELL CAP:TYPE (None, Concrete. Asphalt, etc.):THICKNESS OF CELL CAP: (ft.)ACCESS MANHOLE/PORT EXIST?: (YES or NO)
Figure 6. (Sheet 9 of 26)
28

Page 3C Comments: Structural Components Data
Complete data entry on page 3C if:o Structure type noted on page 1 is Type 1, 2, 3, or 4 ando Wall type noted on page 1 is No. 2 (cellular).
Complete prior to the site inspection and verify or change data during the
site inspection.
Data blanks on page 3C prefaced by (No.) _ must be recorded as numbers.
Multiple cell structures are similar to walls in that they have a linearconfiguration and function similar to a wall and thus can be identifiedreadily with station references.
It is possible to have more than one configuration (or cross-section detail)of a SSP structure. When the configuration changes, use additional sheets ofthis form to record the separate subsections of the wall.
NOTE: The beginning station reference for the first subsection must be thesame as the beginning station references on the other inspection formpages.
CROSS-SECTION TYPE: See next page for description.
CELL TYPE: Select diaphragm or circular. If unsure, review design drawings.This selection is used in the safety analysis (see Fig. 2 on next page).
CELL CROSS-SECTION: Provide the information requested based on dimensionsavailable on the design drawings. The dimensions must be entered in the ordernoted and in the units noted. These data are used in analysis of factors ofsafety for the SSP components.
LOADING ON CELLULAR WALL: Q2 is the surcharge on the top of the cell.Loadings behind the wall, e.g., Q1 in Case 2 and 3 are entered on Page 4.
BACKFILL MATERIAL: Select the appropriate soil type from information usuallyfound on the as-built construction drawings. If Type 7 (unknown) is selected,the soil is assumed to be soft clay.
PILE CROSS-SECTION: Figure 3 on the next page illustrates the typical SSPshape that has been used for cells and is currently available. The SSPsection designation (1) must be entered into the computer program. Also, seePage 3B of Inspection Forms.
Figure 6. (Sheet 10 of 26)
29

FIGURE 1: WALL CROSS-SECTION CONDITIONS by CASE TYPES
CASE 1: ROCK OR STIFF CLAY FOUNDATION CASE 2: ROCK OR STIFF CLAY FOUNDATION
WITH DIFFERENT HATER LEVELS ON WITH WATER ON ONE SIDE AND EARTH
EITHER SIDE OF CELLULAR WALL FILL ON THE BACK SIDE OF THE WALL
Q2 02 01
(I) DAIU DATUM
(2) C'
(s)) SOIL DSOIL A SOIL A 4110 1 1t
(3)(3
(14 (6) (61 (4)SOIL C . _x SOIL C*
SOIL C* SCL C
SOIL B - ROCK OR STIFF CLAY SOIL B - ROCK OR STIFF CLAY
*NOTE: SOIL C MAY BE ASSENT WITH -NOTE: SOIL C MAY BE ABSENT WITH
ROCK OR COULD SE ANY ROCK OR COULD BE ANY
OTHER SOIL TYPE OTHER SOIL TYPE
CASE 3: SAND. GRAVEL. OR SOFT TO MEDIUM CASE 4: SAND, GRAVEL, OR SOFT TO MEDIUM
CLAY FOUNDATION WITH DIFFERENT CLAY FOUNDATION WITH WATER ON ONE
WATER LEVELS O EITHER SIDE OF SIDE AND EARTH FILL ON THE BACK
THE CELLULAR WALL SIDE OF THE WALL
22Q) DATUM ATUM [ oJ
T 7 ... CAP, a; 4I .) SO IL 0
I SOIL A SOIL A
(4) 1 (6) (4)
SOIL SOIL' SOIL B SOIL B 1
SOIL S - SOFT TO MEDIUM CLAY SOIL B -SOFT TO MEDIUM CLAY
FIGURE 2: CELL TYPES
(7) ( ()
DIAPHRAGM TYPE WITH STRAIGHT CIRCULAR TYPE
OR CURVED CROSS WALLS
FlGURE 1: PILE CROSS-SECTION
Figure 6. (Sheet 11 of 26)
30

CROSS-SECTION TYPE: Figure 1 opposite is used to identify various cross-section cases that are utilized in the structural analysis. Differentassumptions and calculations are associated with each case. Generally,the cases differ by foundation type and loading condition on the back(right) side of the wall:
Case Foundation Right Side1 Rock or Stiff Clay Water2 Rock or Stiff Clay Soil3 Other Water4 Other Soil
Figure 6. (Sheet 12 of 26)
31

U.S. ARMY CORPS OF ENGINEERS
STEEL SHEET PILE STRUCTURE INSPECTION
LOADING DATA PROFILE SHEET Page 4
GENERAL INFORMATION - Use the back of this page or another data sheet to listadditional Information that will not fit In spaces provided.
LOADING TABLE: Use this section to describe the location, loading weight (psf)and a brief description of the type of loads applied to the SSP structure.
DISTANCESTATIONS LOADING TO WALL
FROM TO (psf) (ft) DESCRIPTION OF LOADINGa== .... .. .. ...... l~s ..... l f .. .. .. M.. . . .. .. a .. .
Ex. 135 215 300 12 Rock Stockpile(1: 0 Ah 0 - __ _(2): 35 W aw~ ek PK .r"4
(3):
(4):(5):
(7):(8):
(10):
DREDGE DEPTH ALONG STRUCTURE: Page 5
Measurement (or soundings) for Dredge Depth should be recorded at 50' intervalsfor walls along the entire length of the wall or at quarter points of thecircumference of single cells. Specific station notation of greater depthholes, such as Ex. 2 should be noted at other than 50' intervals.
STATION DEPTHEx.1 50 23Ex.2 87 25.8(1): j -21,(2): ItO _.3
(3): ?,g(4): Z3 6 _'
(5): Z56 zz(6): 3 Z8.5(7): 9,9o -'.(8): o ;, ±(9):
(1o): So0 3_(11): "a A1.5(12): - Ug(13):(14):(15):(16):____ __ __
(17):(18):____ __ __
(19):____ __ __
(20):
Figure 6. (Sheet 13 of 26)
32
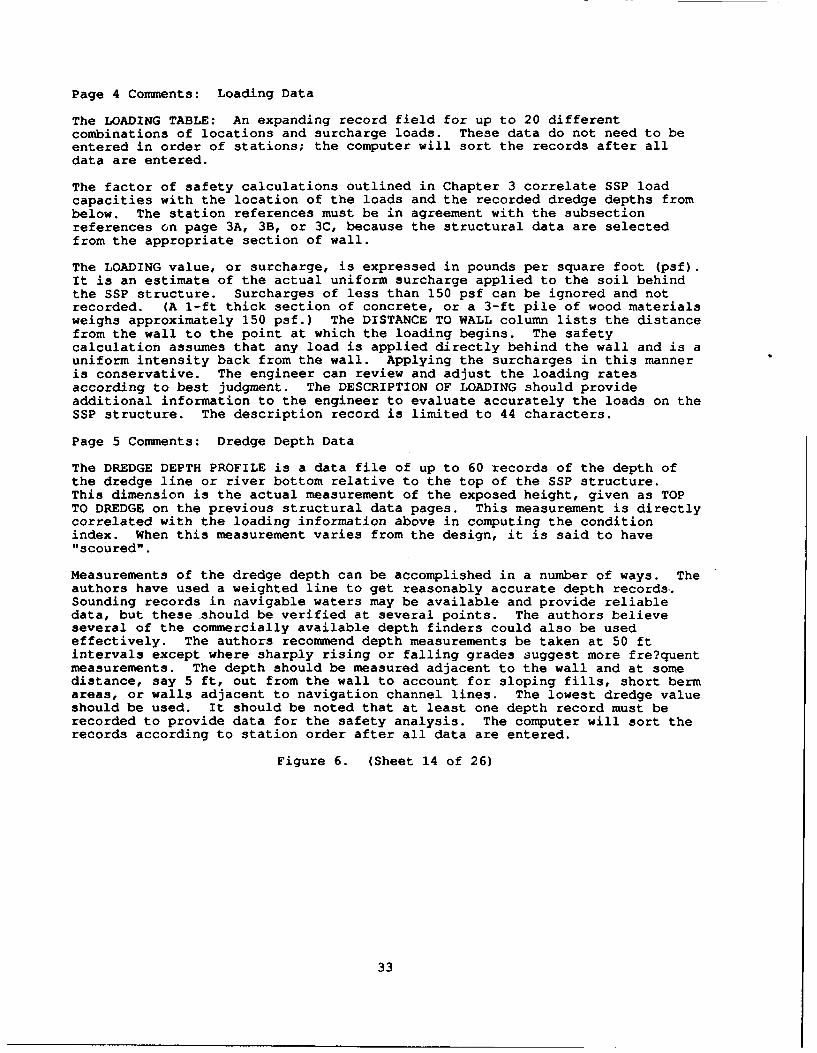
Page 4 Comments: Loading Data
The LOADING TABLE: An expanding record field for up to 20 differentcombinations of locations and surcharge loads. These data do not need to beentered in order of stations; the computer will sort the records after alldata are entered.
The factor of safety calculations outlined in Chapter 3 correlate SSP loadcapacities with the location of the loads and the recorded dredge depths frombelow. The station references must be in agreement with the subsectionreferences on page 3A, 3B, or 3C, because the structural data are selectedfrom the appropriate section of wall.
The LOADING value, or surcharge, is expressed in pounds per square foot (psf).It is an estimate of the actual uniform surcharge applied to the soil behindthe SSP structure. Surcharges of less than 150 psf can be ignored and notrecorded. (A 1-ft thick section of concrete, or a 3-ft pile of wood materialsweighs approximately 150 psf.) The DISTANCE TO WALL column lists the distancefrom the wall to the point at which the loading begins. The safetycalculation assumes that any load is applied directly behind the wall and is auniform intensity back from the wall. Applying the surcharges in this manneris conservative. The engineer can review and adjust the loading ratesaccording to best judgment. The DESCRIPTION OF LOADING should provideadditional information to the engineer to evaluate accurately the loads on theSSP structure. The description record is limited to 44 characters.
Page 5 Comnents: Dredge Depth Data
The DREDGE DEPTH PROFILE is a data file of up to 60 records of the depth ofthe dredge line or river bottom relative to the top of the SSP structure.This dimension is the actual measurement of the exposed height, given as TOPTO DREDGE on the previous structural data pages. This measurement is directlycorrelated with the loading information above in computing the conditionindex. When this measurement varies from the design, it is said to have"scoured".
Measurements of the dredge depth can be accomplished in a number of ways. Theauthors have used a weighted line to get reasonably accurate depth records.Sounding records in navigable waters may be available and provide reliabledata, but these should be verified at several points. The authors believeseveral of the commercially available depth finders could also be usedeffectively. The authors recommend depth measurements be taken at 50 ftintervals except where sharply rising or falling grades suggest more fre?quentmeasurements. The depth should be measured adjacent to the wall and at somedistance, say 5 ft, out from the wall to account for sloping fills, short bermareas, or walls adjacent to navigation channel lines. The lowest dredge valueshould be used. It should be noted that at least one depth record must berecorded to provide data for the safety analysis. The computer will sort therecords according to station order after all data are entered.
Figure 6. (Sheet 14 of 26)
33

U.S. ARMY CORPS OF ENGINEERSSTEEL SHEET PILE STRUCTURE INSPECTION PAGE 6
DISTRESS PROFILE FORM
NOTES FOR USE OF THIS DATA PAGE:1. Use this DATA PAGE for recording pertinent information relative to the
DISTRESS TYPES indicated below. Enter each occurence of a specific distressby recording the DISTRESS TYPE data in the appropriate section below. Theappropriate units of measurement are noted in the column boxes.
2. Use additional sheets of this DATA PAGE if sore space is needed.3. Refer to the Instruction References if more information is required.
MISALIGNMENT STATION DISPLAC. FROM CORROSIONSTATION OF MAX. FROM TOP OF STATION SEVERITY
FROM TO DISPLAC. NORMAL WALL FROM TO LEVEL (1-5)
FT FT IIN FT FT/. /90 j ._ o4zoo 5 ZQ 2 0 __0
SETTLEMENT STATION DISPLAC. SURFACE INTERLOCK SEPARATION
STATION OF MAX. FROM DESCR. INTERLOCK FROM TOPFROM TO DISPLAC. NORMAL TYPE * STATION LENGTH OF WALL
FT APO IN 9 / TF
390- 4 J0 340 __ _ _ _Z____
460 SaC_____zWALL I)STRUCTURE, 2)SURFACED, 3NOTHINW @ELL 1)UNIFORM, 2)DIFFERENTIAL SETTLEMENT
CAVITY FORMATION HOLESCAVITY AT ESTIMATE CAVITY SIZE SURFACE HOLE AT HOLE SIZE FROM TOPSTATION LENGTH WIDTH HEIGHT TYPE 0 STATION LENGTH WIDTH OF WALL
essatas T iFTFTT F
* I)STRUCTURE. 2)SURFACED, 3)NOTHING
DENTS CRACKSDENT AT DENT SIZE FROM TOP CRACK AT CRACK SIZE FROM TOPSTATION LENGTH WIDTH DEPTH OF WALL STATION LENGTH WIDTH OF WALLessasna ssss sessassz ass sta ttasas es e scass assestentss
FT FT IN FT FTt -O 3- Z-0 FT" 0 IT 12 TZ- 0 4____ ___ So z-o o ,,/06 z-0 I a 0
______ZZ __ _I I___z2-0 0 40
Figure 6. (Sheet 15 of 26)
34
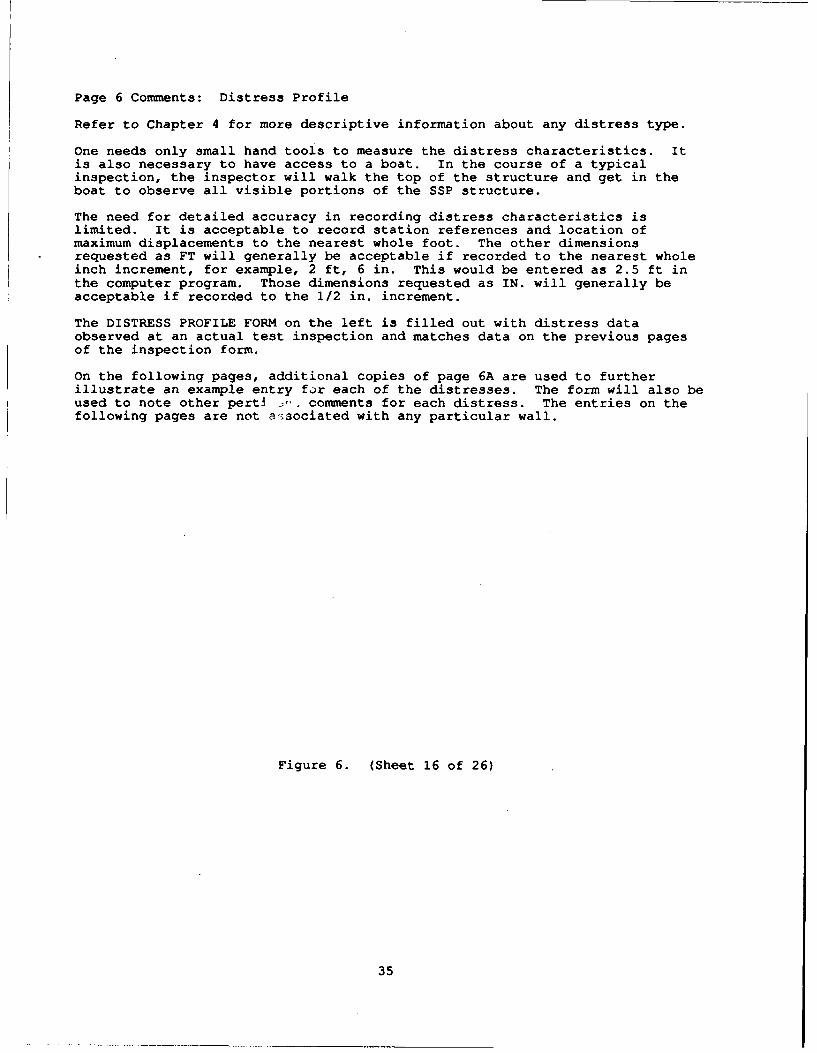
Page 6 Comments: Distress Profile
Refer to Chapter 4 for more descriptive information about any distress type.
One needs only small hand tools to measure the distress characteristics. Itis also necessary to have access to a boat. In the course of a typicalinspection, the inspector will walk the top of the structure and get in theboat to observe all visible portions of the SSP structure.
The need for detailed accuracy in recording distress characteristics islimited. It is acceptable to record station references and location ofmaximum displacements to the nearest whole foot. The other dimensionsrequested as FT will generally be acceptable if recorded to the nearest wholeinch increment, for example, 2 ft, 6 in. This would be entered as 2.5 ft inthe computer program. Those dimensions requested as IN. will generally beacceptable if recorded to the 1/2 in. increment.
The DISTRESS PROFILE FORM on the left is filled out with distress dataobserved at an actual test inspection and matches data on the previous pagesof the inspection form.
On the following pages, additional copies of page 6A are used to furtherillustrate an example entry for each of the distresses. The form will also beused to note other perti , - comments for each distress. The entries on thefollowing pages are not a 3ociated with any particular wall.
Figure 6. (Sheet 16 of 26)
35

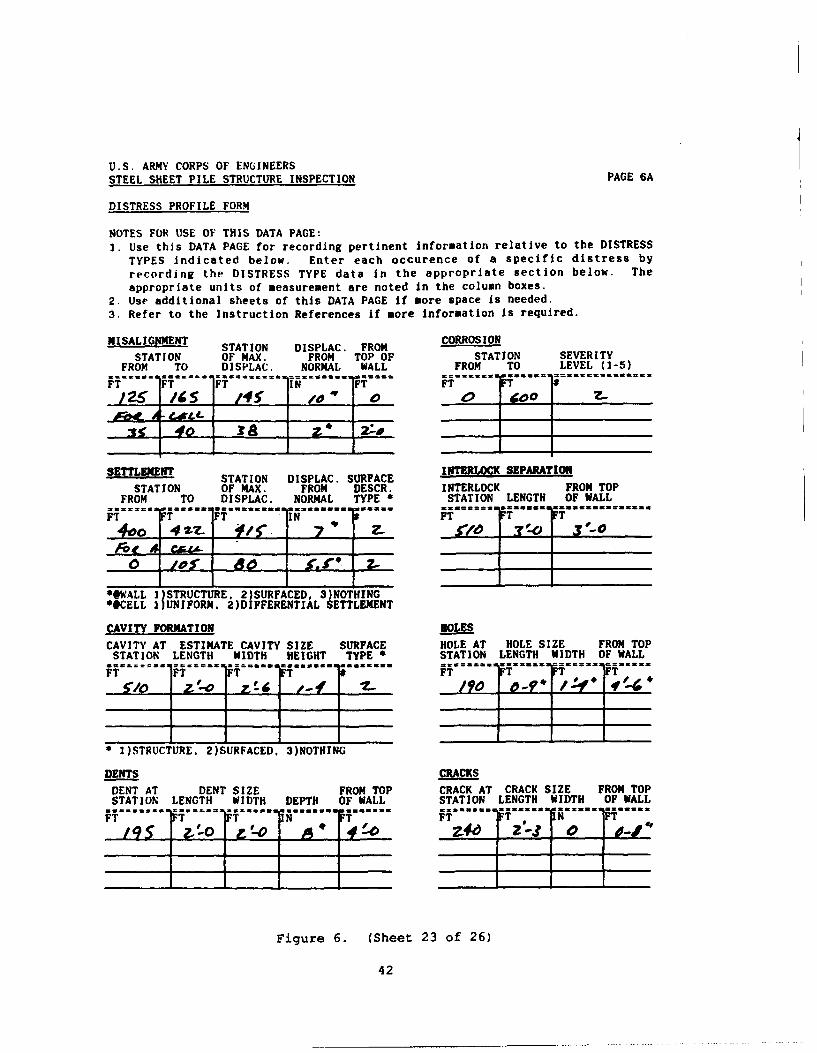
U.S. ARMY CORPS OF ENGINEERS
STEEL SHEET PILE STRUCTURE INSPECTION PAGE 6A
DISTRESS PROFILE FORM
NOTES FOR USE OF THIS DATA PAGE:
I. Use this DATA PAGE for recording pertinent information relative to the DISTRESS
TYPES indicated below. Enter each occurence of a specific distress by
recording the DISTRESS TYPE data in the appropriate section below. The
appropriate units of measurement are noted in the column boxes.
2. Use additional sheets of this DATA PAGE if more space is needed.
3. Refer to the Instruction References if more information Is required.
MISALIGNMENT STATION DISPLAC. FROM CORROSION
STATION OF MAX. FROM TOP OF STATION SEVERITYFROM TO DISPLAC. NORMAL WALL FROM TO LEVEL (1-5)
FT T IN FT0 F
. 40 38 ', _ 2;-_
SETTLEMENT STATION DISPLAC. SURFACE INTERLOCK SEPARATION
STATION OF MAX. FROM DESCR. INTERLOCK FROM TOPFROM TO DISPLAC. NORMAL TYPE * STATION LENGTH OF WALL
FF T T FT uNFT T 1FT4o 4 ZZ 415' 7 I 0 -
:*WALL 1)STRUCTURE, 2)SURFACED, 3)NOTHING*@CELL I UNIFORM, 2)DIFFERENTIAL SETTLEMENT
CAVITY FORMATION HOLES
CAVITY AT ESTIMATE CAVITY SIZE SURFACE HOLE AT HOLE SIZE FROM TOPSTATION LENGTH WIDTH HEIGHT TYPE * STATION LENGTH WIDTH OF WALL
F FT T .TT FT .F ...
* I)STRUCTURE, 2)SURFACED, 3)NOTHING
DENTS CRACKS
DENT AT DENT SIZE FROM TOP CRACK AT CRACK SIZE FROM TOPSTATION LENGTH WIDTH DEPTH OF WALL STATION LENGTH WIDTH OF WALL.. .. ..... ......a -.. ...== = =n==i S I==Ss===== =I
T T IN FT19 S 7"- t- A 4 Z-4d r
Figure 6. (Sheet 17 of 26)
36

Distress Type 1 - MisalignmentLine 1: MISALIGNMENT of a Wall
The measurement of misalignment can be made with a tape measure, a line, a twofoot level, and a straightedge. The typical misalignment of a wall isrepresented by a bow or curvature in the wall that deviates from its initialalignment for some length. Refer to Chapter 4 for types of misalignment andalso illustrations of causes for failure. This line illustrates a bow in thewall that is 40 ft long. The bow is from Station 125 to 165 with a horizontaldisplacement of 10 in. from the design alignment of the wall. The point wheremaximum misalignment was measured is Sta. 145 at the top of the wall. Forcellular walls, wall misalignment is associated with a line that touches thefront edge of each cell.
Minimum misalignment of a wall:
Misalignments in walls 2 in. to 3 in. or less can be ignored. However, ifanother distress such as settlement, a cavity, or a missing fixing bolt occursat the same station location, then the misalignment should be recorded formonitoring its change over time.
Line 3: MISALIGNMENT of a Single Cell
The typical misalignment for a cellular structure, particularly a single cell,is out-of-plumbness. Cell misalignment is recorded by measuring the offsetfrom the plumb line at the point of maximum offset. The location of thismeasurement must correspond with other location criteria relating to the cellconfiguration. For this example, the station location of the misalignment, orout of-plumbness is from Station 35 to 40 approximately 1/3 of the way arounda 35 ft diameter cell. The beginning station location is referenced on theplan view of the cell structure attached to page 2. The reading of themisalignment was 2.0 ft down from the top of the cell and a 2 in. offset (fromvertical line) was measured in the length of the 24 in. hand level. Cellswill bulge and deform from an exact circle as they are filled. This naturallyoccurring bulge should not be interpreted as misalignment. In this case fourmeasurements at 90 degree intervals should be taken and the average should beentered.
Minimum Misalignment of a Single Cell:
Construction standards allow up to 1/8 in. per foot variance from plumb or 1/4in. per two foot. A minimum standard to record vertical misalignment could be1/2 in. vertical offset per two ft.
Figure 6. (Sheet 18 of 26)
37

U.S. ARMY CORPS OF ENGINEERSSTEEL SHEET PILE STRUCTURE INSPECTION PAGE 6A
DISTRESS PROFILE FORM
NOTES FOR USE OF THIS DATA PAGE:1. Use this DATA PAGE for recording pertinent Information relative to the DISTRESS
TYPES indicated below. Enter each occurence of a specific distress by
recording the DISTRESS TYPE data in the appropriate section below. The
appropriate units of measurement are noted in the column boxes.
2. Use additional sheets of this DATA PAGE If more space is needed.
3. Refer to the Instruction References if more information is required.
MISALIGNMENT CORROSIONSTATION DISPLAC. FROM
STATION OF MAX. FROM TOP OF STATION SEVERITYFROM TO DISPLAC. NORMAL WALL FROM TO LEVEL (1-5)
FTm-F ..T. N FT..FTG5 /45 I0 00 goo
mc -40- 4 8 71
SETTLEMENT STATION DISPLAC. SURFACE INTERLOCK SEPARATONSTATION OF MAX. FROM DESCR. INTERLOCK FROM TOP
FROM TO DISPLAC. NORMAL TYPE ' STATION LENGTH OF WALL
Fp T.. F FT FT...... . ...... . ..... ......
_ _ _-o 4 27- 4 f - _-. __- 3 -
*WALL ])STRUCTURE, 2)SURFACED. 3)NOTHING*#CELL I)UNIFORM, 2)DIFFERENTIAL SETTLEMENT
CAVITY FORMATION HOLES
CAVITY AT ESTIMATE CAVITY SIZE SURFACE HOLE AT HOLE SIZE FROM TOPSTATION LENGTH WIDTH HEIGHT TYPE * STATION LENGTH WIDTH OF WALL
FT =F T FT F____ ...o ~ .... 12 i .....L
*])STRUCTURE, 2)SURFACED. 3)NOTHING
DENTS CRACKS
DENT AT DENT SIZE FROM TOP CRACK AT CRACK SIZE FROM TOPSTATION LENGTH WIDTH DEPTH OF WALL STATION LENGTH WIDTH OF WALL
... r V n..... T...
FF T FT
Figure 6. (Sheet 19 of 26)
38

Distress Type 2 - Corrosion
Line 1: CORROSIONThe rating of the deterioration of the SSP structure due to corrosion is madein a subjective manner. Refer to Chapter 4 for a more detailed description ofthe rating system. Selection of the corrosion level observed on a particularsection of a structure is mdde either by comparing the observed condition tostandards in Table 6 or by visually comparing it to photographs in Fig. 15.In the field inspection the only comparison that can be made is a visualinspection of the exposed areas of the structure. There are six levels ofdeterioration within which to rate the structure. The default condition,Group 0, is new or nearly equal to new. This condition requires no entry onthe Profile Form. For the remaining five levels, Groups 1 through 5, aselection must be made and assigned to specific locations of the structure.In this example, the entire length of a 600-foot wall, Sta. 0 to Sta. 600, wasrated at Level 2. An alternative example would be Sta. 0 to 300 rated atLevel 2 and Sta. 300 to 600 rated Level 4, if there had been a majordifference in deteriorated condition between the two sections of wall.
Distress Type 3 - Settlement
Line 1: SETTLEMENT Behind an Anchored or Cellular WallThe measurement of settlement can be made with a tape measure, a line, a 2-ftlevel, and a straightedge. Measurement of settlement will be made at everylocation where a depression of soil occurs and where it appears to beinconsistent with the surrounding soil grade conditions. The settlementcondition noted in this line suggests a depression approximately 22 ft longand 4 ft wide occurring from Sta. 400 to 422. The maximum depth of thesettlement is 7 in. at Sta. 415. For settlement, it is also important to notethat the surface condition is met at the location of the settlement. For awall, the program needs to know whether the backfill is (1) supporting astructure, (2) surfaced with paving or sidewalk, or (3) nothing on thesurface. In this example, the number 2 recorded in the last column suggests apavement or sidewalk was present at the time of the inspection.
In a cellular wall, settlement may occur under a cell cap structure withoutany visible shifting of the cap. This would reflect a surfacing conditiontype (2) with settlement under the paving. The only way this condition can beobserved is by checking through an access port or manhole in the capstructure. When the condition exists, it approximates a large cavity untilthe cap settles down on the fill or the fill is replaced. When this type ofsettlement occurs and is observed, it should be recorded and the void heightshould be measured as the settlement of the fill.
Figure 6. (Sheet 20 of 26)
39

U.S. ARMY CORPS OF ENGINEERSSTEEL SHEET PILE STRUCTURE INSPECTION PAGE 6A
DISTRESS PROFILE FORM
NOTES FOR USE OF THIS DATA PAGE:I. Use this DATA PAGE for recording pertinent Information relative to the DISTRESS
TYPES indicated below. Enter each occurence of a specific distress byrecording the DISTRESS TYPE data in the appropriate section below. Theappropriate units of measurement are noted In the column boxes.
2. Use additional sheets of this DATA PAGE If more space is needed.3. Refer to the Instruction References if more information is required.
MISALIGNMENT STATION DISPLAC. FROM CORROSION
STATION OF MAX. FROM TOP OF STATION SEVERITYFROM TO DISPLAC. NORMAL WALL FROM TO LEVEL (1-5)
FT IT iF 0T ..... I ........ ...../ 1 116 5o HY o01 7-
SETTLEMENT STATION DISPLAC. SURFACE INTERL SEPARATION
STATION OF MAX. FROM DESCR. INTERLOCK FROM TOPFROM TO DISPLAC. NORMAL TYPE * STATION LENGTH OF WALL
FT . T F FT................. T ----- .. ..... FT .............4o 7-2- 1 7 z- .1 0/oI.'ol $ o
! ____g Ar CA4
*SWALL I )STRUCTURE, 2)SURFACED, 3)NOTHINGWCELL I)UNIFORM, 2)DIFFERENTIAL SETTLEMENT
CAVITY FORMATION HOLESCAVITY AT ESTIMATE CAVITY SIZE SURFACE HOLE AT HOLE SIZE FROM TOPSTATION LENGTH WIDTH HEIGHT TYPE * STATION LENGTH WIDTH OF WALL
F ...- ' .... 2.. P ' f ..... fIt"V1 11M F .... f.
I 1)STRUCTURE, 2)SURFACED. 3)NOTHING
DENTS CRACKS
DENT AT DENT SIZE FROM TOP CRACK AT CRACK SIZE FROM TOPSTATION LENGTH WIDTH DEPTH OF WALL STATION LENGTH WIDTH OF WALLF'WVi ... . .. F
T"f ... PT'. VU N TTi FT FT, IN W-/9S z'0 r v 4740 j
Figure 6. (Sheet 21 of 26)
40

Minimum Settlement at a Wall
If the settlement occurs at or near the lock chamber, the minimum settlementthat should be recorded is a 2 in. depression in less than 10 feet. If thesettlement occurs away from a lock site, the minimum settlement that should berecorded is a 4 in. depression in less than 10 feet.
Line 3: SETTLEMENT of a Single Cell Interior Fill
Settlement of interior backfill material can occur and be observed as uniformsettlement or as differential settlement. Uniform settlement of the topsurface is measured from the original construction level or design level tothe current level of the backfill material or cap at its highest point.Differential settlement of the top surface is characterized by a tilted capstructure or uneven slopes that have one point significantly lower than anyother point or surface level. Differential settlement is measured from thelevel of the original construction surface or design level to the currentlevel of the lowest point. The settlement condition noted in this linesuggests that at circumference of 105 feet, a differential settlementmeasuring 5 1/2 in. is located near Sta. 80 (going around the cell). For acell, the type of settlement is recorded in the last column, "SurfaceDescription Type", as either (1) for uniform settlement, or (2) fordifferential settlement.
Settlement may also occur under a single cell cap structure without anyvisible shifting of the cap. The only way this condition can be observed isby checking through an access port or manhole in the cap structure. When thecondition exists, it approximates a large cavity until the cap settles down onthe fill or the fill is replaced. When this type of settlement occurs and isobserved, it should be recorded as uniform settlement and the void heightshould be recorded as the measured displacement of the fill.
Minimum Settlement of Cell Interior Fill:If the settlement is uniform the minimum settlement that should be recorded isa 2 in. change or more. If the settlement is differential, any apparentsettlement that can be measured should be recorded. This provides a recordfor future observation.
Figure 6. (Sheet 22 of 26)
41
U.S. ARMY CORPS OF ENGINEERS
STEEL SHEET PILE STRUCTURE INSPECTION PAGE 6A
DISTRESS PROFILE FORM
NOTES FOR USE OF THIS DATA PAGE:
1. Use this DATA PAGE for recording pertinent Information relative to the DISTRESS
TYPES Indicated below. Enter each occurence of a specific distress by
recording the DISTRESS TYPE data in the appropriate section below. The
appropriate units of measurement are noted in the column boxes.
2 Use additional sheets of this DATA PAGE if more space is needed.
3. Refer to the Instruction References if more information is required.
MISALIGNMENT STATION DISPLAC. FROM CORROSION
STATION OF MAX. FROM TOP OF STATION SEVERITYFROM TO DISPLAC. NORMAL WALL FROM TO LEVEL (1-5)
F;T 6T 'FT45C /40 FTg o
SETTLEMENT STATION DISPLAC. SURFACE ITELOCK SEARATIO
STATION OF MAX. FROM DESCR. INTERLOCK FROM TOPFROM TO DISPLAC. NORMAL TYPE * STATION LENGTH OF WALL.......... ..... Flo...........
a z J. r S0"Z-
:@WALL I)STRUCTURE. 2)SURFACED, 3)NOTHING*@CELL I)UNIFORM, 2)DIFFERENTIAL SETTLEMENT
CAVITY FORMATION HOLES
CAVITY AT ESTIMATE CAVITY SIZE SURFACE HOLE AT HOLE SIZE FROM TOPSTATION LENGTH WIDTH HEIGHT TYPE STATION LENGTH WIDTH OF WALL
F T T FT
/0 7- '- 7*.
' I)STRUCTURE. 2)SURFACED. 3)NOTHING
DENTS CRACKS
DENT AT DENT SIZE FROM TOP CRACK AT CRACK SIZE FROM TOPSTATION LENGTH WIDTH DEPTH OF WALL STATION LENGTH WIDTH OF WALL
Figure 6. (Sheet 23 of 26)
42

Distress Type 4 - Cavity FormationLine 1: CAVITY FORMATIONThe measurement of a cavity that is present behind a SSP wall or within a SSPcell is, at times, a difficult or impossible task. The access point to thecavity may prevent an accurate measurement of the length, depth, and height ofthe cavity. The equipment required to measure a cavity includes a flashlight,tape measure, and a length of wire that can be bent at angles to explore theconcealed sections of the cavity. This line of data describes a cavity behinda wall that is 2 ft wide, 2 ft- 6 in. high, and 1 ft- 4 in. deep. The cavityoccurs at Sta. 510, which coincides with the interlock separation recorded atSta. 510. This illustrates the relationship that a cavity will normally havewith a hole, crack, or a separated interlock. For cavity formation, it isalso important to note what the surface condition is above the cavity. For awall or cellular structure, the program needs to know whether the backfill is(1) supporting a structure, (2) surfaced with paving or sidewalk, or (3)nothing on the surface. In this example, the number 2 recorded in the lastcolumn suggests a pavement or a sidewalk was present at the time of theinspection.
Minimum Cavity Formation
Any cavity formation with a depth exceeding 1 ft. should be recorded. Theinspector may record cavities of a smaller size if other conditions suggestincreasing size or possible contribution to other problems.
Distress Type 5 - Interlock SeparationsLine 1: The measurement of interlock separation is made with a tape measure.The incidence of interlock separation may occur in several different forms butthe measurement will always be the same, that is, the length of the interlockconnection that is no longer connected. The location of the interlockseparation relative to the vertical dimensions of the structure is important,particularly in cellular type structure. This line illustrates an interlockseparation that occurs at Sta. 510 that is 3 ft long and begins 3 ft from thetop of the wall. Every effort should be made to document accurately the totallength of the interlock separation, particularly if the separation extendsbelow the water level. This can be done by feel, by interview of local staff,or by requesting information from local staff when the water level recedes.
Minimum Interlock Separation:On a wall-type SSP structure, any separation that exceeds 12 in. in lengthshould be recorded. On a cellular type structure, all separations should berecorded.
Distress Type 6 - HolesLine 1: The measurement of holes is made with a tape measure. The relativeheight and width of the opening in the SSP section is recorded. The shape
Figure 6. (Sheet 24 of 26)
43

U.S. ARMY CORPS OF ENGINEERS
STEEL SHEET PILE STRUCTURE INSPECTION PAGE 6A
DISTRESS PROFILE FORM
NOTES FOR USE OF THIS DATA PAGE:
1. Use this DATA PAGE for recording pertinent Information relative to the DISTRESS
TYPES indicated below. Enter each occurence of a specific distress by
recording the DISTRESS TYPE data in the appropriate section below. The
appropriate units of measurement are noted in the column boxes.
2. Use additional sheets of this DATA PAGE if more space is needed.
3. Refer to the Instruction References if more information is required.
MISALIGNMENT CORROSIONSTATION DISPLAC. FROM
STATION OF MAX. FROM TOP OF STATION SEVERITYFROM TO DISPLAC. NORMAL WALL FROM TO LEVEL (1-5)....... fln;al ;fl"fif ........~f ff ... fl ..... Er ..... lf...........
_2 __4. /45~ go 0 __ _
mc. 40 .148 z_ 4
STATION ____ I TEROK EARTOSETTLEMENT STATION DISPLAC. SURFACE INTERLOCK SEPRAI
STATION OF MAX. FROM DESCR. INTERLOCK FROM TOPFROM TO DISPLAC. NORMAL TYPE * STATION LENGTH OF WALL..... . ..... .... .............
..... FT T
A0 /o$ 8- ..J. ____ -4oo FRN 477 1' tI _1-O*W.ALL I)STRUCTURE, 2)SURFACED, 3)NOTHING@CELL ;)UNIFOR. 2)DIFFERENTIAL SETTLEMENT
CAVITY FORMATION HOLES
CAVITY AT ESTIMATE CAVITY SIZE SURFACE HOLE AT HOLE SIZE FROM TOPSTATION LENGTH WIDTH HEIGHT TYPE * STATION LENGTH WIDTH OF WALL
= Mus, s M ........ san s s.= f....... .....
Cr/O L1 0 *
I)STRUCTURE. 2)SURFACED, 3)NOTHING
DENTS CRACKS
DENT AT DENT SIZE FROM TOP CRACK AT CRACK SIZE FROM TOPSTATION LENGTH WIDTH DEPTH OF WALL STATION LENGTH WIDTH OF WALL...... .. ... .... .. f...... P .. 7 1 11 1 ;'s .
FT'JFT N TFT TN F
-0 L . k.. Z40 Z-.
Figure 6. (Sheet 25 of 26)
44

of the opening, circular or oblong, is not as crucial as is the occurrence ofan opening that does not have an intended or obvious use. This lineillustrates an oblong opening (hole) that occurs at Sta. 190 that begins 4 ft,6 in. down from the top of the wall. Additional information recorded anopening that is 9 in. long (measured horizontally) by 1 ft 4 in. high or wide.The length of the opening is recorded as the horizontal dimension to indicateif more than one section is affected by the opening.
Minimum Size of Holes:Any opening in an SSP section where the sum of the two recorded dimensions,length and height, will exceed approximately 8 in. should be recorded. Forexample, a round hole of 4 in. in diameter or an oblong hole 6 in. long by 2in. wide should be about the minimum size opening recorded. An exception tothis might be a smaller opening that is the apparent cause of anotherdistress, such as settlement or cavity. The other distress should also berecorded for thorough documentation.
Distress Type 7 - DentsLine 1: Dents are measured with a tape measure. The relative height andwidth of the deformation is recorded. The shape of the deformation could beimportant if it is very large and affects several sections. However, ingeneral, the dimensions of the length and height will be adequate. This lineillustrates an approximately square deformation that occurs at Sta. 194 andbegins 4 ft down from the top of the wall. Additional information describes adeformation that is 2 ft long by 2 ft high or wide and is displaced from thenormal plane of the SSP section approximately 8 in. at its maximumdisplacement. The length of the deformation indicates if more than onesection is affected by the deformation.
Minimum Size of Dent:Any dent in an SSP section where the sum of the two recorded dimensions,length and width, will exceed approximately 18 in. should be recorded. Forexample, an oblong dent 8 in. by 10 in. or a creased dent 3 in. by 24 in.should be recorded. Dents less than 1 in. deep need not be recorded.
Distress Type 8 - CracksLine 1: The measurement of cracks in an SSP section is made with a tapemeasure. The incidence of a crack and its ramifications are very much likethe discussion for interlock separation. Refer to that section, Distress Type5, Interlock Separations, for specifics about measurement and concerns. Thisline illustrates a crack occurring at Sta. 240 that begins 8 in. down from thetop of the wall and the crack is 2 ft-3 in. long. The dimensions describe ahorizontal crack traversing across the sheet.
Minimum Length of Crack:A crack is not intended to be present, so any crack that exceeds 6 in. inlength should be recorded.
Figure 6. (Sheet 26 of 26)
45

PART IV: STRUCTURAL CONDITION INDEX
45. Safety often refers to potential loss of life or significant
property damage. If a structure is unsafe, it is in danger of collapse.
Structural safety has traditionally been measured by a factor of safety.
Hence, uncertainties in loading aid structural strength (i.e., abnormal
conditions) are covered by selecting an appropriately high factor of safety to
ensure a sufficient margin between the applied loads and the structural
resistance. For example, the design criteria for steel sheet pile typically
require a factor of safety of two.
46. In this project, a structural condition index is defined as a
measure of the safety of the structure or risk of failure of the structure.
It is based directly on the factor of safety of the structure. The factor of
safety calculation is often perceived as a fairly rational, objective process.
This is so, in spite of the many simplifying assumptions that must be made.
Presumably, the structural condition index would be reasonably repeatable.
Structural Analysis
47. A basic part of the structural safety evaluation is a structural
analysis. As with all structural analyses, several assumptions must be made.
In this work, the basic assumption is that steel sheet piles behave in the
manner in which they were designed. With this assumption, the US Army Corps
of Engineers design manual (1958) and the US Steel Corporation manual (1975)
are used for the safety analysis. These sources are supplemented by a US
Corps of Engineers computer program (Dawkins 1981) that implements these
rules. These documents describe how to calculate the active and passive soil
pressures on the steel sheet pile by the Coulomb theory.
Cantilevered and Anchored Walls
48. For anchored walls, the equivalent beam method is used to calculate
the bending moments in the sheet pile and the anchor tension. In the equiva-
lent beam method, the sheet is assumed to act as a statically determinate beam
from the top to the inflection point below the dredge line (Figure 7). This
inflection point is assumed to occur at the point of zero net soil pressure,
that is, passive pressure equal to active pressure. In cantilevered wall
design, the sheet is embedded to a sufficient depth to behave as a vertical
cantilever. As referred to in Figure 8, the pile is assumed to rotate about
point 0, mobilizing passive pressure above and below the pivot point 0.
Equilibrium is satisfied for horizontal forces and moments about any point.
46

SURCHARGE
DEFLECTED o ANCHORWALL
,I MAXIMUM
ASUED _ ZEROPOINT OF--', PRESSUREINFL ECTION POIN T
(a) NET PRESSURE (b) MOMENT DIAGRAM
Figure 7. Anchored wall design by equivalent beam method
47

SURCHARGE
I
DEFLECTED--,WALL
IDREDGE''
I_ : lqAXlI'UM
P4VOT
PMOINT, T
(a) NET PRESSURE (b) MOMENT DIAGRAM
Figure 8. Cantilevered wall
49. Three failure modes are analyzed and three factors of safety (FS)
are computed:
a. Pile sheet bending mode
FS, = FY/fb (1)
b. Anchor tension mode (anchored wall only)
FS2 = FY/f t (2)
c. Soil failure at toe
FS3 = s (c + tand)/t (3)
where: Fy = steel yield stress
fb = maximum pile-bending stress
ft = tensile stress in anchors or bolts
s = soil normal stress
c = soil cohesive strength
d = soil friction angle
t = soil shear stress.
48

Some failure modes are not analyzed: fixing bolt, wale bending, and anchor at
the far end of the anchor rod. Also, only uniform surcharge loadings are
considered.
50. The steel yield strength is requested on the inspection sheet. If
it is not available, it is assumed to be 36,000 psi. The inspection sheet
lists various broad categories of soil descriptions. Table 3 lists the soil
properties that are used within this analysis for each of these descriptions
(Lee 1961). These are approximate values selected by the authors as
representative. As discussed in the US Steel Corporation manual (1975, p 25),
the cohesive strength for clays may approach zero for long-term loading, and
an appropriate assumption for such cases is to set the cohesion equal to zero
and a frictional angle between 20 and 30 degrees. "However, many sheet pile
walls have been built on the usual 0 = 0 basis by using the conventional
procedures.. .and it is thought that it would be unduly conservative to design
on the long term 0' basis" (Winterkorn 1975). "However, a great diversity of
opinion exists as to the proper values to use for 0 under different circum-
stances" (Terzaghi 1948) ". ..Such walls are designed on the basis of simple
semiempirical rules for estimating the backfill pressure.. .the design of walls
by this procedure leads on rare occasions to failure, but in the great major-
ity of cases the walls are safer than necessary" (Terzaghi 1948). In the
judgement of the authors, the use of long term properties for clay is too
conservative. Several actual walls which were analyzed using long term
properties had factors of safety less than 1. The time variation of the
properties is obviously difficult to predict, especially with changing water
elevation. Therefore, in this work, the walls will be analyzed using the
short term properties in Table 3.) If users wish to use a more conservative
assumption, they may enter a weaker soil on the inspection sheet.
51. A computer program has been written to calculate the factors of
safety listed above. The program interfaces with the data file prepared from
the inspection data. Hence, to calculate the safety of a steel sheet pile
structure, one need only respond appropriately to the computer prompts.
Within each section, the computer selects the worst case in terms of lowest
dredge depth or largest loading (pages 4 and 5 of inspection sheet). The
water level is assumed to be the same on both sides of the wall since the
water levels usually change slowly enough to permit equalization of the water
level on both sides of the steel sheet. (This is not assumed for lock walls.)
In addition, the water is conservatively assumed to be at the low water level
on page 1 of the inspection sheet. If users wish an analysis at a different
water level, they may enter another low water level on page 1 of the inspec-
tion sheet. If the structural conditions appear to be marginal based on this
analysis, the structural evaluator should use computer programs such as that
developed for the U.S. Army Waterways Experiment Station (Dawkin 1981).
49
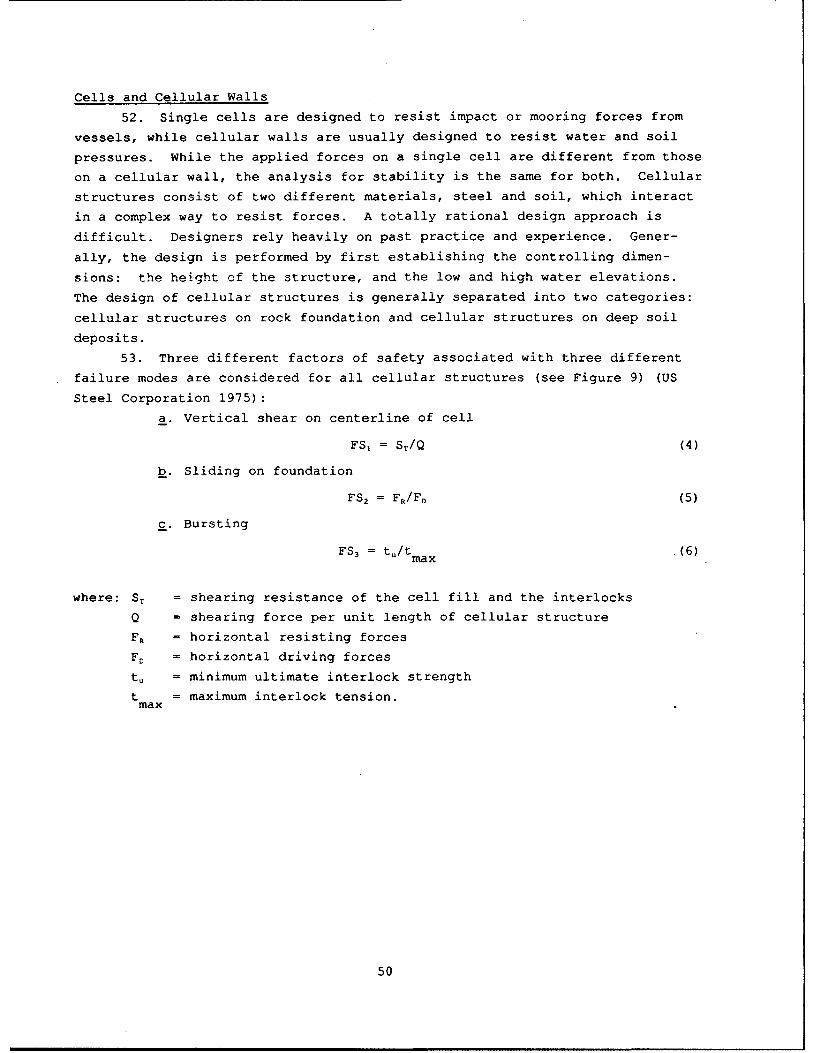
Cells and Cellular Walls
52. Single cells are designed to resist impact or mooring forces from
vessels, while cellular walls are usually designed to resist water and soil
pressures. While the applied forces on a single cell are different from those
on a cellular wall, the analysis for stability is the same for both. Cellular
structures consist of two different materials, steel and soil, which interact
in a complex way to resist forces. A totally rational design approach is
difficult. Designers rely heavily on past practice and experience. Gener-
ally, the design is petformed by first establishing the controlling dimen-
sions: the height of the structure, and the low and high water elevations.
The design of cellular structures is generally separated into two categories:
cellular structures on rock foundation and cellular structures on deep soil
deposits.
53. Three different factors of safety associated with three different
failure modes are considered for all cellular structures (see Figure 9) (US
Steel Corporation 1975):
a. Vertical shear on centerline of cell
FS, = ST/Q (4)
b. Sliding on foundation
FS2 = FR/FD (5)
c. Bursting
FS3 = tu/tmax (6)
where: ST = shearing resistance of the cell fill and the interlocks
Q = shearing force per unit length of cellular structure
FR = horizontal resisting forces
FD = horizontal driving forces
tu = minimum ultimate interlock strength
t = maximum interlock tension.max
50

(a VETCLSER bILDN
I IBURTIN
(dI ONDTO F IR
Fiur 9.FiuemdsfrIellrsrcue51I

For cellular structures founded on consolidating clay (soft tc m-diurr) the
foundation failure factor of safety is also considered (US Steel Corp. 1972):
FS4 = 5.7c/yH (7)
where: y = unit weight of fill
H = height of cellular structure above ground surface.
54. To determine the structural condition index of the cellular
structure, the high water level and the low water level that give the worst
combination are used to give the lowest factor of safety.
55. For cellular walls, the high water level is assumed to be on the
right side of the wall, but not higher than the top of the cell (Figure 10a).
The low water level is assumed to be on the left side of the wall. In the
case of a lock chamber wall, the low water level is assumed to be at the
dredge line.
56. For a single cell, the structural condition index is calculated at
both the low and the high water level, but not higher than the top of the cell
(see Figure 10b) and the minimum of these two values is used.
57. In both cases, if users wish to make the analysis for different
water elevations, they may do so by changing the low and high water level on
page 1 of the inspection sheet.
TOP OF CELL
H.W.L. H.W.L.
L.W.L. __-- L. W. L.
DREDGE
(a) CELLULAR WALL (b) SINGLE CELL
Figure 10. Water level worst case
52

Factor of Safety Relationship
58. The factor of safety is related directly to the structural
condition index using the condition index zones in Table 2. If the factor of
safety is equal to the design value, the condition index is 100. If the
factor of safety falls below one, a Zone 3 (condition index less than 40) is
indicated. Figure 11 illustrates the two straight lines that are used to
relate factor of safety and structural condition index:
C f= 40x SFS FS<l1CI = 40 + 60 FS > 1 (8)
1 1
where: F,1 = the design factor of safety.
59. As described in the previous section, several factors of safety are
calculated, one for each failure mode. The condition index for each mode,
CI;_1 , is calculated using Equation 8. The structural condition index for the
wall section is found as
Structu"al (9)
If a wall has more than one subsection, the minimum value from all of the
subsections is used.
60. Only the scour distress is included in the calculated structural
condition index. Scour is erosion of soil at the toe of the wall caused by
water currents. The effect of scour on safety can be dramatic, since the
passive soil resistance at the wall toe can be significantly reduced. Actual
dredge line elevations from the inspection sheet are used in the safety
calculations. Other distresses discussed in Part V and listed in Table 4 are
not included in the structural condition index.
53

100
ZONE
80 1
S60 II
c 40III
20
II
0 1 DESIGN VALUE
FACTOR OF SAFETY
Figure 11. Relationship between factor of safety and structuralcondition index
54

PART V: FUNCTIONAL CONDITION INDEX
61. The second set of criteria that evolved during this project was
much more subjective than the safety evaluation. This set of criteria involve
"engineering judgment" and depends upon the experience of the person making
the evaluation. These aspects of the condition index were much more difficult
to capture. Experts in this field were interviewed and discussions continued
for some time until a consensus began to develop. The "expert opinion" rules
embedded in the computer-based evaluation of the functional condition index
have been designed to interpret straightforward visual observation data in
much the same manner as a seasoned engineer would interpret field
observations.
62. The experts took many factors into account as they evaluated the
functional condition index. One aspect was the serviceability of the struc-
ture, that is, its performance at and below normal service conditions on a
day-to-day basis. For example, if a lock wall is significantly out of align-
ment, the movement of barges through the lock will be affected. Aesthetics is
also an aspect of serviceability. The appearance of the wall in its parti-
cular location is important.
63. Another factor involved in the functional condition index is, for
lack of a better phrase, subjective safety. Functional safety refers to the
idea that an engineer, using his or her subjective engineering judgment, may
decide that a safety problem is likely. However, with only a visual indica-
tion of the problem, the engineer cannot identify the exact problem without
detailed information.
64. Using misalignment as an example shows that if misalignment exists,
it may not significantly affect serviceability but it may be an indication
that structural failure--such as a tie-rod failure, sheet bending failure, or
passive soil failure at the toe--has occurred or is in progress. Thus,
although the exact cause and effect of the misalignment cannot be pinpointed
without further investigation, the condition index of the structure should
reflect some increased safety risk. For this example and many others, the
increased risk cannot be evaluated by a simple analytical means; thus, it
cannot be included in the structural condition index. It is, therefore,
appropriate to reduce the functional condition index.
65. A distress such as misalignment could be included in the structural
condition index or the functional condition index depending upon the level of
investigation (i.e., objective versus subjective information). Since the
structural analysis in this investigation is at an elementary level (see PART
IV) only one distress (scour) is included in the structural condition index.
66. Typically, each distress (such as misalignment, settlement, or the
number of holes) will be measured by some geometric or numerical quantity X
that is recorded on the inspection sheet. Hence, in the case of misalignment,
55 °

X will be the deviation of the wall from its design condition. Such measur-
able X must be reasonably repeatable. The functional condition index is given
by
FunctionalCI = 100 (0.4) x
where X is some limiting value of X. Referring to the above description ofmaxaction zones (Table 2), X is selected as the point at which the functionalmaxcondition index is 40, that is, the dividing point between Zone 2 and 3.
Figure 12 illustrates the equation and zones from Table 2. If X is zero, that
is, no distress, the condition index is 100. Note that the functional
condition index never quite reaches zero. Following the discussion in the
paragraphs above, X for misalignment has been selected by experts to be themaxpoint at which the misalignment requires immediate repair or, at a minimum, a
more detailed inspection and condition index evaluation must be made. It is a
potentially hazardous situation. The expert makes the judgment for X basedmaxon serviceability or subjective safety considerations. Tables of X aremaxgiven in this chapter for several distresses.
67. If there are several occurrences of an individual distress, the
condition index is found as
That is, the functional condition index for a distress is equal to the product
of the condition indexes for each occurrence of the distress. This equation
is used for all distresses except corrosion.
Distress Descriptions and X
68. A steel sheet pile structure properly designed and constructed
would have an initial condition index of 100. As time passes and the
structure is exposed to varying environmental and operational situations, its
condition will deteriorate. The condition index will degrade as various
distresses are incurred. A total of eight distresses have been identified for
categorization in this project. Each is described briefly in Table 4. Each
of these distresses can detract from the safety and serviceability of the
steel sheet pile.
56

100
g0
80
oo
ZOEE
z0 50 NZONEE2
40 /',. 1Z
0
0.0 0.1 0.2 0.3 0.4 0.5 0.6 0.7 0.8 0.9 1.0 1.1 1.2 1.3 1.4 1.5 1.6X/Xmax
Figure 12. Functional condition index related to X/Xmax
69. The functional condition index for each distress depends upon the
ratio of a field measurement of that distress X to some limit X as inmax
Equation 10. In the following sections, definition, potential causes,
measurement of X, and X values for each distress will be described. Valuesmaxare presented here on a trial basis Before a field inspection, all distress
types should be discussed, with examples and photographs given to assist the
inspectors.
Distress Code 1: Misalignment
Definition and Causes
70. Misalignment is a geometric deviation of the sheet pile from its
initial design alignment. It usually has both vertical and horizontal
components. Misalignment can be caused by several factors (see Figure 13):
a. Structural failure of the sheet, wale, or anchor
b. Soil failure of the toe or slope
C. Horizontal sliding
d. Seepage.
Since misalignment has many causes, its presence may indicate a significant
structural problem. As such, misalignment will reduce the experts' subjective
opinion of the safety of the structure.
57

Measurement and Limits
71. Measurement of the displacement will be made at every location
where either horizontal or vertical misalignment occurs and exceeds a minimum
dimension. The measured dimension will be documented on the profile sheet of
the steel sheet pile structure inspection sheet (PART III). Documentation of
misalignment at each inspection will provide a log of the current conditions,
as well as a record for future inspections, to determine the rate of deflec-
tion. This rate can give information on the severity of the misalignment
problem. The X values fcr misalignment for variois steel sheet pilemaxstructures are listed in Table 5.
Examples
72. A lock guide wall 1500 ft long has a bow from 5+00 to 7+00 with the
maximum deflection of 8 in. at 6+00 (or 600 ft from the 1200 ft lock chamber).
From the formula in Table 5
X =6 + 6 600 = 9 in.max 1200
and the functional condition index for this case (Equation 10) is
8/9CI = 100 (0.4) = 44
73. An erosion control wall 3000 ft long and 2 miles upriver from a
lock has an 18 in. bow that is 600 ft long. Select 40 in. for X from Tablemax5. The functional condition index is
CI = 100 (0.4)18/40 = 66
74. A cell 40 ft high and 32 ft in diameter is 3 in. out of plumb in 24
in. within the exposed height. It is used for protection in the upper pool.
The ratio of cell diameter to height is 32 ft/40 ft or 0.80. Select X = 4maxin. from Table 5. The functional condition index is
CI = 100(0.4) 314 = 50
Distress Code 2: Corrosion
Definition and Cause
75. Corrosion is the loss of the steel material in the sheet pile due
to interaction with its environment. The rate of corrosion is dependent on
the oxygen concentration and moisture in contact with the steel. A steel
sheet pile structure is exposed to different zones of corrosion (Figure 14).
While corrosion is usually very evident and easily noticed in the exposed
58

EXAMPLES OF FAILURES:
SHEET
WALE OR ANCHORI
PLAN VIEWS
TOESLP
CELL STRUCTURE FAILURES:
I All
I SANDI
TIPPING SLIDING UNDERSEEPAGE
Figure 13. Causes of misalignment
59

areas, it is the concealed components (those below the water surface) that are
of most concern for safety reasons.
Measurement and Limits
76. The effect of corrosion in the atmospheric and splash zones is used
to evaluate the functional condition index because it is visible. A distress
coefficient for corrosion must take into account that corrosion of a steel
sheet pile structure seldom impedes the successful or smooth operation of the
structure. However, the condition of a corroded structure of some age is not
as good as the condition of new structure. Its safety has been reduced. The
effect is a subjective evaluation of safety that is difficult to quantify by
measurements or testing. One way to evaluate the corrosion of a structure is
to set a series of standards, or levels of corrosion, with corresponding
numeric distress coefficients. The base for such an evaluation standard would
be new steel sheet pile or clean and painted steel sheet pile with no scale or
pitting. Table 6 describes the various levels of corrosion. The photographs
in Figure 15 illustrate these levels. The limiting value of corrosion is
selected as X = 4. This places a corrosion level of four as the dividingmaxline between fair and poor condition (condition index of 40, see Table 1);
corrosion level five is poor. If more than one level of corrosion is recorded
for a wall, the corrosion condition index is obtained as the length-weighted
average.
77. A 600-ft steel sheet pile wall has a corrosion level of 1 over 500ft and a corrosion level of 3 over 100 ft. The functional condition index for
the 500 ft length is calculated as
1/4CI = 100 (0.4) = 80
and for the 100 ft length as3/4
CI = 100 (0.4) = 50
so that the final corrosion functional condition index is the length-weighted
average
C1 500~)+ 50 00) 675
60
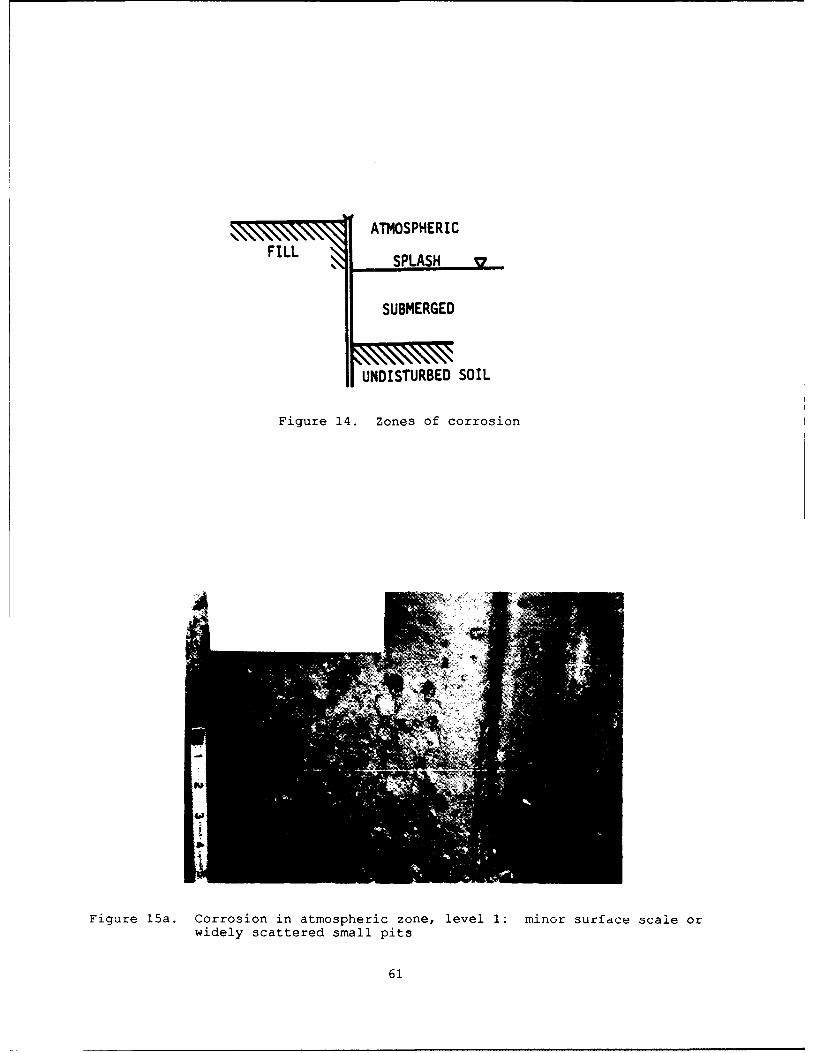
ATMOSPHERIC
FILL SPLASH
SUBMERGED
UNDISTURBED SOIL
Figure 14. Zones of corrosion
Figure 15a. Corrosion in atmospheric zone, level 1: minor surface scale orwidely scattered small pits
61

Figure 15b. Corrosion in atmospheric zone, level 2: considerablesurface scale and/or moderate pitting
Figure 15c. Corrosion in atmospheric zone, level 3: severepitting in dense pattern, thickness reduction in localareas
62

Figure 15d. Corrosion in atmospheric zone, level 4: obviousuniform thickness reduction
Figure 15e. Corrosion in atmospheric zone, level 5: Holes due tothickness reduction and general thickness reduction
63

Distress Code 3: Settlement
Definition and Cause
78. Settlement is the vertical movement of the soil behind the sheet
pile. It can be caused by consolidation of the soil, loss of backfill, or
wall movement. Settlement can affect operations behind the wall. In cells it
can indicate a partial loss of strength, that is, a subjective reduction in
safety.
Measurement and Limits
79. Measurement will be made at every location where settlement occurs
and exceeds a minimum dimension. The measurements must note the location of
the depression on the profile sheet. The settlement depth is recorded and
used to calculate the functional condition index. Additional documentation of
the width of the settlement behind the structure is also recorded. The Xmax
limits for settlement are listed in Table 7.
Examples
80. A lock guide wall (cantilevered, anchored, or cellular) is 1500 ft
long and has no surfacing behind the wall. A depression 27 in. deep by 35 ft
long occurs behind the wall at 800 ft from the lock. From Table 7, select
X = 36 in. and find the functional condition index asmax
27/36CI = 100 (0.4) = 50
81. A single cell has a 42 ft diameter and is 24 ft tall. If a uniform
settlement of 5 in. occurs, the functional condition index is
5/12CI = 100 (0.4) = 68
If a differential settlement of 5 in. occurs, the functional condition index
is
5/(4.2) (3)CI = 100 (0.4) = 70
Distress Code 4 : Cavity Formation
Definition and Cause
82. Cavity formation occurs behind the sheet when some of the fill
material is lost. Associated settlement may or may not occur, but the
potential exists. The material may be lost through a hole in the sheet or
beneath the sheets. The loss of fill material could obstruct navigation,
damage underground utilities, and reduce strength.
64

Measurement and Limits
83. A cavity behind a sheet is recorded during the inspection by
measuring its size: depth, length, and height. Its location (station) will
also be recorded. The volume of the cavity is used as the measure of its
effect on the functional condition index. The limiting values are listed in
Table 8.
Example
84. A cavity is found under the concrete cap on a single cell. The
approximate dimensions of the cavity are 2 ft wide x 18 in. x 10 in. high.
X = (2) (1.5) (0.83) = 2.49 cu ft
Distress Codes 5-8:
5. Interlock Separation, 6. Holes, 7. Dents, 8. Cracks
Definition and Cause
85. These four distresses represent openings in the steel sheet. They
can be cause1 by several factors but usually are caused by impact or corro-
sion. Large, major holes due to impact will most likely be fixed very shortly
after they occur. Generally, they will not be present at an inspection and
therefore are not included.
86. These four distresses are grouped together in terms of their con-
sideration for service loss and safety to the steel sheet pile structure. In
general, these distresses cause no significant loss or impedance to operation
of the structure. However, as is the situation with corrosion, the occurrence
of these distresses does cause the steel sheet pile structure to be in a less
than design condition. Subjectively, the safety has been reduced though it is
difficult to quantify in an analytical manner. These distresses may contrib-
ute directly to the presence of other primary distresses, such as settlement,
which have safety and serviceability consequences. In this case, the effect
of the opening is also accounted for in the primary distress condition index.
Measurement and Limits
87. The sizes of all significant separations--holes, dents, or cracks--
are recorded. Openings below a certain size (e.g., bolt holes or lifting
holes) are ignored.
88. For each singular occurrence of any of these distresses, little
effect would be noted on serviceability. However, the cumulative effect of
five of these distresses would be significant if they occurred in 100 ft of
steel sheet pile structure. Therefore, the X limits for openings aremaxdefined in a slightly different manner than other distresses. The size and
length limits are not explicitly defined. Rather, notes are made of one
occurrence of an interlock separation, a hole, a dent, or a crack. Dimensions
for each are recorded on the profile sheet. The density of the holes per
65
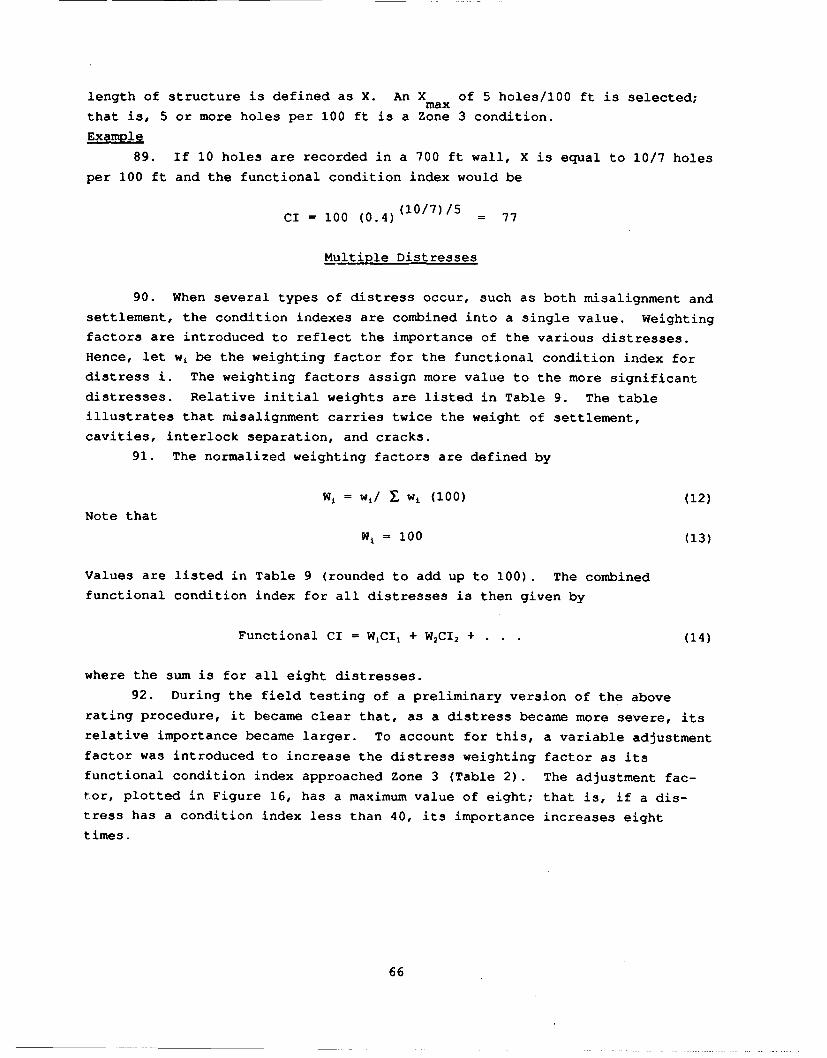
length of structure is defined as X. An X of 5 holes/100 ft is selected;maxthat is, 5 or more holes per 100 ft is a Zone 3 condition.
Example
89. If 10 holes are recorded in a 700 ft wall, X is equal to 10/7 holes
per 100 ft and the functional condition index would be
(10/7)/5CI = 100 (0.4) ( 77
Multiple Distresses
90. When several types of distress occur, such as both misalignment and
settlement, the condition indexes are combined into a single value. Weightingfactors are introduced to reflect the importance of the various distresses.
Hence, let wi be the weighting factor for the functional condition index for
distress i. The weighting factors assign more value to the more significant
distresses. Relative initial weights are listed in Table 9. The tableillustrates that misalignment carries twice the weight of settlement,
cavities, interlock separation, and cracks.91. The normalized weighting factors are defined by
Wi = wi/ X wi (100) (12)
Note that
W= 100 (13)
Values are listed in Table 9 (rounded to add up to 100). The combined
functional condition index for all distresses is then given by
Functional CI = WiCI + W2C12 + (14)
where the sum is for all eight distresses.
92. During the field testing of a preliminary version of the above
rating procedure, it became clear that, as a distress became more severe, its
relative importance became larger. To account for this, a variable adjustment
factor was introduced to increase the distress weighting factor as its
functional condition index approached Zone 3 (Table 2). The adjustment fac-
tor, plotted in Figure 16, has a maximum value of eight; that is, if a dis-
tress has a condition index less than 40, its importance increases eight
times.
66

93. Suppose that only the following distresses are recorded:
CIX X (from Eq 10)max
Misalignment 6 12 63Settlement 2 12 86Misalignment 4 6 54Corrosion 3 4 50
10
9
8 / Cl 8 - 710C-40)/30
0
zi 5
ZONE3
3
2 2 i ZONE 2i
00 10 20 30 40 50 60 70 80 90 100
Figure 16. Weight adjustment factor for functional condition index
Following Equation 11, the functional condition index for misalignment is
100(0.63) (0.54) or 34. With the initial weights from Table 9 and the
adjustment factor from Figure 16, the revised weights are found as:
Adjustment Revised RevisedCI wj Factor wi Wi%
Misalignment 34 8 8.0 64 56.7Corrosion 50 5 5.7 28 24.8Settlement 86 4 1.0 4 3.5Cavities 100 4 1.0 4 3.5Interlock 100 4 1.0 4 3.5Separation
Holes 100 3 1.0 3 2.7Dents 100 2 1.0 2 1.8Cracks 100 4 1.0 4 3.5
11 100.0
67

The final functional condition index is now round as
Subjective CI - 0.567(34) + 0.248(50) + 0.035(86) + 0.035(100) +
0.035(100) + 0.027(100) + 0.018(100) + 0.035(100) - 50
Field Testing
94. The inspection and rating procedure described in this report has
been applied in two field tests. In July 1986 the procedure was applied to
the upper and lower guide wall at Peoria Lock and Dam in Peoria, IL. Three
U.S. Army Corps of Engineer experts were involved in this testing: John Sirak
(Ohio River Division), Richard Atkinson (Rock Island District), and Raymond
Horton (Rock Island District). Dr. Anthony Kao, USACERL project monitor, was
an observer. The results of that field test, although primarily qualitative,
were used to make several modifications to a prev.ous version of the rating
procedure. The results of that test are not specifically addressed here.
95. In July 1987 another field test was conducted in the Chicago area
by four Corps engineers: Sirak, Atkinson, Horton, and Joseph Jacobazzi (North
Central Division). Kao was also present. Nine dif-ferent wall locations and
functions were inspected. Each expert was asked to rate the individual
distresses in each wall and rate the overall wall, that is, assign a
functional condition index. Many of the comments and suggestions made during
that test have been incorporated into the current version of the procedure.
Wall A
96. Wall A is an anchored-type wall approximately 400 ft long that is
used as a loading dock retaining wall. The wall height exposed above water
was 7 ft and the overall height from top of wall to dredge averaged 24 ft.
Anchor rods appeared to be 2.25 in. in diameter at 6 ft spacings. The steel
sheet pile appeared to be PZ27. The observed distresses included two
instances of misalignment with displacements of 8 in. over 75 ft and 5 in.
over 20 ft; seven instances of dents with six being small (1 to 2 ft in
diameter) and one being much larger (9 ft by 3 ft and depressed 8 in.); and a
general state of corrosion judged to be about Level 2. No other distresses
were noted for the computer evaluation, although several of the experts noted
that they considered settlement behind the misalignment and also interlock
damage and cracks in conjunction with the dents.
Wall B
97. Wall B was, in fact, the same wall as Wall A. However, the experts
were asked to rate the wall as if it were a guide wall in a lock and dam
facility.
Wall C
98. Wall C is an anchored-type wall approximately 285 ft long that is
used as a loading dock retaining wall where salt is unloaded. The exposed
68

wall height was 9 ft and the overall wall height was approximately 19 ft. The
steel sheet pile appeared to be PDA27. The observed distresses were dominated
by the severe corrosion. Different levels of corrosion were recorded for
sections of the wall and included levels 2, 3, 4, and 5. One instance of mis-
alignment with a displacement of 6 in. over 40 ft and one hole 2 ft long by 6
in. wide were also recorded. No other distresses were noted, although several
experts noted they considered the corrosion to be severe enough to have caused
interlock damage and left the steel material so thin that holes were imminent.
Wall D
99. Wall D is an anchored-type wall approximately 700 ft long that is
used as a retaining wall for a parking lot. The exposed wall height was 17 ft
and the overall wall height was approximately 28 ft. The steel sheet pile is
PZ32. The original anchorage system was battered H-pile at 4 ft-6 in.
centers. When a soil failure occurred at the toe of the wall, a misalignment
developed with the bottom of the wall moving out with a displacement of 24 in.
over 125 ft. Additional anchor rods were installed at 6 ft centers at a lower
elevation to hold this section of wall. The experts were aware of this repair
so that it may have affected their judgment on the condition index. The
experts were not asked to judge the wall as if the repair had not been made.
One hole was present and a general state of corrosion was judged to be about
Level 2. The experts commented that settlement behind the misalignment might
be a problem.
Wall E
100. Wall E is an anchored-type wall approximately 200 ft long used as
a retaining wall. The exposed wall height was 11 ft and the overall wall
height was approximately 21 ft. Anchor rods appeared to be 1.5 in. in
diameter at 7 ft spacings. No other data could be obtained. The observed
distresses included four instances of holes about 1 ft in diameter, one crack
that was about 2 ft long and separated 1/2 in., and three small dents. A
general state of corrosion was judged to be about Level 4. No particular
comments were noted by the experts.
Wall F
101. Wall F is an anchored-type wall approximately 400 ft long used as
a loading dock retaining wall. The exposed wall height was 8 ft and the
overall wall height was approximately 21 ft. No other data were obtained.
The observed distresses included one misalignment with a displacement of 18
in. at the top of the wall over 65 ft of wall, 14 instances of dents that were
all in the small category (1 to 2 ft in diameter), and one instance of a crack
that was about 2 ft long but not separated. A general state of corrosion was
judged to be about Level 2. No other distresses were noted, although the
experts noted they considered settlement behind the misalignment and interlock
damage and cracks in conjunction with the dents.
69

Wall G
102. Wall G was in fact the same wall as Wall F above but the experts
were asked to evaluate and rate the wall as if it were a lock guide wall at a
lock site.
Thomas J. O'Brien Lock Wall
103. The lock walls of the O'Brien Lock and Dam facility on the Little
Calumet River in South Chicago are cellular structures. The river wall of the
lock chamber is 965 ft long and 23 ft wide, com-posed of diaphragm cells. The
land side wall of the lock chamber is similar in construction, but the steel
sheet pile is not normally exposed to view so no observation could be made.
104. The exposed sheet pile in the river wall appeared to be in
reasonably good condition except for two observed distresses. There was a
crack in one cell running from the top down about 5 ft. The concrete cap had
settled as much as 4 in. near the center of the cells. Little if any
settlement had occurred at the cell diaphragms, producing a slightly uneven
surface on top of the wall. Corrosion was at a low level.
Thomas J. O'Brien Lower Guide Wall
105. The lower pool guide wall is an anchored-type wall 1000 ft long
used as a retaining wall and for barge alignment with the lock. The exposed
wall height was 7 ft and the overall wall height was 24 ft. The anchor rods
were 2.5 in. in diameter at 6 ft spacing. The steel sheet pile is PZ27. The
only observed distress was a general state of corrosion judged to be about
Level 2.
Expert Rating
106. During the field test, each expert was asked to estimate the
functional condition index for each of the individual distresses. The experts
viewed each wall and observed several distresses summarized earlier in this
section. The experts were also asked to assign a weight factor to each
distress, considering wall location and function. Finally, an overall
functional condition index for the wall was requested. The results from each
expert for each wall are presented graphically in Greimann and Stecker (1987).
107. The averages of the experts' ratings for the individual distresses
are also presented in Greimann and Stecker (1987). When these averages were
compared to the functional condition indexes in a previous version of the
rating system, several observations were apparent:
1. The previous version tended te overrate the wall. This wascorrected by introducing Equation 10 for the functionalcondition index.
I. No expert gave a condition index of 100. Apparently, theexperts judged that no wall could be "perfect" if it had beenin existence for several years, even though no particulardistresses could be documented. No correction was made to thecurrent rating model to reflect this observation.
70

c. No condition indexes of zero were recorded. Equation 10
reflects this change.
With these modifications to the previous version, the walls were reanalyzed
using the current version and the resulting individual distress, functional
condition indexes were compared to the expert averages.
108. With regard to the overall wall rating, one observation was very
clear--if a wall had a major distress, the overall wall rating was greatly
affected. That is, if a distress became severe, its importance was increased.
For example, Wall C had a severe corrosion problem. The experts gave the wall
a very low overall rating even though they gave corrosion only about a 25
percent weighting factor. This obser-vation was accounted for by introducing
the weight adjustment factor described in Figure 16. The adjustment factor
increases the importance of a distress as the distress becomes more severe. A
comparison of the expert's average and the overall functional condition index
from the current version is summarized in Figure 17.
109. The correct version of the rating system now shows an improved
reflection of the experts' subjective rating. As one might expect, however,
there is still variance between the current and the expert version (and, in
fact, between individual experts). The results of any rating must be
interpreted in this light (Greimann and Stecker 1987, Appendix E).
EXPERT AVERAGE F RATING MODEL
10090 -
x 80LUS 70
60Z0 50
40 -Z 30 -0
2010
0-
Figure 17. Comparison of functional index rating with experts' rating.
71

PART VI: MAINTENANCE AND REPAIR ANALYSIS
Problems List
110. The inspection and rating procedure is aimed at assessing the
current condition of the structure. Through the safety and functional condi-
tion indexes, a number of distresses and safety problems may be identified for
each structure. Each problem is quantifiable either by a field measurement or
by a safety calculation. The software developed for this project will display
a list of problems that were identified during the inspection. The number of
occurrences and type of distresses (Table 4) are listed. If the safety calcu-
lation produces a factor of safety (see PART IV for various factors of safety)
less than 2.0, a safety problem is also identified on the list.
111. Each problem detracts from the perfc-mance (safety and/or service-
ability) of the structure. As discussed and listed in PARTS IV and V, each
problem can have one or more causes. A problem or distress is usually a
symptom of a cause. To repair the problem, it is often desireable to know the
cause. Frequently, however, the level of inspection does not permit the
precise determination of the cause of a problem. For example, misalignment
(the problem) can have several causes as mentioned in PART V (sheet bending,
anchor failure, toe failure). As another example, a low factor of safety for
the soil on an anchored wall could be caused by weak soil at the toe, insuffi-
cient pile penetration, eroded dredge line, or high surcharge behind the wall.
The software for this project does not diagnose the cause. Each problem is
described and possible causes are listed. "Engineering judgment" is required
to look at the information and assess the cause. In fact, as mentioned in
PART III, an in-depth field inspection with excavation, diving, or ultrasonic
ins, -tions may be required to identify the cause.
Maintenance and Repair Alternatives List
112. For each problem identified above, there is a set of possible
maintenance and repair alternatives. Hence, to fix the misalignment problem,
sections of sheet pile could be replaced, the anchor system repaired, or the
dredge line brought back to design levels and protected. Or, for the low soil
factor of safety problem, longer pile could be driven, soil at the dredge line
could be replaced, or the surcharge could be removed. As discussed in the
previous section, the appropriate maintenance and repair alternative will
often depend upon the cause of the problem. Using engineering judgement, the
user can select preliminary alternatives. Several alternatives may be
possible, ranging from inexpensive but short term fixes to complete replace-
ment of the wall. Some alternatives can solve more than one problem. For
72

example, replacing a section of wall with longer pile can remove several
distresses and solve a safety problem.
113. Each alternative is described by a note in the personal computer
(PC) software. The list of alternatives and notes can be edited and updated
by the user. The user assigns an estimated cost and an effective life to each
alternative. Engineering judgement, past experience in the district, and the
current market value of repair services enter into the cost and life estimate.
Maintenance and Repair Solutions
114. Up to five separate maintenance and repair solutions can be set up
in the current software. Each solution consists of a set of maintenance and
repair alternatives. Some of these alternatives can be selected from those
mentioned in the previous section. Others not on the list can be added. Each
solution can involve varying approaches to fixing the problems. One solution
could be a do-nothing alternative with no initial costs but large, long-term
user costs. Another solution may replace the entire wall, which fixes all the
problems, but at a large initial cost. Other immediate solutions may include
maintenance and repair alternatives that completely fix some problems or
partially iix several problems.
115. As emphasized above, the engineer must use his or her judgment
when developing each solution from the alternatives. The program does not
isolate cause. Many alternatives can often be eliminated "by inspection."
Again, it iray be necessary to collect additional field or analytical data
beyond that recorded on the inspection sheets.
116. The time period for the maintenance and repair solution is entered
by the user. Some alternatives (e.g., painting) may need to be repeated at a
regular frquency throughout the time period for the solution. Since the
expected life and cost of each alternative have been determined by the user,
the total initial cost and annualized costs can be computed for the solution,
as will be jescribed in the discussion of life cycle cost analysis.
Consequence Modeling
117. All of the maintenance and repair alternatives have consequences
that affect the condition of the structure. Consequence modeling is the part
within the maintenance and repair analysis in which the effect of the various
solutions on the safety and functional condition indexes are evaluated and a
life cycle cost analysis performed. The software user is asked to assess the
effect of the solution on the distresses and the safety attributes recorded
during the inspection. Hence, pages 4, 5, and 6 of the inspection sheet are
displayed on the PC monitor one portion at a time. The user is asked to
modify the entries to reflect the solution that is being evaluated. For
73

example, if a sheet pile section is being replaced, the user would eliminate
the associated crack or hole or dent from the distress profile. Similarly, if
safety features such as dredge line or surcharge are altered, the corre-
sponding entries are modified. The user can request a printout of these
modifications as a more detailed explanation of the solution.
118. After the changes have been entered, new safety and functional
condition indexes are calculated to quantify the consequences.
Life Cycle Cost Analysis
119. A preliminary cost analysis can be performed by the program. The
current cost and life of each maintenance and repair alternative, the length
of analysis period, and the beginning year of the analysis period have been
entered in the solution phase of the analysis process. When a life cycle cost
analysis is requested, the user is asked to furnish the interest rate and
inflation rate for the analysis period. Length of downtime and out-of-service
costs are also requested. With this information the program calculates
First Cost = C, + CO (15)
and
Annual Cost = (CTRM + CTD)/AP
where: CM = initial cost of solution (sum of current cost of individual
maintenance and repair alternatives adjusted to year of
implementation by inflation rate)
CTRM - total cost of solution (sum of initial cost of individual
maintenance and repair alternatives incremented by interest
rate for the length of the analysis period)
CD = initial downtime costs (number of days times rate per day)
CTD - initial downtime costs incremented by the interest rate for
the length of the analysis period
AP - length of the analysis period in years
Final Solution
120. A printed record of all the information developed in the inspec-
tion and rating process and the maintenance and repair analysis are available
to the user. Using the consequence modeling results (revised condition
indexes), the preliminary cost analysis, and individual judgment, the engineer
can make a preliminary selection of a maintenance plan for the sheet pile
structure. The program and process that have been developed and presented
here are useful tools to help an engineer perform an inspection, record the
74

data from an inspection, evaluate the condition of a structure from the
inspection data, and perform a preliminary analysis of various maintenance and
repair solutions. However, there are some limitations to the analysis. At
this time, one would be naive to use only the results of this analysis
(ratings and costs) as a basis for a final decision. One purpose of this
report is to publish this analysis process for the Corps community. Exposure
to the analysis system is intended to build confidence in its usage and
results. This work should be viewed as a step in the process of evolving a
more complete maintenance and repair program for steel sheet pile structures.
75

PART VII: SUMMARY AND RECOMMENDATIONS
Summary
121. As a part of the U.S. Army Corps of Engineers REMR program, the
project team at Iowa State University has developed an inspection and rating
procedure and a maintenance and repair analysis for steel sheet pile
structures. Anchored, cantilevered, and cellular structures of steel sheet
pile serve as lock walls, dams, guide walls, protection structures, and
mooring structures.
122. The inspection and rating procedure has intentionally been kept as
simple as possible. The inspection requires only simple hand tools such as a
tape measure, level, weighted rope, and string. An inspection sheet has been
developed for recording historical information (location, previous
inspections, or repair history, etc.), structural information (wall type,
cross section, pile lengths, water depths, dredge line depth, surchargeloadings, etc.) and distress documentation (misalignment, corrosion, settle-
ment, interlock separation, etc.). PC software has been written to record the
inspection information on disks. Software will be available from U.S. Army
Engineer Waterways Experiment Station's Engineering Computer Program Library
(ECPL). Address requests to: Comnander and Director, U.S. Army Engineer
Waterways Experiment Station, ATTN: CEWES-IM-DS, 3909 Halls Ferry Road,
Vicksburg, MS 39180-6199 or call (601) 634-2581.
123. A condition index is computed directly from the inspection
records. The condition index is a number scale from zero to 100 that indi-
cates the current state of the structure. It is primarily a planning tool
that indicates the relative need to perform REMR work. Condition indexes
below 40 indicate that immediate repair is required or, possibly, that a more
detailed inspection and reanalysis are required.
124. Two separate condition indexes make up the condition index. The
structural condition index is a reasonably objective measure of the structural
safety. It is related directly to the factor of safety, which is auto-
matically calculated by the PC software. A functional condition index, based
on the opinion of several experts from the Corps of Engineers, is also
calculated. It involves at least two considerations: (1) serviceability, orhow the structure performs its function on a day-to-day basis and (2) subjec-
tive safety, or how, in the judgment of expert engineers, the safety of the
structure has been degraded by various distresses.
125. The inspection and rating procedure has been applied in two field
tests (July 1986 and July 1987). The results of these tests have been
incorporated into the current version of the procedure.
126. A maintenance and repair analysis phase of the program allows the
user to make a preliminary assessment of various alternatives for fixing the
76

structure. A list of problems in the structure is collected from the inspec-
tion data. A list of maintenance and repair alternatives within the program
can be updated and expanded. The user develops up to five maintenance and
repair solutions, each of which consists of a set of maintenance and repair
alternatives that solve the associated problems. Initial cost and expected
life of each solution are entered. The consequences of each solution are
quantified by reevaluating the condition index of the structure. Life cycle
costs of each solution are evaluated after the rates of interest and inflation
and downtime costs are furnished.
Recommendations
127. The current inspection and rating procedure for steel sheet pile
structures has had sufficient development and testing to warrant its distribu-
tion on a wider basis. However, it should still be considered in a state of
development. Many of the concepts introduced, such as structural condition
index, functional condition index, X values, and weighting factors, shouldmaxbe exposed to a broader range of engineers who work in the area. Modifi-
cations to the procedure are certainly expected and welcomed.
128. The maintenance and repair analysis presented here represents a
significant tool to be used by experienced engineers to help them arrive at
maiatenance and repair decisions. It, too, is ready for an initial distribu-
tion and evaluation by the Corps community. It should be considered as a
preliminary version; a step in an evolutionary process. As with all engineer-
ing analyses, numerical results should not be interpreted too literally, but
considered in the light of "engineering judgement."
77

REFERENCES
1. Dawkins, William P., 1981. Users Guide: Computer Program for Design and
Analysis of Sheet Pile Walls by Classical Methods, U.S. Army Corps of
Engineers, Washington, D.C.
2. Greimann, L., and Stecker, J., 1988. Users' Manual: Inspection and
Rating of Steel Sheet Pile Structures, Draft Technical Manual REMR-EM-XX
(U.S. Army Corps of Engineers).
3. Lee, D.H., 1961. Deep Foundation and Sheet Piling, London: Concrete
Series.
4. Terzaghi, K., and Peck, R. B., 1948. Soil Mechanics in Engineering
Practice, Wiley & Sons.
5. US Army Corps of Engineers, 1958. Depign of Pile Structures and
Foundations, U.S. Army Corps of Engineers, Washington, DC.
6. US Steel Corporation, 1975. U.S. Steel Sheet Piling Design Manual.
7. Winterkorn, H. Y., and Fang, H.-Y., 1975. Foundation Engineering
Handbook, Van Nostrand-Reinhold.
78

Table I
Condition Index Scale
Value Condition Description
85-100 Excellent--No noticeable defects, some aging or wear visible
70-84 Very Good--Only minor deterioration or defects evident
55-69 Good--Some deterioration or defects evident, function notimpaired
40-54 Fair--Moderate deterioration, function not seriously impaired
25-39 Poor--Serious deterioration in at least some portions ofstructure, function seriously impaired
10-24 Very Poor--Extensive deterioration, barely functional
0-9 Failed--General failure or failure of a major component, no
longer functional
Table 2
Condition Index Zones
Zone CI Range Action
1 70-100 Immediate action not required
2 40-69 Economic analysis of repair alternatives recommended todetermine appropriate maintenance action
3 0-39 Detailed evaluation required to determine the need forrepair, rehabilitation or reconstruction, safetyevaluation recommended
79

Table 3
Assumed Pmperties of Soil
Unit Friction Wall CohesionShotpermtil Weight Angle Friction (C)Properties(PC () () (PSF)
1. Sand 90 30 10 0
2. Gravel 110 35 11 0
3. Rock 90 45 15 0
4. Soft clay 95 5 0 400
5. Medium clay 105 10 3 800
6. Stiff clay 115 15 5 1500
7. Unknown 95 5 0 400
Table 4
Distresses- in Steel Sheet Pile Structures
Distress Code Distress Brief Description
1 Misalignment Horizontal or vertical deviation fromthe design alignment
2 Corrosion Loss of steel due to interaction withenvironment
3 Settlement Vertical movement of material behindsheet pile
4 Cavity formation Loss of fill material behind or withinsheet pile
5 • Interlock Failure of sheet interlocksseparation
6 Holes Broad opening in sheet
7 Dents Depression in sheet without rupture
8 Cracks Narrow break in sheet
80
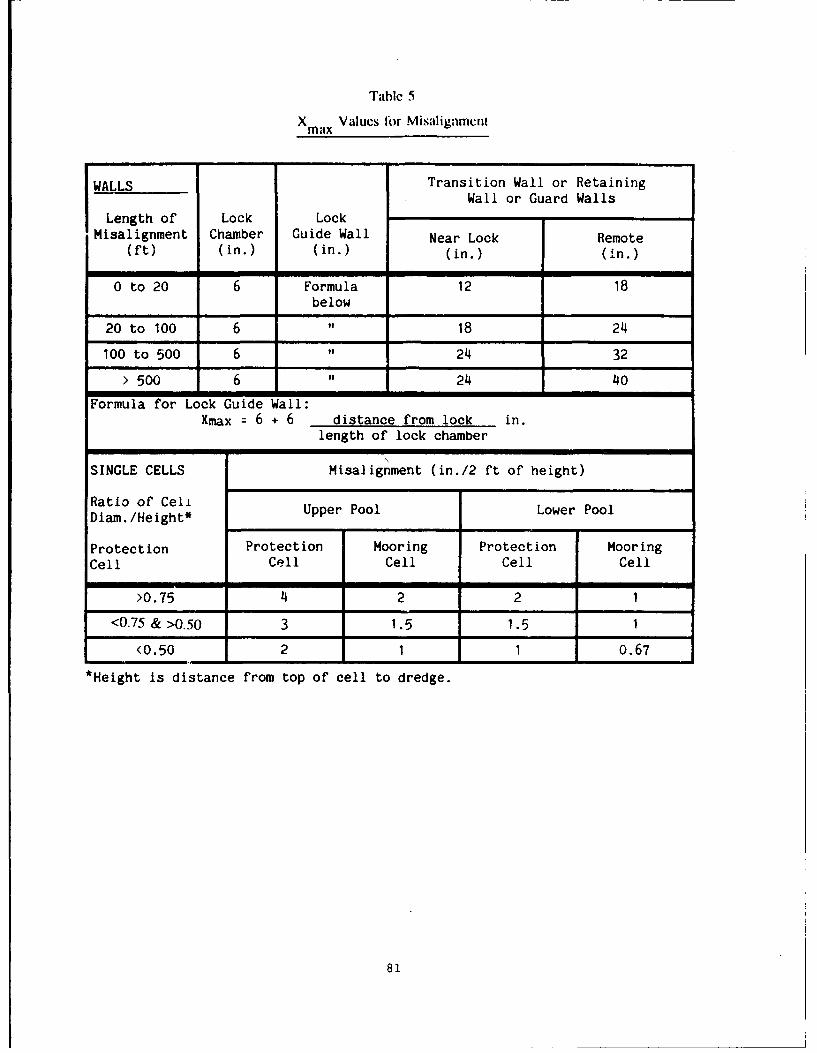
Table 5
X Values bor Misalignmentmax
WALLS Transition Wall or RetainingWall or Guard Walls
Length of Lock LockMisalignment Chamber Guide Wall Near Lock Remote
(ft) (in.) (in.) (in.) (in.)
0 to 20 6 Formula 12 18
below
20 to 100 6 " 18 24
100 to 500 6 " 24 32
> 500 6 24 40
Formula for Lock Guide Wall:Xmax = 6 + 6 distance from lock in.
length of lock chamber
SINGLE CELLS Misalignment (in./2 ft of height)
Ratio of CeliDiam./Height* Upper Pool Lower Pool
Protection Protection Mooring Protection MooringCell Cell Cell Cell Cell
>0.75 4 2 2 1
<0.75 & >0.50 3 1.5 1.5 1
<0.50 2 1 1 0.67
*Height is distance from top of cell to dredge.
81

Table 6
Levels of Corrosion
Level Description
0 New condition
1 Minor surface scale or widely scattered small pits
2 Considerable surface scale or moderate pitting
3 Severe pitting in dense pattern, thickness reduction in localareas
4 Obvious uniform thickness reduction (Xmax value)
5 Holes due to thickness reduction and general thickness
reduction
Table 7
Maximum Limits for Settlement
WALLS (anchored, cantilevered, and cellular)
Length of At Lock Near Lock RemoteSettlement & Chamber (in.) (>1000 ft)Surface Cond. (in.) (in.)
Supporting a 4 6 6structure
<20 ft & hard 4 12 18surfaced
>20 ft & hard 4 18 24surfaced
<20 ft & no 4 24 36surfacing
>20 ft & no 4 36 48
surfacing
BACKFILL WITHIN SINGLE CELLS
Rule 1: For uniform settlement (from top of structure or design level)
Xmax = 1/2 in. allowable increment per 1 ft of cell height
Rule 2: For differential settlement (slopes across top surface or the
cap if tilted from level)
Xmax 3 in. slope per 10 ft diameter
82

Table 8
Maximum Volume Limits for Cavities
Above Grade Surfacing Walls Cells
Condition (ft3) (ft3)
No surfacing 27 16
Surfacing 8 8
Supported structure 3.5 3.5
Table 9
Unadjusted Weighting Factors for Distresses
Distress Code Distress wi Wi (%)
1 Misalignment 8 24
2 Corrosion 5 15
3 Settlement 4 12
4 Cavities 4 12
5 Interlock separation 4 12
6 Holes 3 8
7 Dents 2 6
Cracks 4 11
34 100
83

APPENDIX A: BASIC DATA
1. The following information describes the steel sheet pile profiles
that are supported by the safety analysis program. The user can add steel
sheet pile profiles to the program by editing the file section.des in the
directory SSPMGT. The user must include the profile designation, section
modulus (per foot of wall), and interlock tensile strength. For example, PZ38
is included in the file like this:
PZ38 46.8 12000.
If the inspection personnel are unable to include the section designation on
the inspection sheet (pages 3A, 3B, or 3C), then they select the section
designation from the following data that most correctly match the dimensions
recorded on the inspection sheet.
Al

Basic Data
Table 2 American Engineering UnitsSlandard Sheet PilingA General Oer*lptlo
WEIGHT SECTION MODULUSPER PERLINEAR SQ FT AREA DRIVING PER FT
FT OF WALL A WIDTH WALL PER PILE
DESIGNATION PROFILE LB LB INCH' INCH INCH' INCH'
2t 1 ,- 57.0 38.0 16.8 18 4. 70.2
PZ32 oz S6< • 56.0 32.0 16.5 21" 38.3 67.0
PZ27 uJ-. - 40.5 27.0 11.9 18 30.2 45.3
POA27 8,, 7 ..... 36.0 27.0 10.6 16 10.7 14.3
PMA22 . - 36.0 22.0 10.6 19,'. 4 8.8
PSA28 , ! , 8 37.3 28.0 11.0 16 2.S 3.3
PSA23 , 30.7 23.0 9.0 16 2.4 3.2
PSX32 ,-- -. 44.0 32.0 13.0 16Y, 2.4 3.3
PS28 - -' 35.0 28.0 10.3 15 1.9 2.4
A2

Det~ami and Properlies
PZ32 .
14- .1 S L &MIS
.91
A3

Details and Properties
P0A27
PMA22
PSA23

Details and Properties
A5

APPENDIX B: USERS' GUIDE
Overview
1. An overview of the inspection and rating process and the maintenance
and repair analysis is presented in Chapter 1. The software that performs
many of the operations in the analysis is entitled SSP (Steel Sheet Pile).
Once the program has been installed on a personal computer, it is menu-driven.
All operations including file management, operation selection, and summary
report writing are controlled by menu selection. This appendix will show the
user how to use most menus and what to expect from certain selections. Because
of the many combinations and permutations of paths through the menus, not all
possi-bilities can be illustrated. Figure Bl illustrates the three primary
menus and the general procedure for the use of the program. The steps that
are listed in Figure Bl correspond with those in Figure 1. Each of the steps
is described in more detail in the succeeding section.
Notation Conventions
2. The following notational conventions are used throughout this guide:
a. BOLD CAPITAL LETTERS - File names, directory names, and DOScommands are printed in bold capital letters.
b. Bold face letters - Plain, bold face letters are used to emphasizeuser selection options.
.. Underline - Underlining is used to identify menu names and windownames.
Software will be available from U.S. Army Engineer Waterways Experiment
Station's Engineering Computer Program Library (ECPL). Address requests to:
Commander and Director, U.S. Army Engineer Waterways Experiment Station, ATTN:
CEWES-IM-DS, 3909 Halls Ferry Road, Vicksburg, MS 39180-6199 or call (601)
634-2581.
Installation of SSP
Hardware Requirements
3. The following computer hardware is required as a minimum:
a. An IBM-PC compatible personal computer.
b. At least 640 kilobytes (Kb) of memory (RAM).
c. A hard disk.
B1

The amount of disk space that should be reserved on the hard disk depends on
the number of projects that will be recorded on the personal computer system.
The executable program requires approximately 700 Kb of disk space. Each
project structure (e.g., a steel sheet pile upper guide wall or a single
protection cell) will require 10 Kb of disk space. A typical civilian project
location may have two or three walls and also three or four single cells
associated with the project. A project could be five to ten structures, each
requiring 10 Kb of disk space or 50 to 100 Kb per project. Therefore, ten
projects could require 500 to 1000 Kb of disk space. Initially, it is
recommended that a minimum of one megabyte (Mb) be reserved, which will
accommodate the program and three to six projects of approximately 30 project
structures.
Customizing MS-DOS for SSP
4. To run SSP on the system, some of the MS-DOS operating system defaults
must be extended. In general, this modification will improve performance of
the other programs on the system as well. The changes to the operating system
defaults are made by modifying the CONFIG.SYS file in the root directory of
the system. Include the following statements to the CONFIG.SYS file:
FILES-20
BUFFERS=20
DEVICE-path\ANSI.SYS
BREAK=ON
where path - file path to ANSI.SYS. If the CONFIG.SYS is not already on the
root directory of the system, one can be created using any text editor that
produces a standard DOS text file (ASCII file). For example, EDLINE, which
comes with the DOS, can be used to create the file. Be sure to place the
CONFIG.SYS in the root directory of the C:drive.
Installina SSP on the Comuter System
5. The program SSP is distributed on three 5 1/4 in. 360K floppy disks.
The installation utility program will automatically install the SSP program
and support files on the C:drive of the computer. The utility program
INSTALL.BAT starts on Disk A of the diskette set and continues on each of the
Disks B and C. INSTALL.BAT executes the following DOS commands to create a
directory called SSPMGT on the root directory and several additional
subdirectories to install SSP:
See that the computer is on and the DOS prompt is displayed
Place the SSP program distribution Disk A in Drive A:
Type A:INSTALL.BAT and pres3 ENTER. The following commands are executed
automatically
Command FunctionC: go to C: driveND S8HNT create directory called SSPMGTCD SSPNGT change directory to SSPMGT
B2

HD DATA C L t.i t 'Ii ct 'l y cai I lIt DATAiM TEDM create directory called TEMPMD SAMPLE create directory called SAMPLECD SAMPLE change directory to SAMPLEMD WALL create directory called WALLMD CELL create directory called CELLCD C:\SSPMGT change directory to SSPMGTCOPY A:SSP.EXZ copy SSP.EXE to SSPMGT directory
Insert Disk B in Drive A: and type A:INSTALL and press ENTER.
Program and sample data files are copied to SSPMGT and SAMPLE.
Insert Disk C in Drive A: and type A:INSTALL and press ENTER
Program and data files are copied to SSPMGT and DATA.
If you wish to install SSP on a drive other than C:, or use another name for
the SSP directory, you must either modify INSTALL.BAT or install SSP manually.
In this guide, we will assume that you have used the unmodified INSTALL.AT to
install SSP and use SSPMGT to refer to the SSP directory.
Organization of Project Files
6. The SSP program and all related project data files are normally
installed one level down from the root directory on the C:drive of the
computer system in a directory called SSPMGT. All executable program files
and program support files are at this directory level.7. The SSP program has been designed to operate at the project level.
The organization of projects and SSP structure inspection data files utilize
the DOS hierarchy structure of subdirectories. Project files are identified
and organized into separate subdirectories in the directory SSPMGT. Forexample, the project Lagrange Lock & Dam located at Beardstown, Illinois on
the Illinois River Waterway system has several steel sheet pile structures,
one being the upper guide wall. The project inspection data files for theLagrange Lock upper guide wall would be organized in the following manner:
Root directory
SSPMGT program directory
-- LAGRANGE LOCK project subdirectory
UGWALL SSP structure subdirectory
files structure data files
another SSP structureanother project
This organization of project inspection data files allows the user multiple
SSP structures under a particular project name. This organization of projectinspection data clearly maintains the integrity and transportability of
individual project files. The user can readily copy the inspection data from
the hard disk system to archive data files or to transport to another system.
8. There are other subdirectories under SSPMGT that are not project files
but are required to support the maintenance and repair analysis module of SSP.
B3

They are called DATA and TEMP and support all the project files, not a spec-
ific project file. If a user transports individual inspection data files to
another system, the maintenance and repair modeling solutions can only be
transorted by paper copy and then reentered on the new system. However, if a
user is making a system change and all the projects are being transported,
routine DOS file handling techniques will transport the data as a directory
block.
9. It is possible for the user to organize the data at a higher system
level, such as a waterway system. This can be done by renaming the program
directory level to a waterway system acronym, for example, ILLRVR for Illinois
River waterway. The program does not readily support ,this system level of
project organization, but the user can accomplish it by installing the SSP
program in each waterway system directory. Each time the SSP program is
installed, it does require approximately 700 Kb of disk space.
Project Identification
10. Utilizing the DOS subdirectory hierarchy places a restriction on the
freedom of naming project structures. Each project name or structure name is
limited to eight characters and also to DOS conventions. If you are
unfamiliar with DOS conventions and encounter difficulty, refer to the DOS
system manual for guidance.
11. In the example project used in the manual, the project name used was
LAGRANGZ and the structure name was UGWALL, short for upper guidewall.
Another example might be a structure name such as UPCELL3 for an upper pool
protection cell number 3.
General Procedure Starting and Using SSP
12. Figure B1 illustrates the three primary menus that:
A. control the flow of the program.
b. input data from the inspection form.
c. calculate the condition index.
d. evaluate maintenance and repair options.
Figure B2 follows Figure B1 and is a flow diagram through the three primary
menus as well as several additional submenus.
Getting Started
13. At the system prompt, change tht irectory to SSPMGT:
Type 88P and press ENTER
The screen will display the Main Menu (see Figure B3).
B4

Primary Menu Structure of SSP and Procedure Guide
1. Select projecte.g., Lagrange upper guide wall
2. Select operation to performe.g., 2-Analyze steel sheet pile
9 41ts a nou' to qVh onSlymuiw t pile 3. Input data from inspection form
3 -fMI!S IOCk NOtW 5464 -it "Ww (yWou t W ) Use 1-Create for a new inspection
or 2-Update if updating a previousinspection record. As required,the user edits the input forerrors.
4. Compute condition indexes4-Compute functional conditionindex 5-Compute structuralcondition index
5. Review condition index summary6-Condition index sumary reportThe user must diagnose theproblems that have been identified
........... . and understand why the condition
!i-indexes are as reported.
6. Review maintenance & repair (M&R)options 7-Perform maintenance &repair analysisa. Develop M&R solutions
1. Analyze current problems,or
2. Review previously selectedalt.
b. Analyze and model M&RTlvn lcamat solutions 3-Consequence
3 - CWAe d dmoelie of Wr S01Uos modeling of M&R solutions4 -p mlt c. Review results of analysis ands - ite to um Sr lasaigi mm .modeling to recommend
maintenance or repairmanagement
Figure BI. Primary menus for SSP and procedure guide
B5

Iis
a NI
.1 t
1b,,:j.4
B60
.... . .... .... ... . .. .... .. ...

JWSelect a project to uork On2 - Analqze steel sheet pile.3 - Analype 1oclk miter gate4 - Exit pro~ran (return to DOS)
Figure B3. Main Menu.
14. The user selects 1-Select a project to work on and proceeds to the
next selection menu, Figure B4. Figure B4 illustrates the file maintenance
menu that keeps the project data structure. Three file processing choices
manage the project list contained in the 'file PRO.JECTS.DAT. The file
PROJECTS.DAT must be present in the directory SSPMGT.
W Select a project to work On
3 - EN- Select an existing Project frGm the list4 - 2 -Create a eu PrJct tO kOcm
3 - Delete a project from this disk4 - Return to the "aun OMen
Figure B4. File maintenance menu
B7
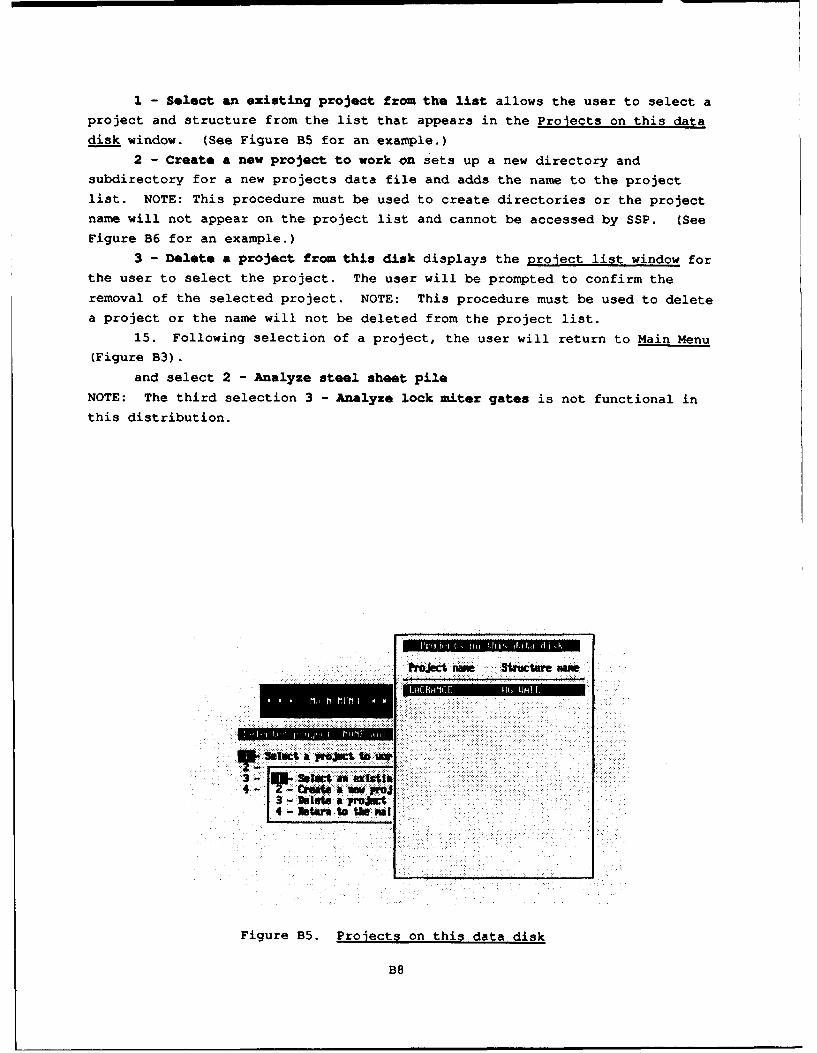
1 - Select an existing project from the list allows the user to select aproject and structure from the list that appears in the Projects on this data
disk window. (See Figure B5 for an example.)
2 - Create a new project to work on sets up a new directory and
subdirectory for a new projects data file and adds the name to the project
list. NOTE: This procedure must be used to create directories or the project
name will not appear on the project list and cannot be accessed by SSP. (See
Figure B6 for an example.)
3 - Delete a project from this disk displays the project list window forthe user to select the project. The user will be prompted to confirm the
removal of the selected project. NOTE: This procedure must be used to delete
a project or the name will not be deleted from the project list.
15. Following selection of a project, the user will return to Main Menu
(Figure B3).
and select 2 - Analyze steel sheet pile
NOTE: The third selection 3 - Analyze lock miter gates is not functional in
this distribution.
&,, a wiiit UM
3 - Palau a ]MJut4 - letan to the nsi
Figure B5. Projects on this data disk
B8

E -Slei.2 - - lea euter naw for neu project.3 - I 1- (Mxmof 8 characterso wo spaces.)4 I- WE. Project n : lagrange
3- Structure mawe u: ug-all14- Project amn 0432IIN
nStructu-ae L:JL
Figure B6. Create new project files
16. The Steel Sheet Pile Analysis (Figure B7) menu provides the
functions to input, store, and print data; to compute condition indexes; and
to go to the maintenance and repair menu.
1 - Create new structure inspection files is the data input function
for the user to transfer inspection data into the computer.
2 - Update current structure inspection files is the data editing
function to change or add to inspection data.
3 - Print current structure inspection files is the print function to
produce documentation and reports, including condition indexes, if they have
been calcuted.
4 - Compute functional condition index performs calculations.
5 - Compute structural condition index performs calculations.
6 - Condition index summary report is a screen display of basic project
identification and the computed condition index.
7 - Perform maintenance and repair analysis is a module to assist in
the development of maintenance and repair solutions.
8 - Return to the main menu returns to the previous menu.
B9

Figure B7. Steel Sheet Pile Analysis menu
Inspection Sheet Input
17. Selecting 1 - Create new structure inspection files is the data
input function that creates data files under the selected SSP structure
subdirectory. The subdirectory is the storage space for the inspection data.
18. Three rules apply to the input of data and must be adhered to.
Rule 1: The user must create each page of data with this selection.
The user may stop after page 3 to edit page 1, but create must
be used to start entering data at page 4.
Rule 2: Pages 1, 3, and 6 must exist before the program will allow the
user to calculate the subjective condition index. Page 6 has
to be created even when there are no distresses noted on the
distress profile form, so that the program can calculate a
condition index.
Rule 3: Pages 1, 3, 4, and 5 must exist before the program can
calculate the safety condition index. Page 4 has to be created
even when there is no load, in which case enter a zero (0) in
the first record. Page 5 has to be created and should have at
least one station location and depth recorded.
19. Selecting 2 - Update current structure inspection files is the data
editing function to change or add to recorded inspection data. A submenu for
Update is very similar to Figure B8.
20. The following section has specific details about entering and
editing data to the SSP structure data files.
B10

Start at initial ae2 - Start at a selected page3 - letars to the 35? reya
Pae Coteut
I - General lformation2 - General Infarmatlon3 - Ma l or Cell Crss-Section Data4 - Loading Table5 - Dredge Depthm Praftle6 - Distress Profile Form
Figure B8. Create SSP data files
Data Entry
21. The SSP program is fully menu-driven and guides the user through
the pages of forms in a straightforward manner. SSP does perform an error
check on certain data fields that must have restricted input of a particular
character or nurmber. The error checks are:
a. Only allowable characters are accepted; illegal characters arerejected with a "beep."
b. A valid range check is performed on some numeric data at thecompletion of the entry. If the number entered is out ofrange, SSP will "beep" and prompt you to enter the data again.Valid data must be entered in order to move on to th next dataitem.
The majority of the data entries are not restricted.
Editing data
22. After the data is entered, the user will find it necessary to editthe data. Some of the typical word processor routines work well but a review
of those working in this program is helpful.
a. Changing data entry mode--SSP supports two different modes fordata entry: the "Insert" and "Overwrite" modes. In the"Insert" mode, the characters that you type are inserted at thecurrent cursor location, whereas, in the "Overwrite" mode, thecharacter at the cursor is replaced with your entry. PressINSERT key to toggle between the "Insert" and "Overwrite"modes. The cursor symbol for the "Insert" mode is a smallflashing square, whereas the cursor for "Overwrite" mode is aflashing underscore character. The default mode is the"Overwrite" mode.
b. Cursor Control--Several commands are available for movingwithin the data entry line for editing:
BlI

(1) Use the RIGHT or LEMT arrow keys to move right or left byone
(2) Use the CTRL-RIGRT ARROW or CTRL-LZrT AROW keys to Movea word right or left
(3) Press ROME key to go to the beginning of the line(4) Press END key to go to the end of the line
c. Delete--Press DEL key to delete a character at the cursorposition and BACKSPACE key to delete a character to the leftof the cursor position.
NOTE: The data on Pag,'? 6--Distress Profile Form is particularlysensitive to the techniques used in editing. To delete a distressline of data, press HOME3, enter "Z" in the first character space,and press ENTER.
23. Selecting 3 - Print current structure inspection f ies will display
the submenu in Figure B9.
Start at Initial page ami print all fullautm pagesPrr tselactetl pae onmly
3 - Start at a selsCWe mage and print all fallovug pages4 - Uturu tO the SP thWA
.2 - tner4l Walifiai3 - Val A ar. al ass-sct Ion Data
6t-01 :Ptsnvt Ile form
Figure B9. Print SSP data files
B1 2

Condition Index Calculation
24. Selecting 4 - Compute functional condition index performs the
calculation of observed distress measurements versus the "expert rules"
embedded in SSP.
25. The functional condition index window, Figure B10, lists the
observed distresses, their distress coefficient, and the calculated subjective
condition index. These data are also summarized in the condition index
summary report. The number of occurrences is later read into the maintenance
and repair module Problem List, Figure B15. Please refer to PART V for
details about the functional condition index.
26. Selecting 5 - Compute structural condition index performs the
calculation of the minimum factors of safety. The computed factors of safety
and the station location of the most critical sections are displayed in the
Safety Factors window displayed in Figure Bll. Refer to Part IV for details
about the structural condition index. Refer to Appendix A if the program is
unable to calculate the structural condition index because the sheet pile
shape is not supported.
~... ...... ..... ......
Figure 10. Calculation of functional condtion index
B13
Figure Bll. Safety Factors
27. Selecting 6--Condition index au-ary report will provide the user
with a screen display of basic project identification and a summary of the
condition indexes. This selection is a quick way to see more data about the
project without performing three separate operations. The summary report is
reproduced in its entirety as print choice, Page 7--Results Summary.
28. Selection 7--Perform maintenance and repair analysis is discussed
in detail in the next section.
29. Selection 8--Return to the main menu returns the user to the
beginning of the SSP program to end the session or select another project.
Maintenance and Repair Analysis
30. Selection of 7--Perform Maintenance and Repair Analysis, at the
Steel Sheet Pile Analysis menu (Figure B7) allows the user to define multiple
scenarios for maintenance and repair of problems or deficiencies observed in
the inspection or identified by the condition index evaluation. Each of
these scenarios, or Maintenance & Repair (M&R) solutions, enables the user to
fix, correct, or replace problems or deficiencies by selecting alternatives
and building M&R solutions. The solutions may be little fixes, like replace a
sheet pile, or big fixes, like replace a sheet pile wall section. The user
can then model each of the M&R solutions to evaluate the improvement in
condition index as a result of the fix. The user can also perform life cycle
cost analysis (LCCA) to evaluate relative costs of each scenario or M&R
solution.
B14

31. Figure B12 illustrates the menu to begin Maintenance and Repair
(M&R) analysis. The selected project is displayed for user information. Five
menu choices are avaiLable for user control of the procedure.
1 - Analyze Current Problems is the selection to create or add new M&R
solutions to the project files,
2 - Review Previously Selected Alternatives is the selection to review
the list of previously defined solutions.
NOTE: A maximum of five M&R solutions can be active on a file
for any one project structure. The user may edit existing M&R
solutions to redefine another M&R solution or the user may
delete alternatives from an existing M&R solution and start
fresh.
3 - Consequence Modeling of the defined M&R Solutions. This allows the
user to analyze the impact of each M&R solution and is discussed in
detail later in the manual.
4 - Update Problem/Alternatives Data Base allows the user to edit or
add to the initial M&R alternatives database.
NOTE: This particular function must be used carefully. The
problem list is predefined for a structure type. Only the M&R
alternatives should be added to or revised by the user. This
process will be described in more detail later in the manual.
5 - Return to the SSP Menu backs the user up one level to the Steel
Sheet Pile Analysis menu.
amut wSam
se.iU liouIsly select d alterwtl s3 - Caiesce noaelins of WI solutio s4 - Update prob~ait datab ..s.S - Worn to the SSP analysis R
Figure B12. Maintenance & Repair analysis menu
Bi5

M&R Solutions
32. Selecting 1--Analyze Curzent Problems will display a blank form for
the user to begin the development of a M&R solution. The first procedure is
to select several analysis parameters ttat are specific to this M&R solution.
The user is prompted to input or edit the parameters.
33. The parameters are
- Analysis Date: Date of the analysis, for future reference.
- Beginning Year: First year for the analysis period; it can be
the current year or a future year. This date
is used as the initial year in the life cycle
cost analysis.
- Analysis Period: Length of the analysis period, for example, 1
year, 5 years, or 20 years
After the analysis parameters are correct, the user selects (yes) and automat-
ically goes to the next selection level, where the Problem List window
appears.
M&R Solution Sheet
34. At this point, a brief explanation of the background form is in
order.
Figure B14 shows the blank sheet that is the basic building block for each M&R
solution. The normal operation will not display this screen with all blank
rows. Normal operation will have a user selection window displayed, such as
Analysis Parameters (Figure B13) or Problem List (Figure B15) or have selected
alternatives displayed for user action. Features of the sheet are
a. The title line informs the user whether the sheet is in a modeto Analyze Current Problems (for creating a new solution), orin a mode to Review Current Problems (edit an existingsolution).
b. Columns to input the year, description, expected life, andcost($) of the selected alternative. A more detaileddescription of the input in each column will be given in alater section.
c. Active user option keys are displayed at the bottom of thescreen and described in the following paragraphs.
B16

Year Descr iption Exp Life cost (S)
3.Aatgsls ate: 9.413'190..I* DD
1. eluons Wuar: 18S. Analysi~s Period. 19 Vears
7.8.
19.11.12.13.14.
1*. PgIp PgDn Ctr-PgWP Ctr-PgDn <esc> 3)eiete EVdit QOuit
Figure B13. Analysis Parameters
Year Description Exp Life Cost (S)
Z.3.
7.
it.12..3
11.12.
B1 7

35. If all selections in the row are highlighted, it means all the
selection keys are active. If only one is highlighted, for example, Edit, the
form is in edit mode at the location of the cursor in the form. The default
location of the cursor is in the first column of row one. The cursor can be
moved to other locations in the form to execute option keys. The cursor
movement keys act as follows:
a. Arrow keys move the cursor from row to row or field to field
b. PgUp or PgDn moves the cursor between window pages
c. Ctr-PgUp and Ctr-PgDn moves the cursor only if there is more thanone page of alternatives. Ctr-PgUp will return the cursor to thedefault location at row one. Ctr-PgDn will move the cursor to thetop row of the last full screen page display.
36. The remaining option key actions depends on the location of the
cursor within the M&R solution sheet.
a. First case: When the cursor is in a row that is not blank, then:- <esc> or Edit enters edit mode at the cursor location- Add inserts a blank row at the cursor location and displays theProblem List window (Figure B15) for user selection of analternative
- Quit ends the selection process and exits to save the M&Rsolution
b. Second case: When the cursor is in a row that is blank (e.g., therow below a list of alternatives or a blank form), then:- <esc>, Add, or Edit displays the Problem List wirdow (FigureBI5) for user selection of an alternative- Quit ends the selection process and exits to save the M&Rsolution
Continue to the next selection level, where the Problem List window appears.
Problem List
37. A typical problem list, Figure B15, has been developed for a project
structure, in this case, steel sheet pile. The typical problem list for steel
sheet pile includes 15 problem definitions that are displayed each time this
screen appears. The list of problems that appears may be more than one page
long, as is the case with steel sheet pile. The user can view or select from
the problems on the second page with cursor movement. The problem types that
are present are identified in the column No. Occur(rences). The project
inspection data file is used to generate the list. In the example window
(Figure B15) there are two occurrences of misalignment, one of corrosion, and
none, or zero for many of the other problems. The number of occurrences noted
will correspond directly to the number of entries recorded for each problem on
the Distress Profile form of the inspection file or to the calculated low
factor of safety (low FS) in the case of a structural problem.
BI8

I Exp Life Cost (S)
3. SETTLNT 4
4. CAUITV FORMAION 95. INITERLOCK SEPARATION6. HOLES U7. DETS 10. CRACKS IN SHEET 39. LOW FS VALL- SOIL UW. LOU FS LL- PILE O
-M-. 1 a)eu notes
S- Ptp PgDn Ctr-PqUp Ctr-P9Dn <esc) D D)elete EMt Q)uit
Figure B15. Problem List window.
38. At the bottom of the Problem List window are active user keys
including cursor movement keys and user option keys. The cursor movement keys
act as follows:
a. Arrow(s) up and down move the cursor from line to line on thedisplayed window page
b. PgUp and PgDn move the cursor between window pages
The user option keys act as follows:
a. <ESC> returns to the background M&R solution sheet
b. Select calls for the M&R Alternative List window to be displayed.The contents of this list are dependent on the problem list (see thenext section). The user selects the problem by moving the cursor tothe specific problem line and ENTER. This is the default user optionkey.
c. View notes is an option to see more information about a problem.This option is activated by typing V to select view notes and thenENTER. A window will display notes pertaining to the selectedproblem. (See Figure B16.)
Developinq an M&R Solution
39. The user develops an M&R solution by selecting a problem from the
Problem List and a corresponding maintenance or repair procedure from the M&R
Alternative List (Figure B17). The user can refer to the inspection form to
identify specific details about the problem location, severity, and so on,
then make decisions about which problems to solve in a specific M&R solution.
B19

eip Life Cost (S)
select: no occur
31 5UITLIR 4
lii U. IS CNOOUD
* .*:* it m~utt
Figure B16. Notes window
Expli LifeCoe
. lMT1. XIfACU WN IMLL 723 No4. ColTf MOM" IfmI0i jmgfl#S. INIURLdc SEPAIIATICH 3. WBLACU AN AMEHU 01tM 4U0 no6. NL7. DM1730. £UAO INSHRWT9, LOWl FS WALL- SOIL
19. LOUl FS WALL- PILE!
U PSWi Pgu CU-POlP Ctt-Pgbn (ego) 1 3elete EVdit qVult
Figure B17. M&R Alternative List window
B2 0

The user can define up to five different M&R solutions for analyzing in conse-
quence modeling. Each of the M&R solutions can be edited, added to, and the
like before consequence modeling or after modeling to study a different
approach.
M&R Alternative List
40. The M&R Alternative List, which is the right-hand window in Figure
B17, is a list read into the M&R module from the problems and alternatives
data file. The data list is typical for all projects of a like structure
type, in this case steel sheet pile. The list of M&R alternatives that
appears may be one alternative or more than one page of alternatives. The
description of each M&R alternative is brief and is intended to be edited and
made specific to a M&R solution. The right-hand column is a estimate of the
expected service life of the alternative. Figure B1B displays an example of
an alternative selected to fix a problem like misalignment, a hole, a dent, or
a crack.
41. The user selects an alternative on the list and it is added to the
M&R solution form. The user is prompted to enter the Year the alternative
would start, edit the Description of the alternative, edit the Exp(ected)
Life, and finally enter an estimate of the current Cost to implement the
alternative. Once the user enters the cost, the program automatically returns
to the Problem List window (Figure B15) to allow the user to select another
alternative to add to the M&R solution. This continues until the user is
finished selecting alternatives. To stop the selection process, the user
selects <esc> at the Problem List (Figure B15). This returns the user to the
M&R solution sheet and the user selects Quit to exit and save the defined M&R
solution.
YeaDesg wilOu t Life Cot ($)
1. 1999 REPLACE A SECTIGK of hALL AT STAr 4. 729 Io2.3.4.5.5.7.9.',ii.11.12.13,14.
is - pSUp plPa ctr-ytp Ctr-Pln <esc> N Dlev E)dIt Q)ult
Figure B18. Example of selected M&R alternative
B21

42. Input of an estimate of the current cost is optional. This infor-
mation is required to perform a life cycle cost analysis in consequence model-
ing, but it is not required to evaluate changes in the condition index. The
user can bypass the cost entry to perform condition index evaluation in conse-
quence modeling and later return and edit the cost estimate into the M&R
solution.
Saving an M&R Solution
43. When Quit is selected, the user is prompted to select a solution
number and enter a name to describe the M&R solution. Figure B19 illustrates
the selection of a solution number 1. The description MINOR REPAIR AND
REPAINT WHOLE WALL has been affixed to the M&R solution with two alternatives
(displayed behind window). After saving the M&R solution, the user is
prompted Add/Edit another version? (y). The user can enter y to continue and
enter another M&R solution, or enter n and return to the Maintenance & Repair
Analysis menu. If y is selected, the M&R solution form will be displayed and
new analysis parameters must be defined for the new M&R solution.
44. The user does have another choice when beginning to save an M&R
solution. Selecting <esc> (instead of a number) (see Figure B19) will let the
user abandon an M&R solution that has just been created or edited. The user
is prompted to confirm the intent to discard the data or to back up and save
the M&R solution.
Vr Descriptiom Ixp Life Cost($)
1. 19 BERM A SCTIOfl OF IALL AT STA. 455 729 No 11U1.992 1 IDST iAND IE IIIOLE WALL lii INo 5.893,4. MRS,6. Select: I7. 19. __"____ go__ on__N
13. IIIRm in mMN WHOLE WL.....
. Pp PIj D Ctr-PgUp Ctr-Pgn <esc> A)dd D)eelate Q)ul.
Figure B19. Saving an M&R solution
B22

45. Returning to the Maintenance and Repair Analysis menu, selecting
2--Review Previously Selected Alternatives, will display a window (Figure B20)
allowing the user to select from the list of M&R solutions previously defined
and saved to the project structure file. Once the user selects an M&R
solution, the completed M&R solution form and defined parameters will be
displayed. The user can then edit or add to the M&R solution by changing
analysis parameters, selecting additional alternatives, or deleting previously
selected alternatives from the list.
Consequence Modeling of M&R Solutions
46. After at least one M&R solution has been defined and saved,
selecting 3--Consequence Modeling of M&R solutions initiates a "What if?"
scenario in the M&R module. This modeling permits the user to correct the
problems or deficiencies observed in the inspection or identified by the
condition index evaluation. The user is directed to model each of the
previously defined M&R solutions to analyze the consequences of the
maintenance and repair scenario in two ways:
a. What will be the change in condition index of the structure ifthe fixes are made? The functional condition index and thestructural condition index are each evaluated separately andthen combined.
b. What will be the first cost and the annual cost of this M&Rsolution? Life cycle cost analysis is optional. The user mustenter costs at the M&R Alternative selection level for thiscalculation to be executed.
3eiect. 31I win H"JU me NVAIHT WU4 ML2. NIPXaZ V3 L e im TO N, rL UTr3,4.S.
Figure B20. Review list of previously selected alternatives
B23

NOTE: Consequence Modelinq does not have any effect on the original structureinspection data files or on Lho actuaL computed condition Index values. The
condition index values calculated in this model are stored in a a temporaryfile structure and are not accessed by any routines outside of consequence
modeling.
47. Selecting 3--Consequence Modeling displays all of the M&R solutions
and allows the user to make one of these choices.
1 to 5--Choose one of five M&R solutions for consequence modeling
6--Print the M&R solutions--This prints a brief schedule of thealternatives that are components of the M&R solutions. This print selection
is also used to get a final print report of the M&R solutions afte: all the
solutions have been modeled and the revised indexes and annual costs have been
posted to the data file.
7--Return to Maintenance & Repair Analysis menu
48. Figure B21 illustrates a typical display of M&R solutions. Each
solution displays the Old Combined CI (from SSP evaluation), the New Combined
CI, First Cost ($), and Annual Cost ($), if these have been previously
computed.
49. After an M&R Solution is selected, the next screen, Figure B22
displays more detail about the subjective and safety condition indexes andlists all of the alternatives attached to the M&R solution. At the bottom of
the screen is a menu to allow the user to choose condition index modeling,life cycle cost analysis (LCCA), or print reports of the selected M&R
solution.
Figure B21. Description of M&R Solutions
B24
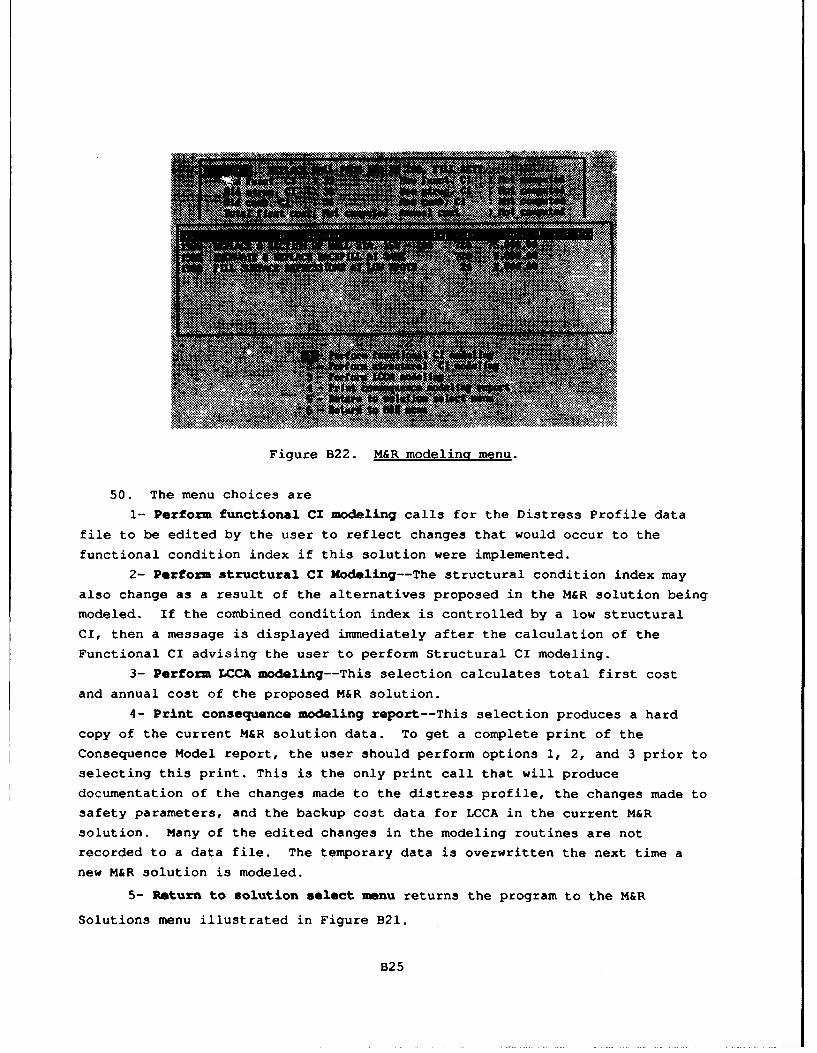
Figure B22. M&R modeling menu.
50. The menu choices are
1- Perform functional CI modeling calls for the Distress Profile data
file to be edited by the user to reflect changes that would occur to the
functional condition index if this solution were implemented.
2- Perform structural CI Modeling--The structural condition index may
also change as a result of the alternatives proposed in the M&R solution being
modeled. If the combined condition index is controlled by a low structural
CI, then a message is displayed immediately after the calculation of the
Functional CI advising the user to perform Structural CI modeling.
3- Perform LCCA modeling--This selection calculates total first cost
and annual cost of the proposed M&R solution.
4- Print consequence modeling report--This selection produces a hard
copy of the current M&R solution data. To get a complete print of the
Consequence Model report, the user should perform options 1, 2, and 3 prior to
selecting this print. This is the only print call that will produce
documentation of the changes made to the distress profile, the changes made to
safety parameters, and the backup cost data for LCCA in the current M&R
solution. Many of the edited changes in the modeling routines are not
recorded to a data file. The temporary data is overwritten the next time a
new M&R solution is modeled.
5- Return to solution select menu returns the program to the M&R
Solutions menu illustrated in Figure B21.
B25

6- Return to Maintenance & Repair Analysis menu illustrated in
Figure B12. This is the last menu and user selection point in the consequence
modeling module. Choices 1 through 4 will each return to this menu for
further selection. This selection exits from consequence modeling.
7- Return to review previous screen of solution alternatives
returns (or pages up) to the previous partial window display of M&R
alternatives.
NOTE: This choice does not display if only one window is required to display
the alternatives.
Functional Condition Index Modeling
51. Selection of 1--Perform subjective CI modeling displays Figure B23.
The M&R solution title appears at the top of the display and a list of the
selected alternatives appears below. Each of the distress records from the
Distress Profile data file are displayed in the lower left corner window for
the user to edit. The user may find it convenient to have a copy of the
original data file to facilitate this editing process. The user reviews each
distress line item and decides how each distress line should be changed or if
it should be deleted. The decision reflects whether the distress is changed
or corrected by the alternatives proposed in the M&R solution being modeled.
In the example illustrated in Figure B23, the M&R solution calls for
replacement of the wall from Sta. 150 to 200; therefore, the first distress
line for misalignment from Sta. 150 to 200 is being deleted by inserting a Z
in the first character space of the distress line. Other distresses are
modified in a similar manner. After the last distress is modified, the model
recalculates the functional condition index and displays it for the user to
review.
B26

Sfl.A WU Fllo Is TO , FILL ST1. M ,
1560 WPLACI A SBCTION OF WIL STA. IM - 2W lefer to 114 solution1509 EXtONAT I F1*3 CEILL AT SA displaged at left.19W8 FILL SIWEACR 184ii=0S AT LOll SPOTS 5dit the distress
problem when theappear loser leftto reflect chaunesuich viii occu as
Steel Sheet Pile Structure: LAGAlG - UGJMLL a result ot thissolution.
HISLIGIIINT (X=stopf Z=delete) For example. for 11aIt. NEPI.AC SOCTION
Statiom isplat. From OF VRIL- delete amiStation of laximm from Top of misalinment, dents
From To DIlsplac. Ikimal (in) Mall (ft.) etc. that occur in-I- I I- that section of aIll
> iZSS 260 193 5.
Figure B23. Edit distresses
52. Figure B24 then follows.
53. After the user follows screen instructions to continue, the program
returns to the M&R Modeling menu (Figure B22). The user makes another
modeling choice 1, 2 or 3; returns to the just completed model to change a
parameter, selects the print option, or returns to another menu.
Structural Condition Index Modeling
54. Selection of 2--Perform Structural CI will direct the program to
several succeeding windows that will prompt the user to confirm or change data
pertinent to the evaluation of the structural condition index. Figure B25
illustrates the first window. The data presented corresponds to structural
characteristics input on page 3 of the inspection form. The user can confirm
or edit the data. The second window (not shown) presents Load Table data and
the third window (not shown) presents Dredge Depth data for confirmation or
editing.
55. Following calculations, an intermediate screen similar to the
functional condition index model can be reviewed. After the user follows
screen instructions to continue, the program returns to the M&R Modeling menu
(Figure 822). The user makes another modeling choice 1, 2, or 3; returns to
the just completed model to change a parameter, selects the print option, or
returns to another menu.
B27

Life Cycle Cost Analysis (LCCA)
56. Selection of 3--Perfozm LCCA will direct the program to LCCA
Parameters window that the user can confirm or edit.
Figure B24. Modeled functional condition index
Figure B25. Structural Modeling Parameters
B28

Figure B26 illustrates the type of data the user must provide to perform LCCA.
Part VI describes the method for calculating the first cost and annual cost.
The first three parameters have been entered previously at the beginning of
the M&R solution development. They can be changed at this time. The interest
rate and inflation rate must be entered at this time. The downtime and
out-of-service cost are optional entries. A second window (Figure B27)
displays a schedule of intermediate cost data in the computation of first cost
and annual cost.
57. Following screen instructions to continue, the program returns to
the M&R Modeling menu (Figure B22). The user makes another modeling choice 1,2, or 3; returns to the just completed model to change a parameter, selects
the print option, or returns to another menu.
Problem and Alternative Database
58. The problem and alternative (PNA) database is a single large filedesigned to be a single source file for M&R alternatives selection. The
problem list in the problems and alternatives database is a standard list of
problems or safety deficiencies that have been identified and related to steel
sheet pile. The alternative list in the problems and alternatives database isa standard list of M&R alternatives that can be applied to a steel sheet pile
structure.
eajlisI late: V1319NIkellua Year: 190Ra19s0 Period: to YarsIuterest ?Ate: 9, xluflatids Nate: 5.9 x
Ont-ot-Sewuicecost. IUN...... W#ag
Figure B26. Life cycle cost parameters
B29

Figure B27. Life cycle cost data
Problem List
59. The list of problems for steel sheet pile consists of 15 items.
The number of items on the problem list, 15, and the order of the problems on
the list should not be changed by the user. The number of occurrences passed
to the Problem List (Figure B15) in maintenance & repair analysis is relative
to a fixed order of problems in steel sheet pile analysis data. The
description and order of steel sheet pile problems is as follows:
1. Misalignment
2. Corrosion
3. Settlement
4. Cavity formation
5. Interlock separation
6. Holes
7. Dents
8. Cracks in sheet
9. Low FS wall- Soil
10. Low FS wall- Pile
11. Low FS wall- Rod
12. Low FS cell- Vertical Shear
13. Low FS cell- Bursting
14. Low FS cell- Pile
15. Low FS cell- Foundation sliding
B30

60. The first eight problems correlate to the eight distresses that are
identified on the Distress Profile form in the inspection. If an occurrence
of one of the distresses is recorded on the form, then it will be listed as
one occurrence of a problem on the Problem List in Maintenance & Repair
analysis. The last seveh, problems (nine through fifteen) correlate safety
deficiencies identified in the calculation of the structural condition index.
Problems nine through eleven correlate to factors of safety for components of
wall type structures. Problems twelve through fifteen correlate to factors of
safety for components of cell type structures. If the computed factor of
safety is less than 2.0 for any component, the deficiencies are reported as a
safety problem on the Problem List in Maintenance & Repair analysis.
61. Each project problem list is unique to the particular steel sheet pile
structure. The uniqueness of the list is defined by the identified distresses
and safety deficiencies from the inspection data files for the particular
steel sheet pile structure.
Maintenance and Repair Alternatives
62. The list of M&R alternatives is the part of the problems and
alternatives database that is designed to be updated by the user. The program
is distributed with a short list of M&R Alternatives that can be used to
formulate M&R solutions. However, the real intent of the list is for the user
to add to the list of M&R Alternatives from personal experience with
successful projects or new technology and product solutions. A user can make
the problems and alternatives database a personal resource of information
about maintenance and repair alternatives.
Update Problem or Alternative Database
63. Selecting 3--Update Prob/Alt Database from the Maintenance & Repair
Analysis menu (Figure B12) calls up a program routine to allow the user to
edit or add to the initial M&R Alternatives database. The initial screen
display lists the structure types that are included in the database. For this
distribution, only steel sheet pile (SSP) is included. See Figure B28.
Selecting 1 - SSP proceeds to the next user option. Selecting Esc returns
to the Maintenance & Repair Analysis menu.
B31

LIST 1W ST1RUCfUIt TV
Choose struct tpe or Ese
Figure B28. Select structure type
64. Continuing to the next screen, Figure B29, allows the user several
options to edit structure data. They are displayed at the bottom of the
screen.
a. Change by typing C allows editing of the description of thestructure type. Do not change the structure type SSP becausethe M&R solutions are keyed to the description term SSP. Addingnew structure types will not affect SSP nor will SSP be able toaccess data in any other structure type.
b. Delete by typing D allows deleting a structure type. Do not useon SSP.
c. Edit Problems by typing P displays the list of problemsidentified with SSP (Figure B30). Do not chance the order ofthe first 15 problems. This will cause erroneous reporting ofproblem occurrences. NOTE: It is possible for the user to addundefined problems to the end of the list and tag M&RAlternatives to the problem. However, these added problems willnever report an occurrence out of the inspection data file. Theuser can use this for defining very specific problems for an SSPstructure.
d. Edit Alternatives by typing A displays the list of maintenancealternatives identified with SSP. This will be the primaryselection of the user to change, update, and improve the M&RAlternatives list.
Edit Problems
65. Selecting Edit Problems by typing P displays the following screen,
Problems List.
B32

LIST OW STIWJCIUN TYPE
OPTIOMS* (C)hange1 MDcletcs Edit (Probleeis, Edit (A)Iternatfues, Esc
Figure B29. Edit Structure Data
TYPE: 53?
2 CORROSION3 SETTLUUT4 cUJJTy FOWATIO"5 INTERLOCE SEPARATION6 HOLE7 JIM1H CMOIS in SHEET9 LOW 7S WALL- SOIL
13 LOWIFS IMLL- PILE11 LOU FSIWALL- NOD12 LOUl FS CELL- VERTICAIL SHEAR13 LOUl FS CEL- MIUNG14 LOU FS CELL- PILE1S LOW FS CELL- POUMIATION1 SLIDE
OPTIONS: (A)d, (C0hange, CDeletes (Plrinti (Ulew alteruatfuess Esc
Figure B30. Problem list
B3 3

The user option keys at the bottom of the screen do the following:
a. Add will insert a row dt the location of the cursor to create a newproblem description. The user will be prompted to enter a note tofurther describe the problem. (See Figure B31.) This is the samenote the user can view in M&R solution development when viewing anote attached to a problem.
b. Change will edit the description of the problem and also the note
attached to the problem.
c. Delete will delete a problem from the list.
d. Print will generate a printout of the problem list.
e. View alternatives will display a window, Alternatives for thisproblem. Selecting the alternative that is highlighted willdisplay a note window describing the alternative. (See FigureB32.)
f. Esc will return to the initial structure type selection.
VVPV: 3 ?
3 $ITWfTO ITr
6 HOWD-7? 1u1S* cMM9 LOU FS
19 LOWI FS$1 Low FS12 LOU IS13 LOUI TS14 U* Sis Low IS
OPTIONS: (AMPI (COhatge, MDelete, Esc
OPIIS, (A(idAN U (D)elete, M()rln, (U)Icw aiternatlues Esc 1
Figure B31. Problem notes
B34

TYPE: SSP
P1031.315 M.INTIUNS MRN THIS P303.3
2 CORROSION 26EAC A SECTIO OF ILL3 SIT3ET3.11PLACI AN ANIIOR104 OJ1TY F0O3MTI0H.5 INTILOC SIPARt IONS HOLES7 EISa cami IN go9 LOU FS WALL- SOIL
19 LOW FS IMIL- Pill11 LOw FS muL-3012. LOU FS CII- kUTICAL SHENU
13LOU IS GUI- BURTING.14 LOU FS CELL- PILEis Lou FS CULL- IJNDATION SLIDE
choose alternative or RIS
OPTIONS5: (A)dd, (C0hanses MDeletei (Prlnts Esc
Figure B32. Alternatives for this problem
TYPE'. 33?
MAINTENANC ALTEMTIME
2 REFIACE ASU ION o 1LL3 REPLAC A1 SINGLE SHEET
4 BERMA~ AN A10103 3036 EMM1IA a RE3lACE MW1FILL6 FILL A DIESSION AT SI3FCE7 ADD PROTICIVE COATING
13
14
B35
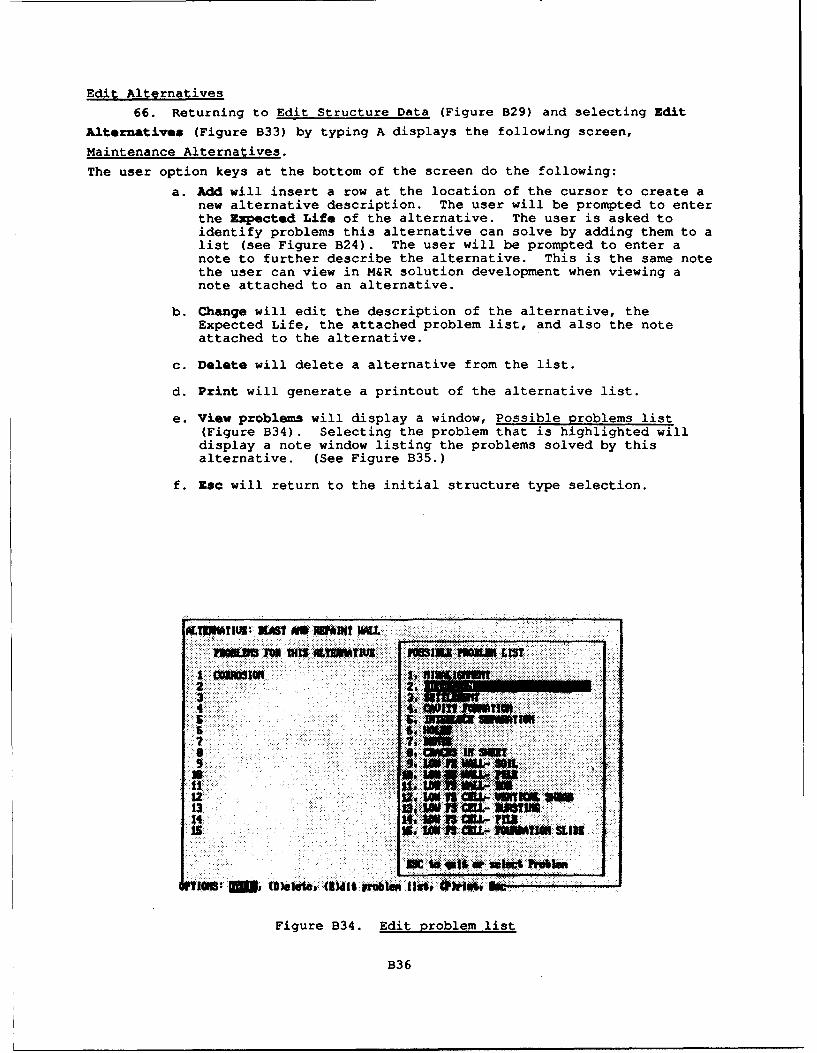
Edit Alternatives
66. Returning to Edit Structure Data (Figure B29) and selecting Edit
Alternatives (Figure B33) by typing A displays the following screen,
Maintenance Alternatives.
The user option keys at the bottom of the screen do the following:
a. Add will insert a row at the location of the cursor to create anew alternative description. The user will be prompted to enterthe Expected Life of the alternative. The user is asked toidentify problems this alternative can solve by adding them to alist (see Figure B24). The user will be prompted to enter anote to further describe the alternative. This is the same notethe user can view in M&R solution development when viewing anote attached to an alternative.
b. Change will edit the description of the alternative, theExpected Life, the attached problem list, and also the noteattached to the alternative.
c. Delete will delete a alternative from the list.
d. Print will generate a printout of the alternative list.
e. View problems will display a window, Possible problems list(Figure B34). Selecting the problem that is highlighted willdisplay a note window listing the problems solved by thisalternative. (See Figure B35.)
f. Esc will return to the initial structure type selection.
A1EMTIUI; *MT * YIT WUI
nggS fo 1IS A.1MUU *SIRI PUE8I LIST
CO01! III* ~ ~ ii+ i .:
12 VO20
14 4trf1 lTuisW: tL "5,I SUWTN
B3
i:! li~~il!:R.+ :S..,,,
F Jigue (S34. Edbiet~ problem l.
B3 6

1WTUWICE ALff3ATIUES 110113 LIST
I WEPMMc Tl MS ILL fl SET2 DENIS3 13 A SINGLE SHEE HOLES4 MI U ~A" ANHO IDIO 3iITEM SEPARATION.5 ECCAIMIE A fWflCS SAWILLU CfTY F9MT IoN6 F'ILL A REPRESSIO AT SMACE SEIILoOUT7 MAST 09MURPINT IMU. NISALIGMIT8 AN PYUTIIUB COATING
,is
1213.14
OPTIONS: (A)dds (COhaugc (DWeletes MPritnt ini.M !sc
Figure B35. Edit maintenance alternatives
B37

APPENDIX C: SAMPLE REPORTS
1. The following figures illustrate the report output available from
SSP.
2. Inspection Report (Figure Cl) - output file of data that
corresponds to the inspection sheets pages 1 through 6.
3. Summary Report (Figure C2) - summary data of the structure
condition index and detail about the functional and structural condition
indices. The sample summary report is in substance the same report included
in the User's Manual by Greimann and Stecker (1988). There is a slight
variation in functional condition index value because minor changes have been
made to interpreting the field data by the rules base.
4. Description of M&R Solutions (Figure C3) - summary output of the
defined M&R solutions and a listening of the selected alternatives for each
solution. Also lists the status of condition indices and costs for each M&R
solution.
5. Consequence Modeling Report (Figure C4) - detail output for a
specific M&R solution that includes data on life cycle cost of each
alternative, the status of condition indices, and finally the backup
parameters and temporary changes made tD data files to generate the results in
the current model.
Cl

Steel Sheet Pile Structure: LAGRANGE - UGWALL
SSP data sheet 1
Name of the civil works project(1): Lagrange Lock & Dam(2): Upper Guide Wall
Location(1): Illinois Waterway(2): Beardstown, IL.
Date of inspection : 8-5-86Inspected by : L Greimann, J Stecker
Type of steel sheet pile structure1. Lock chamber wall 4. Guard wall2. Lock guide wall 5. Single cell3. Transition or retaining wallStructure type: 2
Type of wall system (if applicable)1. Anchored(tie-back) or cantilever2. Cellular wallWall system: 1
Structure length or circumference(ft): 565
Location of structure:Facing downstream, which side of stream(1: Right, 2: Left) : 2In relation to the lock(1: Upstream, 2: Downstream, 3: No lock ) :. 1Proximity to the lock(1: Near, 2: Remote, 3: No relation to lock):1
Length of lock chamber (ft.) : 600Construction date : 1939
Drawings available for reference ? yesDrawings included with this file ? no
Present river level (datum Elevation) : 429.0Record low water level (ft) : ?Record high water level (ft) : 447.25
Figure Cl. Sample inspection report (Sheet 1 of 6)
C2

Steel Sheet Pile Structure: LAGRANGE - UGWALL
SSP data sheet 2
Past 10 year history of:
a.) Major maintenance, repairs, or other modifications.
Date Description ('X' to stop, 'Z' to delete current line)==> ? CURVED SECTION @ END EXTENSIVELY REPAIRED==> AFTER IMPACT DAMAGE
b.) Changes in backfill, building structures, roads, equipment, etc.
Date Description ('X' to stop, 'Z' to delete current line)==> NONE
c.) Previous inspection or reviews.
Date Description ('X' to stop, 'Z' to delete current line)=> NONE
Present day:
Accessories (cap, railing, fender, etc.)
StationsFrom To Description ('X' to stop, 'Z' to delete current line)
==> 0 565 TIMBER FENDERS, 3 ROWS 8x12 OAK~=> 0 565 STEEL PLATE CAP==> 0 565 CABLE HANDRAIL=> 0 565 MOORING POSTS AT 50' INTERVALS
Figure Cl. (Sheet 2 of 6)
C3

Steel Sheet Pile Structure: LAGRANGE - UGWALL
SSP data sheet 3
ANCHORED OR CANTILEVER WALL SECTION
From station : 0
To station : 565
Wall type (1 = Anchored, 2 = Cantilever): 1
Anchor system drawings attached ? NO
Soil composition:1. Sand 5. Medium Clay2. Gravel 6. Stiff Clay3. Rock 7. Unknown4. Soft Clay 8. Not applicable
Soil(A): 2Soil(B): 5Soil(C): 5
Wall Cross-Section1. Datum elevation (ft) : 4342. Pile length (ft) : 383. Top-to-dredge (ft) : 234. Top-to-soil(B) (ft) : 235. Top-to-water (ft) : 5.56. Top-to-Soil(A) (ft) : 07. Top-to-anchor rod (ft) : 78. Anchor rod diameter (in): 2.259. Anchor rod spacing (ft) : 8
10. Anchor depth (ft) : 711. Anchor rod coating : ?
Pile cross-section1. Section designation : MZ382. Driving width (in)3. Flange width (in)4. Flange thickness (in)5. Web thickness (in)6. Cross-section depth (in):7. Yield strength (psi)
Figure C1. (Sheet 3 of 6)
C4

Steel Sheet Pile Structure: LAGRANGE - UGWALL
SSP data sheet 4
LOADING TABLE
('X' to stop, 'Z' to delete the current line)
Stations Loading DistanceFrom To (psf) to Wall (ft) Description of Loading
0 350 0==> 350 450 300 6 STORAGE AREA ON CONC. PEDESTAL SLAB
Steel Sheet Pile Structure: LAGRANGE - UGWALL
SSP data sheet 5
DREDGE DEPTH ALONG STRUCTURE
('X' to stop, 'Z' to delete the current line)
Station Depth
==> 100 23==> 150 23=> 200 24=> 230 25=> 250 28
==> 300 28.5=> 350 29.5=> 400 30=> 450 29.5
==> 500 30=> 550 28.5
==> 565 28
Figure Cl. (Sheet 4 of 6)
C5

Steel Sheet Pile Structure: LAGRANGE - UG WALL
SSP data sheet 6
DISTRESS PROFILE FORM
MISALIGNMENT (X=stop, Z=delete)
Station Displac. FromStation of Maximum from Top of
From To Displac. Normal (in) Wall (ft.)§ - § -------- § ----------- § ----
==> 150 200 190 6.5 0==> 200 250 230 2.5 0
CORROSION (X=stop, Z=delete)
Station SeverityFrom To Level (1-5)
-§ -- §---------==> 0 565 2
SETTLEMENT (X=stop, Z=delete)
Station Displac. SurfaceStation of Maximum from Discrp.
From To Displac. Normal (in) Type§ - § -------- § ----------- § ----
==> 160 200 190 i0 2==> 300 350 340 8 2==> 390 400 398 14 2==> 480 505 500 6 2
CAVITY FORMATION (X=stop, Z=delete)
Cavity at Cavity Size (ft) SurfaceStation Length Width Height Type
§------ § ----- § ------ §------
INTERLOCK (X=stop, Z=delete)
Interlock Length From Topat Station (ft) of Wall (ft)
§ ----- §------
Figure Cl. (Sheet 5 of 6)
C6

HOLES (X=stop, Z=delete)
Hole at Size (ft) From TopStation Length Width of Wall (ft)
-------§------§ ----- § -----------
DENTS (Xstop, Z=delete)
Dent at Dent Size(ft/ft/in) From TopStation Length Width Depth of Wall (ft)
-------§------§ ----- § ----- § -----------~=250 3 2 .5 3
CRACKS (SHEET) (Xstop, Z=delete)
Crack at Size From TopStation Length(ft) Width(in) of Wall (ft)
-------§-----------§ ---------- §-----------==125 2 0 0~=180 2 0 0=~220 2 0 0
Figure C1. (Sheet 6 of 6)
C7

Steel Sheet Pile Structure: LAGRANGE - UGOWALL
SUMMARY REPORT
PROJECT NAME:Lagrange Lock & DamUpper Guide Wall
LOCATION:Illinois WaterwayReardstown. IL.
INSPECTION DATE: 8-5-86
INSPECTED BY: L Greimann, J Stecker
STRUCTURE TYPE: Lock Guide Wall
The overall functional condition and structural condition havebeen analyzed and compiled in the following indices:
FUNCTIONAL CONDITION INDEX = 39STRUCTURAL CONDITION INDEX = 36
COMBINED CONDITION INDEX = 36
NUMBER OF DISTRESSES AND THEIR CALCULATED DISTRESS COEFFICIENTS
2 MlsaliRnment : 36
1 Corrosion 79
4 Settlement : 10
I Dents 98
3 Cracks in Sheet : 95
FUNCTIONAL CONDITION INDEX = 39
LOCATION OF CRITICAL STRUCTURAL CALCULATION AND COMPONENT FACTORS OF SAFETY:
Safety Factors (Anchored or Cantilever Wall)
Station Soil Pile Rod Struc. CI
400 0.91 3.78 2.61 36
Figure C2. Summary report
C8

Steel Sheet I Structure: LAGRANGE - UGWALL,
DESCRIPTION OF M&R SOLUTIONS
PROJECT NAME:Layranpe Lock & DamUpper Guide Wall
IOCAT I ON:Illinois WaterwayBeardstown. IL.
M&R SoltioIIs and Alternatives:
MAR SOLUTION - MINOR REPAIR AND REPAINT WHOLE WALL
Year Description Exp Life Carrent cost($198A REPLACE A SECTION OF WALL AT STA.455 720 1,000.0019818 BLAST AND REPAINT THlE WHOLE WALL, 180 5.000.00
Old functional CT =- 39New functional Cl =Not computedOld structural CI = 36New structural CI = Not computedOld comb. CI = 36New comb. CI = Not computedTotal first Cost ()Not compuitedAnnual Cost ($) = Not computed
MAR SOLUJTION -REPLACE WALL FROM 150 TO 200. FILL SETT.
Year Description Exp Life Current cost()1988 REPLACE A SECTION OF WAILL STA. 150 - 200 720 75,000.001988 EXCAVATE A REPLACE BACKFILL, AT SAME 720 5,000.001988 FILL SURFACE DEPRESSIONS AT LOW SPOTS 24 2,000.00
Old functional CI =39
New functional C:I 90Old structural CI 361New structural CI 346old comb. CI 36New comb. CI =36Total first Cost ()= 87000Annual Cost ($) 18783
Figure C3. Description of M & R solutions
C9

Steel Sheet Pile Structure: LAGRANGE - UGWAI,L
CONSEQUENCE MODELING REPORT
PROJECT NAME:lagrange Lock & DamUpper Guide Wall
LOCATION:Illinois WaterwayReardstown, IL.
M&R SOLUTION - REPLACE WALL FROM 150 TO 200. FILL SETT.
Current First TotalYear Description cost(S) cost(S) cost(S)1988 REPLACE A SECTION OF WALL STA. 150 - 200 75000 75000 1619191988 EXCAVATE & REPLACE BACKFIJ.L AT SAME 5000 5000 107951988 FILL SURFACE DEPRESSIONS AT LOW SPOTS 2000 2000 4318
Old functional CI = 39New functional Cl = 90Old structural CT = 36New structural C1 = 36Old comb. CI = 36New comb. CI = 36Total first Cost (S} = 87000Annual Cost (W) = 18783
LCCA PARAMETERSRegining Year n 1988Period of Analysis (years) = 10Inflation Rnte() = 5.00Interest Rate(%) = 8.00Down Time (days) = 5Out Of Service Cost
($ per day) = 1,000.00
Figure C4. Consequence modeling report (Sheet 1 of 3)
Cl0
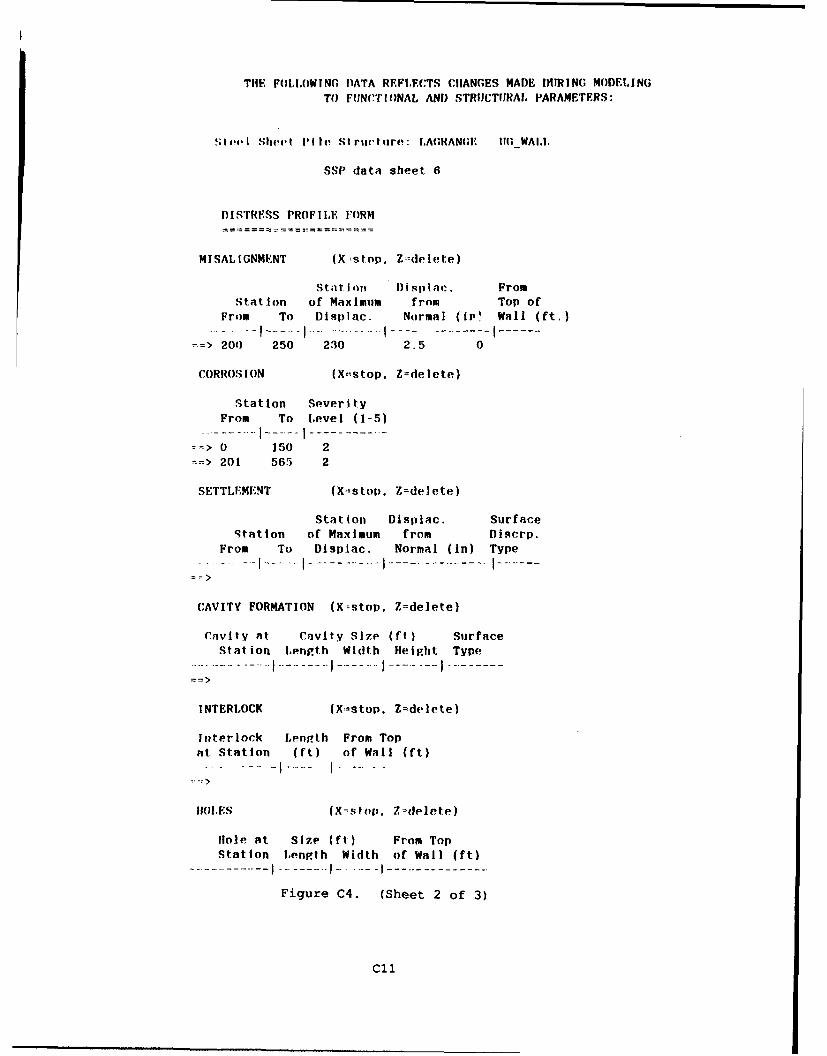
THE FOIOWING DlATA REFLECTS CHANGES MADE DURING MODELINGTO FUNCTIONAL AND STRUCTIURAIL PARAMETERS:
; t lI Sheet I'lle Stru.tur(,: LAGRAN(;E UG WAI.I,
SSP data sheet 6
DISTRESS PROFILE FORM
MISALIGNMENT (X :stop, Zdelete)
Station I)isplac. FromStation of Maximum from Top of
From To Displac. Normal (ip1 Wall (ft.).. . . . ... I.. -- --... -
= 200 250 230 2.5 0
CORROSION (X=stop, Z=delete)
Station SeverityFrom To Level (1-5)
'=> 0 150 2
-- > 201 565 2
SETTLEMENT (X'stop. Z=delete)
Station Displac. SurfaceStatlon of Maximum from Diserp.
From To Displac. Normal (in) Type
CAVITY FORMATION (Xmstop. Z=delete)
Cavity at Cavity Size (ft) SurfaceStation Length Width Height Type
INTERLOCK (X:=stop, Z=delete)
interlock Lenrth From Topat Station (ft) of Wall (ft)
... .... .. ..I ....... .. ------..
I1IOES (X-stop, Z=delete)
Hole at Size (ft) From TopStation Length Width of Wall (ft)
------- I -- - -.- -I ---------------
Figure C4. (Sheet 2 of 3)
Cll

DENTS (X=stop, Z=delete)
Dent at Dent Size(ft/rt/in) From TopStation Length Width Depth of Wall aft)
------ I------ I------I ----------=>250 3 2 .5 0
CRACKS (SHEET) (X=stop, Z-delete)
Crack at Size From TopStation Length(ft) Width(in) of Wall (ft)
------------ I---------I -----------="> 125 2 0 0==220 2 0 0
Figure C4. (Sheet 3 of 3)
C1 2