report documentation page form approved … measurement and modeling division, rtv-4f acoustics...
TRANSCRIPT

REPORT DOCUMENTATION PAGE Form Approved OMB No. 0704-0188
Public reporting burden for this collection of information is estimated to average 1 hour per response, including the time for reviewing instructions, searching existing data sources, gathering and maintaining the data needed, and completing and reviewing the collection of information. Send comments regarding this burden estimate or any other aspect of this collection of information, including suggestions for reducing this burden, to Washington Headquarters Services, Directorate for Information Operations and Reports, 1215 Jefferson Davis Highway, Suite 1204, Arlington, VA 22202-4302, and to the Office of Management and Budget, Paperwork Reduction Project (0704-0188), Washington, DC 20503.
1. AGENCY USE ONLY (Leave blank)
2. REPORT DATE August 2010
3. REPORT TYPE AND DATES COVERED Final Report
4. TITLE AND SUBTITLE Caltrans Thin Lift Study: Effects of Asphalt Pavements on Wayside Noise
6. AUTHOR(S) Judith L. Rochat, David R. Read, and Gregg G. Fleming
5. FUNDING NUMBERS VP40/DS037
7. PERFORMING ORGANIZATION NAME(S) AND ADDRESS(ES) U.S. Department of Transportation Research and Innovative Technology Administration John A. Volpe National Transportation Systems Center Environmental Measurement and Modeling Division, RTV-4F Acoustics Facility Cambridge, MA 02142-1093
8. PERFORMING ORGANIZATION REPORT NUMBER RVT-41-VP940-LR1
9. SPONSORING/MONITORING AGENCY NAME(S) AND ADDRESS(ES) California Department of Transportation (Caltrans) Division of Environmental Analysis and Division of Research and Innovation Sacramento, CA 95814
10.SPONSORING/MONITORING AGENCY REPORT NUMBER
CA 10-0146
11. SUPPLEMENTARY NOTES Caltrans Program Managers: Bruce Rymer, Jim Andrews 12a. DISTRIBUTION/AVAILABILITY STATEMENT 12b. DISTRIBUTION CODE 13. ABSTRACT (Maximum 200 words) The Volpe Center Acoustics Facility, in support of the California Department of Transportation, participated in a long-term study to assess several types of pavement for the purpose of noise abatement. On a 6.4-km (4-mi) stretch of a 2-lane highway in Southern California, several asphalt pavement overlays were examined. Acoustical, meteorological, and traffic data were collected in each pavement overlay section, where microphones were deployed at multiple distances and heights. Single vehicle pass-by events were recorded primarily for 3 vehicle types: automobiles, medium trucks, and heavy trucks. Data were analyzed to determine the noise benefit of each pavement as compared to the reference dense-graded asphalt pavement; this includes a modified Statistical Pass-By Index as well as average LAFmx values for each vehicle type. In addition, 1/3-octave band data were examined. Results from the study indicate that applying a quieter pavement overlay can reduce wayside-measured sound levels.
15. NUMBER OF PAGES 289
14. SUBJECT TERMS Highway traffic noise, tire/pavement interaction noise, asphalt pavements
16. PRICE CODE 17. SECURITY CLASSIFICATION OF REPORT Unclassified
18. SECURITY CLASSIFICATION OF THIS PAGE Unclassified
19. SECURITY CLASSIFICATION OF ABSTRACT Unclassified
20. LIMITATION OF ABSTRACT
NSN 7540-01-280-5500 Standard Form 298 (Rev. 2-89) Prescribed by ANSI Std. 239-18
298-102

DISCLAIMER STATEMENT
This document is disseminated in the interest of information exchange. The contents of this report reflect the views of the authors who are responsible for the facts and accuracy of the data presented herein. The contents do not necessarily reflect the official views or policies of the State of California or the Federal Highway Administration. This publication does not constitute a standard, specification or regulation. This report does not constitute an endorsement by the Department of any product described herein.
For individuals with sensory disabilities, this document is available in Braille, large print, audiocassette, or compact disk. To obtain a copy of this document in one of these alternate formats, please contact: the Division of Research and Innovation, MS-83, California Department of Transportation, P.O. Box 942873, Sacramento, CA 94273-0001.

Caltrans report # CA 10-0146 Volpe letter report # RVT-41-VP940-LR1 September 2010 Final Report
Caltrans Thin Lift Study: Effects of Asphalt Pavements on Wayside Noise
Prepared for: Prepared by: California Department of Transportation United States Department of Transportation Division of Environmental Analysis and Research and Innovative Technology Administration Division of Research and Innovation Volpe National Transportation Systems Center Sacramento, CA 95814 Environmental Measurement and Modeling Cambridge, MA 02142

NOTICE This document is disseminated under the sponsorship of the Department of Transportation in the interest of information exchange. The United States Government assumes no liability for its contents or use thereof. This report does not constitute a standard, specification, or regulation.
NOTICE The United States Government does not endorse products or manufacturers. Trade or manufacturers’ names appear herein solely because they are considered essential to the objective of this report.
DISCLAIMER The contents of this report reflect the views of the authors who are responsible for the facts and the accuracy of the data presented herein. The contents do not necessarily reflect the official views or policies of the California Department of Transportation. This publication does not constitute a standard, specification, or regulation.
NOTICE For individuals with sensory disabilities, this document is available in Braille, large print, audiocassette, or compact disk. To obtain a copy of this document in one of these alternate formats, please contact: the Division of Research and Innovation, MS-83, California Department of Transportation, P.O. Box 942873, Sacramento, CA 94273-0001.

METRIC/ENGLISH CONVERSION FACTORS ENGLISH TO METRIC METRIC TO ENGLISH
LENGTH (APPROXIMATE) LENGTH (APPROXIMATE) 1 inch (in) = 2.5 centimeters (cm) 1 millimeter (mm) = 0.04 inch (in) 1 foot (ft) = 30 centimeters (cm) 1 centimeter (cm) = 0.4 inch (in)
1 yard (yd) = 0.9 meter (m) 1 meter (m) = 3.3 feet (ft) 1 mile (mi) = 1.6 kilometers (km) 1 meter (m) = 1.1 yards (yd)
1 kilometer (km) = 0.6 mile (mi)
AREA (APPROXIMATE) AREA (APPROXIMATE)
1 square inch (sq in, in2) = 6.5 square centimeters (cm2)
1 square centimeter (cm2) = 0.16 square inch (sq in, in2)
1 square foot (sq ft, ft2) = 0.09 square meter (m2) 1 square meter (m2) = 1.2 square yards (sq yd, yd2)
1 square yard (sq yd, yd2) = 0.8 square meter (m2) 1 square kilometer (km2) = 0.4 square mile (sq mi, mi2)
1 square mile (sq mi, mi2) = 2.6 square kilometers (km2)
10,000 square meters (m2) = 1 hectare (ha) = 2.5 acres
1 acre = 0.4 hectare (he) = 4,000 square meters (m2)
MASS - WEIGHT (APPROXIMATE) MASS - WEIGHT (APPROXIMATE)
1 ounce (oz) = 28 grams (gm) 1 gram (gm) = 0.036 ounce (oz) 1 pound (lb) = 0.45 kilogram (kg) 1 kilogram (kg) = 2.2 pounds (lb)
1 short ton = 2,000 pounds (lb)
= 0.9 tonne (t) 1 tonne (t) ==
1,000 kilograms (kg) 1.1 short tons
VOLUME (APPROXIMATE) VOLUME (APPROXIMATE)
1 teaspoon (tsp) = 5 milliliters (ml) 1 milliliter (ml) = 0.03 fluid ounce (fl oz) 1 tablespoon (tbsp) = 15 milliliters (ml) 1 liter (l) = 2.1 pints (pt) 1 fluid ounce (fl oz) = 30 milliliters (ml) 1 liter (l) = 1.06 quarts (qt)
1 cup (c) = 0.24 liter (l) 1 liter (l) = 0.26 gallon (gal) 1 pint (pt) = 0.47 liter (l)
1 quart (qt) = 0.96 liter (l) 1 gallon (gal) = 3.8 liters (l)
1 cubic foot (cu ft, ft3) = 0.03 cubic meter (m3) 1 cubic meter (m3) = 36 cubic feet (cu ft, ft3) 1 cubic yard (cu yd, yd3) = 0.76 cubic meter (m3) 1 cubic meter (m3) = 1.3 cubic yards (cu yd,
yd3)
TEMPERATURE (EXACT) TEMPERATURE (EXACT)
[(x-32)(5/9)] °F = y °C [(9/5) y + 32] °C = x °F
QUICK INCH - CENTIMETER LENGTH CONVERSION10 2 3 4 5
InchesCentimeters 0 1 3 4 52 6 1110987 1312
QUICK FAHRENHEIT - CELSIUS TEMPERATURE CONVERSION -40° -22° -4° 14° 32° 50° 68° 86° 104° 122° 140° 158° 176° 194° 212°
°F
°C -40° -30° -20° -10° 0° 10° 20° 30° 40° 50° 60° 70° 80° 90° 100°
For more exact and or other conversion factors, see NIST Miscellaneous Publication 286, Units of Weights and Measures. Price $2.50 SD Catalog No. C13 10286 Updated 6/17/98


v
ACKNOWLEDGEMENTS
This work was sponsored by Caltrans, for which we thank them, as well as for their measurement
participation. The authors also thank the other members of the Volpe Acoustics team who
participated on this project.

vi

vii
TABLE OF CONTENTS
Section Page
ACKNOWLEDGEMENTS ......................................................................................................... v
1. INTRODUCTION............................................................................................................. 1
1.1 Background......................................................................................................................... 1
1.2 Study Overview .................................................................................................................. 1
1.3 Report Organization............................................................................................................ 2
2. MEASUREMENT SITES ................................................................................................ 3
2.1 Site Locations...................................................................................................................... 3
2.2 Five Test Sections ............................................................................................................... 4
3. DATA COLLECTION ..................................................................................................... 7
3.1 Methodologies..................................................................................................................... 7
3.1.1 Wayside vehicle pass-by noise ............................................................................... 7
3.1.2 Sound absorption of pavement................................................................................ 9
3.2 Data and Instrumentation.................................................................................................... 9
3.2.1 Acoustical data...................................................................................................... 10
3.2.2 Meteorological data .............................................................................................. 11
3.2.3 Traffic data............................................................................................................ 12
3.2.4 Pavement data ....................................................................................................... 13
3.2.5 Pass-by event log and extraneous noise log data .................................................. 14
3.3 Data Collection Sessions................................................................................................... 14
4. DATA PROCESSING AND ANALYSIS ..................................................................... 19
4.1 SPB Methodology Applied to Thin Lift Study................................................................. 19
4.2 Processing Procedure ........................................................................................................ 21

Table of Contents Caltrans Thin Lift Study
viii
4.2.1 Modified SPBI and average vehicle sound level ..................................................... 21
4.2.2 Test vehicle .............................................................................................................. 23
4.2.3 Existing traffic spectral data .................................................................................... 23
4.2.4 Sound absorption of pavement................................................................................. 23
5. RESULTS AND DISCUSSION ..................................................................................... 25
5.1 Overall Performance of Pavements .................................................................................. 25
5.2 Pavement Performance by Vehicle Type.......................................................................... 31
5.2.1 Broadband examination ........................................................................................... 31
5.2.2 Spectral examination................................................................................................ 34
5.3 Pavement Performance for Test Vehicle .......................................................................... 40
5.4 Pavement Performance Related to Sound Absorption...................................................... 43
6. CONCLUSIONS ............................................................................................................. 45
REFERENCES............................................................................................................................ 49
APPENDIX A. MEASUREMENT SITE PHOTOS ............................................................. A-1
A.1 Pavement Types .............................................................................................................. A-2
A.2 Site 1 (S1): DGAC 30mm............................................................................................... A-3
A.3 Site 2 (S2): OGAC 75mm............................................................................................... A-4
A.4 Site 3 (S3): OGAC 30mm............................................................................................... A-5
A.5 Site 4 (S4): RAC Type O 30mm..................................................................................... A-6
A.6 Site 5 (S5): BWC 30mm................................................................................................. A-7
APPENDIX B. INSTRUMENTATION PHOTOS ............................................................... B-1

Table of Contents Caltrans Thin Lift Study
ix
B.1 Acoustical Data Collection Instrumentation................................................................... B-2
B.2 Meteorological Data Collection Instrumentation............................................................ B-4
B.3 Traffic Data Collection Instrumentation......................................................................... B-5
B.4 Pavement Data Collection Instrumentation .................................................................... B-6
B.5 Pass-By Event Identification and Extraneous Noise Event Identification Data Collection
Instrumentation ............................................................................................................... B-7
APPENDIX C. VEHICLE PASS-BY DATA......................................................................... C-1
C.1 Vehicle Pass-By Summary ............................................................................................. C-1
C.2 Pre-Overlay Baseline .................................................................................................... C-20
C.3 Post-Overlay – Pavement Age: 4 months ..................................................................... C-44
C.4 Post-Overlay – Pavement Age: 10 months ................................................................... C-68
C.5 Post-Overlay – Pavement Age: 16 months ................................................................... C-92
C.6 Post-Overlay – Pavement Age: 52 months ................................................................. C-117
APPENDIX D. OVERALL PAVEMENT PERFORMANCE............................................. D-1
D.1 SPBI Values .................................................................................................................... D-2
D.2 SPBI Deltas................................................................................................................... D-11
D.3 Site Bias Decibel Adjustment Values ........................................................................... D-20
APPENDIX E. PAVEMENT PERFORMANCE BY VEHICLE TYPE ............................ E-1
E.1 Lveh Values .....................................................................................................................E-2
E.2 Lveh Deltas ......................................................................................................................E-4

Table of Contents Caltrans Thin Lift Study
x
E.3 Spectral Results..............................................................................................................E-10
APPENDIX F. TEST VEHICLE RESULTS..........................................................................F-1
F.1 Average LAFmx for Test Vehicle.......................................................................................F-2
F.2 Average LAFmx Deltas for Test Vehicle............................................................................F-7

xi
LIST OF FIGURES
Figure Page Figure 1. LA138 pavement testing area map. ................................................................................ 3
Figure 2. LA138 pavement testing area photograph...................................................................... 4
Figure 3. Illustration of basic instrumentation set-up. (Not proportional or to scale) .................. 8
Figure 4. Example of the deployed instrumentation...................................................................... 8
Figure 5. Pavement effects compared to DGAC (Site x minus Site 1) using modified SPBI
(limited data for BWC). Microphone location: distance 7.5 m (25 ft), height 1.5 m (5
ft)................................................................................................................................. 28
Figure 6. Increase in SPBI* values over time, as compared to values at 4 months. Microphone
location: distance 7.5 m (25 ft), height 1.5 m (5 ft). ................................................... 30
Figure 7. Pavement effects compared to DGAC (Site x minus Site 1) for autos and heavy trucks
using modified SPBI.* Microphone location: distance 7.5 m (25 ft), height 1.5 m (5
ft)................................................................................................................................. 34
Figure 8. Spectral data for automobiles (top) and heavy trucks (bottom) on four different
pavement types. Post-overlay results, all pavements aged 16 months. Microphone
location: distance 25 ft, height 5 ft.............................................................................. 38
Figure 9. Test vehicle average LAFmx values for pavement aged 16 months, multiple speeds.
Microphone position: distance 15 m (50 ft), height 1.5 m (5 ft). Site bias removed. 41
Figure 10. Test vehicle average LAFmx deltas (Site x minus Site 1) for pavement ages 4 months,
10 months, and 16 months, 100 km/h (60 mph). Microphone position: distance 15 m
(50 ft), height 1.5 m (5 ft). Site bias removed............................................................ 43
Figure A-1. Pavement types for asphalt overlays on LA138..................................................... A-2
Figure A-2. LA138 Site 1 (S1), DGAC 30 mm......................................................................... A-3
Figure A-3. LA138 Site 2 (S2), OGAC 75 mm......................................................................... A-4
Figure A-4. LA138 Site 3 (S3), OGAC 30 mm......................................................................... A-5
Figure A-5. LA138 Site 4 (S4), RAC Type O 30 mm............................................................... A-6
Figure A-6. LA138 Site 5 (S5), BWC 30 mm. .......................................................................... A-7

List of Figures Caltrans Thin Lift Study
xii
Figure B-1. Deployed sound level meters (LDL Model 820 Sound Level Meters) and DAT recorder (Sony Model TCD-D100 Digital Audio Tape (DAT) Recorder). .................... B-2
Figure B-2. Deployed spectrum analyzers (LDL Model 2900 2-Channel Spectrum Analyzers). ......................................................................................................................................... B-3
Figure B-3. Deployed meteorological data collection system (Qualimetrics Transportable Automated Meteorological Stations (TAMS)). .............................................................. B-4
Figure B-4. Video cameras and radar gun. ................................................................................ B-5
Figure B-5. Infrared temperature gun (also seen in Figure B-2). .............................................. B-6
Figure B-6. Palmtop computer for logging (HP 200 LX palmtop computer) (also seen in Figure B-2). ................................................................................................................................ B-7
Figure C-1. (this and previous page) Vehicle pass-by data, pre-overlay; Site 1 (DGAC), Site 2 (DGAC). Automobiles (top), medium trucks (middle), and heavy trucks (bottom). Microphone location: distance 25 ft, height 5 ft. .......................................................... C-21
Figure C-2. (this and previous page) Vehicle pass-by data, pre-overlay; Site 1 (DGAC), Site 2 (DGAC). Automobiles (top), medium trucks (middle), and heavy trucks (bottom). Microphone location: distance 50 ft, height 5 ft. .......................................................... C-23
Figure C-3. (this and previous page) Vehicle pass-by data, pre-overlay; Site 1 (DGAC), Site 2 (DGAC). Automobiles (top), medium trucks (middle), and heavy trucks (bottom). Microphone location: distance 50 ft, height 15 ft. ........................................................ C-25
Figure C-4. (this and previous page) Vehicle pass-by data, pre-overlay; Site 1 (DGAC), Site 3 (DGAC). Automobiles (top), medium trucks (middle), and heavy trucks (bottom). Microphone location: distance 25 ft, height 5 ft. .......................................................... C-27
Figure C-5. (this and previous page) Vehicle pass-by data, pre-overlay; Site 1 (DGAC), Site 3 (DGAC). Automobiles (top), medium trucks (middle), and heavy trucks (bottom). Microphone location: distance 50 ft, height 5 ft. .......................................................... C-29
Figure C-6. (this and previous page) Vehicle pass-by data, pre-overlay; Site 1 (DGAC), Site 3 (DGAC). Automobiles (top), medium trucks (middle), and heavy trucks (bottom). Microphone location: distance 50 ft, height 15 ft. ........................................................ C-31
Figure C-7. (this and previous page) Vehicle pass-by data, pre-overlay; Site 1 (DGAC), Site 4 (DGAC). Automobiles (top), medium trucks (middle), and heavy trucks (bottom). Microphone location: distance 25 ft, height 5 ft. .......................................................... C-33
Figure C-8. (this and previous page) Vehicle pass-by data, pre-overlay; Site 1 (DGAC), Site 4

List of Figures Caltrans Thin Lift Study
xiii
(DGAC). Automobiles (top), medium trucks (middle), and heavy trucks (bottom). Microphone location: distance 50 ft, height 5 ft. .......................................................... C-35
Figure C-9. (this and previous page) Vehicle pass-by data, pre-overlay; Site 1 (DGAC), Site 4 (DGAC). Automobiles (top), medium trucks (middle), and heavy trucks (bottom). Microphone location: distance 50 ft, height 15 ft. ........................................................ C-37
Figure C-10. (this and previous page) Vehicle pass-by data, pre-overlay; Site 1 (DGAC), Site 5 (DGAC). Automobiles (top), medium trucks (middle), and heavy trucks (bottom). Microphone location: distance 25 ft, height 5 ft. .......................................................... C-39
Figure C-11. (this and previous page) Vehicle pass-by data, pre-overlay; Site 1 (DGAC), Site 5 (DGAC). Automobiles (top), medium trucks (middle), and heavy trucks (bottom). Microphone location: distance 50 ft, height 5 ft. .......................................................... C-41
Figure C-12. (this and previous page) Vehicle pass-by data, pre-overlay; Site 1 (DGAC), Site 5 (DGAC). Automobiles (top), medium trucks (middle), and heavy trucks (bottom). Microphone location: distance 50 ft, height 15 ft. ........................................................ C-43
Figure C-13. (this and previous page) Vehicle pass-by data, post-overlay, 4 months age; Site 1 (DGAC 30mm), Site 2 (OGAC 75mm). Automobiles (top), medium trucks (middle), and heavy trucks (bottom). Microphone location: distance 25 ft, height 5 ft..................... C-45
Figure C-14. (this and previous page) Vehicle pass-by data, post-overlay, 4 months age; Site 1 (DGAC 30mm), Site 2 (OGAC 75mm). Automobiles (top), medium trucks (middle), and heavy trucks (bottom). Microphone location: distance 50 ft, height 5 ft..................... C-47
Figure C-15. Vehicle pass-by data, post-overlay, 4 months age; Site 1 (DGAC 30mm), Site 2 (OGAC 75mm). Automobiles (top), medium trucks (middle), and heavy trucks (bottom). Microphone location: distance 50 ft, height 15 ft. ........................................................ C-49
Figure C-16. (this and previous page) Vehicle pass-by data, post-overlay, 4 months age; Site 1 (DGAC 30mm), Site 3 (OGAC 30mm). Automobiles (top), medium trucks (middle), and heavy trucks (bottom). Microphone location: distance 25 ft, height 5 ft..................... C-51
Figure C-17. (this and previous page) Vehicle pass-by data, post-overlay, 4 months age; Site 1 (DGAC 30mm), Site 3 (OGAC 30mm). Automobiles (top), medium trucks (middle), and heavy trucks (bottom). Microphone location: distance 50 ft, height 5 ft..................... C-53
Figure C-18. (this and previous page) Vehicle pass-by data, post-overlay, 4 months age; Site 1 (DGAC 30mm), Site 3 (OGAC 30mm). Automobiles (top), medium trucks (middle), and

List of Figures Caltrans Thin Lift Study
xiv
heavy trucks (bottom). Microphone location: distance 50 ft, height 15 ft................... C-55
Figure C-19. (this and previous page) Vehicle pass-by data, post-overlay, 4 months age; Site 1 (DGAC 30mm), Site 4 (RAC Type O 30mm). Automobiles (top), medium trucks (middle), and heavy trucks (bottom). Microphone location: distance 25 ft, height 5 ft. . C-57
Figure C-20. (this and previous page) Vehicle pass-by data, post-overlay, 4 months age; Site 1 (DGAC 30mm), Site 4 (RAC Type O 30mm). Automobiles (top), medium trucks (middle), and heavy trucks (bottom). Microphone location: distance 50 ft, height 5 ft. . C-59
Figure C-21. (this and previous page) Vehicle pass-by data, post-overlay, 4 months age; Site 1 (DGAC 30mm), Site 4 (RAC Type O 30mm). Automobiles (top), medium trucks (middle), and heavy trucks (bottom). Microphone location: distance 50 ft, height 15 ft.C-61
Figure C-22. (this and previous page) Vehicle pass-by data, post-overlay, 4 months age; Site 1 (DGAC 30mm), Site 5 (BWC 30mm). Automobiles (top), medium trucks (middle), and heavy trucks (bottom). Microphone location: distance 25 ft, height 5 ft..................... C-63
Figure C-23. (this and previous page) Vehicle pass-by data, post-overlay, 4 months age; Site 1 (DGAC 30mm), Site 5 (BWC 30mm). Automobiles (top), medium trucks (middle), and heavy trucks (bottom). Microphone location: distance 50 ft, height 5 ft..................... C-65
Figure C-24. (this and previous page) Vehicle pass-by data, post-overlay, 4 months age; Site 1 (DGAC 30mm), Site 5 (BWC 30mm). Automobiles (top), medium trucks (middle), and heavy trucks (bottom). Microphone location: distance 50 ft, height 15 ft................... C-67
Figure C-25. (this and previous page) Vehicle pass-by data, post-overlay, 10 months age; Site 1 (DGAC 30mm), Site 2 (OGAC 75mm). Automobiles (top), medium trucks (middle), and heavy trucks (bottom). Microphone location: distance 25 ft, height 5 ft..................... C-69
Figure C-26. (this and previous page) Vehicle pass-by data, post-overlay, 10 months age; Site 1 (DGAC 30mm), Site 2 (OGAC 75mm). Automobiles (top), medium trucks (middle), and heavy trucks (bottom). Microphone location: distance 50 ft, height 5 ft..................... C-71
Figure C-27. (this and previous page) Vehicle pass-by data, post-overlay, 10 months age; Site 1 (DGAC 30mm), Site 2 (OGAC 75mm). Automobiles (top), medium trucks (middle), and heavy trucks (bottom). Microphone location: distance 50 ft, height 15 ft................... C-73
Figure C-28. (this and previous page) Vehicle pass-by data, post-overlay, 10 months age; Site 1 (DGAC 30mm), Site 3 (OGAC 30mm). Automobiles (top), medium trucks (middle), and

List of Figures Caltrans Thin Lift Study
xv
heavy trucks (bottom). Microphone location: distance 25 ft, height 5 ft..................... C-75
Figure C-29. (this and previous page) Vehicle pass-by data, post-overlay, 10 months age; Site 1 (DGAC 30mm), Site 3 (OGAC 30mm). Automobiles (top), medium trucks (middle), and heavy trucks (bottom). Microphone location: distance 50 ft, height 5 ft..................... C-77
Figure C-30. (this and previous page) Vehicle pass-by data, post-overlay, 10 months age; Site 1 (DGAC 30mm), Site 3 (OGAC 30mm). Automobiles (top), medium trucks (middle), and heavy trucks (bottom). Microphone location: distance 50 ft, height 15 ft................... C-79
Figure C-31. (this and previous page) Vehicle pass-by data, post-overlay, 10 months age; Site 1 (DGAC 30mm), Site 4 (RAC Type O 30mm). Automobiles (top), medium trucks (middle), and heavy trucks (bottom). Microphone location: distance 25 ft, height 5 ft. . C-81
Figure C-32. (this and previous page) Vehicle pass-by data, post-overlay, 10 months age; Site 1 (DGAC 30mm), Site 4 (RAC Type O 30mm). Automobiles (top), medium trucks (middle), and heavy trucks (bottom). Microphone location: distance 50 ft, height 5 ft. . C-83
Figure C-33. (this and previous page) Vehicle pass-by data, post-overlay, 10 months age; Site 1 (DGAC 30mm), Site 4 (RAC Type O 30mm). Automobiles (top), medium trucks (middle), and heavy trucks (bottom). Microphone location: distance 50 ft, height 15 ft.C-85
Figure C-34. (this and previous page) Vehicle pass-by data, post-overlay, 10 months age; Site 1 (DGAC 30mm), Site 5 (BWC 30mm). Automobiles (top), medium trucks (middle), and heavy trucks (bottom). Microphone location: distance 25 ft, height 5 ft..................... C-87
Figure C-35. (this and previous page) Vehicle pass-by data, post-overlay, 10 months age; Site 1 (DGAC 30mm), Site 5 (BWC 30mm). Automobiles (top), medium trucks (middle), and heavy trucks (bottom). Microphone location: distance 50 ft, height 5 ft..................... C-89
Figure C-36. (this and previous page) Vehicle pass-by data, post-overlay, 10 months age; Site 1 (DGAC 30mm), Site 5 (BWC 30mm). Automobiles (top), medium trucks (middle), and heavy trucks (bottom). Microphone location: distance 50 ft, height 15 ft................... C-91
Figure C-37. (this and previous page) Vehicle pass-by data, post-overlay, 16 months age; Site 1 (DGAC 30mm), Site 2 (OGAC 75mm). Automobiles (top), medium trucks (middle), and heavy trucks (bottom). Microphone location: distance 25 ft, height 5 ft..................... C-93
Figure C-38. (this and previous page) Vehicle pass-by data, post-overlay, 16 months age; Site 1 (DGAC 30mm), Site 2 (OGAC 75mm). Automobiles (top), medium trucks (middle), and

List of Figures Caltrans Thin Lift Study
xvi
heavy trucks (bottom). Microphone location: distance 50 ft, height 5 ft..................... C-95
Figure C-39. (this and previous page) Vehicle pass-by data, post-overlay, 16 months age; Site 1 (DGAC 30mm), Site 2 (OGAC 75mm). Automobiles (top), medium trucks (middle), and heavy trucks (bottom). Microphone location: distance 50 ft, height 15 ft................... C-97
Figure C-40. (this and previous page) Vehicle pass-by data, post-overlay, 16 months age; Site 1 (DGAC 30mm), Site 3 (OGAC 30mm). Automobiles (top), medium trucks (middle), and heavy trucks (bottom). Microphone location: distance 25 ft, height 5 ft..................... C-99
Figure C-41. (this and previous page) Vehicle pass-by data, post-overlay, 16 months age; Site 1 (DGAC 30mm), Site 3 (OGAC 30mm). Automobiles (top), medium trucks (middle), and heavy trucks (bottom). Microphone location: distance 50 ft, height 5 ft................... C-101
Figure C-42. (this and previous page) Vehicle pass-by data, post-overlay, 16 months age; Site 1 (DGAC 30mm), Site 3 (OGAC 30mm). Automobiles (top), medium trucks (middle), and heavy trucks (bottom). Microphone location: distance 50 ft, height 15 ft................. C-103
Figure C-43. (this and previous page) Vehicle pass-by data, post-overlay, 16 months age; Site 1 (DGAC 30mm), Site 4 (RAC Type O 30mm). Automobiles (top), medium trucks (middle), and heavy trucks (bottom). Microphone location: distance 25 ft, height 5 ft. . C-105
Figure C-44. (this and previous page) Vehicle pass-by data, post-overlay, 16 months age; Site 1 (DGAC 30mm), Site 4 (RAC Type O 30mm). Automobiles (top), medium trucks (middle), and heavy trucks (bottom). Microphone location: distance 50 ft, height 5 ft. . C-107
Figure C-45. (this and previous page) Vehicle pass-by data, post-overlay, 16 months age; Site 1 (DGAC 30mm), Site 4 (RAC Type O 30mm). Automobiles (top), medium trucks (middle), and heavy trucks (bottom). Microphone location: distance 50 ft, height 15 ft.C-109
Figure C-46. (this and previous page) Vehicle pass-by data, post-overlay, 16 months age; Site 1 (DGAC 30mm), Site 5 (BWC 30mm). Automobiles (top), medium trucks (middle), and heavy trucks (bottom). Microphone location: distance 25 ft, height 5 ft................... C-111
Figure C-47. (this and previous page) Vehicle pass-by data, post-overlay, 16 months age; Site 1 (DGAC 30mm), Site 5 (BWC 30mm). Automobiles (top), medium trucks (middle), and heavy trucks (bottom). Microphone location: distance 50 ft, height 5 ft................... C-113
Figure C-48. (this and previous page) Vehicle pass-by data, post-overlay, 16 months age; Site 1 (DGAC 30mm), Site 5 (BWC 30mm). Automobiles (top), medium trucks (middle), and heavy trucks (bottom). Microphone location: distance 50 ft, height 15 ft................. C-115

List of Figures Caltrans Thin Lift Study
xvii
Figure C-49. (this and previous page) Vehicle pass-by data, post-overlay, 52 months age; Site 1 (DGAC 30mm), Site 2 (OGAC 75mm). Automobiles (top), medium trucks (middle), and heavy trucks (bottom). Microphone location: distance 25 ft, height 5 ft................... C-118
Figure C-50. Vehicle pass-by data, post-overlay, 52 months age; Site 1 (DGAC 30mm), Site 2 (OGAC 75mm). Automobiles (top), medium trucks (middle), and heavy trucks (bottom). Microphone location: distance 50 ft, height 5 ft. ........................................................ C-120
Figure C-51. Vehicle pass-by data, post-overlay, 52 months age; Site 1 (DGAC 30mm), Site 2 (OGAC 75mm). Automobiles (top), medium trucks (middle), and heavy trucks (bottom). Microphone location: distance 50 ft, height 15 ft. ...................................................... C-122
Figure C-52. (this and previous page) Vehicle pass-by data, post-overlay, 52 months age; Site 1 (DGAC 30mm), Site 3 (OGAC 30mm). Automobiles (top), medium trucks (middle), and heavy trucks (bottom). Microphone location: distance 25 ft, height 5 ft................... C-124
Figure C-53. (this and previous page) Vehicle pass-by data, post-overlay, 52 months age; Site 1 (DGAC 30mm), Site 3 (OGAC 30mm). Automobiles (top), medium trucks (middle), and heavy trucks (bottom). Microphone location: distance 50 ft, height 5 ft................... C-126
Figure C-54. (this and previous page) Vehicle pass-by data, post-overlay, 52 months age; Site 1 (DGAC 30mm), Site 3 (OGAC 30mm). Automobiles (top), medium trucks (middle), and heavy trucks (bottom). Microphone location: distance 50 ft, height 15 ft................. C-128
Figure C-55. (this and previous page) Vehicle pass-by data, post-overlay, 52 months age; Site 1 (DGAC 30mm), Site 4 (RAC Type O 30mm). Automobiles (top), medium trucks (middle), and heavy trucks (bottom). Microphone location: distance 25 ft, height 5 ft. . C-130
Figure C-56. (this and previous page) Vehicle pass-by data, post-overlay, 52 months age; Site 1 (DGAC 30mm), Site 4 (RAC Type O 30mm). Automobiles (top), medium trucks (middle), and heavy trucks (bottom). Microphone location: distance 50 ft, height 5 ft. . C-132
Figure C-57. (this and previous page) Vehicle pass-by data, post-overlay, 52 months age; Site 1 (DGAC 30mm), Site 4 (RAC Type O 30mm). Automobiles (top), medium trucks (middle), and heavy trucks (bottom). Microphone location: distance 50 ft, height 15 ft.C-134
Figure D-1. SPBI* values over time for pavement pair DGAC 30mm (S1) and OGAC 75mm (S2). Overlay pavements aged 4, 10, 16, and 52 months. Microphone locations: distance 7.5 m (25 ft), height 1.5 m (5 ft); distance 15 m (50 ft), height 1.5 m (5 ft); distance 15 m (50 ft), height 4.5 m (15 ft). ............................................................................................ D-4
Figure D-2. SPBI* values over time for pavement pair DGAC 30mm (S1) and OGAC 30mm

List of Figures Caltrans Thin Lift Study
xviii
(S3). Overlay pavements aged 4, 10, 16, and 52 months. Microphone locations: distance 7.5 m (25 ft), height 1.5 m (5 ft); distance 15 m (50 ft), height 1.5 m (5 ft); distance 15 m (50 ft), height 4.5 m (15 ft). ............................................................................................ D-5
Figure D-3. SPBI* values over time for pavement pair DGAC 30mm (S1) and RAC Type O 30mm (S4). Overlay pavements aged 4, 10, 16, and 52 months. Microphone locations: distance 7.5 m (25 ft), height 1.5 m (5 ft); distance 15 m (50 ft), height 1.5 m (5 ft); distance 15 m (50 ft), height 4.5 m (15 ft). ..................................................................... D-6
Figure D-4. SPBI* values over time for pavement pair DGAC 30mm (S1) and BWC 30mm (S5). Overlay pavements aged 4, 10, and 16 months. Microphone locations: distance 7.5 m (25 ft), height 1.5 m (5 ft); distance 15 m (50 ft), height 1.5 m (5 ft); distance 15 m (50 ft), height 4.5 m (15 ft).................................................................................................... D-7
Figure D-5. Increase in SPBI* values over time, as compared to values at 4 months. Post-overlay results, all pavements (except BWC – no data available), including DGAC, aged 4, 10, 16, and 52 months. Microphone location: distance 7.5 m (25 ft), height 1.5 m (5 ft)..................................................................................................................................... D-8
Figure D-6. Increase in SPBI* values over time, as compared to values at 4 months. Post-overlay results, all pavements, including DGAC, aged 4, 10, 16, and 52 months (limited data for BWC). Microphone location: distance 15 m (50 ft), height 1.5 m (5 ft).......... D-9
Figure D-7. Increase in SPBI* values over time, as compared to values at 4 months. Post-overlay results, all pavements, including DGAC, aged 4, 10, 16, and 52 months (limited data for BWC). Microphone location: distance 15 m (50 ft), height 4.5 m (15 ft)...... D-10
Figure D-8. Pavement effects compared to DGAC (Site x minus Site 1) using modified SPBI. Post-overlay results, all pavements, including DGAC, aged 4 months. Microphone locations: distance 7.5 m (25 ft), height 1.5 m (5 ft); distance 15 m (50 ft), height 1.5 m (5 ft); distance 15 m (50 ft), height 4.5 m (15 ft). ............................................................. D-13
Figure D-9. Pavement effects compared to DGAC (Site x minus Site 1) using modified SPBI. Post-overlay results, all pavements, including DGAC, aged 10 months. Microphone locations: distance 7.5 m (25 ft), height 1.5 m (5 ft); distance 15 m (50 ft), height 1.5 m (5 ft); distance 15 m (50 ft), height 4.5 m (15 ft). ............................................................. D-14
Figure D-10. Pavement effects compared to DGAC (Site x minus Site 1) using modified SPBI. Post-overlay results, all pavements, including DGAC, aged 16 months. Microphone locations: distance 7.5 m (25 ft), height 1.5 m (5 ft); distance 15 m (50 ft), height 1.5 m (5 ft); distance 15 m (50 ft), height 4.5 m (15 ft). ............................................................. D-15
Figure D-11. Pavement effects compared to DGAC (Site x minus Site 1) using modified SPBI. Post-overlay results, all pavements, including DGAC, aged 52 months. Microphone locations: distance 7.5 m (25 ft), height 1.5 m (5 ft); distance 15 m (50 ft), height 1.5 m (5

List of Figures Caltrans Thin Lift Study
xix
ft); distance 15 m (50 ft), height 4.5 m (15 ft). ............................................................. D-16
Figure D-12. Pavement effects compared to DGAC (Site x minus Site 1) using modified SPBI. Post-overlay results, all pavements, including DGAC, aged 4, 10, 16, and 52 months (limited data for BWC). Microphone location: distance 7.5 m (25 ft), height 1.5 m (5 ft)........................................................................................................................................ D-17
Figure D-13. Pavement effects compared to DGAC (Site x minus Site 1) using modified SPBI. Post-overlay results, all pavements, including DGAC, aged 4, 10, 16, and 52 months (limited data for BWC). Microphone location: distance 15 m (50 ft), height 1.5 m (5 ft)........................................................................................................................................ D-18
Figure D-14. Pavement effects compared to DGAC (Site x minus Site 1) using modified SPBI. Post-overlay results, all pavements, including DGAC, aged 4, 10, 16, and 52 months (limited data for BWC). Microphone location: distance 15 m (50 ft), height 4.5 m (15 ft)........................................................................................................................................ D-19
Figure E-1. Pavement effects compared to DGAC (Site x minus Site 1) for autos and heavy trucks using modified SPBI.* Post-overlay results, all pavements, including DGAC, aged 4, 10, 16, and 52 months (limited data for BWC). Microphone location: distance 7.5 m (25 ft), height 1.5 m (5 ft). .....................................................................................E-7
Figure E-2. Pavement effects compared to DGAC (Site x minus Site 1) for autos and heavy trucks using modified SPBI.* Post-overlay results, all pavements, including DGAC, aged 4, 10, 16, and 52 months (limited data for BWC). Microphone location: distance 15 m (50 ft), height 1.5 m (5 ft). ...........................................................................................E-8
Figure E-3. Pavement effects compared to DGAC (Site x minus Site 1) for autos and heavy trucks using modified SPBI.* Post-overlay results, all pavements, including DGAC, aged 4, 10, 16, and 52 months (limited data for BWC). Microphone location: distance 15 m (50 ft), height 4.5 m (15 ft). .........................................................................................E-9
Figure E-4. Spectral data for automobiles (top) and heavy trucks (bottom) on four different pavement types. Post-overlay results, all pavements aged 4 months. Microphone location: distance 25 ft, height 5 ft.................................................................................E-11
Figure E-5. Spectral data for automobiles (top) and heavy trucks (bottom) on four different pavement types. Post-overlay results, all pavements aged 4 months. Microphone location: distance 50 ft, height 5 ft.................................................................................E-12
Figure E-6. Spectral data for automobiles (top) and heavy trucks (bottom) on four different pavement types. Post-overlay results, all pavements aged 4 months. Microphone location: distance 50 ft, height 15 ft...............................................................................E-13
Figure E-7. Spectral data for automobiles (top) and heavy trucks (bottom) on four different

List of Figures Caltrans Thin Lift Study
xx
pavement types. Post-overlay results, all pavements aged 4 months. Microphone location: distance 200 ft, height 5 ft...............................................................................E-14
Figure E-8. Spectral data for automobiles (top) and heavy trucks (bottom) on four different pavement types. Post-overlay results, all pavements aged 10 months. Microphone location: distance 25 ft, height 5 ft.................................................................................E-15
Figure E-9. Spectral data for automobiles (top) and heavy trucks (bottom) on four different pavement types. Post-overlay results, all pavements aged 10 months. Microphone location: distance 50 ft, height 5 ft.................................................................................E-16
Figure E-10. Spectral data for automobiles (top) and heavy trucks (bottom) on four different pavement types. Post-overlay results, all pavements aged 10 months. Microphone location: distance 50 ft, height 15 ft...............................................................................E-17
Figure E-11. Spectral data for automobiles (top) and heavy trucks (bottom) on four different pavement types. Post-overlay results, all pavements aged 10months. Microphone location: distance 200 ft, height 5 ft...............................................................................E-18
Figure E-12. Spectral data for automobiles (top) and heavy trucks (bottom) on four different pavement types. Post-overlay results, all pavements aged 16 months. Microphone location: distance 25 ft, height 5 ft.................................................................................E-19
Figure E-13. Spectral data for automobiles (top) and heavy trucks (bottom) on four different pavement types. Post-overlay results, all pavements aged 16 months. Microphone location: distance 50 ft, height 5 ft.................................................................................E-20
Figure E-14. Spectral data for automobiles (top) and heavy trucks (bottom) on four different pavement types. Post-overlay results, all pavements aged 16 months. Microphone location: distance 50 ft, height 15 ft...............................................................................E-21
Figure E-15. Spectral data for automobiles (top) and heavy trucks (bottom) on four different pavement types. Post-overlay results, all pavements aged 16 months. Microphone location: distance 200 ft, height 5 ft...............................................................................E-22
Figure E-16. Spectral data for automobiles (top) and heavy trucks (bottom) on four different pavement types. Post-overlay results, all pavements aged 52 months. Microphone location: distance 25 ft, height 5 ft.................................................................................E-23
Figure E-17. Spectral data for automobiles (top) and heavy trucks (bottom) on four different pavement types. Post-overlay results, all pavements aged 52 months. Microphone location: distance 50 ft, height 5 ft.................................................................................E-24
Figure E-18. Spectral data for automobiles (top) and heavy trucks (bottom) on four different pavement types. Post-overlay results, all pavements aged 52 months. Microphone

List of Figures Caltrans Thin Lift Study
xxi
location: distance 50 ft, height 15 ft...............................................................................E-25
Figure E-19. Spectral data for automobiles; post-overlay results for Site 1 (DGAC 30 mm); all ages measured. Microphone location: distance 25 ft, height 5 ft (top); microphone location: distance 50 ft, height 5 ft (middle); microphone location: distance 50 ft, height 15 ft (bottom). ................................................................................................................E-26
Figure E-20. Spectral data for automobiles; post-overlay results for Site 2 (OGAC 75 mm); all ages measured. Microphone location: distance 25 ft, height 5 ft (top); microphone location: distance 50 ft, height 5 ft (middle); microphone location: distance 50 ft, height 15 ft (bottom). .............................................................................................................E-27
Figure E-21. Spectral data for automobiles; post-overlay results for Site 3 (OGAC 30 mm); all ages measured. Microphone location: distance 25 ft, height 5 ft (top); microphone location: distance 50 ft, height 5 ft (middle); microphone location: distance 50 ft, height 15 ft (bottom). ............................................................................................................…E-28
Figure E-22. Spectral data for automobiles; post-overlay results for Site 4 (RAC Type O 30 mm); all ages measured. Microphone location: distance 25 ft, height 5 ft (top); microphone location: distance 50 ft, height 5 ft (middle); microphone location: distance 50 ft, height 15 ft (bottom).............................................................................................E-29
Figure E-23. Spectral data for automobiles; post-overlay results for Site 5 (BWC 30 mm); all ages measured. Microphone location: distance 25 ft, height 5 ft (top); microphone location: distance 50 ft, height 5 ft (middle); microphone location: distance 50 ft, height 15 ft (bottom). ............................................................................................................…E-30
Figure E-24. Spectral data for automobiles (top) and heavy trucks (bottom); post-overlay results for Site 1 (DGAC 30 mm) aged 16 months; all microphone positions. ........................E-31
Figure E-25. Spectral data for automobiles (top) and heavy trucks (bottom); post-overlay results for Site 2 (OGAC 75 mm) aged 16 months; all microphone positions. ........................E-32
Figure E-26. Spectral data for automobiles (top) and heavy trucks (bottom); post-overlay results for Site 3 (OGAC 30 mm) aged 16 months; all microphone positions. ........................E-33
Figure E-27. Spectral data for automobiles (top) and heavy trucks (bottom); post-overlay results for Site 4 (RAC Type O 30 mm) aged 16 months; all microphone positions. ..............E-34
Figure E-28. Spectral data for automobiles (top) and heavy trucks (bottom); post-overlay results for Site 5 (BWC 30 mm) aged 16 months; all microphone positions............................E-35
Figure F-1. Test vehicle average LAFmx values for pavement aged 4 months, multiple speeds. Microphone position: (top) distance 15 m (50 ft), height 1.5 m (5 ft); (bottom) distance 15 m (50 ft), height 4.5 m (15 ft). Site bias removed. ....................................................F-4

List of Figures Caltrans Thin Lift Study
xxii
Figure F-2. Test vehicle average LAFmx values for pavement aged 10 months, multiple speeds. Microphone position: (top) distance 15 m (50 ft), height 1.5 m (5 ft); (bottom) distance 15 m (50 ft), height 4.5 m (15 ft). Site bias removed. ....................................................F-5
Figure F-3. Test vehicle average LAFmx values for pavement aged 16 months, multiple speeds. Microphone position: (top) distance 15 m (50 ft), height 1.5 m (5 ft); (bottom) distance 15 m (50 ft), height 4.5 m (15 ft). Site bias removed. ....................................................F-6
Figure F-4. Test vehicle average LAFmx deltas (Site x minus Site 1) for pavement ages 4 months, 10 months, and 16 months, 100 km/h (60 mph). Microphone position: (top) distance 15 m (50 ft), height 1.5 m (5 ft); (bottom) distance 15 m (50 ft), height 4.5 m (15 ft). Site bias removed. .....................................................................................................F-8

xxiii
LIST OF TABLES
Table Page
Table 1. Five test sections.............................................................................................................. 4
Table 2. Post-overlay measurements: sound levels for each pavement type (SPBI*) by site pairs
with identical vehicle sets.** ...................................................................................... 26
Table 3. Post-overlay measurements: site differences due to type of pavement (SPBI* deltas) by
site pairs with identical vehicle sets.**....................................................................... 27
Table 4. Post-overlay measurements: for each vehicle type, site differences due to type of
pavement (Lveh* deltas) by site pairs with identical vehicle sets. ** ........................ 33
Table 5. Post-overlay measurements: for the test vehicle, site differences due to type of
pavement (average LAFmx deltas). Site bias removed.*.............................................. 42
Table C-1. Pre- and Post-overlay measurements: sound levels for each pavement type (Lveh) by site pairs with identical vehicle sets. Microphone location: distance 25 ft, height 5 ft. Vehicle type: automobile. ............................................................................................... C-2
Table C-2. Pre- and Post-overlay measurements: sound levels for each pavement type (Lveh) by site pairs with identical vehicle sets. Microphone location: distance 25 ft, height 5 ft. Vehicle type: medium truck............................................................................................ C-4
Table C-3. Pre- and Post-overlay measurements: sound levels for each pavement type (Lveh) by site pairs with identical vehicle sets. Microphone location: distance 25 ft, height 5 ft. Vehicle type: heavy truck. .............................................................................................. C-6
Table C-4. Pre- and Post-overlay measurements: sound levels for each pavement type (Lveh) by site pairs with identical vehicle sets. Microphone location: distance 50 ft, height 5 ft. Vehicle type: automobile. ............................................................................................... C-8
Table C-5. Pre- and Post-overlay measurements: sound levels for each pavement type (Lveh) by site pairs with identical vehicle sets. Microphone location: distance 50 ft, height 5 ft. Vehicle type: medium truck.......................................................................................... C-10
Table C-6. Pre- and Post-overlay measurements: sound levels for each pavement type (Lveh) by site pairs with identical vehicle sets. Microphone location: distance 50 ft, height 5 ft. Vehicle type: heavy truck. ............................................................................................ C-12
Table C-7. Pre- and Post-overlay measurements: sound levels for each pavement type (Lveh) by

List of Tables Caltrans Thin Lift Study
xxiv
site pairs with identical vehicle sets. Microphone location: distance 50 ft, height 15 ft. Vehicle type: automobile. ............................................................................................. C-14
Table C-8. Pre- and Post-overlay measurements: sound levels for each pavement type (Lveh) by site pairs with identical vehicle sets. Microphone location: distance 50 ft, height 15 ft. Vehicle type: medium truck.......................................................................................... C-16
Table C-9. Pre- and Post-overlay measurements: sound levels for each pavement type (Lveh) by site pairs with identical vehicle sets. Microphone location: distance 50 ft, height 15 ft. Vehicle type: heavy truck. ............................................................................................ C-18
Table D-1. Post-overlay measurements: sound levels for each pavement type (SPBI*) by site pairs with identical vehicle sets. Post-overlay pavements, including DGAC, aged 4, 10, 16, and 52 months. Site bias removed.** ...................................................................... D-2
Table D-2. Post-overlay measurements: sound levels for each pavement type (SPBI*) by site pairs with identical vehicle sets.** Post-overlay pavements, including DGAC, aged 4, 10, 16, and 52 months. .................................................................................................... D-3
Table D-3. Post-overlay measurements: site differences due to type of pavement (SPBI* deltas) by site pairs with identical vehicle sets. Post-overlay pavements, including DGAC, aged 4, 10, 16, and 52 months. Site bias removed.** .......................................................... D-11
Table D-4. Post-overlay measurements: site differences due to type of pavement (SPBI* deltas) by site pairs with identical vehicle sets.** Post-overlay pavements, including DGAC, aged 4, 10, 16, and 52 months. ..................................................................................... D-12
Table D-5. Baseline measurements: Site differences unrelated to type of pavement (SPBI* deltas)............................................................................................................................ D-20
Table E-1. Post-overlay measurements: sound levels for each pavement type (Lveh*) by site pairs with identical vehicle sets.** Post-overlay pavements, including DGAC, aged 4, 10, 16, and 52 months. .....................................................................................................E-3
Table E-2. Post-overlay measurements: for each vehicle type, site differences due to type of pavement (Lveh* deltas) by site pairs with identical vehicle sets. Post-overlay pavements, including DGAC, aged 4, 10, 16, and 52 months. Site bias removed.** ....E-5
Table 3. Post-overlay measurements: for each vehicle type, site differences due to type of pavement (Lveh* deltas) by site pairs with identical vehicle sets.** Post-overlay pavements, including DGAC, aged 4, 10, 16, and 52 months.........................................E-6
Table F-1. Post-overlay measurements: sound levels for each pavement type (average LAFmx for test vehicle). Post-overlay pavements, including DGAC, aged 4, 10, and 16 months. Site bias removed.*..........................................................................................................F-2

List of Tables Caltrans Thin Lift Study
xxv
Table F-2. Post-overlay measurements: sound levels for each pavement type (average LAFmx for test vehicle). Post-overlay pavements, including DGAC, aged 4, 10, and 16 months.*..........................................................................................................................................F-3
Table F-3. Post-overlay measurements: for the test vehicle, site differences due to type of pavement (average LAFmx deltas). Post-overlay pavements, including DGAC, aged 4, 10, and 16 months. Site bias removed.* ..........................................................................F-7

xxvi

1
1. INTRODUCTION
1.1 Background Quieter pavements have the potential to help reduce highway traffic noise, both at the
tire/pavement interface and through absorption of propagating sound. Several aspects of this
non-traditional method of noise abatement are currently being investigated in many parts of the
world;1 included are investigations of noise measurement methodologies, pavement design
parameters, quantification of noise reduction and its longevity, and introduction of pavement
influence into traffic noise prediction models. In California, the Department of Transportation
(Caltrans) would like to add quieter pavements to their noise abatement repertoire. Caltrans is
conducting several studies, using various measurement methodologies, to help determine the
amount and longevity of noise reduction for various types of quieter pavements and surface
treatments.
1.2 Study Overview On a 6.4-km (4-mi) stretch of a two-lane highway in Southern California (on LA138, northwest
of Lancaster, 130 km or 80 mi north of Los Angeles), several asphalt pavement overlays are
being examined over time to evaluate degradation of noise performance due to pavement
deterioration (referred to as Thin Lift Study). The pavements are being assessed for potential use
as noise abatement and to provide valuable information for the development of the Federal
Highway Administration’s Traffic Noise Model® (FHWA TNM),2,3,4,5 currently being evaluated
for the inclusion of pavement noise effects for a large range of pavement types. This model is
mandatory for use in determining noise impacts in the vicinity of highways and designing noise
abatement features, for projects receiving U.S. Federal aid.
For the Thin Lift Study, a total of five pavement sections are being evaluated, each having been
paved for the study (more details are provided in Section 2):
1. dense-graded asphaltic concrete (DGAC) of 30 mm (1 in) thickness;
2. open-graded asphaltic concrete (OGAC) of 75 mm (3 in) thickness;
3. OGAC of 30 mm (1 in) thickness;
4. rubberized asphaltic concrete, Type O (open) (RAC) of 30 mm (1 in) thickness; and

Introduction Caltrans Thin Lift Study
2
5. bonded wearing course (BWC) of 30 mm (1 in) thickness.
The DGAC serves as the reference pavement (typical of standard asphalt), to which all others are
compared.
The primary noise measurement methodology being applied to the work reported here was a
modified Statistical Pass-By Method (SPB);6 this method is used to determine the pavement
effects on wayside noise (noise adjacent to a highway). The SPB application was supplemented
with measurements of pavement sound absorption, applying a methodology that utilizes effective
flow resistivity.7 (Other methodologies, including On-Board Sound Intensity, are being applied
to the study, where results are also being reported.8) Wayside data were collected in all
pavement test sections simultaneously, allowing for direct comparisons of the reference section
to the other test sections. Measurements have been completed for the pavement aged up to 52
months.
Data were analyzed and are reported in terms of individual vehicle types (both broadband and
spectrally) and the SPB index, examining differences among the aging pavements.
1.3 Report Organization Following this introduction, Section 2 describes the measurement sites, including the pavement
types; Section 3 reviews the dates of data collection as well as procedures and methodologies;
Section 4 reviews the data analysis procedures; Section 5 provides study results and discussion
for the performance of the pavements, both overall, and for individual vehicle types; and Section
6 provides conclusions. Also included in this report are several appendices, to supplement the
related sections: Appendix A shows the measurement sites, Appendix B shows instrumentation
used in the study, Appendix C shows tables and plots for the vehicle pass-by data, Appendix D
shows tables and plots for the overall pavement performance, Appendix E shows tables and plots
for the pavement performance by vehicle type, and Appendix F shows results for the test vehicle.
References are listed at the end.

3
2. MEASUREMENT SITES
2.1 Site Locations
The location for the asphalt overlays and noise testing is on LA138 in Southern California (a
desert area about 32 km or 20 miles northwest of Lancaster and 130 km or 80 mi north of Los
Angeles) on a 6.4-kilometer (4-mi) stretch of roadway. (Please refer to Figure 1 and Figure 2.)
LA138 is a two-lane highway (one lane each direction), with a speed limit posted as 55 mph,
with relatively sparse traffic and a substantial percentage of heavy trucks (ADT 4000-5000).
The testing area of LA138 extends from station 101.16+00 to 180.00+00, from 230th St West to
0.2 km (0.12 mi) west of 180th St West (the eastern most part of the test area was not used for the
wayside noise testing).
Figure 1. LA138 pavement testing area map.

Measurement Sites Caltrans Thin Lift Study
4
Figure 2. LA138 pavement testing area photograph.
2.2 Five Test Sections In the LA138 test area, there are five main test sections. Each site (1-5) can be seen in Appendix
A. The sites and associated pavement types are listed in Table 1. Figure A-1 in Appendix A
shows the five pavements.
Table 1. Five test sections.
Pavement type Specified thickness
Specified maximum
aggregate size*
Measured % air void
content**
Site 1 (S1) (reference section)
Dense-graded asphalt concrete (DGAC)
(STA 101+16.60 to 108+00.00) 30 mm 12.5 mm (1/2
in) 9% center
Site 2 (S2) Open-graded asphalt concrete
(OGAC, 75 mm) (STA 108+00.00 to 120+00.00)
75 mm 12.5 mm (1/2 in) 12% center
Site 3 (S3) Open-graded asphalt concrete
(OGAC, 30 mm) (STA 120+00.00 to 148+00.00)
30 mm 12.5 mm (1/2 in) 15% center
Site 4 (S4) Rubberized asphalt concrete type O
(RAC Type O) (STA 148+00.00 to 168+00.00)
30 mm 12.5 mm (1/2 in) 12% center
Site 5 (S5) Bonded wearing course
(BWC) (STA 168+00.00 to 174+00.00)
30 mm 12.5 mm (1/2 in) 7 % center
Note: The shortest overlay covers a distance of 0.4 km (0.25 mi), where the total of all five sections span the 6.4-kilometer (4-mi) piece of LA138. * Pavement analyses show finer gradations than the standard specifications; actual gradations are similar and not listed here.9 ** Measured air void content in the center of the lane shows percentages lower than specified.9

Measurement Sites Caltrans Thin Lift Study
5
Prior to the May/June 2002 construction of the pavement overlays seen in Table 1 and Figure A-
1 in Appendix A, LA138 was treated with a leveling course of new DGAC (completed
December 2001). The DGAC leveling course is associated with the baseline set of
measurements described later in this report (noise measurements taken at each of the sites with
the same type of pavement, before the different overlays were constructed). The December
2001-constructed leveling course was determined to be necessary due to the poor pavement
condition;10 prior to the leveling course, the pavement type was DGAC estimated to be aged at
least 20 years. Although baseline wayside noise measurements were performed with the old
DGAC (referred to as preliminary measurements later in this report), analysis and results are not
reported here since baseline data were re-collected with the December 2001-constructed DGAC
leveling course.

6

Data Collection Caltrans Thin Lift Study
7
3. DATA COLLECTION
Wayside noise measurements were performed with existing traffic to help determine the noise
reduction over time for the four pavements as compared to DGAC. The methodologies applied
to this study are described first, followed by the specifications for the data collected and
instrumentation used, and lastly, the data collection sessions performed are listed by date and
pavement age.
3.1 Methodologies
3.1.1 Wayside vehicle pass-by noise For the wayside vehicle pass-by noise, data are collected in general conformance with the
Statistical Pass-By Method (SPB) standard, ISO 11819-1,6 where the number of
measurement locations is augmented and the data analysis is modified to meet the
requirements of this study (described in Section 4). Acoustical, meteorological, and
traffic speed and identification data are collected for each pavement overlay section
simultaneously, where microphones are deployed at multiple distances (from the center
of the near travel lane) and heights:
1. distance: 7.5 m (25 ft), height: 1.5 m (5 ft) above the ground (low), which ranged
from ~1.2-1.5 m (~4-5 ft) above the roadway surface, depending on the site;
2. distance: 15 m (50 ft), height: 1.5 m (5 ft) above the ground (low, FHWA-
recommended distance11);
3. distance: 15 m (50 ft), height: 4.5 m (15 ft) above the ground (high); and
4. at Sites 1 and 2, distance: 60 m (200 ft), height: 1.5 m (5 ft) above the ground
(low).
Figure 3 shows an illustration of the instrumentation set-up, and Figure 4 shows the
instrumentation deployed on one of the LA138 sites. Each of the sites was relatively flat
with mostly medium- to hard-packed dirt; there were occasional grasses and shrubs
(depending on the measurement session, some sites, usually Sites 3 and 4, had more
shrubs than the others). Other key factors of applying the SPB methodology to this study
are listed below the figures.

Data Collection Caltrans Thin Lift Study
8
Figure 3. Illustration of basic instrumentation set-up. (Not proportional or to scale)
Figure 4. Example of the deployed instrumentation.
Originally, it was thought that traffic flow could be recorded continuously, where the
average 5- to 15-minute sound level for each site could be determined. After the first
1
2
1
2
1 = 1 m icrophone at 5-ft height; on tripod
2= 1 person + incide nt log= 1 video camera;
on tripod
= 2 m icrophones, 1 at 5-ft height and 1 at 15-f t height; on 2 tripods
= 1 m et sensor at 5-ft height; on tr ipod
C altrans Pave m en t S tu dy : full se t-up
25 ft ___
50 ft ___
200 ft ___
100 ft ___
75 ft ___
1
2
1
Section 2(chosen section ; 75m m O GAC)
22
Section 1(re fe rence ; DG AC)
Section 3(30mm OG AC)
Section 4(30mm RAC)
Section 5(30mm BW C )
11 1
Data Collection Caltrans Thin Lift Study
9
set of measurements at the sites (preliminary measurements), it was determined that
the traffic on LA138 was too sparse to apply the continuous flow / sound level
averaging methodology. At that time, it was determined that the SPB methodology
would be more appropriate to measuring at the LA138 sites.
In addition to the SPB methodology, controlled pass-bys with a single vehicle (the
“test vehicle”) are measured at four different speeds at each of the 5 pavement sites.
The test vehicle is a Subaru Outback with Goodyear Aquatred 3 tires, provided and
operated by Illingworth and Rodkin, Inc. (the vehicle was on site for the primary
purpose of conducting On-Board Sound Intensity Measurements, and its secondary
purpose was to serve as a test vehicle for the pass-by measurements). Maximum
sound levels (average LAFmx) are extracted for these events and compared among the
5 pavement sites.
3.1.2 Sound absorption of pavement For measurements of the sound absorption of the pavement, data are collected in general
conformance with the Template Method for Ground Impedance standard, ANSI S1.18-
1999, one-parameter model, geometry A (uses a specified geometry for a source and two
microphones),7 where the effective flow resistivity (EFR, a measure of sound absorption
and a preliminary metric before obtaining acoustical ground impedance) table is
augmented to include a broader and finer range of values, and the data analysis is
modified to meet the requirements of this study. This methodology is still experimental
for the purposes of distinguishing types of pavements.
3.2 Data and Instrumentation Data were collected in all pavement test sections simultaneously, allowing for direct
comparisons of the reference section to the other test sections and also to observe the degradation
of noise benefits of individual sections over time (exception: measurements at Site 5 were
stopped after the pavement was aged 16 months; see section “Data Collection Sessions” for an
explanation). Microphones were deployed in multiple configurations, the set-up dependent on
the test section and the date of data collection. In addition to acoustical data collection,

Data Collection Caltrans Thin Lift Study
10
meteorological data, traffic composition and speed data, ground impedance (sound absorption),
event descriptions log, and extraneous noise log data were also acquired. After each set of
measurements, all data were analyzed.
Following is a list of each type of data that is collected, the procedure of collecting the data, the
primary instrumentation used, and the parameters of the data collected.
3.2.1 Acoustical data Acoustical data are collected at a distance of 7.5 m (25 ft) from the center of the highway
travel lane. Additional microphones (described later) are deployed to provide data at
FHWA-recommended positions11 and also to obtain a better understanding of the
tire/pavement noise farther from the vehicles. Data are recorded continuously with a
sound level meter or spectrum analyzer (and also captured with a DAT recorder) where
vehicle pass-by events are later extracted.
The acoustical data consists of continuous, 1-second time histories, along with the A-
weighted fast response maximum sound levels (LAFmx), using Type 1 sound level meters
and spectrum analyzers; data are also recorded to Digital Audio Tape (DAT).
Key factors of acoustical data:
- At each measurement site, three microphones are deployed (distance=25 ft,
height=5 ft; distance=50 ft, heights=5 and 15 ft), with an additional two
microphones (distance=200 ft, height = 5 ft) at Sites 1 and 2. The heights are
measured above the ground; there is some variation in the ground elevation
compared to the roadway elevations, so the actual heights above roadway vary by
about 1 ft.
- The primary acoustical instrumentation includes
o LDL Model 820 Sound Level Meters (some with frequency-weighting
circuits appropriate for use with B&K Model 4155 and 4189 microphones for
grazing incidence)
o LDL Model 2900 2-Channel Spectrum Analyzers

Data Collection Caltrans Thin Lift Study
11
o B&K Model 4155 and 4189 or GRAS Model 40AE ½-in Microphones
(make/model matched to the appropriate sound level meter)
o B&K Model 2671 Preamplifiers
o B&K Model WB 1372 Power Supplies
o B&K Model 0237 Foam Windscreens
o Sony Model TCD-D100 Digital Audio Tape (DAT) Recorders
- The sound level meters and spectrum analyzers are set up to continuously
measure A-weighted equivalent sound levels (Leq) in 1-second intervals. For the
sound level meters, the LAFmx values for each second of data are also available.
For the spectrum analyzers, one-third octave band data are stored. DAT
recordings allow for sound level meter or spectrum analyzer processing at a later
time.
- The acoustical data are recorded continuously for up to 6 hours per day, weather
permitting, with the exception of saving files in the spectrum analyzers every 2
hours and changing the DAT tapes after 4 hours. Occasionally, 7 hours of data
will be recorded. Three full days of data collection typically allow for the
adequate number of pass-by events for the SPB, paired measurement
methodology (described in Section 4.1).
- Prior to measurements, all microphone/sound level meter and spectrum analyzer
systems are time synchronized; then each is calibrated, and the electronic noise
floor is established. Each system is also calibrated at the end of each
measurement day to document sensitivity drift, if any.
3.2.2 Meteorological data Meteorological data are collected during all acoustical data collection. This includes
wind speed, wind direction, air temperature, and relative humidity. Data are recorded in
1-second intervals. (Acoustical data collected during wind speeds exceeding 5 m/s or 11
mph are eliminated during data processing.)

Data Collection Caltrans Thin Lift Study
12
Key factors of meteorological data:
- At each measurement site, with the exception of Site 2 (which is close to Site 1
and is equipped with a hand held wind anemometer), meteorological sensors are
deployed (distance=75 ft, height=5 ft).
- The primary meteorological instrumentation includes
o Qualimetrics Transportable Automated Meteorological Stations (TAMS)
o HP 200 LX Palmtop Computer
- The meteorological sensors are set up to continuously measure wind speed, wind
direction, air temperature, and relative humidity (among other parameters) in 1-
second intervals.
- The meteorological data are recorded during all acoustical data collection.
- Prior to measurements, all meteorological systems are time-synchronized with
the acoustical instrumentation.
3.2.3 Traffic data Highway traffic is recorded using a video camera (to minimize influence on drivers, such
as might be caused by the presence of a radar gun) at each site. The camera is close
enough to the roadway to allow identification of vehicles while viewing the videotape,
and far enough away to allow speed calculations; distinctive landmarks and the
associated separation distance are documented for speed calculation purposes. For the
October 2006 measurements, in addition to the video, a radar gun facing downstream was
used to obtain speeds at Site 4 (site farthest east in 2006 – traffic traveling from west to
east), so as not to influence driver behavior at any of the sites, while still allowing for the
validation of video-based speed measurements.
Key factors of traffic data:
- At each measurement site, video cameras are deployed (distances vary from
about 200-300 ft, height=5 ft). The variation in distance from the roadway is due
to the visibility of distinctive landmarks in the camera’s view.
- The primary traffic data instrumentation includes
o Sony 8-mm or Hi-8 Video Cameras

Data Collection Caltrans Thin Lift Study
13
o Television with VCR (for post-measurement processing)
- The video cameras are set up to continuously record all traffic that passes the
measurement sites.
- The traffic data are recorded during all acoustical data collection.
- Prior to measurements, all video cameras are time-synchronized with the
acoustical instrumentation.
3.2.4 Pavement data Pavement data are collected, including pavement temperature [which can possibly
influence tire/road noise by about -1 dB per 10° C (50° F), hotter being quieter1] and core
samples (to allow for later evaluation of the pavement – macro texture, porosity, etc.). In
addition, ground impedance measurements are performed in accordance with ANSI
S1.187 (data were collected only in 2001 and 2002). Pavement temperatures are collected
hourly.
Key factors of pavement data:
- At each measurement site, temperature guns (Extech Model 42520 IR
Thermometer) are used at least once an hour to determine and log the pavement
temperature.
- At least once a year, two core samples are extracted from each pavement section
to allow for post-measurement analysis of the pavement, including determining
the macro texture and the porosity. Note: These are the core samples that Volpe
participated in through 2003; other organizations gathered samples later, dates
unknown.
- When appropriate, acoustical impedance measurements are performed in
accordance with ANSI S1.18 to determine the effective flow resistivity (EFR) of
each pavement. The primary instrumentation used are two of the ½-in
microphones and a spectrum analyzer (as listed under Acoustical Data), a Larson
Davis SRC20 tone generator, and a driver feeding a long narrow tube to simulate
a point source.

Data Collection Caltrans Thin Lift Study
14
3.2.5 Pass-by event log and extraneous noise log data Individual vehicle pass-by events are evaluated in real time for acceptability using
observer logs at each site (additional acceptability tests conducted during post-analysis).
With computerized data logs the observer notes the description of each acceptable vehicle
pass-by event at each site; the observer listens for acoustical contamination from nearby
vehicles or other sources and follows general guidelines of identifying a clean event,
typically by allowing for 300 feet or 5 seconds of vehicle separation distance (more for
heavy trucks). (Note: Identification of clean pass-by events was in conformance with
ISO 11819-1, which includes the elimination of vehicles with atypical sounds.)
In the logs the vehicles are identified by type, where automobiles are vehicles with 2
axles, 4 tires, and generally < 4,500 kg or 9,900 lb (cars, pick-up trucks, and sports utility
vehicles); medium trucks are vehicles with 2 axles, more than four tires, and generally >
4,500 kg or 9,900 lb and < 12,000 kg or 26,400 lb; and heavy trucks are vehicles with 3
or more axles and generally > 12,000 kg or 26,400 lb. Buses and motorcycles are
identified but not included in this analysis due to low populations. The logs are also used
to identify extraneous noise events that may have contaminated the vehicle pass-by noise
measurements.
Key factors for pass-by event log and extraneous noise log data:
- At each measurement site, personnel operate an HP 200 LX palmtop computer
electronic log to identify all acceptable vehicle pass-by events (including the type
of vehicle, a brief description, and the time of the event) and to note the
description and time of any noise event that may have possibly contaminated the
acoustical data.
- Prior to measurements, all electronic logs are time-synchronized with the
acoustical instrumentation.
3.3 Data Collection Sessions There have been several wayside data measurement sessions: baseline measurements (both
preliminary and repeated) prior to the overlays being paved (to help determine potential site bias,

Data Collection Caltrans Thin Lift Study
15
i.e., differences among the sites due to parameters other than pavement, e.g., slight differences in
ground elevations) and four post-overlay measurements, with the pavement overlays aged 4, 10,
16, and 52 months. Each measurement session occurred over a period of several days and
included four to seven hours of continuous attended noise measurements simultaneously at each
site each day.
In collecting data at the LA138 sites, wind played a major role in determining the time of
year and number of days that would be required to collect useful data. Even with careful
consideration, the wind limited the amount of data collected (see Section 3.2.2 for wind
speed restrictions). For each measurement session, however, a minimum number of 300
pass-by events per site was achieved. Following is a list of the completed measurement
sessions:
Preliminary Measurements:
May 2001 – This set of measurements was performed with the existing old DGAC. It was
originally going to be used as the baseline set of measurements until it was determined by
Caltrans and University of California Pavement Research Center that the pavement was
structurally failing and would not support pavement overlays. 10 Also, at some of the sites,
cracks in the pavement acoustically contaminated the collected data.
For the May 2001 set of measurements, a continuous flow/sound level averaging
methodology was applied, and data were collected on both sides of the highway at 16
different sites, not all simultaneously (study was going to include more than 5 pavement
types). The data were collected for 7 days. Pass-by events were not logged since that type
of methodology was not being used. However, all other data were collected in a manner
similar to that for all subsequent measurements, and the 16 sites include the 5 sites measured
in subsequent measurements. Some of the May 2001 data could be used to extract vehicle
pass-by events if it is ever of interest to compare the very old DGAC to the newer overlays.
Baseline Measurements:
March 2002 – This set of measurements was performed with a new DGAC leveling course,

Data Collection Caltrans Thin Lift Study
16
aged approximately 3 months. The leveling course covered all pavement test sections,
where the original 16 sections were reduced to 5. For these measurements, the SPB
methodology was applied. The data were collected for 5 days. Over 600 vehicle pass-by
events were collected at each pavement site (this is a field count – during data analysis,
events are eliminated as described in that section). For this measurement trip, EFR data
were also collected. The March 2002 data allow for a direct comparison between sites, with
the variability of pavement removed.
Post-Overlay Measurements (4 sets as of April 2007):
October 2002 (beginning of October) – Aged ~4 Months – This set of measurements was
performed with 5 overlays covering the DGAC leveling course. The overlays were aged
approximately 4 months. Again, the SPB methodology was applied. The data were
collected for 4 days. Over 500 vehicle pass-by events were collected at each pavement site
(this is a field count – during data analysis, events are eliminated as described in that
section). For this measurement trip, EFR data were also collected.
March 2003 (end of March) – Aged ~10 Months – This set of measurements was performed
with the same 5 overlays. The overlays were aged approximately 10 months. Again, the
SPB methodology was applied. The data were collected for 2 days. Over 300 vehicle pass-
by events were collected at each pavement site (this is a field count – during data analysis,
events are eliminated as described in that section).
October 2003 (beginning of October) – Aged ~16 Months – This set of measurements was
performed with the same 5 overlays. The overlays were aged approximately 16 months.
Again, the SPB methodology was applied. The data were collected for 3 days. Over 500
vehicle pass-by events were collected at each pavement site (this is a field count – during
data analysis, events are eliminated as described in that section).
October 2006 (beginning of October) – Aged ~52 Months – This set of measurements was

Data Collection Caltrans Thin Lift Study
17
performed for 4 of the 5 overlays (excluded Site 5, BWCa). The overlays were aged
approximately 52 months. Again the SPB methodology was applied. The data were
collected for 3 days. Over 700 vehicle pass-by events were collected at each pavement site
(this is a field count – during data analysis, events are eliminated as described in that
section).
a Results out to the pavement age of 16 months indicated that BWC is not considered a quieter pavement as compared to DGAC. Due to this fact and to save on funds, Caltrans and the Volpe Center agreed to discontinue wayside measurements for Site 5, BWC.

18

19
4. DATA PROCESSING AND ANALYSIS
Upon capturing all of the data, processing and analysis for the acoustical, meteorological,
traffic, pavement temperature and EFR, pass-by event log, and extraneous noise log data are
performed. Thorough pavement analyses were performed by the University of California
Pavement Research Center; more information about the LA138 pavements can be found in
the UCPRC 2006 reference.9 Applying the SPB methodology to the current study is first
described followed by a section describing the data processing and analysis procedure.
4.1 SPB Methodology Applied to Thin Lift Study A modified SPB analysis is performed for each of the data sets. The result of applying the SPB
methodology is a single number called the Statistical Pass-By Index (SPBI), accounting for noise
from automobiles, medium trucks, and heavy trucks. Intermediate results for each vehicle type
(part of SPBI calculations) are also extracted. For the processing and analysis the following key
factors apply:
- The SPB “paired measurements” technique is applied: this technique employs the selection
of the same vehicles from the traffic stream as they pass each measurement site, improving
accuracy due to the elimination of differences in traffic composition. For determination of
the overall performance of the pavements, four pairs of sites are examined: Site 1 and Site 2,
Site 1 and Site 3, Site 1 and Site 4, and Site 1 and Site 5.
- The baseline set of data (March 2002) is used to determine site biases, without the influence
of pavement type. Differences in average baseline sound levels for each site pair are
calculated, determining each site bias, which is applied to the average post-overlay sound
levels.
- For the spectral sound level processing and analysis, the “paired measurement” technique is
extended to include all sites: analysis includes the exact same vehicle set for each site being
examined. Using identical vehicle sets reduces the number of pass-by events included in the
averages for the spectral levels. With this reduction in number of pass-by events and due to
the collection of fast response values (LAFmx), it was determined that site bias values could
not be considered in the spectral comparison. Therefore, spectral data are presented as
measured. (For the spectral results, sound levels for several pass-by events of the same
vehicle type are arithmetically averaged for each 1/3-octave band.)

Data Processing and Analysis Caltrans Thin Lift Study
20
- The speed category of interest for this study is “highway speeds”. The ISO 11819-1 standard
sets the minimum highway speed to be 100 km/h (~60 mph) for automobiles. For medium
and heavy trucks, the standard allows for unspecified lower speeds. Reviewing all of the
recorded traffic on LA138, it is clear that lower minimum speeds apply to the LA138 site,
and that many pass-by events (~15 %) would be forfeited if applying the ISO restriction. To
better capture the traffic on LA138 and use highway speeds that are more appropriate for the
U.S., the minimum automobile highway speed is dropped to ~90 km/h (55 mph); the
minimum medium and heavy truck speed is set at ~80 km/h (50 mph).
- In order to calculate the SPBI, the standard requires a minimum number of clean pass-by
events for each vehicle category: 100 for automobiles and 80 for combined medium and
heavy trucks, with a minimum of 30 medium trucks and a minimum of 30 heavy trucks.
These requirements are based on single measurements (as opposed to paired measurements,
which should allow the requirements to be relaxed). For the current study, minimum
requirements for the medium and heavy trucks were not always met, however, totals appear
to be adequate for a paired measurement analysis with the modified SPBI calculations.
Typically, 100 or more automobiles are included in each of the averages and 30 or more
heavy trucks (combined medium and heavy trucks numbers not always reaching the
minimum of 80); the baseline measurements yielded fewer pass-by events, although enough
to determine site biases.
- Calculating the SPBI first requires calculating the vehicle sound level (Lveh), which is
calculated for each vehicle type (automobiles, medium trucks, and heavy trucks). Lveh is a
representative (an “average”) sound level for a specific vehicle type for the highway speed
category. In the ISO 11819-1 standard, Lveh uses a regression through the accumulated
maximum sound level (LAFmx) data points for each vehicle type; a single number, Lveh, is
extracted from the regression line at a specified reference speed. It was determined that the
regression methodology breaks down when the minimum number of vehicle pass-bys is not
obtained or when speeds are off even by small amounts (there is error associated with
obtaining vehicle speeds, whatever the methodology/instrumentation). After a brief
investigation with LA138 data, it was determined that the linear arithmetic average of the
LAFmx data for all the events equaled the single value extracted from the regression line at the
reference speed (for data sets with the minimum number of events achieved). Thus, for the

Data Processing and Analysis Caltrans Thin Lift Study
21
current study, Lveh is obtained by taking the linear arithmetic average LAFmx of all events for
each vehicle category. A side benefit to obtaining Lveh in this manner is that it relaxes the
need for precise vehicle speeds. So, for the current study, where there are limitations to
obtaining precise speed data and where the SPB minimum numbers for events were
occasionally not met, the LAFmx averages were calculated for all events for highway speeds
greater than 90 km/h (55 mph) for automobiles and 80 km/h (50 mph) for medium and heavy
trucks (any pass-bys greater than 145 km/h or 90 mph were eliminated).
- The equation below is applied to calculate the SPBI.6 A modified SPBI is calculated using
the LAFmx averages as the Lveh variables in the equation. The vehicle mix ratios in the
equation are maintained as in the standard, and the speeds are updated to better represent
LA138 (approximate average speeds at the sites): 100 km/h (60 mph) for autos and 90 km/h
(55 mph) for medium and heavy trucks.
- ISO 11819-16 provides discussion of expected errors and uncertainty for the SPB method.
- The parameters calculated and presented for this study include the modified Lveh for each of
the three vehicle types and also the modified SPBI for highway speeds.
SPBI = 10*log[W1*10^(L1/10) + W2a*(v1/v2a)*10^(L2a/10) + W2b*(v1/v2b)*10^(L2b/10)], where SPBI = Statistical Pass-By Index, for a standard mix of light and heavy vehicles Lx = vehicle sound level for vehicle category x – refer to Section 3.2.5 for vehicle categories (average LAFmx for each vehicle type is applied; this differs from Lveh calculations in ISO 11819-1) Wx = weighting factor, which is the proportion of vehicle category x in the traffic (taken from Table 1 in ISO 11819-1) vx = reference speed of vehicle category x [60 mph (~100 km/h) for autos, 55 mph (~90 km/h) for medium and heavy trucks; reference speeds differ from those in Table 1 in ISO 11819-1]. 4.2 Processing Procedure
4.2.1 Modified SPBI and average vehicle sound level First, pass-by events are extracted from the vehicle pass-by event log for each site;
the vehicle type, description, and time are entered into a spreadsheet. Events are
eliminated where comments indicate that the event may not have been acceptable.

Data Processing and Analysis Caltrans Thin Lift Study
22
Events are also eliminated where sound levels 10 decibels down from the event
maximum sound level both before and after an event were not achieved (i.e., events
were eliminated when the vehicle pass-by event was acoustically influenced by
another sound source). Next, pass-by events are paired for each of the four site pairs;
only pass-by events that are described to be acoustically clean at both sites are
retained. Meteorological data are then extracted for each event for each site; the
average wind speed around each pass-by event (10 seconds before and after the
event) is calculated, and the maximum wind speed is extracted. Events with
maximum wind speeds exceeding 5 m/s (11.24 mph) are eliminated. Using the
remaining list of pass-by events, vehicle speeds are extracted from the videotapes
and entered into the spreadsheets with the corresponding pass-by events. If the
speeds are not in the same speed category for both sites for a site pair, the vehicle
pass-by event is eliminated. Finally LAFmx is determined for each remaining vehicle
pass-by event for each site. (Pavement temperatures are also entered for each event.)
The pass-by data can be seen in Appendix C. For each site pair, vehicle type,
microphone location, and pavement age, tables show the average pass-by LAFmx (also
shown graphically in Appendix E, Section 1) and standard deviation; the average
vehicle speed and standard deviation; and the average, maximum, and minimum
pavement and air temperatures. Plots show all the LAFmx data points with regression
lines and equations.
Calculations are then performed to obtain the modified SPBI. First, the data are
sorted into three vehicle categories: automobiles, medium trucks, and heavy trucks;
then the data are sorted into vehicle speed categories. Most of the events fall within
the highway speed category, and all remaining analysis is performed just for that
category. The average LAFmx is calculated for each vehicle category for each
pavement site; these averages are determined to be the modified vehicle sound levels
(modified Lveh). Then the ISO 11819-1 equation is used to calculate the SPBI.
The results that are reported are the average LAFmx (modified Lveh) for each of the
three vehicle types for each of the pavement sites (Appendix C and Appendix F,

Data Processing and Analysis Caltrans Thin Lift Study
23
Section 1). Also reported is the modified SPBI for each of the pavement sites
(Appendix E). Each of these parameters is calculated for each of the microphone
locations (except the 200-ft microphones).
4.2.2 Test vehicle The test vehicle data are included in the SPBI calculations if the event meets all the
criteria described above. In addition, the test vehicle data are separated from the
other data. The average LAFmx is calculated for each speed (40, 50, 60, and 70 mph;
~65, 80, 100, and 112 km/h) for each pavement site. These averages are plotted
across speed for comparison.
4.2.3 Existing traffic spectral data Spectral sound level data are also analyzed, including identical vehicle sets for each
site being examined. For this small set of vehicles, the LAFmx values and the spectral
data are examined for all microphones, including the microphones located at 200 ft
(60 m) at Sites 1 and 2.
4.2.4 Sound absorption of pavement For the pavement sound absorption data (effective flow resistivity, EFR), an average
sound level delta is determined for the two microphone positions in the
instrumentation set-up; this is determined for each of thirteen frequencies. Using a
table that matches deltas and frequencies to theoretically calculated ground
absorption curves (based on the ANSI S1.18-specified geometry), the EFR values are
extracted for each type of pavement. The table provided in the ANSI standard has
little resolution and excludes higher impedance surfaces. As such, a new table with
greater resolution was generated, and the effectiveness of this type of methodology
for determining differences in pavement surfaces is being evaluated. During this
evaluation process, it was determined that further analysis techniques (beyond those
in ANSI S1.18) are necessary to allow for extraction of EFR values related to various
pavement types. A “curve selecting” methodology was developeda; this method first
a Due to funding constraints, it was agreed between Caltrans and the Volpe Center that the EFR data captured for the LA138 study could be used in the FHWA TNM Pavement Effects Implementation Study. Starting in 2006,

Data Processing and Analysis Caltrans Thin Lift Study
24
examines peaks and dips in the absorption curves (and based on that, limits the
possible range of EFR values), then the method normalizes the data to better match
amplitudes (assuming cement concrete is 20,000 cgs rayls and old dense-graded
asphalt is 30,000 cgs rayls – these are acoustically hard, reflective ground surfaces),
and then matches amplitudes at specific frequencies. Preliminary results related to
this analysis technique are presented in the Results and Discussion section.
development of the EFR data analysis technique and assessment was funded by FHWA, and information to date from the FHWA study is included in this report.

25
5. RESULTS AND DISCUSSION
The Thin Lift (LA138) Study generates an extensive data set. The following results are included
in this section and corresponding appendices: 1) overall performance of the pavements over time,
compared to DGAC; 2) pavement performance by vehicle type, both broadband and spectral
examinations; 3) pavement performance for the test vehicle (broadband only); and 4) pavement
performance related to sound absorption of the pavement. There are some limitations to the
results presented, related to microphone positions and pavement age; each subsection will note
which results are being presented.
5.1 Overall Performance of Pavements The performance over time of each of the pavements tested compared to the DGAC of the same
age can be seen in Table 2 and Table 3. Table 2 shows the SPBI values and Table 3 shows the
differences or deltas between the SPBI values. An attempt was made to remove any site bias by
applying corrections determined with the baseline measurements – refer to Appendix D, Section
D.3 for more information on site bias corrections. In addition to the tables, Figure 5 shows the
SPBI deltas over time for just the 7.5 m (25 ft) microphone position (as an example); plots for
other microphone positions can be found in Appendix D, Section D.2. Plots of the SPBI values
over time can be found in Appendix D, Section D.1.
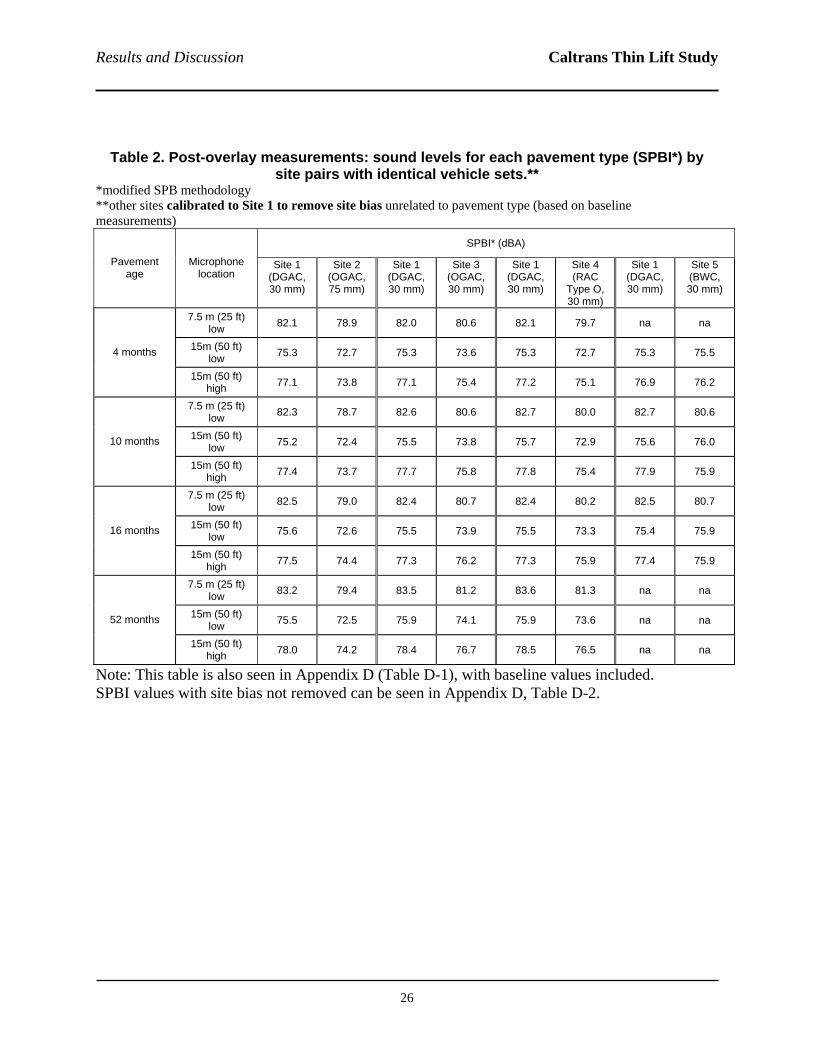
Results and Discussion Caltrans Thin Lift Study
26
Table 2. Post-overlay measurements: sound levels for each pavement type (SPBI*) by site pairs with identical vehicle sets.**
*modified SPB methodology **other sites calibrated to Site 1 to remove site bias unrelated to pavement type (based on baseline measurements)
SPBI* (dBA)
Pavement age
Microphone location
Site 1 (DGAC, 30 mm)
Site 2 (OGAC, 75 mm)
Site 1 (DGAC, 30 mm)
Site 3 (OGAC, 30 mm)
Site 1 (DGAC, 30 mm)
Site 4 (RAC
Type O, 30 mm)
Site 1 (DGAC, 30 mm)
Site 5 (BWC, 30 mm)
7.5 m (25 ft) low 82.1 78.9 82.0 80.6 82.1 79.7 na na
15m (50 ft) low 75.3 72.7 75.3 73.6 75.3 72.7 75.3 75.5 4 months
15m (50 ft) high 77.1 73.8 77.1 75.4 77.2 75.1 76.9 76.2
7.5 m (25 ft) low 82.3 78.7 82.6 80.6 82.7 80.0 82.7 80.6
15m (50 ft) low 75.2 72.4 75.5 73.8 75.7 72.9 75.6 76.0 10 months
15m (50 ft) high 77.4 73.7 77.7 75.8 77.8 75.4 77.9 75.9
7.5 m (25 ft) low 82.5 79.0 82.4 80.7 82.4 80.2 82.5 80.7
15m (50 ft) low 75.6 72.6 75.5 73.9 75.5 73.3 75.4 75.9 16 months
15m (50 ft) high 77.5 74.4 77.3 76.2 77.3 75.9 77.4 75.9
7.5 m (25 ft) low 83.2 79.4 83.5 81.2 83.6 81.3 na na
15m (50 ft) low 75.5 72.5 75.9 74.1 75.9 73.6 na na 52 months
15m (50 ft) high 78.0 74.2 78.4 76.7 78.5 76.5 na na
Note: This table is also seen in Appendix D (Table D-1), with baseline values included. SPBI values with site bias not removed can be seen in Appendix D, Table D-2.

Results and Discussion Caltrans Thin Lift Study
27
Table 3. Post-overlay measurements: site differences due to type of pavement (SPBI*
deltas) by site pairs with identical vehicle sets.** *modified SPB methodology ** other sites calibrated to Site 1 to remove site bias unrelated to pavement type (based on baseline measurements)
SPBI* delta (dBA) Pavement
age Microphone
location Site 2 – Site 1 (OGAC,
75 mm – DGAC)
Site 3 – Site 1 (OGAC,
30 mm – DGAC)
Site 4 – Site 1 (RAC Type O, 30 mm
– DGAC)
Site 5 – Site 1 (BWC,
30 mm – DGAC) 7.5 m (25 ft)
low -3.1 -1.5 -2.5 na
15m (50 ft) low -2.6 -1.7 -2.6 0.2 4 months
15m (50 ft) high -3.2 -1.7 -2.1 -0.7
7.5 m (25 ft) low -3.6 -2.0 -2.6 -2.1
15m (50 ft) low -2.8 -1.8 -2.7 0.4 10 months
15m (50 ft) high -3.6 -1.9 -2.4 -2.0
7.5 m (25 ft) low -3.5 -1.7 -2.3 -1.8
15m (50 ft) low -2.9 -1.5 -2.2 0.5 16 months
15m (50 ft) high -3.1 -1.1 -1.4 -1.5
7.5 m (25 ft) low -3.8 -2.4 -2.3 na
15m (50 ft) low -3.0 -1.7 -2.3 na 52 months
15m (50 ft) high -3.8 -1.7 -2.0 na
Average (all locations, all time) -3.3 -1.7 -2.3 -0.9
Note: Decibel values show in Table 3 may not agree with the source data in Table 2 due to rounding. A slightly modified version of this table is seen in Appendix D (Table D-3), with baseline values included. SPBI deltas with site bias not removed can be seen in Appendix D, Table D-4.

Results and Discussion Caltrans Thin Lift Study
28
Pavement Effects Compared to DGAC (ages 4, 10, 16, & 52 months)microphone distance: 25 ft, height: 5 ft
-6
-5
-4
-3
-2
-1
0
1
2
0 10 20 30 40 50 60
Pavement Age (months)
SPB
I* D
elta
, Sx-
S1 (d
BA
)
OGAC 75mm OGAC 30mmRAC Type O BWC
*modif ied SPBI methodology
0
Figure 5. Pavement effects compared to DGAC (Site x minus Site 1) using modified SPBI
(limited data for BWC). Microphone location: distance 7.5 m (25 ft), height 1.5 m (5 ft).
Note: This plot can also be seen in Appendix D, Figure D-12. Refer to Figures D-13 and D-14
for the other two microphone positions.
As can be seen in Table 3 and Figure 5, the SPB results (with the modified SPB methodology)
indicate that, over a 52-month period, OGAC 75 mm is the quietest pavement, with the average
benefit over DGAC being 3.3 dBA, benefit ranging from 2.6-3.8 dBA, variation depending on
microphone position and pavement age. Observation on microphone position variation: the low
microphone at the 15-m (50-ft) position shows the least benefit. For each microphone position,
the benefit varies only slightly over time (< 1 dBA).
The second quietest pavement is RAC Type O 30 mm, where the average benefit over DGAC is
2.3 dBA, benefit ranging from 1.4-2.7 dBA, variation depending on microphone position and
pavement age. Observation on microphone position variation: all microphone positions show
approximately the same benefit, with the exception of the 15-m (50-ft) high microphone with the

Results and Discussion Caltrans Thin Lift Study
29
pavement aged 16 months. For each microphone position, the benefit varies only slightly over
time (≤ 1 dBA).
The third quietest pavement is OGAC 30 mm, where the average benefit over DGAC is 1.7 dBA,
benefit ranging from 1.1-2.4 dBA, variation depending on microphone position and pavement
age. Observation on microphone position variation: the two 15-m (50-ft) microphone positions
often show almost the exact same benefit (except for the pavement aged 16 months). For each
microphone position, the benefit varies only slightly over time (< 1 dBA).
The final pavement, BWC 30 mm, is actually louder than DGAC for one of the microphone
positions, where the average benefit over DGAC is 0.9 dBA, “benefit” ranging from -0.5 (no
benefit) to 2.1 dBA, variation depending on microphone position and pavement age.
Observation on microphone position variation: although the BWC sometimes shows about a 2-
dBA benefit at the 7.5-m (25-ft) and high 15-m (50-ft) positions, there is no indication of a
benefit at the low 15-m (50-ft) position. For each microphone position, the benefit varies some
over time (< 2 dBA). The BWC 30 mm at Site 5 should not be considered a quieter pavement.
As mentioned, the pavement benefits do vary somewhat by microphone position (although
general trends are the same), and different observations were made for each pavement type.
Possible contributions to the variation include: differences in angle of reflection off pavement,
differences in the ground effect during propagation, and possible differences in meteorological
effects during propagation, although care was take to minimize the meteorological effects. This
aspect of the study should be further investigated; results could affect future guidance on
microphone placement for wayside tire/pavement noise measurements.
It should be noted that the modified SPBI values (not the deltas) show a general trend of slightly
increasing over time for all pavements types except BWC (data not available to identify trends
for this pavement type). Please refer to Figure 6 as an example (also found in Appendix D,
Figure D-5), which shows the increase in SPBI values over time, as compared to values at four
months, for the 7.5-m (25-ft) position (plots for the other microphone positions are found in
Appendix D, Figures D-6 and D-7). Although there is variation by microphone position, DGAC

Results and Discussion Caltrans Thin Lift Study
30
increases approximately 1.5 dBA over 52 months. OGAC 75 mm increases approximately 0.5
dBA. OGAC 30 mm increases approximately 1.5 dBA. RAC Type O increases approximately
1.5 dBA. Because there are only slight sound level increases for test and reference pavements,
the SPBI deltas are fairly consistent over time. However, because the increase in SPBI values
for each of the test pavements can vary from DGAC, the SPBI deltas can be slightly affected. As
an example, for the 7.5-m (25-ft) position, Figure 6 shows that DGAC increases over time more
than both the OGAC pavements. This is reflected in the Figure 5 SPBI delta plot, where it is
seen that the deltas (the benefits) for the OGAC pavements increase slightly at 52 months.
Measurements taken beyond the age of 52 months would help to further determine trends related
to age, both for the SPBI values and the deltas (benefit over DGAC).
Increase in SPBI* Values over Time (ages 4, 10, 16, & 52 months)microphone distance: 25 ft, height: 5 ft
-4
-3
-2
-1
0
1
2
3
4
0 10 20 30 40 50 60
Pavement Age (months)
SPB
I* In
crea
se o
ver V
alue
at 4
Mon
ths
(dB
A)
DGAC OGAC 75mm OGAC 30mmRAC Type O BWC
*modified SPBI methodology
0
Figure 6. Increase in SPBI* values over time, as compared to values at 4 months. Microphone location: distance 7.5 m (25 ft), height 1.5 m (5 ft).
Note: This plot can also be seen in Appendix D, Figure D-5. Refer to Figures D-6 and D-7 for
the other two microphone positions.

Results and Discussion Caltrans Thin Lift Study
31
5.2 Pavement Performance by Vehicle Type The pavement performance by vehicle type is presented in terms of both broadband and spectral
sound levels.
5.2.1 Broadband examination For this examination, the average LAFmx values for automobiles (autos), medium trucks
(med trucks), and heavy trucks (hvy trucks) are considered. Table E-1 in Appendix E
shows the average LAFmx values. The baseline values are used to remove site bias, then
each of the test pavements is compared to the DGAC (Site 1); the average differences or
deltas between the test pavements and DGAC can be seen in Table 4.
As shown in Table 4, the noise benefit relative to the reference DGAC of the same age,
listed in order of the best performance (considering pavement benefits as average over all
microphone locations and time), is as follows: 1. OGAC 75 mm: 3.7 dBA for autos, 3.1 dBA for med trucks, and 3.0 dBA for hvy trucks;
2. RAC 30 mm: 3.5 dBA for autos, 2.0 dBA for med trucks, and 1.3 dBA for hvy trucks;
3. OGAC 30 mm: 2.6 dBA for autos, 1.2 dBA for med trucks, and 1.2 dBA for hvy trucks; and
4. BWC 30 mm: 0.4 dBA for autos, 0.4 dBA for med trucks, and 1.1 dBA for hvy trucks.
It should be noted that the order of performance is the same for all vehicle types. It
should also be noted that there is a greater benefit for automobiles than for medium or
heavy trucks, except in the case of the BWC (Site 5). Lastly, it should be noted that the
difference in benefit comparing automobiles to either medium or heavy trucks is not
consistent among pavement types; for example, the difference in average benefit between
automobiles and heavy trucks for OGAC 75 mm is 0.7 dBA, and the difference for RAC
30 mm is 1.4 dBA. This indicates that some pavements can reduce noise about the same
amount for both automobiles and heavy trucks, where as other pavements see more of a
disparity in reduction between vehicle types.
Figure 7 shows the average difference between the four test pavements and the reference
DGAC (of the same age) at the 7.5 m (25 ft) position for automobiles and heavy trucks

Results and Discussion Caltrans Thin Lift Study
32
(results for the other microphone positions can be seen in Appendix E, Figures E-2 and
E-3). As with Table 4, Figure 7 also indicates that the noise benefit provided by each of
the test pavements is greater for automobiles than for heavy trucks (exception being
BWC). This is also indicated for each of the other microphone positions and also when
site bias is not considered. Table 4 and Figure 7 also indicate that increasing the
thickness of the OGAC layer provides additional benefit for both automobiles and heavy
trucks. In addition, rubberized asphalt seems to provide additional benefit for
automobiles, when comparing the OGAC and RAC of the same thickness.
Such results can be considered when choosing or designing a pavement for highways.
When targeting a highway with a low percentage of heavy truck traffic, 30 mm of RAC
Type O may be almost as effective as 75 mm of OGAC; however, when heavy trucks are
dominant, 75 mm of OGAC should reduce the traffic noise more than 30 mm of RAC
Type O.

Results and Discussion Caltrans Thin Lift Study
33
Table 4. Post-overlay measurements: for each vehicle type, site differences due to type of pavement (Lveh* deltas) by site pairs with identical vehicle sets. ** *modified SPB methodology **other sites calibrated to Site 1 to remove site bias unrelated to pavement type (based on baseline measurements)
Modified Lveh* (or average LAFmx) delta (dBA)
Site 2 – Site 1 (OGAC,
75 mm – DGAC)
Site 3 – Site 1 (OGAC,
30 mm – DGAC)
Site 4 – Site 1 (RAC Type O, 30 mm
– DGAC)
Site 5 – Site 1 (BWC,
30 mm – DGAC)
Pavement age
Microphone location
auto med truck
hvy truck
auto med truck
hvy truck
auto med truck
hvy truck
auto med truck
hvy truck
25 ft (7.5 m) low -3.7 -2.9 -3.0 -2.2 -0.6 -1.2 -3.5 -2.0 -1.7 na na na
50 ft (15 m) low -3.1 -2.4 -2.4 -2.3 -0.5 -1.6 -4.0 -2.3 -1.3 0.5 1.0 0.0 4 months
50 ft (15 m) high -4.0 -3.4 -2.5 -2.7 -0.6 -0.9 -3.3 -1.7 -1.1 0.0 0.4 -1.0
25 ft (7.5 m) low -3.9 -3.3 -3.6 -2.8 -2.4 -1.5 -3.6 -2.6 -1.8 -1.7 -1.6 -2.3
50 ft (15 m) low -3.0 -2.6 -2.7 -2.4 -1.6 -1.5 -3.6 -3.2 -1.6 0.7 -0.3 0.4 10 months
50 ft (15 m) high -4.2 -3.9 -3.0 -2.6 -2.0 -0.9 -3.4 -1.8 -1.6 -0.9 -1.3 -2.3
25 ft (7.5 m) low -4.1 -3.0 -3.4 -2.7 -1.0 -1.4 -3.6 -2.2 -1.4 -1.8 -1.1 -1.9
50 ft (15 m) low -3.6 -2.7 -2.7 -2.1 -0.4 -1.4 -3.7 -2.6 -0.8 0.7 0.3 0.4 16 months
50 ft (15 m) high -3.7 -2.9 -2.5 -2.4 -0.2 0.0 -2.8 -1.0 -0.4 -0.8 -0.8 -1.6
25 ft (7.5 m) low -3.6 -3.3 -4.0 -2.9 -2.1 -2.1 -3.0 -1.6 -1.8 na na na
50 ft (15 m) low -3.1 -2.6 -2.9 -2.7 -1.3 -1.4 -3.9 -2.2 -1.0 na na na 52 months
50 ft (15 m) high -4.0 -4.4 -3.4 -2.8 -2.0 -0.6 -3.1 -1.2 -1.1 na na na
Average (all locations, all time) -3.7 -3.1 -3.0 -2.6 -1.2 -1.2 -3.5 -2.0 -1.3 -0.4 -0.4 -1.1
Note: A slightly modified version of this table is seen in Appendix E (Table E-2), with baseline values included. Lveh deltas with site bias not removed can be seen in Appendix E, Table E-3.

Results and Discussion Caltrans Thin Lift Study
34
Pavement Effects Compared to DGAC, by Vehicle Type (post-overlay, ages 4, 10, 16, & 52 months)
microphone distance: 25 ft, height: 5 ft
-10.0
-9.0-8.0
-7.0-6.0
-5.0-4.0
-3.0-2.0
-1.00.0
1.02.0
3.04.0
5.0
Ave
rage
Lm
ax D
elta
, Sx-
S1 (
dBA
)
auto 04 mo auto 10 mo auto 16 mo auto 52 moHT 04 mo HT 10 mo HT 16 mo HT 52 mo
OGAC 75 mmSite 2
OGAC 30 mmSite 3
RAC Type OSite 4
BWCSite 5
0.0 auto HT auto HT auto HT auto HT
*modif ied SPBI methodology
Figure 7. Pavement effects compared to DGAC (Site x minus Site 1) for autos and heavy trucks using modified SPBI.* Microphone location: distance 7.5 m (25 ft), height 1.5 m (5
ft).
Note: This plot can also be seen in Appendix E, Figure E-1.
5.2.2 Spectral examination For this examination, averages of LAFmx spectral data by vehicle type are considered; the
vehicle types examined here are automobiles and heavy trucks. The spectral data can be
examined in several different ways, each providing a useful perspective, including: 1)
comparing different pavements for a single pavement age and single microphone
location; 2) comparing different pavement ages for a single pavement and single
microphone location; and 3) comparing different microphone locations for a single

Results and Discussion Caltrans Thin Lift Study
35
pavement and pavement age. Data for all these scenarios are presented as plots in
Appendix E. This data set has not been adjusted for site bias and includes far fewer data
points than the average LAFmx data (broadband) discussed in the previous sub-section.
Presented first is an example of the first scenario: comparing different pavements for a
single pavement age and single microphone location. Figure 8 shows the A-weighted
measured 1/3-octave band levels for the reference DGAC pavement and the four test
pavements at the 7.5-m (25-ft) position for the pavement aged 16 months, for
automobiles and heavy trucks. Please refer to Appendix E, Figures E-4 through E-18 for
all microphone positions and pavement ages.
The top plot in Figure 8 shows the spectral levels for automobiles. It indicates that the
quieter pavements provide noise benefits in a critical range around 1000 Hz; for the
DGAC (Site 1), ~70% of the energy is in the 800-1600 Hz range, where the quieter
pavements are showing a noticeable reduction (except BWC). The additional thickness
for the OGAC (Site 2) provides additional benefit (over Site 3) for frequencies greater
than or equal to 1000 Hz. Also the rubberized pavement (Site 4) seems to provide
additional benefit over the open-graded of equal thickness (Site 3) at the most dominant
frequency, 1000 Hz. The BWC (Site 5) provides no noticeable benefit.
The bottom plot in Figure 8 shows the spectral levels for heavy trucks. It indicates that
the quieter pavements provide noise benefits in a critical range around 1000 Hz; for the
DGAC, ~60% of the energy is in the 630-1600 Hz range, where the quieter pavements

Results and Discussion Caltrans Thin Lift Study
36
are showing a noticeable reduction. The frequency of 500 Hz is also a critical frequency
for heavy trucks (~17% of the total energy for DGAC), where very little reduction is seen
due to the quieter pavement types. As with the automobiles, the additional thickness for
the OGAC provides additional benefit for frequencies greater than or equal to 1000 Hz.
Again the rubberized pavement is providing additional benefit over the open-graded of
equal thickness at 1000 Hz, but this is not the most dominant frequency for heavy trucks
(there is some benefit with rubberized at 500 Hz). The BWC provides a small benefit at
frequencies 630 Hz and up.
Results for other microphone positions and pavement ages are similar. Some variation
occurs with the range of 1/3-octave bands affected. For example, the lower 1/3-octave
band for the range of benefit of the thicker OGAC over the thinner one can range from
800 Hz to 1250 Hz. Also, the benefit of RAC over OGAC of the same thickness can
show an effect above 1000 Hz.
It should also be noted that a trend is seen when considering the benefits of pavement as
a function of distance. In Appendix E, Figures E-7, E-11, and E-15 show the results for
DGAC and the thick OGAC at the 60-m (200-ft) distance, each figure representing a
different pavement age. In the plots for both automobiles and heavy trucks, it can be seen
that some lower frequencies that were contributing little, if any, to the overall sound level
closer to the road, are now within 10 dBA of the dominant frequency, and are
contributing to the overall sound level. These lower frequencies see little, if any, benefit
due to the quieter pavement. To demonstrate the distance effect and lower frequency

Results and Discussion Caltrans Thin Lift Study
37
contributions, an example is described here: for the pavement aged 4 months, the benefit
of OGAC over DGAC at a distance of 7.5 m (25 ft) is 3.3 dBA for automobiles and 2.3
dBA for heavy trucks (broadband). At a distance of 60 m (200 ft), the benefit is 2.5 dBA
for automobiles and 1.1 dBA for heavy trucks. So the benefit for automobiles has
reduced 1.0 dBA over 52.5 m (175 ft), and the benefit for heavy trucks has reduced 1.4
dBA over 52.5 m (175 ft).

Results and Discussion Caltrans Thin Lift Study
38
10
20
30
40
50
60
70
80
10 100 1000 10000
Frequency (Hz)
Ave
rage
LA
max
(dB
A)
Site 1Site 2Site 3Site 4Site 5
10
20
30
40
50
60
70
80
10 100 1000 10000
Frequency (Hz)
Ave
rage
LA
max
(dB
A)
Site 1Site 2Site 3Site 4Site 5
Figure 8. Spectral data for automobiles (top) and heavy trucks (bottom) on four different
pavement types. Post-overlay results, all pavements aged 16 months. Microphone location: distance 25 ft, height 5 ft.

Results and Discussion Caltrans Thin Lift Study
39
The second scenario, comparing different pavement ages for a single pavement and
single microphone location, is presented in Appendix E, Figures E-19 through E-23. For
automobiles, trends based on pavement age appear to be microphone location dependent
(for all but the DGAC, which does not show clear trends). For the 7.5-m (25-ft) location,
frequencies from about 400 to 1000 Hz get louder with age. For the 15-m (50-ft)
locations, there is some increase in sound level below 1000 Hz, but frequencies above
1000 Hz also get louder with age. For heavy trucks, no aging trends can be identified.
Further investigations are necessary to extract meaning from these trends or lack of
trends.
The third scenario, comparing different microphone locations for a single pavement and
pavement age, is presented in Appendix E, Figures E-24 through E-28. These plots show
how the spectral shape evolves through propagation. The lower frequencies (below 1000
Hz) become more important to the overall sound level, as discussed in the first scenario.
The spectral content should be considered when choosing or designing a pavement
for highways. In this study, critical differences among the quieter pavements start
around 1000 Hz, although benefits for all pavements affect lower frequencies, in many
cases, down to about 630 Hz. Thicker layers of both OGAC and RAC should be
investigated to determine if the benefit due to thickness can expand down to 500 Hz,
which would help reduce heavy truck noise.

Results and Discussion Caltrans Thin Lift Study
40
5.3 Pavement Performance for Test Vehicle The test vehicle data are included in the SPBI calculations if the event meets all the criteria
previously described. In addition, the test vehicle data are separated from the other data.
The average LAFmx is calculated for each speed (~65, 80, 100, and 112 km/h; 40, 50, 60, and
70 mph) for each pavement site. The microphone positions analyzed are the low and high
microphones at 15 m (50 ft). The data sets analyzed are for the pavements aged 4 months,
10 months, and 16 months (52 months excluded).
Test vehicle LAFmx values can be found in Appendix F, Tables F-1 and F-2, F-1 showing the
site-bias-removed data and F-2 showing the average measured data. Figure 9 shows an
example of the test vehicle results for the four different speeds [pavement aged 16 months,
15-m (50-ft) low microphone position]; similar plots for the other pavement ages and the
higher 15-m (50-ft) microphone position are found in Appendix A, Section F.1. The general
trend is that OGAC 75 mm is the quietest pavement, followed by RAC Type O 30 mm,
OGAC 30 mm, BWC 30 mm, and then DGAC, considering both microphone positions and
the other data sets (other pavement ages).

Results and Discussion Caltrans Thin Lift Study
41
Test Vehicle (Subaru)pavement age: 16 months; microphone distance: 50 ft, height: 5 ft
55
60
65
70
75
30 35 40 45 50 55 60 65 70 75
vehicle speed (mph)
Ave
rage
Lm
ax (d
BA
)
S1, DGAC S2, OGAC 75 mm S3, OGAC 30 mm S4, RAC 30 mm S5, BWC 30 mm
Figure 9. Test vehicle average LAFmx values for pavement aged 16 months, multiple
speeds. Microphone position: distance 15 m (50 ft), height 1.5 m (5 ft). Site bias removed.
Data are presented in Table 5 as average LAFmx differences (Site x minus Site 1) over time
(both measured and site-bias-removed LAFmx values can be found in Appendix F, Tables F-2
and F-1, respectively). The figures that follow present samples of the data. Figure 10 shows
the average LAFmx differences (deltas) (Site x minus Site 1) for only the 16-month old
pavements, for the low 15-m (50-ft) position, for 60 mph (plot for high position can be seen
in Appendix F, Figure F-4). For all results, site bias has been removed by applying the
differences found with the baseline measurements.
Table 5 and Figure 10 again show the general trend that OGAC 75 mm is the quietest
pavement, followed by RAC Type O 30mm, OGAC 30 mm, BWC 30 mm, and then DGAC.
Table 5 shows that the benefit of OGAC 75 mm over the DGAC ranges from 2.7-4.9 dB(A),
OGAC 30 mm over the DGAC ranges from 1.1-3.5 dB(A), RAC over the DGAC ranges
from 2.5-5.0 dB(A), BWC over the DGAC ranges from -0.2 (no benefit) to 1.5 dB(A),

Results and Discussion Caltrans Thin Lift Study
42
where the benefits vary over microphone position, speed, and time.
Table 5. Post-overlay measurements: for the test vehicle, site differences due to type of
pavement (average LAFmx deltas). Site bias removed.* **other sites calibrated to Site 1 to remove site bias unrelated to pavement type (based on baseline measurements of test vehicle)
Average LAFmx delta (dBA)
Site 2 – Site 1 (OGAC,
75 mm – DGAC)
Site 3 – Site 1 (OGAC,
30 mm – DGAC)
Site 4 – Site 1 ( RAC type O, 30 mm –
DGAC)
Site 5 – Site 1 ( BWC,
30 mm – DGAC)
Speed (mph)
Pave-ment age
Micro-phone
location
40 50 60 70 40 50 60 70 40 50 60 70 40 50 60 70
50 ft (15 m) low -3.4 -3.1 -3.3 -2.7 -3.5 -3.1 -2.4 -1.8 -3.9 -4.4 -3.2 -3.1 -1.3 -1.0 -0.8 -0.3 4
months 50 ft (15 m) high -3.6 -3.9 -4.8 -4.2 -2.5 -2.2 -2.9 -1.8 -4.0 -3.4 -4.0 -4.0 -0.9 -0.6 -0.8 -0.2 50 ft (15 m) low -3.4 -3.6 -3.6 -3.6 -2.4 -2.9 -1.1 -1.8 -2.8 -4.3 -2.5 -3.3 -1.3 -1.4 -0.3 -0.1 10
months 50 ft (15 m) high -3.7 -4.5 -4.7 -4.9 -2.0 -2.4 -1.8 -2.8 -4.0 -3.5 -3.5 -5 -1.4 -0.8 -0.7 -0.8 50 ft (15 m) low -4.2 -4.5 -3.9 -3.8 -2.3 -2.1 -1.7 -1.8 -3.1 -3.3 -3.1 -3.2 0.0 -0.2 -1.1 0.2 16
months 50 ft (15 m) high -3.7 -4.5 -4.5 -4.3 -1.8 -2.0 -2.2 -2.0 -3.8 -2.7 -3.8 -4.4 -0.6 0.1 -1.5 -0.5
Average (both locations, all time) -3.7 -4.0 -4.1 -3.9 -2.4 -2.5 -2.0 -2.0 -3.6 -3.6 -3.4 -3.8 -0.9 -0.7 -0.9 -0.3
Average (both locations, all time,
all speeds) -3.9 -2.2 -3.6 -0.7
Note: A slightly modified version of this table is seen in Appendix F (Table F-3), with baseline values included.

Results and Discussion Caltrans Thin Lift Study
43
Test Vehicle (Subaru)60 mph; microphone distance: 50 ft, height: 5 ft
-6
-5
-4
-3
-2
-1
0
1
2
0 2 4 6 8 10 12 14 16 18
pavement age (months)
Ave
rage
Lm
ax D
elta
(Sx-
S1) (
dBA
)
S2, OGAC 75 mm S3, OGAC 30 mm S4, RAC 30 mm S5, BWC 30 mm
Figure 10. Test vehicle average LAFmx deltas (Site x minus Site 1) for pavement ages 4 months, 10 months, and 16 months, 100 km/h (60 mph). Microphone position: distance
15 m (50 ft), height 1.5 m (5 ft). Site bias removed.
5.4 Pavement Performance Related to Sound Absorption The sound absorption of the pavements tested on LA138 is being examined in terms of the
effective flow resistivity (EFR), data collection and analysis briefly described in previous
sections. This section expands more on the data analysis process in addition to the results, since
the process evolved as results were obtained.
Initial investigations using data from LA138 and other locations determined that the original
ANSI S1.18 methodology provided reasonable values for extreme ground surfaces. For
example, the differences between lawn and cement concrete were readily apparent: lawn is
associated with an EFR value of 300 cgs rayls, and cement concrete is associated with an EFR
value of 20,000 cgs rayls. Based on the success with extreme ground types, the standard was

Results and Discussion Caltrans Thin Lift Study
44
expanded upon to include finer resolution and greater range in the potential EFR values (ANSI
S1.18 is very limited in this aspect because it was likely not intended to be sensitive to similar
ground types). New EFR deltas/curves were calculated for EFR values of 100 to 20,000 cgs
rayls in steps of 100 and 20,000 to 30,000 cgs rayls in steps of 2000.
The Volpe data (that from LA138 and other data Volpe has collected) were then analyzed again
using the new EFR curves. Although it was possible to extract EFR values for extreme ground
types, sensitivity in the pavement range was still not possible. Upon further investigation of the
theoretical and measured curves, it was seen that the measured amplitudes do not match the
theoretical amplitudes, so reasonable curve matching was not possible. Based on this
information, it was determined that the analysis methodology needed to be adapted to allow for
the extraction of EFR values related to various pavement types. (The new “curve selecting”
analysis methodology is described in the Data Analysis section.)
Applying the curve selecting methodology to the measured data, reasonable EFR values for
various pavement types were extracted:
Pavement type
Sidewalk (cement
concrete) Old DGAC New DGAC
(30mm thick) New OGAC (30mm thick)
New RAC (30mm thick)
New OGAC (75mm thick)
EFR value [cgs rayls, g/(s·cm3) or (kPa·s)/m2]
20000 30000 12200 9800 7400 7200
These values are characterized as reasonable because: 1) absorptive pavement can very likely be
just as absorptive as hard packed soil (or a dirt road), which has a published EFR value of 5,000
cgs rayls; and 2) the order of EFR values from highest to lowest corresponds with the order of
modified SPBI levels (loudest to quietest) for the new LA138 pavements.
In order to fully assess the accuracy of the EFR method and results, the measured and calculated
values need to be validated. The validation is being done as part of the FHWA TNM Pavement
Effect Implementation Study; information from the FHWA study will be made available as it
progresses.

45
6. CONCLUSIONS
The research conducted in Caltrans Thin Lift (LA138) Study provides: 1) information for
ranking the tested asphalt pavements according to noise reduction capabilities; 2) sound level
information on a broadband and spectral basis, by vehicle type, to help determine appropriate
applications for the pavements tested and to help design quieter pavements; and 3) data that may
be used to include or help validate pavement effects in traffic noise predictions.
Results from the study indicate that applying a quieter pavement overlay can reduce wayside-
measured sound levels.a The amount of reduction is vehicle-type dependent, and the relative
noise reduction is maintained over 52 months when comparing test pavements and the reference
pavement of the same age; although the noise reduction is maintained when comparing
pavements of the same age, each of the pavements tested shows some deterioration in noise
benefit as it ages (up to 1.5 dBA, depending on pavement type, over 52 months).
Of the pavements examined, the OGAC 75 mm thickness provides the greatest noise benefit, as
compared to the reference DGAC 30 mm, with noticeably more benefit than the thinner overlays
at frequencies greater than or equal to 1000 Hz. Considering all data sets (includes ages 4-52
months and multiple microphone positions) the average OGAC 75 mm benefit over DGAC is 3.3
dBA. The RAC Type O 30 mm and OGAC 30 mm also provide noise benefits. The average
RAC Type O 30 mm benefit is 2.3 dBA, and the average OGAC 30 mm benefit is 1.7 dBA. The
rubberized asphalt (RAC) provides extra benefit at some critical frequencies (frequencies with
substantial contribution to the broadband noise level), which affects the overall sound level for
automobiles more than for heavy trucks. The overlay of BWC 30 mm is actually louder than
DGAC for one of the microphone positions, where the average benefit over DGAC for all
microphone positions is 0.9 dBA. The BWC 30 mm should not be considered a quieter
pavement.
a The amount of reduction reported in literature is highly dependent on the reference pavement used for comparison. The Caltrans Thin Lift Study uses a reference asphalt pavement with the same nominal aggregate size and same age as the other test pavements, resulting in relatively small reductions: on average, about 3 dBA or less. It should be noted that decreases in overall sound level of less than 3 dBA are not typically considered to be perceptible,12 although changes in spectral content may be perceived.

Conclusions Caltrans Thin Lift Study
46
When examining the results by vehicle type, the following is observed: 1) the order of the
performance (most noise reduction to least noise reduction) is the same as indicated in the
overall results; 2) the order of the performance is the same for automobiles, medium trucks, and
heavy trucks; 3) for the quieter pavements, each of the pavements provides greater reductions
for automobile noise than for medium or heavy truck noise; and 4) some pavements can reduce
noise about the same amount for both automobiles and heavy trucks, where as other pavements
see more of a disparity in reduction between vehicle types. The disparity between vehicle types
indicates the importance of accounting for light and heavy vehicles when assessing the noise
reduction benefits of pavements.
Spectral results indicate that quieter pavements do provide noise reduction in a critical range
around 1000 Hz, although little to no benefit is seen around 500 Hz, a frequency band with
substantial energy for heavy trucks. Spectral results also indicate that some lower frequencies
that were contributing little, if any, to the overall sound level closer to the road, are within 10
dBA of the dominant frequency farther from the road, and are contributing to the overall sound
level (as is expected due to propagation effects). These lower frequencies see little, if any,
benefit due to the quieter pavement. One example shows the benefit for automobiles decreasing
1.0 dBA, and for heavy trucks decreasing 1.4 dBA, over a distance of 52.5 m (175 ft).
Results from the test vehicle data are similar to those for autos in the existing traffic, identifying
this vehicle as being a good representative of the auto category. Test vehicle data show that
noise reduction due to pavement is fairly consistent over speeds ranging from 40 mph to 70 mph
(~65 to 112 km/h). This is encouraging when considering the use of pavement for noise
abatement on roadways with medium- or high-speed traffic.
Concerning pavement sound absorption, applying an adapted ANSI S1.18 methodology to
measure effective flow resistivity (EFR) is showing reasonable results. For the test pavements,
EFR values from highest to lowest corresponds with the order of modified SPBI levels (loudest
to quietest). The method and results still need to be validated before conclusions can be reached
regarding the relationship between wayside noise levels and pavement absorption and before
specific pavement EFR values can be used as part of noise prediction.

Conclusions Caltrans Thin Lift Study
47
In order to further understand noise benefits related to quieter pavements, the following research
should be conducted:
• Measurements and analysis for the pavements on LA 138 aged beyond 52 months – This
will help determine the longevity of noise reduction benefits, a necessary component
before using quieter pavements for noise abatement.
• Investigate thicker layers of both OGAC and RAC – This would help to determine if the
benefit due to thickness can expand down to 500 Hz, which would help reduce heavy
truck noise.
• Further investigate the variation of measured pavement benefits by microphone position.
Results of such an investigation could affect future guidance on microphone placement
for wayside tire/pavement noise measurements. It is clear when examining the SPB
results that different values for benefit can be obtained for the three different microphone
positions (25 ft low, 50 ft low, and 50 ft high), but which one is best characterizing the
pavement benefit? That is difficult to determine. The low 50-ft position better captures
the angle for sound propagating toward communities adjacent to highways, although it is
more influenced by the ground than the other positions. The 25-ft and high 50-ft
positions minimize ground effects, but capture angles for sound propagation that may not
be representative of what the communities are receiving. The low and high 50-ft
positions are more influenced by meteorological effects than the 25-ft position, although
care can be taken to minimize these effects. The 25-ft position is more likely to be
influenced by near-field effects, and there is the possibility that distinct individual sound
sources on a vehicle, particularly for heavy trucks, may be influencing what is captured
as the maximum sound level when the vehicle drives by.
• Further examine pavement sound absorption – Validate the modified ANSI S1.18 EFR
measurement and analysis method and continue measurements over time; this may
provide EFR data for input into traffic noise models for more accurate noise predictions.
Also, examine relationships between EFR and wayside sound levels; this may help to
determine the potential noise benefit of a pavement while minimizing wayside
measurements.

48

49
REFERENCES
1 Sandberg, Ulf and Jerzy Ejsmont, Tyre/Road Noise Reference Book, INFORMEX
Ejsmont & Sandberg Handelsbolag, Kisa, Sweden, (2002).
2 Grant S. Anderson, Cynthia S.Y. Lee, Gregg G. Fleming, and Christopher W. Menge,
FHWA Traffic Noise Model, Version 1.0: User’s Guide, Report No.s FHWA-PD-96-009
and DOT-VNTSC-FHWA-98-1 (U.S. Department of Transportation, John A. Volpe
National Transportation Systems Center, Massachusetts 1998, TNM v2.5 Addendum
2004).
3 Christopher W. Menge, Christopher F. Rossano, Grant S. Anderson, and Christopher J.
Bajdek, FHWA Traffic Noise Model, Version 1.0: Technical Manual, Report No.s
FHWA-PD-96-010 and DOT-VNTSC-FHWA-98-02 (U.S. Department of
Transportation, John A. Volpe National Transportation Systems Center, Massachusetts
1998). (2004 update sheets available from FHWA)
4 Judith L. Rochat and Gregg G. Fleming, Validation of FHWA’s Traffic Noise Model
(TNM): Phase 1 and Addendum, Report No.s FHWA-EP-02-031 and DOT-VNTSC-
FHWA-02-01 and Addendums (U.S. Department of Transportation, John A. Volpe
National Transportation Systems Center, Massachusetts, 2002, Addendum 2004).
5 Judith Rochat, Aaron Hastings, and Mark Ferroni, “Investigating the implementation of
pavement effects via OBSI data in the FHWA Traffic Noise Model® (FHWA TNM),”
Proceedings of NOISE-CON 2007 (Nevada, 2007).
6 Acoustics - Method for Measuring the Influence of Road Surfaces on Traffic Noise – Part
1: “The Statistical Pass-By Method”, International Standard ISO 11819-1, International
Organization for Standardization, Geneva, Switzerland, (1997).
7 American National Standards Institute and Acoustical Society of America Standards,
Template Method for Ground Impedance, ANSI S1.18-1999 (Acoustical Society of
America, New York, 1999).

References Caltrans Thin Lift Study
50
8 Paul Donavan and Bruce Rymer, “The Application of Sound Intensity to the Evaluation
of Pavement for the Tire/Road Noise Performance – The OBSI Approach,” Proceedings
of NOISE-CON 2007 (Nevada, 2007).
9 Ongle, Aybike and Erwin Kohler, Surface Condition and Road-Tire Noise on Caltrans
Experimental Noise-Reducing Pavement Sections, Draft Report No. UCPRC-RR-2006-
10, University of California Pavement Research Center, Berkeley and Davis, California,
USA, (2006).
10 David Bush, “State Route 138 – Test Site Evaluation,” Technical Memo to Caltrans,
University of California Pavement Research Center, Berkeley and Davis, California,
USA, (2001).
11 Lee, Cynthia S.Y. and Gregg G. Fleming, Measurement of Highway Related Noise,
Report No. FHWA-PD-96-046, U.S. Department of Transportation, Volpe National
Transportation Systems Center, Acoustics Facility, Cambridge, MA, USA, (1996).
12 Technical Noise Supplement, California Department of Transportation, CA, USA, (1998).

A-1
APPENDIX A. MEASUREMENT SITE PHOTOS
This appendix shows photos and descriptions of each pavement type and photos of each
measurement site.

Appendix A Caltrans Thin Lift Study
A-2
A.1 Pavement Types
(a) (b) (c) (d) (e)
Figure A-1. Pavement types for asphalt overlays on LA138. (a) Pavement section 1 (Site 1): dense-graded asphaltic concrete (DGAC) of 30 mm (1 in) thickness; specified maximum aggregate size = 12.5 mm (1/2 in), measured center lane air void content = 9%. (b) Pavement section 2 (Site 2): open-graded asphaltic concrete (OGAC) of 75 mm (3 in) thickness; specified maximum aggregate size = 12.5 mm (1/2 in), measured center lane air void content = 12%. (c) Pavement section 3 (Site 3): OGAC of 30 mm (1 in) thickness; specified maximum aggregate size = 12.5 mm (1/2 in), measured center lane air void content = 15%. (d) Pavement section 4 (Site 4): rubberized asphaltic concrete, Type O (open) (RAC) of 30 mm (1 in) thickness; specified maximum aggregate size = 12.5 mm (1/2 in), measured center lane air void content = 12%. (e) Pavement section 5 (Site 5): bonded wearing course (BWC) of 30 mm (1 in) thickness; specified maximum aggregate size = 12.5 mm (1/2 in), measured center lane air void content = 7%.

Appendix A Caltrans Thin Lift Study
A-3
A.2 Site 1 (S1): DGAC 30mm
Figure A-2. LA138 Site 1 (S1), DGAC 30 mm.

Appendix A Caltrans Thin Lift Study
A-4
A.3 Site 2 (S2): OGAC 75mm
Figure A-3. LA138 Site 2 (S2), OGAC 75 mm.

Appendix A Caltrans Thin Lift Study
A-5
A.4 Site 3 (S3): OGAC 30mm
Figure A-4. LA138 Site 3 (S3), OGAC 30 mm.

Appendix A Caltrans Thin Lift Study
A-6
A.5 Site 4 (S4): RAC Type O 30mm
Figure A-5. LA138 Site 4 (S4), RAC Type O 30 mm.

Appendix A Caltrans Thin Lift Study
A-7
A.6 Site 5 (S5): BWC 30mm
Figure A-6. LA138 Site 5 (S5), BWC 30 mm.

B-1
APPENDIX B. INSTRUMENTATION PHOTOS
This appendix shows the instrumentation utilized for data collection, including instrumentation
for collection of acoustical data, meteorological data, traffic data, pavement data, vehicle pass-by
event identification, and extraneous noise event identification.

Appendix B Caltrans Thin Lift Study
B-2
B.1 Acoustical Data Collection Instrumentation
Figure B-1. Deployed sound level meters (LDL Model 820 Sound Level Meters) and DAT recorder (Sony Model TCD-D100 Digital Audio Tape (DAT) Recorder).

Appendix B Caltrans Thin Lift Study
B-3
Figure B-2. Deployed spectrum analyzers (LDL Model 2900 2-Channel Spectrum
Analyzers).

Appendix B Caltrans Thin Lift Study
B-4
B.2 Meteorological Data Collection Instrumentation
Figure B-3. Deployed meteorological data collection system (Qualimetrics Transportable Automated Meteorological Stations (TAMS)).

Appendix B Caltrans Thin Lift Study
B-5
B.3 Traffic Data Collection Instrumentation
Figure B-4. Video cameras and radar gun.

Appendix B Caltrans Thin Lift Study
B-6
B.4 Pavement Data Collection Instrumentation
Figure B-5. Infrared temperature gun (also seen in Figure B-2).

Appendix B Caltrans Thin Lift Study
B-7
B.5 Pass-By Event Identification and Extraneous Noise Event Identification Data Collection Instrumentation
Figure B-6. Palmtop computer for logging (HP 200 LX palmtop computer) (also seen in Figure B-2).

C-1
APPENDIX C. VEHICLE PASS-BY DATA
The first section in this appendix shows summary tables of vehicle pass-by data, including the
average pass-by sound level, vehicle speed data, and air and pavement temperature data. The
remaining sections (listed by age, starting with the pre-overlay baseline measurements, then post-
overlay 4 months, 10 months, 16 months, and 52 months) show plots of the pass-by events
(sound level as a function of speed) with corresponding regression lines and equations. Data
shown in this appendix are by site pairs and by vehicle type for each age and each microphone
location.
C.1 Vehicle Pass-By Summary This section summarizes the vehicle pass-by data, providing values for each site pair, each
vehicle type, each microphone location, and each pavement age. Each of the tables show: 1)
number of pass-by events; 2) average pass-by sound level (A-weighted maximum sound level,
LAFmx – listed as Lmax) and standard deviation; 3) average vehicle speed and standard deviation;
4) average, maximum, and minimum air temperature; and 5) average, maximum, and minimum
pavement temperature.

Appendix C Caltrans Thin Lift Study
C-2
Table C-1. Pre- and Post-overlay measurements: sound levels for each pavement type (Lveh) by site pairs with identical vehicle sets. Microphone location: distance 25 ft, height 5 ft. Vehicle type: automobile.
Site 1 Site 2 Site 1 Site 3 Site 1 Site 4 Site 1 Site 5 baseline number of data points 104 104 141 141 99 99 74 74 Lmax (dBA) average 76.5 76.5 76.4 77.5 76.6 77.8 76.4 77.5 standard deviation 2.5 2.6 2.9 2.9 2.8 2.6 2.7 2.6 vehicle speed (mph) average 63.3 67.3 64.8 73.6 64.4 75.7 64.2 69.4 standard deviation 6.1 7.0 6.3 5.8 5.8 6.2 6.1 6.6 air temperature (deg F) average 63 63 65 66 65 66 65 66 maximum 74 73 76 77 76 76 75 75 minimum 49 50 46 46 49 51 49 51 pavement temperature (deg F) average 88 88 85 87 83 80 78 80 maximum 103 110 114 108 114 101 108 99 minimum 51 51 47 49 51 52 49 49 4 months number of data points 150 150 104 104 105 105 na na
Lmax (dBA) average 78.6 74.8 78.4 77.3 78.6 76.3 na na standard deviation 2.4 2.6 2.4 2.4 2.5 2.4 na na vehicle speed (mph) average 66.7 68.9 65.7 74.3 65.1 73.3 na na standard deviation 6.6 6.7 5.6 6.9 5.7 7.0 na na air temperature (deg F) average 64 64 63 63 63 61 na na maximum 74 73 74 75 73 74 na na minimum 47 47 40 39 41 40 na na pavement temperature (deg F) average 83 81 82 75 81 78 na na maximum 109 120 109 111 109 103 na na minimum 47 47 46 42 46 46 na na 10 months number of data points 113 113 89 89 82 82 79 79 Lmax (dBA) average 78.9 75.0 78.8 77.1 78.9 76.5 79.0 78.4 standard deviation 2.2 2.4 1.8 2.1 2.3 2.6 1.9 2.0 vehicle speed (mph) average 66.3 66.4 66.5 70.0 66.1 68.4 66.4 67.9 standard deviation 6.4 6.6 5.7 7.0 6.0 7.0 6.4 6.6 air temperature (deg F) average 68 68 68 69 67 68 68 68 maximum 74 75 75 75 74 73 74 75

Appendix C Caltrans Thin Lift Study
C-3
minimum 58 58 59 61 57 60 57 60 pavement temperature (deg F) average 76 81 76 81 74 80 75 81 maximum 99 108 99 101 99 103 99 102 minimum 45 57 43 49 43 56 43 60 16 months number of data points 136 136 107 107 97 97 107 107 Lmax (dBA) average 78.8 74.7 78.9 77.3 78.6 76.2 78.7 78.1 standard deviation 2.3 2.7 2.3 2.4 2.3 2.5 2.3 2.2 vehicle speed (mph) average 64.7 65.6 64.3 67.5 64.4 69.0 63.6 67.7 standard deviation 5.6 5.4 5.7 7.3 5.9 6.6 5.3 5.8 air temperature (deg F) average 83 83 82 83 83 82 83 81 maximum 91 91 91 91 91 93 91 92 minimum 66 66 65 57 65 57 65 57 pavement temperature (deg F) average 95 98 92 90 94 95 93 93 maximum 119 121 119 115 119 116 119 120 minimum 63 58 63 60 63 63 63 54 52 months number of data points 166 166 108 108 74 74 na na
Lmax (dBA) average 79.6 76.0 79.7 78.0 79.6 77.8 na na standard deviation 2.1 2.4 2.3 2.6 2.1 2.3 na na vehicle speed (mph) average 70.7 71.1 70.4 68.8 69.1 66.5 na na standard deviation 7.1 7.2 6.1 6.4 7.0 6.8 na na air temperature (deg F) average 66 66 67 67 68 69 na na maximum 78 78 78 78 79 78 na na minimum 47 48 47 46 51 45 na na pavement temperature (deg F) average 73 70 75 74 78 76 na na maximum 108 100 108 101 108 100 na na minimum 36 54 31 50 37 47 na na

Appendix C Caltrans Thin Lift Study
C-4
Table C-2. Pre- and Post-overlay measurements: sound levels for each pavement type (Lveh) by site pairs with identical vehicle sets. Microphone location: distance 25 ft, height 5 ft. Vehicle type: medium truck.
Site 1 Site 2 Site 1 Site 3 Site 1 Site 4 Site 1 Site 5 baseline number of data points 5 5 10 10 3 3 5 5 Lmax (dBA) average 83.6 83.9 81.0 81.6 81.9 82.3 81.3 81.9 standard deviation 1.9 1.7 3.7 4.1 3.3 2.3 3.2 3.4 vehicle speed (mph) average 61.6 66.5 61.1 73.0 71.1 77.7 65.0 59.7 standard deviation 7.6 5.4 6.2 5.8 10.5 6.6 10.6 4.3 air temperature (deg F) average 63 63 65 66 65 66 65 66 maximum 74 73 76 77 76 76 75 75 minimum 49 50 46 46 49 51 49 51 pavement temperature (deg F) average 88 88 85 87 83 80 78 80 maximum 103 110 114 108 114 101 108 99 minimum 51 51 47 49 51 52 49 49 4 months number of data points 13 13 8 8 9 9 na na
Lmax (dBA) average 82.8 80.2 82.4 82.3 82.0 80.5 na na standard deviation 1.7 2.0 1.9 2.2 1.6 1.5 na na vehicle speed (mph) average 61.2 62.2 62.7 69.7 62.0 66.8 na na standard deviation 3.4 3.8 4.6 7.2 3.0 4.4 na na air temperature (deg F) average 64 64 63 63 63 61 na na maximum 74 73 74 75 73 74 na na minimum 47 47 40 39 41 40 na na pavement temperature (deg F) average 83 81 82 75 81 78 na na maximum 109 120 109 111 109 103 na na minimum 47 47 46 42 46 46 na na 10 months number of data points 10 10 7 7 3 3 5 5 Lmax (dBA) average 82.5 79.4 86.7 85.7 82.8 80.6 82.5 81.5 standard deviation 2.2 2.7 1.4 1.8 2.3 2.3 1.8 1.6 vehicle speed (mph) average 62.0 59.6 60.1 59.7 63.1 60.4 63.9 66.0 standard deviation 5.7 6.1 6.4 5.8 6.1 4.6 5.6 6.7 air temperature (deg F) average 68 68 68 69 67 68 68 68 maximum 74 75 75 75 74 73 74 75 minimum 58 58 59 61 57 60 57 60

Appendix C Caltrans Thin Lift Study
C-5
pavement temperature (deg F) average 76 81 76 81 74 80 75 81 maximum 99 108 99 101 99 103 99 102 minimum 45 57 43 49 43 56 43 60 16 months number of data points 19 19 14 14 11 11 15 15 Lmax (dBA) average 82.7 79.9 83.1 82.7 83.6 81.8 83.4 83.0 standard deviation 2.3 2.8 2.3 2.5 2.5 2.3 2.9 3.1 vehicle speed (mph) average 60.2 61.4 60.2 64.9 62.1 68.4 61.3 65.4 standard deviation 4.6 4.8 4.6 4.4 4.9 4.7 5.2 5.3 air temperature (deg F) average 83 83 82 83 83 82 83 81 maximum 91 91 91 91 91 93 91 92 minimum 66 66 65 57 65 57 65 57 pavement temperature (deg F) average 95 98 92 90 94 95 93 93 maximum 119 121 119 115 119 116 119 120 minimum 63 58 63 60 63 63 63 54 52 months number of data points 19 19 17 17 13 13 na na
Lmax (dBA) average 82.8 79.7 84.4 82.8 83.1 81.9 na na standard deviation 3.5 3.3 3.2 3.0 4.1 4.5 na na vehicle speed (mph) average 64.6 65.8 67.7 67.0 65.5 63.4 na na standard deviation 8.2 7.4 8.3 7.8 6.9 5.0 na na air temperature (deg F) average 66 66 67 67 68 69 na na maximum 78 78 78 78 79 78 na na minimum 47 48 47 46 51 45 na na pavement temperature (deg F) average 73 70 75 74 78 76 na na maximum 108 100 108 101 108 100 na na minimum 36 54 31 50 37 47 na na
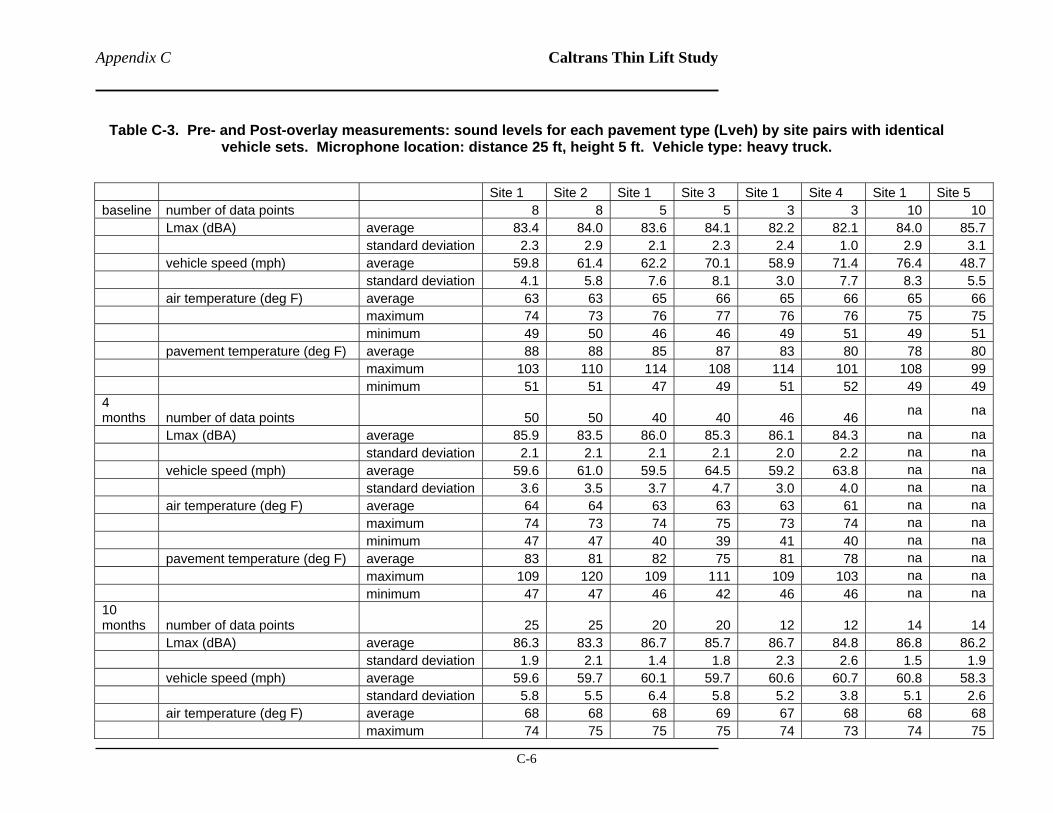
Appendix C Caltrans Thin Lift Study
C-6
Table C-3. Pre- and Post-overlay measurements: sound levels for each pavement type (Lveh) by site pairs with identical vehicle sets. Microphone location: distance 25 ft, height 5 ft. Vehicle type: heavy truck.
Site 1 Site 2 Site 1 Site 3 Site 1 Site 4 Site 1 Site 5 baseline number of data points 8 8 5 5 3 3 10 10 Lmax (dBA) average 83.4 84.0 83.6 84.1 82.2 82.1 84.0 85.7 standard deviation 2.3 2.9 2.1 2.3 2.4 1.0 2.9 3.1 vehicle speed (mph) average 59.8 61.4 62.2 70.1 58.9 71.4 76.4 48.7 standard deviation 4.1 5.8 7.6 8.1 3.0 7.7 8.3 5.5 air temperature (deg F) average 63 63 65 66 65 66 65 66 maximum 74 73 76 77 76 76 75 75 minimum 49 50 46 46 49 51 49 51 pavement temperature (deg F) average 88 88 85 87 83 80 78 80 maximum 103 110 114 108 114 101 108 99 minimum 51 51 47 49 51 52 49 49 4 months number of data points 50 50 40 40 46 46 na na
Lmax (dBA) average 85.9 83.5 86.0 85.3 86.1 84.3 na na standard deviation 2.1 2.1 2.1 2.1 2.0 2.2 na na vehicle speed (mph) average 59.6 61.0 59.5 64.5 59.2 63.8 na na standard deviation 3.6 3.5 3.7 4.7 3.0 4.0 na na air temperature (deg F) average 64 64 63 63 63 61 na na maximum 74 73 74 75 73 74 na na minimum 47 47 40 39 41 40 na na pavement temperature (deg F) average 83 81 82 75 81 78 na na maximum 109 120 109 111 109 103 na na minimum 47 47 46 42 46 46 na na 10 months number of data points 25 25 20 20 12 12 14 14 Lmax (dBA) average 86.3 83.3 86.7 85.7 86.7 84.8 86.8 86.2 standard deviation 1.9 2.1 1.4 1.8 2.3 2.6 1.5 1.9 vehicle speed (mph) average 59.6 59.7 60.1 59.7 60.6 60.7 60.8 58.3 standard deviation 5.8 5.5 6.4 5.8 5.2 3.8 5.1 2.6 air temperature (deg F) average 68 68 68 69 67 68 68 68 maximum 74 75 75 75 74 73 74 75

Appendix C Caltrans Thin Lift Study
C-7
minimum 58 58 59 61 57 60 57 60 pavement temperature (deg F) average 76 81 76 81 74 80 75 81 maximum 99 108 99 101 99 103 99 102 minimum 45 57 43 49 43 56 43 60 16 months number of data points 53 53 44 44 44 44 37 37 Lmax (dBA) average 86.6 83.7 86.3 85.4 86.4 84.9 86.5 86.2 standard deviation 1.5 1.8 1.5 1.9 1.6 2.0 1.6 1.1 vehicle speed (mph) average 58.9 60.6 58.5 61.0 58.6 62.3 59.1 62.3 standard deviation 3.3 3.5 2.8 3.8 3.4 4.2 3.2 3.0 air temperature (deg F) average 83 83 82 83 83 82 83 81 maximum 91 91 91 91 91 93 91 92 minimum 66 66 65 57 65 57 65 57 pavement temperature (deg F) average 95 98 92 90 94 95 93 93 maximum 119 121 119 115 119 116 119 120 minimum 63 58 63 60 63 63 63 54 52 months number of data points 54 54 43 43 35 35 na na
Lmax (dBA) average 87.2 83.8 87.5 85.9 87.8 85.9 na na standard deviation 2.3 2.2 2.0 2.4 1.6 2.1 na na vehicle speed (mph) average 64.2 65.1 63.6 61.8 63.8 61.1 na na standard deviation 5.4 5.0 5.3 5.5 3.4 3.9 na na air temperature (deg F) average 66 66 67 67 68 69 na na maximum 78 78 78 78 79 78 na na minimum 47 48 47 46 51 45 na na pavement temperature (deg F) average 73 70 75 74 78 76 na na maximum 108 100 108 101 108 100 na na minimum 36 54 31 50 37 47 na na

Appendix C Caltrans Thin Lift Study
C-8
Table C-4. Pre- and Post-overlay measurements: sound levels for each pavement type (Lveh) by site pairs with identical vehicle sets. Microphone location: distance 50 ft, height 5 ft. Vehicle type: automobile.
Site 1 Site 2 Site 1 Site 3 Site 1 Site 4 Site 1 Site 5 baseline number of data points 104 104 141 141 99 99 74 74 Lmax (dBA) average 69.3 70.0 69.1 70.1 69.4 71.2 69.2 68.5 standard deviation 2.5 2.6 2.9 3.0 2.9 3.2 2.8 2.4 vehicle speed (mph) average 63.3 67.3 64.8 73.6 64.4 75.7 64.2 69.4 standard deviation 6.1 7.0 6.3 5.8 5.8 6.2 6.1 6.6 air temperature (deg F) average 63 63 65 66 65 66 65 66 maximum 74 73 76 77 76 76 75 75 minimum 49 50 46 46 49 51 49 51 pavement temperature (deg F) average 88 88 85 87 83 80 78 80 maximum 103 110 114 108 114 101 108 99 minimum 51 51 47 49 51 52 49 49 4 months number of data points 150 150 104 104 105 105 86 86 Lmax (dBA) average 71.2 68.9 71.3 69.9 71.5 69.3 71.4 71.1 standard deviation 2.6 2.8 2.5 2.5 2.6 2.6 2.3 2.1 vehicle speed (mph) average 66.7 68.9 65.7 74.3 65.1 73.3 65.4 72.4 standard deviation 6.6 6.7 5.6 6.9 5.7 7.0 6.2 7.2 air temperature (deg F) average 64 64 63 63 63 61 62 61 maximum 74 73 74 75 73 74 73 74 minimum 47 47 40 39 41 40 40 40 pavement temperature (deg F) average 83 81 82 75 81 78 81 78 maximum 109 120 109 111 109 103 107 108 minimum 47 47 46 42 46 46 46 46 10 months number of data points 113 113 89 89 82 82 79 79 Lmax (dBA) average 71.2 68.9 71.2 69.7 71.2 69.4 71.3 71.2 standard deviation 2.2 2.5 2.0 2.3 2.4 2.7 2.1 2.0 vehicle speed (mph) average 66.3 66.4 66.5 70.0 66.1 68.4 66.4 67.9 standard deviation 6.4 6.6 5.7 7.0 6.0 7.0 6.4 6.6 air temperature (deg F) average 68 68 68 69 67 68 68 68 maximum 74 75 75 75 74 73 74 75

Appendix C Caltrans Thin Lift Study
C-9
minimum 58 58 59 61 57 60 57 60 pavement temperature (deg F) average 76 81 76 81 74 80 75 81 maximum 99 108 99 101 99 103 99 102 minimum 45 57 43 49 43 56 43 60 16 months number of data points 136 136 107 107 97 97 107 107 Lmax (dBA) average 71.3 68.4 71.4 70.2 71.2 69.3 71.2 71.2 standard deviation 2.4 2.9 2.4 2.4 2.4 2.6 2.4 2.3 vehicle speed (mph) average 64.7 65.6 64.3 67.5 64.4 69.0 63.6 67.7 standard deviation 5.6 5.4 5.7 7.3 5.9 6.6 5.3 5.8 air temperature (deg F) average 83 83 82 83 83 82 83 81 maximum 91 91 91 91 91 93 91 92 minimum 66 66 65 57 65 57 65 57 pavement temperature (deg F) average 95 98 92 90 94 95 93 93 maximum 119 121 119 115 119 116 119 120 minimum 63 58 63 60 63 63 63 54 52 months number of data points 166 166 108 108 74 74 na na
Lmax (dBA) average 71.7 69.3 71.9 70.2 71.8 69.7 na na standard deviation 2.3 2.5 2.4 2.9 2.1 2.2 na na vehicle speed (mph) average 70.7 71.1 70.4 68.8 69.1 66.5 na na standard deviation 7.1 7.2 6.1 6.4 7.0 6.8 na na air temperature (deg F) average 66 66 67 67 68 69 na na maximum 78 78 78 78 79 78 na na minimum 47 48 47 46 51 45 na na pavement temperature (deg F) average 73 70 75 74 78 76 na na maximum 108 100 108 101 108 100 na na minimum 36 54 31 50 37 47 na na

Appendix C Caltrans Thin Lift Study
C-10
Table C-5. Pre- and Post-overlay measurements: sound levels for each pavement type (Lveh) by site pairs with identical vehicle sets. Microphone location: distance 50 ft, height 5 ft. Vehicle type: medium truck.
Site 1 Site 2 Site 1 Site 3 Site 1 Site 4 Site 1 Site 5 baseline number of data points 5 5 10 10 3 3 2 2 Lmax (dBA) average 76.4 77.3 74.4 74.3 75.0 76.2 74.9 74.5 standard deviation 1.8 1.8 3.7 4.0 1.9 2.4 3.3 2.5 vehicle speed (mph) average 61.6 66.5 61.1 73.0 71.1 77.7 65.0 59.7 standard deviation 7.6 5.4 6.2 5.8 10.5 6.6 10.6 4.3 air temperature (deg F) average 63 63 65 66 65 66 65 66 maximum 74 73 76 77 76 76 75 75 minimum 49 50 46 46 49 51 49 51 pavement temperature (deg F) average 88 88 85 87 83 80 78 80 maximum 103 110 114 108 114 101 108 99 minimum 51 51 47 49 51 52 49 49 4 months number of data points 13 13 8 8 9 9 9 9 Lmax (dBA) average 75.9 74.5 75.5 74.9 75.0 73.8 74.6 75.2 standard deviation 1.9 2.3 2.1 2.5 1.7 1.7 1.3 2.9 vehicle speed (mph) average 61.2 62.2 62.7 69.7 62.0 66.8 61.9 64.4 standard deviation 3.4 3.8 4.6 7.2 3.0 4.4 4.8 2.1 air temperature (deg F) average 64 64 63 63 63 61 62 61 maximum 74 73 74 75 73 74 73 74 minimum 47 47 40 39 41 40 40 40 pavement temperature (deg F) average 83 81 82 75 81 78 81 78 maximum 109 120 109 111 109 103 107 108 minimum 47 47 46 42 46 46 46 46 10 months number of data points 10 10 7 7 3 3 5 5 Lmax (dBA) average 75.0 73.4 80.0 78.9 76.1 74.0 75.0 74.3 standard deviation 2.2 2.5 1.6 2.0 2.4 2.1 2.3 2.0 vehicle speed (mph) average 62.0 59.6 60.1 59.7 63.1 60.4 63.9 66.0 standard deviation 5.7 6.1 6.4 5.8 6.1 4.6 5.6 6.7 air temperature (deg F) average 68 68 68 69 67 68 68 68 maximum 74 75 75 75 74 73 74 75

Appendix C Caltrans Thin Lift Study
C-11
minimum 58 58 59 61 57 60 57 60 pavement temperature (deg F) average 76 81 76 81 74 80 75 81 maximum 99 108 99 101 99 103 99 102 minimum 45 57 43 49 43 56 43 60 16 months number of data points 19 19 14 14 11 11 15 15 Lmax (dBA) average 75.6 73.9 76.1 75.5 76.6 75.1 76.3 76.2 standard deviation 2.6 2.9 2.6 2.5 2.8 1.9 3.2 3.0 vehicle speed (mph) average 60.2 61.4 60.2 64.9 62.1 68.4 61.3 65.4 standard deviation 4.6 4.8 4.6 4.4 4.9 4.7 5.2 5.3 air temperature (deg F) average 83 83 82 83 83 82 83 81 maximum 91 91 91 91 91 93 91 92 minimum 66 66 65 57 65 57 65 57 pavement temperature (deg F) average 95 98 92 90 94 95 93 93 maximum 119 121 119 115 119 116 119 120 minimum 63 58 63 60 63 63 63 54 52 months number of data points 19 19 17 17 13 13 na na
Lmax (dBA) average 74.8 73.2 76.5 75.1 75.2 74.1 na na standard deviation 3.5 3.2 3.4 3.2 4.0 4.6 na na vehicle speed (mph) average 64.6 65.8 67.7 67.0 65.5 63.4 na na standard deviation 8.2 7.4 8.3 7.8 6.9 5.0 na na air temperature (deg F) average 66 66 67 67 68 69 na na maximum 78 78 78 78 79 78 na na minimum 47 48 47 46 51 45 na na pavement temperature (deg F) average 73 70 75 74 78 76 na na maximum 108 100 108 101 108 100 na na minimum 36 54 31 50 37 47 na na

Appendix C Caltrans Thin Lift Study
C-12
Table C-6. Pre- and Post-overlay measurements: sound levels for each pavement type (Lveh) by site pairs with identical vehicle sets. Microphone location: distance 50 ft, height 5 ft. Vehicle type: heavy truck.
Site 1 Site 2 Site 1 Site 3 Site 1 Site 4 Site 1 Site 5 baseline number of data points 8 8 5 5 3 3 9 9 Lmax (dBA) average 76.9 77.7 76.8 77.2 75.5 74.9 77.2 76.5 standard deviation 2.5 2.7 2.6 2.0 2.1 1.5 3.4 2.7 vehicle speed (mph) average 59.8 61.4 62.2 70.1 58.9 71.4 76.4 48.7 standard deviation 4.1 5.8 7.6 8.1 3.0 7.7 8.3 5.5 air temperature (deg F) average 63 63 65 66 65 66 65 66 maximum 74 73 76 77 76 76 75 75 minimum 49 50 46 46 49 51 49 51 pavement temperature (deg F) average 88 88 85 87 83 80 78 80 maximum 103 110 114 108 114 101 108 99 minimum 51 51 47 49 51 52 49 49 4 months number of data points 50 50 40 40 46 46 45 45 Lmax (dBA) average 79.5 77.9 79.5 78.3 79.5 77.6 79.5 78.9 standard deviation 2.3 2.2 2.3 2.2 2.1 2.0 1.9 1.5 vehicle speed (mph) average 59.6 61.0 59.5 64.5 59.2 63.8 59.2 64.3 standard deviation 3.6 3.5 3.7 4.7 3.0 4.0 3.3 4.1 air temperature (deg F) average 64 64 63 63 63 61 62 61 maximum 74 73 74 75 73 74 73 74 minimum 47 47 40 39 41 40 40 40 pavement temperature (deg F) average 83 81 82 75 81 78 81 78 maximum 109 120 109 111 109 103 107 108 minimum 47 47 46 42 46 46 46 46 10 months number of data points 25 25 20 20 12 12 14 14 Lmax (dBA) average 79.5 77.6 80.0 78.9 80.0 77.8 80.0 79.7 standard deviation 2.2 2.5 1.6 2.0 2.6 2.8 1.7 2.3 vehicle speed (mph) average 59.6 59.7 60.1 59.7 60.6 60.7 60.8 58.3 standard deviation 5.8 5.5 6.4 5.8 5.2 3.8 5.1 2.6 air temperature (deg F) average 68 68 68 69 67 68 68 68 maximum 74 75 75 75 74 73 74 75

Appendix C Caltrans Thin Lift Study
C-13
minimum 58 58 59 61 57 60 57 60 pavement temperature (deg F) average 76 81 76 81 74 80 75 81 maximum 99 108 99 101 99 103 99 102 minimum 45 57 43 49 43 56 43 60 16 months number of data points 53 53 44 44 44 44 37 37 Lmax (dBA) average 79.9 78.0 79.6 78.6 79.6 78.3 79.6 79.4 standard deviation 1.7 1.9 1.8 1.7 1.8 1.9 1.8 1.2 vehicle speed (mph) average 58.9 60.6 58.5 61.0 58.6 62.3 59.1 62.3 standard deviation 3.3 3.5 2.8 3.8 3.4 4.2 3.2 3.0 air temperature (deg F) average 83 83 82 83 83 82 83 81 maximum 91 91 91 91 91 93 91 92 minimum 66 66 65 57 65 57 65 57 pavement temperature (deg F) average 95 98 92 90 94 95 93 93 maximum 119 121 119 115 119 116 119 120 minimum 63 58 63 60 63 63 63 54 52 months number of data points 54 54 43 43 35 35 na na
Lmax (dBA) average 79.6 77.6 79.9 78.9 80.2 78.7 na na standard deviation 2.3 2.3 1.9 2.6 1.7 2.1 na na vehicle speed (mph) average 64.2 65.1 63.6 61.8 63.8 61.1 na na standard deviation 5.4 5.0 5.3 5.5 3.4 3.9 na na air temperature (deg F) average 66 66 67 67 68 69 na na maximum 78 78 78 78 79 78 na na minimum 47 48 47 46 51 45 na na pavement temperature (deg F) average 73 70 75 74 78 76 na na maximum 108 100 108 101 108 100 na na minimum 36 54 31 50 37 47 na na

Appendix C Caltrans Thin Lift Study
C-14
Table C-7. Pre- and Post-overlay measurements: sound levels for each pavement type (Lveh) by site pairs with identical vehicle sets. Microphone location: distance 50 ft, height 15 ft. Vehicle type: automobile.
Site 1 Site 2 Site 1 Site 3 Site 1 Site 4 Site 1 Site 5 baseline number of data points 104 54 114 114 84 84 58 58 Lmax (dBA) average 71.1 71.6 71.0 72.1 71.3 72.4 71.3 71.5 standard deviation 2.4 2.2 2.5 3.0 2.7 2.3 2.6 3.3 vehicle speed (mph) average 63.3 67.3 64.8 73.6 64.4 75.7 64.2 69.4 standard deviation 6.1 7.0 6.3 5.8 5.8 6.2 6.1 6.6 air temperature (deg F) average 63 63 65 66 65 66 65 66 maximum 74 73 76 77 76 76 75 75 minimum 49 50 46 46 49 51 49 51 pavement temperature (deg F) average 88 88 85 87 83 80 78 80 maximum 103 110 114 108 114 101 108 99 minimum 51 51 47 49 51 52 49 49 4 months number of data points 150 150 104 104 105 105 86 86 Lmax (dBA) average 73.3 69.8 73.3 71.8 73.4 71.2 73.4 73.7 standard deviation 2.3 2.5 2.3 2.3 2.4 2.4 2.1 2.4 vehicle speed (mph) average 66.7 68.9 65.7 74.3 65.1 73.3 65.4 72.4 standard deviation 6.6 6.7 5.6 6.9 5.7 7.0 6.2 7.2 air temperature (deg F) average 64 64 63 63 63 61 62 61 maximum 74 73 74 75 73 74 73 74 minimum 47 47 40 39 41 40 40 40 pavement temperature (deg F) average 83 81 82 75 81 78 81 78 maximum 109 120 109 111 109 103 107 108 minimum 47 47 46 42 46 46 46 46 10 months number of data points 113 113 89 89 82 82 79 79 Lmax (dBA) average 73.5 69.9 73.5 72.0 73.6 71.3 73.7 73.0 standard deviation 2.1 2.2 1.7 2.5 2.2 2.5 1.9 1.9 vehicle speed (mph) average 66.3 66.4 66.5 70.0 66.1 68.4 66.4 67.9 standard deviation 6.4 6.6 5.7 7.0 6.0 7.0 6.4 6.6 air temperature (deg F) average 68 68 68 69 67 68 68 68 maximum 74 75 75 75 74 73 74 75

Appendix C Caltrans Thin Lift Study
C-15
minimum 58 58 59 61 57 60 57 60 pavement temperature (deg F) average 76 81 76 81 74 80 75 81 maximum 99 108 99 101 99 103 99 102 minimum 45 57 43 49 43 56 43 60 16 months number of data points 136 136 107 107 97 97 107 107 Lmax (dBA) average 73.3 70.1 73.5 72.2 73.2 71.4 73.2 72.7 standard deviation 2.2 2.5 2.3 2.3 2.2 2.4 2.2 2.2 vehicle speed (mph) average 64.7 65.6 64.3 67.5 64.4 69.0 63.6 67.7 standard deviation 5.6 5.4 5.7 7.3 5.9 6.6 5.3 5.8 air temperature (deg F) average 83 83 82 83 83 82 83 81 maximum 91 91 91 91 91 93 91 92 minimum 66 66 65 57 65 57 65 57 pavement temperature (deg F) average 95 98 92 90 94 95 93 93 maximum 119 121 119 115 119 116 119 120 minimum 63 58 63 60 63 63 63 54 52 months number of data points 166 166 108 108 74 74 na na
Lmax (dBA) average 74.3 70.7 74.5 72.9 74.3 72.2 na na standard deviation 2.0 2.3 2.2 2.3 2.0 2.2 na na vehicle speed (mph) average 70.7 71.1 70.4 68.8 69.1 66.5 na na standard deviation 7.1 7.2 6.1 6.4 7.0 6.8 na na air temperature (deg F) average 66 66 67 67 68 69 na na maximum 78 78 78 78 79 78 na na minimum 47 48 47 46 51 45 na na pavement temperature (deg F) average 73 70 75 74 78 76 na na maximum 108 100 108 101 108 100 na na minimum 36 54 31 50 37 47 na na

Appendix C Caltrans Thin Lift Study
C-16
Table C-8. Pre- and Post-overlay measurements: sound levels for each pavement type (Lveh) by site pairs with identical vehicle sets. Microphone location: distance 50 ft, height 15 ft. Vehicle type: medium truck.
Site 1 Site 2 Site 1 Site 3 Site 1 Site 4 Site 1 Site 5 baseline number of data points 4 4 7 7 2 2 3 3 Lmax (dBA) average 78.0 78.9 75.7 75.9 77.1 77.0 74.8 75.4 standard deviation 2.1 1.9 2.8 3.1 2.5 2.2 2.8 3.8 vehicle speed (mph) average 61.6 66.5 61.1 73.0 71.1 77.7 65.0 59.7 standard deviation 7.6 5.4 6.2 5.8 10.5 6.6 10.6 4.3 air temperature (deg F) average 63 63 65 66 65 66 65 66 maximum 74 73 76 77 76 76 75 75 minimum 49 50 46 46 49 51 49 51 pavement temperature (deg F) average 88 88 85 87 83 80 78 80 maximum 103 110 114 108 114 101 108 99 minimum 51 51 47 49 51 52 49 49 4 months number of data points 13 13 8 8 9 9 9 9 Lmax (dBA) average 77.3 74.8 77.1 76.8 76.8 75.0 76.2 77.1 standard deviation 2.0 2.4 2.0 2.3 1.7 1.9 1.2 2.8 vehicle speed (mph) average 61.2 62.2 62.7 69.7 62.0 66.8 61.9 64.4 standard deviation 3.4 3.8 4.6 7.2 3.0 4.4 4.8 2.1 air temperature (deg F) average 64 64 63 63 63 61 62 61 maximum 74 73 74 75 73 74 73 74 minimum 47 47 40 39 41 40 40 40 pavement temperature (deg F) average 83 81 82 75 81 78 81 78 maximum 109 120 109 111 109 103 107 108 minimum 47 47 46 42 46 46 46 46 10 months number of data points 10 10 7 7 3 3 5 5 Lmax (dBA) average 76.8 73.8 82.1 80.7 77.1 75.2 76.6 75.8 standard deviation 2.1 2.5 1.8 1.9 2.4 2.0 2.0 2.0 vehicle speed (mph) average 62.0 59.6 60.1 59.7 63.1 60.4 63.9 66.0 standard deviation 5.7 6.1 6.4 5.8 6.1 4.6 5.6 6.7 air temperature (deg F) average 68 68 68 69 67 68 68 68 maximum 74 75 75 75 74 73 74 75
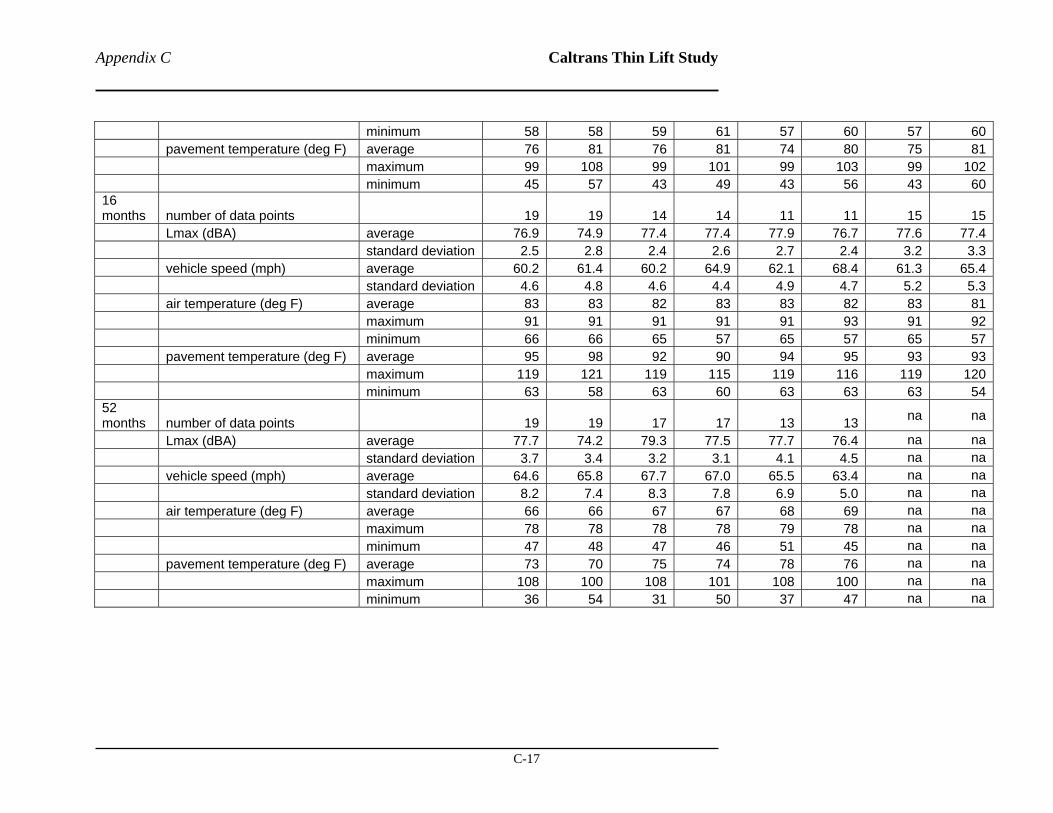
Appendix C Caltrans Thin Lift Study
C-17
minimum 58 58 59 61 57 60 57 60 pavement temperature (deg F) average 76 81 76 81 74 80 75 81 maximum 99 108 99 101 99 103 99 102 minimum 45 57 43 49 43 56 43 60 16 months number of data points 19 19 14 14 11 11 15 15 Lmax (dBA) average 76.9 74.9 77.4 77.4 77.9 76.7 77.6 77.4 standard deviation 2.5 2.8 2.4 2.6 2.7 2.4 3.2 3.3 vehicle speed (mph) average 60.2 61.4 60.2 64.9 62.1 68.4 61.3 65.4 standard deviation 4.6 4.8 4.6 4.4 4.9 4.7 5.2 5.3 air temperature (deg F) average 83 83 82 83 83 82 83 81 maximum 91 91 91 91 91 93 91 92 minimum 66 66 65 57 65 57 65 57 pavement temperature (deg F) average 95 98 92 90 94 95 93 93 maximum 119 121 119 115 119 116 119 120 minimum 63 58 63 60 63 63 63 54 52 months number of data points 19 19 17 17 13 13 na na
Lmax (dBA) average 77.7 74.2 79.3 77.5 77.7 76.4 na na standard deviation 3.7 3.4 3.2 3.1 4.1 4.5 na na vehicle speed (mph) average 64.6 65.8 67.7 67.0 65.5 63.4 na na standard deviation 8.2 7.4 8.3 7.8 6.9 5.0 na na air temperature (deg F) average 66 66 67 67 68 69 na na maximum 78 78 78 78 79 78 na na minimum 47 48 47 46 51 45 na na pavement temperature (deg F) average 73 70 75 74 78 76 na na maximum 108 100 108 101 108 100 na na minimum 36 54 31 50 37 47 na na

Appendix C Caltrans Thin Lift Study
C-18
Table C-9. Pre- and Post-overlay measurements: sound levels for each pavement type (Lveh) by site pairs with identical vehicle sets. Microphone location: distance 50 ft, height 15 ft. Vehicle type: heavy truck.
Site 1 Site 2 Site 1 Site 3 Site 1 Site 4 Site 1 Site 5 baseline number of data points 1 1 1 1 3 3 1 1 Lmax (dBA) average 75.1 75.1 75.1 74.7 77.4 76.3 82.8 83.9 standard deviation na na na na 2.9 2.0 na na vehicle speed (mph) average 59.8 61.4 62.2 70.1 58.9 71.4 76.4 48.7 standard deviation 4.1 5.8 7.6 8.1 3.0 7.7 8.3 5.5 air temperature (deg F) average 63 63 65 66 65 66 65 66 maximum 74 73 76 77 76 76 75 75 minimum 49 50 46 46 49 51 49 51 pavement temperature (deg F) average 88 88 85 87 83 80 78 80 maximum 103 110 114 108 114 101 108 99 minimum 51 51 47 49 51 52 49 49 4 months number of data points 50 50 40 40 46 46 45 45 Lmax (dBA) average 81.1 78.6 81.2 79.9 81.3 79.1 81.0 81.1 standard deviation 2.4 2.4 2.3 2.4 2.2 2.2 1.8 2.0 vehicle speed (mph) average 59.6 61.0 59.5 64.5 59.2 63.8 59.2 64.3 standard deviation 3.6 3.5 3.7 4.7 3.0 4.0 3.3 4.1 air temperature (deg F) average 64 64 63 63 63 61 62 61 maximum 74 73 74 75 73 74 73 74 minimum 47 47 40 39 41 40 40 40 pavement temperature (deg F) average 83 81 82 75 81 78 81 78 maximum 109 120 109 111 109 103 107 108 minimum 47 47 46 42 46 46 46 46 10 months number of data points 25 25 20 20 12 12 14 14 Lmax (dBA) average 81.5 78.5 82.1 80.7 82.2 79.5 82.4 81.1 standard deviation 2.3 2.3 1.8 1.9 2.7 2.9 1.9 2.0 vehicle speed (mph) average 59.6 59.7 60.1 59.7 60.6 60.7 60.8 58.3 standard deviation 5.8 5.5 6.4 5.8 5.2 3.8 5.1 2.6 air temperature (deg F) average 68 68 68 69 67 68 68 68 maximum 74 75 75 75 74 73 74 75

Appendix C Caltrans Thin Lift Study
C-19
minimum 58 58 59 61 57 60 57 60 pavement temperature (deg F) average 76 81 76 81 74 80 75 81 maximum 99 108 99 101 99 103 99 102 minimum 45 57 43 49 43 56 43 60 16 months number of data points 53 53 44 44 44 44 37 37 Lmax (dBA) average 81.8 79.3 81.4 81.0 81.6 80.1 81.6 81.1 standard deviation 1.6 2.1 1.7 2.0 1.8 2.0 1.8 1.2 vehicle speed (mph) average 58.9 60.6 58.5 61.0 58.6 62.3 59.1 62.3 standard deviation 3.3 3.5 2.8 3.8 3.4 4.2 3.2 3.0 air temperature (deg F) average 83 83 82 83 83 82 83 81 maximum 91 91 91 91 91 93 91 92 minimum 66 66 65 57 65 57 65 57 pavement temperature (deg F) average 95 98 92 90 94 95 93 93 maximum 119 121 119 115 119 116 119 120 minimum 63 58 63 60 63 63 63 54 52 months number of data points 54 54 43 43 35 35 na na
Lmax (dBA) average 82.1 78.8 82.4 81.4 82.8 80.6 na na standard deviation 2.5 2.4 2.1 2.6 1.8 2.1 na na vehicle speed (mph) average 64.2 65.1 63.6 61.8 63.8 61.1 na na standard deviation 5.4 5.0 5.3 5.5 3.4 3.9 na na air temperature (deg F) average 66 66 67 67 68 69 na na maximum 78 78 78 78 79 78 na na minimum 47 48 47 46 51 45 na na pavement temperature (deg F) average 73 70 75 74 78 76 na na maximum 108 100 108 101 108 100 na na minimum 36 54 31 50 37 47 na na

Appendix C Caltrans Thin Lift Study
C-20
C.2 Pre-Overlay Baseline
y = 0.1422x + 67.479
y = 0.1097x + 69.07
50
60
70
80
90
100
40 50 60 70 80 90 100
speed (mph)
Lmax
(dB
A)
S1 DGAC S2 DGAC Linear (S1 DGAC) Linear (S2 DGAC)
y = -0.1719x + 94.185
y = -0.1999x + 97.147
50
60
70
80
90
100
40 50 60 70 80 90 100
speed (mph)
Lmax
(dB
A)
S1 DGAC S2 DGAC Linear (S1 DGAC) Linear (S2 DGAC)

Appendix C Caltrans Thin Lift Study
C-21
y = 0.0788x + 78.692
y = -0.3113x + 103.08
50
60
70
80
90
100
40 50 60 70 80 90 100
speed (mph)
Lmax
(dB
A)
S1 DGAC S2 DGAC Linear (S1 DGAC) Linear (S2 DGAC)
Figure C-1. (this and previous page) Vehicle pass-by data, pre-overlay; Site 1 (DGAC), Site 2 (DGAC). Automobiles (top), medium trucks (middle), and heavy trucks (bottom).
Microphone location: distance 25 ft, height 5 ft.

Appendix C Caltrans Thin Lift Study
C-22
y = 0.115x + 61.998
y = 0.1014x + 63.181
50
60
70
80
90
100
40 50 60 70 80 90 100
speed (mph)
Lmax
(dB
A)
S1 DGAC S2 DGAC Linear (S1 DGAC) Linear (S2 DGAC)
y = -0.1382x + 84.869
y = -0.1126x + 84.823
50
60
70
80
90
100
40 50 60 70 80 90 100
speed (mph)
Lmax
(dB
A)
S1 DGAC S2 DGAC Linear (S1 DGAC) Linear (S2 DGAC)

Appendix C Caltrans Thin Lift Study
C-23
y = 0.1552x + 67.573
y = -0.292x + 95.603
50
60
70
80
90
100
40 50 60 70 80 90 100
speed (mph)
Lmax
(dB
A)
S1 DGAC S2 DGAC Linear (S1 DGAC) Linear (S2 DGAC)
Figure C-2. (this and previous page) Vehicle pass-by data, pre-overlay; Site 1 (DGAC), Site 2 (DGAC). Automobiles (top), medium trucks (middle), and heavy trucks (bottom).
Microphone location: distance 50 ft, height 5 ft.

Appendix C Caltrans Thin Lift Study
C-24
y = 0.1242x + 63.277
y = 0.1323x + 62.912
50
60
70
80
90
100
40 50 60 70 80 90 100
speed (mph)
Lmax
(dB
A)
S1 DGAC S2 DGAC Linear (S1 DGAC) Linear (S2 DGAC)
y = -0.2116x + 91.238
y = -0.3744x + 104.4
50
60
70
80
90
100
40 50 60 70 80 90 100
speed (mph)
Lmax
(dB
A)
S1 DGAC S2 DGAC Linear (S1 DGAC) Linear (S2 DGAC)

Appendix C Caltrans Thin Lift Study
C-25
50
60
70
80
90
100
40 50 60 70 80 90 100
speed (mph)
Lmax
(dB
A)
S1 DGAC S2 DGAC Linear (S1 DGAC) Linear (S2 DGAC)
Figure C-3. (this and previous page) Vehicle pass-by data, pre-overlay; Site 1 (DGAC), Site 2 (DGAC). Automobiles (top), medium trucks (middle), and heavy trucks (bottom).
Microphone location: distance 50 ft, height 15 ft.

Appendix C Caltrans Thin Lift Study
C-26
y = 0.1773x + 64.895
y = 0.0502x + 73.817
50
60
70
80
90
100
40 50 60 70 80 90 100
speed (mph)
Lmax
(dB
A)
S1 DGAC S3 DGAC Linear (S1 DGAC) Linear (S3 DGAC)
y = 0.0263x + 79.42 y = -0.0715x + 86.788
50
60
70
80
90
100
40 50 60 70 80 90 100
speed (mph)
Lmax
(dB
A)
S1 DGAC S3 DGAC Linear (S1 DGAC) Linear (S3 DGAC)

Appendix C Caltrans Thin Lift Study
C-27
y = -0.1649x + 93.833
y = -0.1758x + 96.434
50
60
70
80
90
100
40 50 60 70 80 90 100
speed (mph)
Lmax
(dB
A)
S1 DGAC S3 DGAC Linear (S1 DGAC) Linear (S3 DGAC)
Figure C-4. (this and previous page) Vehicle pass-by data, pre-overlay; Site 1 (DGAC), Site 3 (DGAC). Automobiles (top), medium trucks (middle), and heavy trucks (bottom).
Microphone location: distance 25 ft, height 5 ft.

Appendix C Caltrans Thin Lift Study
C-28
y = 0.172x + 58
y = 0.0474x + 66.578
50
60
70
80
90
100
40 50 60 70 80 90 100
speed (mph)
Lmax
(dB
A)
S1 DGAC S3 DGAC Linear (S1 DGAC) Linear (S3 DGAC)
y = 0.0199x + 73.146
y = -0.0808x + 80.146
50
60
70
80
90
100
40 50 60 70 80 90 100
speed (mph)
Lmax
(dB
A)
S1 DGAC S3 DGAC Linear (S1 DGAC) Linear (S3 DGAC)

Appendix C Caltrans Thin Lift Study
C-29
y = -0.1691x + 87.337
y = -0.1693x + 89.098
50
60
70
80
90
100
40 50 60 70 80 90 100
speed (mph)
Lmax
(dB
A)
S1 DGAC S3 DGAC Linear (S1 DGAC) Linear (S3 DGAC)
Figure C-5. (this and previous page) Vehicle pass-by data, pre-overlay; Site 1 (DGAC), Site 3 (DGAC). Automobiles (top), medium trucks (middle), and heavy trucks (bottom).
Microphone location: distance 50 ft, height 5 ft.

Appendix C Caltrans Thin Lift Study
C-30
y = 0.1239x + 62.938
y = 0.0578x + 67.884
50
60
70
80
90
100
40 50 60 70 80 90 100
speed (mph)
Lmax
(dB
A)
S1 DGAC S3 DGAC Linear (S1 DGAC) Linear (S3 DGAC)
y = -0.0018x + 75.784
y = 0.2061x + 61.255
50
60
70
80
90
100
40 50 60 70 80 90 100
speed (mph)
Lmax
(dB
A)
S1 DGAC S3 DGAC Linear (S1 DGAC) Linear (S3 DGAC)
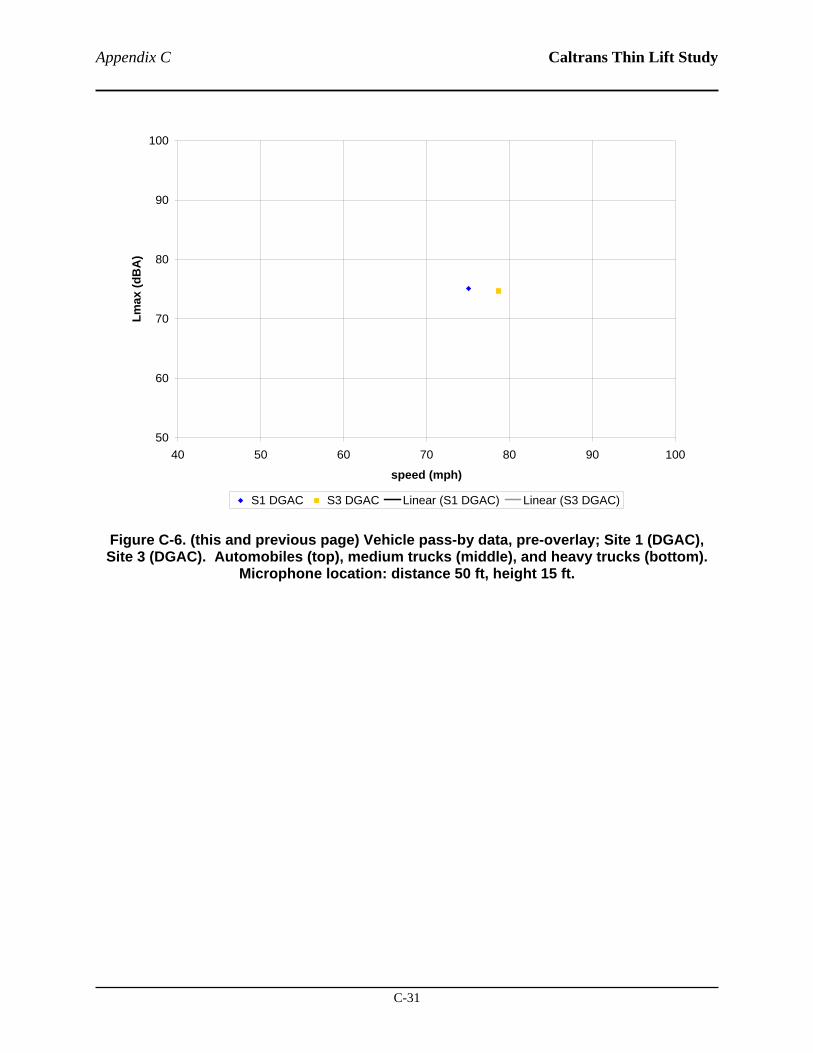
Appendix C Caltrans Thin Lift Study
C-31
50
60
70
80
90
100
40 50 60 70 80 90 100
speed (mph)
Lmax
(dB
A)
S1 DGAC S3 DGAC Linear (S1 DGAC) Linear (S3 DGAC)
Figure C-6. (this and previous page) Vehicle pass-by data, pre-overlay; Site 1 (DGAC), Site 3 (DGAC). Automobiles (top), medium trucks (middle), and heavy trucks (bottom).
Microphone location: distance 50 ft, height 15 ft.

Appendix C Caltrans Thin Lift Study
C-32
y = 0.1639x + 66.01
y = 0.0818x + 71.589
50
60
70
80
90
100
40 50 60 70 80 90 100
speed (mph)
Lmax
(dB
A)
S1 DGAC S4 DGAC Linear (S1 DGAC) Linear (S4 DGAC)
y = 0.2608x + 63.333
y = -0.1443x + 93.482
50
60
70
80
90
100
40 50 60 70 80 90 100
speed (mph)
Lmax
(dB
A)
S1 DGAC S4 DGAC Linear (S1 DGAC) Linear (S4 DGAC)

Appendix C Caltrans Thin Lift Study
C-33
y = -0.5065x + 112.02
y = -0.1212x + 90.75
50
60
70
80
90
100
40 50 60 70 80 90 100
speed (mph)
Lmax
(dB
A)
S1 DGAC S4 DGAC Linear (S1 DGAC) Linear (S4 DGAC)
Figure C-7. (this and previous page) Vehicle pass-by data, pre-overlay; Site 1 (DGAC), Site 4 (DGAC). Automobiles (top), medium trucks (middle), and heavy trucks (bottom).
Microphone location: distance 25 ft, height 5 ft.

Appendix C Caltrans Thin Lift Study
C-34
y = 0.1667x + 58.636
y = 0.048x + 67.53
50
60
70
80
90
100
40 50 60 70 80 90 100
speed (mph)
Lmax
(dB
A)
S1 DGAC S4 DGAC Linear (S1 DGAC) Linear (S4 DGAC)
y = 0.147x + 64.589
y = -0.3174x + 100.83
50
60
70
80
90
100
40 50 60 70 80 90 100
speed (mph)
Lmax
(dB
A)
S1 DGAC S4 DGAC Linear (S1 DGAC) Linear (S4 DGAC)

Appendix C Caltrans Thin Lift Study
C-35
y = -0.3254x + 94.627
y = -0.1286x + 84.111
50
60
70
80
90
100
40 50 60 70 80 90 100
speed (mph)
Lmax
(dB
A)
S1 DGAC S4 DGAC Linear (S1 DGAC) Linear (S4 DGAC)
Figure C-8. (this and previous page) Vehicle pass-by data, pre-overlay; Site 1 (DGAC), Site 4 (DGAC). Automobiles (top), medium trucks (middle), and heavy trucks (bottom).
Microphone location: distance 50 ft, height 5 ft.

Appendix C Caltrans Thin Lift Study
C-36
y = 0.1303x + 62.879
y = -0.0062x + 72.819
50
60
70
80
90
100
40 50 60 70 80 90 100
speed (mph)
Lmax
(dB
A)
S1 DGAC S4 DGAC Linear (S1 DGAC) Linear (S4 DGAC)
y = x
y = -0.2546x + 97.1
50
60
70
80
90
100
40 50 60 70 80 90 100
speed (mph)
Lmax
(dB
A)
S1 DGAC S4 DGAC Linear (S1 DGAC) Linear (S4 DGAC)

Appendix C Caltrans Thin Lift Study
C-37
y = -0.5832x + 111.77
y = -0.2522x + 94.335
50
60
70
80
90
100
40 50 60 70 80 90 100
speed (mph)
Lmax
(dB
A)
S1 DGAC S4 DGAC Linear (S1 DGAC) Linear (S4 DGAC)
Figure C-9. (this and previous page) Vehicle pass-by data, pre-overlay; Site 1 (DGAC), Site 4 (DGAC). Automobiles (top), medium trucks (middle), and heavy trucks (bottom).
Microphone location: distance 50 ft, height 15 ft.

Appendix C Caltrans Thin Lift Study
C-38
y = 0.0893x + 70.64
y = 0.136x + 68.037
50
60
70
80
90
100
40 50 60 70 80 90 100
speed (mph)
Lmax
(dB
A)
S1 DGAC S5 DGAC Linear (S1 DGAC) Linear (S5 DGAC)
y = 0.1761x + 69.862
y = 0.6067x + 45.681
50
60
70
80
90
100
40 50 60 70 80 90 100
speed (mph)
Lmax
(dB
A)
S1 DGAC S5 DGAC Linear (S1 DGAC) Linear (S5 DGAC)

Appendix C Caltrans Thin Lift Study
C-39
y = 0.0108x + 83.217
y = -0.2119x + 96.039
50
60
70
80
90
100
40 50 60 70 80 90 100
speed (mph)
Lmax
(dB
A)
S1 DGAC S5 DGAC Linear (S1 DGAC) Linear (S5 DGAC)
Figure C-10. (this and previous page) Vehicle pass-by data, pre-overlay; Site 1 (DGAC), Site 5 (DGAC). Automobiles (top), medium trucks (middle), and heavy trucks (bottom).
Microphone location: distance 25 ft, height 5 ft.

Appendix C Caltrans Thin Lift Study
C-40
y = 0.1089x + 62.221
y = 0.055x + 64.724
50
60
70
80
90
100
40 50 60 70 80 90 100
speed (mph)
Lmax
(dB
A)
S1 DGAC S5 DGAC Linear (S1 DGAC) Linear (S5 DGAC)
y = x - 1.6
y = 0.4363x + 49
50
60
70
80
90
100
40 50 60 70 80 90 100
speed (mph)
Lmax
(dB
A)
S1 DGAC S5 DGAC Linear (S1 DGAC) Linear (S5 DGAC)

Appendix C Caltrans Thin Lift Study
C-41
y = 0.9955x - 1.2691
y = -0.411x + 96.273
50
60
70
80
90
100
40 50 60 70 80 90 100
speed (mph)
Lmax
(dB
A)
S1 DGAC S5 DGAC Linear (S1 DGAC) Linear (S5 DGAC)
Figure C-11. (this and previous page) Vehicle pass-by data, pre-overlay; Site 1 (DGAC), Site 5 (DGAC). Automobiles (top), medium trucks (middle), and heavy trucks (bottom).
Microphone location: distance 50 ft, height 5 ft.

Appendix C Caltrans Thin Lift Study
C-42
y = 0.0998x + 64.768
y = 0.1619x + 60.216
50
60
70
80
90
100
40 50 60 70 80 90 100
speed (mph)
Lmax
(dB
A)
S1 DGAC S5 DGAC Linear (S1 DGAC) Linear (S5 DGAC)
y = 0.8047x + 28.721
y = 0.8902x + 21.428
50
60
70
80
90
100
40 50 60 70 80 90 100
speed (mph)
Lmax
(dB
A)
S1 DGAC S5 DGAC Linear (S1 DGAC) Linear (S5 DGAC)

Appendix C Caltrans Thin Lift Study
C-43
50
60
70
80
90
100
40 50 60 70 80 90 100
speed (mph)
Lmax
(dB
A)
S1 DGAC S5 DGAC Linear (S1 DGAC) Linear (S5 DGAC)
Figure C-12. (this and previous page) Vehicle pass-by data, pre-overlay; Site 1 (DGAC), Site 5 (DGAC). Automobiles (top), medium trucks (middle), and heavy trucks (bottom).
Microphone location: distance 50 ft, height 15 ft.

Appendix C Caltrans Thin Lift Study
C-44
C.3 Post-Overlay – Pavement Age: 4 months
y = 0.1972x + 65.408
y = 0.1773x + 62.631
50
60
70
80
90
100
40 50 60 70 80 90 100
speed (mph)
Lmax
(dB
A)
S1 DGAC S2 OGAC (75 mm) Linear (S1 DGAC) Linear (S2 OGAC (75 mm))
y = 0.1792x + 71.833
y = 0.2198x + 66.497
50
60
70
80
90
100
40 50 60 70 80 90 100
speed (mph)
Lmax
(dB
A)
S1 DGAC S2 OGAC (75 mm) Linear (S1 DGAC) Linear (S2 OGAC (75 mm))

Appendix C Caltrans Thin Lift Study
C-45
y = 0.2639x + 70.197
y = 0.2185x + 70.123
50
60
70
80
90
100
40 50 60 70 80 90 100
speed (mph)
Lmax
(dB
A)
S1 DGAC S2 OGAC (75 mm) Linear (S1 DGAC) Linear (S2 OGAC (75 mm))
Figure C-13. (this and previous page) Vehicle pass-by data, post-overlay, 4 months age; Site 1 (DGAC 30mm), Site 2 (OGAC 75mm). Automobiles (top), medium trucks (middle),
and heavy trucks (bottom). Microphone location: distance 25 ft, height 5 ft.

Appendix C Caltrans Thin Lift Study
C-46
y = 0.1956x + 58.19
y = 0.1919x + 55.658
50
60
70
80
90
100
40 50 60 70 80 90 100
speed (mph)
Lmax
(dB
A)
S1 DGAC S2 OGAC (75 mm) Linear (S1 DGAC) Linear (S2 OGAC (75 mm))
y = 0.1905x + 64.223
y = 0.2923x + 56.302
50
60
70
80
90
100
40 50 60 70 80 90 100
speed (mph)
Lmax
(dB
A)
S1 DGAC S2 OGAC (75 mm) Linear (S1 DGAC) Linear (S2 OGAC (75 mm))

Appendix C Caltrans Thin Lift Study
C-47
y = 0.2664x + 63.635
y = 0.2313x + 63.764
50
60
70
80
90
100
40 50 60 70 80 90 100
speed (mph)
Lmax
(dB
A)
S1 DGAC S2 OGAC (75 mm) Linear (S1 DGAC) Linear (S2 OGAC (75 mm))
Figure C-14. (this and previous page) Vehicle pass-by data, post-overlay, 4 months age; Site 1 (DGAC 30mm), Site 2 (OGAC 75mm). Automobiles (top), medium trucks (middle),
and heavy trucks (bottom). Microphone location: distance 50 ft, height 5 ft.

Appendix C Caltrans Thin Lift Study
C-48
y = 0.1944x + 60.329
y = 0.1621x + 58.588
50
60
70
80
90
100
40 50 60 70 80 90 100
speed (mph)
Lmax
(dB
A)
S1 DGAC S2 OGAC (75 mm) Linear (S1 DGAC) Linear (S2 OGAC (75 mm))
y = 0.2307x + 63.192
y = 0.3022x + 55.961
50
60
70
80
90
100
40 50 60 70 80 90 100
speed (mph)
Lmax
(dB
A)
S1 DGAC S2 OGAC (75 mm) Linear (S1 DGAC) Linear (S2 OGAC (75 mm))

Appendix C Caltrans Thin Lift Study
C-49
y = 0.3103x + 62.576
y = 0.2343x + 64.263
50
60
70
80
90
100
40 50 60 70 80 90 100
speed (mph)
Lmax
(dB
A)
S1 DGAC S2 OGAC (75 mm) Linear (S1 DGAC) Linear (S2 OGAC (75 mm))
Figure C-15. Vehicle pass-by data, post-overlay, 4 months age; Site 1 (DGAC 30mm), Site 2 (OGAC 75mm). Automobiles (top), medium trucks (middle), and heavy trucks (bottom).
Microphone location: distance 50 ft, height 15 ft.

Appendix C Caltrans Thin Lift Study
C-50
y = 0.2066x + 64.852
y = 0.1853x + 63.58
50
60
70
80
90
100
40 50 60 70 80 90 100
speed (mph)
Lmax
(dB
A)
S1 DGAC S3 OGAC (30 mm) Linear (S1 DGAC) Linear (S3 OGAC (30 mm))
y = 0.1339x + 74.019
y = -0.0257x + 84.075
50
60
70
80
90
100
40 50 60 70 80 90 100
speed (mph)
Lmax
(dB
A)
S1 DGAC S3 OGAC (30 mm) Linear (S1 DGAC) Linear (S3 OGAC (30 mm))

Appendix C Caltrans Thin Lift Study
C-51
y = 0.2637x + 70.322
y = 0.1815x + 73.63
50
60
70
80
90
100
40 50 60 70 80 90 100
speed (mph)
Lmax
(dB
A)
S1 DGAC S3 OGAC (30 mm) Linear (S1 DGAC) Linear (S3 OGAC (30 mm))
Figure C-16. (this and previous page) Vehicle pass-by data, post-overlay, 4 months age; Site 1 (DGAC 30mm), Site 3 (OGAC 30mm). Automobiles (top), medium trucks (middle),
and heavy trucks (bottom). Microphone location: distance 25 ft, height 5 ft.

Appendix C Caltrans Thin Lift Study
C-52
y = 0.2085x + 57.542
y = 0.2077x + 54.487
50
60
70
80
90
100
40 50 60 70 80 90 100
speed (mph)
Lmax
(dB
A)
S1 DGAC S3 OGAC (30 mm) Linear (S1 DGAC) Linear (S3 OGAC (30 mm))
y = 0.1383x + 66.811
y = -0.0425x + 77.816
50
60
70
80
90
100
40 50 60 70 80 90 100
speed (mph)
Lmax
(dB
A)
S1 DGAC S3 OGAC (30 mm) Linear (S1 DGAC) Linear (S3 OGAC (30 mm))

Appendix C Caltrans Thin Lift Study
C-53
y = 0.2562x + 64.294
y = 0.1981x + 65.474
50
60
70
80
90
100
40 50 60 70 80 90 100
speed (mph)
Lmax
(dB
A)
S1 DGAC S3 OGAC (30 mm) Linear (S1 DGAC) Linear (S3 OGAC (30 mm))
Figure C-17. (this and previous page) Vehicle pass-by data, post-overlay, 4 months age; Site 1 (DGAC 30mm), Site 3 (OGAC 30mm). Automobiles (top), medium trucks (middle),
and heavy trucks (bottom). Microphone location: distance 50 ft, height 5 ft.

Appendix C Caltrans Thin Lift Study
C-54
y = 0.2056x + 59.74
y = 0.1864x + 57.925
50
60
70
80
90
100
40 50 60 70 80 90 100
speed (mph)
Lmax
(dB
A)
S1 DGAC S3 OGAC (30 mm) Linear (S1 DGAC) Linear (S3 OGAC (30 mm))
y = 0.1443x + 68.072
y = 0.0096x + 76.083
50
60
70
80
90
100
40 50 60 70 80 90 100
speed (mph)
Lmax
(dB
A)
S1 DGAC S3 OGAC (30 mm) Linear (S1 DGAC) Linear (S3 OGAC (30 mm))

Appendix C Caltrans Thin Lift Study
C-55
y = 0.2953x + 63.604
y = 0.2386x + 64.517
50
60
70
80
90
100
40 50 60 70 80 90 100
speed (mph)
Lmax
(dB
A)
S1 DGAC S3 OGAC (30 mm) Linear (S1 DGAC) Linear (S3 OGAC (30 mm))
Figure C-18. (this and previous page) Vehicle pass-by data, post-overlay, 4 months age; Site 1 (DGAC 30mm), Site 3 (OGAC 30mm). Automobiles (top), medium trucks (middle),
and heavy trucks (bottom). Microphone location: distance 50 ft, height 15 ft.

Appendix C Caltrans Thin Lift Study
C-56
y = 0.1574x + 68.4
y = 0.1289x + 66.876
50
60
70
80
90
100
40 50 60 70 80 90 100
speed (mph)
Lmax
(dB
A)
S1 DGAC S4 RAC Linear (S1 DGAC) Linear (S4 RAC)
y = 0.2279x + 67.912
y = 0.0137x + 79.539
50
60
70
80
90
100
40 50 60 70 80 90 100
speed (mph)
Lmax
(dB
A)
S1 DGAC S4 RAC Linear (S1 DGAC) Linear (S4 RAC)

Appendix C Caltrans Thin Lift Study
C-57
y = 0.3508x + 65.326
y = 0.3342x + 62.975
50
60
70
80
90
100
40 50 60 70 80 90 100
speed (mph)
Lmax
(dB
A)
S1 DGAC S4 RAC Linear (S1 DGAC) Linear (S4 RAC)
Figure C-19. (this and previous page) Vehicle pass-by data, post-overlay, 4 months age;
Site 1 (DGAC 30mm), Site 4 (RAC Type O 30mm). Automobiles (top), medium trucks (middle), and heavy trucks (bottom). Microphone location: distance 25 ft, height 5 ft.

Appendix C Caltrans Thin Lift Study
C-58
y = 0.1531x + 61.495
y = 0.1331x + 59.549
50
60
70
80
90
100
40 50 60 70 80 90 100
speed (mph)
Lmax
(dB
A)
S1 DGAC S4 RAC Linear (S1 DGAC) Linear (S4 RAC)
y = 0.197x + 62.791
y = -0.0496x + 77.145
50
60
70
80
90
100
40 50 60 70 80 90 100
speed (mph)
Lmax
(dB
A)
S1 DGAC S2 OGAC (75 mm) Linear (S1 DGAC) Linear (S2 OGAC (75 mm))

Appendix C Caltrans Thin Lift Study
C-59
y = 0.3492x + 58.8
y = 0.2852x + 59.412
50
60
70
80
90
100
40 50 60 70 80 90 100
speed (mph)
Lmax
(dB
A)
S1 DGAC S4 RAC Linear (S1 DGAC) Linear (S4 RAC)
Figure C-20. (this and previous page) Vehicle pass-by data, post-overlay, 4 months age;
Site 1 (DGAC 30mm), Site 4 (RAC Type O 30mm). Automobiles (top), medium trucks (middle), and heavy trucks (bottom). Microphone location: distance 50 ft, height 5 ft.

Appendix C Caltrans Thin Lift Study
C-60
y = 0.1551x + 63.296
y = 0.1359x + 61.22
50.0
60.0
70.0
80.0
90.0
100.0
40 50 60 70 80 90 100
speed (mph)
Lmax
(dB
A)
S1 DGAC S4 RAC Linear (S1 DGAC) Linear (S4 RAC)
y = 0.2422x + 61.733
y = -0.0261x + 76.75
50
60
70
80
90
100
40 50 60 70 80 90 100
speed (mph)
Lmax
(dB
A)
S1 DGAC S4 RAC Linear (S1 DGAC) Linear (S4 RAC)

Appendix C Caltrans Thin Lift Study
C-61
y = 0.385x + 58.51
y = 0.3098x + 59.356
50
60
70
80
90
100
40 50 60 70 80 90 100
speed (mph)
Lmax
(dB
A)
S1 DGAC S4 RAC Linear (S1 DGAC) Linear (S4 RAC)
Figure C-21. (this and previous page) Vehicle pass-by data, post-overlay, 4 months age;
Site 1 (DGAC 30mm), Site 4 (RAC Type O 30mm). Automobiles (top), medium trucks (middle), and heavy trucks (bottom). Microphone location: distance 50 ft, height 15 ft.

Appendix C Caltrans Thin Lift Study
C-62
y = 0.1224x + 70.656
y = 0.003x + 78.287
50
60
70
80
90
100
40 50 60 70 80 90 100
speed (mph)
Lmax
(dB
A)
S1 DGAC S5 BWC Linear (S1 DGAC) Linear (S5 BWC)
y = 0.1242x + 73.742
y = -2.5118x + 247.84
50
60
70
80
90
100
40 50 60 70 80 90 100
speed (mph)
Lmax
(dB
A)
S1 DGAC S5 BWC Linear (S1 DGAC) Linear (S5 BWC)

Appendix C Caltrans Thin Lift Study
C-63
y = 0.28x + 69.431
y = 0.1657x + 75.298
50
60
70
80
90
100
40 50 60 70 80 90 100
speed (mph)
Lmax
(dB
A)
S1 DGAC S5 BWC Linear (S1 DGAC) Linear (S5 BWC)
Figure C-22. (this and previous page) Vehicle pass-by data, post-overlay, 4 months age; Site 1 (DGAC 30mm), Site 5 (BWC 30mm). Automobiles (top), medium trucks (middle),
and heavy trucks (bottom). Microphone location: distance 25 ft, height 5 ft.

Appendix C Caltrans Thin Lift Study
C-64
y = 0.1094x + 64.202
y = 0.0795x + 65.348
50
60
70
80
90
100
40 50 60 70 80 90 100
speed (mph)
Lmax
(dB
A)
S1 DGAC S5 BWC Linear (S1 DGAC) Linear (S5 BWC)
y = 0.1055x + 68.036
y = -0.1386x + 84.118
50
60
70
80
90
100
40 50 60 70 80 90 100
speed (mph)
Lmax
(dB
A)
S1 DGAC S5 BWC Linear (S1 DGAC) Linear (S5 BWC)

Appendix C Caltrans Thin Lift Study
C-65
y = 0.2758x + 63.21
y = 0.1427x + 69.687
50
60
70
80
90
100
40 50 60 70 80 90 100
speed (mph)
Lmax
(dB
A)
S1 DGAC S5 BWC Linear (S1 DGAC) Linear (S5 BWC)
Figure C-23. (this and previous page) Vehicle pass-by data, post-overlay, 4 months age; Site 1 (DGAC 30mm), Site 5 (BWC 30mm). Automobiles (top), medium trucks (middle),
and heavy trucks (bottom). Microphone location: distance 50 ft, height 5 ft.

Appendix C Caltrans Thin Lift Study
C-66
y = 0.1281x + 64.969
y = 0.0942x + 66.828
50
60
70
80
90
100
40 50 60 70 80 90 100
speed (mph)
Lmax
(dB
A)
S1 DGAC S5 BWC Linear (S1 DGAC) Linear (S5 BWC)
y = 0.1283x + 68.227
y = -0.2064x + 90.369
50
60
70
80
90
100
40 50 60 70 80 90 100
speed (mph)
Lmax
(dB
A)
S1 DGAC S5 BWC Linear (S1 DGAC) Linear (S5 BWC)

Appendix C Caltrans Thin Lift Study
C-67
y = 0.3033x + 63.075
y = 0.1876x + 69.073
50
60
70
80
90
100
40 50 60 70 80 90 100
speed (mph)
Lmax
(dB
A)
S1 DGAC S5 BWC Linear (S1 DGAC) Linear (S5 BWC)
Figure C-24. (this and previous page) Vehicle pass-by data, post-overlay, 4 months age; Site 1 (DGAC 30mm), Site 5 (BWC 30mm). Automobiles (top), medium trucks (middle),
and heavy trucks (bottom). Microphone location: distance 50 ft, height 15 ft.

Appendix C Caltrans Thin Lift Study
C-68
C.4 Post-Overlay – Pavement Age: 10 months
y = 0.1043x + 71.941
y = 0.0901x + 68.991
50
60
70
80
90
100
40 50 60 70 80 90 100
speed (mph)
Lmax
(dB
A)
S1 DGAC S2 OGAC (75 mm) Linear (S1 DGAC) Linear (S2 OGAC (75 mm))
y = 0.0161x + 81.463
y = 0.0533x + 76.199
50
60
70
80
90
100
40 50 60 70 80 90 100
speed (mph)
Lmax
(dB
A)
S1 DGAC S2 OGAC (75 mm) Linear (S1 DGAC) Linear (S2 OGAC (75 mm))

Appendix C Caltrans Thin Lift Study
C-69
y = 0.1439x + 77.694
y = 0.1749x + 72.845
50
60
70
80
90
100
40 50 60 70 80 90 100
speed (mph)
Lmax
(dB
A)
S1 DGAC S2 OGAC (75 mm) Linear (S1 DGAC) Linear (S2 OGAC (75 mm))
Figure C-25. (this and previous page) Vehicle pass-by data, post-overlay, 10 months age; Site 1 (DGAC 30mm), Site 2 (OGAC 75mm). Automobiles (top), medium trucks (middle),
and heavy trucks (bottom). Microphone location: distance 25 ft, height 5 ft.

Appendix C Caltrans Thin Lift Study
C-70
y = 0.0991x + 64.654
y = 0.0808x + 63.555
50
60
70
80
90
100
40 50 60 70 80 90 100
speed (mph)
Lmax
(dB
A)
S1 DGAC S2 OGAC (75 mm) Linear (S1 DGAC) Linear (S2 OGAC (75 mm))
y = 0.0341x + 72.917
y = 0.0321x + 71.46
50
60
70
80
90
100
40 50 60 70 80 90 100
speed (mph)
Lmax
(dB
A)
S1 DGAC S2 OGAC (75 mm) Linear (S1 DGAC) Linear (S2 OGAC (75 mm))

Appendix C Caltrans Thin Lift Study
C-71
y = 0.1708x + 69.27
y = 0.2308x + 63.761
50
60
70
80
90
100
40 50 60 70 80 90 100
speed (mph)
Lmax
(dB
A)
S1 DGAC S2 OGAC (75 mm) Linear (S1 DGAC) Linear (S2 OGAC (75 mm))
Figure C-26. (this and previous page) Vehicle pass-by data, post-overlay, 10 months age; Site 1 (DGAC 30mm), Site 2 (OGAC 75mm). Automobiles (top), medium trucks (middle),
and heavy trucks (bottom). Microphone location: distance 50 ft, height 5 ft.

Appendix C Caltrans Thin Lift Study
C-72
y = 0.113x + 66.035
y = 0.0923x + 63.725
50
60
70
80
90
100
40 50 60 70 80 90 100
speed (mph)
Lmax
(dB
A)
S1 DGAC S2 OGAC (75 mm) Linear (S1 DGAC) Linear (S2 OGAC (75 mm))
y = 0.0125x + 76.036
y = 0.0062x + 73.392
50
60
70
80
90
100
40 50 60 70 80 90 100
speed (mph)
Lmax
(dB
A)
S1 DGAC S2 OGAC (75 mm) Linear (S1 DGAC) Linear (S2 OGAC (75 mm))

Appendix C Caltrans Thin Lift Study
C-73
y = 0.2277x + 67.968
y = 0.2002x + 66.575
50
60
70
80
90
100
40 50 60 70 80 90 100
speed (mph)
Lmax
(dB
A)
S1 DGAC S2 OGAC (75 mm) Linear (S1 DGAC) Linear (S2 OGAC (75 mm))
Figure C-27. (this and previous page) Vehicle pass-by data, post-overlay, 10 months age; Site 1 (DGAC 30mm), Site 2 (OGAC 75mm). Automobiles (top), medium trucks (middle),
and heavy trucks (bottom). Microphone location: distance 50 ft, height 15 ft.

Appendix C Caltrans Thin Lift Study
C-74
y = 0.1096x + 71.481
y = 0.1408x + 67.216
50
60
70
80
90
100
40 50 60 70 80 90 100
speed (mph)
Lmax
(dB
A)
S1 DGAC S3 OGAC (30 mm) Linear (S1 DGAC) Linear (S3 OGAC (30 mm))
y = 0.0071x + 81.607
y = -0.0911x + 86.094
50
60
70
80
90
100
40 50 60 70 80 90 100
speed (mph)
Lmax
(dB
A)
S1 DGAC S3 OGAC (30 mm) Linear (S1 DGAC) Linear (S3 OGAC (30 mm))

Appendix C Caltrans Thin Lift Study
C-75
y = 0.1061x + 80.34
y = 0.1586x + 76.26
50
60
70
80
90
100
40 50 60 70 80 90 100
speed (mph)
Lmax
(dB
A)
S1 DGAC S3 OGAC (30 mm) Linear (S1 DGAC) Linear (S3 OGAC (30 mm))
Figure C-28. (this and previous page) Vehicle pass-by data, post-overlay, 10 months age; Site 1 (DGAC 30mm), Site 3 (OGAC 30mm). Automobiles (top), medium trucks (middle),
and heavy trucks (bottom). Microphone location: distance 25 ft, height 5 ft.

Appendix C Caltrans Thin Lift Study
C-76
y = 0.1085x + 63.945
y = 0.1551x + 58.799
50
60
70
80
90
100
40 50 60 70 80 90 100
speed (mph)
Lmax
(dB
A)
S1 DGAC S3 OGAC (30 mm) Linear (S1 DGAC) Linear (S3 OGAC (30 mm))
y = 0.0164x + 73.555
y = -0.0902x + 78.782
50
60
70
80
90
100
40 50 60 70 80 90 100
speed (mph)
Lmax
(dB
A)
S1 DGAC S3 OGAC (30 mm) Linear (S1 DGAC) Linear (S3 OGAC (30 mm))

Appendix C Caltrans Thin Lift Study
C-77
y = 0.1285x + 72.27
y = 0.1509x + 69.84
50
60
70
80
90
100
40 50 60 70 80 90 100
speed (mph)
Lmax
(dB
A)
S1 DGAC S3 OGAC (30 mm) Linear (S1 DGAC) Linear (S3 OGAC (30 mm))
Figure C-29. (this and previous page) Vehicle pass-by data, post-overlay, 10 months age; Site 1 (DGAC 30mm), Site 3 (OGAC 30mm). Automobiles (top), medium trucks (middle),
and heavy trucks (bottom). Microphone location: distance 50 ft, height 5 ft.

Appendix C Caltrans Thin Lift Study
C-78
y = 0.119x + 65.552
y = 0.1202x + 63.594
50
60
70
80
90
100
40 50 60 70 80 90 100
speed (mph)
Lmax
(dB
A)
S1 DGAC S3 OGAC (30 mm) Linear (S1 DGAC) Linear (S3 OGAC (30 mm))
y = 0.0156x + 75.304
y = -0.1136x + 81.96
50
60
70
80
90
100
40 50 60 70 80 90 100
speed (mph)
Lmax
(dB
A)
S1 DGAC S3 OGAC (30 mm) Linear (S1 DGAC) Linear (S3 OGAC (30 mm))

Appendix C Caltrans Thin Lift Study
C-79
y = 0.1849x + 70.968
y = 0.1612x + 71.108
50
60
70
80
90
100
40 50 60 70 80 90 100
speed (mph)
Lmax
(dB
A)
S1 DGAC S3 OGAC (30 mm) Linear (S1 DGAC) Linear (S3 OGAC (30 mm))
Figure C-30. (this and previous page) Vehicle pass-by data, post-overlay, 10 months age; Site 1 (DGAC 30mm), Site 3 (OGAC 30mm). Automobiles (top), medium trucks (middle),
and heavy trucks (bottom). Microphone location: distance 50 ft, height 15 ft.

Appendix C Caltrans Thin Lift Study
C-80
y = 0.116x + 71.251
y = 0.1087x + 69.069
50
60
70
80
90
100
40 50 60 70 80 90 100
speed (mph)
Lmax
(dB
A)
S1 DGAC S4 RAC Linear (S1 DGAC) Linear (S4 RAC)
y = 0.3326x + 61.862
y = 0.3409x + 60.021
50
60
70
80
90
100
40 50 60 70 80 90 100
speed (mph)
Lmax
(dB
A)
S1 DGAC S4 RAC Linear (S1 DGAC) Linear (S4 RAC)

Appendix C Caltrans Thin Lift Study
C-81
y = 0.2735x + 70.136
y = 0.5903x + 48.934
50
60
70
80
90
100
40 50 60 70 80 90 100
speed (mph)
Lmax
(dB
A)
S1 DGAC S4 RAC Linear (S1 DGAC) Linear (S4 RAC)
Figure C-31. (this and previous page) Vehicle pass-by data, post-overlay, 10 months age;
Site 1 (DGAC 30mm), Site 4 (RAC Type O 30mm). Automobiles (top), medium trucks (middle), and heavy trucks (bottom). Microphone location: distance 25 ft, height 5 ft.

Appendix C Caltrans Thin Lift Study
C-82
y = 0.1128x + 63.759
y = 0.1265x + 60.764
50
60
70
80
90
100
40 50 60 70 80 90 100
speed (mph)
Lmax
(dB
A)
S1 DGAC S4 RAC Linear (S1 DGAC) Linear (S4 RAC)
y = 0.3367x + 54.904
y = 0.3399x + 53.515
50
60
70
80
90
100
40 50 60 70 80 90 100
speed (mph)
Lmax
(dB
A)
S1 DGAC S4 RAC Linear (S1 DGAC) Linear (S4 RAC)

Appendix C Caltrans Thin Lift Study
C-83
y = 0.3159x + 60.83
y = 0.6684x + 37.264
50
60
70
80
90
100
40 50 60 70 80 90 100
speed (mph)
Lmax
(dB
A)
S1 DGAC S4 RAC Linear (S1 DGAC) Linear (S4 RAC)
Figure C-32. (this and previous page) Vehicle pass-by data, post-overlay, 10 months age;
Site 1 (DGAC 30mm), Site 4 (RAC Type O 30mm). Automobiles (top), medium trucks (middle), and heavy trucks (bottom). Microphone location: distance 50 ft, height 5 ft.
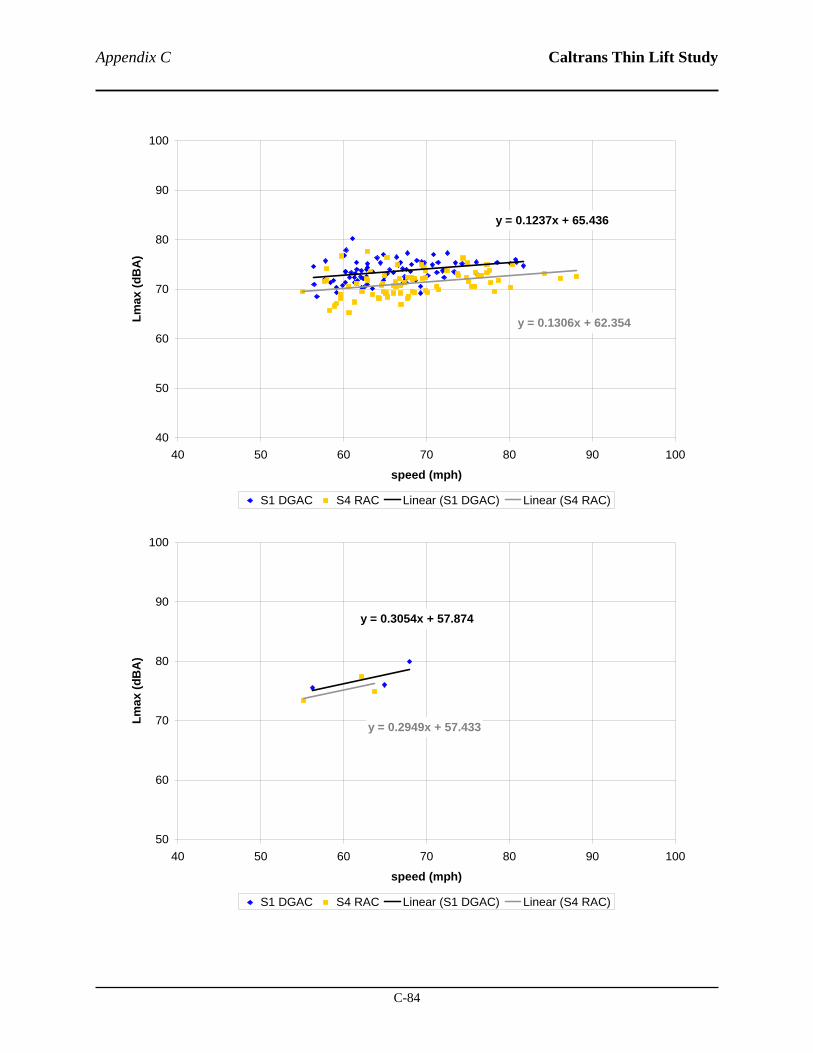
Appendix C Caltrans Thin Lift Study
C-84
y = 0.1237x + 65.436
y = 0.1306x + 62.354
40
50
60
70
80
90
100
40 50 60 70 80 90 100
speed (mph)
Lmax
(dB
A)
S1 DGAC S4 RAC Linear (S1 DGAC) Linear (S4 RAC)
y = 0.3054x + 57.874
y = 0.2949x + 57.433
50
60
70
80
90
100
40 50 60 70 80 90 100
speed (mph)
Lmax
(dB
A)
S1 DGAC S4 RAC Linear (S1 DGAC) Linear (S4 RAC)

Appendix C Caltrans Thin Lift Study
C-85
y = 0.3558x + 60.649
y = 0.5954x + 43.405
50
60
70
80
90
100
40 50 60 70 80 90 100
speed (mph)
Lmax
(dB
A)
S1 DGAC S4 RAC Linear (S1 DGAC) Linear (S4 RAC)
Figure C-33. (this and previous page) Vehicle pass-by data, post-overlay, 10 months age;
Site 1 (DGAC 30mm), Site 4 (RAC Type O 30mm). Automobiles (top), medium trucks (middle), and heavy trucks (bottom). Microphone location: distance 50 ft, height 15 ft.

Appendix C Caltrans Thin Lift Study
C-86
y = 0.1436x + 69.449
y = 0.1179x + 70.399
50
60
70
80
90
100
40 50 60 70 80 90 100
speed (mph)
Lmax
(dB
A)
S1 DGAC S5 BWC Linear (S1 DGAC) Linear (S5 BWC)
y = 0.2306x + 67.752
y = 0.0144x + 80.548
50
60
70
80
90
100
40 50 60 70 80 90 100
speed (mph)
Lmax
(dB
A)
S1 DGAC S5 BWC Linear (S1 DGAC) Linear (S5 BWC)

Appendix C Caltrans Thin Lift Study
C-87
y = 0.1417x + 78.216
y = 0.3181x + 67.616
50
60
70
80
90
100
40 50 60 70 80 90 100
speed (mph)
Lmax
(dB
A)
S1 DGAC S5 BWC Linear (S1 DGAC) Linear (S5 BWC)
Figure C-34. (this and previous page) Vehicle pass-by data, post-overlay, 10 months age;
Site 1 (DGAC 30mm), Site 5 (BWC 30mm). Automobiles (top), medium trucks (middle), and heavy trucks (bottom). Microphone location: distance 25 ft, height 5 ft.

Appendix C Caltrans Thin Lift Study
C-88
y = 0.1341x + 62.414
y = 0.1338x + 62.171
50
60
70
80
90
100
40 50 60 70 80 90 100
speed (mph)
Lmax
(dB
A)
S1 DGAC S5 BWC Linear (S1 DGAC) Linear (S5 BWC)
y = 0.2299x + 60.297
y = -0.0329x + 76.51
50
60
70
80
90
100
40 50 60 70 80 90 100
speed (mph)
Lmax
(dB
A)
S1 DGAC S5 BWC Linear (S1 DGAC) Linear (S5 BWC)

Appendix C Caltrans Thin Lift Study
C-89
y = 0.1876x + 68.543
y = 0.253x + 64.957
50
60
70
80
90
100
40 50 60 70 80 90 100
speed (mph)
Lmax
(dB
A)
S1 DGAC S5 RAC Linear (S1 DGAC) Linear (S5 RAC)
Figure C-35. (this and previous page) Vehicle pass-by data, post-overlay, 10 months age;
Site 1 (DGAC 30mm), Site 5 (BWC 30mm). Automobiles (top), medium trucks (middle), and heavy trucks (bottom). Microphone location: distance 50 ft, height 5 ft.

Appendix C Caltrans Thin Lift Study
C-90
y = 0.1402x + 64.358
y = 0.1217x + 64.715
50
60
70
80
90
100
40 50 60 70 80 90 100
speed (mph)
Lmax
(dB
A)
S1 DGAC S5 BWC Linear (S1 DGAC) Linear (S5 BWC)
y = 0.2333x + 61.745
y = -0.0433x + 78.698
50
60
70
80
90
100
40 50 60 70 80 90 100
speed (mph)
Lmax
(dB
A)
S1 DGAC S5 BWC Linear (S1 DGAC) Linear (S5 BWC)

Appendix C Caltrans Thin Lift Study
C-91
y = 0.2223x + 68.838
y = 0.2406x + 67.085
50
60
70
80
90
100
40 50 60 70 80 90 100
speed (mph)
Lmax
(dB
A)
S1 DGAC S5 BWC Linear (S1 DGAC) Linear (S5 BWC)
Figure C-36. (this and previous page) Vehicle pass-by data, post-overlay, 10 months age; Site 1 (DGAC 30mm), Site 5 (BWC 30mm). Automobiles (top), medium trucks (middle),
and heavy trucks (bottom). Microphone location: distance 50 ft, height 15 ft.

Appendix C Caltrans Thin Lift Study
C-92
C.5 Post-Overlay – Pavement Age: 16 months
y = 0.1565x + 68.654
y = 0.133x + 65.954
50
60
70
80
90
100
40 50 60 70 80 90 100
speed (mph)
Lmax
(dB
A)
S1 DGAC S2 OGAC (75 mm) Linear (S1 DGAC) Linear (S2 OGAC (75 mm))
y = -0.0247x + 84.194
y = 0.0171x + 78.864
50
60
70
80
90
100
40 50 60 70 80 90 100
speed (mph)
Lmax
(dB
A)
S1 DGAC S2 OGAC (75 mm) Linear (S1 DGAC) Linear (S2 OGAC (75 mm))

Appendix C Caltrans Thin Lift Study
C-93
y = 0.2389x + 72.482
y = 0.2815x + 66.618
50
60
70
80
90
100
40 50 60 70 80 90 100
speed (mph)
Lmax
(dB
A)
S1 DGAC S2 OGAC (75 mm) Linear (S1 DGAC) Linear (S2 OGAC (75 mm))
Figure C-37. (this and previous page) Vehicle pass-by data, post-overlay, 16 months age; Site 1 (DGAC 30mm), Site 2 (OGAC 75mm). Automobiles (top), medium trucks (middle),
and heavy trucks (bottom). Microphone location: distance 25 ft, height 5 ft.

Appendix C Caltrans Thin Lift Study
C-94
y = 0.1587x + 61.038
y = 0.1408x + 59.169
50
60
70
80
90
100
40 50 60 70 80 90 100
speed (mph)
Lmax
(dB
A)
S1 DGAC S2 OGAC (75 mm) Linear (S1 DGAC) Linear (S2 OGAC (75 mm))
y = 7E-05x + 75.57
y = 0.0154x + 72.951
50
60
70
80
90
100
40 50 60 70 80 90 100
speed (mph)
Lmax
(dB
A)
S1 DGAC S2 OGAC (75 mm) Linear (S1 DGAC) Linear (S2 OGAC (75 mm))

Appendix C Caltrans Thin Lift Study
C-95
y = 0.2474x + 65.306
y = 0.2802x + 61.012
50
60
70
80
90
100
40 50 60 70 80 90 100
speed (mph)
Lmax
(dB
A)
S1 DGAC S2 OGAC (75 mm) Linear (S1 DGAC) Linear (S2 OGAC (75 mm))
Figure C-38. (this and previous page) Vehicle pass-by data, post-overlay, 16 months age; Site 1 (DGAC 30mm), Site 2 (OGAC 75mm). Automobiles (top), medium trucks (middle),
and heavy trucks (bottom). Microphone location: distance 50 ft, height 5 ft.

Appendix C Caltrans Thin Lift Study
C-96
y = 0.1567x + 63.212
y = 0.1221x + 62.127
50
60
70
80
90
100
40 50 60 70 80 90 100
speed (mph)
Lmax
(dB
A)
S1 DGAC S2 OGAC (75 mm) Linear (S1 DGAC) Linear (S2 OGAC (75 mm))
y = 0.0264x + 75.315
y = -0.0012x + 74.973
50
60
70
80
90
100
40 50 60 70 80 90 100
speed (mph)
Lmax
(dB
A)
S1 DGAC S2 OGAC (75 mm) Linear (S1 DGAC) Linear (S2 OGAC (75 mm))

Appendix C Caltrans Thin Lift Study
C-97
y = 0.2646x + 66.168
y = 0.3146x + 60.202
50
60
70
80
90
100
40 50 60 70 80 90 100
speed (mph)
Lmax
(dB
A)
S1 DGAC S2 OGAC (75 mm) Linear (S1 DGAC) Linear (S2 OGAC (75 mm))
Figure C-39. (this and previous page) Vehicle pass-by data, post-overlay, 16 months age; Site 1 (DGAC 30mm), Site 2 (OGAC 75mm). Automobiles (top), medium trucks (middle),
and heavy trucks (bottom). Microphone location: distance 50 ft, height 15 ft.

Appendix C Caltrans Thin Lift Study
C-98
y = 0.2043x + 65.726
y = 0.0939x + 70.986
50
60
70
80
90
100
40.00 50.00 60.00 70.00 80.00 90.00 100.00
speed (mph)
Lmax
(dB
A)
S1 DGAC S3 OGAC (30 mm) Linear (S1 DGAC) Linear (S3 OGAC (30 mm))
y = -0.0774x + 87.796
y = -0.1358x + 91.496
50
60
70
80
90
100
40.00 50.00 60.00 70.00 80.00 90.00 100.00
speed (mph)
Lmax
(dB
A)
S1 DGAC S3 OGAC (30 mm) Linear (S1 DGAC) Linear (S3 OGAC (30 mm))

Appendix C Caltrans Thin Lift Study
C-99
y = 0.1872x + 75.384
y = 0.0059x + 85.088
50
60
70
80
90
100
40.00 50.00 60.00 70.00 80.00 90.00 100.00
speed (mph)
Lmax
(dB
A)
S1 DGAC S3 OGAC (30 mm) Linear (S1 DGAC) Linear (S3 OGAC (30 mm))
Figure C-40. (this and previous page) Vehicle pass-by data, post-overlay, 16 months age; Site 1 (DGAC 30mm), Site 3 (OGAC 30mm). Automobiles (top), medium trucks (middle),
and heavy trucks (bottom). Microphone location: distance 25 ft, height 5 ft.

Appendix C Caltrans Thin Lift Study
C-100
y = 0.1944x + 58.939
y = 0.1014x + 63.403
50
60
70
80
90
100
40.00 50.00 60.00 70.00 80.00 90.00 100.00
speed (mph)
Lmax
(dB
A)
S1 DGAC S3 OGAC (30 mm) Linear (S1 DGAC) Linear (S3 OGAC (30 mm))
y = -0.0723x + 80.434
y = -0.1256x + 83.696
50
60
70
80
90
100
40.00 50.00 60.00 70.00 80.00 90.00 100.00
speed (mph)
Lmax
(dB
A)
S1 DGAC S3 OGAC (30 mm) Linear (S1 DGAC) Linear (S3 OGAC (30 mm))

Appendix C Caltrans Thin Lift Study
C-101
y = 0.1676x + 69.827
y = 0.0189x + 77.429
50
60
70
80
90
100
40.00 50.00 60.00 70.00 80.00 90.00 100.00
speed (mph)
Lmax
(dB
A)
S1 DGAC S3 OGAC (30 mm) Linear (S1 DGAC) Linear (S3 OGAC (30 mm))
Figure C-41. (this and previous page) Vehicle pass-by data, post-overlay, 16 months age; Site 1 (DGAC 30mm), Site 3 (OGAC 30mm). Automobiles (top), medium trucks (middle),
and heavy trucks (bottom). Microphone location: distance 50 ft, height 5 ft.

Appendix C Caltrans Thin Lift Study
C-102
y = 0.2067x + 60.21
y = 0.1089x + 64.884
50
60
70
80
90
100
40.00 50.00 60.00 70.00 80.00 90.00 100.00
speed (mph)
Lmax
(dB
A)
S1 DGAC S3 OGAC (30 mm) Linear (S1 DGAC) Linear (S3 OGAC (30 mm))
y = -0.0342x + 79.452
y = -0.1055x + 84.276
50
60
70
80
90
100
40.00 50.00 60.00 70.00 80.00 90.00 100.00
speed (mph)
Lmax
(dB
A)
S1 DGAC S3 OGAC (30 mm) Linear (S1 DGAC) Linear (S3 OGAC (30 mm))

Appendix C Caltrans Thin Lift Study
C-103
y = 0.2208x + 68.502
y = -0.0168x + 82.034
50
60
70
80
90
100
40.00 50.00 60.00 70.00 80.00 90.00 100.00
speed (mph)
Lmax
(dB
A)
S1 DGAC S3 OGAC (30 mm) Linear (S1 DGAC) Linear (S3 OGAC (30 mm))
Figure C-42. (this and previous page) Vehicle pass-by data, post-overlay, 16 months age; Site 1 (DGAC 30mm), Site 3 (OGAC 30mm). Automobiles (top), medium trucks (middle),
and heavy trucks (bottom). Microphone location: distance 50 ft, height 15 ft.

Appendix C Caltrans Thin Lift Study
C-104
y = 0.1885x + 66.464
y = 0.1494x + 65.927
50
60
70
80
90
100
40.00 50.00 60.00 70.00 80.00 90.00 100.00
speed (mph)
Lmax
(dB
A)
S1 DGAC S4 RAC Linear (S1 DGAC) Linear (S4 RAC)
y = -0.1176x + 90.889
y = -0.2713x + 100.33
50
60
70
80
90
100
40.00 50.00 60.00 70.00 80.00 90.00 100.00
speed (mph)
Lmax
(dB
A)
S1 DGAC S4 RAC Linear (S1 DGAC) Linear (S4 RAC)

Appendix C Caltrans Thin Lift Study
C-105
y = 0.2404x + 72.298
y = 0.2467x + 69.538
50
60
70
80
90
100
40.00 50.00 60.00 70.00 80.00 90.00 100.00
speed (mph)
Lmax
(dB
A)
S1 DGAC S4 RAC Linear (S1 DGAC) Linear (S4 RAC)
Figure C-43. (this and previous page) Vehicle pass-by data, post-overlay, 16 months age;
Site 1 (DGAC 30mm), Site 4 (RAC Type O 30mm). Automobiles (top), medium trucks (middle), and heavy trucks (bottom). Microphone location: distance 25 ft, height 5 ft.

Appendix C Caltrans Thin Lift Study
C-106
y = 0.1916x + 58.805
y = 0.1523x + 58.747
50
60
70
80
90
100
40.00 50.00 60.00 70.00 80.00 90.00 100.00
speed (mph)
Lmax
(dB
A)
S1 DGAC S4 RAC Linear (S1 DGAC) Linear (S4 RAC)
y = -0.1217x + 84.113
y = -0.2378x + 91.351
50
60
70
80
90
100
40.00 50.00 60.00 70.00 80.00 90.00 100.00
speed (mph)
Lmax
(dB
A)
S1 DGAC S4 RAC Linear (S1 DGAC) Linear (S4 RAC)

Appendix C Caltrans Thin Lift Study
C-107
y = 0.2535x + 64.798
y = 0.2539x + 62.453
50
60
70
80
90
100
40.00 50.00 60.00 70.00 80.00 90.00 100.00
speed (mph)
Lmax
(dB
A)
S1 DGAC S4 RAC Linear (S1 DGAC) Linear (S4 RAC)
Figure C-44. (this and previous page) Vehicle pass-by data, post-overlay, 16 months age;
Site 1 (DGAC 30mm), Site 4 (RAC Type O 30mm). Automobiles (top), medium trucks (middle), and heavy trucks (bottom). Microphone location: distance 50 ft, height 5 ft.

Appendix C Caltrans Thin Lift Study
C-108
y = 0.1904x + 60.883
y = 0.1542x + 60.755
50
60
70
80
90
100
40.00 50.00 60.00 70.00 80.00 90.00 100.00
speed (mph)
Lmax
(dB
A)
S1 DGAC S4 RAC Linear (S1 DGAC) Linear (S4 RAC)
y = -0.0903x + 83.462
y = -0.344x + 100.26
50
60
70
80
90
100
40.00 50.00 60.00 70.00 80.00 90.00 100.00
speed (mph)
Lmax
(dB
A)
S1 DGAC S4 RAC Linear (S1 DGAC) Linear (S4 RAC)

Appendix C Caltrans Thin Lift Study
C-109
y = 0.3149x + 63.11
y = 0.2696x + 63.26
50
60
70
80
90
100
40.00 50.00 60.00 70.00 80.00 90.00 100.00
speed (mph)
Lmax
(dB
A)
S1 DGAC S4 RAC Linear (S1 DGAC) Linear (S4 RAC)
Figure C-45. (this and previous page) Vehicle pass-by data, post-overlay, 16 months age;
Site 1 (DGAC 30mm), Site 4 (RAC Type O 30mm). Automobiles (top), medium trucks (middle), and heavy trucks (bottom). Microphone location: distance 50 ft, height 15 ft.

Appendix C Caltrans Thin Lift Study
C-110
y = 0.2204x + 64.715
y = 0.1627x + 67.089
50
60
70
80
90
100
40 50 60 70 80 90 100
speed (mph)
Lmax
(dB
A)
S1 DGAC S5 BWC Linear (S1 DGAC) Linear (S5 BWC)
y = 0.0197x + 82.196
y = -0.0178x + 84.12
50
60
70
80
90
100
40 50 60 70 80 90 100
speed (mph)
Lmax
(dB
A)
S1 DGAC S5 BWC Linear (S1 DGAC) Linear (S5 BWC)

Appendix C Caltrans Thin Lift Study
C-111
y = 0.3183x + 67.64
y = 0.117x + 78.904
50
60
70
80
90
100
40 50 60 70 80 90 100
speed (mph)
Lmax
(dB
A)
S1 DGAC S5 BWC Linear (S1 DGAC) Linear (S5 BWC)
Figure C-46. (this and previous page) Vehicle pass-by data, post-overlay, 16 months age;
Site 1 (DGAC 30mm), Site 5 (BWC 30mm). Automobiles (top), medium trucks (middle), and heavy trucks (bottom). Microphone location: distance 25 ft, height 5 ft.

Appendix C Caltrans Thin Lift Study
C-112
y = 0.226x + 56.857
y = 0.1697x + 59.684
50
60
70
80
90
100
40 50 60 70 80 90 100
speed (mph)
Lmax
(dB
A)
S1 DGAC S5 BWC Linear (S1 DGAC) Linear (S5 BWC)
y = 0.0529x + 73.011
y = -0.031x + 78.232
50
60
70
80
90
100
40 50 60 70 80 90 100
speed (mph)
Lmax
(dB
A)
S1 DGAC S5 BWC Linear (S1 DGAC) Linear (S5 BWC)

Appendix C Caltrans Thin Lift Study
C-113
y = 0.3295x + 60.129
y = 0.0975x + 73.285
50
60
70
80
90
100
40 50 60 70 80 90 100
speed (mph)
Lmax
(dB
A)
S1 DGAC S5 BWC Linear (S1 DGAC) Linear (S5 BWC)
Figure C-47. (this and previous page) Vehicle pass-by data, post-overlay, 16 months age;
Site 1 (DGAC 30mm), Site 5 (BWC 30mm). Automobiles (top), medium trucks (middle), and heavy trucks (bottom). Microphone location: distance 50 ft, height 5 ft.

Appendix C Caltrans Thin Lift Study
C-114
y = 0.2244x + 58.979
y = 0.1667x + 61.405
50
60
70
80
90
100
40 50 60 70 80 90 100
speed (mph)
Lmax
(dB
A)
S1 DGAC S5 BWC Linear (S1 DGAC) Linear (S5 BWC)
y = 0.0733x + 73.096
y = -0.0136x + 78.256
50
60
70
80
90
100
40 50 60 70 80 90 100
speed (mph)
Lmax
(dB
A)
S1 DGAC S5 BWC Linear (S1 DGAC) Linear (S5 BWC)

Appendix C Caltrans Thin Lift Study
C-115
y = 0.3408x + 61.471
y = 0.1174x + 73.777
50
60
70
80
90
100
40 50 60 70 80 90 100
speed (mph)
Lmax
(dB
A)
S1 DGAC S5 BWC Linear (S1 DGAC) Linear (S5 BWC)
Figure C-48. (this and previous page) Vehicle pass-by data, post-overlay, 16 months age;
Site 1 (DGAC 30mm), Site 5 (BWC 30mm). Automobiles (top), medium trucks (middle), and heavy trucks (bottom). Microphone location: distance 50 ft, height 15 ft.


Appendix C Caltrans Thin Lift Study
C-117
C.6 Post-Overlay – Pavement Age: 52 months
y = 0.1048x + 72.14
y = 0.1037x + 68.587
50
60
70
80
90
100
40 50 60 70 80 90 100
speed (mph)
Lmax
(dB
A)
S1 DGAC S2 OGAC (75 mm) Linear (S1 DGAC) Linear (S2 OGAC (75 mm))
y = 0.2667x + 65.541
y = 0.2426x + 63.76
50
60
70
80
90
100
40 50 60 70 80 90 100
speed (mph)
Lmax
(dB
A)
S1 DGAC S2 OGAC (75 mm) Linear (S1 DGAC) Linear (S2 OGAC (75 mm))

Appendix C Caltrans Thin Lift Study
C-118
y = 0.1711x + 76.23
y = 0.2163x + 69.732
50
60
70
80
90
100
40 50 60 70 80 90 100
speed (mph)
Lmax
(dB
A)
S1 DGAC S2 OGAC (75 mm) Linear (S1 DGAC) Linear (S2 OGAC (75 mm))
Figure C-49. (this and previous page) Vehicle pass-by data, post-overlay, 52 months age; Site 1 (DGAC 30mm), Site 2 (OGAC 75mm). Automobiles (top), medium trucks (middle),
and heavy trucks (bottom). Microphone location: distance 25 ft, height 5 ft.

Appendix C Caltrans Thin Lift Study
C-119
y = 0.1086x + 64.062
y = 0.1005x + 62.184
50
60
70
80
90
100
40 50 60 70 80 90 100
speed (mph)
Lmax
(dB
A)
S1 DGAC S2 OGAC (75 mm) Linear (S1 DGAC) Linear (S2 OGAC (75 mm))
y = 0.2487x + 58.767
y = 0.2299x + 58.066
50
60
70
80
90
100
40 50 60 70 80 90 100
speed (mph)
Lmax
(dB
A)
S1 DGAC S2 OGAC (75 mm) Linear (S1 DGAC) Linear (S2 OGAC (75 mm))

Appendix C Caltrans Thin Lift Study
C-120
y = 0.1718x + 68.578
y = 0.2492x + 61.36
50
60
70
80
90
100
40 50 60 70 80 90 100
speed (mph)
Lmax
(dB
A)
S1 DGAC S2 OGAC (75 mm) Linear (S1 DGAC) Linear (S2 OGAC (75 mm))
Figure C-50. Vehicle pass-by data, post-overlay, 52 months age; Site 1 (DGAC 30mm),
Site 2 (OGAC 75mm). Automobiles (top), medium trucks (middle), and heavy trucks (bottom). Microphone location: distance 50 ft, height 5 ft.

Appendix C Caltrans Thin Lift Study
C-121
y = 0.1117x + 66.364
y = 0.1046x + 63.293
50
60
70
80
90
100
40 50 60 70 80 90 100
speed (mph)
Lmax
(dB
A)
S1 DGAC S2 OGAC (75 mm) Linear (S1 DGAC) Linear (S2 OGAC (75 mm))
y = 0.2756x + 59.855
y = 0.2631x + 56.88
50
60
70
80
90
100
40 50 60 70 80 90 100
speed (mph)
Lmax
(dB
A)
S1 DGAC S2 OGAC (75 mm) Linear (S1 DGAC) Linear (S2 OGAC (75 mm))

Appendix C Caltrans Thin Lift Study
C-122
y = 0.1908x + 69.886
y = 0.2447x + 62.86
50
60
70
80
90
100
40 50 60 70 80 90 100
speed (mph)
Lmax
(dB
A)
S1 DGAC S2 OGAC (75 mm) Linear (S1 DGAC) Linear (S2 OGAC (75 mm))
Figure C-51. Vehicle pass-by data, post-overlay, 52 months age; Site 1 (DGAC 30mm),
Site 2 (OGAC 75mm). Automobiles (top), medium trucks (middle), and heavy trucks (bottom). Microphone location: distance 50 ft, height 15 ft.

Appendix C Caltrans Thin Lift Study
C-123
y = 0.1541x + 68.9
y = 0.1409x + 68.261
50
60
70
80
90
100
40 50 60 70 80 90 100
speed (mph)
Lmax
(dB
A)
S1 DGAC S3 OGAC (30 mm) Linear (S1 DGAC) Linear (S3 OGAC (30 mm))
y = 0.2129x + 69.981
y = 0.1832x + 70.547
50
60
70
80
90
100
40 50 60 70 80 90 100
speed (mph)
Lmax
(dB
A)
S1 DGAC S3 OGAC (30 mm) Linear (S1 DGAC) Linear (S3 OGAC (30 mm))

Appendix C Caltrans Thin Lift Study
C-124
y = 0.2293x + 72.91
y = 0.2443x + 70.818
50
60
70
80
90
100
40 50 60 70 80 90 100
speed (mph)
Lmax
(dB
A)
S1 DGAC S3 OGAC (30 mm) Linear (S1 DGAC) Linear (S3 OGAC (30 mm))
Figure C-52. (this and previous page) Vehicle pass-by data, post-overlay, 52 months age; Site 1 (DGAC 30mm), Site 3 (OGAC 30mm). Automobiles (top), medium trucks (middle),
and heavy trucks (bottom). Microphone location: distance 25 ft, height 5 ft.

Appendix C Caltrans Thin Lift Study
C-125
y = 0.1735x + 59.729
y = 0.1269x + 61.43
50
60
70
80
90
100
40 50 60 70 80 90 100
speed (mph)
Lmax
(dB
A)
S1 DGAC S3 OGAC (30 mm) Linear (S1 DGAC) Linear (S3 OGAC (30 mm))
y = 0.2258x + 61.262
y = 0.2052x + 61.403
50
60
70
80
90
100
40 50 60 70 80 90 100
speed (mph)
Lmax
(dB
A)
S1 DGAC S3 OGAC (30 mm) Linear (S1 DGAC) Linear (S3 OGAC (30 mm))

Appendix C Caltrans Thin Lift Study
C-126
y = 0.221x + 65.86
y = 0.2948x + 60.697
50
60
70
80
90
100
40 50 60 70 80 90 100
speed (mph)
Lmax
(dB
A)
S1 DGAC S3 OGAC (30 mm) Linear (S1 DGAC) Linear (S3 OGAC (30 mm))
Figure C-53. (this and previous page) Vehicle pass-by data, post-overlay, 52 months age; Site 1 (DGAC 30mm), Site 3 (OGAC 30mm). Automobiles (top), medium trucks (middle),
and heavy trucks (bottom). Microphone location: distance 50 ft, height 5 ft.

Appendix C Caltrans Thin Lift Study
C-127
y = 0.1616x + 63.136
y = 0.1357x + 63.594
50
60
70
80
90
100
40 50 60 70 80 90 100
speed (mph)
Lmax
(dB
A)
S1 DGAC S3 OGAC (30 mm) Linear (S1 DGAC) Linear (S3 OGAC (30 mm))
y = 0.226x + 63.993
y = 0.2021x + 63.993
50
60
70
80
90
100
40 50 60 70 80 90 100
speed (mph)
Lmax
(dB
A)
S1 DGAC S3 OGAC (30 mm) Linear (S1 DGAC) Linear (S3 OGAC (30 mm))

Appendix C Caltrans Thin Lift Study
C-128
y = 0.2403x + 67.109
y = 0.2773x + 64.217
50
60
70
80
90
100
40 50 60 70 80 90 100
speed (mph)
Lmax
(dB
A)
S1 DGAC S3 OGAC (30 mm) Linear (S1 DGAC) Linear (S3 OGAC (30 mm))
Figure C-54. (this and previous page) Vehicle pass-by data, post-overlay, 52 months age; Site 1 (DGAC 30mm), Site 3 (OGAC 30mm). Automobiles (top), medium trucks (middle),
and heavy trucks (bottom). Microphone location: distance 50 ft, height 15 ft.

Appendix C Caltrans Thin Lift Study
C-129
y = 0.1234x + 71.034
y = 0.1601x + 67.149
50
60
70
80
90
100
40 50 60 70 80 90 100
speed (mph)
Lmax
(dB
A)
S1 DGAC S4 RAC Linear (S1 DGAC) Linear (S4 RAC)
y = 0.4199x + 55.576
y = 0.6074x + 43.424
50
60
70
80
90
100
40 50 60 70 80 90 100
speed (mph)
Lmax
(dB
A)
S1 DGAC S4 RAC Linear (S1 DGAC) Linear (S4 RAC)

Appendix C Caltrans Thin Lift Study
C-130
y = 0.1681x + 77.121
y = 0.3198x + 66.42
50
60
70
80
90
100
40 50 60 70 80 90 100
speed (mph)
Lmax
(dB
A)
S1 DGAC S4 RAC Linear (S1 DGAC) Linear (S4 RAC)
Figure C-55. (this and previous page) Vehicle pass-by data, post-overlay, 52 months age;
Site 1 (DGAC 30mm), Site 4 (RAC Type O 30mm). Automobiles (top), medium trucks (middle), and heavy trucks (bottom). Microphone location: distance 25 ft, height 5 ft.

Appendix C Caltrans Thin Lift Study
C-131
y = 0.1345x + 62.476
y = 0.1512x + 59.598
50
60
70
80
90
100
40 50 60 70 80 90 100
speed (mph)
Lmax
(dB
A)
S1 DGAC S4 RAC Linear (S1 DGAC) Linear (S4 RAC)
y = 0.4279x + 47.204y = 0.5811x + 37.308
50
60
70
80
90
100
40 50 60 70 80 90 100
speed (mph)
Lmax
(dB
A)
S1 DGAC S4 RAC Linear (S1 DGAC) Linear (S4 RAC)

Appendix C Caltrans Thin Lift Study
C-132
y = 0.2299x + 65.522
y = 0.3391x + 57.977
50
60
70
80
90
100
40 50 60 70 80 90 100
speed (mph)
Lmax
(dB
A)
S1 DGAC S4 RAC Linear (S1 DGAC) Linear (S4 RAC)
Figure C-56. (this and previous page) Vehicle pass-by data, post-overlay, 52 months age;
Site 1 (DGAC 30mm), Site 4 (RAC Type O 30mm). Automobiles (top), medium trucks (middle), and heavy trucks (bottom). Microphone location: distance 50 ft, height 5 ft.

Appendix C Caltrans Thin Lift Study
C-133
y = 0.1131x + 66.513
y = 0.1661x + 61.189
50
60
70
80
90
100
40 50 60 70 80 90 100
speed (mph)
Lmax
(dB
A)
S1 DGAC S4 RAC Linear (S1 DGAC) Linear (S4 RAC)
y = 0.4411x + 48.765
y = 0.6072x + 37.892
50
60
70
80
90
100
40 50 60 70 80 90 100
speed (mph)
Lmax
(dB
A)
S1 DGAC S4 RAC Linear (S1 DGAC) Linear (S4 RAC)

Appendix C Caltrans Thin Lift Study
C-134
y = 0.1988x + 70.121
y = 0.3519x + 59.133
50
60
70
80
90
100
40 50 60 70 80 90 100
speed (mph)
Lmax
(dB
A)
S1 DGAC S4 RAC Linear (S1 DGAC) Linear (S4 RAC)
Figure C-57. (this and previous page) Vehicle pass-by data, post-overlay, 52 months age;
Site 1 (DGAC 30mm), Site 4 (RAC Type O 30mm). Automobiles (top), medium trucks (middle), and heavy trucks (bottom). Microphone location: distance 50 ft, height 15 ft.

D-1
APPENDIX D. OVERALL PAVEMENT PERFORMANCE
This appendix shows the following:
• tables and plots of the modified SPBI values for each pavement pair, age, and
microphone position;
• tables and plots of the modified SPBI deltas (comparing each of the other pavements to
DGAC) for each pavement pair, age, and microphone position; and
• tables and discussion of the site bias decibel adjustment values.

Appendix D Caltrans Thin Lift Study
D-2
D.1 SPBI Values Tables show values with and without site bias being removed. All plots show only values with
the site bias removed.
Table D-1. Post-overlay measurements: sound levels for each pavement type (SPBI*) by site pairs with identical vehicle sets. Post-overlay pavements, including DGAC, aged 4,
10, 16, and 52 months. Site bias removed.** *modified SPB methodology **other sites calibrated to Site 1 to remove site bias unrelated to pavement type (based on baseline measurements)
SPBI* (dBA)
Pavement age
Microphone location
Site 1 (DGAC, 30 mm)
Site 2 (OGAC, 75 mm)
Site 1 (DGAC, 30 mm)
Site 3 (OGAC, 30 mm)
Site 1 (DGAC, 30 mm)
Site 4 (RAC
Type O, 30 mm)
Site 1 (DGAC, 30 mm)
Site 5 (BWC, 30 mm)
7.5 m (25 ft) low 80.1 80.1 79.8 79.8 79.3 79.3 80.1 80.1
15m (50 ft) low 73.3 73.3 72.9 72.9 72.4 72.4 73.2 73.2 baseline
15m (50 ft) high 73.5 73.5 72.9 72.9 74.3 74.3 77.7 77.7
7.5 m (25 ft) low 82.1 78.9 82.0 80.6 82.1 79.7 na na
15m (50 ft) low 75.3 72.7 75.3 73.6 75.3 72.7 75.3 75.5 4 months
15m (50 ft) high 77.1 73.8 77.1 75.4 77.2 75.1 76.9 76.2
7.5 m (25 ft) low 82.3 78.7 82.6 80.6 82.7 80.0 82.7 80.6
15m (50 ft) low 75.2 72.4 75.5 73.8 75.7 72.9 75.6 76.0 10 months
15m (50 ft) high 77.4 73.7 77.7 75.8 77.8 75.4 77.9 75.9
7.5 m (25 ft) low 82.5 79.0 82.4 80.7 82.4 80.2 82.5 80.7
15m (50 ft) low 75.6 72.6 75.5 73.9 75.5 73.3 75.4 75.9 16 months
15m (50 ft) high 77.5 74.4 77.3 76.2 77.3 75.9 77.4 75.9
7.5 m (25 ft) low 83.2 79.4 83.5 81.2 83.6 81.3 na na
15m (50 ft) low 75.5 72.5 75.9 74.1 75.9 73.6 na na 52 months
15m (50 ft) high 78.0 74.2 78.4 76.7 78.5 76.5 na na

Appendix D Caltrans Thin Lift Study
D-3
Table D-2. Post-overlay measurements: sound levels for each pavement type (SPBI*) by site pairs with identical vehicle sets.** Post-overlay pavements, including DGAC, aged 4,
10, 16, and 52 months. *modified SPB methodology **other sites not calibrated to Site 1 to remove site bias unrelated to pavement type
SPBI* (dBA)
Pavement age
Microphone location
Site 1 (DGAC, 30 mm)
Site 2 (OGAC, 75 mm)
Site 1 (DGAC, 30 mm)
Site 3 (OGAC, 30 mm)
Site 1 (DGAC, 30 mm)
Site 4 (RAC
Type O, 30 mm)
Site 1 (DGAC, 30 mm)
Site 5 (BWC, 30 mm)
7.5 m (25 ft) low 80.1 80.5 79.8 80.6 79.3 79.8 80.1 81.6
15m (50 ft) low 73.3 74.1 72.9 73.4 72.4 73.0 73.2 72.6 baseline
15m (50 ft) high 73.5 73.9 72.9 73.4 74.3 74.2 77.7 78.6
7.5 m (25 ft) low 82.1 79.3 82.0 81.3 82.1 80.2 na na
15m (50 ft) low 75.3 73.6 75.3 74.1 75.3 73.4 75.3 74.8 4 months
15m (50 ft) high 77.1 74.3 77.1 75.8 77.2 75.0 76.9 77.2
7.5 m (25 ft) low 82.3 79.1 82.6 81.3 82.7 80.6 82.7 82.1
15m (50 ft) low 75.2 73.2 75.5 74.3 75.7 73.6 75.6 75.4 10 months
15m (50 ft) high 77.4 74.2 77.7 76.3 77.8 75.3 77.9 76.9
7.5 m (25 ft) low 82.5 79.3 82.4 81.4 82.4 80.7 82.5 82.1
15m (50 ft) low 75.6 73.5 75.5 74.5 75.5 74.0 75.4 75.3 16 months
15m (50 ft) high 77.5 74.8 77.3 76.7 77.3 75.8 77.4 76.9
7.5 m (25 ft) low 83.2 79.7 83.5 81.9 83.6 81.8 na na
15m (50 ft) low 75.5 73.3 75.9 74.6 75.9 74.2 na na 52 months
15m (50 ft) high 78.0 74.6 78.4 77.1 78.5 76.4 na na

Appendix D Caltrans Thin Lift Study
D-4
SPBI for DGAC (S1) and OGAC 75 mm (S2) (post-overlay, ages 4, 10, 16, & 52 months)
microphone positions (distance_height in ft): 25_5; 50_5; 50_15
65
70
75
80
85
0 10 20 30 40 50 60
Pavement Age (months)
SPB
I* (d
BA
)
S1 25_5 S1 50_5 S1 50_15 S2 25_5 S2 50_5 S2 50_15
*modified SPBI methodology
Figure D-1. SPBI* values over time for pavement pair DGAC 30mm (S1) and OGAC 75mm (S2). Overlay pavements aged 4, 10, 16, and 52 months. Microphone locations: distance
7.5 m (25 ft), height 1.5 m (5 ft); distance 15 m (50 ft), height 1.5 m (5 ft); distance 15 m (50 ft), height 4.5 m (15 ft).

Appendix D Caltrans Thin Lift Study
D-5
SPBI for DGAC (S1) and OGAC 30 mm (S3) (post-overlay, ages 4, 10, 16, & 52 months)
microphone positions (distance_height in ft): 25_5; 50_5; 50_15
65
70
75
80
85
0 10 20 30 40 50 60
Pavement Age (months)
SPB
I* (d
BA
)
S1 25_5 S1 50_5 S1 50_15 S3 25_5 S3 50_5 S3 50_15
*modified SPBI methodology
Figure D-2. SPBI* values over time for pavement pair DGAC 30mm (S1) and OGAC 30mm (S3). Overlay pavements aged 4, 10, 16, and 52 months. Microphone locations: distance
7.5 m (25 ft), height 1.5 m (5 ft); distance 15 m (50 ft), height 1.5 m (5 ft); distance 15 m (50 ft), height 4.5 m (15 ft).

Appendix D Caltrans Thin Lift Study
D-6
SPBI for DGAC (S1) and RAC 30 mm (S4) (post-overlay, ages 4, 10, 16, & 52 months)
microphone positions (distance_height in ft): 25_5; 50_5; 50_15
65
70
75
80
85
0 10 20 30 40 50 60
Pavement Age (months)
SPB
I* (d
BA
)
S1 25_5 S1 50_5 S1 50_15 S4 25_5 S4 50_5 S4 50_15
*modified SPBI methodology
Figure D-3. SPBI* values over time for pavement pair DGAC 30mm (S1) and RAC Type O
30mm (S4). Overlay pavements aged 4, 10, 16, and 52 months. Microphone locations: distance 7.5 m (25 ft), height 1.5 m (5 ft); distance 15 m (50 ft), height 1.5 m (5 ft); distance
15 m (50 ft), height 4.5 m (15 ft).

Appendix D Caltrans Thin Lift Study
D-7
SPBI for DGAC (S1) and BWC 30 mm (S5) (post-overlay, ages 4, 10, & 16 months)
microphone positions (distance_height in ft): 25_5; 50_5; 50_15
65
70
75
80
85
0 10 20 30 40 50 60
Pavement Age (months)
SPB
I* (d
BA
)
S1 25_5 S1 50_5 S1 50_15 S5 25_5 S5 50_5 S5 50_15
*modified SPBI methodology
Figure D-4. SPBI* values over time for pavement pair DGAC 30mm (S1) and BWC 30mm (S5). Overlay pavements aged 4, 10, and 16 months. Microphone locations: distance 7.5 m (25 ft), height 1.5 m (5 ft); distance 15 m (50 ft), height 1.5 m (5 ft); distance 15 m (50 ft),
height 4.5 m (15 ft).

Appendix D Caltrans Thin Lift Study
D-8
Increase in SPBI* Values over Time (ages 4, 10, 16, & 52 months)microphone distance: 25 ft, height: 5 ft
-4
-3
-2
-1
0
1
2
3
4
0 10 20 30 40 50 60
Pavement Age (months)
SPB
I* In
crea
se o
ver V
alue
at 4
Mon
ths
(dB
A)
DGAC OGAC 75mm OGAC 30mmRAC Type O BWC
*modified SPBI methodology
0
Figure D-5. Increase in SPBI* values over time, as compared to values at 4 months.
Post-overlay results, all pavements (except BWC – no data available), including DGAC, aged 4, 10, 16, and 52 months. Microphone location: distance 7.5 m (25 ft), height 1.5 m
(5 ft).

Appendix D Caltrans Thin Lift Study
D-9
Increase in SPBI* Values over Time (ages 4, 10, 16, & 52 months)microphone distance: 50 ft, height: 5 ft
-4
-3
-2
-1
0
1
2
3
4
0 10 20 30 40 50 60
Pavement Age (months)
SPB
I* In
crea
se o
ver V
alue
at 4
Mon
ths
(dB
A)
DGAC OGAC 75mm OGAC 30mmRAC Type O BWC
*modified SPBI methodology
0
Figure D-6. Increase in SPBI* values over time, as compared to values at 4 months. Post-overlay results, all pavements, including DGAC, aged 4, 10, 16, and 52 months
(limited data for BWC). Microphone location: distance 15 m (50 ft), height 1.5 m (5 ft).

Appendix D Caltrans Thin Lift Study
D-10
Increase in SPBI* Values over Time (ages 4, 10, 16, & 52 months)microphone distance: 50 ft, height: 15 ft
-4
-3
-2
-1
0
1
2
3
4
0 10 20 30 40 50 60
Pavement Age (months)
SPB
I* In
crea
se o
ver V
alue
at 4
Mon
ths
(dB
A)
DGAC OGAC 75mm OGAC 30mmRAC Type O BWC
*modified SPBI methodology
0
Figure D-7. Increase in SPBI* values over time, as compared to values at 4 months. Post-overlay results, all pavements, including DGAC, aged 4, 10, 16, and 52 months (limited data for BWC). Microphone location: distance 15 m (50 ft), height 4.5 m (15 ft).

Appendix D Caltrans Thin Lift Study
D-11
D.2 SPBI Deltas
Tables show values with and without site bias being removed. All plots show only values with
the site bias removed.
Table D-3. Post-overlay measurements: site differences due to type of pavement (SPBI*
deltas) by site pairs with identical vehicle sets. Post-overlay pavements, including DGAC, aged 4, 10, 16, and 52 months. Site bias removed.**
*modified SPB methodology **other sites calibrated to Site 1 to remove site bias unrelated to pavement type (based on baseline measurements)
SPBI* delta (dBA) Pavement
age Microphone
location Site 2 – Site 1 (OGAC,
75 mm – DGAC)
Site 3 – Site 1 (OGAC,
30 mm – DGAC)
Site 4 – Site 1 (RAC Type O, 30 mm
– DGAC)
Site 5 – Site 1 (BWC,
30 mm – DGAC) 7.5 m (25 ft)
low 0.0 0.0 0.0 0.0
15m (50 ft) low 0.0 0.0 0.0 0.0 baseline
15m (50 ft) high 0.0 0.0 0.0 0.0
7.5 m (25 ft) low -3.1 -1.5 -2.5 na
15m (50 ft) low -2.6 -1.7 -2.6 0.2 4 months
15m (50 ft) high -3.2 -1.7 -2.1 -0.7
7.5 m (25 ft) low -3.6 -2.0 -2.6 -2.1
15m (50 ft) low -2.8 -1.8 -2.7 0.4 10 months
15m (50 ft) high -3.6 -1.9 -2.4 -2.0
7.5 m (25 ft) low -3.5 -1.7 -2.3 -1.8
15m (50 ft) low -2.9 -1.5 -2.2 0.5 16 months
15m (50 ft) high -3.1 -1.1 -1.4 -1.5
7.5 m (25 ft) low -3.8 -2.4 -2.3 na
15m (50 ft) low -3.0 -1.7 -2.3 na 52 months
15m (50 ft) high -3.8 -1.7 -2.0 na

Appendix D Caltrans Thin Lift Study
D-12
Table D-4. Post-overlay measurements: site differences due to type of pavement (SPBI* deltas) by site pairs with identical vehicle sets.** Post-overlay pavements, including
DGAC, aged 4, 10, 16, and 52 months. *modified SPB methodology **other sites not calibrated to Site 1 to remove site bias unrelated to pavement type
SPBI* delta (dBA) Pavement
age Microphone
location Site 2 – Site 1 (OGAC,
75 mm – DGAC)
Site 3 – Site 1 (OGAC,
30 mm – DGAC)
Site 4 – Site 1 (RAC Type O, 30 mm
– DGAC)
Site 5 – Site 1 (BWC,
30 mm – DGAC) 7.5 m (25 ft)
low 0.3 0.7 0.5 1.4
15m (50 ft) low 0.8 0.5 0.7 -0.6 baseline
15m (50 ft) high 0.4 0.5 -0.1 1.0
7.5 m (25 ft) low -2.8 -0.8 -1.9 na
15m (50 ft) low -1.8 -1.2 -1.9 -0.4 4 months
15m (50 ft) high -2.8 -1.3 -2.2 0.2
7.5 m (25 ft) low -3.3 -1.2 -2.1 -0.7
15m (50 ft) low -2.0 -1.3 -2.1 -0.2 10 months
15m (50 ft) high -3.2 -1.4 -2.5 -1.1
7.5 m (25 ft) low -3.2 -1.0 -1.7 -0.4
15m (50 ft) low -2.1 -1.0 -1.5 -0.2 16 months
15m (50 ft) high -2.6 -0.6 -1.5 -0.5
7.5 m (25 ft) low -3.4 -1.6 -1.8 na
15m (50 ft) low -2.1 -1.2 -1.6 na 52 months
15m (50 ft) high -3.4 -1.2 -2.1 na

Appendix D Caltrans Thin Lift Study
D-13
Pavement Effects Compared to DGAC (post-overlay, age ~4 mo)microphone positions (distance_height in ft): 25_5; 50_5; 50_15
-10
-9
-8
-7
-6
-5
-4
-3
-2
-1
0
1
2
3
4
5
SPB
I* D
elta
, Sx-
S1 (d
BA
)
25_550_550_15
OGAC 75 mmSite 2
OGAC 30 mmSite 3
RAC Type OSite 4
BWCSite 5
*modified SPBI methodology
0
Figure D-8. Pavement effects compared to DGAC (Site x minus Site 1) using modified
SPBI. Post-overlay results, all pavements, including DGAC, aged 4 months. Microphone locations: distance 7.5 m (25 ft), height 1.5 m (5 ft); distance 15 m (50 ft), height 1.5 m (5
ft); distance 15 m (50 ft), height 4.5 m (15 ft).

Appendix D Caltrans Thin Lift Study
D-14
Pavement Effects Compared to DGAC (post-overlay, age ~10 mo)microphone positions (distance_height in ft): 25_5; 50_5; 50_15
-10
-9
-8
-7
-6
-5
-4
-3
-2
-1
0
1
2
3
4
5
SPB
I* D
elta
, Sx-
S1 (d
BA
)
25_550_550_15
OGAC 75 mmSite 2
OGAC 30 mmSite 3
RAC Type OSite 4
BWCSite 5
*modified SPBI methodology
0
Figure D-9. Pavement effects compared to DGAC (Site x minus Site 1) using modified
SPBI. Post-overlay results, all pavements, including DGAC, aged 10 months. Microphone locations: distance 7.5 m (25 ft), height 1.5 m (5 ft); distance 15 m (50 ft),
height 1.5 m (5 ft); distance 15 m (50 ft), height 4.5 m (15 ft).

Appendix D Caltrans Thin Lift Study
D-15
Pavement Effects Compared to DGAC (post-overlay, age ~16 mo)microphone positions (distance_height in ft): 25_5; 50_5; 50_15
-10
-9
-8
-7
-6
-5
-4
-3
-2
-1
0
1
2
3
4
5
SPB
I* D
elta
, Sx-
S1 (d
BA
)
25_550_550_15
OGAC 75 mmSite 2
OGAC 30 mmSite 3
RAC Type OSite 4
BWCSite 5
*modified SPBI methodology
0
Figure D-10. Pavement effects compared to DGAC (Site x minus Site 1) using modified
SPBI. Post-overlay results, all pavements, including DGAC, aged 16 months. Microphone locations: distance 7.5 m (25 ft), height 1.5 m (5 ft); distance 15 m (50 ft),
height 1.5 m (5 ft); distance 15 m (50 ft), height 4.5 m (15 ft).

Appendix D Caltrans Thin Lift Study
D-16
Pavement Effects Compared to DGAC (post-overlay, age ~52 mo)microphone positions (distance_height in ft): 25_5; 50_5; 50_15
-10
-9
-8
-7
-6
-5
-4
-3
-2
-1
0
1
2
3
4
5
SPB
I* D
elta
, Sx-
S1 (d
BA
)
25_550_550_15
OGAC 75 mmSite 2
OGAC 30 mmSite 3
RAC Type OSite 4
BWCSite 5
*modified SPBI methodology
0
Figure D-11. Pavement effects compared to DGAC (Site x minus Site 1) using modified
SPBI. Post-overlay results, all pavements, including DGAC, aged 52 months. Microphone locations: distance 7.5 m (25 ft), height 1.5 m (5 ft); distance 15 m (50 ft),
height 1.5 m (5 ft); distance 15 m (50 ft), height 4.5 m (15 ft).

Appendix D Caltrans Thin Lift Study
D-17
Pavement Effects Compared to DGAC (ages 4, 10, 16, & 52 months)microphone distance: 25 ft, height: 5 ft
-6
-5
-4
-3
-2
-1
0
1
2
0 10 20 30 40 50 60
Pavement Age (months)
SPB
I* D
elta
, Sx-
S1 (d
BA
)
OGAC 75mm OGAC 30mmRAC Type O BWC
*modified SPBI methodology
0
Figure D-12. Pavement effects compared to DGAC (Site x minus Site 1) using modified
SPBI. Post-overlay results, all pavements, including DGAC, aged 4, 10, 16, and 52 months (limited data for BWC). Microphone location: distance 7.5 m (25 ft), height 1.5 m
(5 ft).

Appendix D Caltrans Thin Lift Study
D-18
Pavement Effects Compared to DGAC (ages 4, 10, 16, & 52 months)microphone distance: 50 ft, height: 5 ft
-6
-5
-4
-3
-2
-1
0
1
2
0 10 20 30 40 50 60
Pavement Age (months)
SPB
I* D
elta
, Sx-
S1 (d
BA
)
OGAC 75mm OGAC 30mmRAC Type O BWC
*modified SPBI methodology
0
Figure D-13. Pavement effects compared to DGAC (Site x minus Site 1) using modified
SPBI. Post-overlay results, all pavements, including DGAC, aged 4, 10, 16, and 52 months (limited data for BWC). Microphone location: distance 15 m (50 ft), height 1.5 m
(5 ft).

Appendix D Caltrans Thin Lift Study
D-19
Pavement Effects Compared to DGAC (ages 4, 10, 16, & 52 months)microphone distance: 50 ft, height: 15 ft
-6
-5
-4
-3
-2
-1
0
1
2
0 10 20 30 40 50 60
Pavement Age (months)
SPB
I* D
elta
, Sx-
S1 (d
BA
)
OGAC 75mm OGAC 30mmRAC Type O BWC
*modified SPBI methodology
0
Figure D-14. Pavement effects compared to DGAC (Site x minus Site 1) using modified
SPBI. Post-overlay results, all pavements, including DGAC, aged 4, 10, 16, and 52 months (limited data for BWC). Microphone location: distance 15 m (50 ft), height 4.5 m
(15 ft).

Appendix D Caltrans Thin Lift Study
D-20
D.3 Site Bias Decibel Adjustment Values
The baseline data collected in March 2002, with pavement at all sites being new DGAC, allow
for the determination of site differences unrelated to the type of pavement. Data from Sites 2-5
are compared to data from Site 1. Because the terrain is not identical for each site, some
differences are found. These differences are applied after the pavement overlays are in place in
order to remove site bias (calibrate to Site 1).
The differences (Site x minus Site 1) range from -0.6 to 1.4 dB(A) and can be seen in Table 1;
these differences are applied directly to (subtracted from) the SPBI results for post-overlay
measurements for each Site x.
Table D-5. Baseline measurements: Site differences unrelated to type of pavement (SPBI* deltas).
*modified SPB methodology SPBI delta (dB(A))
Microphone location Site 2 – Site 1
(DGAC)
Site 3 – Site 1
(DGAC)
Site 4 – Site 1
(DGAC)
Site 5 – Site 1
(DGAC)
25 ft (7.5 m) low 0.3 0.7 0.5 1.4
50 ft (15 m) low 0.8 0.5 0.7 -0.6
50 ft (15 m) high 0.4 0.5 -0.1 1.0

E-1
APPENDIX E. PAVEMENT PERFORMANCE BY VEHICLE TYPE
This appendix shows the following:
• tables and plots of the modified-SPB Lveh values for each pavement pair, age, and
microphone position;
• tables and plots of the modified-SPB Lveh deltas (comparing each of the other
pavements to DGAC) for each pavement pair, age, and microphone position; and
• plots of spectral data averaged over several vehicle pass-by events, shown with varying
parameter configurations.

Appendix E Caltrans Thin Lift Study
E-2
E.1 Lveh Values Tables show only values with site bias.

Appendix E Caltrans Thin Lift Study
E-3
Table E-1. Post-overlay measurements: sound levels for each pavement type (Lveh*) by site pairs with identical vehicle sets.** Post-overlay pavements, including DGAC, aged 4, 10, 16, and 52 months.
*modified SPB methodology **other sites not calibrated to Site 1 to remove site bias unrelated to pavement type
Modified Lveh (or average LAFmx) (dBA)
Site 1 (DGAC, 30 mm)
Site 2 (OGAC, 75 mm)
Site 1 (DGAC, 30 mm)
Site 3 (OGAC, 30 mm)
Site 1 (DGAC, 30 mm)
Site 4 (RAC Type O, 30
mm)
Site 1 (DGAC, 30 mm)
Site 5 (BWC, 30 mm)
Pav
emen
t age
Mic
roph
one
loca
tion
auto
med
truc
k
hvy
truck
auto
med
truc
k
hvy
truck
auto
med
truc
k
hvy
truck
auto
med
truc
k
hvy
truck
auto
med
truc
k
hvy
truck
auto
med
truc
k
hvy
truck
auto
med
truc
k
hvy
truck
auto
med
truc
k
hvy
truck
7.5 m (25 ft) low 76.5 83.6 83.4 76.5 83.9 84.0 76.4 81.0 83.6 77.5 81.6 84.1 76.6 81.9 82.2 77.8 82.3 82.1 76.4 81.3 84.0 77.5 81.9 85.7
15m (50 ft) low 69.3 76.4 76.9 70.0 77.3 77.7 69.1 74.4 76.8 70.1 74.3 77.2 69.4 75.0 75.5 71.2 76.2 74.9 69.2 74.9 77.2 68.5 74.5 76.5
base
line
15m (50 ft) high 71.1 78.0 75.1 71.6 78.9 75.1 71.0 75.7 75.1 72.1 75.9 74.7 71.3 77.1 77.4 72.4 77.0 76.3 71.3 74.8 82.8 71.5 75.4 83.9
7.5 m (25 ft) low 78.6 82.8 85.9 74.8 80.2 83.5 78.4 82.4 86.0 77.3 82.3 85.3 78.6 82.0 86.1 76.3 80.5 84.3 na na na na na na
15m (50 ft) low 71.2 75.9 79.5 68.9 74.5 77.9 71.3 75.5 79.5 69.9 74.9 78.3 71.5 75.0 79.5 69.3 73.8 77.6 71.4 74.6 79.5 71.1 75.2 78.9
4 m
onth
s
15m (50 ft) high 73.3 77.3 81.1 69.8 74.8 78.6 73.3 77.1 81.2 71.8 76.8 79.9 73.4 76.8 81.3 71.2 75.0 79.1 73.4 76.2 81 73.7 77.1 81.1
7.5 m (25 ft) low 78.9 82.5 86.3 75 79.4 83.3 78.8 82.1 86.7 77.1 80.2 85.7 78.9 82.8 86.7 76.5 80.6 84.8 79 82.5 86.8 78.4 81.5 86.2
15m (50 ft) low 71.2 75 79.5 68.9 73.4 77.6 71.2 74.6 80 69.7 72.9 78.9 71.2 76.1 80.0 69.4 74.0 77.8 71.3 75.0 80.0 71.2 74.3 79.7
10 m
onth
s
15m (50 ft) high 73.5 76.8 81.5 69.9 73.8 78.5 73.5 76.3 82.1 72 74.6 80.7 73.6 77.1 82.2 71.3 75.2 79.5 73.7 76.6 82.4 73.0 75.8 81.1
7.5 m (25 ft) low 78.8 82.7 86.6 74.7 79.9 83.7 78.9 83.1 86.3 77.3 82.7 85.4 78.6 83.6 86.4 76.2 81.8 84.9 78.7 83.4 86.5 78.1 83.0 86.2
15m (50 ft) low 71.3 75.6 79.9 68.4 73.9 78.0 71.4 76.1 79.6 70.2 75.5 78.6 71.2 76.6 79.6 69.3 75.1 78.3 71.2 76.3 79.6 71.2 76.2 79.4
16 m
onth
s
15m (50 ft) high 73.3 76.9 81.8 70.1 74.9 79.3 73.5 77.4 81.4 72.2 77.4 81.0 73.2 77.9 81.6 71.4 76.7 80.1 73.2 77.6 81.6 72.7 77.4 81.1
7.5 m (25 ft) low 79.6 82.8 87.2 76.0 79.7 83.8 79.7 84.4 87.5 78.0 82.8 85.9 79.6 83.1 87.8 77.8 81.9 85.9 na na na na na na
15m (50 ft) low 71.7 74.8 79.6 69.3 73.2 77.6 71.9 76.5 79.9 70.2 75.1 78.9 71.8 75.2 80.2 69.7 74.1 78.7 na na na na na na
52 m
onth
s
15m (50 ft) high 74.3 77.7 82.1 70.7 74.2 78.8 74.5 79.3 82.4 72.9 77.5 81.4 74.3 77.7 82.8 72.2 76.4 80.6 na na na na na na

Appendix E Caltrans Thin Lift Study
E-4
E.2 Lveh Deltas Tables show values with and without site bias being removed. All plots show only values with
the site bias removed.

Appendix E Caltrans Thin Lift Study
E-5
Table E-2. Post-overlay measurements: for each vehicle type, site differences due to type of pavement (Lveh* deltas) by site pairs with identical vehicle sets. Post-overlay
pavements, including DGAC, aged 4, 10, 16, and 52 months. Site bias removed.** *modified SPB methodology **other sites calibrated to Site 1 to remove site bias unrelated to pavement type (based on baseline measurements)
Modified Lveh* (or average LAFmx) delta (dBA)
Site 2 – Site 1 (OGAC,
75 mm – DGAC)
Site 3 – Site 1 (OGAC,
30 mm – DGAC)
Site 4 – Site 1 (RAC Type O, 30 mm
– DGAC)
Site 5 – Site 1 (BWC,
30 mm – DGAC)
Pavement age
Microphone location
auto med truck
hvy truck
auto med truck
hvy truck
auto med truck
hvy truck
auto med truck
hvy truck
25 ft (7.5 m) low 0.0 0.0 0.0 0.0 0.0 0.0 0.0 0.0 0.0 0.0 0.0 0.0
50 ft (15 m) low 0.0 0.0 0.0 0.0 0.0 0.0 0.0 0.0 0.0 0.0 0.0 0.0 baseline
50 ft (15 m) high 0.0 0.0 0.0 0.0 0.0 0.0 0.0 0.0 0.0 0.0 0.0 0.0
25 ft (7.5 m) low -3.7 -2.9 -3.0 -2.2 -0.6 -1.2 -3.5 -2.0 -1.7 na na na
50 ft (15 m) low -3.1 -2.4 -2.4 -2.3 -0.5 -1.6 -4.0 -2.3 -1.3 0.5 1.0 0.0 4 months
50 ft (15 m) high -4.0 -3.4 -2.5 -2.7 -0.6 -0.9 -3.3 -1.7 -1.1 0.0 0.4 -1.0
25 ft (7.5 m) low -3.9 -3.3 -3.6 -2.8 -2.4 -1.5 -3.6 -2.6 -1.8 -1.7 -1.6 -2.3
50 ft (15 m) low -3.0 -2.6 -2.7 -2.4 -1.6 -1.5 -3.6 -3.2 -1.6 0.7 -0.3 0.4 10 months
50 ft (15 m) high -4.2 -3.9 -3.0 -2.6 -2.0 -0.9 -3.4 -1.8 -1.6 -0.9 -1.3 -2.3
25 ft (7.5 m) low -4.1 -3.0 -3.4 -2.7 -1.0 -1.4 -3.6 -2.2 -1.4 -1.8 -1.1 -1.9
50 ft (15 m) low -3.6 -2.7 -2.7 -2.1 -0.4 -1.4 -3.7 -2.6 -0.8 0.7 0.3 0.4 16 months
50 ft (15 m) high -3.7 -2.9 -2.5 -2.4 -0.2 0.0 -2.8 -1.0 -0.4 -0.8 -0.8 -1.6
25 ft (7.5 m) low -3.6 -3.3 -4.0 -2.9 -2.1 -2.1 -3.0 -1.6 -1.8 na na na
50 ft (15 m) low -3.1 -2.6 -2.9 -2.7 -1.3 -1.4 -3.9 -2.2 -1.0 na na na 52 months
50 ft (15 m) high -4.0 -4.4 -3.4 -2.8 -2.0 -0.6 -3.1 -1.2 -1.1 na na na

Appendix E Caltrans Thin Lift Study
E-6
Table 3. Post-overlay measurements: for each vehicle type, site differences due to type of pavement (Lveh* deltas) by site pairs with identical vehicle sets.** Post-overlay
pavements, including DGAC, aged 4, 10, 16, and 52 months. *modified SPB methodology **other sites not calibrated to Site 1 to remove site bias unrelated to pavement type
Modified Lveh* (or average LAFmx) delta (dBA)
Site 2 – Site 1 (OGAC,
75 mm – DGAC)
Site 3 – Site 1 (OGAC,
30 mm – DGAC)
Site 4 – Site 1 (RAC Type O, 30 mm
– DGAC)
Site 5 – Site 1 (BWC,
30 mm – DGAC)
Pavement age
Microphone location
auto med truck
hvy truck
auto med truck
hvy truck
auto med truck
hvy truck
auto med truck
hvy truck
25 ft (7.5 m) low 0.0 0.3 0.6 1.1 0.5 0.5 1.2 0.4 -0.1 1.2 0.6 1.7
50 ft (15 m) low 0.7 1.0 0.8 0.9 -0.1 0.4 1.8 1.1 -0.5 -0.7 -0.3 -0.7 baseline
50 ft (15 m) high 0.5 0.9 0.0 1.2 0.3 -0.4 1.0 -0.1 -1.1 0.3 0.5 1.1
25 ft (7.5 m) low -3.7 -2.6 -2.4 -1.1 -0.1 -0.7 -2.3 -1.6 -1.8 na na na
50 ft (15 m) low -2.4 -1.4 -1.6 -1.3 -0.6 -1.2 -2.2 -1.2 -1.9 -0.3 0.6 -0.7 4 months
50 ft (15 m) high -3.5 -2.5 -2.5 -1.5 -0.3 -1.3 -2.2 -1.8 -2.2 0.3 0.9 0.1
25 ft (7.5 m) low -3.9 -3.1 -3.0 -1.7 -1.9 -1.0 -2.4 -2.2 -1.9 -0.6 -1.0 -0.7
50 ft (15 m) low -2.3 -1.7 -1.9 -1.5 -1.7 -1.1 -1.8 -2.1 -2.2 -0.1 -0.6 -0.2 10 months
50 ft (15 m) high -3.7 -3.1 -3.0 -1.5 -1.7 -1.3 -2.3 -1.9 -2.7 -0.7 -0.8 -1.2
25 ft (7.5 m) low -4.1 -2.8 -2.9 -1.5 -0.4 -0.9 -2.4 -1.8 -1.5 -0.6 -0.4 -0.3
50 ft (15 m) low -2.9 -1.7 -1.9 -1.2 -0.5 -1.0 -1.9 -1.5 -1.4 -0.1 0.0 -0.2 16 months
50 ft (15 m) high -3.2 -2.0 -2.5 -1.3 0.0 -0.4 -1.8 -1.1 -1.5 -0.6 -0.2 -0.5
25 ft (7.5 m) low -3.6 -3.1 -3.4 -1.8 -1.6 -1.6 -1.8 -1.2 -1.9 na na na
50 ft (15 m) low -2.4 -1.7 -2.0 -1.8 -1.4 -1.0 -2.1 -1.1 -1.5 na na na 52 months
50 ft (15 m) high -3.5 -3.5 -3.4 -1.6 -1.8 -1.0 -2.1 -1.3 -2.2 na na na

Appendix E Caltrans Thin Lift Study
E-7
Pavement Effects Compared to DGAC, by Vehicle Type (post-overlay, ages 4, 10, 16, & 52 months)
microphone distance: 25 ft, height: 5 ft
-10.0
-9.0
-8.0
-7.0
-6.0
-5.0
-4.0
-3.0
-2.0
-1.0
0.0
1.0
2.0
3.0
4.0
5.0
Ave
rage
Lm
ax D
elta
, Sx-
S1 (
dBA
)
auto 04 mo auto 10 mo auto 16 mo auto 52 moHT 04 mo HT 10 mo HT 16 mo HT 52 mo
OGAC 75 mmSite 2
OGAC 30 mmSite 3
RAC Type OSite 4
BWCSite 5
0.0 auto HT auto HT auto HT auto HT
*modified SPBI methodology
Figure E-1. Pavement effects compared to DGAC (Site x minus Site 1) for autos and heavy trucks using modified SPBI.* Post-overlay results, all pavements, including DGAC, aged 4, 10, 16, and 52 months (limited data for BWC). Microphone location:
distance 7.5 m (25 ft), height 1.5 m (5 ft).

Appendix E Caltrans Thin Lift Study
E-8
Pavement Effects Compared to DGAC, by Vehicle Type (post-overlay, ages 4, 10, & 16 months)microphone distance: 50 ft, height: 5 ft
-10.0
-9.0
-8.0
-7.0
-6.0
-5.0
-4.0
-3.0
-2.0
-1.0
0.0
1.0
2.0
3.0
4.0
5.0
Ave
rage
Lm
ax D
elta
, Sx-
S1 (
dBA
)
auto 04 mo auto 10 mo auto 16 mo auto 52 moHT 04 mo HT 10 mo HT 16 mo HT 52 mo
OGAC 75 mmSite 2
OGAC 30 mmSite 3
RAC Type OSite 4
BWCSite 5
0.0 auto HT auto HT auto HT auto HT
*modified SPBI methodology
Figure E-2. Pavement effects compared to DGAC (Site x minus Site 1) for autos and heavy trucks using modified SPBI.* Post-overlay results, all pavements, including DGAC, aged 4, 10, 16, and 52 months (limited data for BWC). Microphone location:
distance 15 m (50 ft), height 1.5 m (5 ft).

Appendix E Caltrans Thin Lift Study
E-9
Pavement Effects Compared to DGAC, by Vehicle Type (post-overlay, ages 4, 10, 16, & 52 months)
microphone distance: 50 ft, height: 15 ft
-10.0
-9.0
-8.0
-7.0
-6.0
-5.0
-4.0
-3.0
-2.0
-1.0
0.0
1.0
2.0
3.0
4.0
5.0
Ave
rage
Lm
ax D
elta
, Sx-
S1 (
dBA
)
auto 04 mo auto 10 mo auto 16 mo auto 52 moHT 04 mo HT 10 mo HT 16 mo HT 52 mo
OGAC 75 mmSite 2
OGAC 30 mmSite 3
RAC Type OSite 4
BWCSite 5
0.0 auto HT auto HT auto HT auto HT
*modified SPBI methodology
Figure E-3. Pavement effects compared to DGAC (Site x minus Site 1) for autos and heavy trucks using modified SPBI.* Post-overlay results, all pavements, including DGAC, aged 4, 10, 16, and 52 months (limited data for BWC). Microphone location:
distance 15 m (50 ft), height 4.5 m (15 ft).

Appendix E Caltrans Thin Lift Study
E-10
E.3 Spectral Results All plots show values where site bias has not been removed. Results are shown for various
combinations of parameters:
• Figures E-4 through E-18 compare results for the different pavements for one age and a
single microphone location; this includes results for both automobiles and heavy trucks.
These plots highlight the spectral differences among pavements.
• Figures E-19 through E-23 compare results for different ages of a single pavement for a
single microphone location; this includes results for automobiles only (heavy truck
results show no trends). These plots highlight the age-related spectral differences among
microphone locations.
• Figures E-24 through E-28 compare results for different microphone locations for a
single pavement for one age (16 months only); this includes results for both automobiles
and heavy trucks. These plots highlight the spectral differences among microphone
locations.
Note: Data are not available for some data sets in Figures 4-28; results shown are those available.
As a reminder … Site Information Microphone Locations
site name pavement type distance (ft) height (ft)
Site 1 (S1) DGAC 30 mm 25 5
Site 2 (S2) OGAC 75 mm 50 5
Site 3 (S3) OGAC 30 mm 50 15
Site 4 (S4) RAC Type O 30 mm 200 5
Site 5 (S5) BWC 30 mm

Appendix E Caltrans Thin Lift Study
E-11
10
20
30
40
50
60
70
80
10 100 1000 10000
Frequency (Hz)
Ave
rage
LA
max
(dB
A)
Site 1
Site 2
Site 3
Site 4
10
20
30
40
50
60
70
80
10 100 1000 10000
Frequency (Hz)
Ave
rage
LA
max
(dB
A)
Site 1Site 2Site 3Site 4
Figure E-4. Spectral data for automobiles (top) and heavy trucks (bottom) on four
different pavement types. Post-overlay results, all pavements aged 4 months. Microphone location: distance 25 ft, height 5 ft.

Appendix E Caltrans Thin Lift Study
E-12
10
20
30
40
50
60
70
80
10 100 1000 10000
Frequency (Hz)
Ave
rage
LA
max
(dB
A)
Site 1Site 2Site 3Site 4Site 5
10
20
30
40
50
60
70
80
10 100 1000 10000
Frequency (Hz)
Ave
rage
LA
max
(dB
A)
Site 1Site 2Site 3Site 4Site 5
Figure E-5. Spectral data for automobiles (top) and heavy trucks (bottom) on four
different pavement types. Post-overlay results, all pavements aged 4 months. Microphone location: distance 50 ft, height 5 ft.

Appendix E Caltrans Thin Lift Study
E-13
10
20
30
40
50
60
70
80
10 100 1000 10000
Frequency (Hz)
Ave
rage
LA
max
(dB
A)
Site 1Site 2Site 3Site 4Site 5
10
20
30
40
50
60
70
80
10 100 1000 10000
Frequency (Hz)
Ave
rage
LA
max
(dB
A)
Site 1Site 2Site 3Site 4Site 5
Figure E-6. Spectral data for automobiles (top) and heavy trucks (bottom) on four
different pavement types. Post-overlay results, all pavements aged 4 months. Microphone location: distance 50 ft, height 15 ft.

Appendix E Caltrans Thin Lift Study
E-14
10
20
30
40
50
60
70
80
10 100 1000 10000
Frequency (Hz)
Ave
rage
LA
max
(dB
A)
Site 1Site 2
10
20
30
40
50
60
70
80
10 100 1000 10000
Frequency (Hz)
Ave
rage
LA
max
(dB
A)
Site 1Site 2
Figure E-7. Spectral data for automobiles (top) and heavy trucks (bottom) on four
different pavement types. Post-overlay results, all pavements aged 4 months. Microphone location: distance 200 ft, height 5 ft.

Appendix E Caltrans Thin Lift Study
E-15
10
20
30
40
50
60
70
80
10 100 1000 10000
Frequency (Hz)
Ave
rage
LA
max
(dB
A)
Site 1Site 2Site 3Site 4Site 5
10
20
30
40
50
60
70
80
10 100 1000 10000
Frequency (Hz)
Ave
rage
LA
max
(dB
A)
Site 1Site 2Site 3Site 4Site 5
Figure E-8. Spectral data for automobiles (top) and heavy trucks (bottom) on four
different pavement types. Post-overlay results, all pavements aged 10 months. Microphone location: distance 25 ft, height 5 ft.

Appendix E Caltrans Thin Lift Study
E-16
10
20
30
40
50
60
70
80
10 100 1000 10000
Frequency (Hz)
Ave
rage
LA
max
(dB
A)
Site 1Site 2Site 3Site 4Site 5
10
20
30
40
50
60
70
80
10 100 1000 10000
Frequency (Hz)
Ave
rage
LA
max
(dB
A)
Site 1Site 2Site 3Site 4Site 5
Figure E-9. Spectral data for automobiles (top) and heavy trucks (bottom) on four
different pavement types. Post-overlay results, all pavements aged 10 months. Microphone location: distance 50 ft, height 5 ft.

Appendix E Caltrans Thin Lift Study
E-17
10
20
30
40
50
60
70
80
10 100 1000 10000
Frequency (Hz)
Ave
rage
LA
max
(dB
A)
Site 1Site 2Site 3Site 4Site 5
10
20
30
40
50
60
70
80
10 100 1000 10000
Frequency (Hz)
Ave
rage
LA
max
(dB
A)
Site 1Site 2Site 3Site 4Site 5
Figure E-10. Spectral data for automobiles (top) and heavy trucks (bottom) on four
different pavement types. Post-overlay results, all pavements aged 10 months. Microphone location: distance 50 ft, height 15 ft.

Appendix E Caltrans Thin Lift Study
E-18
10
20
30
40
50
60
70
80
10 100 1000 10000
Frequency (Hz)
Ave
rage
LA
max
(dB
A)
Site 1Site 2
10
20
30
40
50
60
70
80
10 100 1000 10000
Frequency (Hz)
Ave
rage
LA
max
(dB
A)
Site 1
Site 2
Figure E-11. Spectral data for automobiles (top) and heavy trucks (bottom) on four
different pavement types. Post-overlay results, all pavements aged 10months. Microphone location: distance 200 ft, height 5 ft.

Appendix E Caltrans Thin Lift Study
E-19
10
20
30
40
50
60
70
80
10 100 1000 10000
Frequency (Hz)
Ave
rage
LA
max
(dB
A)
Site 1Site 2Site 3Site 4Site 5
10
20
30
40
50
60
70
80
10 100 1000 10000
Frequency (Hz)
Ave
rage
LA
max
(dB
A)
Site 1Site 2Site 3Site 4Site 5
Figure E-12. Spectral data for automobiles (top) and heavy trucks (bottom) on four
different pavement types. Post-overlay results, all pavements aged 16 months. Microphone location: distance 25 ft, height 5 ft.

Appendix E Caltrans Thin Lift Study
E-20
10
20
30
40
50
60
70
80
10 100 1000 10000
Frequency (Hz)
Ave
rage
LA
max
(dB
A)
Site 1Site 2Site 3Site 4Site 5
10
20
30
40
50
60
70
80
10 100 1000 10000
Frequency (Hz)
Ave
rage
LA
max
(dB
A)
Site 1Site 2Site 3Site 4Site 5
Figure E-13. Spectral data for automobiles (top) and heavy trucks (bottom) on four
different pavement types. Post-overlay results, all pavements aged 16 months. Microphone location: distance 50 ft, height 5 ft.

Appendix E Caltrans Thin Lift Study
E-21
10
20
30
40
50
60
70
80
10 100 1000 10000
Frequency (Hz)
Ave
rage
LA
max
(dB
A)
Site 1Site 2Site 3Site 4Site 5
10
20
30
40
50
60
70
80
10 100 1000 10000
Frequency (Hz)
Ave
rage
LA
max
(dB
A)
Site 1
Site 2
Site 3
Site 4
Site 5
Figure E-14. Spectral data for automobiles (top) and heavy trucks (bottom) on four
different pavement types. Post-overlay results, all pavements aged 16 months. Microphone location: distance 50 ft, height 15 ft.

Appendix E Caltrans Thin Lift Study
E-22
10
20
30
40
50
60
70
80
10 100 1000 10000
Frequency (Hz)
Ave
rage
LA
max
(dB
A)
Site 1
Site 2
10
20
30
40
50
60
70
80
10 100 1000 10000
Frequency (Hz)
Ave
rage
LA
max
(dB
A)
Site 1Site 2
Figure E-15. Spectral data for automobiles (top) and heavy trucks (bottom) on four
different pavement types. Post-overlay results, all pavements aged 16 months. Microphone location: distance 200 ft, height 5 ft.

Appendix E Caltrans Thin Lift Study
E-23
10
20
30
40
50
60
70
80
10 100 1000 10000
Frequency (Hz)
Ave
rage
LA
max
(dB
A)
Site 1Site 2Site 3Site 4
10
20
30
40
50
60
70
80
10 100 1000 10000
Frequency (Hz)
Ave
rage
LA
max
(dB
A)
Site 1Site 2Site 3Site 4
Figure E-16. Spectral data for automobiles (top) and heavy trucks (bottom) on four
different pavement types. Post-overlay results, all pavements aged 52 months. Microphone location: distance 25 ft, height 5 ft.

Appendix E Caltrans Thin Lift Study
E-24
10
20
30
40
50
60
70
80
10 100 1000 10000
Frequency (Hz)
Ave
rage
LA
max
(dB
A)
Site 1Site 2
10
20
30
40
50
60
70
80
10 100 1000 10000
Frequency (Hz)
Ave
rage
LA
max
(dB
A)
Site 1Site 2
Figure E-17. Spectral data for automobiles (top) and heavy trucks (bottom) on four
different pavement types. Post-overlay results, all pavements aged 52 months. Microphone location: distance 50 ft, height 5 ft.

Appendix E Caltrans Thin Lift Study
E-25
10
20
30
40
50
60
70
80
10 100 1000 10000
Frequency (Hz)
Ave
rage
LA
max
(dB
A)
Site 1Site 2
10
20
30
40
50
60
70
80
10 100 1000 10000
Frequency (Hz)
Ave
rage
LA
max
(dB
A)
Site 1Site 2
Figure E-18. Spectral data for automobiles (top) and heavy trucks (bottom) on four
different pavement types. Post-overlay results, all pavements aged 52 months. Microphone location: distance 50 ft, height 15 ft.

Appendix E Caltrans Thin Lift Study
E-26
30
40
50
60
70
80
10 100 1000 10000
Frequency (Hz)
Ave
rage
LA
max
(dB
A)
4 months
10 months
16 months
52 months
Figure E-19. Spectral data for automobiles; post-overlay results for Site 1 (DGAC 30 mm); all ages measured. Microphone location: distance 25 ft, height 5 ft (top);
microphone location: distance 50 ft, height 5 ft (middle); microphone location: distance 50 ft, height 15 ft (bottom).
30
40
50
60
70
80
10 100 1000 10000
Frequency (Hz)
Ave
rage
LA
max
(dB
A)
4 months
10 months
16 months
52 months
30
40
50
60
70
80
10 100 1000 10000
Frequency (Hz)
Ave
rage
LA
max
(dB
A)
4 months
10 months
16 months
52 months

Appendix E Caltrans Thin Lift Study
E-27
30
40
50
60
70
80
10 100 1000 10000
Frequency (Hz)
Ave
rage
LA
max
(dB
A)
4 months
10 months
16 months
52 months
Figure E-20. Spectral data for automobiles; post-overlay results for Site 2 (OGAC 75
mm); all ages measured. Microphone location: distance 25 ft, height 5 ft (top); microphone location: distance 50 ft, height 5 ft (middle); microphone location: distance
50 ft, height 15 ft (bottom).
30
40
50
60
70
80
10 100 1000 10000
Frequency (Hz)
Ave
rage
LA
max
(dB
A)
4 months
10 months
16 months
52 months
30
40
50
60
70
80
10 100 1000 10000
Frequency (Hz)
Ave
rage
LA
max
(dB
A)
4 months
10 months
16 months
52 months

Appendix E Caltrans Thin Lift Study
E-28
30
40
50
60
70
80
10 100 1000 10000
Frequency (Hz)
Ave
rage
LA
max
(dB
A)
4 months
10 months
16 months
52 months
Figure E-21. Spectral data for automobiles; post-overlay results for Site 3 (OGAC 30
mm); all ages measured. Microphone location: distance 25 ft, height 5 ft (top); microphone location: distance 50 ft, height 5 ft (middle); microphone location: distance
50 ft, height 15 ft (bottom).
30
40
50
60
70
80
10 100 1000 10000
Frequency (Hz)
Ave
rage
LA
max
(dB
A)
4 months
10 months
16 months
30
40
50
60
70
80
10 100 1000 10000
Frequency (Hz)
Ave
rage
LA
max
(dB
A)
4 months
10 months
16 months

Appendix E Caltrans Thin Lift Study
E-29
30
40
50
60
70
80
10 100 1000 10000
Frequency (Hz)
Ave
rage
LA
max
(dB
A)
4 months
10 months
16 months
52 months
Figure E-22. Spectral data for automobiles; post-overlay results for Site 4 (RAC Type O 30 mm); all ages measured. Microphone location: distance 25 ft, height 5 ft (top);
microphone location: distance 50 ft, height 5 ft (middle); microphone location: distance 50 ft, height 15 ft (bottom).
30
40
50
60
70
80
10 100 1000 10000
Frequency (Hz)
Ave
rage
LA
max
(dB
A)
4 months
10 months
16 months
30
40
50
60
70
80
10 100 1000 10000
Frequency (Hz)
Ave
rage
LA
max
(dB
A)
4 months
10 months
16 months

Appendix E Caltrans Thin Lift Study
E-30
30
40
50
60
70
80
10 100 1000 10000
Frequency (Hz)
Ave
rage
LA
max
(dB
A)
10 months
16 months
Figure E-23. Spectral data for automobiles; post-overlay results for Site 5 (BWC 30 mm); all ages measured. Microphone location: distance 25 ft, height 5 ft (top); microphone
location: distance 50 ft, height 5 ft (middle); microphone location: distance 50 ft, height 15 ft (bottom).
30
40
50
60
70
80
10 100 1000 10000
Frequency (Hz)
Ave
rage
LA
max
(dB
A)
4 months
10 months
16 months
30
40
50
60
70
80
10 100 1000 10000
Frequency (Hz)
Ave
rage
LA
max
(dB
A)
4 months
10 months
16 months

Appendix E Caltrans Thin Lift Study
E-31
0
10
20
30
40
50
60
70
80
10 100 1000 10000
Frequency (Hz)
Ave
rage
LA
max
(dB
A)
25 ft
50 ft
50 ft high
200 ft
0
10
20
30
40
50
60
70
80
10 100 1000 10000
Frequency (Hz)
Ave
rage
LA
max
(dB
A)
25 ft
50 ft
50 ft high
200 ft
Figure E-24. Spectral data for automobiles (top) and heavy trucks (bottom); post-overlay
results for Site 1 (DGAC 30 mm) aged 16 months; all microphone positions.

Appendix E Caltrans Thin Lift Study
E-32
0
10
20
30
40
50
60
70
80
10 100 1000 10000
Frequency (Hz)
Ave
rage
LA
max
(dB
A)
25 ft
50 ft
50 ft high
200 ft
0
10
20
30
40
50
60
70
80
10 100 1000 10000
Frequency (Hz)
Ave
rage
LA
max
(dB
A)
25 ft50 ft50 ft high200 ft
Figure E-25. Spectral data for automobiles (top) and heavy trucks (bottom); post-overlay
results for Site 2 (OGAC 75 mm) aged 16 months; all microphone positions.

Appendix E Caltrans Thin Lift Study
E-33
0
10
20
30
40
50
60
70
80
10 100 1000 10000
Frequency (Hz)
Ave
rage
LA
max
(dB
A)
25 ft50 ft50 ft high
0
10
20
30
40
50
60
70
80
10 100 1000 10000
Frequency (Hz)
Ave
rage
LA
max
(dB
A)
25 ft
50 ft
50 ft high
Figure E-26. Spectral data for automobiles (top) and heavy trucks (bottom); post-overlay
results for Site 3 (OGAC 30 mm) aged 16 months; all microphone positions.

Appendix E Caltrans Thin Lift Study
E-34
0
10
20
30
40
50
60
70
80
10 100 1000 10000
Frequency (Hz)
Ave
rage
LA
max
(dB
A)
25 ft
50 ft
50 ft high
0
10
20
30
40
50
60
70
80
10 100 1000 10000
Frequency (Hz)
Ave
rage
LA
max
(dB
A)
25 ft50 ft50 ft high
Figure E-27. Spectral data for automobiles (top) and heavy trucks (bottom); post-overlay
results for Site 4 (RAC Type O 30 mm) aged 16 months; all microphone positions.

Appendix E Caltrans Thin Lift Study
E-35
0
10
20
30
40
50
60
70
80
10 100 1000 10000
Frequency (Hz)
Ave
rage
LA
max
(dB
A)
25 ft
50 ft
50 ft high
0
10
20
30
40
50
60
70
80
10 100 1000 10000
Frequency (Hz)
Ave
rage
LA
max
(dB
A)
25 ft50 ft50 ft high
Figure E-28. Spectral data for automobiles (top) and heavy trucks (bottom); post-overlay
results for Site 5 (BWC 30 mm) aged 16 months; all microphone positions.

F-1
APPENDIX F. TEST VEHICLE RESULTS
This appendix shows the following:
• tables and plots of the average LAFmx values for the test vehicle for each pavement, age
(except 52 months), and microphone position; and
• tables and plots of the average LAFmx deltas (comparing each of the other pavements to
DGAC) for each pavement pair, age (except 52 months), and microphone position.

Appendix F Caltrans Thin Lift Study
F-2
F.1 Average LAFmx for Test Vehicle
Table F-1 shows the average LAFmx for the test vehicle with site bias removed and Table F-2 shows the values with site bias not
removed. The figures following the tables show plots of the site-bias-removed data (each plot shows multiple vehicle speeds and
represents a different pavement age and microphone position).
Table F-1. Post-overlay measurements: sound levels for each pavement type (average LAFmx for test vehicle). Post-overlay pavements, including DGAC, aged 4, 10, and 16 months. Site bias removed.*
*other sites calibrated to Site 1 to remove site bias unrelated to pavement type (based on baseline measurements of test vehicle)
Test vehicle Average LAFmx (dBA)
Site 1 (DGAC)
Site 2 (OGAC, 75 mm)
Site 3 (OGAC, 30 mm)
Site 4 ( RAC type O, 30 mm)
Site 5 ( BWC, 30 mm)
Speed (mph)
Pave-ment age
Microphone location
40 50 60 70 40 50 60 70 40 50 60 70 40 50 60 70 40 50 60 70
50 ft (15 m) low 62.6 65.4 68.3 71.3 59.2 62.3 65.0 68.6 59.1 62.3 65.9 69.4 58.7 61.0 65.1 68.1 61.4 64.4 67.5 71.0
4 months 50 ft (15 m)
high 64.1 67.2 70.2 72.8 60.5 63.3 65.4 68.6 61.6 65 67.3 71 60.1 63.8 66.2 68.8 63.2 66.6 69.4 72.6
50 ft (15 m) low 62.3 66.0 68.0 71.0 58.9 62.5 64.4 67.4 59.9 63.1 66.9 69.2 59.5 61.8 65.5 67.7 61.0 64.6 67.7 70.9
10 months 50 ft (15 m)
high 65.1 68.3 70.5 73.6 61.4 63.8 65.8 68.7 63.1 65.9 68.7 70.8 61.1 64.8 67.0 68.6 63.7 67.5 69.8 72.8
50 ft (15 m) low 62.2 65.7 68.5 71.3 58.0 61.3 64.6 67.5 59.9 63.6 66.8 69.5 59.1 62.5 65.4 68.1 62.2 65.5 67.4 71.5
16 months 50 ft (15 m)
high 64.6 67.9 70.5 73.2 60.9 63.4 66.0 68.9 62.8 65.9 68.3 71.2 60.8 65.2 66.7 68.8 64.0 68.0 69.0 72.7

Appendix F Caltrans Thin Lift Study
F-3
Table F-2. Post-overlay measurements: sound levels for each pavement type (average LAFmx for test vehicle). Post-overlay pavements, including DGAC, aged 4, 10, and 16 months.*
*other sites not calibrated to Site 1 to remove site bias unrelated to pavement type
Test vehicle Average LAFmx (dBA)
Site 1 (DGAC)
Site 2 (OGAC, 75 mm)
Site 3 (OGAC, 30 mm)
Site 4 ( RAC type O, 30 mm)
Site 5 ( BWC, 30 mm)
Speed (mph)
Pave-ment age
Microphone location
40 50 60 70 40 50 60 70 40 50 60 70 40 50 60 70 40 50 60 70
50 ft (15 m) low 60.3 63.7 67.0 69.9 60.8 63.7 67.4 69.6 60.5 63.9 66.8 69.5 60.7 64.8 67.1 70.1 61.2 64.7 67.6 69.3
Base-line 50 ft (15 m)
high 62.5 65.9 68.7 71.0 62.5 66.0 69.4 71.2 62.4 65.8 68.9 71.0 63.4 66.1 69.3 71.9 62.8 66.0 68.8 70.3
50 ft (15 m) low 62.6 65.4 68.3 71.3 59.7 62.3 65.4 68.3 59.3 62.5 65.7 69.1 59.1 62.1 65.1 68.3 62.3 65.5 68.1 70.4
4 months 50 ft (15 m)
high 64.1 67.2 70.2 72.8 60.5 63.4 66.1 68.8 61.5 64.9 67.5 71.0 61.0 64.0 66.8 69.7 63.5 66.7 69.5 71.9
50 ft (15 m) low 62.3 66.0 68.0 71.0 59.4 62.5 64.8 67.1 60.1 63.3 66.7 68.9 59.9 62.9 65.5 67.9 61.9 65.7 68.3 70.3
10 months 50 ft (15 m)
high 65.1 68.3 70.5 73.6 61.4 63.9 66.5 68.9 63.0 65.8 68.9 70.8 62.0 65.0 67.6 69.5 64.0 67.6 69.9 72.1
50 ft (15 m) low 62.2 65.7 68.5 71.3 58.5 61.3 65.0 67.2 60.1 63.8 66.6 69.2 59.5 63.6 65.4 68.3 63.1 66.6 68.0 70.9
16 months 50 ft (15 m)
high 64.6 67.9 70.5 73.2 60.9 63.5 66.7 69.1 62.7 65.8 68.5 71.2 61.7 65.4 67.3 69.7 64.3 68.1 69.1 72.0

Appendix F Caltrans Thin Lift Study
F-4
Test Vehicle (Subaru)pavement age: 4 months; microphone distance: 50 ft, height: 5 ft
55
60
65
70
75
30 35 40 45 50 55 60 65 70 75
vehicle speed (mph)
Ave
rage
Lm
ax (d
BA
)
S1, DGAC S2, OGAC 75 mm S3, OGAC 30 mm S4, RAC 30 mm S5, BWC 30 mm
Test Vehicle (Subaru)
pavement age: 4 months; microphone distance: 50 ft, height: 15 ft
55
60
65
70
75
30 35 40 45 50 55 60 65 70 75
vehicle speed (mph)
Ave
rage
Lm
ax (d
BA
)
S1, DGAC S2, OGAC 75 mm S3, OGAC 30 mm S4, RAC 30 mm S5, BWC 30 mm
Figure F-1. Test vehicle average LAFmx values for pavement aged 4 months, multiple speeds. Microphone position: (top) distance 15 m (50 ft), height 1.5 m (5 ft); (bottom)
distance 15 m (50 ft), height 4.5 m (15 ft). Site bias removed.

Appendix F Caltrans Thin Lift Study
F-5
Test Vehicle (Subaru)pavement age: 10 months; microphone distance: 50 ft, height: 5 ft
55
60
65
70
75
30 35 40 45 50 55 60 65 70 75
vehicle speed (mph)
Ave
rage
Lm
ax (d
BA
)
S1, DGAC S2, OGAC 75 mm S3, OGAC 30 mm S4, RAC 30 mm S5, BWC 30 mm
Test Vehicle (Subaru)
pavement age: 10 months; microphone distance: 50 ft, height: 15 ft
55
60
65
70
75
30 35 40 45 50 55 60 65 70 75
vehicle speed (mph)
Ave
rage
Lm
ax (d
BA
)
S1, DGAC S2, OGAC 75 mm S3, OGAC 30 mm S4, RAC 30 mm S5, BWC 30 mm
Figure F-2. Test vehicle average LAFmx values for pavement aged 10 months, multiple speeds. Microphone position: (top) distance 15 m (50 ft), height 1.5 m (5 ft); (bottom)
distance 15 m (50 ft), height 4.5 m (15 ft). Site bias removed.

Appendix F Caltrans Thin Lift Study
F-6
Test Vehicle (Subaru)pavement age: 16 months; microphone distance: 50 ft, height: 5 ft
55
60
65
70
75
30 35 40 45 50 55 60 65 70 75
vehicle speed (mph)
Ave
rage
Lm
ax (d
BA
)
S1, DGAC S2, OGAC 75 mm S3, OGAC 30 mm S4, RAC 30 mm S5, BWC 30 mm
Test Vehicle (Subaru)
pavement age: 16 months; microphone distance: 50 ft, height: 15 ft
55
60
65
70
75
30 35 40 45 50 55 60 65 70 75
vehicle speed (mph)
Ave
rage
Lm
ax (d
BA
)
S1, DGAC S2, OGAC 75 mm S3, OGAC 30 mm S4, RAC 30 mm S5, BWC 30 mm
Figure F-3. Test vehicle average LAFmx values for pavement aged 16 months, multiple speeds. Microphone position: (top) distance 15 m (50 ft), height 1.5 m (5 ft); (bottom)
distance 15 m (50 ft), height 4.5 m (15 ft). Site bias removed.

Appendix F Caltrans Thin Lift Study
F-7
F.2 Average LAFmx Deltas for Test Vehicle
Table F-3 shows the average LAFmx deltas (Site 1 minus Site x) for the test vehicle with site bias
removed. The figures following the tables show plots of the data (each plot representing a
different microphone position for a single vehicle speed).
Table F-3. Post-overlay measurements: for the test vehicle, site differences due to type of pavement (average LAFmx deltas). Post-overlay pavements, including DGAC, aged 4,
10, and 16 months. Site bias removed.* **other sites calibrated to Site 1 to remove site bias unrelated to pavement type (based on baseline measurements of test vehicle)
Average LAFmx delta (dBA)
Site 2 – Site 1 (OGAC,
75 mm – DGAC)
Site 3 – Site 1 (OGAC,
30 mm – DGAC)
Site 4 – Site 1 ( RAC type O, 30 mm –
DGAC)
Site 5 – Site 1 ( BWC,
30 mm – DGAC)
Speed (mph)
Pave-ment age
Micro-phone
location
40 50 60 70 40 50 60 70 40 50 60 70 40 50 60 70
50 ft (15 m) low 0 0 0 0 0 0 0 0 0 0 0 0 0 0 0 0 base-
line 50 ft (15 m) high 0 0 0 0 0 0 0 0 0 0 0 0 0 0 0 0 50 ft (15 m) low -3.4 -3.1 -3.3 -2.7 -3.5 -3.1 -2.4 -1.8 -3.9 -4.4 -3.2 -3.1 -1.3 -1.0 -0.8 -0.3 4
months 50 ft (15 m) high -3.6 -3.9 -4.8 -4.2 -2.5 -2.2 -2.9 -1.8 -4.0 -3.4 -4.0 -4.0 -0.9 -0.6 -0.8 -0.2 50 ft (15 m) low -3.4 -3.6 -3.6 -3.6 -2.4 -2.9 -1.1 -1.8 -2.8 -4.3 -2.5 -3.3 -1.3 -1.4 -0.3 -0.1 10
months 50 ft (15 m) high -3.7 -4.5 -4.7 -4.9 -2.0 -2.4 -1.8 -2.8 -4.0 -3.5 -3.5 -5 -1.4 -0.8 -0.7 -0.8 50 ft (15 m) low -4.2 -4.5 -3.9 -3.8 -2.3 -2.1 -1.7 -1.8 -3.1 -3.3 -3.1 -3.2 0.0 -0.2 -1.1 0.2 16
months 50 ft (15 m) high -3.7 -4.5 -4.5 -4.3 -1.8 -2.0 -2.2 -2.0 -3.8 -2.7 -3.8 -4.4 -0.6 0.1 -1.5 -0.5
Average (both locations, all time) -3.7 -4.0 -4.1 -3.9 -2.4 -2.5 -2.0 -2.0 -3.6 -3.6 -3.4 -3.8 -0.9 -0.7 -0.9 -0.3
Average (both locations, all time,
all speeds) -3.9 -2.2 -3.6 -0.7

Appendix F Caltrans Thin Lift Study
F-8
Test Vehicle (Subaru)60 mph; microphone distance: 50 ft, height: 5 ft
-6
-5
-4
-3
-2
-1
0
1
2
0 2 4 6 8 10 12 14 16 18
pavement age (months)
Ave
rage
Lm
ax D
elta
(Sx-
S1) (
dBA
)
S2, OGAC 75 mm S3, OGAC 30 mm S4, RAC 30 mm S5, BWC 30 mm
Test Vehicle (Subaru)
60 mph; microphone distance: 50 ft, height: 15 ft
-6
-5
-4
-3
-2
-1
0
1
2
0 2 4 6 8 10 12 14 16 18pavement age (months)
Ave
rage
Lm
ax D
elta
(Sx-
S1) (
dBA
)
S2, OGAC 75 mm S3, OGAC 30 mm S4, RAC 30 mm S5, BWC 30 mm
Figure F-4. Test vehicle average LAFmx deltas (Site x minus Site 1) for pavement ages 4 months, 10 months, and 16 months, 100 km/h (60 mph). Microphone position: (top)
distance 15 m (50 ft), height 1.5 m (5 ft); (bottom) distance 15 m (50 ft), height 4.5 m (15 ft). Site bias removed.