report documentation page form approved · american physical society 1. omar espino, brian yust,...
TRANSCRIPT

Standard Form 298 (Rev 8/98) Prescribed by ANSI Std. Z39.18
Final Report
W911NF-15-1-0063
66369-MS-REP.1
956-665-3521
a. REPORT
14. ABSTRACT
16. SECURITY CLASSIFICATION OF:
The grant focused on the purchase of a Renishaw InVia Raman microscope to support and enhance the research in nanomaterials at The University of Texas Rio Grande Valley. The system was purchased, according to the description provided in the proposal (two laser beam capabilities at 785 nm and 532 nm, cell for temperature dependence capabilities manufactured by Linkam, and filters for low wave numbers for the 785 nm laser. The system includes an accessory for polarization (for 785 nm) and an optical cable that allows external Raman measurements. The manufacturer installed the system and provided the training of the main users. The Users
1. REPORT DATE (DD-MM-YYYY)
4. TITLE AND SUBTITLE
13. SUPPLEMENTARY NOTES
12. DISTRIBUTION AVAILIBILITY STATEMENT
6. AUTHORS
7. PERFORMING ORGANIZATION NAMES AND ADDRESSES
15. SUBJECT TERMS
b. ABSTRACT
2. REPORT TYPE
17. LIMITATION OF ABSTRACT
15. NUMBER OF PAGES
5d. PROJECT NUMBER
5e. TASK NUMBER
5f. WORK UNIT NUMBER
5c. PROGRAM ELEMENT NUMBER
5b. GRANT NUMBER
5a. CONTRACT NUMBER
Form Approved OMB NO. 0704-0188
3. DATES COVERED (From - To)-
Approved for Public Release; Distribution Unlimited
UU UU UU UU
18-04-2016 1-Feb-2015 31-Jan-2016
Final Report: Raman Spectrometer for the Characterization of Advanced Materials and Nanomaterials
The views, opinions and/or findings contained in this report are those of the author(s) and should not contrued as an official Department of the Army position, policy or decision, unless so designated by other documentation.
9. SPONSORING/MONITORING AGENCY NAME(S) AND ADDRESS(ES)
U.S. Army Research Office P.O. Box 12211 Research Triangle Park, NC 27709-2211
Raman Spectrometer, measurements
REPORT DOCUMENTATION PAGE
11. SPONSOR/MONITOR'S REPORT NUMBER(S)
10. SPONSOR/MONITOR'S ACRONYM(S) ARO
8. PERFORMING ORGANIZATION REPORT NUMBER
19a. NAME OF RESPONSIBLE PERSON
19b. TELEPHONE NUMBERDorina Chipara
Dorina Chipara
106012
c. THIS PAGE
The public reporting burden for this collection of information is estimated to average 1 hour per response, including the time for reviewing instructions, searching existing data sources, gathering and maintaining the data needed, and completing and reviewing the collection of information. Send comments regarding this burden estimate or any other aspect of this collection of information, including suggesstions for reducing this burden, to Washington Headquarters Services, Directorate for Information Operations and Reports, 1215 Jefferson Davis Highway, Suite 1204, Arlington VA, 22202-4302. Respondents should be aware that notwithstanding any other provision of law, no person shall be subject to any oenalty for failing to comply with a collection of information if it does not display a currently valid OMB control number.PLEASE DO NOT RETURN YOUR FORM TO THE ABOVE ADDRESS.
University of Texas-Rio Grande Valley1201 W. University Drive
Edinburg, TX 78539 -2909

ABSTRACT
Number of Papers published in peer-reviewed journals:
Final Report: Raman Spectrometer for the Characterization of Advanced Materials and Nanomaterials
Report Title
The grant focused on the purchase of a Renishaw InVia Raman microscope to support and enhance the research in nanomaterials at The University of Texas Rio Grande Valley. The system was purchased, according to the description provided in the proposal (two laser beam capabilities at 785 nm and 532 nm, cell for temperature dependence capabilities manufactured by Linkam, and filters for low wave numbers for the 785 nm laser. The system includes an accessory for polarization (for 785 nm) and an optical cable that allows external Raman measurements. The manufacturer installed the system and provided the training of the main users. The Users confirmed that the system fulfills the technical requirements. Preliminary data have been obtained and undergraduate/graduate students started their research by using this Raman Spectrometer.
(a) Papers published in peer-reviewed journals (N/A for none)
Enter List of papers submitted or published that acknowledge ARO support from the start of the project to the date of this printing. List the papers, including journal references, in the following categories:
(b) Papers published in non-peer-reviewed journals (N/A for none)
Received Paper
TOTAL:
Received Paper
TOTAL:

Number of Papers published in non peer-reviewed journals:
(c) Presentations

American Physical Society 1. Omar Espino, Brian Yust, Dorina Chipara, Pullickel Ajayan, Alin Chipara, Mircea Chipara. Microwave Irradiation on Halloysite - Polypropylene Nanocomposites. T1.00139, Poster Session III, Thursday, 1:00 pm - 4:00 pm, March 17, 2016, APS March Meeting 2016, Monday-Friday, March 14-18, 2016; Baltimore, Maryland, USA. 2. Fernando Flor, Pullickel Ajayan, Alin Chipara, Karen Lozano, Dorina Chipara, Robert Vajtai, Mircea Chipara. On the Radial Breathing Mode in SWCNTs dispersed within PVC. T1.00140 Poster Session III. Thursday, 1:00 pm - 4:00 pm, March 17, 2016, APS March Meeting 2016, Monday-Friday, March 14-18, 2016, Baltimore, Maryland, USA. 3. Filipe Ferreira, Felipe Brito, Dorina Chipara, Pullickel Ajayan, Wesley Francisco, Cristian Chipara, Evelyn Simonetti, Charles Cartwright, Luciana Cividanes, James Hinthorne, Gilmar Thim, Robert Vajtai, Mircea Chipara. Spectroscopic Studies on Graphenes Dispersed Within Polymeric Matrices T1.00068. Poster Session III. Thursday, 1:00 pm - 4:00 pm, March 17, 2016, APS March Meeting 2016, Monday-Friday, March 14-18, 2016; Baltimore, Maryland, USA. 4. Julio Cantu, Cristian Chipara, Pullickel Ajayan, James Hinthorne, Mircea Chipara. Raman Investigations of PVDF-BaTiO3 Nanocomposites. E42.00011, Session E42: Bi-Component Systems: Composites and Blends, Tuesday, 10:24 AM–10:36 AM, March 15, 2016, Room: 345 APS March Meeting 2016, Baltimore, Maryland, USA. 5. Arnold Fonseca, Dorina Chipara, Karen Lozano, Mircea Chipara. Wide Angle X-Ray Scattering Investigations on Irradiated iPP-VGCNF Nanocomposites. M1.00091. Session M1: Poster Session II, 11:30 am - 2:30 pm, Wednesday March 16, 2016. APS March Meeting 2016, Baltimore, Maryland, USA. 6. Roberto Rangel, Dorina Chipara, Brian Yust, Desiree Padilla, Mircea Chipara. Water - Based TiO2 Suspensions: A Raman Study. M1.00280. Session M1: Poster Session II, Wednesday 11:30 am - 2:30 pm, March 16, 2016. APS March Meeting 2016, Baltimore, Maryland, USA 7. Andres Salgado, Robert Jones, Samantha Ramirez, Ibrahim Elamin, James Hinthorne, Mircea Chipara. PVC-OH Functionalized SWCNT Nanocomposites. Session E42: Bi-Component Systems: Composites and Blends Room: 345. E42.000089:48 AM–10:00 AM Tuesday, March 15, 2016. APS March Meeting 2016, Baltimore, Maryland, USA. 8. Oscar Guerrero, Samantha Ramirez, Robert Jones, Brian Yust, James Hinthorne, Mircea Chipara. Spectroscopic Investigations on PVDF-MWCNTs. S42.00012. Session S42: Assembly of Nanoparticles Nanocomposites 11:15 AM–2:15 PM, Thursday, March 17, 2016 Room: 345, APS March Meeting 2016, Baltimore, Maryland, USA. 9. Jorge Cisneros, Brian Yust, Mircea Chipara Microwave Irradiation on Graphene Dispersed Within Polymeric Matrices M1.00106 Session M1: Poster Session II, Wednesday, 11:30 am - 2:30 pm. APS March Meeting 2016, Baltimore, Maryland, USA. American Chemical Society Spring Meeting. 10. Mircea Chipara, Elamin Ibrahim, Dorina M. Chipara, Julian A. Martinez, Raman investigations on nanocomposites of colloidal silver in block copolymers. Contribution presented to the 251st American Chemical Society Spring Meeting, DIVISION: POLY 405 SYMPOSIUM Responsive Nanostructures & Nanocomposites, San Diego, 13-17 March, 2016.

(d) Manuscripts submitted for publication in peer reviewed journals: 1. Yunlong Jin, Shah Valloppilly, Dorina Magdalena Chipara, Ralph Skomski, Mircea Chipara*, Wenyong Zhang, Maximilian Villarreal, David J. Sellmyer, On Polystyrene - Block Polyisoprene – Block Polystyrene Filled with C Coated Ni Nanoparticles, Journal of Materials Science, submitted.
Number of Non Peer-Reviewed Conference Proceeding publications (other than abstracts):
Peer-Reviewed Conference Proceeding publications (other than abstracts):
Number of Peer-Reviewed Conference Proceeding publications (other than abstracts):
11.00Number of Presentations:
Non Peer-Reviewed Conference Proceeding publications (other than abstracts):
(d) Manuscripts
Received Paper
TOTAL:
Received Paper
TOTAL:
Received Paper
TOTAL:

Books
Number of Manuscripts:
Patents Submitted
Patents Awarded
Awards
Graduate Students
Names of Post Doctorates
Received Book
TOTAL:
Received Book Chapter
TOTAL:
PERCENT_SUPPORTEDNAME
FTE Equivalent:
Total Number:
DisciplineMaximllian Villarreal 0.00
0.00
1
PERCENT_SUPPORTEDNAME
FTE Equivalent:
Total Number:

Names of Faculty Supported
Names of Under Graduate students supported
Names of Personnel receiving masters degrees
Number of graduating undergraduates who achieved a 3.5 GPA to 4.0 (4.0 max scale):Number of graduating undergraduates funded by a DoD funded Center of Excellence grant for
Education, Research and Engineering:The number of undergraduates funded by your agreement who graduated during this period and intend to work
for the Department of DefenseThe number of undergraduates funded by your agreement who graduated during this period and will receive
scholarships or fellowships for further studies in science, mathematics, engineering or technology fields:
Student MetricsThis section only applies to graduating undergraduates supported by this agreement in this reporting period
The number of undergraduates funded by this agreement who graduated during this period:
0.00
0.00
0.00
0.00
0.00
0.00
0.00
The number of undergraduates funded by this agreement who graduated during this period with a degree in science, mathematics, engineering, or technology fields:
The number of undergraduates funded by your agreement who graduated during this period and will continue to pursue a graduate or Ph.D. degree in science, mathematics, engineering, or technology fields:......
......
......
......
......
PERCENT_SUPPORTEDNAME
FTE Equivalent:
Total Number:
National Academy MemberDorina Chipara 0.00Mircea Chipara 0.00Brian Yust 0.00Elamin Ibrahim 0.00Louis Materon 0.00
0.00
5
PERCENT_SUPPORTEDNAME
FTE Equivalent:
Total Number:
DisciplineJulian A. Martinez 0.00 ChemistryOmar Espino 0.00 PhysicsFernando Flor 0.00 PhysicsJulio Cantu 0.00 PhysicsArnold Fonseca 0.00 PhysicsRobert Rangel 0.00 PhysicsAndres Salgado 0.00 PhysicsOscar Guerrero 0.00 PhysicsJorge Cisneros 0.00 PhysicsAndres Marroquin 0.00 Mechanical EngineeringSuzana Campos 0.00 Mechanical Engieering
0.00
11
NAME
Total Number:
......
......

Sub Contractors (DD882)
Names of personnel receiving PHDs
Names of other research staff
Inventions (DD882)
Scientific Progress
See Attachment
Technology Transfer
NAME
Total Number:
PERCENT_SUPPORTEDNAME
FTE Equivalent:
Total Number:

1
Figure 1. Raman spectrum of TiO2 powder
The following research directions were ignited by the acquisition of the Renishaw InVia Raman Confocal
Microscope:
Semiconducting Nanoparticles for Future Biological and Medical Applications
This preliminary research focused on TiO2 nanoparticles. These nanoparticles have been considered for
the following reasons: 1). Relatively small TiO2 nanoparticles (average size below 50 nm) are available
from many vendors at a relatively low price. 2). TiO2 is a semiconducting material. 3). The role of TiO2 in
the generation of reactive oxygen species in the presence of water and electromagnetic radiation is well
documented. 4. The antibacterial features are still under debate.
Our point of view is that TiO2 has antibacterial features solely if UV radiation (or component) is present.
Dark properties of TiO2 may not include antibacterial features. Fig. 1 shows the typical Raman spectrum
of TiO2 (anatase) at various powers and the assignment for each line. Spectrum has been recorded by
using the 785 nm incident laser beam.
Dispersions of TiO2 into a polymeric matrix (Polyethylene oxide; PEO) have been prepared by solution
method dissolving the polymer matrix in deionized water, mixing the solution with various amounts of

2
Figure 2. Raman spectra of PEO-TiO2 nanocomposites.
500 1000 1500 2000 2500 3000
0
2000
4000
6000
8000
TiO2
PEO 15% TiO2
PEO 1% TiO2
Lin
e A
mplit
ude [
Arb
. U
nits]
Raman Shift [cm-1]
PEO
TiO2, sonicating the mixture 30 minutes for a good dispersion of the nanofiller and removing the residual
solvent by heating in an oven at 90 oC.
The Raman spectrum of PEO-TiO2 is shown in Fig. 2. It is easily noticed that the Raman lines of TiO2
dominates the wavelength ranging from 100 up to about 800 cm-1, where the polymer has some weak
lines. This study indicated that the Raman spectrometer can detect quantities containing as low as 1%
wt. TiO2 and indicated that the best line to focus on is the line located at about 125 cm-1. This line, which
is the most intense component of the Raman spectrum of TiO2, is typically intense and narrow.
However, a shift of the Raman line, connected to the size of TiO2 nanoparticles was noticed. The shift
may indicate also a change in the phase composition although Wide Angle X-Ray Scattering was not able
to support such hypothesis.

3
Figure 3. The effect of the size of TiO2 nanoparticle (anatase) on the Raman line located at about 140 cm-1
.
80 120 160 200
0
100000
200000
300000
400000L
ine I
nte
nsity [
Arb
. U
nits ]
Raman Shift [ cm-1 ]
15 nm
5 nm
Dispersions of TiO2-deionized water and TiO2-nutrients have been prepared. The recording of the Raman
spectra was difficult as the focal point for light did not coincides to the optical point for the Raman laser.
However, we have exploited the z scanning capability to obtain the Raman spectra of sediment TiO2
nanoparticles. It was confirmed that the spectral region between 100 and 200 cm-1 is not affected by the
presence of water or nutrients. Next steps will include the study of TiO2-nutrients-bacteria systems and
the development of the accessories for dark and light investigations.
This topic was the central point of an undergraduate senior thesis (student Desiree Padilla) and of a
poster presentation at APS 2016.
Raman Investigations on carbon nanostructures dispersed within polymeric matrices.
PS-PI-PS-Graphene nanocomposites. Polystyrene-block polyisoprene - block polystyrene three block
copolymer purchased from Sigma Aldrich has been loaded with graphene nanoparticles purchased from
CheapTubes Inc., by using the solution method, with chloroform as solvent. The preliminary results were
4
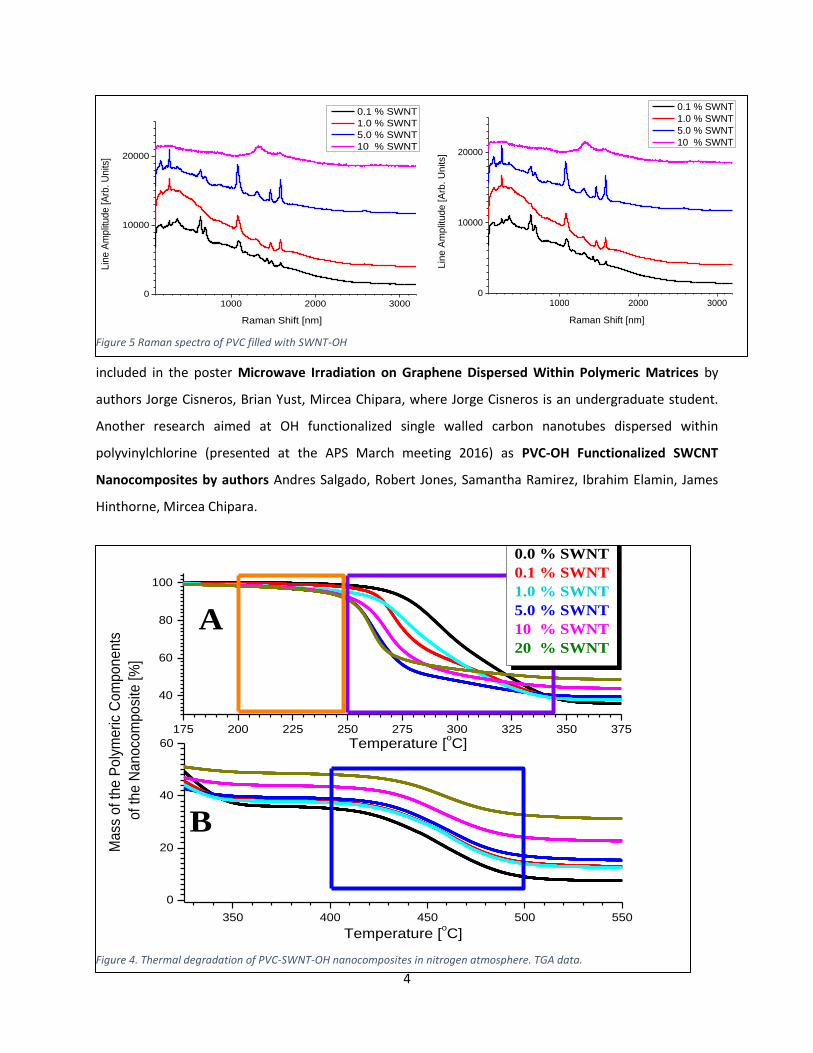
Figure 5 Raman spectra of PVC filled with SWNT-OH
1000 2000 30000
10000
20000
Lin
e A
mp
litu
de
[A
rb. U
nits
]
Raman Shift [nm]
0.1 % SWNT
1.0 % SWNT
5.0 % SWNT
10 % SWNT
1000 2000 30000
10000
20000
Lin
e A
mplit
ude [A
rb. U
nits]
Raman Shift [nm]
0.1 % SWNT
1.0 % SWNT
5.0 % SWNT
10 % SWNT
Figure 4. Thermal degradation of PVC-SWNT-OH nanocomposites in nitrogen atmosphere. TGA data.
175 200 225 250 275 300 325 350 375
40
60
80
100
350 400 450 500 550
0
20
40
60
B
Temperature [oC]
Ma
ss o
f th
e P
oly
me
ric
Co
mp
on
en
ts
of
the
Na
no
com
po
site
[%
]
0.0 % SWNT
0.1 % SWNT
1.0 % SWNT
5.0 % SWNT
10 % SWNT
20 % SWNT
A
Temperature [oC]
included in the poster Microwave Irradiation on Graphene Dispersed Within Polymeric Matrices by
authors Jorge Cisneros, Brian Yust, Mircea Chipara, where Jorge Cisneros is an undergraduate student.
Another research aimed at OH functionalized single walled carbon nanotubes dispersed within
polyvinylchlorine (presented at the APS March meeting 2016) as PVC-OH Functionalized SWCNT
Nanocomposites by authors Andres Salgado, Robert Jones, Samantha Ramirez, Ibrahim Elamin, James
Hinthorne, Mircea Chipara.

5
The Raman spectra at room temperature is shown in Fig. 4. We are focusing now at the effect of
temperature on the Raman spectra. According to TGA, the polymer exhibits a two steps degradation in
nitrogen (see Fig. 5) and oxygen atmosphere.
Additional information about preliminary results and experiments is included in the list of publications.
During this period, a single manuscript has been submitted for publication to Journal of Materials
Science (Springer).

6
On Polystyrene - Block Polyisoprene – Block Polystyrene Filled with
C Coated Ni Nanoparticles
Yunlong Jin1, Shah Valloppilly
1, Dorina Magdalena Chipara
2, Ralph Skomski
1, Maximiliano
Villarreal2, Mircea Chipara
2*, Wenyong Zhang
1, David J. Sellmyer
1
1The University of Nebraska, Nebraska Center for Materials and Nanoscience, Lincoln, NE-
68588, USA
2The University of Texas Rio Grande Valley, Edinburg, TX-78539, USA
Corresponding author: Mircea Chipara, The University of Texas Rio Grande Valley, Department
of Physics, 1201 W. University Drive, Edinburg, TX-78539, USA
(E-mail: [email protected]; [email protected])
ABSTRACT
Carbon coated nickel nanoparticles dispersed within polystyrene-block polyisoprene-block
polystyrene have been investigated by Raman, X-Ray, SQUID, Differential Scanning
Calorimetry, and Electron Microscopy. The effect of nanofiller on the self-assembly features of
the block copolymer is reported. Preferential localization of nanofiller within the soft phase was
noticed below 20 % weight nanofiller. Higher loadings showed uniform distribution of nanofiller
within the block copolymer, consistent with the destruction of self-assembly. The effect of
nanoparticles' concentration on blocking temperature is discussed.
KEYWORDS:
Block copolymers; Self-assembly; Squid; DSC; XRD; magnetic properties.
INTRODUCTION

7
Recent attention is focused on elastic materials with magnetic features for rheological
applications [1], electronics [2], energy [3], data storage [4], and future spintronics [5]. Medical
applications [6] are exploiting either the magnetic characteristics for controlled localization and
release of drugs or superparamagnetic features for contrast agents in Nuclear Magnetic
Resonance Imaging. Block copolymers (BC) such as polystyrene block polyisoprene block
polystyrene (PS-bPI-bPS) are attractive matrices, with excellent mechanical properties and rich
morphologies derived from their self-assembly capabilities. Dispersion of magnetic nanoparticles
(MN) within BC is expected to result in nanocomposites that combine the magnetic
characteristics with the elastic features of the matrix [7]. The ability of BC to spontaneously
reorganize in ordered structures at submicron scale opens the possibility of new nanomaterials,
where the MN are preferentially localized within a given phase of BC [8]. Preliminary data
revealed that barium ferrite MN are preferentially trapped within the soft domains (polyisoprene;
PI) [7],[8] of PS-bPI-bPS.
Bulk Ni is a ferromagnet with Curie temperature (TC) of 631 K, whose nanoparticle oxidizes
easily in air to NiO, an antiferromagnet with a Neel temperature (TN) of 525 K. The blocking
temperature, TB, is the temperature at which magnetic properties are averaged out by thermal
motions. MNs are characterized by TB rather than TC or TN. TB depends on the size of MN
(decreases as the size is decreased) and on the distance between them (due to the competition
between dipolar and exchange interactions). Above TB, nanoparticles are superparamagnetic.
Typically, MN with spherical morphology (such as Fe, Co, Ni) under 25 nm, are
superparamagnetic at room temperature (RT) [9]. The coating with C decreases both the
oxidation (by delaying the diffusion of oxygen) and the exchange interactions among MN,
allowing for a better dispersion. This justifies the choice of carbon coated Ni nanoparticles (Ni-
C) as filler.
EXPERIMENTAL
PS-bPI-bPS with average degree of polymerization 19,000 containing 17 % polystyrene (PS)
was acquired from Sigma-Aldrich. Ni-C, with average size of 20 nm, coated by a 1 nm layer of
carbon, was purchased from US Research Nanomaterials, Inc. Solutions of 10 % wt. PS-bPI-bPS
in chloroform were prepared and stirred at RT for 1 hour. MNs were dispersed by sonication in
chloroform for about 1 h, to enhance their dispersion. Then, these solutions were mixed and

8
Fig. 1. SEM of NiO (A) and its elemental composition (B). PS-bPI-bPS containing 10% wt. Ni-C (C, E, F, and G) and its elemental composition (D). EDAX distribution of atoms (H, I) where red is nickel, blue carbon, and cyan oxygen.
sonicated at 500 W for 1 hour at RT. The as obtained dispersions were poured onto glass slides
and the solvent was removed in a vacuum oven at 75 oC for 12 hours. Full evaporation was
confirmed by TGA measurements in nitrogen. Films containing various amounts of Ni-C in PS-
bPI-bPS have been obtained and investigated by Electron Microscopy (Carl Zeiss microscope
with EDAX capabilities), X-Ray Diffraction (Bruker Discovery 8 operating in both Wide Angle
X-Ray Scattering, WAXS and Small Angle X-Ray Scattering, SAXS modes), Raman
Spectroscopy (Bruker Senterra confocal Raman microscope at 785 nm), and Differential
Scanning Calorimetry, DSC (Q 200 from TA Instruments). DSC data obtained during the second
heating/cooling cycle (at 10 oC/min).after a 10 minutes isothermal annealing at 200
oC, were
recorded. Magnetic properties were investigated by SQUID.
EXPERIMENTAL RESULTS AND DISCUSSIONS
PS-bPI-bPS has a quasi-continuous phase of PI with spheres or cylinders of PS. Figs. 1A and 1B
show the electron microscopy of Ni-C and its elemental composition, respectively. The oxygen’s
presence reflects the partial
oxidation of Ni to NiO. Figs
1C-1G show the
nanocomposite containing 10%
Ni-C, and its elemental
composition (Fig. 1D),
indicating well dispersed MN.
The distribution of atoms in
the sample loaded with 10 %
wt. Ni-C is shown in Figs. 1H-
1I.
Fig. 2 collects the temperature
dependence of the
magnetization. Pristine Ni-C
shows a magnetization (in
magnetic field of 100 Oe) of
about 3.7 emu/g at 375 K, in

9
agreement with literature [10]. Field cooled (FC)
and zero field cooled (ZFC) magnetization
branches have been measured as reported
elsewhere [11].
Fig. 2A depicts the temperature dependence of
the magnetization for FC and ZFC branches. The
splitting between the FC and ZFC branches of the
magnetization occurs at the splitting temperature,
TDIFF, a temperature at which the largest particles
are frozen (Fig. 2A) [12], [13]. TDIFF is close to
the irreversible temperature TIRR, defined by:
[MFC(TIRR)-MZFC(TIRR)]/MFC(TIRR)<0.01, where
MFC and MZFC are the sample magnetizations on
the FC and ZFC branches, respectively[14]. The
dependence of TDIFF on Ni-C concentration is
shown in Fig. 2B. TDIFF is almost independent on
Ni-C concentration (within the experimental errors), due to the competition between dipolar and
exchange interactions as well as to the modification of the volume available to MN within the
BC. For a more accurate estimation of TB, the temperature dependence of the magnetization
(ZFC branch) was modelled assuming the following additive contributions: a magnetic
contribution A/(T-TC), where TC is the Curie temperature, a blocking contribution C/{1+[(T-
TB)/W]2}represented by a wide Lorentzian of width W centered on TB, and a linear term D(T-
TA), which takes into account the observed quasi-linear dependence of the magnetization on
temperature [15]. A, C and D were fitting constants. The best fit was obtained for A≈0, and TC
oscillating between 0 and -20 K, suggesting weak antiferromagnetic interactions consistent with
the oxidation of a thin layer of Ni. TB was estimated to be in the range 220 to 340 K, in
agreement with other experimental data [16].
TB increases as the loading with Ni-C is increased, reflecting the enhancement of dipole and
exchange interactions between MN (distance between MN is decreased) [15] (see Fig. 2B). A
quasilinear dependence of TB on the mass fraction of Ni-C is expected [15]. Such a behavior is
confirmed by Fig. 2B.However, as the concentration of nanoparticles increases from 10 to 24 %
Fig. 2. (A).Temperature dependence of magne-
tization (FC and ZFC) for nanocomposites. (B).
Dependence of TDIFF and TB on Ni-C
concentration.

10
wt. Ni-C, the magnetization shows a local maxim at about wt. 15 % Ni-C followed by a sudden
decrease at about 24 % wt. Ni-C. This indicates that in the concentration range 0 to 20 % wt. Ni-
C nanoparticles, the MNs are preferentially located in the soft phase, owing to the segregation
between macromolecular chains (self-assembly capabilities of BC). This is consistent with a
drop of the distance between MN as their concentration is increased. As the concentration of
nanoparticles is increased above 20 % wt, the self-assembly capabilities are destroyed and the
whole BC volume becomes available to the MN (i.e. even the polystyrene domains are available
to MN). The transition from the localization of MN within the soft phase to the localization of
nanoparticles within the whole BC is equivalent to a sudden increase of the average distance
between MN, decreasing the contribution of dipole-dipole and exchange interactions.
The Raman spectra of nanocomposites are collected in Fig. 3. The most important lines of cis 1,4
PI are [17] located at 498 (C-C-C deformation), 1001 (C-C stretching), 1375 (CH3 asymmetric
deformation), and 1673 (C=C stretching) cm-1
. Some Raman lines of PS and PI overlap (the most
intense PS Raman line located at 1001 cm-1
overlaps with the most intense Raman line of PI).
However, the line at 2904 cm-1
assigned solely to PS, was easily observed and identified. Fig. 3
shows that the Raman lines of PS-bPI-bPS are broadened rapidly by the addition of nanofiller.
This is a typical behavior assigned to a dephasing of Raman molecular motions due to the
interactions (collisions) between nanofiller and the chains of the polymeric matrix [18].
The carbon coating is extremely disordered contributing to a very weak and broad D band [19],
[20] barely visible within the nanocomposites with a high amount of filler. The graphitic band
(G-Band) [20] is almost absent.
Fig. 4A collects WAXS data. PS-bPI-bPS
spectrum consists of a single broad line, located at
19o. No narrow WAXS lines of PS-bPI-bPS are
expected at room temperature as the PI
component is melted at RT and the PS component
is amorphous (atactic). The carbon shell of MNs
is expected to show a weak signal at about 21o
[21], which probably is masked by the broad line
assigned to the polymeric matrix. Fig. 4B shows
in more detail the lines due to the face cubic
500 1000 1500 2000 2500 3000 3500
8000
8500
9000
9500
PS-bPI-bPS -15% Ni-C
PS-bPI-bPS -10% Ni-C
PS-bPI-bPS -5% Ni-C
PS-bPI-bPS -1% Ni-C
PS-bPI-bPS -0% Ni-C
G Band
PS-bPI-bPS -24% Ni-C
Ra
man
In
ten
sity [ A
rb.
Un
its ]
Raman Shift [ cm-1 ]
D Band
Fig. 3. Raman spectra of nanocomposites.

11
centered Ni nanoparticles, with typical lines at 44o, 52
o and 76
o assigned to (111), (200) and
(220) reflections in Ni [12], [22], [21]. No hexagonal close packed Ni crystallites were observed
[23]. The weak line at 75o, was assigned to NiO [24] supporting the Ni-C oxidation. The lines
marked with x in Figs 4 originate from the Al substrate. A splitting of all lines assigned to Ni
was noticed for doping level above 20 % wt. Ni-C. Tentatively, this splitting was assigned to the
filling of both PI and PS domain with Ni-C at high concentration of nanoparticles (due to the
destruction of the self-assembly). At low concentration of Ni-C, most nanoparticles are
accommodated within the soft PI phase.
Fig. 4C collects the SAXS spectra. It is noticed
the presence of a relatively narrow line at very
small angles and the shift of the position of this
line (accompanied by a drop of the amplitude)
towards larger angles as the amount of filler is
increased. This spectrum confirms the existence
of a statistical order at the nanometer scale,
confirming the local self-assembly.
DSC data provided additional support. As noticed
from Fig. 5A, both the pristine polymer and the
nanocomposites show no melting/crystallization.
A weak glass transition is noticed at 100 oC. This
is the typical glass transition temperature (TG) of
polystyrene. In the low temperature range, at
about -60 oC another TG assigned to the rubber
component (PI) was observed. As expected, the
BC is not compatible, showing clear phase
separation. More detail is available from Figs. 5B,
5C, where the derivative of the heat exchange
with respect to the temperature was represented
as a function of temperature. In this
representation, the TG is represented by an
extreme (actually the lowest value). It is observed that the TG of PI decreases as the
Fig. 4. (A).WAXS spectra. (B). Detailed WAXS lines of Ni-C. (C). SAXS spectra.

12
concentration of the filler is increased. This
indicates an increase of the free volume
suggesting a strong stretching of the PI phase due
to the addition of the nanofiller. This free volume
is generated on the expense of PS available free
volume, which is decreased, forcing the TG of the
hard phase (PS) to shift upwards. At high loading
with MN this is also the mechanism that destroys
the self-assembly of the BC.
CONCLUSIONS
The uniform dispersion of Ni-C nanoparticles
within PS-bPI-bPS was confirmed. DSC data
revealed shifts of TG, for both soft and hard
components consistent with the preferential
localization of the nanofiller in the soft domains
and self-assembly destruction at high loading.
Magnetization data indicated that the self-
assembly is destroyed at loading in excess of 15 % with Ni-C nanoparticles, in agreement with
DSC data. The self-assembly of the polymeric matrix was confirmed by SAXS measurements.
Raman spectroscopy confirmed the presence of carbon coatings on Ni-C. X-Ray data were
consistent with DSC data, indicating no crystalline component within BC. WAXS data supported
the presence of cubic Ni nanoparticles with a small admixture of NiO, consistent with
magnetization data.
ACKNOWLEDGEMENTS.
Research was supported by Nebraska Center for Materials and Nanoscience and acknowledges NSF
DMR 1040419 MRI grant “Acquisition of an Environmental Scanning Electron Microscope”.
UTRGV acknowledges the Department of Defense Grant "Raman Spectrometer for the
Characterization of Advanced Materials and Nanomaterials", W911NF-15-1-0063 and the NSF
Fig. 5. (A). DSC thermograms. The derivative of the heat exchange as a function of temperature showing the TG of PS (B) and PI (C).

13
DMR-1523577: UTRGV-UMN Partnership for Fostering Innovation by Bridging Excellence in
Research and Student Success.
Figure Caption
Fig. 1. SEM of NiO (A) and its elemental composition (B). PS-bPI-bPS containing 10% wt. Ni-C (C,
E, F, and G) and its elemental composition (D). EDAX distribution of atoms (H, I) where red is
nickel, blue carbon, and cyan oxygen.
Fig. 2. (A). Temperature dependence of magnetization (FC and ZFC) for nanocomposites. (B).
Dependence of TDIFF and TB on Ni-C concentration.
Fig. 3. Raman spectra of nanocomposites.
Fig. 4. (A).WAXS spectra. (B). Detailed WAXS lines of Ni-C. (C). SAXS spectra.
Fig. 5. (A). DSC thermograms. The derivative of the heat exchange as a function of temperature
showing the TG of PS (B) and PI (C).
REFERENCES
[1] K.L. Pickering, S.I. Raa Khim, S. Ilanko, The effect of silane coupling agent on iron sand
for use in magnetorheological elastomers part 1: Surface chemical modification and
characterization, Compos. Part A Appl. Sci. Manuf. 68 (2015) 377–386.
[2] T. Sekitani, T. Someya, Stretchable, large-area organic electronics., Adv. Mater. 22 (2010)
2228–46.
[3] S. Zhang, Y. Li, L. Peng, Q. Li, S. Chen, K. Hou, Synthesis and characterization of novel
waterborne polyurethane nanocomposites with magnetic and electrical properties,
Compos. Part A Appl. Sci. Manuf. 66 (2013) 94–101.
[4] K. Xie, B. Wei, Materials and Structures for Stretchable Energy Storage and Conversion
Devices., Adv. Mater. 26 (2014) 3592–3617.

14
[5] S. Sanvito, Organic electronics: Spintronics goes plastic, Nat. Mater. 6 (2007) 803–804.
[6] C. Xu, S. Sun, New forms of superparamagnetic nanoparticles for biomedical
applications., Adv. Drug Deliv. Rev. 65 (2013) 732–43.
[7] M. Chipara, R. Skomski, N. Ali, D. Hui, D.J. Sellmyer, Magnetic properties of barium
ferrite dispersed within polystyrene-butadiene-styrene block copolymers., J. Nanosci.
Nanotechnol. 9 (2009) 3678–3683.
[8] M. Chipara, D. Hui, J. Sankar, D. Leslie-Pelecky, A. Bender, L. Yue, et al., On styrene–
butadiene–styrene–barium ferrite nanocomposites, Compos. Part B Eng. 35 (2004) 235–
243.
[9] V.R. Galakhov, A. Buling, M. Neumann, N.A. Ovechkina, A.S. Shkvarin, A.S.
Semenova, et al., Carbon States in Carbon-Encapsulated Nickel Nanoparticles Studied by
Means of X-ray Absorption, Emission, and Photoelectron Spectroscopies, J. Phys. Chem.
C. 115 (2011) 24615–24620.
[10] B. Nayak, S. Vitta, A. Nigam, D. Bahadur, Ni and Ni–nickel oxide nanoparticles with
different shapes and a core–shell structure, Thin Solid Films. (2006) 9–12.
[11] D. Gozzi, A. Latini, G. Capannelli, F. Canepa, M. Napoletano, M.R. Cimberle, et al.,
Synthesis and magnetic characterization of Ni nanoparticles and Ni nanoparticles in
multiwalled carbon nanotubes, J. Alloys Compd. 419 (2006) 32–39.
[12] W. Li, T. Qiu, L. Wang, S. Ren, J. Zhang, L. He, et al., Preparation and electromagnetic
properties of core/shell polystyrene@polypyrrole@nickel composite microspheres., ACS
Appl. Mater. Interfaces. 5 (2013) 883–91.
[13] P. Granitzer, K. Rumpf, M. Venkatesan, a. G. Roca, L. Cabrera, M.P. Morales, et al.,
Magnetic Study of Fe[sub 3]O[sub 4] Nanoparticles Incorporated within Mesoporous
Silicon, J. Electrochem. Soc. 157 (2010) K145.
[14] P. Zhang, F. Zuo, F.K.U. Iii, A. Khabari, P. Griffiths, A. Hosseini-Tehrani, Irreversible
magnetization in nickel nanoparticles, J. Magn. Ma. 225 (2001) 337–345.
[15] K. Trohidou, M. Vasilakaki, Magnetic Behaviour of Core / Shell Nanoparticle
Assemblies : Interparticle Interactions Effects, Acta Phys. Pol. A. 117 (2010) 374–378.
[16] L.M. Moreau, D.-H. Ha, C.R. Bealing, H. Zhang, R.G. Hennig, R.D. Robinson,
Unintended phosphorus doping of nickel nanoparticles during synthesis with TOP: a
discovery through structural analysis, Nano Lett. 12 (2012) 4530–9.
[17] P. Nallasamy, S. Mohan, Vibrational Spectra of cis-1, 4-polyisoprene, Arab. J. Sci. Eng.
29 (2004) 17–26.

15
[18] M. Chipara, J.R. Villarreal, M.D. Chipara, K. Lozano, A.C. Chipara, D.J. Sellmyer,
Spectroscopic investigations on polypropylene-carbon nanofiber composites. I. Raman
and electron spin resonance spectroscopy, J. Polym. Sci. Part B Polym. Phys. 47 (2009)
1644–1652.
[19] K. Bhowmik, A. Mukherjee, M. Mishra, G. De, Stable Ni Nanoparticle–Reduced
Graphene Oxide Composites for the Reduction of Highly Toxic Aqueous Cr (VI) at Room
Temperature, Langmuir. (2014) 3209–3216.
[20] D.M. Chipara, A.C. Chipara, M. Chipara, Raman Spectroscopy of Carbonaceous
Materials : A Concise Review, Spectroscopy. 26 (2011) 2–7.
[21] Y. Huang, Z. Xu, Y. Yang, Preparation, characterization, and surface modification of
carbon-encapsulated nickel nanoparticles, J Phys.Chem. C. (2009) 6533–6538.
[22] J. Gong, L.L. Wang, Y. Liu, J.H. Yang, Z.G. Zong, Structural and magnetic properties of
hcp and fcc Ni nanoparticles, J. Alloys Compd. 457 (2008) 6–9.
[23] X. Luo, Y. Chen, G.-H. Yue, D.-L. Peng, X. Luo, Preparation of hexagonal close-packed
nickel nanoparticles via a thermal decomposition approach using nickel acetate
tetrahydrate as a precursor, J. Alloys Compd. 476 (2009) 864–868.
[24] F. Davar, Z. Fereshteh, M. Salavati-Niasari, Nanoparticles Ni and NiO: Synthesis,
characterization and magnetic properties, J. Alloys Compd. 476 (2009) 797–801.